dynamic spectrum sharing for future lte-nr networks - mdpi
TRANSCRIPT

sensors
Communication
Dynamic Spectrum Sharing for Future LTE-NR Networks †
Gordana Barb, Florin Alexa * and Marius Otesteanu
�����������������
Citation: Barb, G.; Alexa, F.;
Otesteanu, M. Dynamic Spectrum
Sharing for Future LTE-NR Networks.
Sensors 2021, 21, 4215. https://
doi.org/10.3390/s21124215
Academic Editor: Dimitrie
C. Popescu
Received: 10 May 2021
Accepted: 16 June 2021
Published: 19 June 2021
Publisher’s Note: MDPI stays neutral
with regard to jurisdictional claims in
published maps and institutional affil-
iations.
Copyright: © 2021 by the authors.
Licensee MDPI, Basel, Switzerland.
This article is an open access article
distributed under the terms and
conditions of the Creative Commons
Attribution (CC BY) license (https://
creativecommons.org/licenses/by/
4.0/).
Department of Communications, Politehnica University Timis, oara, 300006 Timis, oara, Romania;[email protected] (G.B.); [email protected] (M.O.)* Correspondence: [email protected]† This manuscript is extension version of the conference paper: Barb, Gordana, Marius Otesteanu, and Marius
Roman. “Dynamic Spectrum Sharing for LTE-NR Downlink MIMO Systems.” In Proceedings of the 2020International Symposium on Electronics and Telecommunications (ISETC), Timisoara, Romania,5–6 November 2020; pp. 1–4.
Abstract: 5G is the next mobile generation, already being deployed in some countries. It is expectedto revolutionize our society, having extremely high target requirements. The use of spectrum is,therefore, tremendously important, as it is a limited and expensive resource. A solution for thespectrum efficiency consists of the use of dynamic spectrum sharing, where an operator can sharethe spectrum between two different technologies. In this paper, we studied the concept of dynamicspectrum sharing between LTE and 5G New Radio. We presented a solution that allows operators tooffer both LTE and New Radio services using the same frequency bands, although in an interleavedmode. We evaluated the performance, in terms of throughput, of a communication system using thedynamic spectrum sharing feature. The results obtained led to the conclusion that using the dynamicspectrum sharing comes with a compromise of a maximum 25% loss on throughput. Nevertheless,the decrease is not that substantial, as the mobile network operator does not need to buy an additional15 MHz of bandwidth, using the already existing bandwidth of LTE to offer 5G services, leading tocost reduction and an increase in spectrum efficiency.
Keywords: dynamic spectrum sharing; LTE; 5G NR; throughput; spectrum efficiency
1. Introduction
The next mobile generation following Long Term Evolution (LTE) that has started itsdeployment in some countries is the 5th Generation (5G). The main focus of LTE was setto increase data transfer rates, while 5G is expected to revolutionize our society, focusingnot only on delivering extreme mobile broadband, but also in the fields of critical machinecommunication and massive machine communication. New applications will emerge,and the target values and requirements proposed are extremely demanding [1]. The mainchallenges of 5G systems consist of increasing data transfer rates, reducing latency, andincreasing capacity, spectrum efficiency, and network energy efficiency, which will benecessary for different application scenarios [2].
The current network architecture cannot sustain all the requirements and target val-ues of 5G New Radio (NR). Therefore, the 3rd Generation Partnership Project (3GPP)released two variations for the new network architecture of 5G NR communication sys-tems: Non-standalone (NSA) and Standalone (SA) [3]. The main difference between bothtypes is that the NSA architecture is based and depends on the LTE core network, whilethe SA architecture uses a novel next-generation core network, not depending of anyLTE infrastructure.
The Internet of Things (IoT), mobile internet, and Cognitive Radio (CR) stand asrelevant driving forces for 5G development [4–7]. The IoT technology has the potentialability to connect almost everything to the internet, which will lead to the massive growthof devices that require network acceptance. Particularly, in 2018, there were approximately22 billion connected devices, which is the equivalent of around 2.9 devices/person. It
Sensors 2021, 21, 4215. https://doi.org/10.3390/s21124215 https://www.mdpi.com/journal/sensors

Sensors 2021, 21, 4215 2 of 15
is expected that by 2025, the number of connected devices to be nearly 38.6 billion [8].Simultaneously, the mobile internet has surpassed the traditional mobile communications,offering users innovative experiences. On the other hand, cognitive radio representsa technology that has evolved in order to improve the spectrum usage, exploiting bothlicensed and unlicensed bands. It became a promising wireless communications technologythat is able to solve spectrum problems by: observation, learning, and intelligent adaptationto obtain an optimal frequency band [9].
In addition to the network architecture, another major challenge of 5G systems consistsof the available frequency spectrum. Presently, the spectrum used for mobile communi-cations is located between 300 MHz and up to 6 GHz. Due to the fact that most of it iscompletely saturated, new frequency bands above 6 GHz need to be taken into consider-ation. Hence, it is expected that 5G NR systems will use frequency bands above 6 GHz,reaching up to 300 GHz [10]. Therefore, the main frequency spectrum to be used for 5Gsystems can be in licensed, shared, and unlicensed bands, see Table 1. The low-band spec-trum has the goal of supporting high coverage and penetration; the mid-band spectrumprovides data transfer rates up to 1 Gbps; the high-band spectrum supports peak datatransfer rates up to 20 Gbps. The last group, even though it supports such high data rates,comes with the inconvenience of low coverage and penetration, being indicated to beapplied in closed/indoor environments.
Table 1. 5G spectrum options.
Frequency Band Characteristics Spectrum Use
600–2600 MHzWide area coverage Spectrum sharing
Reframing fromold technologies
3.3–5 GHzMid-band mainstream for 5G
Independent deployment(without old technologies)
Massive MIMO-crowded andurban areas
5–6 GHzUnlicensed spectrum
No spectrumlicensed necessary
24–39 GHzAllocated mmWaves for 5G
Increased data rates
It is clear that the frequency spectrum is a scarce and limited resource that constitutesan important factor in mobile communication systems, as well as the related cost for theMobile Network Operator (MNO). In this context, new spectrum explorations [11,12],higher energy efficiency [13], and dynamic spectrum usage [14–18] have become the newfeatures of communication networks.
The topic of spectrum sharing in the bands of old communication systems starteddrawing the attention of researchers, as it is the safest and most economical solution [19].The standardization procedure for the spectrum sharing principles started in March 2017by 3GPP. One of the solutions presented regarding the spectrum allocation for 5G NRsystems comprises the use of the existing frequency spectrum used by the already deployedmobile generations.
Spectrum sharing is based on the flexibility of the physical layer and the fact that inthe LTE network, all channels are assigned in the time-frequency domain. This way, theflexibility of the 5G NR radio interface can be used for reference signals, allowing dynamicconfiguration and minimizing collisions between NR and LTE during simultaneous datatransmission. Consequently, there is the possibility of sharing a frequency domain within thesame communication channel. A comprehensive overview on the different ways of spectrumsharing that has been investigated in recent years is found in [14]. In addition, in [20,21],new schemes and algorithms for dynamic spectrum sharing between Global System forMobile Communications (GSM) and LTE technologies were investigated. Regarding theIoT, spectrum sharing is a preferable approach to cope with the conflicts between massive

Sensors 2021, 21, 4215 3 of 15
IoT connections and limited spectrum resources as it was discussed in [22–25]. It can alsobe used to solve vertical requirements and the competition in the acquisition of frequencybands between MNOs [26,27], as well as to improve spectrum utilization in CognitiveRadio (CR) and TV white space [28–30]. The leading mobile producers have shown massiveinterest in developing solutions for dynamic spectrum sharing. These are presented inTable 2.
Table 2. Leading producers and adopted DSS solution.
Leading Producers Name of DSS Solution
Ericsson ESS—Ericsson Spectrum SharingHuawei CloudAIR
MediaTeck Dimensity 1000Nokia Dynamic Spectrum Sharing (DSS)
QualComm Snapdragon X60Samsung DSS
ZTE SuperDSS/Magic Radio Pro
The Dynamic Spectrum Sharing (DSS) solution allows mobile network operators tooffer LTE and NR services using the same frequency bands, although in an interleavedmode. This allows NR services without the need of acquiring new and dedicated frequencyspectrum, antenna, or radio frequency units. The solution is intended to assist operators inthe short-term rollout deployment of 5G services through LTE already-in-use spectrum. It isnot intended to provide substantial performance, as that would necessitate new dedicatedspectrum for NR, but to provide coverage, reduce costs, and improve spectrum efficiencyfor the operator. Figure 1 presents the DSS technology with LTE and NR sharing the samefrequency band in comparison to using two separate bands for each technology.
Sensors 2021, 21, 4215 3 of 16
between massive IoT connections and limited spectrum resources as it was discussed in
[22–25]. It can also be used to solve vertical requirements and the competition in the ac‐
quisition of frequency bands between MNOs [26,27], as well as to improve spectrum uti‐
lization in Cognitive Radio (CR) and TV white space [28–30]. The leading mobile produc‐
ers have shown massive interest in developing solutions for dynamic spectrum sharing.
These are presented in Table 2.
Table 2. Leading producers and adopted DSS solution.
Leading Producers Name of DSS Solution
Ericsson ESS—Ericsson Spectrum Sharing
Huawei CloudAIR
MediaTeck Dimensity 1000
Nokia Dynamic Spectrum Sharing (DSS)
QualComm Snapdragon X60
Samsung DSS
ZTE SuperDSS/Magic Radio Pro
The Dynamic Spectrum Sharing (DSS) solution allows mobile network operators to
offer LTE and NR services using the same frequency bands, although in an interleaved
mode. This allows NR services without the need of acquiring new and dedicated fre‐
quency spectrum, antenna, or radio frequency units. The solution is intended to assist
operators in the short‐term rollout deployment of 5G services through LTE already‐in‐use
spectrum. It is not intended to provide substantial performance, as that would necessitate
new dedicated spectrum for NR, but to provide coverage, reduce costs, and improve spec‐
trum efficiency for the operator. Figure 1 presents the DSS technology with LTE and NR
sharing the same frequency band in comparison to using two separate bands for each
technology.
Figure 1. DSS vs. using dedicated bands for NR and LTE [31].
The deploying of DSS technology is divided into two phases: Phase 1, which is based
only on the NSA architecture and accepts a sharing ratio between 20 and 60% with a fixed
UL sharing ratio; and Phase 2, which introduces a dynamic UL sharing ratio and accepts
both NSA and SA architectures. The main differences between both phases are presented
in Table 3. The sharing ratio refers to the ratio of shared resources between both technol‐
ogies. For example, considering a sharing ratio of 20% refers to 5G NR occupying 20% of
the available resources, while LTE occupies 80%. Another example is for a sharing ratio
of 60%, meaning that 5G NR uses 60% of the available resources while LTE uses only 40%.
Figure 1. DSS vs. using dedicated bands for NR and LTE [31].
The deploying of DSS technology is divided into two phases: Phase 1, which is basedonly on the NSA architecture and accepts a sharing ratio between 20 and 60% with a fixedUL sharing ratio; and Phase 2, which introduces a dynamic UL sharing ratio and acceptsboth NSA and SA architectures. The main differences between both phases are presented inTable 3. The sharing ratio refers to the ratio of shared resources between both technologies.For example, considering a sharing ratio of 20% refers to 5G NR occupying 20% of theavailable resources, while LTE occupies 80%. Another example is for a sharing ratio of 60%,meaning that 5G NR uses 60% of the available resources while LTE uses only 40%.
For downlink, the allocation of the subframes is based on Time Division Multiplexing(TDM). In one frame, regardless of the sharing ratio adopted, subframes 0, 5, and 9 arestrictly dedicated to LTE transmission. Subframes 1, 2, 3, 4, 6, 7, and 8 can be used forboth LTE and NR transmission, depending on the sharing ratio and the architecture modeadopted, see Figure 2 [32].

Sensors 2021, 21, 4215 4 of 15
Table 3. Comparisons between two phases of DSS implementation.
Phase 1 Phase 2
Sharing ratio 20–60% Sharing ratio 5–70%Fixed UL sharing ratio Dynamic UL sharing ratioOnly NSA architecture NSA and SA architectures
Supports only FDD Supports FDD and TDDSharing ratio update is slow Sharing ratio update takes up to 100 ms
Sensors 2021, 21, 4215 4 of 16
Table 3. Comparisons between two phases of DSS implementation.
Phase 1 Phase 2
Sharing ratio 20–60% Sharing ratio 5–70%
Fixed UL sharing ratio Dynamic UL sharing ratio
Only NSA architecture NSA and SA architectures
Supports only FDD Supports FDD and TDD
Sharing ratio update is slow Sharing ratio update takes up to 100 ms
For downlink, the allocation of the subframes is based on Time Division Multiplexing
(TDM). In one frame, regardless of the sharing ratio adopted, subframes 0, 5, and 9 are
strictly dedicated to LTE transmission. Subframes 1, 2, 3, 4, 6, 7, and 8 can be used for both
LTE and NR transmission, depending on the sharing ratio and the architecture mode
adopted, see Figure 2 [32].
Figure 2. Frame allocation for DL Phase 2 DSS [32].
The downlink resource allocation, when considering the transmission of several
frames, varies depending on the sharing ratio implemented [33]. Different patterns are
depicted in Figure 3, for the NSA architecture mode. It can be observed that for every
frame, subframes 0, 5, and 9 are always dedicated to LTE. In addition, for the first frame
only, slot 1 is represented with yellow (slot type B) and slot 2 with orange (slot type B*),
and both are used for transmitting synchronization and CSI‐RS signals, respectively. Ad‐
ditional synchronization signals are sent with a period of 20 ms in slot 1 of the remaining
frames, represented by green (slot type B**). The remaining slots are used for LTE and NR
transmission.
Figure 3. Resource allocation patterns for DL Phase 2 DSS [34].
Figure 2. Frame allocation for DL Phase 2 DSS [32].
The downlink resource allocation, when considering the transmission of severalframes, varies depending on the sharing ratio implemented [33]. Different patterns aredepicted in Figure 3, for the NSA architecture mode. It can be observed that for everyframe, subframes 0, 5, and 9 are always dedicated to LTE. In addition, for the first frameonly, slot 1 is represented with yellow (slot type B) and slot 2 with orange (slot typeB*), and both are used for transmitting synchronization and CSI-RS signals, respectively.Additional synchronization signals are sent with a period of 20 ms in slot 1 of the remainingframes, represented by green (slot type B**). The remaining slots are used for LTE andNR transmission.
Sensors 2021, 21, 4215 4 of 16
Table 3. Comparisons between two phases of DSS implementation.
Phase 1 Phase 2
Sharing ratio 20–60% Sharing ratio 5–70%
Fixed UL sharing ratio Dynamic UL sharing ratio
Only NSA architecture NSA and SA architectures
Supports only FDD Supports FDD and TDD
Sharing ratio update is slow Sharing ratio update takes up to 100 ms
For downlink, the allocation of the subframes is based on Time Division Multiplexing
(TDM). In one frame, regardless of the sharing ratio adopted, subframes 0, 5, and 9 are
strictly dedicated to LTE transmission. Subframes 1, 2, 3, 4, 6, 7, and 8 can be used for both
LTE and NR transmission, depending on the sharing ratio and the architecture mode
adopted, see Figure 2 [32].
Figure 2. Frame allocation for DL Phase 2 DSS [32].
The downlink resource allocation, when considering the transmission of several
frames, varies depending on the sharing ratio implemented [33]. Different patterns are
depicted in Figure 3, for the NSA architecture mode. It can be observed that for every
frame, subframes 0, 5, and 9 are always dedicated to LTE. In addition, for the first frame
only, slot 1 is represented with yellow (slot type B) and slot 2 with orange (slot type B*),
and both are used for transmitting synchronization and CSI‐RS signals, respectively. Ad‐
ditional synchronization signals are sent with a period of 20 ms in slot 1 of the remaining
frames, represented by green (slot type B**). The remaining slots are used for LTE and NR
transmission.
Figure 3. Resource allocation patterns for DL Phase 2 DSS [34]. Figure 3. Resource allocation patterns for DL Phase 2 DSS [34].

Sensors 2021, 21, 4215 5 of 15
For uplink, the allocation of the resources is based on Frequency Division Multiplexing(FDM). As depicted in Figure 4, the Physical Resource Blocks (PRB) available for LTE orNR transmission are represented by the color green and depend on the sharing ratioadopted and carrier bandwidth. Furthermore, there are seven PRBs dedicated to NR ULtransmission only, represented by the color yellow in the right outer edge of the frequencyband. These PRBs depend on the positioning of the LTE PRACH PRBs. In Figure 4, theseare located in the left outer edge of the frequency band. If the LTE PRACH PRBs werelocated in the right outer edge, the seven NR UL PRBs would then be positioned in the leftouter edge (meaning the opposite side).
Sensors 2021, 21, 4215 5 of 16
For uplink, the allocation of the resources is based on Frequency Division Multiplex‐
ing (FDM). As depicted in Figure 4, the Physical Resource Blocks (PRB) available for LTE
or NR transmission are represented by the color green and depend on the sharing ratio
adopted and carrier bandwidth. Furthermore, there are seven PRBs dedicated to NR UL
transmission only, represented by the color yellow in the right outer edge of the frequency
band. These PRBs depend on the positioning of the LTE PRACH PRBs. In Figure 4, these
are located in the left outer edge of the frequency band. If the LTE PRACH PRBs were
located in the right outer edge, the seven NR UL PRBs would then be positioned in the
left outer edge (meaning the opposite side).
Figure 4. Resource allocation for UL Phase 2 DSS [34].
The calculation of the maximum available NR/LTE sharing ratio is given by the fol‐
lowing equation:
Sharing ratioMax_UL
= 1‐N + PUCCHMax_LTE
LTE BW in PRBs (1)
where N represents the number of PRBs that are necessary for LTE transmission, for in‐
stance, the LTE PRACH PRBs.
In this paper, we studied the concept of dynamic spectrum sharing between LTE and
5G NR technologies for the same mobile network operator. We assessed the performance
of an LTE‐NR communication system using the DSS feature, in terms of throughput, using
different sharing ratios for both NSA and SA architectures and for both transmission di‐
rections (downlink and uplink). We performed a comparison of the performance while
using different modulation schemes and numbers of layers. The remainder of the paper
is organized as follows. Section 2 presents the sharing ratio calculation for downlink and
uplink; Section 3 provides the equipment and methods used for the measurements; and
Section 4 presents the results obtained and analysis. Lastly, Section 5 delivers the conclu‐
sions of this paper.
2. Sharing Ratio Calculation
The sharing ratio between LTE and NR is defined and managed by a new system unit
denominated Common Resource Manager (CRM). It has the responsibility to compute the
sharing ratio and update it according to traffic demands. In order to do so, the CRM con‐
tinuously gathers information from both LTE and NR sites. The CRM component is com‐
posed by 3 objects: CRM, situated in the base station; LTE CRM, situated in the LTE sys‐
tem unit; NR CRM, situated in the NR system unit. Figure 5 presents the main
Figure 4. Resource allocation for UL Phase 2 DSS [34].
The calculation of the maximum available NR/LTE sharing ratio is given by thefollowing equation:
Sharing ratioMax_UL = 1 −(
N + PUCCHMax_LTE
LTE BW in PRBs
)(1)
where N represents the number of PRBs that are necessary for LTE transmission, forinstance, the LTE PRACH PRBs.
In this paper, we studied the concept of dynamic spectrum sharing between LTE and5G NR technologies for the same mobile network operator. We assessed the performanceof an LTE-NR communication system using the DSS feature, in terms of throughput, usingdifferent sharing ratios for both NSA and SA architectures and for both transmissiondirections (downlink and uplink). We performed a comparison of the performance whileusing different modulation schemes and numbers of layers. The remainder of the paperis organized as follows. Section 2 presents the sharing ratio calculation for downlinkand uplink; Section 3 provides the equipment and methods used for the measurements;and Section 4 presents the results obtained and analysis. Lastly, Section 5 delivers theconclusions of this paper.
2. Sharing Ratio Calculation
The sharing ratio between LTE and NR is defined and managed by a new system unitdenominated Common Resource Manager (CRM). It has the responsibility to computethe sharing ratio and update it according to traffic demands. In order to do so, the CRMcontinuously gathers information from both LTE and NR sites. The CRM componentis composed by 3 objects: CRM, situated in the base station; LTE CRM, situated in theLTE system unit; NR CRM, situated in the NR system unit. Figure 5 presents the mainresponsibilities of the CRM. Initially, it starts by gathering information from LTE and NR

Sensors 2021, 21, 4215 6 of 15
sites and, based on the information receives, it defines the resources to be shared. It thenallocates the shared resources to both technologies. According to traffic conditions anddemands for a specific moment, it evaluates the optimal sharing ratio to be selected andfinally updates it for LTE and NR.
Sensors 2021, 21, 4215 6 of 16
responsibilities of the CRM. Initially, it starts by gathering information from LTE and NR
sites and, based on the information receives, it defines the resources to be shared. It then
allocates the shared resources to both technologies. According to traffic conditions and
demands for a specific moment, it evaluates the optimal sharing ratio to be selected and
finally updates it for LTE and NR.
Figure 5. CRM main responsibilities [31].
For downlink, depending on the traffic demands for a specific moment, the CRM
receives information concerning load indication and takes a decision on the DL sharing
ratio that needs to be adopted. To calculate the DL load, the weighted load (based on PRB
occupancy), average LTE DSS Guaranteed Bit Rate (GBR) load, NR DSS GBR load, and
NR PDCCH load need to be determined [35]. The algorithm for the sharing ratio calcula‐
tion for DL is presented in Figure 6. The first step consists of the verification, from the
CRM entity, of the average LTE GBR load, as well as the NR PDCCH load against a de‐
fined threshold, so that a decision can be taken regarding the resources to be assigned. If
the average LTE GBR load is higher than 70% and the NR PDCCH load is lower than 70%,
then the sharing ratio for NR will decrease. Else, if the average LTE GBR load is equal or
lower than 70% and the NR PDCCH load is higher than 70%, then the sharing ratio for
NR will increase. Lastly, if both the average LTE GBR load and NR PDCCH load are
higher than 70%, then one of the two following conditions is applied:
If the LTE GBR resource delta (n; n − 1) > 0, the sharing ratio for NR will be reduced;
If the LTE GBR resource delta (n; n − 1) ≤ 0 and the NR PDCCH resource delta (n; n −
1) > 0, the sharing ratio for NR will increase.
The second step of the algorithm is based on the load information received from step
1. The CRM then calculates the LTE‐weighted load and the NR weighted load, from which
the LTE and NR total loads are determined. Finally, in step 3, the number of LTE and NR
subframes is calculated, taking into account the LTE and NR total loads from step 2. The
resulting number of subframes matches to a specific sharing ratio value.
Figure 5. CRM main responsibilities [31].
For downlink, depending on the traffic demands for a specific moment, the CRMreceives information concerning load indication and takes a decision on the DL sharingratio that needs to be adopted. To calculate the DL load, the weighted load (based on PRBoccupancy), average LTE DSS Guaranteed Bit Rate (GBR) load, NR DSS GBR load, and NRPDCCH load need to be determined [35]. The algorithm for the sharing ratio calculationfor DL is presented in Figure 6. The first step consists of the verification, from the CRMentity, of the average LTE GBR load, as well as the NR PDCCH load against a definedthreshold, so that a decision can be taken regarding the resources to be assigned. If theaverage LTE GBR load is higher than 70% and the NR PDCCH load is lower than 70%,then the sharing ratio for NR will decrease. Else, if the average LTE GBR load is equal orlower than 70% and the NR PDCCH load is higher than 70%, then the sharing ratio for NRwill increase. Lastly, if both the average LTE GBR load and NR PDCCH load are higherthan 70%, then one of the two following conditions is applied:
• If the LTE GBR resource delta (n; n − 1) > 0, the sharing ratio for NR will be reduced;• If the LTE GBR resource delta (n; n − 1) ≤ 0 and the NR PDCCH resource delta
(n; n − 1) > 0, the sharing ratio for NR will increase.
The second step of the algorithm is based on the load information received from step1. The CRM then calculates the LTE-weighted load and the NR weighted load, from whichthe LTE and NR total loads are determined. Finally, in step 3, the number of LTE and NRsubframes is calculated, taking into account the LTE and NR total loads from step 2. Theresulting number of subframes matches to a specific sharing ratio value.

Sensors 2021, 21, 4215 7 of 15
1
Figure 6. Algorithm for DL Phase 2 DSS sharing ratio calculation [34].
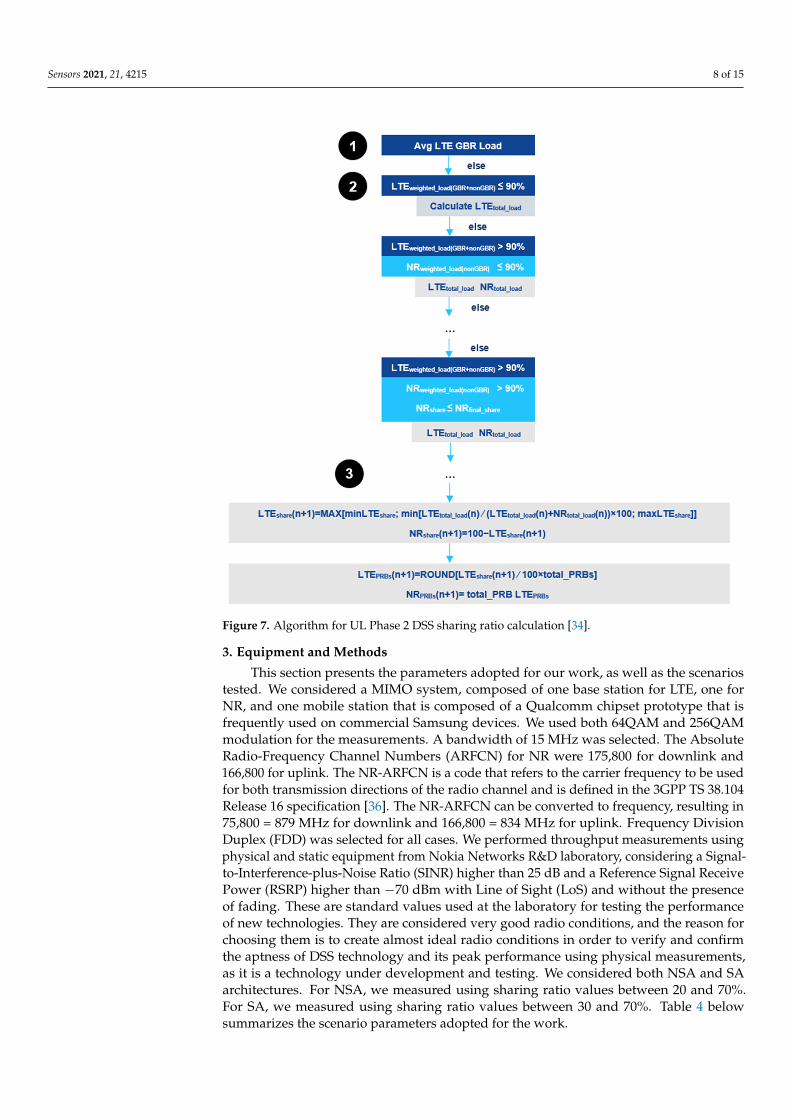
For uplink, a similar procedure as for downlink is taken. Depending on the trafficdemands for a specific moment, the CRM receives information concerning load indicationand takes a decision on the UL sharing ratio that needs to be adopted. To calculate the ULload, the weighted load (based on PRB occupancy) and the average LTE DSS GBR loadneed to be determined. Figure 7 presents the algorithm for the UL sharing ratio calculation.For step 1, the average LTE GBR load is verified by the CRM, so a decision can be takenregarding the assignment of resources. If the average LTE GBR load is higher than 70%,then the sharing ratio for NR will be decreased. The second step of the algorithm is basedon the load information received from step 1. The CRM then calculates the LTE weightedload and the NR weighted load, from which the LTE and NR total loads are determined.Finally, in step 3, the number of LTE and NR subframes is calculated, taking into accountthe LTE and NR total loads from step 2. The resulting number of subframes matches to aspecific sharing ratio value.
Sensors 2021, 21, 4215 8 of 15Sensors 2021, 21, 4215 8 of 16
Figure 7. Algorithm for UL Phase 2 DSS sharing ratio calculation [34].
3. Equipment and Methods
This section presents the parameters adopted for our work, as well as the scenarios
tested. We considered a MIMO system, composed of one base station for LTE, one for NR,
and one mobile station that is composed of a Qualcomm chipset prototype that is fre‐
quently used on commercial Samsung devices. We used both 64QAM and 256QAM mod‐
ulation for the measurements. A bandwidth of 15 MHz was selected. The Absolute Radio‐
Frequency Channel Numbers (ARFCN) for NR were 175,800 for downlink and 166,800 for
uplink. The NR‐ARFCN is a code that refers to the carrier frequency to be used for both
transmission directions of the radio channel and is defined in the 3GPP TS 38.104 Release
16 specification [36]. The NR‐ARFCN can be converted to frequency, resulting in 75,800 =
879 MHz for downlink and 166,800 = 834 MHz for uplink. Frequency Division Duplex
(FDD) was selected for all cases. We performed throughput measurements using physical
and static equipment from Nokia Networks R&D laboratory, considering a Signal‐to‐In‐
terference‐plus‐Noise Ratio (SINR) higher than 25 dB and a Reference Signal Receive
Power (RSRP) higher than −70 dBm with Line of Sight (LoS) and without the presence of
fading. These are standard values used at the laboratory for testing the performance of
new technologies. They are considered very good radio conditions, and the reason for
choosing them is to create almost ideal radio conditions in order to verify and confirm the
aptness of DSS technology and its peak performance using physical measurements, as it
is a technology under development and testing. We considered both NSA and SA archi‐
tectures. For NSA, we measured using sharing ratio values between 20 and 70%. For SA,
we measured using sharing ratio values between 30 and 70%. Table 4 below summarizes
the scenario parameters adopted for the work.
Figure 7. Algorithm for UL Phase 2 DSS sharing ratio calculation [34].
3. Equipment and Methods
This section presents the parameters adopted for our work, as well as the scenariostested. We considered a MIMO system, composed of one base station for LTE, one forNR, and one mobile station that is composed of a Qualcomm chipset prototype that isfrequently used on commercial Samsung devices. We used both 64QAM and 256QAMmodulation for the measurements. A bandwidth of 15 MHz was selected. The AbsoluteRadio-Frequency Channel Numbers (ARFCN) for NR were 175,800 for downlink and166,800 for uplink. The NR-ARFCN is a code that refers to the carrier frequency to be usedfor both transmission directions of the radio channel and is defined in the 3GPP TS 38.104Release 16 specification [36]. The NR-ARFCN can be converted to frequency, resulting in75,800 = 879 MHz for downlink and 166,800 = 834 MHz for uplink. Frequency DivisionDuplex (FDD) was selected for all cases. We performed throughput measurements usingphysical and static equipment from Nokia Networks R&D laboratory, considering a Signal-to-Interference-plus-Noise Ratio (SINR) higher than 25 dB and a Reference Signal ReceivePower (RSRP) higher than −70 dBm with Line of Sight (LoS) and without the presenceof fading. These are standard values used at the laboratory for testing the performanceof new technologies. They are considered very good radio conditions, and the reason forchoosing them is to create almost ideal radio conditions in order to verify and confirmthe aptness of DSS technology and its peak performance using physical measurements,as it is a technology under development and testing. We considered both NSA and SAarchitectures. For NSA, we measured using sharing ratio values between 20 and 70%.For SA, we measured using sharing ratio values between 30 and 70%. Table 4 belowsummarizes the scenario parameters adopted for the work.

Sensors 2021, 21, 4215 9 of 15
Table 4. Set of parameters adopted for our work.
Case Direction Bandwidth Nr. of Layers Modulation MIMO
1 DL 15 2 64QAM 2 × 22 DL 15 2 256QAM 2 × 23 DL 15 4 64QAM 4 × 44 DL 15 4 256QAM 4 × 45 UL 15 1 64QAM 1 × 1
Each network architecture type has different possible variations. The NSA architectureis based on the LTE core network and uses LTE-based interfaces. For this type of architec-ture, the gNodeB needs to support these interfaces and acts as a secondary node, while theeNodeB acts as a primary or master node. There are different options to deploy an NSAarchitecture—option 3, 3a, 3x, 4, 4a, 7, and 7a. The option used for our measurements isNSA option 3x, where the control plane is routed through the master eNodeB and the userplane is directly routed through the secondary gNodeB. The eNodeB also communicatesdirectly with the gNodeB and both communicate directly with the Evolved Packet Core(EPC). The SA architecture has 2 options—option 2 and 5. Option 2 is that adopted forour work and, as it can be seen in Figure 8b, consists of a Next Generation Core (NGC)and a gNodeB that communicates directly with it, without needing any support of LTEstructures. For both network architectures studied, we used two radio modules that haveattached to them one attenuator, as the measurements were performed in a laboratorywith close proximity to the mobile user. We used either 2 or 4 antennas, depending on thecase studied.
Sensors 2021, 21, 4215 9 of 16
Table 4. Set of parameters adopted for our work.
Case Direction Bandwidth Nr. of Layers Modulation MIMO
1 DL 15 2 64QAM 2 × 2
2 DL 15 2 256QAM 2 × 2
3 DL 15 4 64QAM 4 × 4
4 DL 15 4 256QAM 4 × 4
5 UL 15 1 64QAM 1 × 1
Each network architecture type has different possible variations. The NSA architec‐
ture is based on the LTE core network and uses LTE‐based interfaces. For this type of
architecture, the gNodeB needs to support these interfaces and acts as a secondary node,
while the eNodeB acts as a primary or master node. There are different options to deploy
an NSA architecture—option 3, 3a, 3x, 4, 4a, 7, and 7a. The option used for our measure‐
ments is NSA option 3x, where the control plane is routed through the master eNodeB
and the user plane is directly routed through the secondary gNodeB. The eNodeB also
communicates directly with the gNodeB and both communicate directly with the Evolved
Packet Core (EPC). The SA architecture has 2 options—option 2 and 5. Option 2 is that
adopted for our work and, as it can be seen in Figure 8b, consists of a Next Generation
Core (NGC) and a gNodeB that communicates directly with it, without needing any sup‐
port of LTE structures. For both network architectures studied, we used two radio mod‐
ules that have attached to them one attenuator, as the measurements were performed in
a laboratory with close proximity to the mobile user. We used either 2 or 4 antennas, de‐
pending on the case studied.
(a) (b)
Figure 8. Architecture diagram adopted for the measurements: (a) NSA architecture; (b) SA archi‐
tecture. Figure 8. Architecture diagram adopted for the measurements: (a) NSA architecture; (b) SA architecture.

Sensors 2021, 21, 4215 10 of 15
4. Results and Discussion
This section presents the results obtained from our measurements. We divide it intotwo subsections: downlink and uplink results. In each subsection, we present results forboth NSA and SA architectures. We considered sharing ratios ranging from 20 to 70% for theNSA architecture and from 30 to 70% for the SA architecture, meaning that 5G NR occupiesbetween 20 and 70%, and 30 and 70% of the available resources, while LTE occupies between80 and 30%, and 70 and 30% for the NSA and SA architectures, respectively.
4.1. Downlink
Figure 9 presents the throughput results using the DSS feature from the first four casesof Table 2, comprising the NSA architecture. The differences between the cases consist ofthe modulation type, that is either 64QAM or 256QAM modulation, and MIMO type, thatis either 2 × 2 or 4 × 4 MIMO. Each case depicts five different curves. The green (NR only)and purple (LTE only) curves represent the values for the throughput achieved without theuse of DSS technology. The yellow curve (DSS LTE + NR) is the most important one as itpresents the total throughput obtained with DSS. The remaining blue (DSS LTE) and red(DSS NR) curves represent the individual throughputs for each technology while usingDSS. Notice that the DSS LTE + NR throughput equals the sum of the individual DSSLTE and DSS NR throughputs. It can be observed that, for all cases, when we increasedthe sharing ratio, the values for the DSS NR TP also increased while the DSS LTE TPvalues decreased. This was an expected behavior, as the higher the sharing ratio, the moreresources will be available for NR transmission and the fewer for LTE transmission. It canalso be observed that from a sharing ratio of approximately 57%, meaning that NR occupies57% of the resources while LTE occupies 43%, the individual throughput for NR surpassedthe LTE throughput. In addition, it is visible that the overall throughput using DSS wasslightly lower than that for the LTE or NR-only throughputs. This is understandable, as theavailable frame resources are shared between both technologies.
Comparing case 1 and case 2, where the difference is the modulation type that increasesfrom 64QAM to 256QAM modulation, it can be concluded that the major difference is onthe maximum values for throughput. For case 1, depending on the sharing ratio adopted,between 90 and 100 Mbps were obtained, while for case 2, the values for throughput wereapproximately 120–135 Mbps. An increase of 35% was observed. A similar comparisoncan be conducted for cases 3 and 4. For case 3, the maximum DSS throughput values were175–200 Mbps, while for case 4, the values varied between 240 and 260 Mbps, dependingon the sharing ratio. For these cases, an increase of 37% in throughput was observed for asharing ratio of 20%, while for a 70% sharing ratio, the throughput increase was 30% (seeTable 5).
Sensors 2021, 21, 4215 10 of 16
4. Results and Discussion
This section presents the results obtained from our measurements. We divide it into
two subsections: downlink and uplink results. In each subsection, we present results for
both NSA and SA architectures. We considered sharing ratios ranging from 20 to 70% for
the NSA architecture and from 30 to 70% for the SA architecture, meaning that 5G NR
occupies between 20 and 70%, and 30 and 70% of the available resources, while LTE oc‐
cupies between 80 and 30%, and 70 and 30% for the NSA and SA architectures, respec‐
tively.
4.1. Downlink
Figure 9 presents the throughput results using the DSS feature from the first four
cases of Table 2, comprising the NSA architecture. The differences between the cases con‐
sist of the modulation type, that is either 64QAM or 256QAM modulation, and MIMO
type, that is either 2 × 2 or 4 × 4 MIMO. Each case depicts five different curves. The green
(NR only) and purple (LTE only) curves represent the values for the throughput achieved
without the use of DSS technology. The yellow curve (DSS LTE + NR) is the most im‐
portant one as it presents the total throughput obtained with DSS. The remaining blue
(DSS LTE) and red (DSS NR) curves represent the individual throughputs for each tech‐
nology while using DSS. Notice that the DSS LTE + NR throughput equals the sum of the
individual DSS LTE and DSS NR throughputs. It can be observed that, for all cases, when
we increased the sharing ratio, the values for the DSS NR TP also increased while the DSS
LTE TP values decreased. This was an expected behavior, as the higher the sharing ratio,
the more resources will be available for NR transmission and the fewer for LTE transmis‐
sion. It can also be observed that from a sharing ratio of approximately 57%, meaning that
NR occupies 57% of the resources while LTE occupies 43%, the individual throughput for
NR surpassed the LTE throughput. In addition, it is visible that the overall throughput
using DSS was slightly lower than that for the LTE or NR‐only throughputs. This is un‐
derstandable, as the available frame resources are shared between both technologies.
(a) (b)
Figure 9. Cont.

Sensors 2021, 21, 4215 11 of 15Sensors 2021, 21, 4215 11 of 16
(c) (d)
Figure 9. DL throughput results for NSA architecture, with sharing ratios from 20% up to 70%: (a) Case 1 results; (b) Case
2 results; (c) Case 3 results; (d) Case 4 results.
Comparing case 1 and case 2, where the difference is the modulation type that in‐
creases from 64QAM to 256QAM modulation, it can be concluded that the major differ‐
ence is on the maximum values for throughput. For case 1, depending on the sharing ratio
adopted, between 90 and 100 Mbps were obtained, while for case 2, the values for
throughput were approximately 120–135 Mbps. An increase of 35% was observed. A sim‐
ilar comparison can be conducted for cases 3 and 4. For case 3, the maximum DSS through‐
put values were 175–200 Mbps, while for case 4, the values varied between 240 and 260
Mbps, depending on the sharing ratio. For these cases, an increase of 37% in throughput
was observed for a sharing ratio of 20%, while for a 70% sharing ratio, the throughput
increase was 30% (see Table 5).
Table 5. DL throughput results for DSS LTE + NR in Mbps.
DL NSA DSS LTE + NR (Mbps) DL SA DSS LTE + NR (Mbps)
30% 40% 50% 60% 70% 30% 40% 50% 60% 70%
Case 1 97.5 95.9 94.4 92.9 91.4 90.9 88.3 85.8 83.2 80.7
Case 2 132.9 130.6 128.3 126 123.8 123.9 120.1 116.4 112.7 109
Case 3 192.6 188.8 185 181.2 177.4 179.8 174 168.1 162.3 156.5
Case 4 257.1 251.4 245.7 240 234 239.9 231.3 222.7 214.2 205.6
Regarding case 1 and case 3, where the difference consists of the number of transmit‐
ting and receiving antennas, 2 × 2 MIMO and 4 × 4 MIMO, respectively, an increase in all
throughput values of approximately 50% could be observed, along with an increase in
complexity.
Figure 10 depicts the DL throughput results with the DSS feature for the first four
cases from Table 2, using the SA architecture, contrary to the results from Figure 8 that
made use of the NSA architecture. The main difference of both types of architectures is
that NSA is an intermediary solution that is based on the LTE network, while the SA ar‐
chitecture does not depend in any way on the LTE network, using a Next‐Generation Core
(NGC) along with NR protocols. Moreover, the SA architecture leads to an improved ef‐
ficiency with less complexity. Comparing case 1 and case 2, we can observe that maximum
DSS throughput values varied between 80 and 90 Mbps, and 110 and 120 Mbps, respec‐
tively. The increase from one case to another was approximately 36%. For cases 3 and 4,
the DSS values varied between 160 and 180 Mbps, and 200 and 240 Mbps, respectively.
For these, an increase of approximately 29% was observed.
Figure 9. DL throughput results for NSA architecture, with sharing ratios from 20% up to 70%: (a) Case 1 results; (b) Case 2results; (c) Case 3 results; (d) Case 4 results.
Table 5. DL throughput results for DSS LTE + NR in Mbps.
DL NSA DSS LTE + NR (Mbps) DL SA DSS LTE + NR (Mbps)
30% 40% 50% 60% 70% 30% 40% 50% 60% 70%Case 1 97.5 95.9 94.4 92.9 91.4 90.9 88.3 85.8 83.2 80.7Case 2 132.9 130.6 128.3 126 123.8 123.9 120.1 116.4 112.7 109Case 3 192.6 188.8 185 181.2 177.4 179.8 174 168.1 162.3 156.5Case 4 257.1 251.4 245.7 240 234 239.9 231.3 222.7 214.2 205.6
Regarding case 1 and case 3, where the difference consists of the number of transmit-ting and receiving antennas, 2 × 2 MIMO and 4 × 4 MIMO, respectively, an increase inall throughput values of approximately 50% could be observed, along with an increasein complexity.
Figure 10 depicts the DL throughput results with the DSS feature for the first four casesfrom Table 2, using the SA architecture, contrary to the results from Figure 8 that made useof the NSA architecture. The main difference of both types of architectures is that NSA isan intermediary solution that is based on the LTE network, while the SA architecture doesnot depend in any way on the LTE network, using a Next-Generation Core (NGC) alongwith NR protocols. Moreover, the SA architecture leads to an improved efficiency with lesscomplexity. Comparing case 1 and case 2, we can observe that maximum DSS throughputvalues varied between 80 and 90 Mbps, and 110 and 120 Mbps, respectively. The increasefrom one case to another was approximately 36%. For cases 3 and 4, the DSS values variedbetween 160 and 180 Mbps, and 200 and 240 Mbps, respectively. For these, an increase ofapproximately 29% was observed.
Regarding case 2 and case 4, the increase in the DSS throughput was approximately87% for both sharing ratios of 30% and 70%. In addition, it can be remarked that for allcases, the values for the NR-only throughput for the SA architecture were smaller thanthose of the NSA architecture, with a difference of around 15 Mbps for case 1, 20 Mbps forcases 2 and 3, and 40 Mbps for case 4. The reason for this is that in the SA architecture, thenumber of broadcast signals was higher than that in the NSA architecture. An example isthe presence of System Information Block (SIB) signals, as well as paging with informationregarding the cell.

Sensors 2021, 21, 4215 12 of 15Sensors 2021, 21, 4215 12 of 16
(a) (b)
(c) (d)
Figure 10. DL throughput results for SA architecture, with sharing ratios from 30% up to 70%: (a) Case 1 results; (b) Case
2 results; (c) Case 3 results; (d) Case 4 results.
Regarding case 2 and case 4, the increase in the DSS throughput was approximately
87% for both sharing ratios of 30% and 70%. In addition, it can be remarked that for all
cases, the values for the NR‐only throughput for the SA architecture were smaller than
those of the NSA architecture, with a difference of around 15 Mbps for case 1, 20 Mbps for
cases 2 and 3, and 40 Mbps for case 4. The reason for this is that in the SA architecture, the
number of broadcast signals was higher than that in the NSA architecture. An example is
the presence of System Information Block (SIB) signals, as well as paging with information
regarding the cell.
Table 6 provides the percentage loss of the throughput that occurs when using DSS
instead of an NR‐only system. It can be observed that there was a loss in throughput val‐
ues between a minimum of 10% and a maximum of 26%, depending on the sharing ratio
and case adopted. The existence of a decrease in throughput was expected, as with DSS,
the available resources are shared with LTE, and hence, there are fewer resources availa‐
ble for NR, compared to a system that is based only on NR. However, from the results
obtained, for the NSA architecture, having a loss between 14 and 25% is not a considerable
decrease taking in account the fact that there is no need for new dedicated spectrum to be
allocated for NR, as it shares the bandwidth with LTE technology. For case 1, the average
loss was 19.8% for NSA and 17.2% for SA. For case 2, the loss was 17.5% for NSA and
15.6% for SA. For case 3, we had a 21.2% loss for NSA and 19% for SA. Lastly, for case 4,
the loss was 20.6% for NSA and 19.2% for SA.
Figure 10. DL throughput results for SA architecture, with sharing ratios from 30% up to 70%: (a) Case 1 results; (b) Case 2results; (c) Case 3 results; (d) Case 4 results.
Table 6 provides the percentage loss of the throughput that occurs when using DSSinstead of an NR-only system. It can be observed that there was a loss in throughput valuesbetween a minimum of 10% and a maximum of 26%, depending on the sharing ratio andcase adopted. The existence of a decrease in throughput was expected, as with DSS, theavailable resources are shared with LTE, and hence, there are fewer resources available forNR, compared to a system that is based only on NR. However, from the results obtained,for the NSA architecture, having a loss between 14 and 25% is not a considerable decreasetaking in account the fact that there is no need for new dedicated spectrum to be allocatedfor NR, as it shares the bandwidth with LTE technology. For case 1, the average loss was19.8% for NSA and 17.2% for SA. For case 2, the loss was 17.5% for NSA and 15.6% for SA.For case 3, we had a 21.2% loss for NSA and 19% for SA. Lastly, for case 4, the loss was20.6% for NSA and 19.2% for SA.
We can observe that the decrease in the DSS throughput was higher with the increasein the sharing ratio. This is due to the fact that, as the sharing ratio increases (meaning thata higher number of the available resources were used for NR transmission and fewer forLTE), more synchronization signals are transmitted in the slots dedicated to NR, as well asoverhead signals.

Sensors 2021, 21, 4215 13 of 15
Table 6. Loss of DL throughput, in %, of the DSS LTE + NR value in comparison to NR only.
Sharing Ratio 20% 30% 40% 50% 60% 70% 30% 40% 50% 60% 70%
NSA ARCHITECTURE SA ARCHITECTURE
Case 1 −17% −18% −19% −20% −22% −23% −12% −15% −17% −20% −22%Case 2 −14% −15% −17% −18% −20% −21% −10% −13% −16% −18% −21%Case 3 −17% −19% −20% −22% −24% −25% −13% −16% −19% −22% −25%Case 4 −16% −18% −20% −22% −23% −25% −13% −16% −19% −22% −26%
4.2. Uplink
Figure 11 depicts the UL throughput results for case 5 from Table 6, using both NSAand SA architecture. Regarding the NSA architecture, it can be observed that the maximumthroughput values for LTE and NR only (not considering the DSS feature) were 40 and22 Mbps, respectively. Moreover, if we compare the results of the DSS LTE + NR andNR-only throughputs from both architecture types, we can conclude that they were similar.Therefore, there is no difference between the SA and NSA architecture, as there are noadditional channels that need to be transmitted and hence occupy extra resources.
Sensors 2021, 21, 4215 13 of 16
Table 6. Loss of DL throughput, in %, of the DSS LTE + NR value in comparison to NR only.
Sharing
Ratio 20% 30% 40% 50% 60% 70% 30% 40% 50% 60% 70%
NSA ARCHITECTURE SA ARCHITECTURE
Case 1 −17% −18% −19% −20% −22% −23% −12% −15% −17% −20% −22%
CASE 2 −14% −15% −17% −18% −20% −21% −10% −13% −16% −18% −21%
CASE 3 −17% −19% −20% −22% −24% −25% −13% −16% −19% −22% −25%
CASE 4 −16% −18% −20% −22% −23% −25% −13% −16% −19% −22% −26%
We can observe that the decrease in the DSS throughput was higher with the increase
in the sharing ratio. This is due to the fact that, as the sharing ratio increases (meaning that
a higher number of the available resources were used for NR transmission and fewer for
LTE), more synchronization signals are transmitted in the slots dedicated to NR, as well
as overhead signals.
4.2. Uplink
Figure 11 depicts the UL throughput results for case 5 from Table 6, using both NSA
and SA architecture. Regarding the NSA architecture, it can be observed that the maxi‐
mum throughput values for LTE and NR only (not considering the DSS feature) were 40
and 22 Mbps, respectively. Moreover, if we compare the results of the DSS LTE + NR and
NR‐only throughputs from both architecture types, we can conclude that they were simi‐
lar. Therefore, there is no difference between the SA and NSA architecture, as there are no
additional channels that need to be transmitted and hence occupy extra resources.
(a) (b)
Figure 11. UL throughput results for case 5. (a) NSA architecture; (b) SA architecture.
Table 7 presents the percentage loss of throughput when using the DSS technology.
We can observe that for both architecture types, a maximum loss of 25% occurred for a
sharing ratio of 70%, meaning that NR occupied 70% of the available resources while LTE
occupied only 30%. Therefore, we can conclude that using the DSS technology comes with
a compromise of a maximum 25% loss on throughput. However, the decrease observed is
not that considerable if taking into account that, instead of needing an additional 15 MHz
of bandwidth, the system shares the actual 15 MHz between both technologies. Subse‐
quently, from the operator’s point of view, DSS brings the advantage of cost reduction
and spectrum efficiency, while being able to present the “5G icon game” and provide cov‐
erage strategies.
Figure 11. UL throughput results for case 5. (a) NSA architecture; (b) SA architecture.
Table 7 presents the percentage loss of throughput when using the DSS technology.We can observe that for both architecture types, a maximum loss of 25% occurred for asharing ratio of 70%, meaning that NR occupied 70% of the available resources while LTEoccupied only 30%. Therefore, we can conclude that using the DSS technology comes witha compromise of a maximum 25% loss on throughput. However, the decrease observed isnot that considerable if taking into account that, instead of needing an additional 15 MHz ofbandwidth, the system shares the actual 15 MHz between both technologies. Subsequently,from the operator’s point of view, DSS brings the advantage of cost reduction and spectrumefficiency, while being able to present the “5G icon game” and provide coverage strategies.
Table 7. Loss of UL throughput, in %, of the DSS LTE + NR value in comparison to NR only.
Sharing Ratio 20% 30% 40% 50% 60% 70% 30% 40% 50% 60% 70%
NSA ARCHITECTURE SA ARCHITECTURE
Case 5 −2% −5% −10% −17% −20% −25% −5% −10% −17% −20% −25%
5. Conclusions
In this paper, we analyzed the impact and the advantages of using the DSS technologyin an LTE-NR communication system. We proposed different schemes for the resourceallocation, according to the selected sharing ratio. The results obtained provided insightinto the behavior of the system with DSS and showed that it is a technology that bringsadvantages from the operator’s point of view, mainly regarding the spectrum efficiency

Sensors 2021, 21, 4215 14 of 15
and cost reduction. In conclusion, from the results obtained, it is clear that using the DSStechnology brings a major advantage of not needing extra dedicated bandwidth for NRsystems, which, from the operator’s point of view, leads to an improvement of spectrumefficiency and cost reduction. We performed a comparison of the spectrum usage forLTE and NR when adopting the DSS feature and without. In addition, we measured thethroughput obtained for both LTE and NR, using the proposed allocation schemes for eachsharing ratio. The results obtained clearly demonstrated that even if a maximum loss of25% on throughput is observed, there is a major advantage in using the DSS technology dueto the fact that there is a cost reduction for the mobile operator alongside an optimizationon the spectrum usage, due to the fact that the MNO can re-use the already existing 15 MHzbandwidth of LTE and does not need to buy any new dedicated supplementary 15 MHzfor 5G services.
In conclusion, the deployment of DSS technology is useful, especially for the initialdeployment of 5G NR, as the operator is able to build strategies while presenting the initial5G picture to the consumer, through LTE already-in-use spectrum.
Author Contributions: Conceptualization, G.B., F.A. and M.O.; software, G.B.; validation, G.B., F.A.and M.O.; formal analysis, G.B., F.A. and M.O.; investigation, G.B. and F.A.; resources, G.B. and F.A.;data curation, G.B. and F.A.; writing—original draft preparation, G.B.; writing—review and editing,G.B. and F.A.; project administration, F.A.; funding acquisition, F.A. All authors have read and agreedto the published version of the manuscript.
Funding: This research received no external funding.
Institutional Review Board Statement: Not applicable.
Informed Consent Statement: Not applicable.
Acknowledgments: This work was developed using Nokia’s equipment and infrastructure. For thisreason, the authors wish to acknowledge the support provided by Nokia.
Conflicts of Interest: The authors declare no conflict of interest. The funders had no role in the designof the study; in the collection, analyses, or interpretation of data; in the writing of the manuscript, orin the decision to publish the results.
References1. Shafi, M.; Molisch, A.F.; Smith, P.J.; Haustein, T.; Zhu, P.; De Silva, P.; Tufvesson, F.; Benjebbour, A.; Wunder, G. 5G: A Tutorial
Overview of Standards, Trials, Challenges, Deployment, and Practice. IEEE J. Sel. Areas Commun. 2017, 35, 1201–1221. [CrossRef]2. Adebusola, J.A.; Ariyo, A.A.; Elisha, O.A.; Olubunmi, A.M.; Julius, O.O. An Overview of 5G Technology. In Proceedings of the
2020 International Conference in Mathematics, Computer Engineering and Computer Science (ICMCECS), Ayobo, Nigeria, 18–21March 2020; pp. 1–4.
3. Rhayour, A.E.; Mazri, T. 5G Architecture: Deployment scenarios and options. In Proceedings of the 2019 International Symposiumon Advanced Electrical and Communication Technologies (ISAECT), Rome, Italy, 27–29 November 2019; pp. 1–6.
4. Agiwal, M.; Roy, A.; Saxena, N. Next generation 5G wireless networks: A comprehensive survey. IEEE Commun. Surv. Tutor. 2016,18, 1617–1655. [CrossRef]
5. Dymkova, S.S. Breakthrough 5G data call using dynamic spectrum sharing to accelerate nationwide 5G deployments. SynchroinfoJ. 2019, 5, 17–21.
6. 5G NR and 4G LTE Coexistence: A Comprehensive Deployment Guide to Dynamic Spectrum Sharing [Online]. Availableonline: https://newsletter.mediatek.com/hubfs/mediatek5gprogress/Dynamic-Spectrum-Sharing-WhitePaper-PDFDSSWP-031320.pdf (accessed on 27 May 2021).
7. Tikhvinskiy, V.; Deviatkin, E.; Aitmagambetov, A.; Kulakaeva, A. Provision of IoT Services for CO-Located 4G/5G NetworksUtilization with Dynamic Frequency Sharing. In Proceedings of the 2020 International Conference on Engineering Managementof Communication and Technology (EMCTECH), Vienna, Austria, 20–22 October 2020; pp. 1–4. [CrossRef]
8. Number of IoT Connected Devices Worldwide in 2018, 2025 and 2030 [Online]. Available online: https://www.statista.com/statistics/802690/worldwide-connected-devices-by-access-technology/ (accessed on 29 May 2021).
9. Pandit, S.; Singh, G. An overview of spectrum sharing techniques in cognitive radio communication system. Wirel. Netw. 2017,23, 497–518. [CrossRef]
10. Matinmikko-Blue, M.; Yrjölä, S.; Seppänen, V.; Ahokangas, P.; Hämmäinen, H.; Latva-aho, M. Analysis of Spectrum ValuationApproaches: The Viewpoint of Local 5G Networks in Shared Spectrum Bands. In Proceedings of the 2018 IEEE InternationalSymposium on Dynamic Spectrum Access Networks (DySPAN), Seoul, Korea, 22–25 October 2018; pp. 1–9.

Sensors 2021, 21, 4215 15 of 15
11. Li, S.; Da Xu, L.; Zhao, S. The internet of things: A survey. Inf. Syst. Front. 2015, 17, 243–259. [CrossRef]12. Ning, H.; Liu, H.; Ma, J.; Yang, L.T.; Wan, Y.; Ye, X.; Huang, R. From Internet to Smart World. IEEE Access 2015, 3, 1994–1999.
[CrossRef]13. Chilipirea, C.; Ursache, A.; Popa, D.O.; Pop, F. Energy efficiency and robustness for IoT: Building a smart home security system.
In Proceedings of the (ICCP), Cluj-Napoca, Romania, 8–10 September 2016; pp. 43–48.14. Tehrani, R.H.; Vahid, S.; Triantafyllopoulou, D.; Lee, H.; Moessner, K. Licensed Spectrum Sharing Schemes for Mobile Operators:
A Survey and Outlook. IEEE Commun. Surv. Tutor. 2016, 18, 2591–2623. [CrossRef]15. Zhang, L.; Xiao, M.; Wu, G.; Alam, M.; Liang, Y.-C.; Li, S. A survey of advanced techniques for spectrum sharing in 5G networks.
IEEE Wirel. Commun. 2017, 24, 44–51. [CrossRef]16. Gandotra, P.; Jha, R.K.; Jain, S. Green communication in next generation cellular networks: A survey. IEEE Access 2017, 5,
11727–11758. [CrossRef]17. Massaro, M.; Beltrán, F. Will 5G lead to more spectrum sharing? Discussing recent developments of the LSA and the CBRS
spectrum sharing frameworks. Telecommun. Policy 2020, 44, 101973. [CrossRef]18. Jorswieck, E.A.; Badia, L.; Fahldieck, T.; Karipidis, E.; Luo, J. Spectrum sharing improves the network efficiency for cellular
operators. IEEE Commun. Mag. 2014, 52, 129–136. [CrossRef]19. Yu, G.; Li, G.Y.; Wang, L.; Maaref, A.; Lee, J.; Lopez-Perez, D. Guest Editorial: LTE in Unlicensed Spectrum. IEEE Wirel. Commun.
2016, 23, 6–7. [CrossRef]20. Guohua, Z.; Tianle, D.; Li, Y. A dynamic spectrum re-allocation scheme in GSM and LTE co-existed networks. In Proceedings of
the 2014 International Symposium on Wireless Personal Multimedia Communications (WPMC), Sydney, NSW, Australia, 7–10September 2014; pp. 595–600.
21. Jo, M.; Klymash, M.; Maksymyuk, T.; Kozlovskiy, R. Dynamic spectrum sharing algorithm for combined mobile networks. InProceedings of the 2014 20th International Conference on Microwaves, Radar and Wireless Communications (MIKON), Gdansk,Poland, 16–18 June 2014; pp. 1–3.
22. Irnich, T.; Kronander, J.; Selén, Y.; Li, G. Spectrum sharing scenarios and resulting technical requirements for 5G systems. InProceedings of the 2013 IEEE 24th International Symposium on Personal, Indoor and Mobile Radio Communications (PIMRCWorkshops), London, UK, 8–9 September 2013; pp. 127–132. [CrossRef]
23. Whitmore, A.; Agarwal, A.; Xu, L.D. The Internet of Things. A survey of topics and trends. Inf. Syst. Front. 2015, 17, 261–274.[CrossRef]
24. Palattella, M.R.; Dohler, M.; Grieco, A.; Rizzo, G.; Torsner, J.; Engel, T.; Ladid, L. Internet of Things in the 5G Era: Enablers,Architecture, and Business Models. IEEE J. Sel. Areas Commun. 2016, 34, 510–527. [CrossRef]
25. Zhang, L.; Liang, Y.; Xiao, M. Spectrum Sharing for Internet of Things: A Survey. IEEE Wirel. Commun. 2019, 26, 132–139.[CrossRef]
26. Lin, S.; Kong, L.; Gao, Q.; Khan, M.K.; Zhong, Z.; Jin, X.; Zeng, P. Advanced Dynamic Channel Access Strategy in SpectrumSharing 5G Systems. IEEE Wirel. Commun. 2017, 24, 74–80. [CrossRef]
27. Andrews, J.G.; Buzzi, S.; Choi, W.; Hanly, S.V.; Lozano, A.; Soong, A.C.; Zhang, J.C. What Will 5G Be? IEEE J. Sel. Areas Commun.2014, 32, 1065–1082. [CrossRef]
28. Bogucka, H.; Kryszkiewicz, P.; Kliks, A. Dynamic spectrum aggregation for future 5G communications. IEEE Commun. Mag.2015, 53, 35–43. [CrossRef]
29. Yang, Y.; Dai, L.; Li, J.; Mumtaz, S.; Rodriguez, J. Optimal Spectrum Access and Power Control of Secondary Users in CognitiveRadio Networks. EURASIP J. Wirel. Commun. Netw. 2017, 98, 1–15. [CrossRef]
30. Hu, F.; Chen, B.; Zhu, K. Full Spectrum Sharing in Cognitive Radio Networks toward 5G: A Survey. IEEE Access 2018, 6,15754–15776. [CrossRef]
31. Nokia Networks. LTE-NR DSS Phase I; Network Engineering: Espoo, Finland, 2020.32. Barb, G.; Otesteanu, M.; Roman, M. Dynamic Spectrum Sharing for LTE-NR Downlink MIMO Systems. In Proceedings of the
2020 International Symposium on Electronics and Telecommunications (ISETC), Timisoara, Romania, 5–6 November 2020; pp. 1–4.[CrossRef]
33. Bhattarai, S.; Park, J.J.; Gao, B.; Bian, K.; Lehr, W. An overview of dynamic spectrum sharing: Ongoing initiatives, challenges, anda roadmap for future research. IEEE Trans. Cogn. Commun. Netw. 2016, 2, 110–128. [CrossRef]
34. Nokia Networks. LTE-NR DSS with CRS Rate Matching; Network Engineering: Espoo, Finland, 2020.35. Kliks, A.; Kryszkiewicz, P. Multichannel simultaneous uplink and downlink transmission scheme for flexible duplexing. J. Wirel.
Com. Netw. 2017, 2017, 111. [CrossRef]36. 5G; NR; Base Station (BS) Radio Transmission and Reception. 3GPP TS 38.104 Version 16.7.0 Release 16, April 2021 [Online].
Available online: https://www.etsi.org/deliver/etsi_ts/138100_138199/138104/16.07.00_60/ts_138104v160700p.pdf (accessedon 18 June 2021).