dynamic modeling for simulation and control of a circulating fluidized-bed combustor
TRANSCRIPT
Dynamic Modeling for Simulation and Control of a Circulating Fluidized-Bed Combustor
James R. Muir, Clive Brereton, John R. Grace, and C. Jim Lim Dept. of Chemical Engineering, University of British Columbia, 2216 Main Mall,
Vancouver, BC, Canada V6T 124
A dynamic model has been developed to predict the transient behavior of the temper- ature, the heat removal rate by the in-bed heat exchanger, and the flue-gas oxygen concentration for a circulating fluidized-bed (CFB) combustor. The model was incorpo- rated into a control simulator to reproduce the combustion process within the overall program. The simulator predicts the behavior of the combustor under manual or auto- matic control to allow testing of control strategies. The model is validated by cornpari- son with step-response tests cam'ed out on a pilot CFB combustor. Discrepancies are attributable to unmodeled disturbances. Further validation, necessary to ensure the ap- plicability of the simulator to control development, is provided by comparing control models identified experimentally using the pilot CFB to those obtained by simulation. Favorable comparison suggests that the dynamic model is suitable for use in control simulation.
Introduction Over the past two decades, circulating fluidized-bed (CFB)
technology has received rapidly growing attention. Industry quickly recognized the broad potential of high-velocity flu- idization. Among its unique advantages are greater gas/solids contacting efficiency, short per-pass solids residence times (of the order of seconds), and independent control of gas and solids retention times. Applications of fast fluidization tech- nology include combustion for power generation and waste incineration, pyrolysis, calcining, and catalytic processes. One of the more significant current applications of this technology is for CFB boilers. In some cases, these boilers provide signif- icant advantages over conventional fluidized-bed steam and electrical power-generation processes (Lee, 1997).
To date there is only limited understanding of the dynamic behavior of CFBs. This has led to difficulties in the develop- ment of reliable design methods and control models. What is needed is a model that can describe both the internal riser and external loop of the CFB, predicting both steady-state behavior and dynamic responses. Steady-state analysis is re- quired for the design of a CFB around a given operating condition. Dynamic-response analysis is necessary for both physical design and, more importantly, for design and imple- mentation of a reliable control structure. Such a model could
Present address of J . R. Muir: NOVA Chemicals Ltd., 2928 16 Street N.E., Cal- gary, Aka., Canada T2E 7K7
be used not only for simulation of a control structure, but also in controllers as a predictor.
The most important benefit of simulation in control devel- opment is the opportunity it affords to investigate not only control parameters, but also a large number of control schemes. Simulators offer a particular advantage in upgrad- ing current controls, and in developing and optimizing new units, in that they enable this to be done off-line. Once on- line, although limited dynamic testing is possible, complete testing of a particular control system is difficult due to de- mands on the performance of the unit. The ability to perform these tests off-line avoids disturbances to the plant and en- hances the opportunity for controls upgrading and design. In addition, well-designed simulators are invaluable for training those inexperienced with the operation of a particular unit.
This article describes a dynamic model of a CFB combus- tor. Muir (1995) provides details and an application of how such a model can be useful in the simulation and develop- ment of advanced control structures such as Generalized Predictive Control (Clarke et al., 1987).
Dynamic modeling Dynamic models of CFBs tend to be modular in nature
and to require cell-block solution schemes. This arises be-
AIChE Journal May 1997 Vol. 43, No. 5 1141
cause a CFB system is not a single unit but an assembly com- prised of a riser, gas/solids separation device, solids storage vessel, and solids return conduit and valve-all interactively affecting the overall behavior of the system.
At present, all dynamic models are extreme simplifications. Inclusion of time adds to the complexity both of the model itself and of experimentation needed for validation. No dy- namic continuum approach has been published. This is not surprising since, as just noted, the current level of steady-state modeling (especially for riser hydrodynamics and heat trans- fer) is itself far from complete. This is illustrated by the fact that, although interaction between the heat-transfer surfaces and suspended particles is known to be critical, heat-transfer coefficients are generally correlated against average suspen- sion density across the riser cross section, without direct ref- erence to wall coverage.
Given the paucity of understanding, modelers have ap- proached the system from a macroscale point of view, leading to cell models for the characterization of reaction process in the riser of the CFB. As clustering and wall strand formation are not yet well characterized, there is little point in adding this level of complexity in dynamic modeling, nor is it clear that it is necessary to model such microscale phenomena for good dynamic results. Weiss and Fett (1986) developed a cell model for the decomposition of sodium bicarbonate, a simple reaction that could be used to provide model validation for application to more complex reactions. The model assumes a gas/solids suspension phase of uniform radial density across the entire column cross section. Backmixing of solids is in- cluded, although it is unclear how the rate of backmixing is to be determined. Weiss et al. (1988) extended this model to coal combustion, with voidage a function of height and the solids backmixing rate used as a fitting parameter.
Mori et al. (1991) proposed a dynamic model for a 70-ton/h multisolid circulating fluidized bed boiler. The purpose of this model was to investigate the control system. The riser is con- sidered in three zones-a dense zone, a reducing zone, and an oxidizing zone. Both gas and solids are considered to be well mixed in each of these zones and backflow of solids be- tween zones is taken into account. Devolatilization and sub- sequent combustion of volatiles are deemed to be instanta- neous, while the char combustion reactions are taken to be:
1 c+ yc, --$ co L
1 2
co+ -0, -3 co, (2)
C+CO, -3 2 c + o , (3)
The authors consider neither SO, generation and capture nor NO, formation and reduction. The suspension density is as- sumed to vary in the axial direction only and is obtained from steady-state experimental pressure-drop measurements.
The only unknown parameter in this model is the solids downflow ratio, X , , representing backmixing between the three riser zones. X , is formally defined as the ratio of down- flow of solid particles in the combustor to the external recy- cle flow rate (through the recirculation loop). X, = 15 was selected in order to match measured temperature profiles that were nearly uniform.
Zhang et al. (1991) developed a dynamic model for CFB combustion, emphasizing the effect of particle-size distribu- tion of both bed and feed materials. The combustor is consid- ered to consist of two zones-a dense (bubbling bed) zone and a dilute zone. The dilute zone is subdivided into an arbi- trary number of lump-parameter blocks in series, with gas and solids assumed to be well mixed in each block, and with no backmixing of gas between blocks. The riser hydrodynam- ics are considered to be at steady state. The voidage profile is obtained from the correlation of Yu (19891, while the solids entrainment rate along the riser is taken from Wen and Chen (1982). Included in the reaction scheme are the reduction of NO by carbon and the capture of SO, by CaO.
Hyppanen et al. (1993) presented a dynamic simulation of an Ahlstrom Pyroflow 125 MWe CFB utility power plant. This model incorporates not only the combustion, but also the steam side of the boiler. The riser is divided into numerous compartments in series, each assumed to be well mixed. The axial suspension-density profile is determined using an em- pirical correlation, while the dynamics of these profiles are estimated with the aid of an experimentally obtained time constant. As in the model presented below, the solids circula- tion flux is based on experimental data. Volatiles release, burning, and mixing are combined in a single expression and fitted to experimental data. Solids mixing between cells is de- scribed using a dispersion model, the details of which are not discussed. The heat-transfer coefficient is correlated as a function of suspension density. Experimental results from the 125-MWe Seinajoki power plant were used for verification. The authors also developed an advanced control structure and applied it to the plant. The data indicate improved load fol- lowing based on this new structure.
Experimental Apparatus and Materials The University of British Columbia circulating fluidized-
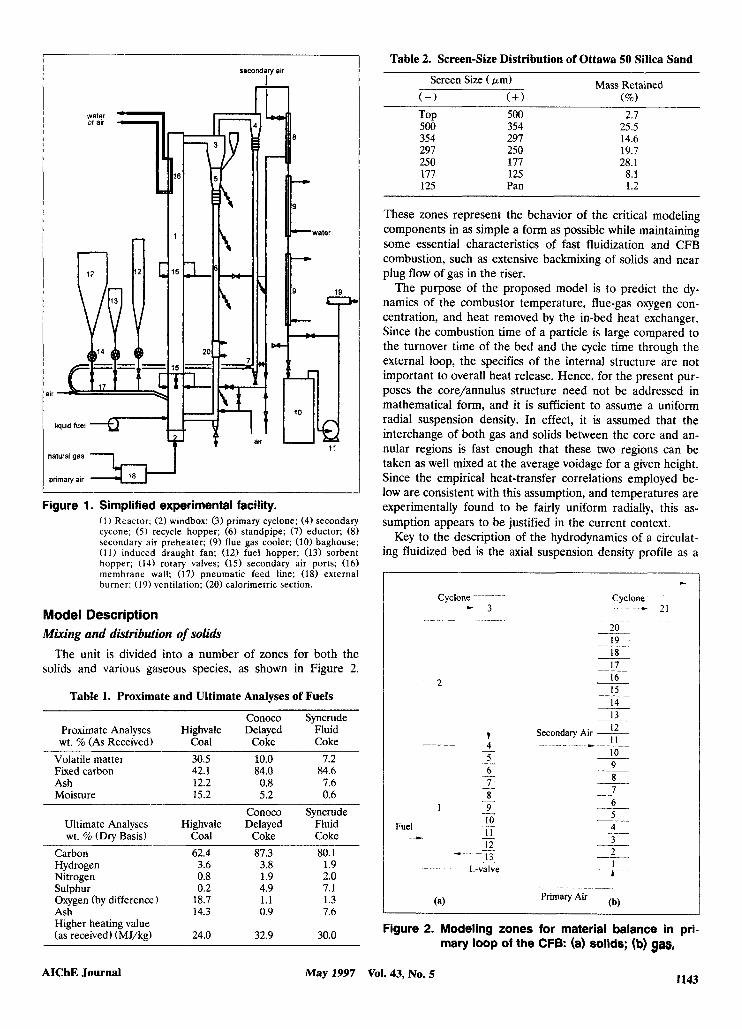
bed combustor (UBC CFBC) pilot plant used for the experi- mental tests carried out in this work is shown in Figure 1. This apparatus is described in detail elsewhere (Brereton et al., 1991). Briefly, the riser has a 152-mm2 cross section and a height of 7.32 m. Primary air enters at the base of the unit, while secondary air enters at a height of 3.1 m. Fuel is pneu- matically fed to the bottom section of the riser from a hopper mounted on load cells for determination of fuel feed rate. An in-bed heat-transfer surface consisting of tubes of 12.7-mm OD is located in the upper section of the riser. With water as a cooling fluid, this surface allows heat-removal rates of ap- proximately 20 kW. Gas and solids leaving the top of the re- actor are passed to a medium-efficiency primary cyclone. The separated solids are returned to the base of the riser via a standpipe and controllable L-valve. Solids escaping the pri- mary cyclone are separated from the gas in a high-efficiency secondary cyclone and pneumatically returned to the base of the riser.
The fuels used include Highvale coal, Conoco coke, and Syncrude fluid coke. The fuel particles fed to the combustor had broad particle-size distributions ranging from fines to greater than 5 mm in diameter. Proximate and ultimate anal- yses of these fuels are provided in Table 1. Table 2 provides the size distribution of the Ottawa 50 silica sand employed as the start-up bed material throughout this work. The Sauter mean diameter of this sand is 259 pm.
1142 May 1997 Vol. 43, No. 5 AIChE Journal
secondary air I
ialuralgas 1 I
wirnaw air - 2 K P Figure 1. Simplified experimental facility.
( 1 ) Reactor: (2) windbox; (3) primary cyclone; (4) secondary cycone; ( 5 ) recycle hopper; (6) standpipe; (7) eductor; (8) secondary air preheater; (9) flue gas cooler; (10) baghouse; (11) induced draught fan; (12) fuel hopper; (13) sorbent hopper; (14) rotary valves; (1.5) secondary air ports; (16) membrane wall; (17) pneumatic feed line; (18) external burner; ( 1 9 ) ventilation; (20) calorimetric section.
Model Description Mixing and distribution of solids
The unit is divided into a number of zones for both the solids and various gaseous species, as shown in Figure 2.
Table 1. Proximate and Ultimate Analyses of Fuels
Conoco Syncrude Proximate Analyses Highvale Delayed Fluid wt. % (As Received) Coal Coke Coke
Volatile matter 30.5 10.0 7.2 Fixed carbon 42.1 84.0 84.6 Ash 12.2 0.8 7.6 Moisture 15.2 5.2 0.6
Conoco Syncrude Ultimate Analyses Highvale Delayed Fluid wt. % (Dry Basis) Coal Coke Coke
Carbon 62.4 87.3 80.1 Hydrogen 3.6 3.8 1.9
Sulphur 0.2 4.9 7.1 Oxygen (by difference) 18.7 1.1 1.3 Ash 14.3 0.9 7.6 Higher heating value (as received) (MJ/kg) 24.0 32.9 30.0
Nitrogen 0.8 1.9 2.0
Table 2. Screen-Size Distribution of Ottawa 50 Silica Sand
Screen Size ( Fm) Mass Retained (--) ( + I (9% ) TOP 500 354 297 250 177 125
500 354 297 250 177 125 Pan
2.7 25.5 14.6 19.7 28.1 8.1 1.2
These zones represent the behavior of the critical modeling components in as simple a form as possible while maintaining some essential characteristics of fast fluidization and CFB combustion, such as extensive backmixing of solids and near plug flow of gas in the riser.
The purpose of the proposed model is to predict the dy- namics of the combustor temperature, flue-gas oxygen con- centration, and heat removed by the in-bed heat exchanger. Since the combustion time of a particle is large compared to the turnover time of the bed and the cycle time through the external loop, the specifics of the internal structure are not important to overall heat release. Hence, for the present pur- poses the core/annulus structure need not be addressed in mathematical form, and it is sufficient to assume a uniform radial suspension density. In effect, it is assumed that the interchange of both gas and solids between the core and an- nular regions is fast enough that these two regions can be taken as well mixed at the average voidage for a given height. Since the empirical heat-transfer correlations employed be- low are consistent with this assumption, and temperatures are experimentally found to be fairly uniform radially, this as- sumption appears to be justified in the current context.
Key to the description of the hydrodynamics of a circulat- ing fluidized bed is the axial suspension density profile as a
c
Cyclone - - 3
Cyclone - - 21
2
L - v a I v e ._
19 18 17 16 15
__
14 13 12 11
__.
Secondary Air __
14 13 12
__.
Secondary Air __ 1 1
10 __ 9 8 7 6 5
__ __
4 3 2 1
- A -
Figure 2. Modeling zones for material balance in pri- mary loop of the CFB: (a) solids; (b) gas,
1143 AIChE Journal May 1997 Vol. 43, No. 5
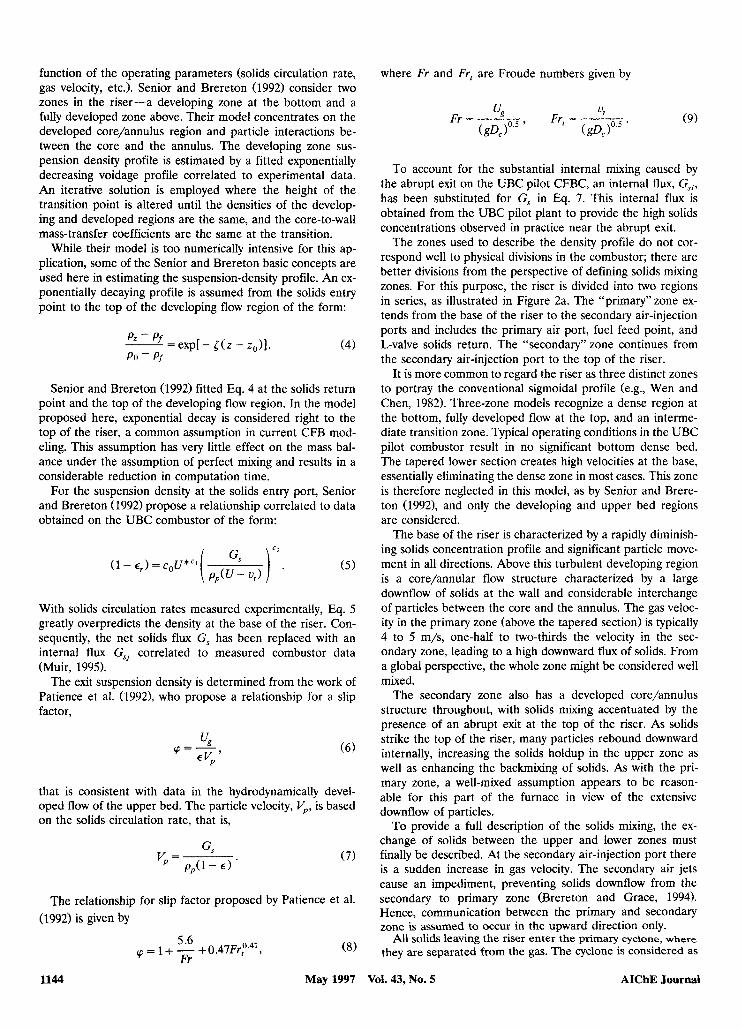
function of the operating parameters (solids circulation rate, gas velocity, etc.). Senior and Brereton (1992) consider two zones in the riser-a developing zone at the bottom and a fully developed zone above. Their model concentrates on the developed core/annulus region and particle interactions be- tween the core and the annulus. The developing zone sus- pension density profile is estimated by a fitted exponentially decreasing voidage profile correlated to experimental data. An iterative solution is employed where the height of the transition point is altered until the densities of the develop- ing and developed regions are the same, and the core-to-wall mass-transfer coefficients are the same at the transition.
While their model is too numerically intensive for this ap- plication, some of the Senior and Brereton basic concepts are used here in estimating the suspension-density profile. An ex- ponentially decaying profile is assumed from the solids entry point to the top of the developing flow region of the form:
Pr - Pf
Po - Pf -- - expl- 5 ( z - zO>l. (4)
Senior and Brereton (1992) fitted Eq. 4 at the solids return point and the top of the developing flow region. In the model proposed here, exponential decay is considered right to the top of the riser, a common assumption in current CFB mod- eling. This assumption has very little effect on the mass bal- ance under the assumption of perfect mixing and results in a considerable reduction in computation time.
For the suspension density at the solids entry port, Senior and Brereton (1992) propose a relationship correlated to data obtained on the UBC combustor of the form:
With solids circulation rates measured experimentally, Eq. 5 greatly overpredicts the density at the base of the riser. Con- sequently, the net solids flux G, has been replaced with an internal flux Gsj correlated to measured combustor data (Muir, 1995).
The exit suspension density is determined from the work of Patience et al. (1992), who propose a relationship for a slip factor,
(6)
that is consistent with data in the hydrodynamically devel- oped flow of the upper bed. The particle velocity, Vp, is based on the solids circulation rate, that is,
(7)
The relationship for slip factor proposed by Patience et al. (1992) is given by
5.6 Fr
= 1 + - + 0.47Frp.41,
where Fr and Fr, are Froude numbers given by
(9)
To account for the substantial internal mixing caused by the abrupt exit on the UBC pilot CFBC, an internal flux, Gsi, has been substituted for G, in Eq. 7. This internal flux is obtained from the UBC pilot plant to provide the high solids concentrations observed in practice near the abrupt exit.
The zones used to describe the density profile do not cor- respond well to physical divisions in the combustor; there are better divisions from the perspective of defining solids mixing zones. For this purpose, the riser is divided into two regions in series, as illustrated in Figure 2a. The “primary”zone ex- tends from the base of the riser to the secondary air-injection ports and includes the primary air port, fuel feed point, and L-valve solids return. The “secondary” zone continues from the secondary air-injection port to the top of the riser.
It is more common to regard the riser as three distinct zones to portray the conventional sigmoidal profile (e.g., Wen and Chen, 1982). Three-zone models recognize a dense region at the bottom, fully developed flow at the top, and an interme- diate transition zone. Typical operating conditions in the UBC pilot combustor result in no significant bottom dense bed. The tapered lower section creates high velocities at the base, essentially eliminating the dense zone in most cases. This zone is therefore neglected in this model, as by Senior and Brere- ton (1992), and only the developing and upper bed regions are considered.
The base of the riser is characterized by a rapidly diminish- ing solids concentration profile and significant particle move- ment in all directions. Above this turbulent developing region is a core/annular flow structure characterized by a large downflow of solids at the wall and considerable interchange of particles between the core and the annulus. The gas veloc- ity in the primary zone (above the tapered section) is typically 4 to 5 m/s, one-half to two-thirds the velocity in the sec- ondary zone, leading to a high downward flux of solids. From a global perspective, the whole zone might be considered well mixed.
The secondary zone also has a developed core/annulus structure throughout, with solids mixing accentuated by the presence of an abrupt exit at the top of the riser. As solids strike the top of the riser, many particles rebound downward internally, increasing the solids holdup in the upper zone as well as enhancing the backmixing of solids. As with the pri- mary zone, a well-mixed assumption appears to be reason- able for this part of the furnace in view of the extensive downflow of particles.
To provide a full description of the solids mixing, the ex- change of solids between the upper and lower zones must finally be described. At the secondary air-injection port there is a sudden increase in gas velocity. The secondary air jets cause an impediment, preventing solids downflow from the secondary to primary zone (Brereton and Grace, 1994). Hence, communication between the primary and secondary zone is assumed to occur in the upward direction only.
All solids leaving the riser enter the primary cyclone, where they are separated from the gas. The cyclone is considered as
1144 May 1997 VoI. 43, No. 5 AIChE Journal
having a 100% collection efficiency. Gas and solids are as- sumed to be thoroughly mixed in the cyclone. Kang et al. (1989) correlated the average solids residence time in cy- clones (for geometric ratios of cylinder to cone height of 1.8 to 5.0) from experimental measurements as
H -1'76 0.70 0.42 -
==0.032Re~.43( t .5 T ) u g - "t ( PP - pg (-) . 1, H - h ,
(10)
The mean gas residence time, q, is given by Leith and Licht (1972) as
(11)
The suspension density of solids in the cyclone, p,.+ (kg/m3), can be estimated from
where the solids mass-flow rate, ms (kg/s), is
ms = GsAris. (13)
The standpipe is simulated by a large number of continu- ous stirred-tank reactors (CSTRs) in series; sufficient to ap- proximate plug flow in order to calculate the gradual cooling as they pass through the standpipe, as well as to dynamically represent the accumulation or consumption of carbon in the total inventory as it is returned to the base of the combustion zone.
The gas is assumed to be near plug flow in the riser. For simplicity, both the primary and secondary solids regions are treated as ten well-mixed gas zones in series as shown in Fig- ure 2b, giving a close approximation to plug flow. In practice, some gas backmixing occurs as gas is pulled downwards by solids in the annular region (Brereton, 1988). However, this backmixing is small in combustors compared to the overall throughput of the system, and, in any case, the model is rela- tively insensitive to the gas-mixing assumption. The number of gas zones could be reduced in order to account for gas backmixing as an alternative to an axial dispersion model.
Combustion reaction Small batch tests were carried out in a bench-scale fluid-bed
reactor to determine chemical kinetic constants for a given char. Such tests are of relatively low cost and should provide combustion rates approximating those in the CFB combustor. Complete details and results of these tests can be found in Muir (1995).
For simplicity, fuel particles were assumed to be spherical. Allowing for a nonuniform particle-size distribution would increase the computational cost manyfold, while not neces- sarily improving accuracy, given such processes as swelling, fragmentation, and attrition, which are very difficult to model.
In view of these factors, the particles are represented for ki- netic purposes by a single effective mean particle diameter.
Devolatilization is treated as if it were instantaneous. Combustion is assumed to take place on the surface of the particle, and all carbon consumed is assumed to be converted to CO,. Unknown properties of the burning fuel (pore-size distribution, etc.) make any assumption regarding the extent of internal burning questionable. Previous measurements (e.g., LaNauze, 1985) indicate particle burning temperatures 50 to 200°C above that of the surroundings, the excess being a function of fuel type and particle size. To reduce computa- tional time, the particle temperature is taken as a conserva- tive 100°C above that of the combustion gas. Errors in this assumption are corrected for by the choice of representative char size described earlier.
The Sherwood number, Sh = kddc/a) , is taken as that de- veloped for bubbling fluidized beds by Chakraborty and Howard (1981):
Sh = 2~ +0.69( 2 ) v ( S c ) 1 ' , (14)
where Sc is the Schmidt number = p/p, a> and Re, is the particle Reynolds number, defined as
Re,=-( dc Pg -- ug p E pJ1- E )
(15)
Equation 14 assumes that the external resistance is that of char particles moving freely in a gaseous suspension. Con- sistent with results of deLasa and Gau (1973), clustering and streamer formation are assumed to have little effect on the mass transfer.
The overall rate of combustion can be determined by equat- ing the rate defined by kinetics to that defined by external diffusion to the char surface, that is,
(16) rc = k,c: = kd(Cb - C s ) ,
where n is the order of the reaction. The kinetic rate con- stant, k,, is expressed by an Arrhenius expression:
Solving Eq. 16 for the surface concentration of oxygen, cs, gives the rate of combustion.
Although air is introduced to the standpipe through the L-valve for solids circulation control, the amount is very small compared to the total throughput of the system (less than 1%). The contribution of this air to reaction with carbon in the standpipe is therefore neglected.
Only the reaction of 0, with C is considered at this stage. Other reactions, such as those involving S or N, are ignored. The amount of oxygen involved with these secondary reac- tions is negligible compared to the total throughput, as is their effect on the overall heat balance.
AIChE Journal May 1997 Vol. 43, No. 5 1145
Heat bahnce The hydrodynamic and combustion elements of the pro-
gram combine to give the rate of heat release as a function of fluid mechanics, gas and fuel feed rates, and system tempera- ture. To then solve for the critical system temperature and oxygen level requires simultaneous solution of the unsteady- state heat transfer from the system.
The heat balance on the riser/cyclone section considers the heat of reaction (taking into account combustion and overall enthalpy change), heat removed by the in-bed heat exchanger (controllable by variation of the suspension density), heat lost to the refractory, and heat added by solids returning to the riser. Unlike the mass balance in which the combustor is separated into numerous zones, the heat balance is made globally because, due to rapid solids backmixing, there are essentially no temperature gradients along the riser under typical steady-state operation, while during periods of tran- sients the gradients do not exceed 10 to 15°C unless the solids circulation rate is so low that the combustor no longer oper- ates in the fast fluidization flow regime.
The heat generated due to combustion is determined from the heating value of the fuel and the amount of carbon con- sumed over a period At. The heat leaving the reactor in the flue gas is determined from the enthalpies and mass balances for N,, O,, CO,, and H,O, from which the heat from the entering air is subtracted.
The water-side heat-transfer coefficient, h,; (for turbulent flow), is computed from Sleicher and Rouse (1975):
where
0.24 4+ Pr'
rn = 0.88- - . n = 0.333+0.5e-0.hP' (19)
The gas-side heat-transfer coefficient is determined from the work of Wu (1989) in the same experimental equipment:
T," - T," h,,= 13+2.0pa,,,h, +4.735X10-' ~ ( Tg - T,. ) ' ( 2 1 )
where the three terms on the right side account for gas con- vection, particle convection, and radiation, respectively.
The overall heat transfer coefficient, U,, based on the combustion side. is then
If the tube wall resistance is neglected, it can be shown that the tube wall temperature can be estimated as
(23)
Table 3. Thermal Properties of Materials of Construction and Insulating Materials
Thermal Heat Conductivity Capacity Density
Material (W/m2. K) (J/kg.K) (kg/m') Plicast Refractory* 0.3 920 96 1 Fiberfrax J-Paper 0.1 12 1130 160 Carbon Steel** 34 473 7801 Fiberfrax Durablanket* 0.09 1130 64 Paroc Insulation* 0.08 920 128 Stainless Steel** 26 477 7900
*From supplier. From R. H. Perry and D. Green (1984). **
with AT,,,, being the overall log mean temperature differ- ence.
The riser is constructed (from the inside out) of 90-mm of Plicast LWI-20 Insulating Castable, 1-mm Fiberfrax 970 J- Paper, 6-mm carbon steel, 21-mm Fiberfrax Durablanket S Ceramic Fiber Blanket, and 21-mm Paroc Basalt Insulation. Thermal properties of these materials are in Table 3. The refractory within the riser and primary cyclone is taken to have an equivalent hydraulic inside radius rj and outside ra- dius r,. Heat loss through the refractory is treated as an un- steady-state conduction problem in the radial direction with:
dT a rl
at r ar _ - - - - ( r g ) ,
and boundary conditions:
. - k,- = h,(T - T.1 @ r = r,.
dr
(24)
(25)
(26)
The contact resistance between adjacent materials is ignored. Equation 24 subject to the given boundary conditions is solved using a finite difference technique.
The external heat transfer coefficient, h,, is calculated to be 12 W/m2-K, which is consistent with surface temperature measurements and experimental heat balances. Equation 21 is assumed to apply to the refractory, as well as the cooling tubes, with the overall average suspension density replacing pave,hl. Measurements of temperature at the inside wall of the combustor indicate that this expression provides an ade- quate estimation of the wall temperature, approximately 20°C below the combustion temperature at steady-state conditions.
To account for heat lost through the standpipe, a separate heat balance is performed to determine the temperature of the sand/ash/char mixture returned to the base of the riser. The same ten standpipe zones used in the mass balance (Fig- ure 2a) are employed to estimate the heat loss to the sur- roundings. Each individual zone is considered to be at a uniform temperature, with the particles entering the first zone (top of standpipe) at the combustor temperature. As the solids travel down the standpipe they are assumed to be well mixed in each consecutive zone in order t o determine a new
1146 May 1997 Vol. 43, No. 5 AIChE Journal
zonal average temperature, accounting for heat lost to the surroundings.
The standpipe heat losses are modeled in the same way as in the riser; however, the insulation is configured differently. The standpipe is made of 6 mm thickness stainless steel with 21 mm of Fiberfrax Durablanket S Ceramic Fiber Blanket and 21 mm of Paroc Basalt Insulation on the outside. Axial conduction of heat is neglected, consistent with the observa- tion that the solids, having a very high heat capacity, tend to exhibit only a small drop in temperature as they pass down the standpipe (5 to 10°C from top to bottom compared to the driving force to the atmosphere of 800 to 850°C).
The particles are small enough that the Biot number is < 0.1; hence the temperature within each particle is consid- ered uniform. It is assumed that the gas and solids in the riser are at the same temperature and that particles intro- duced to the combustor are instantaneously heated to the combustion temperature. These assumptions are justified and more details are provided by Muir (1995).
Validation Transfer finction comparison
Transfer function identification tests were performed using PRBS testing and time series analysis (Box and Jenkins, 1970). The purpose was to generate discrete time process transfer- function models to compare the dynamics of the simulator to the UBC pilot CFBC.
Figure 3 compares the pseudorandom binary sequence (PRBS) input sequence to the simulator for the generation of data for discrete time modeling of the UBC pilot CFB com- bustor operating with Highvale coal with the predicted tem- perature response during this test.
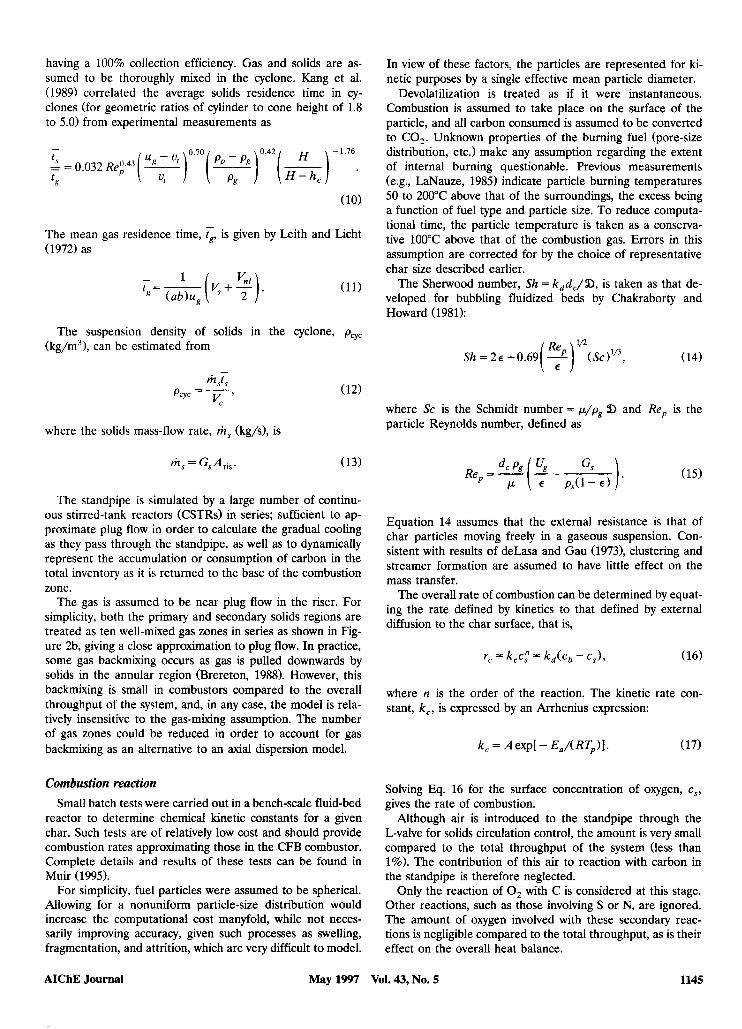
Comparison of the step response from the time-series model determined from the simulation with that determined experimentally is shown in Figures 4a and 4b for two fuels, Highvale coal and Conoco coke, respectively. The predicted process gain of the simulator response has an error of k 5”C, a result of small differences in the transfer function models developed experimentally to those determined for the simu- lator. The input to the experimental transfer functions is the mA signal to the rotary valve controller, while that for the simulator transfer functions is the fuel feed rate in kg/h. To compare these models, it is necessary to know the fuel feed rate as a function of the mA setting of the rotary valve. This
Feedrate --- Temperature -
24 . - _. - -- -. 1 8 0 0 200 280 360 440 520 600 680 760
Time (minutes)
Figure 3. Temperature response to fuel feed rate for simulated PRBS test with Highvale coal.
880
h
2 870 .
Simulation Experimental
- c 5 ...... 860 .
5
830 -~ _ - ~ -
0 80 160 240 320 Tune (mutes)
(a)
880 -
h
2 870 - - 5
Simulation ...... Experimental .-
4
840 I V
830 - ~- - . -
0 80 160 240 320 Time (mutes)
(b)
Figure 4. Comparison of responses to a step change in fuel feed rate with discrete-time models for (a) Highvale coal, and (b) Conoco coke.
changes as a function of fuel type and even hopper level. In this work, the fuel feed rate has been adjusted to match the gains of the transfer functions. The determined fuel feed rates are well within “expected” experimental error in the estima- tion of the true fuel feed rate based on the signal to the rotary valve controller.
Figures 4a and 4b both show favorable comparison of the simulator with experimental measurements. The simulator provides a good representation of the dynamic response of the pilot CFBC unit.
Step testing comparison To obtain further validation of the proposed dynamic
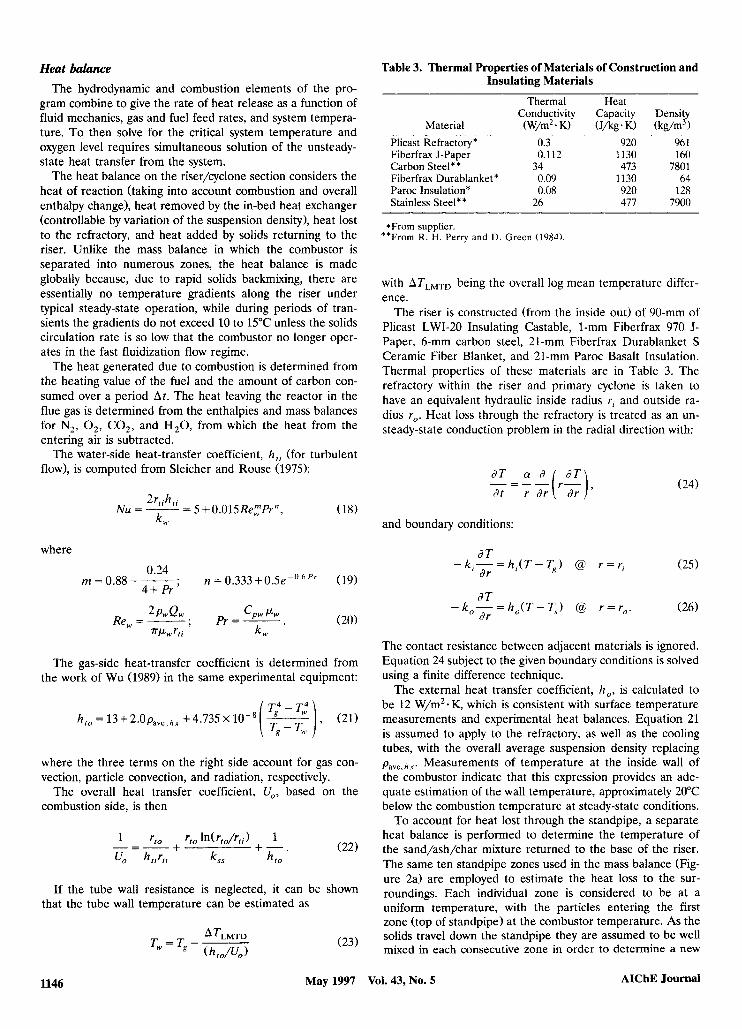
model, additional experimental testing was conducted, forc- ing the combustor with a number of step changes in the fuel feed rate and comparing its response with similar forcing of the simulator. The pilot-plant tests were performed by step- changing the mA signal to the rotary valve. This does not always ensure an equivalent change in the fuel feed rate to the combustor, for example, because of variations in fuel packing in the feed hopper. This is illustrated in Figure 5 in which the mA signal to the rotary valve is compared with the fuel feed rate measured by loss-in-weight from the fuel hop- per, averaged over 10-min periods. It is evident that there are discrepancies between these two measures. For example, there was a decrease in flow at 700 min while the mA signal was maintained constant, while there was a higher feed rate
1147 AIChE Journal May 1997 Vol. 43, No. 5
Measured
8.5 580 660 740 820 900 980 1060 1140 1220 1300
Time (minutes)
Figure 5. Comparison of rotary valve speed signal with the measured 10-min-averaged fuel feed rate for Highvale coal, demonstrating the lack of complete consistency between variations in fuel feed rate and valve speed.
of fuel at the end of the test than at the beginning, even though the mA settings were the same.
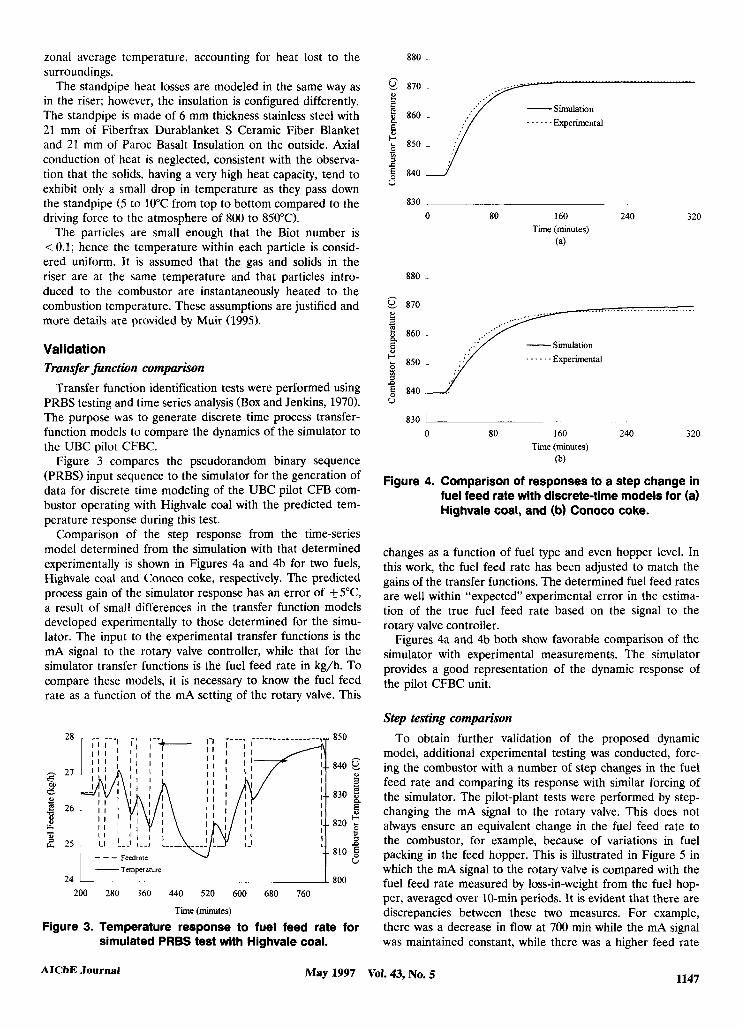
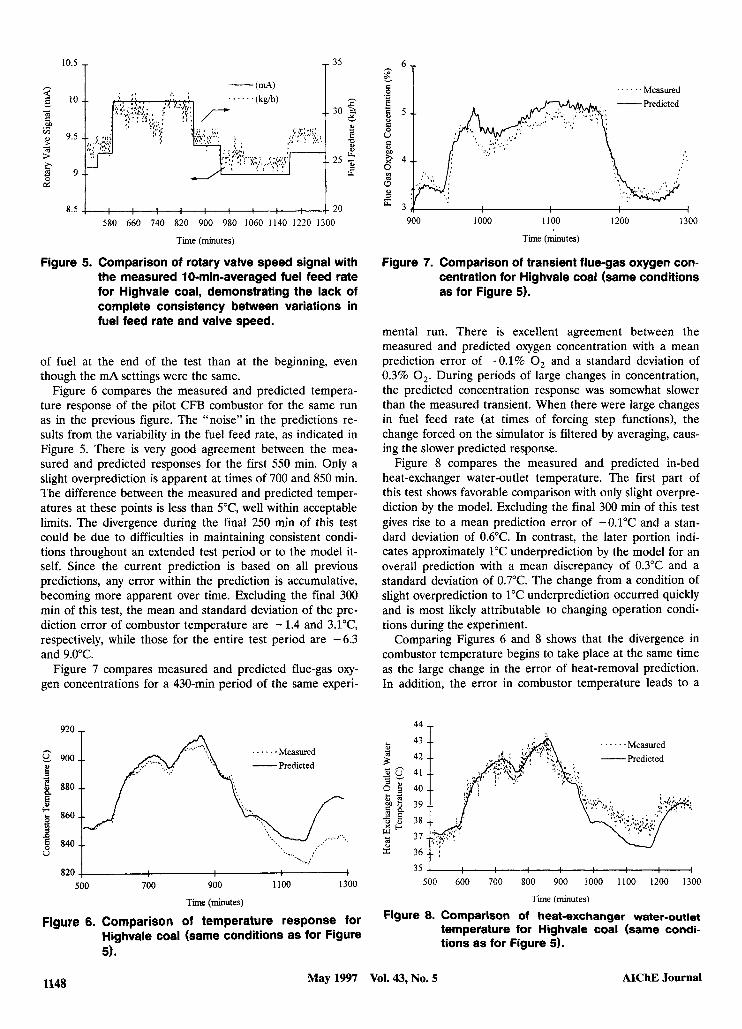
Figure 6 compares the measured and predicted tempera- ture response of the pilot CFB combustor for the same run as in the previous figure. The "noise" in the predictions re- sults from the variability in the fuel feed rate, as indicated in Figure 5. There is very good agreement between the mea- sured and predicted responses for the first 550 min. Only a slight overprediction is apparent at times of 700 and 850 min. The difference between the measured and predicted temper- atures at these points is less than 5"C, well within acceptable limits. The divergence during the final 250 min of this test could be due to difficulties in maintaining consistent condi- tions throughout an extended test period or to the model it- self. Since the current prediction is based on all previous predictions, any error within the prediction is accumulative, becoming more apparent over time. Excluding the final 300 min of this test, the mean and standard deviation of the pre- diction error of combustor temperature are - 1.4 and 3.1"C, respectively, while those for the entire test period are -6.3 and 9.0"C.
Figure 7 compares measured and predicted flue-gas oxy- gen concentrations for a 430-min period of the same experi-
920 T
840 t
...... Measured -Predicted
500 700 900 1100 1300
Time (minutes)
Figure 6. Comparison of temperature response for Highvale coal (same conditions as for Figure 5).
900 1000 1100 1200 1300
Time (minutes)
Figure 7. Comparison of transient flue-gas oxygen con- centration for Highvale coal (same conditions as for Figure 5).
mental run. There is excellent agreement between the measured and predicted oxygen concentration with a mean prediction error of -0.1% 0, and a standard deviation of 0.3% 0,. During periods of large changes in concentration, the predicted concentration response was somewhat slower than the measured transient. When there were large changes in fuel feed rate (at times of forcing step functions), the change forced on the simulator is filtered by averaging, caus- ing the slower predicted response.
Figure 8 compares the measured and predicted in-bed heat-exchanger water-outlet temperature. The first part of this test shows favorable comparison with only slight overpre- diction by the model. Excluding the final 300 min of this test gives rise to a mean prediction error of -0.1"C and a stan- dard deviation of 0.6"C. In contrast, the later portion indi- cates approximately 1°C underprediction by the model for an overall prediction with a mean discrepancy of 0.3"C and a standard deviation of 0.7"C. The change from a condition of slight overprediction to 1°C underprediction occurred quickly and is most likely attributable to changing operation condi- tions during the experiment.
Comparing Figures 6 and 8 shows that the divergence in combustor temperature begins to take place at the same time as the large change in the error of heat-removal prediction. In addition, the error in combustor temperature leads to a
44 - ...... * 43 Measured -Predicted
--
35 4 I 500 600 700 800 900 1000 1100 1200 1300
T i e (minutes)
Figure 8. Comparison of heat-exchanger water-outlet temperature for Highvale coal (same condi- tions as for Figure 5).
1148 May 1997 Vol. 43, No. 5 AIChE Journal
880 - - 870 1 Y 3 860
850
2 830 E 6 820
...... Measured -Predicted
810 I I 600 700 800 900 1000
Time (minutes)
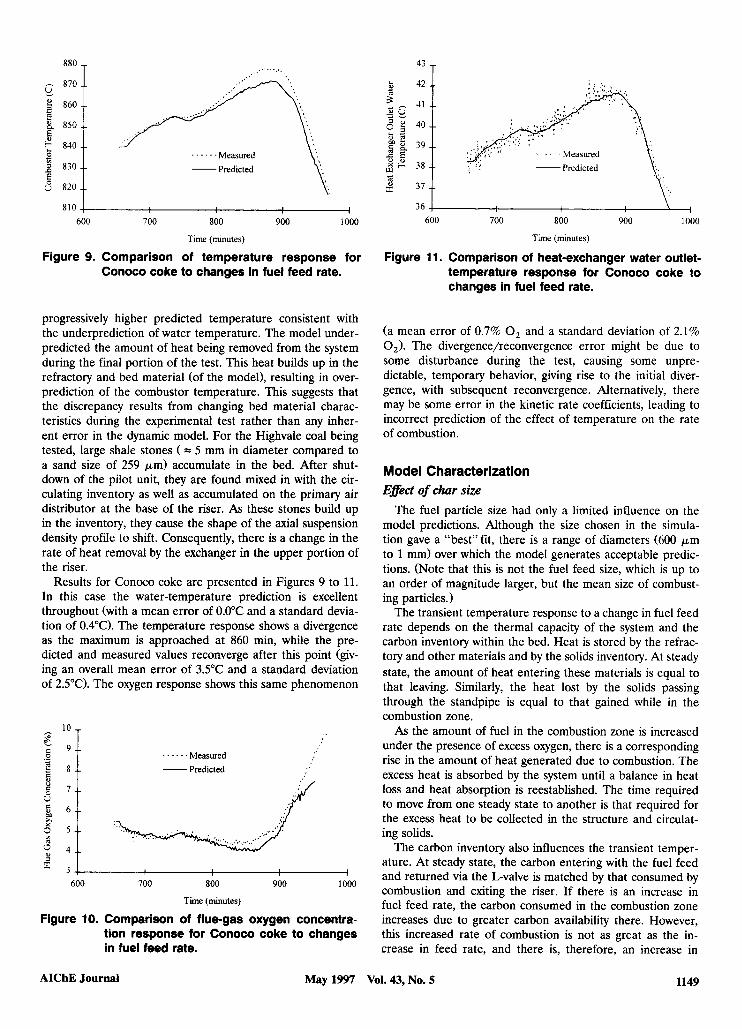
Figure 9. Comparison of temperature response for Conoco coke to changes in fuel feed rate.
progressively higher predicted temperature consistent with the underprediction of water temperature. The model under- predicted the amount of heat being removed from the system during the final portion of the test. This heat builds up in the refractory and bed material (of the model), resulting in over- prediction of the combustor temperature. This suggests that the discrepancy results from changing bed material charac- teristics during the experimental test rather than any inher- ent error in the dynamic model. For the Highvale coal being tested, large shale stones ( = 5 mm in diameter compared to a sand size of 259 pm) accumulate in the bed. After shut- down of the pilot unit, they are found mixed in with the cir- culating inventory as well as accumulated on the primary air distributor at the base of the riser. As these stones build up in the inventory, they cause the shape of the axial suspension density profile to shift. Consequently, there is a change in the rate of heat removal by the exchanger in the upper portion of the riser.
Results for Conoco coke are presented in Figures 9 to 11. In this case the water-temperature prediction is excellent throughout (with a mean error of 0.0"C and a standard devia- tion of 0.4"C). The temperature response shows a divergence as the maximum is approached at 860 min, while the pre- dicted and measured values reconverge after this point (giv- ing an overall mean error of 3.5"C and a standard deviation of 2.5'0. The oxygen response shows this same phenomenon
...... Measured -Predicted
- cL 3 4 i
600 700 800 900 1000
Time (minutes)
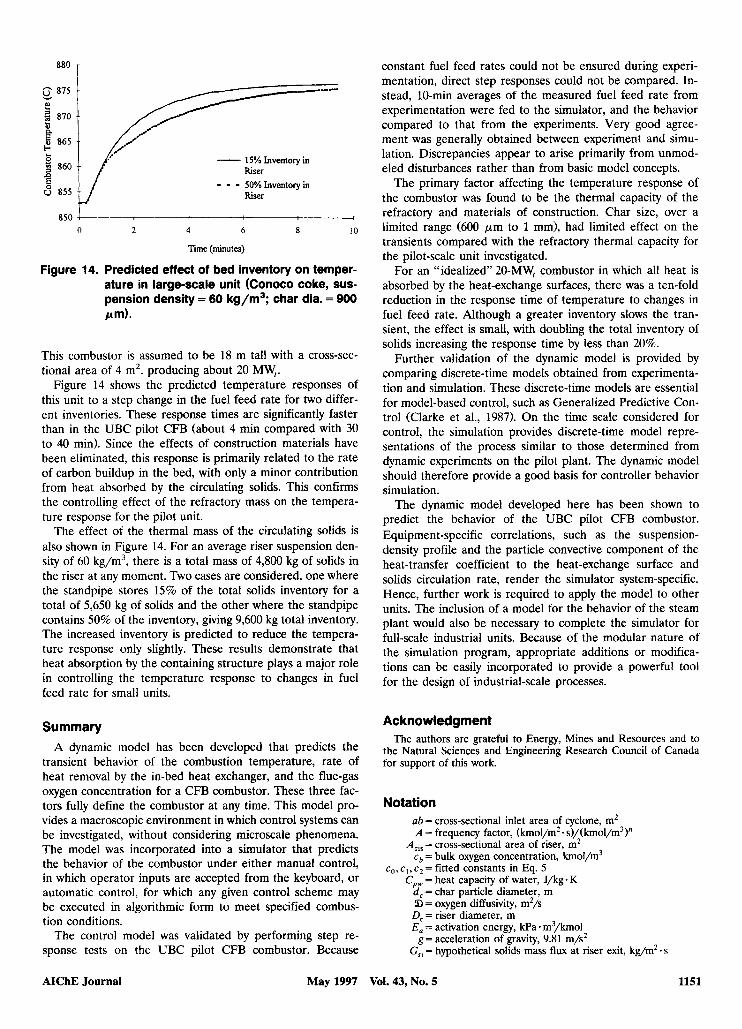
Figure 10. Comparison of flue-gas oxygen concentra- tion response for Conoco coke to changes in fuel feed rate.
k 42 43 I I ! :.
...... ;.& .: Measured -Predicted .: i.. . .
36 \ , 600 700 800 900 1000
Time (minutes)
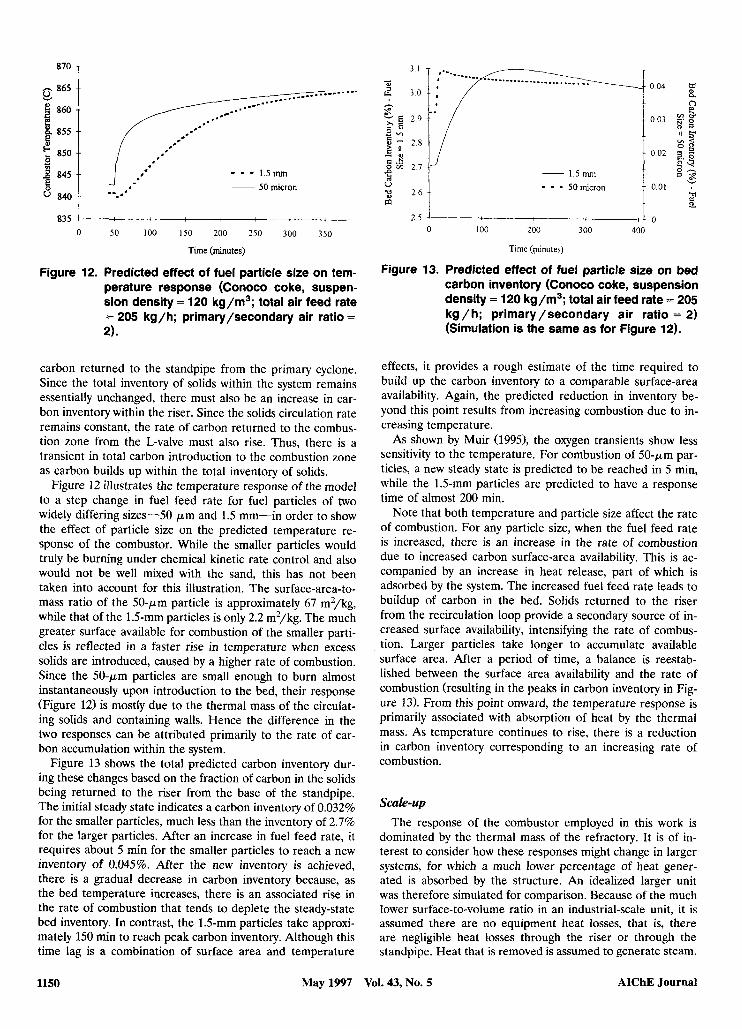
Figure 11. Comparison of heat-exchanger water outlet- temperature response for Conoco coke to changes in fuel feed rate.
(a mean error of 0.7% 0, and a standard deviation of 2.1% 0,). The divergence/reconvergence error might be due to some disturbance during the test, causing some unpre- dictable, temporary behavior, giving rise to the initial diver- gence, with subsequent reconvergence. Alternatively, there may be some error in the kinetic rate coefficients, leading to incorrect prediction of the effect of temperature on the rate of combustion.
Model Characterization Effect of char size
The fuel particle size had only a limited influence on the model predictions. Although the size chosen in the simula- tion gave a "best"fit, there is a range of diameters (600 pm to 1 mm) over which the model generates acceptable predic- tions. (Note that this is not the fuel feed size, which is up to an order of magnitude larger, but the mean size of combust- ing particles.)
The transient temperature response to a change in fuel feed rate depends on the thermal capacity of the system and the carbon inventory within the bed. Heat is stored by the refrac- tory and other materials and by the solids inventory. At steady state, the amount of heat entering these materials is equal to that leaving. Similarly, the heat lost by the solids passing through the standpipe is equal to that gained while in the combustion zone.
As the amount of fuel in the combustion zone is increased under the presence of excess oxygen, there is a corresponding rise in the amount of heat generated due to combustion. The excess heat is absorbed by the system until a balance in heat loss and heat absorption is reestablished. The time required to move from one steady state to another is that required for the excess heat to be collected in the structure and circulat- ing solids.
The carbon inventory also influences the transient temper- ature. At steady state, the carbon entering with the fuel feed and returned via the L-valve is matched by that consumed by combustion and exiting the riser. If there is an increase in fuel feed rate, the carbon consumed in the combustion zone increases due to greater carbon availability there. However, this increased rate of combustion is not as great as the in- crease in feed rate, and there is, therefore, an increase in
AIChE Journal May 1997 Vol. 43, No. 5 1149
870 T - 865 2,
% 855
i2 860 -. 3 ; 850 B
B 845 E,
... 840
--
--
.-
--
-.
- - - 1.5 mm ~ 50 micron
3 1
2 3 0 - w
t 1 0°'
- - - Somicron 2 a
835 4 2 5 i : I 0 0 50 100 IS0 200 250 300 350 0 I00 200 300 400
Time (minutes) Time (pi-nutes)
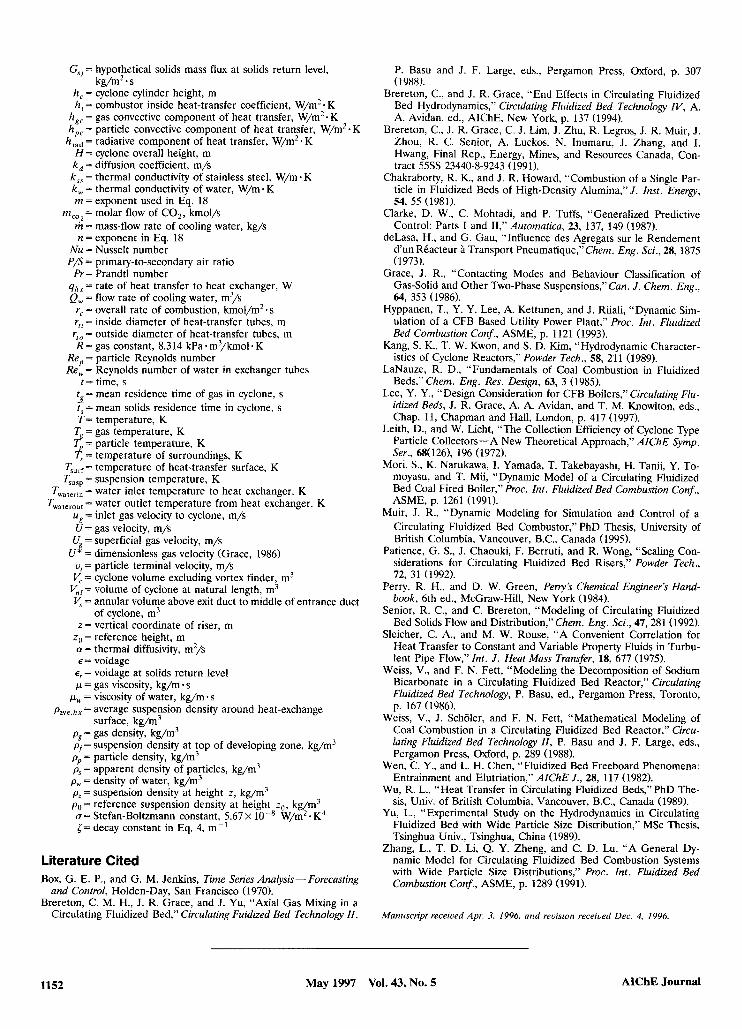
Figure 12. Predicted effect of fuel particle size on tern- perature response (Conoco coke, suspen- sion density = 120 kg/m3; total air feed rate = 205 kg/h; primary/secondary air ratio =
2).
Figure 13. Predicted effect Of fuel particle size on bed carbon inventory (Conoco coke, suspension density = 120 kg/m3; total air feed rate = 205 kg / h; primary /secondary air ratio = 2) (Simulation is the same as for Figure 12).
carbon returned to the standpipe from the primary cyclone. Since the total inventory of solids within the system remains essentially unchanged, there must also be an increase in car- bon inventory within the riser. Since the solids circulation rate remains constant, the rate of carbon returned to the combus- tion zone from the L-valve must also rise. Thus, there is a transient in total carbon introduction to the combustion zone as carbon builds up within the total inventory of solids.
Figure 12 illustrates the temperature response of the model to a step change in fuel feed rate for fuel particles of two widely differing sizes-50 p m and 1.5 mm-in order to show the effect of particle size on the predicted temperature re- sponse of the combustor. While the smaller particles would truly be burning under chemical kinetic rate control and also would not be well mixed with the sand, this has not been taken into account for this illustration. The surface-area-to- mass ratio of the 50-pm particle is approximately 67 m2/kg, while that of the 1.5-mm particles is only 2.2 m2/kg. The much greater surface available for combustion of the smaller parti- cles is reflected in a faster rise in temperature when excess solids are introduced, caused by a higher rate of combustion. Since the 50-pm particles are small enough to burn almost instantaneously upon introduction to the bed, their response (Figure 12) is mostly due to the thermal mass of the circulat- ing solids and containing walls. Hence the difference in the two responses can be attributed primarily to the rate of car- bon accumulation within the system.
Figure 13 shows the total predicted carbon inventory dur- ing these changes based on the fraction of carbon in the solids being returned to the riser from the base of the standpipe. The initial steady state indicates a carbon inventory of 0.032% for the smaller particles, much less than the inventory of 2.7% for the larger particles, After an increase in fuel feed rate, it requires about 5 min for the smaller particles to reach a new inventory of 0.045%. After the new inventory is achieved, there is a gradual decrease in carbon inventory because, as the bed temperature increases, there is an associated rise in the rate of combustion that tends to deplete the steady-state bed inventory. In contrast, the 1.5-mm particles take approxi- mately 150 min to reach peak carbon inventory. Although this time lag is a combination of surface area and temperature
effects, it provides a rough estimate of the time required to build up the carbon inventory to a comparable surface-area availability. Again, the predicted reduction in inventory be- yond this point results from increasing combustion due to in- creasing temperature.
As shown by Muir (199.51, the oxygen transients show less sensitivity to the temperature. For combustion of 50-pm par- ticles, a new steady state is predicted to be reached in 5 min, while the 1.5-mm particles are predicted to have a response time of almost 200 min.
Note that both temperature and particle size affect the rate of combustion. For any particle size, when the fuel feed rate is increased, there is an increase in the rate of combustion due to increased carbon surface-area availability. This is ac- companied by an increase in heat release, part of which is adsorbed by the system. The increased fuel feed rate leads to buildup of carbon in the bed. Solids returned to the riser from the recirculation loop provide a secondary source of in- creased surface availability, intensifying the rate of combus- tion. Larger particles take longer to accumulate available surface area. After a period of time, a balance is reestab- lished between the surface area availability and the rate of combustion (resulting in the peaks in carbon inventory in Fig- ure 13). From this point onward, the temperature response is primarily associated with absorption of heat by the thermal mass. As temperature continues to rise, there is a reduction in carbon inventory corresponding to an increasing rate of combustion.
Scale-up The response of the combustor employed in this work is
dominated by the thermal mass of the refractory. It is of in- terest to consider how these responses might change in larger systems, for which a much lower percentage of heat gener- ated is absorbed by the structure. An idealized larger unit was therefore simulated for comparison. Because of the much lower surface-to-volume ratio in an industrial-scale unit, it is assumed there are no equipment heat losses, that is, there are negligible heat losses through the riser or through the standpipe. Heat that is removed is assumed to generate steam.
1150 May 1997 Vol. 43, No. 5 AIChE Journal
T
6 855 E v 15% Inventory in Riser - - - SO%Inventoryin Riser
-
850 L- 1
0 2 4 6 8 10
Time (minutes)
Figure 14. Predicted effect of bed inventory on temper- ature in large-scale unit (Conoco coke, sus- pension density = 60 kg/m3; char dia. = 900 wn).
This combustor is assumed to be 18 m tall with a cross-sec- tional area of 4 m2. producing about 20 MW,.
Figure 14 shows the predicted temperature responses of this unit to a step change in the fuel feed rate for two differ- ent inventories. These response times are significantly faster than in the UBC pilot CFB (about 4 min compared with 30 to 40 min). Since the effects of construction materials have been eliminated, this response is primarily related to the rate of carbon buildup in the bed, with only a minor contribution from heat absorbed by the circulating solids. This confirms the controlling effect of the refractory mass on the tempera- ture response for the pilot unit.
The effect of the thermal mass of the circulating solids is also shown in Figure 14. For an average riser suspension den- sity of 60 kg/m3, there is a total mass of 4,800 kg of solids in the riser at any moment. Two cases are considered, one where the standpipe stores 15% of the total solids inventory for a total of 5,650 kg of solids and the other where the standpipe contains 50% of the inventory, giving 9,600 kg total inventory. The increased inventory is predicted to reduce the tempera- ture response only slightly. These results demonstrate that heat absorption by the containing structure plays a major role in controlling the temperature response to changes in fuel feed rate for small units.
Summary A dynamic model has been developed that predicts the
transient behavior of the combustion temperature, rate of heat removal by the in-bed heat exchanger, and the flue-gas oxygen concentration for a CFB combustor. These three fac- tors fully define the combustor at any time. This model pro- vides a macroscopic environment in which control systems can be investigated, without considering microscale phenomena. The model was incorporated into a simulator that predicts the behavior of the combustor under either manual control, in which operator inputs are accepted from the keyboard, or automatic control, for which any given control scheme may be executed in algorithmic form to meet specified combus- tion conditions.
The control model was validated by performing step re- sponse tests on the UBC pilot CFB combustor. Because
AIChE Journal May 1997
constant fuel feed rates could not be ensured during experi- mentation, direct step responses could not be compared. In- stead, 10-min averages of the measured fuel feed rate from experimentation were fed to the simulator, and the behavior compared to that from the experiments. Very good agree- ment was generally obtained between experiment and simu- lation. Discrepancies appear to arise primarily from unmod- eled disturbances rather than from basic model concepts.
The primary factor affecting the temperature response of the combustor was found to be the thermal capacity of the refractory and materials of construction. Char size, over a limited range (600 p m to 1 mm), had limited effect on the transients compared with the refractory thermal capacity for the pilot-scale unit investigated.
For an “idealized” 20-MWt combustor in which all heat is absorbed by the heat-exchange surfaces, there was a ten-fold reduction in the response time of temperature to changes in fuel feed rate. Although a greater inventory slows the tran- sient, the effect is small, with doubling the total inventory of solids increasing the response time by less than 20%.
Further validation of the dynamic model is provided by comparing discrete-time models obtained from experimenta- tion and simulation. These discrete-time models are essential for model-based control, such as Generalized Predictive Con- trol (Clarke et al., 1987). On the time scale considered for control, the simulation provides discrete-time model repre- sentations of the process similar to those determined from dynamic experiments on the pilot plant. The dynamic model should therefore provide a good basis for controller behavior simulation.
The dynamic model developed here has been shown to predict the behavior of the UBC pilot CFB combustor. Equipment-specific correlations, such as the suspension- density profile and the particle convective component of the heat-transfer coefficient to the heat-exchange surface and solids circulation rate, render the simulator system-specific. Hence, further work is required to apply the model to other units. The inclusion of a model for the behavior of the steam plant would also be necessary to complete the simulator for full-scale industrial units. Because of the modular nature of the simulation program, appropriate additions or modifica- tions can be easily incorporated to provide a powerful tool for the design of industrial-scale processes.
Acknowledgment The authors are grateful to Energy, Mines and Resources and to
the Natural Sciences and Engineering Research Council of Canada for support of this work.
Notation ab = cross-sectional inlet area of cyclone, m2 A = frequency factor, (kmol/m2. s ) / (km~i /m~)~
cb = bulk oxygen concentration, km01/m3 = cross-sectional area of riser, m2
co, cl, c2 = fitted constants in Eq. 5 C p w = heat capacity of water, J/kg.K
d , = char particle diameter, m a> = oxygen diffksivity, m2/s 0, = riser diameter, m E, = activation energy, kPa * m3/hol
g = acceleration of gravity, 9.81 m/s2 GXi= hypothetical solids mass flux at riser exit, kg/m2.s
Vol. 43, No. 5 1151
G Y j = hypothetical solids mass flux at solids return level,
h , = cyclone cylinder height, m hi = combustor inside heat-transfer coefficient, W/m’* K
h,, = gas convective component of heat transfer, W/m2 * K h,, = particle convective component of heat transfer, W/m2- K
hrad = radiative component of heat transfer, W/m*.K
kg/m2-s
H = cyclone overall height, m k , = diffusion coefficient, m/s k,5, = thermal conductivity of stainless steel, W/m.K k , = thermal conductivity of water, W/m * K m = exponent used in Eq. 18
mC02= molar flow of CO,, kmol/s m = mass-flow rate of cooling water, kg/s n = exponent in Eq. 18
Nu = Nusselt number P/S= primary-to-secondary air ratio
Pr = Prandtl number qhx = rate of heat transfer to heat exchanger, W Q, = flow rate of cooling water, m3/s
r, = overall rate of combustion, kmol/m2-s r,, = inside diameter of heat-transfer tubes, m rr0 = outside diameter of heat-transfer tubes, m R = gas constant, 8.314 kPa . m3/kmol K
Re, = particle Reynolds number Re, = Reynolds number of water in exchanger tubes
t = time, s tg = mean residence time of gas in cyclone, s < = mean solids residence time in cyclone, s T = temperature, K
T = gas temperature, K r“ = particle temperature, K f = temperature of surroundings, K
Tsurf= temperature of heat-transfer surface, K quSp = suspension temperature, K
Twaterin = water inlet temperature to heat exchanger, K TwaterOut = water outlet temperature from heat exchanger, K
ug = inlet gas velocity to cyclone, m/s U = gas velocity, m/s
CIg = superficial gas velocity, m/s CI* = dimensionless gas velocity (Grace, 1986)
u, = particle terminal velocity, m/s V, = cyclone volume excluding vortex finder, m3
V,,= volume of cyclone at natural length, m3 V , = annular volume above exit duct to middle of entrance duct
of cyclone, m3 z = vertical coordinate of riser, m
zo = reference height, m (Y = thermal diffusivity, m2/s E = voidage
er = voidage at solids return level p = gas viscosity, kg/m - s
pW = viscosity of water, kg/m.s pave,hx = average suspension density around heat-exchange
surface, kg/m’ pg = gas density, kg/m3 pf= suspension density at top of developing zone, kg/m3 p, = particle density, kg/m3 ps = apparent density of particles, kg/m3 p, = density of water, kg/m3 pr = suspension density at height z , kg/m3 po = reference suspension density at height zo, kg/m’ u= Stefan-Boltzmann constant, 5 . 6 7 ~ I = decay constant in Eq. 4, m-’
W/m2. K4
Literature Cited Box, G. E. P., and G. M. Jenkins, Time Series Analysis- Forecasting
and Control, Holden-Day, San Francisco (1970). Brereton, C. M. H., J. R. Grace, and J. Yu, “Axial Gas Mixing in a
Circulating Fluidized Bed,” Circulating Fuidized Bed Technology I I ,
P. Basu and J. F. Large, eds., Pergamon Press, Oxford, p. 307 (1988).
Brereton, C., and J. R. Grace, “End Effects in Circulating Fluidized Bed Hydrodynamics,” Circulating Fluidized Bed Technology N, A. A. Avidan, ed., AIChE, New York, p. 137 (1994).
Brereton, C., J. R. Grace, C. J. Lim, J. Zhu, R. Legros, J. R. Muir, J. Zhou, R. C. Senior, A. Luckos. N. Inumaru, J. Zhang, and I. Hwang, Final Rep., Energy, Mines, and Resources Canada, Con-
Chakraborty, R. K., and J. R. Howard, “Combustion of a Single Par- ticle in Fluidized Beds of High-Density Alumina,” J . Inst. Energy, 54, 55 (1981).
Clarke, D. W., C. Mohtadi, and P. Tuffs, “Generalized Predictive Control: Parts I and 11,” Automatica, 23, 137, 149 (1987).
deLasa, H., and G. Gau, “Influence des Agregats sur le Rendement d’un Rtacteur h Transport Pneumatique,”Chem. Eng. Sci., 28,1875 (1973).
Grace, J. R., “Contacting Modes and Behaviour Classification of Gas-Solid and Other Two-Phase Suspensions,”Can. J . Chem. Eng., 64, 353 (1986).
Hyppanen, T., Y. Y. Lee, A. Kettunen, and J. Riiali, “Dynamic Sim- ulation of a CFB Based Utility Power Plant,” Proc. Int. Fluidized Bed Combustion Conf., ASME, p. 1121 (1993).
Kang, S. K., T. W. Kwon, and S . D. Kim, “Hydrodynamic Character- istics of Cyclone Reactors,” Powder Tech., 58, 211 (1989).
LaNauze, R. D., “Fundamentals of Coal Combustion in Fluidized Beds,”Chem. Eng. Res. Design, 63, 3 (1985).
Lee, Y. Y., “Design Consideration for CFB Boilers,” Circulating Flu- idized Beds, J. R. Grace, A. A. Avidan, and T. M. Knowlton, eds., Chap. 11, Chapman and Hall, London, p. 417 (1997).
Leith, D., and W. Licht, “The Collection Efficiency of Cyclone Type Particle Collectors-A New Theoretical Approach,” AIChE Symp. Ser., 68(126), 196 (1972).
Mori, S. , K. Narukawa, 1. Yamada, T. Takebayashi, H. Tanii, Y. To- moyasu, and T. Mii, “Dynamic Model of a Circulating Fluidized Bed Coal Fired Boiler,” Proc. Int. Fluidized Bed Combustion Conf.. ASME, p. 1261 (1991).
Muir, J. R., “Dynamic Modeling for Simulation and Control of a Circulating Fluidized Bed Combustor,” PhD Thesis, University of British Columbia, Vancouver, B.C., Canada (1995).
Patience, G. S. , J. Chaouki, F. Berruti, and R. Wong, “Scaling Con- siderations for Circulating Fluidized Bed Risers,” Powder Tech., 72, 31 (1992).
Perry, R. H., and D. W. Green, Perry‘s Chemical Engineer’s Hand- book, 6th ed., McGraw-Hill, New York (1984).
Senior, R. C., and C. Brereton, “Modeling of Circulating Fluidized Bed Solids Flow and Distribution,” Chem. Eng. Sci., 47,281 (1992).
Sleicher, C. A,, and M. W. Rouse, “A Convenient Correlation for Heat Transfer to Constant and Variable Property Fluids in Turbu- lent Pipe Flow,” Int. J . Heat Mass Transfer, IS, 677 (1975).
Weiss, V., and F. N. Fett, “Modeling the Decomposition of Sodium Bicarbonate in a Circulating Fluidized Bed Reactor,” Circulating Fluidized Bed Technology, P. Basu, ed., Pergamon Press, Toronto, p. 167 (1986).
Weiss, V., J. Scholer, and F. N. Fett, “Mathematical Modeling of Coal Combustion in a Circulating Fluidized Bed Reactor,” Circu- lating Fluidized Bed Technology II , P. Basu and J. F. Large, eds., Pergamon Press, Oxford, p. 289 (1988).
Wen, C. Y., and L. H. Chen, “Fluidized Bed Freeboard Phenomena: Entrainment and Elutriation,” AIChE J. , 28, 117 (1982).
Wu, R. L., “Heat Transfer in Circulating Fluidized Beds,” PhD The- sis, Univ. of British Columbia, Vancouver, B.C., Canada (1989).
Yu, L., “Experimental Study on the Hydrodynamics in Circulating Fluidized Bed with Wide Particle Size Distribution,” MSc Thesis, Tsinghua Univ., Tsinghua, China (1989).
Zhang, L., T. D. Li, Q. Y. Zheng, and C. D. Lu, “A General Dy- namic Model for Circulating Fluidized Bed Combustion Systems with Wide Particle Size Distributions,” Proc. Int. Fluidized Bed Combustion Conf., ASME, p. 1289 (1991).
tract 55ss 23440-8-9243 (1991).
Maniiscript received Apr. 3. 1996, and revision received Dec. 4, 1996.
1152 May 1997 Vol. 43, No. 5 AIChE Journal