durability of wood polymer composites: part 1. influence of wood on the photochemical properties
TRANSCRIPT

Accepted Manuscript
�Durability of wood polymer composites: 1. Influence of wood on the photo
chemical properties
Diène Ndiaye, Elisabeth Fanton, Sandrine Morlat-Therias, Loı ̈ c Vidal, Adams
Tidjani, Jean-Luc Gardette
PII: S0266-3538(08)00232-7
DOI: 10.1016/j.compscitech.2008.06.014
Reference: CSTE 4101
To appear in: Composites Science and Technology
Received Date: 23 October 2007
Revised Date: 27 May 2008
Accepted Date: 1 June 2008
Please cite this article as: Ndiaye, D., Fanton, E., Morlat-Therias, S., Vidal, L., Tidjani, A., Gardette, J-L., Durability
of wood polymer composites: 1. Influence of wood on the photochemical properties, Composites Science and
Technology (2008), doi: 10.1016/j.compscitech.2008.06.014
This is a PDF file of an unedited manuscript that has been accepted for publication. As a service to our customers
we are providing this early version of the manuscript. The manuscript will undergo copyediting, typesetting, and
review of the resulting proof before it is published in its final form. Please note that during the production process
errors may be discovered which could affect the content, and all legal disclaimers that apply to the journal pertain.

ACCEPTED MANUSCRIPT
1
Durability of wood polymer composites:
1. Influence of wood on the photochemical properties
Diène Ndiaye1, Elisabeth Fanton2, Sandrine Morlat-Therias2, Loïc Vidal3,
Adams Tidjani4 and Jean-Luc Gardette2*
1 Université Gaston Berger de Saint-Louis, Sénégal 2 Laboratoire de Photochimie Moléculaire et Macromoléculaire,
Université Blaise Pascal - UMR CNRS 6505, 63170 Aubière, France 3 Service de Microscopie Electronique, Institut de Chimie des Surfaces et Interfaces
UPR CNRS 9069, 15 rue Jean Starcky, BP 2488 F-68057 Mulhouse, France 4 LRNA, Faculté des Sciences et Techniques, Université Cheikh Anta Diop de Dakar, Sénégal
Abstract:
The photooxidation of wood-based composites (WPC) using thermoplastics (PE, PP) as a
continuous phase has been investigated. WPC are increasingly used in applications in which
UV exposure has become a concern. The composites were produced by melt blending in a
Brabender at 180°C. Characterization of the samples, with the aid of scanning electron
microscopy supplemented by microscope photography, showed a good dispersion of wood in
the polymeric material. Dispersion was improved by adding polypropylene grafted with
maleic anhydride (PP-g-MA). The results clearly displayed that the presence of wood in
polymer composites does not change the pathway of photooxidation of the host polymer.
However, wood absorbs in the UV-visible domain and can contribute to the degradation
initiation through the creation of radicals. The outstanding outcome of this study is the
significant improvement of the photostability of WPC made with PPgMA. This opens a door
of better long term behaviour of this last formulation in the objective of outdoors applications.
Keywords: A polymer-matrix composites (PMCs); A wood; B Durability; D Infrared(IR) spectroscopy.
*Corresponding author Tel : 33 (4) 73 40 71 77, Fax : 33 (4) 73 40 77 00
e-mail address : [email protected]

ACCEPTED MANUSCRIPT
2
1. Introduction
Composites made from blend of thermoplastic and natural fibres have attracted a
number of researchers and manufacturers because of their great advantages [1]. Among them,
one can quote a reduction of the production cost, a low density of the material, and good
mechanical properties combining with renewability. So far, various thermoplastics, including
polyethylene and polypropylene, have been used as host material for research and
development, both on laboratory and industrial scales [2]. The enthusiasm in this field is
explained by the number of potential applications. For example wood - polymer composites
(WPC), mostly manufactured through extrusion and injection moulding processes are used in
automotive (dashboards or screen-doors of the vehicles) and construction industry (interior
floor coverings, profiled for doors and windows, ornamental panels, external shutters,
pavements, garage or entrance doors, and so on). However, because they are constituted of
organic materials, polymers and wood fibres, WPC are sensitive to UV light and thermal
ageing. Then, in applications which demand routine exposure to solar radiations, WPC are
likely to undergo degradation that limits their use.
The first key point for the production of acceptable WPC is the compatibility between
wood and polymer host matrix. Wood is hydrophilic in nature (high surface tension), which
lowers the compatibility with hydrophobic polymeric material (low surface tension) during
composite preparation. Scanning the literature, one can find different surface treatments that
have been experienced to improve wood/polymer adhesion in composites. Remind that the
level of adhesion and/or the dispersion state of wood are the key points for the improvement
of mechanical properties of the composites. Indeed, the wood particles which have high
strength and modulus -with good adhesion and uniform dispersion- can impart better
mechanical properties to the host polymer in order to obtain a composite with better
properties than those of the unfilled polymer. Maleic anhydride is the usual choice as a

ACCEPTED MANUSCRIPT
3
coupling agent [2]. Thus, the surface tension of wood fibres is reduced approaching that of
the molten polymer. From this point, wetting and adhesion are improved via mechanisms
such as diffusion and mechanical interlocking between the two entities.
WPC are produced starting from wood (up to 70 %), in the form of pellets, “flour” (fine
particles) or fibres, mixed with a polymeric matrix: for instance polyethylene, polypropylene
or polyvinylchloride. The unit is supplemented by many additives (antioxidants, pigments,
fungicides, stabilizing anti-UV, etc...).
Wood is a composite material consisting mainly of three major polymers: cellulose,
hemicellulose and lignin (schemes 1 and 2). It also contains extractives in few percentages
(proteins, oses). Contrary to the other components of the fibres which have an amorphous
structure, the cellulose has mainly a crystalline structure. The cellulose chains are joined
together into micro fibrillates which are arranged into several layers.
Scheme1: Chemical structure of cellulose
Scheme 2: Monomers constitutive of lignin (Alcohol coumarylic, coniferylic and
synapylic).

ACCEPTED MANUSCRIPT
4
As mentioned above, WPC are very sensitive to UV-light degradation. It has been shown
that lignins are keener to degradation among constituents of the wood [3-8]. The main
degradation process of lignin identified by the authors is the demethoxylation of the guaiacyl
or syringyl ring. Phenoxy radicals, which are the key intermediates, are formed through
different pathways. Phenols present might be photo oxidized into quinines and muconic acids.
The explanation given is the abstraction of phenol hydrogen by excited α -carbonyl or singlet
oxygen. Direct oxidation of phenols absorbing near UV light or homolysis of the β -O-4 bond
in aryl glycerol- β -aryl ethers can then occur. Scission of chemical bonds can also take place
leading to a production of radicals. This process is claimed to be responsible for yellowing of
wood [6].
The aim of this work is to develop photostable composite materials from polyolefin
(polypropylene and polyethylene) and wood flour. A first series of specimen was obtained by
blending wood flour and polymeric material. In a second series, polypropylene-grafted-maleic
anhydride was added to the previous ingredients. The behaviour of these materials under UV
light was studied. The evaluation of mechanical properties of the produced composites
through several tests (thickness swelling, hardness and moisture content) was also carried out
and will be reported in a forthcoming article.
2. Experimental
Materials
The wood flour particles of 425 microns (40-mesh) in size were kindly donated by
American Wood fibbers (Schofield, WI) and are constituted predominantly with ponderosa
pine, maple, oak, spruce, southern yellow pine, cedar. The wood was oven dried at 100°C for
24 h before processing to remove moisture.

ACCEPTED MANUSCRIPT
5
The isotactic polypropylene matrix (PP) has a density of 0.900 g/cm3 and a melt flow
index of 2.5g/10min. High density polyethylene (HDPE) used has a density 0.963g/cm3 and a
melt index of 0.72g/10min. Both polymers were provided by Solvay Co.
Polypropylene grafted with maleic anhydride (PP-g-MA) with an approximate maleic
anhydride (MA) content of 3 wt% was purchased from Aldrich Chemical Company, Inc.
(Milwaukee, WI). All ingredients were used as received.
Compounding and processing
The composite materials were obtained by melt blending in a chamber of a Brabender
mixer AEV 330 at 180°C for 10 min at 90 rpm. For the extraction of volatile and harmful
gases, the hood was open. At first, polymer was introduced for 5 min at 170°C and the screw
speed fixed at 40 rpm. In a second step the wood granulates and others compatibilizers were
introduced. The system was mixed during 10 min at 180°C at 90 rpm. After the processing
step, each sample was sandwiched during 1 min between two Teflon papers and pressed at
175°C under a pressure of 200 bars to obtain films with thicknesses between 100 to 200
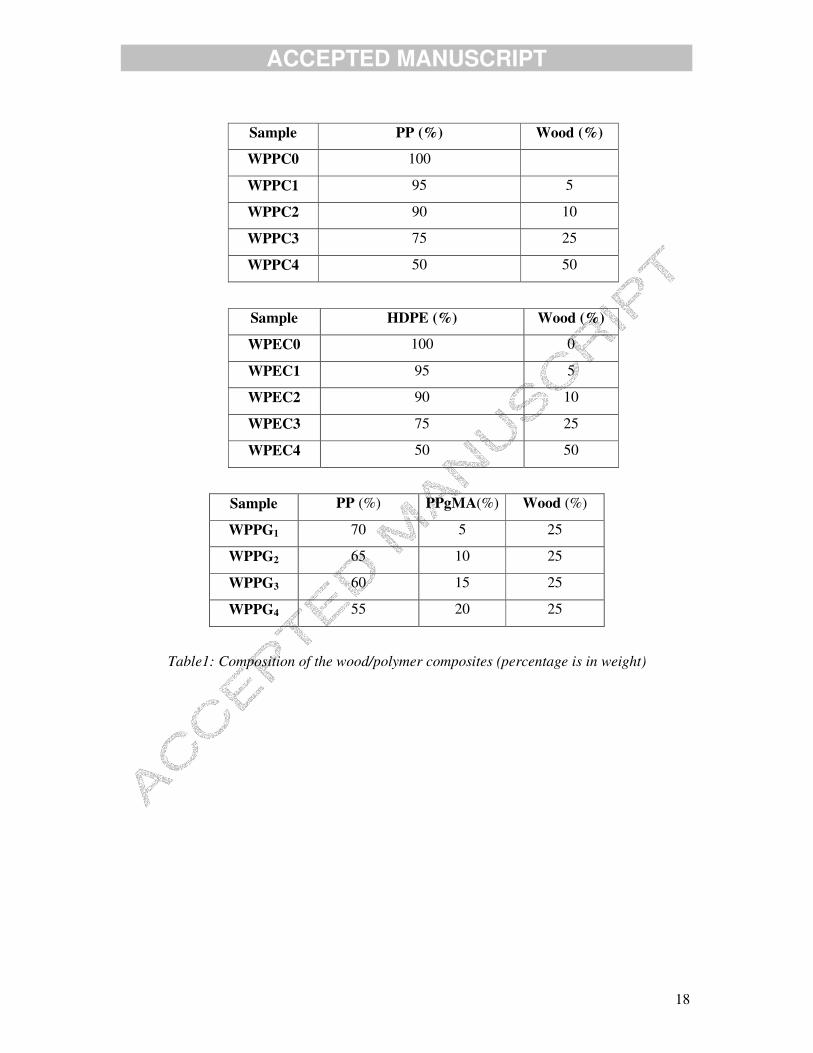
microns. For each polymer matrix (PP, PE), four formulations were produced with various
content of wood (table 1).
Table 1
Electron and optical microscopy
The state of dispersion of the wood inside the polymeric matrix was analyzed using
optical microscopy on samples of 100 to 200 µm thick. Scanning Electron Microscopy (SEM)
was used to obtain microphotographs of the fracture surfaces of the wood composites. These
factures have been performed in liquid nitrogen to avoid any deformation. SEM has been
performed using a FEI Quanta 400 microscope working at 30 kV.

ACCEPTED MANUSCRIPT
6
The polymer surface was examined with LEICA optical microscope working in a
transmission mode. Samples were thin enough that no special preparation of the samples was
needed for their observations with the optical microscope.
UV-irradiation and chemical characterization
The UV absorption of each sample was measured using a UV-510 Perkin-Elmer
spectrophotometer. Irradiation in conditions relevant to outdoor exposure (λ > 300 nm) in the
presence of air was carried out in a SEPAP 12/24 unit working at a temperature of 60°C.
Details on this artificial accelerated photoageing device are given elsewhere [9]. To follow the
degradation of the UV-light irradiated specimen, the infrared spectra were recorded with a
Nicolet 5SX FTIR-spectrometer, working with OMNIC software. Spectra were obtained
using 32 scans and a 4 cm-1 resolution.
3. Experimental results
3.1. Characterization of the initial properties of the WPC samples
Morphology and dispersion of the composites
Figure 1 shows the SEM micrographs of the fracture surface of the WP composites
made from PP, PE and PP with PPgMA.
Figure 1
Visual observation reveals a separation between particles and matrix in PP and PE
composites probably because of the lack of interfacial adhesion. In composites in which a
coupling agent is used, it looks smooth. This could result from the presence of PPgMA that
could bind the two phases together due to the OH groups of the wood that react with maleic
anhydride to form bonds [2] This provides sufficient adhesion between the components to
resist cracks forming as the consequence of the Poisson effect. Note that in all cases, an
absence of fibre pull-out, which indicates a weak interfacial adhesion [2, 10, 11]. The actual

ACCEPTED MANUSCRIPT
7
images of the wood dispersion acquired display a good dispersion of wood in the polymeric
material whatever the host material (Fig 2). However, in PE and PP composites, the wood
remains compact at opposite to PP/PPgMA in which the fibres are separated. This good
dispersion could be attributed to the fact that some of the OH groups of wood react with
maleic anhydride to form linkages and thereby improve the dispersion of wood in the
composite [10].
Figure 2
UV-visible absorption
The WPC samples made with PP and different percentages (from 0 to 50%) of wood
were characterized by their UV-visible spectrum before irradiation. Figure 3 shows the curves
obtained for thin films (thickness around 100 microns) of WPC with 0%, 5%, 10%, 25%and
50% of wood (WPPC0 to 4). The UV-visible spectrum of a PP film shows the presence of
two maxima at 230 nm and 280 nm which correspond to the processing phenolic antioxidant
remaining in the processed polymer. In presence of wood, the UV-visible spectra of WPC
reveal an increase of absorbance towards the long wavelengths in the visible part of the
spectrum. The absorbance increases with the amount of wood, but the presence of the
processing antioxidant is still observable even for the highest contents in wood.
Figure 3
Very similar observations can be made on the basis of the analysis of the UV-visible
absorption spectra of the PE/wood composites.
3.2. Influence of UV-irradiation on the chemical structure of PP and PE wood polymer
composites
PP/wood composites (WPPC)
Infrared analysis

ACCEPTED MANUSCRIPT
8
UV light irradiation of PP in air is known to produce dramatic modifications of the
infrared spectra of the exposed samples. The modifications of the IR spectra of all the WPC
films upon irradiation in the presence of oxygen are comparable to that of pristine
polypropylene, and are mainly characterized by an increase of absorbance in the hydroxyl and
carbonyl regions, as observed on figure 4, which shows the IR spectrum of the sample with 5
% of wood.
Figure 4
The photooxidation of polypropylene results in the formation of hydroxyl (mainly
hydroperoxides and alcohols) and carbonyl groups (mainly ketones, esters and acids) easily
detectable by infrared spectroscopy respectively in the 3200-3600 cm-1 and 1900-1500 cm-1
domains. The chemical structure of the main oxidation products can be considered as well
established and the mechanisms by which oxidation occur is now fairly well understood [12].
In the carbonyl domain the photochemical oxidation of PP leads to the formation of a broad
band with several maxima, peaking at 1713, 1735 and 1780 cm-1. The photoproducts
corresponding to these absorption maxima have been identified formerly [13, 14], and it is
agreed that the main absorption at 1713 cm-1 is that of the carboxylic acids in the dimer form.
The formation of carboxylic acids occurs with chain scissions, which are partly responsible
for the formation of nano/microcracks at the surface of the polymer and lead to the
degradation of the mechanical properties of the material. The chemical modifications of the
polymer measured by the concentration of the oxidation photoproducts can be quantitatively
related to the mechanical degradation of the material [15].
Rates of photooxidation
Figure 5 shows the variation of the ratio 1713 cm-1/ 2722 cm-1 as a function of
irradiation time respectively for PP and PP/wood films with different percentages of wood

ACCEPTED MANUSCRIPT
9
flour (WPPC 0 to 4). Because the content of polymer was different for the various samples as
a result of the different contents of wood flour, the kinetic curves of oxidation were plotted as
the ratio of the absorbance at 1713 cm-1 versus the absorbance at 2722 cm-1 (� (C-H) stretching
vibration band characteristic of PP).
Fig. 5 shows that in the case of pristine PP (WPPC0), no increase of absorbance is
observed during the first 20 hours of exposure. This is also the case in the domain of hydroxyl
not shown here. Oxidation can be detected only after this first period. This induction period
results from the disappearance of the processing antioxidant, which is consumed as a
sacrificial additive [16].
At opposite, it can be observed on the infrared spectra of all the samples containing
wood (WPPC1 to 4) that the absorbance in the carbonyl domain increases within the first 20
hours of irradiation. A careful examination of the hydroxyl domain shows that no increase of
absorbance occurs in this last domain for the same irradiation time (see for example Fig. 4
relative to WPPC2). This observation suggests that oxidation is not coming from the PP
matrix. A second important point observed in Figure 5 is that, within these first 20 hours, the
carbonyl absorbance in the case of PP/wood composites increases with the amount of wood in
the samples. These observations indicate that the initial increase of the carbonyl absorbance is
related to the oxidation of wood and not that of PP.
After the first period, oxidation of the polymer starts with a rate which is more
important for the samples with wood than for the PP one. The rate is slightly increasing with
the amount of wood in the composite but a plateau is reached for concentrations above 25%
of wood. These results indicate that the presence of wood considerably shortens the durability
of the composite.

ACCEPTED MANUSCRIPT
10
UV-visible analysis
Figure 6 shows the modifications of the UV-visible spectrum of WPPC4 (PP/ (50 %
wood) during photooxidation. This figure shows that the absorbance in the visible domain
increases with irradiation time. No modifications of the absorption spectrum of pristine PP are
expected in this domain of the visible absorption (above 300 nm) [16], even for longer
irradiation times. This result suggests that the modifications of the UV-visible absorption can
be unambiguously attributed to a photochemical transformation of wood in the polypropylene
matrix. The reaction involved in this process has been largely reported in the literature [3, 4,
6]. Considering the chemical composition of wood, lignin is the key structure in wood
photodegradation as only lignin absorbs in the UV-visible spectral domain [5-7]. The
mechanism of lignin photodegradation is complex, involving different pathways giving the
formation of radical species. These free radicals react with oxygen to produce chromophoric
groups as carbonyl and carboxyl groups, which also lead to chain cleavage and yellowing.
One of the main radicals is a long life guaiacoxy radical, which undergoes transformation into
quinoid structures which are the origin of the yellowing of wood [5-7].
Figure 6
HDPE/wood composites
Rate of oxidation
Photooxidation of WPC films with HDPE as polymer matrix (samples WPEC 0 to 4)
was followed by IR analysis. The same conclusions as for WPC with PP (samples WPPC 0 to
4) can be drawn concerning the reaction stoechiometry. The photooxidation of pure HDPE
gives an induction time of 30 hours, and in presence of wood the oxidation of the polymer
starts earlier (Fig. 7). Moreover, an increase of the rate of oxidation is observed by increasing
the percentage of wood. These observations indicate that the presence of wood participates in

ACCEPTED MANUSCRIPT
11
the initiation of degradation but does not change the reaction stoechiometry as seen
previously.
Figure 7
WPC made with PP/PPgMA/wood:
Beside the study of composites of wood and PP or HDPE, the photooxidation of
composites with wood, PP and a compatibilizing agent (PPgMA) was examined in order to
characterize the influence of a compatibilizing agent (PPgMA) on the photodegradation of
WPC. Figure 8 shows the modifications of the infrared spectrum of a sample made with 25%
of wood resulting from UV light irradiation in the presence of air (WPPG 1). The initial
spectrum of a WPPG 1 film shows a broad complex absorption band in the carbonyl domain.
This band results of the presence of both wood (25%) and maleic anhydride (3%). During the
UV irradiation, absorption bands develop in the carbonyl domain (Fig. 8). Previous studies of
the photooxidation of PPgMA samples have shown that no specific photoproducts of maleic
anhydride degradation were detected [16]. The modifications observed in Fig. 8 indicate then
the formation of oxidation photoproducts that come only from wood and PP, and not from
MA. As reported above, in the first 20 hours, the modifications reveal a rapid oxidation of
wood. The same behaviour is observed in the case of the other samples not presented here
(WPPG 2 to 4).
Figure 8
On the basis of the infrared spectra of the various samples, the rates of photooxidation
of WPC containing increasing amount of PPgMA (WPPG1 to 4) can be compared. Figure 9
represents the kinetic curves of oxidation for these samples and compares them with the curve
obtained in the case of the sample of PP/wood (25%) (WPPC3) extracted from fig. 5. Two
sets of curves are given, one for the carbonyl domain (fig.9a) and another one for the

ACCEPTED MANUSCRIPT
12
hydroxyl domain (fig.9b). In both cases one can make the same remarks. At first it is clearly
observed that the presence of MA as a compatibilizer has for effect to decrease the oxidation
rate of PP in the WPC. All the curves presented in figure 9 are below the curve corresponding
to the sample that has no compatibilizer. Moreover it can be clearly observed that increasing
the amount of PPgMA increases the stability of the polymer. After 80 hours of irradiation, no
oxidation can be observed in the case of the samples with PPgMA (WPPG 3 and 4), whereas
in the case of WPPC 3, oxidation started after only 20 hours under irradiation. This stabilizing
effect resulting from the presence of maleic anhydride has to be considered as rather
important in terms of applications of WPC.
Figure 9
4. Conclusion
The wood polymer composites produced using PE and PP as the host polymer showed
interesting features. The characterization of the samples with the help of electron microscopy
supplemented with microscope photographs revealed an acceptable level of dispersion of the
wood particle in the polymeric material. Addition of PPgMA in polypropylene composites
appreciably improved this dispersion, which might be explained by the formation of linkages
between the OH groups of wood and maleic anhydride.
The following of the photooxidation behaviour of the samples highlights that the
presence of wood in polymer composites has no influence on the mechanism of
photooxidation of the polymer (PP or PE). This means that the same photoproducts are
formed as well in WPC and as the pristine polymer, in the same relative concentrations.
However, wood absorbs in the UV-visible region, as observed on the spectra of the WPC
samples that present a higher absorbance in the UV domain (300-400 nm) than the polymer
samples. Wood is not inert under UV-visible light and specific photoproducts coming from
the oxidation of wood are detected in the first 20 hours of irradiation.

ACCEPTED MANUSCRIPT
13
Under irradiation, lignins that are considered in the literature as the key structures
involved in the degradation of wood generate phenoxy radicals, and phenols might be
oxidized [3, 4, 5, 19]. The influence of wood in composites expresses itself in the durability of
the WPC by the modification of the kinetics of photooxidation. The results show that wood
has no marked effect on the oxidation induction time of the polymer, which corresponds to
the disappearance of the residual processing antioxidant [17, 18]. However one can clearly
observe that the presence of wood results in an increase of the oxidation rate of the polymeric
matrix, after the induction period. This effect is more and more accentuated with increasing
amounts of wood within the WPC, up to 25%. This can be explained by radicalar species
produced by photooxidation of wood that are likely to initiate the oxidation of the polymer
once the antioxidant has been consumed within the induction period. Wood acts then as an
initiator on the photooxidation of the polymer matrix, PP or PE, in the WPC material.
However, by increasing the percentage of wood, the amount of polymer in the composite is
lower, and the global effect on the durability of the WPC material might be positive if one
considers the level of degradation of the composite and of the pure polymer after the same
ageing time.
In PP/PPgMA/wood composites the fibres are separated. This better dispersion has
been attributed to the possible reaction of some of the OH groups of wood with maleic
anhydride to form linkages and thereby improve the dispersion of wood in the composite.
Interestingly this results in an improvement of the photostability of WPC composites made
with PPgMA and a better long-term behaviour in the objective of outdoors applications.
The next step of this study will be the analysis of the evolution of the used properties
of the WPC material, which have only been characterized before ageing.

ACCEPTED MANUSCRIPT
14
References
1. Stark MN, Matuana M L. Surface chemistry and mechanical property changes of
wood-flour/High-density-polyethylene composites after accelerated weathering. J. Appl.
Polym. Sci. 2004; 94: 2263-2273.
2. Sombatsompop N, Yotinwattanakumtorn C, Thongpin C. Influence of type and
concentration of maleic anhydride grafted polypropylene and impact modifiers on mechanical
properties of PP/wood sawdust composites. J. Appl. Polym. Sci. 2005; 97:475-484.
3. Béarnais-Barbry S., Ph D Thesis (2001), Université de Bordeaux 1: Etude de la
photoréactivité de la méthoxy-p-quinone et de phenyl-p-benzoquinones en solution.
4. Ruggiero R, Machado AEH, Gardrat C, Hoareau W, Grelier S, Siegmund B, Castellan
A. Photodegradation of sugar cane bagasse acidolysis lignins. J Photochem. Photobiol. A:
Chem. 2005;173 :150-155.
5. George B, Suttie E, Merlin A, Deglise X. Photodegradation and photostabilisation of
wood - the state of the art. Polym. Degrad. Stab. 2005;88 :268-274.
6. Mitsui K, Tsuchikawa S. Low atmospheric temperature dependence on
photodegradation of wood. J. Photochem. Photobiol. B: Biol. 2005;81:84-88.
7. Ayadi N, Lejeune F, Charrier F, Charrier B, Merlin A. Color stability of heat-treated
wood during artificial weathering. Holz als Roh- und Werkstoff, 2003;61:221-226.
8. Lundquist L, Marque B, Hagstrand P-O, Leterrier Y, Manson J-AE. Novel pulp fibre
reinforced thermoplastic composites, Comp. Sci. Technol. 2003; 63 : 137-152.
9. Lemaire J, Arnaud R, Gardette JL. Le vieillissement des polymères : Principes d’étude
du photovieillissement., Rev. Gen. Caoutch. Plast. 1981;613:87-92

ACCEPTED MANUSCRIPT
15
10. .Kandem DP, Jiang H, Cui W, Freed J, Matuana LM. Properties of wood plastic
composites made of recycled HDPE and wood flour from CCA-treated wood removed from
service. Composites: Part A. 2004; 35 : 347-355.
11. Bengtsson M, Gatenholm P, Oksman K. The effect of crosslinking on the properties of
polyethylene/wood flour composites. Composites Sci. Technol. 2005;65:1468-1479.
12. Phillipart JL, Sinturel C, Gardette JL. Influence of light intensity on the
photooxidation of polypropylene . Polym. Degrad. Stab. 1997;58:261-268.
13. Phillipart JL, Sinturel C, Arnaud R, Gardette JL. Influence of the exposure parameters
on the mechanism of photooxidation of polypropylene. Polym. Degrad. Stab. 1999;64: 213-
225.
14. Lacoste J, Vaillant D, Carlsson DJ. Gamma-, photo- and thermally-initiated oxidation
of isotactic polypropylene. J. Polym. Sci., part A: Polym. Chem. 1993; 31(3): 715-722.
15. Fréchou C. Influence des conditions d’injection sur le comportement photochimique
de polypropylenes. Ph D Thesis, Université Blaise Pascal, 1994.
16. Morlat S, Mailhot B, Gonzalez D; Gardette JL. Photooxidation of
Polypropylene/Montmorillonite nanocomposites Part I : Influence of nanoclay and
compatibilising agent. Chem. Mater. 2004; 16(3):377-383.
17. Morlat-Thérias S, Mailhot B,Gonzalez D, Gardette JL. Photooxidation of
Polypropylene/Montmorillonite nanocomposites Part II : Interactions with antioxidants.
Chem. Mater. 2005; 17(5):1072-1078.
18. Marcovich NE, Villar MA. Thermal and mechanical characterization of linear low-
density polyethylene/wood flour composites. J.Appl. Polym. Sci. 2003; 90: 2775-2784.
19 Colom X, Carrillo F, Nogues F, Garriga P Structural analysis of photodegraded wood
by means of FTIR spectroscopy. Polym. Degrad. Stab. 2003; 80: 543-549.

ACCEPTED MANUSCRIPT
16
Figure captions
Figure 1: SEM micrographs of WP composites with PE (left) PP (middle) and PP /PPgMA
(right). The percentage of wood is 25% in all samples.
Figure 2: Photographs of the composite surfaces: PE/wood (left), PP/wood (middle) and
PP/PPgMA/wood (right).
Figure 3: UV-Visible spectra of film of WPC made with PP and wood: the curves go from
bottom to the top according to the percentage of wood incorporated in the sample (0, 5, 10,
25, and 50% wood’s weight).
Figure 4: IR spectra of a WPPC2 film (PP/wood (5%)) during photooxidation.
Figure 5: Variations of the normalized carbonyl absorbance
(∆(OD(1713 cm-1)/OD(2722 cm-1)) as a function of irradiation time for films of PP/wood
during photooxidation at λ > 300nm, 60°C (WPPC0 to 4).
Figure 6: UV-visible spectra of a WPPC4 film (e~100 µm) during photooxidation (λ > 300
nm, 60°C)(the curves go from bottom to the top according to the irradiation time 0h, 30h, 60h
and 80h).
Figure 7: Variations of normalized absorbance (∆(OD (1712 cm-1)/OD(720 cm-1)) as a
function of irradiation time for films of HDPE/wood (WPEC 0 to 4) during photooxidation at
λ > 300nm, 60°C.
Figure 8: Modifications of the infrared spectra of PP/PPgMA/wood (WPPG 1) under
photooxidation at λ > 300nm, 60°C (differences of spectra in the carbonyl domain 10h-0h,
20h-0h,…80h-0h).
Figure 9: Variations of a) normalized carbonyl absorbance
(∆(OD(1718 cm-1)/OD(2722 cm-1)) and b) normalized hydroxyl absorbance

ACCEPTED MANUSCRIPT
17
(∆(OD (3400 cm-1)/OD(2722 cm-1)) as a function of irradiation time for films of
PP/PPgMA/wood (25% of wood) during photooxidation at λ > 300nm, 60°C ( WPPG1 to
4)and film of PP/wood (WPPC3).
ACCEPTED MANUSCRIPT
18
Sample PP (%) Wood (%)
WPPC0 100
WPPC1 95 5
WPPC2 90 10
WPPC3 75 25
WPPC4 50 50
Sample HDPE (%) Wood (%)
WPEC0 100 0
WPEC1 95 5
WPEC2 90 10
WPEC3 75 25
WPEC4 50 50
Sample PP (%) PPgMA(%) Wood (%)
WPPG1 70 5 25
WPPG2 65 10 25
WPPG3 60 15 25
WPPG4 55 20 25
Table1: Composition of the wood/polymer composites (percentage is in weight)

ACCEPTED MANUSCRIPT
19
Figure 1: SEM micrographs of WP composites with PE (left) PP (middle) and PP /PPgMA
(right).The percentage of wood is 25% in weight in all samples.
Figure 2: Photographs of the composite surfaces: PE/wood (left), PP/wood (middle) and
PP/PPgMA/wood (right).

ACCEPTED MANUSCRIPT
20
0
0,2
0,4
0,6
0,8
1
1,2
1,4
1,6
1,8
2
200 250 300 350 400 450 500 550 600
Ab
sorb
ance
�(nm)
0
0,2
0,4
0,6
0,8
1
1,2
1,4
1,6
1,8
2
200 250 300 350 400 450 500 550 600
Ab
sorb
ance
�(nm) Figure 3: UV-Visible spectra of film of WPC made with PP and wood: the curves go from
bottom to the top according to the percentage of wood incorporated in the sample (0, 5, 10,
25, and 50°/° wood’s weight)
Figure 4: IR spectra of a WPPC2 film (PP/wood (5%)) during photooxidation
0.0
0.4
0.8
1.2
1.6
2.0
2.4
2.8
Abs
orba
nce
500 1000 1500 2000 2500 3000 3500 4000
Wavenumber (cm-1)
80h70h60h50h40h30h20h10h
0h
0.0
0.4
0.8
1.2
1.6
2.0
2.4
2.8
Abs
orba
nce
500 1000 1500 2000 2500 3000 3500 4000
Wavenumber (cm-1)
80h70h60h50h40h30h20h10h
0h

ACCEPTED MANUSCRIPT
21
Figure 5 : Variations of the normalized carbonyl absorbance (∆(OD (1713 cm-1)/OD(2722
cm-1)) as a function of irradiation time for films of PP/wood during photooxidation at λ >
300nm, 60°C (WPPC0 to 4).
0 20 40 60 80 100 1200
1
2
3
4
5
∆∆ ∆∆O
D 1
713
cm-1
/OD
272
2 cm
-1
Irradiation time (h)
WPPC0WPPC4WPPC3WPPC2WPPC1
0 20 40 60 80 100 1200
1
2
3
4
5
∆∆ ∆∆O
D 1
713
cm-1
/OD
272
2 cm
-1
Irradiation time (h)
WPPC0WPPC4WPPC3WPPC2WPPC1
0 20 40 60 80 100 1200
1
2
3
4
5
∆∆ ∆∆O
D 1
713
cm-1
/OD
272
2 cm
-1
Irradiation time (h)
WPPC0WPPC4WPPC3WPPC2WPPC1

ACCEPTED MANUSCRIPT
22
Figure 6: UV-visible spectra of a WPPC4 film (e~100 µm) during photooxidation (λ > 300
nm, 60°C)(the curves go from bottom to the top according to the irradiation time 0h, 30h, 60h
and 80h)
0
0,5
1
1,5
2
2,5
3
Abs
orba
nce
�(nm)
200 300 400 500 600250 350 450 5500
0,5
1
1,5
2
2,5
3
Abs
orba
nce
0
0,5
1
1,5
2
2,5
3
Abs
orba
nce
�(nm)
200 300 400 500 600250 350 450 550200 300 400 500 600250 350 450 550

ACCEPTED MANUSCRIPT
23
Figure 7: Variations of normalized absorbance (∆(OD (1712 cm-1)/OD(720 cm-1)) as a
function of irradiation time for films of HDPE/wood (WPEC 0 to 4) during photooxidation at
λ > 300nm, 60°C.
0 20 40 60 80 1000,0
0,1
0,2
0,3
0,4
0,5
0,6
0,7
∆∆ ∆∆ OD
171
2cm
-1/O
D 7
20cm
-1
Irradiation time (h)
WPEC0WPEC1WPEC2WPEC3WPEC4
0 20 40 60 80 1000,0
0,1
0,2
0,3
0,4
0,5
0,6
0,7
∆∆ ∆∆ OD
171
2cm
-1/O
D 7
20cm
-1
Irradiation time (h)
WPEC0WPEC1WPEC2WPEC3WPEC4
0 20 40 60 80 1000,0
0,1
0,2
0,3
0,4
0,5
0,6
0,7
∆∆ ∆∆ OD
171
2cm
-1/O
D 7
20cm
-1
Irradiation time (h)
WPEC0WPEC1WPEC2WPEC3WPEC4
0 20 40 60 80 1000,0
0,1
0,2
0,3
0,4
0,5
0,6
0,7
∆∆ ∆∆ OD
171
2cm
-1/O
D 7
20cm
-1
Irradiation time (h)
WPEC0WPEC1WPEC2WPEC3WPEC4
0 20 40 60 80 1000,0
0,1
0,2
0,3
0,4
0,5
0,6
0,7
∆∆ ∆∆ OD
171
2cm
-1/O
D 7
20cm
-1
Irradiation time (h)
WPEC0WPEC1WPEC2WPEC3WPEC4
0 20 40 60 80 1000,0
0,1
0,2
0,3
0,4
0,5
0,6
0,7
∆∆ ∆∆ OD
171
2cm
-1/O
D 7
20cm
-1
Irradiation time (h)
WPEC0WPEC1WPEC2WPEC3WPEC4

ACCEPTED MANUSCRIPT
24
Figure 8: Modifications of the infrared spectra of PP/PPgMA/wood (WPPG 1) under
photooxidation at λ > 300nm, 60°C (differences of spectra in the carbonyl domain 10h-0h,
20h-0h,…80h-0h)
0,00
0,10
0,20
0,30
0,40
0,50
0,60
0,70
Abs
orba
nce
1550 1600 1650 1700 1750 1800 1850 1900
Wavenumber (cm-1)
80h70h60h50h40h30h20h10h
0,00
0,10
0,20
0,30
0,40
0,50
0,60
0,70
Abs
orba
nce
1550 1600 1650 1700 1750 1800 1850 1900
Wavenumber (cm-1)
80h70h60h50h40h30h20h10h
80h70h60h50h40h30h20h10h

ACCEPTED MANUSCRIPT
25
a)
b)
Figure 9: Variations of a) normalized carbonyl absorbance (∆(OD (1718 cm-1)/OD(2722cm-
1)) and b) normalized hydroxyl absorbance(∆(OD (3400 cm-1)/OD(2722 cm-1)) as a function
of irradiation time for films of PP/PPgMA/wood (25% of wood) during photooxidation at λ >
300nm, 60°C ( WPPG1 to 4)and film of PP/wood (WPPC3).
0 20 40 60 800,0
0,2
0,4
0,6
0,8
1,0
1,2
1,4
1,6
1,8
2,0
∆(O
D)
1718
cm
-1 / ∆
(OD
) 27
22 c
m-1
Irradiation time (h)
WPPG1WPPG2WPPG3WPPC3WPPG4
0 20 40 60 800,0
0,2
0,4
0,6
0,8
1,0
1,2
1,4
1,6
1,8
2,0
∆(O
D)
1718
cm
-1 / ∆
(OD
) 27
22 c
m-1
Irradiation time (h)
WPPG1WPPG2WPPG3WPPC3WPPG4
0 20 40 60 800,00
0,05
0,10
0,15
0,20
0,25
0,30
0,35
0,40
∆∆ ∆∆ (O
D)3
400
cm-1
// (
OD
)272
2 cm
-1
Irradiation time (h)
WPPG1WPPG2WPPC3WPPG3WPPG4
0 20 40 60 800,00
0,05
0,10
0,15
0,20
0,25
0,30
0,35
0,40
∆∆ ∆∆
Irradiation time (h)
WPPG1WPPG2WPPC3WPPG3WPPG4
0 20 40 60 800,00
0,05
0,10
0,15
0,20
0,25
0,30
0,35
0,40
Irradiation time (h)
WPPG1WPPG2WPPC3WPPG3WPPG4
0 20 40 60 800,00
0,05
0,10
0,15
0,20
0,25
0,30
0,35
0,40
∆∆ ∆∆ (O
D)3
400
cm-1
// (
OD
)272
2 cm
-1
Irradiation time (h)
WPPG1WPPG2WPPC3WPPG3WPPG4
0 20 40 60 800,00
0,05
0,10
0,15
0,20
0,25
0,30
0,35
0,40
∆∆ ∆∆ (O
D)3
400
cm-1
// (
OD
)272
2 cm
-1
Irradiation time (h)
WPPG1WPPG2WPPC3WPPG3WPPG4
0 20 40 60 800,00
0,05
0,10
0,15
0,20
0,25
0,30
0,35
0,40
∆∆ ∆∆
Irradiation time (h)
WPPG1WPPG2WPPC3WPPG3WPPG4
0 20 40 60 800,00
0,05
0,10
0,15
0,20
0,25
0,30
0,35
0,40
Irradiation time (h)
WPPG1WPPG2WPPC3WPPG3WPPG4