driverdb: an exome sequencing database for cancer driver gene identification
TRANSCRIPT

DriverDB an exome sequencing database forcancer driver gene identificationWei-Chung Cheng12 I-Fang Chung3 Chen-Yang Chen3 Hsing-Jen Sun3
Jun-Jeng Fen34 Wei-Chun Tang3 Ting-Yu Chang5 Tai-Tong Wong12 and
Hsei-Wei Wang2356
1Pediatric Neurosurgery Department of Surgery Cheng Hsin General Hospital Taipei 11220 Taiwan 2VGH-YMGenomic Research Center National Yang-Ming University Taipei 11221 Taiwan 3Institute of BiomedicalInformatics National Yang-Ming University Taipei 11221 Taiwan 4Information Technology Office TaipeiVeterans General Hospital Taipei 11217 Taiwan 5Institute of Microbiology and Immunology National Yang-Ming University Taipei 11221 Taiwan and 6Department of Education and Research Taipei City Hospital Taipei10341 Taiwan
Received August 15 2013 Revised and Accepted October 7 2013
ABSTRACT
Exome sequencing (exome-seq) has aided in thediscovery of a huge amount of mutations incancers yet challenges remain in convertingoncogenomics data into information that is inter-pretable and accessible for clinical care We con-structed DriverDB (httpngsymedutwdriverdb)a database which incorporates 6079 cases ofexome-seq data annotation databases (such asdbSNP 1000 Genome and Cosmic) and publishedbioinformatics algorithms dedicated to drivergenemutation identification We provide twopoints of view lsquoCancerrsquo and lsquoGenersquo to help re-searchers to visualize the relationships betweencancers and driver genesmutations The lsquoCancerrsquosection summarizes the calculated results of drivergenes by eight computational methods for a specificcancer typedataset and provides three levels ofbiological interpretation for realization of the rela-tionships between driver genes The lsquoGenersquo sectionis designed to visualize the mutation information ofa driver gene in five different aspects Moreover alsquoMeta-Analysisrsquo function is provided so researchersmay identify driver genes in customer-definedsamples The novel driver genesmutationsidentified hold potential for both basic researchand biotech applications
INTRODUCTION
Next-generation sequencing (NGS) has greatly increasedthe identification of mutations in cancer genomes andallows researchers to profile the molecular characteristicsof various cancer types In the past few years applyingexome sequencing (exome-seq) in oncogenomics studieshas become the norm (1) Also enormous amounts ofcancer genomics data have been generated from large-scale cancer projects (2) such as The Cancer GenomeAtlas (TCGA) the International Cancer GenomeConsortium (ICGC) the Therapeutically ApplicableResearch to Generate Effective Treatments (TARGET)and the Pediatric Cancer Genome Project (PCGP)Although NGS has already helped researchers discoverhuge amounts of aberrant events in cancer genomicstranslating these data into information that can be easilyinterpreted and accessed is still challengingCancers are primarily caused by the accumulation of
genetic alterations and could be characterized bynumerous somatic mutations However not all of thesemutations are involved in tumorigenesis Only a subsetof mutations contributes to cancer development whereasothers make no or little important contribution To crys-tallize this concept the terms lsquodriver and lsquopassengerrsquomutation have been coined (3) The mutations thatconfer a selective growth advantage to the tumor cell arecalled lsquodriverrsquo mutations (1) lsquoPassengerrsquo mutations aredefined as those which do not confer growth advantagebut that do occur in a cell that coincidentally or subse-
To whom correspondence should be addressed Tel +886 2 2826 7109 Fax +886 2 28212880 Email hwwangymedutwCorrespondence may also be addressed to Tai-Tong Wong Tel +886 2 28264545 Fax +886 2 28264533 Email ch9321chghorgtw
The authors wish it to be known that in their opinion the first two authors should be regarded as Joint First Authors
Nucleic Acids Research 2013 1ndash7doi101093nargkt1025
The Author(s) 2013 Published by Oxford University PressThis is an Open Access article distributed under the terms of the Creative Commons Attribution Non-Commercial License (httpcreativecommonsorglicensesby-nc30) which permits non-commercial re-use distribution and reproduction in any medium provided the original work is properly cited For commercialre-use please contact journalspermissionsoupcom
Nucleic Acids Research Advance Access published November 7 2013 at N
ational Yang-M
ing Univ L
ibrary on Novem
ber 13 2013httpnaroxfordjournalsorg
Dow
nloaded from
quently acquires a driver mutation (4) In most solidtumors an average of 33ndash66 genes with somatic mutationswere found to alter their protein products but the countof non-synonymous mutations varies across cancer types(1) More than 80 of mutations are missense (1) andthese mutations vary highly in their functional impactdepending on their position and function in the proteinand the nature of the replacement amino acid It remains asignificant challenge to identify cancer driver mutationsbecause many observed missense changes are neutral pas-senger mutations (5) Several computational algorithmshave been developed to predict the functional impact ofmissense mutations based on concepts including evolu-tionary conservation structural constraints and thephysicochemical attributes of amino acids In the lastfew years machine learning methods have been developedto specifically predict cancer-driving deleterious mutations(6ndash8)A driver gene is defined as a gene whose dysfunction
will cause tumorigenesis Vogelstein et al have demon-strated the fundamental difference between a driver geneand a driver mutation (1) Numerous computationalmethods to identify driver genes have been publishedalgorithms such as MutsigCV (9) MuSiC (10) Simon(11) OncodriverFM (12) and ActiveDriver (13) arebased on the mutation frequency of an individual genecompared with the background mutation rate Howeverbackground mutation rates among different genomeregions and patients are highly variable (9) Recentstudies have shown that the mutation rate varies innormal cells by more than 100-fold within the genome(14) and that such variation is higher in tumor cells (15)To correct for this bias MutSigCV uses patient-specificmutation frequency and spectrum as well as gene-specific background mutation rates OncodriverFMincorporates the functional impacts of mutations as add-itional information ActiveDriver identifies driver geneswith statistically significant mutation rates in phosphoryl-ation-specific regions Other methods are based on thesub-network approach (16ndash24) that can identify groupsof genes containing driver mutations directly fromcancer mutation data either with or without prior know-ledge of pathways or other information of proteingeneticsinteractions This approach is successful particularly whenthe observed frequencies of passenger and driver muta-tions are indistinguishable a situation wherein singlegene tests fail Moreover sub-networks are believed toidentify cancer driver genes with low recurrence (25)Most of sub-network based methods such as MEMo(19) MDPFinder (16) Dendrix (17) Multi-Dendrix (18)and RME (24) identify driver genes with the characteris-tics of mutual exclusivity Moreover sub-networkmethods could additionally incorporate copy numbervariation (CNV) data for driver gene identification(16ndash192224)In this study we present the DriverDB database which
incorporates a large amount (gt6000 cases) of exome-seqdata annotation databases (such as dbSNP (26) 1000Genome (27) and COSMIC (28)) and the various bio-informatics algorithms devoted to defining driver genesor mutations DriverDB focuses on predicting driver
genes by various algorithms and provides differentaspects of the mutation profiles of an individual geneWe provide two view points lsquoCancerrsquo and lsquoGenersquo forbenefiting researchers to visualize the relationshipsbetween cancers and driver genesmutations A lsquoMeta-Analysisrsquo function is further included in the DriverDBfor allowing researchers to identify driver genes ofcustom-defined samples according to clinical criteria
MATERIALS AND METHODS
Dataset collection
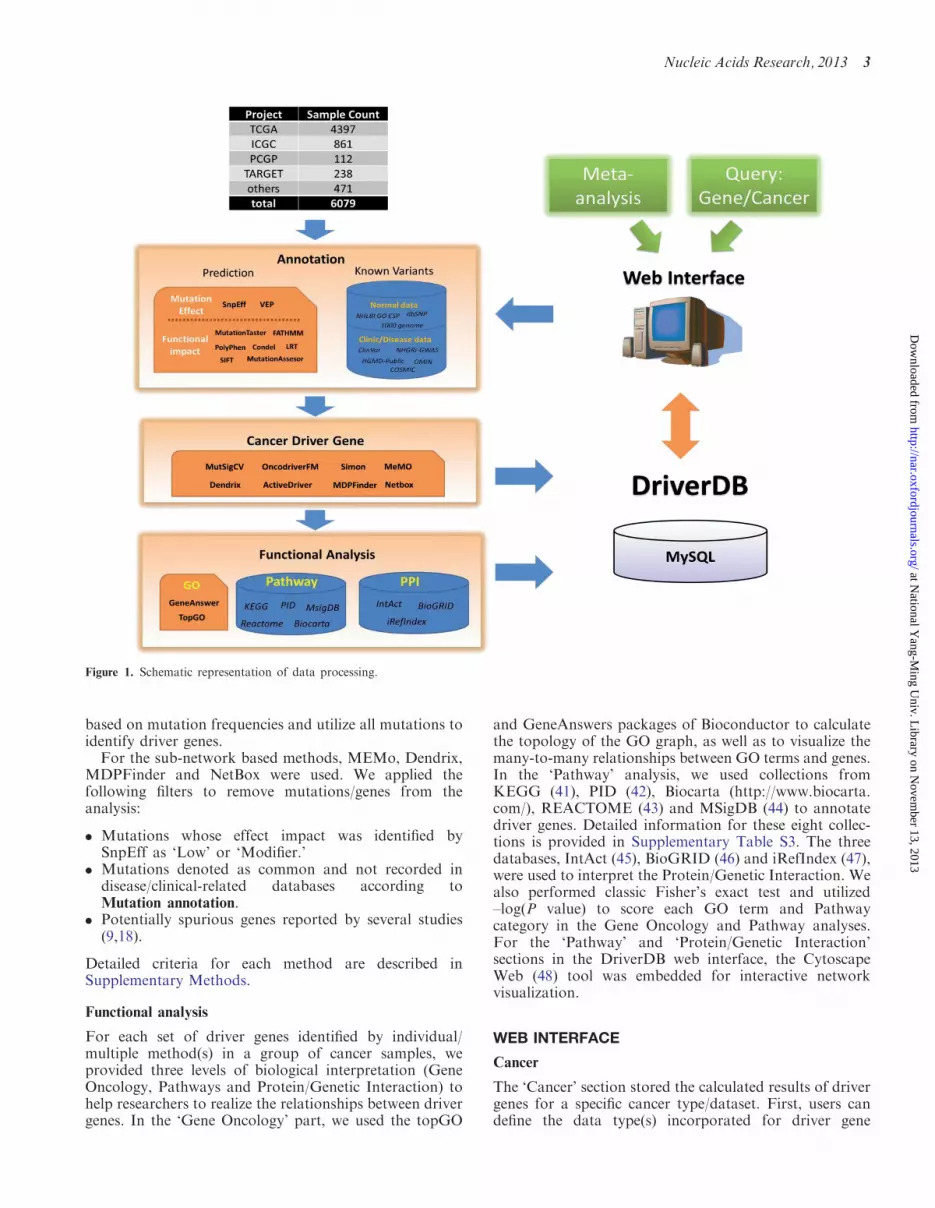
As shown in Figure 1 DriverDB includes mutationprofiles from 6079 tumorndashnormal pairs including 4397from TCGA 861 from ICGC 112 from PCGP 238from TARGET and 471 from published papers (denotedas lsquoothersrsquo in Figure 1) Detailed information for thedatasets is provided in Supplementary Table S1 Themutation data and CNV data of these pairs were retrievedfrom the data portal of the projects or from the supple-mentary data of the published papers and were thenparsed using in-house Perl scripts To ensure annotationconsistency and to make the retrieval process more effi-cient clinical information for each sample was manuallycurated based on clinical data obtained as mentionedabove Each sample was re-annotated with 38 clinicalcharacteristics The summary of the clinical informationis provided in Supplementary Table S2
Mutation annotation
All mutations were mapped to known databases and theirfunctional impacts were predicted by numerous bioinfor-matics tools shown in the Annotation module in Figure 1For annotating known variants DriverDB incorporatesthe information collected from different databasesincluding dbSNP NHLBI GO ESP (29) 1000 genomesCOSMIC ClinVar (httpwwwncbinlmnihgovclinvar)NHGRI GWAS catalog (30) HGMD-PUBLIC (31) andOMIM (httpomimorg) We used SnpEff (32) and VEP(33) to predict the effect of each mutation such as non-synonymous coding stop gainedlost and frame-shiftIn addition DriverDB scores the deleterious effects andfunctional impact by seven algorithms including SIFT(34) PolyPhen2 (35) Condel (36) LRT (37) FATHMM(38) MutationAssessor (39) and MutationTaster (40)Furthermore we scored each mutation by the number ofalgorithms that judge the mutation as deleterious (thesenumbers are denoted as lsquoDriver Scorersquo) For examplethe mutation g178952085AgtG of PIK3CA which occursin gt100 patients from various cancer types was identifiedas deleterious by seven algorithms therefore its DriverScore is 7
Driver gene identification
DriverDB utilized eight computational methods toidentify driver genes of cancer types (the Cancer DriverGene module in Figure 1) Four methods includingMutsigCV Simon OncodriverFM and ActiveDriver are
2 Nucleic Acids Research 2013
at National Y
ang-Ming U
niv Library on N
ovember 13 2013
httpnaroxfordjournalsorgD
ownloaded from
based on mutation frequencies and utilize all mutations toidentify driver genes
For the sub-network based methods MEMo DendrixMDPFinder and NetBox were used We applied thefollowing filters to remove mutationsgenes from theanalysis
Mutations whose effect impact was identified bySnpEff as lsquoLowrsquo or lsquoModifierrsquo
Mutations denoted as common and not recorded indiseaseclinical-related databases according toMutation annotation
Potentially spurious genes reported by several studies(918)
Detailed criteria for each method are described inSupplementary Methods
Functional analysis
For each set of driver genes identified by individualmultiple method(s) in a group of cancer samples weprovided three levels of biological interpretation (GeneOncology Pathways and ProteinGenetic Interaction) tohelp researchers to realize the relationships between drivergenes In the lsquoGene Oncologyrsquo part we used the topGO
and GeneAnswers packages of Bioconductor to calculatethe topology of the GO graph as well as to visualize themany-to-many relationships between GO terms and genesIn the lsquoPathwayrsquo analysis we used collections fromKEGG (41) PID (42) Biocarta (httpwwwbiocartacom) REACTOME (43) and MSigDB (44) to annotatedriver genes Detailed information for these eight collec-tions is provided in Supplementary Table S3 The threedatabases IntAct (45) BioGRID (46) and iRefIndex (47)were used to interpret the ProteinGenetic Interaction Wealso performed classic Fisherrsquos exact test and utilizedndashlog(P value) to score each GO term and Pathwaycategory in the Gene Oncology and Pathway analysesFor the lsquoPathwayrsquo and lsquoProteinGenetic Interactionrsquosections in the DriverDB web interface the CytoscapeWeb (48) tool was embedded for interactive networkvisualization
WEB INTERFACE
Cancer
The lsquoCancerrsquo section stored the calculated results of drivergenes for a specific cancer typedataset First users candefine the data type(s) incorporated for driver gene
Figure 1 Schematic representation of data processing
Nucleic Acids Research 2013 3
at National Y
ang-Ming U
niv Library on N
ovember 13 2013
httpnaroxfordjournalsorgD
ownloaded from
identification (the red rectangle in Supplementary FigureS1A) and then select a specific dataset for examplelsquoGlioblastoma multiformersquo (GBM) The result sectionwill then indicate the detailed information of the specificdataset (red circle in Supplementary Figure S1B) Userscan select a driver gene set identified by lsquoNrsquo methods(the lsquoSummaryrsquo in Supplementary Figure S1B lsquoNrsquo isdetermined by a drop-down menu) or by individualmethods according to the name of the method(Supplementary Figure S1B) For lsquoSummaryrsquo a heatmap shows the relationship between genes and methods(Supplementary Figure S1C the blue color indicates genesidentified as driver genes by a method) For each drivergene set there is a heat map showing a mutation profile ofthat driver gene set of samples (Supplementary FigureS1D) We also performed functional analysis in threelevels of biological interpretation lsquoGene OntologyrsquolsquoPathwayrsquo and lsquoProteinGenetics Interactionrsquo In thelsquoGene Ontologyrsquo analysis I and II indicate the topologyof GO graph by topGO and GeneAnswers respectively(Supplementary Figure S1E) whereas III and IV show themost significant GO terms and genes The table inSupplementary Figure S1E lists the information of allthe significant GO terms In the lsquoPathwayrsquo analysisthere are eight collections of gene sets from public data-bases including KEGG REACTOME MSigDB PIDand Biocarta For each collection there is a network visu-alization and a table displaying pathway categories of thedriver genes that are involved (Supplementary FigureS1F) Finally in the lsquoProteinGenetics Interactionrsquo partthe interactions between driver genes are illustrated ac-cording to three resources BioGRID IntAct andiRefIndex (Supplementary Figure S1G)
Gene
In this section researchers can visualize the mutation datafor a specific protein encoded by a gene in five differentkinds of aspects Mutation Profile Mutation PercentageExon Driver Score and Mutation Information(Supplementary Figure S2A) Here we use the genePIK3CA which is identified as a driver gene in thelsquoCancerrsquo section as an example Bar chart colors in thesub-figures of Supplementary Figure S2 indicate the func-tional impact of a mutation such as non-synonymous andframe-shift shown in Supplementary Figure S2B ForlsquoMutation Profilersquo (Supplementary Figure S2C) a heatmap shows the mutation rate calculated by the mutationcountsample count of a cancer at different protein pos-itions across several cancer types We also provide exonand domain information with protein coordinates at thebottom of the heat map (Supplementary Figure S2C)Two bar charts located at the top and the left of theheat map indicate the sum of mutation rate according toprotein position and cancer type respectively ThelsquoMutation Percentagersquo (Supplementary Figure S2D) issimilar to Supplementary Figure S2C but the number inthe heat map is calculated by the following (mutationcount of a protein regiontotal mutation count of a can-cer) 100 The heights of the two bar charts at the left andthe top of the heat map are normalized to the mutation
count of a cancer type or a protein region respectivelyIn the lsquoExonrsquo panel the mutation counts and the mutationtypes of each exon are illustrated in Supplementary FigureS2E and S2F respectively For the lsquoDriver Scorersquo partSupplementary Figure S2G and S2H indicate the DriverScore (please see the lsquoMaterials and Methodsrsquo section fordetails) distributions of exons and protein positions re-spectively All the mutation data of a specific protein arelisted under lsquoMutation Informationrsquo (SupplementaryFigure S2A)
Meta-analysis
In addition to the stored calculated resultsDriverDB allows researchers to identify driver genes of auser-defined specific set of samples As shown inSupplementary Figure S3 users can select one ormultiple datasets in DriverDB We provide a list ofclinical criteria such as ICD-O-3 histology tumor stagedistant metastasis and lymph node status to helpresearchers to select a sub-group of well-defined cancersamples according to one or multiple clinical parametersfor driver gene identification Users can overview thedetailed clinical information of selected samples beforesubmitting this job to the server for real-time calculationThe user will receive a notification email with a Result IDand then visualized driver gene results in the lsquoResult andDownloadrsquo section when the job is completed
DISCUSSION
DriverDB makes the best of the massive amount ofexome-seq data published in recent years by integratingdriver gene analysis from numerous methods as well as byproviding visualizations of mutation information accord-ing to different aspects As described in the lsquoIntroductionrsquosection different bioinformatics algorithms have beendeveloped to identify driver genes based on severalassumptions and characteristics each of which providesdifferent points of view regarding driver genesDriverDB integrates the analysis results of individualmultiple method(s) and provides three levels of biologicalinterpretation Gene Oncology Pathway and ProteinGenetics Interaction These visualization results will helpusers to quickly realize the relationships between drivergenes A representative example of driver genes identifiedin GBM is shown in Supplementary Figure S1 A total of14 driver genes were identified (each gene by at least 4methods) and nearly all samples had at least 1 deleteriousmutation among these 14 genes Ten genes (CDKN2AEGFR PTEN TP53 CDK4 PIK3R1 NF1 PIK3CARB1 and IDH1) are known to be critical in GBM tumori-genesis (4950) For the other four genes (ATRX CHEK2CPSF6 and COL6A3) our functional analysis shows thatthey are involved in cell cycle-related categories(Supplementary Figure S1F) Moreover ATRX hasbeen reported as the driver gene in pediatric glioblastomas(51) and neuroblastomas (5253) CHEK2 is relevant tofamilial breastovarian cancer (54) and neuroblastomas(54) CPSF6 can either enhance the invasive capacities ofor inhibit the proliferation of cancer cells (55) The spliced
4 Nucleic Acids Research 2013
at National Y
ang-Ming U
niv Library on N
ovember 13 2013
httpnaroxfordjournalsorgD
ownloaded from
variants and the aberrant methylation of COL6A3 arealso related to cancers (56ndash58) Genes reported in otherreferences but not included in our 14-gene list can beidentified by less stringent criteria (such as those identifiedby at least three methods for example PDGFRAMDM2 MDM4 and CDKN2B)
The lsquoGenersquo section is designed to help researchers tovisualize the mutation data of a driver gene The represen-tative example is PIK3CA a well-known driver gene inGBM as well as in other cancers (Supplementary FigureS2) It is easy to find that there are two hotspot mutationregions (at the middle and the end of the protein) espe-cially in the lsquoMutation Percentagersquo figure (SupplementaryFigure S2D) The two well-known driver genes BRAFand KRAS also have the same characteristics(Supplementary Figure S4) However a driver gene mayhave distinct hotspot mutation regions in differentcancers For example unlike lung cancers that carryEGFR mutations at the kinase domain (KD) activationof EGFR in GBM occurs through mutation at the extra-cellular domain (59) This has been noted as the reasonthat GBM with mutations in the extracellular domainrespond poorly to EGFR inhibitors (eg erlotinib) thattarget the active kinase conformation (59) This phenom-ena was recaptured by our calculation and was present inthe lsquoMutation Profilersquo of EGFR in DriverDB(Supplementary Figure S5)
In the lsquoGenersquo section bar chart colors indicate the func-tional impact of a mutation which can help to conveyimportant information For example FLT3 has beenreported to be mutated in approximately one-third ofpatients in acute myeloid leukemia and has two hotspotregions one consists of internal tandem duplication (ITD)mutations of 3ndash400 bp (always in-frame) and the otherconsists of point mutations at aspartic acid 835 of theKD (60) Such mutation information for FLT3 can beeasily obtained in DriverDB (Supplementary Figure S6)
Several studies have assessed the performance ofexisting tools for predicting deleterious mutations andthe results have demonstrated that identifying cancer-driving mutations remains a significant challenge (561)Hence we used the lsquoDriver Scorersquo which integrates theinformation from seven computational tools to describethe deleterious level of a mutation and to highlight thehotspot mutation region For example the Driver Scoredistribution of the cancer-related gene lsquoMLL2rsquo impliesthat the third region of the MLL2 protein plays a moreimportant role than other positions (SupplementaryFigure S7) In summary in the lsquoGenersquo section ofDriverDB researchers can easily be informed when muta-tions are concentrated in onesome specific protein pos-ition(s)domain(s)exon(s)cancer(s)
The lsquoMeta-analysisrsquo section allows a user to re-define agroup of samples from onemultiple datasets and thenidentify driver genes for selected samples It has beennoted that mutations are accumulated during tumorprogression Different driver mutations may be used toconvert a normal cell to a tumor cell or to turn abenign tumor into a malignant one The timing of muta-tions is relevant to metastasis and there are mutationsthat occur during this process (1) Thus if we could
define samples by a clarified biological or clinical goalwe would have the opportunity to identify a specific setof driver genes for a distinct question To achieve thisDriverDB offers a list of clinical characteristics to definesamples and provides a high degree of freedom forresearchers to utilize the huge amount of sequencingdata For example in Supplementary Figure S3 weselected only 180 samples from TCGA breast cancerproject Their lymphonode pathologic spread and ICDoncology of histology are lsquoN0rsquo and lsquoinfiltrating duct car-cinoma NOSrsquo respectivelyA number of databases and frameworks have been
developed to integrate large-scale genomic data (2)including cBioportal (6263) and IntOGen (64)cBioportal contains datasets from TCGA and providesgene-based search capabilities to interactively exploremultidimensional cancer genomics data IntOGen is aframework that integrates multidimensional data for theidentification of genes and biological modules involved incancer development DriverDB incorporates a large-scaledata mining work using these algorithms in one gopresents summarized driver genes and provides differentkinds of aspects for mutation visualization Anotherunique part of DriverDB is that it also helps researchersto identify driver genes in a customer-defined mannerNGS has become the norm for large-scale cancer
research and cancer exome-seq results will accumulaterapidly in the next few years For example TCGA willexamine over 11000 samples for 20 cancer types bythe end of 2014 Due to the Publication Guidelines ofTCGA (httpcancergenomenihgovabouttcgapoliciespublicationguidelines) parts of data from TCGA areexcluded in DriverDB As time goes by data fromTCGA as well as from other cancer projectsliteratureswill have no publication limitations and will beincorporated into updated DriverDB We envision thatthese novel driver genes or mutations identified andstored in DriverDB will hold great potential for bothbasic research and biotech product development
SUPPLEMENTARY DATA
Supplementary Data are available at NAR Online
ACKNOWLEDGEMENTS
We acknowledge the contribution of Chien Shu and KunZhang from University of California at San Diego for theanalysis of exome-seq and thank the National Center forHigh-performance Computing for computer time andfacilities
FUNDING
National Science Council [NSC NSC101-2320-B-010-059-MY3 NSC101-2627-B-010-003 and NSC101-2321-B-010-011] Veterans General Hospitals University System ofTaiwan (VGHUST) Joint Research Program TsoursquosFoundation [GHUST102-G7-3-2] National HealthResearch Institutes (NHRI) [NHRI-EX102-10254SI]
Nucleic Acids Research 2013 5
at National Y
ang-Ming U
niv Library on N
ovember 13 2013
httpnaroxfordjournalsorgD
ownloaded from
Taipei Veteran General Hospital [Cancer ExcellenceCenter Plan DOH102-TD-C-111-007] Taipei CityHospital [10201-62-070] National Yang-Ming University[Ministry of Education Aim for the Top University Plan]UST-UCSD International Center for Excellence inAdvanced Bioengineering sponsored by the Taiwan NSCI-RiCE Program (in part) [NSC101-2911-I-009-101]Funding for open access charge NSC
Conflict of interest statement None declared
REFERENCES
1 VogelsteinB PapadopoulosN VelculescuVE ZhouSDiazLA Jr and KinzlerKW (2013) Cancer genome landscapesScience 339 1546ndash1558
2 ShyrD and LiuQ (2013) Next generation sequencing in cancerresearch and clinical application Biol Proced Online 15 4
3 StrattonMR CampbellPJ and FutrealPA (2009) The cancergenome Nature 458 719ndash724
4 BozicI AntalT OhtsukiH CarterH KimD ChenSKarchinR KinzlerKW VogelsteinB and NowakMA (2010)Accumulation of driver and passenger mutations during tumorprogression Proc Natl Acad Sci USA 107 18545ndash18550
5 GnadF BaucomA MukhyalaK ManningG and ZhangZ(2013) Assessment of computational methods for predicting theeffects of missense mutations in human cancers BMC Genomics14(Suppl 3) S7
6 CarterH ChenS IsikL TyekuchevaS VelculescuVEKinzlerKW VogelsteinB and KarchinR (2009) Cancer-specifichigh-throughput annotation of somatic mutations computationalprediction of driver missense mutations Cancer Res 696660ndash6667
7 ZhaoH YangY LinH ZhangX MortM CopperDNLiuY and ZhouY (2013) DDIG-in discriminating betweendisease-associated and neutral non-frameshifting micro-indelsGenome Biol 14 R23
8 LiMX KwanJS BaoSY YangW HoSL SongYQ andShamPC (2013) Predicting mendelian disease-causing non-synonymous single nucleotide variants in exome sequencingstudies PLoS Genet 9 e1003143
9 LawrenceMS StojanovP PolakP KryukovGVCibulskisK SivachenkoA CarterSL StewartCMermelCH RobertsSA et al (2013) Mutational heterogeneityin cancer and the search for new cancer-associated genes Nature499 214ndash218
10 DeesND ZhangQ KandothC WendlMC SchierdingWKoboldtDC MooneyTB CallawayMB DoolingDMardisER et al (2012) MuSiC identifying mutationalsignificance in cancer genomes Genome Res 22 1589ndash1598
11 YounA and SimonR (2011) Identifying cancer driver genes intumor genome sequencing studies Bioinformatics 27 175ndash181
12 Gonzalez-PerezA and Lopez-BigasN (2012) Functional impactbias reveals cancer drivers Nucleic Acids Res 40 e169
13 ReimandJ and BaderGD (2013) Systematic analysis of somaticmutations in phosphorylation signaling predicts novel cancerdrivers Mol Syst Biol 9 637
14 MichaelsonJJ ShiY GujralM ZhengH MalhotraDJinX JianM LiuG GreerD BhandariA et al (2012)Whole-genome sequencing in autism identifies hot spots for denovo germline mutation Cell 151 1431ndash1442
15 Nik-ZainalS AlexandrovLB WedgeDC Van LooPGreenmanCD RaineK JonesD HintonJ MarshallJStebbingsLA et al (2012) Mutational processes molding thegenomes of 21 breast cancers Cell 149 979ndash993
16 ZhaoJ ZhangS WuLY and ZhangXS (2012) Efficientmethods for identifying mutated driver pathways in cancerBioinformatics 28 2940ndash2947
17 VandinF UpfalE and RaphaelBJ (2012) De novodiscovery of mutated driver pathways in cancer Genome Res 22375ndash385
18 LeisersonMD BlokhD SharanR and RaphaelBJ (2013)Simultaneous identification of multiple driver pathways in cancerPLoS Comput Biol 9 e1003054
19 CirielloG CeramiE SanderC and SchultzN (2012) Mutualexclusivity analysis identifies oncogenic network modules GenomeRes 22 398ndash406
20 CeramiE DemirE SchultzN TaylorBS and SanderC(2010) Automated network analysis identifies core pathways inglioblastoma PLoS ONE 5 e8918
21 BashashatiA HaffariG DingJ HaG LuiK RosnerJHuntsmanDG CaldasC AparicioSA and ShahSP (2012)DriverNet uncovering the impact of somatic driver mutations ontranscriptional networks in cancer Genome Biol 13 R124
22 TrifonovV PasqualucciL Dalla FaveraR and RabadanR(2013) MutComFocal an integrative approach to identifyingrecurrent and focal genomic alterations in tumor samples BMCSyst Biol 7 25
23 DandN SprengelF AhlersV and SchlittT (2013) BioGranat-IG a network analysis tool to suggest mechanisms of geneticheterogeneity from exome-sequencing data Bioinformatics 29733ndash741
24 MillerCA SettleSH SulmanEP AldapeKD andMilosavljevicA (2011) Discovering functional modules byidentifying recurrent and mutually exclusive mutational patternsin tumors BMC Med Genomics 4 34
25 VandinF UpfalE and RaphaelBJ (2012) Finding driverpathways in cancer models and algorithms Algorithm Mol Biol7 23
26 SherryST WardMH KholodovM BakerJ PhanLSmigielskiEM and SirotkinK (2001) dbSNP the NCBIdatabase of genetic variation Nucleic Acids Res 29 308ndash311
27 AbecasisGR AutonA BrooksLD DePristoMADurbinRM HandsakerRE KangHM MarthGT andMcVeanGA (2012) An integrated map of genetic variation from1092 human genomes Nature 491 56ndash65
28 ForbesSA BindalN BamfordS ColeC KokCY BeareDJiaM ShepherdR LeungK MenziesA et al (2011)COSMIC mining complete cancer genomes in the Catalogue ofSomatic Mutations in Cancer Nucleic Acids Res 39D945ndashD950
29 TennessenJA BighamAW OrsquoConnorTD FuWKennyEE GravelS McGeeS DoR LiuX JunG et al(2012) Evolution and functional impact of rare coding variationfrom deep sequencing of human exomes Science 337 64ndash69
30 HindorffLA SethupathyP JunkinsHA RamosEMMehtaJP CollinsFS and ManolioTA (2009) Potentialetiologic and functional implications of genome-wide associationloci for human diseases and traits Proc Natl Acad Sci USA106 9362ndash9367
31 CooperDN StensonPD and ChuzhanovaNA (2006) TheHuman Gene Mutation Database (HGMD) and its exploitationin the study of mutational mechanisms Curr ProtocBioinformatics Chapter 1 Unit 1 13
32 CingolaniP PlattsA Wang leL CoonM NguyenTWangL LandSJ LuX and RudenDM (2012) Aprogram for annotating and predicting the effects ofsingle nucleotide polymorphisms SnpEff SNPs in the genomeof Drosophila melanogaster strain w1118 iso-2 iso-3 Fly 680ndash92
33 McLarenW PritchardB RiosD ChenY FlicekP andCunninghamF (2010) Deriving the consequences of genomicvariants with the Ensembl API and SNP Effect PredictorBioinformatics 26 2069ndash2070
34 NgPC and HenikoffS (2001) Predicting deleterious amino acidsubstitutions Genome Res 11 863ndash874
35 AdzhubeiIA SchmidtS PeshkinL RamenskyVEGerasimovaA BorkP KondrashovAS and SunyaevSR(2010) A method and server for predicting damaging missensemutations Nat Methods 7 248ndash249
36 Gonzalez-PerezA and Lopez-BigasN (2011) Improving theassessment of the outcome of nonsynonymous SNVs with aconsensus deleteriousness score Condel Am J Hum Genet 88440ndash449
6 Nucleic Acids Research 2013
at National Y
ang-Ming U
niv Library on N
ovember 13 2013
httpnaroxfordjournalsorgD
ownloaded from
37 ChunS and FayJC (2009) Identification of deleteriousmutations within three human genomes Genome Res 191553ndash1561
38 ShihabHA GoughJ CooperDN DayIN and GauntTR(2013) Predicting the functional consequences of cancer-associatedamino acid substitutions Bioinformatics 29 1504ndash1510
39 RevaB AntipinY and SanderC (2011) Predicting thefunctional impact of protein mutations application to cancergenomics Nucleic Acids Res 39 e118
40 SchwarzJM RodelspergerC SchuelkeM and SeelowD (2010)MutationTaster evaluates disease-causing potential of sequencealterations Nat Methods 7 575ndash576
41 KanehisaM GotoS SatoY FurumichiM and TanabeM(2012) KEGG for integration and interpretation of large-scalemolecular data sets Nucleic Acids Res 40 D109ndashD114
42 SchaeferCF AnthonyK KrupaS BuchoffJ DayMHannayT and BuetowKH (2009) PID the Pathway InteractionDatabase Nucleic Acids Res 37 D674ndashD679
43 CroftD OrsquoKellyG WuG HawR GillespieM MatthewsLCaudyM GarapatiP GopinathG JassalB et al (2011)Reactome a database of reactions pathways and biologicalprocesses Nucleic Acids Res 39 D691ndashD697
44 SubramanianA TamayoP MoothaVK MukherjeeSEbertBL GilletteMA PaulovichA PomeroySLGolubTR LanderES et al (2005) Gene set enrichmentanalysis a knowledge-based approach for interpreting genome-wide expression profiles Proc Natl Acad Sci USA 10215545ndash15550
45 KerrienS ArandaB BreuzaL BridgeA Broackes-CarterFChenC DuesburyM DumousseauM FeuermannM HinzUet al (2012) The IntAct molecular interaction database in 2012Nucleic Acids Res 40 D841ndashD846
46 Chatr-AryamontriA BreitkreutzBJ HeinickeS BoucherLWinterA StarkC NixonJ RamageL KolasN OrsquoDonnellLet al (2013) The BioGRID interaction database 2013 updateNucleic Acids Res 41 D816ndashD823
47 RazickS MagklarasG and DonaldsonIM (2008) iRefIndex aconsolidated protein interaction database with provenance BMCBioinformatics 9 405
48 LopesCT FranzM KaziF DonaldsonSL MorrisQ andBaderGD (2010) Cytoscape Web an interactive web-basednetwork browser Bioinformatics 26 2347ndash2348
49 VerhaakRG HoadleyKA PurdomE WangV QiYWilkersonMD MillerCR DingL GolubT MesirovJPet al (2010) Integrated genomic analysis identifies clinicallyrelevant subtypes of glioblastoma characterized by abnormalitiesin PDGFRA IDH1 EGFR and NF1 Cancer Cell 17 98ndash110
50 Cancer Genome Atlas Research Network (2008) Comprehensivegenomic characterization defines human glioblastoma genes andcore pathways Nature 455 1061ndash1068
51 SchwartzentruberJ KorshunovA LiuXY JonesDTPfaffE JacobK SturmD FontebassoAM QuangDATonjesM et al (2012) Driver mutations in histone H33 andchromatin remodelling genes in paediatric glioblastoma Nature482 226ndash231
52 PughTJ MorozovaO AttiyehEF AsgharzadehS WeiJSAuclairD CarterSL CibulskisK HannaM KiezunA et al(2013) The genetic landscape of high-risk neuroblastoma NatGenet 45 279ndash284
53 CheungNK and DyerMA (2013) Neuroblastomadevelopmental biology cancer genomics and immunotherapyNat Rev Cancer 13 397ndash411
54 RashidMU MuhammadN FaisalS AminA and HamannU(2013) Constitutional CHEK2 mutations are infrequent in early-onset and familial breastovarian cancer patients from PakistanBMC Cancer 13 312
55 YuK GanesanK TanLK LabanM WuJ ZhaoXDLiH LeungCH ZhuY WeiCL et al (2008) A preciselyregulated gene expression cassette potently modulates metastasisand survival in multiple solid cancers PLoS Genet 4 e1000129
56 MaekawaR SatoS YamagataY AsadaH TamuraI LeeLOkadaM TamuraH TakakiE NakaiA et al (2013)Genome-wide DNA methylation analysis reveals a potentialmechanism for the pathogenesis and development of uterineleiomyomas PLoS ONE 8 e66632
57 GardinaPJ ClarkTA ShimadaB StaplesMK YangQVeitchJ SchweitzerA AwadT SugnetC DeeS et al (2006)Alternative splicing and differential gene expression in coloncancer detected by a whole genome exon array BMC Genomics7 325
58 ArafatH LazarM SalemK ChipitsynaG GongQPanTC ZhangRZ YeoCJ and ChuML (2011) Tumor-specific expression and alternative splicing of the COL6A3 genein pancreatic cancer Surgery 150 306ndash315
59 VivancoI RobinsHI RohleD CamposC GrommesCNghiemphuPL KubekS OldriniB ChhedaMGYannuzziN et al (2012) Differential sensitivity of glioma- versuslung cancer-specific EGFR mutations to EGFR kinase inhibitorsCancer Disc 2 458ndash471
60 SmallD (2006) FLT3 mutations biology and treatmentHematology the Education Program of the American Society ofHematology American Society of Hematology Education Program178ndash184
61 Gonzalez-PerezA Deu-PonsJ and Lopez-BigasN (2012)Improving the prediction of the functional impact of cancermutations by baseline tolerance transformation Genome Med 489
62 CeramiE GaoJ DogrusozU GrossBE SumerSOAksoyBA JacobsenA ByrneCJ HeuerML LarssonEet al (2012) The cBio cancer genomics portal an open platformfor exploring multidimensional cancer genomics data CancerDisc 2 401ndash404
63 GaoJ AksoyBA DogrusozU DresdnerG GrossBSumerSO SunY JacobsenA SinhaR LarssonE et al(2013) Integrative analysis of complex cancer genomics andclinical profiles using the cBioPortal Sci Signal 6 pl1
64 GundemG Perez-LlamasC Jene-SanzA KedzierskaAIslamA Deu-PonsJ FurneySJ and Lopez-BigasN (2010)IntOGen integration and data mining of multidimensionaloncogenomic data Nat Methods 7 92ndash93
Nucleic Acids Research 2013 7
at National Y
ang-Ming U
niv Library on N
ovember 13 2013
httpnaroxfordjournalsorgD
ownloaded from

quently acquires a driver mutation (4) In most solidtumors an average of 33ndash66 genes with somatic mutationswere found to alter their protein products but the countof non-synonymous mutations varies across cancer types(1) More than 80 of mutations are missense (1) andthese mutations vary highly in their functional impactdepending on their position and function in the proteinand the nature of the replacement amino acid It remains asignificant challenge to identify cancer driver mutationsbecause many observed missense changes are neutral pas-senger mutations (5) Several computational algorithmshave been developed to predict the functional impact ofmissense mutations based on concepts including evolu-tionary conservation structural constraints and thephysicochemical attributes of amino acids In the lastfew years machine learning methods have been developedto specifically predict cancer-driving deleterious mutations(6ndash8)A driver gene is defined as a gene whose dysfunction
will cause tumorigenesis Vogelstein et al have demon-strated the fundamental difference between a driver geneand a driver mutation (1) Numerous computationalmethods to identify driver genes have been publishedalgorithms such as MutsigCV (9) MuSiC (10) Simon(11) OncodriverFM (12) and ActiveDriver (13) arebased on the mutation frequency of an individual genecompared with the background mutation rate Howeverbackground mutation rates among different genomeregions and patients are highly variable (9) Recentstudies have shown that the mutation rate varies innormal cells by more than 100-fold within the genome(14) and that such variation is higher in tumor cells (15)To correct for this bias MutSigCV uses patient-specificmutation frequency and spectrum as well as gene-specific background mutation rates OncodriverFMincorporates the functional impacts of mutations as add-itional information ActiveDriver identifies driver geneswith statistically significant mutation rates in phosphoryl-ation-specific regions Other methods are based on thesub-network approach (16ndash24) that can identify groupsof genes containing driver mutations directly fromcancer mutation data either with or without prior know-ledge of pathways or other information of proteingeneticsinteractions This approach is successful particularly whenthe observed frequencies of passenger and driver muta-tions are indistinguishable a situation wherein singlegene tests fail Moreover sub-networks are believed toidentify cancer driver genes with low recurrence (25)Most of sub-network based methods such as MEMo(19) MDPFinder (16) Dendrix (17) Multi-Dendrix (18)and RME (24) identify driver genes with the characteris-tics of mutual exclusivity Moreover sub-networkmethods could additionally incorporate copy numbervariation (CNV) data for driver gene identification(16ndash192224)In this study we present the DriverDB database which
incorporates a large amount (gt6000 cases) of exome-seqdata annotation databases (such as dbSNP (26) 1000Genome (27) and COSMIC (28)) and the various bio-informatics algorithms devoted to defining driver genesor mutations DriverDB focuses on predicting driver
genes by various algorithms and provides differentaspects of the mutation profiles of an individual geneWe provide two view points lsquoCancerrsquo and lsquoGenersquo forbenefiting researchers to visualize the relationshipsbetween cancers and driver genesmutations A lsquoMeta-Analysisrsquo function is further included in the DriverDBfor allowing researchers to identify driver genes ofcustom-defined samples according to clinical criteria
MATERIALS AND METHODS
Dataset collection
As shown in Figure 1 DriverDB includes mutationprofiles from 6079 tumorndashnormal pairs including 4397from TCGA 861 from ICGC 112 from PCGP 238from TARGET and 471 from published papers (denotedas lsquoothersrsquo in Figure 1) Detailed information for thedatasets is provided in Supplementary Table S1 Themutation data and CNV data of these pairs were retrievedfrom the data portal of the projects or from the supple-mentary data of the published papers and were thenparsed using in-house Perl scripts To ensure annotationconsistency and to make the retrieval process more effi-cient clinical information for each sample was manuallycurated based on clinical data obtained as mentionedabove Each sample was re-annotated with 38 clinicalcharacteristics The summary of the clinical informationis provided in Supplementary Table S2
Mutation annotation
All mutations were mapped to known databases and theirfunctional impacts were predicted by numerous bioinfor-matics tools shown in the Annotation module in Figure 1For annotating known variants DriverDB incorporatesthe information collected from different databasesincluding dbSNP NHLBI GO ESP (29) 1000 genomesCOSMIC ClinVar (httpwwwncbinlmnihgovclinvar)NHGRI GWAS catalog (30) HGMD-PUBLIC (31) andOMIM (httpomimorg) We used SnpEff (32) and VEP(33) to predict the effect of each mutation such as non-synonymous coding stop gainedlost and frame-shiftIn addition DriverDB scores the deleterious effects andfunctional impact by seven algorithms including SIFT(34) PolyPhen2 (35) Condel (36) LRT (37) FATHMM(38) MutationAssessor (39) and MutationTaster (40)Furthermore we scored each mutation by the number ofalgorithms that judge the mutation as deleterious (thesenumbers are denoted as lsquoDriver Scorersquo) For examplethe mutation g178952085AgtG of PIK3CA which occursin gt100 patients from various cancer types was identifiedas deleterious by seven algorithms therefore its DriverScore is 7
Driver gene identification
DriverDB utilized eight computational methods toidentify driver genes of cancer types (the Cancer DriverGene module in Figure 1) Four methods includingMutsigCV Simon OncodriverFM and ActiveDriver are
2 Nucleic Acids Research 2013
at National Y
ang-Ming U
niv Library on N
ovember 13 2013
httpnaroxfordjournalsorgD
ownloaded from
based on mutation frequencies and utilize all mutations toidentify driver genes
For the sub-network based methods MEMo DendrixMDPFinder and NetBox were used We applied thefollowing filters to remove mutationsgenes from theanalysis
Mutations whose effect impact was identified bySnpEff as lsquoLowrsquo or lsquoModifierrsquo
Mutations denoted as common and not recorded indiseaseclinical-related databases according toMutation annotation
Potentially spurious genes reported by several studies(918)
Detailed criteria for each method are described inSupplementary Methods
Functional analysis
For each set of driver genes identified by individualmultiple method(s) in a group of cancer samples weprovided three levels of biological interpretation (GeneOncology Pathways and ProteinGenetic Interaction) tohelp researchers to realize the relationships between drivergenes In the lsquoGene Oncologyrsquo part we used the topGO
and GeneAnswers packages of Bioconductor to calculatethe topology of the GO graph as well as to visualize themany-to-many relationships between GO terms and genesIn the lsquoPathwayrsquo analysis we used collections fromKEGG (41) PID (42) Biocarta (httpwwwbiocartacom) REACTOME (43) and MSigDB (44) to annotatedriver genes Detailed information for these eight collec-tions is provided in Supplementary Table S3 The threedatabases IntAct (45) BioGRID (46) and iRefIndex (47)were used to interpret the ProteinGenetic Interaction Wealso performed classic Fisherrsquos exact test and utilizedndashlog(P value) to score each GO term and Pathwaycategory in the Gene Oncology and Pathway analysesFor the lsquoPathwayrsquo and lsquoProteinGenetic Interactionrsquosections in the DriverDB web interface the CytoscapeWeb (48) tool was embedded for interactive networkvisualization
WEB INTERFACE
Cancer
The lsquoCancerrsquo section stored the calculated results of drivergenes for a specific cancer typedataset First users candefine the data type(s) incorporated for driver gene
Figure 1 Schematic representation of data processing
Nucleic Acids Research 2013 3
at National Y
ang-Ming U
niv Library on N
ovember 13 2013
httpnaroxfordjournalsorgD
ownloaded from
identification (the red rectangle in Supplementary FigureS1A) and then select a specific dataset for examplelsquoGlioblastoma multiformersquo (GBM) The result sectionwill then indicate the detailed information of the specificdataset (red circle in Supplementary Figure S1B) Userscan select a driver gene set identified by lsquoNrsquo methods(the lsquoSummaryrsquo in Supplementary Figure S1B lsquoNrsquo isdetermined by a drop-down menu) or by individualmethods according to the name of the method(Supplementary Figure S1B) For lsquoSummaryrsquo a heatmap shows the relationship between genes and methods(Supplementary Figure S1C the blue color indicates genesidentified as driver genes by a method) For each drivergene set there is a heat map showing a mutation profile ofthat driver gene set of samples (Supplementary FigureS1D) We also performed functional analysis in threelevels of biological interpretation lsquoGene OntologyrsquolsquoPathwayrsquo and lsquoProteinGenetics Interactionrsquo In thelsquoGene Ontologyrsquo analysis I and II indicate the topologyof GO graph by topGO and GeneAnswers respectively(Supplementary Figure S1E) whereas III and IV show themost significant GO terms and genes The table inSupplementary Figure S1E lists the information of allthe significant GO terms In the lsquoPathwayrsquo analysisthere are eight collections of gene sets from public data-bases including KEGG REACTOME MSigDB PIDand Biocarta For each collection there is a network visu-alization and a table displaying pathway categories of thedriver genes that are involved (Supplementary FigureS1F) Finally in the lsquoProteinGenetics Interactionrsquo partthe interactions between driver genes are illustrated ac-cording to three resources BioGRID IntAct andiRefIndex (Supplementary Figure S1G)
Gene
In this section researchers can visualize the mutation datafor a specific protein encoded by a gene in five differentkinds of aspects Mutation Profile Mutation PercentageExon Driver Score and Mutation Information(Supplementary Figure S2A) Here we use the genePIK3CA which is identified as a driver gene in thelsquoCancerrsquo section as an example Bar chart colors in thesub-figures of Supplementary Figure S2 indicate the func-tional impact of a mutation such as non-synonymous andframe-shift shown in Supplementary Figure S2B ForlsquoMutation Profilersquo (Supplementary Figure S2C) a heatmap shows the mutation rate calculated by the mutationcountsample count of a cancer at different protein pos-itions across several cancer types We also provide exonand domain information with protein coordinates at thebottom of the heat map (Supplementary Figure S2C)Two bar charts located at the top and the left of theheat map indicate the sum of mutation rate according toprotein position and cancer type respectively ThelsquoMutation Percentagersquo (Supplementary Figure S2D) issimilar to Supplementary Figure S2C but the number inthe heat map is calculated by the following (mutationcount of a protein regiontotal mutation count of a can-cer) 100 The heights of the two bar charts at the left andthe top of the heat map are normalized to the mutation
count of a cancer type or a protein region respectivelyIn the lsquoExonrsquo panel the mutation counts and the mutationtypes of each exon are illustrated in Supplementary FigureS2E and S2F respectively For the lsquoDriver Scorersquo partSupplementary Figure S2G and S2H indicate the DriverScore (please see the lsquoMaterials and Methodsrsquo section fordetails) distributions of exons and protein positions re-spectively All the mutation data of a specific protein arelisted under lsquoMutation Informationrsquo (SupplementaryFigure S2A)
Meta-analysis
In addition to the stored calculated resultsDriverDB allows researchers to identify driver genes of auser-defined specific set of samples As shown inSupplementary Figure S3 users can select one ormultiple datasets in DriverDB We provide a list ofclinical criteria such as ICD-O-3 histology tumor stagedistant metastasis and lymph node status to helpresearchers to select a sub-group of well-defined cancersamples according to one or multiple clinical parametersfor driver gene identification Users can overview thedetailed clinical information of selected samples beforesubmitting this job to the server for real-time calculationThe user will receive a notification email with a Result IDand then visualized driver gene results in the lsquoResult andDownloadrsquo section when the job is completed
DISCUSSION
DriverDB makes the best of the massive amount ofexome-seq data published in recent years by integratingdriver gene analysis from numerous methods as well as byproviding visualizations of mutation information accord-ing to different aspects As described in the lsquoIntroductionrsquosection different bioinformatics algorithms have beendeveloped to identify driver genes based on severalassumptions and characteristics each of which providesdifferent points of view regarding driver genesDriverDB integrates the analysis results of individualmultiple method(s) and provides three levels of biologicalinterpretation Gene Oncology Pathway and ProteinGenetics Interaction These visualization results will helpusers to quickly realize the relationships between drivergenes A representative example of driver genes identifiedin GBM is shown in Supplementary Figure S1 A total of14 driver genes were identified (each gene by at least 4methods) and nearly all samples had at least 1 deleteriousmutation among these 14 genes Ten genes (CDKN2AEGFR PTEN TP53 CDK4 PIK3R1 NF1 PIK3CARB1 and IDH1) are known to be critical in GBM tumori-genesis (4950) For the other four genes (ATRX CHEK2CPSF6 and COL6A3) our functional analysis shows thatthey are involved in cell cycle-related categories(Supplementary Figure S1F) Moreover ATRX hasbeen reported as the driver gene in pediatric glioblastomas(51) and neuroblastomas (5253) CHEK2 is relevant tofamilial breastovarian cancer (54) and neuroblastomas(54) CPSF6 can either enhance the invasive capacities ofor inhibit the proliferation of cancer cells (55) The spliced
4 Nucleic Acids Research 2013
at National Y
ang-Ming U
niv Library on N
ovember 13 2013
httpnaroxfordjournalsorgD
ownloaded from
variants and the aberrant methylation of COL6A3 arealso related to cancers (56ndash58) Genes reported in otherreferences but not included in our 14-gene list can beidentified by less stringent criteria (such as those identifiedby at least three methods for example PDGFRAMDM2 MDM4 and CDKN2B)
The lsquoGenersquo section is designed to help researchers tovisualize the mutation data of a driver gene The represen-tative example is PIK3CA a well-known driver gene inGBM as well as in other cancers (Supplementary FigureS2) It is easy to find that there are two hotspot mutationregions (at the middle and the end of the protein) espe-cially in the lsquoMutation Percentagersquo figure (SupplementaryFigure S2D) The two well-known driver genes BRAFand KRAS also have the same characteristics(Supplementary Figure S4) However a driver gene mayhave distinct hotspot mutation regions in differentcancers For example unlike lung cancers that carryEGFR mutations at the kinase domain (KD) activationof EGFR in GBM occurs through mutation at the extra-cellular domain (59) This has been noted as the reasonthat GBM with mutations in the extracellular domainrespond poorly to EGFR inhibitors (eg erlotinib) thattarget the active kinase conformation (59) This phenom-ena was recaptured by our calculation and was present inthe lsquoMutation Profilersquo of EGFR in DriverDB(Supplementary Figure S5)
In the lsquoGenersquo section bar chart colors indicate the func-tional impact of a mutation which can help to conveyimportant information For example FLT3 has beenreported to be mutated in approximately one-third ofpatients in acute myeloid leukemia and has two hotspotregions one consists of internal tandem duplication (ITD)mutations of 3ndash400 bp (always in-frame) and the otherconsists of point mutations at aspartic acid 835 of theKD (60) Such mutation information for FLT3 can beeasily obtained in DriverDB (Supplementary Figure S6)
Several studies have assessed the performance ofexisting tools for predicting deleterious mutations andthe results have demonstrated that identifying cancer-driving mutations remains a significant challenge (561)Hence we used the lsquoDriver Scorersquo which integrates theinformation from seven computational tools to describethe deleterious level of a mutation and to highlight thehotspot mutation region For example the Driver Scoredistribution of the cancer-related gene lsquoMLL2rsquo impliesthat the third region of the MLL2 protein plays a moreimportant role than other positions (SupplementaryFigure S7) In summary in the lsquoGenersquo section ofDriverDB researchers can easily be informed when muta-tions are concentrated in onesome specific protein pos-ition(s)domain(s)exon(s)cancer(s)
The lsquoMeta-analysisrsquo section allows a user to re-define agroup of samples from onemultiple datasets and thenidentify driver genes for selected samples It has beennoted that mutations are accumulated during tumorprogression Different driver mutations may be used toconvert a normal cell to a tumor cell or to turn abenign tumor into a malignant one The timing of muta-tions is relevant to metastasis and there are mutationsthat occur during this process (1) Thus if we could
define samples by a clarified biological or clinical goalwe would have the opportunity to identify a specific setof driver genes for a distinct question To achieve thisDriverDB offers a list of clinical characteristics to definesamples and provides a high degree of freedom forresearchers to utilize the huge amount of sequencingdata For example in Supplementary Figure S3 weselected only 180 samples from TCGA breast cancerproject Their lymphonode pathologic spread and ICDoncology of histology are lsquoN0rsquo and lsquoinfiltrating duct car-cinoma NOSrsquo respectivelyA number of databases and frameworks have been
developed to integrate large-scale genomic data (2)including cBioportal (6263) and IntOGen (64)cBioportal contains datasets from TCGA and providesgene-based search capabilities to interactively exploremultidimensional cancer genomics data IntOGen is aframework that integrates multidimensional data for theidentification of genes and biological modules involved incancer development DriverDB incorporates a large-scaledata mining work using these algorithms in one gopresents summarized driver genes and provides differentkinds of aspects for mutation visualization Anotherunique part of DriverDB is that it also helps researchersto identify driver genes in a customer-defined mannerNGS has become the norm for large-scale cancer
research and cancer exome-seq results will accumulaterapidly in the next few years For example TCGA willexamine over 11000 samples for 20 cancer types bythe end of 2014 Due to the Publication Guidelines ofTCGA (httpcancergenomenihgovabouttcgapoliciespublicationguidelines) parts of data from TCGA areexcluded in DriverDB As time goes by data fromTCGA as well as from other cancer projectsliteratureswill have no publication limitations and will beincorporated into updated DriverDB We envision thatthese novel driver genes or mutations identified andstored in DriverDB will hold great potential for bothbasic research and biotech product development
SUPPLEMENTARY DATA
Supplementary Data are available at NAR Online
ACKNOWLEDGEMENTS
We acknowledge the contribution of Chien Shu and KunZhang from University of California at San Diego for theanalysis of exome-seq and thank the National Center forHigh-performance Computing for computer time andfacilities
FUNDING
National Science Council [NSC NSC101-2320-B-010-059-MY3 NSC101-2627-B-010-003 and NSC101-2321-B-010-011] Veterans General Hospitals University System ofTaiwan (VGHUST) Joint Research Program TsoursquosFoundation [GHUST102-G7-3-2] National HealthResearch Institutes (NHRI) [NHRI-EX102-10254SI]
Nucleic Acids Research 2013 5
at National Y
ang-Ming U
niv Library on N
ovember 13 2013
httpnaroxfordjournalsorgD
ownloaded from
Taipei Veteran General Hospital [Cancer ExcellenceCenter Plan DOH102-TD-C-111-007] Taipei CityHospital [10201-62-070] National Yang-Ming University[Ministry of Education Aim for the Top University Plan]UST-UCSD International Center for Excellence inAdvanced Bioengineering sponsored by the Taiwan NSCI-RiCE Program (in part) [NSC101-2911-I-009-101]Funding for open access charge NSC
Conflict of interest statement None declared
REFERENCES
1 VogelsteinB PapadopoulosN VelculescuVE ZhouSDiazLA Jr and KinzlerKW (2013) Cancer genome landscapesScience 339 1546ndash1558
2 ShyrD and LiuQ (2013) Next generation sequencing in cancerresearch and clinical application Biol Proced Online 15 4
3 StrattonMR CampbellPJ and FutrealPA (2009) The cancergenome Nature 458 719ndash724
4 BozicI AntalT OhtsukiH CarterH KimD ChenSKarchinR KinzlerKW VogelsteinB and NowakMA (2010)Accumulation of driver and passenger mutations during tumorprogression Proc Natl Acad Sci USA 107 18545ndash18550
5 GnadF BaucomA MukhyalaK ManningG and ZhangZ(2013) Assessment of computational methods for predicting theeffects of missense mutations in human cancers BMC Genomics14(Suppl 3) S7
6 CarterH ChenS IsikL TyekuchevaS VelculescuVEKinzlerKW VogelsteinB and KarchinR (2009) Cancer-specifichigh-throughput annotation of somatic mutations computationalprediction of driver missense mutations Cancer Res 696660ndash6667
7 ZhaoH YangY LinH ZhangX MortM CopperDNLiuY and ZhouY (2013) DDIG-in discriminating betweendisease-associated and neutral non-frameshifting micro-indelsGenome Biol 14 R23
8 LiMX KwanJS BaoSY YangW HoSL SongYQ andShamPC (2013) Predicting mendelian disease-causing non-synonymous single nucleotide variants in exome sequencingstudies PLoS Genet 9 e1003143
9 LawrenceMS StojanovP PolakP KryukovGVCibulskisK SivachenkoA CarterSL StewartCMermelCH RobertsSA et al (2013) Mutational heterogeneityin cancer and the search for new cancer-associated genes Nature499 214ndash218
10 DeesND ZhangQ KandothC WendlMC SchierdingWKoboldtDC MooneyTB CallawayMB DoolingDMardisER et al (2012) MuSiC identifying mutationalsignificance in cancer genomes Genome Res 22 1589ndash1598
11 YounA and SimonR (2011) Identifying cancer driver genes intumor genome sequencing studies Bioinformatics 27 175ndash181
12 Gonzalez-PerezA and Lopez-BigasN (2012) Functional impactbias reveals cancer drivers Nucleic Acids Res 40 e169
13 ReimandJ and BaderGD (2013) Systematic analysis of somaticmutations in phosphorylation signaling predicts novel cancerdrivers Mol Syst Biol 9 637
14 MichaelsonJJ ShiY GujralM ZhengH MalhotraDJinX JianM LiuG GreerD BhandariA et al (2012)Whole-genome sequencing in autism identifies hot spots for denovo germline mutation Cell 151 1431ndash1442
15 Nik-ZainalS AlexandrovLB WedgeDC Van LooPGreenmanCD RaineK JonesD HintonJ MarshallJStebbingsLA et al (2012) Mutational processes molding thegenomes of 21 breast cancers Cell 149 979ndash993
16 ZhaoJ ZhangS WuLY and ZhangXS (2012) Efficientmethods for identifying mutated driver pathways in cancerBioinformatics 28 2940ndash2947
17 VandinF UpfalE and RaphaelBJ (2012) De novodiscovery of mutated driver pathways in cancer Genome Res 22375ndash385
18 LeisersonMD BlokhD SharanR and RaphaelBJ (2013)Simultaneous identification of multiple driver pathways in cancerPLoS Comput Biol 9 e1003054
19 CirielloG CeramiE SanderC and SchultzN (2012) Mutualexclusivity analysis identifies oncogenic network modules GenomeRes 22 398ndash406
20 CeramiE DemirE SchultzN TaylorBS and SanderC(2010) Automated network analysis identifies core pathways inglioblastoma PLoS ONE 5 e8918
21 BashashatiA HaffariG DingJ HaG LuiK RosnerJHuntsmanDG CaldasC AparicioSA and ShahSP (2012)DriverNet uncovering the impact of somatic driver mutations ontranscriptional networks in cancer Genome Biol 13 R124
22 TrifonovV PasqualucciL Dalla FaveraR and RabadanR(2013) MutComFocal an integrative approach to identifyingrecurrent and focal genomic alterations in tumor samples BMCSyst Biol 7 25
23 DandN SprengelF AhlersV and SchlittT (2013) BioGranat-IG a network analysis tool to suggest mechanisms of geneticheterogeneity from exome-sequencing data Bioinformatics 29733ndash741
24 MillerCA SettleSH SulmanEP AldapeKD andMilosavljevicA (2011) Discovering functional modules byidentifying recurrent and mutually exclusive mutational patternsin tumors BMC Med Genomics 4 34
25 VandinF UpfalE and RaphaelBJ (2012) Finding driverpathways in cancer models and algorithms Algorithm Mol Biol7 23
26 SherryST WardMH KholodovM BakerJ PhanLSmigielskiEM and SirotkinK (2001) dbSNP the NCBIdatabase of genetic variation Nucleic Acids Res 29 308ndash311
27 AbecasisGR AutonA BrooksLD DePristoMADurbinRM HandsakerRE KangHM MarthGT andMcVeanGA (2012) An integrated map of genetic variation from1092 human genomes Nature 491 56ndash65
28 ForbesSA BindalN BamfordS ColeC KokCY BeareDJiaM ShepherdR LeungK MenziesA et al (2011)COSMIC mining complete cancer genomes in the Catalogue ofSomatic Mutations in Cancer Nucleic Acids Res 39D945ndashD950
29 TennessenJA BighamAW OrsquoConnorTD FuWKennyEE GravelS McGeeS DoR LiuX JunG et al(2012) Evolution and functional impact of rare coding variationfrom deep sequencing of human exomes Science 337 64ndash69
30 HindorffLA SethupathyP JunkinsHA RamosEMMehtaJP CollinsFS and ManolioTA (2009) Potentialetiologic and functional implications of genome-wide associationloci for human diseases and traits Proc Natl Acad Sci USA106 9362ndash9367
31 CooperDN StensonPD and ChuzhanovaNA (2006) TheHuman Gene Mutation Database (HGMD) and its exploitationin the study of mutational mechanisms Curr ProtocBioinformatics Chapter 1 Unit 1 13
32 CingolaniP PlattsA Wang leL CoonM NguyenTWangL LandSJ LuX and RudenDM (2012) Aprogram for annotating and predicting the effects ofsingle nucleotide polymorphisms SnpEff SNPs in the genomeof Drosophila melanogaster strain w1118 iso-2 iso-3 Fly 680ndash92
33 McLarenW PritchardB RiosD ChenY FlicekP andCunninghamF (2010) Deriving the consequences of genomicvariants with the Ensembl API and SNP Effect PredictorBioinformatics 26 2069ndash2070
34 NgPC and HenikoffS (2001) Predicting deleterious amino acidsubstitutions Genome Res 11 863ndash874
35 AdzhubeiIA SchmidtS PeshkinL RamenskyVEGerasimovaA BorkP KondrashovAS and SunyaevSR(2010) A method and server for predicting damaging missensemutations Nat Methods 7 248ndash249
36 Gonzalez-PerezA and Lopez-BigasN (2011) Improving theassessment of the outcome of nonsynonymous SNVs with aconsensus deleteriousness score Condel Am J Hum Genet 88440ndash449
6 Nucleic Acids Research 2013
at National Y
ang-Ming U
niv Library on N
ovember 13 2013
httpnaroxfordjournalsorgD
ownloaded from
37 ChunS and FayJC (2009) Identification of deleteriousmutations within three human genomes Genome Res 191553ndash1561
38 ShihabHA GoughJ CooperDN DayIN and GauntTR(2013) Predicting the functional consequences of cancer-associatedamino acid substitutions Bioinformatics 29 1504ndash1510
39 RevaB AntipinY and SanderC (2011) Predicting thefunctional impact of protein mutations application to cancergenomics Nucleic Acids Res 39 e118
40 SchwarzJM RodelspergerC SchuelkeM and SeelowD (2010)MutationTaster evaluates disease-causing potential of sequencealterations Nat Methods 7 575ndash576
41 KanehisaM GotoS SatoY FurumichiM and TanabeM(2012) KEGG for integration and interpretation of large-scalemolecular data sets Nucleic Acids Res 40 D109ndashD114
42 SchaeferCF AnthonyK KrupaS BuchoffJ DayMHannayT and BuetowKH (2009) PID the Pathway InteractionDatabase Nucleic Acids Res 37 D674ndashD679
43 CroftD OrsquoKellyG WuG HawR GillespieM MatthewsLCaudyM GarapatiP GopinathG JassalB et al (2011)Reactome a database of reactions pathways and biologicalprocesses Nucleic Acids Res 39 D691ndashD697
44 SubramanianA TamayoP MoothaVK MukherjeeSEbertBL GilletteMA PaulovichA PomeroySLGolubTR LanderES et al (2005) Gene set enrichmentanalysis a knowledge-based approach for interpreting genome-wide expression profiles Proc Natl Acad Sci USA 10215545ndash15550
45 KerrienS ArandaB BreuzaL BridgeA Broackes-CarterFChenC DuesburyM DumousseauM FeuermannM HinzUet al (2012) The IntAct molecular interaction database in 2012Nucleic Acids Res 40 D841ndashD846
46 Chatr-AryamontriA BreitkreutzBJ HeinickeS BoucherLWinterA StarkC NixonJ RamageL KolasN OrsquoDonnellLet al (2013) The BioGRID interaction database 2013 updateNucleic Acids Res 41 D816ndashD823
47 RazickS MagklarasG and DonaldsonIM (2008) iRefIndex aconsolidated protein interaction database with provenance BMCBioinformatics 9 405
48 LopesCT FranzM KaziF DonaldsonSL MorrisQ andBaderGD (2010) Cytoscape Web an interactive web-basednetwork browser Bioinformatics 26 2347ndash2348
49 VerhaakRG HoadleyKA PurdomE WangV QiYWilkersonMD MillerCR DingL GolubT MesirovJPet al (2010) Integrated genomic analysis identifies clinicallyrelevant subtypes of glioblastoma characterized by abnormalitiesin PDGFRA IDH1 EGFR and NF1 Cancer Cell 17 98ndash110
50 Cancer Genome Atlas Research Network (2008) Comprehensivegenomic characterization defines human glioblastoma genes andcore pathways Nature 455 1061ndash1068
51 SchwartzentruberJ KorshunovA LiuXY JonesDTPfaffE JacobK SturmD FontebassoAM QuangDATonjesM et al (2012) Driver mutations in histone H33 andchromatin remodelling genes in paediatric glioblastoma Nature482 226ndash231
52 PughTJ MorozovaO AttiyehEF AsgharzadehS WeiJSAuclairD CarterSL CibulskisK HannaM KiezunA et al(2013) The genetic landscape of high-risk neuroblastoma NatGenet 45 279ndash284
53 CheungNK and DyerMA (2013) Neuroblastomadevelopmental biology cancer genomics and immunotherapyNat Rev Cancer 13 397ndash411
54 RashidMU MuhammadN FaisalS AminA and HamannU(2013) Constitutional CHEK2 mutations are infrequent in early-onset and familial breastovarian cancer patients from PakistanBMC Cancer 13 312
55 YuK GanesanK TanLK LabanM WuJ ZhaoXDLiH LeungCH ZhuY WeiCL et al (2008) A preciselyregulated gene expression cassette potently modulates metastasisand survival in multiple solid cancers PLoS Genet 4 e1000129
56 MaekawaR SatoS YamagataY AsadaH TamuraI LeeLOkadaM TamuraH TakakiE NakaiA et al (2013)Genome-wide DNA methylation analysis reveals a potentialmechanism for the pathogenesis and development of uterineleiomyomas PLoS ONE 8 e66632
57 GardinaPJ ClarkTA ShimadaB StaplesMK YangQVeitchJ SchweitzerA AwadT SugnetC DeeS et al (2006)Alternative splicing and differential gene expression in coloncancer detected by a whole genome exon array BMC Genomics7 325
58 ArafatH LazarM SalemK ChipitsynaG GongQPanTC ZhangRZ YeoCJ and ChuML (2011) Tumor-specific expression and alternative splicing of the COL6A3 genein pancreatic cancer Surgery 150 306ndash315
59 VivancoI RobinsHI RohleD CamposC GrommesCNghiemphuPL KubekS OldriniB ChhedaMGYannuzziN et al (2012) Differential sensitivity of glioma- versuslung cancer-specific EGFR mutations to EGFR kinase inhibitorsCancer Disc 2 458ndash471
60 SmallD (2006) FLT3 mutations biology and treatmentHematology the Education Program of the American Society ofHematology American Society of Hematology Education Program178ndash184
61 Gonzalez-PerezA Deu-PonsJ and Lopez-BigasN (2012)Improving the prediction of the functional impact of cancermutations by baseline tolerance transformation Genome Med 489
62 CeramiE GaoJ DogrusozU GrossBE SumerSOAksoyBA JacobsenA ByrneCJ HeuerML LarssonEet al (2012) The cBio cancer genomics portal an open platformfor exploring multidimensional cancer genomics data CancerDisc 2 401ndash404
63 GaoJ AksoyBA DogrusozU DresdnerG GrossBSumerSO SunY JacobsenA SinhaR LarssonE et al(2013) Integrative analysis of complex cancer genomics andclinical profiles using the cBioPortal Sci Signal 6 pl1
64 GundemG Perez-LlamasC Jene-SanzA KedzierskaAIslamA Deu-PonsJ FurneySJ and Lopez-BigasN (2010)IntOGen integration and data mining of multidimensionaloncogenomic data Nat Methods 7 92ndash93
Nucleic Acids Research 2013 7
at National Y
ang-Ming U
niv Library on N
ovember 13 2013
httpnaroxfordjournalsorgD
ownloaded from