exome sequencing analysis of rare autosomal recessive
TRANSCRIPT
0
Exome Sequencing Analysis of Rare Autosomal Recessive Disorders
by
Atif Saud Alsaedi
A thesis submitted to the University of Birmingham for the degree of
DOCTOR OF PHILOSOPHY
Institute of Biomedical Research
College of Medical and Dental Sciences
University of Birmingham
February 2017
University of Birmingham Research Archive
e-theses repository This unpublished thesis/dissertation is copyright of the author and/or third parties. The intellectual property rights of the author or third parties in respect of this work are as defined by The Copyright Designs and Patents Act 1988 or as modified by any successor legislation. Any use made of information contained in this thesis/dissertation must be in accordance with that legislation and must be properly acknowledged. Further distribution or reproduction in any format is prohibited without the permission of the copyright holder.
1
Abstract
Since the human genome project was completed in 2003, extraordinary progress has been made
in the field of genomics with the development of new sequencing technologies and the
widespread introduction of next generation sequencing (NGS). The application of NGS initiated
a new era in genomics by massively increasing the number and diversity of the sequenced
genomes at lower cost. Human Molecular Genetics has greatly benefited from the use of NGS-
based strategies to identify human disease genes. In this thesis, I investigated the application of
genetic techniques to investigate the molecular basis of autosomal recessively inherited disorders
of unknown etiology. A range of disease phenotypes, including oligodontia and fetal
akinesia/multiple pterygium syndrome (FA/MPS), were investigated in patient cohorts that
included many cases with parental consanguinity. Using an autozygosity linkage analysis-based
approach and Sanger sequencing of candidate genes resulted in the identification germline RYR1
mutations in FA/MPS. Subsequently, using exome sequencing techniques, the molecular basis of
FA/MPS was further elucidated by the identification of germline mutations in RYR1, NEB,
CHRNG, CHRNA1 and TPM2. The application of NGS in genetically heterogeneous disorders
such as fetal akinesia/multiple pterygium syndrome can enable better and less expensive
molecular diagnostic services aimed at specific mutation spectra, though more extensive
sequencing can lead to the identification of larger numbers of variants of uncertain significance.
2
Acknowledgment
All praises and thanks go to Allah Almighty, the Giver of bountiful blessings and gifts. Then, I
would like to take the opportunity to thank everyone who gave help and encouragement to me
during my time in research. Firstly, I want to thank my Supervisor prof. Eamonn Maher for the
continuous help, advice, and encouragement he has given me over the past few years. Secondly,
I want to thank Prof. Farida Latif for being a second supervisor during the first and second year
of my PhD and for her help and advice. Thirdly, I want to thank Dr. Neil Morgan who helped me
with supervision during the last two years especially with the writing up stage. After that, I want
to thank all my colleagues and staff at Molecular Medical Genetics Laboratory during the period
of my research. A great thanks to the technician Louise Tee who undertook the SNP genotyping
in this project as well as training me on microsatellite genotyping analysis. Thanks to Maher’s
group for their help in the Lab. Thanks to Dr. Arthur McKie in Cambridge for the great
collaboration we had together in investigating the FADS/MPS patients which was stated in this
thesis. Also, I want to thank Diana, Mark and Naomi for their help and advice. Further thanks
goes to the colleagues; Abdullah, Thoraia, Alamin, Amy and others. Also, a special thanks to the
staff members; Dean, Uncaar, Dewi and Malgosia for all of their help and advice in the lab. I am
thankful to the West Midlands Regional Genetic Laboratory for the help in providing the
samples, DNA extraction and storage in this research with a special thanks to Dr Julie Vogt. I am
also grateful to all the families who participated in the research. Finally, many thanks to my
family who supported me in this journey. Thanks to my parents, to my wife (Nahla) who was
behind me at all times , my uncle (Abdulaziz) and to my whole family for their support.
3
Table of Contents Chapterone:Introduction.........................................................................................................................13
1.1 The basics of Inheritance......................................................................................................................14
1.1.1 Autosomal Recessive Disorders....................................................................................................16
1.1.2 Autosomal Dominant Disorders....................................................................................................17
1.2 Main approaches to study genetic disorders.........................................................................................18
1.2.1 Cytogenetics..................................................................................................................................19
1.2.1a Conventional cytogenetics.......................................................................................................19
1.2.1b Molecular cytogenetics............................................................................................................20
1.2.2 Molecular Genetics.......................................................................................................................21
1.2.2a Gene identification approaches: ................................................................................................21
1.2.2a.i Candidate Gene Approach…………………...…………………………………………….22
1.2.2a. ii Positional Cloning Approach…………………………………………………………………………………………24
1.3 Haplotype and genetic markers............................................................................................................25
1.4 Genetic Mapping projects....................................................................................................................27
1.5 Consanguinity......................................................................................................................................28
1.5.1 Global Prevalence of consanguinity..............................................................................................29
1.5.2 Consanguinity prevalence in Arabian countries............................................................................32
1.5.3 Effect of high consanguinity within Pakistani British in Birmingham..........................................34
1.6 Autozygosity mapping.........................................................................................................................36
1.6.1 Background about the technique...................................................................................................36
1.6.2 Advantages and disadvantages of autozygosity mapping..............................................................39
1.7DNAsequencing...................................................................................................................................40
1.7.1 Sanger Sequencing method...........................................................................................................40
1.7.1a Main principle of the technique...............................................................................................40
1.7.1b The automation of the technique.............................................................................................42
1.7.2 Next generation sequencing..........................................................................................................43
1.7.2.1 Whole Exome sequencing (WES)..........................................................................................45
1.7.2.1aBackgroundaboutWES………………………………………………………………………………………………….45
1.7.2.1bMainPrincipleofWES………………………………………………………………………………………………….46
1.7.2.1cMajorPlatformsofWES………………………………………………………………………………………………..51
4
1.7.2.1dThestrategyofexomesequencingtostudyMendelianinheriteddisorders…………………52
1.7.2.2 Targeted Exome Sequencing..................................................................................................53
1.7.2.3 Sequencing depth and breadth of coverage............................................................................55
1.8 Summary of genetic testing types and their applications in genetic diagnosis.............................56
1.9 Exome sequencing for the studied disorders in this project.............................................................58
1.10 Aim of the Project:.........................................................................................................................60
ChapterTwo:Materials&Methods.........................................................................................................61
2.1 Acquisition of patients.........................................................................................................................62
2.1.1 Patients..........................................................................................................................................62
2.1.1.i Congenital Oligodontia...........................................................................................................62
2.1.1.ii Fetal Akinesia........................................................................................................................63
2.1.2 Consent and ethics approval..........................................................................................................63
2.1.3 DNA extractions............................................................................................................................63
2.2 Materials:.............................................................................................................................................64
2.2.1 Chemical Reagents........................................................................................................................64
2.2 Kits...................................................................................................................................................65
2.2.3 Other Materials..............................................................................................................................65
2.3 Molecular genetic investigation...........................................................................................................65
2.3.1 Sanger Sequencing of Candidate genes:........................................................................................65
2.3.1a Standard Polymerase Chain Reaction (PCR)...........................................................................65
2.3.1b Primers design:........................................................................................................................66
2.3.1c PCR conditions:.......................................................................................................................67
2.3.1d Touchdown PCR amplification...............................................................................................68
2.3.1e. Gel electrophoresis:................................................................................................................70
2.3.2DNAPurificationmethod..............................................................................................................70
2.3.2a Exosap method........................................................................................................................70
2.3.2.balternativemethodofclean-up(microCLEAN)......................................................................71
2.3.3 Sequencing reaction......................................................................................................................71
2.3.4. Mutational screening....................................................................................................................73
2.3.5 Linkage Studies.............................................................................................................................73
2.3.5a SNP genotyping:......................................................................................................................73
5
2.3.5b Microsatellite Markers:...........................................................................................................74
2.3.6 Next Generation Sequencing (NGS).............................................................................................76
2.3.6a Whole exome sequencing........................................................................................................76
2.3.6b Assessment of Mutation Pathogenicity...................................................................................77
2.3.6c Definitions of the predictive bioinformatics tools...................................................................77
ChapterThree:MolecularGeneticInvestigationofinheritedOligodontia.............................................81
3.1 Disease background..............................................................................................................................82
3.1.1 Tooth developmental anomalies....................................................................................................82
3.1.2 The known causing genes of tooth Agenesis.................................................................................84
3.1.3 LTBP3 as a possible cause of Oligodontia....................................................................................85
3.2 Method.................................................................................................................................................86
3.2.1 Patients and Clinical assessment...................................................................................................86
3.2.2 Genetic Analysis:..........................................................................................................................88
3.2.2a Sequencing the candidate genes:.............................................................................................88
3.2.2b Linkage analysis using microsatellites:...................................................................................89
3.3 Results..................................................................................................................................................90
3.3.1 Mutation analysis:.........................................................................................................................90
3.3.2 Linkage Analysis:..........................................................................................................................91
3.4.3 Whole Exome Sequencing (WES)................................................................................................93
3.3.3a Whole exome sequencing (WES) at King’s College London..................................................94
3.3.3b Analysing WES data to identify the causing gene...................................................................94
3.4 Discussion:...........................................................................................................................................96
3.4.1 The selection of candidate genes for sequencing...........................................................................96
3.4.2 Linkage analysis for LTBP3 and the use of WES.........................................................................98
ChapterFour:GeneticInvestigationsofFADS/LMPSbyAutozygosityMapping&Genesequencing.100
4.1 Introduction:.......................................................................................................................................101
4.1.1 Clinical background of MPS disorders…………………………………………………………………………………….101
4.1.2 Genetic causes of MPS disorders…………………………………………………………………………………………….102
4.2 Method…………………………………………………………………………………………………………………………………………..105
4.2.1 Patients…………………………………………………………………………………………..105
4.2.2 Molecular Genetic analysis...........................................................................................................108
6
4.2.2a. Autozygosity mapping……………………………………………………………………………………………………..108
4.2.2b Candidate gene analysis from autozygosity mapping............................................................110
4.2.2b.iCandidategeneselection……………………………………………………………………………………………….110
4.2.2b.iiRYR1sequencing…………………………………………………………………………………………………………..111
4.2.3 Histopathological investigations:................................................................................................111
4.3 Results................................................................................................................................................113
4.3.1 MPS001 family...........................................................................................................................113
4.3.1a Clinical assessment of MPS001.............................................................................................113
4.3.1b Molecular findings of MPS001.............................................................................................114
4.3.1bPathologicalfindingsofMPS001……………………………………………………………………………………….115
3.3.2 Family MPS002...........................................................................................................................118
3.3.2a Clinical assessment of MPS002.............................................................................................118
4.3.2b Molecular findings of MPS002.............................................................................................119
4.3.3 Family MPS003...........................................................................................................................121
4.3.3a Clinical assessment of MPS003.............................................................................................121
4.3.3b Molecular Finings of MPS003:.............................................................................................121
4.3.3c Pathological findings of MPS003..........................................................................................123
4.4 Discussion:.........................................................................................................................................123
4.4.1 Autozygosity mapping analysis...................................................................................................123
4.4.2 Mutational analysis of RYR1......................................................................................................124
4.4.3. Genotype-Phenotype correlation................................................................................................127
ChapterFive:theapplicationofCESinMPSdisorder........................................................................130
5.1 Introduction........................................................................................................................................131
5.2 Patients:..............................................................................................................................................132
5.3 Molecular Genetic Analysis:..............................................................................................................134
5.4 Results................................................................................................................................................137
5.4.1 Detection of known mutations in CHRNG, DOK7, LMNA, RAPSN and RYR1.......................137
5.4.2 Identification of previously uncharacterised mutations by clinical exome analysis....................141
5.4.3 Identification of potential pathogenic mutations by clinical exome analysis..............................156
5.5 Discussion..........................................................................................................................................161
5.5.1 Why we selected CES strategy to investigate MPS disorders?...................................................161
7
5.5.2 RIPK4 as a novel potential gene for MPS disorder.....................................................................163
5.5.3 Genotype/phenotype correlations of RYR1 and NEB genes........................................................164
5.5.4 TMP2 gene: a further implicated gene in MPS disorder?............................................................166
5.6 Cunclusion…………………………………………………………………………………………...167
ChapterSix:GeneralDiscussion..............................................................................................................169
6.1 Summary:...........................................................................................................................................170
6.2 Application of Autozygosity mapping for investigating autosomal recessive diseases......................170
6.3 The Application of NGS in investigating rare inherited disorders:....................................................172
6.4 Evaluation of Clinical Exome Sequencing for use in MPS diseases/Autosomal recessive................174
6.5 Limitations of applying NGS in investigating rare autosomal recessive disorders:...........................175
6.6 The future of human gnomes and national genome projects..............................................................177
6.7 Comparison of various genetic tests and their applications................................................................177
6.8 Future Directions:...............................................................................................................................178
8
List of Figures
Figure1.1Apedigreerepresentsgermlinemosaicisminthefatheroftwoaffectedchildren..................18
Figure1.2Amapshowingtheprevalenceofglobalconsanguinity...........................................................31
Figure1.3diagramshowsthehighrateofconsanguinityinArabcountries.............................................33
Figure1.4Theroleofhighconsanguinityincausingrecessivediseases...................................................35
Figure1.5Theprincipleofautozygositymapping.....................................................................................38
Figure1.6Diagramshowsthedecreaseofthecostofgenomesequencing.............................................44
Figure1.7thepublishedpapersinmedicalresearchwhichappliedexomesequencingintheperiod
(2009-2012)................................................................................................................................................46
Figure1.8TheExomeSequencingWorkflow.............................................................................................48
Figure1.9SummaryoftheMainStagesInvolvedintheProcessofWholeExomeSequencing................50
Figure2.1thefilteringexomestrategytoidentifythediseasecausingvariants.......................................79
Figure3.1Themainthreephenotypesoftoothagenesis.........................................................................83
Figure3.2thepedigreeoftheOligodontialargefamilyOD006................................................................88
Figure3.3MicrosatelliteanaysisforOligodontiaexaminedfamilies.........................................................92
Figure3.4DrawingsillustratingtheautozygouslinkedregionforOligodontiafamilyOD05....................93
Figure3.5FilteringstepsAppliedtoidentifythecausinggenefromExomeSequencingDatafor
Oligodonticpatient....................................................................................................................................95
Figure4.1drawingshowsthestructureofAChRanditsgeneticpathway..............................................103
Figure4.2GeneticMappingofaconsanguineousfamily(MPS001)........................................................109
Figure4.3homozygousRYR1stopcodonmutationinMPS0001family..................................................115
Figure4.4HistologicalandultrastructuralfindingsinRYR1-mutantfetalskeletalmuscle(MPS001).....117
Figure4.5Achromatogramhomozygousin-frameshiftdeletioninRYR1...............................................120
Figure4.6homozygousin-framedeletioninX45(c.7039delGAG)..........................................................122
Figure4.7histologicalfindingsinRYR1-mutant(FamilyMPS003)...........................................................123
Figure4.8AdiagramshowingthelocationoftheidentifiedmutationwithinthecDNAofRYR1...........127
Figure5.1Anexampleoftheclinicalexomefileandthefilteringusedstepstofindthecausinggene..136
Figure5.2SequenceanalysisofRYR1c.6721C>T(p.Arg2241Ter)mutation...........................................139
Figure5.3SequenceanalysisofRYR1c.7043delGAG(p.Glu2347del)…………………………………………………..140
Figure5.4Sequenceanalysisofthevariants:RAPSNc.264C>A(p.Asn88Lys)&LMNAc.357C>T.........141
Figure5.5Sequenceanalysisoftherarevariant:CHRNGc.715C>T(p.Arg239Cys).................................142
9
Figure5.6Sangerconfirmationforthevariant:CHRNGc.715C>T(p.Arg239Cys)andtheconservativelocationoftheaminoacid…………………………………………………………………………………………………………………..143
Figure5.7SequenceanalysisoftherareCHRNA1variantinsertion:p.His45ArgfsTer19……………………..145
Figure5.8SangerconfirmationfortherareCHRNA1variantinsertion:p.His45ArgfsTer19………………….146
Figure5.9SequenceanalysisoftherareRYR1nonsensevariant:(c.12882G>T;p.E4294*)....................148
Figure5.10SequenceanalysisoftherareNEBvariant:c.10075G>T;p.Glu3359*..................................151
Figure5.11SangerconfirmationoftherarenonsenseNEBvariant:c.10075G>T;p.Glu3359*…………….152
Figure5.12SequenceanalysisoftherareTPM2missensevariant(c.379C>Tc.502G>A;p.Arg133Trp)155
Figure5.13:ConfirmationofTPM2missensevariant(c.379C>Tc.502G>A;p.Arg133Trp)……………………156
Figure5.14SequenceanalysisoftherareRIPK4missense:c.481G>C(p.Asp161His).............................158
Figure5.15SangeranalysisoftherareRIPK4missense:c.481G>C(p.Asp161His)……………………………….159
10
List of Tables
Table1.1Thebasicmodesinheritanceforsingle-geneinheriteddiseases..............................................15
Table1.2Thedegreeofconsanguinityandthechanceofpassingthegeneticcomponent.....................29
Table1.3Comparisonbetweenthemainplatformsthatusedforexomesequencingtechnology..........51
Table 2.1 The designed program of standard PCR steps …………………………………………………69
Table2.2Webbasedresourcesusedin(materialsandmethods)............................................................80
Table3.1Summaryofthedetectedmutationsandtheincludedpatientsidentifiedwithnon-syndromic
Oligodontia(fromliterature)......................................................................................................................85
Table3.2Oligodontiafamiliesincludedinourstudytoinvestigatetheirgeneticbackground.................87
Table3.3MappingandtranscriptdetailsofthescreenedOligodontiagenes(obtainedfromEnsembl).89
Table3.4Microsatellitemarkersusedforlinkageanalysisinoligodontiafamilies...................................90
Table4.1SummaryofthereportedgenesthathavebeenassociatedwithMPSphenotypesinthe
literature..................................................................................................................................................105
Table4.2TheavailableClinicalfeaturesoftheLMPS/FADSrecruitedprobands....................................107
Table4.3Microsatellitemarkersappliedingeneticmappingofchromosome19..................................110
Table4.4SummaryoftheidentifiedrareRYR1variantsdetectedinfamilieswithLMPS.......................125
Table5.1Summaryofrecruitedprobandsanalysedbyclinicalexomesequencing.........................133,134
Table5.2ThelistofgenesincludedinthediagnosticandtheMPS-relatedpanels................................137
Table5.3 SummaryofthedetectedraremutationsusingClinicalExomeTrusightOnePanelindifferentMPS-relatedgenes………………………………………………………………………………………………………………………………160
11
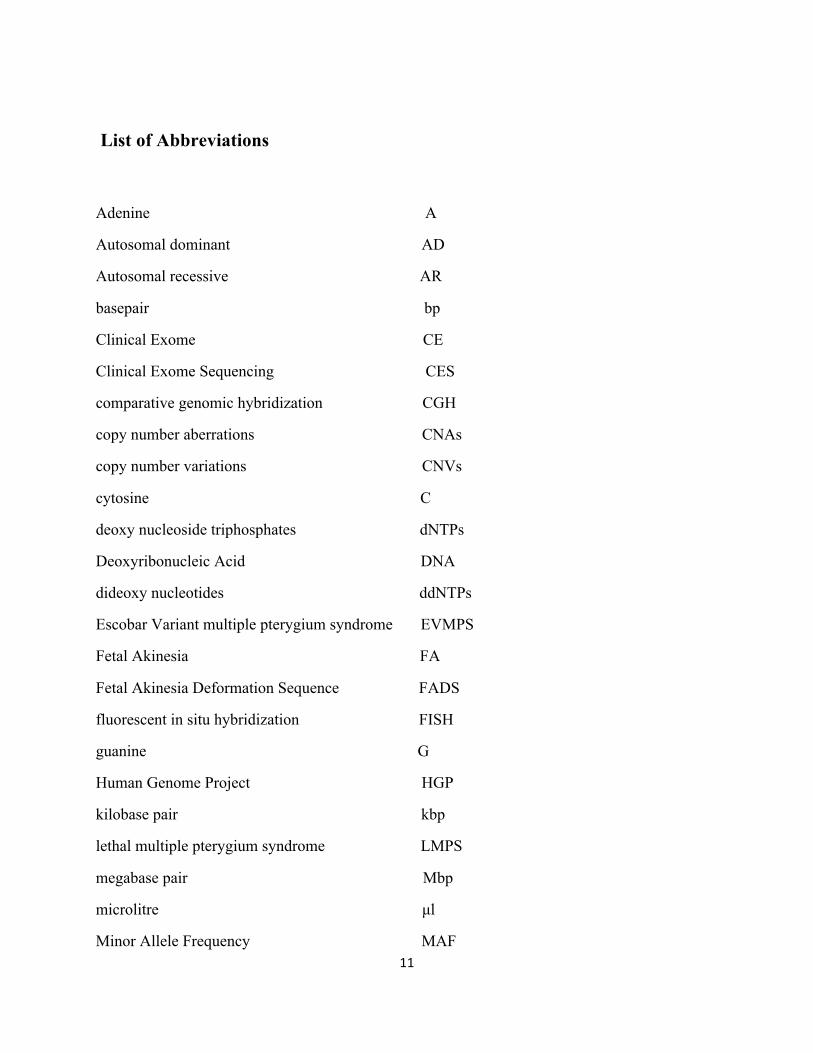
List of Abbreviations
Adenine A
Autosomal dominant AD
Autosomal recessive AR
basepair bp
Clinical Exome CE
Clinical Exome Sequencing CES
comparative genomic hybridization CGH
copy number aberrations CNAs
copy number variations CNVs
cytosine C
deoxy nucleoside triphosphates dNTPs
Deoxyribonucleic Acid DNA
dideoxy nucleotides ddNTPs
Escobar Variant multiple pterygium syndrome EVMPS
Fetal Akinesia FA
Fetal Akinesia Deformation Sequence FADS
fluorescent in situ hybridization FISH
guanine G
Human Genome Project HGP
kilobase pair kbp
lethal multiple pterygium syndrome LMPS
megabase pair Mbp
microlitre µl
Minor Allele Frequency MAF
12
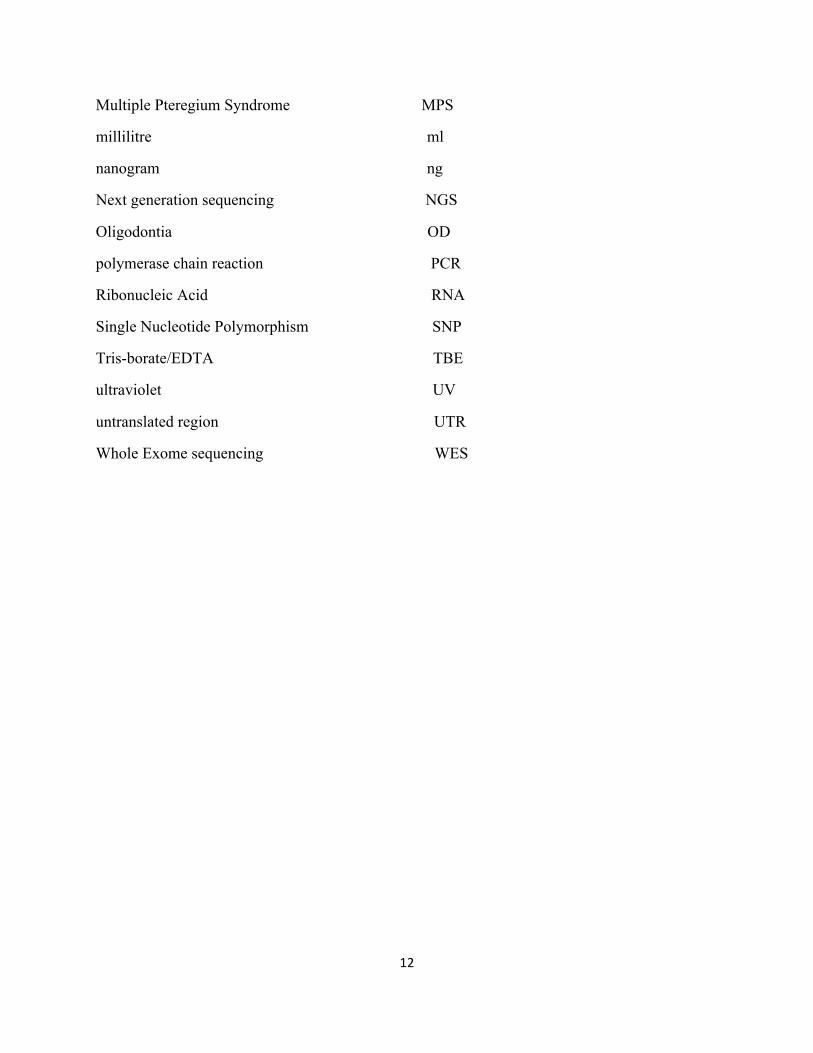
Multiple Pteregium Syndrome MPS
millilitre ml
nanogram ng
Next generation sequencing NGS
Oligodontia OD
polymerase chain reaction PCR
Ribonucleic Acid RNA
Single Nucleotide Polymorphism SNP
Tris-borate/EDTA TBE
ultraviolet UV
untranslated region UTR
Whole Exome sequencing WES

13
Chapterone:Introduction
14
1.1 The basics of Inheritance
Knowledge towards understanding the basics of genetics and inheritance has been developed
during the past 150 years. The way of passing on the traits from the parents to the offspring was
not known until George Mendel discovered these basic principles through his work conducted
between 1856 and 1863 using pea plants. He had chosen the peas due to their several distinctive
varieties, and quick reproduction in order to observe the traits in offspring. Mendel found that the
inheritance of certain traits such as height, colour, shape etc. follow particular patterns. Mendel
postulated that alleles are inherited in pairs (one from each parent), and furthermore that certain
traits are inherited in a dominant manner while some are recessive which could be hidden in one
generation and appear in subsequent ones. He also stated that the inheritance of one trait is not
influenced by the inheritance of another. From his results, he derived three main theories of
inheritance; these are now known as the law of segregation, the law of independent assortment
and the law of dominance (Mendel & Bateson 1865). These laws became the foundation of
modern genetics. According to Mendel’s principles, single gene disorders can be classified into
four major groups based on their mode of inheritance; autosomal recessive disorders, autosomal
dominant disorders, X-linked inheritance and Y-linked inheritance. Table 1.1 shows all types of
inheritance which based on Mendel’s principles.
15
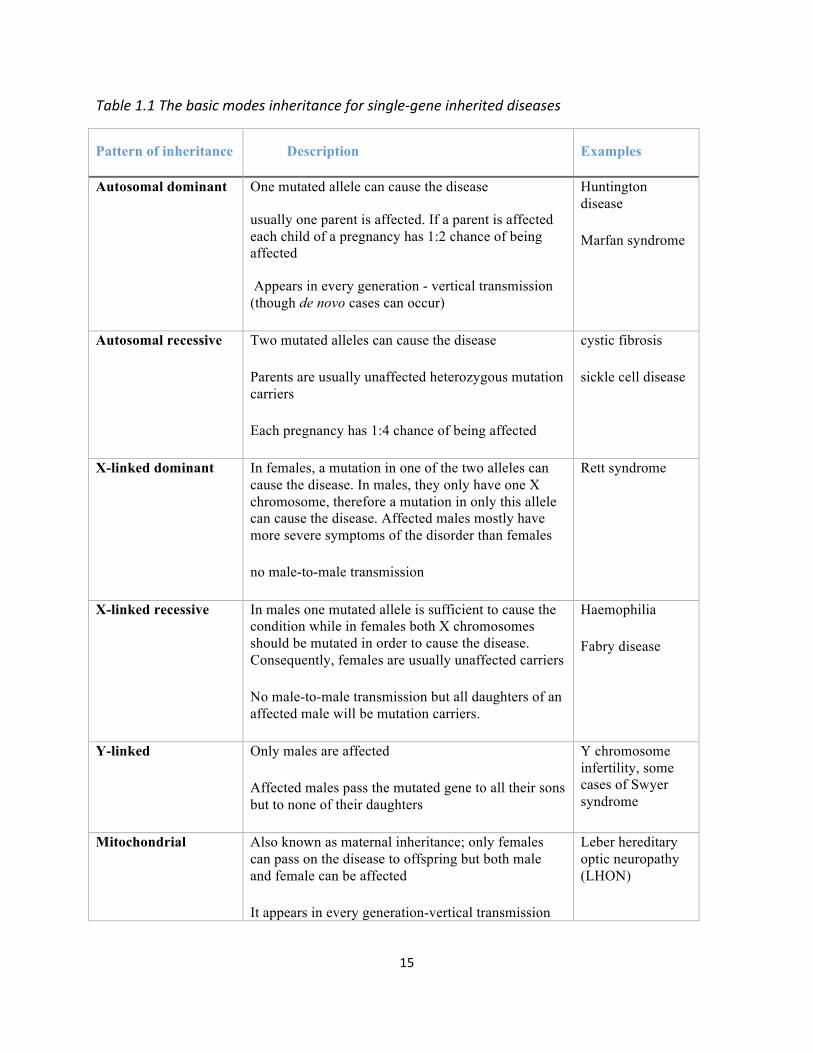
Table1.1Thebasicmodesinheritanceforsingle-geneinheriteddiseases
Pattern of inheritance Description Examples
Autosomal dominant One mutated allele can cause the disease
usually one parent is affected. If a parent is affected each child of a pregnancy has 1:2 chance of being affected
Appears in every generation - vertical transmission (though de novo cases can occur)
Huntington disease
Marfan syndrome
Autosomal recessive Two mutated alleles can cause the disease
Parents are usually unaffected heterozygous mutation carriers
Each pregnancy has 1:4 chance of being affected
cystic fibrosis
sickle cell disease
X-linked dominant In females, a mutation in one of the two alleles can cause the disease. In males, they only have one X chromosome, therefore a mutation in only this allele can cause the disease. Affected males mostly have more severe symptoms of the disorder than females
no male-to-male transmission
Rett syndrome
X-linked recessive In males one mutated allele is sufficient to cause the condition while in females both X chromosomes should be mutated in order to cause the disease. Consequently, females are usually unaffected carriers
No male-to-male transmission but all daughters of an affected male will be mutation carriers.
Haemophilia
Fabry disease
Y-linked Only males are affected
Affected males pass the mutated gene to all their sons but to none of their daughters
Y chromosome infertility, some cases of Swyer syndrome
Mitochondrial Also known as maternal inheritance; only females can pass on the disease to offspring but both male and female can be affected
It appears in every generation-vertical transmission
Leber hereditary optic neuropathy (LHON)
16
1.1.1 Autosomal Recessive Disorders
Autosomal recessive (AR) disorders manifest when the child inherits two mutated alleles (one
allele from each unaffected parent). Each child born to healthy carrier parents has a 25% chance
of being wild-type, 50% chance to be a heterozygous mutation carrier and 25% chance to be
homozygous affected. The affected child may harbour homozygous alleles at the disease locus or
be a compound heterozygote for two different mutations on separate alleles (Table 1.1). Known
examples of these disorders include hemochromatosis (incidence 1:400), cystic fibrosis
(incidence 1:2,500), phenylketonuria (incidence 1: 5,000) spinal muscular atrophy (1: 10,000).
Cystic fibrosis (CF), is an autosomal recessive disorder that affects the pulmonary and digestive
systems of the patient and is characterized by body secretion of sticky thick mucus in the lungs
and airways of affected individuals instead of normal thinner mucus. Around 70,000 individuals
are affected with this disorder worldwide (Cutting, 2015). It is caused by bialleleic mutations of
the CFTR gene, and the severity of the disease is quite variable.
Offspring of consanguineous unions are more likely to exhibit a recessive disorder than offspring
of unrelated couples because consanguineous parents share genes from at least one common
ancestor. As such, if it carries the same allele mutation, the child will be at high risk of inheriting
both mutated copies and therefore become homozygously affected. The significance of
consanguinity will be discussed in further detail later in this chapter. Most of the cases studied in
my project were consanguineous families who had autosomal recessive diseases, and therefore the gene
and pathogenic mutations were mostly expected to be homozygous. However, there is still a possibility
that in some cases despite the family being consanguineous, that disease might be caused by compound
heterozygous mutations or even a non-autosomal recessive manner such as autosomal dominant disorders
that are caused by de novo mutation and so could result in an affected child with normal parents
17
1.1.2 Autosomal Dominant Disorders
. Autosomal dominant (AD) mutations were previously reported in the phenotypes studied within
this project. As described above (Table 1.1), a single mutated allele will be sufficient to cause the
disease in this type of inheritance. If one parent is heterozygous for a dominant mutation, there is
a 50% chance of the offspring being affected. In rare circumstances both parents may be carriers
for the same dominant mutation, and in such cases, there will be a 75% chance that the child will
be affected by either inheriting one mutated allele (50% chance) or by inheriting both mutated
alleles (25% chance), and in this case the disease is expected to be very severe. There will be
only a 25% chance that the child will inherit two wild type alleles and be healthy.
A child might be affected by a dominantly inherited disorder despite having healthy non-carrier
healthy parents. This can occur if there is a de novo mutation or if there is germline mosaicism in
the parents in which the mutation will occur in some of the sperm or egg cells but not the
somatic cells. Germline mosaicism can be observed with any inheritance pattern, but it is most
commonly seen with autosomal dominant and X-linked disorders and the pedigree will resemble
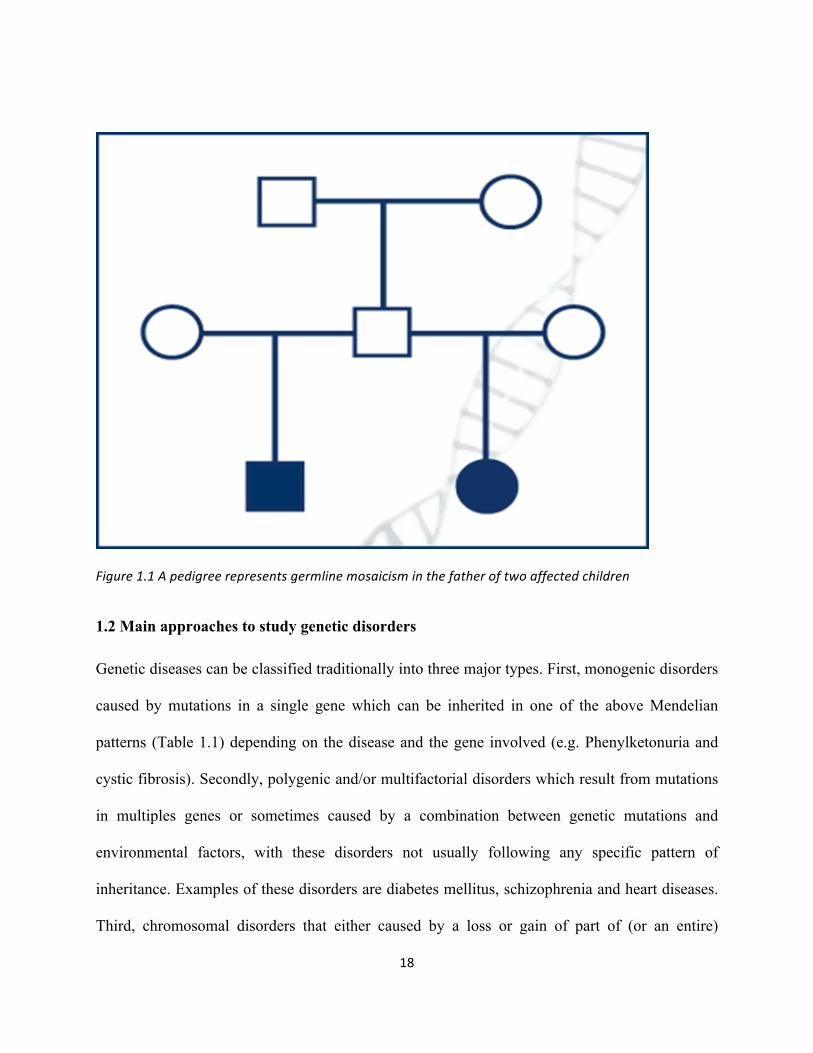
the autosomal recessive pattern of inheritance (Figure 1.1). A child who inherits a mutation from
the mosaic parent will be affected with the disorder and will not show mosaicism. An example of
this is the heterozygous de novo mutation (p.R954L) which was detected in KIF21A in two
siblings who were diagnosed with congenital fibrosis of the extraocular muscles, whereas both
parents were homozygous for the wild allele with apparent recessive inheritance. Further
mutational screening revealed another heterozygous variation in another area of the gene in the
father and in both affected siblings while the mother was normal. As a result, the authors
suggested that the p.R954L mutation arose from the father haplotype who is thought to be a
germline mosaic for the mutation (Khan et al., 2010).
18
Figure1.1Apedigreerepresentsgermlinemosaicisminthefatheroftwoaffectedchildren
1.2 Main approaches to study genetic disorders Genetic diseases can be classified traditionally into three major types. First, monogenic disorders
caused by mutations in a single gene which can be inherited in one of the above Mendelian
patterns (Table 1.1) depending on the disease and the gene involved (e.g. Phenylketonuria and
cystic fibrosis). Secondly, polygenic and/or multifactorial disorders which result from mutations
in multiples genes or sometimes caused by a combination between genetic mutations and
environmental factors, with these disorders not usually following any specific pattern of
inheritance. Examples of these disorders are diabetes mellitus, schizophrenia and heart diseases.
Third, chromosomal disorders that either caused by a loss or gain of part of (or an entire)
19
chromosome copy or may be by rearrangement of part of the chromosome such as by
translocation and/or inversion.
Over the past century-and-a-half, many methods and techniques have been developed to identify
the genetic causes which underlie these disorders in order to help in the diagnostic process and
also improve the treatment approach. Three major historical approaches have been established
for studying genetic and genomic changes in the laboratory. First, is cytogenetics (which analyse
the chromosomal changes). Second, is molecular genetics (which can study the structure and the
function of genes at molecular level), or thirdly, it can be a combination of these two approaches
that can be referred as molecular cytogenetics. In this project, all investigations carried out fell
under the umbrella of molecular genetics, however, I will describe briefly how cytogenetics and
molecular cytogenetics can be used.
1.2.1 Cytogenetics
1.2.1a Conventional cytogenetics
Karyotyping is the conventional cytogenetic method used to check a patient’s set of
chromosomes and test the numerical changes, such as the loss or gain of an entire chromosome
or part of it under the microscope as well as structural changes. The technique was developed by
Tjio and Levan more than 50 years ago. They were the researchers who first discovered the
correct number of human chromosomes as being 46 (Tjio and Levan, 1956). An example of the
chromosomal genetic disorders is Down syndrome which is characterized by the presence of an
extra copy of chromosome 21 (trisomy 21). This method is also efficient in diagnosing some
mental disorders, developmental delay, congenital abnormalities and recurrent miscarriages
which are mainly caused by similar abnormalities in the chromosomes.
20
The most common method for karyotyping is the G-banding technique which is based on the
application of Giemsa dye on the metaphase chromosomes in order to give non-fluorescent
permanent staining for the chromosome which can thus be visualised under a standard
microscope. The main disadvantages of standard cytogenetics is that it takes long time and also
has limited resolution. It can only detects large structural and chromosomal aberrations ranging
from 5-10 Mb in size (Riegel, 2014) . In order to overcome this limitation, the molecular
cytogenetic approach was developed.
1.2.1b Molecular cytogenetics
Three major molecular cytogenetic approaches are used to identify and analyse chromosomal
abnormalities: fluorescent in situ hybridization (FISH), comparative genomic hybridization
(CGH) and SNP-genotyping arrays. FISH is a powerful technique that utilises a fluorescent
probe to bind to a specific chromosomal region to enable the region to be visualised and
localized with fluorescence microscopy in a metaphase or interphase stage. It is useful in
karyotyping to detect the changes in chromosomes (e.g. copy number variation). Also, it is a
sensitive and specific method for detecting abnormalities at a resolution up to few kilobases (kb)
such as translocations, aneuploidy, deletions, inversions, or amplifications. CGH is a high-
throughput technique developed in the 1990s and utilised for the analysis of the whole genome to
identify copy number variations/aberrations (CNVs/CNAs) that cannot be detected by
conventional karyotyping or targeted FISH studies, however it is very helpful in the genetic
diagnosis of cancer patients. Two DNA samples (tumour and normal) are used and compared to
observe any difference between them (Michels et al., 2007, Martin and Warburton, 2015). One
of the main advantages of CGH is that it can be applied effectively to discover novel genetic
21
changes, as it does not really require prior knowledge of the chromosome imbalance that is
involved (Speicher & Carter et al.2005).
In addition, SNP arrays is a further molecular cytogenetic technique that can provide high
resolution copy number data. Recently SNP arrays have been used to detect copy number
variants in the human genome by utilising >946,000 probes with an average inter-marker
distance of 680 base pairs. Also, SNP arrays can detect copy-neutral loss of
heterozygosity/uniparental disomy (UPD), which cannot be detected by conventional
cytogenetics or FISH techniques (Bentley et al., 2008, Mardis et al., 2009)
1.2.2 Molecular Genetics Mutations at the DNA level can be inherited from the parents or might be acquired at some point
of the person’s life. They arise in many different forms, including single nucleotide substitution,
as both insertions and deletions. Based on their impact, they can either cause no effect, alter the
gene product, or prevent the gene from functioning properly or completely. Loss of function
mutations mostly cause harmful effects although on some occasions they can be beneficial
(Loewe, 2008)
1.2.2a Gene identification approaches:
To identify these molecular changes, two main approaches have been developed over the years.
Firstly, functional cloning which is a method that entirely based on the available data about the
gene function in order to determine the suspected causative gene without the need to know the
genomic location of the gene. The second approach is the positional cloning method. Unlike the
first method, a specific region of interest is located in the chromosome and the causative gene is
then identified within the located candidate region without knowledge of the gene function. In
22
practice, using the two methods together has been found to be more efficient and useful rather
than relying only on just one approach (Deloukas et al., 1998).
1.2.2a. i Candidate Gene Approach
This approach was previously known as the functional cloning approach. It requires a detailed
prior knowledge of a particular disease phenotype including the pathophysiology of the disease.
As such it is mainly based on the assessment of the association of a particular candidate gene that
is thought to be relevant to the disease. The major difficulty with this approach is that, before
selecting the potential candidate gene, the researcher should have adequate knowledge and
understanding of the mechanism which underlies the studied disease and its pathophysiology
such as the gene function, tissue expression pattern, role in known developmental pathways,
homologies to other genes, and/or animal models. In contrast, one of the advantages of this
method that it does not require the study of large families with both affected and unaffected
individuals, but can be performed on small families with only parents and probands or it can
even be carried out on unrelated patients and control subjects in some occasions. Furthermore,
this approach can be effective for identifying the genes underlying common and complex
disorders where the risk associated with any chosen candidate gene is quite small (Kwon and
Goate, 2000a, Risch and Merikangas, 1996).
Large number of disease-causing genes have been identified using this method, for example the
identification of phenylalanine hydroxylase (PAH) that causes phenylketonuria (DiLella et al.,
1987). This method was the main approach for identifying the causing genes before the
development of genetic mapping.
However, it is still very helpful today especially when it is combined with the linkage mapping
to identify the disease-causing gene amongst the huge number of genes provided by highly
23
advanced techniques such as next generation techniques. In fact, in the latter scenario, the
researcher is dependent on this strategy to identify both the mutations and the causative genes.
By performing a linkage analysis prior to whole exome sequencing, the region of interest can be
narrowed down to a smaller size. After identifying many suspected variants in different
candidate genes, the list of variants can be filtered according their genetic function and according
to any role of the candidate genes may play in the biological process, and also in terms of any
previous studies on animal models. If the identified genes had any role in the biological pathway,
then it is more likely to select further genes from the same pathway that may lead to specific
disease or related conditions. For instance, the identification of several genes to be a part of the
RAS-MAPK signal transduction pathway (PTPN11, SOS1, RAF1, KRAS, HRAS, BRAF, MEK1,
and MEK2) with the pathway recognised to be responsible for causing a variety of genetic
syndromes (Noonan syndrome, LEOPARD syndrome, Costello syndrome, and
Cardiofaciocutaneous syndrome) that all have overlapping clinical phenotypes (Weismann et al.,
2005). Recently, an analysis of mouse mutants with some genes knocked out using systematic
mutagenesis programs has greatly aided the approach of functional cloning.
Furthermore, the completion of the mouse genome project was a very significant advance
(Waterston et al., 2002) due to the high genetic similarities between human and mouse genomes.
In this way, genetic disease-causing mutations in mice have been hypothesised to reflect similar
diseases in humans. It has also been found that the combination of linkage mapping and a
candidate gene approach is the most successful method of identifying disease genes (Kwon and
Goate, 2000b).
24
1.2.2a.ii Positional cloning
Positional cloning studies are used to identify the location of the disease-causing candidate genes
in Mendelian disorders. The method requires families with multiple affected individuals and
genetic markers of known chromosomal locations to perform linkage analysis from which to
define a candidate segment on a chromosome (locus) which contains the disease-causing gene
(Wicking and Williamson, 1991). Having pinpointed a candidate interval region, mutational
screening for the selected candidate genes within the interval is performed.
In the last decade, The Human Genome Project greatly helped this approach (Lander et al., 2001,
Venter et al., 2001) as it provided physical and genetic maps for millions of polymorphisms and
sequence repeats on the chromosome. In addition, it provided a comprehensive sequence
analysis, which has collectively led to detailed maps of genes of known or unknown function
throughout the human genome. In addition, the public databases provided by genome browsers
such as UCSC, NCBI, and Ensembl include detailed information about a massive number of the
genes and polymorphic markers that have been mapped throughout the whole genome and the
maps. In Mendelian disorders, linkage analysis can achieve the direct mapping of any candidate
genes to locate the candidate genetic segment on the chromosome. Then, from this localized
segment, the candidate gene itself will be selected according to the available information about
the gene activity, tissue expression, biological process and any previous work on animal models
related to this candidate gene.
The highly-advanced genotyping and sequencing project played a significant role in speeding up
the process of gene mapping and identification considerably. Nevertheless, many genes are still
not identified although more than 15,000 genes involved in human diseases are present on
OMIM.
25
1.3 Haplotype and genetic markers
A haplotype is a group of adjacent alleles or DNA sequences (genes or polymorphisms) which
tend to be inherited together and can thus be used as a helpful tool in genetic mapping and
population studies. Genetic mapping depends on the behaviour of chromosomes at the time of
meiosis because this is when the linked region containing the candidate genes is passed along as
a block unit unless they are separated by crossing over between paired homologous chromosome
that results in swapping genetic material, with this process acting as the source of genetic
recombination. The closer the genes occur on the same chromosome, the higher the chance that
they will be inherited as a single unit, because crossing over between two linked genes is
infrequent (Morgan, 1911). Recombination fraction is defined as the genetic distance between
two separate loci, and usually loci separated by recombination in 1% of meiosis are defined as
being 1centiMorgan (cM) distant. This genetic distance is different from physical distance
(measured in bp, kb, or Mb of DNA). In addition, some chromosome regions have a higher
frequency of cross over than others. The order of loci should be similar in genetic and physical
maps, but the spacing may be different, and on average 1cM corresponds to 1Mb, although this
can be variable across the genome. Linkage between two loci is considered to be present when
recombination events occur less than 50% of the time, and results in a recombination fraction of
<0.5 (Ott and Bhat, 1999) which consequently means that the loci are located on the same
chromosome and lie close to each other. Genetic mapping in humans thus looks at a large
number of loci and types them for genetic markers.
Different genetic markers were developed over the years and have been used in genetic mapping
studies including allozymes, Random Amplified Polymorphic DNA (RAPDs), Restriction
Fragment Length Polymorphisms (RFLPs), Amplified Fragment Length Polymorphisms
26
(AFLPs), Sequence-Tagged Sites (STSs), microsatellites and SNPs. In practice, each type of
markers presents slightly different advantages and disadvantages. For selecting the best genetic
markers to use in any linkage mapping studies, three main characteristics need to be considered:
(i) high polymorphic rate of the genetic marker, (ii) the spreading across the genome or
chromosomal region that contains the candidate gene with good coverage (iii) the genotyping
error rate should be relatively small. (Ball et al., 2010) All these features can be found with
single nucleotide polymorphisms which make them along with microsatellites the most used
markers in genetic mapping studies. Both SNPs and microsatellite markers have been utilised in
my project.
Microsatellite markers are short tandemly repeated DNA sequences from 2-5 bases with a high
polymorphic rate (e.g. [CA] repeats 40 times in a sequence). An analysis of microsatellites can
then be performed using polymerase chain reaction (PCR) by amplification of the region which
contains the microsatellites using fluorescently-tagged primers followed by fragment analysis.
Microsatellites occur on average nearly every 30,000 bases throughout the human genome
(Stallings et al., 1991). Practically speaking, these are found to be very informative and
successful in many mapping projects but they do have high error rates compared to SNPs (Ball et
al., 2010). Because of advances in high-throughput sequencing technologies and bioinformatics,
SNPs have been increasingly used in genetic mapping studies in Mendelian monogenic,
multifactorial diseases and the detection of copy number variants (CNVs). These are distributed
throughout the whole human genome with an average presence of one polymorphism each 300
nucleotides , which means that the human genome contains nearly 10 million SNPs (Salisbury et
al., 2003). SNPs are relatively less informative than microsatellites because they are less
27
polymorphic but in contrast they are significantly more abundant across the human genome with
a far less error rate.
1.4 Genetic Mapping projects
In the recent years, human genome sequencing projects such as the international HapMap
Consortium facilitated the use of SNP markers in mapping studies by providing around 11
million polymorphisms across the genome. The International HapMap is one of the biggest
established mapping projects which has had a great impact in the design and analysis of genome-
wide association studies. Using 270 individuals originating from different ethnic populations,
the project successfully provided the mapping locations of more than one million SNPs. This
achievement was later named as Phase I of the project and the result was published in 2005. In
Phase II of the HapMap Project and with genotyping of same individuals, they found a further
2.1 million SNPs. Based on phase I and II, the HapMap project thus contains a catalogue of
nearly 3.1 million SNPs in total which means one polymorphism occurs every 1kbp nucleotide
(International HapMap et al., 2007). These 3.1 million SNPs represent nearly one third of all the
estimated 10 million commonly published SNPs (MAF≥0.05) in the whole assembled human
genome (International HapMap et al., 2007). As a result, genome wide scans using SNP markers
can be done utilizing high throughput methods such as (‘SNP-chips’), which provide high
resolution mapping information. The first applied SNP chip array was (GeneChip® 10K Xba
Array) and it could scan more than 10,000 SNP markers in a single experiment (Affymetrix Inc,
Santa Clara, CA). This 10K chip was subsequently successfully used in many mapping projects
(Janecke et al., 2004, Gissen et al., 2004). Also, Affymetrix has developed the SNP array
techniques and produced upgraded array chips including 100K, and 500K which genotype more
than 100,000 and 500,000 SNP markers respectively. More recently, they released SNP Array
28
6.0 that contains more than 900,000 SNPs and similar number of markers to detect copy number
variation.
Many genetic mapping and linkage studies have been established over the last three decades and
these have become a crucial part of the genetic maps and the gene identification approach by
providing a high-density framework of genetic markers across the genome with known positions
for both the known genes and the markers. An example of these developed maps is the Généthon
map which mainly focused on the microsatellite markers (Weissenbach et al., 1992, Dib et al.,
1996). Another microsatellite map was constructed by genotyping nearly 8,000 markers based on
the analysis of eight large, three-generation families (Broman et al., 1998). In 2002, a paper was
published describing a genetic mapping project which was undertaken in Reykjavik, Iceland by
genotyping 869 individuals from 146 families. The study provided a defined map of 5,136
polymorphic microsatellite markers. Based on this particular map framework, around 2 million
further SNPs have been located as well (Kong et al., 2002). These genetic maps can be very
helpful in performing linkage studies and identifying genes in specific diseases and aiding the
assembly of known DNA sequence for the human genome project.
1.5 Consanguinity
In clinical genetics, consanguinity is described as a union between two related individuals such
as first and second cousins, with an inbreeding coefficient factor (F) not less than 0.0156 (Bittles,
2001) where (F) measures the probability of passing on identical copies of the alleles from the
related parents to their offspring, so that they become homozygous for that allele and are
identical by descent (IBD). F thus relates to the risk for the child to be homozygous by descent
for a particular genetic sequence. In contrast, the coefficient of relationship (R) is related to the
29
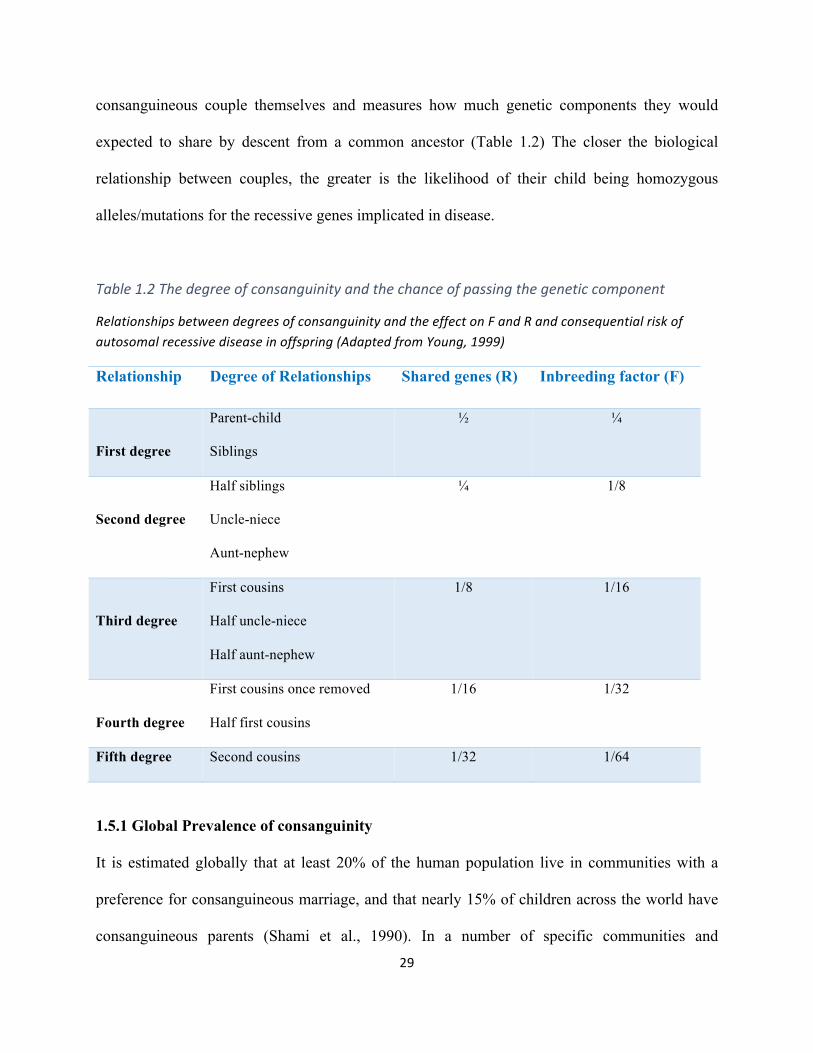
consanguineous couple themselves and measures how much genetic components they would
expected to share by descent from a common ancestor (Table 1.2) The closer the biological
relationship between couples, the greater is the likelihood of their child being homozygous
alleles/mutations for the recessive genes implicated in disease.
Table1.2Thedegreeofconsanguinityandthechanceofpassingthegeneticcomponent
RelationshipsbetweendegreesofconsanguinityandtheeffectonFandRandconsequentialriskofautosomalrecessivediseaseinoffspring(AdaptedfromYoung,1999)
Relationship Degree of Relationships Shared genes (R) Inbreeding factor (F)
First degree
Parent-child
Siblings
½ ¼
Second degree
Half siblings
Uncle-niece
Aunt-nephew
¼ 1/8
Third degree
First cousins
Half uncle-niece
Half aunt-nephew
1/8 1/16
Fourth degree
First cousins once removed
Half first cousins
1/16 1/32
Fifth degree Second cousins 1/32 1/64
1.5.1 Global Prevalence of consanguinity
It is estimated globally that at least 20% of the human population live in communities with a
preference for consanguineous marriage, and that nearly 15% of children across the world have
consanguineous parents (Shami et al., 1990). In a number of specific communities and
30
populations, there is a preference towards consanguineous marriage and this has led to an
increased expression of autosomal recessive disorders among these communities because the
offspring is at a higher risk of inheriting homozygous recessive gene mutations from a common
ancestor (Bittles et al., 1991, Bittles and Black, 2010, Hamamy et al., 2011). In contrast, no
significant associations have been indicated in the genetic studies between the consanguineous
marriages and the diseases inherited either in autosomal dominant conditions or for X-linked
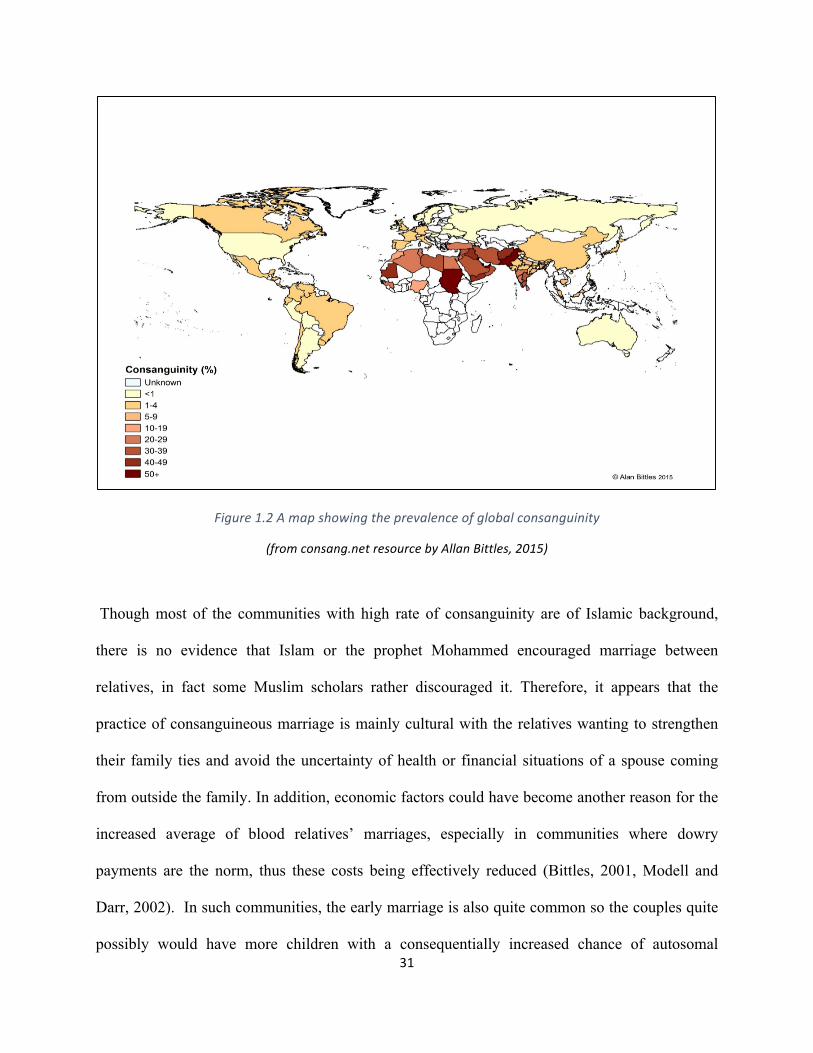
recessive conditions (Hamamy et al., 2007). Consanguineous marriage has been reported with
high rate in some countries such as India, Pakistan Turkey, Arabian Gulf countries and in North
Africa in varying rates (Figure 1.2) (Hamamy et al., 2007, Hamamy et al., 2011).
31
Figure1.2Amapshowingtheprevalenceofglobalconsanguinity
(fromconsang.netresourcebyAllanBittles,2015)
Though most of the communities with high rate of consanguinity are of Islamic background,
there is no evidence that Islam or the prophet Mohammed encouraged marriage between
relatives, in fact some Muslim scholars rather discouraged it. Therefore, it appears that the
practice of consanguineous marriage is mainly cultural with the relatives wanting to strengthen
their family ties and avoid the uncertainty of health or financial situations of a spouse coming
from outside the family. In addition, economic factors could have become another reason for the
increased average of blood relatives’ marriages, especially in communities where dowry
payments are the norm, thus these costs being effectively reduced (Bittles, 2001, Modell and
Darr, 2002). In such communities, the early marriage is also quite common so the couples quite
possibly would have more children with a consequentially increased chance of autosomal
32
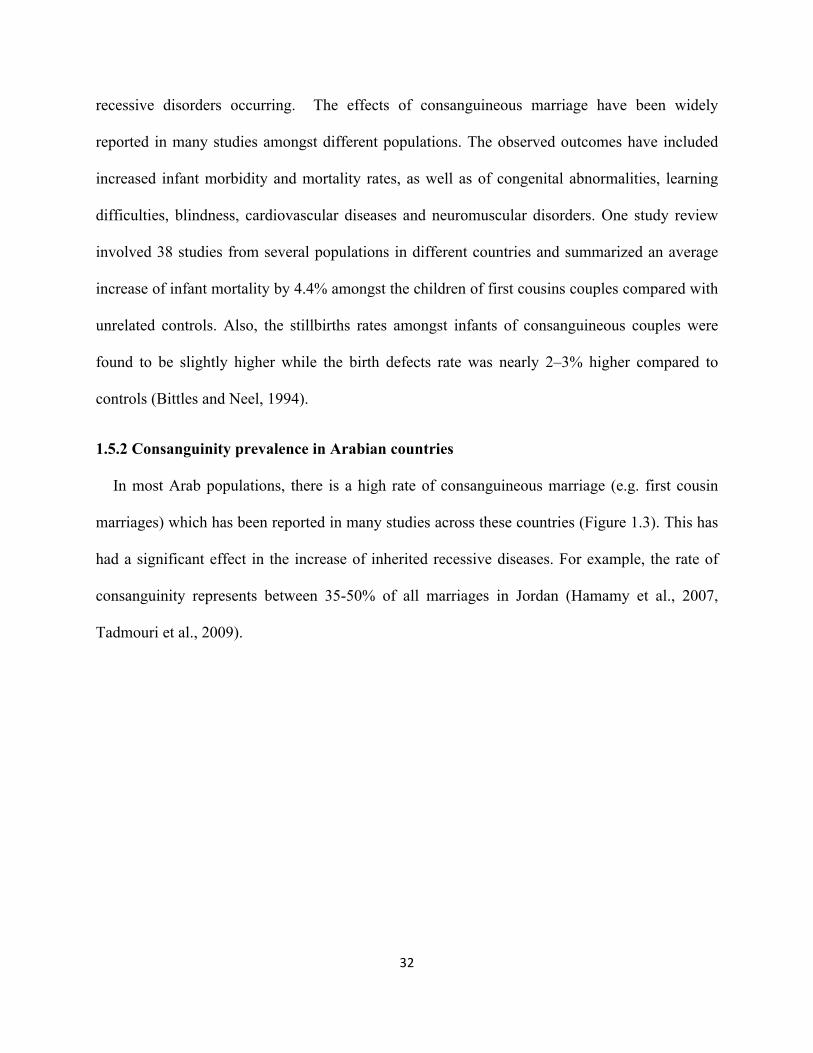
recessive disorders occurring. The effects of consanguineous marriage have been widely
reported in many studies amongst different populations. The observed outcomes have included
increased infant morbidity and mortality rates, as well as of congenital abnormalities, learning
difficulties, blindness, cardiovascular diseases and neuromuscular disorders. One study review
involved 38 studies from several populations in different countries and summarized an average
increase of infant mortality by 4.4% amongst the children of first cousins couples compared with
unrelated controls. Also, the stillbirths rates amongst infants of consanguineous couples were
found to be slightly higher while the birth defects rate was nearly 2–3% higher compared to
controls (Bittles and Neel, 1994).
1.5.2 Consanguinity prevalence in Arabian countries
In most Arab populations, there is a high rate of consanguineous marriage (e.g. first cousin
marriages) which has been reported in many studies across these countries (Figure 1.3). This has
had a significant effect in the increase of inherited recessive diseases. For example, the rate of
consanguinity represents between 35-50% of all marriages in Jordan (Hamamy et al., 2007,
Tadmouri et al., 2009).
33
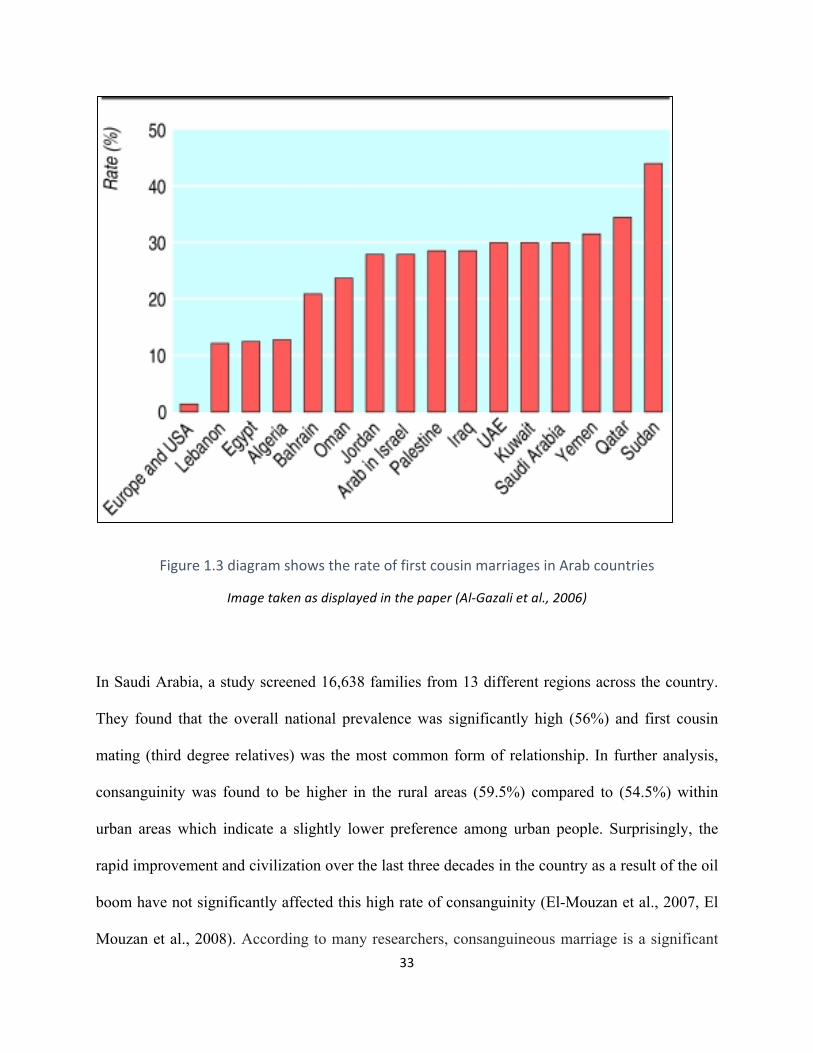
Figure1.3diagramshowstherateoffirstcousinmarriagesinArabcountries
Imagetakenasdisplayedinthepaper(Al-Gazalietal.,2006)
In Saudi Arabia, a study screened 16,638 families from 13 different regions across the country.
They found that the overall national prevalence was significantly high (56%) and first cousin
mating (third degree relatives) was the most common form of relationship. In further analysis,
consanguinity was found to be higher in the rural areas (59.5%) compared to (54.5%) within
urban areas which indicate a slightly lower preference among urban people. Surprisingly, the
rapid improvement and civilization over the last three decades in the country as a result of the oil
boom have not significantly affected this high rate of consanguinity (El-Mouzan et al., 2007, El
Mouzan et al., 2008). According to many researchers, consanguineous marriage is a significant
34
factor in increasing the prevalence of autosomal recessive genetic disorders within Arab
populations and consanguinity is suggested as a reason of the high postnatal mortality rate
amongst offspring of consanguineous unions, compared to offspring of non-consanguineous
parents (Hamamy et al., 2007, Tadmouri et al., 2009).
A study focused on investigating the role of consanguinity in pregnancy outcomes involved 4498
pregnant women in Saudi Arabia and identified that the rate of consanguinity was 54.3%
including 31.4% of first cousins and 22.9% of other relatives. This very high rate of
consanguineous marriages in the Saudi population could be due to the role of the family in
arranging the marriages as well as to the social and cultural influences which try to keep the
family together. In the results, the high frequency of deleterious pregnancy outcome was noted
among the consanguineous compared to those of the non-consanguineous marriages. The rates of
the most severe outcomes such as perinatal deaths, infant deaths and neonatal deaths were highly
significant among the consanguineous with 62%, 60.3% and 57.9% respectively, and collectively
was 5% higher the non-related marriages. Furthermore, a higher average of the other outcomes
such as abortions, still births, prematurity, live births and low weight were reported when
compared to the non-consanguineous marriages (Wong and Anokute, 1990)
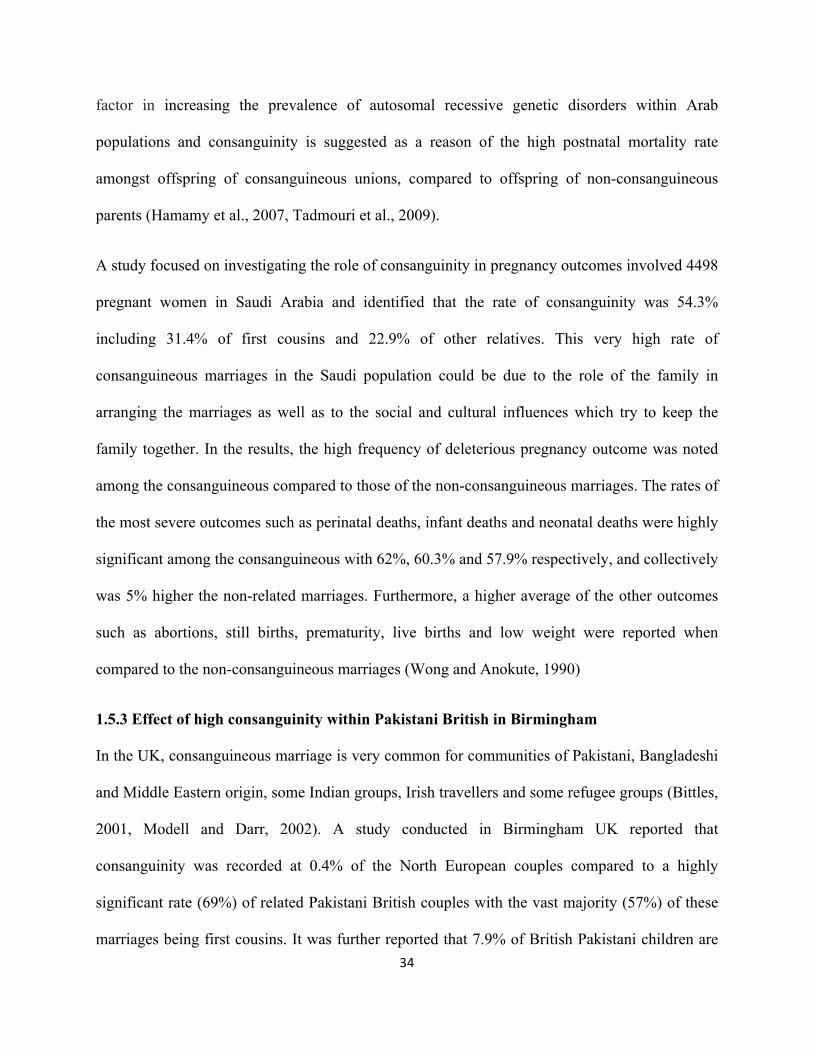
1.5.3 Effect of high consanguinity within Pakistani British in Birmingham
In the UK, consanguineous marriage is very common for communities of Pakistani, Bangladeshi
and Middle Eastern origin, some Indian groups, Irish travellers and some refugee groups (Bittles,
2001, Modell and Darr, 2002). A study conducted in Birmingham UK reported that
consanguinity was recorded at 0.4% of the North European couples compared to a highly
significant rate (69%) of related Pakistani British couples with the vast majority (57%) of these
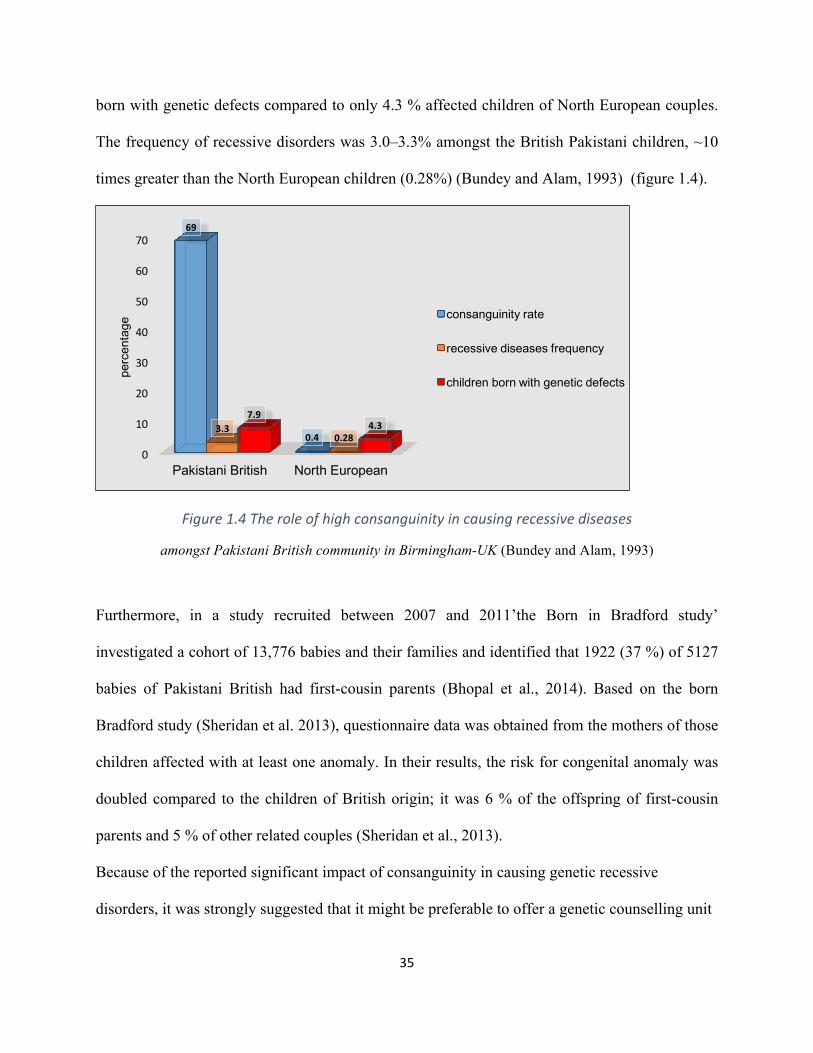
marriages being first cousins. It was further reported that 7.9% of British Pakistani children are
35
born with genetic defects compared to only 4.3 % affected children of North European couples.
The frequency of recessive disorders was 3.0–3.3% amongst the British Pakistani children, ~10
times greater than the North European children (0.28%) (Bundey and Alam, 1993) (figure 1.4).
Figure1.4Theroleofhighconsanguinityincausingrecessivediseases
amongst Pakistani British community in Birmingham-UK (Bundey and Alam, 1993)
Furthermore, in a study recruited between 2007 and 2011’the Born in Bradford study’
investigated a cohort of 13,776 babies and their families and identified that 1922 (37 %) of 5127
babies of Pakistani British had first-cousin parents (Bhopal et al., 2014). Based on the born
Bradford study (Sheridan et al. 2013), questionnaire data was obtained from the mothers of those
children affected with at least one anomaly. In their results, the risk for congenital anomaly was
doubled compared to the children of British origin; it was 6 % of the offspring of first-cousin
parents and 5 % of other related couples (Sheridan et al., 2013).
Because of the reported significant impact of consanguinity in causing genetic recessive
disorders, it was strongly suggested that it might be preferable to offer a genetic counselling unit
0
10
20
30
40
50
60
70
Pakistani British North European
69
0.43.3
0.28
7.94.3
perc
enta
ge
consanguinity rate
recessive diseases frequency
children born with genetic defects
36
for any related couples who intend to get married rather than simply attempting to convince them
to avoid it. This suggestion was made due to the high traditional preference of consanguinity
amongst these societies as previously explained. Such genetic counselling would include carrier
testing for at-risk couples prior to their marriage. Also, a prenatal test would be suggested to
detect any abnormality or severe disorders of the fetus during the first trimester of the pregnancy
such as thalassaemia disorder. This test can be typically dome by chorionic villus sampling in the
first trimester for severe disorders (Darr and Modell 1988)
1.6 Autozygosity mapping
1.6.1 Background about the technique
The homozygous locus which is inherited from both parents is called autozygous, and the
method of identifying this locus is known as autozygosity mapping (Mueller and Bishop, 1993).
The technique is found to be very effective in searching for homozygous regions by descent in
consanguineous families affected by autosomal recessive disorders (Figure 1.5). The advances in
genetic mapping techniques (in particular genotyping SNP assays) have greatly helped in
implementing the homozygosity mapping technique for analysing autosomal recessive disorders
in consanguineous families (Lander and Botstein, 1987). Though the parental consanguinity is
considered as the main cause of the homozygosity, however, several other mechanisms might be
involved such as linkage disequilibrium (LD) in a population which could result in a
homozygous chromosomal segment. This is not autozygous however and is more likely be
shorter. Heterozygous deletion of one chromosome is another cause of apparent homozygosity
but it would be in very much shorter segments. Furthermore, homozygosity mapping has been
applied on more complex disorders (i.e. schizophrenia), so the success of the strategy can be
37
seen to have been extended not only for examining monogenic but also for the identification of
rare genomic variants in complex traits (Broman and Weber, 1999).
Moreover, longer homozygous regions can also be caused by long deletions or chromosomal
abnormalities such as uniparental disomy, when both copies of a chromosome or part of it are
received from only one parent with no copies from the other parent. The efficiency of
autozygosity mapping was confirmed in many studies which focused on investigating different
disorders that follow in an autosomal recessive manner in consanguineous families. Over the last
two decades, many autosomal recessively disorders (including lethal ones) have been studied
with great success by utilizing this method of mapping to provide the genetic basis that could
lead to identifying the disease-causing developmental genes in these disorders (Aligianis et al.,
2005, Morgan et al., 2006b). For instance, the technique successfully mapped the candidate
genetic region that causes alkaptonuria disorder (Pollak et al., 1993). Therefore, the autozygosity
mapping technique has proved itself to be a very useful approach and a powerful strategy to
locate the disease-causing genes in these closed families. However, this method can’t be helpful
in terms of finding the definite mutation which ultimately has to be achieved by direct gene
sequencing.
38
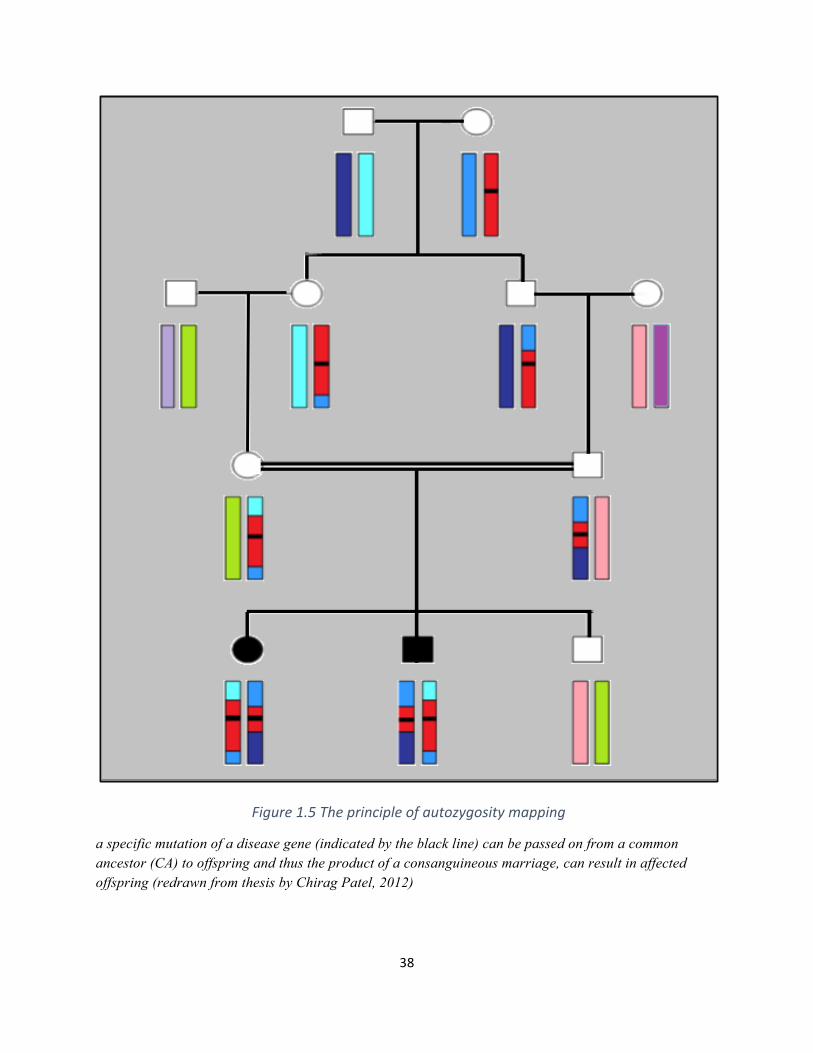
Figure1.5Theprincipleofautozygositymapping
a specific mutation of a disease gene (indicated by the black line) can be passed on from a common ancestor (CA) to offspring and thus the product of a consanguineous marriage, can result in affected offspring (redrawn from thesis by Chirag Patel, 2012)
39
1.6.2 Advantages / disadvantages of autozygosity mapping
As introduced above, the use of autozygosity mapping and positional candidate gene analysis has
shown a high efficiency in identifying the recessive genes of consanguineous families, much
more so than in non-consanguineous families. The technique is currently regarded as an efficient
and successful approach for localising the disease gene amongst the consanguineous families,
even in the presence of locus heterogeneity (Petukhova et al., 2009).
The more affected individuals from a studied consanguineous family, the more efficient the
method will be to identify the region of interest that is linked to the disease. As many autosomal
recessive disorders are considered very rare among the population, however, it will often be
difficult to identify a sufficient number of patients with the same phenotype to perform
autozygosity mapping. In the case of a small family size, for example, (i.e. a family with two
affected individuals) collaborative projects between several centres would be an alternative
solution to obtain more information about the disease genotype. A limitation for the effect of this
option in studying some disorders is when there is a ‘private mutation’ that could only be present
in a number of families which would then be difficult to find it in other families even with the
same phenotype.
Furthermore, some autosomal recessive diseases in consanguineous families can be caused by
compound heterozygous mutations, so in this case the disease locus might not be within a
homozygous region at all, and would not be covered by the autozygosity mapping as the
technique focuses only on the homozygous regions. Moreover, some rare diseases are also
extremely heterogeneous with more than one genetic locus for the disease, so it is also important
to identify any previously mapped disease loci in such instances. Linkage studies performed in
one large consanguineous family with multiple affected individuals would certainly be more
40
powerful than using several different families with one or two affected individuals. Once linkage
is established in such a large family, other smaller consanguineous families could then be used to
investigate the linkage at the same candidate region. Such approaches might help to overcome
the problem of locus heterogeneity.
1.7 DNA sequencing
DNA sequencing is referred as the determination of the precise order of nucleotides [Adenine
(A), Guanine (G), Cytosine (C), and Thymine (T)] within the DNA molecule/genome. The
development of Sanger sequencing has enabled many advances in biology and medicine and
improved understanding of the genetic basis of a large number of inherited diseases. The
automation of this process also greatly facilitated the completion of the human genome project
(Levy et al., 2007). The human genome project was officially started in 1990 and was completed
in 2003 with the mapping of nearly 3 billion base pairs at a final cost of approximately $2.7
billion. The Sanger method (First-Generation Sequencing) was the standard method for DNA
sequencing since it was originally developed in the 1970s, until the advent of high throughput
machines or next generation techniques at the beginning of the last decade. Next generation
sequencing greatly reduced the time and the cost of sequencing provided the ability to sequence
the entire human genome in a few days with highly reduced costs. These can be considered the
two major methods for DNA sequencing.
1.7.1 Sanger Sequencing method
1.7.1a Main principle of the technique
the discovery of double helix structure of DNA was firstly discovered in 1953 by the British
scientists Watson and Crick (Watson and Crick, 1953). For their great discovery, they both won
41
the 1962 Nobel Prize in Medicine. Sanger sequencing was developed by Fredrick Sanger in 1977
(Sanger et al., 1977) who began a new era in molecular biology and it is still used widely today.
Until this, the accepted method of sequencing DNA was described by Maxam and Gilbert who
first developed the chemical cleavage of DNA for sequencing. After the publication of the
Sanger method however, Maxam–Gilbert sequencing became increasingly unfavorable due to
the method’s complexity, its extensive use hazardous chemicals, and the implicit difficulties with
scale-up (Tipu and Shabbir, 2015b). The Sanger technique was based on a chain termination
method by using dideoxy nucleotides (ddNTPs) in the presence of a specific primer, DNA
polymerase and deoxy nucleoside triphosphates (dNTPs). The ddNTPs lack the hydroxyl group
which is required to form a phosphodiester bond between nucleotides causing DNA polymerase
to terminate DNA elongation which results in fragmented sequences of DNA with different
sizes. The resulting fragments are then separated according to size using gel electrophoresis
(Bayes et al., 2012). The used ddNTPs are normally radioactively or fluorescently labeled to
enable detection in gel electrophoresis. The reaction is divided into four separate sequencing
reactions, each reaction includes the standard deoxynucleotides (dATP, dGTP, dCTP and dTTP).
Though this represented a remarkable achievement in developing DNA sequencing the main
limitation of this chain-termination method was the non-specific primer binding to the target
sequence which affects the accuracy of reading the DNA. Therefore, a new method called Dye-
terminator sequencing has been developed more recently. This depends on the labelling of the
chain terminator ddNTPs, and sequencing can be done in a single rather than four as used in the
labelled-primer method (Tucker et al., 2009)
42
1.7.1b The automation of the technique
An automated sequencing of Sanger method was further developed by Prober and colleagues. It
depends on fluorescent labelling to detect DNA fragments based on the use of fluorescent chain
terminators. The method was based on four ddNTPs, each one is attached to a distinct succinyl
fluorescein. The DNA fragments are resolved on polyacrylamide gel electrophoresis (PAGE) and
then detected by a fluorescent system. Subsequent progress in the technique has resulted in
identifying developing colour coding of terminating ddNTPs, allowing running the four ddNTPs
in one tube reaction instead of four. Since then, many commercial companies have introduced
different automated DNA sequencers. The use of PAGE still has had some limitations such as in
the preparation of gels, the use of toxic chemicals, problems of gel loading, thickness and
electrophoresis (Prober et al., 1987). In the early 1980s, the Capillary electrophoresis method
was successfully developed using high purity fused silica capillaries which hold a sieving
medium that allows DNA fragments to be separated based on their molecular size. A laser
detector near the end of capillaries enable the detection of fluorescent signals emitted by
incorporated labelled ddNTPs which is considered another important step towards the
automation of Sanger sequencing. A further acceleration in the automated sequencing
instruments was achieved by developing Capillary Array Electrophoresis (CAE) method which
is based on the use of laser detector to scan 96 samples one by one across all 96. It only uses 1%
of the amount of DNA in each sample to be scanned, however, while the remaining 99% is lost
without detection. This limitation was covered by developing a new system that could detect
signals from all capillaries simultaneously by the introduction of a sheath flow cuvette. DNA
sequencing fragments were run as discrete streams from each capillary within the sheath fluid. A
43
laser beam focused into the cuvette skims beneath the capillary tips thus scanning all 96
capillaries simultaneously (Tipu and Shabbir, 2015a)
1.7.2 Next generation sequencing (NGS)
Since the discovery of DNA structure in 1953, a lot of rapid advancement in genomic
technologies have been made, including the recent NGS techniques to understand the complexity
and diversity of human genome in health and disease. One major advancement was the
completion of Human Genome Project in 2003. Though this was a huge achievement in the
genetic and genomic field, it revealed the need to accelerate the effort to develop more advanced
sequencing technologies instead of relying on the limited throughput of Sanger-dye sequencing
method. This would thus provide better understanding for the human genome by sequencing
more genomes and running bigger databases. Therefore, a great competition was created that
could help reducing the high costs of sequencing. In 2005, Life Sciences 454 launched the
release of NGS platforms by introducing the 454 genome sequencer (Margulies et al., 2005).
This saw a huge advancement in genomic sequencing which brought about a very competitive
environment between companies (Goodwin et al., 2016). This competition also resulted in a
sharp decrease in the cost of commercial sequencing kits which had a very positive impact on
medical research and the associated economic cost in which whole exome sequencing (the
coding part of the whole genome) for example might cost currently less than $1000 while the
whole genome sequencing costs nearly $1500. This race in share marketing in genome
sequencing resulted in a trend in the price falling significantly faster than in Moore’s law (Figure
1.6). Moore’s law describes the concept that the power of computer technology doubles every
two years. This law can also be applied to the progression in the power cand efficiency of NGS.
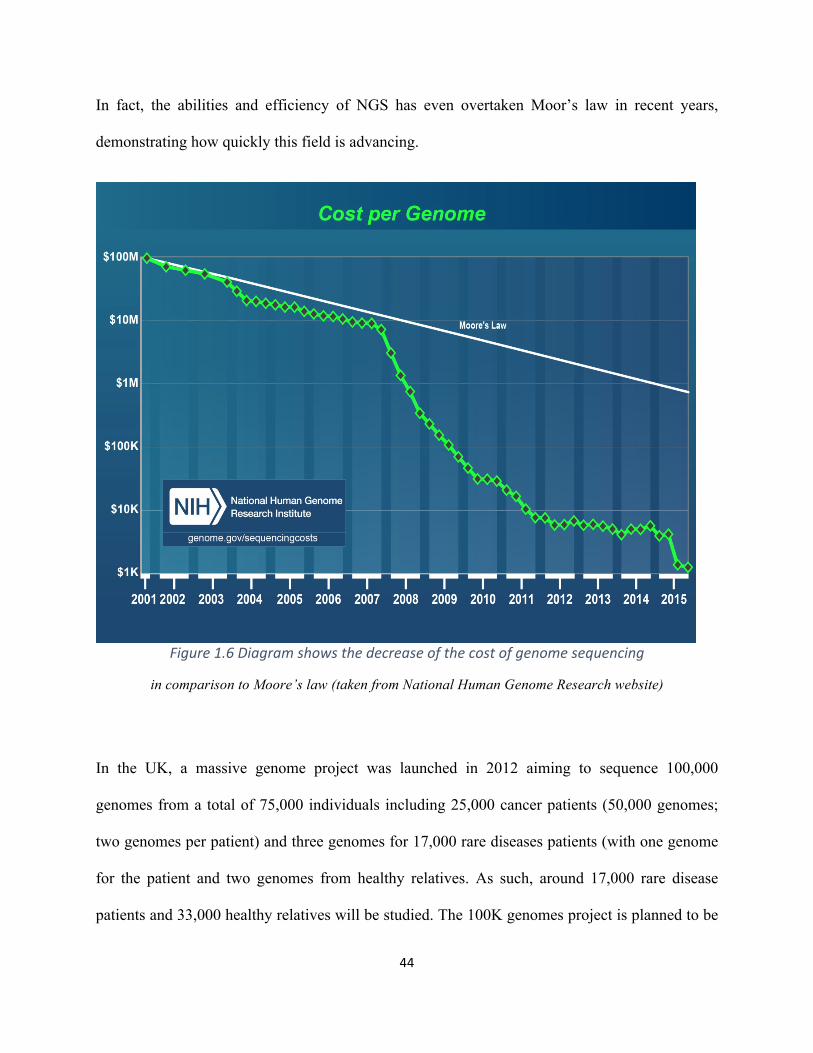
44
In fact, the abilities and efficiency of NGS has even overtaken Moor’s law in recent years,
demonstrating how quickly this field is advancing.
Figure1.6Diagramshowsthedecreaseofthecostofgenomesequencing
in comparison to Moore’s law (taken from National Human Genome Research website)
In the UK, a massive genome project was launched in 2012 aiming to sequence 100,000
genomes from a total of 75,000 individuals including 25,000 cancer patients (50,000 genomes;
two genomes per patient) and three genomes for 17,000 rare diseases patients (with one genome
for the patient and two genomes from healthy relatives. As such, around 17,000 rare disease
patients and 33,000 healthy relatives will be studied. The 100K genomes project is planned to be
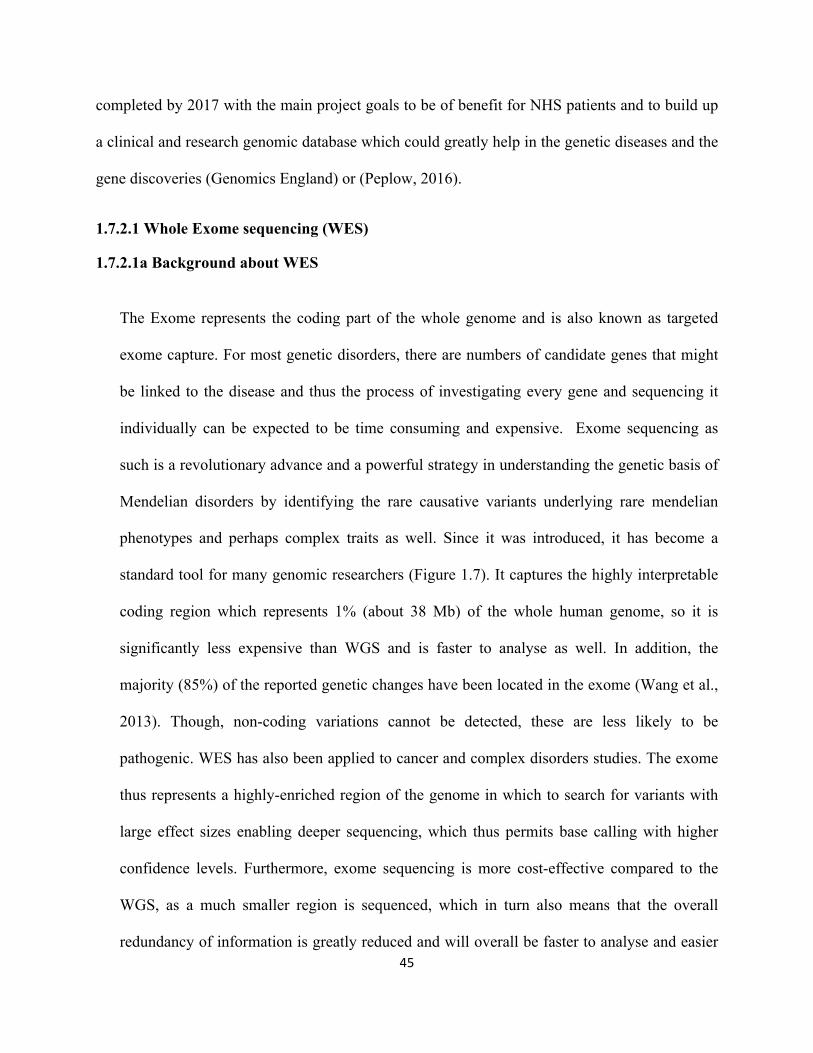
45
completed by 2017 with the main project goals to be of benefit for NHS patients and to build up
a clinical and research genomic database which could greatly help in the genetic diseases and the
gene discoveries (Genomics England) or (Peplow, 2016).
1.7.2.1 Whole Exome sequencing (WES)
1.7.2.1a Background about WES
The Exome represents the coding part of the whole genome and is also known as targeted
exome capture. For most genetic disorders, there are numbers of candidate genes that might
be linked to the disease and thus the process of investigating every gene and sequencing it
individually can be expected to be time consuming and expensive. Exome sequencing as
such is a revolutionary advance and a powerful strategy in understanding the genetic basis of
Mendelian disorders by identifying the rare causative variants underlying rare mendelian
phenotypes and perhaps complex traits as well. Since it was introduced, it has become a
standard tool for many genomic researchers (Figure 1.7). It captures the highly interpretable
coding region which represents 1% (about 38 Mb) of the whole human genome, so it is
significantly less expensive than WGS and is faster to analyse as well. In addition, the
majority (85%) of the reported genetic changes have been located in the exome (Wang et al.,
2013). Though, non-coding variations cannot be detected, these are less likely to be
pathogenic. WES has also been applied to cancer and complex disorders studies. The exome
thus represents a highly-enriched region of the genome in which to search for variants with
large effect sizes enabling deeper sequencing, which thus permits base calling with higher
confidence levels. Furthermore, exome sequencing is more cost-effective compared to the
WGS, as a much smaller region is sequenced, which in turn also means that the overall
redundancy of information is greatly reduced and will overall be faster to analyse and easier
46
to manage. These features make exome a favourable option over WGS for studying
mendelian inherited diseases (Chilamakuri et al., 2014).
Figure1.7thepublishedpapersinmedicalresearchwhichappliedexomesequencingintheperiod(2009-2012)
1.7.2.1b Main Principles of Exome Sequencing
In principle, the general concept of next generation sequencing including WES is very similar to
the Sanger sequencing method in which DNA polymerase catalyses the incorporation of
fluorescently labelled deoxynucleotides (dNTPs) during the extension of a new DNA strand. In
each cycle, at the point of incorporation, the nucleotides are detected by a process called
fluorophore excitation. The main difference is that NGS can run millions of extension reactions
in a massively parallel way rather than sequencing for a single DNA fragment as happens in the
case of Sanger sequencing (Illumina 2015). Practically, exome sequencing includes three basic
steps: sample preparation, raw data processing, and data interpretation (figure 1.8). Currently, the
most commonly used method in this respect is a hybridisation-based capture approach (Rykalina
47
et al 2014) and the most widely used commercial enrichment kits using this approach include
Agilent, NimbleGen and Illumina; and despite the slight differences between each kit, the main
principle is almost the same.
1.7.2.1b.iLibrarypreparationandsequencing
Initially, genomic DNA is randomly fragmented into various lengths, followed by adapter
ligation at both ends of the target sequence. However, these two steps can be combined into a
single step (tagmentation) which is found to create a high efficient library preparation process.
Normally a volume of 50ng/µl of genomic DNA should be enough to perform this step because
significantly less DNA is lost at the fragmentation step. A massive collection of these adapter-
ligated fragments can then finally construct the genomic library. The library is then loaded in a
specific cell where fragments are captured by specific oligonucleotides. Each fragment can then
be amplified by PCR and hybridised to biotinylated RNA baits, which is designed to target the
coding portion of the genome. Using streptavidin coated magnetic beads, biotinylated RNA baits
are captured and pulled down while the other unhybridized and intronic regions are washed
away. As a result, the library only contains the exomic regions. This captured coding DNA is
amplified to produce sequence ready enriched targets (Figure 1.9) (Rykalina et al., 2014).
Illumina uses sequencing by synthesis (SBS) technology for generating the exome data. During
each single sequencing cycle, a fluorescently labelled dNTP is added to DNA template strand to
produce nucleotide label which ultimately terminates polymerization. Following each dNTPs
incorporation, a fluorescent image is produced to detect the nucleotide base and then cleaved to
be followed by a further incorporation of the next base because all the four reversible terminator-
bound dNTPs (A,C,T,G) are present. This makes natural competition by which the bias is
minimized and results eventually in highly accurate sequencing reads. A huge quantity of raw
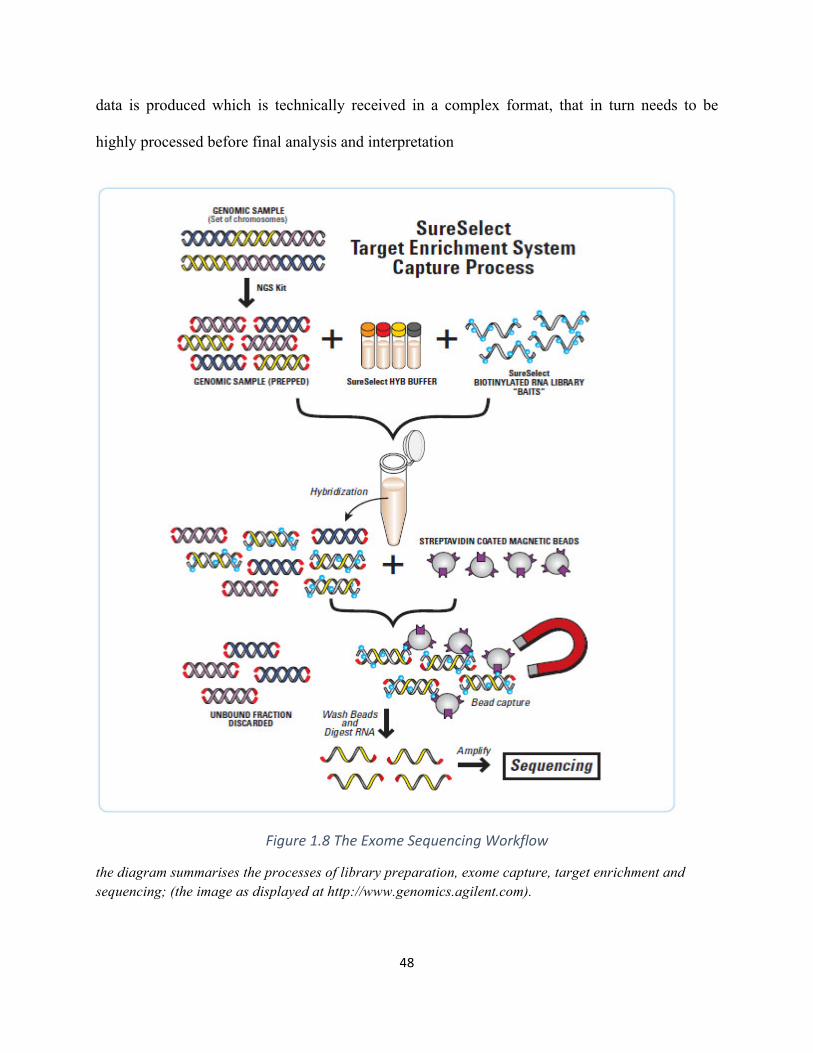
48
data is produced which is technically received in a complex format, that in turn needs to be
highly processed before final analysis and interpretation
Figure1.8TheExomeSequencingWorkflow
the diagram summarises the processes of library preparation, exome capture, target enrichment and sequencing; (the image as displayed at http://www.genomics.agilent.com).
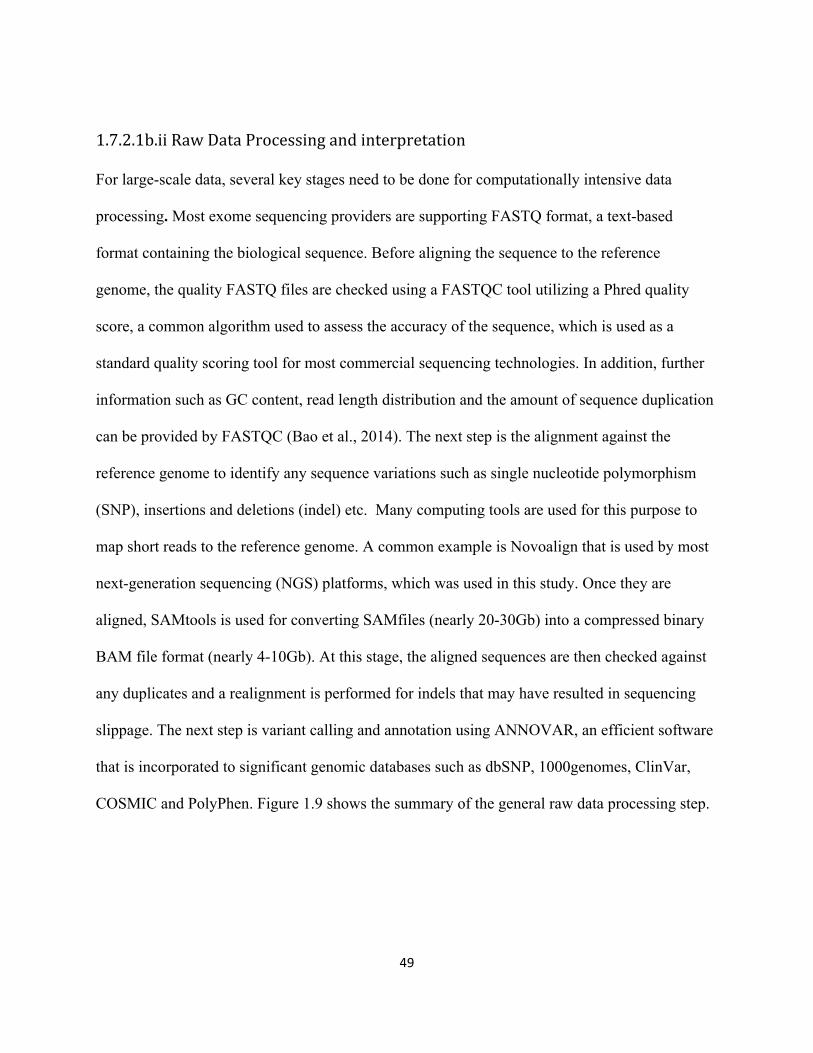
49
1.7.2.1b.iiRawDataProcessingandinterpretation
For large-scale data, several key stages need to be done for computationally intensive data
processing. Most exome sequencing providers are supporting FASTQ format, a text-based
format containing the biological sequence. Before aligning the sequence to the reference
genome, the quality FASTQ files are checked using a FASTQC tool utilizing a Phred quality
score, a common algorithm used to assess the accuracy of the sequence, which is used as a
standard quality scoring tool for most commercial sequencing technologies. In addition, further
information such as GC content, read length distribution and the amount of sequence duplication
can be provided by FASTQC (Bao et al., 2014). The next step is the alignment against the
reference genome to identify any sequence variations such as single nucleotide polymorphism
(SNP), insertions and deletions (indel) etc. Many computing tools are used for this purpose to
map short reads to the reference genome. A common example is Novoalign that is used by most
next-generation sequencing (NGS) platforms, which was used in this study. Once they are
aligned, SAMtools is used for converting SAMfiles (nearly 20-30Gb) into a compressed binary
BAM file format (nearly 4-10Gb). At this stage, the aligned sequences are then checked against
any duplicates and a realignment is performed for indels that may have resulted in sequencing
slippage. The next step is variant calling and annotation using ANNOVAR, an efficient software
that is incorporated to significant genomic databases such as dbSNP, 1000genomes, ClinVar,
COSMIC and PolyPhen. Figure 1.9 shows the summary of the general raw data processing step.
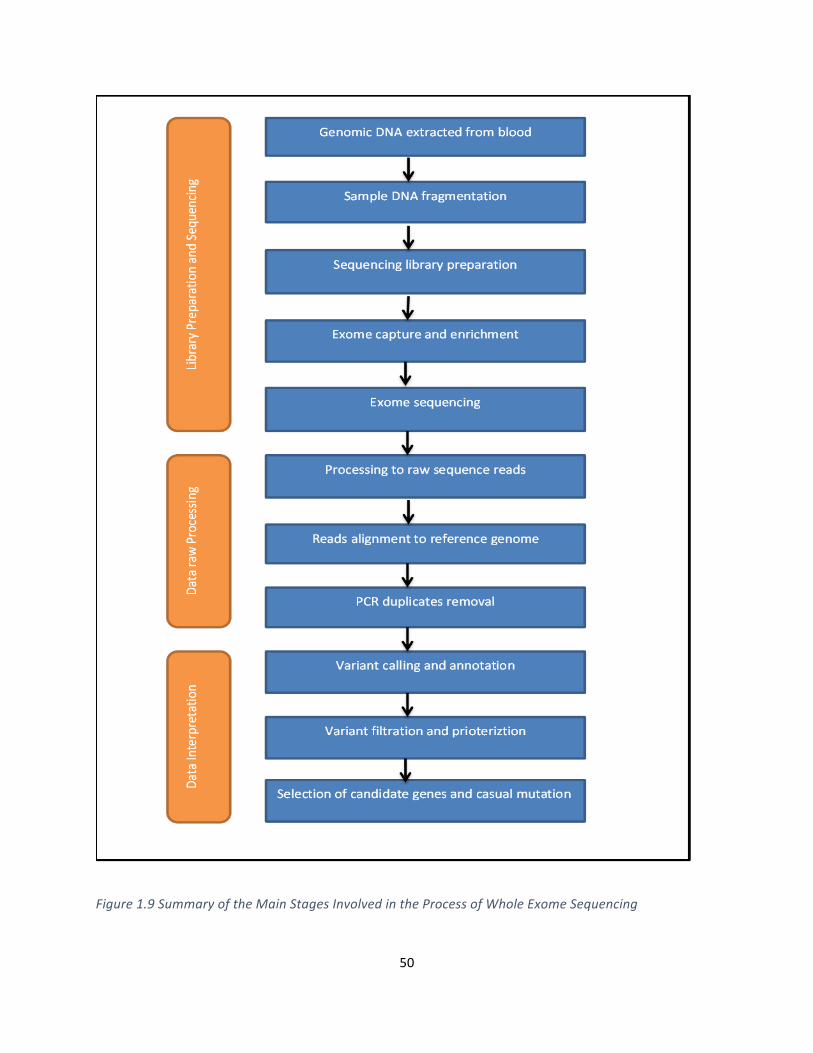
50
Figure1.9SummaryoftheMainStagesInvolvedintheProcessofWholeExomeSequencing
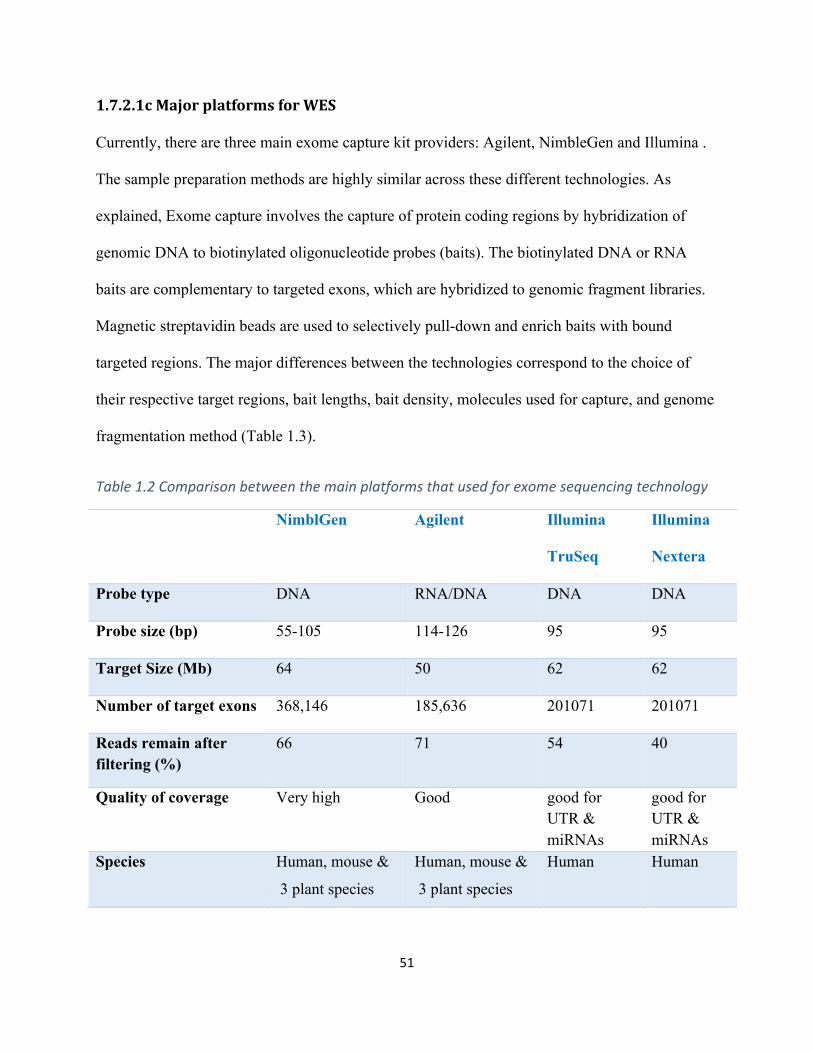
51
1.7.2.1cMajorplatformsforWES
Currently, there are three main exome capture kit providers: Agilent, NimbleGen and Illumina .
The sample preparation methods are highly similar across these different technologies. As
explained, Exome capture involves the capture of protein coding regions by hybridization of
genomic DNA to biotinylated oligonucleotide probes (baits). The biotinylated DNA or RNA
baits are complementary to targeted exons, which are hybridized to genomic fragment libraries.
Magnetic streptavidin beads are used to selectively pull-down and enrich baits with bound
targeted regions. The major differences between the technologies correspond to the choice of
their respective target regions, bait lengths, bait density, molecules used for capture, and genome
fragmentation method (Table 1.3).
Table1.2Comparisonbetweenthemainplatformsthatusedforexomesequencingtechnology
NimblGen Agilent Illumina
TruSeq
Illumina
Nextera
Probe type DNA RNA/DNA DNA DNA
Probe size (bp) 55-105 114-126 95 95
Target Size (Mb) 64 50 62 62
Number of target exons 368,146 185,636 201071 201071
Reads remain after filtering (%)
66 71 54 40
Quality of coverage Very high Good good for UTR & miRNAs
good for UTR & miRNAs
Species Human, mouse &
3 plant species
Human, mouse &
3 plant species
Human Human
52
1.7.2.1d the strategy of exome sequencing for Mendelian inherited disorders
Finding rare disease-causing alleles among such a huge number of exome variants is a major
challenge when using exome sequencing to identify the novel disease genes in both Mendelian
and complex disorders. Exome sequencing typically detects more than 20,000 single nucleotide
variants; however, the vast majority (~95%) of these variants are non-pathogenic polymorphisms
which are already present in the human public databases. Several factors are included in
selecting the effective strategy for identifying the disease-causing rare variants against the exome
background. These include: the expected pattern of inheritance according to the family pedigree
or population structure; whether a phenotype is supposed to be caused by inherited or de novo
variation; and the degree of locus heterogeneity for the trait. Therefore, the possible novelty for
any suspected rare variants is assessed by filtering against the polymorphism database such as
dbSNP and 1000 Genomes Project as well as in-house control databases. This step is expected to
eliminate candidate variants down to nearly 2% of the total exome variants for each individual.
Further filtering is used to reduce the candidate genes to keep only the high-priority candidates
(if not only one) by identifying and selecting those genes circulating in the disease pathway and
exclude the others.
This allows for the sequencing of only a modest number of affected individuals, and then applies
discrete filtering to the data to reduce the number of candidate genes to a minimum number of
high-priority candidates (if not to a single one). This strategy has been effectively applied for
rare Mendelian disorders (Bamshad et al., 2011). Some limitations are involved in applying this
method, however. First, a small number of pathogenic alleles might be contained within dbSNP
which are filtered out by this method. Second, the increase in the number of sequenced exomes
and genomes could affect minor allele frequency (MAF) and therefore truly pathogenic variants
53
that might segregate in the general population at low but appreciable frequencies might be
mistakenly eliminated.
1.7.2.2 Targeted Exome Sequencing
As the NGS technology is rapidly advancing and because whole-genome and exome sequencing
techniques are still expensive, targeted exome and gene panel capture have been recently
developed to assess gene identification and genetic diagnosis. The gene multiple panels can be
divided into two main categories i) panels which are designed to cover the associated genes for
specific disorders and ii) those that are for wider categories of phenotypes or disorders ranging
from nearly 10 genes up to hundreds or even thousands of genes (Zemojtel et al., 2014)
Generally, these targeted panels are characterized by high accuracy and deep coverage.
Furthermore, this option is more cost effective compared to the broader approaches. In addition,
the data size resulting from these targeted panels is smaller than the more comprehensive
approaches such as the whole exome or whole genome sequencing; therefore, the data analysis
will be much easier and faster as well. Illumina have developed different panels that target
specific regions of the genome in any given sample. These focused panels are designed to cover
a select set of genes or gene regions that have been associated with a specific phenotype or even
number of phenotypes. A well-known example of these panels is the ‘Trusight One’ panel which
contains more than 4,800 genes involved in the clinical phenotypes associated with inherited
human disorders. This panel is characterized by covering the most commonly ordered molecular
assays and it was applied in my project to investigate patients diagnosed with multiple pterygium
syndrome or foetal akinesia (more details in Chapter 6)
54
Hence, by selecting this option, the focus has been shifted from the whole exome to enriched
regions of the exome/genome that is relevant to human genetic diseases. This interpretable
region can thus be referred to as the disease-associated genome (DAG). These multiple genes
can be run across many samples in parallel rather than running multiple separate assays in order
to both save time and reduce the associated cost. This panel was successfully used in many
recent studies that have investigated the Mendelian disorders and it has shown a high diagnostic
rate. For instance, in a recent Japanese study, they applied the Trusight One panel to examine 17
families with specific known diagnoses for different mendelian diseases such as Sotos syndrome,
and Joubert syndrome to test the efficiency of this panel (Okazaki et al., 2016).
The main disadvantage of this targeted exome approach is that; it can only detect the mutations
in genes previously implicated in the studied disease, thus no novel genes can be detected out of
those involved genes. Therefore, if a mutation responsible for the examined disease is positioned
in a novel gene, this approach cannot successfully expedite genetic diagnosis. In this case, whole
exome/genome sequencing would be the better option since it is designed to include all the
coding genes (either the previously implicated ones or even the novel ones). In the case of
disease caused by chromosomal mutations such as structural rearrangement or large copy
number variations the best approach to be applied is still the whole genome sequencing because
neither whole exome nor the targeted exome would be able to detect these variants (Gorokhova
et al., 2015).
55
In my project we applied the targeted clinical Trusight One panel to investigate 53 patients who
were affected with foetal akinesia because of the high diagnostic rate of this panel as well as the
reduced cost compared to the whole exome option as the number of patients in the study was
large.
1.7.2.3 Sequencing depth and breadth of coverage
Genomic technologies are developed continuously with the focus on providing a highly qualified
sequencing at a lower cost per base so that the high cost of great depth sequencing can be
reduced as well. This reduction of the cost per run allows for increasing the number of sequenced
exomes/genomes which ultimately increases the statistical power of disease-gene identification.
The coverage represents the average number of times for each nucleotide base to be sequenced,
while the breadth of coverage is related to the percentage of sequencing a targeted region of
interest (Sims et al. 2014). Good coverage is important to eliminate any sequencing errors or
false positive that could occur during the sequencing process, therefore, the more the read is
sequenced the least error can happen, which leads to more accurate and reliable data. Many
studies have focused on investigating the maximum number of variants that can be identified at a
low coverage rate to enable researchers to access a highly accurate and efficient degree of
sequencing data at the lowest cost. For example, a study published in 2008 identified that
sequencing a human genome using short read methodology at a read depth of 15X, resulted in
detecting all the homozygous single nucleotide variants while the same number of heterozygous
SNVs were detected at a read depth of 33X (Bentley et al., 2008). Recently, it was reported that
the read depth of 35X was sufficient to achieve highly covered reads and this has become the
standard for many sequencing projects (Sims et al., 2014).
56
Although the cost of NGS has rapidly decreased WGS remains a costly option for analysing an
individual sample. This disadvantage has made exome sequencing a preferable option for many
researchers besides the other advantages already mentioned (such as the short time expended on
analysis and less storage requirements). Analysing some data from the 1,000 genomes project
showed that the use of WGS with the depth coverage of 20X across 95% of the consensus
coding sequence (CCDS) exons required 200Gb of raw input sequencing (YRI and CEU
samples) whereas similar percentage of targeted CCDS (~90% of the Agilent capture region and
~85% of the NimbleGen capture region) with similar depth required less than 20Gb of raw input
from WES. Therefore, exome sequencing achieves at least the same efficiency as whole genome
sequencing with 10-20 folds less raw sequence data (Parla et al., 2011). Solution based hybrid
capture enrichment is the most preferred option by many genetic researchers. On the other hand,
exome sequencing has few disadvantages that need to be addressed such as uniformity of
coverage, target specificity and consistency.
1.8 Summary of genetic testing types and their applications in genetic diagnosis
NGS technology has made different types of tests available for the genetic diagnosis including
single-gene tests, gene panel tests, exome sequencing and genome sequencing. Selecting the
appropriate test is a big challenge to giving a successful genetic diagnosis. In fact, a review study
published in 2015 has critically discussed the approach of selecting the best genetic test for the
examined individual. According to the study, single-gene testing is mostly chosen in the case of
a minimal locus heterogeneity with a clear clinical diagnosis based on distinctive clinical
features. Also, an existing association between the diagnosed disease and a disease-causing gene
needs to be already established. Gene panel testing is more cost-effective than a single-gene
approach and it should be the suitable test for heterogeneous disorders with otherwise unclear
57
clinical diagnoses such as disorders with overlapping phenotypes or disorders which share
specific manifestations but in which the overall phenotypes are different. Such disorders are
generally associated with multiple genes.
Exome Sequencing (ES) and Genome Sequencing (GS) normally selected for the disorders with
extreme heterogeneity and de novo mutations are the major mutation. Also, it is a good option in
the case of a diagnosis which is very difficult to make or when there are at least two possible
phenotypes for one patient. In addition, if there is no key phenotypic feature is present at the time
of requesting the testing so the real underlying cause of the disease will be very difficult to
identify. Examples of these disorders are Autism and Kabuki syndrome. ES was specifically
selected in my project for studying foetal akinesia because of the high heterogeneity of the
disorder plus because it has many overlapping phenotypes. It has an advantage over the gene
panel in that it is less biased regarding which set of genes to test as the latter assumes that the
abnormal clinical features are restricted to be associated within the included genes in the panel
itself. Factors such as technical limitations involved in NGS technology, the risk of false positive
especially for insertion or deletion and the weak coverage for a particular area make both ES or
GS are not completely independent methods. Because of this for diagnosis, aCGH and Sanger
sequencing are currently required as a complement method to cover the shortcomings of NGS in
order to detect the full spectrum of mutations and to validate those findings which are identified
by NGS approaches. In this way the differences and difficulties associated with the used
technology, test interpretation, clinical significance, and ethical problems, need to be well
considered by the clinician who selects the gene test because they ultimately affect the correct
order and the diagnosis for the patient (Xue et al., 2015)
58
1.9 Exome sequencing for the studied disorders in this project
As discussed earlier, exome sequencing is well justified as an efficient approach to identify the
genetic causes underlying rare Mendelian disorders. This proven efficiency is supported by a
range of genetic evidences. First, many genetic mapping studies that have been applied on the
coding part of the genome have successfully identified the candidate genetic region which
contain the disease-causing variants of monogenic disorders. Second, the majority of pathogenic
variants associated with Mendelian disorders are located within the exome and therefore they are
more likely to disrupt the protein function. Third, it has been found that rare coding variants
could have pathogenic effect in most rare disorders while the noncoding variants are less likely
to have any negative effect even when located in a conservative area. Accordingly, it has become
a standard tool to discover genes in these disorders.
A good example for these Mendelian disorders is the autosomal recessive disorders. Typically,
the affected individual is most likely a homozygous carrier or in some cases is compound
heterozygous with the pathogenic mutation while the parents are heterozygous carriers. Large
families with multiple affected siblings compared with healthy individuals are the preferred
subjects to carry out the genetic investigation for Mendelian disorders as they provide the
opportunity to perform segregation analysis. This technique showed higher efficiency when it
has been used in consanguineous families as their offspring are at high risk of carrying
homozygous recessive mutations from a common ancestor. In 2009, the technique was applied to
investigate Miller syndrome (OMIM263750), an autosomal recessive disorder, successfully
identifying the causal variants in the DHODH gene (Ng et al., 2010). Furthermore, the technique
was also performed to diagnose two affected siblings of a consanguineous Pakistani family
diagnosed with congenital oligodontia, another rare autosomal recessive, utilising the SureSelect
59
Human all Exon 50 Mb kit. In the results, a homozygous stop codon was identified in both
individuals in the SMOC2 gene, which encodes the SPARC related modular calcium binding 2
protein (OMIM # 607223) (Alfawaz et al., 2013). Another example for the efficiency of exome
sequencing was a work published by Walsh and others at 2010, who applied exome sequencing
together with homozygosity mapping in a consanguineous Palestinian family diagnosed with
congenital deafness. A pathogenic mutation (p.Arg127*) was identified in the GPSM2 gene and
was then reported as a cause of the disease in this particular family (Walsh et al., 2010).
Many other studies that have applied this method have produced promising results for a genetic
diagnosis which can provide helpful information to the genetic counselling and diagnosis to both
affected and unaffected carriers. Also, these disease-causing genes or disease variants can be
used in identifying the risk identified by genetic screening tests such as pre-conceptive and
prenatal screening. In addition, it can provide useful information which can be used in treatment
approach.
60
1.10 Aim of the Project:
In my project, I wanted to investigate the role of DNA sequencing in two different examples of
rare Autosomal recessive disorders; congenital oligodontia, and lethal multiple pterygium
syndrome (LMPS)/Fetal Akinesia. The primary shared aim of my project was to identify disease-
causing mutations of these particular phenotypes in view of the frequency of recessive diseases
in the Saudi Population Furthermore I was particularly interested in consanguineous families
likely to have recessively inherited cases of these phenotypes. Initially, I used autozygosity
mapping and Sanger sequencing of single genes and then I proceeded to utilise NGS technique in
particularly the targeted enriched methods (whole exome sequencing and clinical exome
sequencing) to demonstrate the efficiency of this method in identifying the causing genes which
underlie rare mendelian disorders.

61
ChapterTwo:Materials&Methods
62
2.1 Acquisition of patients
2.1.1 Patients In this project, I studied two different congenital disorders. In the first year I investigated
Oligodontia patients while during the second and third year, I studied patients diagnosed with
Fetal Akinesia/ Lethal Multiple Pterygium syndrome. Molecular genetic investigations were
undertaken in each disorder in which the underlying genetic causes were unknown yet. In both
examined disorders, number of patients from different families most of them were
consanguineous have been involved and they were from a variety of ethnic backgrounds
(Pakistani, North Indian, Bangladeshi and mixed European descent, Arabs and Turkish). Also
few non consanguineous families were also involved. When available, DNA from unaffected
family members was studied to check the segregation of interesting genetic variants. All of the
families recruited in this project were initially patients seen that had been counseled by the West
Midlands Clinical Genetics department. All of the clinical information available about these
patients was therefore collected and provided by the West Midlands clinical genetics department
2.1.1.i Congenital Oligodontia
Patients affected with congenital oligodontia from Six different consanguineous families were
selected for studying the genetic basis of this disorder.Peripheral blood was obtained from the
probands, their parents and, where possible, affected and unaffected siblings. Aa clinical dentist
who examined the panoramic radiographs in the Birmingham Dental Hospital confirmed the
diagnoses of congenital oligodontia in these patients. Dental examinations revealed congenital
oligodontia i.e. six or more missing teeth were reported in one affected individual from each
family.. Medical diagnosis was confirmed by a clinical dentist via clinical examinations and
panoramic radiographs in Birmingham Dental Hospital.
63
2.1.1.ii Fetal Akinesia
A total of 66 families that displayed clinical features of either multiple pterygium syndrome or
fetal akinesia were selected for molecular genetic studies due to the phenotypic overlap between
the two disorders. There was at least one individual in each of 36 families that displayed features
consistent with non-syndromic FADS/LMPS without a known underlying genetic cause, while
the remaining 30 families were diagnosed with the milder EVMPS phenotype. Consanguinity
was recorded in nearly 50% of tested LMPS families and in only 20% of EVMPS families.
Clinical information including family history, ethnicity and pregnancy history was collected
from the families by clinical collaborators (Dr Julie Vogt, Professor Eamonn Maher and others).
Relevant phenotypic information such as brain scans and muscle biopsy results were recorded
where available.
2.1.2 Consent and ethics approval
Both studies have been approved by the South Birmingham Research Ethics Committee and the
clinical research followed the principles outlined by the Declaration of Helsinki in 1964. An
informed consent was obtained by the committee for all the families in all the studies in this
project
2.1.3 DNA extractions
All genomic DNAs used in this project were kindly extracted by West Midlands Regional
Genetics Molecular Genetics Laboratory mainly from blood samples, using Gentra System’s
Puregene DNA Purification method according to the manufacturer’s instructions which based on
salting-out precipitation. After cell lysis, the protein is precipitated, followed by DNA
precipitation which is washed then with ethanol to be hydrated. Then, DNA will be ready to store
at -80°C.
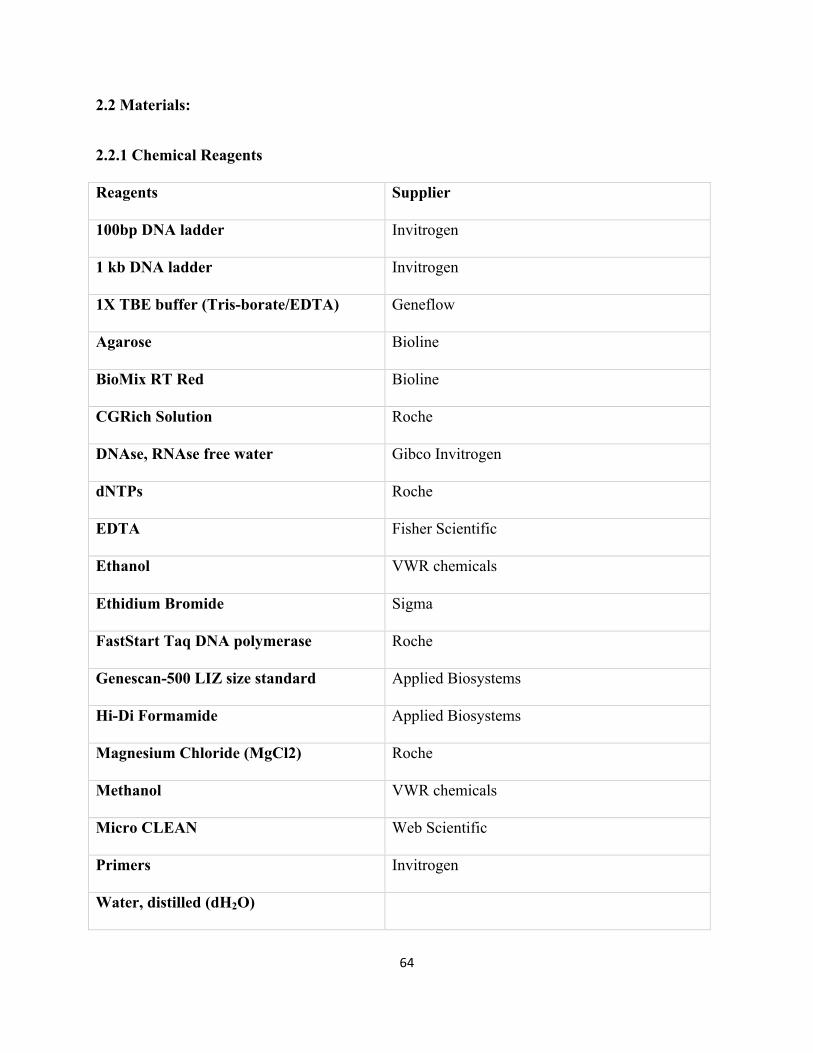
64
2.2 Materials:
2.2.1 Chemical Reagents
Reagents Supplier
100bp DNA ladder Invitrogen
1 kb DNA ladder Invitrogen
1X TBE buffer (Tris-borate/EDTA) Geneflow
Agarose Bioline
BioMix RT Red Bioline
CGRich Solution Roche
DNAse, RNAse free water Gibco Invitrogen
dNTPs Roche
EDTA Fisher Scientific
Ethanol VWR chemicals
Ethidium Bromide Sigma
FastStart Taq DNA polymerase Roche
Genescan-500 LIZ size standard Applied Biosystems
Hi-Di Formamide Applied Biosystems
Magnesium Chloride (MgCl2) Roche
Methanol VWR chemicals
Micro CLEAN Web Scientific
Primers Invitrogen
Water, distilled (dH2O)
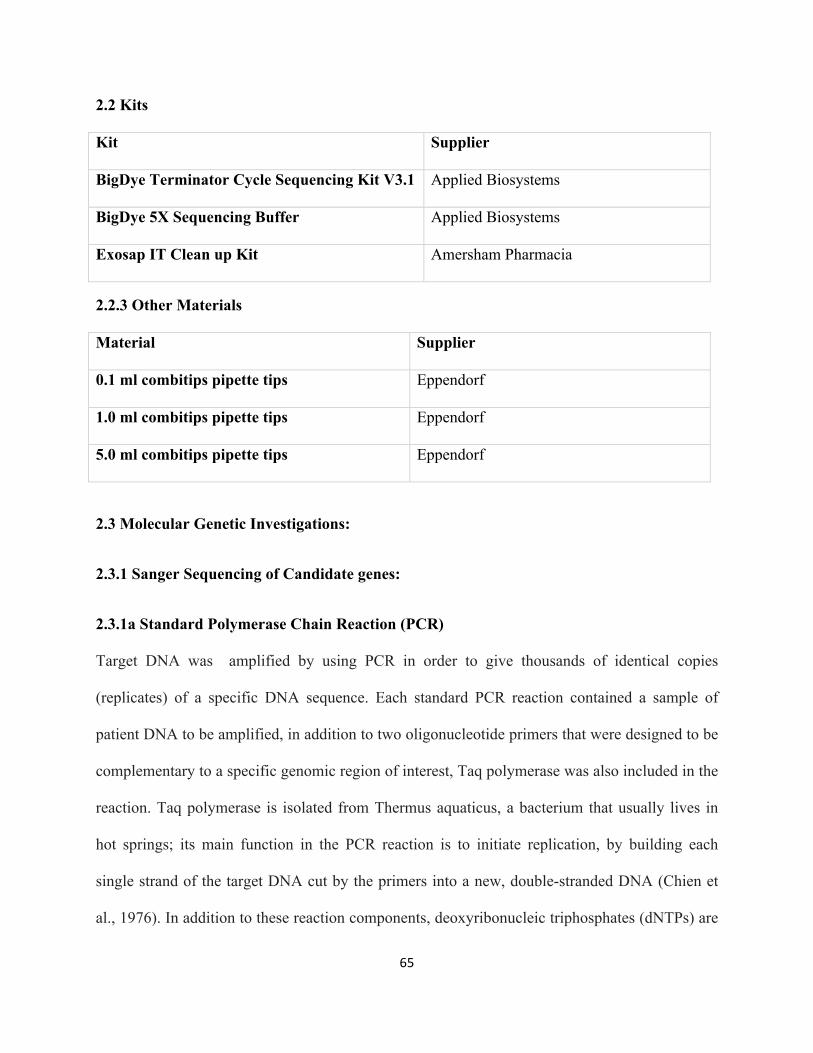
65
2.2 Kits
Kit Supplier
BigDye Terminator Cycle Sequencing Kit V3.1 Applied Biosystems
BigDye 5X Sequencing Buffer Applied Biosystems
Exosap IT Clean up Kit Amersham Pharmacia
2.2.3 Other Materials
Material Supplier
0.1 ml combitips pipette tips Eppendorf
1.0 ml combitips pipette tips Eppendorf
5.0 ml combitips pipette tips Eppendorf
2.3 Molecular Genetic Investigations:
2.3.1 Sanger Sequencing of Candidate genes:
2.3.1a Standard Polymerase Chain Reaction (PCR)
Target DNA was amplified by using PCR in order to give thousands of identical copies
(replicates) of a specific DNA sequence. Each standard PCR reaction contained a sample of
patient DNA to be amplified, in addition to two oligonucleotide primers that were designed to be
complementary to a specific genomic region of interest, Taq polymerase was also included in the
reaction. Taq polymerase is isolated from Thermus aquaticus, a bacterium that usually lives in
hot springs; its main function in the PCR reaction is to initiate replication, by building each
single strand of the target DNA cut by the primers into a new, double-stranded DNA (Chien et
al., 1976). In addition to these reaction components, deoxyribonucleic triphosphates (dNTPs) are
66
also included, as they are the building blocks needed to create a new DNA strand. The dNTPs
added consist of an equal mixture of four dinucleotide triphosphates: dATP, dTTP, dCTP and
dGTP. Finally, 10X PCR Buffer II and MgCl2 solution are also included in the raction in order
to provide a suitable environment and versatility for the reaction.
Based on thermal cycling, each PCR consists of three main steps: denaturation, annealing and
finally extension (elongation). Denaturation is achieved by heating the reaction to high
temperatures (~95C’), which causes the disruption of the hydrogen bonds that hold the double
strands of DNA together, resulting in the formation of single stranded DNA. The reaction
temperature is then lowered to 50–65 °C, to allow the primers to anneal to the single-stranded
DNA template. The ideal annealing temperature differs for each primer depending on a number
of factors, including the CG% content of the primer sequence and the primer length. Taq
polymerase enzyme normally works at temperatures of around 72 °C, which allows it to
synthesize a new DNA strand which is complementary to the DNA template strand.
2.3.1b Primer Design:
Initially, primers were designed to bind to genomic sequences, which were approximately 20-80
nucleotides upstream or downstream from encoding exons. Primers were were designed to
amplify all the coding exons of the targeted genes plus intron-exon boundaries. This was mostly
achieved by using primer design programs such as ExonPrimer and Primer3
(https://ihg.gsf.de/ihg/ExonPrimer.html) after obtaining the genomic sequence of the gene of
interest from Ensemble browser (http://www.ensembl.org/index.html). The length of the primers
designed varied between 18-26bp. The annealing temperature for each primer was calculated
manually using the following formula: (Annealing temperature = 60.9 + 0.41 x (%GC) –
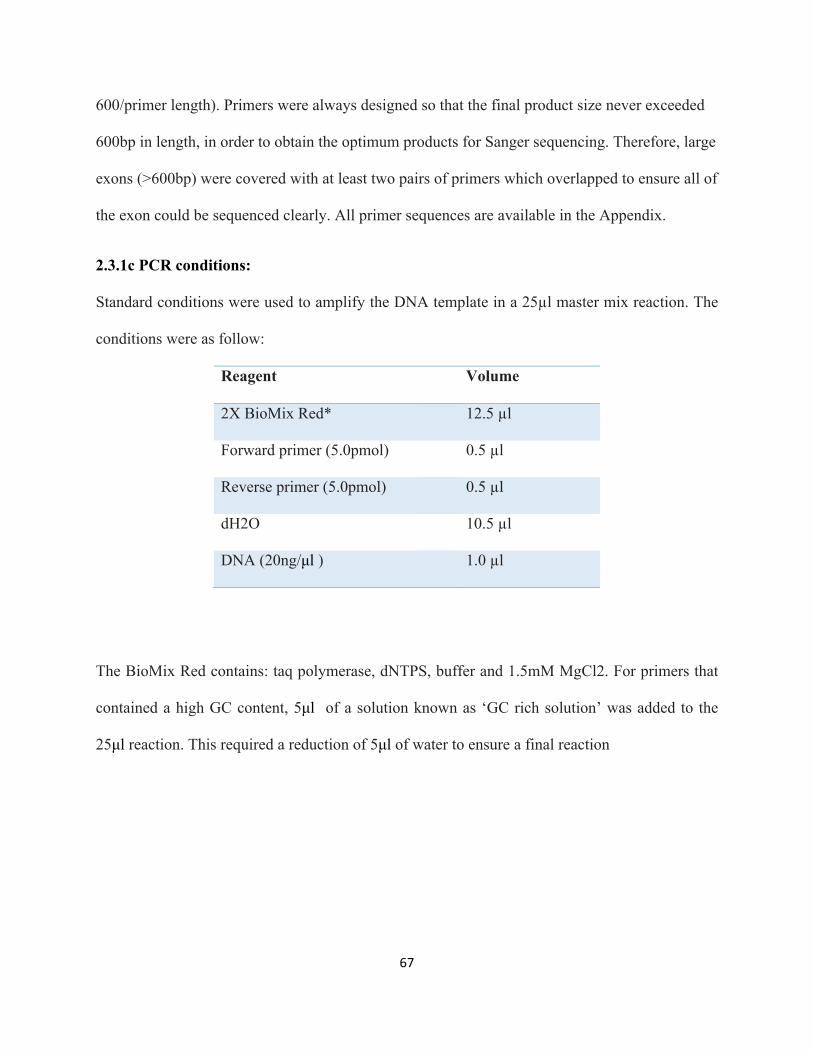
67
600/primer length). Primers were always designed so that the final product size never exceeded
600bp in length, in order to obtain the optimum products for Sanger sequencing. Therefore, large
exons (>600bp) were covered with at least two pairs of primers which overlapped to ensure all of
the exon could be sequenced clearly. All primer sequences are available in the Appendix.
2.3.1c PCR conditions:
Standard conditions were used to amplify the DNA template in a 25µl master mix reaction. The
conditions were as follow:
Reagent Volume
2X BioMix Red* 12.5 µl
Forward primer (5.0pmol) 0.5 µl
Reverse primer (5.0pmol) 0.5 µl
dH2O 10.5 µl
DNA (20ng/µl ) 1.0 µl
The BioMix Red contains: taq polymerase, dNTPS, buffer and 1.5mM MgCl2. For primers that
contained a high GC content, 5µl of a solution known as ‘GC rich solution’ was added to the
25µl reaction. This required a reduction of 5µl of water to ensure a final reaction
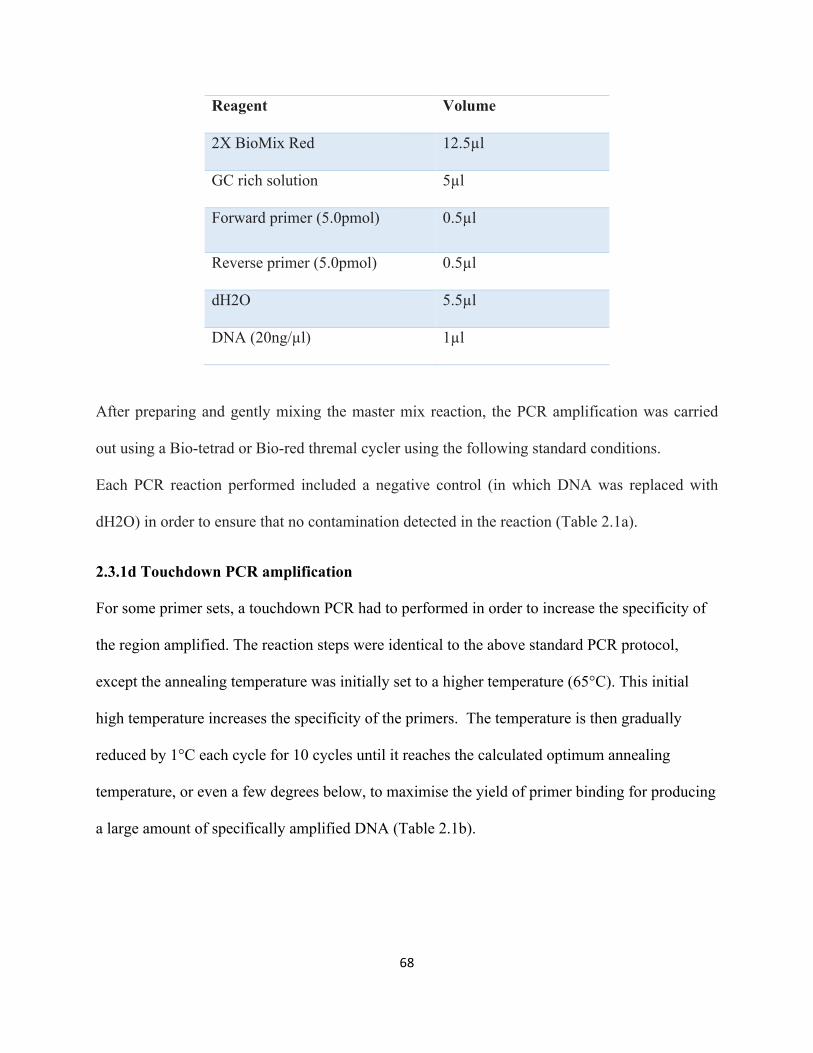
68
Reagent Volume
2X BioMix Red 12.5µl
GC rich solution 5µl
Forward primer (5.0pmol) 0.5µl
Reverse primer (5.0pmol) 0.5µl
dH2O 5.5µl
DNA (20ng/µl) 1µl
After preparing and gently mixing the master mix reaction, the PCR amplification was carried
out using a Bio-tetrad or Bio-red thremal cycler using the following standard conditions.
Each PCR reaction performed included a negative control (in which DNA was replaced with
dH2O) in order to ensure that no contamination detected in the reaction (Table 2.1a).
2.3.1d Touchdown PCR amplification
For some primer sets, a touchdown PCR had to performed in order to increase the specificity of
the region amplified. The reaction steps were identical to the above standard PCR protocol,
except the annealing temperature was initially set to a higher temperature (65°C). This initial
high temperature increases the specificity of the primers. The temperature is then gradually
reduced by 1°C each cycle for 10 cycles until it reaches the calculated optimum annealing
temperature, or even a few degrees below, to maximise the yield of primer binding for producing
a large amount of specifically amplified DNA (Table 2.1b).
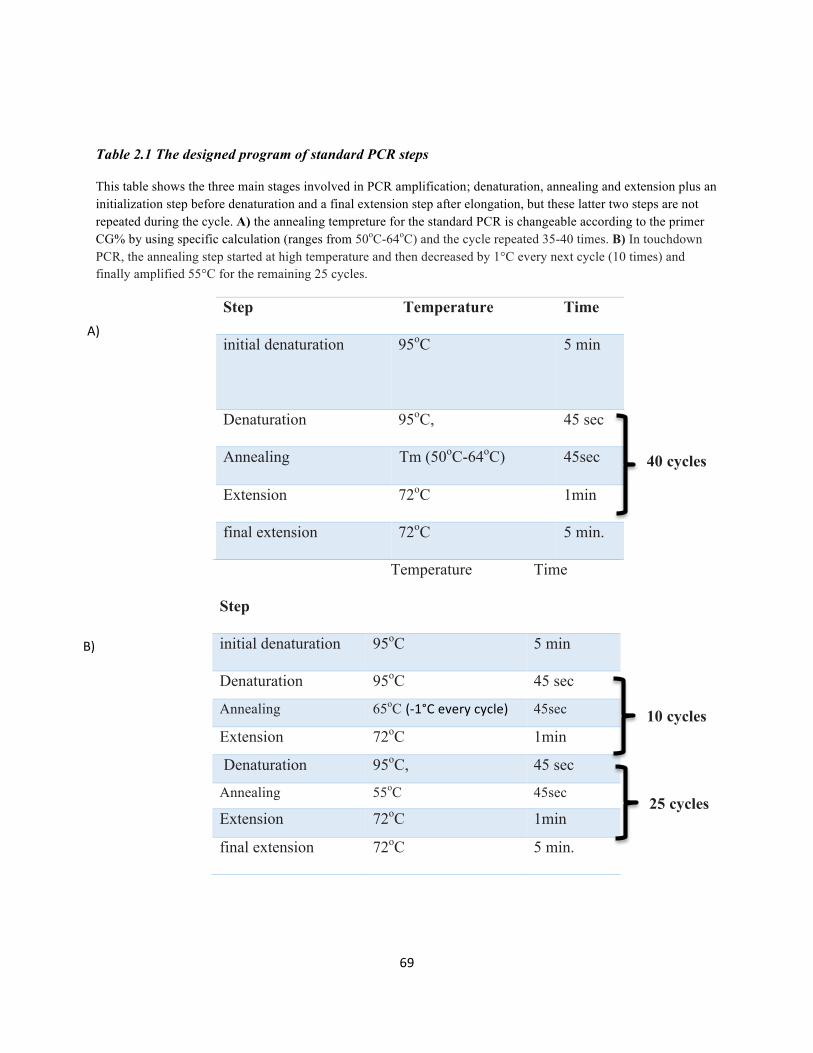
69
Table 2.1 The designed program of standard PCR steps
This table shows the three main stages involved in PCR amplification; denaturation, annealing and extension plus an initialization step before denaturation and a final extension step after elongation, but these latter two steps are not repeated during the cycle. A) the annealing tempreture for the standard PCR is changeable according to the primer CG% by using specific calculation (ranges from 50oC-64oC) and the cycle repeated 35-40 times. B) In touchdown PCR, the annealing step started at high temperature and then decreased by 1°C every next cycle (10 times) and finally amplified 55°C for the remaining 25 cycles.
Step Temperature Time
initial denaturation 95oC 5 min
Denaturation 95oC, 45 sec
Annealing Tm (50oC-64oC) 45sec
Extension 72oC 1min
final extension 72oC 5 min.
Step
Temperature Time
initial denaturation 95oC 5 min
Denaturation 95oC 45 sec
Annealing 65oC (-1°Ceverycycle) 45sec
Extension 72oC 1min
Denaturation 95oC, 45 sec
Annealing 55oC 45sec
Extension 72oC 1min
final extension 72oC 5 min.
40 cycles
25 cycles
10 cycles
A)
B)
70
2.3.1e. Gel electrophoresis:
After PCR, the products were checked on a 1.0 % horizontal agarose gel, which separates
fragments according to their molecular size. Visualising a single clear band at the correct size
ensures that the DNA is successfully amplified without contamination. DNA has a negative
charge; therefore, it should runs through the gel towards the positive anode.
To prepare a 1% agarose gel, 2 gm of agarose powder is weighed and added to 200 ml TBE
buffer (10X). The mixture is boiled in a microwave for 3 minutes and then cooled under tap
water, followed by the addition of 2 µl of ethidium bromide dye. Ethidium bromide is an
intercalating substance that reacts with the DNA and enables it to fluorescence under UV light,
therefore enabling the bands to be clearly visualized. The prepared gel mixture is poured into the
cast, with toothed combs to create wells, and it is left to cool and harden. After cooling, 4µl of
loading dye is mixed with 6µl of PCR product. The PCR-loading dye mix is added into the wells
of the gel. A DNA size marker (100- bp ladder) is also mixed with 2 µl from loading dye and
added to the first well. The gel is then run at 180V for 15-20 minutes. The electrophoresis is
stopped before the dye runs off the end of the gel. The gel is then viewed under a UV
transilluminator (LKB, UK). The gel can then be photographed using a gel documentation
system (CCD camera).
2.3.2DNAPurificationmethod
2.3.2a Exosap method
Prior to Sanger sequencing, PCR products that have successfully shown a band under the UV
light (working DNA) need to be cleaned up. This is done by using ExoSAP; a method used to
remove unwanted dNTPs and primers, while maintaining the target sequence.. The ExoSAP kit
71
contains a variety of components, including Exonuclease I, Antarctic Phosphatase and Antarctic
Phosphatase buffer.. In the experiment, for each 4µl of exosap, 6µl of PCR product was added
and mixed gently with a pipette. The microtitre plate including the ExoSap-PCR product mix is
then run on a tetrad or biometra PCR machine using a specific cleanup program, followed by an
incubation step at 37°C for 15 min. Subsequent inactivation of enzymes was achieved by
incubation at 80°C for 15 min.
2.3.2b Alternative method of clean-up (microCLEAN)
In most of the experiments in this thesis, the Exo-SAP-IT® PCR product clean up kit was used,
however, a different method using a reagent known as microCLEAN was also used in a large
number of the sequencing reactions. This was because microCLEAN was much cheaper and it
gives the same quality of sequence.
The protocol for microCLEAN involved adding 3µl of PCR product with an equal volume of
microCLEAN to a 96-well microtitre plate, and then incubated for few minutes at room
temperature and centrifuged then for 40 minutes at 4000RPM. This creates a DNA pellet on the
bottom of the well, while the supernatant contains all of the impurities. After centrifuging, the
supernatant is removed by centrifuging the plate upside-down on tissue paper at 500RPM for 30
seconds. The slow speed enables the supernatant to be removed while maintaining the pellet at
the bottom of the well.
2.3.3 Sanger Sequencing reaction
Sequencing was performed on whole genome amplified (WGA) DNA (acquired using Qiagen
REPLI-g kits) in each PCR plate as well as normal DNA controls. All of the fragments were
sequenced in both orientations (forward and reverse). Any candidate variants that were
identified during analysis were confirmed using original stock DNA samples, in order to avoid
72
any potentially false positive results that may have occurred using WGA DNA. PCR products
were sequenced using a standard BigDye Terminator v3.1 cycle sequencing method on an ABI
3730 automated genetic analyzer (Applied Biosystems). The data was processed by specific
sequencing analysis software (i.e. Bioedit and/or mutation surveyor). Sequence traces for each
amplified DNA sample was compared to a reference sequence obtained from the ENSEMBL
database.
After the clean up step described in sections 2.3.2a and 2.3.2b, a 10µl reaction mixture is
prepared with the following:
Two different master mixes are made; one for the forward primer and the other for the reverse
one. 4µl of exosap product is added to 6µl of the forward reaction. Another 4µl of the same
exosap product is taken and added to the reverse sequencing reaction. The reactions are put into
a thermocycler using a PCR program with conditions specific for sequencing. The cycling
conditions briefly involve a denaturing step for 3 minutes at 96°C, followed by an additional 30
cycles of 96°C for 30 seconds, 50°C for 15 seconds, and 60°C for 4 minutes.
After the sequencing run is complete, precipitation of the reaction is carried out. 1µl of
precipitation buffer (including 250mM EDTA) is added into each well. Following this, 30µl of
100% Ethanol is added to each reaction. The plate is then centrifuged for 20 minutes at 2000rpm,
which precipitates the DNA. The plate is then centrifuged upside-down in tissue paper at
400rpm/1minute, in order to remove the ethanol. Following this, 200µl of 70% ethanol is added
into each reaction, and again centrifuged for 20 minutes at 4000rpm. The plate is then
centrifuged once more, upside-down in tissue paper at 400rpm/1minute. Finally, 10µl of HiDi is
73
added to each well followed by a denaturing step is performed by heating the plate at 95°C for 5
minutes. Following denaturation, the plate is cooled by placing it on ice, which prevents the
products from reannealing. At this point, the plate can be loaded on the ABI 3730 automated
sequencer. The sequencing results can then be viewed using BioEdit software and Mutation
Surveyor to analyse the sequence.
2.3.4. Mutational screening
Sequence traces from each of the DNA samples analysed was compared to a reference sequence
obtained from the ENSEMBL database, using the Mutation Surveyor software. Any variants of
interest identified were then confirmed in original stock DNA of the patient.
2.3.5 Linkage Studies
In this project, two main approaches were used to conduct linkage studies: SNP microarrays and
microsatellite marker analysis
2.3.5a SNP genotyping:
Autozygosity mapping strategies were utilized to establish disease loci and identify novel
disease-causing genes in consanguineous families. To perform this, a genome-wide linkage scan
was undertaken in affected children and their unaffected siblings before this PhD started. This
was carried out using the Affymetrix 250K Human SNP Array 5.0 (Affymetrix UK Ltd) in order
to identify the shared common homozygous regions and/or genomic copy number variants. This
SNP array technology allows the simultaneous genotyping of >500,000 single nucleotide
polymorphisms (SNPs) for each individual’s DNA. This SNP genotyping study was kindly
performed by Louise Tee (a research laboratory technician) according to the manufacturer‘s
instructions (Affymetrix GeneChip Human Mapping SNP 5.0 Assay Manual).
74
In brief, 250ng of genomic DNA was digested with Sty 1 and Nsp 1 restriction enzyme. The Sty
and Nsp adaptor molecules were then ligated to the product using a DNA ligase enzyme. For
each DNA sample, PCR reactions were set up (Sty-3 reactions and Nsp-4 reactions) using a
universal PCR primer. Once amplified, PCR products were run on a 1.5% agarose gel according
to molecular size (sizes ranged from 200-1100bp). After that, products were pooled and cleaned
up using magnetic beads (Ampure). The amplified DNA was then fragmented into product sizes
of 200bp or less in length. Following this step, the amplified products were labelled and
underwent a hybridizationstepto the SNP 5.0 chip (Affymetrix) for 16-18 hours. The DNA
arrays were then washed and stained using a fluidics station (Affymetrix) A fluidics station. An
Affymetrix GeneChip Scanner 3000 with GCOS 1.3 software was used for scanning the chips.
Data analysis was then performed utilizing GCOS v3.0.2 software to derive SNP genotypes,
marker order and linear chromosomal location.
2.3.5b Microsatellite Markers:
2.3.5b.i the technique significance and primer design
Linkage analysis using microsatellite markers was, applied during the course of this study with
varying conditions. The specific details can be found in the appropriate chapters (Chapters 3 and
4). Microsatellites are di, tri or tetra tandem nucleotide repeats of DNA ranging from few a
repeats up to 50 times or more with known location in the genome. A set of polymorphic
microsatellite markers with high heterozygosity rates were selected using NCBI, UCSC and
Ensembl genome browsers which located within a candidate homozygous region. Linkage
analysis was carried out using fluorescently labelled microsatellite markers and an ABI PRISM
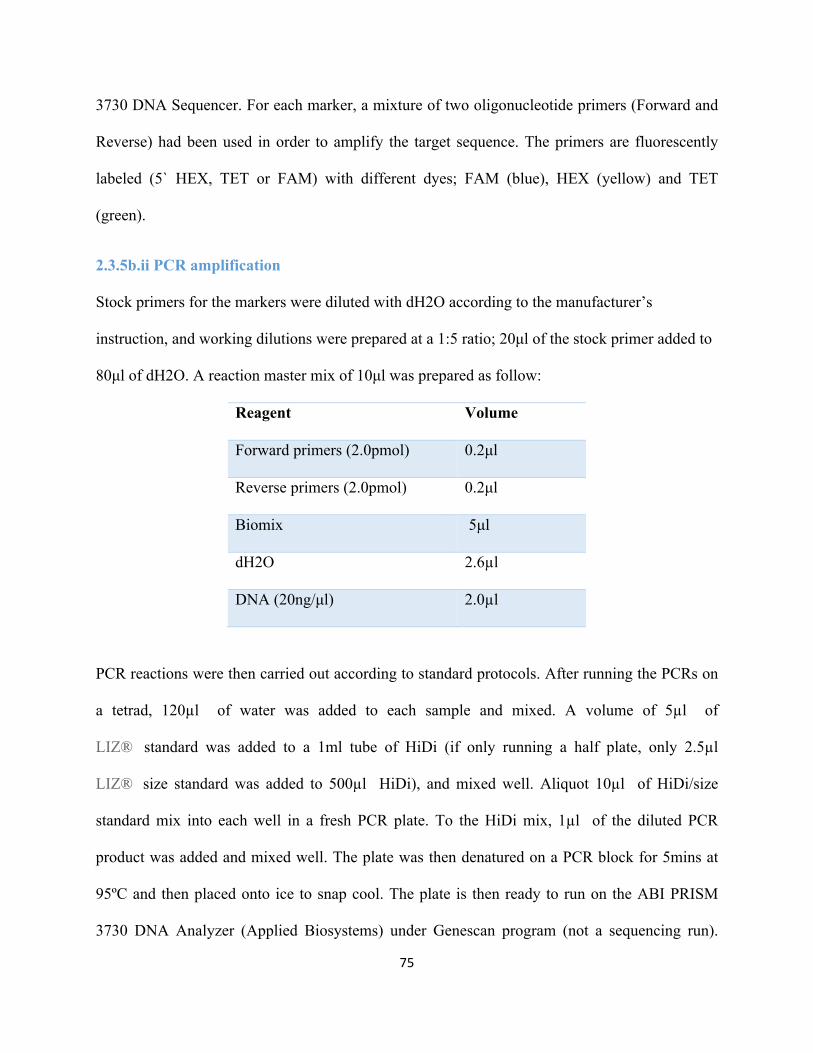
75
3730 DNA Sequencer. For each marker, a mixture of two oligonucleotide primers (Forward and
Reverse) had been used in order to amplify the target sequence. The primers are fluorescently
labeled (5` HEX, TET or FAM) with different dyes; FAM (blue), HEX (yellow) and TET
(green).
2.3.5b.ii PCR amplification
Stock primers for the markers were diluted with dH2O according to the manufacturer’s
instruction, and working dilutions were prepared at a 1:5 ratio; 20µl of the stock primer added to
80µl of dH2O. A reaction master mix of 10µl was prepared as follow:
Reagent Volume
Forward primers (2.0pmol) 0.2µl
Reverse primers (2.0pmol) 0.2µl
Biomix 5µl
dH2O 2.6µl
DNA (20ng/µl) 2.0µl
PCR reactions were then carried out according to standard protocols. After running the PCRs on
a tetrad, 120µl of water was added to each sample and mixed. A volume of 5µl of
LIZ® standard was added to a 1ml tube of HiDi (if only running a half plate, only 2.5µl
LIZ® size standard was added to 500µl HiDi), and mixed well. Aliquot 10µl of HiDi/size
standard mix into each well in a fresh PCR plate. To the HiDi mix, 1µl of the diluted PCR
product was added and mixed well. The plate was then denatured on a PCR block for 5mins at
95ºC and then placed onto ice to snap cool. The plate is then ready to run on the ABI PRISM
3730 DNA Analyzer (Applied Biosystems) under Genescan program (not a sequencing run).
76
Finally, the data obtained from the microsatellite products can be processed by GENEMAPPER
v3.0 software.
2.3.6 Next Generation Sequencing (NGS)
2.3.6a Whole exome sequencing
All whole exome sequencing data was provided by Prof. Eamonn Maher. Agilent SureSelect
Whole Exome hybrid capture was used to enrich these fragments for exomic sequences. For each
individual exome, nearly 25,000-30,000 variants were detected and have been analyzed and
screened using a specific strategy outlined in figure 2.1. In addition to whole exome sequencing,
the Trusight One panel kit (covering 4813 genes in total) was also used to acquire data in this
project. The reference genome hg18 was used for alignment. The SamTools software was
applied to sort through SNPs and small insertion deletions, and sequence variations. These were
screened against the 1000 Genomes Project and dbSNP131 to filter out common variants that are
already present at high frequencies in dbSNP131 or the 1000 Genomes project database in order
to highlight the novel variants which could be pathogenic (Ostergaard et al., 2011). Any variant
found on public databases with a frequency of > 1% in the population was considered common,
and therefore likely to be benign, and was therefore excluded. Also, synonymous variants that
result in the same amino acid product were excluded. The variations considered to be most
interesting were nonsense variants, frameshift and splice site variants because they are expected
to cause the most damage in the protein function and/or structure. For splicing variants, any
variant that was > 2bp from the exon-intron junction was excluded, as these were less likely to
affect splicing. This resulted in a list of candidate variants ranging from (10-50 variations). Any
novel variants that were present in candidate genes of interest, known to play a role in relevant
disease pathways were selected for further analysis. However, we expect one causing gene per
77
each family. As a supportive tool in selecting candidate genes, prioritization software such as
Toppgene software was used, which highlights the most relevant candidate genes according to a
number of pathological considerations for each studied disorder.
2.3.6b Assessment of Mutation Pathogenicity
A few important steps have been followed to interpret the probability of pathogenicity of the
detected variants. (a) The prediction of possible effects of any amino acid substitution was
achieved with specific bioinformatics tools such as PolyPhen-2 and SIFTS tools (e.g. putative
missense mutations). These tools mainly predict the consequences of amino acid substitutions
based on the levels of conservation of the region affected and whether the change has any
occurred within an important functional domain. (b) Identifying if candidate genes are involved
in relevant disease-associated pathways. For instance, for a disease that affects bone, a good
starting point is to assess the genes involved in bone development and/or additional members of
developmental pathways. . This can be achieved using genomic browsers (Ensembl,
GeneDistiller, Gene cards, OMIM, PubMed, UCSC and others). (c) Information available from
the literature (Mouse Genome Informatics, PubMed), in order to identify if the candidate genes
have been associated with similar phenotypes in any animal models. (d) Checking segregation in
parents and other family members using Sanger sequencing. (e) Further frequency information in
population-based controls for the candidate variants was sought from NHLBI Exome variant
server [http://evs.gs.washington.edu/EVS/] if available.
2.3.6c Definitions of the predictive bioinformatics tools
2.3.6c.i Polymorphism Phenotyping v2 (PolyPhen-2)
Polyphen-2 (http://genetics.bwh.harvard.edu/pph2) is a computational analysis tool for
78
Predicting the pathogenesis of missense variants on proteins. It uses a combination of two
parameters; protein structure and protein function, to calculate the score of pathogenicity.Scores
range from 0 (predicted to be benign) to 1 (predicted to be probably damaging).
2.3.6c.ii Sorting intolerant from tolerant (SIFT):
SIFT is a further bioinformatical tool (http://sift.jcvi.org/) used as a supportive tool beside
Polyphen to predicts whether an amino acid substitution affects protein function or not, based on
the degree of conservation of amino acid residues in sequence alignments derived from closely
related sequences, collected through PSI-BLAST. It detes whether the variation tolerant or not.
2.3.3c.iii. Splice site prediction by Neural Network
This is an in silico method (http://www.fruitfly.org) to predict the effect of a splice-site mutation
on gene splicing and proteins.
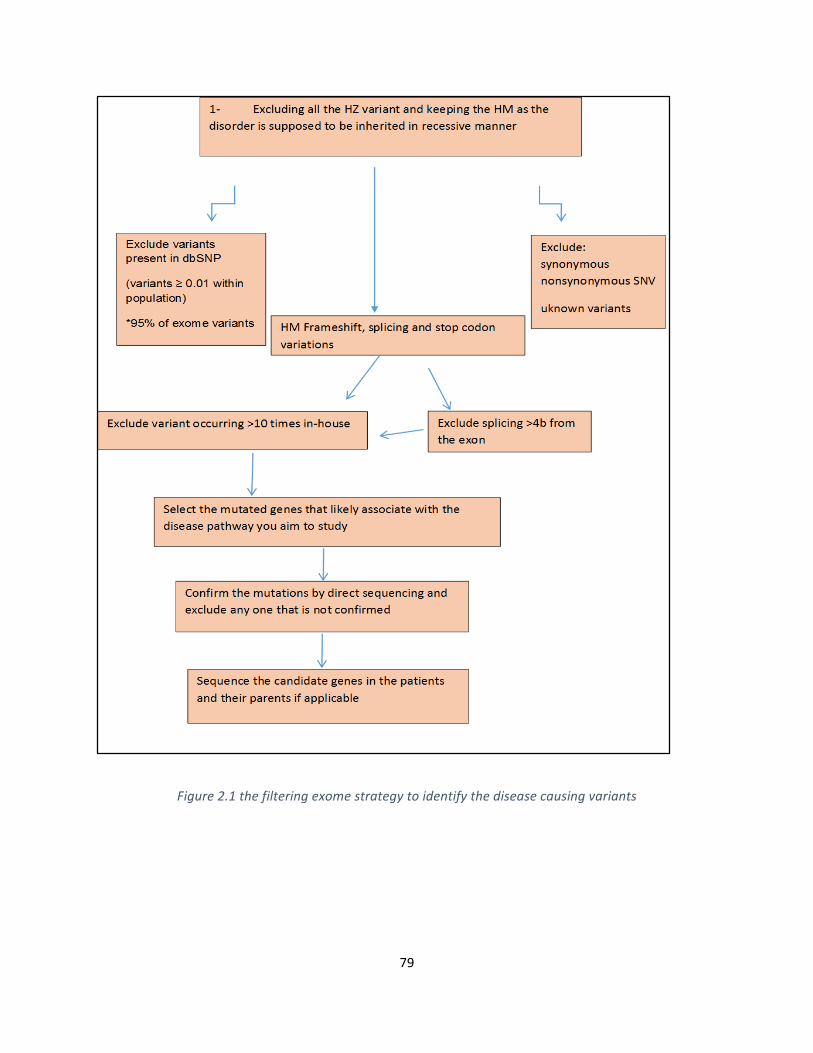
79
Figure2.1thefilteringexomestrategytoidentifythediseasecausingvariants
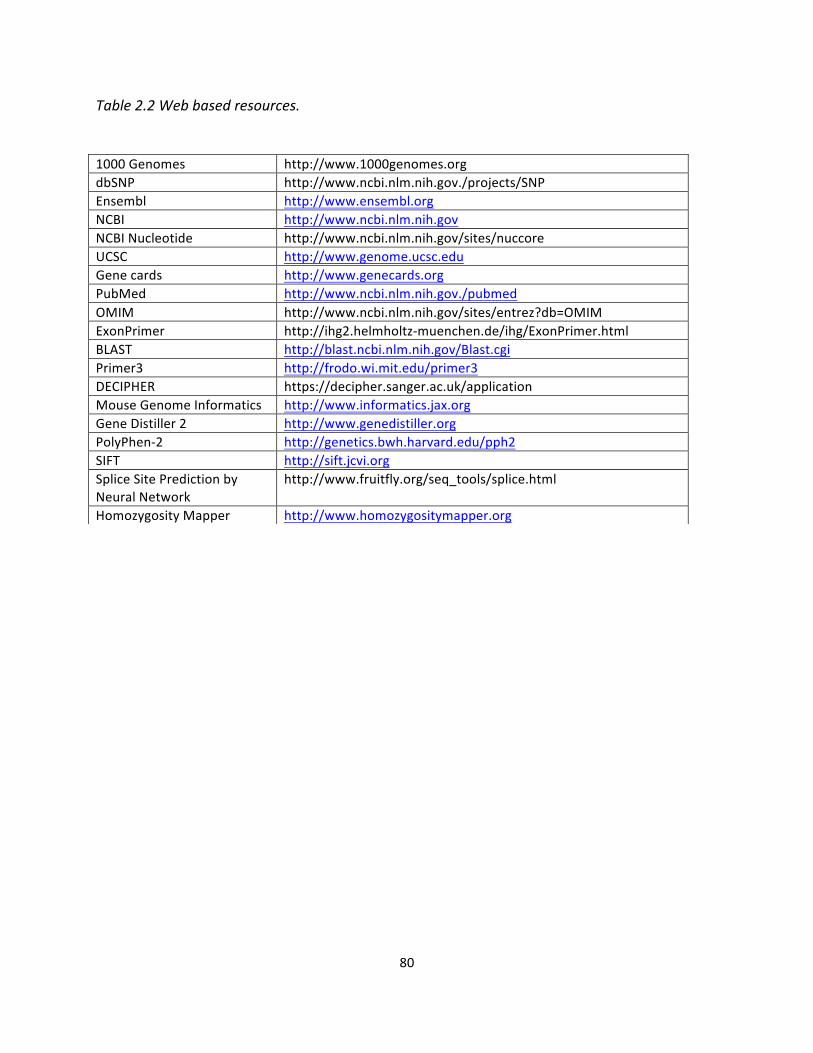
80
Table2.2Webbasedresources.
1000Genomes http://www.1000genomes.orgdbSNP http://www.ncbi.nlm.nih.gov./projects/SNPEnsembl http://www.ensembl.orgNCBI http://www.ncbi.nlm.nih.govNCBINucleotide http://www.ncbi.nlm.nih.gov/sites/nuccoreUCSC http://www.genome.ucsc.eduGenecards http://www.genecards.orgPubMed http://www.ncbi.nlm.nih.gov./pubmedOMIM http://www.ncbi.nlm.nih.gov/sites/entrez?db=OMIMExonPrimer http://ihg2.helmholtz-muenchen.de/ihg/ExonPrimer.htmlBLAST http://blast.ncbi.nlm.nih.gov/Blast.cgiPrimer3 http://frodo.wi.mit.edu/primer3DECIPHER https://decipher.sanger.ac.uk/applicationMouseGenomeInformatics http://www.informatics.jax.orgGeneDistiller2 http://www.genedistiller.orgPolyPhen-2 http://genetics.bwh.harvard.edu/pph2SIFT http://sift.jcvi.orgSpliceSitePredictionbyNeuralNetwork
http://www.fruitfly.org/seq_tools/splice.html
HomozygosityMapper http://www.homozygositymapper.org
81
ChapterThree:MolecularGeneticInvestigationofinheritedOligodontia
82
3.1 Disease background
The development of human teeth (known as odontogenesis) is a long, well-organized and
complex process. It is regulated by specific interactions between epithelial cells and neural crest-
derived mesenchymal tissues (THESLEFF and HURMERINTA, 1981). The process starts
prenatally after the first month of embryogenesis and continues through childhood before being
completed at some stage in adolescence (18-25 years) when the third molars appear (Aiello et al.,
1991, Nieminen, 2009). Congenital teeth agenesis is the most common form of abnormal teeth
development in humans and may be caused by inherited disorders or environmental factors such
as local trauma, chemical radiation and chemotherapy (De Coster et al., 2009). Genetic disorders
of ontogenesis are important to study and are the subject of this Results Chapter.
Based on previous reports, the prevalence of dental agenesis is about 6.76% across different
populations (Bozga et al., 2014)
3.1.1 Tooth developmental anomalies
Though much advancement has been made in understanding the developmental basis of tooth
formation, the mechanism of dental development and the entire molecular basis of inherited
tooth agenesis is still relatively unclear (Cobourne, 2007). Genetic tooth abnormalities normally
studied using three main ways. First, the clinical features of the anomaly such as number of
teeth, shape, or both. For instance, the presence of extra teeth (hyperdontia), the lack or reduction
in the teeth (tooth agenesis), however, the shape of teeth can be abnormal such as taurodontism
abnormality (enlargement of the body and pulp of the tooth). Second, determining whether the
teeth abnormality is part of another condition (syndromic) or isolated trait (non-syndromic).
Third, knowing the mode of inheritance by studying the family pedigree e.g. autosomal dominant
or recessive manner (Klein et al., 2013). Clinically, tooth agenesis is classified into three main
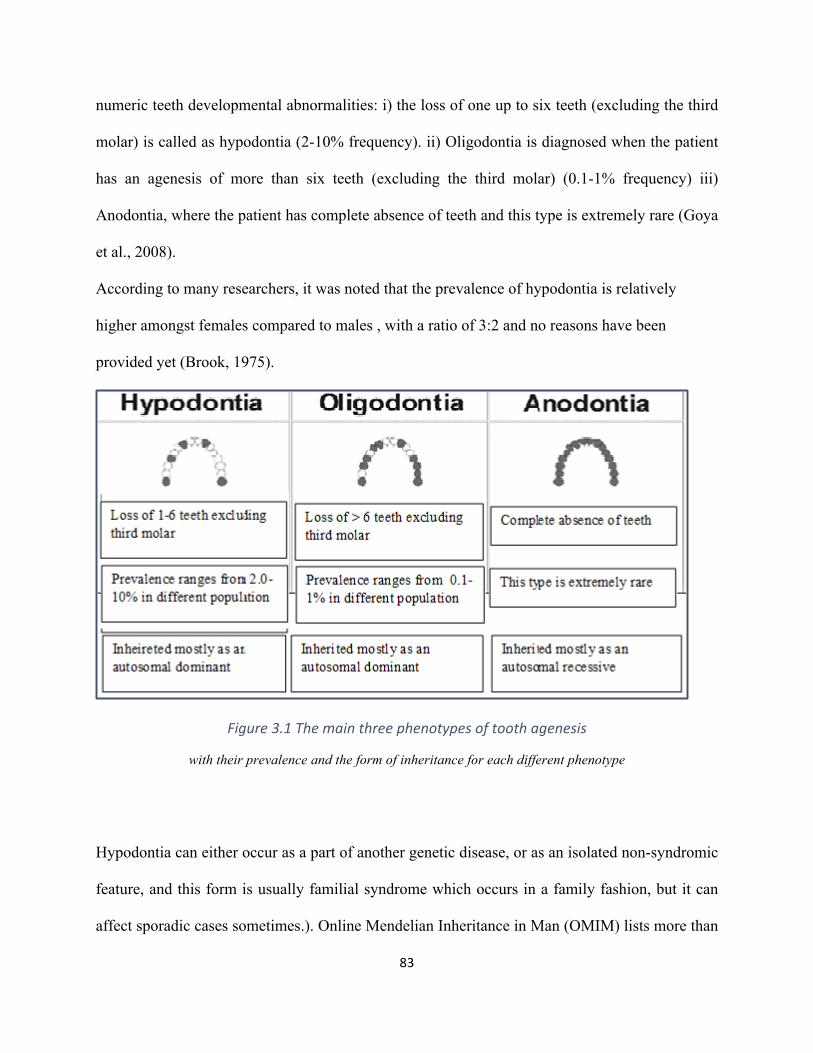
83
numeric teeth developmental abnormalities: i) the loss of one up to six teeth (excluding the third
molar) is called as hypodontia (2-10% frequency). ii) Oligodontia is diagnosed when the patient
has an agenesis of more than six teeth (excluding the third molar) (0.1-1% frequency) iii)
Anodontia, where the patient has complete absence of teeth and this type is extremely rare (Goya
et al., 2008).
According to many researchers, it was noted that the prevalence of hypodontia is relatively
higher amongst females compared to males , with a ratio of 3:2 and no reasons have been
provided yet (Brook, 1975).
Figure3.1Themainthreephenotypesoftoothagenesis
with their prevalence and the form of inheritance for each different phenotype
Hypodontia can either occur as a part of another genetic disease, or as an isolated non-syndromic
feature, and this form is usually familial syndrome which occurs in a family fashion, but it can
affect sporadic cases sometimes.). Online Mendelian Inheritance in Man (OMIM) lists more than
84
60 different syndromic disorders that included hypodontia phenotype as part of other clinical
phenotypes spectrum of anomalies. A lot of candidate genes have been identified in both types
(Cobourne, 2007, Klein et al., 2013).
3.1.2 The known causing genes of tooth Agenesis
The early stages of dental development are mostly similar in human and mouse, and the basic
findings that discovered by investigating mice models have been confirmed in humans as well.
Therefore, studying the dental mice genetics were very helpful approach to understand the
mechanism of dental development and the genes involved in the process using several knockouts
techniques. By knocking out PAX9, MSX1, PITX2, GLI2/3, P63 genes, Tooth development was
stopped at the bud stage, while when Dlx1/2 gene was knocked out, only maxillary molars were
lost (Matalova et al., 2008, Fleischmannova et al., 2008). More than 200 genes have been
implicated in tooth development (Jernvall and Thesleff, 2000) but the most common genes that
have been associated with dental agenesis are PAX9, MSX1, WNT10A and AXIN2 genes.
Mutations in these particular genes were mostly associated with the familial non-syndromic
hypodontia while other genes such as EDA, EDARADD, NEMO, P63 and others were reported in
sybdromic hypodontia (Shimizu and Maeda, 2009). Most disorders of odontogenesis are
inherited in an autosomal dominant manner (Larmour et al., 2005) though autosomal recessive
and X-linked patterns can exist in some cases (Cobourne, 2007) In this project, I primarily
focused on potential autosomal recessive causes within consanguineous families and screened
specific associated genes and carried out a linkage analysis to determine potential evidence for
novel causing genes.
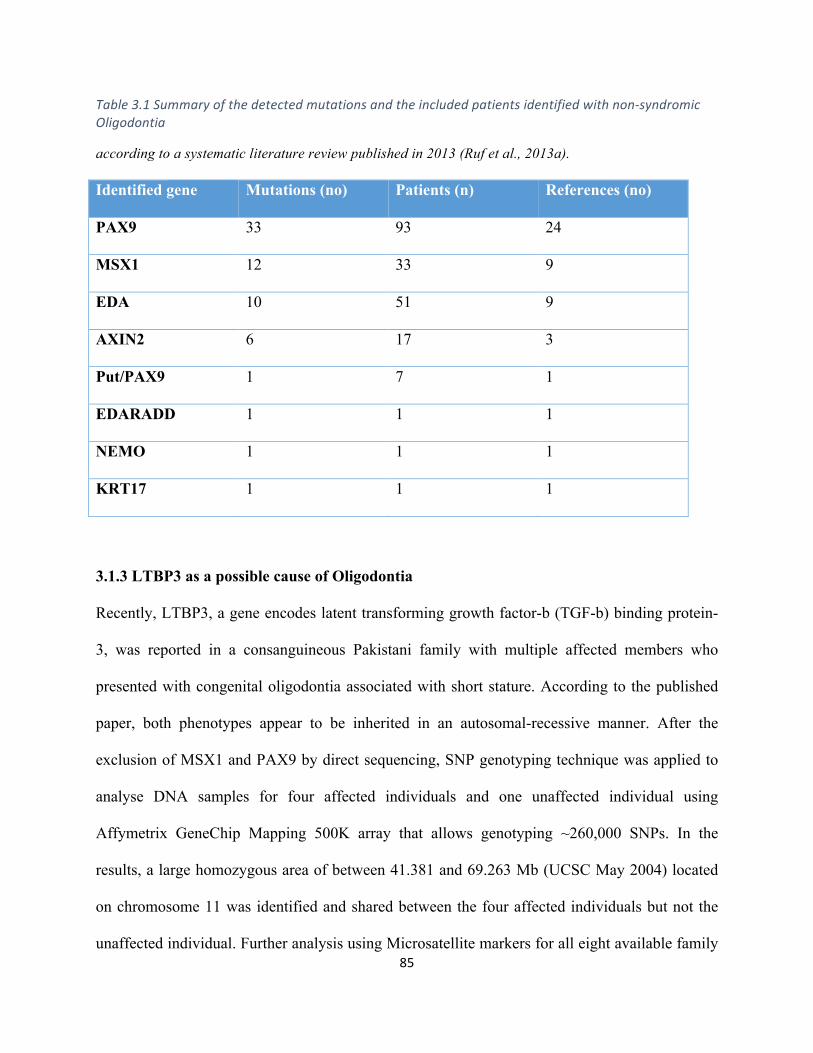
85
Table3.1Summaryofthedetectedmutationsandtheincludedpatientsidentifiedwithnon-syndromicOligodontia
according to a systematic literature review published in 2013 (Ruf et al., 2013a). Identified gene Mutations (no) Patients (n) References (no)
PAX9 33 93 24
MSX1 12 33 9
EDA 10 51 9
AXIN2 6 17 3
Put/PAX9 1 7 1
EDARADD 1 1 1
NEMO 1 1 1
KRT17 1 1 1
3.1.3 LTBP3 as a possible cause of Oligodontia
Recently, LTBP3, a gene encodes latent transforming growth factor-b (TGF-b) binding protein-
3, was reported in a consanguineous Pakistani family with multiple affected members who
presented with congenital oligodontia associated with short stature. According to the published
paper, both phenotypes appear to be inherited in an autosomal-recessive manner. After the
exclusion of MSX1 and PAX9 by direct sequencing, SNP genotyping technique was applied to
analyse DNA samples for four affected individuals and one unaffected individual using
Affymetrix GeneChip Mapping 500K array that allows genotyping ~260,000 SNPs. In the
results, a large homozygous area of between 41.381 and 69.263 Mb (UCSC May 2004) located
on chromosome 11 was identified and shared between the four affected individuals but not the
unaffected individual. Further analysis using Microsatellite markers for all eight available family
86
members (mother and seven of her offspring) across this region was carried out which confirmed
the shared autozygous region. Then many genes from the identified region were analysed by
direct sequencing of genomic DNA based on their known function and expression profiles e.g.
FGF4, FGF19, FIBP, LRP5, EHD1, FOSL1, and LTBP3. Amongst all the analysed genes, they
only identified a stop codon variant c.2322C > G, resulting in the nonsense mutation Y744X
within LTBP3 gene. However, screening 240 unrelated unaffected individuals of Pakistani origin
did not show this mutation (Noor et al., 2009)
3.2 Method
3.2.1 Patients and Clinical assessment Fourteen cases of non-syndromic oligodontia belonging to six different families were ascertained
in order to study the genetic basis, which might cause the disease for each case. All the
ascertained families were consanguineous and were all of Pakistani origin (Table 3.2). All of the
affected subjects were diagnosed with severe hyopdontia/oligodontia at the time of diagnosis. All
patients and their parents gave written informed consent and the study was approved by the
Research Ethics Committees.
A Specialist Registrar in Orthodontics (Dr Joyti Vasudev) undertook full dental and medical
assessment. A family pedigree was recorded for each case and indicated potential autosomal
recessively inherited manner. Blood samples were taken from affected individuals and the
available parents, and then sent to the West Midlands Regional Genetics Laboratory in
Birmingham Women’s Hospital for DNA extraction.
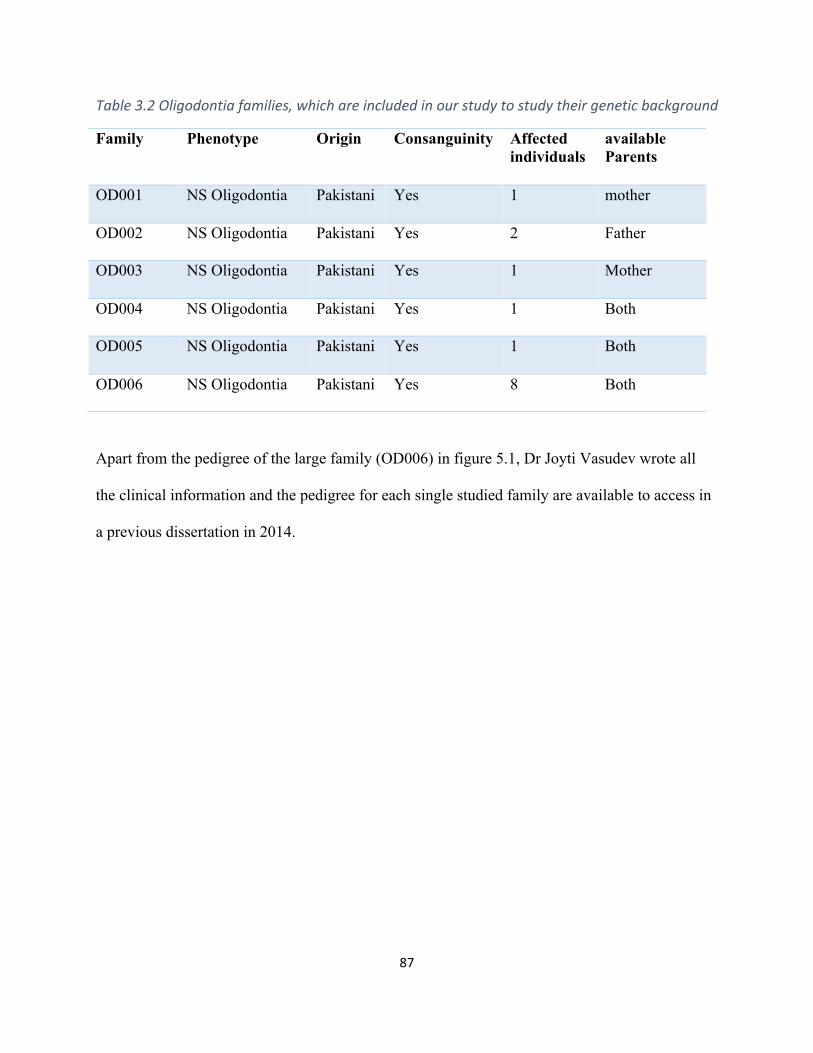
87
Table3.2Oligodontiafamilies,whichareincludedinourstudytostudytheirgeneticbackground
Family Phenotype Origin Consanguinity Affected individuals
available Parents
OD001 NS Oligodontia Pakistani Yes 1 mother
OD002 NS Oligodontia Pakistani Yes 2 Father
OD003 NS Oligodontia Pakistani Yes 1 Mother
OD004 NS Oligodontia Pakistani Yes 1 Both
OD005 NS Oligodontia Pakistani Yes 1 Both
OD006 NS Oligodontia Pakistani Yes 8 Both
Apart from the pedigree of the large family (OD006) in figure 5.1, Dr Joyti Vasudev wrote all
the clinical information and the pedigree for each single studied family are available to access in
a previous dissertation in 2014.
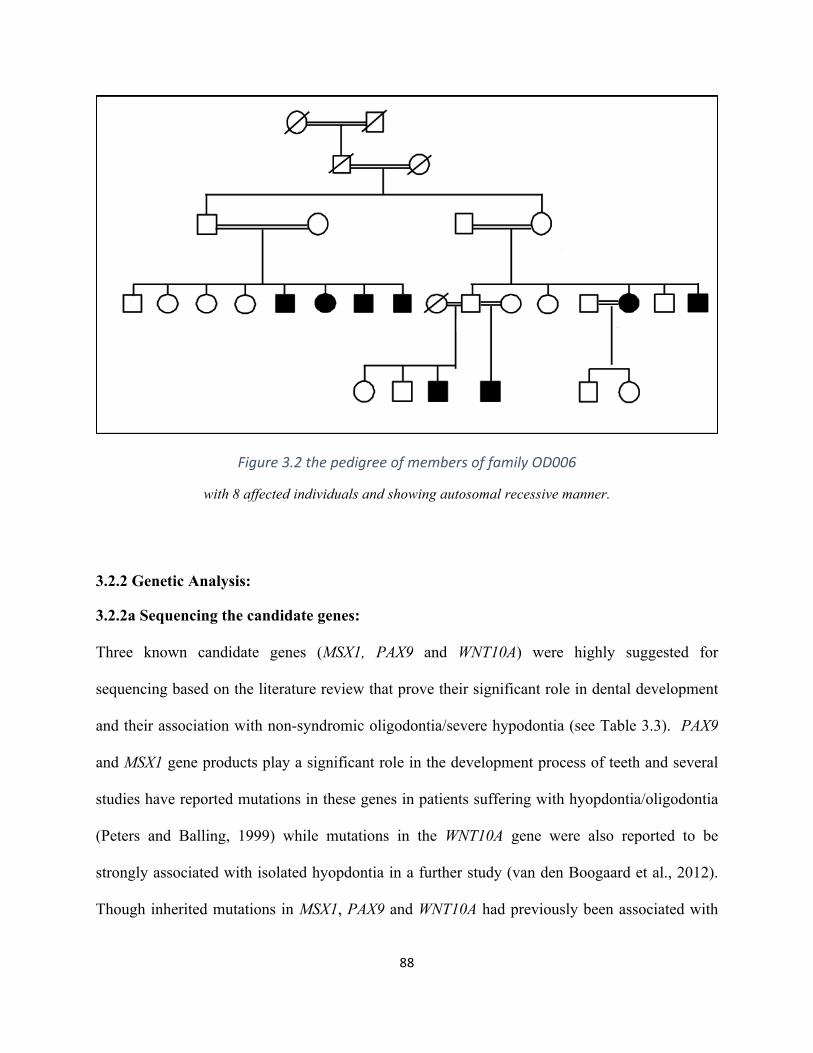
88
Figure3.2thepedigreeofmembersoffamilyOD006
with 8 affected individuals and showing autosomal recessive manner.
3.2.2 Genetic Analysis:
3.2.2a Sequencing the candidate genes:
Three known candidate genes (MSX1, PAX9 and WNT10A) were highly suggested for
sequencing based on the literature review that prove their significant role in dental development
and their association with non-syndromic oligodontia/severe hypodontia (see Table 3.3). PAX9
and MSX1 gene products play a significant role in the development process of teeth and several
studies have reported mutations in these genes in patients suffering with hyopdontia/oligodontia
(Peters and Balling, 1999) while mutations in the WNT10A gene were also reported to be
strongly associated with isolated hyopdontia in a further study (van den Boogaard et al., 2012).
Though inherited mutations in MSX1, PAX9 and WNT10A had previously been associated with
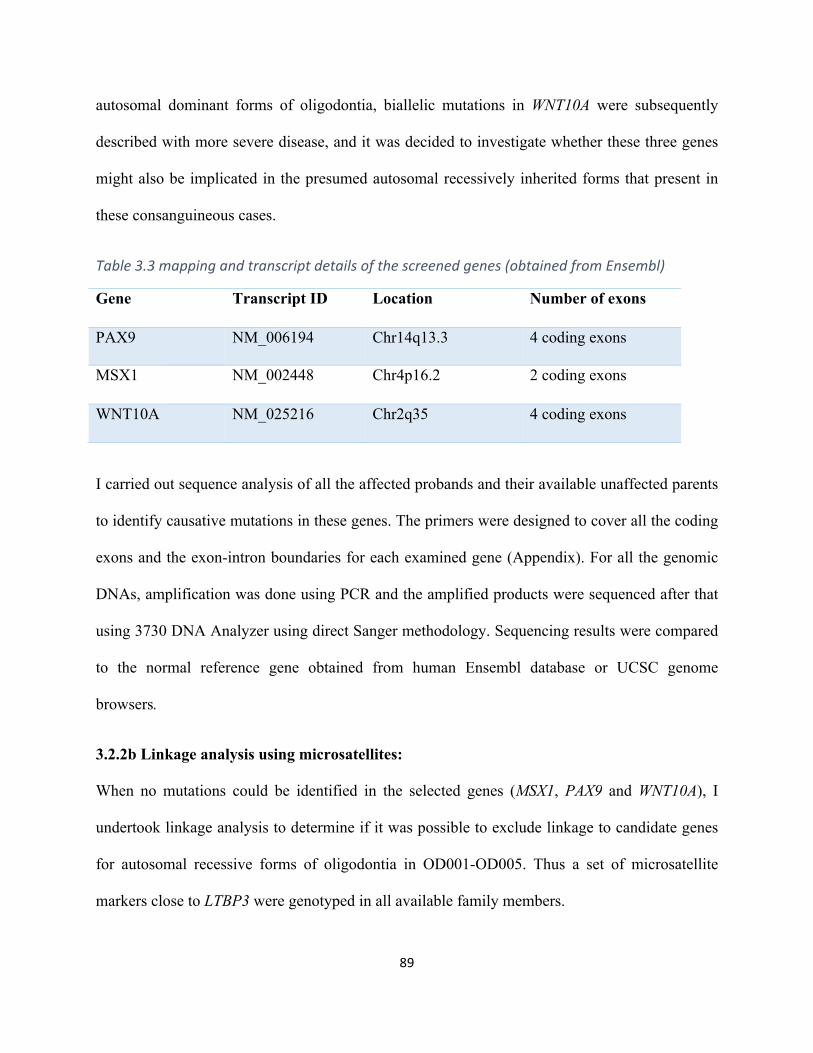
89
autosomal dominant forms of oligodontia, biallelic mutations in WNT10A were subsequently
described with more severe disease, and it was decided to investigate whether these three genes
might also be implicated in the presumed autosomal recessively inherited forms that present in
these consanguineous cases.
Table3.3mappingandtranscriptdetailsofthescreenedgenes(obtainedfromEnsembl)
Gene Transcript ID Location Number of exons
PAX9 NM_006194 Chr14q13.3 4 coding exons
MSX1 NM_002448 Chr4p16.2 2 coding exons
WNT10A NM_025216 Chr2q35 4 coding exons
I carried out sequence analysis of all the affected probands and their available unaffected parents
to identify causative mutations in these genes. The primers were designed to cover all the coding
exons and the exon-intron boundaries for each examined gene (Appendix). For all the genomic
DNAs, amplification was done using PCR and the amplified products were sequenced after that
using 3730 DNA Analyzer using direct Sanger methodology. Sequencing results were compared
to the normal reference gene obtained from human Ensembl database or UCSC genome
browsers.
3.2.2b Linkage analysis using microsatellites:
When no mutations could be identified in the selected genes (MSX1, PAX9 and WNT10A), I
undertook linkage analysis to determine if it was possible to exclude linkage to candidate genes
for autosomal recessive forms of oligodontia in OD001-OD005. Thus a set of microsatellite
markers close to LTBP3 were genotyped in all available family members.
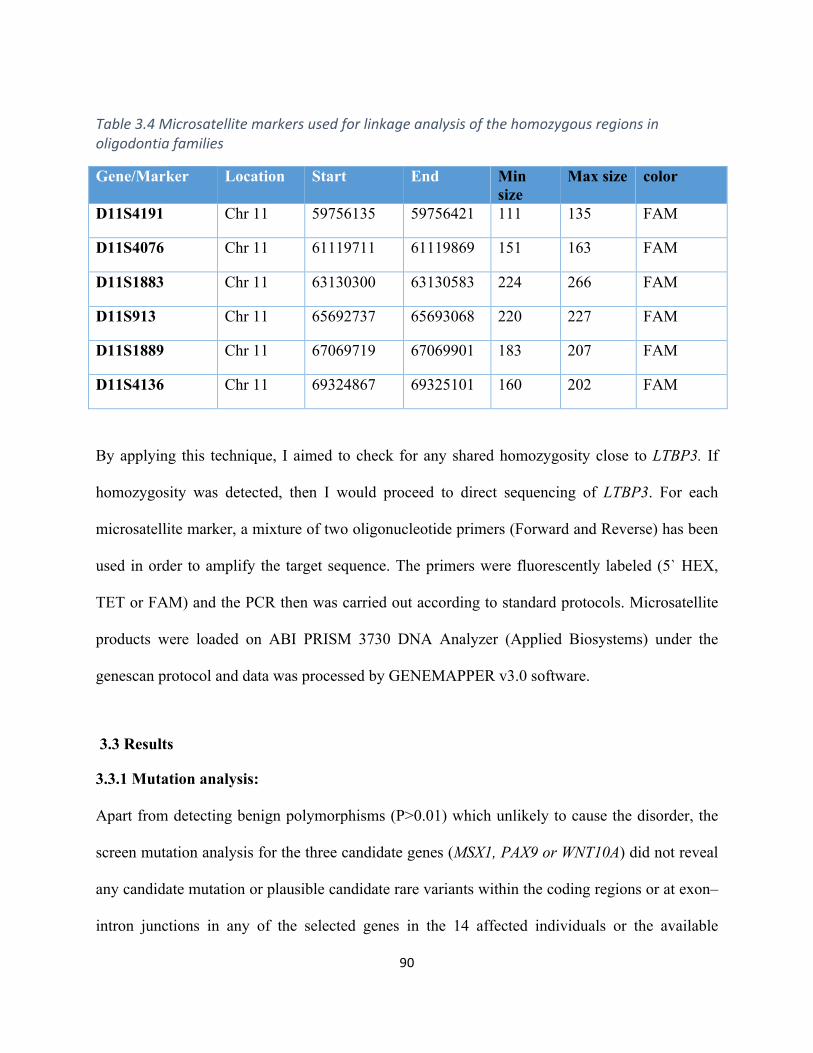
90
Table3.4Microsatellitemarkersusedforlinkageanalysisofthehomozygousregionsinoligodontiafamilies
Gene/Marker Location Start End Min size
Max size color
D11S4191 Chr 11 59756135 59756421 111 135 FAM
D11S4076 Chr 11 61119711 61119869 151 163 FAM
D11S1883 Chr 11 63130300 63130583 224 266 FAM
D11S913 Chr 11 65692737 65693068 220 227 FAM
D11S1889 Chr 11 67069719 67069901 183 207 FAM
D11S4136 Chr 11 69324867 69325101 160 202 FAM
By applying this technique, I aimed to check for any shared homozygosity close to LTBP3. If
homozygosity was detected, then I would proceed to direct sequencing of LTBP3. For each
microsatellite marker, a mixture of two oligonucleotide primers (Forward and Reverse) has been
used in order to amplify the target sequence. The primers were fluorescently labeled (5` HEX,
TET or FAM) and the PCR then was carried out according to standard protocols. Microsatellite
products were loaded on ABI PRISM 3730 DNA Analyzer (Applied Biosystems) under the
genescan protocol and data was processed by GENEMAPPER v3.0 software.
3.3 Results
3.3.1 Mutation analysis:
Apart from detecting benign polymorphisms (P>0.01) which unlikely to cause the disorder, the
screen mutation analysis for the three candidate genes (MSX1, PAX9 or WNT10A) did not reveal
any candidate mutation or plausible candidate rare variants within the coding regions or at exon–
intron junctions in any of the selected genes in the 14 affected individuals or the available
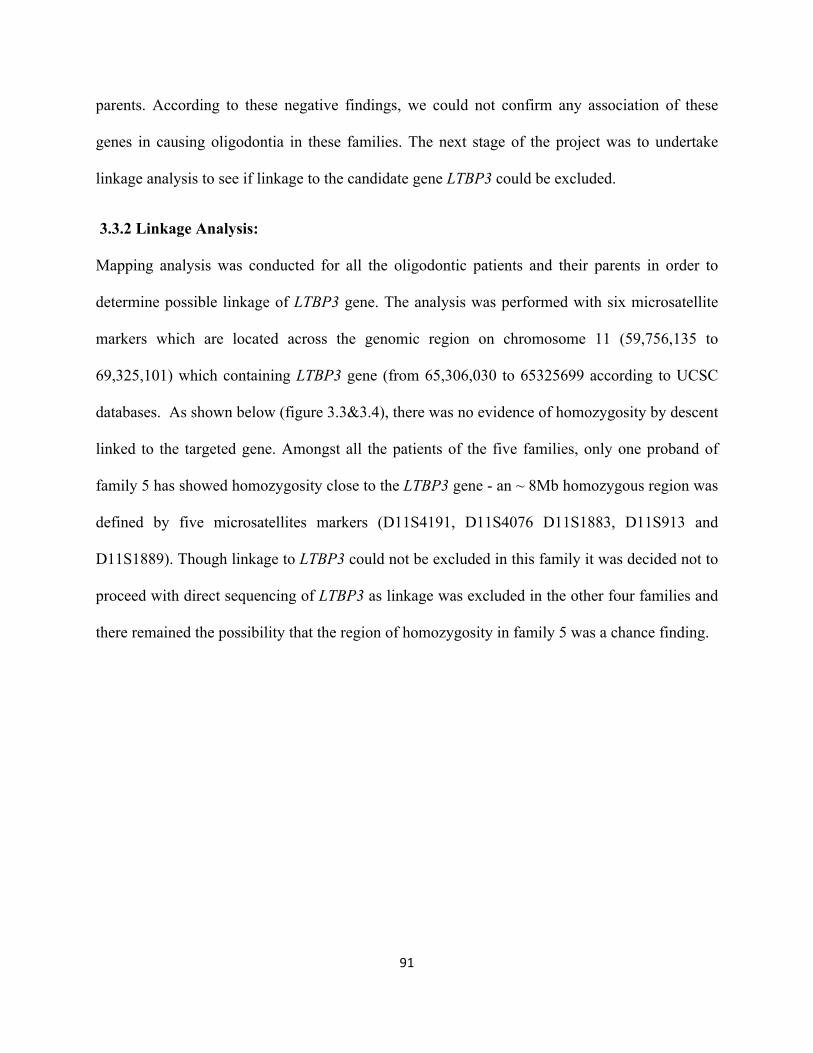
91
parents. According to these negative findings, we could not confirm any association of these
genes in causing oligodontia in these families. The next stage of the project was to undertake
linkage analysis to see if linkage to the candidate gene LTBP3 could be excluded.
3.3.2 Linkage Analysis:
Mapping analysis was conducted for all the oligodontic patients and their parents in order to
determine possible linkage of LTBP3 gene. The analysis was performed with six microsatellite
markers which are located across the genomic region on chromosome 11 (59,756,135 to
69,325,101) which containing LTBP3 gene (from 65,306,030 to 65325699 according to UCSC
databases. As shown below (figure 3.3&3.4), there was no evidence of homozygosity by descent
linked to the targeted gene. Amongst all the patients of the five families, only one proband of
family 5 has showed homozygosity close to the LTBP3 gene - an ~ 8Mb homozygous region was
defined by five microsatellites markers (D11S4191, D11S4076 D11S1883, D11S913 and
D11S1889). Though linkage to LTBP3 could not be excluded in this family it was decided not to
proceed with direct sequencing of LTBP3 as linkage was excluded in the other four families and
there remained the possibility that the region of homozygosity in family 5 was a chance finding.
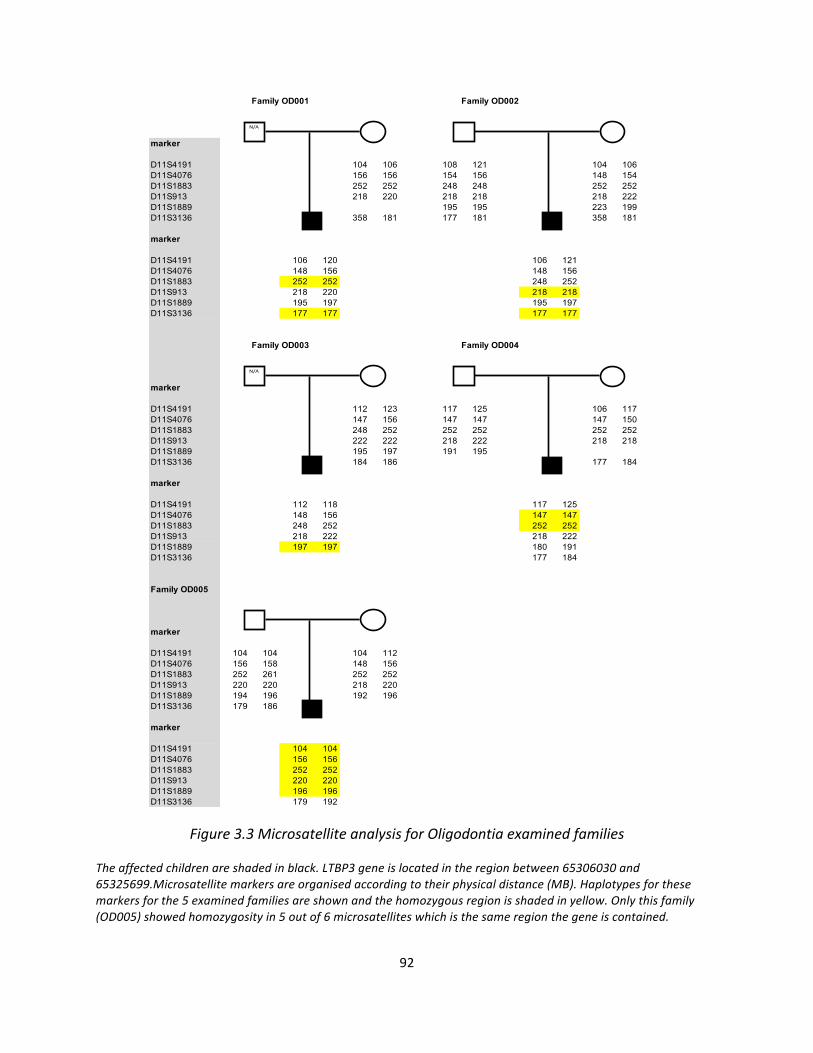
92
Figure3.3MicrosatelliteanalysisforOligodontiaexaminedfamilies
Theaffectedchildrenareshadedinblack.LTBP3geneislocatedintheregionbetween65306030and65325699.Microsatellitemarkersareorganisedaccordingtotheirphysicaldistance(MB).Haplotypesforthesemarkersforthe5examinedfamiliesareshownandthehomozygousregionisshadedinyellow.Onlythisfamily(OD005)showedhomozygosityin5outof6microsatelliteswhichisthesameregionthegeneiscontained.
Family OD001 Family OD002
marker
D11S4191 104 106 108 121 104 106D11S4076 156 156 154 156 148 154D11S1883 252 252 248 248 252 252D11S913 218 220 218 218 218 222D11S1889 195 195 223 199D11S3136 358 181 177 181 358 181
marker
D11S4191 106 120 106 121D11S4076 148 156 148 156D11S1883 252 252 248 252D11S913 218 220 218 218D11S1889 195 197 195 197D11S3136 177 177 177 177
Family OD003 Family OD004
marker
D11S4191 112 123 117 125 106 117D11S4076 147 156 147 147 147 150D11S1883 248 252 252 252 252 252D11S913 222 222 218 222 218 218D11S1889 195 197 191 195D11S3136 184 186 177 184
marker
D11S4191 112 118 117 125D11S4076 148 156 147 147D11S1883 248 252 252 252D11S913 218 222 218 222D11S1889 197 197 180 191D11S3136 177 184
Family OD005
marker
D11S4191 104 104 104 112D11S4076 156 158 148 156D11S1883 252 261 252 252D11S913 220 220 218 220D11S1889 194 196 192 196D11S3136 179 186
marker
D11S4191 104 104D11S4076 156 156D11S1883 252 252D11S913 220 220D11S1889 196 196D11S3136 179 192
N/A
N/A
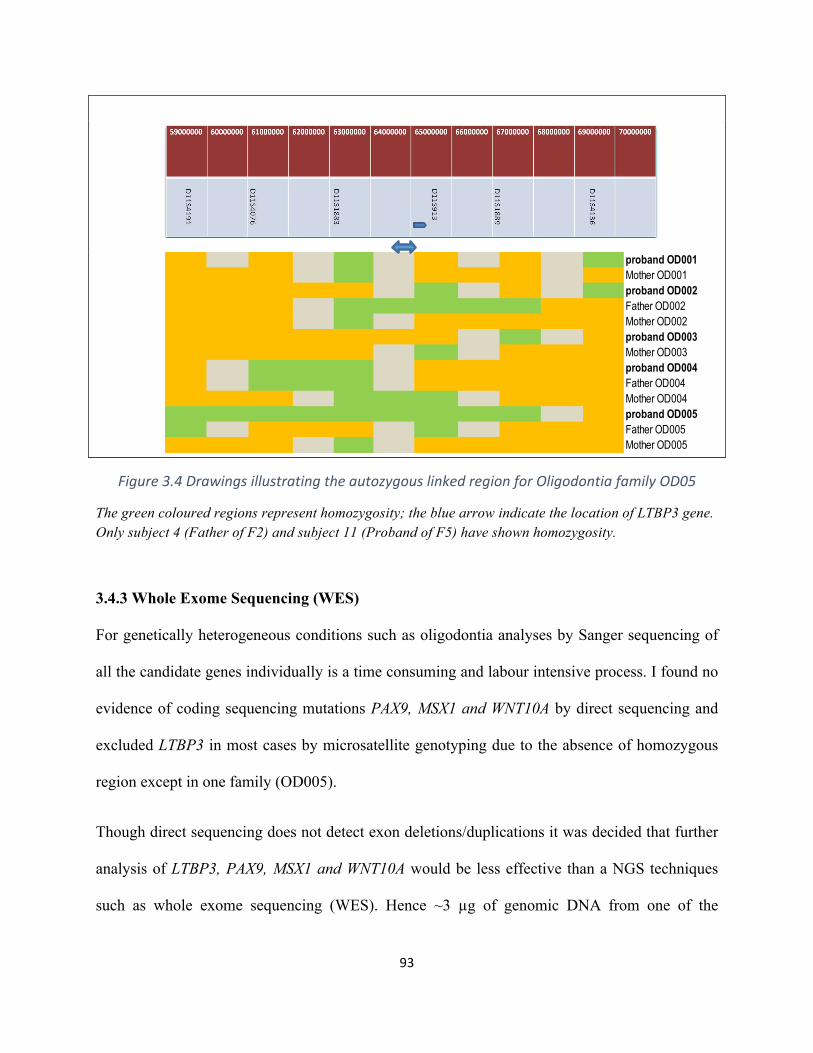
93
Figure3.4DrawingsillustratingtheautozygouslinkedregionforOligodontiafamilyOD05
The green coloured regions represent homozygosity; the blue arrow indicate the location of LTBP3 gene. Only subject 4 (Father of F2) and subject 11 (Proband of F5) have shown homozygosity.
3.4.3 Whole Exome Sequencing (WES)
For genetically heterogeneous conditions such as oligodontia analyses by Sanger sequencing of
all the candidate genes individually is a time consuming and labour intensive process. I found no
evidence of coding sequencing mutations PAX9, MSX1 and WNT10A by direct sequencing and
excluded LTBP3 in most cases by microsatellite genotyping due to the absence of homozygous
region except in one family (OD005).
Though direct sequencing does not detect exon deletions/duplications it was decided that further
analysis of LTBP3, PAX9, MSX1 and WNT10A would be less effective than a NGS techniques
such as whole exome sequencing (WES). Hence ~3 µg of genomic DNA from one of the
proband OD001 Mother OD001proband OD002 Father OD002Mother OD002proband OD003 Mother OD003proband OD004 Father OD004Mother OD004proband OD005 Father OD005Mother OD005
94
affected individuals of the OD006 family was sent to Kings College London (KCL) for singleton
exome sequencing (March 2013).
3.3.3a Whole exome sequencing (WES) at King’s College London (KCL)
The scientists at KCL (directed by Professor Michael Simpson) used the 50Mb Agilent
SureSelect enrichment kits to target the coding regions of most human genes and then proceeded
to NGS. After several months, the raw exome data was available and annotated at KCL using
genomic databases, software prediction tools and their own in-house database. The annotation of
the variants with respect to genes and transcripts was done by the help of the Annovar tool. They
annotated the variants as SNP if it found on the dbSNP or a novel variant if it is not already
published and not presents in the in-house genomic database. All the variants that caused no
change in the amino acids of the corresponding protein were reported as synonymous and filtered
out in the next stage. Also they annotated whether the variant is heterozygous or homozygous. A
total of 25,034 variants were identified. All this exome data was provided to me in an excel
spreadsheet (Microsoft)
3.3.3b Analysing WES data to identify the causing gene
From the large amount of WES data provided by KCL, I created an Excel file to analyze all the
variants using specific filtering strategy. The first step was excluding all the common variants
with a high minor allele frequency (MAF). It was reported in many studies that MAF ≥5% is
considered common, while MAF between 1-5% is defined as low frequency variants, and when
the variant has a MAF <1% will be considered as a rare variant (Genome of the Netherlands,
2014). Also I filtered out all the synonymous variants and (SNPs) that already present in
dbSNP131 or the 1000 Genomes project database with a frequency of > 1% in the population
95
and this highly reduced the number of variants from total 25,034 variants to, only 2,856 variants
and I only focused one the nonsynonymous pathogenic variants that might have a significant
effect on the protein level such as stop codon, frameshift and splicing site changes. Looking into
the rare and functional variants reduced the number from 2856 to 337 variants in 74 genes
(Appendix). As the affected proband was from a consanguineous family and because the family
pedigree was consistent with autosomal recessive inheritance, I concentrated on the homozygous
variants and this reduced the number of variants down to 21. At this stage, the remaining variants
were assessed to determine if they were within a gene that had previously been associated with
oligodontia, hypodontia or dental abnormalities (e.g. PAX9 , MSX1 , EDA , AXIN2 , Put/PAX9 1 ,
EDARADD , NEMO , KRT17 (Ruf et al., 2013b) WNT10A, IRF6,TGFA, , FGR1 ,EDAR
(Galluccio et al., 2012, Cobourne and Sharpe, 2013), HYD2 (Ahmad et al., 1998) STHAG5 and
LTBP3). However none of the variants were within these genes.
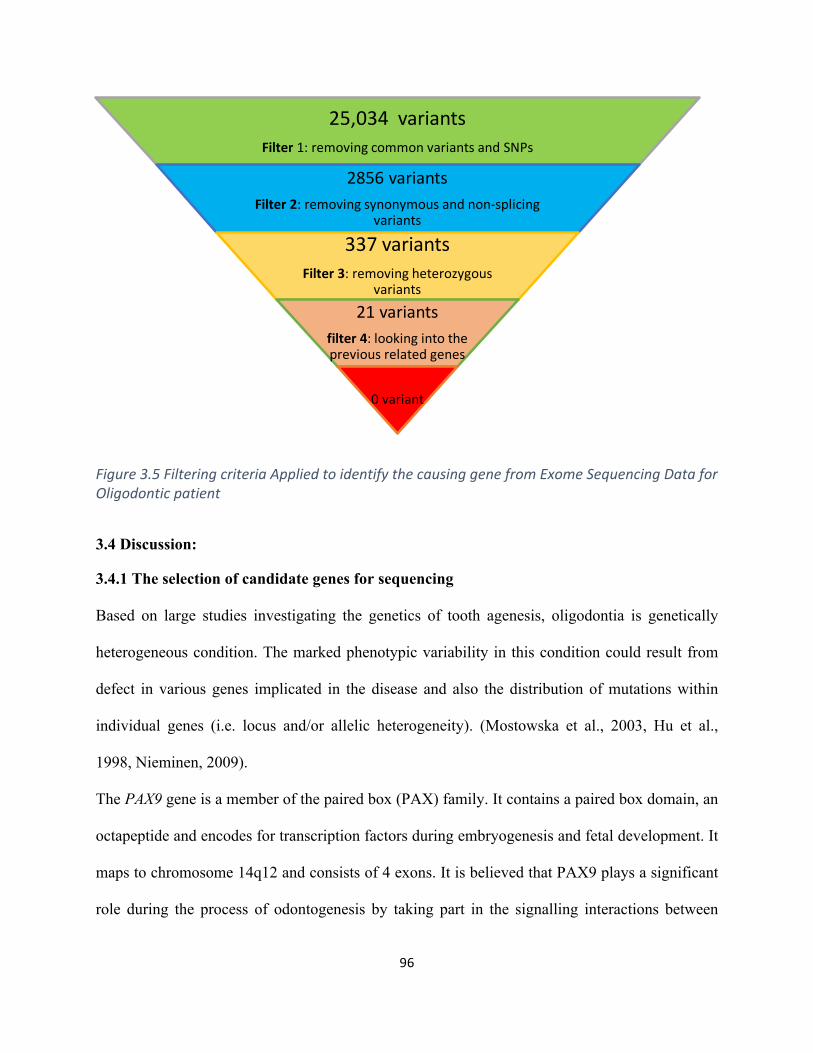
96
Figure3.5FilteringcriteriaAppliedtoidentifythecausinggenefromExomeSequencingDataforOligodonticpatient
3.4 Discussion:
3.4.1 The selection of candidate genes for sequencing
Based on large studies investigating the genetics of tooth agenesis, oligodontia is genetically
heterogeneous condition. The marked phenotypic variability in this condition could result from
defect in various genes implicated in the disease and also the distribution of mutations within
individual genes (i.e. locus and/or allelic heterogeneity). (Mostowska et al., 2003, Hu et al.,
1998, Nieminen, 2009).
The PAX9 gene is a member of the paired box (PAX) family. It contains a paired box domain, an
octapeptide and encodes for transcription factors during embryogenesis and fetal development. It
maps to chromosome 14q12 and consists of 4 exons. It is believed that PAX9 plays a significant
role during the process of odontogenesis by taking part in the signalling interactions between
25,034variantsFilter 1:removingcommonvariantsandSNPs
2856variantsFilter2:removingsynonymousandnon-splicing
variants
337variantsFilter3:removingheterozygous
variants
21variantsfilter4:lookingintothepreviousrelatedgenes
0variant
97
epithelial cells and mesenchymal cell layers. A published study discovered mutations within
PAX9 gene which might cause isolated hypodontia (Das et al., 2003). Also, two more studies
identified frameshift and missense mutations amongst patients affected with tooth agenesis and
particularly congenital oligodontia (Lammi et al., 2003, Frazier-Bowers et al., 2002). Depending
on the clinical phenotypes of the tooth agenesis cases for prioritizing the candidate genes to be
sequenced is not a precise method.
MSX1 gene is a member of homeobox family that plays essential role in the progression of many
organs during the fetal development, however, the gene located on chromosome 4p16.1 and
encodes for MSX1 protein which is expressed in odontogenesis and taking part in inhibiting the
transcription and, same as PAX9, it participates in regulating the signalling pathways of
odontogenesis (Vieira et al., 2004, Ogawa et al., 2005) . MSX1 has been screened in 92 affected
unrelated individuals belonging to 82 nuclear families and resulted in identifying a novel
missense mutation which suggested a significant role in causing tooth agenesis acording to the
researchers (Lidral and Reising, 2002). Nieminen et al. (2003) analysed MSX1 gene in 8 Finnish
patients diagnosed with Wolf-Hirschhorn syndrome. Five of the patients were presenting
oligodontia. Using FISH technique, the 5 patients with oligodontia showed a heterozygous
deletion in MSX1 gene, while the other three individuals were completely normal. Therefore,
they suggested in the conclusion that haploinsufficiency for MSX1 could be as a mechanism that
play a significant role in causing a selective tooth agenesis with other factors (Nieminen et al.,
2003). Mice homozygous for a deletion in MSX1 gene demonstrate craniofacial and limb
anomalies plus decreased development of teeth agenesis whereas the heterozygous PAX9 mice
seems completely normal (Peters et al., 1998, Peters and Balling, 1999). Mice with homozygous
deleted Msx1exhibit craniofacial abnormalities in cleft palate, and impairment in mandibular and
98
maxillary alveolar development and also demonstrate malformations in tooth development
process in particular during moving from bud to cap stage. In contrast, heterozygous mice for
Msx1 deletion show normal status (Satokata and Maas, 1994).
WNT10A is a member of the WNT gene family. It is mapped to chromosome 2q35and composed
of 4 exons. The expression of its protein is mainly expressed in the cell lines of promyelocytic
leukaemia and Burkitt's lymphomas. So athough this gene is not as known as PAX9 and MSX1
but mutations were detected in 19 individuals (56%) of total 34 unrelated patients of non
syndromic tooth agenesis, 8 mutations of them were homozygous, 4 compound heterozygous,
and 7 of them were heterozygous for the mutations. Also, it is found that 3% of patients have
mutations within MSX1 and 9% of the patients were found they have mutations in PAX9 gene
(van den Boogaard et al., 2012). Furthermore, in a cohort of 94 families affected with isolated
oligodontia, Arzoo and others identified several mutations in 26 affected individuals (27.7%), 17
of them were homozygous while 11 were heterozygous (Arzoo et al., 2014).
3.4.2 Linkage analysis for LTBP3 and the use of WES
Using direct sequencing, no mutations were identified within the coding and splicing regions of
PAX9, MSX1 or WNT10A genes except the normal polymorphisms that are unlikely to cause
disease. Thus, the cause of oligodontia in the examined families appeared most likely to be in
other genes that were either already associated with oligodontia or in novel oligodontia genes
(though the possibility of intronic or regulatory mutations in PAX9, MSX1 or WNT10A could not
be excluded). After the negative outcome of sequencing the three selected genes, it was decided
to evaluate the use of microsatellite genotyping. I applied this strategy for the LTBP3 gene which
had previously been reported as a cause of the disease in a consanguineous Pakistani family that
diagnosed with congenital oligodontia and short stature (Noor et al., 2009). However, in most
99
cases (assuming the proband would be homozygous for a mutation) linkage was excluded - only
proband of family OD005 has showed homozygosity that could be linked to LTBP3 in a ~8Mb
region which harbours five microsatellites (D11S4191, D11S4076 D11S1883, D11S913 and
D11S1889). In all the other families, no extended region of homozygosity was noted in the
genotyped microsatellites, so in conclusion the LTBP3 gene is unlikely to be a common cause in
this cohort of cases. Following the negative results from analysis of PAX9, MSX1 and WNT10A
and the exclusion of LTBP3 (in most cases), it was decided to screen the whole exome by
applying NGS techniques due to the high efficiency of WES in finding the rare disease causing
mutations in a variety of Mendelian diseases.
In view of the high cost of WES (in 2013) it was planned to sequence a single individual from
the largest family and then screen other family members for candidate mutations and then
proceed to testing the relevant gene in affected cases from the other five families. After analysing
large number of variants provided by exome sequencing using specific filtering criteria to
attempt to identify the disease causing variant, none of the known candidate genes appeared to
contain a pathogenic mutation. Nevertheless, the cohort of consanguineous families with a
common ethnic origin might contain a novel genetic cause for oligodontia or severe hypodontia
and we would suggest pursuing WES in additional cases from the cohort.
This study is not the first to fail to find positive linkage between mutations in the known genes
tested genes and tooth agenesis. In five unrelated families affected with hypodontia, Nieminen
and colleagues did not identify any association of the MSX1 gene. Also, no mutations were
discovered in MSX1 in other 20 patients with hypodontia (Scarel et al., 2000). Moreover, in a
Vietnamese study involving 20 families, PAX9 and MSX1 were analyzed but no mutations were
identified (Frazier-Bowers et al., 2003). In addition, the small size of the patient cohort could be

100
considered a major limitation of this study. Therefore, a larger number of affected families is
needed in order to be more confident about the contribution of the genes tested to tooth agenesis
disorders in individuals of Pakistani descent.
101
ChapterFour*:GeneticInvestigationsofFADS/LMPSbyAutozygosityMapping&Genesequencing
*ThischaptercontainsworkpublishedaspartofthepaperbyMckieetal(2014)(withAlSaediasjointfirstauthor)
102
4.1 Introduction:
4.1.1 Clinical background of MPS disorders
Multiple pterygium syndrome (MPS) is a congenital multiple anomaly disorder. MPS is
characterised by the presence of skin webs (pterygium) and the lack of muscle movement
(akinesia) associated with muscle weakness and joint contractures (arthrogryposis) (Gillin and
Pryse-Davis, 1976, Morgan et al., 2006a). Other clinical features of MPS include scoliosis, cystic
hygroma, micrognathia, cleft palate, and lung abnormalities (McKie et al., 2014b). MPS is a
heterogeneous rare disorder, inherited mainly in an autosomal recessive manner, though
autosomal dominant and X-linked inherited cases can also occur (McKeown and Harris, 1988,
Tolmie et al., 1987). According to the severity, MPS is divided into two main clinical forms; the
milder Escobar multiple pterygium syndrome (EVMPS) [OMIM 26500] and the lethal multiple
pterygium syndrome (LMPS) [OMIM 253290]. LMPS is a severe disorder and is fatal either
during pregnancy or shortly after birth whereas EVMPS patients can survive into adulthood.
There is a clear genetic and phenotypic overlap between Fetal Akinesia Deformation
Sequence (FADS [MIM 208150]) and the lethal form of MPS especially with overlapping
clinical features and certain genes may cause both disorders (Vogt et al., 2008). FADS is as the
classical form of MPS which characterised by most of the common clinical MPS features such as
decreased fetal movements, intrauterine growth restriction, craniofacial anomalies, joint
contractures and pulmonary hypoplasia. FADS can be caused by environmental factors such as
curare exposure and circulating maternal antibodies against the fetal acetylcholine receptor
(Michalk et al., 2008) Also, the phenotype can occur as a result of genetic mutations that affect
the normal function of the associated organs (Michalk et al., 2008) and this will be discussed
with more details in this chapter.
103
4.1.2 Genetic causes of MPS disorders
Many genes have been identified as potential causes of MPS-related diseases in the literature.
However, at the time this work was commenced, the best recognised genetic causes were related
to defects in the components of embryonal acetylcholine receptor (AChR). Thus, AChR
components are significant cause of recessively or dominantly inherited myasthenic syndromes
with variable age of onset and clinical severity. AChR protein is located in the membrane of
skeletal muscle cells and it is essential for neuromuscular signalling pathway between axon and
muscles which is necessary for the movement in both fetus and adult. During fetal development,
AChR consists of two α1, one β1, one δ, and one γ subunit {(CHRNA1 [MIM 100690],
CHRNB1[MIM 100710],CHRND [MIM 100720], CHRNG [MIM 100730] respectively}.
CHRNG gene is naturally expressed until the thirty third week of the pregnancy when it is
replaced by the epsilon (ε) subunit, which is produced by the CHRNE gene, to form the adult
AChR protein (figure 4.1). All these subunits are clustered in a complex process to produce the
signal transduction. However, some other genes are involved in the AChR assembly such as
AGRN, MUSK, DOK7 and RAPSN (Sanes and Lichtman, 2001).
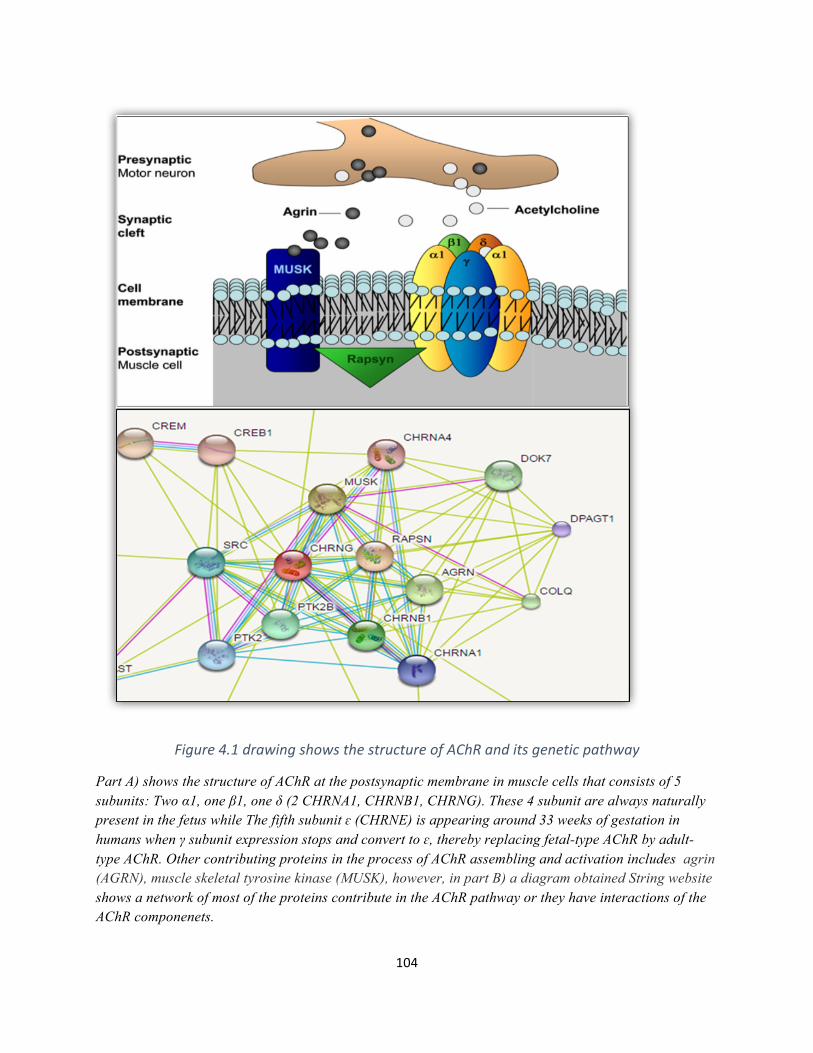
104
Figure4.1drawingshowsthestructureofAChRanditsgeneticpathway
Part A) shows the structure of AChR at the postsynaptic membrane in muscle cells that consists of 5 subunits: Two α1, one β1, one δ (2 CHRNA1, CHRNB1, CHRNG). These 4 subunit are always naturally present in the fetus while The fifth subunit ɛ (CHRNE) is appearing around 33 weeks of gestation in humans when γ subunit expression stops and convert to ɛ, thereby replacing fetal-type AChR by adult-type AChR. Other contributing proteins in the process of AChR assembling and activation includes agrin (AGRN), muscle skeletal tyrosine kinase (MUSK), however, in part B) a diagram obtained String website shows a network of most of the proteins contribute in the AChR pathway or they have interactions of the AChR componenets.
105
Mutations in the (CHRNG) have been implicated in both FADS and LMPS. Numbers of
associated mutations have been identified in the lethal and the Escobar types of MPS. For
instance, Hoffmann et al. (2006) identified 8 mutations in CHRNG amongst 7 families diagnosed
with Escobar syndrome. In addition, Morgan et al. (2006) was able to find 6 homozygous
mutations in 6 families with lethal or Escobar variants (Hoffmann et al., 2006, Morgan et al.,
2006a). In addition, genes encoding other components of the AChR complex (e.g. CHRNA1,
CHRND, RAPSN, DOK7 and MUSK) that are predicted to cause severe dysfunction of the
neuromuscular junction have been described in autosomal recessively inherited LMPS/FADS
(Vogt et al., 2008, Michalk et al., 2008, Vogt et al., 2012). Furthermore, many other genes which
involved in the neural and skeletal muscle development have been described in some
neuromyopathies (e.g. motor neuropathies associated with central or peripheral nervous system
disease or muscular dystrophy) that have been associated with a LMPS/FADS phenotype. Also,
mutations in genes associated with inherited arthrogryposis have occasionally been linked to
EVMPS (e.g. TPM2, TNNI2, MYH3) (Ravenscroft et al., 2011, Chong et al., 2015) which are
summarized in Table 4.1. Nevertheless, many cases of FADS and MPS do not have a mutation in
a known FADS/MPS gene and this is the main reason I undertook further genetic investigations
in these conditions.
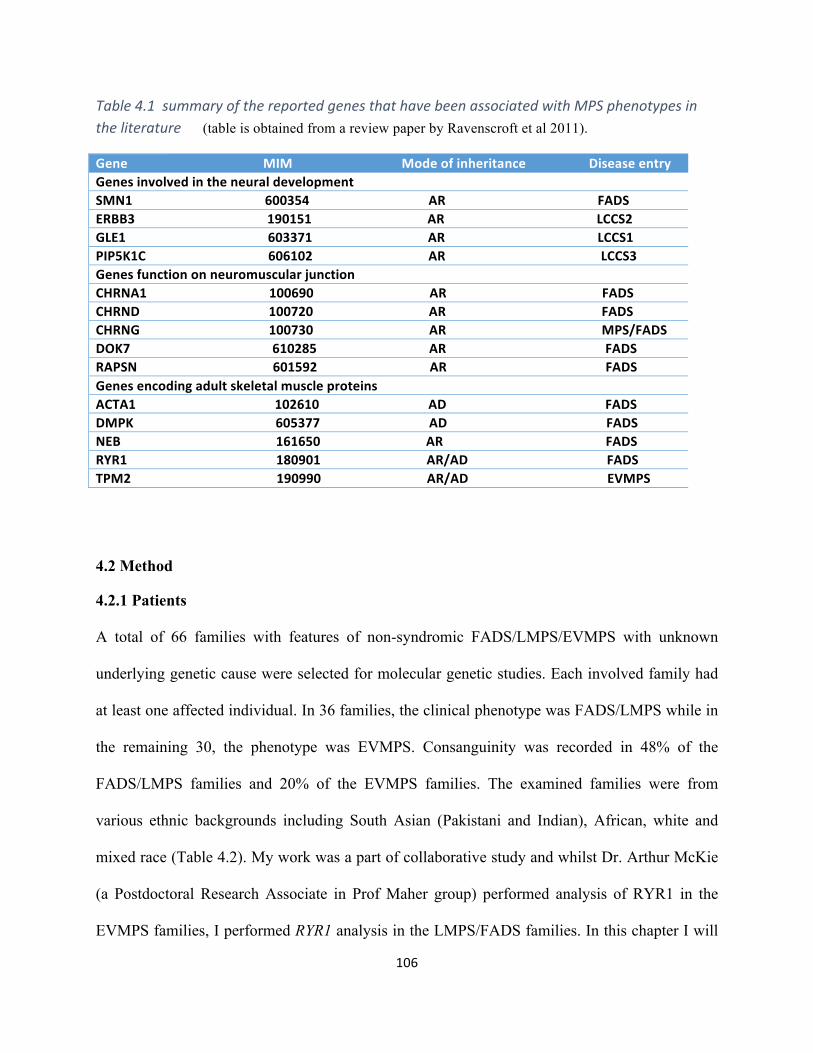
106
Table4.1summaryofthereportedgenesthathavebeenassociatedwithMPSphenotypesintheliterature(table is obtained from a review paper by Ravenscroft et al 2011).
GeneMIMModeofinheritanceDiseaseentryGenesinvolvedintheneuraldevelopmentSMN1600354ARFADSERBB3190151ARLCCS2GLE1603371ARLCCS1PIP5K1C606102ARLCCS3GenesfunctiononneuromuscularjunctionCHRNA1100690ARFADSCHRND100720ARFADSCHRNG100730ARMPS/FADSDOK7610285ARFADSRAPSN601592ARFADSGenesencodingadultskeletalmuscleproteinsACTA1102610ADFADSDMPK605377ADFADSNEB161650ARFADSRYR1180901AR/ADFADSTPM2190990AR/ADEVMPS
4.2 Method
4.2.1 Patients
A total of 66 families with features of non-syndromic FADS/LMPS/EVMPS with unknown
underlying genetic cause were selected for molecular genetic studies. Each involved family had
at least one affected individual. In 36 families, the clinical phenotype was FADS/LMPS while in
the remaining 30, the phenotype was EVMPS. Consanguinity was recorded in 48% of the
FADS/LMPS families and 20% of the EVMPS families. The examined families were from
various ethnic backgrounds including South Asian (Pakistani and Indian), African, white and
mixed race (Table 4.2). My work was a part of collaborative study and whilst Dr. Arthur McKie
(a Postdoctoral Research Associate in Prof Maher group) performed analysis of RYR1 in the
EVMPS families, I performed RYR1 analysis in the LMPS/FADS families. In this chapter I will
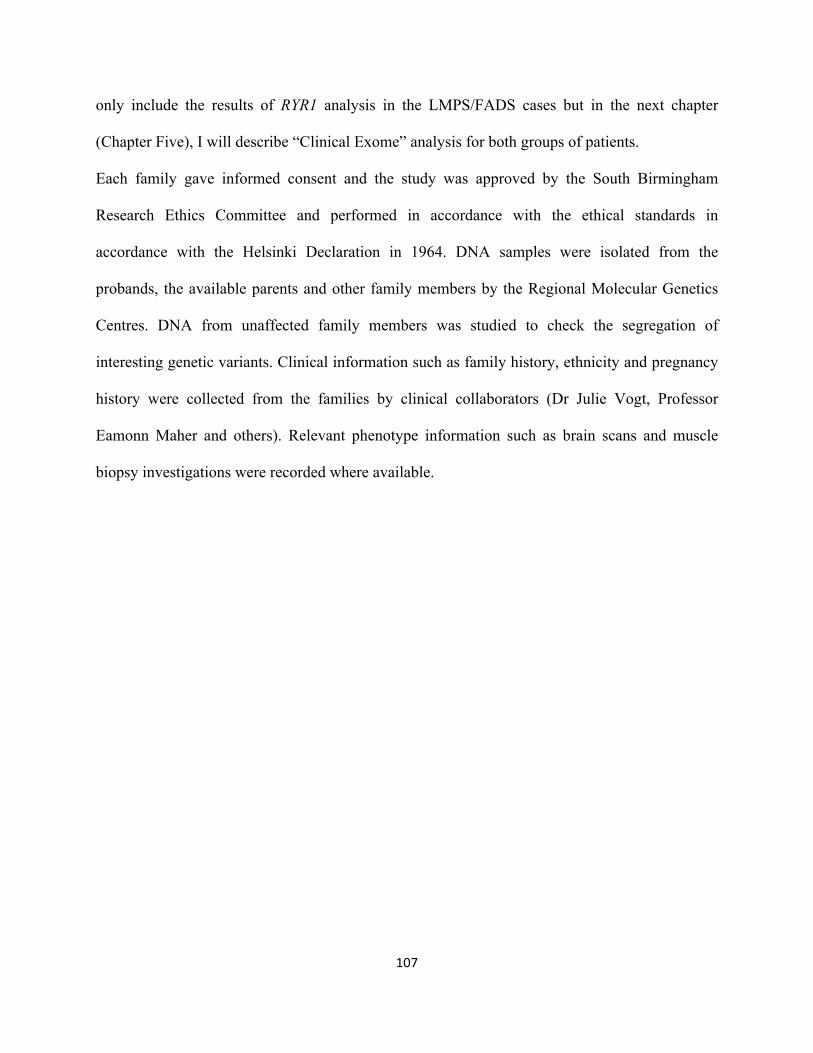
107
only include the results of RYR1 analysis in the LMPS/FADS cases but in the next chapter
(Chapter Five), I will describe “Clinical Exome” analysis for both groups of patients.
Each family gave informed consent and the study was approved by the South Birmingham
Research Ethics Committee and performed in accordance with the ethical standards in
accordance with the Helsinki Declaration in 1964. DNA samples were isolated from the
probands, the available parents and other family members by the Regional Molecular Genetics
Centres. DNA from unaffected family members was studied to check the segregation of
interesting genetic variants. Clinical information such as family history, ethnicity and pregnancy
history were collected from the families by clinical collaborators (Dr Julie Vogt, Professor
Eamonn Maher and others). Relevant phenotype information such as brain scans and muscle
biopsy investigations were recorded where available.
108
Table4.2theavailableClinicalfeaturesoftheLMPS/FADSrecruitedpatients
Family number Phenotype Ethnicity Consanguinity MPS001 LMPS White Yes MPS002 LMPS South Asian Yes MPS003 LMPS Middle Eastern Yes MPS004 LMPS South Asian Yes MPS005 LMPS South Asian Yes MPS006 LMPS South Asian Yes MPS007 LMPS Not available No MPS008 LMPS White No MPS009 LMPS White No MPS010 FADS Middle Eastern Yes MPS011 LMPS Not recorded Yes MPS012 LMPS North African Yes MPS013 LMPS White No MPS014 LMPS South Asian Yes MPS015 LMPS White No MPS016 LMPS Not available Yes MPS017 LMPS North African Yes MPS018 FADS White No MPS019 LMPS White No MPS020 LMPS White No MPS021 LMPS South Asian Yes MPS022 FADS Middle Eastern Yes MPS023 LMPS Middle Eastern Yes MPS024 LMPS White No MPS025 FADS Mixed race No MPS026 FADS White No MPS027 LMPS Not available Yes MPS028 LMPS Not available No MPS029 FADS/LMPS Not available No MPS030 FADS/LMPS Not available No MPS031 LMPS White No MPS032 LMPS White No MPS033 LMPS White No
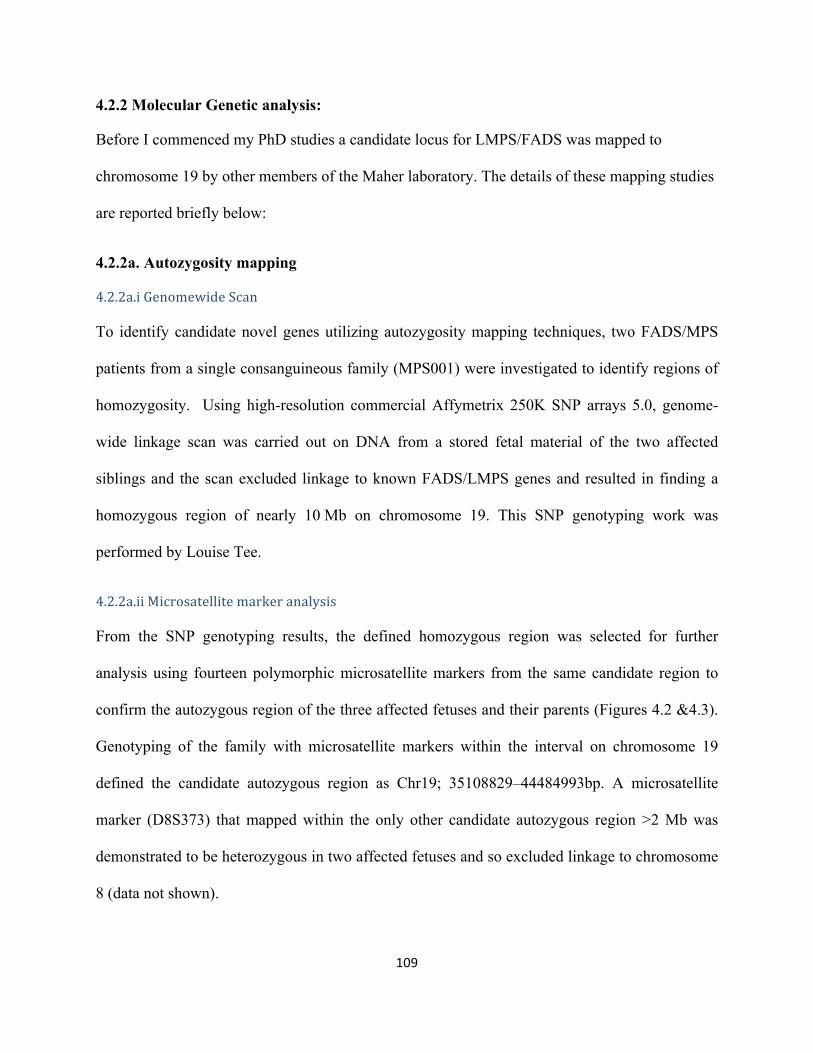
109
4.2.2 Molecular Genetic analysis:
Before I commenced my PhD studies a candidate locus for LMPS/FADS was mapped to
chromosome 19 by other members of the Maher laboratory. The details of these mapping studies
are reported briefly below:
4.2.2a. Autozygosity mapping
4.2.2a.iGenomewideScan
To identify candidate novel genes utilizing autozygosity mapping techniques, two FADS/MPS
patients from a single consanguineous family (MPS001) were investigated to identify regions of
homozygosity. Using high-resolution commercial Affymetrix 250K SNP arrays 5.0, genome-
wide linkage scan was carried out on DNA from a stored fetal material of the two affected
siblings and the scan excluded linkage to known FADS/LMPS genes and resulted in finding a
homozygous region of nearly 10 Mb on chromosome 19. This SNP genotyping work was
performed by Louise Tee.
4.2.2a.iiMicrosatellitemarkeranalysis
From the SNP genotyping results, the defined homozygous region was selected for further
analysis using fourteen polymorphic microsatellite markers from the same candidate region to
confirm the autozygous region of the three affected fetuses and their parents (Figures 4.2 &4.3).
Genotyping of the family with microsatellite markers within the interval on chromosome 19
defined the candidate autozygous region as Chr19; 35108829–44484993bp. A microsatellite
marker (D8S373) that mapped within the only other candidate autozygous region >2 Mb was
demonstrated to be heterozygous in two affected fetuses and so excluded linkage to chromosome
8 (data not shown).
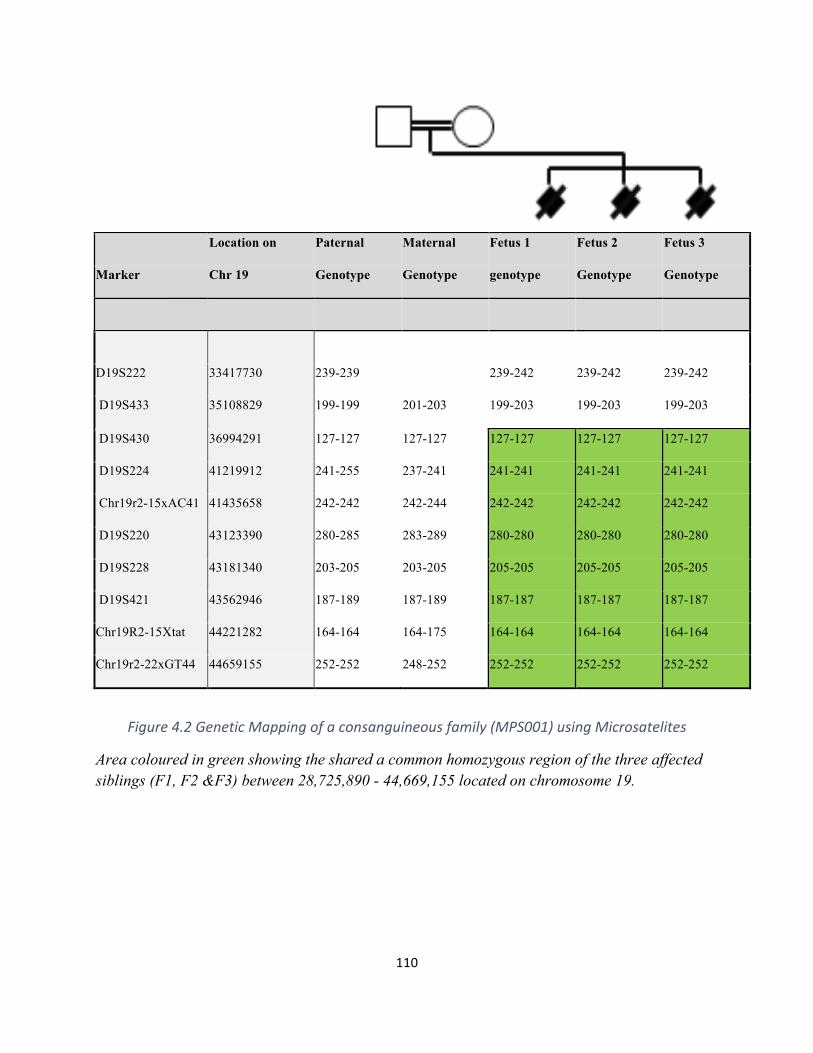
110
Location on Paternal Maternal Fetus 1 Fetus 2 Fetus 3
Marker Chr 19 Genotype Genotype genotype Genotype Genotype
D19S222 33417730 239-239
239-242 239-242 239-242
D19S433 35108829 199-199 201-203 199-203 199-203 199-203
D19S430 36994291 127-127 127-127 127-127 127-127 127-127
D19S224 41219912 241-255 237-241 241-241 241-241 241-241
Chr19r2-15xAC41 41435658 242-242 242-244 242-242 242-242 242-242
D19S220 43123390 280-285 283-289 280-280 280-280 280-280
D19S228 43181340 203-205 203-205 205-205 205-205 205-205
D19S421 43562946 187-189 187-189 187-187 187-187 187-187
Chr19R2-15Xtat 44221282 164-164 164-175 164-164 164-164 164-164
Chr19r2-22xGT44 44659155 252-252 248-252 252-252 252-252 252-252
Figure4.2GeneticMappingofaconsanguineousfamily(MPS001)usingMicrosatelites
Area coloured in green showing the shared a common homozygous region of the three affected siblings (F1, F2 &F3) between 28,725,890 - 44,669,155 located on chromosome 19.
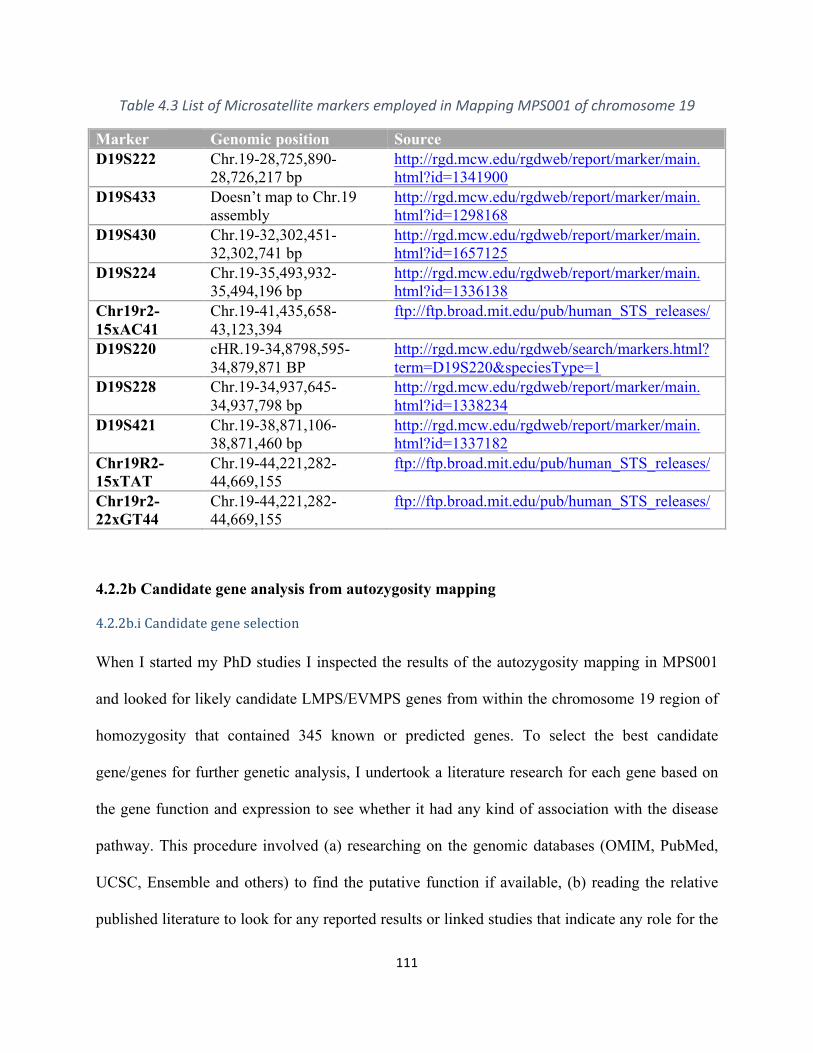
111
Table4.3ListofMicrosatellitemarkersemployedinMappingMPS001ofchromosome19
Marker Genomic position Source D19S222 Chr.19-28,725,890-
28,726,217 bp http://rgd.mcw.edu/rgdweb/report/marker/main.html?id=1341900
D19S433 Doesn’t map to Chr.19 assembly
http://rgd.mcw.edu/rgdweb/report/marker/main.html?id=1298168
D19S430 Chr.19-32,302,451-32,302,741 bp
http://rgd.mcw.edu/rgdweb/report/marker/main.html?id=1657125
D19S224 Chr.19-35,493,932-35,494,196 bp
http://rgd.mcw.edu/rgdweb/report/marker/main.html?id=1336138
Chr19r2-15xAC41
Chr.19-41,435,658-43,123,394
ftp://ftp.broad.mit.edu/pub/human_STS_releases/
D19S220 cHR.19-34,8798,595-34,879,871 BP
http://rgd.mcw.edu/rgdweb/search/markers.html?term=D19S220&speciesType=1
D19S228 Chr.19-34,937,645-34,937,798 bp
http://rgd.mcw.edu/rgdweb/report/marker/main.html?id=1338234
D19S421 Chr.19-38,871,106-38,871,460 bp
http://rgd.mcw.edu/rgdweb/report/marker/main.html?id=1337182
Chr19R2-15xTAT
Chr.19-44,221,282-44,669,155
ftp://ftp.broad.mit.edu/pub/human_STS_releases/
Chr19r2-22xGT44
Chr.19-44,221,282-44,669,155
ftp://ftp.broad.mit.edu/pub/human_STS_releases/
4.2.2b Candidate gene analysis from autozygosity mapping
4.2.2b.iCandidategeneselection
When I started my PhD studies I inspected the results of the autozygosity mapping in MPS001
and looked for likely candidate LMPS/EVMPS genes from within the chromosome 19 region of
homozygosity that contained 345 known or predicted genes. To select the best candidate
gene/genes for further genetic analysis, I undertook a literature research for each gene based on
the gene function and expression to see whether it had any kind of association with the disease
pathway. This procedure involved (a) researching on the genomic databases (OMIM, PubMed,
UCSC, Ensemble and others) to find the putative function if available, (b) reading the relative
published literature to look for any reported results or linked studies that indicate any role for the
112
gene relevant to MPS/FADS (c) any information on animal model experiments such as model
organism genomic databases (MGI). According to this strategy, RYR1 gene, mapped to
Chromosome 19: 38,433,830-38,587,420 was highlighted to be the best candidate for further
analysis to screen any pathogenic mutations in all the studied cases. It is a very large gene (15.3
kb coding sequence) and encodes RYR1 protein which is found mainly in the skeletal muscle
and known as skeletal muscle calcium release channel. Mutations within RYR1 found to be
implicated in many histological subtypes of congenital myopathies in humans and mouse
models. Further details about the clinical associations and the pathogenicity of RYR1 can be
found the Discussion section of this chapter.
4.2.2b.iiRYR1sequencing:
After selecting RYR1 as the best candidate gene for further analysis, I then proceeded to
sequence the entire coding exons of the gene in all the 36 LMPS/FADS families to search for
mutations and to establish a frequency figure of any detected mutations. PCR amplification and
sequencing was carried out using direct Sanger method for all the genomic DNAs using specific
primers that cover the whole RYR1 open reading Frame (ORF), including the coding exons (106
exons) and the exon-intron boundaries. RYR1 sequencing and mutational screening was
undertaken in all LMPS/FADS affected individuals and the segregation of any detected variants
was checked in parents and other family members (when available) as well.
4.2.3 Histopathological investigations:
Our laboratory collaborators in the Department of Pathology, VU University Medical Centre,
Amsterdam, Netherlands undertook histopathological analysis in order to assess any role of the
RYR1 mutations. Autopsy tissues of intercostal skeletal muscle were obtained from the two
affected fetuses of family MPS001 (12 + 6 and 14 + 0 weeks GA, respectively) and two age-
113
matched controls (13 + 0 and 13 + 4 weeks GA, respectively). The tissue was taken from the
autopsy archive of the VU University Medical Center, and was the only available tissue for both
patients. In the experimental details provided by the team, the tissue sections were fixed by
formalin and embedded by paraffin and the processing was consistent with the standard
protocols (Bancroft and Gamble, 2008). A variety of stains were used including Hematoxylin &
Eosin, Gomori trichrome and alizarin red S for calcium and each stain has different use. After
heat-induced antigen retrieval in 0.01 M citrate buffer (pH6), immunohistochemical staining was
performed with antibodies against desmin (Abcam, 1:500), myosin heavy chain slow (Abcam,
1:100), active caspase 3 (Dako, 1:500), CD3 (Dako, 1:250), CD20 (Dako, 1:50) and CD45
(Dako, 1:100). Immunoreactivity was detected with 3, 3′-diaminobenzidine as chromogen. The
photographs for the tissue sections were taken by Leica DM6000B microscope (Leica
Microsystems). Omitting primary antibodies yielded no significant staining. The
histopathological examinations included an Ultrastructural analysis for all the muscle tissue
which fixed in formalin solution. The tissue was deparaffinised in xylene (60 minutes at 70°C),
rehydrated,fixed with 2% glutaraldehyde in 0.1 M sodium cacodylate buffer (pH 7.4), post-fixed
in 2% osmium tetroxide and embedded in epoxy resin. Ultrathin sections were stained with
uranyl acetate and lead citrate and viewed in a FEI Technai 12 electron microscope. The pictures
were acquired as TIFF files and images were optimized for brightness and contrast using
Photoshop, version 7.0 (Adobe systems, San Jose, CA).
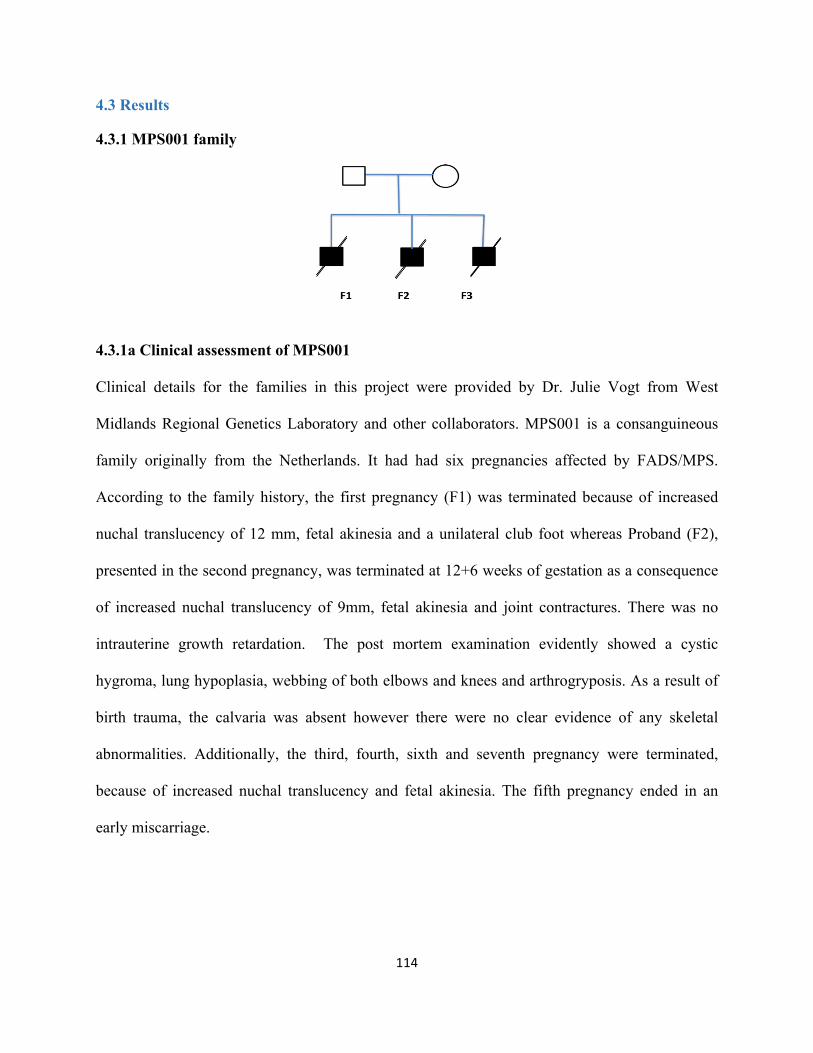
114
4.3 Results
4.3.1 MPS001 family
4.3.1a Clinical assessment of MPS001
Clinical details for the families in this project were provided by Dr. Julie Vogt from West
Midlands Regional Genetics Laboratory and other collaborators. MPS001 is a consanguineous
family originally from the Netherlands. It had had six pregnancies affected by FADS/MPS.
According to the family history, the first pregnancy (F1) was terminated because of increased
nuchal translucency of 12 mm, fetal akinesia and a unilateral club foot whereas Proband (F2),
presented in the second pregnancy, was terminated at 12+6 weeks of gestation as a consequence
of increased nuchal translucency of 9mm, fetal akinesia and joint contractures. There was no
intrauterine growth retardation. The post mortem examination evidently showed a cystic
hygroma, lung hypoplasia, webbing of both elbows and knees and arthrogryposis. As a result of
birth trauma, the calvaria was absent however there were no clear evidence of any skeletal
abnormalities. Additionally, the third, fourth, sixth and seventh pregnancy were terminated,
because of increased nuchal translucency and fetal akinesia. The fifth pregnancy ended in an
early miscarriage.
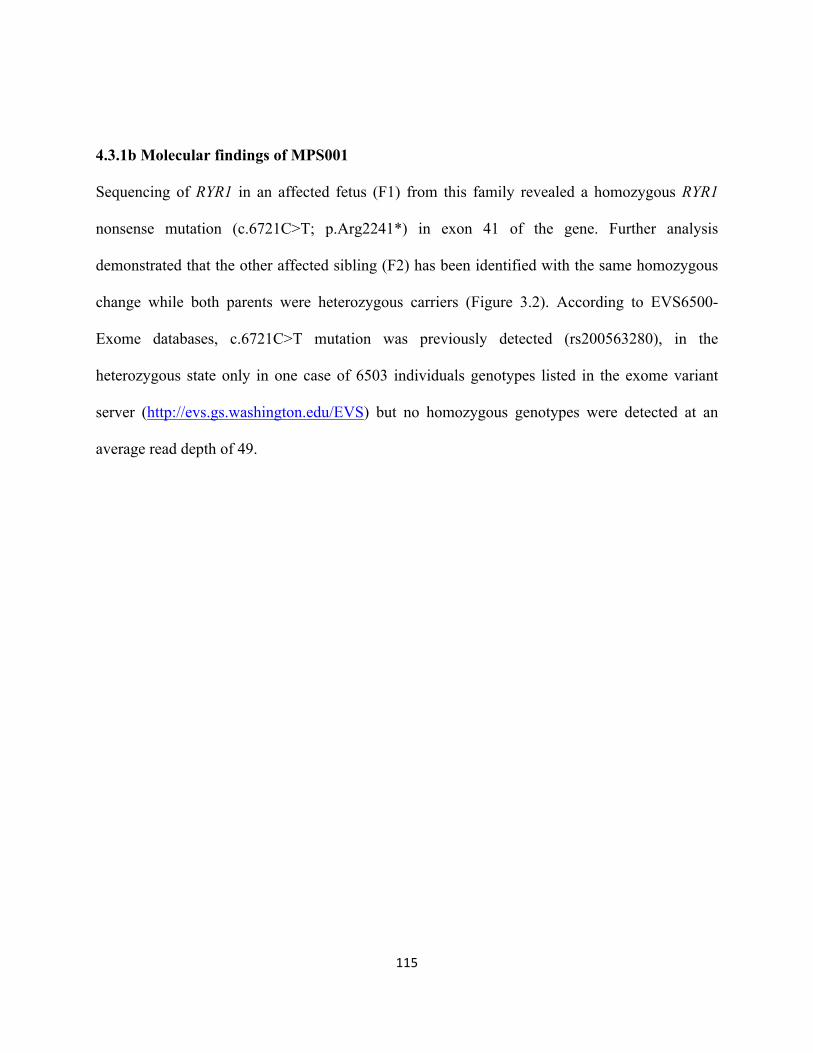
115
4.3.1b Molecular findings of MPS001
Sequencing of RYR1 in an affected fetus (F1) from this family revealed a homozygous RYR1
nonsense mutation (c.6721C>T; p.Arg2241*) in exon 41 of the gene. Further analysis
demonstrated that the other affected sibling (F2) has been identified with the same homozygous
change while both parents were heterozygous carriers (Figure 3.2). According to EVS6500-
Exome databases, c.6721C>T mutation was previously detected (rs200563280), in the
heterozygous state only in one case of 6503 individuals genotypes listed in the exome variant
server (http://evs.gs.washington.edu/EVS) but no homozygous genotypes were detected at an
average read depth of 49.
116
6841 GCTATTTCTGCCGAATCAGCCGGCAGAACCAGCGCTCCATGTTTGACCACCTGAGCTACC 6900
6710 GCTATTTCTGCCGAATCAGCCGGCAGAACCAGCGCTCCATGTTTGACCACCTGAGCTACC 6769
2237 C--Y--F--C--R--I--S--R--Q--N--Q--R--S--M--F--D--H--L--S--Y-- 2256
Figure4.3homozygousRYR1stopcodondetectedinMPS0001family
homozygousstopcodonc.6721(p.Arg2242*)wasdetectedinMPS0001familyoftwoaffectedsibling(F1&F2chromatograms)andbothparentswereheterozygousforthemutantalleles(3rd&4thchromatograms).
4.3.1c Pathological findings of MPS001
The quantitative histopathological examination performed by the Dutch collaborators showed
some structural abnormalities in the affected siblings tissues, including fibre loss, increased fibre
size variability and increased endomysial spacing with fibrosis (Figure 3A, B). Centrally
positioned nuclei were notified in the examined muscle fibres in both patients and controls. In
Normalreference
117
contrast, thin muscle fibres with intense eosinophilic cytoplasm were seen only in the patients,
while the controls were completely normal under the microscope (Figure 3.3 A,B) and this had
nothing to do with calcium accumulation according to the specialized team (Figure 3.3 J).
Moreover, staining against desmin, an intermediate filament protein which normally exists in
muscle, showed no core-like structures (Figure 3.3C,D). Further significant staining against the
slow and fast myosin heavy chain was carried out by the group in order to assess fibre type
distribution, however, the results showed a notable reduction in the level of myosin slow
immunoreactivity, which indicates preferential hypotrophy of type I fibres (Figure 3.3 E-H).
Labelling for active caspase 3 excluded apoptotic loss of muscle fibres (Figure 3.3 I). Further
fine investigations showed hypotrophy associated with profound myofibrillar disarray and Z-disc
loss (Figure 3K,L). The analysis of the spinal cord did not show any loss of motor neurons or
other abnormal pathological features in the anterior horns and all the proximal segments of the
motor neural system and this confirm that the histopathological findings are mostly myogenic.
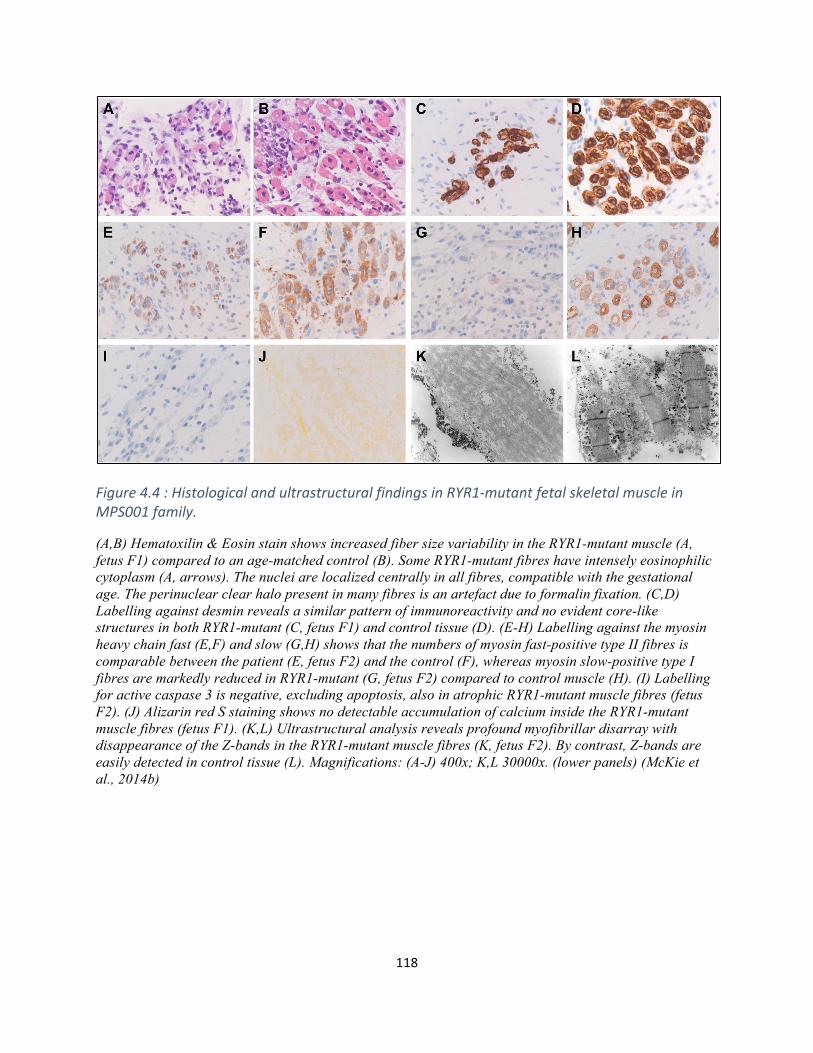
118
Figure4.4:HistologicalandultrastructuralfindingsinRYR1-mutantfetalskeletalmuscleinMPS001family.
(A,B) Hematoxilin & Eosin stain shows increased fiber size variability in the RYR1-mutant muscle (A, fetus F1) compared to an age-matched control (B). Some RYR1-mutant fibres have intensely eosinophilic cytoplasm (A, arrows). The nuclei are localized centrally in all fibres, compatible with the gestational age. The perinuclear clear halo present in many fibres is an artefact due to formalin fixation. (C,D) Labelling against desmin reveals a similar pattern of immunoreactivity and no evident core-like structures in both RYR1-mutant (C, fetus F1) and control tissue (D). (E-H) Labelling against the myosin heavy chain fast (E,F) and slow (G,H) shows that the numbers of myosin fast-positive type II fibres is comparable between the patient (E, fetus F2) and the control (F), whereas myosin slow-positive type I fibres are markedly reduced in RYR1-mutant (G, fetus F2) compared to control muscle (H). (I) Labelling for active caspase 3 is negative, excluding apoptosis, also in atrophic RYR1-mutant muscle fibres (fetus F2). (J) Alizarin red S staining shows no detectable accumulation of calcium inside the RYR1-mutant muscle fibres (fetus F1). (K,L) Ultrastructural analysis reveals profound myofibrillar disarray with disappearance of the Z-bands in the RYR1-mutant muscle fibres (K, fetus F2). By contrast, Z-bands are easily detected in control tissue (L). Magnifications: (A-J) 400x; K,L 30000x. (lower panels) (McKie et al., 2014b)
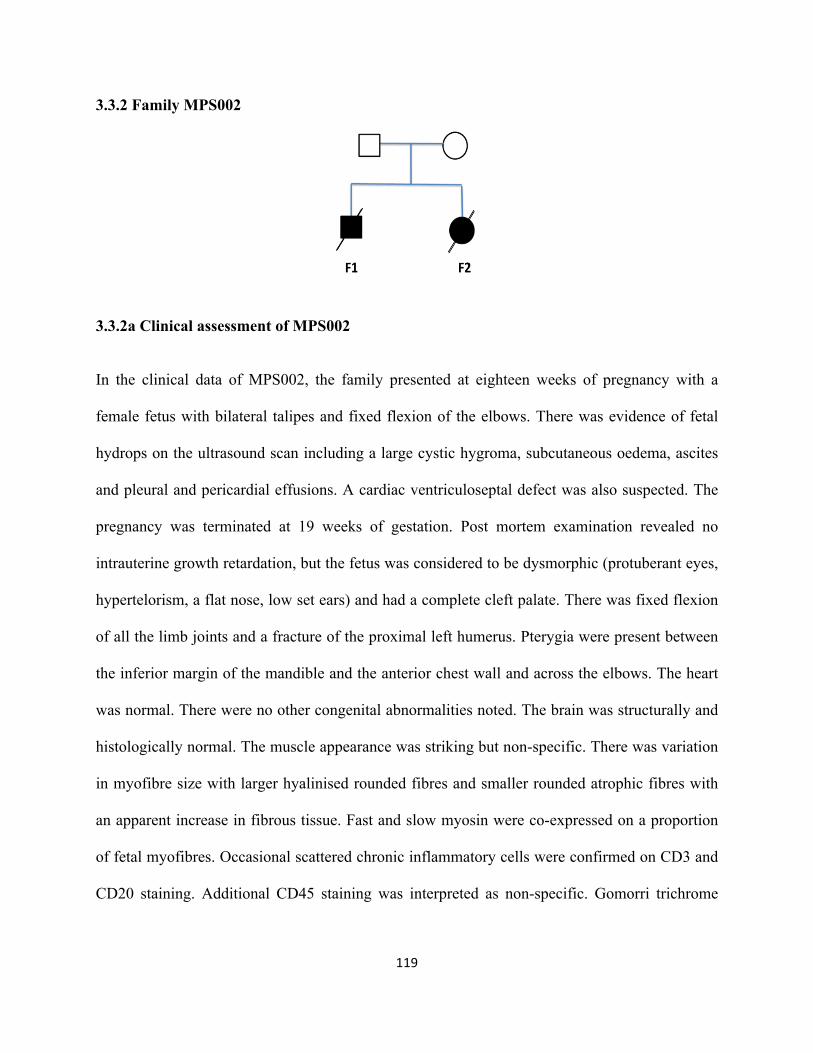
119
3.3.2 Family MPS002
3.3.2a Clinical assessment of MPS002
In the clinical data of MPS002, the family presented at eighteen weeks of pregnancy with a
female fetus with bilateral talipes and fixed flexion of the elbows. There was evidence of fetal
hydrops on the ultrasound scan including a large cystic hygroma, subcutaneous oedema, ascites
and pleural and pericardial effusions. A cardiac ventriculoseptal defect was also suspected. The
pregnancy was terminated at 19 weeks of gestation. Post mortem examination revealed no
intrauterine growth retardation, but the fetus was considered to be dysmorphic (protuberant eyes,
hypertelorism, a flat nose, low set ears) and had a complete cleft palate. There was fixed flexion
of all the limb joints and a fracture of the proximal left humerus. Pterygia were present between
the inferior margin of the mandible and the anterior chest wall and across the elbows. The heart
was normal. There were no other congenital abnormalities noted. The brain was structurally and
histologically normal. The muscle appearance was striking but non-specific. There was variation
in myofibre size with larger hyalinised rounded fibres and smaller rounded atrophic fibres with
an apparent increase in fibrous tissue. Fast and slow myosin were co-expressed on a proportion
of fetal myofibres. Occasional scattered chronic inflammatory cells were confirmed on CD3 and
CD20 staining. Additional CD45 staining was interpreted as non-specific. Gomorri trichrome
120
staining was negative for nemaline rods and ragged red fibres. The couple had a previous
intrauterine death at 23 weeks of gestation of a similarly affected male fetus.
4.3.2b Molecular findings of MPS002
Mutation screening in this family revealed a novel in-frame deletion of 27 nucleotides (c.2096-
2123del). This was absent from the known genomic database and our in-house database. This
27bp deletion is located in exon 18 and the two affected fetuses of the family (F1&F2) were
homozygous for the deletion while both parents were heterozygous carriers (Figure 3.4 ) (no
sequence data for F2 due to the insufficient DNA). This novel deletion was predicted to result in
a missense substitution (p.Glu699Asp) followed by a deletion of 9 amino acids; located within
the SPRY1 domain of the RYR1 gene product. All these deleted amino acids were conserved in
vertebrate RYR1 orthologues including zebrafish and 6 of 9 amino acids were conserved in
C.elegans (Figure 3.4b).
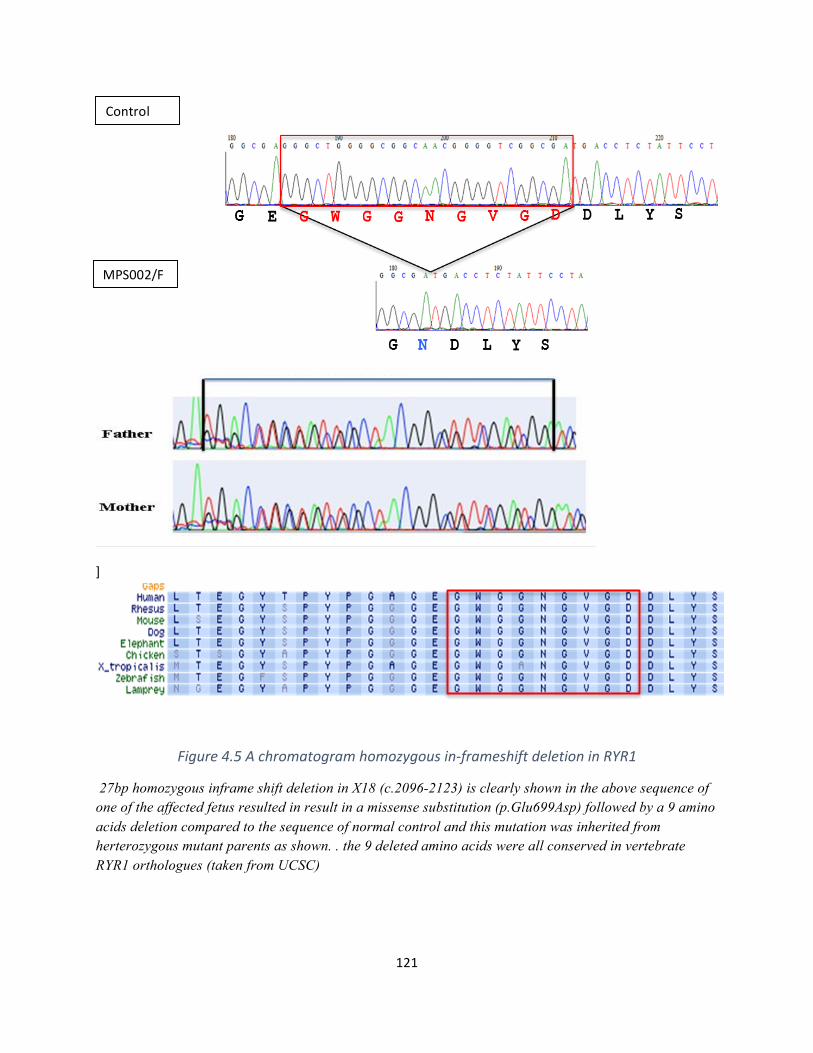
121
]
Figure4.5Achromatogramhomozygousin-frameshiftdeletioninRYR1
27bp homozygous inframe shift deletion in X18 (c.2096-2123) is clearly shown in the above sequence of one of the affected fetus resulted in result in a missense substitution (p.Glu699Asp) followed by a 9 amino acids deletion compared to the sequence of normal control and this mutation was inherited from herterozygous mutant parents as shown. . the 9 deleted amino acids were all conserved in vertebrate RYR1 orthologues (taken from UCSC)
Control
MPS002/F
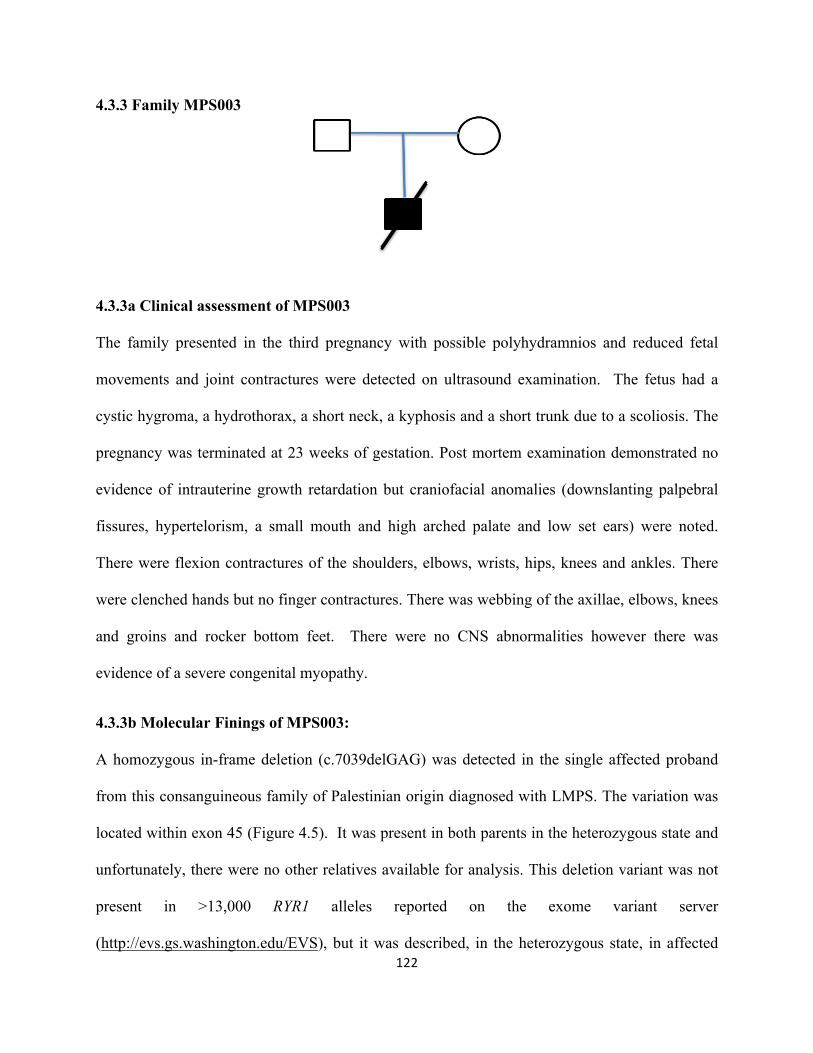
122
4.3.3 Family MPS003
4.3.3a Clinical assessment of MPS003
The family presented in the third pregnancy with possible polyhydramnios and reduced fetal
movements and joint contractures were detected on ultrasound examination. The fetus had a
cystic hygroma, a hydrothorax, a short neck, a kyphosis and a short trunk due to a scoliosis. The
pregnancy was terminated at 23 weeks of gestation. Post mortem examination demonstrated no
evidence of intrauterine growth retardation but craniofacial anomalies (downslanting palpebral
fissures, hypertelorism, a small mouth and high arched palate and low set ears) were noted.
There were flexion contractures of the shoulders, elbows, wrists, hips, knees and ankles. There
were clenched hands but no finger contractures. There was webbing of the axillae, elbows, knees
and groins and rocker bottom feet. There were no CNS abnormalities however there was
evidence of a severe congenital myopathy.
4.3.3b Molecular Finings of MPS003:
A homozygous in-frame deletion (c.7039delGAG) was detected in the single affected proband
from this consanguineous family of Palestinian origin diagnosed with LMPS. The variation was
located within exon 45 (Figure 4.5). It was present in both parents in the heterozygous state and
unfortunately, there were no other relatives available for analysis. This deletion variant was not
present in >13,000 RYR1 alleles reported on the exome variant server
(http://evs.gs.washington.edu/EVS), but it was described, in the heterozygous state, in affected
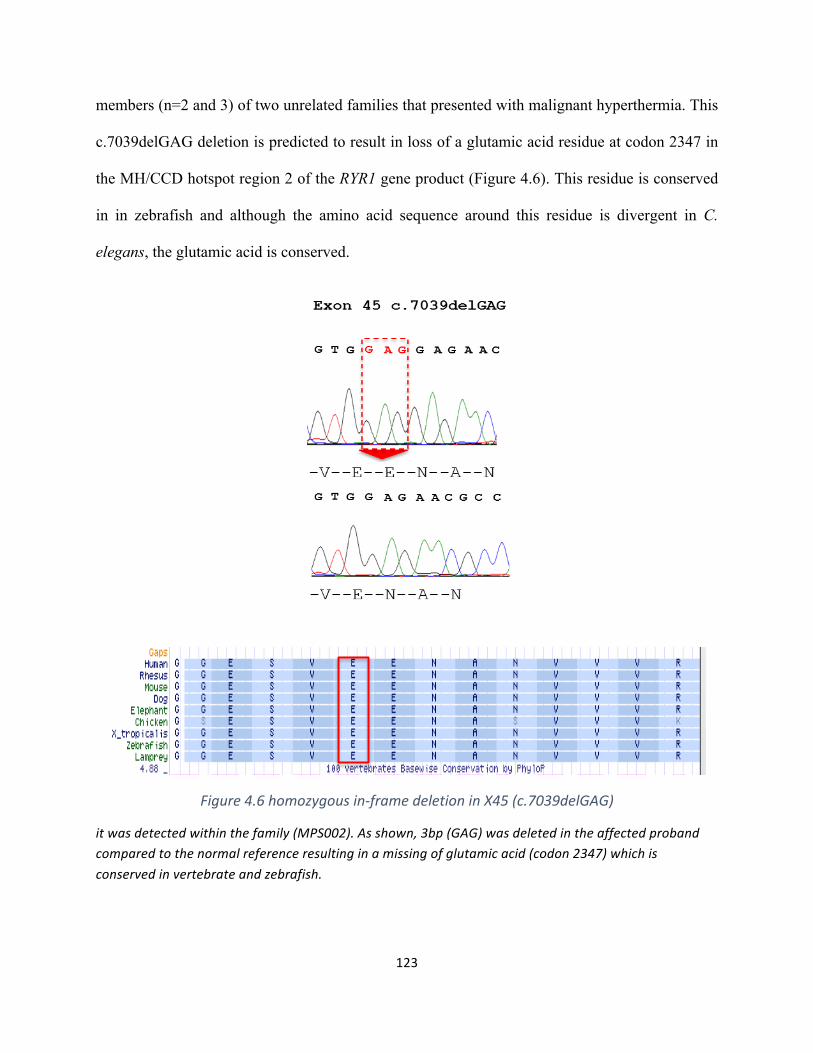
123
members (n=2 and 3) of two unrelated families that presented with malignant hyperthermia. This
c.7039delGAG deletion is predicted to result in loss of a glutamic acid residue at codon 2347 in
the MH/CCD hotspot region 2 of the RYR1 gene product (Figure 4.6). This residue is conserved
in in zebrafish and although the amino acid sequence around this residue is divergent in C.
elegans, the glutamic acid is conserved.
Figure4.6homozygousin-framedeletioninX45(c.7039delGAG)
itwasdetectedwithinthefamily(MPS002).Asshown,3bp(GAG)wasdeletedintheaffectedprobandcomparedtothenormalreferenceresultinginamissingofglutamicacid(codon2347)whichisconservedinvertebrateandzebrafish.
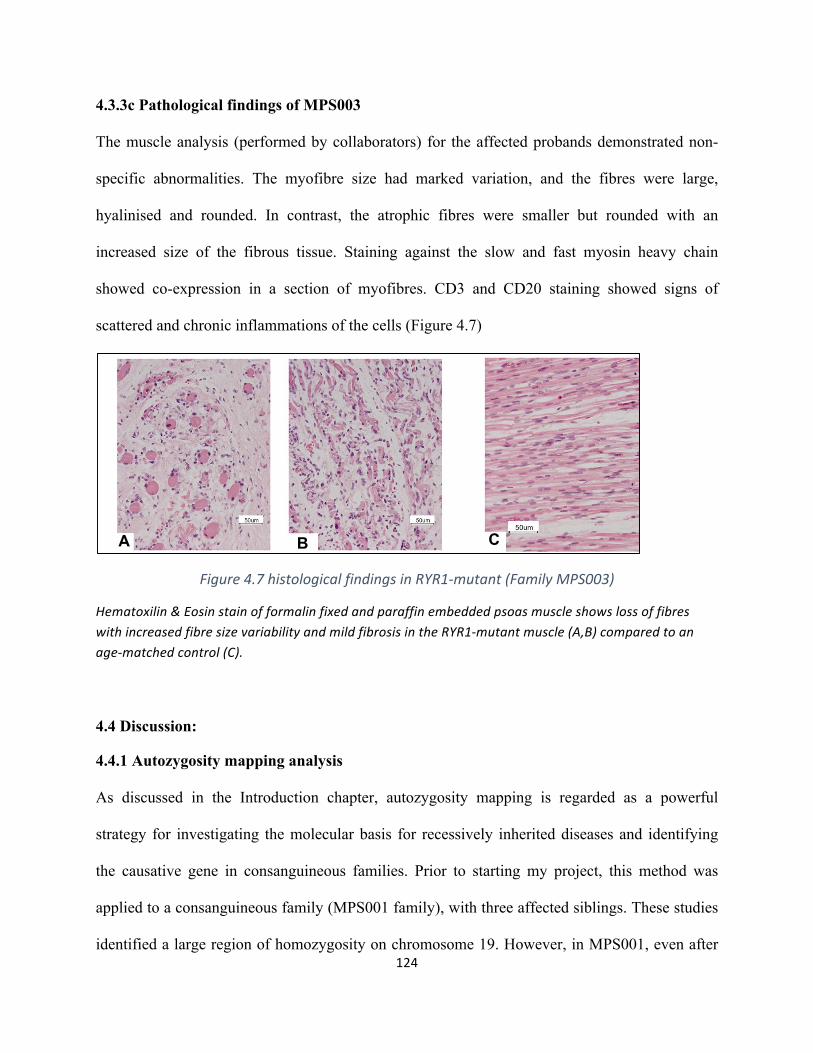
124
4.3.3c Pathological findings of MPS003
The muscle analysis (performed by collaborators) for the affected probands demonstrated non-
specific abnormalities. The myofibre size had marked variation, and the fibres were large,
hyalinised and rounded. In contrast, the atrophic fibres were smaller but rounded with an
increased size of the fibrous tissue. Staining against the slow and fast myosin heavy chain
showed co-expression in a section of myofibres. CD3 and CD20 staining showed signs of
scattered and chronic inflammations of the cells (Figure 4.7)
Figure4.7histologicalfindingsinRYR1-mutant(FamilyMPS003)
Hematoxilin&EosinstainofformalinfixedandparaffinembeddedpsoasmuscleshowslossoffibreswithincreasedfibresizevariabilityandmildfibrosisintheRYR1-mutantmuscle(A,B)comparedtoanage-matchedcontrol(C).
4.4 Discussion:
4.4.1 Autozygosity mapping analysis
As discussed in the Introduction chapter, autozygosity mapping is regarded as a powerful
strategy for investigating the molecular basis for recessively inherited diseases and identifying
the causative gene in consanguineous families. Prior to starting my project, this method was
applied to a consanguineous family (MPS001 family), with three affected siblings. These studies
identified a large region of homozygosity on chromosome 19. However, in MPS001, even after
A B C
125
the candidate region was refined by genotyping with microsatellite markers, the target interval
contained a large number of genes (345 genes). I followed a specific prioritization procedure
(previously explained) to identify candidate genes and selected RYR1 as the promising candidate.
4.4.2 Mutational analysis of RYR1
RYR1 is a very large gene (15.3 kb) which composed of 106 exons and encodes a large RYR1
protein (565kDa) that is a key component of the excitation-coupling (EC) process in skeletal
muscle. RYR1 is a subtype of Ryanodine receptors (RyRs) which are intracellular calcium
(Ca2+) release channels located on the endo/sarcoplasmic reticulum (ER/SR) and represent the
major Ca2+ reservoir inside the cell. RyR1 facilitates the rapid and coordinated release of Ca2+
from the sarcoplasmic reticulum stores to initiate the skeletal muscle contraction The excitation-
coupling process converts electrical signals/increased Ca2+ levels into mechanical output (i.e.
muscle contraction). Ca2+ ions play a significant signalling role in activating the channel and
regulating the signal. In this mechanism, plasma membrane is depolarised and cause an
activation of L-type voltage-gated calcium channels (Cav). These Cav channels signal RYR1
located on the SR to release Ca2+ to activate muscle contraction (Rios and Brum 1987, Gordon
et al. 2000, des Georges et al. 2016)
It is a well-recognized cause of a variety of human congenital myopathies in particular
congenital central core disease (CCD; MIM# 117000) and the malignant hyperthermia
susceptibility (MHS), congenital skeletal muscle disorder, (MIM# 145600). As these conditions
are inherited as an autosomal dominant trait, most reported mutations are heterozygous variants
(Brandom et al., 2013, Broman et al., 2011). However, in recent years the further
histopathological phenotypes have been associated with RYR1 mutations including multi-
minicore disease (MmD),congenital fiber-type disproportion, and centronuclear myopathy
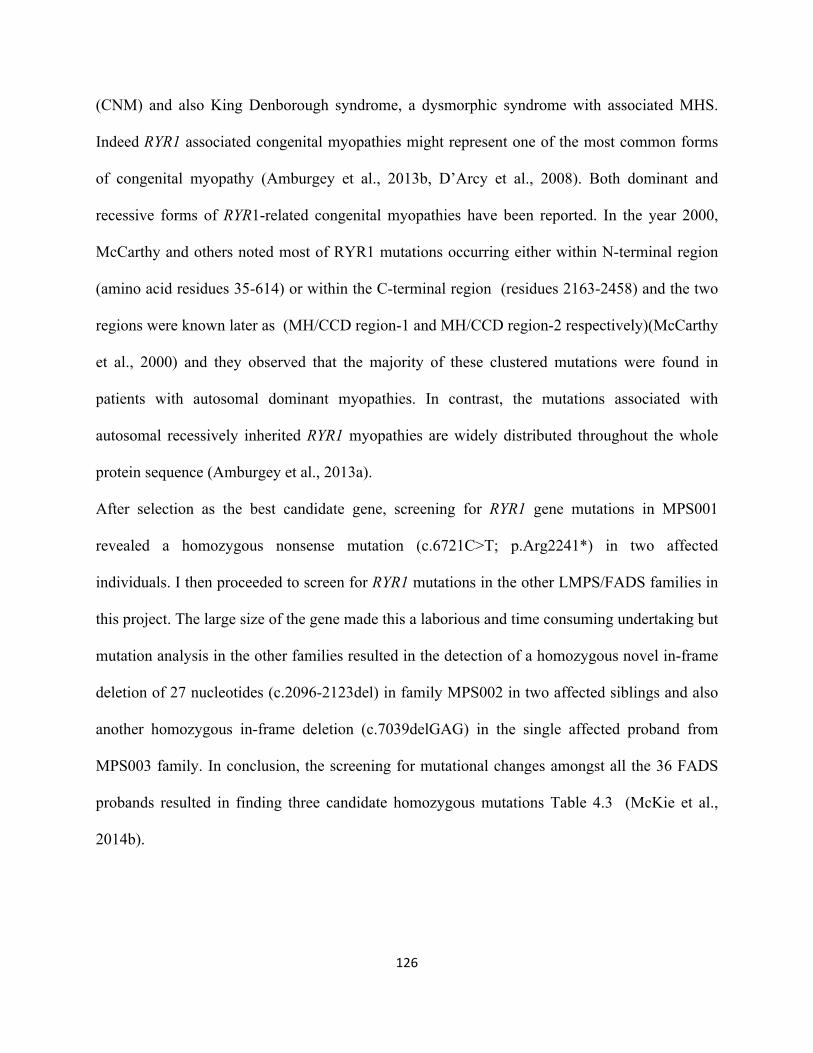
126
(CNM) and also King Denborough syndrome, a dysmorphic syndrome with associated MHS.
Indeed RYR1 associated congenital myopathies might represent one of the most common forms
of congenital myopathy (Amburgey et al., 2013b, D’Arcy et al., 2008). Both dominant and
recessive forms of RYR1-related congenital myopathies have been reported. In the year 2000,
McCarthy and others noted most of RYR1 mutations occurring either within N-terminal region
(amino acid residues 35-614) or within the C-terminal region (residues 2163-2458) and the two
regions were known later as (MH/CCD region-1 and MH/CCD region-2 respectively)(McCarthy
et al., 2000) and they observed that the majority of these clustered mutations were found in
patients with autosomal dominant myopathies. In contrast, the mutations associated with
autosomal recessively inherited RYR1 myopathies are widely distributed throughout the whole
protein sequence (Amburgey et al., 2013a).
After selection as the best candidate gene, screening for RYR1 gene mutations in MPS001
revealed a homozygous nonsense mutation (c.6721C>T; p.Arg2241*) in two affected
individuals. I then proceeded to screen for RYR1 mutations in the other LMPS/FADS families in
this project. The large size of the gene made this a laborious and time consuming undertaking but
mutation analysis in the other families resulted in the detection of a homozygous novel in-frame
deletion of 27 nucleotides (c.2096-2123del) in family MPS002 in two affected siblings and also
another homozygous in-frame deletion (c.7039delGAG) in the single affected proband from
MPS003 family. In conclusion, the screening for mutational changes amongst all the 36 FADS
probands resulted in finding three candidate homozygous mutations Table 4.3 (McKie et al.,
2014b).
127
Table4.4SummaryoftheidentifiedrareRYR1variantsdetectedinfamilieswithLMPS
The overall frequency of RYR1-related disease was 8.3% (3/36; 95% CI 0 to 19.5%) in our
FADS/LMPS cohort. The case for pathogenicity of the three identified variants is supported by
their low frequency in the population and also their absence from large repositories of genetic
variation in control individuals, in addition to the co-segregation of the variants within the
relevant families and evolutionary conservation of the mutated/ deleted amino acid residues, and
finally the location of these variants within conserved domain sites. All these factors are
considered very important for the pathogenicity assessment of any causative genetic variants
(MacArthur et al., 2014). The novel in-frame deletion of 27 nucleotides (c.2097_2123del
p.(Glu699_Gly707del)) detected in Family MPS002 is predicted to result in a missense
substitution (p.E699N) followed by a deletion of 9 amino acids (GWGGNGVGD) within the
SPRY2 predicted protein-protein interaction motif (Peralvarez-Marin et al., 2011). Previously
missense substitutions within or adjacent to this deletion (c.2113G > C; p.Gly705Arg and
p.Asp708Asn) have been reported in recessively inherited myopathies (Klein et al., 2012). The
exon 45 in-frame deletion (c.7043delGAG) identified in Family MPS003 was predicted to result
in loss of a glutamic acid residue at codon 2347. A missense mutation at a nearby residue
(p.Arg2355Trp) has been reported in both dominantly and recessively inherited myopathies (Kim
et al., 2013) and it is interesting that this deletion was previously described in the heterozygous
128
state, in two unrelated families with malignant hyperthermia (Sambuughin et al., 2001).
p.Glu2347 is contained within the MHS/CCD mutation hotspot in N-terminal region 2 (stippled
box Figure 4). Though no history of malignant hyperthermia syndrome was reported in Family
MPS003, incomplete penetrance is well recognised in malignant hyperthermia and mutation
carriers may not have been exposed to trigger events.
Though my findings further established recessive RYR1 mutations as a cause FADS/LMPS,
further work is required to fully establish the precise frequency of RYR1 mutations in
FADS/LMPS cohorts and to address how novel missense or in-frame deletions/insertions might
be reliably interpreted in a clinical diagnostic setting. It is noted that the identified mutations are
located within the mutation hotspot regions (MHS/CCD 1 &2) where most of the previous
mutations of RYR1 was located. Also, interestingly, the three mutations also located within RIH
domain which is a conserved structure RYR1 protein. The 27bp novel in-frameshift deletion
occurred within RIH-1 domain (in the interval 440-643 amino acids) while the nonsense
mutation plus the 3-bp in frame deletion occurred in the RIH-2 domain (in the interval 2157-
2365 amino acids) and this domain is in fact situated in the second main hotspot of RYR1
mutations (Sorrentino et al., 2000) see the below figure 4.8.
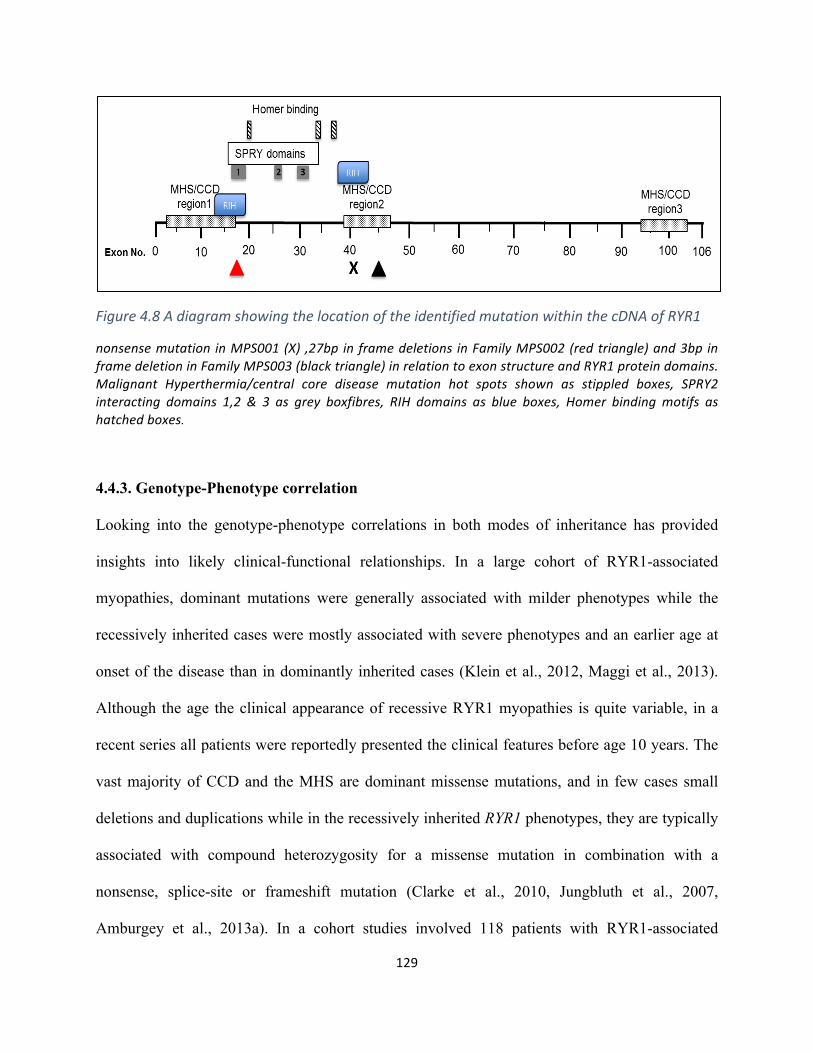
129
Figure4.8AdiagramshowingthelocationoftheidentifiedmutationwithinthecDNAofRYR1
nonsensemutation inMPS001(X) ,27bp inframedeletions inFamilyMPS002(redtriangle)and3bp inframedeletioninFamilyMPS003(blacktriangle)inrelationtoexonstructureandRYR1proteindomains.Malignant Hyperthermia/central core disease mutation hot spots shown as stippled boxes, SPRY2interacting domains 1,2 & 3 as grey boxfibres, RIH domains as blue boxes, Homer bindingmotifs ashatchedboxes.
4.4.3. Genotype-Phenotype correlation
Looking into the genotype-phenotype correlations in both modes of inheritance has provided
insights into likely clinical-functional relationships. In a large cohort of RYR1-associated
myopathies, dominant mutations were generally associated with milder phenotypes while the
recessively inherited cases were mostly associated with severe phenotypes and an earlier age at
onset of the disease than in dominantly inherited cases (Klein et al., 2012, Maggi et al., 2013).
Although the age the clinical appearance of recessive RYR1 myopathies is quite variable, in a
recent series all patients were reportedly presented the clinical features before age 10 years. The
vast majority of CCD and the MHS are dominant missense mutations, and in few cases small
deletions and duplications while in the recessively inherited RYR1 phenotypes, they are typically
associated with compound heterozygosity for a missense mutation in combination with a
nonsense, splice-site or frameshift mutation (Clarke et al., 2010, Jungbluth et al., 2007,
Amburgey et al., 2013a). In a cohort studies involved 118 patients with RYR1-associated
130
recessively inherited myopathies, 61.5% of the cases had a truncating/in frame deletion/splice
site mutation in combination with a missense mutation while 38.1% of the cases had two
missense mutations (Klein et al., 2012, Maggi et al., 2013, Jungbluth et al., 2007).
In my investigations I identified a homozygous null mutation in LMPS/FADS affected
individuals from Family MPS001 and this finding is consistent with a previous study
investigating the role of the RAPSN gene in FADS/LMPS. The study concluded that
homozygosity for a null (frameshift) mutation can cause FADS/LMPS whereas other compound
mutations with only a single null mutation can cause a milder phenotype (Vogt et al., 2008) .
Also, it is consistent with the observation that in mice Ryr1 knockout was lethal in the perinatal
period due to heart and lung abnormalities (Takeshima et al., 1994). Our finding also agreed with
the fact that fetal akinesia caused by RYR1 recessive mutations had earlier onset of the disease in
comparison to the dominantly inherited mutations (Klein et al., 2012). In addition, a study
reported seven fetuses/infants from six unrelated families affected by central core disease in
whom there was a history of fetal akinesia (Romero et al., 2003). In that study: four cases from
three families were found to harbour RYR1 mutations: three cases (from two families) were
compound heterozygotes for RYR1 missense mutations and in one case only a heterozygous
missense mutation was detected. Three of the four cases presented at birth and though in one
case the fetus died at 32 weeks gestation (following termination of pregnancy after a previously
affected sibling). Thus the phenotype in these cases was less severe than in the cases I studied
and my findings demonstrated that the association between RYR1 mutations and fetal akinesia
extends to severe early onset lethal FADS and that histopathological evidence of central core
disease is not a prerequisite for molecular investigation of RYR1 in fetal akinesia. In a recent
review of congenital myopathies treated at a single referral centre, a genetic diagnosis was
131
established in two-thirds of cases and almost 60% of those with a genetic diagnosis had a RYR1-
related myopathy (Maggi et al., 2013).
My findings suggest that RYR1-related neuromuscular disease may be a significant cause of
FADS/LMPS. Though recessively inherited RYR1-related myopathies have been associated with
certain histopathological subtypes such as minicore, centronuclear and congenital fibre-type
disproportion myopathies, RYR1 mutations may be associated with other histological subtypes or
only nonspecific myopathic features. Extrapolating from these observations, it can be suggested
that in cases of FADS/LMPS, RYR1 mutation analysis should be performed as part of a
multigene diagnostic strategy (e.g. by second generation sequencing analysis) rather than being
specifically targeted to cases with histopathological features that are considered characteristic of
a RYR1-associated myopathy. The identification of RYR1 mutations as a cause of familial
LMPS/ fetal akinesia enables accurate reproductive risk prediction and reproductive options
including prenatal diagnosis and pre-implantation diagnosis but also might lead to the
identification of relatives at risk of malignant hyperthermia.

132
ChapterFive:theapplicationofCESinMPSdisorder
133
5.1 Introduction
Clinical exome sequencing (CES) is a NGS-based approach that focuses on specific
genes/regions which have been associated with disease causing-mutations and reported in the
Human Mutation Database (Lee et al., 2014). This targeted exome component represents nearly
25% of the whole exome (~5000 genes). Many users will analyse only a subgroup of genes in a
disease specific panel which is updated continuously. The first existence of clinical diagnostic
exome panel was in 2011 by Ambry Genetics (Aliso Viejo, CA, USA). Then, Illumina Inc. (San
Diego, CA, USA) has designed a new kit for CES that composed of 2800 genes based on
Nextera enrichment method (TruSight™ One). However, this particular kit has been developed
to contain further 2000 genes (4813 genes in total) which was used in this project.
There are some advantages of the application of clinical exome in the diagnosis of rare inherited
disorders. First, it is a cost-effective method compared to the whole exome as it only focuses on
the clinical associated genes with deep achievable coverage and less data to be analysed.
Second, the number of resulting non-significant variants or variants of uncertain significance is
considerably less than the data generated by whole exome/whole genome sequencing. Therefore,
analysing the data would be faster and easier with this approach (Klein et al., 2014). Multiple
pterygium syndrome (MPS) and its related phenotypes are characterised by marked genetic
heterogeneity which makes molecular diagnosis very challenging as many genes could be
involved in the disease.
Screening for RYR1 mutations that I performed in 36 LMPS/FADS families -in the previous
chapter- has only resulted in identifying three homozygous mutations in three affected families
while the others screened patients remained genetically undiagnosed. Hence, further analysis
needed to be done for these families. Furthermore, many other families diagnosed with MPS
134
subtypes (EVMPS/arthrogryposis etc.) were recruited to this study in order to investigate the
genetic causes of these families. Instead of sequencing the candidate genes by Sanger sequencing
on an exon-by-exon basis, it was decided that a more efficient approach would be to use a NGS-
based sequencing technology.
In collaboration with Dr.Arthur Mckie in Cambridge, I investigated the application of “clinical
exome” sequencing (Illumina TruSightOne assay for ~4800 human disease genes) to study the
genetic basis of MPS-related phenotypes. I wished to evaluate whether clinical exome
sequencing in MPS-related phenotypes (FADS, LMPS, EVMPS, distal arthrogryposis) could
provide a more cost-effective molecular genetic analysis strategy for clinical diagnostic testing
than the whole exome sequencing (WES) and also whether this analysis might provide a new
insight into genotype-phenotype correlations in MPS-related disorders.
5.2 Patients:
Fifty-three patients were recruited in this study. All the cases were clinically diagnosed by MPS-
spectrum disorders (LMPS/FADS/EVMPS/arthrogrypposis) and the diagnosis was done by
clinicians from across the UK (Table 5.1). All the clinical details and family history for the
patients were provided by clinical geneticists (Dr Julie Vogt, Professor Eamonn Maher and
others). Also, DNA from parents and unaffected family members was extracted to test the
segregation of any candidate mutation. Eight probands out of 53 who underwent clinical exome
analysis were known to harbour a mutation in an MPS-related gene (including two cases with
RYR1 mutations reported previously in this chapter that have been published) (McKie et al.,
2014a) and these were included as positive controls for the study. The remaining 45 cases were
genetically undiagnosed though most of them had undergone a variable amount of pre-study
genetic analysis either in the NHS diagnostic laboratory or by the Maher research group and had
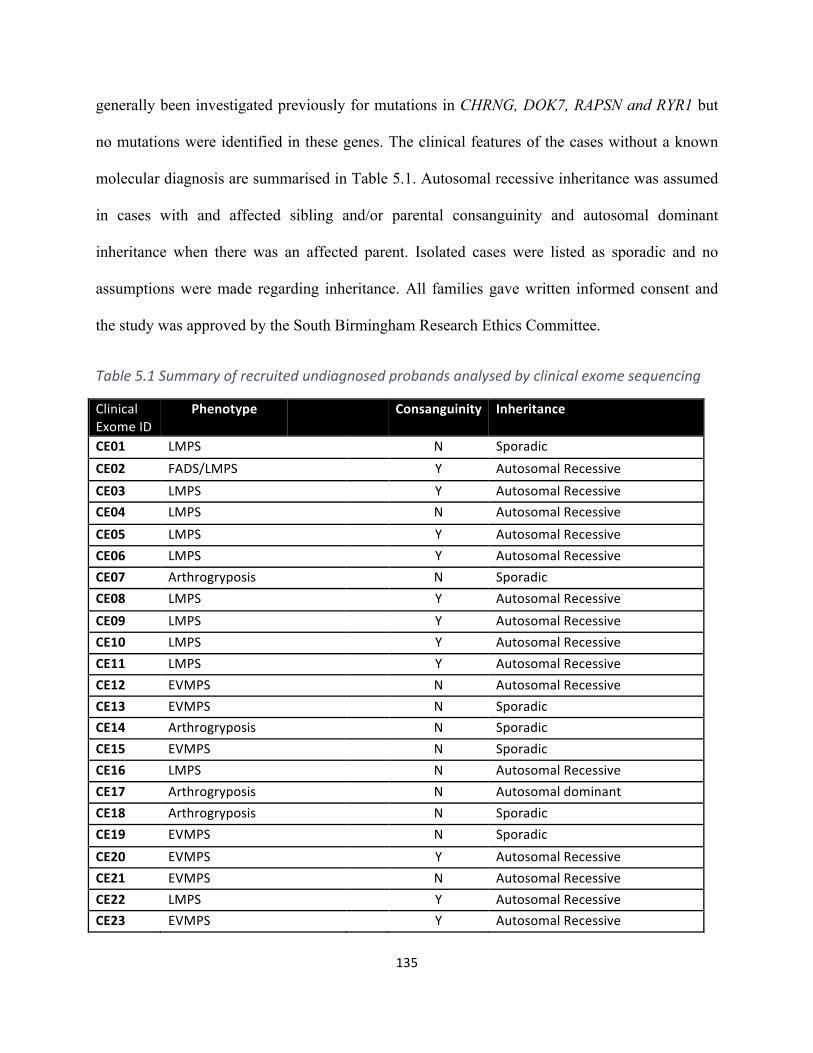
135
generally been investigated previously for mutations in CHRNG, DOK7, RAPSN and RYR1 but
no mutations were identified in these genes. The clinical features of the cases without a known
molecular diagnosis are summarised in Table 5.1. Autosomal recessive inheritance was assumed
in cases with and affected sibling and/or parental consanguinity and autosomal dominant
inheritance when there was an affected parent. Isolated cases were listed as sporadic and no
assumptions were made regarding inheritance. All families gave written informed consent and
the study was approved by the South Birmingham Research Ethics Committee.
Table5.1Summaryofrecruitedundiagnosedprobandsanalysedbyclinicalexomesequencing
ClinicalExomeID
Phenotype Consanguinity Inheritance
CE01 LMPS N SporadicCE02 FADS/LMPS Y AutosomalRecessiveCE03 LMPS Y AutosomalRecessiveCE04 LMPS N AutosomalRecessiveCE05 LMPS Y AutosomalRecessiveCE06 LMPS Y AutosomalRecessiveCE07 Arthrogryposis N SporadicCE08 LMPS Y AutosomalRecessiveCE09 LMPS Y AutosomalRecessiveCE10 LMPS Y AutosomalRecessiveCE11 LMPS Y AutosomalRecessiveCE12 EVMPS N AutosomalRecessiveCE13 EVMPS N SporadicCE14 Arthrogryposis N SporadicCE15 EVMPS N SporadicCE16 LMPS N AutosomalRecessiveCE17 Arthrogryposis N AutosomaldominantCE18 Arthrogryposis N SporadicCE19 EVMPS N SporadicCE20 EVMPS Y AutosomalRecessiveCE21 EVMPS N AutosomalRecessiveCE22 LMPS Y AutosomalRecessiveCE23 EVMPS Y AutosomalRecessive
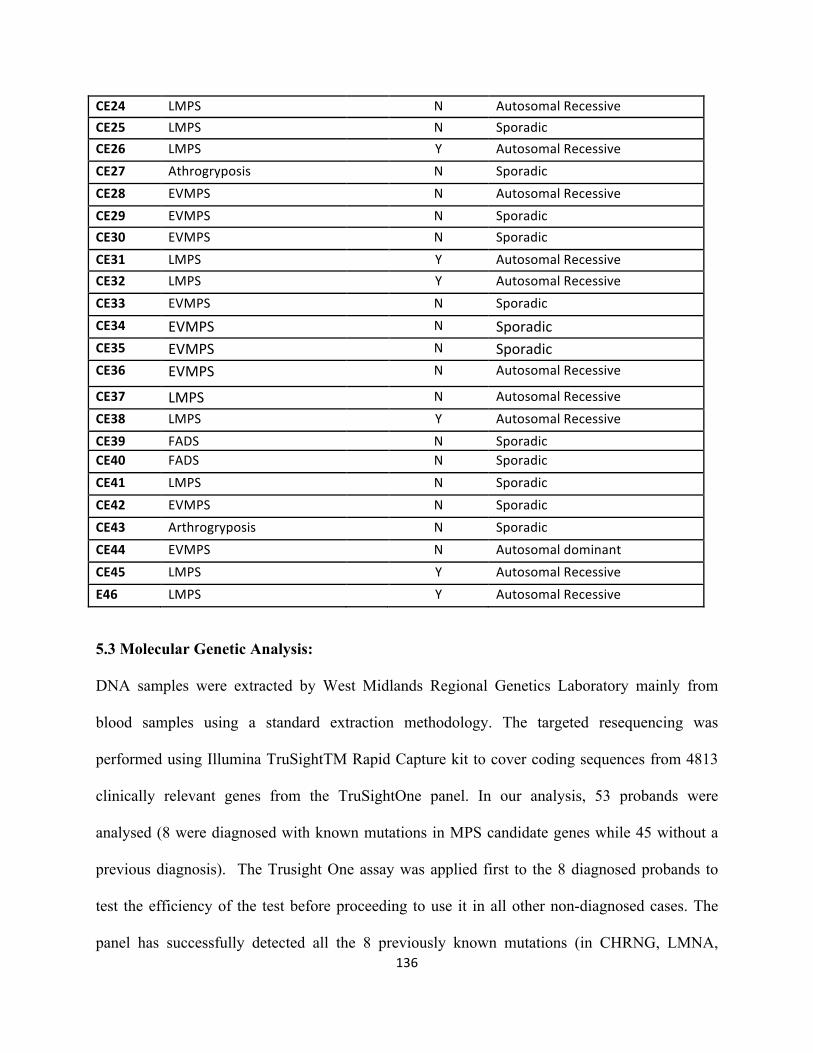
136
CE24 LMPS N AutosomalRecessiveCE25 LMPS N SporadicCE26 LMPS Y AutosomalRecessiveCE27 Athrogryposis N SporadicCE28 EVMPS N AutosomalRecessiveCE29 EVMPS N SporadicCE30 EVMPS N SporadicCE31 LMPS Y AutosomalRecessiveCE32 LMPS Y AutosomalRecessiveCE33 EVMPS N SporadicCE34 EVMPS N SporadicCE35 EVMPS N SporadicCE36 EVMPS N AutosomalRecessive
CE37 LMPS N AutosomalRecessiveCE38 LMPS Y AutosomalRecessiveCE39 FADS N SporadicCE40 FADS N SporadicCE41 LMPS N SporadicCE42 EVMPS N SporadicCE43 Arthrogryposis N SporadicCE44 EVMPS N AutosomaldominantCE45LMPS Y AutosomalRecessiveE46 LMPS Y AutosomalRecessive
5.3 Molecular Genetic Analysis:
DNA samples were extracted by West Midlands Regional Genetics Laboratory mainly from
blood samples using a standard extraction methodology. The targeted resequencing was
performed using Illumina TruSightTM Rapid Capture kit to cover coding sequences from 4813
clinically relevant genes from the TruSightOne panel. In our analysis, 53 probands were
analysed (8 were diagnosed with known mutations in MPS candidate genes while 45 without a
previous diagnosis). The Trusight One assay was applied first to the 8 diagnosed probands to
test the efficiency of the test before proceeding to use it in all other non-diagnosed cases. The
panel has successfully detected all the 8 previously known mutations (in CHRNG, LMNA,
137
RAPSN, RYR1). Then, we decided to use the panel to most of the undiagnosed cases. The panel
contains all the required reagents for the amplification, amplicon enrichment, indexing of the
samples and the use of NextSeq 500 (Dello Russo et al., 2014). Using Nextera library
preparation technology, genomic DNA was fragmented and tagged prior to multiplex pre-
enrichment sample pooling, an average 400bp fragment library size is achieved and a final
pooled library concentration of 8-12Pm was assembled. For the assessment of the genomic
library quality, 2100 Bioanalyzer tools (Agilent Technology) were used. The sequencing was
then performed on NGS Illumina’s HiSeq2500 analyser employing a pair-end 150-cycle
sequencing run. The Trusight One sequencing assay was performed by members of the Stratified
Medicine Core Laboratory in Cambridge. I then analysed the clinical exome data to identify
candidate mutations. Bioinformatics analysis and annotation of rare genetic variants were
performed. Any variant reported >2% heterozygote frequency in 1,000 genomes project and
variant exome server data (www.1000genomes.org/ and http://evs.gs.washington.edu/EVS/
respectively) was removed. Sequence data was inspected in two stages: I primarily focused on
the gens that present in the clinical diagnostic gene panel (n=39 genes) and then in a wider set of
further 47 potential MPS-related genes giving a total of 86 genes that were thought to be of
potential relevance to MPS-related phenotypes. Finally, if no candidate mutations were
identified, then all rare variants were inspected (Figure 5.1 & Table 5.2).
The variants identified as pathogenic mutations were confirmed by Sanger sequencing in the
proband sample and, when available, segregation was checked in DNA from other family
members on whole genome amplified DNA (Qiagen REPLI-g kits) and stock DNA. PCR
products were sequenced in forward and reverse orientations using a standard sequencing
method (BigDye® Terminator v3.1 Cycle Sequencing Kit, Applied Biosystems®).
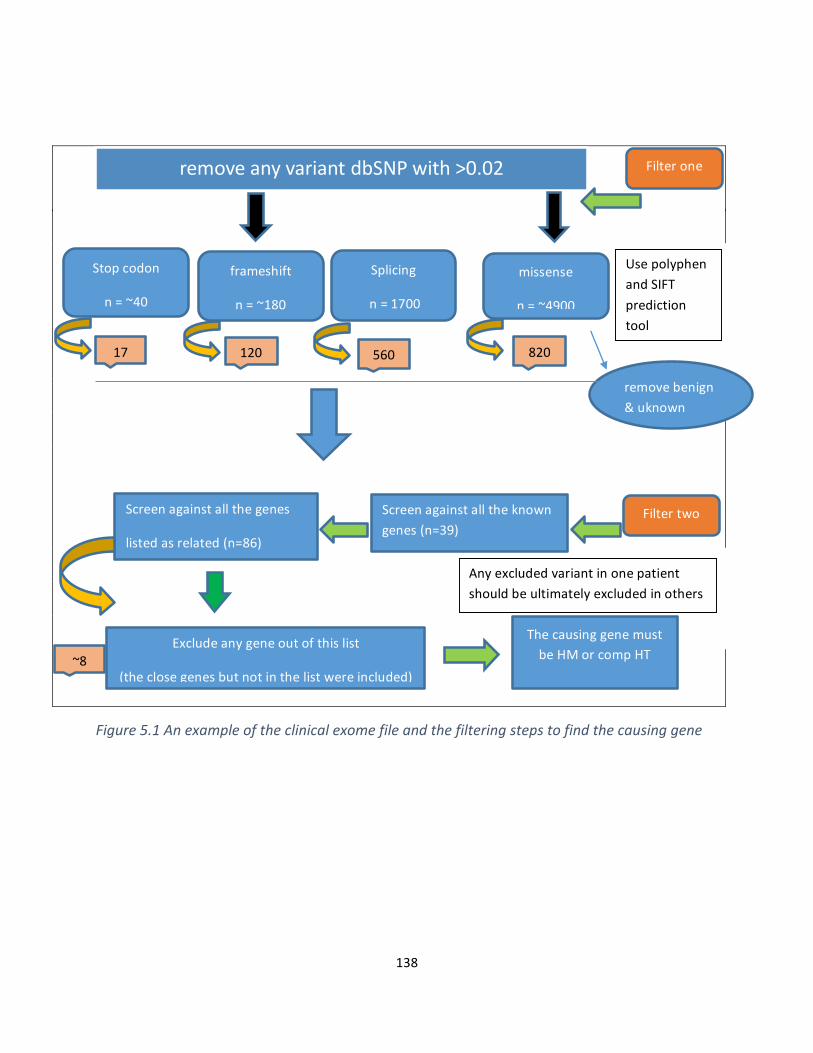
138
Figure5.1Anexampleoftheclinicalexomefileandthefilteringstepstofindthecausinggene
removeanyvariantdbSNPwith>0.02 Filterone
Stopcodon
n=~40
Splicing
n=1700
frameshift
n=~180
missense
n=~4900
17 120 560 820
removebenign&uknown
UsepolyphenandSIFTpredictiontool
Filtertwo
Screenagainstallthegenes
listedasrelated(n=86)
Excludeanygeneoutofthislist
(theclosegenesbutnotinthelistwereincluded)
~8
ThecausinggenemustbeHMorcompHT
Anyexcludedvariantinonepatientshouldbeultimatelyexcludedinothers
Screenagainstalltheknowngenes(n=39)
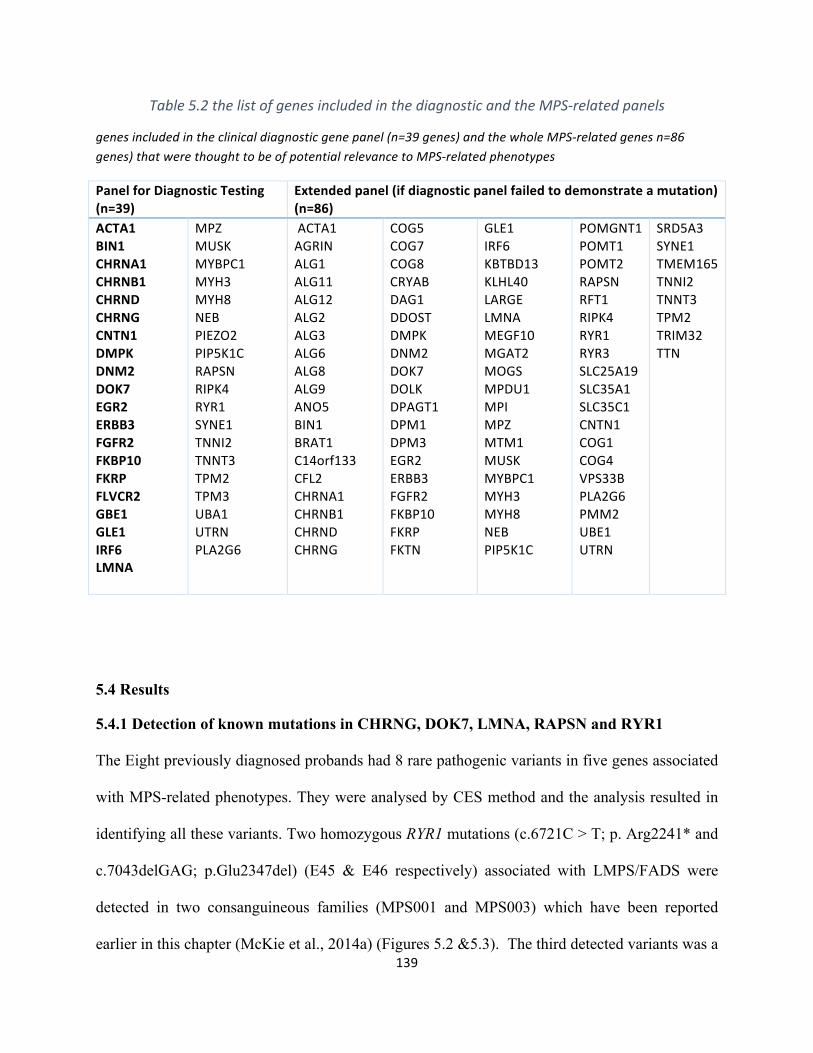
139
Table5.2thelistofgenesincludedinthediagnosticandtheMPS-relatedpanels
genesincludedintheclinicaldiagnosticgenepanel(n=39genes)andthewholeMPS-relatedgenesn=86genes)thatwerethoughttobeofpotentialrelevancetoMPS-relatedphenotypes
PanelforDiagnosticTesting(n=39)
Extendedpanel(ifdiagnosticpanelfailedtodemonstrateamutation)(n=86)
ACTA1BIN1CHRNA1CHRNB1CHRNDCHRNGCNTN1DMPKDNM2DOK7EGR2ERBB3FGFR2FKBP10FKRPFLVCR2GBE1GLE1IRF6LMNA
MPZMUSKMYBPC1MYH3MYH8NEBPIEZO2PIP5K1CRAPSNRIPK4RYR1SYNE1TNNI2TNNT3TPM2TPM3UBA1UTRNPLA2G6
ACTA1AGRINALG1ALG11ALG12ALG2ALG3ALG6ALG8ALG9ANO5BIN1BRAT1C14orf133CFL2CHRNA1CHRNB1CHRNDCHRNG
COG5COG7COG8CRYABDAG1DDOSTDMPKDNM2DOK7DOLKDPAGT1DPM1DPM3EGR2ERBB3FGFR2FKBP10FKRPFKTN
GLE1IRF6KBTBD13KLHL40LARGELMNAMEGF10MGAT2MOGSMPDU1MPIMPZMTM1MUSKMYBPC1MYH3MYH8NEBPIP5K1C
POMGNT1POMT1POMT2RAPSNRFT1RIPK4RYR1RYR3SLC25A19SLC35A1SLC35C1CNTN1COG1COG4VPS33BPLA2G6PMM2UBE1UTRN
SRD5A3SYNE1TMEM165TNNI2TNNT3TPM2TRIM32TTN
5.4 Results
5.4.1 Detection of known mutations in CHRNG, DOK7, LMNA, RAPSN and RYR1
The Eight previously diagnosed probands had 8 rare pathogenic variants in five genes associated
with MPS-related phenotypes. They were analysed by CES method and the analysis resulted in
identifying all these variants. Two homozygous RYR1 mutations (c.6721C > T; p. Arg2241* and
c.7043delGAG; p.Glu2347del) (E45 & E46 respectively) associated with LMPS/FADS were
detected in two consanguineous families (MPS001 and MPS003) which have been reported
earlier in this chapter (McKie et al., 2014a) (Figures 5.2 &5.3). The third detected variants was a
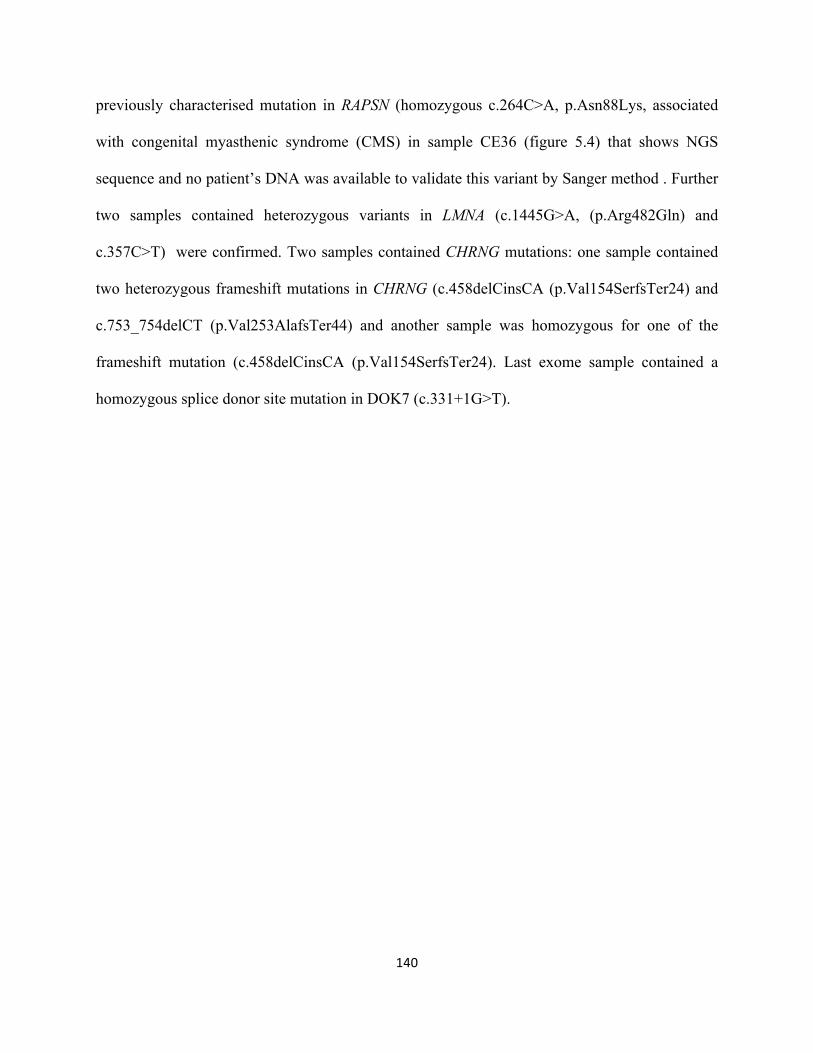
140
previously characterised mutation in RAPSN (homozygous c.264C>A, p.Asn88Lys, associated
with congenital myasthenic syndrome (CMS) in sample CE36 (figure 5.4) that shows NGS
sequence and no patient’s DNA was available to validate this variant by Sanger method . Further
two samples contained heterozygous variants in LMNA (c.1445G>A, (p.Arg482Gln) and
c.357C>T) were confirmed. Two samples contained CHRNG mutations: one sample contained
two heterozygous frameshift mutations in CHRNG (c.458delCinsCA (p.Val154SerfsTer24) and
c.753_754delCT (p.Val253AlafsTer44) and another sample was homozygous for one of the
frameshift mutation (c.458delCinsCA (p.Val154SerfsTer24). Last exome sample contained a
homozygous splice donor site mutation in DOK7 (c.331+1G>T).
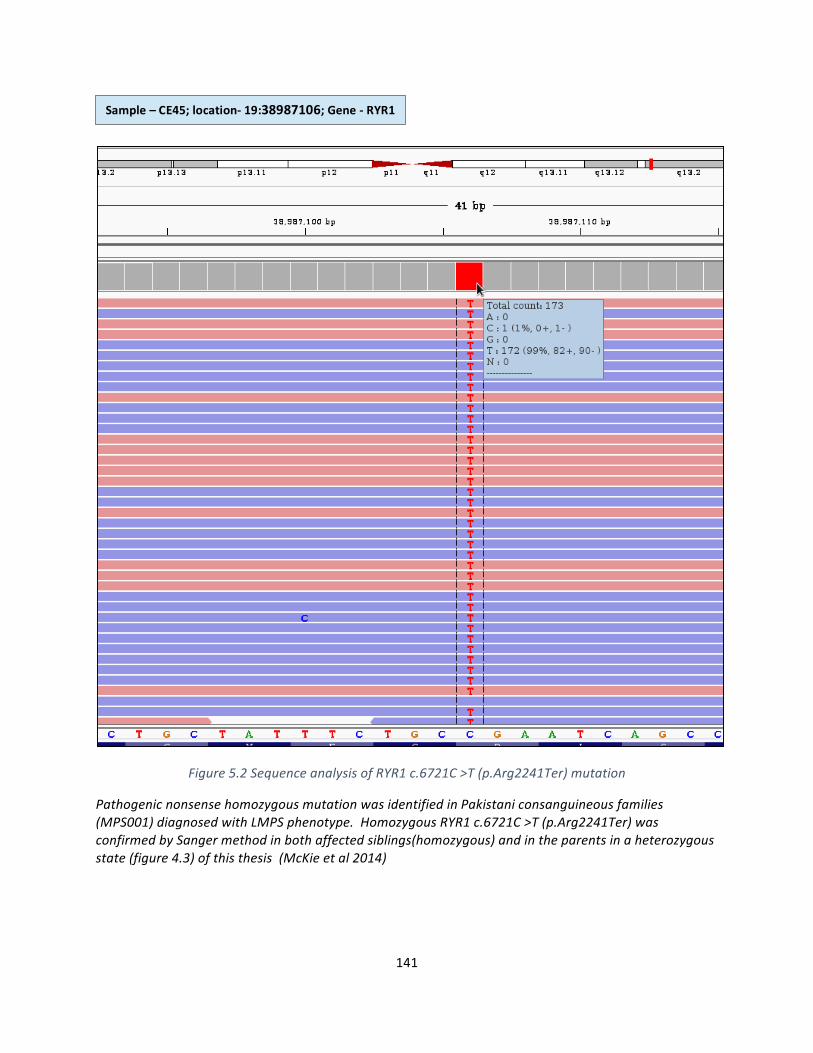
141
Figure5.2SequenceanalysisofRYR1c.6721C>T(p.Arg2241Ter)mutation
PathogenicnonsensehomozygousmutationwasidentifiedinPakistaniconsanguineousfamilies(MPS001)diagnosedwithLMPSphenotype.HomozygousRYR1c.6721C>T(p.Arg2241Ter)wasconfirmedbySangermethodinbothaffectedsiblings(homozygous)andintheparentsinaheterozygousstate(figure4.3)ofthisthesis(McKieetal2014)
Sample–CE45;location-19:38987106;Gene-RYR1
142
Figure5.2SequenceanalysisofRYR1c.7043delGAG(p.Glu2347del)
Pathogenic27bhomozygousdeletionwasidentifiedinPakistaniconsanguineousfamilies(MPS002)diagnosedwithLMPSphenotype.HomozygousRYR1c.7043delGAG(p.Glu2347del)variantwasalreadyconfirmedbySangerinfigure4.6ofthisthesis(McKieetal2014)
Deletion
Sample–CE46;location-19:38990284;Gene-RYR1
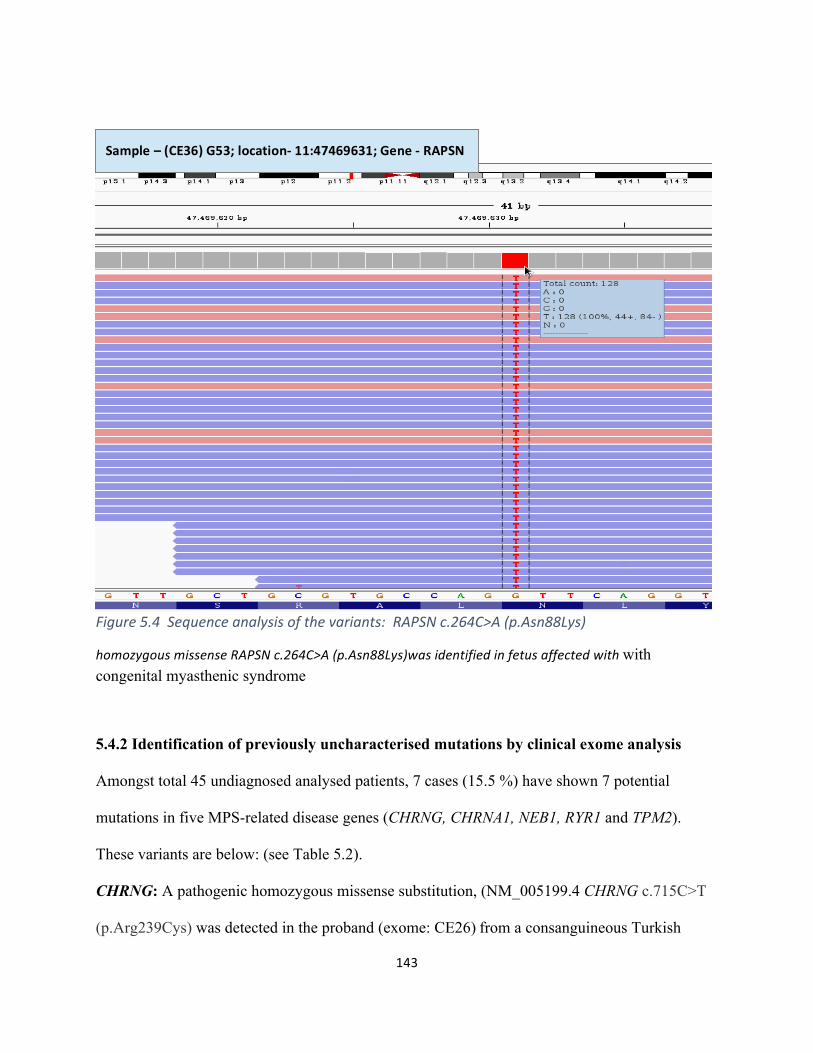
143
Figure5.4Sequenceanalysisofthevariants:RAPSNc.264C>A(p.Asn88Lys)
homozygousmissenseRAPSNc.264C>A(p.Asn88Lys)wasidentifiedinfetusaffectedwithwith congenital myasthenic syndrome
5.4.2 Identification of previously uncharacterised mutations by clinical exome analysis
Amongst total 45 undiagnosed analysed patients, 7 cases (15.5 %) have shown 7 potential
mutations in five MPS-related disease genes (CHRNG, CHRNA1, NEB1, RYR1 and TPM2).
These variants are below: (see Table 5.2).
CHRNG: A pathogenic homozygous missense substitution, (NM_005199.4 CHRNG c.715C>T
(p.Arg239Cys) was detected in the proband (exome: CE26)from a consanguineous Turkish
Sample–(CE36)G53;location-11:47469631;Gene-RAPSN
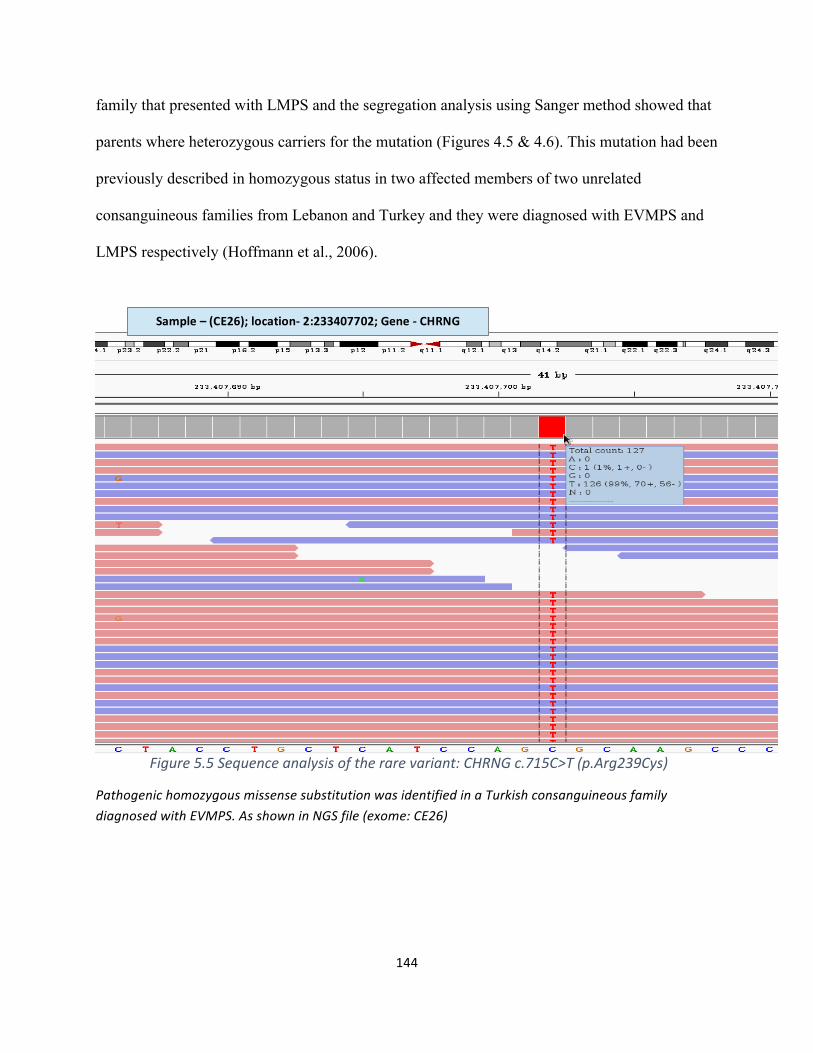
144
family that presented with LMPS and the segregation analysis using Sanger method showed that
parents where heterozygous carriers for the mutation (Figures 4.5 & 4.6). This mutation had been
previously described in homozygous status in two affected members of two unrelated
consanguineous families from Lebanon and Turkey and they were diagnosed with EVMPS and
LMPS respectively (Hoffmann et al., 2006).
Figure5.5Sequenceanalysisoftherarevariant:CHRNGc.715C>T(p.Arg239Cys)
PathogenichomozygousmissensesubstitutionwasidentifiedinaTurkishconsanguineousfamilydiagnosedwithEVMPS.AsshowninNGSfile(exome:CE26)
Sample–(CE26);location-2:233407702;Gene-CHRNG
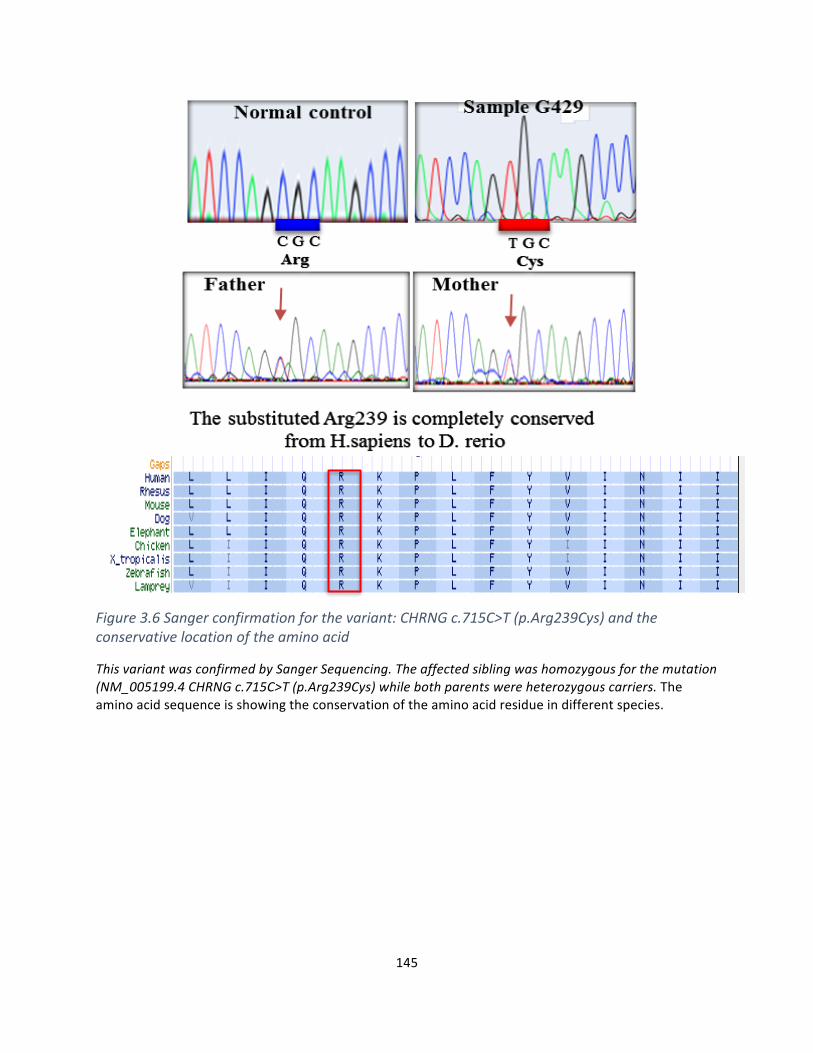
145
Figure3.6Sangerconfirmationforthevariant:CHRNGc.715C>T(p.Arg239Cys)andtheconservativelocationoftheaminoacid
ThisvariantwasconfirmedbySangerSequencing.Theaffectedsiblingwashomozygousforthemutation(NM_005199.4CHRNGc.715C>T(p.Arg239Cys)whilebothparentswereheterozygouscarriers.Theaminoacidsequenceisshowingtheconservationoftheaminoacidresidueindifferentspecies.
146
CHRNA1:
The second identified mutation was a homozygous insertion (duplication) of 17 nucleotides of
CHRNA1 gene (NM_000079.3 CHRNA1; c.117_133dupGCGGCCAGTGGAAGACC
(p.His45ArgfsTer19) which was detected in a proband (exome: CE22) (Figure 5.7) that was
diagnosed with FADS and born to a consanguineous parents from Somalia, resulting in a
frameshift mutation with a subsequent premature stop codon (a1.H25RfsX19). This mutation
was previously reported in a family of African origin diagnosed with FADS (Michalk et al,
2008). According to the provided clinical history, the male fetus had a severe septated cystic
hygroma, early hydrops and fixed flexion deformity of all four limbs detected on antenatal
ultrasound scan. Microarray analysis for copy number abnormalities (CNA) was normal.
Autopsy was declined. The couple had had three previous male pregnancy losses between 20 and
23 weeks of gestation with cystic hygroma, hydrops and fixed flexion contractures. Prior testing
of CHRNG and DOK7 had not identified any pathogenic sequence variants. Confirmation by
Sanger sequencing revealed the insertion was a tandem duplication of 17 nucleotides and
appropriate segregation was demonstrated in two unaffected siblings and the parents.
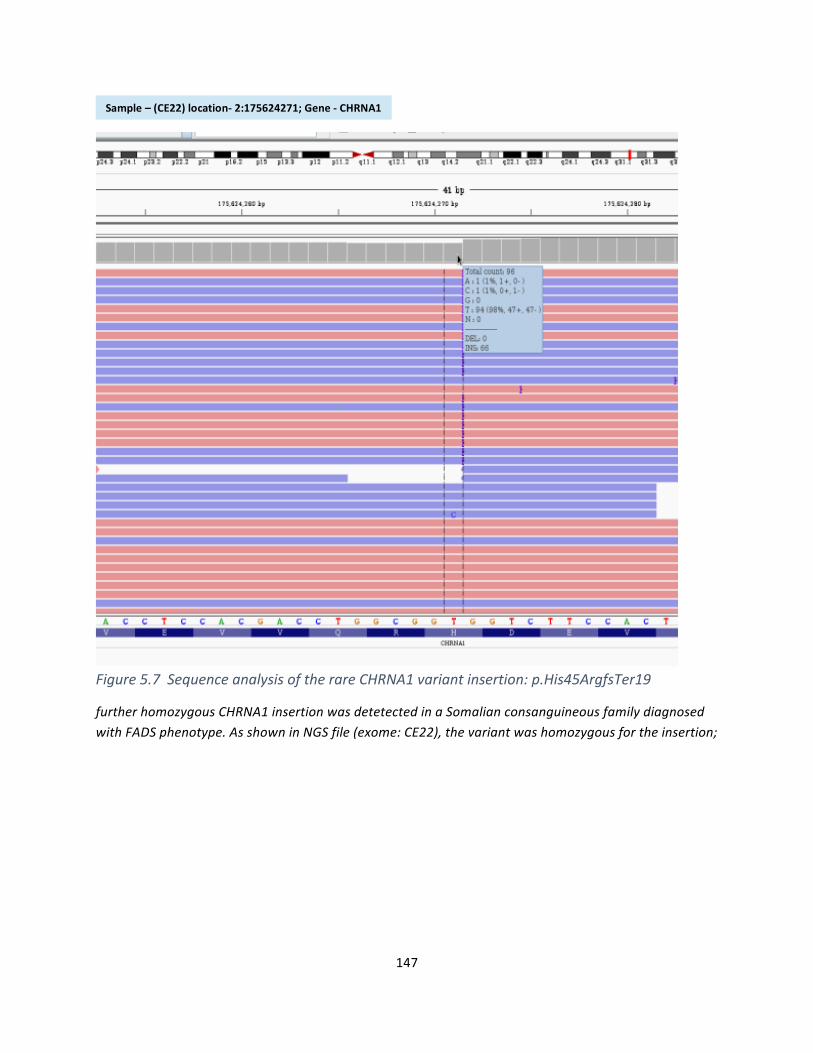
147
Figure5.7SequenceanalysisoftherareCHRNA1variantinsertion:p.His45ArgfsTer19
furtherhomozygousCHRNA1insertionwasdetetectedinaSomalianconsanguineousfamilydiagnosedwithFADSphenotype.AsshowninNGSfile(exome:CE22),thevariantwashomozygousfortheinsertion;
Sample–(CE22)location-2:175624271;Gene-CHRNA1
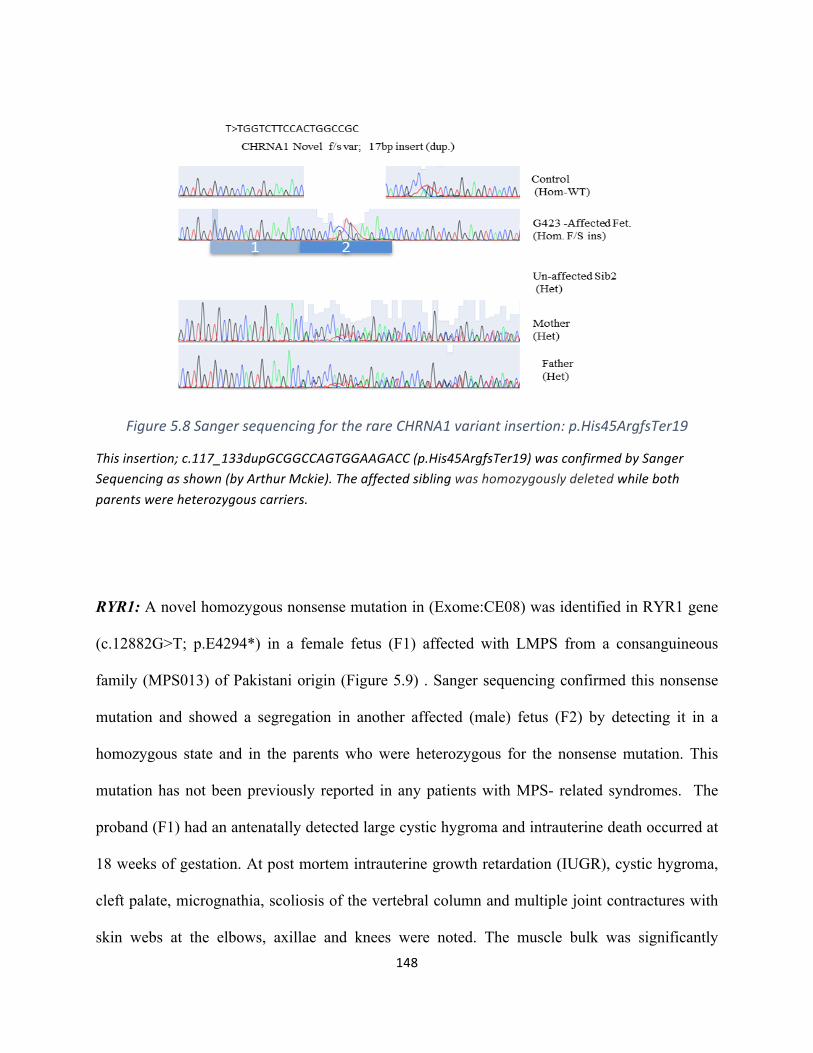
148
Figure5.8SangersequencingfortherareCHRNA1variantinsertion:p.His45ArgfsTer19
Thisinsertion;c.117_133dupGCGGCCAGTGGAAGACC(p.His45ArgfsTer19)wasconfirmedbySangerSequencingasshown(byArthurMckie).Theaffectedsiblingwashomozygouslydeletedwhilebothparentswereheterozygouscarriers.
RYR1: A novel homozygous nonsense mutation in (Exome:CE08) was identified in RYR1 gene
(c.12882G>T; p.E4294*) in a female fetus (F1) affected with LMPS from a consanguineous
family (MPS013) of Pakistani origin (Figure 5.9) . Sanger sequencing confirmed this nonsense
mutation and showed a segregation in another affected (male) fetus (F2) by detecting it in a
homozygous state and in the parents who were heterozygous for the nonsense mutation. This
mutation has not been previously reported in any patients with MPS- related syndromes. The
proband (F1) had an antenatally detected large cystic hygroma and intrauterine death occurred at
18 weeks of gestation. At post mortem intrauterine growth retardation (IUGR), cystic hygroma,
cleft palate, micrognathia, scoliosis of the vertebral column and multiple joint contractures with
skin webs at the elbows, axillae and knees were noted. The muscle bulk was significantly
149
reduced with no muscle identified in the extremities. All the muscles were autolytic with severe
degeneration of the fibres and variability in the shape and size of the muscle cells. There was
some positive staining of slow and fast myosin in the muscles. PAS and DiPAS stains were
negative excluding a glycogen storage disease. Lymphocytic infiltration of the muscle cells was
considered suggestive of a possible inflammatory myopathy. The second affected fetus was
terminated at 19 weeks following the antenatal detection of a large cystic hygroma. Post mortem
examination revealed an affected male fetus with IUGR, a cystic hygroma, cleft palate, flexion
contractures of the upper and lower limbs and skin webs at the elbows, groins and knees. There
was bilateral talipes and prominent heels. The thoracic cavities were narrow and the ribs
appeared shorter than usual. The long bones were gracile. The muscle bulk was significantly
reduced and microscopicy revealed degenerative and regenerative changes with very scattered
myocytes. There was no slow fibre staining and a few fibres stained with fast myosin. The a-
laminin staining was weak and patchy. There was no family history of malignant hyperthermia.
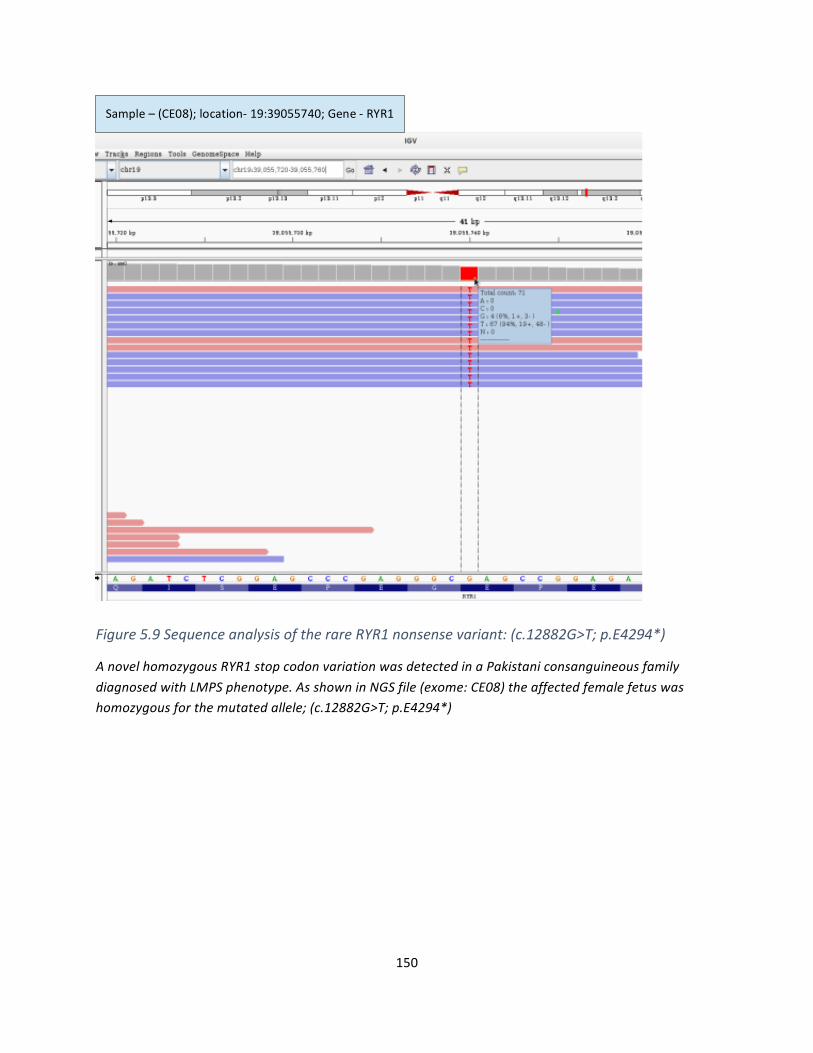
150
Figure5.9SequenceanalysisoftherareRYR1nonsensevariant:(c.12882G>T;p.E4294*)
AnovelhomozygousRYR1stopcodonvariationwasdetectedinaPakistaniconsanguineousfamilydiagnosedwithLMPSphenotype.AsshowninNGSfile(exome:CE08)theaffectedfemalefetuswashomozygousforthemutatedallele;(c.12882G>T;p.E4294*)
Sample–(CE08);location-19:39055740;Gene-RYR1
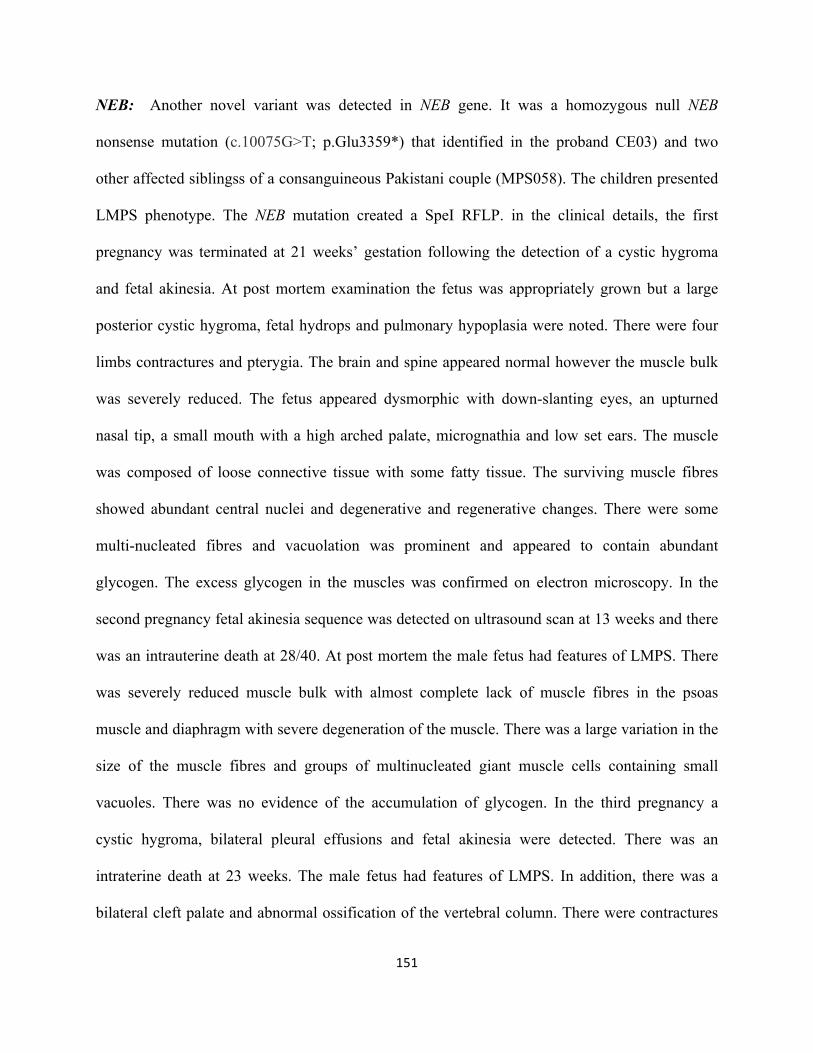
151
NEB: Another novel variant was detected in NEB gene. It was a homozygous null NEB
nonsense mutation (c.10075G>T; p.Glu3359*) that identified in the proband CE03) and two
other affected siblingss of a consanguineous Pakistani couple (MPS058). The children presented
LMPS phenotype. The NEB mutation created a SpeI RFLP. in the clinical details, the first
pregnancy was terminated at 21 weeks’ gestation following the detection of a cystic hygroma
and fetal akinesia. At post mortem examination the fetus was appropriately grown but a large
posterior cystic hygroma, fetal hydrops and pulmonary hypoplasia were noted. There were four
limbs contractures and pterygia. The brain and spine appeared normal however the muscle bulk
was severely reduced. The fetus appeared dysmorphic with down-slanting eyes, an upturned
nasal tip, a small mouth with a high arched palate, micrognathia and low set ears. The muscle
was composed of loose connective tissue with some fatty tissue. The surviving muscle fibres
showed abundant central nuclei and degenerative and regenerative changes. There were some
multi-nucleated fibres and vacuolation was prominent and appeared to contain abundant
glycogen. The excess glycogen in the muscles was confirmed on electron microscopy. In the
second pregnancy fetal akinesia sequence was detected on ultrasound scan at 13 weeks and there
was an intrauterine death at 28/40. At post mortem the male fetus had features of LMPS. There
was severely reduced muscle bulk with almost complete lack of muscle fibres in the psoas
muscle and diaphragm with severe degeneration of the muscle. There was a large variation in the
size of the muscle fibres and groups of multinucleated giant muscle cells containing small
vacuoles. There was no evidence of the accumulation of glycogen. In the third pregnancy a
cystic hygroma, bilateral pleural effusions and fetal akinesia were detected. There was an
intraterine death at 23 weeks. The male fetus had features of LMPS. In addition, there was a
bilateral cleft palate and abnormal ossification of the vertebral column. There were contractures
152
and the vertebral column appeared short with block and hemivertebrae. There was deficient
ossification of the sacrum. The muscle contained connective tissue and lacked muscle fibres.
There were very thin muscle fibres and very large giant cells with multiple nuclei. There were no
vacuolar or PAS positive inclusions.
Maternal Myotonic dystrophy genetic testing was normal and maternal AChRAbs were negative.
Karyotyping and genetic testing of PFKM for glycogen storage disease type VII was normal.
Prior to CES analysis, no pathogenic sequence variants were detected in CHRNG, CHRNA1,
CHRND, RAPSN, or DOK7.
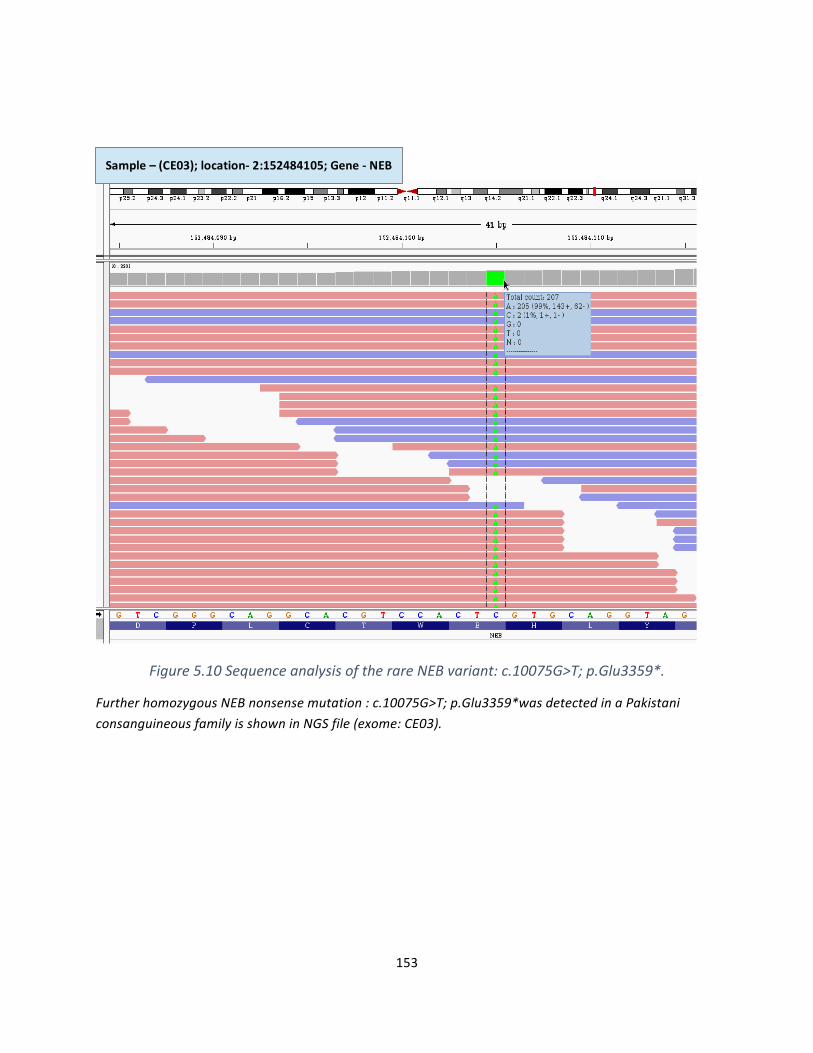
153
Figure5.10SequenceanalysisoftherareNEBvariant:c.10075G>T;p.Glu3359*.
FurtherhomozygousNEBnonsensemutation:c.10075G>T;p.Glu3359*wasdetectedinaPakistaniconsanguineousfamilyisshowninNGSfile(exome:CE03).
Sample–(CE03);location-2:152484105;Gene-NEB
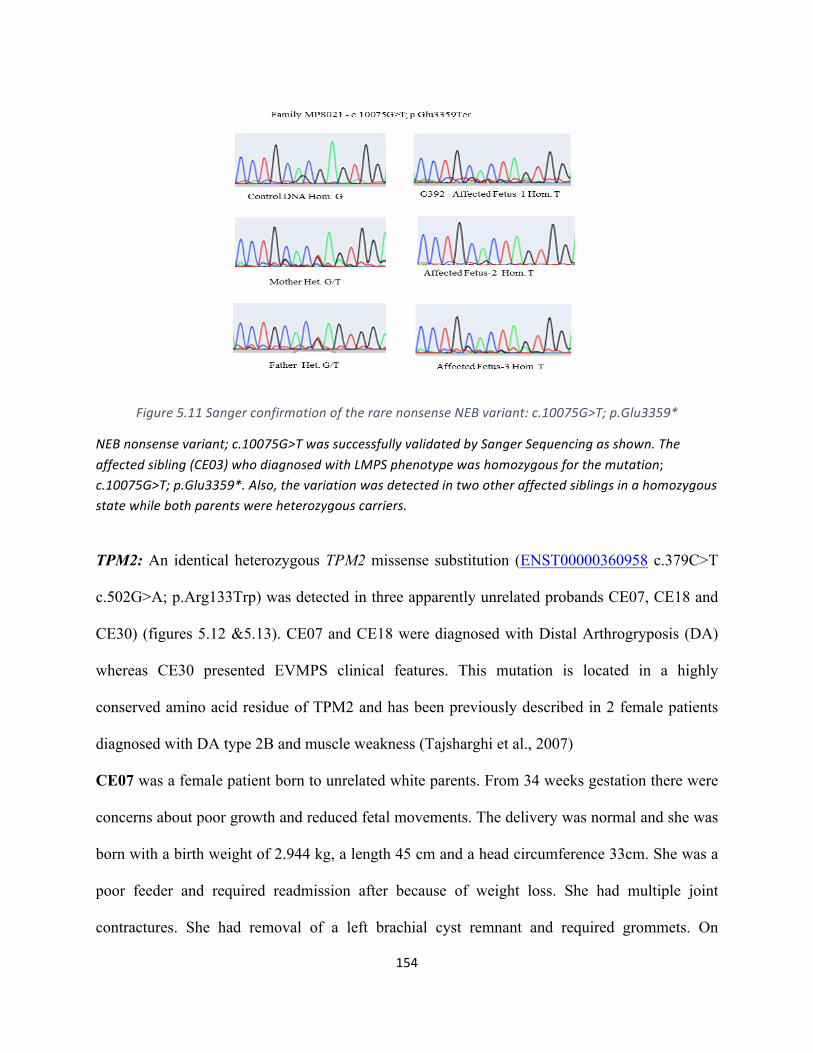
154
Figure5.11SangerconfirmationoftherarenonsenseNEBvariant:c.10075G>T;p.Glu3359*
NEBnonsensevariant;c.10075G>TwassuccessfullyvalidatedbySangerSequencingasshown.Theaffectedsibling(CE03)whodiagnosedwithLMPSphenotypewashomozygousforthemutation;c.10075G>T;p.Glu3359*.Also,thevariationwasdetectedintwootheraffectedsiblingsinahomozygousstatewhilebothparentswereheterozygouscarriers.
TPM2: An identical heterozygous TPM2 missense substitution (ENST00000360958 c.379C>T
c.502G>A; p.Arg133Trp) was detected in three apparently unrelated probands CE07, CE18 and
CE30) (figures 5.12 &5.13). CE07 and CE18 were diagnosed with Distal Arthrogryposis (DA)
whereas CE30 presented EVMPS clinical features. This mutation is located in a highly
conserved amino acid residue of TPM2 and has been previously described in 2 female patients
diagnosed with DA type 2B and muscle weakness (Tajsharghi et al., 2007)
CE07 was a female patient born to unrelated white parents. From 34 weeks gestation there were
concerns about poor growth and reduced fetal movements. The delivery was normal and she was
born with a birth weight of 2.944 kg, a length 45 cm and a head circumference 33cm. She was a
poor feeder and required readmission after because of weight loss. She had multiple joint
contractures. She had removal of a left brachial cyst remnant and required grommets. On
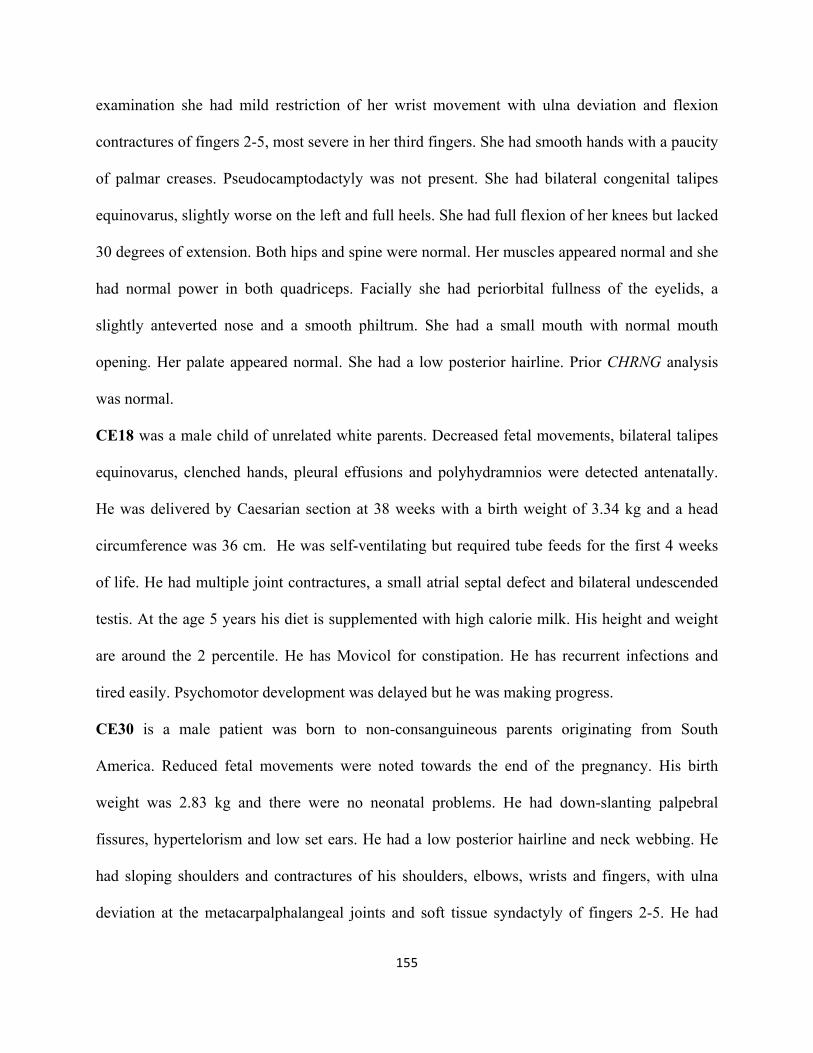
155
examination she had mild restriction of her wrist movement with ulna deviation and flexion
contractures of fingers 2-5, most severe in her third fingers. She had smooth hands with a paucity
of palmar creases. Pseudocamptodactyly was not present. She had bilateral congenital talipes
equinovarus, slightly worse on the left and full heels. She had full flexion of her knees but lacked
30 degrees of extension. Both hips and spine were normal. Her muscles appeared normal and she
had normal power in both quadriceps. Facially she had periorbital fullness of the eyelids, a
slightly anteverted nose and a smooth philtrum. She had a small mouth with normal mouth
opening. Her palate appeared normal. She had a low posterior hairline. Prior CHRNG analysis
was normal.
CE18 was a male child of unrelated white parents. Decreased fetal movements, bilateral talipes
equinovarus, clenched hands, pleural effusions and polyhydramnios were detected antenatally.
He was delivered by Caesarian section at 38 weeks with a birth weight of 3.34 kg and a head
circumference was 36 cm. He was self-ventilating but required tube feeds for the first 4 weeks
of life. He had multiple joint contractures, a small atrial septal defect and bilateral undescended
testis. At the age 5 years his diet is supplemented with high calorie milk. His height and weight
are around the 2 percentile. He has Movicol for constipation. He has recurrent infections and
tired easily. Psychomotor development was delayed but he was making progress.
CE30 is a male patient was born to non-consanguineous parents originating from South
America. Reduced fetal movements were noted towards the end of the pregnancy. His birth
weight was 2.83 kg and there were no neonatal problems. He had down-slanting palpebral
fissures, hypertelorism and low set ears. He had a low posterior hairline and neck webbing. He
had sloping shoulders and contractures of his shoulders, elbows, wrists and fingers, with ulna
deviation at the metacarpalphalangeal joints and soft tissue syndactyly of fingers 2-5. He had
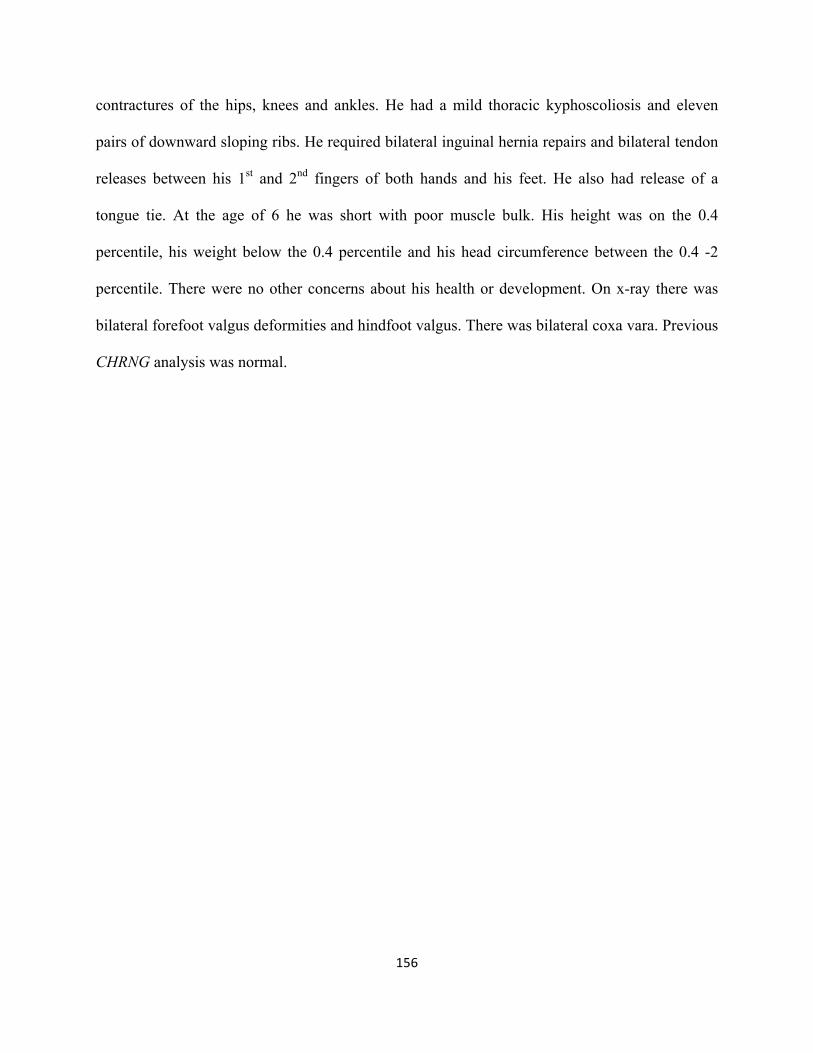
156
contractures of the hips, knees and ankles. He had a mild thoracic kyphoscoliosis and eleven
pairs of downward sloping ribs. He required bilateral inguinal hernia repairs and bilateral tendon
releases between his 1st and 2nd fingers of both hands and his feet. He also had release of a
tongue tie. At the age of 6 he was short with poor muscle bulk. His height was on the 0.4
percentile, his weight below the 0.4 percentile and his head circumference between the 0.4 -2
percentile. There were no other concerns about his health or development. On x-ray there was
bilateral forefoot valgus deformities and hindfoot valgus. There was bilateral coxa vara. Previous
CHRNG analysis was normal.
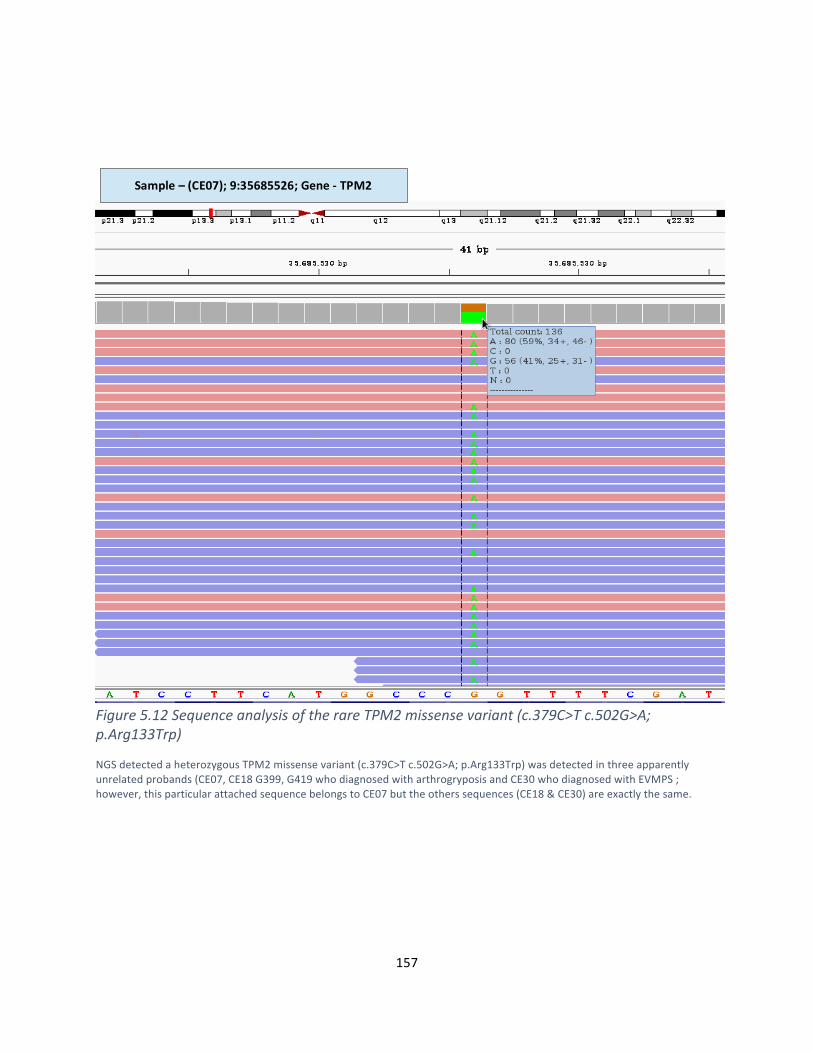
157
Figure5.12SequenceanalysisoftherareTPM2missensevariant(c.379C>Tc.502G>A;p.Arg133Trp)
NGSdetectedaheterozygousTPM2missensevariant(c.379C>Tc.502G>A;p.Arg133Trp)wasdetectedinthreeapparentlyunrelatedprobands(CE07,CE18G399,G419whodiagnosedwitharthrogryposisandCE30whodiagnosedwithEVMPS;however,thisparticularattachedsequencebelongstoCE07buttheotherssequences(CE18&CE30)areexactlythesame.
Sample–(CE07);9:35685526;Gene-TPM2
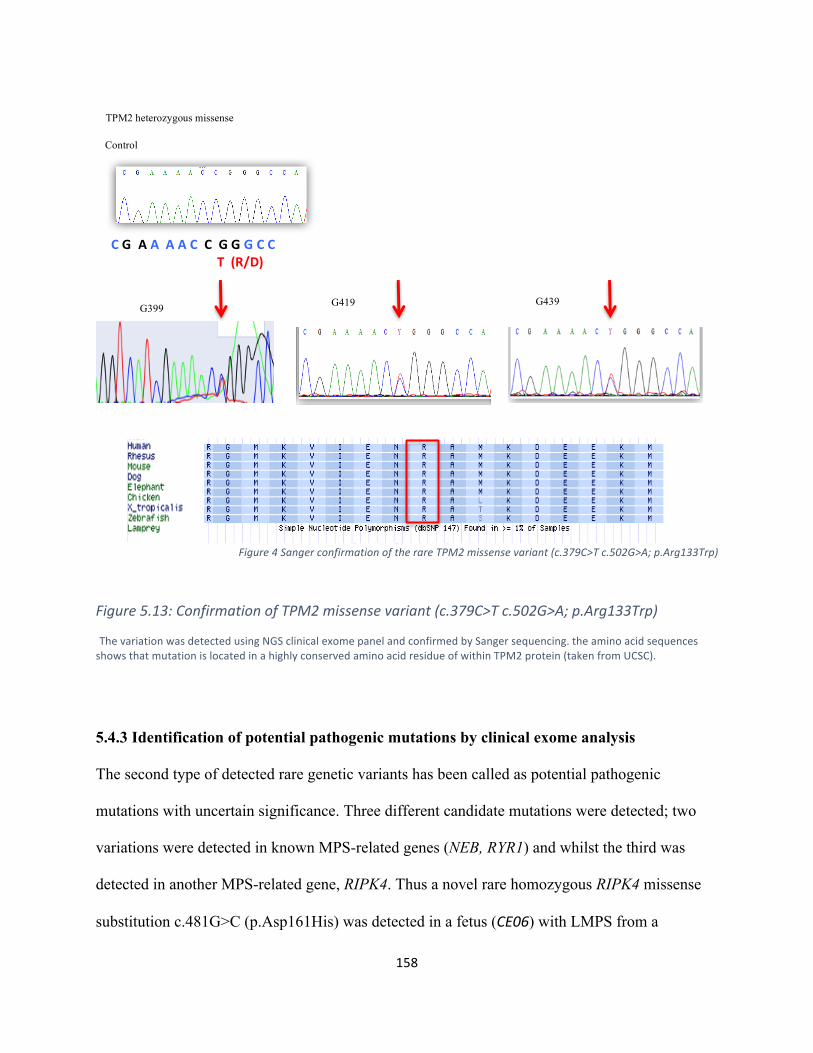
158
Figure4SangerconfirmationoftherareTPM2missensevariant(c.379C>Tc.502G>A;p.Arg133Trp)
Figure5.13:ConfirmationofTPM2missensevariant(c.379C>Tc.502G>A;p.Arg133Trp)
ThevariationwasdetectedusingNGSclinicalexomepanelandconfirmedbySangersequencing.theaminoacidsequencesshowsthatmutationislocatedinahighlyconservedaminoacidresidueofwithinTPM2protein(takenfromUCSC).
5.4.3 Identification of potential pathogenic mutations by clinical exome analysis
The second type of detected rare genetic variants has been called as potential pathogenic
mutations with uncertain significance. Three different candidate mutations were detected; two
variations were detected in known MPS-related genes (NEB, RYR1) and whilst the third was
detected in another MPS-related gene, RIPK4. Thus a novel rare homozygous RIPK4 missense
substitution c.481G>C (p.Asp161His) was detected in a fetus (CE06) with LMPS from a
CGAAAACCGGGCC T(R/D)
G399 G419 G439
TPM2 heterozygous missense
Control
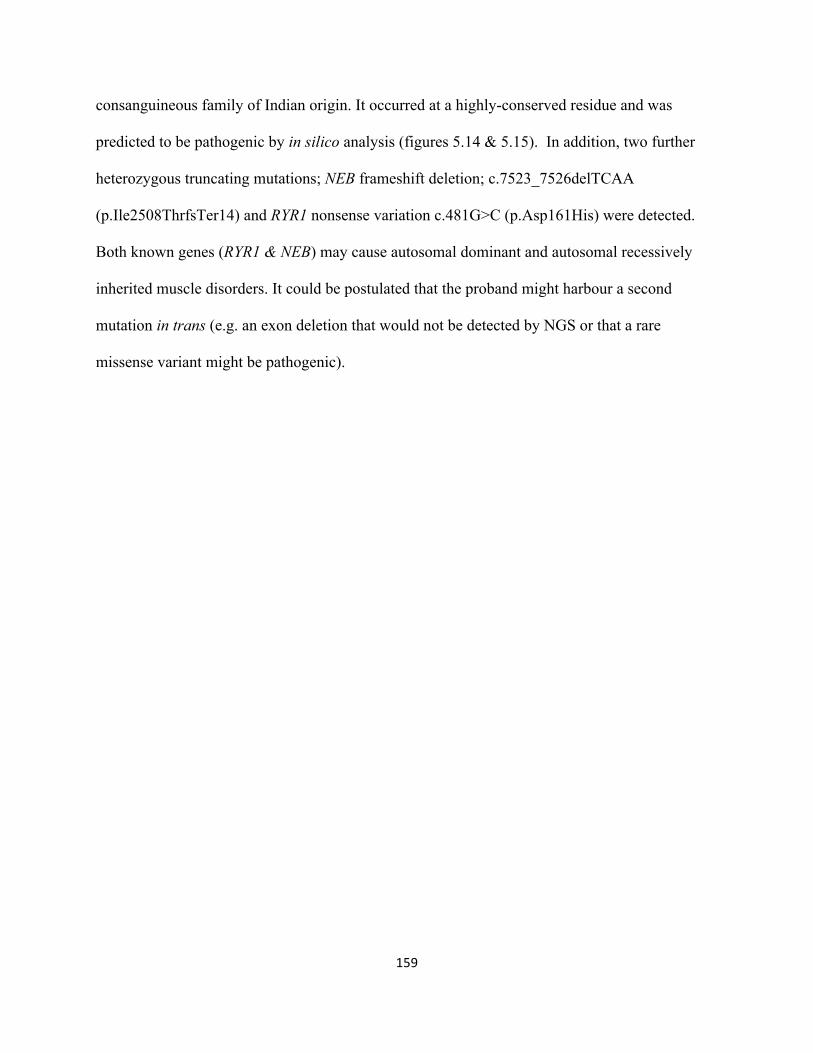
159
consanguineous family of Indian origin. It occurred at a highly-conserved residue and was
predicted to be pathogenic by in silico analysis (figures 5.14 & 5.15). In addition, two further
heterozygous truncating mutations; NEB frameshift deletion; c.7523_7526delTCAA
(p.Ile2508ThrfsTer14) and RYR1 nonsense variation c.481G>C (p.Asp161His) were detected.
Both known genes (RYR1 & NEB) may cause autosomal dominant and autosomal recessively
inherited muscle disorders. It could be postulated that the proband might harbour a second
mutation in trans (e.g. an exon deletion that would not be detected by NGS or that a rare
missense variant might be pathogenic).
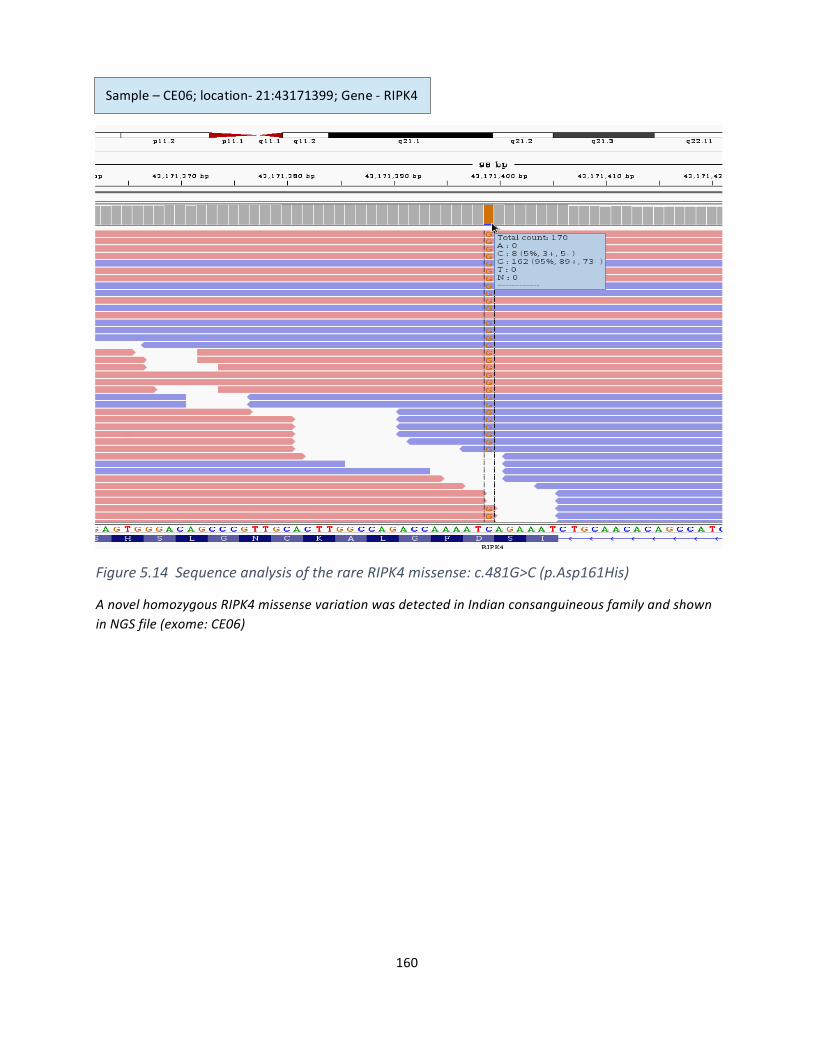
160
Figure5.14SequenceanalysisoftherareRIPK4missense:c.481G>C(p.Asp161His)
AnovelhomozygousRIPK4missensevariationwasdetectedinIndianconsanguineousfamilyandshowninNGSfile(exome:CE06)
Sample–CE06;location-21:43171399;Gene-RIPK4
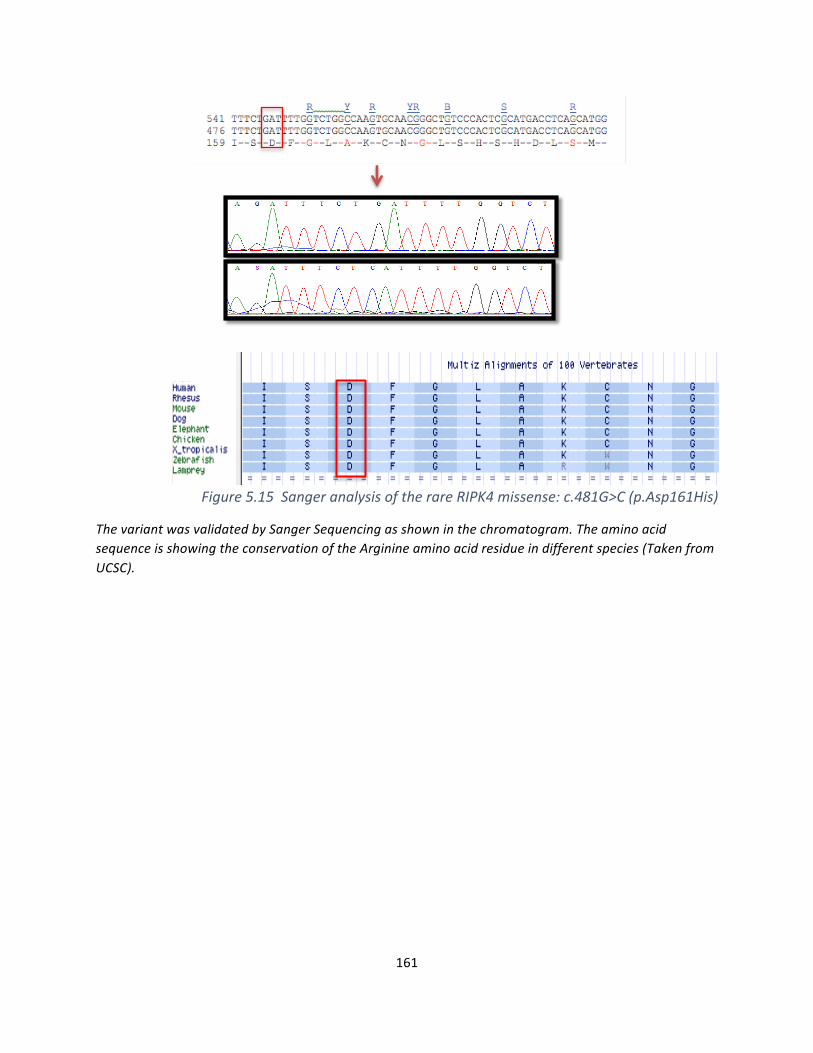
161
Figure5.15SangeranalysisoftherareRIPK4missense:c.481G>C(p.Asp161His)
ThevariantwasvalidatedbySangerSequencingasshowninthechromatogram.TheaminoacidsequenceisshowingtheconservationoftheArginineaminoacidresidueindifferentspecies(TakenfromUCSC).
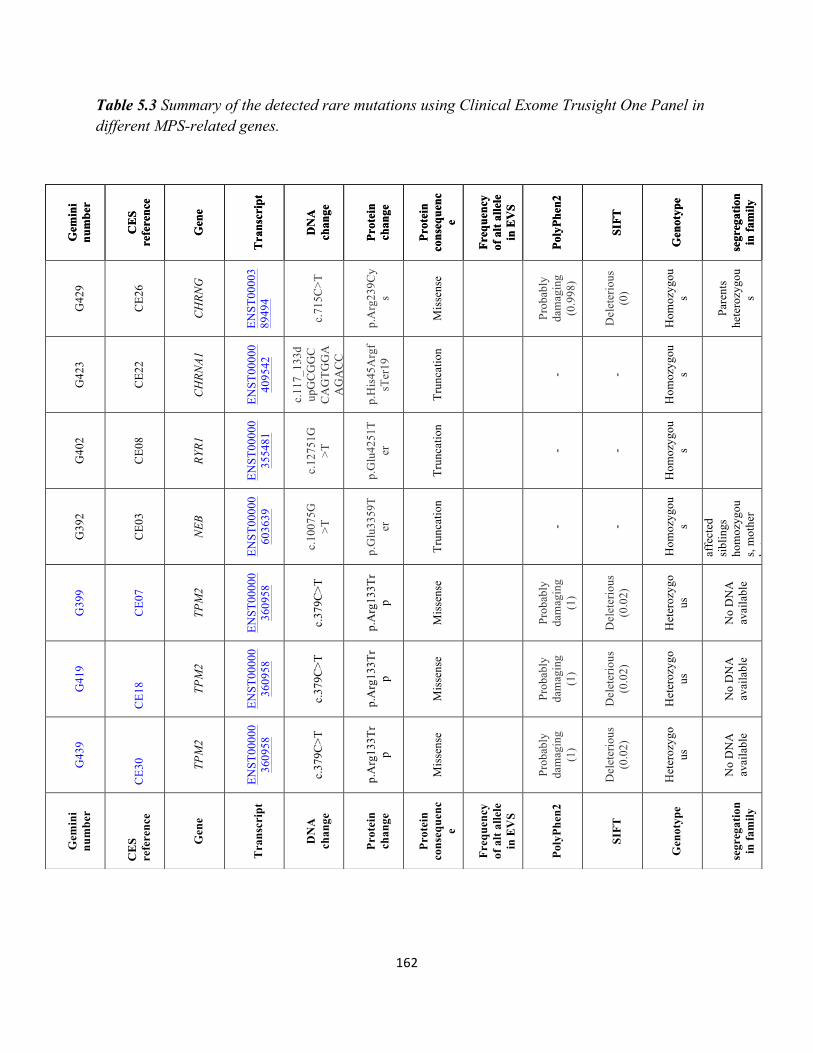
162
Table 5.3 Summary of the detected rare mutations using Clinical Exome Trusight One Panel in different MPS-related genes.
Gem
ini
num
ber
CE
S re
fere
nce
Gen
e
Tra
nscr
ipt
DN
A
chan
ge
Prot
ein
chan
ge
Prot
ein
cons
eque
nce
Freq
uenc
y of
alt
alle
le
in E
VS
Poly
Phen
2
SIFT
Gen
otyp
e
se
greg
atio
n in
fam
ily
G42
9
CE2
6
CH
RNG
ENST
0000
389
494
c.71
5C>T
p.A
rg23
9Cy
s
Mis
sens
e
Prob
ably
da
mag
ing
(0.9
98)
Del
eter
ious
(0
)
Hom
ozyg
ous
Pare
nts
hete
rozy
gou
s
G42
3
CE2
2
CH
RNA1
ENST
0000
040
9542
c.11
7_13
3dup
GC
GG
CC
AG
TGG
AA
GA
CC
p.H
is45
Arg
fsT
er19
Trun
catio
n
- -
Hom
ozyg
ous
G40
2
CE0
8
RYR1
ENST
0000
035
5481
c.12
751G
>T
p.G
lu42
51T
er
Trun
catio
n
- -
Hom
ozyg
ous
G39
2
CE0
3
NEB
ENST
0000
060
3639
c.10
075G
>T
p.G
lu33
59T
er
Trun
catio
n
- -
Hom
ozyg
ous
Yes
. Tw
o af
fect
ed
sibl
ings
ho
moz
ygou
s, m
othe
r he
tero
zygo
us
G39
9
CE0
7
TPM
2
ENST
0000
036
0958
c.37
9C>T
p.A
rg13
3Tr
p
Mis
sens
e
Prob
ably
da
mag
ing
(1)
Del
eter
ious
(0
.02)
Het
eroz
ygo
us
No
DN
A
avai
labl
e
G41
9
CE1
8 TPM
2
ENST
0000
036
0958
c.37
9C>T
p.A
rg13
3Tr
p
Mis
sens
e
Prob
ably
da
mag
ing
(1)
Del
eter
ious
(0
.02)
Het
eroz
ygo
us
No
DN
A
avai
labl
e
G43
9
CE3
0 TPM
2
ENST
0000
036
0958
c.37
9C>T
p.A
rg13
3Tr
p
Mis
sens
e
Prob
ably
da
mag
ing
(1)
Del
eter
ious
(0
.02)
Het
eroz
ygo
us
No
DN
A
avai
labl
e
Gem
ini
num
ber
CE
S re
fere
nce
Gen
e
Tra
nscr
ipt
DN
A
chan
ge
Prot
ein
chan
ge
Prot
ein
cons
eque
nce
Freq
uenc
y of
alt
alle
le
in E
VS
Poly
Phen
2
SIFT
Gen
otyp
e
se
greg
atio
n in
fam
ily
Gem
ini
num
ber
CE
S re
fere
nce
Gen
e
Tra
nscr
ipt
DN
A
chan
ge
Prot
ein
chan
ge
Prot
ein
cons
eque
nce
Freq
uenc
y of
alt
alle
le
in E
VS
Poly
Phen
2
SIFT
Gen
otyp
e
se
greg
atio
n in
fam
ily
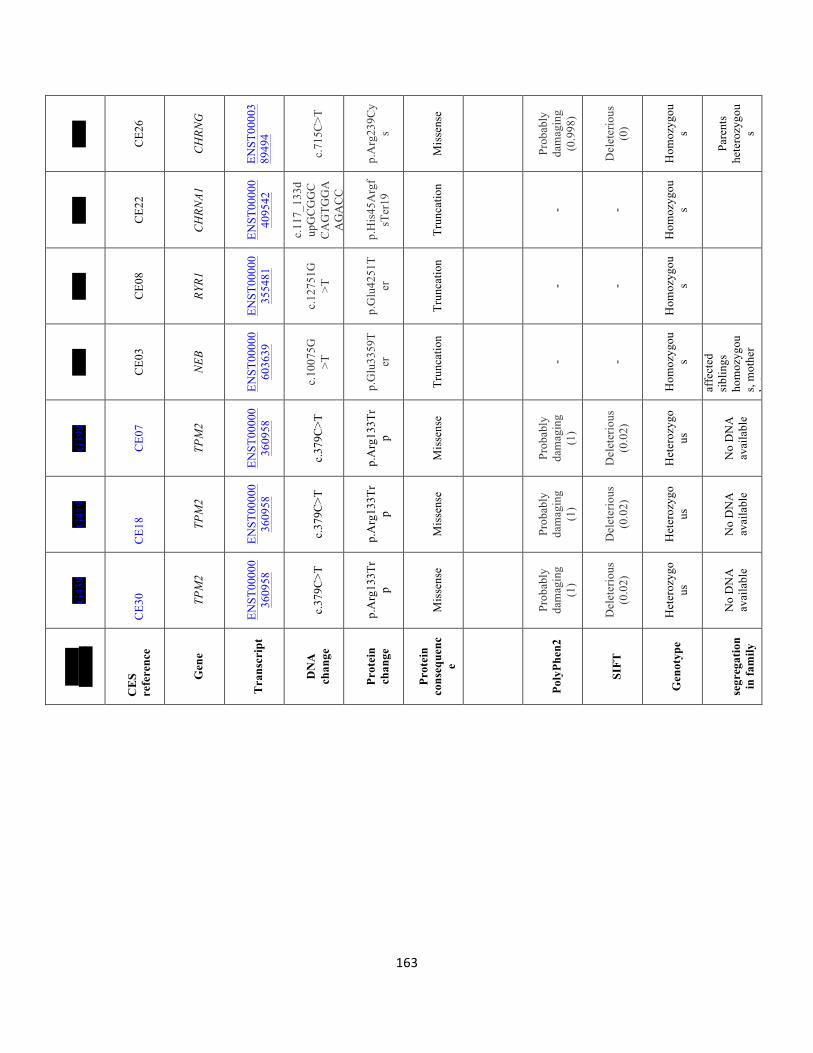
163
G42
9
CE2
6
CH
RNG
ENST
0000
389
494
c.71
5C>T
p.A
rg23
9Cy
s
Mis
sens
e
Prob
ably
da
mag
ing
(0.9
98)
Del
eter
ious
(0
)
Hom
ozyg
ous
Pare
nts
hete
rozy
gou
s
G42
3
CE2
2
CH
RNA1
ENST
0000
040
9542
c.11
7_13
3dup
GC
GG
CC
AG
TGG
AA
GA
CC
p.H
is45
Arg
fsT
er19
Trun
catio
n
- -
Hom
ozyg
ous
G40
2
CE0
8
RYR1
ENST
0000
035
5481
c.12
751G
>T
p.G
lu42
51T
er
Trun
catio
n
- -
Hom
ozyg
ous
G39
2
CE0
3
NEB
ENST
0000
060
3639
c.10
075G
>T
p.G
lu33
59T
er
Trun
catio
n
- -
Hom
ozyg
ous
Yes
. Tw
o af
fect
ed
sibl
ings
ho
moz
ygou
s, m
othe
r he
tero
zygo
us
G39
9
CE0
7
TPM
2
ENST
0000
036
0958
c.37
9C>T
p.A
rg13
3Tr
p
Mis
sens
e
Prob
ably
da
mag
ing
(1)
Del
eter
ious
(0
.02)
Het
eroz
ygo
us
No
DN
A
avai
labl
e
G41
9
CE1
8 TPM
2
ENST
0000
036
0958
c.37
9C>T
p.A
rg13
3Tr
p
Mis
sens
e
Prob
ably
da
mag
ing
(1)
Del
eter
ious
(0
.02)
Het
eroz
ygo
us
No
DN
A
avai
labl
e
G43
9
CE3
0 TPM
2
ENST
0000
036
0958
c.37
9C>T
p.A
rg13
3Tr
p
Mis
sens
e
Prob
ably
da
mag
ing
(1)
Del
eter
ious
(0
.02)
Het
eroz
ygo
us
No
DN
A
avai
labl
e
Gem
ini
num
ber
CE
S re
fere
nce
Gen
e
Tra
nscr
ipt
DN
A
chan
ge
Prot
ein
chan
ge
Prot
ein
cons
eque
nce
Poly
Phen
2
SIFT
Gen
otyp
e
se
greg
atio
n in
fam
ily
164
5.5 Discussion
5.5.1 Why we selected CES strategy to investigate MPS disorders?
We undertook “clinical exome sequencing” (CES) of a cohort of families with MPS-related
disorders and detected both previously characterised (positive control) and previously unknown
mutations in MPS-related disease genes. A major advantage of CES or whole exome sequencing
(WES) for diagnostic testing is the ability to cost-effectively sequence large numbers of
candidate genes in parallel. Traditionally molecular genetic analysis of MPS-related disorders
has been undertaken by sequential analysis of single genes (CHRNG, DOK7, RAPSN and RYR1)
for most of the cases. Apart from few identified mutation, known MPS genes were not reported
as a cause for most cases. According to The United Kingdom Genetic Testing Network
(http://ukgtn.nhs.uk/find-a-test/), the cost of single gene sequencing analysis of CHRNG or
RAPSN in a clinical diagnostic laboratory as at least £423 while genetic testing of extremely
large genes such as RYR1 (106 exons) and NEB genes (160 exons) is more expensive. Both
genes (but not RAPSN or CHRNA1 or CHRNG) are included in a panel test of congenital
myopathy (n=22 genes) that cost nearly £1300. In contrast, the cost for testing our diagnostic
panel of 39 MPS-related genes (including the RYR1 and NEB) in a clinical diagnostic laboratory
is £650 (unpublished data). Furthermore, if no mutation is detected in the 39 genes selected for
the “MPS clinical diagnostic panel” sequence information for additional candidate genes can be
interrogated. WES and WGS offer a wider choice of candidate genes but involves higher costs.
Also, the interpretation of large obtained data is difficult. Hence, target gene capture sequencing
using gene panels has been recently applied in genetic diagnosis of Mendelian diseases. For
instance, in a recent Japanese study, they applied Trusight One panel to investigate the genetic
aetiology of 17 families with different mendelian diseases such including Sotos syndrome,
165
Joubert syndrome and others (Okazaki et al., 2016). According to the study, the overall rate of
accurate molecular diagnosis was 35% which was relatively higher than the diagnostic rate of the
whole exome option (25%) when it had been applied in 250 patients. Most cases (80%) were
children diagnosed with mendelian neurologic conditions (Yang et al., 2013). In very recent
study, whole exome sequencing was applied for 52 patients (from 48 kindreds) with clinical
presentation of arthrogryposis. Several candidate variants have been detected in known
arthrogryposis-associated genes including homozygous variants in 35.4% of probands (e.g.
CHRNG in 6 subjects and ECEL1 in 4 subjects). In addition, they identified variants in candidate
arthrogryposis-causing genes such as FBN3, MYO9A, pleckstrin and PSD3 (Bayram et al.,
2016). In contrast, a very recent paper has concluded that WES has a very high rate in detecting
the pathogenic variants in heterogeneous disorders such as inherited retinal disease by detecting
pathogenic variants (single-nucleotide variants, indels, or structural variants) for 404/722 (56%)
individuals (Keren and McKenna, 2016). However, differences in the composition of the patient
cohorts studies and the extent of prior genetic testing prevent a direct comparison of the results
of CES and WES testing in this study and that reported by Bayram et al (2016). Nevertheless,
number of genes that harboured variants in the cohort reported by Bayram et al (2016) were not
included in our MPS-related gene panels including candidate or potential arthrogryposis linked
genes (CENPJ, COL6A3, ECEL1, ERCC2, FBN3, GPR126, ICAM1, IDS, LIFR, MYBPC2,
MYO9A, MYO18B, POLR3A, PSD3, VPS8). Resequencing theses implicated genes using
Trusight One panel did not reveal any reported mutations. However, ECEL1 was not included in
the version of the Illumina TrusightONE gene panel used by us.
Both CES and WES diagnostic strategies for MPS-related disorders are limited by the inability to
reliably detect heterozygous exon deletions (or duplications) and failure to detect mutations in
166
parts of a gene that are not captured by the exome probes (e.g. much of the intronic sequences).
Though WES has the potential to identify novel genes for MPS-related phenotypes, the
preference is shifted to the application of CES. That is mainly because of economic advantages
of restricting the sequencing to known human disease genes and analysing candidate mutations
to the genes known to be associated with MPS-related disorders which will result in reducing
number of variants of uncertain significance and incidental findings. The overall frequency of
pathogenic mutations in our cohort was 16% (7/45) and a further (3/45) 7% of probands had
candidate (possible pathogenic) mutations that might, in time, prove to be diagnostic. So, the
overall frequency of the detected candidate mutation in this study is 13/45 (29%) of the
examined patients which suggest that clinic al exome method (Trusight One) is a successful
approach for studying FADS/LMPS/EVMPS phenotypes. Many of our cases had been
previously screened for mutations in single candidate genes (e.g. CHRNG, RAPSN, DOK7, and
RYR1) and the mutation detection rate expected to be higher in a previously unscreened cohort
and/or a cohort of exclusively familial cases. Though CES/WES can provide a powerful strategy
for the diagnosis of MPS-related disorders, that correct diagnosis requires careful interpretation
of variants, determination of the pathogenicity and clinical significant of the variants which is a
big challenge.
5.5.2 RIPK4 as a novel potential gene for MPS disorder
The detection of rare missense mutations in known MPS-related genes can pose problems of
interpretation if no functional assay is readily available and clinical or histopathological findings
are not specific. This was illustrated by the finding of a homozygous rare missense variant
(p.Asp161His) in RIPK4 in a fetus with autosomal recessively inherited FADS. Biallelic
mutations in RIPK4 cause the frequently lethal autosomal recessively inherited form of popliteal
167
pterygium syndrome (Bartsocas-Papas syndrome) which is characterized by marked popliteal
pterygium and multiple congenital malformations (Mitchell et al., 2012, Kalay et al., 2012). So,
RIPK4 is not previously known to be associated with inherited MPS disorder in particular
LMPS. Though the p.Asp161His substitution was predicted to be damaging by in silico tools and
was not present in the ExAC database, it had not previously been reported in FADS. Review of
the clinical data revealed that affected fetus was the second affected pregnancy of a
consanguineous couple. Also it was reported that the presence of pterygia (axillae, elbows,
groins, knees and there were pterygia between the two lower limbs) and developmental defects
(retracted eyelids, hypertelorism, depressed nasal bridge, cleft palate, absent mandible and digits
and indeterminate genitalia) led to an independent clinical diagnosis of Bartsocas-Papas
syndrome. The congruence of the presumptive clinical and molecular diagnoses supported the
case for pathogenicity but familial segregation studies have not been possible because of
unavailability of DNA samples.
5.5.3 Genotype/phenotype correlations of RYR1 and NEB genes
Previously, others and we have described LPMS/FADS associated with biallelic RYR1 mutations
(Romero et al., 2003, McKie et al., 2014a, Kariminejad et al., 2016) and here we describe few
additional candidate variants identified by CES panel. It seems likely that the frequency of this
disorder has been underestimated because the large size of RYR1 gene (15.3 kb coding sequence
in 106 exons) which made genetic sequencing and analysis using standard method is expensive
and time consuming. As NGS-based diagnostics approaches such as CES or WES were applied
more commonly, we expect additional cases of RYR1-related FADS/LMPS to be identified.
RYR1 mutations are associated with a range of muscle disease phenotypes including a variety of
168
histological subtypes of congenital myopathies and malignant hyperthermia (MH) (Manning et
al., 1998, McCarthy et al., 2000, Wilmshurst et al., 2010, Ghassemi et al., 2009).
RYR1-associated congenital myopathies may be inherited as autosomal dominant or recessive
trait with recessively inherited cases tending to be more severely affected and having an earlier
age-at-onset. RYR1 mutations described in recessively RYR1-myopathies have predominantly
consisted of a combination of a null mutation with a missense mutation (Amburgey et al., 2013b,
Bharucha-Goebel et al., 2013, Klein et al., 2012, Zhou et al., 2007) whereas RYR1-associated
cases of severe LMPS/FADS appear to be more likely to be associated with biallelic truncating
mutations. Though a potential implication of detecting RYR1-associated LMPS/FADS is to
indirectly identify parents and other mutation carriers at risk of malignant hyperthermia, to date
MH not been observed in the cases we have studied and we note that MH-associated RYR1
mutations are usually missense mutations and cluster in specific protein domains (Brandom et
al., 2013, Kim et al., 2013, Broman et al., 2011)
Similar to RYR1, mutations in nebulin (NEB) have been associated with a variety of congenital
myopathies including autosomal recessively inherited nemaline myopathy, one of the most
common congenital myopathies (Anderson et al., 2004, Lawlor et al., 2011, Lehtokari et al.,
2006). Also, it was implicated, less commonly, with early-onset distal myopathy without
nemaline bodies (Wallgren-Pettersson et al., 2007), distal nemaline myopathy (Lehtokari et al.,
2011) and childhood distal myopathy with rods and cores (Scoto et al., 2013). In a recent
comprehensive review of NEB mutations (212 mutations in 159 kindreds), it was noted that 83%
of patients were compound heterozygotes and only 2% had a prenatal presentation (in two cases
there was a LMPS/FADS phenotype and in one case FADS (Lehtokari et al., 2014) As with
RYR1-associated FADS/LMPS it appears that NEB-associated FADS/LMPS cases mostly have
169
biallelic truncating mutations suggesting a genotype-phenotype correlation with the most severe
mutations causing prenatal presentation (Todd et al., 2015). It is interesting to note that in the
three cases with homozygous NEB null mutation (c. 10278C>A; p.Glu3359Ter) described here
there were severe muscle abnormalities (the muscle was composed of connective tissue with a
severe lack of muscle fibres). Like, RYR1, NEB is a very large gene (~26 kb coding sequence and
183 exons) which is not routinely screened and cases of NEB-associated MPS-related disorders
have probably been underdiagnosed.
An interesting observation was that we identified multiple probands with heterozygous
truncating (or candidate missense) mutations in MPS-related gens (NEB, RYR1, TTN, COL6A2).
The interpretation of these findings can be challenging as such cases might represent autosomal
recessively inherited cases in which the second mutation has not been detected. Conversely it
might be that the mutation is acting in a dominant manner or might be contributing to an
oligogenic phenotype. In the study of 48 families with arthrogryposis, it was noted that 8
families with a homozygous mutation in an arthrogryposis-associated gene also had a second
locus with a homozygous/ compound heterozygous variant in a further candidate gene. These
potential diagnostic uncertainties illustrate the complexity of the interpretation of NGS-based
approaches that can generate large numbers of potentially relevant genetic variants (Bayram et
al., 2016)
5.5.4 TMP2 gene: a further implicated gene in MPS disorder?
Though autosomal recessively inherited forms of MPS are the most commonly recognised, in
sporadic cases recessive, dominant and X-linked causes should be considered. We detected an
identical heterozygous p. R133W missense substitution in TPM2 (which encodes beta-
tropomyosin) in three sporadic individuals. Two of them were diagnosed with Arthrogryposis
170
(CE07,CE18) while the third proband (CE30) has presented EVMPS phenotype. This particular
mutation was initially described in a mother and daughter with distal arthrogryposis type 2B and
muscle weakness without progressive muscle wasting (Tajsharghi et al., 2007). Also it was
reported in various overlapping muscle phenotypes including nemaline myopathy, cap
myopathy, core-rod myopathy, congenital fibre-type disproportion, distal arthrogryposis and
trismus-pseudocamptodactyly (Donner et al. 2002, Sung et al. 2003, Ohlsson et al. 2008, Clarke
et al., 2012, Dowling et al., 2012). Although most disease causing TPM2 mutations are
dominant, autosomal recessive TPM2 mutations have been described in association with EVMPS
and a nemaline myopathy on histology (Monnier et al 2009). Interestingly, the three patients we
identified with a TPM2 mutation were referred to our study because of clinical features
reminiscent of multiple pterygium syndrome, although there was an absence of joint webbing.
The three cases that harboured this mutation in our series demonstrated overlapping but variable
features. It has been shown that TPM2 mutations causing increased calcium sensitivity result in a
hypercontractile phenotype with limb and jaw contractures compared to the non hypercontractile
mutations (Marttila et al., 2014). However although in vitro studies did not demonstrate an
increased sensitivity of the contractile proteins to calcium it resulted in reduced myosin–actin
interactions causing muscle weakness without muscle wasting (Ochala et al 2007).
5.6 Conclusion
The “MPS spectrum disorders” are genetically heterogeneous and although, in some cases, a
diagnosis of a specific primary myopathy, metabolic or neurodevelopmental disorder can be
made by clinical and pathological investigations, the underlying aetiology is unknown in the
majority of cases (Cox PM et al., 2003). Thus, establishing the cause of MPS by clinical and
171
histopathological investigations is challenging because in many cases the histopathological
features may be non-specific or autolysis prevents accurate characterisation of muscle pathology.
Hence comprehensive molecular genetic analysis can greatly facilitate the diagnostic process.
Extensive genetic analysis by CES or WES enables almost all candidate MPS genes to be
examined and so CES/WES provide better strategies to determine the relative frequencies of
individual genetic causes of MPS than sequential testing of single genes. Thus, our data suggests
that after, CHRNG, mutations in RYR1 may be the second most common cause of autosomal
recessive LMPS/FADS. As NGS strategies for genetic diagnosis become more readily available
mutations in large genes such as RYR1 and NEB are more likely to be identified. Additionally, as
the expanded phenotypes that can be associated with mutations in genes such as TPM2 (i.e.
EVMPS as well as distal athrogryposis) become better recognised the proportion of cases of
MPS-related disorders with a molecular diagnosis should increase. Testing mutation negative
cases for whole exon deletions/duplications should further increase diagnostic rates but,
considering that currently a molecular diagnosis is only reached in a minority of cases, it seems
likely that further MPS genes remain to be identified.

172
ChapterSix:GeneralDiscussion
173
6.1 Summary:
This thesis demonstrates the evolution of genetic advances in the field of mutation identification
in autosomal recessively inherited diseases; in particular, amongst families with parental
consanguinity, progressing from genetic mapping, candidate gene analysis to NGS based
approaches. Two main outcomes can be concluded from this thesis and these will be discussed in
detail in this chapter. Firstly, the benefit of applying autozygosity mapping in studying the
autosomal recessively inherited diseases. Secondly, the power of using NGS techniques in
investigating such rare disorders. In this project, NGS was applied as a main investigative tool in
an attempt to identify genes associated with a range of different rare autosomal recessive
disorders in consanguineous families. Two different “exome strategies” were applied in the
project. Whole exome sequencing (WES) was applied to one affected patient of congenital
Oligodontia in order to investigate the genetic basis of the disease whilst the clinical exome
sequencing (CES/Trusight One) was used for the genetic analysis of MPS disorders. The use of
enriched exome panel (Trusight One) for studying MPS disorders has shown good detection rate
(31%) in identifying pathogenic variations in known candidate genes. However, applying whole
exome sequencing for one patient affected with Oligodontia did not result in identifying any
pathogenic variants. Though no mutation was identified by WES in the analysed oligodontia
patient, this method is highly suitable for mutation detection in diseases with genetic
heterogeneity and for gene discovery in such cases. In the future, a larger WES study of patients
with inherited oligodontia.
6.2 Application of Autozygosity mapping for investigating autosomal recessive diseases
Linkage analysis can be used to identify genetic markers linked to disease genes but is
particularly powerful in consanguineous families for excluding linkage to candidate genes. This
174
was illustrated in this project in excluding LTBP3 gene involvement for oligodontia, in most
patients, by analysing microsatellite markers located across the genomic region on chromosome
11 (59,756,135 to 69,325,101) which contain the target LTBP3 gene. However, no evidence of
linkage was identified in 4 families and only one proband of family 5 has showed nearly ~8Mb
homozygous region that contains LTBP3 gene in five microsatellites markers (D11S4191,
D11S4076 D11S1883, D11S913 and D11S1889). Therefore, the gene was not selected to be a
candidate for the disease in the majorities of families. Linkage analysis in addition to excluding
candidate genes is also used to identify candidate region particularly when studying
consanguineous families with multiple affected members with the presence of parents and
unaffected members. This was illustrated in my project by analysing two FADS/MPS patients
from a single consanguineous family (MPS001) to identify regions of homozygosity. This was
carried out using Affymetrix 250K SNP arrays 5.0, genome-wide linkage scan on DNA of the
two affected siblings. The SNP genotyping work was performed by Louise Tee (a research
laboratory technician) prior to starting my project. After excluding linkage to known
FADS/LMPS genes, a candidate homozygous region of nearly10 Mb on chromosome 19 was
identified. As the locus was mapped to chromosome 19, the target region was genotyped using
fourteen polymorphic microsatellite markers from the same candidate region, over 345 genes
were found within the target interval. Amongst these genes, RYR1 was selected as the best
candidate to be sequenced using specific prioritization strategy.
A homozygous null mutation (c.6721C > T) was identified within the RYR1 gene in two affected
siblings of the family MPS001. Then, I proceeded to sequence RYR1 using Sanger method in a
cohort of 36 unrelated probands with FADS/LMPS and revealed two additional homozygous
deletions. Thus, the frequency of RYR1mutations in the analysed probands with FADS/LMPS
175
was 8.3%. These findings suggest that RYR1 gene is a significant cause of FADS/LMPS.
Accordingly, it was recommended adding this gene to the diagnostic panel for the disease in the
future testing.
As introduced in the introduction chapter, our findings agree with many studies that autozygosity
mapping is an effective approach in searching for homozygous regions in particular amongst
consanguineous families. However, the method becomes less informative in case of studying
single cases with no relatives. Over the past decade, Professor Maher’s research group utilised
the autozygosity mapping studies as a main approach in studying different rare recessive
disorders and they have successfully identified a large number of novel genes including genes
for: Achromatopsia (GNAT2) (Aligianis et al., 2002), ARC syndrome (VPS33B, VIPAR)
(Gissen et al., 2004; Cullinane et al., 2010), Beckwith-Wiedemann syndrome (NLRP2) (Meyer
et al., 2009), Faisalabad histiocytosis/3 Rosai- Dorfman disease (SLC29A3) (Morgan et al.,
2010), Fowler syndrome (FLVCR2) (Meyer et al., 2010), Hermansky-Pudlak syndrome
(BLOC1S3) (Morgan et al., 2006b), Immunodeficiency syndromes (TRAC) (Morgan et al.,
2011), Infantile neuraxonal dystrophy (PLA2G6) (Morgan et al., 2006a), Infantile parkinsonism
(DAT) (Kurian et al., 2009), Martsolf syndrome (RAB3GAP2) (Aligianis et al., 2006), Meckel-
Gruber syndrome (MKS3) (Smith et al., 2006), Multiple pterygium/Fetal akinesia syndrome
(CHRNG, RAPSN, DOK7) (Morgan et al., 2006c; Vogt et al., 2008) Also, many other genes
were identified by the help of this efficient method and they can be found in the literature either
of the Maher group or of the many other genetic researchers.
6.3 The Application of NGS in investigating rare inherited disorders:
Linkage mapping and gene-by-gene analysis based on Sanger Sequencing in a disease interval is
a time consuming and expensive process. Several factors could affect the power of that approach
176
such as the small size of studied samples or families, reduced penetrance and locus heterogeneity
(Bamshad et al., 2011). Exome and NGS sequencing techniques in general have revolutionised
human genetics and helped in understanding the genetic basis of many inherited disorders
through identifying the pathogenic variants underlying the rare and complex diseases. NGS is
regarded as the best tool to elucidate disease causing mutation not only in the large extended
families with possibility of performing linkage analysis to identify the candidate genomic region
but also can be efficient in sporadic cases to search mainly for de novo mutations (Veltman and
Brunner, 2012). Exome sequencing became a standard technique because it is more cost-
effective compared to WGS as it only captures the highly interpretable coding region which
represents 1% (about 38 Mb) of the whole human genome. In addition, it contains the majority
(85%) of the reported genetic changes (Wang et al., 2013). Partial exome approach was adopted
in our study for investigating MPS disorder by applying an enriched clinical exome (Trusight
One) panel whereas whole exome sequencing method was used for investigating one patients
who is diagnosed with a severe oligodontia disorder.
In genetically heterogeneous diseases such as MPS, large number of candidate genes is usually
involved in the investigation process. Different gene panels can be tested including specific
diagnostic panel which might comprise up to 50 genes (e.g. NHS diagnostic panel for MPS=39
genes). In addition, whole exome sequencing (WES) can be applied for the extreme
heterogeneous diseases and was used in my project to investigate the genetic causes of
congenital oligodontia. In the results, this project has proven the power of clinical exome
techniques in investigating the autosomal receive disorders by identifying pathogenic mutations
and potential candidate genes that could play a significant role in the genetic basis of MPS
disorders.
177
6.4 Evaluation of Clinical Exome Sequencing for use in MPS diseases/Autosomal recessive
Clinical exome sequencing was applied using the Trusight One panel which screens more than
4,800 genes involved in the clinical phenotypes associated with inherited human disorders. 53
patients were analysed using this clinical panel. 8 analysed patients were already identified with
known mutations in MPS-related genes and the clinical exome was used as a confirmatory
method for them. 45 recruited patients had no previous genetic diagnosis but they have
undergone mutation-screening analysis in number of candidate genes (CHRNG, DOK7, RAPSN
and RYR1) and it was decided to apply clinical exome sequencing to determine if a pathogenic
variant could be identified in another candidate gene.
For each individual, the panel detected nearly 14,800 variants in total. For those whose family
history and parental consanguinity suggested autosomal recessive inheritance of MPS, I focussed
my attention on homozygous variants or compound heterozygous variations while in no-
consanguineous cases, single heterozygous were not excluded as the autosomal dominant
inheritance is considered. After using specific filtering strategy, the total candidate variants are
summarised in table. All 8 previously mutations in CHRNG, LMNA, RAPSN, and RYR1 were
successfully detected with 100% accuracy. In the undiagnosed cases, 7 out of 45 cases (~16%)
novel mutations in known MPS-related genes (CHRNG, CHRNA1, NEB1, RYR1 and TPM2)
within seven different affected patients. Other rare genetic variants which classified as
potentially associated with MPS phenotype were identified in 6 probands in five genes; two of
them are known genes which already reported with pathogenic mutations (NEB, RYR1) and 3
(RIPK4, TTN, COL6A2) were less well characterised genes. Therefore, clinical exome
sequencing has successfully identified the causing genetic variants in 13 out of 45 total
individuals which demonstrate a 29% success rate in identifying associated mutations within
178
MPS-related phenotypes (FADS, LMPS, EVMPS, distal arthrogryposis) in both consanguineous
and non-consanguineous cases including the most pathogenic cases summarised in Table 5.3.
The method is a cost-effective strategy for investigating these inherited diseases compared to
WES and provided new insights into genotype-phenotype correlations.
These research findings could be helpful in the diagnostic process in the future because many
newly detected genes in such research and studies were quickly added to the pipelines of number
of designed diagnostic testing. Sometimes, it takes only few months from the publication of a
new gene to its incorporation into commercial diagnostic gene panels (Lohmann and Klein,
2014).
6.5 Limitations of applying NGS in investigating rare autosomal recessive disorders:
Due to the huge number of data, interpretation of these detected variants is the biggest challenge
for applying the NGS approach in genomic medicine. NGS techniques have some disadvantages
that need an improvement in the future such as the risk of false positive findings from
sequencing errors and the insufficient coverage for a particular gene or nucleotides that reduce
the method specificity. Exome Sequencing approach suffers from an inability to reliably detect
heterozygous exonic deletions or duplications and/or rearrangements that occur within the
targeted regions of associated genes. Though these changes might be reported in HGMD, they
would not be detected due to the limitations exome technology. However, number of alternative
techniques can be used to detect these changes including Multiplex Ligation-dependent Probe
Amplification (MLPA technique) or high-density cytogenetic technologies (e.g. aCGH) that
designed by Oxford Gene Technology and regarded as the most accurate method for detecting
CNV. Another approach that can detect these changes is whole genome sequencing (WGS).
179
Second, there is inadequate and different coverage of the region that contains a causal variant,
which could result in missing variants and false positive findings.
For exome technology, the kits can only target exons that already identified, however, as
knowledge of all truly protein-coding exons in the genome is still incomplete, so the kit might
miss the non-covered exons. A pathogenic variant may be present, but if it is not targeted in
analysis it may not be detected depending on the filtering NGS parameters.
Currently, whole genome sequencing can be good alternative approach but is still more
expensive than exome sequencing. WGS offers some advantages compared with exome
sequencing comprises the unbiased analysis of the genome. First, it allows more reliable
detection of structural variants (e.g. CNV) as well as identifying the noncoding variation
(Gilissen et al., 2014, Spielmann and Klopocki, 2013). Also, the potential protein-coding regions
that have not yet been annotated as genes are included in the genome sequence analysis and it
would not face the technical challenges seen in WES such as exon capture and coverage.
However, although the costs of WGS only higher than WES 2–4 times but the larger data
storage and longer analysis time makes WES a convenient technology To some extent, the
results in this project revealed both the strengths and limitations of using WES/CES as a tool to
evaluate genes related to rare autosomal recessive conditions.
180
6.6 The future of human gnomes and national genome projects
One of the limitations of gene identification studies is the rarity of the patients with the disease
of interest. In familial diseases, the method can be most successful in large extended families
with multiple affected individuals. In addition, it can be a powerful tool to investigate the
genetics for sporadic disease in the presence of many affected individuals displaying similar
phenotypes. Finding those vulnerable people is very difficult for the rare inherited disorders.
However, as genomic medicine continues to progress, many projects could help overcoming this
problem by providing big database based on large number of recruited patients. One of these
large-scale projects is the UK 100,000 Genomes Project that aims to sequence 100,000 genomes
from around 70,000 people including 17,000 rare disease patients and 33,000 healthy relatives.
Another global example of genomic projects is the Saudi Genomic Project to sequence 20,000
subjects including healthy people and patients affected with common or rare genetic disorders.
One of the main project goal is eliminating the huge burden of recessive genetic disease which is
very high in the kingdom (8% of the births) that can be achieved through identifying the causing
gene variants that cause these diseases and then providing genetic counselling for those who at
risk. Also, if the costs of sequencing genome/exome continue to fall as expected with the
accelerating advances in the genomic techniques, similar projects can emerge and support the
process of identifying novel genes and associated pathways. Therefore, NGS can be very helpful
not only in the prediction/diagnostic process through discovering novel genes but may also be
beneficial for the therapeutic approach.
6.7 Comparison of various genetic tests and their applications
NGS technology has made different types of tests available for the genetic diagnosis including
single-gene tests, gene panel tests, exome sequencing and genome sequencing. Selecting the
181
appropriate test is a big challenge to giving a successful genetic diagnosis. In fact, a review study
published in 2015 has critically discussed the approach of selecting the best genetic test for the
examined individual. According to the study, single-gene testing is mostly chosen in the case of
minimal locus heterogeneity with a clear clinical diagnosis based on distinctive clinical features.
Also, an existing association between the diagnosed disease and a disease-causing gene needs to
be already established. Gene panel testing is more cost-effective than a single-gene approach
and it should be the suitable test for heterogeneous disorders with otherwise unclear clinical
diagnoses such as disorders with overlapping phenotypes or disorders which share specific
manifestations but in which the overall phenotypes are different. Such disorders are generally
associated with multiple genes.
Exome Sequencing (ES) and Genome Sequencing (GS) normally selected for the disorders with
extreme heterogeneity and de novo mutations are the major mutation. Also, it is a good option in
the case of a diagnosis which is very difficult to make or when there are at least two possible
phenotypes for one patient. In addition, if there are key phenotypic features are not present at the
time of requesting the testing the real underlying cause of the disease will be very difficult to
identify. Examples of these disorders are Autism and congenital heart disease. ES was
specifically selected in my project for studying foetal akinesia because of the high heterogeneity
of the disorder plus because it has many overlapping phenotypes. It has an advantage over the
gene panel in that it is less biased regarding which set of genes to test as the latter assumes that
the abnormal clinical features are restricted to be associated within the included genes in the
panel itself (though the use of WES rather CES would have enabled a larger number of genes to
be tested). Factors such as technical limitations involved in NGS technology, the risk of false
positive especially for insertion/deletion and the weak coverage for a particular area make both
182
ES or GS are not completely independent methods. Because of this for diagnosis, aCGH and
Sanger sequencing are currently required as a complement method to cover the shortcomings of
NGS in order to detect the full spectrum of mutations and to validate those findings which are
identified by NGS approaches. In this way the differences and difficulties associated with the
used technology, test interpretation, clinical significance, and ethical problems, need to be well
considered by the clinician who selects the gene test because they ultimately affect the correct
order and the diagnosis for the patient (Xue et al., 2015)
6.8 Future Directions:
There are a number of limitations of this project that hopefully directed and improved in further
studies in the future. Firstly, familial cases of congenital oligodontia (like many other congenital
defects) are a valuable source to undertake genetic research and investigate the genetic basis of
the disease. Identification and including more familial cases of oligodontia would facilitate the
discovery of the causing genes of the disorder. This could help in performing conventional
autozygosity mapping in consanguineous families to identify new candidate regions/genes for
the disease or preferably, the method can be combined with WES technique. So, after performing
the exome sequencing to identify rare mutations, the identified linked region can be further
screened for candidate mutations. Also, large cohort of unrelated control subjects from the same
ethnicity of the recruited patients would be suggested in future studies to screen the identified
mutations in these subjects. This might be achieved through a collaboration with similar research
groups within the UK and internationally. Such comparison would provide a further powerful
filter for determining pathogenicity of any candidate variants as well as narrowing down
mutations responsible for familial cases in which the absence of the candidate-causing variant
183
might support the hypothesis that the gene is playing a disease-associated role. Finally,
functional studies in appropriate animal models will be helpful to characterise the pathogenicity
of mutations in candidate regions/genes by recording any molecular or phenotypical changes and
compare it to the human subjects.
In MPS project, for the patients who had no mutations using the use clinical exome method,
WES offers better choice as it includes all the coding genes in case the mutations present in
genes out of the used panel. However, in case the WES failed to identify the candidate rare
variant, moving to the whole genome (WGS) will become the next tool to investigate the genetic
basis of the disease as it includes coding and non-coding region of the genome. In addition, it can
detect the structural changes such as CNV and large genetic changes that cannot be detected
neither by CES or WES.
184
References:
Sachidanandam, R. et al. A map of human genome sequence variation containing 1.42 million single nucleotide polymorphisms. Nature 409, 928–933 (2001).
The International HapMap Consortium. A second generation human haplotype map of over 3.1 million SNPs. Nature 449, 851–861 (2007)
AHMAD, W., BRANCOLINI, V., UL FAIYAZ, M. F., LAM, H., UL HAQUE, S., HAIDER, M., MAIMON, A., AITA, V. M., OWEN, J., BROWN, D., ZEGARELLI, D. J., AHMAD, M., OTT, J. & CHRISTIANO, A. M. 1998. A locus for autosomal recessive hypodontia with associated dental anomalies maps to chromosome 16q12.1. Am J Hum Genet, 62, 987-91.
AIELLO, L. C., MONTGOMERY, C. & DEAN, C. 1991. The natural history of deciduous tooth attrition in hominoids. Journal of Human Evolution, 21, 397-412.
ALFAWAZ, S., FONG, F., PLAGNOL, V., WONG, F. S., FEARNE, J. & KELSELL, D. P. 2013. Recessive oligodontia linked to a homozygous loss-of-function mutation in the SMOC2 gene. Arch Oral Biol, 58, 462-6.
ALIGIANIS, I. A., JOHNSON, C. A., GISSEN, P., CHEN, D., HAMPSHIRE, D., HOFFMANN, K., MAINA, E. N., MORGAN, N. V., TEE, L., MORTON, J., AINSWORTH, J. R., HORN, D., ROSSER, E., COLE, T. R., STOLTE-DIJKSTRA, I., FIEGGEN, K., CLAYTON-SMITH, J., MEGARBANE, A., SHIELD, J. P., NEWBURY-ECOB, R., DOBYNS, W. B., GRAHAM, J. M., JR., KJAER, K. W., WARBURG, M., BOND, J., TREMBATH, R. C., HARRIS, L. W., TAKAI, Y., MUNDLOS, S., TANNAHILL, D., WOODS, C. G. & MAHER, E. R. 2005. Mutations of the catalytic subunit of RAB3GAP cause Warburg Micro syndrome. Nat Genet, 37, 221-3.
AMBURGEY, K., BAILEY, A., HWANG, J. H., TARNOPOLSKY, M. A., BONNEMANN, C. G., MEDNE, L., MATHEWS, K. D., COLLINS, J., DAUBE, J. R. & WELLMAN, G. P. 2013a. Genotype-phenotype correlations in recessive RYR1-related myopathies. Orphanet J Rare Dis, 8, 117.
AMBURGEY, K., BAILEY, A., HWANG, J. H., TARNOPOLSKY, M. A., BONNEMANN, C. G., MEDNE, L., MATHEWS, K. D., COLLINS, J., DAUBE, J. R., WELLMAN, G. P., CALLAGHAN, B., CLARKE, N. F. & DOWLING, J. J. 2013b. Genotype-phenotype correlations in recessive RYR1-related myopathies. Orphanet J Rare Dis, 8, 117.
ANDERSON, S. L., EKSTEIN, J., DONNELLY, M. C., KEEFE, E. M., TOTO, N. R., LEVOCI, L. A. & RUBIN, B. Y. 2004. Nemaline myopathy in the Ashkenazi Jewish population is caused by a deletion in the nebulin gene. Hum Genet, 115, 185-90.
ARZOO, P. S., KLAR, J., BERGENDAL, B., NORDERYD, J. & DAHL, N. 2014. WNT10A mutations account for ¼ of population-based isolated oligodontia and show phenotypic correlations. American Journal of Medical Genetics Part A, 164, 353-359.
BALL, A. D., STAPLEY, J., DAWSON, D. A., BIRKHEAD, T. R., BURKE, T. & SLATE, J. 2010. A comparison of SNPs and microsatellites as linkage mapping markers: lessons from the zebra finch (Taeniopygia guttata). BMC Genomics, 11, 218.
185
BAMSHAD, M. J., NG, S. B., BIGHAM, A. W., TABOR, H. K., EMOND, M. J., NICKERSON, D. A. & SHENDURE, J. 2011. Exome sequencing as a tool for Mendelian disease gene discovery. Nat Rev Genet, 12, 745-55.
BANCROFT, J. D. & GAMBLE, M. 2008. Theory and practice of histological techniques, Elsevier Health Sciences.
BAO, R., HUANG, L., ANDRADE, J., TAN, W., KIBBE, W. A., JIANG, H. & FENG, G. 2014. Review of current methods, applications, and data management for the bioinformatics analysis of whole exome sequencing. Cancer Inform, 13, 67-82.
BAYES, M., HEATH, S. & GUT, I. G. 2012. Applications of second generation sequencing technologies in complex disorders. Curr Top Behav Neurosci, 12, 321-43.
BAYRAM, Y., KARACA, E., COBAN AKDEMIR, Z., YILMAZ, E. O., TAYFUN, G. A., AYDIN, H., TORUN, D., BOZDOGAN, S. T., GEZDIRICI, A., ISIKAY, S., ATIK, M. M., GAMBIN, T., HAREL, T., EL-HATTAB, A. W., CHARNG, W. L., PEHLIVAN, D., JHANGIANI, S. N., MUZNY, D. M., KARAMAN, A., CELIK, T., YUREGIR, O. O., YILDIRIM, T., BAYHAN, I. A., BOERWINKLE, E., GIBBS, R. A., ELCIOGLU, N., TUYSUZ, B. & LUPSKI, J. R. 2016. Molecular etiology of arthrogryposis in multiple families of mostly Turkish origin. J Clin Invest, 126, 762-78.
BENTLEY, D. R., BALASUBRAMANIAN, S., SWERDLOW, H. P., SMITH, G. P., MILTON, J., BROWN, C. G., HALL, K. P., EVERS, D. J., BARNES, C. L., BIGNELL, H. R., BOUTELL, J. M., BRYANT, J., CARTER, R. J., KEIRA CHEETHAM, R., COX, A. J., ELLIS, D. J., FLATBUSH, M. R., GORMLEY, N. A., HUMPHRAY, S. J., IRVING, L. J., KARBELASHVILI, M. S., KIRK, S. M., LI, H., LIU, X., MAISINGER, K. S., MURRAY, L. J., OBRADOVIC, B., OST, T., PARKINSON, M. L., PRATT, M. R., RASOLONJATOVO, I. M., REED, M. T., RIGATTI, R., RODIGHIERO, C., ROSS, M. T., SABOT, A., SANKAR, S. V., SCALLY, A., SCHROTH, G. P., SMITH, M. E., SMITH, V. P., SPIRIDOU, A., TORRANCE, P. E., TZONEV, S. S., VERMAAS, E. H., WALTER, K., WU, X., ZHANG, L., ALAM, M. D., ANASTASI, C., ANIEBO, I. C., BAILEY, D. M., BANCARZ, I. R., BANERJEE, S., BARBOUR, S. G., BAYBAYAN, P. A., BENOIT, V. A., BENSON, K. F., BEVIS, C., BLACK, P. J., BOODHUN, A., BRENNAN, J. S., BRIDGHAM, J. A., BROWN, R. C., BROWN, A. A., BUERMANN, D. H., BUNDU, A. A., BURROWS, J. C., CARTER, N. P., CASTILLO, N., CHIARA, E. C. M., CHANG, S., NEIL COOLEY, R., CRAKE, N. R., DADA, O. O., DIAKOUMAKOS, K. D., DOMINGUEZ-FERNANDEZ, B., EARNSHAW, D. J., EGBUJOR, U. C., ELMORE, D. W., ETCHIN, S. S., EWAN, M. R., FEDURCO, M., FRASER, L. J., FUENTES FAJARDO, K. V., SCOTT FUREY, W., GEORGE, D., GIETZEN, K. J., GODDARD, C. P., GOLDA, G. S., GRANIERI, P. A., GREEN, D. E., GUSTAFSON, D. L., HANSEN, N. F., HARNISH, K., HAUDENSCHILD, C. D., HEYER, N. I., HIMS, M. M., HO, J. T., HORGAN, A. M., et al. 2008. Accurate whole human genome sequencing using reversible terminator chemistry. Nature, 456, 53-9.
BHARUCHA-GOEBEL, D. X., SANTI, M., MEDNE, L., ZUKOSKY, K., DASTGIR, J., SHIEH, P. B., WINDER, T., TENNEKOON, G., FINKEL, R. S., DOWLING, J. J., MONNIER, N. & BONNEMANN, C. G. 2013. Severe congenital RYR1-associated myopathy: the expanding clinicopathologic and genetic spectrum. Neurology, 80, 1584-9.
BHOPAL, R. S., PETHERICK, E. S., WRIGHT, J. & SMALL, N. 2014. Potential social, economic and general health benefits of consanguineous marriage: results from the Born in Bradford cohort study. Eur J Public Health, 24, 862-9.
186
BITTLES, A. 2001. Consanguinity and its relevance to clinical genetics. Clin Genet, 60, 89-98. BITTLES, A. H. & BLACK, M. L. 2010. The impact of consanguinity on neonatal and infant
health. Early Hum Dev, 86, 737-41. BITTLES, A. H., MASON, W. M., GREENE, J. & RAO, N. A. 1991. Reproductive behavior
and health in consanguineous marriages. Science, 252, 789-94. BITTLES, A. H. & NEEL, J. V. 1994. The costs of human inbreeding and their implications for
variations at the DNA level. Nat Genet, 8, 117-21. BOZGA, A., STANCIU, R. P. & MANUC, D. 2014. A study of prevalence and distribution of
tooth agenesis. J Med Life, 7, 551-4. BRANDOM, B. W., BINA, S., WONG, C. A., WALLACE, T., VISOIU, M., ISACKSON, P. J.,
VLADUTIU, G. D., SAMBUUGHIN, N. & MULDOON, S. M. 2013. Ryanodine receptor type 1 gene variants in the malignant hyperthermia-susceptible population of the United States. Anesth Analg, 116, 1078-86.
BROMAN, K. W., MURRAY, J. C., SHEFFIELD, V. C., WHITE, R. L. & WEBER, J. L. 1998. Comprehensive human genetic maps: individual and sex-specific variation in recombination. Am J Hum Genet, 63, 861-9.
BROMAN, K. W. & WEBER, J. L. 1999. Long homozygous chromosomal segments in reference families from the centre d'Etude du polymorphisme humain. Am J Hum Genet, 65, 1493-500.
BROMAN, M., HEINECKE, K., ISLANDER, G., SCHUSTER, F., GLAHN, K., BODELSSON, M., TREVES, S. & MULLER, C. 2011. Screening of the ryanodine 1 gene for malignant hyperthermia causative mutations by high resolution melt curve analysis. Anesth Analg, 113, 1120-8.
BROOK, A. H. 1975. Variables and criteria in prevalence studies of dental anomalies of number, form and size. Community Dent Oral Epidemiol, 3, 288-93.
BUNDEY, S. & ALAM, H. 1993. A five-year prospective study of the health of children in different ethnic groups, with particular reference to the effect of inbreeding. Eur J Hum Genet, 1, 206-19.
CHIEN, A., EDGAR, D. B. & TRELA, J. M. 1976. Deoxyribonucleic acid polymerase from the extreme thermophile Thermus aquaticus. Journal of bacteriology, 127, 1550-1557.
CHILAMAKURI, C. S., LORENZ, S., MADOUI, M. A., VODAK, D., SUN, J., HOVIG, E., MYKLEBOST, O. & MEZA-ZEPEDA, L. A. 2014. Performance comparison of four exome capture systems for deep sequencing. BMC Genomics, 15, 449.
CHONG, J. X., BURRAGE, L. C., BECK, A. E., MARVIN, C. T., MCMILLIN, M. J., SHIVELY, K. M., HARRELL, T. M., BUCKINGHAM, K. J., BACINO, C. A., JAIN, M., ALANAY, Y., BERRY, S. A., CAREY, J. C., GIBBS, R. A., LEE, B. H., KRAKOW, D., SHENDURE, J., NICKERSON, D. A., UNIVERSITY OF WASHINGTON CENTER FOR MENDELIAN, G. & BAMSHAD, M. J. 2015. Autosomal-Dominant Multiple Pterygium Syndrome Is Caused by Mutations in MYH3. Am J Hum Genet, 96, 841-9.
CLARKE, N. F., WADDELL, L. B., COOPER, S. T., PERRY, M., SMITH, R. L., KORNBERG, A. J., MUNTONI, F., LILLIS, S., STRAUB, V., BUSHBY, K., GUGLIERI, M., KING, M. D., FARRELL, M. A., MARTY, I., LUNARDI, J., MONNIER, N. & NORTH, K. N. 2010. Recessive mutations in RYR1 are a common cause of congenital fiber type disproportion. Hum Mutat, 31, E1544-50.
187
COBOURNE, M. T. 2007. Familial human hypodontia--is it all in the genes? Br Dent J, 203, 203-8.
COBOURNE, M. T. & SHARPE, P. T. 2013. Diseases of the tooth: the genetic and molecular basis of inherited anomalies affecting the dentition. Wiley Interdiscip Rev Dev Biol, 2, 183-212.
COX PM, BRUETON LA, BJELOGRLIC P, POMROY P & CA, S. 2003. Diversity of neuromuscular pathology in lethal multiple pterygium syndrome. Pediatric developmental Pathology, 6, 59-68
CUTTING, G. R. 2015. Cystic fibrosis genetics: from molecular understanding to clinical application. Nature Reviews Genetics, 16, 45-56.
Darr, A. and B. Modell (1988). "The frequency of consanguineous marriage among British Pakistanis." J Med Genet 25(3): 186-190.
D’ARCY, C., BJORKSTEN, A., YIU, E., BANKIER, A., GILLIES, R., MCLEAN, C., SHIELD, L. & RYAN, M. 2008. King-Denborough syndrome caused by a novel mutation in the ryanodine receptor gene. Neurology, 71, 776-777.
DAS, P., HAI, M., ELCOCK, C., LEAL, S. M., BROWN, D. T., BROOK, A. H. & PATEL, P. I. 2003. Novel missense mutations and a 288-bp exonic insertion in pax9 in families with autosomal dominant hypodontia. American Journal of Medical Genetics Part A, 118, 35-42.
DE COSTER, P. J., MARKS, L. A., MARTENS, L. C. & HUYSSEUNE, A. 2009. Dental agenesis: genetic and clinical perspectives. J Oral Pathol Med, 38, 1-17.
DELLO RUSSO, C., DI GIACOMO, G., MESORACA, A., D'EMIDIO, L., IACONIANNI, P., MINUTOLO, E., LIPPA, A. & GIORLANDINO, C. 2014. Next generation sequencing in the identification of a rare genetic disease from preconceptional couple screening to preimplantation genetic diagnosis. J Prenat Med, 8, 17-24.
DELOUKAS, P., SCHULER, G. D., GYAPAY, G., BEASLEY, E. M., SODERLUND, C., RODRIGUEZ-TOME, P., HUI, L., MATISE, T. C., MCKUSICK, K. B., BECKMANN, J. S., BENTOLILA, S., BIHOREAU, M., BIRREN, B. B., BROWNE, J., BUTLER, A., CASTLE, A. B., CHIANNILKULCHAI, N., CLEE, C., DAY, P. J., DEHEJIA, A., DIBLING, T., DROUOT, N., DUPRAT, S., FIZAMES, C., FOX, S., GELLING, S., GREEN, L., HARRISON, P., HOCKING, R., HOLLOWAY, E., HUNT, S., KEIL, S., LIJNZAAD, P., LOUIS-DIT-SULLY, C., MA, J., MENDIS, A., MILLER, J., MORISSETTE, J., MUSELET, D., NUSBAUM, H. C., PECK, A., ROZEN, S., SIMON, D., SLONIM, D. K., STAPLES, R., STEIN, L. D., STEWART, E. A., SUCHARD, M. A., THANGARAJAH, T., VEGA-CZARNY, N., WEBBER, C., WU, X., HUDSON, J., AUFFRAY, C., NOMURA, N., SIKELA, J. M., POLYMEROPOULOS, M. H., JAMES, M. R., LANDER, E. S., HUDSON, T. J., MYERS, R. M., COX, D. R., WEISSENBACH, J., BOGUSKI, M. S. & BENTLEY, D. R. 1998. A physical map of 30,000 human genes. Science, 282, 744-6.
des Georges, A., et al. (2016). "Structural Basis for Gating and Activation of RyR1." Cell 167(1): 145-157 e117.
DIB, C., FAURE, S., FIZAMES, C., SAMSON, D., DROUOT, N., VIGNAL, A., MILLASSEAU, P., MARC, S., HAZAN, J., SEBOUN, E., LATHROP, M., GYAPAY,
188
G., MORISSETTE, J. & WEISSENBACH, J. 1996. A comprehensive genetic map of the human genome based on 5,264 microsatellites. Nature, 380, 152-4.
DILELLA, A. G., MARVIT, J., BRAYTON, K. & WOO, S. L. 1987. An amino-acid substitution involved in phenylketonuria is in linkage disequilibrium with DNA haplotype 2. Nature, 327, 333-6.
EL-MOUZAN, M. I., AL-SALLOUM, A. A., AL-HERBISH, A. S., QURACHI, M. M. & AL-OMAR, A. A. 2007. Regional variations in the prevalence of consanguinity in Saudi Arabia. Saudi medical journal, 28, 1881-1884.
EL MOUZAN, M., AL SALLOUM, A., AL HERBISH, A., QURACHI, M. & AL OMAR, A. 2008. Consanguinity and major genetic disorders in Saudi children: a community-based cross-sectional study. Annals of Saudi medicine, 28, 169.
FLEISCHMANNOVA, J., MATALOVA, E., TUCKER, A. S. & SHARPE, P. T. 2008. Mouse models of tooth abnormalities. Eur J Oral Sci, 116, 1-10.
Flucher, B. E., et al. (1993). "Development of the excitation-contraction coupling apparatus in skeletal muscle: association of sarcoplasmic reticulum and transverse tubules with myofibrils." Dev Biol 160(1): 135-147.
FRAZIER-BOWERS, S., PHAM, K., LE, E., CAVENDER, A., KAPADIA, H., KING, T., MILEWICZ, D. & D'SOUZA, R. 2003. A unique form of hypodontia seen in Vietnamese patients: cinical and molecular analysis. Journal of medical genetics, 40, e79-e79.
FRAZIER-BOWERS, S. A., GUO, D. C., CAVENDER, A., XUE, L., EVANS, B., KING, T., MILEWICZ, D. & D'SOUZA, R. N. 2002. A novel mutation in human PAX9 causes molar oligodontia. J Dent Res, 81, 129-33.
GALLUCCIO, G., CASTELLANO, M. & LA MONACA, C. 2012. Genetic basis of non-syndromic anomalies of human tooth number. Arch Oral Biol, 57, 918-30.
GENOME OF THE NETHERLANDS, C. 2014. Whole-genome sequence variation, population structure and demographic history of the Dutch population. Nat Genet, 46, 818-25.
GHASSEMI, F., VUKCEVIC, M., XU, L., ZHOU, H., MEISSNER, G., MUNTONI, F., JUNGBLUTH, H., ZORZATO, F. & TREVES, S. 2009. A recessive ryanodine receptor 1 mutation in a CCD patient increases channel activity. Cell Calcium, 45, 192-7.
GILISSEN, C., HEHIR-KWA, J. Y., THUNG, D. T., VAN DE VORST, M., VAN BON, B. W., WILLEMSEN, M. H., KWINT, M., JANSSEN, I. M., HOISCHEN, A., SCHENCK, A., LEACH, R., KLEIN, R., TEARLE, R., BO, T., PFUNDT, R., YNTEMA, H. G., DE VRIES, B. B., KLEEFSTRA, T., BRUNNER, H. G., VISSERS, L. E. & VELTMAN, J. A. 2014. Genome sequencing identifies major causes of severe intellectual disability. Nature, 511, 344-7.
GILLIN, M. E. & PRYSE-DAVIS, J. 1976. Pterygium syndrome. J Med Genet, 13, 249-51. GISSEN, P., JOHNSON, C. A., MORGAN, N. V., STAPELBROEK, J. M., FORSHEW, T.,
COOPER, W. N., MCKIERNAN, P. J., KLOMP, L. W., MORRIS, A. A., WRAITH, J. E., MCCLEAN, P., LYNCH, S. A., THOMPSON, R. J., LO, B., QUARRELL, O. W., DI ROCCO, M., TREMBATH, R. C., MANDEL, H., WALI, S., KARET, F. E., KNISELY, A. S., HOUWEN, R. H., KELLY, D. A. & MAHER, E. R. 2004. Mutations in VPS33B, encoding a regulator of SNARE-dependent membrane fusion, cause arthrogryposis-renal dysfunction-cholestasis (ARC) syndrome. Nat Genet, 36, 400-4.
GOODWIN, S., MCPHERSON, J. D. & MCCOMBIE, W. R. 2016. Coming of age: ten years of next-generation sequencing technologies. Nat Rev Genet, 17, 333-51.
189
Gordon, A. M., et al. (2000). "Regulation of contraction in striated muscle." Physiol Rev 80(2): 853-924.
GOROKHOVA, S., CERINO, M., MATHIEU, Y., COURRIER, S., DESVIGNES, J. P., SALGADO, D., BEROUD, C., KRAHN, M. & BARTOLI, M. 2015. Comparing targeted exome and whole exome approaches for genetic diagnosis of neuromuscular disorders. Appl Transl Genom, 7, 26-31.
GOYA, H. A., TANAKA, S., MAEDA, T. & AKIMOTO, Y. 2008. An orthopantomographic study of hypodontia in permanent teeth of Japanese pediatric patients. J Oral Sci, 50, 143-50.
HAMAMY, H., ANTONARAKIS, S. E., CAVALLI-SFORZA, L. L., TEMTAMY, S., ROMEO, G., KATE, L. P., BENNETT, R. L., SHAW, A., MEGARBANE, A., VAN DUIJN, C., BATHIJA, H., FOKSTUEN, S., ENGEL, E., ZLOTOGORA, J., DERMITZAKIS, E., BOTTANI, A., DAHOUN, S., MORRIS, M. A., ARSENAULT, S., AGLAN, M. S., AJAZ, M., ALKALAMCHI, A., ALNAQEB, D., ALWASIYAH, M. K., ANWER, N., AWWAD, R., BONNEFIN, M., CORRY, P., GWANMESIA, L., KARBANI, G. A., MOSTAFAVI, M., PIPPUCCI, T., RANZA-BOSCARDIN, E., REVERSADE, B., SHARIF, S. M., TEEUW, M. E. & BITTLES, A. H. 2011. Consanguineous marriages, pearls and perils: Geneva International Consanguinity Workshop Report. Genet Med, 13, 841-7.
HAMAMY, H. A., MASRI, A. T., AL-HADIDY, A. M. & AJLOUNI, K. M. 2007. Consanguinity and genetic disorders. Profile from Jordan. Saudi Med J, 28, 1015-7.
HOFFMANN, K., MULLER, J. S., STRICKER, S., MEGARBANE, A., RAJAB, A., LINDNER, T. H., COHEN, M., CHOUERY, E., ADAIMY, L., GHANEM, I., DELAGUE, V., BOLTSHAUSER, E., TALIM, B., HORVATH, R., ROBINSON, P. N., LOCHMULLER, H., HUBNER, C. & MUNDLOS, S. 2006. Escobar syndrome is a prenatal myasthenia caused by disruption of the acetylcholine receptor fetal gamma subunit. Am J Hum Genet, 79, 303-12.
HU, G., VASTARDIS, H., BENDALL, A. J., WANG, Z., LOGAN, M., ZHANG, H., NELSON, C., STEIN, S., GREENFIELD, N. & SEIDMAN, C. E. 1998. Haploinsufficiency of MSX1: a mechanism for selective tooth agenesis. Molecular and cellular biology, 18, 6044-6051.
INTERNATIONAL HAPMAP, C., FRAZER, K. A., BALLINGER, D. G., COX, D. R., HINDS, D. A., STUVE, L. L., GIBBS, R. A., BELMONT, J. W., BOUDREAU, A., HARDENBOL, P., LEAL, S. M., PASTERNAK, S., WHEELER, D. A., WILLIS, T. D., YU, F., YANG, H., ZENG, C., GAO, Y., HU, H., HU, W., LI, C., LIN, W., LIU, S., PAN, H., TANG, X., WANG, J., WANG, W., YU, J., ZHANG, B., ZHANG, Q., ZHAO, H., ZHAO, H., ZHOU, J., GABRIEL, S. B., BARRY, R., BLUMENSTIEL, B., CAMARGO, A., DEFELICE, M., FAGGART, M., GOYETTE, M., GUPTA, S., MOORE, J., NGUYEN, H., ONOFRIO, R. C., PARKIN, M., ROY, J., STAHL, E., WINCHESTER, E., ZIAUGRA, L., ALTSHULER, D., SHEN, Y., YAO, Z., HUANG, W., CHU, X., HE, Y., JIN, L., LIU, Y., SHEN, Y., SUN, W., WANG, H., WANG, Y., WANG, Y., XIONG, X., XU, L., WAYE, M. M., TSUI, S. K., XUE, H., WONG, J. T., GALVER, L. M., FAN, J. B., GUNDERSON, K., MURRAY, S. S., OLIPHANT, A. R., CHEE, M. S., MONTPETIT, A., CHAGNON, F., FERRETTI, V., LEBOEUF, M.,
190
OLIVIER, J. F., PHILLIPS, M. S., ROUMY, S., SALLEE, C., VERNER, A., HUDSON, T. J., KWOK, P. Y., CAI, D., KOBOLDT, D. C., MILLER, R. D., PAWLIKOWSKA, L., TAILLON-MILLER, P., XIAO, M., TSUI, L. C., MAK, W., SONG, Y. Q., TAM, P. K., NAKAMURA, Y., KAWAGUCHI, T., KITAMOTO, T., MORIZONO, T., NAGASHIMA, A., et al. 2007. A second generation human haplotype map of over 3.1 million SNPs. Nature, 449, 851-61.
JANECKE, A. R., THOMPSON, D. A., UTERMANN, G., BECKER, C., HUBNER, C. A., SCHMID, E., MCHENRY, C. L., NAIR, A. R., RUSCHENDORF, F., HECKENLIVELY, J., WISSINGER, B., NURNBERG, P. & GAL, A. 2004. Mutations in RDH12 encoding a photoreceptor cell retinol dehydrogenase cause childhood-onset severe retinal dystrophy. Nat Genet, 36, 850-4.
JERNVALL, J. & THESLEFF, I. 2000. Reiterative signaling and patterning during mammalian tooth morphogenesis. Mech Dev, 92, 19-29.
JUNGBLUTH, H., ZHOU, H., SEWRY, C. A., ROBB, S., TREVES, S., BITOUN, M., GUICHENEY, P., BUJ-BELLO, A., BONNEMANN, C. & MUNTONI, F. 2007. Centronuclear myopathy due to a de novo dominant mutation in the skeletal muscle ryanodine receptor (RYR1) gene. Neuromuscul Disord, 17, 338-45.
KALAY, E., SEZGIN, O., CHELLAPPA, V., MUTLU, M., MORSY, H., KAYSERILI, H., KREIGER, E., CANSU, A., TORAMAN, B., ABDALLA, E. M., ASLAN, Y., PILLAI, S. & AKARSU, N. A. 2012. Mutations in RIPK4 cause the autosomal-recessive form of popliteal pterygium syndrome. Am J Hum Genet, 90, 76-85.
KARIMINEJAD, A., GHADERI-SOHI, S., HOSSEIN-NEJAD NEDAI, H., VARASTEH, V., MOSLEMI, A. R. & TAJSHARGHI, H. 2016. Lethal multiple pterygium syndrome, the extreme end of the RYR1 spectrum. BMC Musculoskelet Disord, 17, 109.
KEREN, A. & MCKENNA, W. J. 2016. Successful launch of a comprehensive European registry for the cardiomyopathies. Eur Heart J, 37, 174-6.
KHAN, A. O., KHALIL, D. S., AL SHARIF, L. J., AL-GHADHFAN, F. E. & AL TASSAN, N. A. 2010. Germline mosaicism for KIF21A mutation (p. R954L) mimicking recessive inheritance for congenital fibrosis of the extraocular muscles. Ophthalmology, 117, 154-158.
KIM, J. H., JARVIK, G. P., BROWNING, B. L., RAJAGOPALAN, R., GORDON, A. S., RIEDER, M. J., ROBERTSON, P. D., NICKERSON, D. A., FISHER, N. A. & HOPKINS, P. M. 2013. Exome sequencing reveals novel rare variants in the ryanodine receptor and calcium channel genes in malignant hyperthermia families. Anesthesiology, 119, 1054-65.
KLEIN, A., LILLIS, S., MUNTEANU, I., SCOTO, M., ZHOU, H., QUINLIVAN, R., STRAUB, V., MANZUR, A. Y., ROPER, H., JEANNET, P. Y., RAKOWICZ, W., JONES, D. H., JENSEN, U. B., WRAIGE, E., TRUMP, N., SCHARA, U., LOCHMULLER, H., SARKOZY, A., KINGSTON, H., NORWOOD, F., DAMIAN, M., KIRSCHNER, J., LONGMAN, C., ROBERTS, M., AUER-GRUMBACH, M., HUGHES, I., BUSHBY, K., SEWRY, C., ROBB, S., ABBS, S., JUNGBLUTH, H. & MUNTONI, F. 2012. Clinical and genetic findings in a large cohort of patients with ryanodine receptor 1 gene-associated myopathies. Hum Mutat, 33, 981-8.
KLEIN, H.-G., BAUER, P. & HAMBUCH, T. 2014. Whole genome sequencing (WGS), whole exome sequencing (WES) and clinical exome sequencing (CES) in patient care. LaboratoriumsMedizin, 38, 221-230.
191
KLEIN, O. D., OBEROI, S., HUYSSEUNE, A., HOVORAKOVA, M., PETERKA, M. & PETERKOVA, R. 2013. Developmental disorders of the dentition: an update. Am J Med Genet C Semin Med Genet, 163C, 318-32.
KONG, A., GUDBJARTSSON, D. F., SAINZ, J., JONSDOTTIR, G. M., GUDJONSSON, S. A., RICHARDSSON, B., SIGURDARDOTTIR, S., BARNARD, J., HALLBECK, B., MASSON, G., SHLIEN, A., PALSSON, S. T., FRIGGE, M. L., THORGEIRSSON, T. E., GULCHER, J. R. & STEFANSSON, K. 2002. A high-resolution recombination map of the human genome. Nat Genet, 31, 241-7.
KWON, J. M. & GOATE, A. M. 2000a. The candidate gene approach. Alcohol research and health, 24, 164-168.
KWON, J. M. & GOATE, A. M. 2000b. The candidate gene approach. Alcohol Res Health, 24, 164-8.
LAMMI, L., HALONEN, K., PIRINEN, S., THESLEFF, I., ARTE, S. & NIEMINEN, P. 2003. A missense mutation in PAX9 in a family with distinct phenotype of oligodontia. Eur J Hum Genet, 11, 866-71.
LANDER, E. S. & BOTSTEIN, D. 1987. Homozygosity mapping: a way to map human recessive traits with the DNA of inbred children. Science, 236, 1567-70.
LANDER, E. S., LINTON, L. M., BIRREN, B., NUSBAUM, C., ZODY, M. C., BALDWIN, J., DEVON, K., DEWAR, K., DOYLE, M., FITZHUGH, W., FUNKE, R., GAGE, D., HARRIS, K., HEAFORD, A., HOWLAND, J., KANN, L., LEHOCZKY, J., LEVINE, R., MCEWAN, P., MCKERNAN, K., MELDRIM, J., MESIROV, J. P., MIRANDA, C., MORRIS, W., NAYLOR, J., RAYMOND, C., ROSETTI, M., SANTOS, R., SHERIDAN, A., SOUGNEZ, C., STANGE-THOMANN, Y., STOJANOVIC, N., SUBRAMANIAN, A., WYMAN, D., ROGERS, J., SULSTON, J., AINSCOUGH, R., BECK, S., BENTLEY, D., BURTON, J., CLEE, C., CARTER, N., COULSON, A., DEADMAN, R., DELOUKAS, P., DUNHAM, A., DUNHAM, I., DURBIN, R., FRENCH, L., GRAFHAM, D., GREGORY, S., HUBBARD, T., HUMPHRAY, S., HUNT, A., JONES, M., LLOYD, C., MCMURRAY, A., MATTHEWS, L., MERCER, S., MILNE, S., MULLIKIN, J. C., MUNGALL, A., PLUMB, R., ROSS, M., SHOWNKEEN, R., SIMS, S., WATERSTON, R. H., WILSON, R. K., HILLIER, L. W., MCPHERSON, J. D., MARRA, M. A., MARDIS, E. R., FULTON, L. A., CHINWALLA, A. T., PEPIN, K. H., GISH, W. R., CHISSOE, S. L., WENDL, M. C., DELEHAUNTY, K. D., MINER, T. L., DELEHAUNTY, A., KRAMER, J. B., COOK, L. L., FULTON, R. S., JOHNSON, D. L., MINX, P. J., CLIFTON, S. W., HAWKINS, T., BRANSCOMB, E., PREDKI, P., RICHARDSON, P., WENNING, S., SLEZAK, T., DOGGETT, N., CHENG, J. F., OLSEN, A., LUCAS, S., ELKIN, C., UBERBACHER, E., FRAZIER, M., et al. 2001. Initial sequencing and analysis of the human genome. Nature, 409, 860-921.
LARMOUR, C. J., MOSSEY, P. A., THIND, B. S., FORGIE, A. H. & STIRRUPS, D. R. 2005. Hypodontia--a retrospective review of prevalence and etiology. Part I. Quintessence Int, 36, 263-70.
LAWLOR, M. W., OTTENHEIJM, C. A., LEHTOKARI, V. L., CHO, K., PELIN, K., WALLGREN-PETTERSSON, C., GRANZIER, H. & BEGGS, A. H. 2011. Novel mutations in NEB cause abnormal nebulin expression and markedly impaired muscle force generation in severe nemaline myopathy. Skelet Muscle, 1, 23.
192
LEE, H., DEIGNAN, J. L., DORRANI, N., STROM, S. P., KANTARCI, S., QUINTERO-RIVERA, F., DAS, K., TOY, T., HARRY, B. & YOURSHAW, M. 2014. Clinical exome sequencing for genetic identification of rare Mendelian disorders. JAmA, 312, 1880-1887.
LEHTOKARI, V. L., KIISKI, K., SANDARADURA, S. A., LAPORTE, J., REPO, P., FREY, J. A., DONNER, K., MARTTILA, M., SAUNDERS, C., BARTH, P. G., DEN DUNNEN, J. T., BEGGS, A. H., CLARKE, N. F., NORTH, K. N., LAING, N. G., ROMERO, N. B., WINDER, T. L., PELIN, K. & WALLGREN-PETTERSSON, C. 2014. Mutation update: the spectra of nebulin variants and associated myopathies. Hum Mutat, 35, 1418-26.
LEHTOKARI, V. L., PELIN, K., SANDBACKA, M., RANTA, S., DONNER, K., MUNTONI, F., SEWRY, C., ANGELINI, C., BUSHBY, K., VAN DEN BERGH, P., IANNACCONE, S., LAING, N. G. & WALLGREN-PETTERSSON, C. 2006. Identification of 45 novel mutations in the nebulin gene associated with autosomal recessive nemaline myopathy. Hum Mutat, 27, 946-56.
LEVY, S., SUTTON, G., NG, P. C., FEUK, L., HALPERN, A. L., WALENZ, B. P., AXELROD, N., HUANG, J., KIRKNESS, E. F., DENISOV, G., LIN, Y., MACDONALD, J. R., PANG, A. W., SHAGO, M., STOCKWELL, T. B., TSIAMOURI, A., BAFNA, V., BANSAL, V., KRAVITZ, S. A., BUSAM, D. A., BEESON, K. Y., MCINTOSH, T. C., REMINGTON, K. A., ABRIL, J. F., GILL, J., BORMAN, J., ROGERS, Y. H., FRAZIER, M. E., SCHERER, S. W., STRAUSBERG, R. L. & VENTER, J. C. 2007. The diploid genome sequence of an individual human. PLoS Biol, 5, e254.
LIDRAL, A. C. & REISING, B. C. 2002. The role of MSX1 in human tooth agenesis. J Dent Res, 81, 274-8.
LOEWE, L. 2008. Genetic mutation. Nature Education, 1, 113. MACARTHUR, D. G., MANOLIO, T. A., DIMMOCK, D. P., REHM, H. L., SHENDURE, J.,
ABECASIS, G. R., ADAMS, D. R., ALTMAN, R. B., ANTONARAKIS, S. E., ASHLEY, E. A., BARRETT, J. C., BIESECKER, L. G., CONRAD, D. F., COOPER, G. M., COX, N. J., DALY, M. J., GERSTEIN, M. B., GOLDSTEIN, D. B., HIRSCHHORN, J. N., LEAL, S. M., PENNACCHIO, L. A., STAMATOYANNOPOULOS, J. A., SUNYAEV, S. R., VALLE, D., VOIGHT, B. F., WINCKLER, W. & GUNTER, C. 2014. Guidelines for investigating causality of sequence variants in human disease. Nature, 508, 469-76.
MAGGI, L., SCOTO, M., CIRAK, S., ROBB, S. A., KLEIN, A., LILLIS, S., CULLUP, T., FENG, L., MANZUR, A. Y., SEWRY, C. A., ABBS, S., JUNGBLUTH, H. & MUNTONI, F. 2013. Congenital myopathies--clinical features and frequency of individual subtypes diagnosed over a 5-year period in the United Kingdom. Neuromuscul Disord, 23, 195-205.
MANNING, B. M., QUANE, K. A., ORDING, H., URWYLER, A., TEGAZZIN, V., LEHANE, M., O'HALLORAN, J., HARTUNG, E., GIBLIN, L. M., LYNCH, P. J., VAUGHAN, P., CENSIER, K., BENDIXEN, D., COMI, G., HEYTENS, L., MONSIEURS, K., FAGERLUND, T., WOLZ, W., HEFFRON, J. J., MULLER, C. R. & MCCARTHY, T. V. 1998. Identification of novel mutations in the ryanodine-receptor gene (RYR1) in malignant hyperthermia: genotype-phenotype correlation. Am J Hum Genet, 62, 599-609.
MARDIS, E. R., DING, L., DOOLING, D. J., LARSON, D. E., MCLELLAN, M. D., CHEN, K., KOBOLDT, D. C., FULTON, R. S., DELEHAUNTY, K. D. & MCGRATH, S. D.
193
2009. Recurring mutations found by sequencing an acute myeloid leukemia genome. New England Journal of Medicine, 361, 1058-1066.
MARGULIES, M., EGHOLM, M., ALTMAN, W. E., ATTIYA, S., BADER, J. S., BEMBEN, L. A., BERKA, J., BRAVERMAN, M. S., CHEN, Y. J., CHEN, Z., DEWELL, S. B., DU, L., FIERRO, J. M., GOMES, X. V., GODWIN, B. C., HE, W., HELGESEN, S., HO, C. H., IRZYK, G. P., JANDO, S. C., ALENQUER, M. L., JARVIE, T. P., JIRAGE, K. B., KIM, J. B., KNIGHT, J. R., LANZA, J. R., LEAMON, J. H., LEFKOWITZ, S. M., LEI, M., LI, J., LOHMAN, K. L., LU, H., MAKHIJANI, V. B., MCDADE, K. E., MCKENNA, M. P., MYERS, E. W., NICKERSON, E., NOBILE, J. R., PLANT, R., PUC, B. P., RONAN, M. T., ROTH, G. T., SARKIS, G. J., SIMONS, J. F., SIMPSON, J. W., SRINIVASAN, M., TARTARO, K. R., TOMASZ, A., VOGT, K. A., VOLKMER, G. A., WANG, S. H., WANG, Y., WEINER, M. P., YU, P., BEGLEY, R. F. & ROTHBERG, J. M. 2005. Genome sequencing in microfabricated high-density picolitre reactors. Nature, 437, 376-80.
MARTIN, C. L. & WARBURTON, D. 2015. Detection of Chromosomal Aberrations in Clinical Practice: From Karyotype to Genome Sequence. Annu Rev Genomics Hum Genet, 16, 309-26.
MARTTILA, M., LEHTOKARI, V. L., MARSTON, S., NYMAN, T. A., BARNERIAS, C., BEGGS, A. H., BERTINI, E., CEYHAN-BIRSOY, O., CINTAS, P., GERARD, M., GILBERT-DUSSARDIER, B., HOGUE, J. S., LONGMAN, C., EYMARD, B., FRYDMAN, M., KANG, P. B., KLINGE, L., KOLSKI, H., LOCHMULLER, H., MAGY, L., MANEL, V., MAYER, M., MERCURI, E., NORTH, K. N., PEUDENIER-ROBERT, S., PIHKO, H., PROBST, F. J., REISIN, R., STEWART, W., TARATUTO, A. L., DE VISSER, M., WILICHOWSKI, E., WINER, J., NOWAK, K., LAING, N. G., WINDER, T. L., MONNIER, N., CLARKE, N. F., PELIN, K., GRONHOLM, M. & WALLGREN-PETTERSSON, C. 2014. Mutation update and genotype-phenotype correlations of novel and previously described mutations in TPM2 and TPM3 causing congenital myopathies. Hum Mutat, 35, 779-90.
MATALOVA, E., FLEISCHMANNOVA, J., SHARPE, P. T. & TUCKER, A. S. 2008. Tooth agenesis: from molecular genetics to molecular dentistry. J Dent Res, 87, 617-23.
MCCARTHY, T. V., QUANE, K. A. & LYNCH, P. J. 2000. Ryanodine receptor mutations in malignant hyperthermia and central core disease. Hum Mutat, 15, 410-7.
MCKEOWN, C. M. & HARRIS, R. 1988. An autosomal dominant multiple pterygium syndrome. J Med Genet, 25, 96-103.
MCKIE, A. B., ALSAEDI, A., VOGT, J., STUURMAN, K. E., WEISS, M. M., SHAKEEL, H., TEE, L., MORGAN, N. V., NIKKELS, P. G., VAN HAAFTEN, G., PARK, S. M., VAN DER SMAGT, J. J., BUGIANI, M. & MAHER, E. R. 2014b. Germline mutations in RYR1 are associated with foetal akinesia deformation sequence/lethal multiple pterygium syndrome. Acta Neuropathol Commun, 2, 148.
MICHALK, A., STRICKER, S., BECKER, J., RUPPS, R., PANTZAR, T., MIERTUS, J., BOTTA, G., NARETTO, V. G., JANETZKI, C., YAQOOB, N., OTT, C. E., SEELOW, D., WIECZOREK, D., FIEBIG, B., WIRTH, B., HOOPMANN, M., WALTHER, M., KORBER, F., BLANKENBURG, M., MUNDLOS, S., HELLER, R. & HOFFMANN, K. 2008. Acetylcholine receptor pathway mutations explain various fetal akinesia deformation sequence disorders. Am J Hum Genet, 82, 464-76.
194
MICHELS, E., DE PRETER, K., VAN ROY, N. & SPELEMAN, F. 2007. Detection of DNA copy number alterations in cancer by array comparative genomic hybridization. Genet Med, 9, 574-84.
MITCHELL, K., O'SULLIVAN, J., MISSERO, C., BLAIR, E., RICHARDSON, R., ANDERSON, B., ANTONINI, D., MURRAY, J. C., SHANSKE, A. L., SCHUTTE, B. C., ROMANO, R. A., SINHA, S., BHASKAR, S. S., BLACK, G. C., DIXON, J. & DIXON, M. J. 2012. Exome sequence identifies RIPK4 as the Bartsocas-Papas syndrome locus. Am J Hum Genet, 90, 69-75.
MODELL, B. & DARR, A. 2002. Science and society: genetic counselling and customary consanguineous marriage. Nat Rev Genet, 3, 225-9.
MORGAN, N. V., BRUETON, L. A., COX, P., GREALLY, M. T., TOLMIE, J., PASHA, S., ALIGIANIS, I. A., VAN BOKHOVEN, H., MARTON, T., AL-GAZALI, L., MORTON, J. E., OLEY, C., JOHNSON, C. A., TREMBATH, R. C., BRUNNER, H. G. & MAHER, E. R. 2006a. Mutations in the embryonal subunit of the acetylcholine receptor (CHRNG) cause lethal and Escobar variants of multiple pterygium syndrome. Am J Hum Genet, 79, 390-5.
MORGAN, N. V., PASHA, S., JOHNSON, C. A., AINSWORTH, J. R., EADY, R. A., DAWOOD, B., MCKEOWN, C., TREMBATH, R. C., WILDE, J., WATSON, S. P. & MAHER, E. R. 2006b. A germline mutation in BLOC1S3/reduced pigmentation causes a novel variant of Hermansky-Pudlak syndrome (HPS8). Am J Hum Genet, 78, 160-6.
MORGAN, T. H. 1911. Random Segregation Versus Coupling in Mendelian Inheritance. Science, 34, 384.
MOSTOWSKA, A., KOBIELAK, A. & TRZECIAK, W. H. 2003. Molecular basis of non-syndromic tooth agenesis: mutations of MSX1 and PAX9 reflect their role in patterning human dentition. European journal of oral sciences, 111, 365-370.
MUELLER, R. F. & BISHOP, D. T. 1993. Autozygosity mapping, complex consanguinity, and autosomal recessive disorders. J Med Genet, 30, 798-9.
NG, S. B., BUCKINGHAM, K. J., LEE, C., BIGHAM, A. W., TABOR, H. K., DENT, K. M., HUFF, C. D., SHANNON, P. T., JABS, E. W., NICKERSON, D. A., SHENDURE, J. & BAMSHAD, M. J. 2010. Exome sequencing identifies the cause of a mendelian disorder. Nat Genet, 42, 30-5.
NIEMINEN, P. 2009. Genetic basis of tooth agenesis. Journal of Experimental Zoology Part B: Molecular and Developmental Evolution, 312, 320-342.
NIEMINEN, P., KOTILAINEN, J., AALTO, Y., KNUUTILA, S., PIRINEN, S. & THESLEFF, I. 2003. MSX1 gene is deleted in Wolf-Hirschhorn syndrome patients with oligodontia. J Dent Res, 82, 1013-7.
NOOR, A., WINDPASSINGER, C., VITCU, I., ORLIC, M., RAFIQ, M. A., KHALID, M., MALIK, M. N., AYUB, M., ALMAN, B. & VINCENT, J. B. 2009. Oligodontia is caused by mutation in LTBP3, the gene encoding latent TGF-beta binding protein 3. Am J Hum Genet, 84, 519-23.
OGAWA, T., KAPADIA, H., WANG, B. & D'SOUZA, R. N. 2005. Studies on Pax9–Msx1 protein interactions. Archives of oral biology, 50, 141-145.
OKAZAKI, T., MURATA, M., KAI, M., ADACHI, K., NAKAGAWA, N., KASAGI, N., MATSUMURA, W., MAEGAKI, Y. & NANBA, E. 2016. Clinical Diagnosis of Mendelian Disorders Using a Comprehensive Gene-Targeted Panel Test for Next-Generation Sequencing. Yonago Acta medica, 59, 118.
195
OSTERGAARD, P., SIMPSON, M. A., BRICE, G., MANSOUR, S., CONNELL, F. C., ONOUFRIADIS, A., CHILD, A. H., HWANG, J., KALIDAS, K. & MORTIMER, P. S. 2011. Rapid identification of mutations in GJC2 in primary lymphoedema using whole exome sequencing combined with linkage analysis with delineation of the phenotype. Journal of medical genetics, jmg. 2010.085563.
OTT, J. & BHAT, A. 1999. Linkage analysis in heterogeneous and complex traits. Eur Child Adolesc Psychiatry, 8 Suppl 3, 43-6.
PARLA, J. S., IOSSIFOV, I., GRABILL, I., SPECTOR, M. S., KRAMER, M. & MCCOMBIE, W. R. 2011. A comparative analysis of exome capture. Genome Biol, 12, R97.
PEPLOW, M. 2016. The 100,000 Genomes Project. BMJ, 353, i1757. PERALVAREZ-MARIN, A., TAE, H., BOARD, P. G., CASAROTTO, M. G., DULHUNTY, A.
F. & SAMSO, M. 2011. 3D Mapping of the SPRY2 domain of ryanodine receptor 1 by single-particle cryo-EM. PLoS One, 6, e25813.
PETERS, H. & BALLING, R. 1999. Teeth: where and how to make them. Trends in Genetics, 15, 59-65.
PETERS, H., NEUBUSER, A., KRATOCHWIL, K. & BALLING, R. 1998. Pax9-deficient mice lack pharyngeal pouch derivatives and teeth and exhibit craniofacial and limb abnormalities. Genes Dev, 12, 2735-47.
PETUKHOVA, L., SHIMOMURA, Y., WAJID, M., GORROOCHURN, P., HODGE, S. E. & CHRISTIANO, A. M. 2009. The effect of inbreeding on the distribution of compound heterozygotes: a lesson from Lipase H mutations in autosomal recessive woolly hair/hypotrichosis. Hum Hered, 68, 117-30.
POLLAK, M. R., CHOU, Y. H., CERDA, J. J., STEINMANN, B., LA DU, B. N., SEIDMAN, J. G. & SEIDMAN, C. E. 1993. Homozygosity mapping of the gene for alkaptonuria to chromosome 3q2. Nat Genet, 5, 201-4.
PROBER, J. M., TRAINOR, G. L., DAM, R. J., HOBBS, F. W., ROBERTSON, C. W., ZAGURSKY, R. J., COCUZZA, A. J., JENSEN, M. A. & BAUMEISTER, K. 1987. A system for rapid DNA sequencing with fluorescent chain-terminating dideoxynucleotides. Science, 238, 336-41.
RAVENSCROFT, G., SOLLIS, E., CHARLES, A. K., NORTH, K. N., BAYNAM, G. & LAING, N. G. 2011. Fetal akinesia: review of the genetics of the neuromuscular causes. J Med Genet, 48, 793-801.
RIEGEL, M. 2014. Human molecular cytogenetics: From cells to nucleotides. Genet Mol Biol, 37, 194-209.
RISCH, N. & MERIKANGAS, K. 1996. The future of genetic studies of complex human diseases. Science, 273, 1516-7.
ROMERO, N. B., MONNIER, N., VIOLLET, L., CORTEY, A., CHEVALLAY, M., LEROY, J. P., LUNARDI, J. & FARDEAU, M. 2003. Dominant and recessive central core disease associated with RYR1 mutations and fetal akinesia. Brain, 126, 2341-9.
RUF, S., KLIMAS, D., HONEMANN, M. & JABIR, S. 2013a. Genetic background of nonsyndromic oligodontia: a systematic review and meta-analysis. J Orofac Orthop, 74, 295-308.
RUF, S., KLIMAS, D., HONEMANN, M. & JABIR, S. 2013b. Genetic background of nonsyndromic oligodontia: a systematic review and meta-analysis. Journal of Orofacial Orthopedics-Fortschritte Der Kieferorthopadie, 74, 295-308.
196
RYKALINA, V. N., SHADRIN, A. A., AMSTISLAVSKIY, V. S., ROGAEV, E. I., LEHRACH, H. & BORODINA, T. A. 2014. Exome sequencing from nanogram amounts of starting DNA: comparing three approaches. PLoS One, 9, e101154.
SALISBURY, B. A., PUNGLIYA, M., CHOI, J. Y., JIANG, R., SUN, X. J. & STEPHENS, J. C. 2003. SNP and haplotype variation in the human genome. Mutat Res, 526, 53-61.
SAMBUUGHIN, N., MCWILLIAMS, S., DE BANTEL, A., SIVAKUMAR, K. & NELSON, T. E. 2001. Single-amino-acid deletion in the RYR1 gene, associated with malignant hyperthermia susceptibility and unusual contraction phenotype. Am J Hum Genet, 69, 204-8.
SANES, J. R. & LICHTMAN, J. W. 2001. Induction, assembly, maturation and maintenance of a postsynaptic apparatus. Nat Rev Neurosci, 2, 791-805.
SANGER, F., NICKLEN, S. & COULSON, A. R. 1977. DNA sequencing with chain-terminating inhibitors. Proc Natl Acad Sci U S A, 74, 5463-7.
SATOKATA, I. & MAAS, R. 1994. Msx1 deficient mice exhibit cleft palate and abnormalities of craniofacial and tooth development. Nature genetics, 6, 348-356.
SCAREL, R. M., TREVILATTO, P. C., DI HIPÓLITO, O., CAMARGO, L. E. & LINE, S. R. 2000. Absence of mutations in the homeodomain of the MSX1 gene in patients with hypodontia. American journal of medical genetics, 92, 346-349.
SHAMI, S. A., SCHMITT, L. H. & BITTLES, A. H. 1990. Consanguinity, spousal age at marriage and fertility in seven Pakistani Punjab cities. Ann Hum Biol, 17, 97-105.
SHERIDAN, E., WRIGHT, J., SMALL, N., CORRY, P. C., ODDIE, S., WHIBLEY, C., PETHERICK, E. S., MALIK, T., PAWSON, N., MCKINNEY, P. A. & PARSLOW, R. C. 2013. Risk factors for congenital anomaly in a multiethnic birth cohort: an analysis of the Born in Bradford study. Lancet, 382, 1350-9.
SHIMIZU, T. & MAEDA, T. 2009. Prevalence and genetic basis of tooth agenesis. Japanese dental science review, 45, 52-58.
SIMS, D., SUDBERY, I., ILOTT, N. E., HEGER, A. & PONTING, C. P. 2014. Sequencing depth and coverage: key considerations in genomic analyses. Nat Rev Genet, 15, 121-32.
SORRENTINO, V., BARONE, V. & ROSSI, D. 2000. Intracellular Ca(2+) release channels in evolution. Curr Opin Genet Dev, 10, 662-7.
SPIELMANN, M. & KLOPOCKI, E. 2013. CNVs of noncoding cis-regulatory elements in human disease. Curr Opin Genet Dev, 23, 249-56.
STALLINGS, R. L., FORD, A. F., NELSON, D., TORNEY, D. C., HILDEBRAND, C. E. & MOYZIS, R. K. 1991. Evolution and distribution of (GT)n repetitive sequences in mammalian genomes. Genomics, 10, 807-15.
TADMOURI, G. O., NAIR, P., OBEID, T., AL ALI, M. T., AL KHAJA, N. & HAMAMY, H. A. 2009. Consanguinity and reproductive health among Arabs. Reprod Health, 6, 17.
TAJSHARGHI, H., KIMBER, E., HOLMGREN, D., TULINIUS, M. & OLDFORS, A. 2007. Distal arthrogryposis and muscle weakness associated with a beta-tropomyosin mutation. Neurology, 68, 772-5.
TAKESHIMA, H., TAKEKURA, H., NISHI, M., KUNO, J., MINOWA, O., TAKANO, H. & NODA, T. 1994. Excitation-contraction uncoupling and muscular degeneration in mice lacking functional skeletal muscle ryanodine-receptor gene.
THESLEFF, I. & HURMERINTA, K. 1981. Tissue interactions in tooth development. Differentiation, 18, 75-88.
197
TIPU, H. N. & SHABBIR, A. 2015a. Evolution of DNA sequencing. J Coll Physicians Surg Pak, 25, 210-5.
TIPU, H. N. & SHABBIR, A. 2015b. Evolution of DNA sequencing. J Coll Phys Surg Pak, 25, 210-215.
TJIO, J. H. & LEVAN, A. 1956. The chromosome number of man. Hereditas, 42, 1-6. TODD, E. J., YAU, K. S., ONG, R., SLEE, J., MCGILLIVRAY, G., BARNETT, C. P.,
HALILOGLU, G., TALIM, B., AKCOREN, Z., KARIMINEJAD, A., CAIRNS, A., CLARKE, N. F., FRECKMANN, M. L., ROMERO, N. B., WILLIAMS, D., SEWRY, C. A., COLLEY, A., RYAN, M. M., KIRALY-BORRI, C., SIVADORAI, P., ALLCOCK, R. J., BEESON, D., MAXWELL, S., DAVIS, M. R., LAING, N. G. & RAVENSCROFT, G. 2015. Next generation sequencing in a large cohort of patients presenting with neuromuscular disease before or at birth. Orphanet J Rare Dis, 10, 148.
TOLMIE, J. L., PATRICK, A. & YATES, J. R. 1987. A lethal multiple pterygium syndrome with apparent X-linked recessive inheritance. Am J Med Genet, 27, 913-9.
TUCKER, T., MARRA, M. & FRIEDMAN, J. M. 2009. Massively parallel sequencing: the next big thing in genetic medicine. Am J Hum Genet, 85, 142-54.
VAN DEN BOOGAARD, M. J., CRETON, M., BRONKHORST, Y., VAN DER HOUT, A., HENNEKAM, E., LINDHOUT, D., CUNE, M. & PLOOS VAN AMSTEL, H. K. 2012. Mutations in WNT10A are present in more than half of isolated hypodontia cases. J Med Genet, 49, 327-31.
VELTMAN, J. A. & BRUNNER, H. G. 2012. De novo mutations in human genetic disease. Nat Rev Genet, 13, 565-75.
VENTER, J. C., ADAMS, M. D., MYERS, E. W., LI, P. W., MURAL, R. J., SUTTON, G. G., SMITH, H. O., YANDELL, M., EVANS, C. A., HOLT, R. A., GOCAYNE, J. D., AMANATIDES, P., BALLEW, R. M., HUSON, D. H., WORTMAN, J. R., ZHANG, Q., KODIRA, C. D., ZHENG, X. H., CHEN, L., SKUPSKI, M., SUBRAMANIAN, G., THOMAS, P. D., ZHANG, J., GABOR MIKLOS, G. L., NELSON, C., BRODER, S., CLARK, A. G., NADEAU, J., MCKUSICK, V. A., ZINDER, N., LEVINE, A. J., ROBERTS, R. J., SIMON, M., SLAYMAN, C., HUNKAPILLER, M., BOLANOS, R., DELCHER, A., DEW, I., FASULO, D., FLANIGAN, M., FLOREA, L., HALPERN, A., HANNENHALLI, S., KRAVITZ, S., LEVY, S., MOBARRY, C., REINERT, K., REMINGTON, K., ABU-THREIDEH, J., BEASLEY, E., BIDDICK, K., BONAZZI, V., BRANDON, R., CARGILL, M., CHANDRAMOULISWARAN, I., CHARLAB, R., CHATURVEDI, K., DENG, Z., DI FRANCESCO, V., DUNN, P., EILBECK, K., EVANGELISTA, C., GABRIELIAN, A. E., GAN, W., GE, W., GONG, F., GU, Z., GUAN, P., HEIMAN, T. J., HIGGINS, M. E., JI, R. R., KE, Z., KETCHUM, K. A., LAI, Z., LEI, Y., LI, Z., LI, J., LIANG, Y., LIN, X., LU, F., MERKULOV, G. V., MILSHINA, N., MOORE, H. M., NAIK, A. K., NARAYAN, V. A., NEELAM, B., NUSSKERN, D., RUSCH, D. B., SALZBERG, S., SHAO, W., SHUE, B., SUN, J., WANG, Z., WANG, A., WANG, X., WANG, J., WEI, M., WIDES, R., XIAO, C., YAN, C., et al. 2001. The sequence of the human genome. Science, 291, 1304-51.
VIEIRA, A., MEIRA, R., MODESTO, A. & MURRAY, J. 2004. MSX1, PAX9, and TGFA contribute to tooth agenesis in humans. Journal of dental research, 83, 723-727.
VOGT, J., HARRISON, B. J., SPEARMAN, H., COSSINS, J., VERMEER, S., TEN CATE, L. N., MORGAN, N. V., BEESON, D. & MAHER, E. R. 2008. Mutation analysis of
198
CHRNA1, CHRNB1, CHRND, and RAPSN genes in multiple pterygium syndrome/fetal akinesia patients. Am J Hum Genet, 82, 222-7.
VOGT, J., MORGAN, N. V., REHAL, P., FAIVRE, L., BRUETON, L. A., BECKER, K., FRYNS, J. P., HOLDER, S., ISLAM, L., KIVUVA, E., LYNCH, S. A., TOURAINE, R., WILSON, L. C., MACDONALD, F. & MAHER, E. R. 2012. CHRNG genotype-phenotype correlations in the multiple pterygium syndromes. J Med Genet, 49, 21-6.
WALSH, T., SHAHIN, H., ELKAN-MILLER, T., LEE, M. K., THORNTON, A. M., ROEB, W., ABU RAYYAN, A., LOULUS, S., AVRAHAM, K. B., KING, M. C. & KANAAN, M. 2010. Whole exome sequencing and homozygosity mapping identify mutation in the cell polarity protein GPSM2 as the cause of nonsyndromic hearing loss DFNB82. Am J Hum Genet, 87, 90-4.
WANG, Z., LIU, X., YANG, B. Z. & GELERNTER, J. 2013. The role and challenges of exome sequencing in studies of human diseases. Front Genet, 4, 160.
WATSON, J. D. & CRICK, F. H. 1953. The structure of DNA. Cold Spring Harb Symp Quant Biol, 18, 123-31.
WEISMANN, C. G., HAGER, A., KAEMMERER, H., MASLEN, C. L., MORRIS, C. D., SCHRANZ, D., KREUDER, J. & GELB, B. D. 2005. PTPN11 mutations play a minor role in isolated congenital heart disease. Am J Med Genet A, 136, 146-51.
WEISSENBACH, J., GYAPAY, G., DIB, C., VIGNAL, A., MORISSETTE, J., MILLASSEAU, P., VAYSSEIX, G. & LATHROP, M. 1992. A second-generation linkage map of the human genome. Nature, 359, 794-801.
WICKING, C. & WILLIAMSON, B. 1991. From linked marker to gene. Trends Genet, 7, 288-93.
WILMSHURST, J. M., LILLIS, S., ZHOU, H., PILLAY, K., HENDERSON, H., KRESS, W., MULLER, C. R., NDONDO, A., CLOKE, V., CULLUP, T., BERTINI, E., BOENNEMANN, C., STRAUB, V., QUINLIVAN, R., DOWLING, J. J., AL-SARRAJ, S., TREVES, S., ABBS, S., MANZUR, A. Y., SEWRY, C. A., MUNTONI, F. & JUNGBLUTH, H. 2010. RYR1 mutations are a common cause of congenital myopathies with central nuclei. Ann Neurol, 68, 717-26.
WONG, S. S. & ANOKUTE, C. C. 1990. The effect of consanguinity on pregnancy outcome in Saudi Arabia. J R Soc Health, 110, 146-7.
XUE, Y., ANKALA, A., WILCOX, W. R. & HEGDE, M. R. 2015. Solving the molecular diagnostic testing conundrum for Mendelian disorders in the era of next-generation sequencing: single-gene, gene panel, or exome/genome sequencing. Genet Med, 17, 444-51.
YANG, Y., MUZNY, D. M., REID, J. G., BAINBRIDGE, M. N., WILLIS, A., WARD, P. A., BRAXTON, A., BEUTEN, J., XIA, F., NIU, Z., HARDISON, M., PERSON, R., BEKHEIRNIA, M. R., LEDUC, M. S., KIRBY, A., PHAM, P., SCULL, J., WANG, M., DING, Y., PLON, S. E., LUPSKI, J. R., BEAUDET, A. L., GIBBS, R. A. & ENG, C. M. 2013. Clinical whole-exome sequencing for the diagnosis of mendelian disorders. N Engl J Med, 369, 1502-11.
ZEMOJTEL, T., KOHLER, S., MACKENROTH, L., JAGER, M., HECHT, J., KRAWITZ, P., GRAUL-NEUMANN, L., DOELKEN, S., EHMKE, N., SPIELMANN, M., OIEN, N. C., SCHWEIGER, M. R., KRUGER, U., FROMMER, G., FISCHER, B., KORNAK, U., FLOTTMANN, R., ARDESHIRDAVANI, A., MOREAU, Y., LEWIS, S. E., HAENDEL, M., SMEDLEY, D., HORN, D., MUNDLOS, S. & ROBINSON, P. N.
199
2014. Effective diagnosis of genetic disease by computational phenotype analysis of the disease-associated genome. Sci Transl Med, 6, 252ra123.
ZHOU, H., JUNGBLUTH, H., SEWRY, C. A., FENG, L., BERTINI, E., BUSHBY, K., STRAUB, V., ROPER, H., ROSE, M. R., BROCKINGTON, M., KINALI, M., MANZUR, A., ROBB, S., APPLETON, R., MESSINA, S., D'AMICO, A., QUINLIVAN, R., SWASH, M., MULLER, C. R., BROWN, S., TREVES, S. & MUNTONI, F. 2007. Molecular mechanisms and phenotypic variation in RYR1-related congenital myopathies. Brain, 130, 2024-36.