does patient demand contribute to the overuse of
TRANSCRIPT
Policy Research Working Paper 9482
Does Patient Demand Contribute to the Overuse of Prescription Drugs?
Carolina LopezAnja SautmannSimone Schaner
Development Economics Development Research GroupNovember 2020
Pub
lic D
iscl
osur
e A
utho
rized
Pub
lic D
iscl
osur
e A
utho
rized
Pub
lic D
iscl
osur
e A
utho
rized
Pub
lic D
iscl
osur
e A
utho
rized
Produced by the Research Support Team
Abstract
The Policy Research Working Paper Series disseminates the findings of work in progress to encourage the exchange of ideas about development issues. An objective of the series is to get the findings out quickly, even if the presentations are less than fully polished. The papers carry the names of the authors and should be cited accordingly. The findings, interpretations, and conclusions expressed in this paper are entirely those of the authors. They do not necessarily represent the views of the International Bank for Reconstruction and Development/World Bank and its affiliated organizations, or those of the Executive Directors of the World Bank or the governments they represent.
Policy Research Working Paper 9482
This study conducted an experiment in Mali to test whether patients pressure doctors to prescribe medical treatment they do not necessarily need. The experiment varied patients’ information about a discount for antimalarial tablets and measured demand for both tablets and costlier antimalar-ial injections. The study finds evidence of patient-driven demand: informing patients about the discount, instead of
letting doctors decide to share this information, increased discount use by 35 percent and overall malaria treatment by 10 percent. These marginal patients rarely had malaria, worsening the illness-treatment match. Providers did not use the information advantage to sell injections—their use fell in both information conditions.
This paper is a product of the Development Research Group, Development Economics. It is part of a larger effort by the World Bank to provide open access to its research and make a contribution to development policy discussions around the world. Policy Research Working Papers are also posted on the Web at http://www.worldbank.org/prwp. The authors may be contacted at [email protected].
Does Patient Demand Contribute to theOveruse of Prescription Drugs?
Carolina Lopez and Anja Sautmann
and Simone Schaner∗
JEL Codes: I12, I18, O12Keywords: malaria treatment, demand for prescription drugs, healt careoveruse, doctor-patient interaction, Mali
∗We are grateful to Pascaline Dupas, Rema Hanna, seminar participants at the Univer-sity of Toronto, Loyola Marymount University, MIT, USC, Rice University, UCSD Rady, the Barcelona Summer Forum, the BREAD pre-conference, the Stanford Rosenkranz Global Health Policy Symposium, McGill, Brown, Microsoft Research, FGV Sao Paulo, PUC Rio, the University of Cape Town, the University of Gothenburg, and the Stock-holm School of Economics for many helpful comments. We thank the staff of IPA Mali and especially Alassane Koulibaly for expert field coordination. This project would not have been possible without the advice and support of Dr. Seydou Doumbia and Dr. Is-saka Sagara (Malaria Research and Training Center, University of Bamako) as well as Dr. Seydou Fomba (Programme National de Lutte contre le Paludisme (PNLP)). We thank the Ministry of Health and the participating community clinics for allowing us to conduct this research. The study was funded by ESRC/DFID Development Frontiers Award ES/N00583X/1. The research protocol was approved by the IRB of La Facult de Mdecine de Pharmacie et d’Odontostomatologie de Bamako (FMPOS) (protocol No. 2016/47/CE/FMPOS) and registered in the AEA RCT registry (AEARCTR-0001707). The findings, interpretations, and conclusions expressed in this paper are entirely those of the authors. They do not necessarily represent the views of the World Bank and its affiliated organizations, or those of the Executive Directors of the World Bank or the governments they represent. All errors are our own. Carolina Lopez: Brown University, carolina [email protected]. Anja Sautmann: World Bank, [email protected]. Si-mone Schaner: University of Southern California, BREAD, and NBER, [email protected].
Low-income countries must address two opposing challenges when craft-ing health policy: many patients do not seek care when they are ill (White-head, Dahlgren and Evans, 2001; Sautmann, Brown and Dean, 2017), butthose who do often consume a great deal of unnecessary treatment (Das andHammer, 2014; Li et al., 2012). One solution could be to subsidize criticaltreatments in the public sector, while staffing facilities with trained health-care providers to act as gatekeepers to subsidized care.
Yet providers often fail to live up to their gatekeeping mandate. For ex-ample, in an audit study Das et al. (2016) find that 74 percent of publicsector providers in India dispensed at least one unnecessary treatment; theCenters for Disease Control and Prevention estimate that 30 percent of an-tibiotic prescriptions in the United States are unnecessary (Fleming-Dutraet al., 2016); and studies across Sub-Saharan Africa document large shares(36-81 percent) of malaria-negative patients receiving antimalarials at publichealth centers (Reyburn et al., 2004; Hamer et al., 2007; Bisoffi et al., 2009;Ansah et al., 2010). Providers’ gatekeeping ability is key for healthcare poli-cies that increase demand, such as subsidies: only if healthcare providers aregood gatekeepers will such policies expand access to those who need treat-ment while limiting overuse among those who do not need treatment.
Why are so many providers such poor gatekeepers? Most existing liter-ature studies doctor-driven reasons for overtreatment. These include mis-aligned financial incentives (e.g. Iizuka, 2012; Currie, Lin and Meng, 2014;Das et al., 2016) and knowledge gaps, compounded by low motivation (e.g.Banerjee, Duflo and Glennerster, 2008; Das, Hammer and Leonard, 2008).1
Doctors and other healthcare providers can overprescribe to patients becausehealth care is a credence good: since patients cannot verify the true cause oftheir illness, they must rely on the provider’s recommendation. But by a sim-ilar argument, there is scope for patient-driven demand for unnecessary treat-ment: if the provider cannot persuade the patient that a medication is notneeded, she may write a prescription just to keep the patient satisfied. Anec-dotal evidence suggests patient demand matters: for example, in 2016 theU.S. pharmaceutical industry spent $6 billion on direct-to-consumer market-ing of prescription drugs, 22 percent of total marketing spending (Schwartzand Woloshin, 2019), and explicit or perceived patient demand is often citedby providers as a reason for overtreatment (Kotwani et al., 2010; Linder et al.,2014). Yet there has been much less rigorous research on this channel.
1For a detailed review of this literature, see Dupas and Miguel (2017).
2
Our paper aims to fill this gap. We begin by developing a theoreticalmodel of doctor-patient interactions, where doctors and patients may havedifferent preferences about the best course of medical treatment for an illness,and may in particular disagree about whether a certain treatment is trulyneeded. Patient-driven demand occurs when the patient consumes moretreatment than the doctor would like. In our model, this can happen whendoctors change their prescription behavior to avoid “gatekeeping costs”. Pa-tients inflict this utility cost (e.g., in time, hassle, or lost future business) ondoctors when they learn that the doctor’s prescription does not allow themto obtain their preferred treatment option.2 We then conduct an experimentfocused on malaria treatment. Within the experiment, the model generatespredictions for when and how a provider will selectively share informationwith patients to reduce gatekeeping costs and steer treatment towards herown preferences. The theory guides our analysis, allowing us to (1) test forthe presence of gatekeeping costs, (2) assess to what extent patients driveincreased use of antimalarials in response to a price subsidy, and (3) assessthe extent to which providers drive demand for more expensive antimalarialinjections. Finally, we estimate how these changes in demand impact themisallocation of treatment.
The experiment was conducted with 2,055 patients visiting 60 public-sector health clinics in Bamako, Mali. Mali’s policies for malaria control arein line with international consensus and dictate that patients should only beprescribed an antimalarial if they have a positive malaria test (Ministere dela Sante, 2013). The vast majority of malaria patients present with “sim-ple” or “uncomplicated” malaria, which should be treated with artemisinincombination therapy (ACT) tablets. A small share of patients present with“severe” malaria, which requires more intensive (and expensive) medication,usually delivered via injection or IV drip. We document widespread overuseof antimalarials even though diagnostic tests are readily available: in ourcontrol group, 58 percent of malaria-negative patients received an antimalar-ial prescription, and 41 percent of these prescriptions were for severe malariatreatment.
The experiment introduced a discount for simple malaria treatment, bygiving a voucher for a free course of ACT tablets. This subsidy increased the
2Our conceptualization of gatekeeping costs is related to Prendergast’s (2003) modelof bureaucracy, where the risk of complaints distorts the decisions of a bureaucrat taskedwith allocating a good.
3
attractiveness of simple malaria treatment relative to both no treatment andsevere treatment. The experiment varied (within clinic, across different days)whether this discount was a provider’s private information or known to bothprovider and patient. On “Patient Voucher” days, all acutely ill patientsvisiting the health clinic were given a voucher. On “Doctor Voucher” days,the same vouchers were given to providers to dispense at their discretion.This means the healthcare provider could choose to make simple treatmentmore attractive to the patient by revealing the voucher.3
Our model shows that treatment outcomes will not vary across the Doc-tor and Patient Voucher conditions unless there are gatekeeping costs. Intu-itively, the patient-facing costs and clinic revenues associated with differenttreatments are the same in the Doctor and Patient Voucher conditions; con-sequently a doctor (or other healthcare provider’s) preferred action basedon these factors will also be the same in both conditions. The doctor willsometimes deviate from her preferred prescription to satisfy the patient andavoid gatekeeping costs. However, relative to the Patient Voucher condition,the doctor’s information advantage in the Doctor Voucher condition mayhelp her avoid making such compromises. Consider, for example, a doctorwho does not want to prescribe an antimalarial: she may give in to patientpressure for free treatment in the Patient Voucher condition, but can concealthe discount and avoid prescribing in the Doctor Voucher condition. Thisprovides us with a test of the case where patients prefer more simple malariatreatment than doctors (“patient-driven demand”).
By contrast, suppose the provider would like to induce as much treatmentas possible, for example because she wants to increase clinic revenue: in thiscase she will reveal the voucher to patients who would otherwise not buymalaria treatment, but conceal the voucher from patients who are preparedto buy the more expensive severe malaria treatment. Thus, we can also testfor the case when providers have a stronger preference for severe malariatreatment than patients (“doctor-driven demand”). Note that our primarytests of doctor- and patient-driven demand rely on different margins (simpleversus no malaria treatment for patient-driven demand; simple versus severemalaria treatment for doctor-driven demand). It is therefore ex ante possibleto find support for one, both, or neither type of misalignment.
3Vouchers in both conditions had identical appearances, terms, and conditions. Weused clinics’ regular stocks of malaria medicine and reimbursed clinics for all free medica-tion dispensed through the voucher program at the prevailing retail price. This kept thefinancial incentives for doctors constant across the three treatment groups.
4
We find robust evidence that gatekeeping costs affect providers’ choices:patients are nine percentage points (35 percent) more likely to redeem avoucher on Patient as compared to Doctor Voucher days. This implies thatprovider and patient preferences are frequently misaligned. We also find con-sistent evidence that excess demand for vouchers on Patient Voucher days isdriven by patients’ preferences for simple treatment. First, providers are 4percentage points more likely to write an antimalarial prescription (for sim-ple or severe treatment) on Patient Voucher versus Doctor Voucher days,and patients are 6 percentage points more likely to purchase malaria treat-ment. Second, the excess demand for antimalarials on Patient Voucher daysis driven by patients with the fewest malaria symptoms – antimalarial pur-chases by this group are 9 percentage points (23 percent) higher. This sug-gests providers prefer to withhold treatment from these marginal low-riskcases, but accede to demand when patients know that treatment is free.
In contrast, we find no evidence of doctor-driven demand for severemalaria treatment. There are no significant differences in rates of severemalaria treatment across Patient and Doctor Voucher days, and we findno evidence that providers use their information advantage in the DoctorVoucher condition to increase clinic revenues.4
Next, we assess the match between underlying illness and treatment withdata from follow-up home-based malaria tests with patients. In the Controlgroup, we estimate that 57 percent of patients received “appropriate” malariatreatment, in that they either were malaria positive and purchased malariatreatment, or were negative and did not purchase treatment. The PatientVoucher condition reduced the match by 8 percentage points, compared toonly 4 percentage points in the Doctor Voucher condition.5 Over half ofthe worsening of the match in the Patient Voucher condition is driven by achange in providers’ prescribing behavior that is not observed in the DoctorVoucher condition; in other words, patient-driven demand for ACTs leads toovertreatment.6
4Although doctors in our setting are salaried, they have an incentive to increase revenuebecause this funds their salaries, and bonuses are often tied to revenues. See Section 1 formore detail.
5We reject equality of these two treatment effects at the one percent level.6The remainder is driven by an increase in antimalarial purchases among individuals
who would have received prescriptions even absent the price discount (some patients donot purchase prescribed medication, which in our context works to improve the match,since most patients do not actually have malaria).
5
Our experiment provides some of the first well-identified evidence ofpatient-driven demand for excess medical treatment. Most directly relatedto our work are Kravitz et al. (2005) and Currie, Lin and Meng (2014), whoconduct audit studies where “simulated patients” or SPs (trained actors whoare not actually sick) request a specific treatment. Kravitz et al. find thatdoctors are more likely to prescribe antidepressants when SPs ask for them.Currie, Lin and Meng find that direct SP requests for an antibiotic increasedprescription rates at hospitals in China, although this effect disappearedwhen SPs indicated they would purchase their medications outside the hos-pital pharmacy. Our contribution is to develop a method to identify whetherthis provider compliance with patient requests for medication is willing (thedoctor prefers to prescribe) or reluctant (the doctor would rather not pre-scribe, but goes along to avoid gatekeeping costs). Our experiment also hasthe advantage that it uses real patients, allowing for natural doctor-patientinteractions where patients themselves choose whether to express demand fortreatment in response to the subsidy.
Our work also contributes to the literature on the pricing of health goodsin developing countries. Most recent work in this area focuses on preventivehealth products like mosquito bednets and water purification, where benefi-ciary demand is low, use generates positive externalities, and large subsidiestypically improve outcomes.7 Use of curative products, by contrast, can gen-erate negative externalities (e.g. by contributing to disease resistance (WHO,2014)). Recent work on the pricing of curative health products has foundmixed results. Cohen, Dupas and Schaner (2015) find that subsidizing anti-malarials at private-sector “drug shops” dramatically improves access to life-saving medication, but making the subsidy too high generates large amountsof overtreatment with only marginal additional gains in access. Importantly,these shops were staffed by retail workers, who were not expected to performa gatekeeping function. In the public sector, Sautmann, Brown and Dean(2017) find that subsidizing health care for children (combined with closecost control) can improve access at the extensive margin significantly. Ourpaper contributes by offering evidence on misallocation – and its drivers –conditional on seeking care.
Our tests are specific to marginal changes in patient demand in responseto the ACT subsidy and do not allow us to extrapolate how the different
7For bednets see Cohen and Dupas (2010), (Dupas, 2014), and (Tarozzi et al., 2014).For water purifications see (Ashraf, Berry and Shapiro, 2010) and (Kremer et al., 2011).
6
mechanisms contribute to overall levels of overtreatment. Even so, publicclinics are a prime delivery mechanism for acute malaria care across Sub-Saharan Africa, meaning this is precisely the margin of interest for poli-cymakers deciding whether to subsidize malaria treatment. On this margin,we show subsidies induce patient-driven demand that leads to overtreatment.Thus, interventions that strengthen the provider’s authority and reduce gate-keeping costs (like patient communication tools) could help sustain subsidieswhile limiting overtreatment.
The rest of the paper is structured as follows: in the next section we pro-vide background on health care and malaria treatment in Mali and presentsome stylized features of status quo malaria treatment. We develop a modelof doctor-patient interactions in section 2. Section 3 describes our experimen-tal design, section 4 presents and discusses our empirical results, includingalternative explanations for our findings, and section 5 concludes.
1 Background
1.1 Health Care and Malaria in Mali
The public health system in Mali is organized around decentralized community-based primary care funded by user fees. At the foundation of this systemare Centres de Sant Communautaire (CSComs) – community-based primarycare clinics managed by a local health association. A typical clinic in oursample is staffed with one or two physicians and around five medical traineesand five other staff who can prescribe malaria, along with additional techni-cal and administrative staff. Clinics with a laboratory have a lab technicianwho conducts blood tests. Table B1 in the Appendix gives an overview of thestaffing numbers in our sample. The local health association retains revenuesfrom sales of medications and other user fees, which are used to fund the op-erations of the CSCom. Qualitative research suggests this system leads staffto prioritize profit generation, since clinic revenues can be used to fund end-of-year physician bonuses (Toure, 2015; Escot, 2012). Moreover, pharmacysales often directly fund staff salaries – this is the case in 87 percent of theclinics in our sample.
Similar community-funded public healthcare is found all over West Africa,and in other countries like China, where high rates of antibiotic use in thepublic sector have been attributed to physicians’ incentives to generate bonus
7
revenue (Currie, Lin and Meng, 2014). This structure – where medical staffare salaried but still have an incentive to generate revenue to sustain theclinic – exists in many other settings across the developing world, includingprivate, mission, and NGO-run medical facilities.
CSComs are one of the most important sources of care in Mali: accordingto the 2012-2013 Demographic and Health Survey, 47 percent of mothersin Bamako who sought care for a child under five with fever or cough tookthe child to a CSCom. The quality of care across CSComs varies and istypically poorest in rural areas. Our study was conducted in the capital cityof Bamako and a nearby suburb, where clinics offer a higher standard ofcare and are usually headed by a trained medical doctor (as compared to anational average of roughly one third (PMI, 2016)). All clinics in our samplehave at least one salaried physician on staff, and in over 90 percent of clinicsthat have a pharmacy, there is a physician present when the pharmacy isopen (see Appendix Table B1).
One of the most commonly-treated illnesses in CSComs is malaria. De-spite recent progress, malaria is the second largest cause of mortality in Mali,accounting for roughly 14 percent of all deaths and 19 percent of deathsamong children under five (IHME, 2018). Although the parasite is endemicin all parts of the country except the sparsely populated northern desert,rates of transmission are substantially lower in urban areas. For example, in2015 the estimated prevalence of the parasite in children under five in Ba-mako was six percent, as compared to 36 percent nationwide (PNLP et al.,2016).
Malaria infections are classified as either “simple/uncomplicated” or “se-vere”. Simple malaria is not life threatening if treated promptly, and ischaracterized by non-specific, flu-like symptoms including fever, chills, andheadache. If left untreated, simple malaria can progress to severe malaria.In this stage of the disease, patients often suffer convulsions and experiencelife-threatening complications, including loss of consciousness/coma, respira-tory failure, renal failure, and severe anemia (Trampuz et al., 2003). Patientswith severe malaria require prompt, aggressive treatment to avoid death andshould be hospitalized until their symptoms stabilize.
Mali’s national malaria policy requires that suspected malaria cases beconfirmed via a positive microscopy or rapid diagnostic test (RDT) beforedispensing treatment (Ministere de la Sante, 2013).8 RDTs are meant to be
8This recommendation was first made in the five-year strategic plan for 2007-2011.
8
free in public health facilities (including CSComs) to ensure that cost is nota barrier to accurate diagnosis.9 Artemisinin combination therapies (ACTs)are recommended for simple malaria, while severe malaria cases should betreated with injectable artesunate followed by a dose of ACTs once the pa-tient is stable.10 These policies are in line with WHO recommendations(WHO, 2014) and are designed to limit the spread of drug resistance, which ishastened by overtreatment. Limiting overuse of antimalarials is particularlyimportant, as drug resistance has rendered past generations of antimalarialsineffective across much of Sub-Saharan Africa and Asia (Arrow, Panosianand Gelband, 2004). This externality is one of the largest (potential) coststo overtreatment, though overtreatment also strains government budgets fordrug subsidies, wastes resources of poor families, causes side effects, and canslow diagnosis and treatment of non-malarial illnesses.
In public facilities, ACTs are meant to be free for children under fiveand subsidized for older individuals, but there are no subsidies for othercomponents of severe malaria treatment (PMI, 2016). In our study area, theACT subsidy policy is only partially enforced, as evidenced by the fact that37 percent of children under five receiving ACTs in our control group paid apositive price.
1.2 Status Quo Malaria Treatment in the Study Sam-ple
We use data from our Control group to quantify overuse of malaria treatmentat the 60 clinics that participated in our study. Here we give a brief overviewof the data; we provide additional detail on the sampling frame and datacollection protocols in section 3. We stationed surveyors at each clinic for
Previously, presumptive treatment of any fever cases was the main approach to malariacontrol (Kone et al., 2015).
9In our data, RDTs were free of charge 70 percent of the time, while microscopy testswere free less than 3 percent of the time.
10Artesunate is a derivative of artemisinin. Artemisinin-based antimalarials are themost effective treatments for malaria in Sub-Saharan Africa, where the emergence of drug-resistant parasites has rendered earlier generations of antimalarials ineffective. Quininecan also effectively treat both simple and severe malaria infections in this region, but thedrug is less effective than artemisinin and has more side effects (Achan et al., 2011). Malianpolicy generally reserves quinine for pregnant mothers, though national policy allows foran initial dose of quinine to treat severe malaria if an injectable artemisinin-based therapyis not available.
9
6 days over a two week period. Enumerators administered a short “intake”interview to all consenting patients seeking care for an acute illness. Afterthe patient’s consultation with the provider was complete, the enumeratorrecorded details of all blood tests performed, medications prescribed, medi-cations purchased, and fees paid. A randomly chosen subset of these patientswere selected for a more detailed home-based follow up survey on the dayafter their clinic visit. As part of this visit, a trained enumerator performedan RDT on the patient to confirm his/her malaria status.11
Table 1 uses the 628 patient observations in the Control group to givean overview of how acute illnesses are treated in clinics in Bamako. Panel Ashows average indicators regarding malaria beliefs and treatment outcomes.Panel B reports treatments that often accompany malaria medications: an-tibiotics, which are often given for fevers but are not indicated for malaria,as well as injections/IV, which are used in severe malaria treatment. Panel Balso shows how often patients were referred to a hospital, the recommendedcourse of action for severe malaria. Finally, Panel C shows average costs inWest African CFA (at the time of the experiment CFA 610 was approximatelyUSD 1), split by the type of treatment received.
Looking at means in the whole sample of 628 (column 2), treatment formalaria is very common, with 31 percent of patients prescribed treatmentfor simple malaria and 30 percent for severe malaria. Twenty-one and 26percent of patients purchase medication for simple and severe malaria, re-spectively (Panel A).12 Malaria treatment is expensive: while the averagepatient not treated for malaria reported spending CFA 2,793 ($4.58 at theaverage exchange rate of CFA 610 per USD that prevailed during the studyperiod), simple malaria patients paid CFA 4,475 ($7.34) and severe malaria
11RDTs detect antigens for malaria, which remain in the bloodstream after the infectionis cured. We used CareStart HRP2(Pf) tests, which detect an antigen that typically takes acouple of weeks to become undetectable in blood samples (Humar et al., 1997; Kyabayinzeet al., 2008). This test detects the P. falciparum malaria parasite, which accounts for 92percent of all malaria infections in Mali (PMI, 2016). In WHO quality assurance testing,these RDTs correctly identified malaria infection in 91 percent of low parasite densityblood samples and 100 percent of high parasite density samples. False positives occurredless than 1 percent of the time, and the invalid test rate was 0 percent (WHO, 2017).
12We classify treatment as indicating severe malaria treatment if the patient receivedartemisinin monotherapy or quinine, (1) as an injectable or (2) recorded in the surveyas tablets, and received an ACT. These cases are consistent with guidelines for severemalaria treament which require administering monotherapy/quinine into the bloodstreamor rectally.
10
patients paid CFA 10,353 ($16.97). To put this in perspective, the fee forsevere malaria patients amounts to 47 percent of average per capita monthlyincome in our sample (Panel C).
We quantify overtreatment among the subset of patients who received avalid RDT result at the home follow up. Column 3 shows average outcomesfor all patients who took a test, while columns 4 and 5 show means for pa-tients who tested malaria positive and negative, respectively. Overtreatmentis widespread, with 58 percent of malaria negative patients being prescribedantimalarials, as compared to 76 percent of malaria positive patients. Severetreatment accounts for 78 percent of prescriptions for those who tested pos-itive for malaria and 41 percent for those who tested negative, even thoughdonors estimate that only 10 percent of malaria cases should be severe (PMI,2015). Use of antibiotics is also widespread, with over 40 percent of malariapositive and negative patients purchasing the drugs. Finally, only 56 per-cent of Control group patients prescribed an antimalarial took a test, eventhough all clinics in our study had malaria testing capability. These factssuggest gatekeeping failures, especially given the very straightforward treat-ment guidelines for malaria (prescribe only for patients with a positive test).
There are some indications that overprescription might be driven byproviders. The patterns of severe malaria treatment we observe match anec-dotal reports that doctors in our sample treat positive malaria tests as asign of severe malaria, while interpreting negative tests accompanied bymalaria-like symptoms as a sign of simple malaria. This, coupled with thefact that microscopy tests for malaria are not very accurate in field settings(Wongsrichanalai et al., 2007), could explain some of the misallocation we ob-serve.13 The revenue especially from severe treatment provides an additionalmotive if doctors are concerned with the clinic’s financial health.14
Moreover, 25 percent of patients do not purchase their antimalarial pre-
13We find indications for this in our sample as well. Appendix Figure B1 shows thatthe match between malaria status in our at-home test and receipt of an antimalarialprescription is better among patients who received an RDT at the clinic as comparedto microscopy. Specifically, we find higher rates of overtreatment after microscope-basedtests, which suggests clinics may see more false positives with microscopy.
14While we do not observe profits, higher revenue from an individual patient will indi-cate higher profits provided profit is positively correlated with revenue. This likely holdsin our case, especially since the higher cost of severe treatment includes service fees e.g. forinjections. Our estimates suggest service fees are 35-47 percent higher for severe (as com-pared to simple) malaria. Since there was very limited patient queuing in our setting, theshort-run marginal cost of providing such services is close to zero.
11
scription, with the prescription-purchase gap mostly driven by individualsdeclining to purchase available treatment (77 percent of cases) rather thanstock outs.15 This could be a consequence of credit constraints – a reason tosubsidize treatment in the first place – but may also be a sign of misalignmentbetween doctor prescriptions and patient preferences.
On the other hand, there are also signs of patient-driven overprescription.First, patients over-estimate their malaria risk: 55 percent of respondents re-port suspecting malaria before they see the provider; among those with avalid home-based RDT, this proportion is 61 percent, even though only 25percent actually test positive. Second, the share of patients prescribed treat-ment exceeds providers’ average estimate of true malaria prevalence (48 per-cent) by 13 percentage points (see Appendix Table B2). Finally, 57 percent ofhealth workers report feeling pressure from patients to prescribe unnecessarymedication, with over half mentioning antimalarials specifically.16
2 Theory
In order to investigate the role of patients pressuring health workers to pre-scribe, we use a simple model of a doctor-patient interaction to predict dif-ferences between two experimental pricing conditions. In both conditions,we provide vouchers that make simple malaria treatment free of charge tothe patient, while keeping the clinic’s and doctor’s financial incentives con-stant. In the first condition, which we refer to as “Patient Voucher” or “PV ”,both the doctor (she) and the patient (he) know that simple malaria treat-ment is free. In the second condition (“Doctor Voucher” or “DV ”), only thedoctor knows about the discount going into the consultation, and she candecide whether to reveal this information to the patient. In section 3, weexplain how we operationalized these pricing treatments. The remainder ofthis section introduces the model and outlines the key testable predictionsthat identify patient- and doctor-driven demand. We leave the full modeland formal analysis for Appendix A.
15Our home survey found that just 6 percent of individuals who declined to purchaseat the clinic obtained an antimalarial from another source after leaving the clinic.
16Appendix B gives additional detail on the health worker survey.
12
2.1 Model Setup
Malaria Risk and Patient Preferences. Patient and doctor observe thepatient’s symptoms and assign probability π that the patient has malaria.17
Patients receive different utilities from taking either simple malaria treatment(t = L) or severe malaria treatment (t = H). The expected utility of t ∈{L,H} is the expected benefit minus the cost:
Ut (π, Pt) = πBt − Ct (Pt) .
where Bt denotes the benefit from treatment t to a malaria-positive patient,and Pt is the price of treatment to the patient, with PL ∈ {0, P}, dependingon whether the patient has a voucher. The full cost of treatment, Ct (Pt),includes both monetary and non-monetary costs such as side effects. Weassume CL(0) < CL(P ) < CH (PH). We normalize the expected utility of notreatment (t = N) to zero.
Figure 1, Panel A illustrates patient preferences with and without thesimple malaria discount. Assuming that CL(·)
BL< CH
BH, there are three regions
of the malaria probability πfrom low to high: individuals in N prefer notreatment; patients in L prefer simple treatment; and those in H prefer severetreatment over simple or no treatment. This captures that the benefits ofboth simple and severe treatment – and thus the patient’s willingness to buythem – are increasing in the severity of symptoms, but that the benefits ofsevere treatment only outweigh the higher costs when symptoms are mostpronounced. Panel A also shows that when the voucher lowers the price PL
from P to 0, L expands, so that more patients prefer simple treatment overboth no and severe treatment.
Note that there is an area within L, denoted L2, where patients prefersimple treatment but would be willing to purchase severe (whereas in L1 theywould rather get no treatment at all). This means doctors could “oversell”severe treatment to at least some patients.
Doctor Utility. Doctors may disagree with patients’ preferences. This isexpressed by a wedge ∆t, making the doctor’s direct utility from the patienttaking treatment t
Vt(π, Pt) = Ut (π, Pt) + ∆t.
17The full model in the appendix allows for private signals about malaria risk; see alsobelow.
13
The wedge may be positive, for example if the doctor does not care aboutfinancial costs paid by the patient, or if the doctor’s utility factors in clinicprofits. A positive ∆t also captures non-financial reasons for preferring totreat, such as risk aversion or fear of missing a diagnosis. On the other hand,∆t could be negative, meaning the doctor gets less utility from treatment tthan the patient. This may reflect internalized costs of public provision ofhealth care, anticipated side effects, concerns about creating disease resis-tance, or discomfort with disregarding official treatment policy.
From low to high π, preferences Vt generate regions N , L, and V wheredoctors prefer no, simple, and severe treatment, respectively (assuming CL
BL+∆L<
CH
BH+∆H). Unless doctors are completely altruistic and ∆L = ∆H = 0, these
regions will be shifted relative to N , L, and V . When ∆t is positive, thethreshold for treatment t shifts to the left, and doctors prefer more of thistreatment than patients. When ∆t is negative, the threshold for treatment tshifts to the right and doctors have a lower preference for t than patients.18
The cases of disagreement are our object of interest. In what follows, wesay patients drive (marginal) demand for treatment when the doctor pre-scribes (and patients purchase) more aggressive treatment than the doctorherself thinks is optimal. We say the doctor drives demand when the doctorleads patients to purchase more (powerful) treatment than patients find op-timal. The extent to which this drives misallocation will depend on whetherdoctor versus patient preferences are better aligned with the social planner.We can also assess misallocation empirically.
Gatekeeping Costs. If the doctor only cares about her own utility V ,patients have no way to influence her prescription. To allow for a deviationbetween what the doctor prescribes and what she truly prefers, we assumethat the doctor incurs a gatekeeping cost if she fails to prescribe the patient’smost preferred treatment. This utility cost encompasses factors like the riskof losing the patient to another clinic, any direct cost of dealing with an upsetor angry person in the office, and the effort cost of explaining the prescriptionand cajoling the patient to comply. We assume that the gatekeeping cost thedoctor experiences is a share g of the patient’s lost utility relative to his
18It may be natural to assume that doctors prefer “more treatment” or “less treatment”than patients across both treatment options, but it is in principle possible to have wedgeswith different signs, e.g. ∆L > 0 and ∆H < 0, which would imply that doctors want tostart treating with simple at lower levels of π, but prefer to switch to severe at a higher π.
14
first-best treatment choice.19
Patient-driven demand for simple treatment can occur for example whenthe doctor intrinsically prefers no treatment, but the patient strongly preferssimple, so that the gatekeeping costs exceed the utility loss the doctor incursby writing a prescription: gUL(π, PL) > |UL(π, PL) + ∆L|.20 In a similarmanner, there may be patient-driven demand for severe treatment over simpleor no treatment. Doctor-driven demand for severe treatment occurs whenthe patient prefers simple treatment, but the doctor prefers, and prescribes,severe treatment (note that this can only lead to a purchase when patientsare prepared to buy severe treatment, i.e. π ∈ L2). Not only are preferencesreversed between patients and doctors, but the utility the doctor gains fromprescribing severe must outweigh the gatekeeping cost. This requires a higherwedge in doctor preferences in favor of severe over simple: ∆H > ∆L.
The range of beliefs π for which prescribing no or severe treatment incursa gatekeeping cost increases when patients know that simple treatment isfree (in the Patient Voucher condition). This reflects the fact that patientdemand for simple treatment is higher when the price is lower; i.e. L ex-pands. However, in the Doctor Voucher condition the doctor has the optionto selectively conceal the voucher to reduce her gatekeeping costs from pre-scribing no treatment or severe treatment. We use this below to identifypatient-driven and doctor-driven demand.
In the full model, we assume that patients and doctors have private signalsabout the patient’s probability of being malaria positive. Unobserved signalsallow for uncertainty on both sides: patients do not know in advance whatprescription will be given, and the doctor does not know whether the patientwill buy the prescription she makes, as we observe frequently in the data.This also means the doctor cannot be completely sure what gatekeeping costshe will incur when prescribing treatment t. In the face of this uncertainty, wepermit doctors to avoid gatekeeping costs completely by letting the patientchoose between simple and severe treatment. If the doctor takes this option,treatment is completely determined by patient preferences.21
19Note that when a patient prefers not to receive treatment, he can always choose notto purchase the prescription. This form of overprescription therefore incurs no gatekeepingcost.
20Note that this requires ∆L < 0 since UL(π, PL) > 0 > UL(π, PL) + ∆L.21In an earlier version of this paper, we discuss the model without this option (available
on request) – the key insights are unchanged.
15
2.2 Comparing Doctor Voucher and Patient VoucherTreatments
Our first testable prediction focuses on detecting gatekeeping costs whendoctors and patients have different prescription preferences:
Prediction (1) If there are gatekeeping costs and doctors and patients donot always agree on the optimal prescription, the use of vouchers willbe higher in PV than DV .
Obtaining this result is straightforward: absent gatekeeping costs, thedoctor will always choose the action that maximizes her utility, V . Thisaction is independent of voucher condition, which in turn implies that voucheruse will be the same in PV and DV . When gatekeeping costs are present,note two things: First, if it is optimal to use the voucher under DV , it is alsooptimal to use the voucher under PV . Second, under DV the doctor canstrategically conceal the voucher from patients to whom she does not wantto prescribe simple treatment and thereby avoid the increased gatekeepingcosts when simple treatment is free. In PV , by contrast, these additionalgatekeeping costs may lead her to switch her prescription to simple, despiteher own preferences.
We motivate the remaining predictions with two stylized examples, illus-trated in Panels B and C of Figure 1. For simplicity, the examples considera case where gatekeeping costs are so high that the doctor is never willing tooverride the patient’s preferences. Our predictions hold more generally; weformally establish these results in Appendix A.
Prediction (2) If the share of patients who are prescribed and purchaseany kind of malaria treatment is lower in DV than PV , this indicatespatient-driven demand for (simple) treatment.
This prediction maps to Figure 1, Panel B, where we consider the optimalstrategy of a doctor who would like to sell as little medication as possible(i.e. nothing � simple � severe). The uppermost bar at the bottom of thefigure shows patient demand when PL = P (no voucher), while the middlebar shows patient demand when PL = 0. Since gatekeeping costs are high,this bar also reflects prescription and purchase outcomes under PV . Thelowermost bar shows outcomes per the doctor’s optimal strategy under DV .
16
To minimize demand, the doctor conceals the voucher from lower risk patientswith π ∈ NP (at price PL = P these patients prefer to buy nothing, so nogatekeeping cost is incurred), but shares the voucher and prescribes simplemalaria treatment to patients with π ∈ L1P ∪ L20. This strategy lets thedoctor sell less malaria treatment under DV than under PV , in line withprediction (2). In the appendix, we formally show that any substitutionfrom no malaria treatment in DV to malaria treatment in PV will be drivenby doctors who prefer not to prescribe, but give in to patient pressure whenthe discount is known. Note that we formulate this as a prediction about thedemand for any treatment vs. no treatment, because, as the next predictionshows, the change in the rate of simple treatment is ambiguous.
Prediction (3) If the share of patients who are prescribed and purchasesevere treatment is lower in PV than DV , this indicates doctor-drivendemand (for severe treatment).
Figure 1, Panel C, illustrates the optimal strategy of a doctor who wouldlike to sell as much medication as possible (i.e. severe � simple � nothing).This is our example of doctor-driven demand. In this case, the doctor willshare the voucher with lower risk patients with π ∈ L10, since this maximizestheir demand for antimalarials. Thus, in contrast to Panel B, the share ofpatients receiving any antimalarial does not differ between PV and DV .However, in DV the doctor will conceal the voucher from higher risk patientson the margin between preferring simple and severe treatment (π ∈ L20 ∩HP ), thereby increasing the share of patients purchasing severe treatmentrelative to PV . The appendix establishes the general case: that any shiftfrom simple in PV to severe in DV will be driven by doctors who prefersevere, selling to patients who prefer simple.
Our final prediction summarizes observations made above about the “marginal”patients receiving vouchers under PV but not DV :
Prediction (4) Higher voucher use and substitution into prescription andpurchase of simple treatment in PV are driven by lower malaria prob-abilities if patients drive demand for treatment, but by higher malariaprobabilities if doctors drive demand for treatment.
This prediction highlights that our experiment can only detect patient-driven demand at the margin between no treatment and simple treatment,
17
and doctor-driven demand at the margin between severe treatment and sim-ple treatment. Within our model, doctor-driven demand at the margin ofany versus no treatment is not possible because doctors cannot force pa-tients to buy unwanted treatment (although doctor-driven demand induce-ment through influencing the patient’s beliefs, which is independent of theexperimental interventions and therefore not part of our model, might stilloccur).
While our predictions work on different margins, finding evidence of de-mand driven by one side suggests that this side has a stronger preferencefor treatment than the other. For example, in the presence of patient-drivendemand as in prediction (2), doctors have a weaker preference for simpletreatment than patients, and so there would not be doctor-driven demandat this margin. Similarly, if there is doctor-driven demand for severe oversimple treatment as in prediction (3), it implies that patients have a weakerpreference for severe and so there would not be patient-driven demand forsevere treatment.
All proofs are in Appendix A, where we also discuss additional results onprescribing simple treatment without using the voucher, and on doctors whoare purely revenue motivated. We now turn to the experiment we designedto identify the role of patient and doctor preferences in driving demand formalaria treatment.
3 Experimental Design and Sample
3.1 Experimental Design
Sampling Frame. At the outset of our study, we obtained an administrativelist of all CSComs in the city of Bamako and nearby Kati and Kalaban Coroin Koulikoro. After conducting a census of these clinics, we dropped clinicsthat had closed or were more than 15 kilometers away from Bamako, andremoved 21 clinics that were working with a local NGO to offer subsidized,improved care to mothers and children. This yielded a final sample of 60clinics. Four health workers at each clinic were invited to attend a refreshertraining that covered Mali’s official malaria guidelines and a hands-on train-ing on how to administer an RDT. The training materials were preparedby the research team in cooperation with researchers at the University ofBamako, as well as the Programme National de Lutte contre le Paludisme
18
(PNLP), Mali’s department of malaria control, and the Malaria Researchand Training Center Bamako. The trainings were conducted by five trainersfrom the PNLP and one trainer from the regional health directorate. Clinicswere trained in six groups in November 2016; all clinics sent at least two andon average 3.9 providers to the training.
Doctor and Patient Voucher Treatments. The simple malaria treat-ment discounts were delivered via vouchers for a free course of ACTs, andrandomized within each clinic across six days during a two-week observationperiod. The objective of the vouchers was to reduce the cost of treatmentfor simple malaria, while leaving both the revenue to the clinic and the costof other types of treatment to the patient fixed. The vouchers were deliveredby trained “intervention officers” who arrived at the clinic in the morning.Intervention officers did not perform any survey activities and were stationedat a separate part of the clinic from the survey team. Intervention eligibilitywas not tied to survey participation.
In the Patient Voucher condition, vouchers were distributed directly topatients when they arrived at the clinic, before they went to consult the doc-tor. Patients and/or caregivers were informed that the voucher would pay forsimple malaria treatment (ACT tablets), provided the provider determinedthat this was the appropriate course of action. Study officers were carefullytrained to limit potential endorsement effects: patients were informed thatthe decision of whether to use the voucher was up to the treating healthworker, and that the patient could not and should not use the voucher ifthey were not diagnosed with malaria. In the Doctor Voucher condition, pa-tients were not informed about voucher availability before the consultation.The vouchers were directly given to the provider(s) on staff, who could assignthe vouchers to patients at their discretion.
Intervention officers always brought more than enough vouchers to covera day’s demand, so voucher rationing was not an issue. Both conditions usedthe same voucher design, which required the provider’s signature to verifythe simple malaria diagnosis. The voucher was not valid unless used on thesame day. Signed vouchers were processed at the clinic pharmacy after theconsultation was complete, and a copy had to be returned to the interven-tion officer by the patient, who verified that the correct medication and fulldiscount was received. At the end of the day, unused vouchers were collected(in DV ), and the clinic was reimbursed for all vouchers redeemed that dayat their standard sales price.
19
Information Treatments. The Doctor and Patient Voucher treatmentswere cross-cut with a third within-clinic treatment. This “Patient Informa-tion” (PI) was conveyed through a short video, which emphasized that allsuspected malaria cases should be confirmed with a malaria test, noted thatRDTs should be available for free at the clinic, and described recommendedtreatment for simple and severe malaria. The video also demonstrated anRDT test and how to recognize a positive test result. Finally, half the clin-ics were randomly selected to receive a more intensive training designed toincrease providers’ trust in the diagnostic accuracy of RDTs. Both informa-tion treatments are analyzed in detail in a separate paper. We find limitedevidence that the information treatments impacted the size of PV and DVtreatment effects (see Appendix Tables B3 and B4 ).
The within-clinic randomization and associated data collection were con-ducted after the health worker trainings in November and December 2016,covering the end of the rainy season and therefore the period of highestmalaria risk. We divided the 60 clinics into three cohorts of 20 based ongeography. Each of the three cohorts rotated through two weeks of datacollection and experimental intervention. Within each cohort, we randomlyassigned each clinic to one of 20 intervention schedules depicted in Figure2. Each clinic received two Control days, two Doctor Voucher days, and twoPatient Voucher days. Although all clinics were informed of the upcomingstudy activities and interventions in advance, clinic staff did not receive priornotice of the actual intervention schedule – rather, our field officers informedclinic staff of the day’s intervention on the morning of an observation day.
3.2 Data Collection
In order to identify the source of over-demand for malaria treatment, we re-quire detailed data on prescription and treatment outcomes from patients atthe clinic, as well as patients’ true malaria status. Our main analysis usesdata from three different sources.
In-Clinic Survey. On clinic observation days, enumerators approachedall acutely ill patients at clinic intake and requested consent to participatein the study. We classified a patient as “acutely ill” if they were feelingsick and exhibited any of the following symptoms: fever, chills, excessivesweating, nausea, vomiting, diarrhea, poor appetite, headache, cough, weak-
20
ness, fatigue, or reduced consciousness. Before the doctors’ consultation,enumerators recorded patients’ basic demographic details, symptoms, andinformation on any prior treatment/diagnosis.22 After the consultation wascomplete, the enumerator recorded details of all prescribed and purchasedmedications, blood tests taken, and costs paid to the clinic. All told, wecompleted 2,055 interviews.
Home Follow-Up Survey. We randomly selected 1,735 patients for a moredetailed follow-up survey conducted in the patient’s home the day after theclinic visit, of whom 1,495 (86 percent) were successfully interviewed.23 Thehome survey collected information on changes in the illness, any treatmentsor tests obtained after the clinic visit, and recorded whether patients weretaking the medications that were purchased at the clinic. During this sur-vey, 1,126 patients (75 percent of interviewed patients/65 percent of patientstargeted for the home survey) gave separate consent to take an RDT andobtained a valid test result.24 Appendix Table B5 shows that there are nosignificant differences in the probabilities of being selected for home survey,taking the home survey, or having a valid home-based RDT by treatmentarm.
Administrative Voucher Data. Finally, we use administrative data onvoucher redemption to quantify how informing patients about vouchers im-pacted redemption rates.
3.3 Background Characteristics and Randomization Ver-ification
Table 2 presents summary statistics on the study population and verifiesrandomization balance. The first column of the table displays means andstandard deviations of baseline characteristics in the Control group (patients
22We interviewed the patient whenever s/he was aged 15 or older and well enough totake the interview; otherwise a guardian answered the survey.
23From November 14-17 2016 we randomly selected up to six patients per clinic perstudy day to interview at home. Between November 18 and December 30 2016 (the endof the study) we randomly selected up to six patients per clinic per study day, and thenoversampled at clinics where more than six patients were seen, until 60 patients per studyday were sampled.
241,158 patients gave consent; 32 tests were inconclusive.
21
who visited the clinic on days where no vouchers were available). Columns 2and 3 present coefficients from the following regression specification, whichwe use throughout the paper:
yict = β0 + βPPVct + βDDVct + γt + εict (1)
where yict is the outcome of interest for patient i visiting clinic c on dayt, PVct and DVct are dummy variables indicating the patient voucher anddoctor voucher interventions for clinic c on day t, and γt are date fixedeffects.25 The treatment rotation schedules were assigned at the clinic level,so we cluster standard errors at this level as well. Since the relative differencebetween giving vouchers to health workers versus patients will be of specialfocus in the analysis, column 4 presents the p-value from an F-test of thenull hypothesis that βP = βD. Column 5 presents the p-value from an F-testof the null hypothesis that the vouchers treatment effects are jointly equalto zero (βP = βD = 0). Each row shows results from a separate regression.
The first row of Table 2 shows that 5-6 acutely ill patients with eligiblesymptoms visited the clinic on the average observation day. The vouchertreatments could affect outcomes not just through a direct effect on prescrip-tion and purchase behavior, but also through a selection effect, whereby thepool of patients visiting the clinic changes in response to treatment. We ran-domized the voucher treatments within-clinic and administered them onlyfor a day at a time and at unannounced dates in order to minimize this se-lection effect. Nonetheless there is a 0.63-0.76 patient increase in traffic onDoctor and Patient Voucher days (significant at the 5 percent level in bothcases). Critically, there is no evidence of a differential increase on PV versusDV days, which is most important for our testable predictions.
Panels B and C show that the average characteristics of patients (andtheir households) are similar across treatment groups. Forty percent of pa-tients are male. The average patient is 17 years old, reports 3.6 symptomsand has been sick for 4.3 days. The most commonly reported symptomsare fever (80 percent of patients) and headache (62 percent of patients).Thirty percent of patients report chills or excessive sweating. These symp-toms are all commonly associated with malaria (Taylor et al., 2010), but only25 percent of patients taking a home RDT tested positive. Individuals in thePatient Voucher group were 6 percentage points less likely than those in the
25We include date fixed effects because the proportion of PV , DV , and C days in thesample varies depending on the date.
22
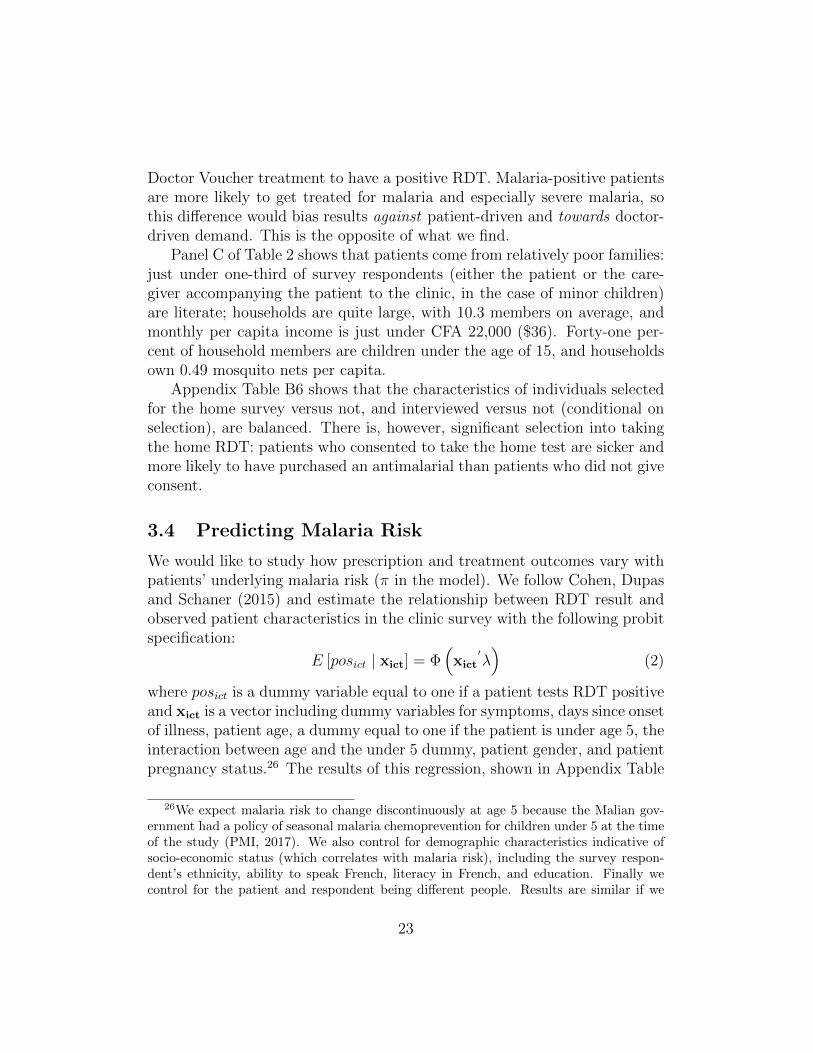
Doctor Voucher treatment to have a positive RDT. Malaria-positive patientsare more likely to get treated for malaria and especially severe malaria, sothis difference would bias results against patient-driven and towards doctor-driven demand. This is the opposite of what we find.
Panel C of Table 2 shows that patients come from relatively poor families:just under one-third of survey respondents (either the patient or the care-giver accompanying the patient to the clinic, in the case of minor children)are literate; households are quite large, with 10.3 members on average, andmonthly per capita income is just under CFA 22,000 ($36). Forty-one per-cent of household members are children under the age of 15, and householdsown 0.49 mosquito nets per capita.
Appendix Table B6 shows that the characteristics of individuals selectedfor the home survey versus not, and interviewed versus not (conditional onselection), are balanced. There is, however, significant selection into takingthe home RDT: patients who consented to take the home test are sicker andmore likely to have purchased an antimalarial than patients who did not giveconsent.
3.4 Predicting Malaria Risk
We would like to study how prescription and treatment outcomes vary withpatients’ underlying malaria risk (π in the model). We follow Cohen, Dupasand Schaner (2015) and estimate the relationship between RDT result andobserved patient characteristics in the clinic survey with the following probitspecification:
E [posict | xict] = Φ(xict
′λ)
(2)
where posict is a dummy variable equal to one if a patient tests RDT positiveand xict is a vector including dummy variables for symptoms, days since onsetof illness, patient age, a dummy equal to one if the patient is under age 5, theinteraction between age and the under 5 dummy, patient gender, and patientpregnancy status.26 The results of this regression, shown in Appendix Table
26We expect malaria risk to change discontinuously at age 5 because the Malian gov-ernment had a policy of seasonal malaria chemoprevention for children under 5 at the timeof the study (PMI, 2017). We also control for demographic characteristics indicative ofsocio-economic status (which correlates with malaria risk), including the survey respon-dent’s ethnicity, ability to speak French, literacy in French, and education. Finally wecontrol for the patient and respondent being different people. Results are similar if we
23
B7, are used to impute a malaria risk for each patient. Appendix Figure B2shows that the distribution of predicted malaria risk by treatment group isvery similar, and Table 2 finds no significant difference in average predictedrisk across treatment groups.
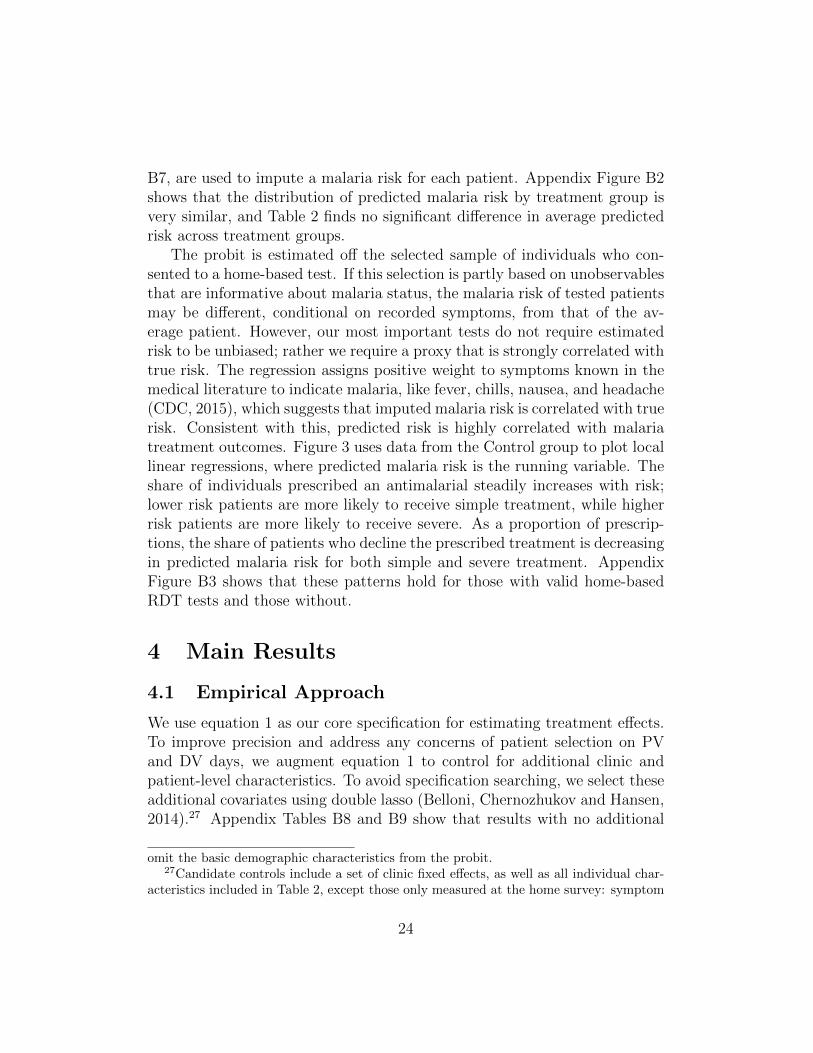
The probit is estimated off the selected sample of individuals who con-sented to a home-based test. If this selection is partly based on unobservablesthat are informative about malaria status, the malaria risk of tested patientsmay be different, conditional on recorded symptoms, from that of the av-erage patient. However, our most important tests do not require estimatedrisk to be unbiased; rather we require a proxy that is strongly correlated withtrue risk. The regression assigns positive weight to symptoms known in themedical literature to indicate malaria, like fever, chills, nausea, and headache(CDC, 2015), which suggests that imputed malaria risk is correlated with truerisk. Consistent with this, predicted risk is highly correlated with malariatreatment outcomes. Figure 3 uses data from the Control group to plot locallinear regressions, where predicted malaria risk is the running variable. Theshare of individuals prescribed an antimalarial steadily increases with risk;lower risk patients are more likely to receive simple treatment, while higherrisk patients are more likely to receive severe. As a proportion of prescrip-tions, the share of patients who decline the prescribed treatment is decreasingin predicted malaria risk for both simple and severe treatment. AppendixFigure B3 shows that these patterns hold for those with valid home-basedRDT tests and those without.
4 Main Results
4.1 Empirical Approach
We use equation 1 as our core specification for estimating treatment effects.To improve precision and address any concerns of patient selection on PVand DV days, we augment equation 1 to control for additional clinic andpatient-level characteristics. To avoid specification searching, we select theseadditional covariates using double lasso (Belloni, Chernozhukov and Hansen,2014).27 Appendix Tables B8 and B9 show that results with no additional
omit the basic demographic characteristics from the probit.27Candidate controls include a set of clinic fixed effects, as well as all individual char-
acteristics included in Table 2, except those only measured at the home survey: symptom
24
controls are very similar. In addition, Appendix Tables B10 and B11 indicatethat results are analogous when using covariates without the lasso procedure.
We estimate heterogeneous treatment effects with respect to predictedmalaria risk using the following specification:
yict = δ0 + δPHPV × highict + δDHDV × highict + δPLPV × lowict +(3)
δDLDV × lowict + θhighict + xict′α + λt + νict
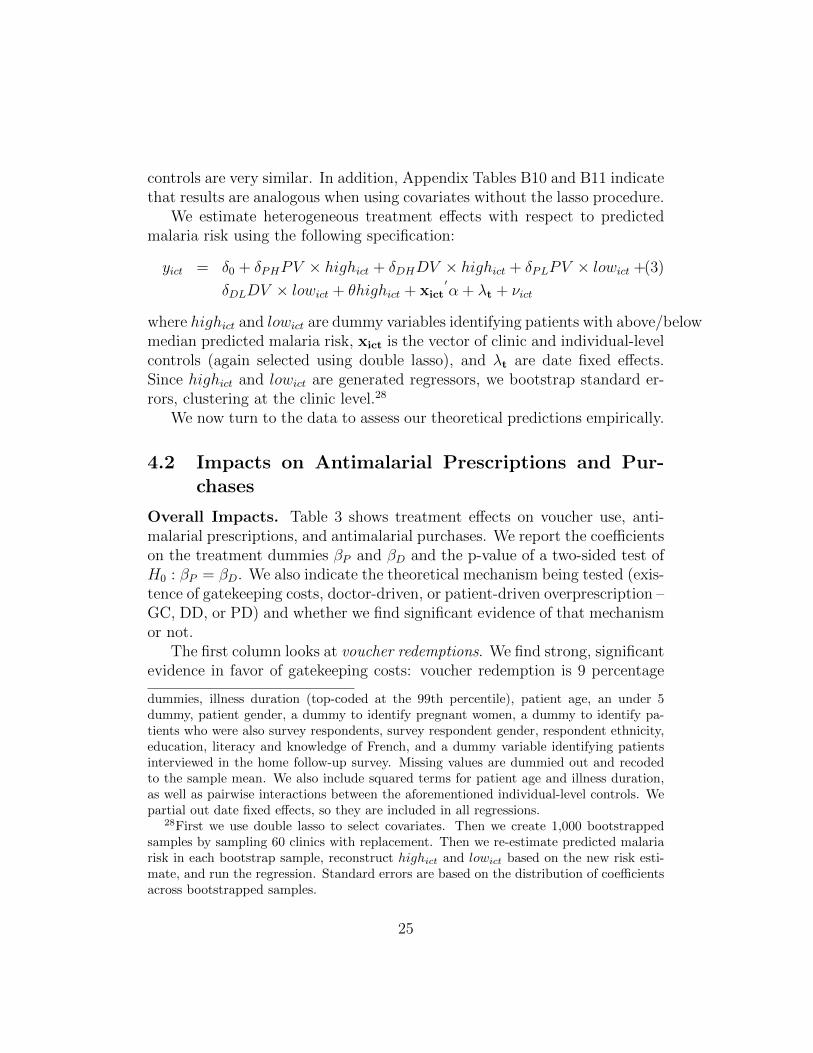
where highict and lowict are dummy variables identifying patients with above/belowmedian predicted malaria risk, xict is the vector of clinic and individual-levelcontrols (again selected using double lasso), and λt are date fixed effects.Since highict and lowict are generated regressors, we bootstrap standard er-rors, clustering at the clinic level.28
We now turn to the data to assess our theoretical predictions empirically.
4.2 Impacts on Antimalarial Prescriptions and Pur-chases
Overall Impacts. Table 3 shows treatment effects on voucher use, anti-malarial prescriptions, and antimalarial purchases. We report the coefficientson the treatment dummies βP and βD and the p-value of a two-sided test ofH0 : βP = βD. We also indicate the theoretical mechanism being tested (exis-tence of gatekeeping costs, doctor-driven, or patient-driven overprescription –GC, DD, or PD) and whether we find significant evidence of that mechanismor not.
The first column looks at voucher redemptions. We find strong, significantevidence in favor of gatekeeping costs: voucher redemption is 9 percentage
dummies, illness duration (top-coded at the 99th percentile), patient age, an under 5dummy, patient gender, a dummy to identify pregnant women, a dummy to identify pa-tients who were also survey respondents, survey respondent gender, respondent ethnicity,education, literacy and knowledge of French, and a dummy variable identifying patientsinterviewed in the home follow-up survey. Missing values are dummied out and recodedto the sample mean. We also include squared terms for patient age and illness duration,as well as pairwise interactions between the aforementioned individual-level controls. Wepartial out date fixed effects, so they are included in all regressions.
28First we use double lasso to select covariates. Then we create 1,000 bootstrappedsamples by sampling 60 clinics with replacement. Then we re-estimate predicted malariarisk in each bootstrap sample, reconstruct highict and lowict based on the new risk esti-mate, and run the regression. Standard errors are based on the distribution of coefficientsacross bootstrapped samples.
25
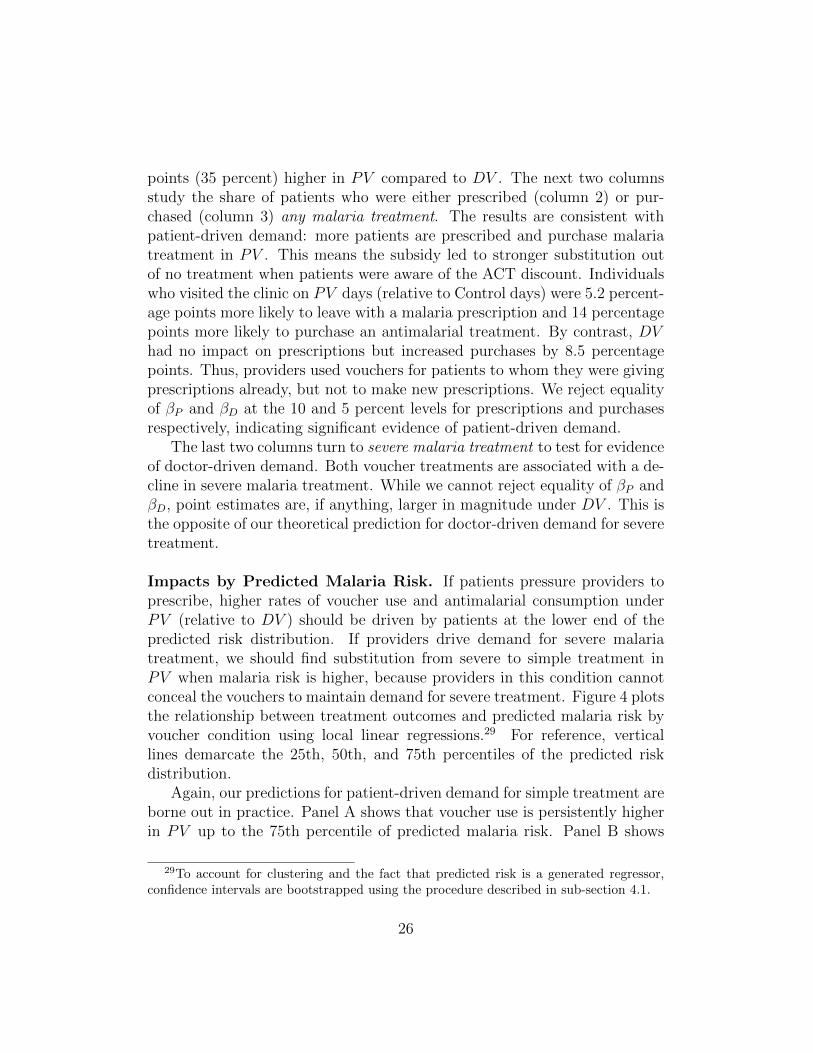
points (35 percent) higher in PV compared to DV . The next two columnsstudy the share of patients who were either prescribed (column 2) or pur-chased (column 3) any malaria treatment. The results are consistent withpatient-driven demand: more patients are prescribed and purchase malariatreatment in PV . This means the subsidy led to stronger substitution outof no treatment when patients were aware of the ACT discount. Individualswho visited the clinic on PV days (relative to Control days) were 5.2 percent-age points more likely to leave with a malaria prescription and 14 percentagepoints more likely to purchase an antimalarial treatment. By contrast, DVhad no impact on prescriptions but increased purchases by 8.5 percentagepoints. Thus, providers used vouchers for patients to whom they were givingprescriptions already, but not to make new prescriptions. We reject equalityof βP and βD at the 10 and 5 percent levels for prescriptions and purchasesrespectively, indicating significant evidence of patient-driven demand.
The last two columns turn to severe malaria treatment to test for evidenceof doctor-driven demand. Both voucher treatments are associated with a de-cline in severe malaria treatment. While we cannot reject equality of βP andβD, point estimates are, if anything, larger in magnitude under DV . This isthe opposite of our theoretical prediction for doctor-driven demand for severetreatment.
Impacts by Predicted Malaria Risk. If patients pressure providers toprescribe, higher rates of voucher use and antimalarial consumption underPV (relative to DV ) should be driven by patients at the lower end of thepredicted risk distribution. If providers drive demand for severe malariatreatment, we should find substitution from severe to simple treatment inPV when malaria risk is higher, because providers in this condition cannotconceal the vouchers to maintain demand for severe treatment. Figure 4 plotsthe relationship between treatment outcomes and predicted malaria risk byvoucher condition using local linear regressions.29 For reference, verticallines demarcate the 25th, 50th, and 75th percentiles of the predicted riskdistribution.
Again, our predictions for patient-driven demand for simple treatment areborne out in practice. Panel A shows that voucher use is persistently higherin PV up to the 75th percentile of predicted malaria risk. Panel B shows
29To account for clustering and the fact that predicted risk is a generated regressor,confidence intervals are bootstrapped using the procedure described in sub-section 4.1.
26
the share of patients purchasing any malaria treatment is higher in PV upuntil the 75th percentile. Panel C shows that the Doctor Voucher group haslower purchase rates for severe malaria at higher levels of predicted malariarisk. This cuts against the prediction for doctor-driven demand.
To quantify these patterns, Table 4 looks at heterogeneity in treatmenteffects by above versus below median predicted risk. While rates of voucheruse among “high risk” patients in DV and PV are very similar, voucher useby “low risk” patients is 15 percentage points (71 percent) higher when pa-tients know about the vouchers before consulting the doctor. We see similarpatterns for any antimalarial prescription and purchase, where PV increaseslow-risk prescriptions by 8.1 percentage points (16 percent) and purchasesby 9 percentage points (23 percent) relative to DV . These differences aresignificant at the 5 percent level. Finally, columns 4 and 5 explore effects forsevere malaria treatment. While we formally reject H0 : δPH = δDH at the 1percent level in column 5, the point estimates run counter to the theoreticalpredictions for doctor driven demand.
Adherence to Treatment Guidelines. Why would use of severe malariatreatment – especially among high risk patients – be lower in DV relativeto PV ? Figure 5 offers an explanation: providers were more likely to bendthe vouchers’ rules when patients knew about discounts. Specifically, PanelA graphs the share of patients who purchased severe malaria treatment byexperimental arm. In the Control group, none of the 26 percent of patientspurchasing severe malaria treatment used a free ACT voucher. None ofthe severe malaria patients in the Doctor and Patient Voucher treatmentsshould have used a voucher either, since the vouchers were only valid forsimple malaria prescriptions. This condition, however, relied on providercertification as well as patients reporting their prescription correctly to theintervention officer, so could in practice be violated.
The third bar of Panel A shows that providers and patients almost neverbroke the rules in DV : just one percent of patients in this condition pur-chased severe malaria treatment and used a voucher. In contrast, over fourpercent of patients in PV purchased severe malaria treatment and used avoucher. Columns 1 and 2 in Appendix Table B12 verify that the rate ofrule breaking is significantly higher in PV versus DV . This behavior is alsoconsistent with patient-driven demand: providers are sometimes willing toviolate the terms of the voucher when patients push for the discounted treat-ment.
27
Not Using the Voucher for Simple Treatment. Columns 3 and 4 ex-plore the inverse of this phenomenon: patients purchasing simple malariatreatment without a voucher in DV versus PV . Non-voucher purchases mayhave occurred because antimalarials other than ACTs were given, becausepatients visited the clinic when the intervention officer was absent, or be-cause the provider or patient forgot to apply the voucher. Additionally, ourmodel predicts that providers will sometimes intentionally prescribe simpletreatment without a voucher, and that they do so more often in DV (see pre-diction (5) in Appendix A). Intuitively, a provider who prefers to prescribesomething different from simple treatment, but suspects that her patienthas a strong preference for it, may offer simple malaria treatment withoutthe voucher. This “hedging” lets her avoid gatekeeping costs if the patientturns out to have a strong preference for simple treatment, while ensuringthe patient will not purchase simple if his preferences are not strong. Theassumption that the doctor cannot observe patient beliefs, π, is critical forobtaining this result – otherwise there would be no reason to hedge. Consis-tent with prediction 5, Appendix Table B12 shows that patients in DV werethree percentage points more likely than patients in PV to purchase simplemalaria treatment without a voucher (significant at the 10 percent level).
Other Explanations. Alternatively, it could be that providers in DV sim-ply forgot about the vouchers in some cases, whereas in PV they were re-minded by patients. This could lower voucher use in DV relative to PVand explain why patients in DV are relatively less likely to receive/purchasemalaria treatment (Table 3). This mechanism cannot, however, explain whythe reduction in voucher use in DV is concentrated among low risk patients,while prescriptions for severe treatment are if anything lower in DV thanin PV . With limited attention we would expect to see less use of vouchersacross the risk distribution under DV versus PV , meaning more use of severemalaria treatment.
Another possibility is that knowledge of the vouchers led patients to ex-aggerate their symptoms, either intentionally or subconsciously. If this ledproviders to overestimate malaria risk and therefore prescribe more anti-malarials, this would amount to a form of patient-driven demand that op-erates through changing providers’ direct utility, rather than gatekeeping
28
costs.30 However, the fact that providers almost never violated the rules ofthe vouchers in DV , but did in PV , suggests that gatekeeping costs matterin our context.
A final question is whether differences between PV and DV reflect dif-ferential rates of patients “stockpiling” ACTs for future use. Differencesbetween PV and DV due to stockpiling would be consistent with patient-driven demand, but may not occur in a long-run equilibrium where subsidiesare permanent. We check for stockpiling using our home survey data, wherewe cycled through the list of all medications purchased at the clinic andasked if the patient was currently taking the medication.31 Appendix TableB13, column 2, shows that 94 percent of individuals who purchased ACTs forsimple malaria at the clinic reported taking ACTs during the home survey,with no significant differences by voucher condition. Barring the possibilityof poor self-reporting, this suggests that stockpiling is not a significant driverof the higher purchase rates in PV relative to DV .
Hawthorne and Experimenter Demand Effects. It is also important toask how our results might be influenced by Hawthorne or experimenter de-mand effects. This could be especially relevant for doctor behavior; althoughall clinics were formally told that the study was not a performance review andthat all data would be kept strictly confidential, clinics were informed that thestudy was being conducted in collaboration with the National Malaria Con-trol Program and the National Directorate of Health. Clinics also knew thatthe pre-intervention training was part of the study; this training emphasizedthe importance of adhering to official Malian policy when treating malaria,meaning that only patients with confirmed positive test results should receivean antimalarial prescription. We therefore expect Hawthorne effects to haveincreased the likelihood of providers adhering to official treatment guidelines.
Since treatments rotated within clinic, this would impact behavior in alltreatment arms, which would bias us away from finding PV -DV differencesin outcomes. Consistent with this (and the hypothesis that Hawthorne ef-fects decay across observation days, see e.g. Leonard and Masatu (2010)),
30A related possibility would be if providers perceived more patients in PV to be“likely compliers” with prescribed simple malaria treatment, if for example more patientsexplicitly requested simple malaria treatment.
31ACT treatment courses last for three days and individuals were interviewed the dayafter the clinic visit, so the treatment course should be ongoing at the time of the homesurvey.
29
Appendix Figure B4 shows that PV -DV differences are larger after the firstcouple of clinic observation days. At the same time, we find that only 56percent of patients prescribed an antimalarial on Control days received amalaria test, and there is no significant difference in this “test given pre-scription” rate across treatment arms, even though testing before treatmentwas a major focus of the training and a requirement for using the voucher.Overall this suggests the implicit monitoring that took place during the ex-periment had limited effects on behavior that, if anything, bias us away fromdetecting effects.
A related worry is that PV -DV differences are driven by experimenterdemand effects on the patient side (e.g. if patients interpreted receiving thevoucher as a signal that “buying an antimalarial is encouraged by an outsideNGO”). While this would not invalidate our tests of gatekeeping costs and re-luctant compliance by doctors, it is important for interpretation. We believeexperimenter demand effects were minimal in our setting for two reasons.First, study staff were carefully trained to explain that the vouchers werenot valid without a provider’s signature, and that the doctor was the onewho would make the malaria diagnosis. Second, data from the patient infor-mation treatment (PI) suggests patients were not influenced by experimenterdemand effects. The PI video communicated that suspected malaria casesshould only be treated if they received a positive test. However, AppendixTable B14 shows that PI actually decreased the share of total patients andantimalarial prescription-holders who took a malaria test, while leaving theshare of patients who were prescribed an antimalarial unchanged. Panel Bshows there is no significant interaction effect with the voucher treatmentarms, which suggests that effects are not simply driven by patients refusingtests in the hope of redeeming a voucher. These results are inconsistent withexperimenter demand effects changing patient preferences, but are consistentwith patients having preferences of their own about whether to get tested.
4.3 Do Doctors Use Vouchers to Increase Revenue?
Financial motives are one of the most cited reasons for doctor-driven demandfor drugs. We argued above that doctor-driven demand for severe treatmentwould arise if (relative to patient preferences) providers get substantiallymore utility from severe over simple treatment (∆H > ∆L). A health workerwho cares mostly about revenue would be a plausible explanation for this,since severe treatment is much pricier and incurs more high-margin service
30
fees. Having said that, providers could opt to use the vouchers to prescribesimple treatment instead of severe because this strategy leads to an almostguaranteed purchase. In this case, providers might be revenue driven andmotivated to oversell treatment, but they may not be “driving demand”(prescribing more treatment than patients would like) per our definition.
Fortunately we can test whether providers are revenue motivated inde-pendent of whether this leads doctors to drive demand for severe malariatreatment: prediction (6) in Appendix A shows that vouchers will lead to anincrease in clinic revenue when doctors are purely revenue motivated, andprediction (7) says that revenue-maximizing doctors will use the informa-tional advantage in the DV treatment to increase clinic revenues relative toPV .32
In practice, we find no significant differences in (per-patient) clinic rev-enues across treatment arms (Appendix Table B15). Moreover, the averagepatient in both PV and DV pays roughly CFA 500 less than in the Controlgroup (significant at the 5 percent level for DV only). Lastly, from the re-sults we already saw, ACT prescriptions and purchases for low-risk patients,voucher use, and overall treatment rates in DV do not increase at the samerate as in PV. This is not consistent with providers who are simply tryingto sell as much treatment as possible. All told, our results do not paint apicture of providers primarily motivated by revenue, at least on the margin.
4.4 Quantifying Contributions to Overtreatment
What do doctors’ gatekeeping failures mean for overuse of antimalarials? Ide-ally, we would use the home-based RDTs to directly assess the match betweenprescriptions/purchases and the patient’s underlying malaria status. Unfor-tunately, patients who consented to the home-based test were significantlysicker and more likely to have malaria, based on our predicted risk metric,than patients who refused the test (Appendix Table B6). Since PV -DV dif-ferences in malaria prescriptions and purchases are concentrated among thosewith the lowest predicted malaria risk, relying on the home-tested subsamplecould understate PV -DV differences in appropriate treatment.
As an alternative, we focus on “expected match quality” based on pre-dicted malaria risk (denoted π), which we decompose into two parts. First,
32The greater number of patients on voucher days versus control days complicates ourtest of prediction (6), so we place more weight on prediction (7).
31
the probability of a “correct positive”, i.e. that an antimalarial is given toa truly sick patient, is given by mpict = πict × antimalict, where antimalictis a dummy variable equal to one if patient i at clinic c on day t was eitherprescribed or purchased an antimalarial of any type. Second, the proba-bility that an antimalarial is withheld from a patient without malaria – a“correct negative” – is mnict = (1− πict) × (1− antimalict). We considertreatment effects on both components separately, as well as the “expectedmatch”, which for the sake of illustration puts equal weight on both desirableoutcomes: matchict = mpict +mnict. In practice, the social planner may putvery different weights on these two outcomes.
Table 5 shows treatment effects on the expected match and its two compo-nents, for both antimalarial prescriptions and purchases. While the vouchertreatments did not increase the number of correct positives (mpict) for pre-scriptions, they did for purchases (1.8-2.3 percentage points, significant atthe 1 percent level). This amounts to a 15-19 percent increase over the meanin the Control group and underscores the rationale of subsidizing health care:some truly sick patients may not purchase treatment due to credit constraintsor because they value treatment below its cost.
The higher treatment rates for malaria-positive patients come at a price,however. While mn does not get worse for prescriptions in DV , it does inPV (column 2); and mn significantly declines for both voucher conditionswhen considering purchases. Column 5 shows that an estimated 45 percentof patients do not have malaria and do not purchase an antimalarial in theControl group. In PV , this share is 11 percentage points (24 percent) lower,in DV it is 6.3 percentage points (14 percent) lower. The PV -DV differenceis significant at the 1 percent level, underscoring the concern that patient-driven demand at low drug prices leads to overuse.
Turning to the expected match, we estimate that 48 percent of patientsare prescribed the proper (malaria-related) treatment in the control group,and 57 percent purchase it. In PV , this share is significantly lower for bothprescriptions (3.2 percentage points) and purchases (8.3 percentage points),while it is lower for purchases only in DV (3.9 percentage points). The8.3 percentage point lower match rate amounts to a 19 percent increase inmisallocation, which is substantial, and driven entirely by patient behavior:doctor preferences (captured by the effect of DV on the expected matchfor prescriptions) have no impact on misallocation, while distortions in pre-scription behavior from patient-driven demand and the decline in patients’non-purchase rate each account for roughly half of the additional misalloca-
32
tion we observe with the ACT subsidy.Changes in mismatch rates relative to the Control need to be interpreted
with caution, given that more patients visit clinics on PV and DV days.More generally, we cannot extrapolate our findings in the voucher treatmentsto mismatch rates we would observe in a long-term equilibrium with subsi-dized ACTs, since the composition of patients visiting the clinic would likelychange. However, we have no evidence of differential selection in PV andDV , and the analysis indicates that patient-driven demand in our samplesignificantly worsens the treatment-illness match.
One weakness of our expected match measure is that it assumes no privateinformation on the part of doctors. Doctors may have access to private signals– in particular malaria tests – that improve upon π when making prescrip-tion decisions.33 This would bias our expected match measures downwards,because private signals would improve the match of treatment to illness con-ditional on π. Assessing the consequences for estimated treatment effectsis more difficult, since this depends on what drives “marginal” prescriptionsin the different experimental conditions. For example, suppose all marginalprescriptions in PV were driven by malaria negative patients. In this case,we would falsely estimate a positive effect on mp (since marginal patientswill have π > 0) and underestimate the negative effect on mn.
Appendix Table B16 uses the home-tested RDT subsample to get an ideaof how much private information skews our expected match estimates. Wefind strikingly similar treatment effects on the expected and actual match forthe home-tested subsample.Control group means are also similar, at 0.48 forthe expected match and 0.51 for the actual match. Analogous numbers forpurchases are 0.56 and 0.61. While these numbers are consistent with someprivate information, the impacts on match estimates are very modest, likelybecause providers often do not use, or do not comply with malaria tests.
5 Conclusion
A critical challenge for developing country health systems is to craft policythat simultaneously avoids undertreatment and overtreatment. Undertreat-ment remains a major problem; for example, treatable conditions like pneu-monia, diarrhea, and malaria account for 48 percent of global postnatal childmortality (WHO, 2018). Overtreatment is problematic for a range of reasons:
33This is captured by the private signal η in our model in the Appendix.
33
poor households with very high marginal utilities of income waste preciousresources, overuse of vital drugs like antimalarials and antibiotics promotesdisease resistance, and unnecessary consumption of government-subsidizedcare strains already-tight public budgets.
Doctors (and other health workers) are the first line of defense againstovertreatment when care is subsidized. Yet a growing body of evidence makesit abundantly clear that providers in both the public and private sectors areimperfect gatekeepers, prescribing unnecessary treatment at very high rates.It is therefore essential to understand the factors that limit doctors’ abilityto target treatments to the right patients.
The existing literature has largely focused on doctor-driven overtreat-ment. The implicit assumption is that doctors prefer to overtreat, for ex-ample because they do not bear the cost of treatment, because it is in theirfinancial interest to increase revenue, or because they do not care to exerteffort to arrive at a better diagnosis. Our paper broadens the scope of investi-gation by asking whether patients’ preferences may also drive overtreatment:while the doctor would prefer not to prescribe a medication, she is willing todo so in order to avoid the “gatekeeping costs” of dealing with an unhappyor distrustful patient.
We begin by developing a model that can generate both doctor- andpatient-driven demand for treatment, and delivers testable implications forboth channels (albeit at different margins of substitution). We test themodel’s predictions with an RCT that we conducted with 60 public healthclinics in Bamako, Mali. Our context is well-suited to studying this issue,as misallocation of malaria treatment in public clinics is both verifiable (viafollow-up RDTs), and rampant: 75 percent of patients with confirmed RDTstested negative, yet 58 percent of these malaria-negative patients were pre-scribed some form of malaria treatment.
We find that vouchers for free malaria treatment are much more likelyto be used when both patients and providers (as opposed to just providers)know about their availability, indicating that gatekeeping costs are empiri-cally important. Patients with the lowest levels of malaria risk receive moreprescriptions and buy more treatment, which is consistent with patient-drivendemand for simple malaria treatment. We also find that this additional de-mand significantly worsens overtreatment. On the other hand, we find noevidence that physicians in the Doctor Voucher treatment exploit their infor-mational advantage to upsell patients more expensive severe malaria treat-ment, or increase clinic revenues more generally.
34
Our approach is agnostic about the underlying factors that might drivedoctors’ or patients’ preferences for administering treatment even when malariarisk is low; and our results do not rule out the possibility that doctor prefer-ences are driving a share of the baseline misallocation we see in our sample.However, our findings do show that marginal misallocation from price subsi-dies is attributable to patient preferences and behavior. Doctors are no morelikely to write an antimalarial prescription when only they know about theprice discounts; this margin only moves when both providers and patients areinformed. This evidence is not just important for enriching our understand-ing of doctor preferences, patient preferences, and how they interact duringthe consultation process; our results also contribute to the ongoing debateover how to price health products in the developing world. Our findings im-ply that cost sharing in public sector settings can reduce overtreatment byreducing patient demand, but at the cost of fewer malaria patients gettingappropriate treatment. Policies and tools that improve physicians’ gatekeep-ing capabilities could help sustain higher subsidies while limiting overuse;additional research on the design and efficacy of such interventions is animportant area for future work.
Our model highlights how the effects of gatekeeping costs will be deter-mined by the nature of mismatch between doctor and patient preferences –in our setting patients prefer more simple malaria treatment than providerswould like to prescribe. Doctor-patient preference gaps may be different inother contexts where providers face different incentives and patients face dif-ferent prices. Both our model and empirical approach can be adapted toother settings to generate customized evidence – and a more nuanced under-standing of how gatekeeping failures mediate healthcare outcomes worldwide.
35
References
Achan, Jane, Ambrose O Talisuna, Annette Erhart, Adoke Yeka,James K Tibenderana, Frederick N Baliraine, Philip J Rosenthal,and Umberto D’Alessandro. 2011. “Quinine, an Old Anti-MalarialDrug in a Modern World: Role in the Treatment of Malaria.” MalariaJournal, 10(1): 144.
Ansah, Evelyn K, Solomon Narh-Bana, Michael Epokor, Sam-son Akanpigbiam, Alberta Amu Quartey, John Gyapong, andChristopher JM Whitty. 2010. “Rapid testing for malaria in settingswhere microscopy is available and peripheral clinics where only presump-tive treatment is available: A randomised controlled trial in Ghana.” BMJ,340: c930.
Arrow, K., C. Panosian, and H. Gelband, ed. 2004. Saving Lives, Buy-ing Time: Economics of Malaria Drugs in an Age of Resistance. Washing-ton, DC:Institute of Medicine: National Academies Press.
Ashraf, Nava, James Berry, and Jesse M. Shapiro. 2010. “Can HigherPrices Stimulate Product Use? Evidence from a Field Experiment in Zam-bia.” American Economic Review, 100(5): 2383–2413.
Banerjee, Abhijit V, Esther Duflo, and Rachel Glennerster. 2008.“Putting a Band-Aid on a Corpse: Incentives for Nurses in the Indian Pub-lic Health Care System.” Journal of the European Economic Association,6(2-3): 487–500.
Belloni, Alexandre, Victor Chernozhukov, and Christian Hansen.2014. “High-Dimensional Methods and Inference on Structural and Treat-ment Effects.” Journal of Economic Perspectives, 28(2): 29–50.
Bisoffi, Zeno, Bienvenu Sodiomon Sirima, Andrea Angheben, Clau-dia Lodesani, Federico Gobbi, Halidou Tinto, and Jef Van denEnde. 2009. “Rapid malaria diagnostic tests vs. clinical management ofmalaria in rural Burkina Faso: safety and effect on clinical decisions. Arandomized trial.” Tropical Medicine & International Health, 14(5): 491–498.
CDC. 2015. “Malaria.” http://www.cdc.gov/malaria/about/disease.html.
36
Cohen, Jessica, and Pascaline Dupas. 2010. “Free Distribution or Cost-Sharing? Evidence from a Randomized Malaria Prevention Experiment.”The Quarterly Journal of Economics, 125(1): 1–45.
Cohen, Jessica, Pascaline Dupas, and Simone Schaner. 2015. “PriceSubsidies, Diagnostic Tests, and Targeting of Malaria Treatment: Evi-dence from a Randomized Controlled Trial.” American Economic Review,105(2): 609–45.
Currie, Janet, Wanchuan Lin, and Juanjuan Meng. 2014. “AddressingAntibiotic Abuse in China: An Experimental Audit Study.” Journal ofDevelopment Economics, 110: 39–51.
Das, Jishnu, Alaka Holla, Aakash Mohpal, and Karthik Muralidha-ran. 2016. “Quality and Accountability in Health Care Delivery: Audit-Study Evidence from Primary Care in India.” American Economic Review,106(12): 3765–99.
Das, Jishnu, and Jeffrey Hammer. 2014. “Quality of Primary Care inLow-Income Countries: Facts and Economics.” 6: 525–553.
Das, Jishnu, Jeffrey Hammer, and Kenneth Leonard. 2008. “TheQuality of Medical Advice in Low-Income Countries.” The Journal of Eco-nomic Perspectives, 22(2): pp. 93–114.
Dupas, Pascaline. 2014. “Short-Run Subsidies and Long-Run Adoption ofNew Health Products: Evidence from a Field Experiment.” Econometrica,82(1): 191–228.
Dupas, Pascaline, and Edward Miguel. 2017. “Impacts and Determi-nants of Health Levels in Low-Income Countries.” In Handbook of Eco-nomic Field Experiments. Vol. 2, 3–93. Elsevier.
Escot, Fabrice. 2012. “Bilan des diagnostics socio-sanitaires et desressources humaines de la sante de la region de Sikasso.”
Fleming-Dutra, Katherine E, Adam L Hersh, Daniel J Shapiro,Monina Bartoces, Eva A Enns, Thomas M File, Jonathan AFinkelstein, Jeffrey S Gerber, David Y Hyun, Jeffrey A Linder,et al. 2016. “Prevalence of Inappropriate Antibiotic Prescriptions amongUS Ambulatory Care Visits, 2010-2011.” JAMA, 315(17): 1864–1873.
37
Hamer, Davidson H, Micky Ndhlovu, Dejan Zurovac, MatthewFox, Kojo Yeboah-Antwi, Pascalina Chanda, Naawa Sip-ilinyambe, Jonathon L Simon, and Robert W Snow. 2007. “Im-proved diagnostic testing and malaria treatment practices in Zambia.”JAMA, 297(20): 2227–2231.
Humar, Atul, Colin Ohrt, Mary Anne Harrington, Dylan Pillai,and Kevin C Kain. 1997. “ParaSight R© F Test Compared with thePolymerase Chain Reaction and Microscopy for the Diagnosis of Plasmod-ium Falciparum Malaria in Travelers.” The American Journal of TropicalMedicine and Hygiene, 56(1): 44–48.
IHME. 2018. “Global Burden of Disease Study 2017 (GBD 2017) Results.”Online, Accessed May 22, 2020.
Iizuka, Toshiaki. 2012. “Physician Agency and Adoption of Generic Phar-maceuticals.” American Economic Review, 102(6): 2826–58.
Kone, Diakalia, Drissa Coulibaly, Ogobara Doumbo, Ibrahima-SoceFall, Eliud Kibuchi, Bernard Mitto, Gilbert Sang, David Kyalo,Robert W. Snow, and Abdisalan M. Noor. 2015. An Epidemiolog-ical Profile of Malaria in Mali. Programme National de Lutte contre lePaludisme (PNLP).
Kotwani, Anita, Chand Wattal, Shashi Katewa, PC Joshi, andKathleen Holloway. 2010. “Factors Influencing Primary Care Physiciansto Prescribe Antibiotics in Delhi India.” Family Practice, 27(6): 684–690.
Kravitz, Richard L, Ronald M Epstein, Mitchell D Feldman,Carol E Franz, Rahman Azari, Michael S Wilkes, Ladson Hinton,and Peter Franks. 2005. “Influence of Patients’ Requests for Direct-to-Consumer Advertised Antidepressants: A Randomized Controlled Trial.”JAMA, 293(16): 1995–2002.
Kremer, Michael, Jessica Leino, Edward Miguel, and Alix Zwane.2011. “Spring Cleaning: Rural Water Impacts, Valuation, and PropertyRights Institutions.” The Quarterly Journal of Economics, 126(1).
Kyabayinze, Daniel J, James K Tibenderana, George W Odong,John B Rwakimari, and Helen Counihan. 2008. “Operational Accu-racy and Comparative Persistent Antigenicity of HRP2 Rapid Diagnostic
38
Tests for Plasmodium Falciparum Malaria in a Hyperendemic Region ofUganda.” Malaria Journal, 7(1): 221.
Leonard, Kenneth L., and Melkiory C. Masatu. 2010. “Using theHawthorne effect to examine the gap between a doctor’s best possible prac-tice and actual performance.” Journal of Development Economics, 93: 226–234.
Linder, Jeffrey A, Jason N Doctor, Mark W Friedberg,Harry Reyes Nieva, Caroline Birks, Daniella Meeker, andCraig R Fox. 2014. “Time of Day and the Decision to Prescribe An-tibiotics.” JAMA Internal Medicine, 174(12): 2029–2031.
Li, Yongbin, Jing Xu, Fang Wang, Bin Wang, Liqun Liu, WanliHou, Hong Fan, Yeqing Tong, Juan Zhang, and Zuxun Lu. 2012.“Overprescribing in China, Driven by Financial Incentives, Results in VeryHigh Use of Antibiotics, injections, and corticosteroids.” Health affairs,31(5): 1075–1082.
Ministere de la Sante. 2013. Politique Nationale De Lutte Contre LePaludisme. Republique du Mali.
PMI. 2015. “President’s Malaria Initiative Mali: Malaria Operational PlanFY 2016.” USAID.
PMI. 2016. “President’s Malaria Initiative Mali: Malaria Operational PlanFY 2017.” USAID.
PMI. 2017. “President’s Malaria Initiative Mali: Malaria Operational PlanFY 2018.” USAID.
PNLP, INSTAT, INFO-STAT, INRSP, and ICF International. 2016.“Enquete sur les Indicateurs du Paludisme au Mali (EIPM) 2015.” IN-STAT, INFO-STAT and ICF International, Rockville, Maryland, USA.
Prendergast, Canice. 2003. “The Limits of Bureaucratic Efficiency.” Jour-nal of Political Economy, 111(5): 929–958.
Reyburn, H, R Mbatia, C Drakeley, I Carneiro, E Mwakasungula,O Mwerinde, K Saganda, J Shao, A Kitua, R Olomi, BM Green-wood, and CJ Whitty. 2004. “Overdiagnosis of Malaria in Patients with
39
Severe Febrile Illness in Tanzania: A Prospective Study.” British MedicalJournal, 329(7476): 1212.
Sautmann, Anja, Samuel Brown, and Mark Dean. 2017. “Subsidies,Information, and the Timing of Children’s Health Care in Mali.”
Schwartz, Lisa M., and Steven Woloshin. 2019. “Medical Marketing inthe United States, 1997-2016.” JAMA, 321(1): 80–96.
Tarozzi, Alessandro, Aprajit Mahajan, Brian Blackburn, DanKopf, Lakshmi Krishnan, and Joanne Yoong. 2014. “Micro-loans,Insecticide-Treated Bednets and Malaria: Evidence from a randomizedcontrolled trial in Orissa (India).” The American Economic Review,104(7): 1909–41.
Taylor, Steve M, Malcolm E Molyneux, David L Simel, Steven RMeshnick, and Jonathan J Juliano. 2010. “Does This Patient HaveMalaria?” JAMA: The Journal of the American Medical Association,304(18): 2048–2056.
Toure, Laurence. 2015. “User fee exemption policies in Mali: sustainabilityjeopardized by the malfunctioning of the health system.” BMC HealthServices Research, 15(3): S8.
Trampuz, Andrej, Matjaz Jereb, Igor Muzlovic, and Rajesh MPrabhu. 2003. “Clinical Review: Severe Malaria.” Critical Care, 7(4): 315.
Whitehead, Margaret, Goran Dahlgren, and Timothy Evans. 2001.“Equity and Health Sector Reforms: Can Low-Income Countries Escapethe Medical Poverty Trap?” The Lancet, 358(9284): 833–836.
WHO. 2014. “Emergence and Spread of Artemisinin Resistance Calls forIntensified Efforts to Withdraw Oral Artemisinin-Based Monotherapy fromthe Market.” World Health Organization.
WHO. 2017. “Malaria rapid diagnostic test performance: results of WHOproduct testing of malaria RDTs: round 7 (2015-2016).” World HealthOrganization.
WHO. 2018. “MCEE Methods and Data Sources for Child Causes of Death2000-2016.”
40
Wongsrichanalai, Chansuda, Mazie J Barcus, Sinuon Muth, Awal-ludin Sutamihardja, and Walther H Wernsdorfer. 2007. “A Re-view of Malaria Diagnostic Tools: Microscopy and Rapid DiagnosticTest (RDT).” The American Journal of Tropical Medicine and Hygiene,77(6 Suppl): 119–127.
41
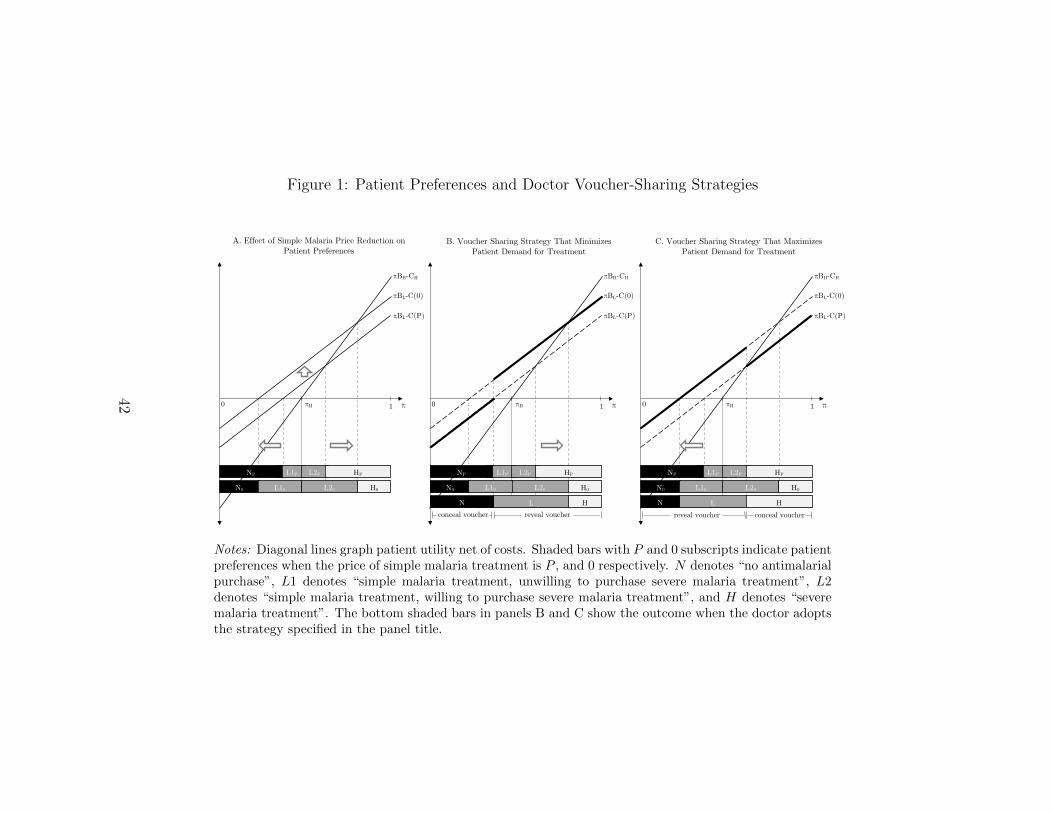
Figure 1: Patient Preferences and Doctor Voucher-Sharing Strategies
A. Effect of Simple Malaria Price Reduction on Patient Preferences
B. Voucher Sharing Strategy That Minimizes Patient Demand for Treatment
C. Voucher Sharing Strategy That Maximizes Patient Demand for Treatment
reveal voucher
π
πBH-CH
0
N0 L20 H0L10
πH
πBL-C(0)
πBL-C(P)
L1PNP L2P HP
L HNconceal voucher
1
conceal voucher
π
πBH-CH
0
N0 L20 H0L10
πH
πBL-C(0)
πBL-C(P)
L1PNP L2P HP
L HNreveal voucher
1π
πBH-CH
0
N0 L20 H0L10
πH
πBL-C(0)
πBL-C(P)
L1PNP L2P HP
1
Notes: Diagonal lines graph patient utility net of costs. Shaded bars with P and 0 subscripts indicate patientpreferences when the price of simple malaria treatment is P , and 0 respectively. N denotes “no antimalarialpurchase”, L1 denotes “simple malaria treatment, unwilling to purchase severe malaria treatment”, L2denotes “simple malaria treatment, willing to purchase severe malaria treatment”, and H denotes “severemalaria treatment”. The bottom shaded bars in panels B and C show the outcome when the doctor adoptsthe strategy specified in the panel title.
42
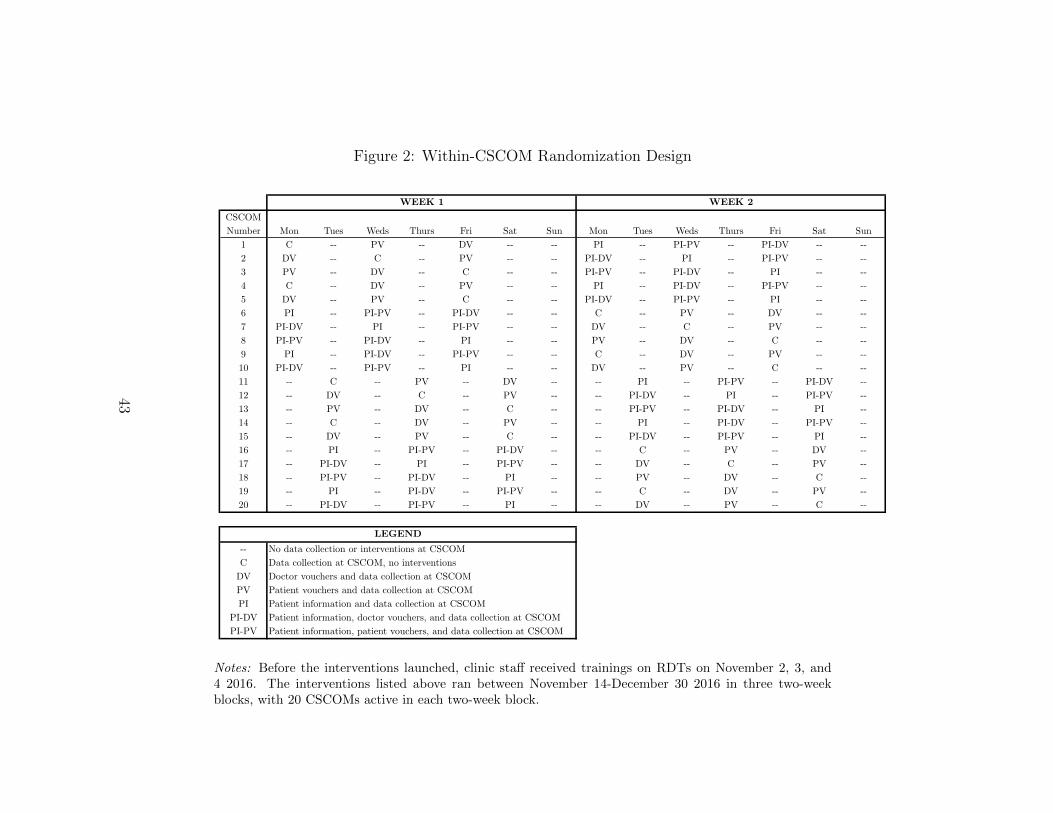
Figure 2: Within-CSCOM Randomization Design
CSCOM Number Mon Tues Weds Thurs Fri Sat Sun Mon Tues Weds Thurs Fri Sat Sun
1 C -- PV -- DV -- -- PI -- PI-PV -- PI-DV -- --2 DV -- C -- PV -- -- PI-DV -- PI -- PI-PV -- --3 PV -- DV -- C -- -- PI-PV -- PI-DV -- PI -- --4 C -- DV -- PV -- -- PI -- PI-DV -- PI-PV -- --5 DV -- PV -- C -- -- PI-DV -- PI-PV -- PI -- --6 PI -- PI-PV -- PI-DV -- -- C -- PV -- DV -- --7 PI-DV -- PI -- PI-PV -- -- DV -- C -- PV -- --8 PI-PV -- PI-DV -- PI -- -- PV -- DV -- C -- --9 PI -- PI-DV -- PI-PV -- -- C -- DV -- PV -- --10 PI-DV -- PI-PV -- PI -- -- DV -- PV -- C -- --11 -- C -- PV -- DV -- -- PI -- PI-PV -- PI-DV --12 -- DV -- C -- PV -- -- PI-DV -- PI -- PI-PV --13 -- PV -- DV -- C -- -- PI-PV -- PI-DV -- PI --14 -- C -- DV -- PV -- -- PI -- PI-DV -- PI-PV --15 -- DV -- PV -- C -- -- PI-DV -- PI-PV -- PI --16 -- PI -- PI-PV -- PI-DV -- -- C -- PV -- DV --17 -- PI-DV -- PI -- PI-PV -- -- DV -- C -- PV --18 -- PI-PV -- PI-DV -- PI -- -- PV -- DV -- C --19 -- PI -- PI-DV -- PI-PV -- -- C -- DV -- PV --20 -- PI-DV -- PI-PV -- PI -- -- DV -- PV -- C --
-- No data collection or interventions at CSCOMC Data collection at CSCOM, no interventions
DV Doctor vouchers and data collection at CSCOMPV Patient vouchers and data collection at CSCOMPI Patient information and data collection at CSCOM
PI-DV Patient information, doctor vouchers, and data collection at CSCOMPI-PV Patient information, patient vouchers, and data collection at CSCOM
WEEK 1 WEEK 2
LEGEND
Notes: Before the interventions launched, clinic staff received trainings on RDTs on November 2, 3, and4 2016. The interventions listed above ran between November 14-December 30 2016 in three two-weekblocks, with 20 CSCOMs active in each two-week block.
43
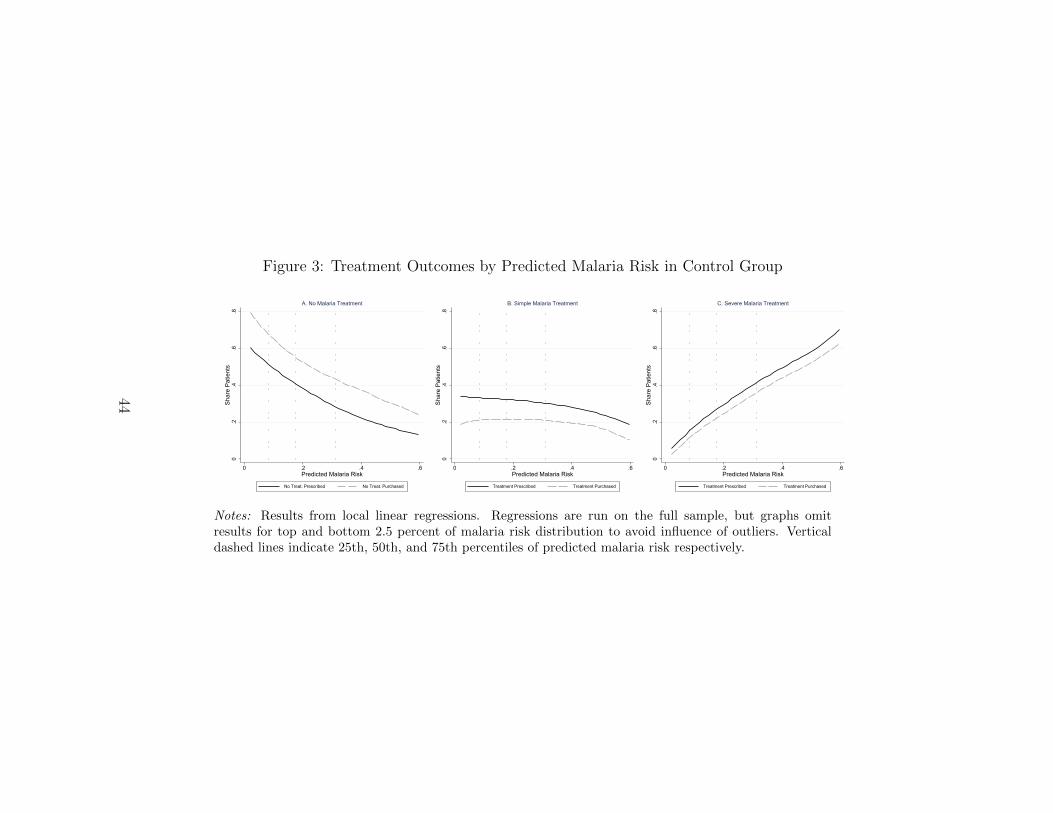
Figure 3: Treatment Outcomes by Predicted Malaria Risk in Control Group
0.2
.4.6
.8Sh
are
Patie
nts
0 .2 .4 .6Predicted Malaria Risk
No Treat. Prescribed No Treat. Purchased
A. No Malaria Treatment
0.2
.4.6
.8Sh
are
Patie
nts
0 .2 .4 .6Predicted Malaria Risk
Treatment Prescribed Treatment Purchased
B. Simple Malaria Treatment
0.2
.4.6
.8Sh
are
Patie
nts
0 .2 .4 .6Predicted Malaria Risk
Treatment Prescribed Treatment Purchased
C. Severe Malaria Treatment
Notes: Results from local linear regressions. Regressions are run on the full sample, but graphs omitresults for top and bottom 2.5 percent of malaria risk distribution to avoid influence of outliers. Verticaldashed lines indicate 25th, 50th, and 75th percentiles of predicted malaria risk respectively.
44
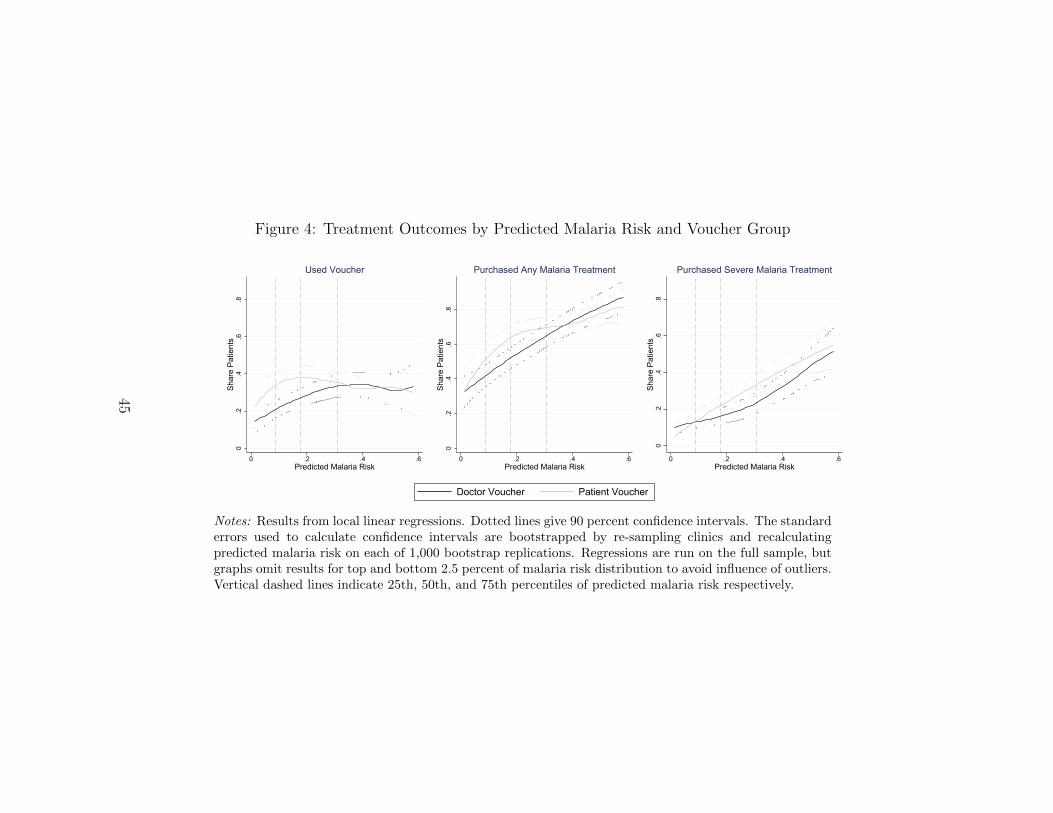
Figure 4: Treatment Outcomes by Predicted Malaria Risk and Voucher Group0
.2.4
.6.8
Shar
e Pa
tient
s
0 .2 .4 .6Predicted Malaria Risk
Used Voucher
0.2
.4.6
.8Sh
are
Patie
nts
0 .2 .4 .6Predicted Malaria Risk
Purchased Any Malaria Treatment
0.2
.4.6
.8Sh
are
Patie
nts
0 .2 .4 .6Predicted Malaria Risk
Purchased Severe Malaria Treatment
Doctor Voucher Patient Voucher
Notes: Results from local linear regressions. Dotted lines give 90 percent confidence intervals. The standarderrors used to calculate confidence intervals are bootstrapped by re-sampling clinics and recalculatingpredicted malaria risk on each of 1,000 bootstrap replications. Regressions are run on the full sample, butgraphs omit results for top and bottom 2.5 percent of malaria risk distribution to avoid influence of outliers.Vertical dashed lines indicate 25th, 50th, and 75th percentiles of predicted malaria risk respectively.
45
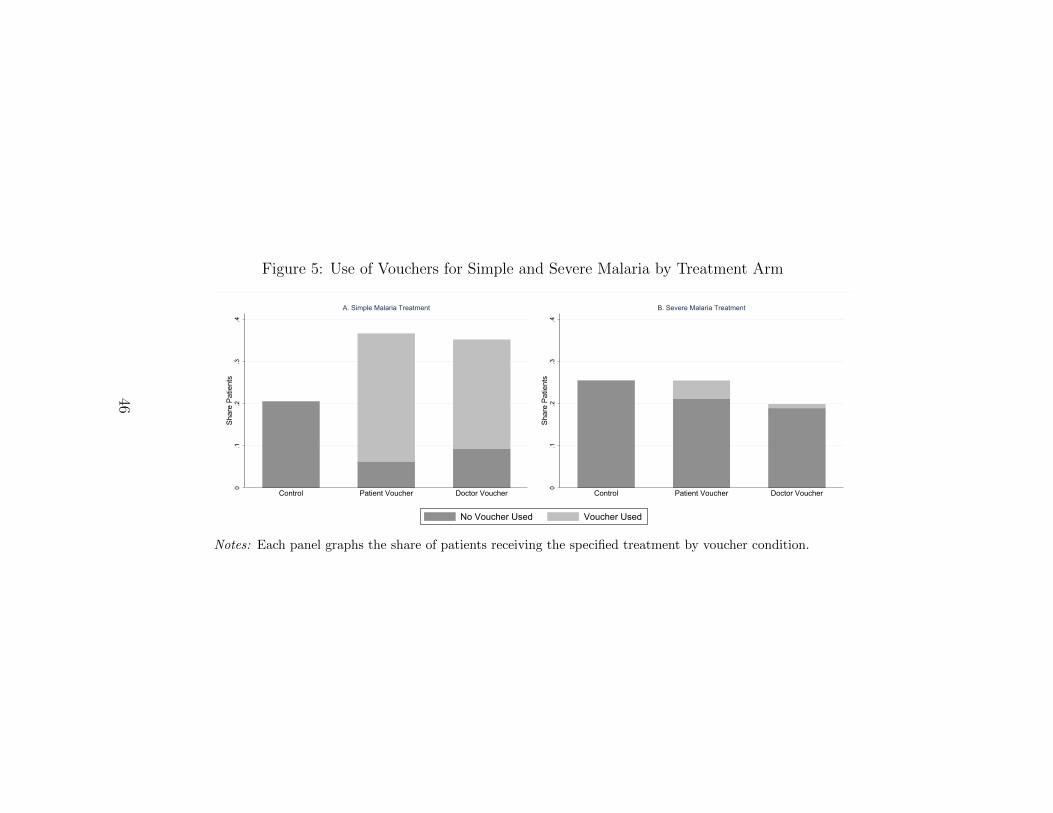
Figure 5: Use of Vouchers for Simple and Severe Malaria by Treatment Arm
0.1
.2.3
.4Sh
are
Patie
nts
Control Patient Voucher Doctor Voucher
A. Simple Malaria Treatment
0.1
.2.3
.4Sh
are
Patie
nts
Control Patient Voucher Doctor Voucher
B. Severe Malaria Treatment
No Voucher Used Voucher Used
Notes: Each panel graphs the share of patients receiving the specified treatment by voucher condition.
46
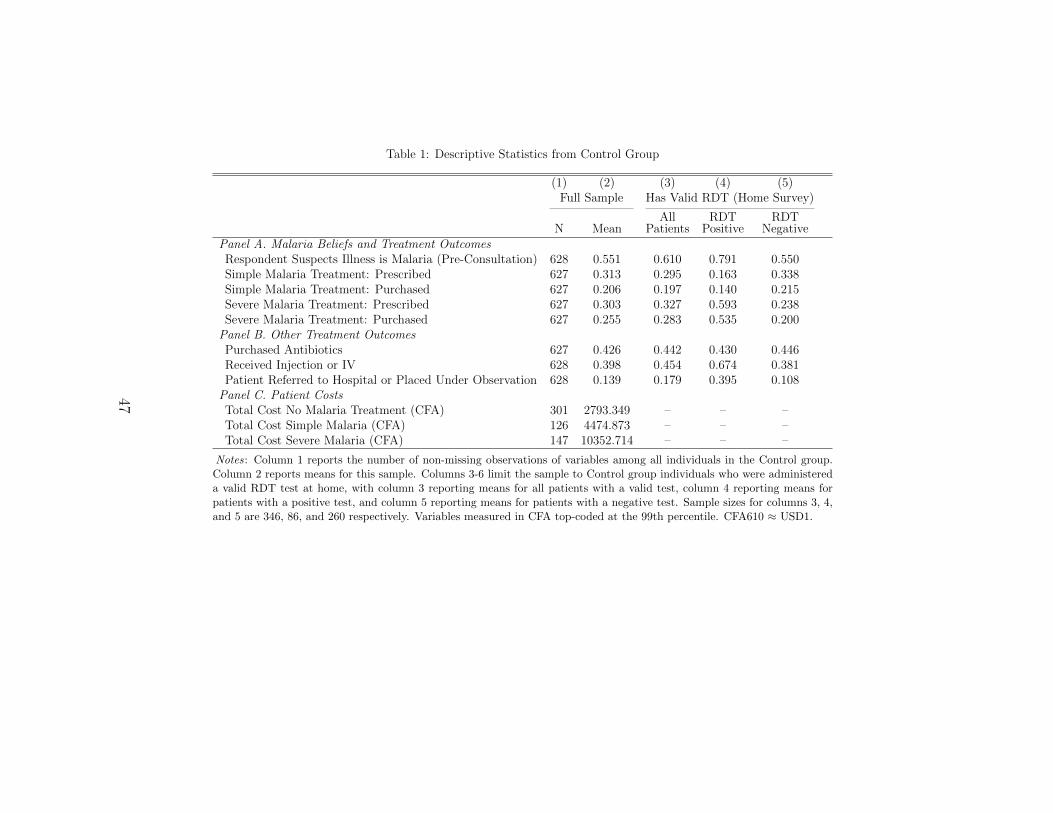
Table 1: Descriptive Statistics from Control Group
(1) (2) (3) (4) (5)Full Sample Has Valid RDT (Home Survey)
N MeanAll
PatientsRDT
PositiveRDT
NegativePanel A. Malaria Beliefs and Treatment OutcomesRespondent Suspects Illness is Malaria (Pre-Consultation) 628 0.551 0.610 0.791 0.550Simple Malaria Treatment: Prescribed 627 0.313 0.295 0.163 0.338Simple Malaria Treatment: Purchased 627 0.206 0.197 0.140 0.215Severe Malaria Treatment: Prescribed 627 0.303 0.327 0.593 0.238Severe Malaria Treatment: Purchased 627 0.255 0.283 0.535 0.200
Panel B. Other Treatment OutcomesPurchased Antibiotics 627 0.426 0.442 0.430 0.446Received Injection or IV 628 0.398 0.454 0.674 0.381Patient Referred to Hospital or Placed Under Observation 628 0.139 0.179 0.395 0.108
Panel C. Patient CostsTotal Cost No Malaria Treatment (CFA) 301 2793.349 – – –Total Cost Simple Malaria (CFA) 126 4474.873 – – –Total Cost Severe Malaria (CFA) 147 10352.714 – – –
Notes: Column 1 reports the number of non-missing observations of variables among all individuals in the Control group.Column 2 reports means for this sample. Columns 3-6 limit the sample to Control group individuals who were administereda valid RDT test at home, with column 3 reporting means for all patients with a valid test, column 4 reporting means forpatients with a positive test, and column 5 reporting means for patients with a negative test. Sample sizes for columns 3, 4,and 5 are 346, 86, and 260 respectively. Variables measured in CFA top-coded at the 99th percentile. CFA610 ≈ USD1.
47
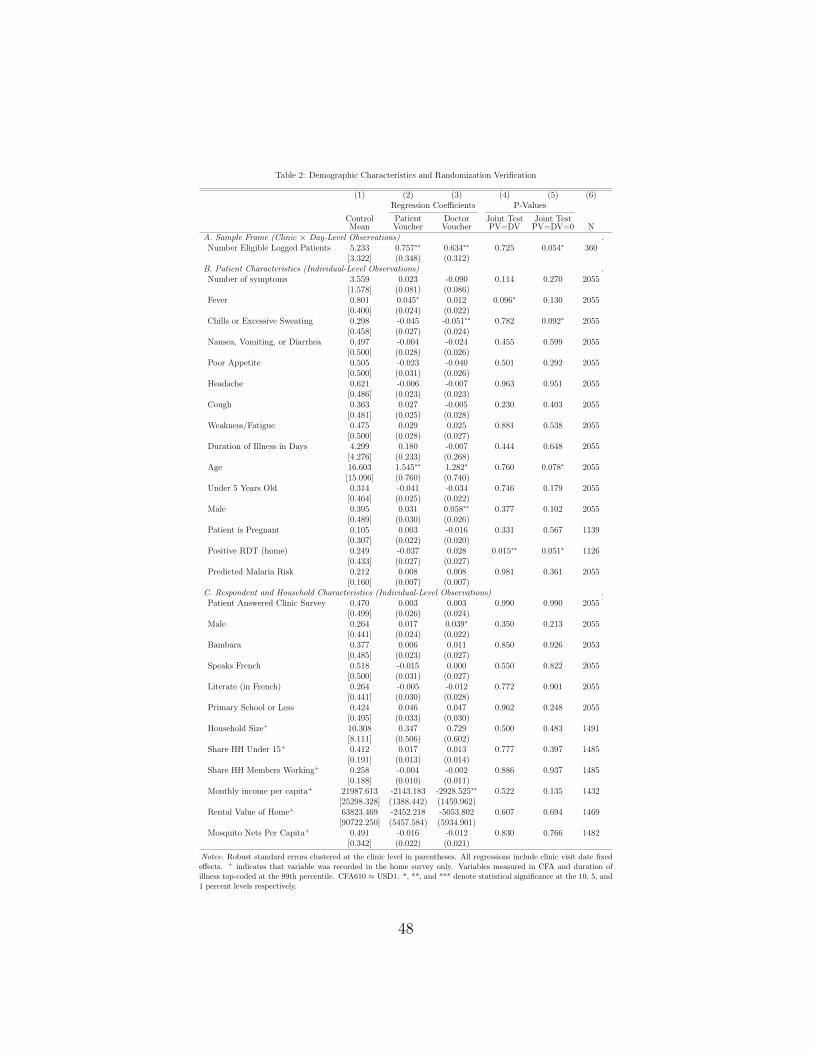
Table 2: Demographic Characteristics and Randomization Verification
(1) (2) (3) (4) (5) (6)Regression Coefficients P-Values
ControlMean
PatientVoucher
DoctorVoucher
Joint TestPV=DV
Joint TestPV=DV=0 N
A. Sample Frame (Clinic × Day-Level Observations) .Number Eligible Logged Patients 5.233 0.757∗∗ 0.634∗∗ 0.725 0.054∗ 360
[3.322] (0.348) (0.312)B. Patient Characteristics (Individual-Level Observations) .Number of symptoms 3.559 0.023 -0.090 0.114 0.270 2055
[1.578] (0.081) (0.086)Fever 0.801 0.045∗ 0.012 0.096∗ 0.130 2055
[0.400] (0.024) (0.022)Chills or Excessive Sweating 0.298 -0.045 -0.051∗∗ 0.782 0.092∗ 2055
[0.458] (0.027) (0.024)Nausea, Vomiting, or Diarrhea 0.497 -0.004 -0.024 0.455 0.599 2055
[0.500] (0.028) (0.026)Poor Appetite 0.505 -0.023 -0.040 0.501 0.292 2055
[0.500] (0.031) (0.026)Headache 0.621 -0.006 -0.007 0.963 0.951 2055
[0.486] (0.023) (0.023)Cough 0.363 0.027 -0.005 0.230 0.403 2055
[0.481] (0.025) (0.028)Weakness/Fatigue 0.475 0.029 0.025 0.881 0.538 2055
[0.500] (0.028) (0.027)Duration of Illness in Days 4.299 0.180 -0.007 0.444 0.648 2055
[4.276] (0.233) (0.268)Age 16.603 1.545∗∗ 1.282∗ 0.760 0.078∗ 2055
[15.096] (0.760) (0.740)Under 5 Years Old 0.314 -0.041 -0.034 0.746 0.179 2055
[0.464] (0.025) (0.022)Male 0.395 0.031 0.058∗∗ 0.377 0.102 2055
[0.489] (0.030) (0.026)Patient is Pregnant 0.105 0.003 -0.016 0.331 0.567 1139
[0.307] (0.022) (0.020)Positive RDT (home) 0.249 -0.037 0.028 0.015∗∗ 0.051∗ 1126
[0.433] (0.027) (0.027)Predicted Malaria Risk 0.212 0.008 0.008 0.981 0.361 2055
[0.160] (0.007) (0.007)C. Respondent and Household Characteristics (Individual-Level Observations) .Patient Answered Clinic Survey 0.470 0.003 0.003 0.990 0.990 2055
[0.499] (0.026) (0.024)Male 0.264 0.017 0.039∗ 0.350 0.213 2055
[0.441] (0.024) (0.022)Bambara 0.377 0.006 0.011 0.850 0.926 2053
[0.485] (0.023) (0.027)Speaks French 0.518 -0.015 0.000 0.550 0.822 2055
[0.500] (0.031) (0.027)Literate (in French) 0.264 -0.005 -0.012 0.772 0.901 2055
[0.441] (0.030) (0.028)Primary School or Less 0.424 0.046 0.047 0.962 0.248 2055
[0.495] (0.033) (0.030)Household Size+ 10.308 0.347 0.729 0.500 0.483 1491
[8.111] (0.506) (0.602)Share HH Under 15+ 0.412 0.017 0.013 0.777 0.397 1485
[0.191] (0.013) (0.014)Share HH Members Working+ 0.258 -0.004 -0.002 0.886 0.937 1485
[0.188] (0.010) (0.011)Monthly income per capita+ 21987.613 -2143.183 -2928.525∗∗ 0.522 0.135 1432
[25298.328] (1388.442) (1459.962)Rental Value of Home+ 63823.469 -2452.218 -5053.802 0.607 0.694 1469
[90722.250] (5457.584) (5934.901)Mosquito Nets Per Capita+ 0.491 -0.016 -0.012 0.830 0.766 1482
[0.342] (0.022) (0.021)
Notes: Robust standard errors clustered at the clinic level in parentheses. All regressions include clinic visit date fixedeffects. + indicates that variable was recorded in the home survey only. Variables measured in CFA and duration ofillness top-coded at the 99th percentile. CFA610 ≈ USD1. *, **, and *** denote statistical significance at the 10, 5, and1 percent levels respectively.
48
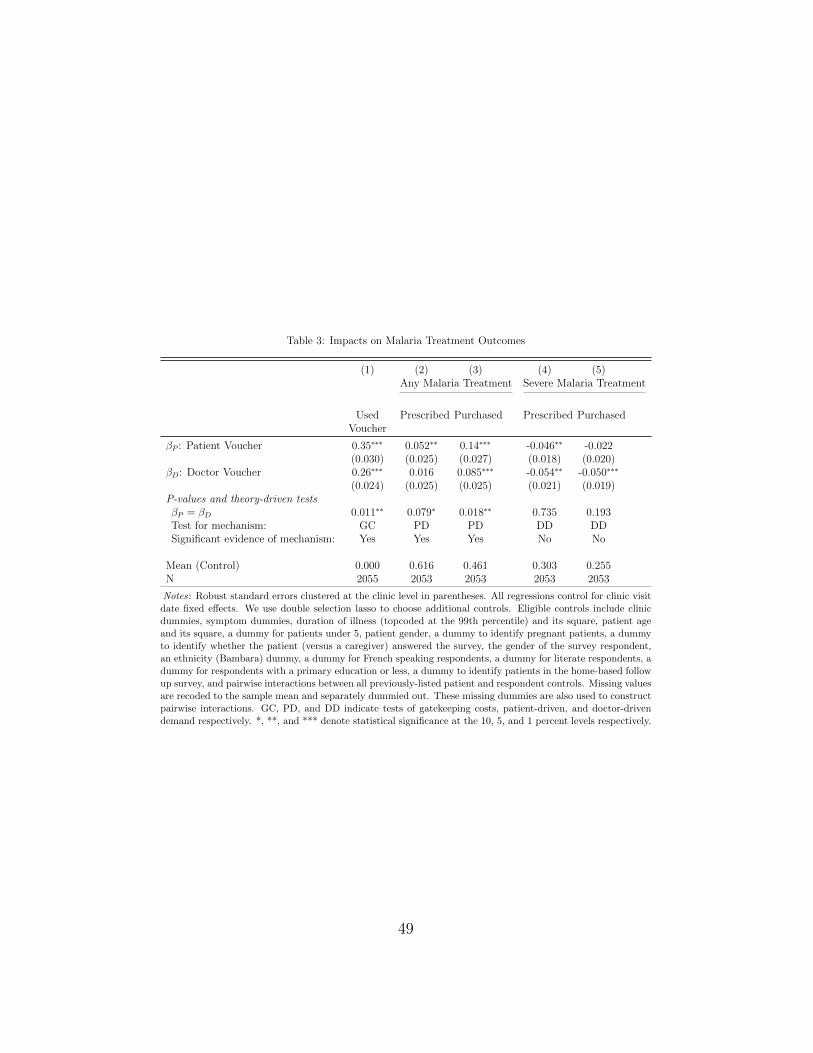
Table 3: Impacts on Malaria Treatment Outcomes
(1) (2) (3) (4) (5)Any Malaria Treatment Severe Malaria Treatment
UsedVoucher
Prescribed Purchased Prescribed Purchased
βP : Patient Voucher 0.35∗∗∗ 0.052∗∗ 0.14∗∗∗ -0.046∗∗ -0.022(0.030) (0.025) (0.027) (0.018) (0.020)
βD: Doctor Voucher 0.26∗∗∗ 0.016 0.085∗∗∗ -0.054∗∗ -0.050∗∗∗
(0.024) (0.025) (0.025) (0.021) (0.019)P-values and theory-driven testsβP = βD 0.011∗∗ 0.079∗ 0.018∗∗ 0.735 0.193Test for mechanism: GC PD PD DD DDSignificant evidence of mechanism: Yes Yes Yes No No
Mean (Control) 0.000 0.616 0.461 0.303 0.255N 2055 2053 2053 2053 2053
Notes: Robust standard errors clustered at the clinic level in parentheses. All regressions control for clinic visitdate fixed effects. We use double selection lasso to choose additional controls. Eligible controls include clinicdummies, symptom dummies, duration of illness (topcoded at the 99th percentile) and its square, patient ageand its square, a dummy for patients under 5, patient gender, a dummy to identify pregnant patients, a dummyto identify whether the patient (versus a caregiver) answered the survey, the gender of the survey respondent,an ethnicity (Bambara) dummy, a dummy for French speaking respondents, a dummy for literate respondents, adummy for respondents with a primary education or less, a dummy to identify patients in the home-based followup survey, and pairwise interactions between all previously-listed patient and respondent controls. Missing valuesare recoded to the sample mean and separately dummied out. These missing dummies are also used to constructpairwise interactions. GC, PD, and DD indicate tests of gatekeeping costs, patient-driven, and doctor-drivendemand respectively. *, **, and *** denote statistical significance at the 10, 5, and 1 percent levels respectively.
49
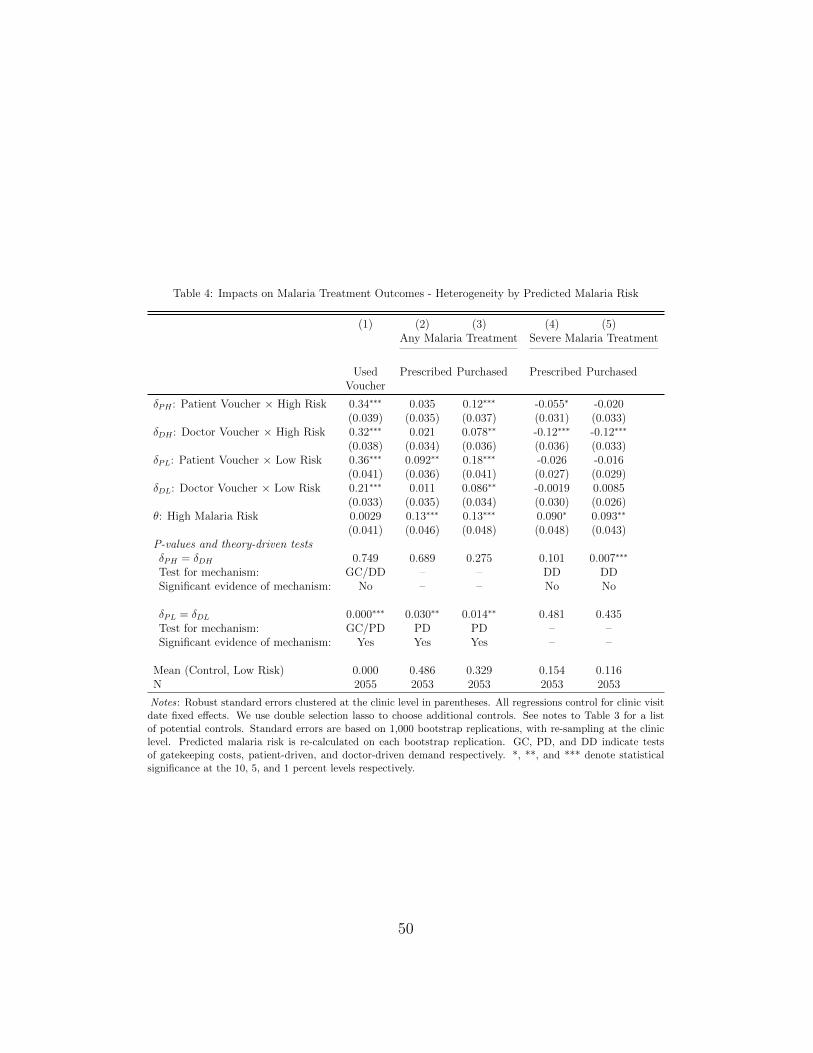
Table 4: Impacts on Malaria Treatment Outcomes - Heterogeneity by Predicted Malaria Risk
(1) (2) (3) (4) (5)Any Malaria Treatment Severe Malaria Treatment
UsedVoucher
Prescribed Purchased Prescribed Purchased
δPH : Patient Voucher × High Risk 0.34∗∗∗ 0.035 0.12∗∗∗ -0.055∗ -0.020(0.039) (0.035) (0.037) (0.031) (0.033)
δDH : Doctor Voucher × High Risk 0.32∗∗∗ 0.021 0.078∗∗ -0.12∗∗∗ -0.12∗∗∗
(0.038) (0.034) (0.036) (0.036) (0.033)δPL: Patient Voucher × Low Risk 0.36∗∗∗ 0.092∗∗ 0.18∗∗∗ -0.026 -0.016
(0.041) (0.036) (0.041) (0.027) (0.029)δDL: Doctor Voucher × Low Risk 0.21∗∗∗ 0.011 0.086∗∗ -0.0019 0.0085
(0.033) (0.035) (0.034) (0.030) (0.026)θ: High Malaria Risk 0.0029 0.13∗∗∗ 0.13∗∗∗ 0.090∗ 0.093∗∗
(0.041) (0.046) (0.048) (0.048) (0.043)P-values and theory-driven testsδPH = δDH 0.749 0.689 0.275 0.101 0.007∗∗∗
Test for mechanism: GC/DD – – DD DDSignificant evidence of mechanism: No – – No No
δPL = δDL 0.000∗∗∗ 0.030∗∗ 0.014∗∗ 0.481 0.435Test for mechanism: GC/PD PD PD – –Significant evidence of mechanism: Yes Yes Yes – –
Mean (Control, Low Risk) 0.000 0.486 0.329 0.154 0.116N 2055 2053 2053 2053 2053
Notes: Robust standard errors clustered at the clinic level in parentheses. All regressions control for clinic visitdate fixed effects. We use double selection lasso to choose additional controls. See notes to Table 3 for a listof potential controls. Standard errors are based on 1,000 bootstrap replications, with re-sampling at the cliniclevel. Predicted malaria risk is re-calculated on each bootstrap replication. GC, PD, and DD indicate testsof gatekeeping costs, patient-driven, and doctor-driven demand respectively. *, **, and *** denote statisticalsignificance at the 10, 5, and 1 percent levels respectively.
50
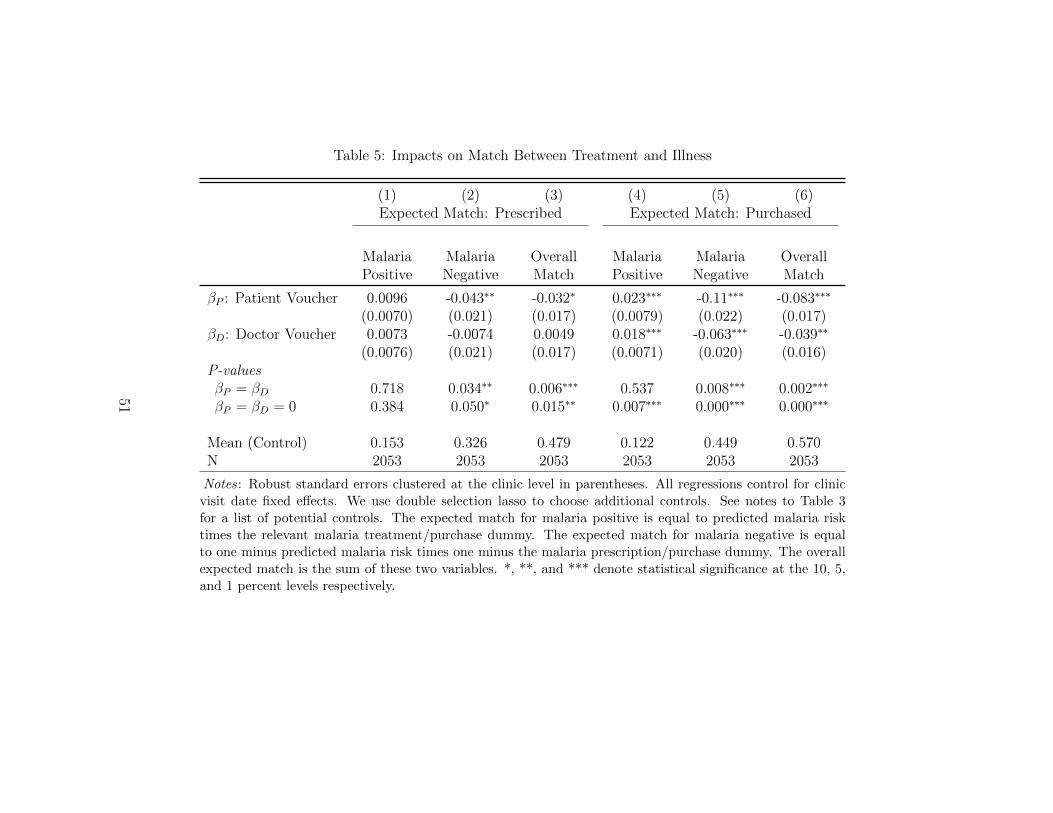
Table 5: Impacts on Match Between Treatment and Illness
(1) (2) (3) (4) (5) (6)Expected Match: Prescribed Expected Match: Purchased
MalariaPositive
MalariaNegative
OverallMatch
MalariaPositive
MalariaNegative
OverallMatch
βP : Patient Voucher 0.0096 -0.043∗∗ -0.032∗ 0.023∗∗∗ -0.11∗∗∗ -0.083∗∗∗
(0.0070) (0.021) (0.017) (0.0079) (0.022) (0.017)βD: Doctor Voucher 0.0073 -0.0074 0.0049 0.018∗∗∗ -0.063∗∗∗ -0.039∗∗
(0.0076) (0.021) (0.017) (0.0071) (0.020) (0.016)P-valuesβP = βD 0.718 0.034∗∗ 0.006∗∗∗ 0.537 0.008∗∗∗ 0.002∗∗∗
βP = βD = 0 0.384 0.050∗ 0.015∗∗ 0.007∗∗∗ 0.000∗∗∗ 0.000∗∗∗
Mean (Control) 0.153 0.326 0.479 0.122 0.449 0.570N 2053 2053 2053 2053 2053 2053
Notes: Robust standard errors clustered at the clinic level in parentheses. All regressions control for clinicvisit date fixed effects. We use double selection lasso to choose additional controls. See notes to Table 3for a list of potential controls. The expected match for malaria positive is equal to predicted malaria risktimes the relevant malaria treatment/purchase dummy. The expected match for malaria negative is equalto one minus predicted malaria risk times one minus the malaria prescription/purchase dummy. The overallexpected match is the sum of these two variables. *, **, and *** denote statistical significance at the 10, 5,and 1 percent levels respectively.
51