diversity and community assemblage of littoral zone benthic macroinvertebrates in jagadishpur...
TRANSCRIPT
Nepal Journal of Science and Technology 12 (2011) 211-220
Diversity and Community Assemblage of LittoralZone Benthic Macroinvertebrates in Jagadishpur
Reservoir
1Deep N. Shah, 1Ram D. Tachamo Shah and 2Bandana K Pradhan1Hindu Kush Himalayan Benthological Society, Kathmandu
2Department of Community Medicine and Family Health, Institute of Medicine, Tribhuvan Universitye-mail: [email protected]
AbstractLittoral benthic macroinvertebrates diversity and community assemblage of Jagadishpur Reservoir were studiedduring post-monsoon (2008) and pre-monsoon (2009) seasons. Altogether twelve sites in the littoral zone of thereservoir were sampled for benthic macroinvertebrates by using a kick-and-sweep method with a standard handnet.At each site, benthic macroinvertebrate samples were taken from different possible substrate types. Theenvironmental variables of each site were collected based on Lentic Ecosystem Field Protocol during sampling.Biological metrics were used to describe the diversity and composition of benthic macroinvertebrates. The relationshipbetween benthic macroinvertebrates assemblage and substrate types were examined by using principal componentanalysis. Cluster analyses were performed to describe the similarity among samples. In total, 50 taxa, belonging to15 orders were recorded for littoral zone of the reservoir. The recorded higher number of taxa (family level) belongedto order Heteroptera (water bugs) and Diptera (flies), and class Mollusca. Mollusca for post-monsoon and Diptera(particularly Chironomidae) for pre-monsoon shared the highest proportion in the total density. Shannon diversityindex (H’) for post-monsoon was 1.82±0.46 and for pre-monsoon was 1.38±0.53 and was significantlydifferent between seasons (p=0.01). Principal component analysis revealed that increase in taxa numbers werepositively correlated to soft substrates while negatively correlated to non-soft substrates in littoral zone of thereservoir. Cluster analyses discriminated the sites into two main groups for both seasons. The study concludesthat benthic macroinvertebrates diversity is highly influenced by substrate types, water level fluctuation, andhuman accessibility to the reservoir. Therefore, in order to stabilize benthic macroinvertebrates diversity and theirabundance, it is essential to maintain surface water level, stabilize bank substrate and minimize human pressure.
Key words: benthic macroinvertebrates, aquatic biodiversity, littoral zone, reservoir, substrates
IntroductionThe ecological attributes of wetlands (rivers, lakes,reservoir, marshy lands, paddy fields etc) are highlydiverse and provide especially important ecosystemservices (Costanza et al. 1991). These valued ecologicalattributes, such as water storage capacity,biogeochemical cycling, biotic productivity, and
biodiversity, are integral to the structure and functionof wetland ecosystems and their ecological integrity(Stevenson & Hauer 2002).
Benthic macroinvertebrates (BMI) play an essentialrole in key processes (food chain dynamics,
211
Nepal Journal of Science and Technology 12 (2011) 211-219
productivity, nutrient cycling and decomposition)within wetland ecosystems (Batzer et al. 1993, Hann1991, Reice & Wohlenberg 1993, Schriver et al. 1995).For example, many fish and waterfowl species dependon BMI communities for food (Wiley et al. 1984, Euliss& Grodhaus 1987; Swanson 1988, Euliss et al. 1991).They also indicate any environmental changes likeeutrophication and several other modes of lakedegradation which are reflected by related changes intheir structure (abundance and species composition)(Solimini et al. 2006, Sharma & Rawat 2009).Hydrological and morphological alterations cause themost severe impact on littoral BMI structures sincetheir low mobility restricts their ability to follow thereceding water than fish, and exhibit a much higherdependence on littoral habitat types (Solimini et al.2006). The water level fluctuations reduce diversityand alter the composition of littoral habitats (Baxter1977; Hellsten et al. 1996; Hill and Keddy 1992; Soliminiet al. 2006) which may affect littoral speciescomposition. In such system, macrophytes playimportant role by providing attachment sites andmaterials to build protective retreats to invertebrates(Soszka 1975, Lodge 1985, Dudley 1988). Biologicalmetrics such as species richness, diversity, andcomposition measures are often used to describeecological changes of an ecosystem (e.g., Niemi &McDonald 2004, Shah et al. 2011) as they integratethe effects of multiple stressors, including those whosemechanisms or even existence might be poorly known.
Jagadispur reservoir is one of the most importantwetlands of Nepal designated as Ramsar site in 2003and is also highlighted in the Directory of AsianWetlands chiefly because of its support for threatenedand endangered species of birds and mammals. A totalof 118 bird species are recorded from the reservoir inwhich seven species are globally Threatened and threespecies are Near Threatened (Baral 2008). The globallyThreatened smooth-coated Otter (Lutrogaleperspicillata) also occurs in the reservoir area(DNPWC & IUCN 2003 cited in Baral 2008). Nearly2000 people live in the immediate vicinity of the lakewithin 500m radius. The majority of people living inthe area are from Tharu, Yadav and Muslimcommunities. There are also migrated hill tribes eg.Brahmin, Chhetris, Gurungs, Magars, etc. Majority ofvillagers that live in the adjacent area are farmers andare poor.
The reservoir was built in the early 1970s over JakhiraLake and agricultural land for irrigation purpose.Currently, it supplies water for 6,200 ha of surroundingcultivated lands for irrigation (Fact sheet of Nepal2005). It also provides tremendous economic benefitsto local people, for example, fisheries; maintenance ofwater table and nutrient retention in surroundingwetlands; timber production; energy resources(fuelwood and fodder collection), domestic use (e.g.laundry), harvesting of wetland products (e.g.Gastropods-apple snails, macrophytes-water-chestnut), recreation (e.g. picnic spots, bathing) andtourism opportunities.
The reservoir water is extensively used by local farmersduring crop seasons. Although, the reservoir getsreplenished from the Banganga river, the water levelfluctuates remarkably from dry to wet seasons. Thewater level becomes very low during pre-monsoon andonly covers its bottom which is mainly composed ofsoft substrates like mud, organic debris. In contract,the water level is relatively higher during post-monsoon and reaches up to its dike which is composedof non-soft substrates like boulders, cobbles andstones. Additionally, it is subjected to various humanuse e.g. fishing, grazing, fuel wood and foddercollection, domestic use (e.g. laundry), harvesting ofwetland products, recreation (e.g. picnic, bathing,boating) and supply of water for irrigation.
There have been some studies focused on assessmentof water quality (Gautam and Bhatarai 2010) and birds’status (Baral 2008). However, the diversity andstructure of littoral benthic macroinvertebrates are stillpoorly known from the reservoir though it has highsignificance in understanding the overall status of theecosystem. Thus, the present research focuses ondiversity and community assemblage of benthicmacroinvertebrates and their relation to stressors ofthe reservoir for post-monsoon (2008) and pre-monsoon (2009) seasons.
MethodologyStudy areaJagadishpur Reservoir (also known as Sagar Taal),located at 27º35’00'’N and 83º05’00'’E (altitude 197m)in Taulihawa county, Kapilbastu district, is the largest(157 ha) manmade reservoir in Nepal (Fig. 1) with atotal shoreline perimeter of approximately 5 km (Bhuju
212
Deep N. Shah et al./Diversity and Community ........
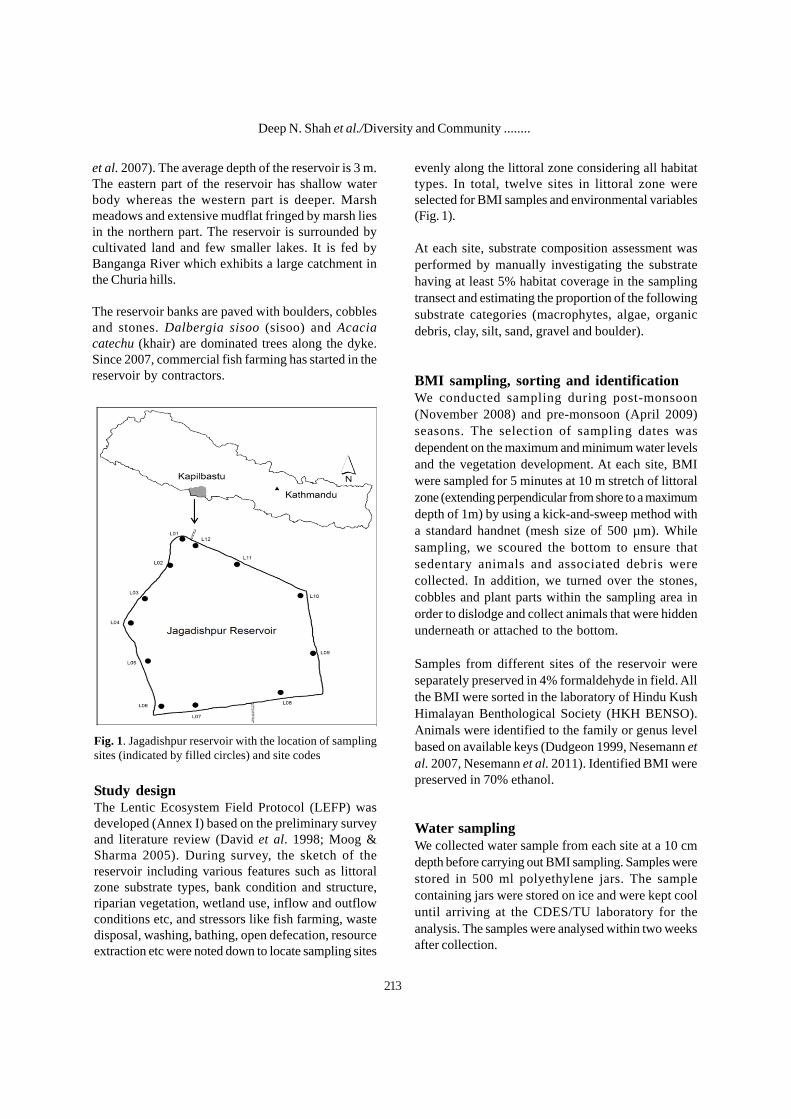
et al. 2007). The average depth of the reservoir is 3 m.The eastern part of the reservoir has shallow waterbody whereas the western part is deeper. Marshmeadows and extensive mudflat fringed by marsh liesin the northern part. The reservoir is surrounded bycultivated land and few smaller lakes. It is fed byBanganga River which exhibits a large catchment inthe Churia hills.
The reservoir banks are paved with boulders, cobblesand stones. Dalbergia sisoo (sisoo) and Acaciacatechu (khair) are dominated trees along the dyke.Since 2007, commercial fish farming has started in thereservoir by contractors.
Fig. 1. Jagadishpur reservoir with the location of samplingsites (indicated by filled circles) and site codes
Study designThe Lentic Ecosystem Field Protocol (LEFP) wasdeveloped (Annex I) based on the preliminary surveyand literature review (David et al. 1998; Moog &Sharma 2005). During survey, the sketch of thereservoir including various features such as littoralzone substrate types, bank condition and structure,riparian vegetation, wetland use, inflow and outflowconditions etc, and stressors like fish farming, wastedisposal, washing, bathing, open defecation, resourceextraction etc were noted down to locate sampling sites
evenly along the littoral zone considering all habitattypes. In total, twelve sites in littoral zone wereselected for BMI samples and environmental variables(Fig. 1).
At each site, substrate composition assessment wasperformed by manually investigating the substratehaving at least 5% habitat coverage in the samplingtransect and estimating the proportion of the followingsubstrate categories (macrophytes, algae, organicdebris, clay, silt, sand, gravel and boulder).
BMI sampling, sorting and identificationWe conducted sampling during post-monsoon(November 2008) and pre-monsoon (April 2009)seasons. The selection of sampling dates wasdependent on the maximum and minimum water levelsand the vegetation development. At each site, BMIwere sampled for 5 minutes at 10 m stretch of littoralzone (extending perpendicular from shore to a maximumdepth of 1m) by using a kick-and-sweep method witha standard handnet (mesh size of 500 µm). Whilesampling, we scoured the bottom to ensure thatsedentary animals and associated debris werecollected. In addition, we turned over the stones,cobbles and plant parts within the sampling area inorder to dislodge and collect animals that were hiddenunderneath or attached to the bottom.
Samples from different sites of the reservoir wereseparately preserved in 4% formaldehyde in field. Allthe BMI were sorted in the laboratory of Hindu KushHimalayan Benthological Society (HKH BENSO).Animals were identified to the family or genus levelbased on available keys (Dudgeon 1999, Nesemann etal. 2007, Nesemann et al. 2011). Identified BMI werepreserved in 70% ethanol.
Water samplingWe collected water sample from each site at a 10 cmdepth before carrying out BMI sampling. Samples werestored in 500 ml polyethylene jars. The samplecontaining jars were stored on ice and were kept cooluntil arriving at the CDES/TU laboratory for theanalysis. The samples were analysed within two weeksafter collection.
213
Nepal Journal of Science and Technology 12 (2011) 211-219
214
Dissolved oxygen (DO), temperature, pH,conductivity, free CO2, nitrate-nitrogen, ammonium-nitrogen, ortho-phosphate phosphorus, Ca++
hardness, Mg++ hardness, total hardness, totalalkalinity and chloride were measured (based onmethods APHA 1995, and Trivedy & Goel 1984) foreach site.
Data analysisBiological metrics: Alpha diversity (Taxa richness,Shannon diversity index), ETO (Ephemeroptera,Trichoptera and Odonata) taxa, Diptera taxa andcomposition measures (% of Diptera taxa, % of ETOtaxa, % of Diptera individuals, % of Non-insectaindividuals, % of Mollusca individuals and % ofOligochaetes and Leeches) were calculated forassessing variability in diversity and communityassemblages of BMI in post-monsoon and pre-monsoon seasons.
Multivariate analyses: Detrended CorrespondenceAnalysis (DCA), Principal Component Analysis (PCA),and Cluster Analysis (CA) were carried out for bothseasons separately in PC-ORD 5.16 version (McCuneand Mefford 2006). Taxa occurrence in less than 12%of total sites were excluded from the analysis to avoiddown weighting BMI distribution pattern. Density ofthe taxa were transformed into log10(x+1) in prior to theanalysis. The logarithmic transformation was used toreduce the effect of absolute density. DCA was initiallyconducted to calculate the maximum amount of variationin the BMI assemblage data. Based on the length of thegradient, an appropriate ordination technique (PCA) wasselected for analyzing relationship between biologicaldata and substrate types. Cluster analysis was performedto describe the similarity among the biological samples,where Sorensen Bray-Curtis was used as distancemeasures and flexible beta for group linkage method.
Statistical tests were carried out in statistical programSPSS (version 10 for windows; SPSS Inc, Chicago, IL).Non-parametric Spearman correlation test wasperformed between taxa richness and soft substrates(organic debris, mud/clay and macrophytes) and non-soft substrates (cobbles, boulders) for both seasonsseparately. In addition, non-parametric WilcoxonSigned Ranks Test was conducted for statisticalsignificance difference in biological metrics andenvironmental variables between post-monsoon andpre-monsoon seasons.
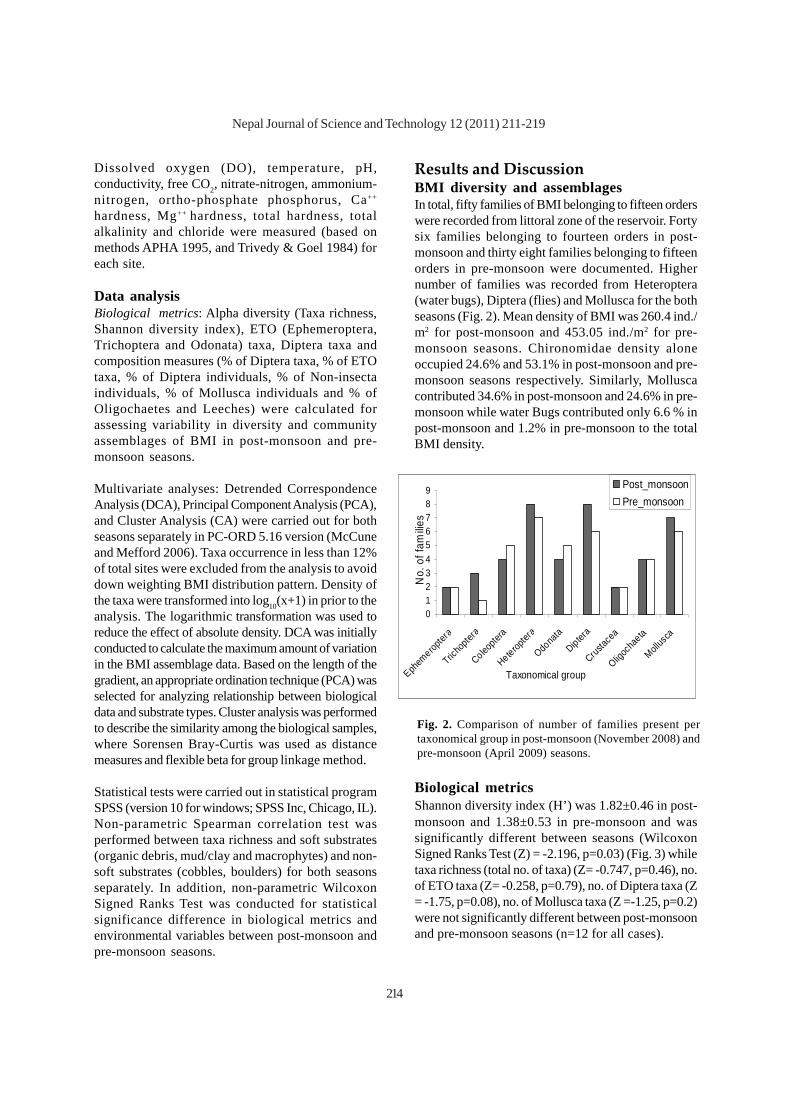
Results and DiscussionBMI diversity and assemblagesIn total, fifty families of BMI belonging to fifteen orderswere recorded from littoral zone of the reservoir. Fortysix families belonging to fourteen orders in post-monsoon and thirty eight families belonging to fifteenorders in pre-monsoon were documented. Highernumber of families was recorded from Heteroptera(water bugs), Diptera (flies) and Mollusca for the bothseasons (Fig. 2). Mean density of BMI was 260.4 ind./m2 for post-monsoon and 453.05 ind./m2 for pre-monsoon seasons. Chironomidae density aloneoccupied 24.6% and 53.1% in post-monsoon and pre-monsoon seasons respectively. Similarly, Molluscacontributed 34.6% in post-monsoon and 24.6% in pre-monsoon while water Bugs contributed only 6.6 % inpost-monsoon and 1.2% in pre-monsoon to the totalBMI density.
0123456789
Ephem
eropter
a
Tricho
ptera
Coleopte
ra
Heteropter
a
Odona
ta
Diptera
Crustac
ea
Oligoch
aeta
Mollusca
Taxonomical group
No.
of f
amilie
s
Post_monsoonPre_monsoon
Fig. 2. Comparison of number of families present pertaxonomical group in post-monsoon (November 2008) andpre-monsoon (April 2009) seasons.
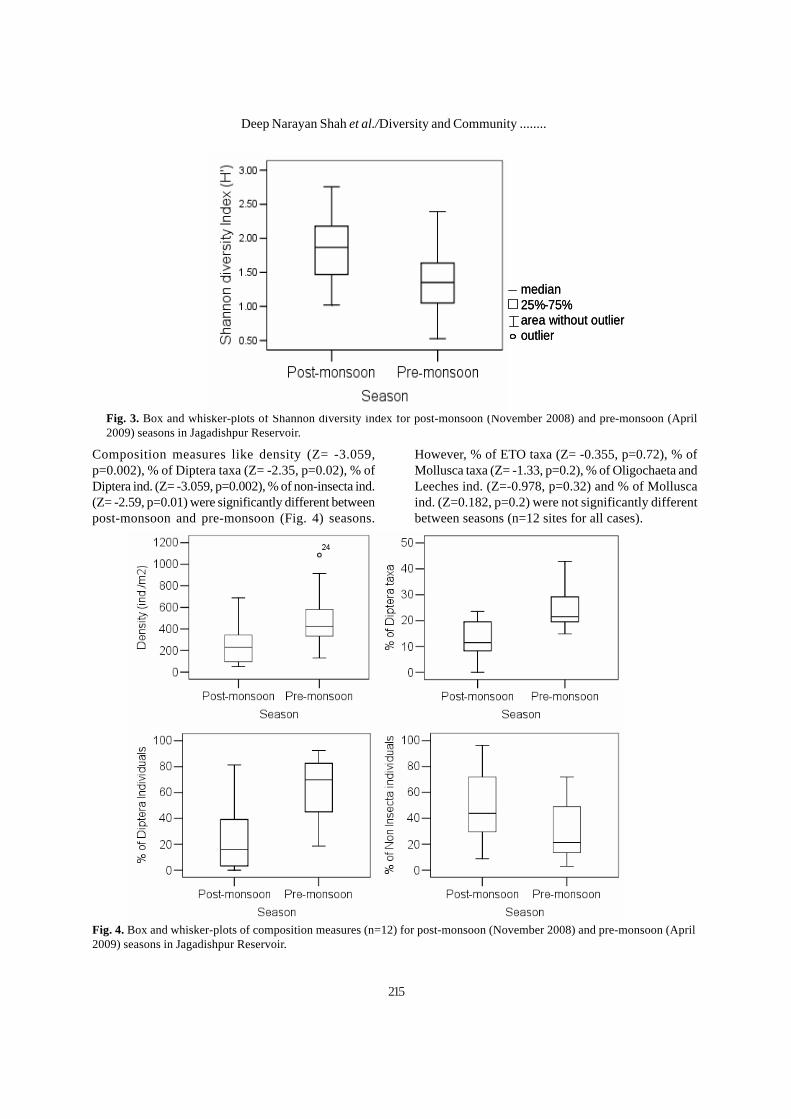
Biological metricsShannon diversity index (H’) was 1.82±0.46 in post-monsoon and 1.38±0.53 in pre-monsoon and wassignificantly different between seasons (WilcoxonSigned Ranks Test (Z) = -2.196, p=0.03) (Fig. 3) whiletaxa richness (total no. of taxa) (Z= -0.747, p=0.46), no.of ETO taxa (Z= -0.258, p=0.79), no. of Diptera taxa (Z= -1.75, p=0.08), no. of Mollusca taxa (Z =-1.25, p=0.2)were not significantly different between post-monsoonand pre-monsoon seasons (n=12 for all cases).
215
Fig. 3. Box and whisker-plots of Shannon diversity index for post-monsoon (November 2008) and pre-monsoon (April2009) seasons in Jagadishpur Reservoir.
median25%-75%area without outlieroutlier
median25%-75%area without outlieroutlier
Composition measures like density (Z= -3.059,p=0.002), % of Diptera taxa (Z= -2.35, p=0.02), % ofDiptera ind. (Z= -3.059, p=0.002), % of non-insecta ind.(Z= -2.59, p=0.01) were significantly different betweenpost-monsoon and pre-monsoon (Fig. 4) seasons.
However, % of ETO taxa (Z= -0.355, p=0.72), % ofMollusca taxa (Z= -1.33, p=0.2), % of Oligochaeta andLeeches ind. (Z=-0.978, p=0.32) and % of Molluscaind. (Z=0.182, p=0.2) were not significantly differentbetween seasons (n=12 sites for all cases).
Fig. 4. Box and whisker-plots of composition measures (n=12) for post-monsoon (November 2008) and pre-monsoon (April2009) seasons in Jagadishpur Reservoir.
Deep Narayan Shah et al./Diversity and Community ........
Nepal Journal of Science and Technology 12 (2011) 211-219
216
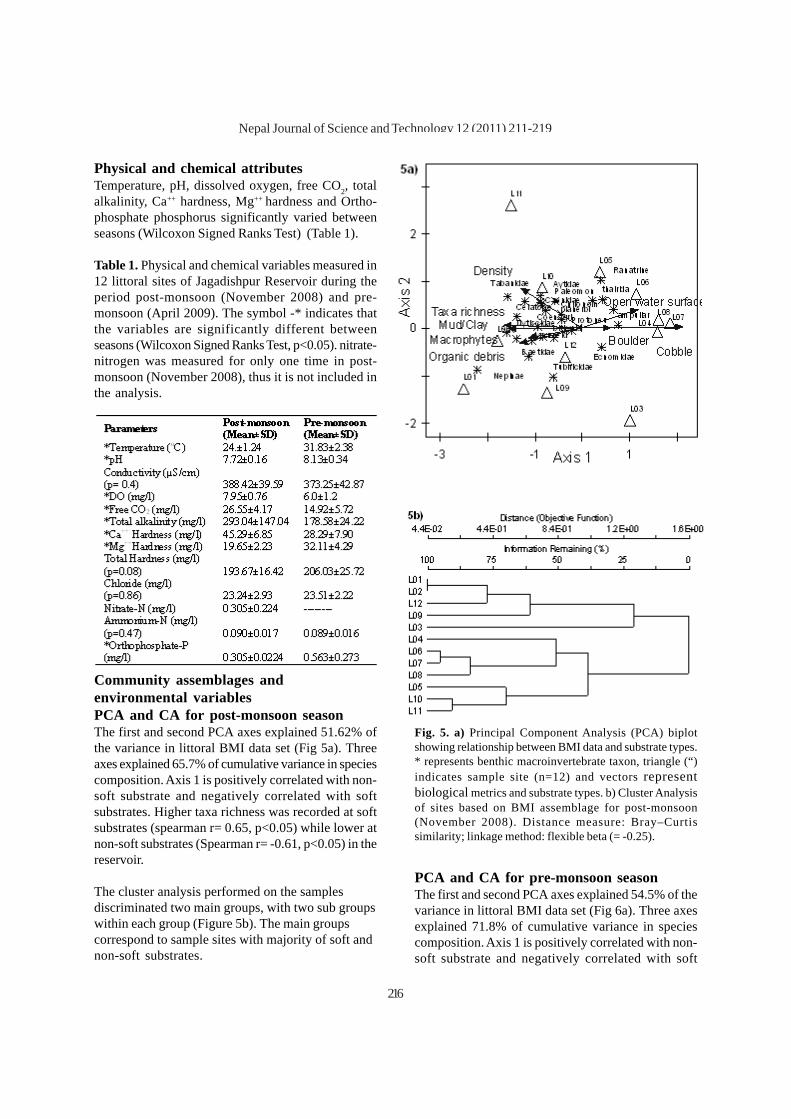
Physical and chemical attributesTemperature, pH, dissolved oxygen, free CO2, totalalkalinity, Ca++ hardness, Mg++ hardness and Ortho-phosphate phosphorus significantly varied betweenseasons (Wilcoxon Signed Ranks Test) (Table 1).
Table 1. Physical and chemical variables measured in12 littoral sites of Jagadishpur Reservoir during theperiod post-monsoon (November 2008) and pre-monsoon (April 2009). The symbol -* indicates thatthe variables are significantly different betweenseasons (Wilcoxon Signed Ranks Test, p<0.05). nitrate-nitrogen was measured for only one time in post-monsoon (November 2008), thus it is not included inthe analysis.
Community assemblages andenvironmental variablesPCA and CA for post-monsoon seasonThe first and second PCA axes explained 51.62% ofthe variance in littoral BMI data set (Fig 5a). Threeaxes explained 65.7% of cumulative variance in speciescomposition. Axis 1 is positively correlated with non-soft substrate and negatively correlated with softsubstrates. Higher taxa richness was recorded at softsubstrates (spearman r= 0.65, p<0.05) while lower atnon-soft substrates (Spearman r= -0.61, p<0.05) in thereservoir.
The cluster analysis performed on the samplesdiscriminated two main groups, with two sub groupswithin each group (Figure 5b). The main groupscorrespond to sample sites with majority of soft andnon-soft substrates.
Fig. 5. a) Principal Component Analysis (PCA) biplotshowing relationship between BMI data and substrate types.* represents benthic macroinvertebrate taxon, triangle (“)indicates sample site (n=12) and vectors representbiological metrics and substrate types. b) Cluster Analysisof sites based on BMI assemblage for post-monsoon(November 2008). Distance measure: Bray–Curtissimilarity; linkage method: flexible beta (= -0.25).
PCA and CA for pre-monsoon seasonThe first and second PCA axes explained 54.5% of thevariance in littoral BMI data set (Fig 6a). Three axesexplained 71.8% of cumulative variance in speciescomposition. Axis 1 is positively correlated with non-soft substrate and negatively correlated with soft
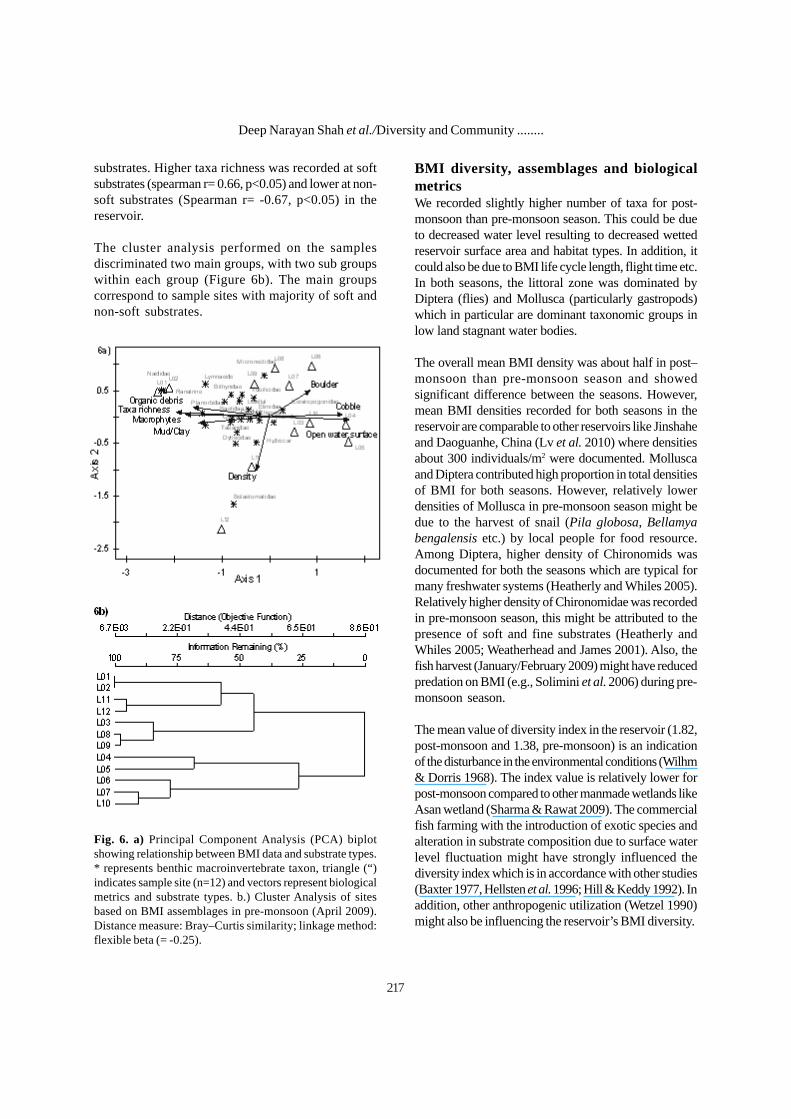
substrates. Higher taxa richness was recorded at softsubstrates (spearman r= 0.66, p<0.05) and lower at non-soft substrates (Spearman r= -0.67, p<0.05) in thereservoir.
The cluster analysis performed on the samplesdiscriminated two main groups, with two sub groupswithin each group (Figure 6b). The main groupscorrespond to sample sites with majority of soft andnon-soft substrates.
Fig. 6. a) Principal Component Analysis (PCA) biplotshowing relationship between BMI data and substrate types.* represents benthic macroinvertebrate taxon, triangle (“)indicates sample site (n=12) and vectors represent biologicalmetrics and substrate types. b.) Cluster Analysis of sitesbased on BMI assemblages in pre-monsoon (April 2009).Distance measure: Bray–Curtis similarity; linkage method:flexible beta (= -0.25).
BMI diversity, assemblages and biologicalmetricsWe recorded slightly higher number of taxa for post-monsoon than pre-monsoon season. This could be dueto decreased water level resulting to decreased wettedreservoir surface area and habitat types. In addition, itcould also be due to BMI life cycle length, flight time etc.In both seasons, the littoral zone was dominated byDiptera (flies) and Mollusca (particularly gastropods)which in particular are dominant taxonomic groups inlow land stagnant water bodies.
The overall mean BMI density was about half in post–monsoon than pre-monsoon season and showedsignificant difference between the seasons. However,mean BMI densities recorded for both seasons in thereservoir are comparable to other reservoirs like Jinshaheand Daoguanhe, China (Lv et al. 2010) where densitiesabout 300 individuals/m2 were documented. Molluscaand Diptera contributed high proportion in total densitiesof BMI for both seasons. However, relatively lowerdensities of Mollusca in pre-monsoon season might bedue to the harvest of snail (Pila globosa, Bellamyabengalensis etc.) by local people for food resource.Among Diptera, higher density of Chironomids wasdocumented for both the seasons which are typical formany freshwater systems (Heatherly and Whiles 2005).Relatively higher density of Chironomidae was recordedin pre-monsoon season, this might be attributed to thepresence of soft and fine substrates (Heatherly andWhiles 2005; Weatherhead and James 2001). Also, thefish harvest (January/February 2009) might have reducedpredation on BMI (e.g., Solimini et al. 2006) during pre-monsoon season.
The mean value of diversity index in the reservoir (1.82,post-monsoon and 1.38, pre-monsoon) is an indicationof the disturbance in the environmental conditions (Wilhm& Dorris 1968). The index value is relatively lower forpost-monsoon compared to other manmade wetlands likeAsan wetland (Sharma & Rawat 2009). The commercialfish farming with the introduction of exotic species andalteration in substrate composition due to surface waterlevel fluctuation might have strongly influenced thediversity index which is in accordance with other studies(Baxter 1977, Hellsten et al. 1996; Hill & Keddy 1992). Inaddition, other anthropogenic utilization (Wetzel 1990)might also be influencing the reservoir’s BMI diversity.
Deep Narayan Shah et al./Diversity and Community ........
217
PCA and CA analysisThe result of PCA showed higher number of BMI taxa atsites dominated with soft substrate habitats than thosedominated by cobbles and boulders for both seasons,supporting the studies conducted by Watkins et al. (1983)and Mcewen and Butler (2010).
The similarity in community assemblages of BMI areprimarily driven by substrate distribution in littoral zone.For instance, similar substrate habitats in L01 and L02(inlet side) sites showed almost similar taxa assemblage(family level) for both seasons in the reservoir. Thechange in substrate types modified BMI assemblages(see Solimini et al. 2006) because substrate is an importantfactor directly controlling littoral BMI distribution andabundance (e.g. Weatherhead & James 2001).
We conclude that the diversity and communityassemblage of littoral BMI is highly dependent onsubstrate distribution in the reservoir, i.e., higher numbersof taxa are associated with soft-substrates than non-softsubstrates. Therefore, maintaining littoral zone habitat innatural condition will enhance stable BMI assemblage.Our study also foresee that intensive fish farming andsurface water level fluctuation could have adverselyaffected littoral BMI diversity and community assemblage,however, more research are required for betterunderstanding of the mechanism. Sustainable waterharvest and low human activities will prevent the loss oflittoral habitat and thus maintain benthicmacroinvertebrate diversity and assemblage. In turn, thiswill help to maintain nature conservation interest.
AcknowledgementsWe thank our research team members Mr. Pramod Bhagat,Ms. Mangleshwori Dhonju, Ms. Mira Prajapati and MrsManju Sapkota. We also thank Prof. Dr. Subodh Sharmafor his technical advice. We are grateful to Dr. Dinesh RajBhuju for his advices and encouragement in conductingthis research. This research was supported by a grant
Nepal Journal of Science and Technology 12 (2011) 211-219
ReferencesAPHA, AWWA and WPCF. 1995. Standard methods for
examination of water and waste water. Nineteeneditions. American Public Health Association,Washington D.C.
Baral, H.M. 2008. Birds of Jagadishpur Reservoir, Nepal.Forktail 24:115-119.
Batzer, D.P., M. McGee , V.H. Resh and R.R. Smith. 1993.Characteristics of invertebrates consumed by mallardsand prey response to wetland flooding schedules.Wetlands 13:41–49.
Baxter, R. M. 1977. Environmental effects of dams and im-poundments. Annual Review of Ecology, Evolution andSystematics 8:255-283.
Bhuju U.R., P.R. Shakya, T.B. Basnet and S. Shrestha. 2007.Nepal biodiversity resource book: Protected areas,ramsar sites and world heritage sites. InternationalCentre for Integrated Mountain Development(ICIMOD) and Ministry of Environment, Science andTechnology (MOEST), Gevernment of Nepal (GoN).
Costanza, R., R. D´Arge, R. Degroot, S. Farber, M. Grasso,B. Hannon, K. Limburg, S. Naeem, R.V. O´Neill, J.Paruelo, R.G. Raskin, P. Sutton and M. Van Den Belt.1991. The value of the world’s ecosystem services andnatural capital. Nature 387:253-260.
Dudgeon, D. 1999. Tropical Asian stream: Zoobenthos,ecology and conversation. Hong Kong University Press.
Dudley, T.L. 1988. The roles of plant complexity and epiphytonin colonization of macrophytes by stream insects.Verhandlung International Verein Limnology 23:1153-1158.
Euliss N.H. and G. Grodhaus. 1987. Management of midgesand other invertebrates for waterfowl wintering inCalifornia. California Fish and Game 73: 238-243.
Euliss, N.H., R.L Jarvis and D.S. Gilmer. 1991. Feeding ecologyof waterfowl wintering on evaporation ponds in California.Condor 93:582-590.
Gautam, B. and B. Bhattarai. 2008. Seasonal changes in waterquality parameters and sediment nutrients in JagadishpurReservoir, a Ramsar site in Nepal. Nepal Journal of Scienceand Technology 9: 149-156.
Hellsten, S., M. Marttunen, R. Palomäki, J. Riihimäki and E.Alasaarela.1996. Towards an ecologically-based regulationpractice in Finnish hydroelectric lakes. Regulated Rivers:Research and Management 12: 535-545.
Hill, N.M. and P.A. Keddy. 1992. Prediction of raritiesfrom habitat variables: coastal plain plants on
Nova Scotian lakeshores. Ecology 73: 1852-1859.Lv, G., B. Xiong, M. Liu, X. Yang, L. Qin, P. Chen,W. Xu,
J. Liu and K. Wei. 2010. Composition and structure ofbenthic macroinvertebrate community in two reservoirsin Hubei province, China: Response to eutrophication.Desalination and water treatment 20: 297-306.
Hann, B.J. 1991. Invertebrate grazer–periphytoninteractions in a eutrophic marsh pond. FreshwaterBiology 26: 87–96.
Heatherly, II T. and M.R. Whiles. 2005. Diversity andcommunity structure of littoral zonemacroinvertebrates in Southern Illionis reclaimedsurface mines lakes. The American Midland NaturalistJournal 154: 67-77.
218
Deep Narayan Shah et al./Diversity and Community ........
Lodge, D.M. 1985. Macrophyte–Gastropod associations:observations and experiments on macrophyte choiceby gastropods. Freshwater Biology 15: 695-708.
McCune, B.A. and M.J. Mefford, 2006. PC-ORD.Multivariate Analysis of Ecological Data. Version 5.16.MjM Software, Gleneden Beach, Oregon, U.S.A.
Mcewen, D.C. and M.G. Butler. 2010. The effects of waterlevel manipulation on the benthic invertebrates of amanaged reservoir, Freshwater Biology 55: 1086-1101.
Moog, O. and S. Sharma. 2005. http://www.assess-hkh.at/downloads/HKH_site_protocol_v3 _2006-02-22.pdf.
Nesemann, H., S. Sharma, G. Sharma, S. Khanal, B. Pradhan,D.N. Shah, and R.D. Tachamo. 2007. Aquaticinvertebrates of the Ganga River System. Vol. 1.Kathmandu, Nepal.
Nesemann, H., R.D.T. Shah, D.N., Shah and S. Sharma.2011. Key to the larval stages of common Odonata ofHindu Kush Himalaya, with short notes on habitatsand ecology. Journal of Threatened Taxa 3: 2045-2060.
Niemi, G.J. and M. McDonald. 2004. Application ofecological indicators. Annual Review of Ecology,Evolution and Systematics 35: 89-111.
Reice, S.R. and M. Wohlenberg. 1993. Monitoring freshwaterbenthic macroinvertebrates and benthic processes:measures for assessment of ecosystem health. In:Freshwater biomonitoring and benthicmacroinvertebrates (Eds. D.M. Rosenberg & V.H.Resh). Chapman and Hall, New York, Pp.287-305.
Schriver, P., J. Bogestrand, E. Jeppesen and M. Sondergaard.1995. Impact of submerged macrophytes on fish–zooplankton–phytoplankton interactions: large-scaleenclosure experiments in a shallow eutrophic lake.Freshwater Biology 33:255–270.
Shah, R.D.T., D.N. Shah and H. Nesemann. 2011.Development of a macroinvertebrate-based Nepal LakeBiotic Index (NLBI): an applied method for assessingthe ecological quality of lakes and reservoirs in Nepal.International Journal of Hydrology Science andTechnology 1:125-146.
Sharma, R.C. and J.S. Rawat. 2009. Monitoring of aquaticmacroinvertebrates as bioindicator for assessing thehealth of wetlands: A case study in the CentralHimalayas, India. Ecological Indicators 9:118-128.
Solimini, A.G., G. Free, I. Donohue, K. Irvine, M. Pusch, B.Rossaro, L. Sandin and C. Ana Cardoso. 2006. Usingbenthic macroinvertebrates to assess ecological statusof lakes current knowledge and way forward to supportWFD Implementation. Obtained through the Internet:http://www.igb-berlin.de/. [ accessed 15/09/2010].
Soszka, G.J. 1975. Ecological relationships betweeninvertebrates and submerged macrophytes in the lakelittoral. Ekologia Polska 23: 393–415.
Stevenson, R.J. and F.R. Hauer. 2002. Integratinghydrogeomorphic and index of biotic integrityapproaches for environmental assessment of wetalnds.Journal of the American Benthological Society21: 502-513.
Swanson, G.A. 1988. Aquatic habitats of breedingwaterfowl. In: The Ecology and Management ofWetlands (Ed. D.L. Hook). Croom Helm, Kent.Pp.195–203.
Trivedy, R.K. and P.K. Goel. 1986. Chemical and biologicalmethods for water pollution studies. Department ofEnvironmental Pollution. Y. K. College of Science,Karad, India.
Watkins, C.E., J.V. Shireman and W.T. Haller. 1983. Theinfluence of aquatic vegetation upon zooplankton andbenthic macroinvertebrates in Orange Lake, Florida.Journal of Aquatic Plant Management 21:78-83.
Weatherhead, M.A. and M.R. James. 2001. Distribution ofmacroinvertebrates in relation to physical and biologicalvariables in the littoral zone of nine New Zealand Lakes.Hydrobiologia 462:115–129.
Wetzel, R.G. 1990. Reservoir ecosystems: Conclusions andspeculations. In: Reservoir limnology: Ecologicalperspectives (Eds K.W. Thornton, B.L. Kimmel & F.E.Payne). Wiley, New York, Pp.27-38.
Wiley M.J., R.W. Gorden, S.W. Waite and T. Powless. 1984.The relationship between aquatic macrophytes andsport fish production in Illinois ponds: a simple model.North American Journal of Fisheries Management4:111–119.
Wilhm, J.L. and T.C. Dorris. 1968. Biological parametersof water quality criteria. Bioscience 18: 477-481.
219

Nepal Journal of Science and Technology 12 (2011) 211-219
219