divarchive.7.2.divaprotect user guide.v.1.1
TRANSCRIPT
[1] Oracle® DIVArchiveDIVAprotect User’s Guide
Release 7.3
E64037-02
January 2016
Oracle DIVArchive DIVAprotect User's Guide, Release 7.3
E64037-02
Copyright © 2015, 2016, Oracle and/or its affiliates. All rights reserved.
Primary Author: Lou Bonaventura
This software and related documentation are provided under a license agreement containing restrictions on use and disclosure and are protected by intellectual property laws. Except as expressly permitted in your license agreement or allowed by law, you may not use, copy, reproduce, translate, broadcast, modify, license, transmit, distribute, exhibit, perform, publish, or display any part, in any form, or by any means. Reverse engineering, disassembly, or decompilation of this software, unless required by law for interoperability, is prohibited.
The information contained herein is subject to change without notice and is not warranted to be error-free. If you find any errors, please report them to us in writing.
If this is software or related documentation that is delivered to the U.S. Government or anyone licensing it on behalf of the U.S. Government, the following notice is applicable:
U.S. GOVERNMENT END USERS: Oracle programs, including any operating system, integrated software, any programs installed on the hardware, and/or documentation, delivered to U.S. Government end users are "commercial computer software" pursuant to the applicable Federal Acquisition Regulation and agency-specific supplemental regulations. As such, use, duplication, disclosure, modification, and adaptation of the programs, including any operating system, integrated software, any programs installed on the hardware, and/or documentation, shall be subject to license terms and license restrictions applicable to the programs. No other rights are granted to the U.S. Government.
This software or hardware is developed for general use in a variety of information management applications. It is not developed or intended for use in any inherently dangerous applications, including applications that may create a risk of personal injury. If you use this software or hardware in dangerous applications, then you shall be responsible to take all appropriate fail-safe, backup, redundancy, and other measures to ensure its safe use. Oracle Corporation and its affiliates disclaim any liability for any damages caused by use of this software or hardware in dangerous applications.
Oracle and Java are registered trademarks of Oracle and/or its affiliates. Other names may be trademarks of their respective owners.
Intel and Intel Xeon are trademarks or registered trademarks of Intel Corporation. All SPARC trademarks are used under license and are trademarks or registered trademarks of SPARC International, Inc. AMD, Opteron, the AMD logo, and the AMD Opteron logo are trademarks or registered trademarks of Advanced Micro Devices. UNIX is a registered trademark of The Open Group.
This software or hardware and documentation may provide access to or information on content, products, and services from third parties. Oracle Corporation and its affiliates are not responsible for and expressly disclaim all warranties of any kind with respect to third-party content, products, and services. Oracle Corporation and its affiliates will not be responsible for any loss, costs, or damages incurred due to your access to or use of third-party content, products, or services.
iii
Table of Contents
1 INTRODUCTION ............................................................................................................. 1
1.1 DOCUMENT CONVENTIONS .................................................................................................. 2
1.2 DEFINITIONS, ACRONYMS, AND SPECIAL TERMS ................................................................... 3
1.3 CHECKSUM RETRY AFTER FAILURE (NEW) ........................................................................... 5
2 DIVAPROTECT OPERATIONS ...................................................................................... 6
2.1 COLLECTING OPERATIONS EVENTS ..................................................................................... 8
2.2 COLLECTING SYSTEM HARDWARE INFORMATION (DIVARCHIVE RESOURCE STATISTICS) ........ 9
2.3 COLLECTING QUICK RESPONSE DATA (QRD) ..................................................................... 11
2.4 COLLECTING DRIVE AND LIBRARY ALERT LOGS INFORMATION ............................................. 14
2.5 COLLECTING METRICS ...................................................................................................... 15
2.5.1 Calculating Metrics Based on Operations Events ..................................................... 15
2.5.1.1 Sum Collection Type ......................................................................................... 15
2.5.1.2 Count Collection Type ...................................................................................... 15
2.5.1.3 Minimum Collection Type .................................................................................. 15
2.5.1.4 Maximum Collection Type ................................................................................. 16
2.5.1.5 Average Collection Type ................................................................................... 16
2.5.1.6 Weight-Based Average Collection Type ............................................................ 16
2.5.2 Calculating DIVArchive Built-in Metrics .................................................................... 17
2.6 USING THE DIVARCHIVE GUI TO MONITOR USAGE AND STATUS ......................................... 18
2.6.1 System Events (Journal) .......................................................................................... 19
2.6.2 Library Alert Logs Information .................................................................................. 23
2.6.3 Drive Alert Logs ....................................................................................................... 24
2.6.4 System Analytics (Metrics) ....................................................................................... 25
2.6.5 System Information .................................................................................................. 27
2.6.6 Source and Destination Information ......................................................................... 27
2.6.7 Media Information .................................................................................................... 28
2.6.8 Library Information ................................................................................................... 29
2.6.9 Extended Tape Drive Information ............................................................................ 31
2.6.10 Extended Object Information.................................................................................... 33
2.6.11 Extended Object Instance Information ..................................................................... 33
2.6.12 Extended Disk Information ....................................................................................... 34
2.6.13 Extended Actor Information ..................................................................................... 35
2.6.14 Extended Tape Information ...................................................................................... 36
2.7 TRACKING CHECKSUM ERRORS IN DIVAPROTECT JOURNAL................................................ 38
3 DIVAPROTECT CONFIGURATION .............................................................................. 39
3.1 DIVAPROTECT MAIN CONFIGURATION ............................................................................... 39
iv
3.1.1 Configuration Utility GUI: Enable/Disable DIVAprotect Configuration ....................... 39
3.1.2 DB: Maximum Possible History of Events in Months ................................................ 39
3.1.3 DB: Maximum Possible Number of Metrics .............................................................. 39
3.1.4 Manager: Enable/Disable DIVAprotect Data Collection ............................................ 39
3.1.5 Manager: Size Triggering Event Queue DB flush (nb events) .................................. 40
3.1.6 Manager: Time Delay Triggering Event Queue DB flush (seconds) ......................... 40
3.1.7 Configuration Utility DIVAprotect Items .................................................................... 40
3.1.8 Tape Drives ............................................................................................................. 40
3.1.9 Actors ...................................................................................................................... 41
3.1.10 Libraries ................................................................................................................... 41
3.2 DIVAPROTECT EVENTS AND METRICS CONFIGURATION ...................................................... 42
3.2.1 Viewing DIVAprotect Events and Metrics ................................................................. 42
3.2.2 Default Events and Metrics Configuration ................................................................ 44
3.2.3 Sample Metric Configuration .................................................................................... 44
4 FREQUENTLY ASKED QUESTIONS AND TROUBLESHOOTING ............................. 46
4.1 HOW OFTEN ARE METRICS UPDATED? ................................................................................ 46
4.2 HOW DO I INSTALL DIVAPROTECT WITH MY FRESH INSTALLATION OF DIVARCHIVE? .............. 46
4.3 CAN I CHOOSE NOT TO INSTALL DIVAPROTECT? ............................................................... 46
4.4 CAN I DISABLE DIVAPROTECT? ......................................................................................... 46
4.5 HOW DO I ACCESS THE SYSTEM IN ENGINEERING MODE? .................................................... 46
APPENDIX ........................................................................................................................ 47
A1 EVENT FIELD DEFINITIONS ................................................................................................ 47
A2 EVENT DEFINITIONS .......................................................................................................... 49
A3 METRICS DEFINITIONS ...................................................................................................... 52
A4 DEFAULT CONFIGURATION ................................................................................................ 58
A5 SUPPORTED TAPE LIBRARIES AND DRIVES ......................................................................... 59
Tables Index
Table 1: Definitions, Acronyms, and Special Terms .................................................................. 3
Table 2: System Operations Events and Associated Data ......................................................... 8
Table 3: DIVArchive Resource Statistics ................................................................................... 9
Table 4: Quick Response Data (QRD) Collected ..................................................................... 11
Table 5: Example Manufacturer Codes ................................................................................... 14
Table 6: Checksum Events ..................................................................................................... 38
v
Figures Index
Figure 1: Control GUI Journal Screen ..................................................................................... 18
Figure 2: Control GUI Metrics Screen ...................................................................................... 18
Figure 3: DIVAprotect Journal View......................................................................................... 19
Figure 4: Previous Queries Drop-Down List ............................................................................ 20
Figure 5: Event Severities ....................................................................................................... 20
Figure 6: Journal Entry Properties View .................................................................................. 22
Figure 7: Journal View Request Shortcuts............................................................................... 23
Figure 8: Library Alert Logs View ............................................................................................ 23
Figure 9: Drive Alert Logs View ............................................................................................... 24
Figure 10: Metrics View ........................................................................................................... 25
Figure 11: Metric Reset Contextual Menu ............................................................................... 26
Figure 12: Metrics Entry Properties View ................................................................................ 26
Figure 13: DIVArchive Information Dialog ............................................................................... 27
Figure 14: Source/Destination Information .............................................................................. 27
Figure 15: Source/Destination Entry Detail Window ................................................................ 28
Figure 16: Media View............................................................................................................. 28
Figure 17: Libraries Information Panel ..................................................................................... 29
Figure 18: Library Entry Detail Window ................................................................................... 30
Figure 19: Drives View ............................................................................................................ 31
Figure 20: Drive Details Dialog – Properties Tab ..................................................................... 32
Figure 21: Drive Details Dialog – Usage Tab ........................................................................... 32
Figure 22: Archived Objects View ........................................................................................... 33
Figure 23: Object Properties Window ...................................................................................... 33
Figure 24: Disks View.............................................................................................................. 34
Figure 25: Actor Properties Dialog – Usage Tab ..................................................................... 35
Figure 26: Actor Properties Dialog - Transcoders Tab ............................................................. 35
Figure 27: Actor Properties Dialog - Analyzer Tab ................................................................... 36
Figure 28: List View of Tapes in the System ............................................................................ 36
Figure 29: Tape Properties Dialog Window ............................................................................. 37
Figure 30: DIVAprotect Journal - Errors Generated By Failed Checksum Verification ............. 38
Figure 31: DIVAprotect Tab in the DIVArchive Configuration Utility ......................................... 39
Figure 32: Edit Drives Entry Dialog.......................................................................................... 40
Figure 33: Configuration Utility Drives Panel ........................................................................... 41
Figure 34: Configuration Utility System Tab - Actors Panel ..................................................... 41
Figure 35: Configuration Utility Robots Tab - Libraries Panel .................................................. 41

vi
Figure 36: Configuration Utility DIVAprotect Tab ..................................................................... 42
Figure 37: Event Definition Properties Dialog .......................................................................... 42
Figure 38: Metric Definition Editor ........................................................................................... 43
Figure 39: DIVAprotect Tab on the Configuration Utility and the “+” Button ............................. 44
Figure 40: Metric Definition Window ........................................................................................ 45
1
1 Introduction
DIVAprotect is an Oracle DIVArchive option that constantly monitors the digital storage infrastructure and warns about media or tape drive degradation before it results in reduced performance or even data loss.
DIVAprotect provides long-term content protection, management and security to DIVArchive.
If using DIVAprotectWS, refer to the Oracle DIVArchive DIVAprotect WS API User Guide in the DIVArchive API Documentation library.
DIVAprotect Features
Continuous monitoring of tape drives and media to preempt equipment failure and performance degradation.
Complete history of drive and media performance.
Full integration with DIVArchive Content Storage Management System.
Performance Analysis
DIVAprotect presents the System Administrator with information regarding current and past performance numbers of various system components. Armed with this information, System Administrators can draw projections based on various premises and plan for appropriate system evolutions.
Identify Potential Issues Ahead Of Time
DIVAprotect collects quality and performance data in real-time within the archive environment. This information can be used as an aid to perform selective migration of content, recycling of defective media, and preventative maintenance of hardware devices. With DIVAprotect, System Administrators can better deal with integrity issues in their network and storage systems, and have increased confidence that their digital assets are available and safe.
2
1.1 Document Conventions
The following conventions are used with respect to text:
Normal Standard Text.
Italic Used to emphasize a term or variable.
Bold Used to emphasize critical information.
6.1 Refers to a section or sub-section in the document.
Courier New Used for system screen output and system commands.
The following conventions are used with respect to figures and drawings:
Red outlined boxes pointing to specific areas in a figure indicate procedural steps, or point out specific parameters being discussed in the section text.
Red outlined boxes that surround specific areas in a figure indicate specific areas of the figure being discussed in the section text.
3
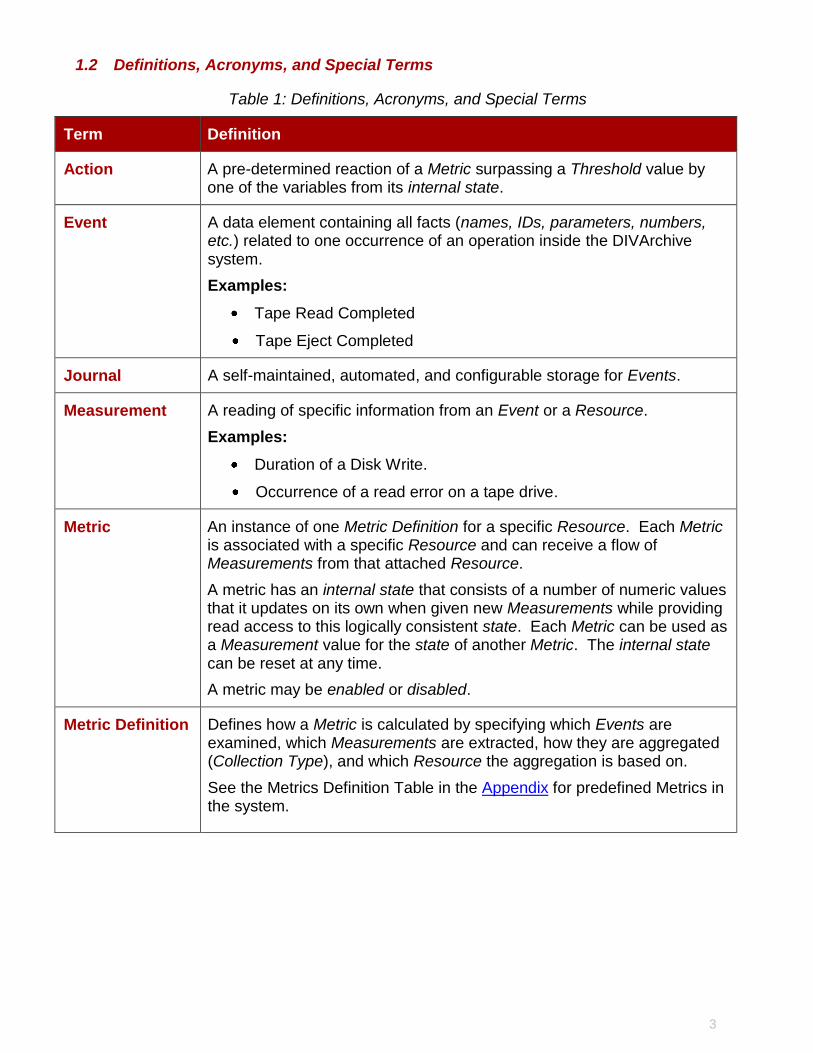
1.2 Definitions, Acronyms, and Special Terms
Table 1: Definitions, Acronyms, and Special Terms
Term Definition
Action A pre-determined reaction of a Metric surpassing a Threshold value by one of the variables from its internal state.
Event A data element containing all facts (names, IDs, parameters, numbers, etc.) related to one occurrence of an operation inside the DIVArchive system.
Examples:
Tape Read Completed
Tape Eject Completed
Journal A self-maintained, automated, and configurable storage for Events.
Measurement A reading of specific information from an Event or a Resource.
Examples:
Duration of a Disk Write.
Occurrence of a read error on a tape drive.
Metric An instance of one Metric Definition for a specific Resource. Each Metric is associated with a specific Resource and can receive a flow of Measurements from that attached Resource.
A metric has an internal state that consists of a number of numeric values that it updates on its own when given new Measurements while providing read access to this logically consistent state. Each Metric can be used as a Measurement value for the state of another Metric. The internal state can be reset at any time.
A metric may be enabled or disabled.
Metric Definition Defines how a Metric is calculated by specifying which Events are examined, which Measurements are extracted, how they are aggregated (Collection Type), and which Resource the aggregation is based on.
See the Metrics Definition Table in the Appendix for predefined Metrics in the system.
4
Term Definition
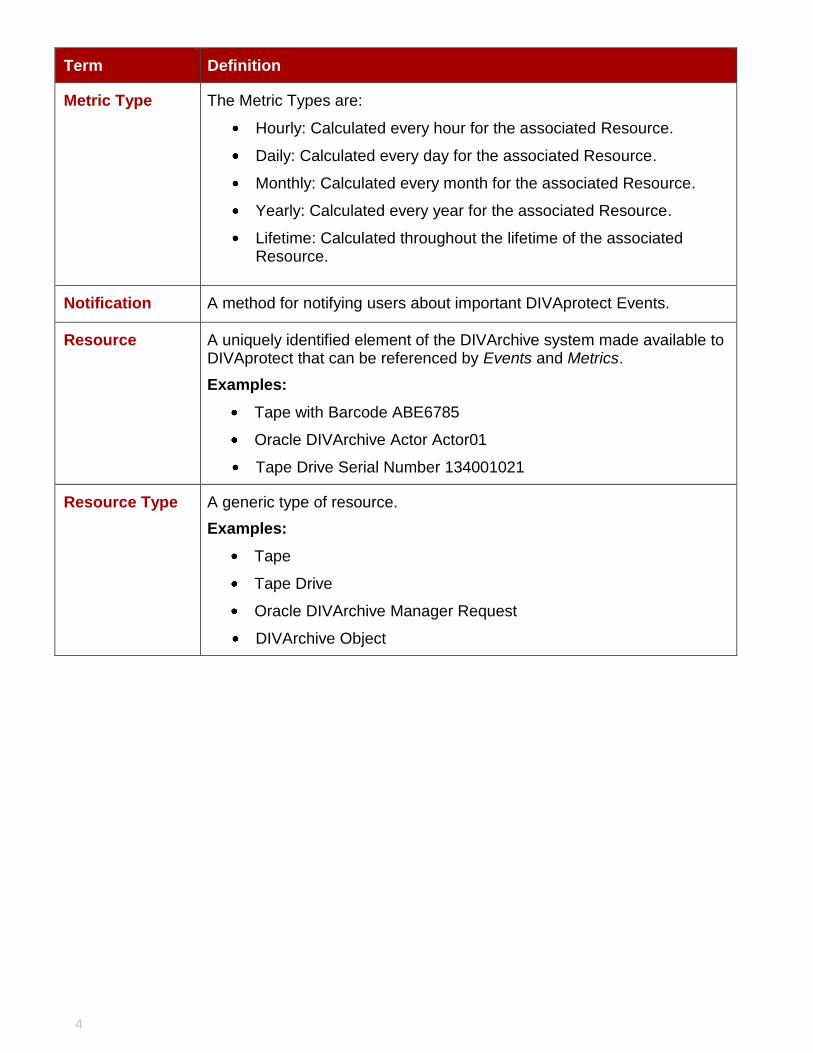
Metric Type The Metric Types are:
Hourly: Calculated every hour for the associated Resource.
Daily: Calculated every day for the associated Resource.
Monthly: Calculated every month for the associated Resource.
Yearly: Calculated every year for the associated Resource.
Lifetime: Calculated throughout the lifetime of the associated Resource.
Notification A method for notifying users about important DIVAprotect Events.
Resource A uniquely identified element of the DIVArchive system made available to DIVAprotect that can be referenced by Events and Metrics.
Examples:
Tape with Barcode ABE6785
Oracle DIVArchive Actor Actor01
Tape Drive Serial Number 134001021
Resource Type A generic type of resource.
Examples:
Tape
Tape Drive
Oracle DIVArchive Manager Request
DIVArchive Object
5
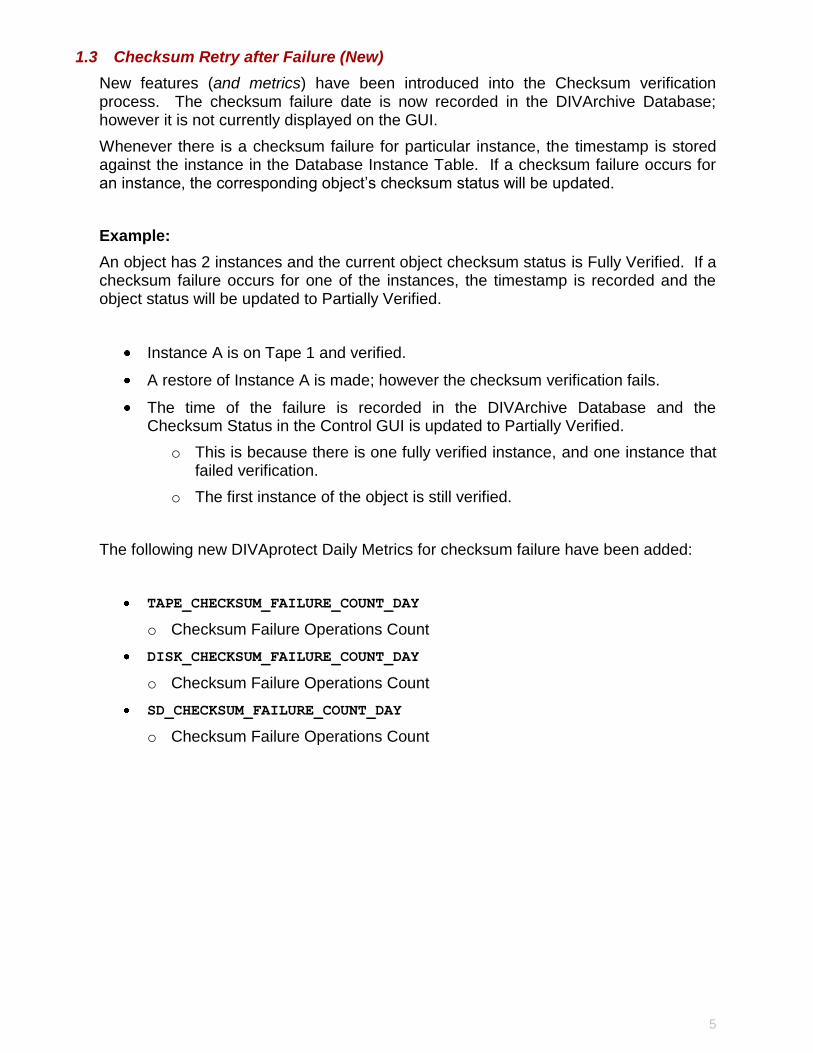
1.3 Checksum Retry after Failure (New)
New features (and metrics) have been introduced into the Checksum verification process. The checksum failure date is now recorded in the DIVArchive Database; however it is not currently displayed on the GUI.
Whenever there is a checksum failure for particular instance, the timestamp is stored against the instance in the Database Instance Table. If a checksum failure occurs for an instance, the corresponding object’s checksum status will be updated.
Example:
An object has 2 instances and the current object checksum status is Fully Verified. If a checksum failure occurs for one of the instances, the timestamp is recorded and the object status will be updated to Partially Verified.
Instance A is on Tape 1 and verified.
A restore of Instance A is made; however the checksum verification fails.
The time of the failure is recorded in the DIVArchive Database and the Checksum Status in the Control GUI is updated to Partially Verified.
o This is because there is one fully verified instance, and one instance that failed verification.
o The first instance of the object is still verified.
The following new DIVAprotect Daily Metrics for checksum failure have been added:
TAPE_CHECKSUM_FAILURE_COUNT_DAY
o Checksum Failure Operations Count
DISK_CHECKSUM_FAILURE_COUNT_DAY
o Checksum Failure Operations Count
SD_CHECKSUM_FAILURE_COUNT_DAY
o Checksum Failure Operations Count
6
2 DIVAprotect Operations
The DIVAprotect System is an analytical and monitoring option integrated into the DIVArchive Solution bringing long-term content protection, management, and security to DIVArchive Systems. DIVAprotect includes reporting through the Journal using various metrics as described in the following sections.
DIVAprotect Features and Components
Performance Analysis
Preventative and corrective maintenance aid
Journal
Metrics
DIVAprotect Tasks
Gather operational facts from the following sources:
o DIVArchive System (software components and equipment)
o Platforms (Servers and OS)
o Exchanged Data
Process operational facts into metrics by sampling, filtering, normalizing, counting, and aggregating data.
Maintain a view of the system’s current and past performance.
Collect and verify Checksum Data in order to expose disk and tape errors and report Disk/Tape and Source/Destination failures.
Assist in managing large volumes of data.
Provide billing data for customers offering DIVArchive as a service to other customers.
Predict operational conditions of interest (e.g. end of life of a tape, a drive).
Provide low-level diagnostic information to assist Support Staff investigations.
Answer a broad range of questions about:
o Optimal performance (what can the system deliver in an optimal context?).
o Current performance (is the system performing at its best?).
o Causes of the current state (what led to the current state, e.g. how did we consume that many tapes in the last month).
o History (e.g. evolution of the capacity, throughput, activity, etc.).
o Possible solutions/adjustments (what needs fixing/relocation, what should be replaced, what should be reconfigured, etc.).
7
o “What If” scenarios (what will be the impact of a proposed change in the system, capacity planning, etc.).
o Usage of the system at various levels (DIVArchive System, DIVArchive Component, Request Type, Tape, Library, Tape Drive, Disk, Category, etc.) as a basis for billing (who, what, when, how much, how many, how long).
Principles of Operation
The primary purpose of DIVAprotect is to collect operational data generated by activity in the archive system (Archive, Restore, Copy, Insert Tapes, etc.). Each activity generates Events like a TAPE READ or a DELETE INSTANCE. Events are collected in
real-time and stored in the database.
Each event has various information attached to it (e.g. the size of a transfer, its duration, the Oracle DIVArchive Actor used, etc.) referred to as Event Parameters.
Metrics are generated and updated by processing event parameters using background jobs scheduled every hour. Event data can be broken down (aggregated) by various resources or attributes (e.g. Object Name, Tape Barcode, storage device), and per hour, day, week, month, or year interval (or no interval for a lifetime metric). Various aggregation functions are provided; e.g. count, sum, average.
For example the TAPE_DRIVE_READ_WRITE_DAY built-in metric sums the transfer sizes
of TAPE READ and TAPE WRITE events and breaks down the values per device and
day.
DIVAprotect supports additional data retrieval like the DIVArchive Resource Statistics and Quick Response Data (QRD), detailed in the next sections. This data is processed separately and isn’t available in Metric Definitions.
8
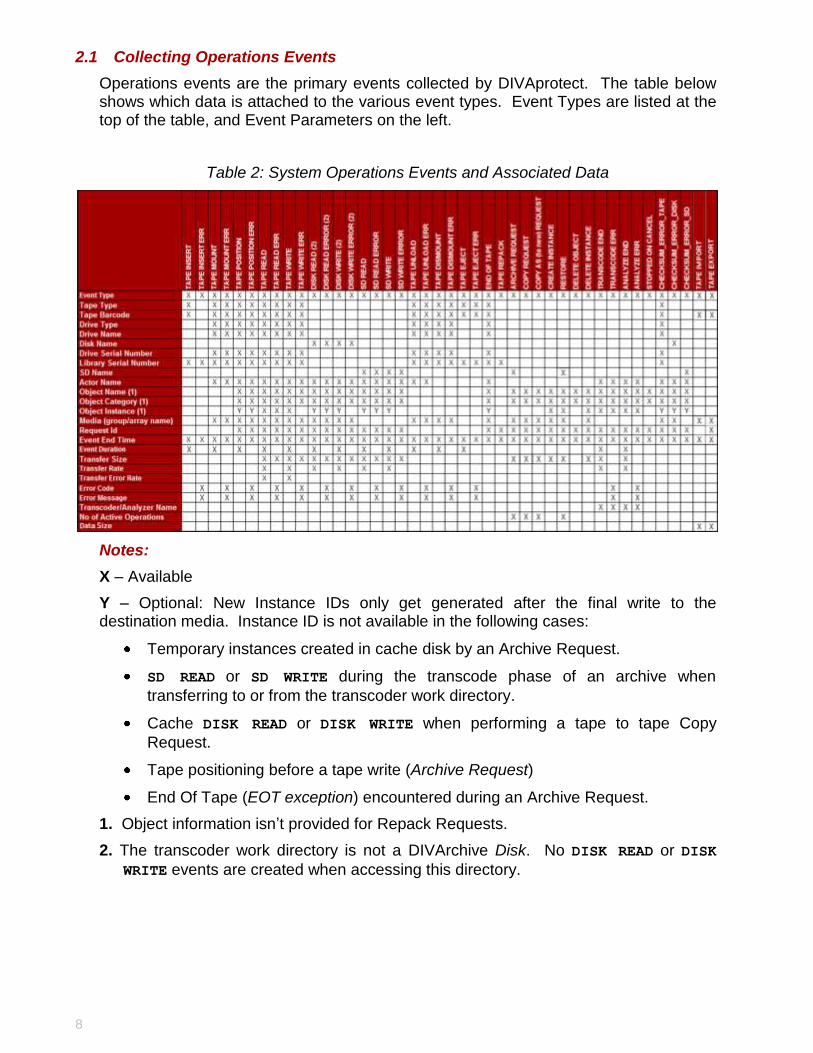
2.1 Collecting Operations Events
Operations events are the primary events collected by DIVAprotect. The table below shows which data is attached to the various event types. Event Types are listed at the top of the table, and Event Parameters on the left.
Table 2: System Operations Events and Associated Data
Notes:
X – Available
Y – Optional: New Instance IDs only get generated after the final write to the destination media. Instance ID is not available in the following cases:
Temporary instances created in cache disk by an Archive Request.
SD READ or SD WRITE during the transcode phase of an archive when
transferring to or from the transcoder work directory.
Cache DISK READ or DISK WRITE when performing a tape to tape Copy
Request.
Tape positioning before a tape write (Archive Request)
End Of Tape (EOT exception) encountered during an Archive Request.
1. Object information isn’t provided for Repack Requests.
2. The transcoder work directory is not a DIVArchive Disk. No DISK READ or DISK
WRITE events are created when accessing this directory.
9
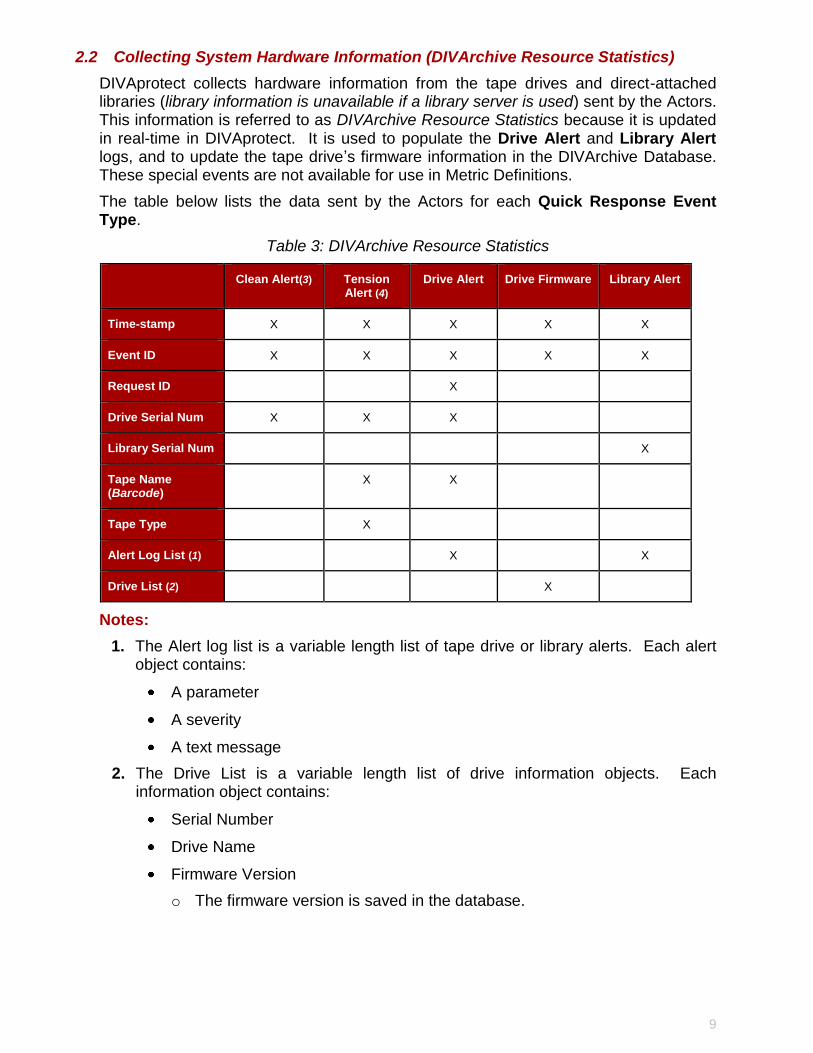
2.2 Collecting System Hardware Information (DIVArchive Resource Statistics)
DIVAprotect collects hardware information from the tape drives and direct-attached libraries (library information is unavailable if a library server is used) sent by the Actors. This information is referred to as DIVArchive Resource Statistics because it is updated in real-time in DIVAprotect. It is used to populate the Drive Alert and Library Alert logs, and to update the tape drive’s firmware information in the DIVArchive Database. These special events are not available for use in Metric Definitions.
The table below lists the data sent by the Actors for each Quick Response Event Type.
Table 3: DIVArchive Resource Statistics
Clean Alert(3) Tension Alert (4)
Drive Alert Drive Firmware Library Alert
Time-stamp X X X X X
Event ID X X X X X
Request ID X
Drive Serial Num X X X
Library Serial Num X
Tape Name (Barcode)
X X
Tape Type X
Alert Log List (1) X X
Drive List (2) X
Notes:
1. The Alert log list is a variable length list of tape drive or library alerts. Each alert object contains:
A parameter
A severity
A text message
2. The Drive List is a variable length list of drive information objects. Each information object contains:
Serial Number
Drive Name
Firmware Version
o The firmware version is saved in the database.

10
3. Clean Alerts are issued by the Actor when a drive indicates it needs cleaning. These alerts are typically trapped by the Library, or the Library Server, and the cleaning process handled by these components. For this reason, DIVArchive doesn’t include a drive cleaning mechanism.
4. Tension Alerts are issued by the Actor when a drive indicates it needs re-tensioning.
11
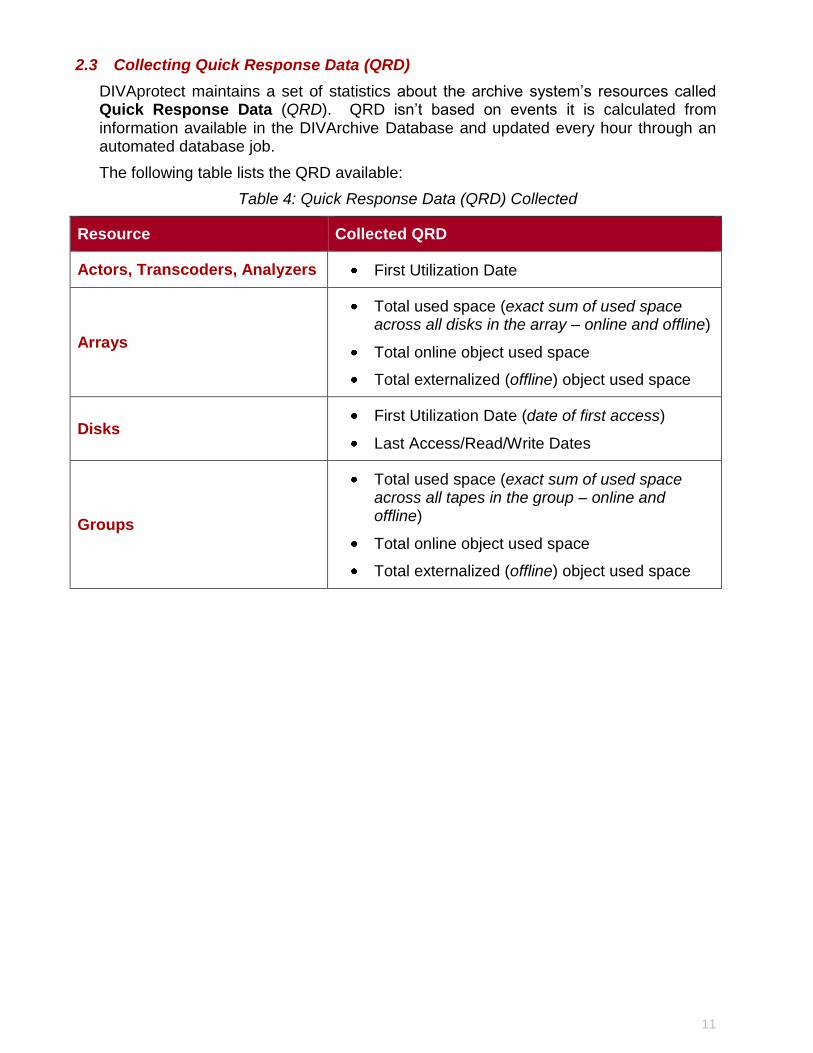
2.3 Collecting Quick Response Data (QRD)
DIVAprotect maintains a set of statistics about the archive system’s resources called Quick Response Data (QRD). QRD isn’t based on events it is calculated from information available in the DIVArchive Database and updated every hour through an automated database job.
The following table lists the QRD available:
Table 4: Quick Response Data (QRD) Collected
Resource Collected QRD
Actors, Transcoders, Analyzers First Utilization Date
Arrays
Total used space (exact sum of used space across all disks in the array – online and offline)
Total online object used space
Total externalized (offline) object used space
Disks First Utilization Date (date of first access)
Last Access/Read/Write Dates
Groups
Total used space (exact sum of used space across all tapes in the group – online and offline)
Total online object used space
Total externalized (offline) object used space
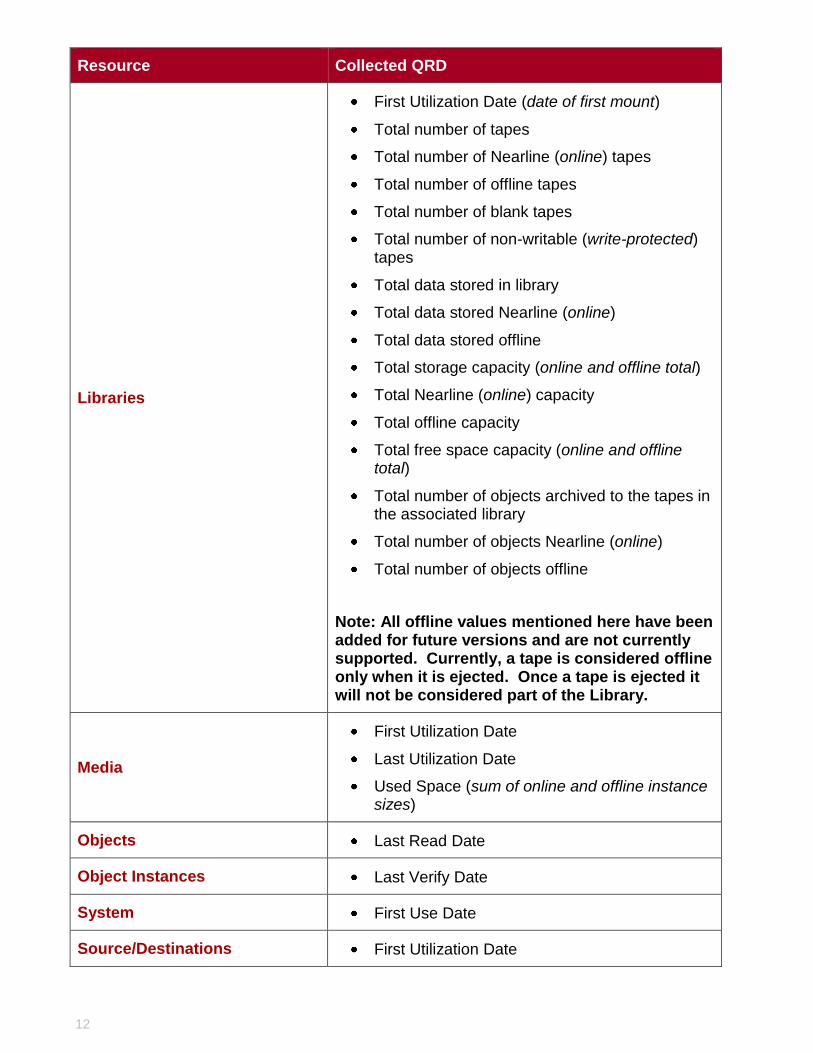
12
Resource Collected QRD
Libraries
First Utilization Date (date of first mount)
Total number of tapes
Total number of Nearline (online) tapes
Total number of offline tapes
Total number of blank tapes
Total number of non-writable (write-protected) tapes
Total data stored in library
Total data stored Nearline (online)
Total data stored offline
Total storage capacity (online and offline total)
Total Nearline (online) capacity
Total offline capacity
Total free space capacity (online and offline total)
Total number of objects archived to the tapes in the associated library
Total number of objects Nearline (online)
Total number of objects offline
Note: All offline values mentioned here have been added for future versions and are not currently supported. Currently, a tape is considered offline only when it is ejected. Once a tape is ejected it will not be considered part of the Library.
Media
First Utilization Date
Last Utilization Date
Used Space (sum of online and offline instance sizes)
Objects Last Read Date
Object Instances Last Verify Date
System First Use Date
Source/Destinations First Utilization Date

13
Resource Collected QRD
Tapes
First Insertion Date (date it appeared in the system)
First Utilization Date (date of first mount)
14
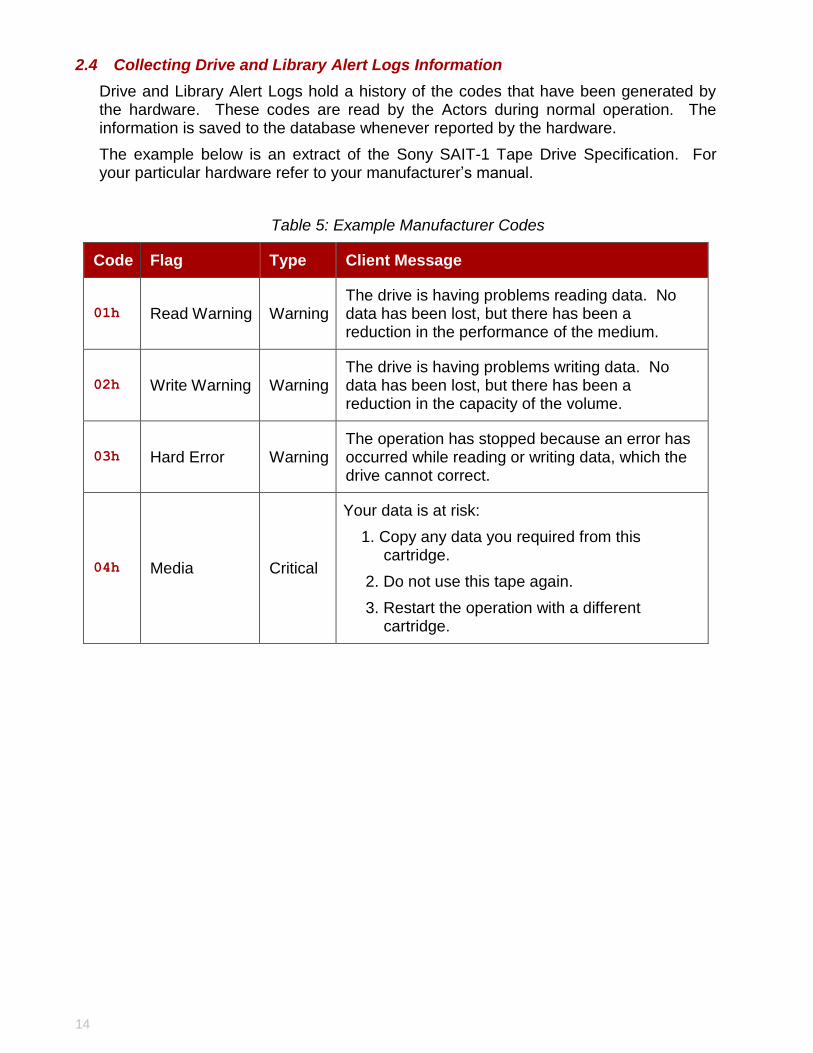
2.4 Collecting Drive and Library Alert Logs Information
Drive and Library Alert Logs hold a history of the codes that have been generated by the hardware. These codes are read by the Actors during normal operation. The information is saved to the database whenever reported by the hardware.
The example below is an extract of the Sony SAIT-1 Tape Drive Specification. For your particular hardware refer to your manufacturer’s manual.
Table 5: Example Manufacturer Codes
Code Flag Type Client Message
01h Read Warning Warning The drive is having problems reading data. No data has been lost, but there has been a reduction in the performance of the medium.
02h Write Warning Warning The drive is having problems writing data. No data has been lost, but there has been a reduction in the capacity of the volume.
03h Hard Error Warning The operation has stopped because an error has occurred while reading or writing data, which the drive cannot correct.
04h Media Critical
Your data is at risk:
1. Copy any data you required from this cartridge.
2. Do not use this tape again.
3. Restart the operation with a different cartridge.
15
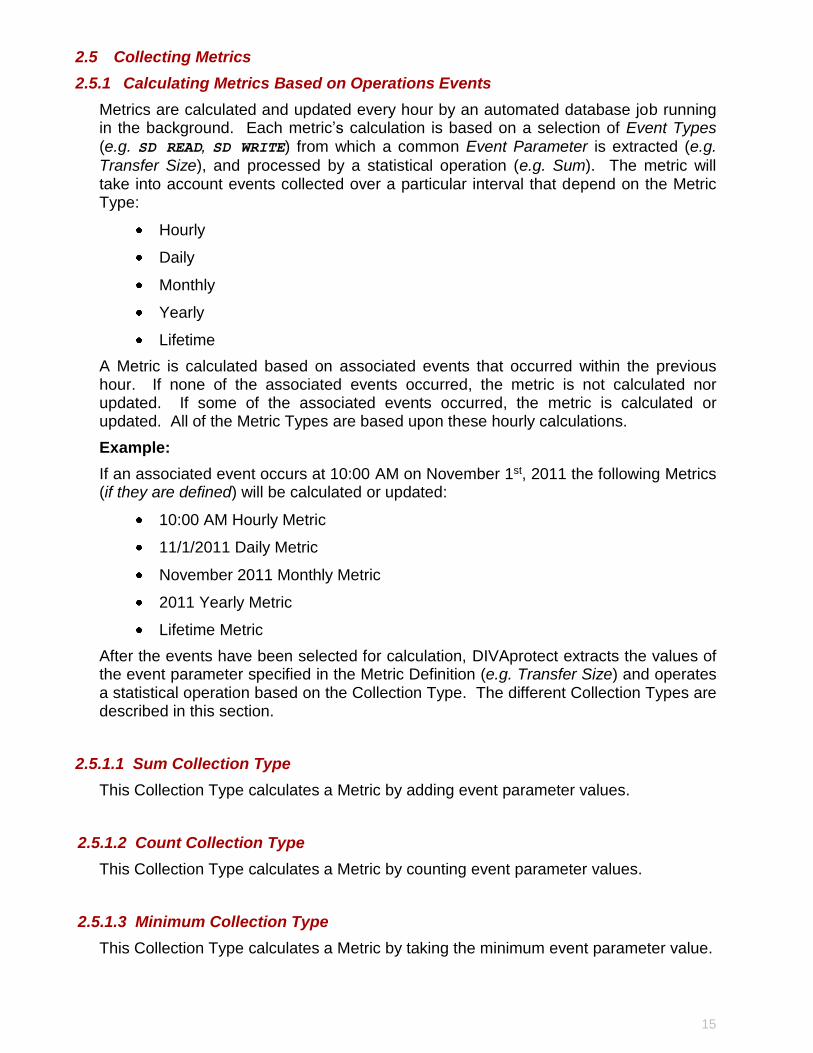
2.5 Collecting Metrics
2.5.1 Calculating Metrics Based on Operations Events
Metrics are calculated and updated every hour by an automated database job running in the background. Each metric’s calculation is based on a selection of Event Types (e.g. SD READ, SD WRITE) from which a common Event Parameter is extracted (e.g.
Transfer Size), and processed by a statistical operation (e.g. Sum). The metric will take into account events collected over a particular interval that depend on the Metric Type:
Hourly
Daily
Monthly
Yearly
Lifetime
A Metric is calculated based on associated events that occurred within the previous hour. If none of the associated events occurred, the metric is not calculated nor updated. If some of the associated events occurred, the metric is calculated or updated. All of the Metric Types are based upon these hourly calculations.
Example:
If an associated event occurs at 10:00 AM on November 1st, 2011 the following Metrics (if they are defined) will be calculated or updated:
10:00 AM Hourly Metric
11/1/2011 Daily Metric
November 2011 Monthly Metric
2011 Yearly Metric
Lifetime Metric
After the events have been selected for calculation, DIVAprotect extracts the values of the event parameter specified in the Metric Definition (e.g. Transfer Size) and operates a statistical operation based on the Collection Type. The different Collection Types are described in this section.
2.5.1.1 Sum Collection Type
This Collection Type calculates a Metric by adding event parameter values.
2.5.1.2 Count Collection Type
This Collection Type calculates a Metric by counting event parameter values.
2.5.1.3 Minimum Collection Type
This Collection Type calculates a Metric by taking the minimum event parameter value.
16
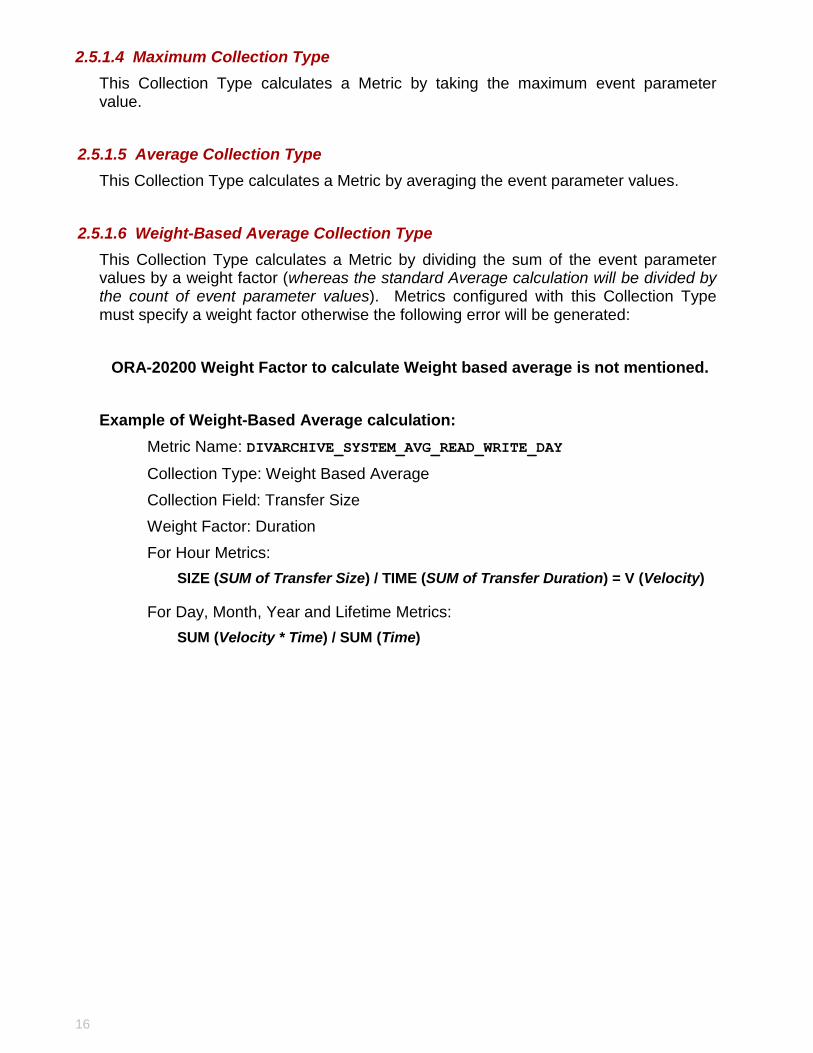
2.5.1.4 Maximum Collection Type
This Collection Type calculates a Metric by taking the maximum event parameter value.
2.5.1.5 Average Collection Type
This Collection Type calculates a Metric by averaging the event parameter values.
2.5.1.6 Weight-Based Average Collection Type
This Collection Type calculates a Metric by dividing the sum of the event parameter values by a weight factor (whereas the standard Average calculation will be divided by the count of event parameter values). Metrics configured with this Collection Type must specify a weight factor otherwise the following error will be generated:
ORA-20200 Weight Factor to calculate Weight based average is not mentioned.
Example of Weight-Based Average calculation:
Metric Name: DIVARCHIVE_SYSTEM_AVG_READ_WRITE_DAY
Collection Type: Weight Based Average
Collection Field: Transfer Size
Weight Factor: Duration
For Hour Metrics:
SIZE (SUM of Transfer Size) / TIME (SUM of Transfer Duration) = V (Velocity)
For Day, Month, Year and Lifetime Metrics:
SUM (Velocity * Time) / SUM (Time)
17
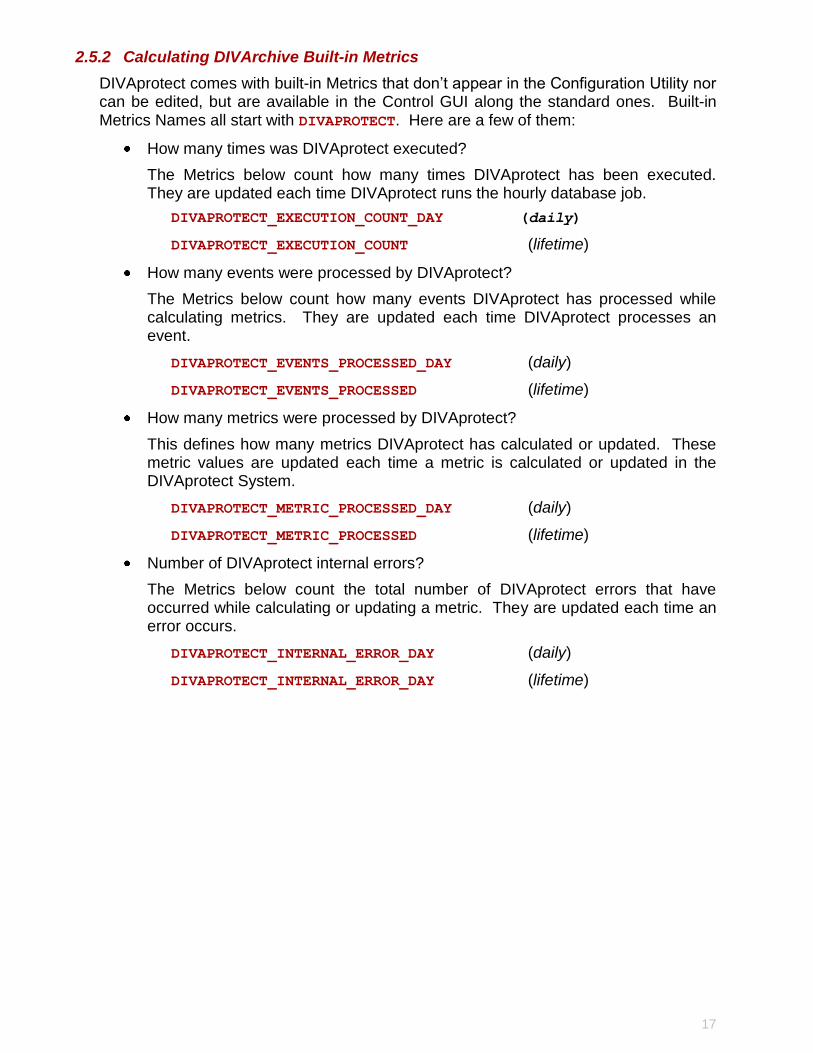
2.5.2 Calculating DIVArchive Built-in Metrics
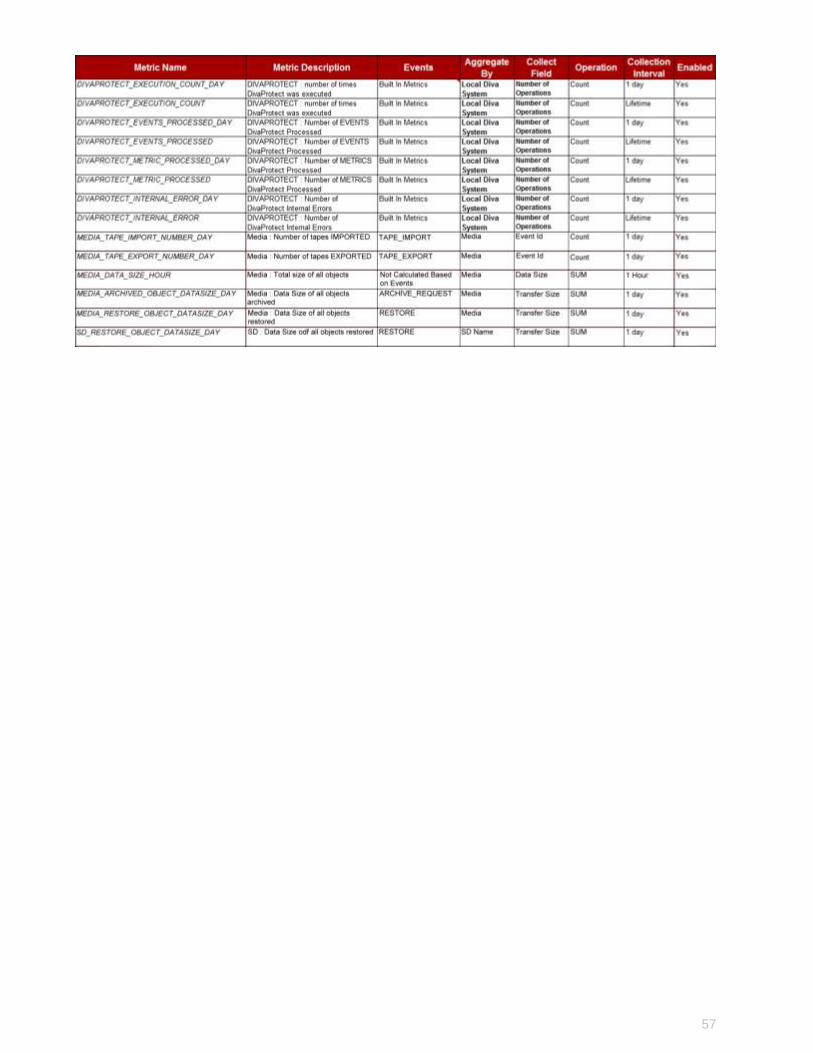
DIVAprotect comes with built-in Metrics that don’t appear in the Configuration Utility nor can be edited, but are available in the Control GUI along the standard ones. Built-in Metrics Names all start with DIVAPROTECT. Here are a few of them:
How many times was DIVAprotect executed?
The Metrics below count how many times DIVAprotect has been executed. They are updated each time DIVAprotect runs the hourly database job.
DIVAPROTECT_EXECUTION_COUNT_DAY (daily)
DIVAPROTECT_EXECUTION_COUNT (lifetime)
How many events were processed by DIVAprotect?
The Metrics below count how many events DIVAprotect has processed while calculating metrics. They are updated each time DIVAprotect processes an event.
DIVAPROTECT_EVENTS_PROCESSED_DAY (daily)
DIVAPROTECT_EVENTS_PROCESSED (lifetime)
How many metrics were processed by DIVAprotect?
This defines how many metrics DIVAprotect has calculated or updated. These metric values are updated each time a metric is calculated or updated in the DIVAprotect System.
DIVAPROTECT_METRIC_PROCESSED_DAY (daily)
DIVAPROTECT_METRIC_PROCESSED (lifetime)
Number of DIVAprotect internal errors?
The Metrics below count the total number of DIVAprotect errors that have occurred while calculating or updating a metric. They are updated each time an error occurs.
DIVAPROTECT_INTERNAL_ERROR_DAY (daily)
DIVAPROTECT_INTERNAL_ERROR_DAY (lifetime)
18
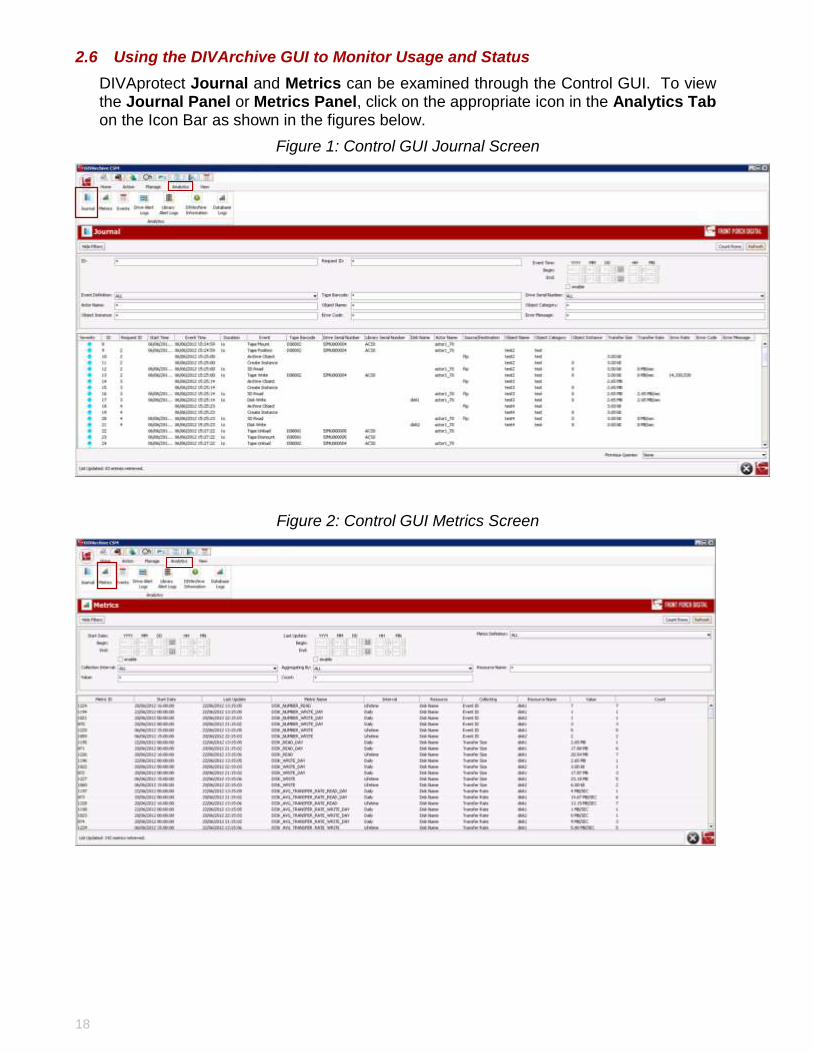
2.6 Using the DIVArchive GUI to Monitor Usage and Status
DIVAprotect Journal and Metrics can be examined through the Control GUI. To view the Journal Panel or Metrics Panel, click on the appropriate icon in the Analytics Tab on the Icon Bar as shown in the figures below.
Figure 1: Control GUI Journal Screen
Figure 2: Control GUI Metrics Screen
19
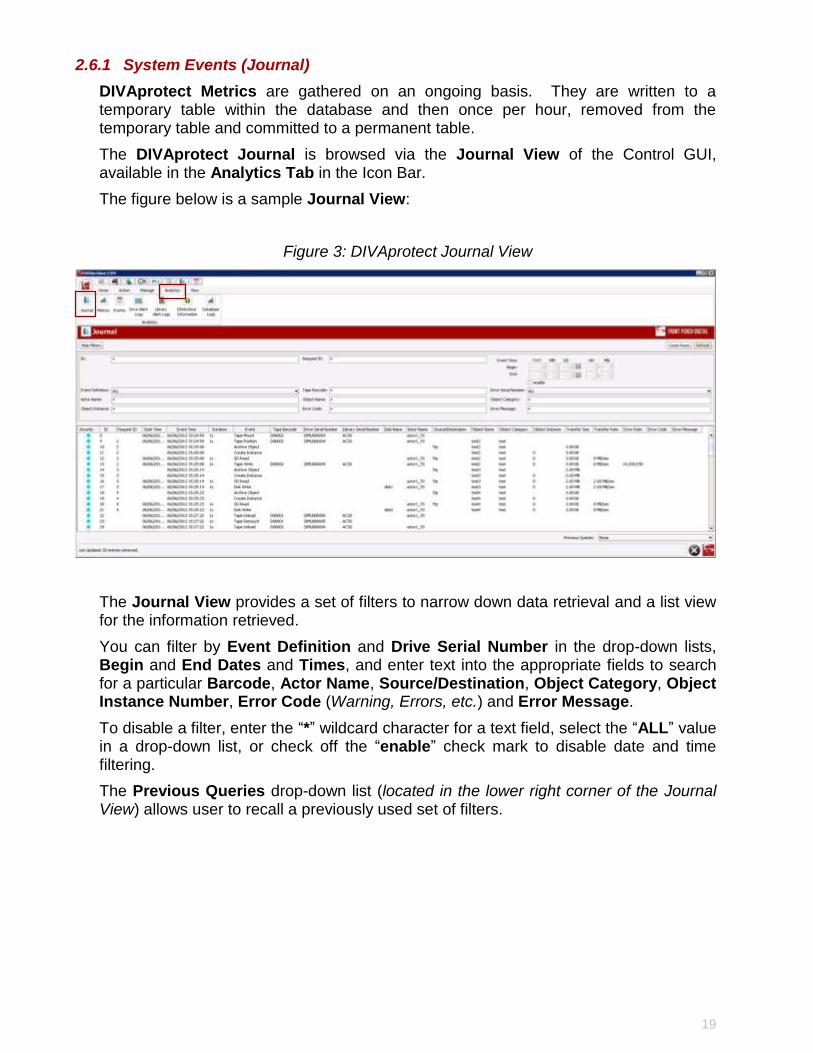
2.6.1 System Events (Journal)
DIVAprotect Metrics are gathered on an ongoing basis. They are written to a temporary table within the database and then once per hour, removed from the temporary table and committed to a permanent table.
The DIVAprotect Journal is browsed via the Journal View of the Control GUI, available in the Analytics Tab in the Icon Bar.
The figure below is a sample Journal View:
Figure 3: DIVAprotect Journal View
The Journal View provides a set of filters to narrow down data retrieval and a list view for the information retrieved.
You can filter by Event Definition and Drive Serial Number in the drop-down lists, Begin and End Dates and Times, and enter text into the appropriate fields to search for a particular Barcode, Actor Name, Source/Destination, Object Category, Object Instance Number, Error Code (Warning, Errors, etc.) and Error Message.
To disable a filter, enter the “*” wildcard character for a text field, select the “ALL” value in a drop-down list, or check off the “enable” check mark to disable date and time filtering.
The Previous Queries drop-down list (located in the lower right corner of the Journal View) allows user to recall a previously used set of filters.
20
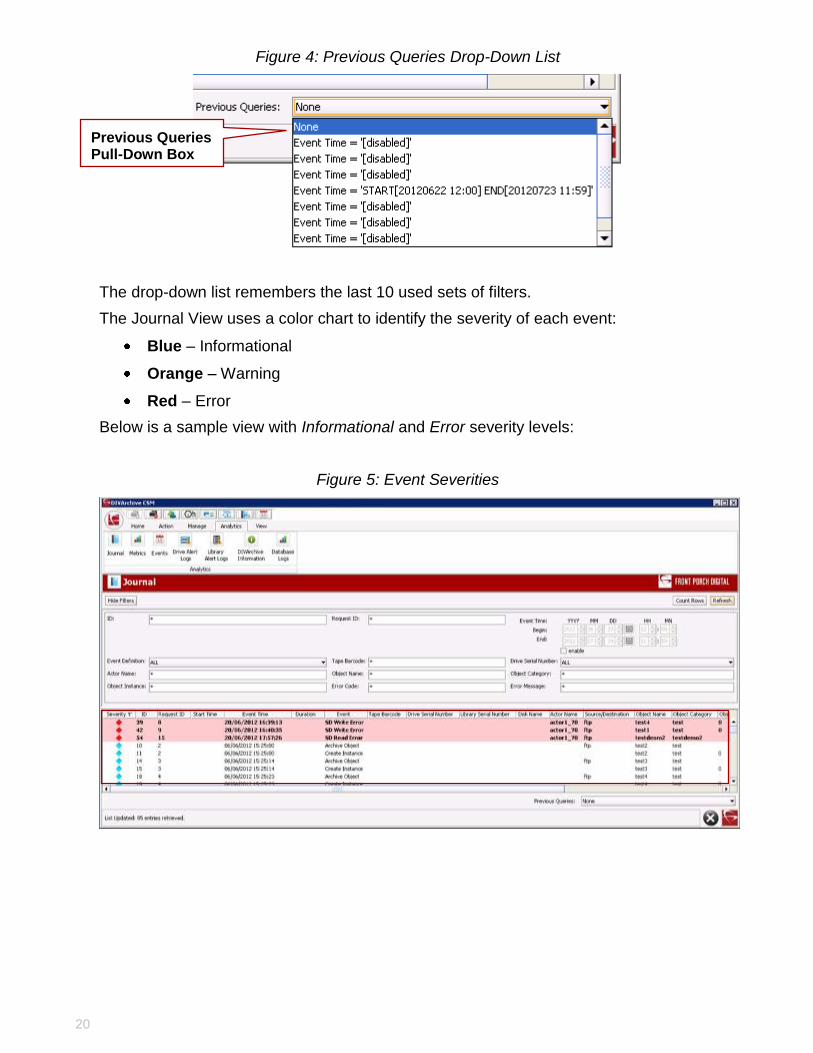
Figure 4: Previous Queries Drop-Down List
The drop-down list remembers the last 10 used sets of filters.
The Journal View uses a color chart to identify the severity of each event:
Blue – Informational
Orange – Warning
Red – Error
Below is a sample view with Informational and Error severity levels:
Figure 5: Event Severities
Previous Queries Pull-Down Box
21
The columns displayed in the Journal View are:
Severity – the severity of the event.
ID – the ID being used to internally identify the event.
Request ID – the DIVArchive Request ID that the event concerns.
Start Time – the time the event started.
Event Time – the time the event occurred.
Duration – the total duration of the event (in seconds).
Event – the type of event.
Tape Barcode – the barcode of the Tape that the event concerns.
Drive Serial Number – the serial number of the Drive that the event concerns.
Library Serial Number – the serial number of the Library that the event concerns.
Disk Name – the name of the Disk that the event concerns.
Actor Name – the name of the Actor that the event concerns.
Source/Destination – the name of the Source/Destination that the event concerns.
Object Name – the name of the Object that the event concerns.
Object Category – the category of the Object that the event concerns.
Object Instance – the instance number of the Object that the event concerns.
Transfer Size – the total data transfer size (in bytes) for the event.
Transfer Rate – the rate of transfer (in bytes) for the event.
Error Rate – the number of Errors per Gigabyte of data transferred. These errors are recovered automatically b the tape drive.
Error Code – the internal code of the error (when applicable) for the event.
Error Message – a standardized error message (when applicable) for the event.
The user can double-click an entry in the list to display its properties, as in the illustration below:
22
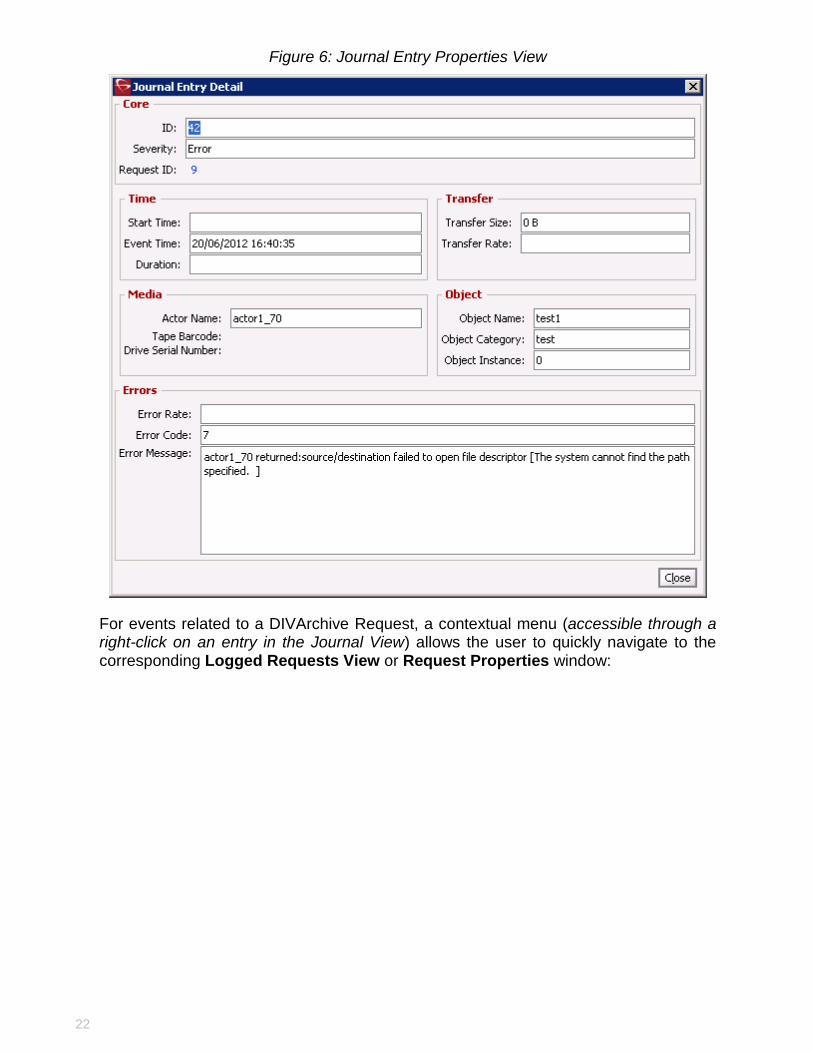
Figure 6: Journal Entry Properties View
For events related to a DIVArchive Request, a contextual menu (accessible through a right-click on an entry in the Journal View) allows the user to quickly navigate to the corresponding Logged Requests View or Request Properties window:
23
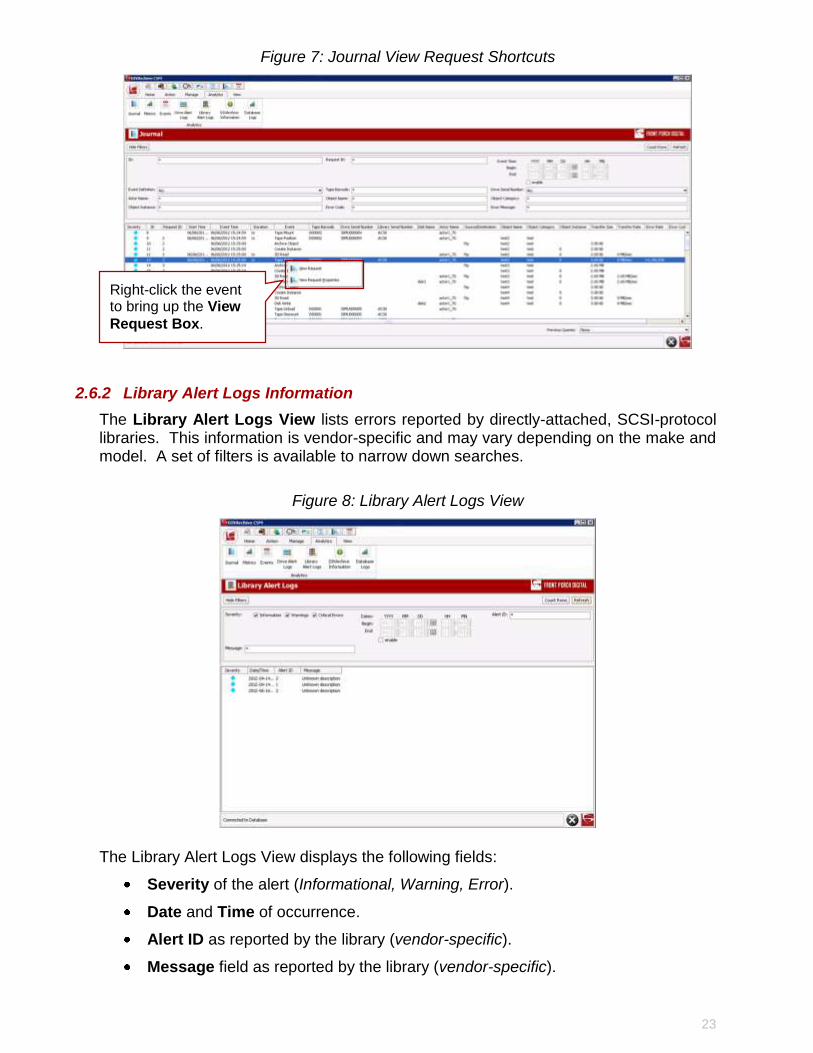
Figure 7: Journal View Request Shortcuts
2.6.2 Library Alert Logs Information
The Library Alert Logs View lists errors reported by directly-attached, SCSI-protocol libraries. This information is vendor-specific and may vary depending on the make and model. A set of filters is available to narrow down searches.
Figure 8: Library Alert Logs View
The Library Alert Logs View displays the following fields:
Severity of the alert (Informational, Warning, Error).
Date and Time of occurrence.
Alert ID as reported by the library (vendor-specific).
Message field as reported by the library (vendor-specific).
Right-click the event to bring up the View
Request Box.
24
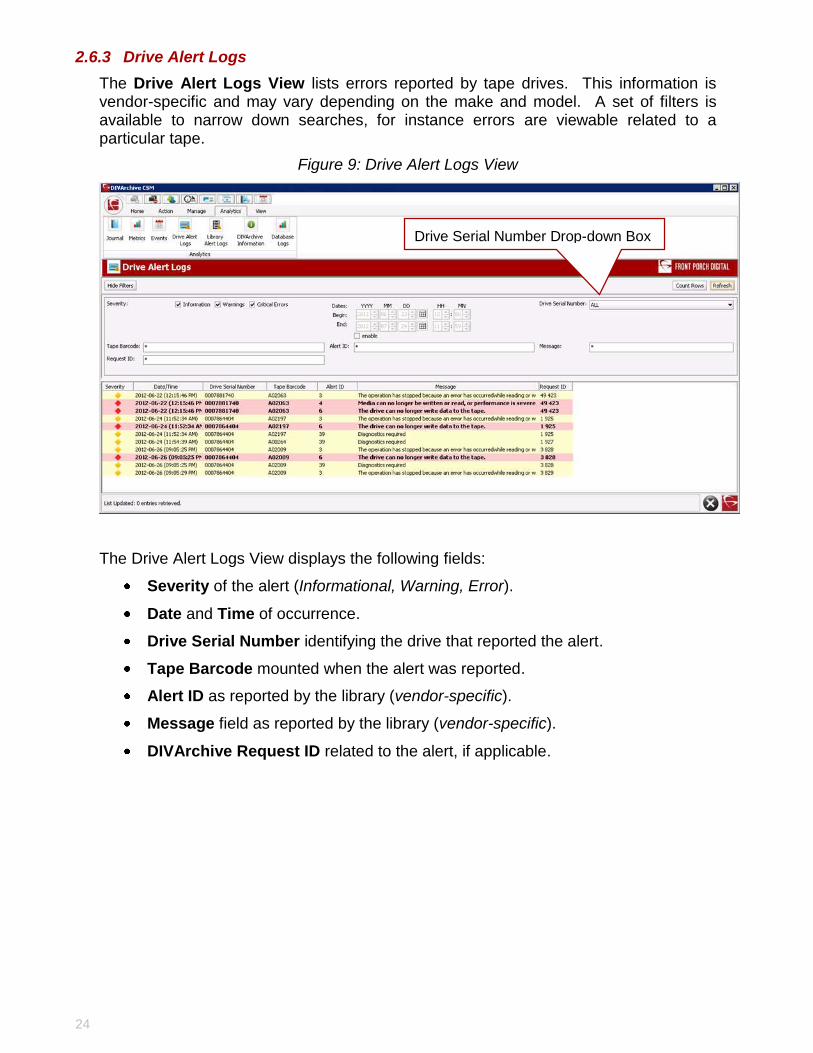
2.6.3 Drive Alert Logs
The Drive Alert Logs View lists errors reported by tape drives. This information is vendor-specific and may vary depending on the make and model. A set of filters is available to narrow down searches, for instance errors are viewable related to a particular tape.
Figure 9: Drive Alert Logs View
The Drive Alert Logs View displays the following fields:
Severity of the alert (Informational, Warning, Error).
Date and Time of occurrence.
Drive Serial Number identifying the drive that reported the alert.
Tape Barcode mounted when the alert was reported.
Alert ID as reported by the library (vendor-specific).
Message field as reported by the library (vendor-specific).
DIVArchive Request ID related to the alert, if applicable.
Drive Serial Number Drop-down Box
25
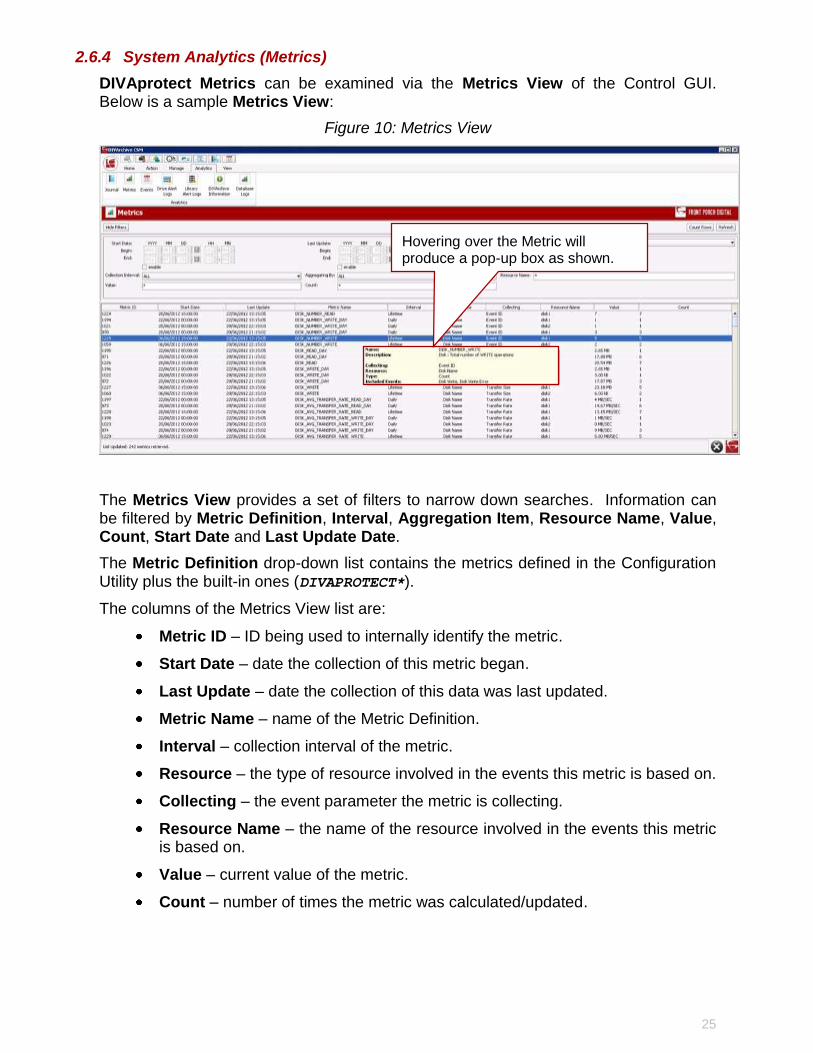
2.6.4 System Analytics (Metrics)
DIVAprotect Metrics can be examined via the Metrics View of the Control GUI. Below is a sample Metrics View:
Figure 10: Metrics View
The Metrics View provides a set of filters to narrow down searches. Information can be filtered by Metric Definition, Interval, Aggregation Item, Resource Name, Value, Count, Start Date and Last Update Date.
The Metric Definition drop-down list contains the metrics defined in the Configuration Utility plus the built-in ones (DIVAPROTECT*).
The columns of the Metrics View list are:
Metric ID – ID being used to internally identify the metric.
Start Date – date the collection of this metric began.
Last Update – date the collection of this data was last updated.
Metric Name – name of the Metric Definition.
Interval – collection interval of the metric.
Resource – the type of resource involved in the events this metric is based on.
Collecting – the event parameter the metric is collecting.
Resource Name – the name of the resource involved in the events this metric is based on.
Value – current value of the metric.
Count – number of times the metric was calculated/updated.
Hovering over the Metric will produce a pop-up box as shown.

26
Figure 11: Metric Reset Contextual Menu
Right-clicking on an entry will display a contextual menu allowing the user to reset the current value or hit count of the metric to zero. The user must be logged in the Control GUI as Administrator for these options to be enabled.
Double-clicking an entry in the list will display its properties as in the illustration below:
Figure 12: Metrics Entry Properties View
27
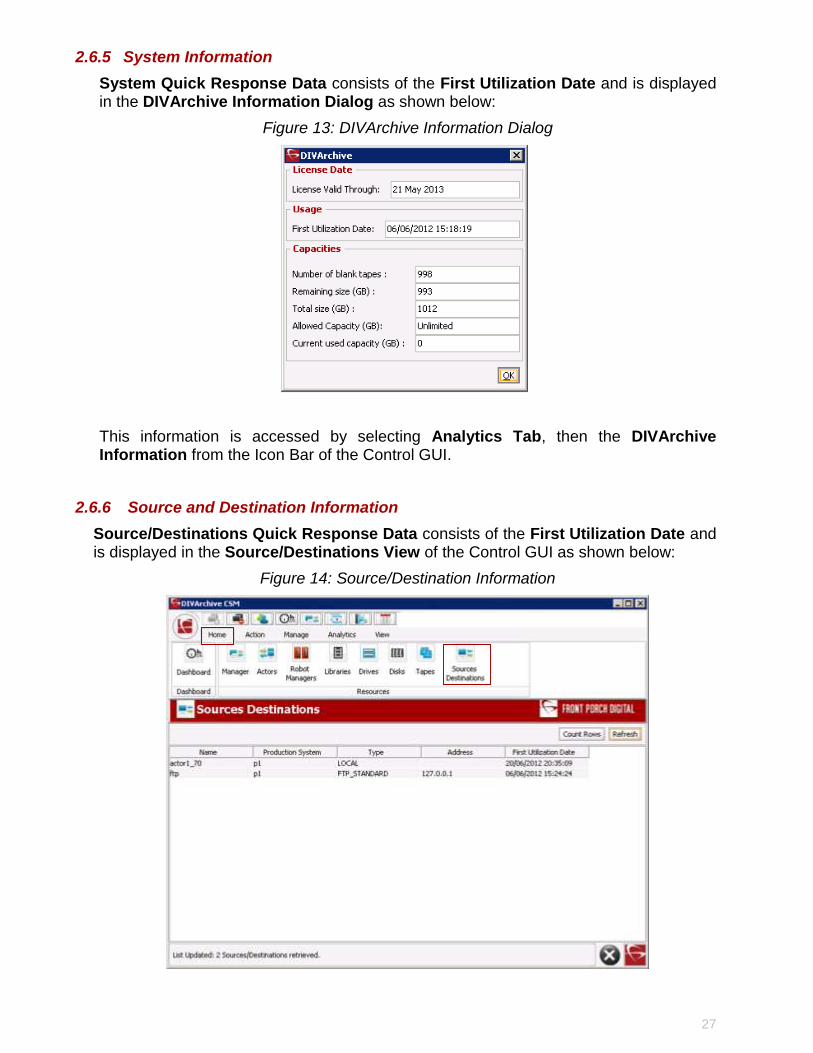
2.6.5 System Information
System Quick Response Data consists of the First Utilization Date and is displayed in the DIVArchive Information Dialog as shown below:
Figure 13: DIVArchive Information Dialog
This information is accessed by selecting Analytics Tab, then the DIVArchive Information from the Icon Bar of the Control GUI.
2.6.6 Source and Destination Information
Source/Destinations Quick Response Data consists of the First Utilization Date and is displayed in the Source/Destinations View of the Control GUI as shown below:
Figure 14: Source/Destination Information
28
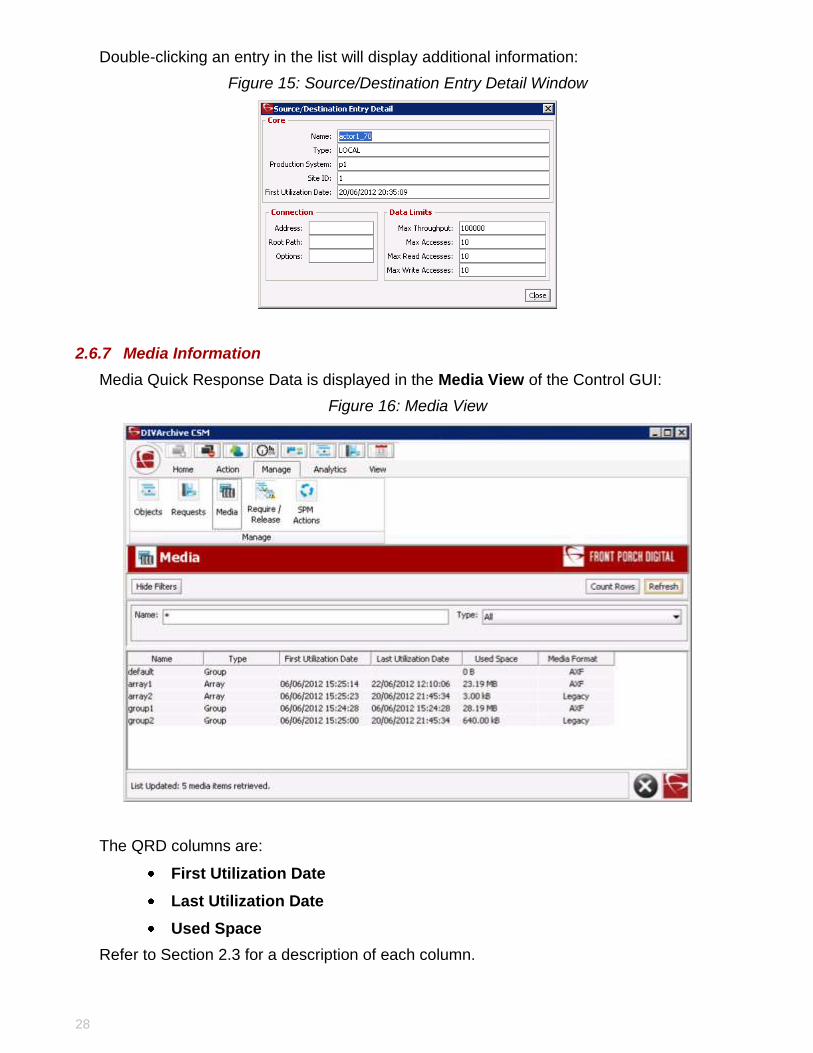
Double-clicking an entry in the list will display additional information:
Figure 15: Source/Destination Entry Detail Window
2.6.7 Media Information
Media Quick Response Data is displayed in the Media View of the Control GUI:
Figure 16: Media View
The QRD columns are:
First Utilization Date
Last Utilization Date
Used Space
Refer to Section 2.3 for a description of each column.
29
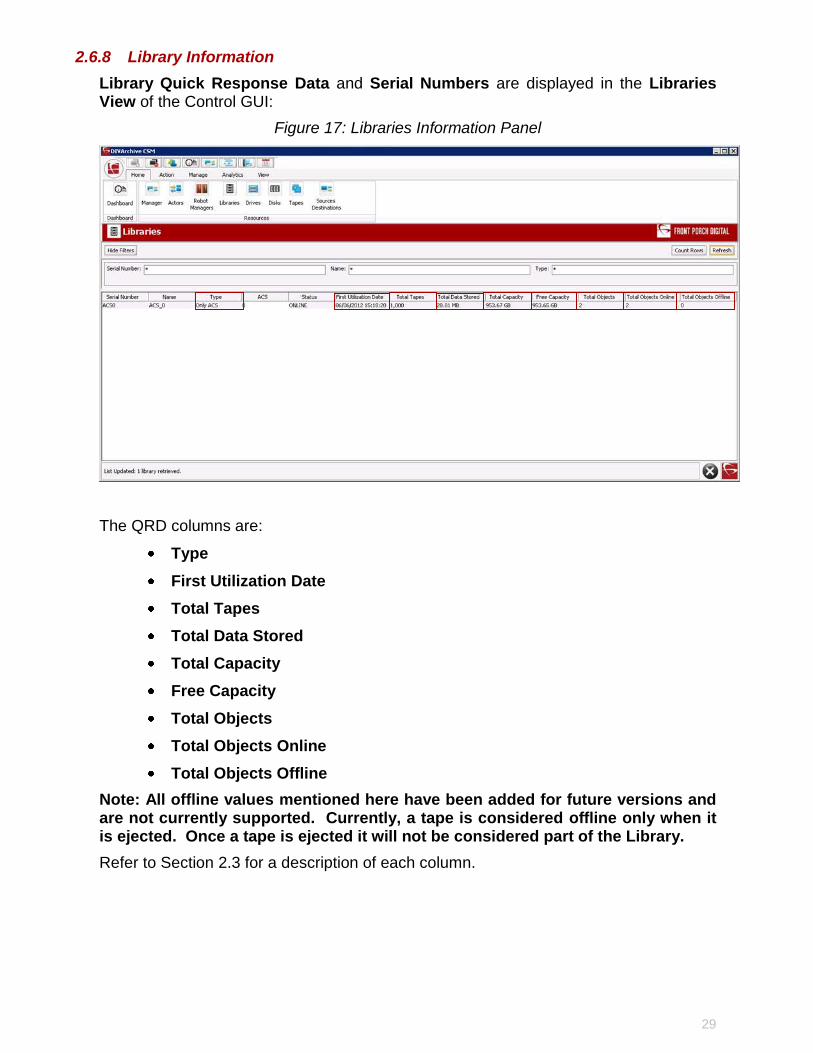
2.6.8 Library Information
Library Quick Response Data and Serial Numbers are displayed in the Libraries View of the Control GUI:
Figure 17: Libraries Information Panel
The QRD columns are:
Type
First Utilization Date
Total Tapes
Total Data Stored
Total Capacity
Free Capacity
Total Objects
Total Objects Online
Total Objects Offline
Note: All offline values mentioned here have been added for future versions and are not currently supported. Currently, a tape is considered offline only when it is ejected. Once a tape is ejected it will not be considered part of the Library.
Refer to Section 2.3 for a description of each column.
30
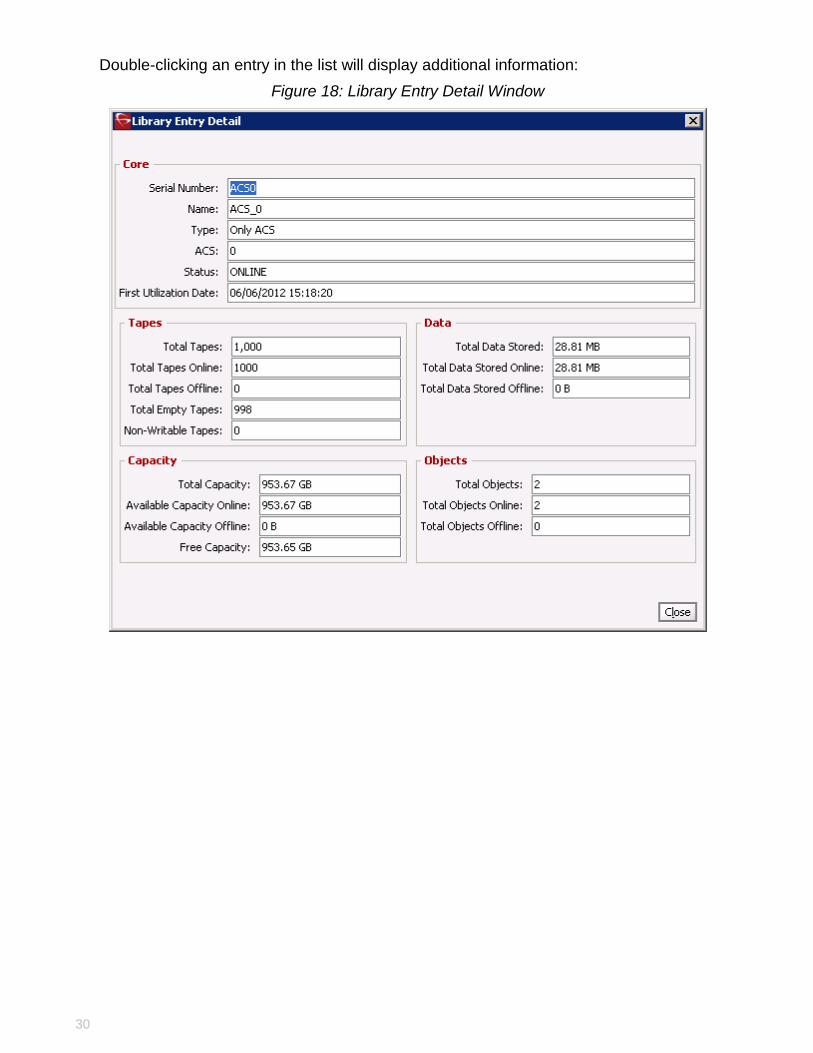
Double-clicking an entry in the list will display additional information:
Figure 18: Library Entry Detail Window
31
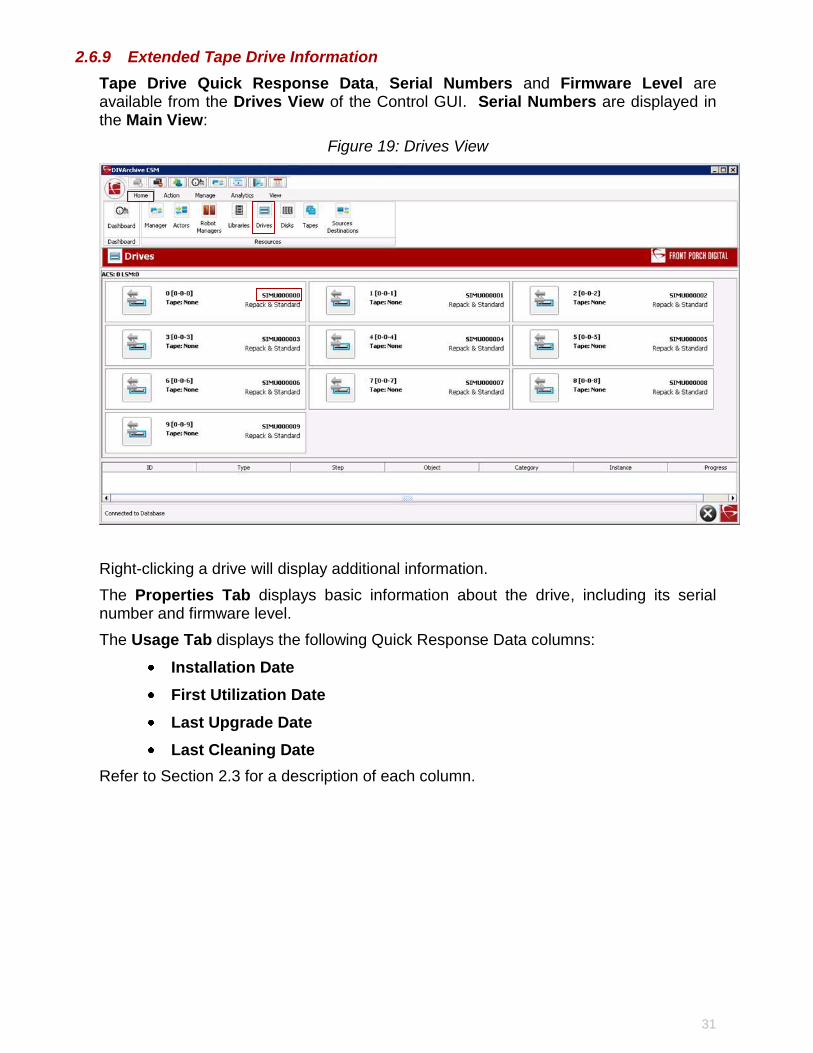
2.6.9 Extended Tape Drive Information
Tape Drive Quick Response Data, Serial Numbers and Firmware Level are available from the Drives View of the Control GUI. Serial Numbers are displayed in the Main View:
Figure 19: Drives View
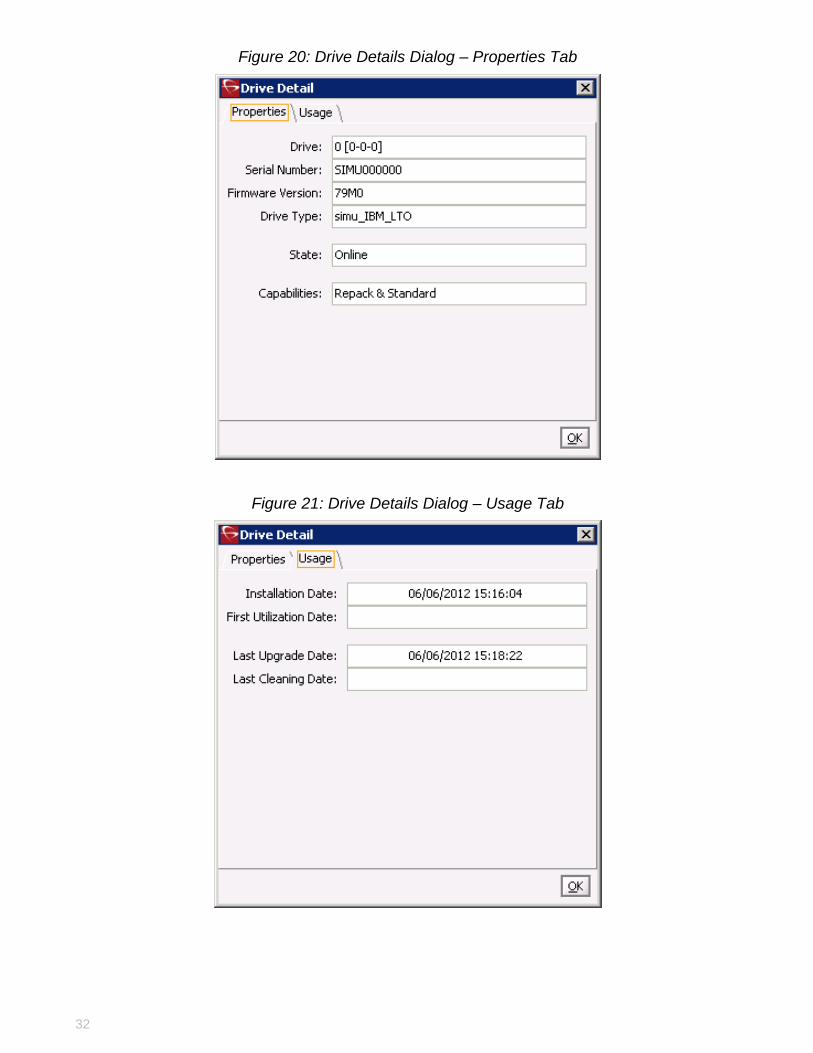
Right-clicking a drive will display additional information.
The Properties Tab displays basic information about the drive, including its serial number and firmware level.
The Usage Tab displays the following Quick Response Data columns:
Installation Date
First Utilization Date
Last Upgrade Date
Last Cleaning Date
Refer to Section 2.3 for a description of each column.
32
Figure 20: Drive Details Dialog – Properties Tab
Figure 21: Drive Details Dialog – Usage Tab
33
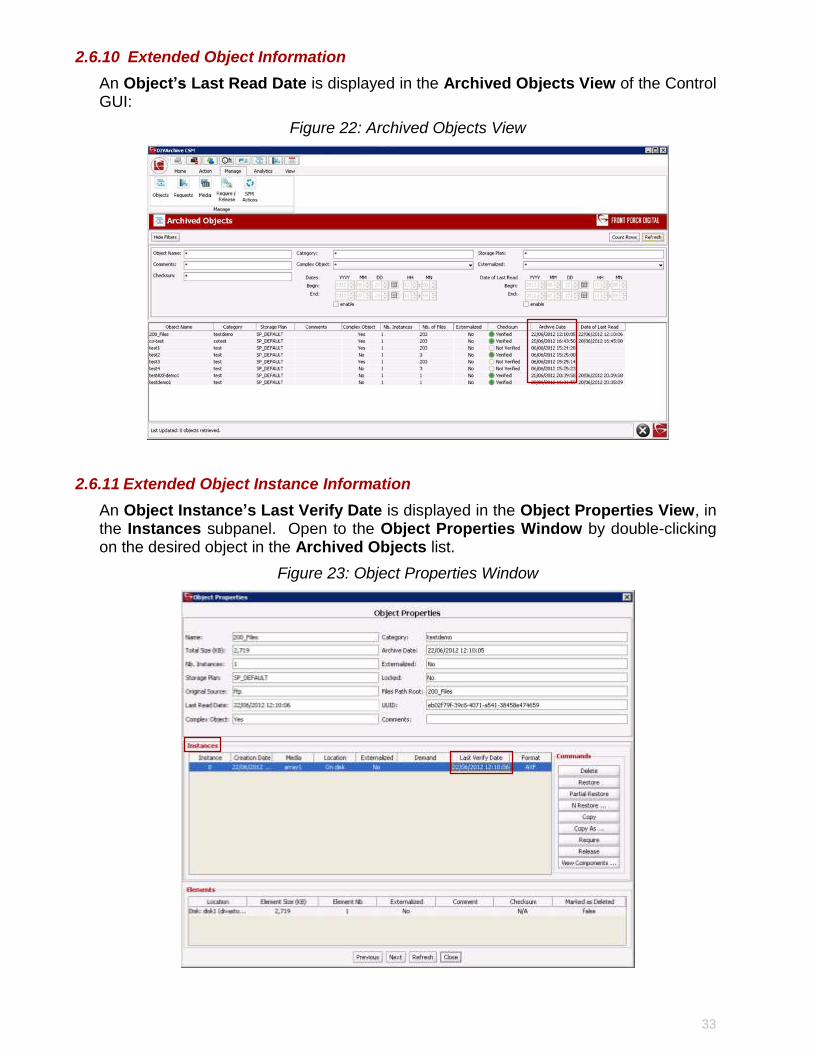
2.6.10 Extended Object Information
An Object’s Last Read Date is displayed in the Archived Objects View of the Control GUI:
Figure 22: Archived Objects View
2.6.11 Extended Object Instance Information
An Object Instance’s Last Verify Date is displayed in the Object Properties View, in the Instances subpanel. Open to the Object Properties Window by double-clicking on the desired object in the Archived Objects list.
Figure 23: Object Properties Window

34
2.6.12 Extended Disk Information
A Disk’s Quick Response Data is displayed in the Disks View of the Control GUI:
Figure 24: Disks View
The QRD columns are:
First Utilization Date
Last Access Date
Last Read Date
Last Write Date
Refer to Section 2.3 for a description of each column.
35
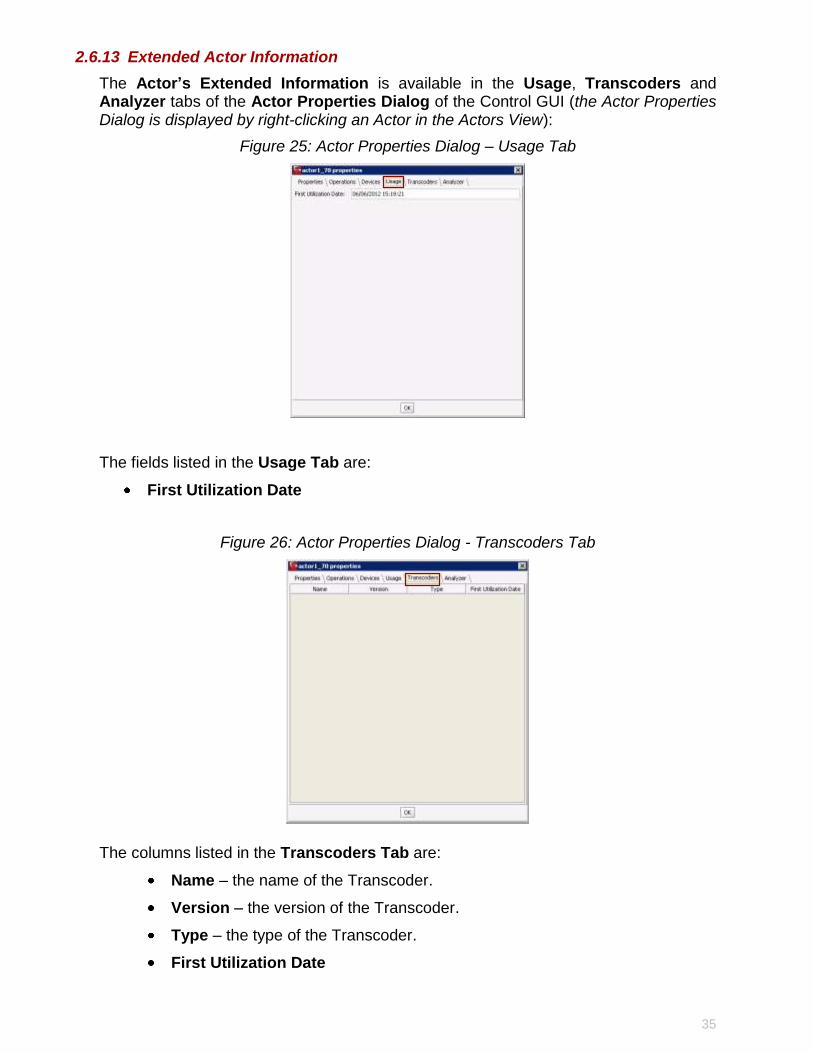
2.6.13 Extended Actor Information
The Actor’s Extended Information is available in the Usage, Transcoders and Analyzer tabs of the Actor Properties Dialog of the Control GUI (the Actor Properties Dialog is displayed by right-clicking an Actor in the Actors View):
Figure 25: Actor Properties Dialog – Usage Tab
The fields listed in the Usage Tab are:
First Utilization Date
Figure 26: Actor Properties Dialog - Transcoders Tab
The columns listed in the Transcoders Tab are:
Name – the name of the Transcoder.
Version – the version of the Transcoder.
Type – the type of the Transcoder.
First Utilization Date
36
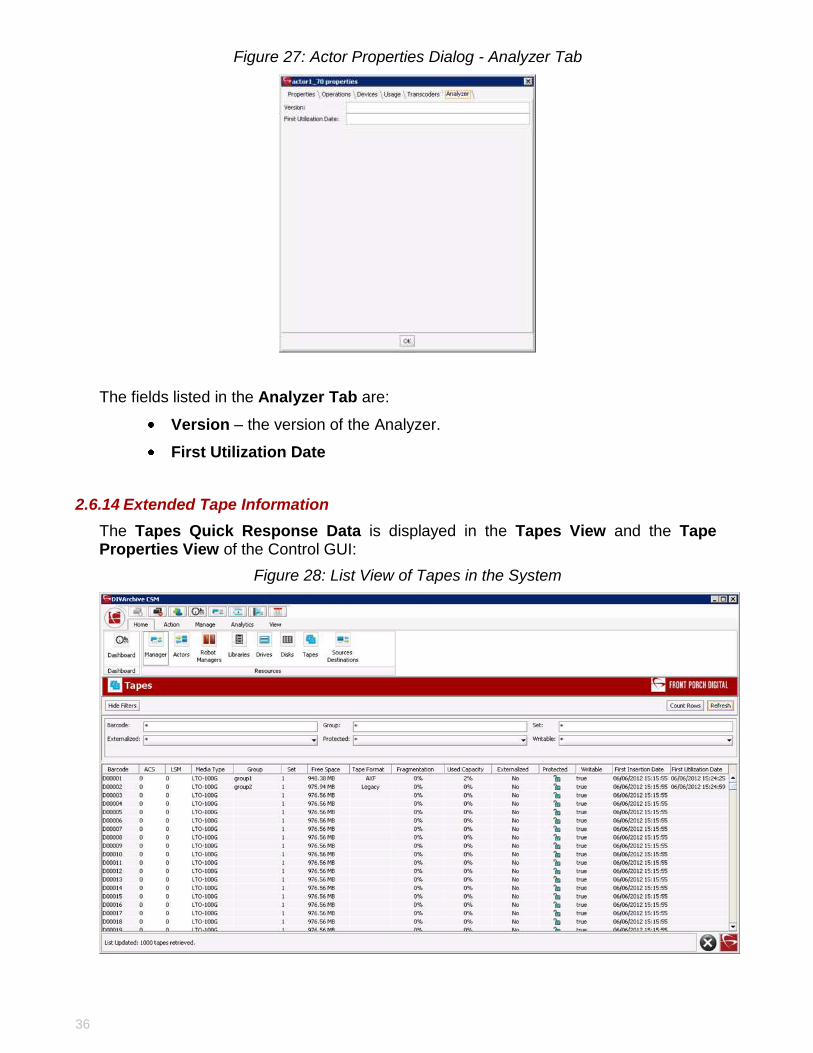
Figure 27: Actor Properties Dialog - Analyzer Tab
The fields listed in the Analyzer Tab are:
Version – the version of the Analyzer.
First Utilization Date
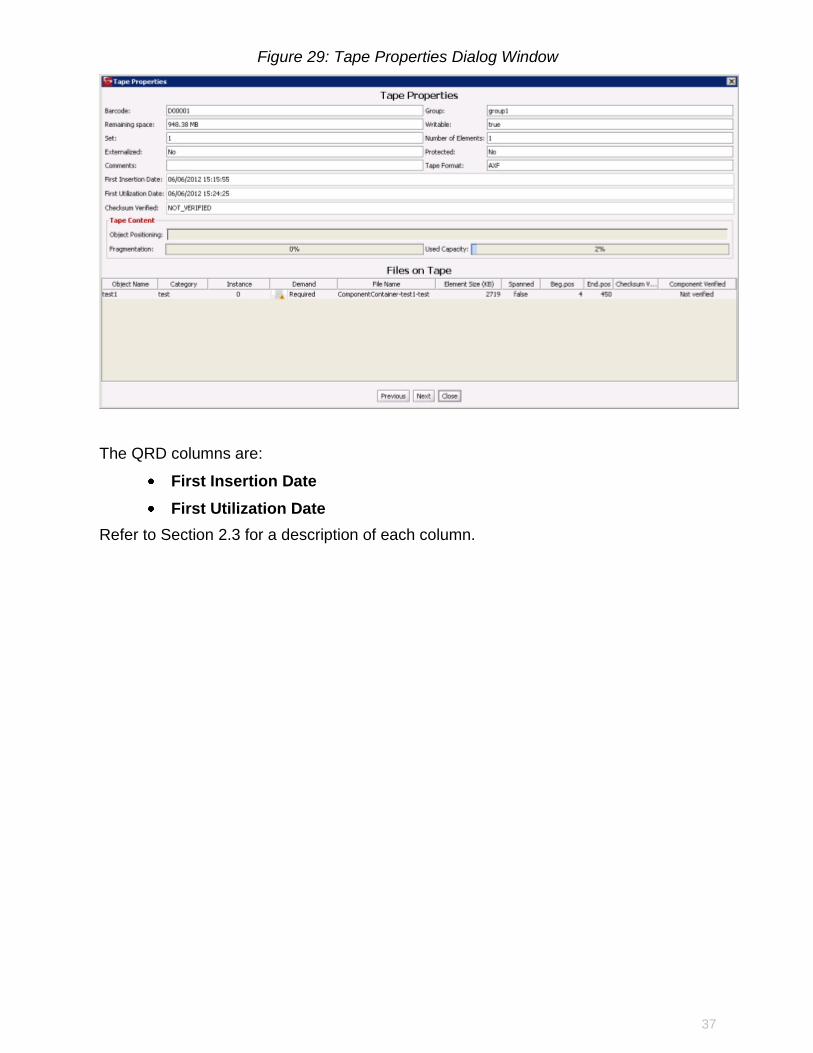
2.6.14 Extended Tape Information
The Tapes Quick Response Data is displayed in the Tapes View and the Tape Properties View of the Control GUI:
Figure 28: List View of Tapes in the System
37
Figure 29: Tape Properties Dialog Window
The QRD columns are:
First Insertion Date
First Utilization Date
Refer to Section 2.3 for a description of each column.
38
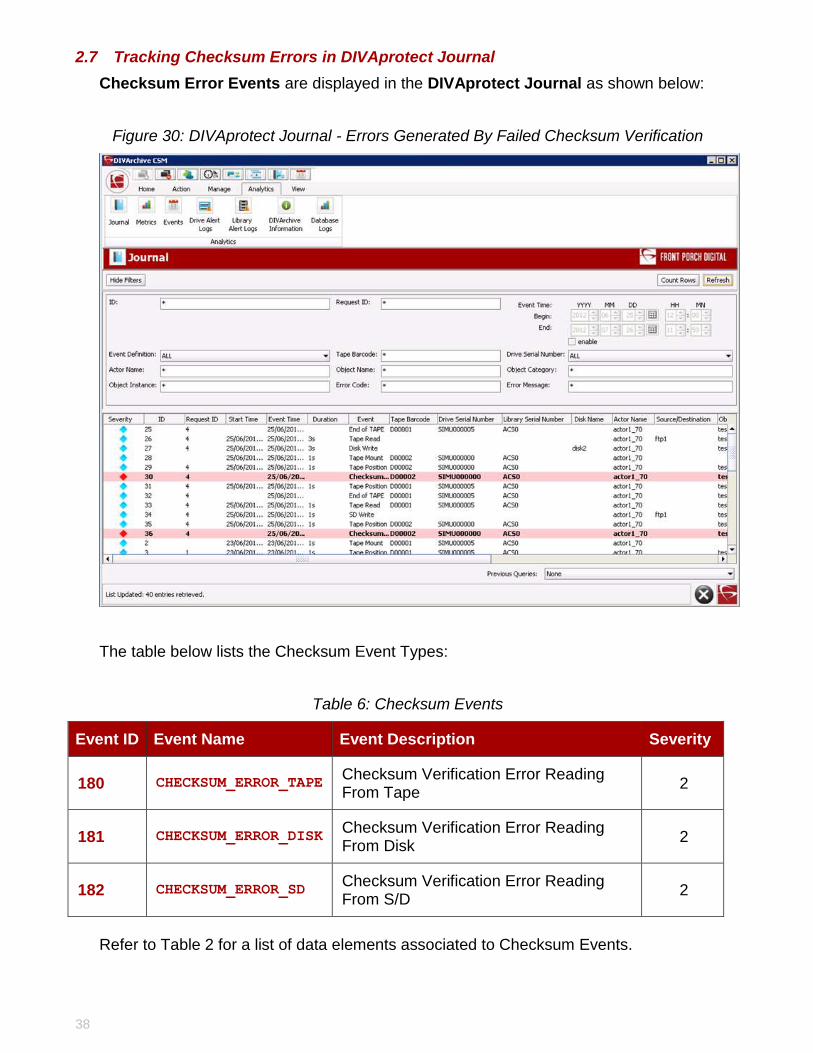
2.7 Tracking Checksum Errors in DIVAprotect Journal
Checksum Error Events are displayed in the DIVAprotect Journal as shown below:
Figure 30: DIVAprotect Journal - Errors Generated By Failed Checksum Verification
The table below lists the Checksum Event Types:
Table 6: Checksum Events
Event ID Event Name Event Description Severity
180 CHECKSUM_ERROR_TAPE Checksum Verification Error Reading From Tape
2
181 CHECKSUM_ERROR_DISK Checksum Verification Error Reading From Disk
2
182 CHECKSUM_ERROR_SD Checksum Verification Error Reading From S/D
2
Refer to Table 2 for a list of data elements associated to Checksum Events.
39
3 DIVAprotect Configuration
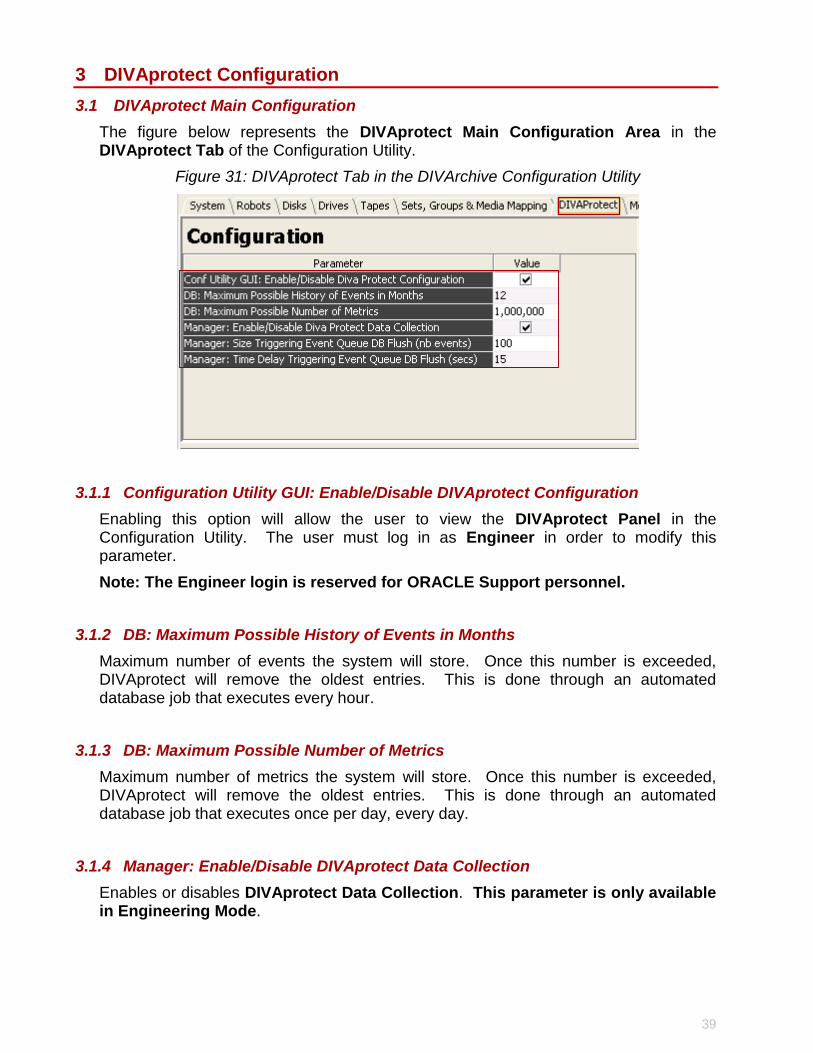
3.1 DIVAprotect Main Configuration
The figure below represents the DIVAprotect Main Configuration Area in the DIVAprotect Tab of the Configuration Utility.
Figure 31: DIVAprotect Tab in the DIVArchive Configuration Utility
3.1.1 Configuration Utility GUI: Enable/Disable DIVAprotect Configuration
Enabling this option will allow the user to view the DIVAprotect Panel in the Configuration Utility. The user must log in as Engineer in order to modify this parameter.
Note: The Engineer login is reserved for ORACLE Support personnel.
3.1.2 DB: Maximum Possible History of Events in Months
Maximum number of events the system will store. Once this number is exceeded, DIVAprotect will remove the oldest entries. This is done through an automated database job that executes every hour.
3.1.3 DB: Maximum Possible Number of Metrics
Maximum number of metrics the system will store. Once this number is exceeded, DIVAprotect will remove the oldest entries. This is done through an automated database job that executes once per day, every day.
3.1.4 Manager: Enable/Disable DIVAprotect Data Collection
Enables or disables DIVAprotect Data Collection. This parameter is only available in Engineering Mode.

40
3.1.5 Manager: Size Triggering Event Queue DB flush (nb events)
Number of events collected in memory before saving them to the database.
3.1.6 Manager: Time Delay Triggering Event Queue DB flush (seconds)
This is the maximum interval for saving events to the database. If this interval is reached before the Size Triggering parameter is reached, the events will be saved to the database no matter how many have been collected.
3.1.7 Configuration Utility DIVAprotect Items
The DIVArchive Configuration Utility includes configuration elements specific to DIVAprotect. They are detailed in the following sections.
3.1.8 Tape Drives
The Drive Edit Dialog allows the user to edit the serial number of a drive. This is useful if this information wasn’t retrieved, or entered improperly, during a Sync DB process. The firmware of the drive is also displayed in a non-editable field (this information is obtained from the Actors when they scan for tape drive devices).
Figure 32: Edit Drives Entry Dialog
41
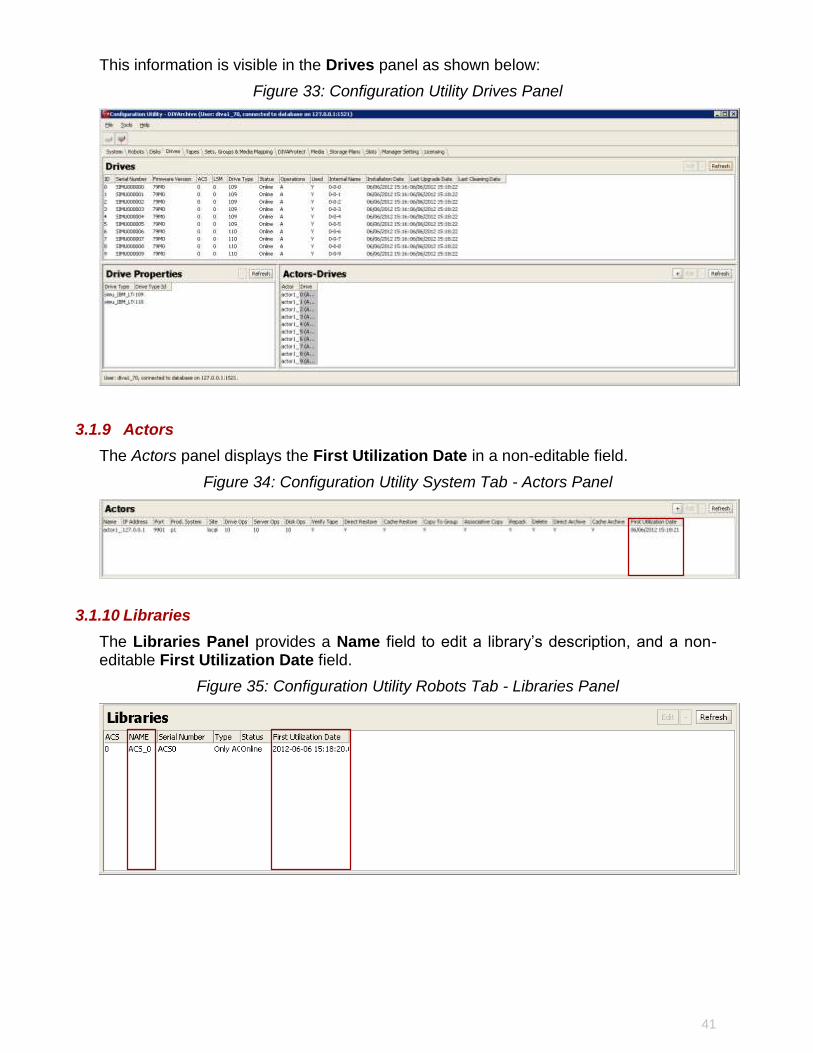
This information is visible in the Drives panel as shown below:
Figure 33: Configuration Utility Drives Panel
3.1.9 Actors
The Actors panel displays the First Utilization Date in a non-editable field.
Figure 34: Configuration Utility System Tab - Actors Panel
3.1.10 Libraries
The Libraries Panel provides a Name field to edit a library’s description, and a non-editable First Utilization Date field.
Figure 35: Configuration Utility Robots Tab - Libraries Panel
42
3.2 DIVAprotect Events and Metrics Configuration
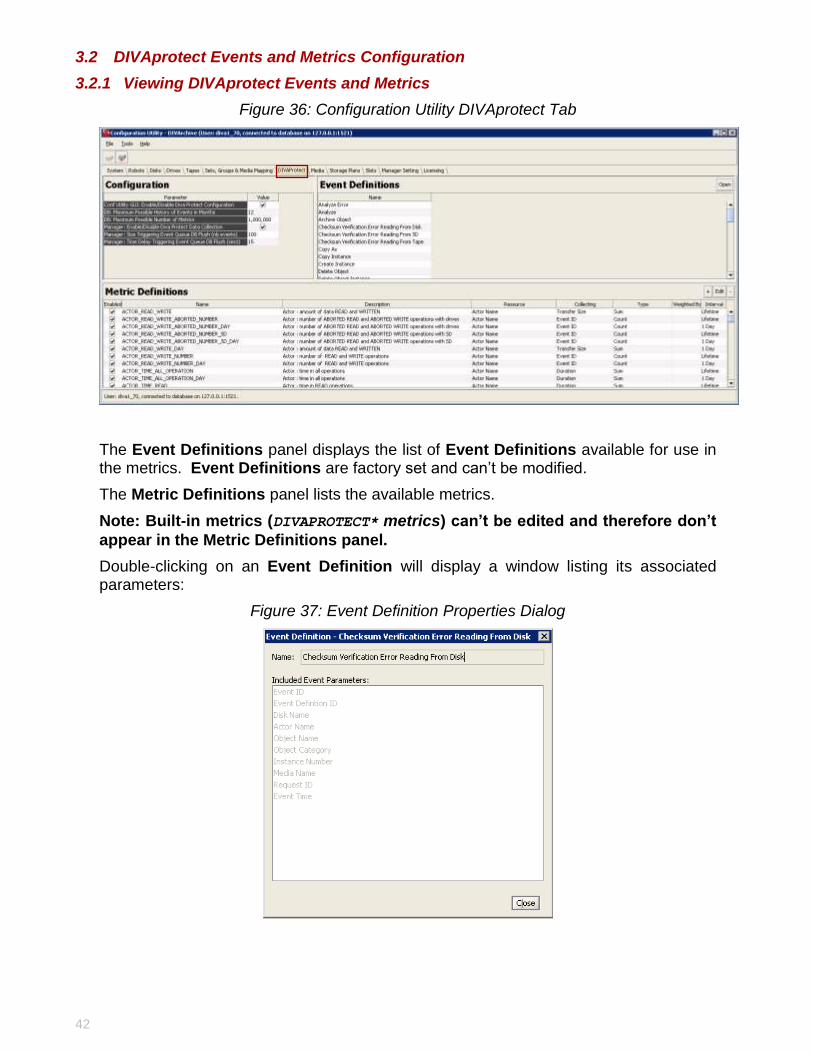
3.2.1 Viewing DIVAprotect Events and Metrics
Figure 36: Configuration Utility DIVAprotect Tab
The Event Definitions panel displays the list of Event Definitions available for use in the metrics. Event Definitions are factory set and can’t be modified.
The Metric Definitions panel lists the available metrics.
Note: Built-in metrics (DIVAPROTECT* metrics) can’t be edited and therefore don’t
appear in the Metric Definitions panel.
Double-clicking on an Event Definition will display a window listing its associated parameters:
Figure 37: Event Definition Properties Dialog
43
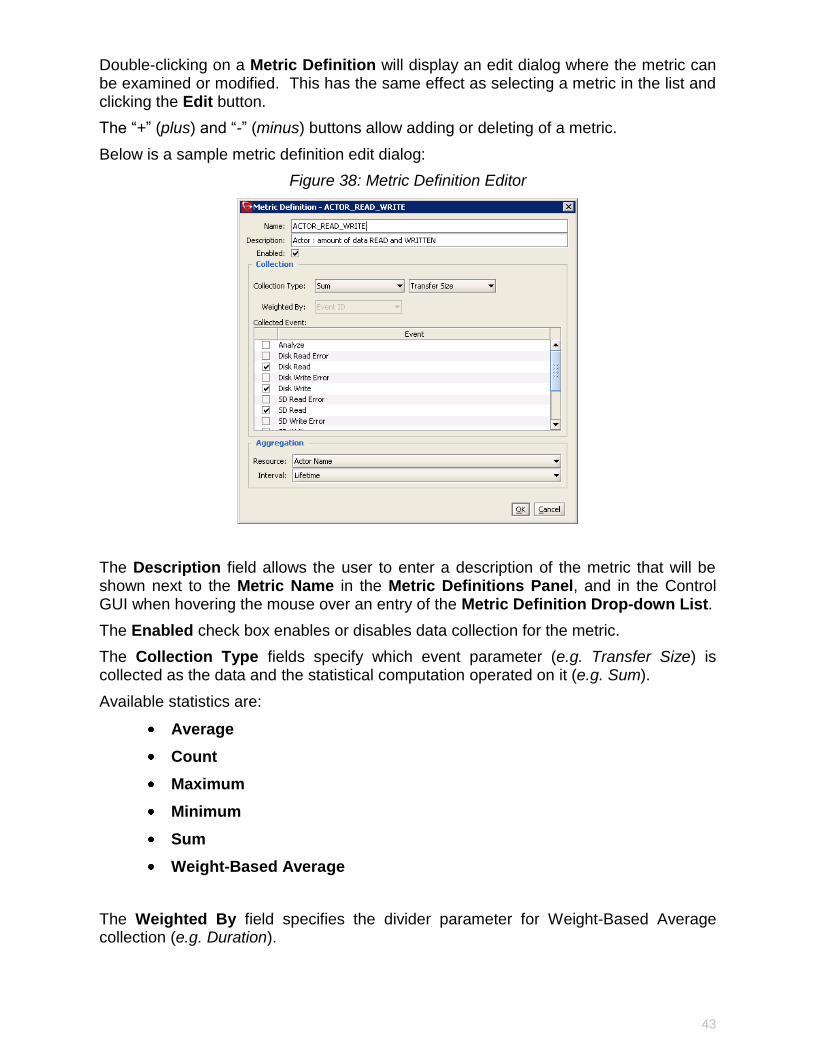
Double-clicking on a Metric Definition will display an edit dialog where the metric can be examined or modified. This has the same effect as selecting a metric in the list and clicking the Edit button.
The “+” (plus) and “-” (minus) buttons allow adding or deleting of a metric.
Below is a sample metric definition edit dialog:
Figure 38: Metric Definition Editor
The Description field allows the user to enter a description of the metric that will be shown next to the Metric Name in the Metric Definitions Panel, and in the Control GUI when hovering the mouse over an entry of the Metric Definition Drop-down List.
The Enabled check box enables or disables data collection for the metric.
The Collection Type fields specify which event parameter (e.g. Transfer Size) is collected as the data and the statistical computation operated on it (e.g. Sum).
Available statistics are:
Average
Count
Maximum
Minimum
Sum
Weight-Based Average
The Weighted By field specifies the divider parameter for Weight-Based Average collection (e.g. Duration).
44
The Collected Event list specifies the events from which the collected event parameter is retrieved. The list will only display event types suitable for the parameter specified in the Collection Type second field. Event Types that have no such parameter attached will be absent from the listing.
The Resource Pull-down Box specifies which resource is used to break down the data. For instance, if Drive Serial Number is selected, separate metrics will be generated for each drive.
The Interval specifies the interval for metric calculation. For instance, selecting “1 Day” will generate a metric each day (if corresponding data is available). The metric calculation will be based on the associated events that occurred in the last 24 hours.
3.2.2 Default Events and Metrics Configuration
Refer to the APPENDIX for factory-set Events and Metrics.
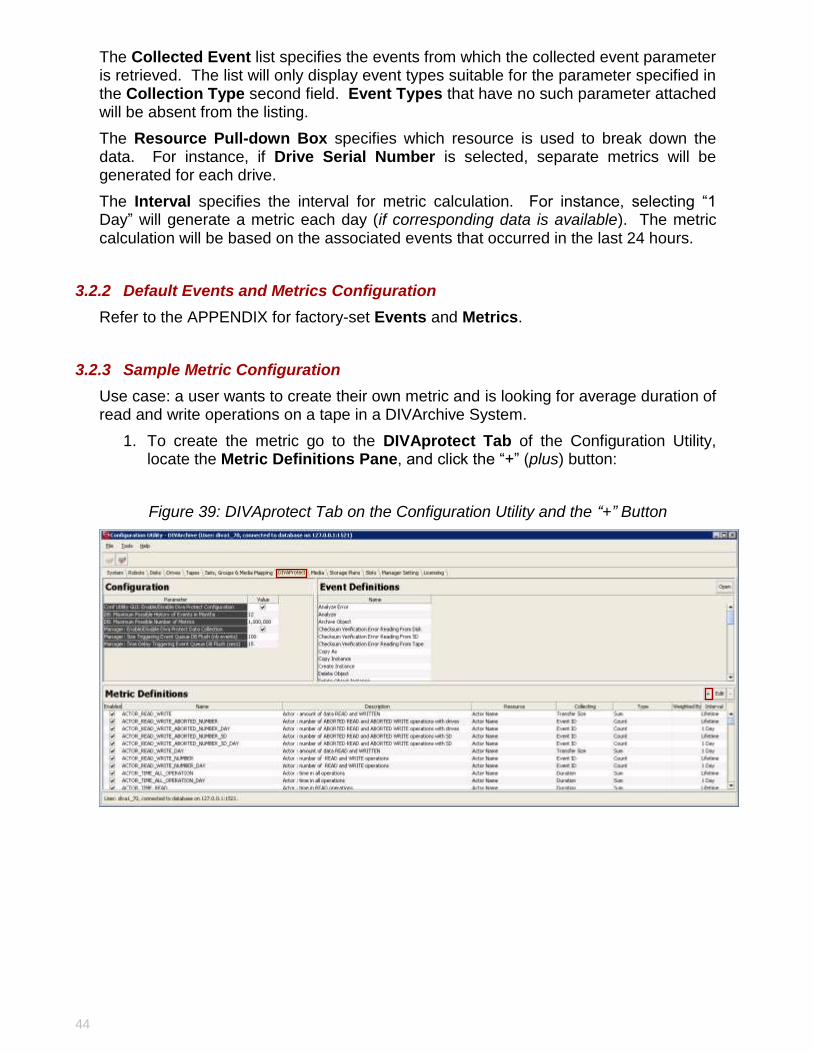
3.2.3 Sample Metric Configuration
Use case: a user wants to create their own metric and is looking for average duration of read and write operations on a tape in a DIVArchive System.
1. To create the metric go to the DIVAprotect Tab of the Configuration Utility, locate the Metric Definitions Pane, and click the “+” (plus) button:
Figure 39: DIVAprotect Tab on the Configuration Utility and the “+” Button
45
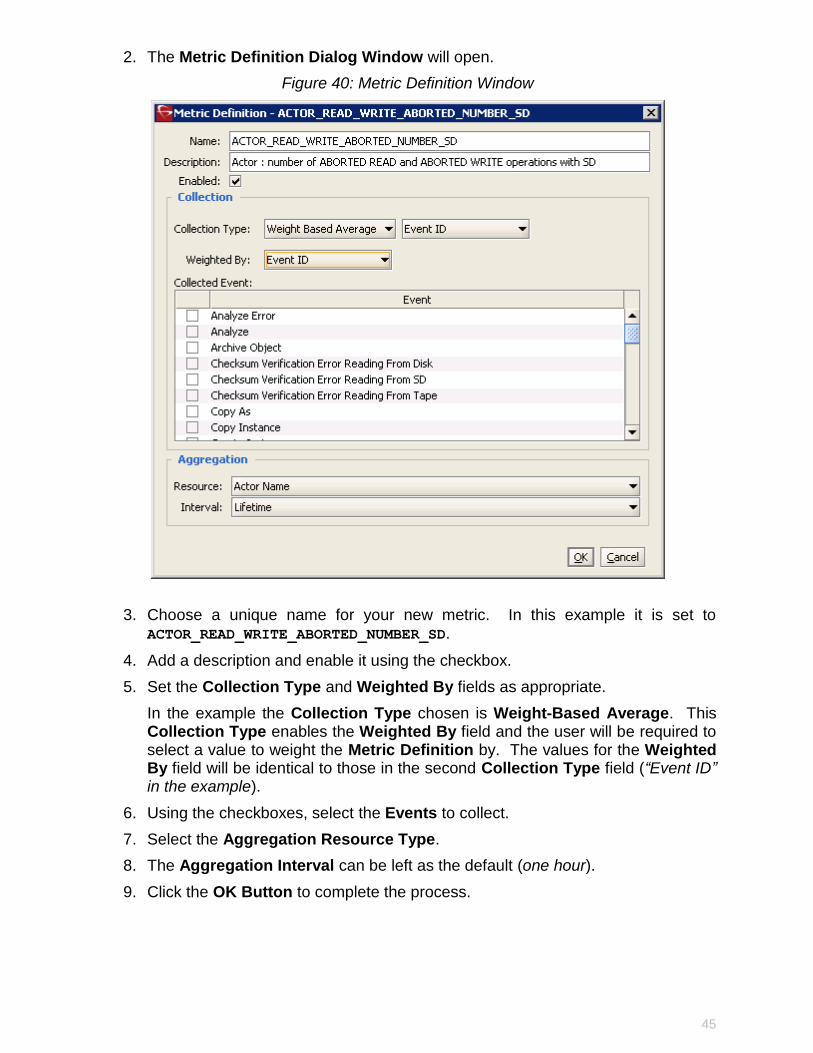
2. The Metric Definition Dialog Window will open.
Figure 40: Metric Definition Window
3. Choose a unique name for your new metric. In this example it is set to
ACTOR_READ_WRITE_ABORTED_NUMBER_SD.
4. Add a description and enable it using the checkbox.
5. Set the Collection Type and Weighted By fields as appropriate.
In the example the Collection Type chosen is Weight-Based Average. This Collection Type enables the Weighted By field and the user will be required to select a value to weight the Metric Definition by. The values for the Weighted By field will be identical to those in the second Collection Type field (“Event ID” in the example).
6. Using the checkboxes, select the Events to collect.
7. Select the Aggregation Resource Type.
8. The Aggregation Interval can be left as the default (one hour).
9. Click the OK Button to complete the process.
46
4 Frequently Asked Questions and Troubleshooting
4.1 How often are metrics updated?
Data Metrics are calculated and updated every hour through an automated database job that runs in the background.
4.2 How do I install DIVAprotect with my fresh installation of DIVArchive?
It is installed automatically with DIVArchive.
4.3 Can I choose NOT to install DIVAprotect?
No. DIVAprotect is a mandatory subsystem built into DIVArchive. However, you can disable DIVAprotect data collection and computation after the system has been installed.
4.4 Can I disable DIVAprotect?
Yes. It is possible to disable DIVAprotect functionality by proper configuration. See 3.1.4 for more details.
4.5 How do I access the system in Engineering Mode?
Please contact Oracle Support to access the system in Engineering Mode. Engineering Mode is accessible for Oracle Support Personnel only to avoid accidental misconfiguration of the system, which could possibly result in degradation of DIVArchive operations.
47
APPENDIX
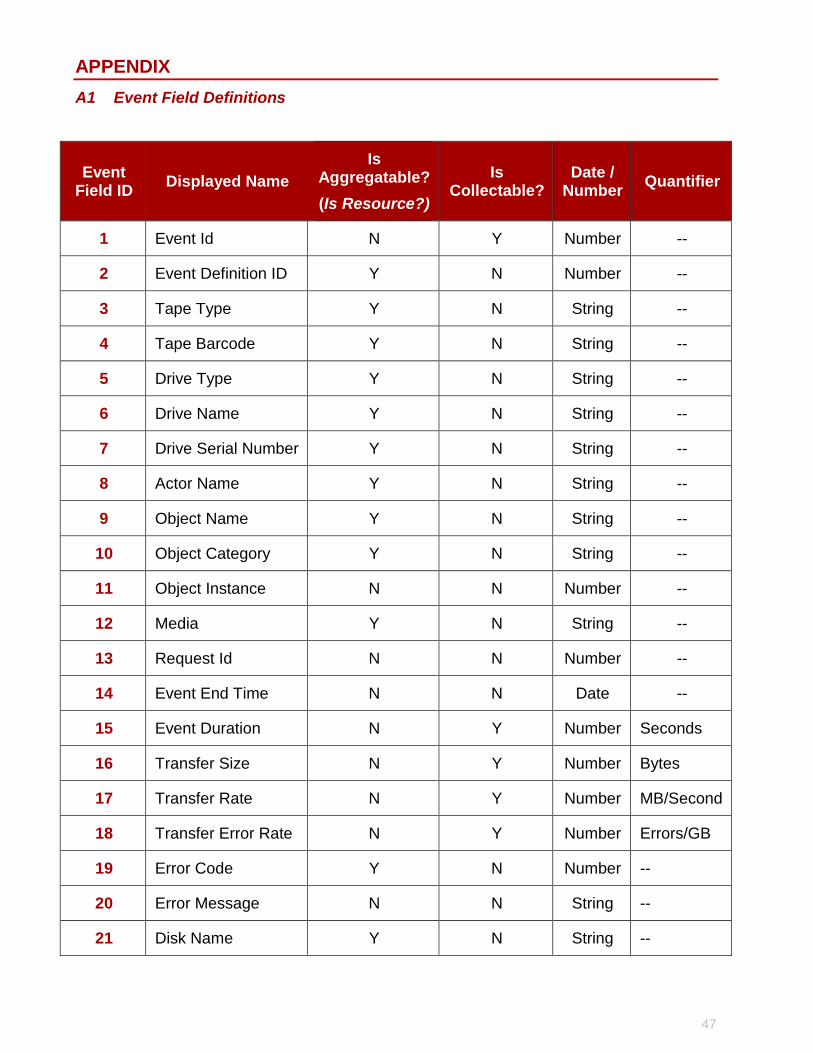
A1 Event Field Definitions
Event Field ID
Displayed Name
Is Aggregatable?
(Is Resource?)
Is Collectable?
Date / Number
Quantifier
1 Event Id N Y Number --
2 Event Definition ID Y N Number --
3 Tape Type Y N String --
4 Tape Barcode Y N String --
5 Drive Type Y N String --
6 Drive Name Y N String --
7 Drive Serial Number Y N String --
8 Actor Name Y N String --
9 Object Name Y N String --
10 Object Category Y N String --
11 Object Instance N N Number --
12 Media Y N String --
13 Request Id N N Number --
14 Event End Time N N Date --
15 Event Duration N Y Number Seconds
16 Transfer Size N Y Number Bytes
17 Transfer Rate N Y Number MB/Second
18 Transfer Error Rate N Y Number Errors/GB
19 Error Code Y N Number --
20 Error Message N N String --
21 Disk Name Y N String --
48
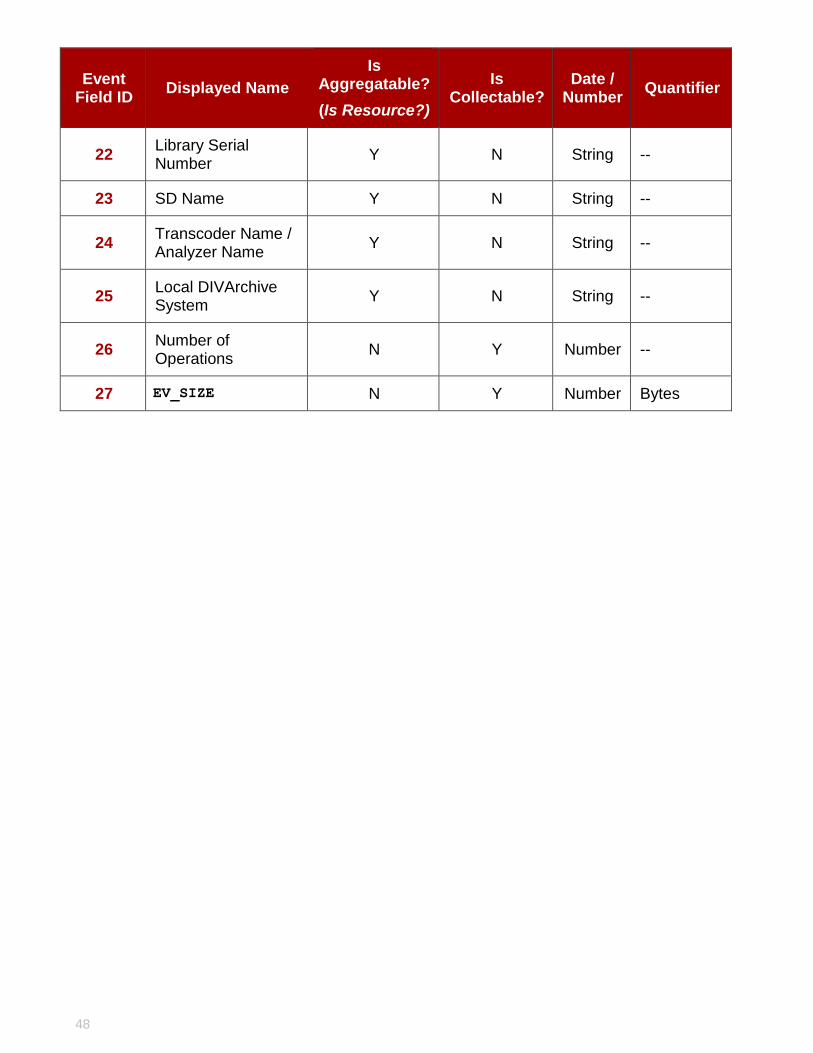
Event Field ID
Displayed Name
Is Aggregatable?
(Is Resource?)
Is Collectable?
Date / Number
Quantifier
22 Library Serial Number
Y N String --
23 SD Name Y N String --
24 Transcoder Name / Analyzer Name
Y N String --
25 Local DIVArchive System
Y N String --
26 Number of Operations
N Y Number --
27 EV_SIZE N Y Number Bytes
49
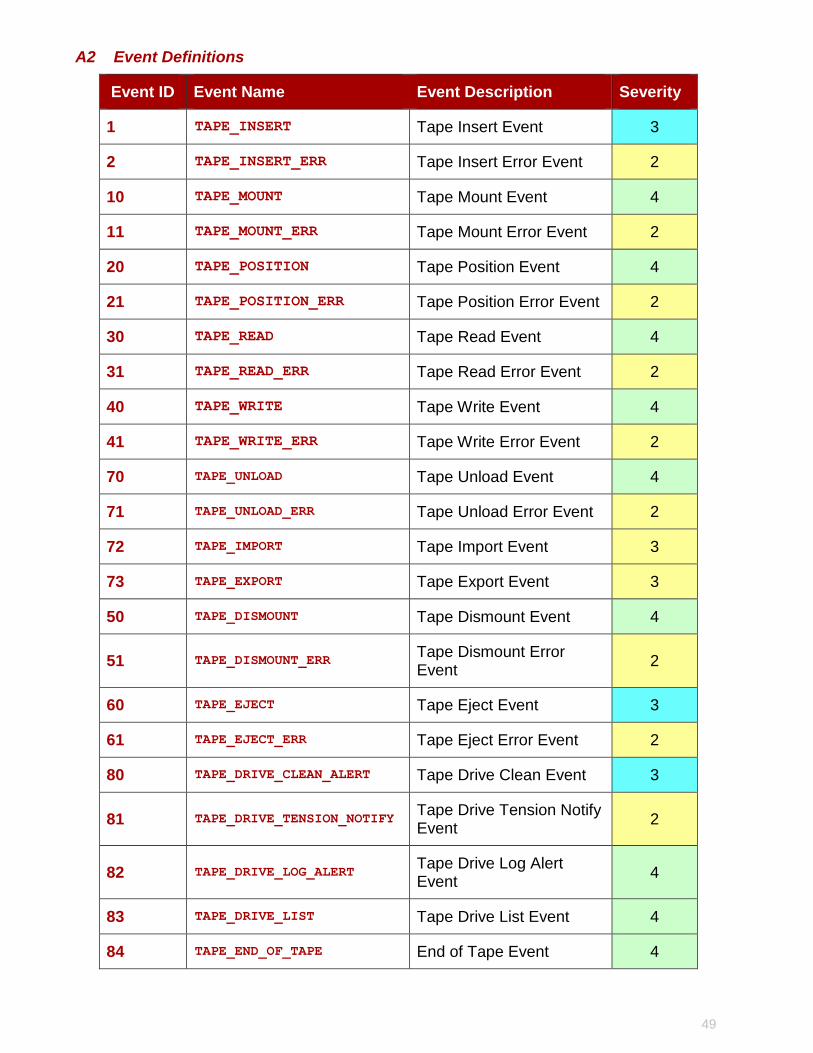
A2 Event Definitions
Event ID Event Name Event Description Severity
1 TAPE_INSERT Tape Insert Event 3
2 TAPE_INSERT_ERR Tape Insert Error Event 2
10 TAPE_MOUNT Tape Mount Event 4
11 TAPE_MOUNT_ERR Tape Mount Error Event 2
20 TAPE_POSITION Tape Position Event 4
21 TAPE_POSITION_ERR Tape Position Error Event 2
30 TAPE_READ Tape Read Event 4
31 TAPE_READ_ERR Tape Read Error Event 2
40 TAPE_WRITE Tape Write Event 4
41 TAPE_WRITE_ERR Tape Write Error Event 2
70 TAPE_UNLOAD Tape Unload Event 4
71 TAPE_UNLOAD_ERR Tape Unload Error Event 2
72 TAPE_IMPORT Tape Import Event 3
73 TAPE_EXPORT Tape Export Event 3
50 TAPE_DISMOUNT Tape Dismount Event 4
51 TAPE_DISMOUNT_ERR Tape Dismount Error Event
2
60 TAPE_EJECT Tape Eject Event 3
61 TAPE_EJECT_ERR Tape Eject Error Event 2
80 TAPE_DRIVE_CLEAN_ALERT Tape Drive Clean Event 3
81 TAPE_DRIVE_TENSION_NOTIFY Tape Drive Tension Notify Event
2
82 TAPE_DRIVE_LOG_ALERT Tape Drive Log Alert Event
4
83 TAPE_DRIVE_LIST Tape Drive List Event 4
84 TAPE_END_OF_TAPE End of Tape Event 4
50
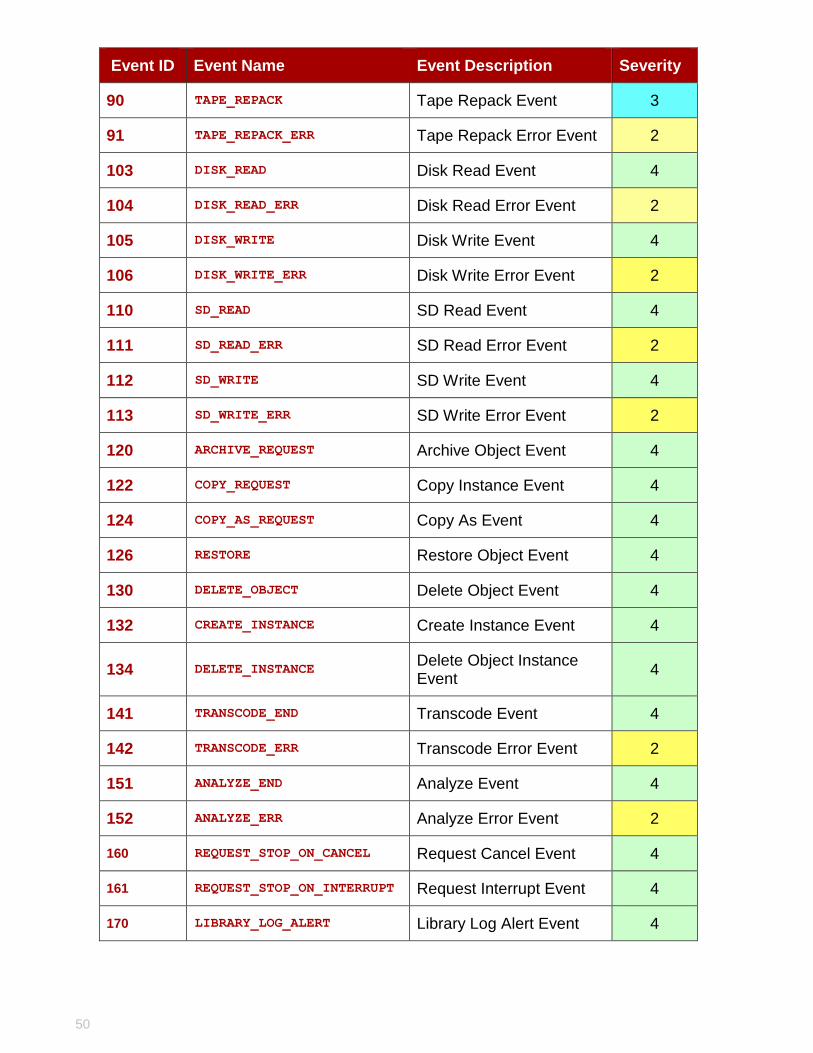
Event ID Event Name Event Description Severity
90 TAPE_REPACK Tape Repack Event 3
91 TAPE_REPACK_ERR Tape Repack Error Event 2
103 DISK_READ Disk Read Event 4
104 DISK_READ_ERR Disk Read Error Event 2
105 DISK_WRITE Disk Write Event 4
106 DISK_WRITE_ERR Disk Write Error Event 2
110 SD_READ SD Read Event 4
111 SD_READ_ERR SD Read Error Event 2
112 SD_WRITE SD Write Event 4
113 SD_WRITE_ERR SD Write Error Event 2
120 ARCHIVE_REQUEST Archive Object Event 4
122 COPY_REQUEST Copy Instance Event 4
124 COPY_AS_REQUEST Copy As Event 4
126 RESTORE Restore Object Event 4
130 DELETE_OBJECT Delete Object Event 4
132 CREATE_INSTANCE Create Instance Event 4
134 DELETE_INSTANCE Delete Object Instance Event
4
141 TRANSCODE_END Transcode Event 4
142 TRANSCODE_ERR Transcode Error Event 2
151 ANALYZE_END Analyze Event 4
152 ANALYZE_ERR Analyze Error Event 2
160 REQUEST_STOP_ON_CANCEL Request Cancel Event 4
161 REQUEST_STOP_ON_INTERRUPT Request Interrupt Event 4
170 LIBRARY_LOG_ALERT Library Log Alert Event 4
51
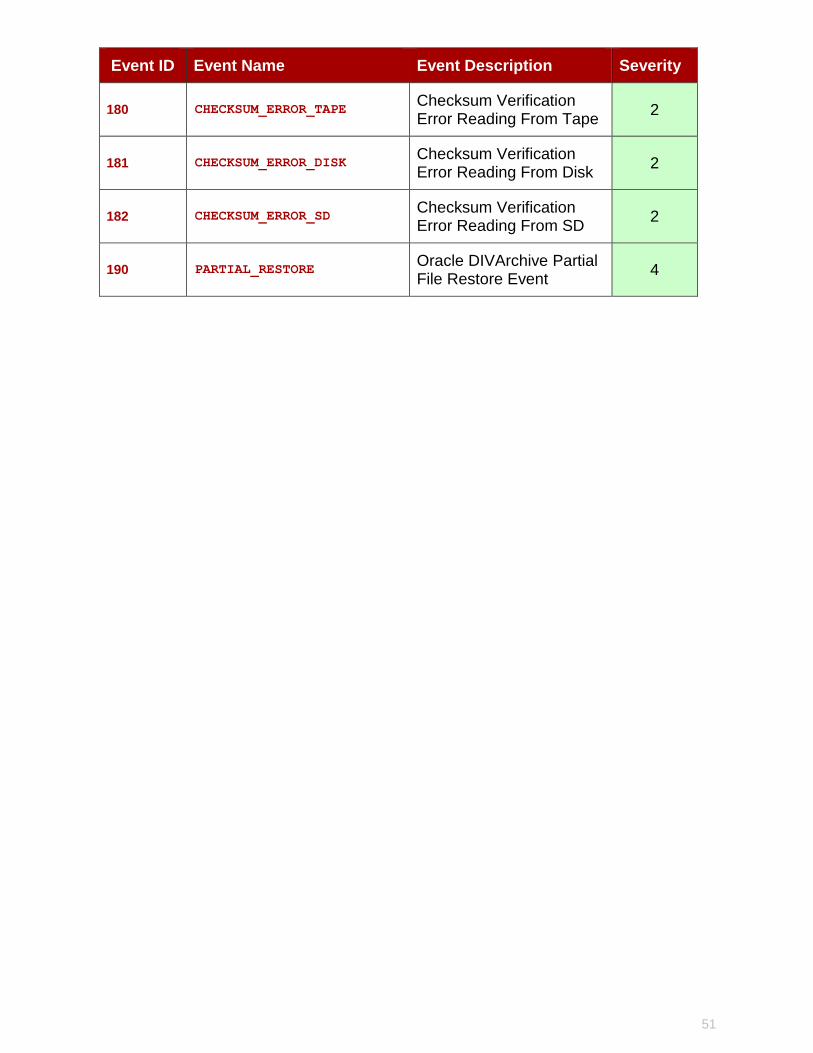
Event ID Event Name Event Description Severity
180 CHECKSUM_ERROR_TAPE Checksum Verification Error Reading From Tape
2
181 CHECKSUM_ERROR_DISK Checksum Verification Error Reading From Disk
2
182 CHECKSUM_ERROR_SD Checksum Verification Error Reading From SD
2
190 PARTIAL_RESTORE Oracle DIVArchive Partial File Restore Event
4
52
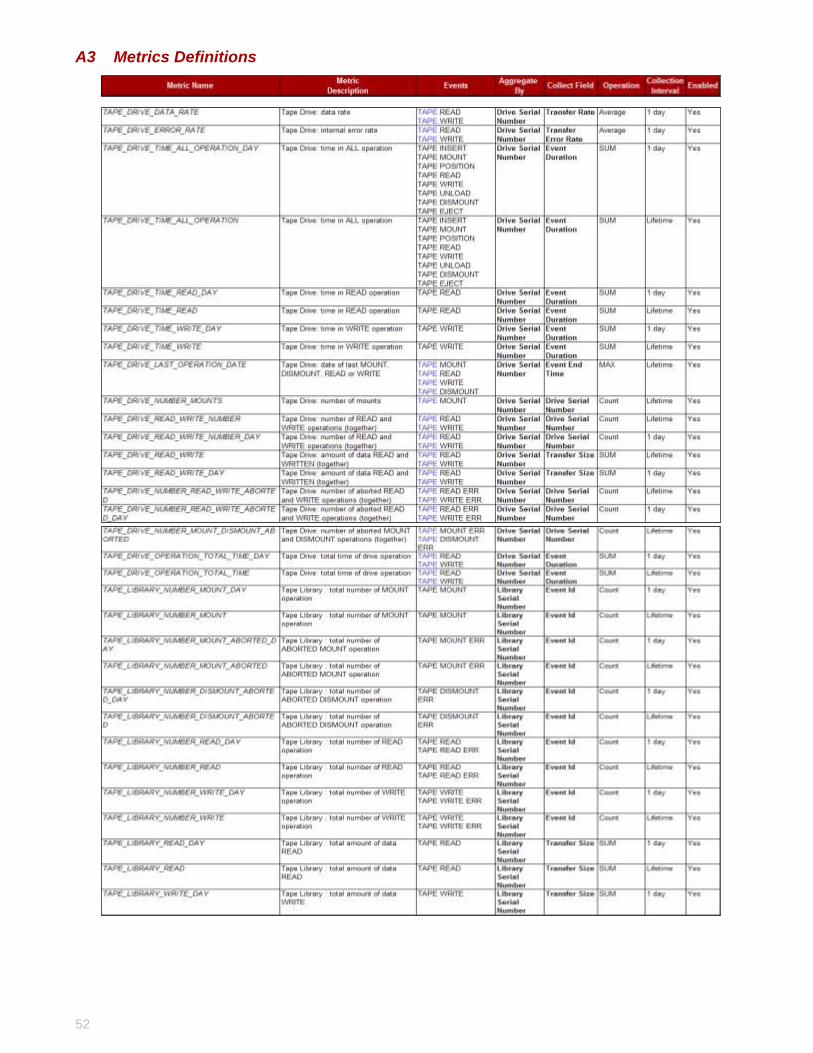
A3 Metrics Definitions
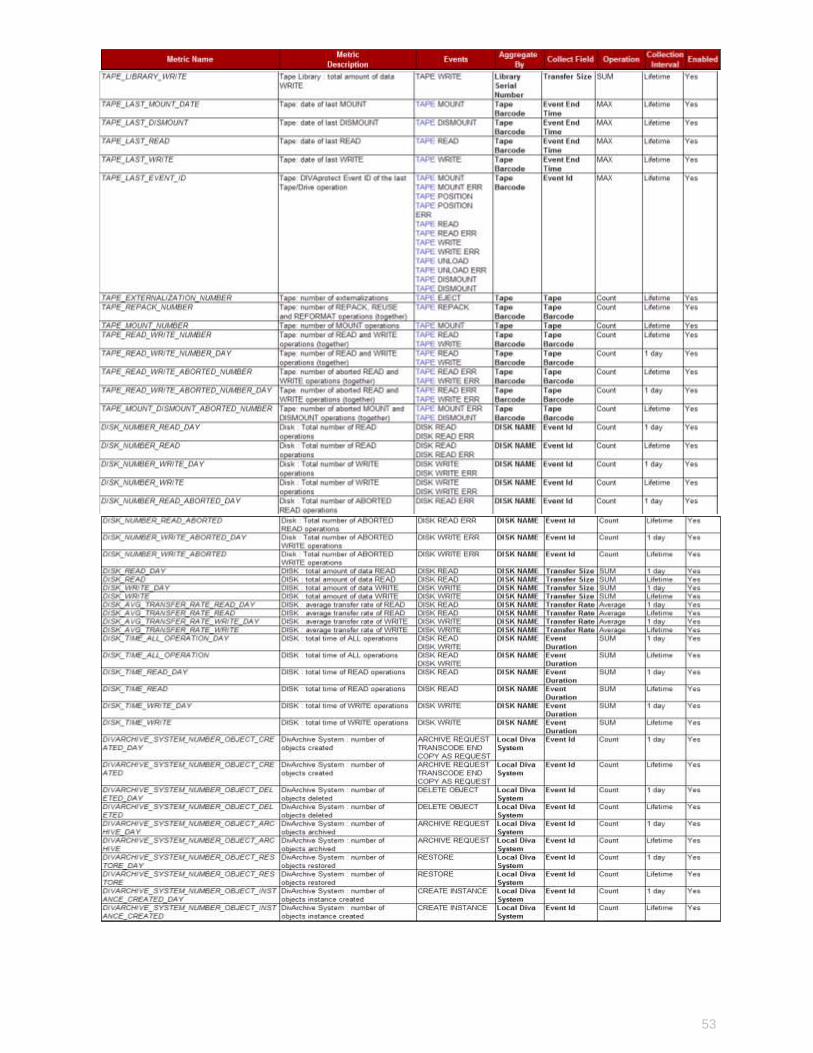
53
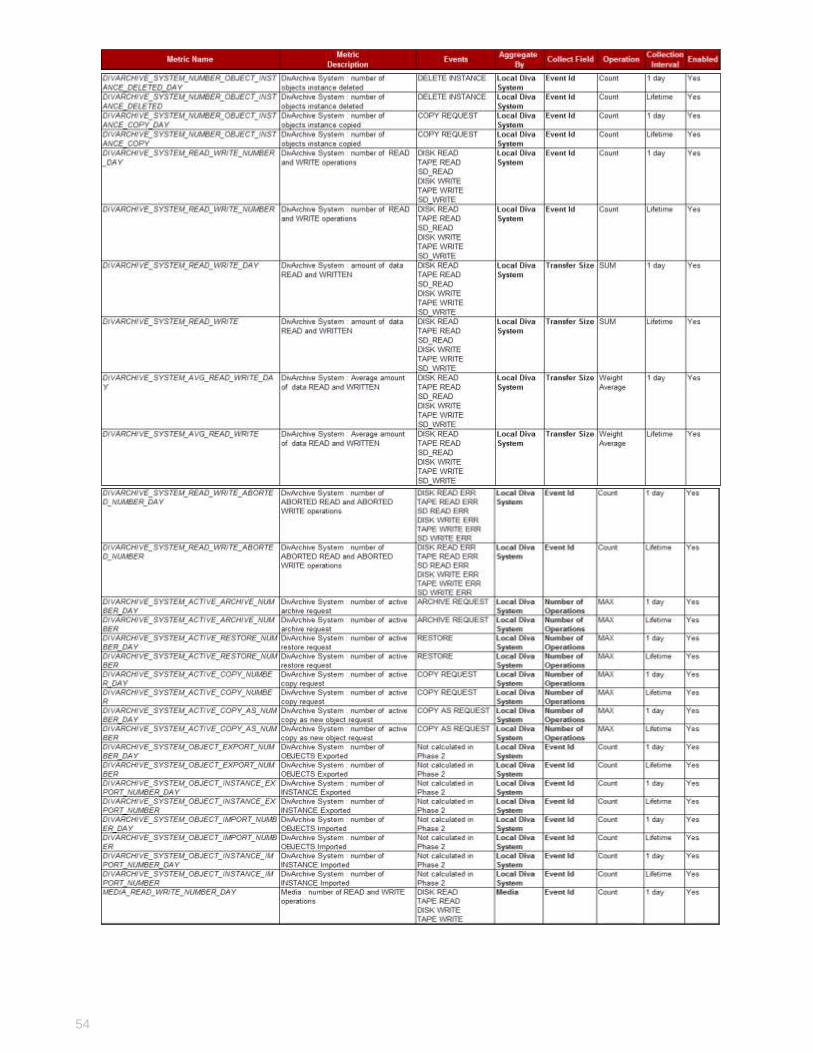
54
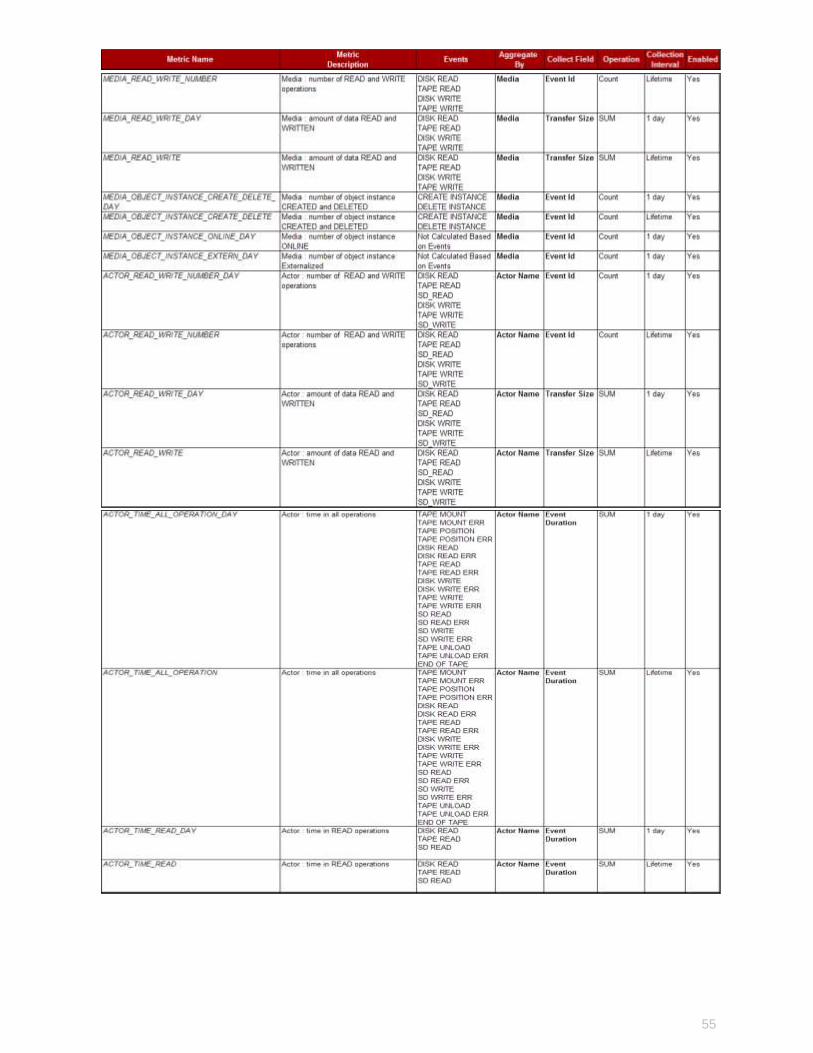
55
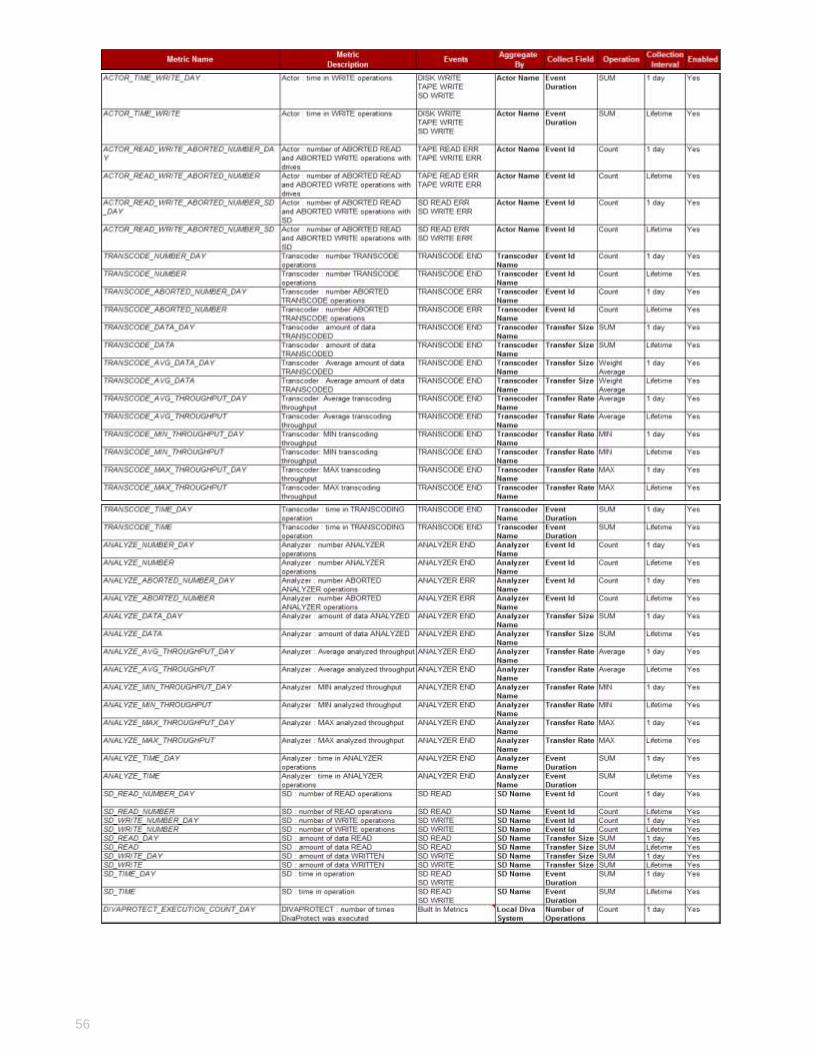
56
57
58
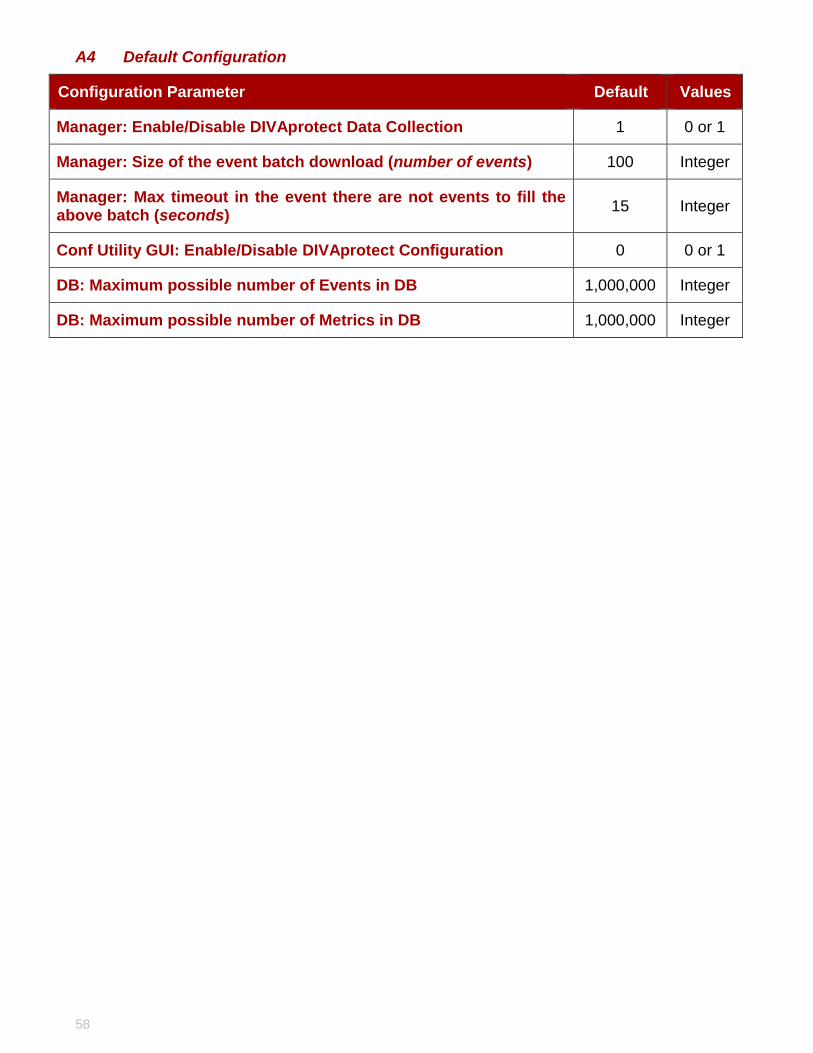
A4 Default Configuration
Configuration Parameter Default Values
Manager: Enable/Disable DIVAprotect Data Collection 1 0 or 1
Manager: Size of the event batch download (number of events) 100 Integer
Manager: Max timeout in the event there are not events to fill the above batch (seconds)
15 Integer
Conf Utility GUI: Enable/Disable DIVAprotect Configuration 0 0 or 1
DB: Maximum possible number of Events in DB 1,000,000 Integer
DB: Maximum possible number of Metrics in DB 1,000,000 Integer
59
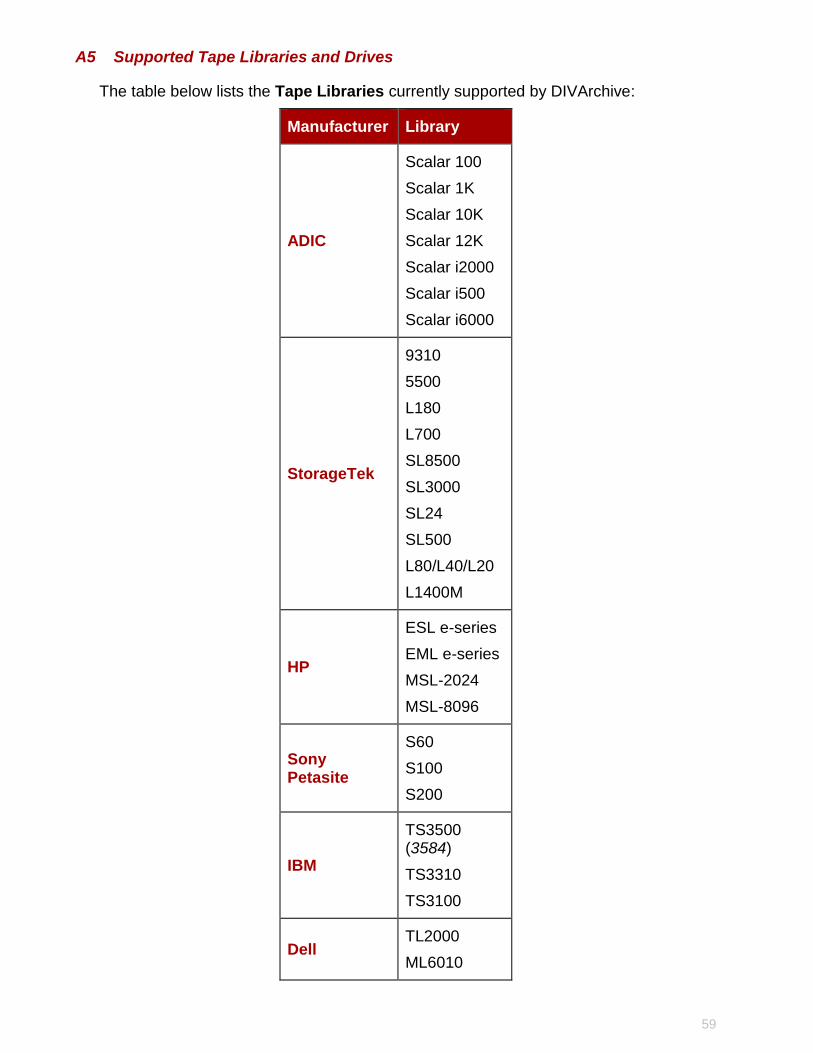
A5 Supported Tape Libraries and Drives
The table below lists the Tape Libraries currently supported by DIVArchive:
Manufacturer Library
ADIC
Scalar 100
Scalar 1K
Scalar 10K
Scalar 12K
Scalar i2000
Scalar i500
Scalar i6000
StorageTek
9310
5500
L180
L700
SL8500
SL3000
SL24
SL500
L80/L40/L20
L1400M
HP
ESL e-series
EML e-series
MSL-2024
MSL-8096
Sony Petasite
S60
S100
S200
IBM
TS3500 (3584)
TS3310
TS3100
Dell TL2000
ML6010
60
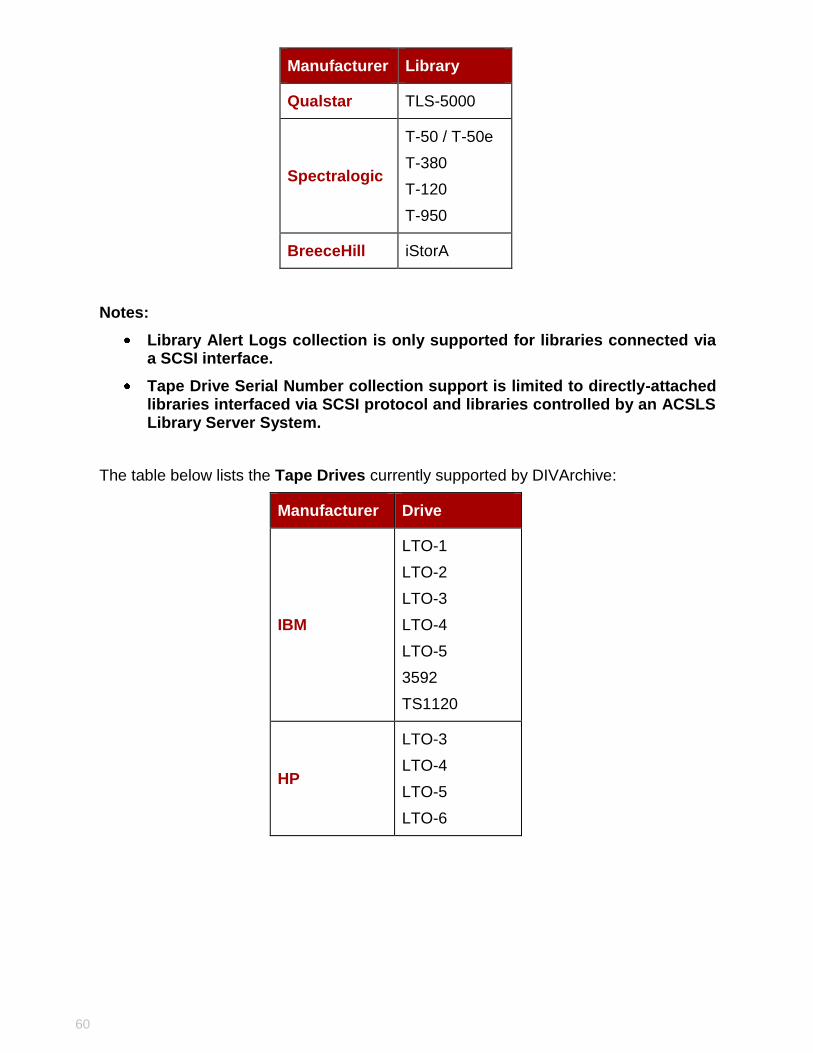
Manufacturer Library
Qualstar TLS-5000
Spectralogic
T-50 / T-50e
T-380
T-120
T-950
BreeceHill iStorA
Notes:
Library Alert Logs collection is only supported for libraries connected via a SCSI interface.
Tape Drive Serial Number collection support is limited to directly-attached libraries interfaced via SCSI protocol and libraries controlled by an ACSLS Library Server System.
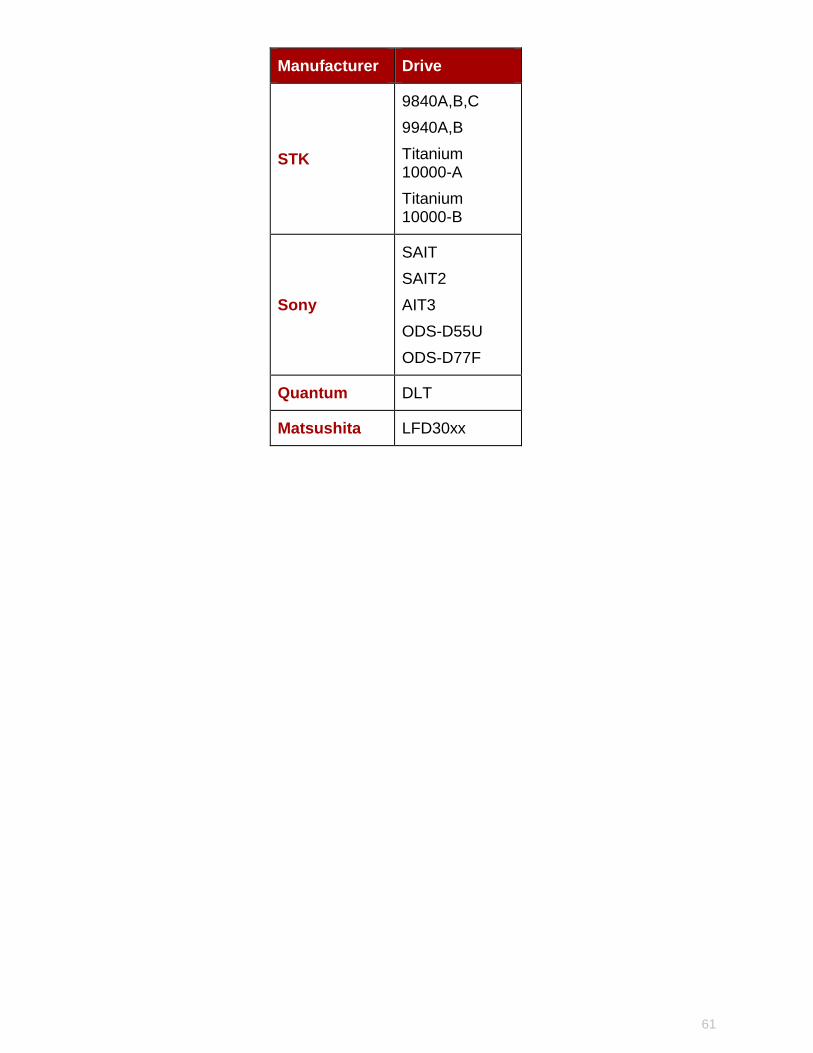
The table below lists the Tape Drives currently supported by DIVArchive:
Manufacturer Drive
IBM
LTO-1
LTO-2
LTO-3
LTO-4
LTO-5
3592
TS1120
HP
LTO-3
LTO-4
LTO-5
LTO-6
61
Manufacturer Drive
STK
9840A,B,C
9940A,B
Titanium 10000-A
Titanium 10000-B
Sony
SAIT
SAIT2
AIT3
ODS-D55U
ODS-D77F
Quantum DLT
Matsushita LFD30xx