s.a.p.i.en.s, 7.2 - openedition journals
TRANSCRIPT
S.A.P.I.EN.SSurveys and Perspectives Integrating Environment andSociety
7.2 | 2014Vol.7 / n°2 - Large-Scale Restoration
Electronic versionURL: http://journals.openedition.org/sapiens/1541ISSN: 1993-3819
PublisherInstitut Veolia
Electronic referenceS.A.P.I.EN.S, 7.2 | 2014, « Vol.7 / n°2 - Large-Scale Restoration » [Online], Online since 23 April 2014,connection on 23 October 2020. URL : http://journals.openedition.org/sapiens/1541
This text was automatically generated on 23 October 2020.
Licence Creative Commons
TABLE OF CONTENTS
The State of United States Aquatic RestorationSiobhan Fennessy and Jeffrey JacobsGaëll Mainguy (ed.)
300,000 Hectares Restored in Shinyanga, Tanzania — but what did it really take to achievethis restoration?Edmund BarrowGaëll Mainguy (ed.)
CASE STUDY: Community Based Ecological Mangrove Rehabilitation (CBEMR) in IndonesiaFrom small (12-33 ha) to medium scales (400 ha) with pathways for adoption at larger scales (>5000 ha)Ben Brown, Ratna Fadillah, Yusran Nurdin, Iona Soulsby and Rio AhmadGaëll Mainguy (ed.)
Participatory governance of Marine Protected Areas: a political challenge, an ethicalimperative, different trajectoriesSenegal case studiesMarie-Christine Cormier-SalemGaëll Mainguy (ed.)
Restoration of rice landscape biodiversity by farmers in Vietnam through education andmotivation using mediaK.L. Heong, M.M. Escalada, H.V. Chien and L.Q. CuongGaëll Mainguy (ed.)
Oregon’s Restoration Economy: How investing in natural assets benefits communities andthe regional economyCathy P. Kellon and Taylor HesselgraveGaëll Mainguy (ed.)
A 10-year ecosystem restoration community of practice tracks large-scale restoration trendsRobert Daoust, Terry Doss, Mark Gorman, Matt Harwell and Cheryl UlrichGaëll Mainguy (ed.)
Transborder Drylands Restoration: Vision and Reality After Three Decades of InnovativePartnerships on the U.S.-Mexico BorderTom BarryGaëll Mainguy (ed.)
S.A.P.I.EN.S, 7.2 | 2014
1
The State of United States AquaticRestoration
Siobhan Fennessy and Jeffrey Jacobs
Gaëll Mainguy (ed.)
EDITOR'S NOTE
This manuscript was published as part of a special issue on the subject of largescale
restoration of ecosystems.
1 The last twenty-five years have seen increasing interests in both the science and
practice of aquatic ecosystem restoration in the United States. Aquatic ecosystems were
heavily altered in the U.S. during the early and mid-twentieth century for purposes of
flood control, navigation, water supply, and agricultural and urban development. Over
time, and with changing social preferences, it became clear that past successes in water
resource development often led to the loss of important functions and services
provided by aquatic ecosystems. Restoration activities began as a result, in part driven
by legal imperatives, such as the 1973 Endangered Species Act and 1972, 1977, and
other amendments to the Clean Water Act.
2 Aquatic restoration activities span a range of activities and scales. Examples include:
systematic, long-term restoration of some degree of pre-regulation river and stream
flow; discrete river flow or reservoir release experiments; deliberate drawdown of river
levels in navigation pools behind dams; and, physical construction of meanders, cutoffs
and wetlands in floodplains and adjacent to river channels. At smaller scales,
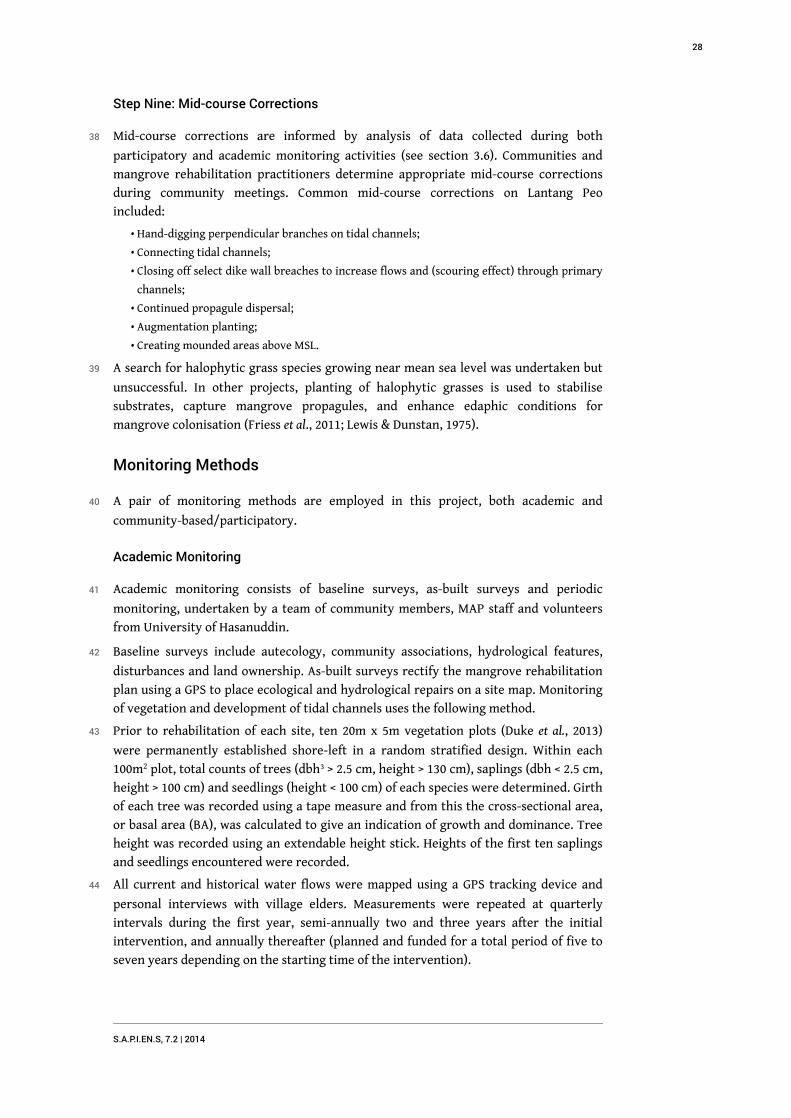
restoration activities may be carried out by individual landowners, or farmers; at larger
scales, the resources and authorities of state and the U.S. federal government often are
required. To this end, in 1996 the U.S. Army Corps of Engineers added a new mission
area of ecosystem restoration to its traditional responsibilities of flood risk
management and support of navigation. Their focus is on integrated restoration
including wetland, riparian, river and coastal habitats.
S.A.P.I.EN.S, 7.2 | 2014
2
3 As the demand for aquatic ecosystem restoration in the U.S. has increased, the science
of restoration and the need for regionally-based restoration programs, has grown
accordingly. The challenges of restoration are many and include our incomplete
understanding of the complexity of ecosystems and the limit this places on our ability
to predict ecosystem response to restoration efforts. As a result, many U. S. federal and
state agencies now employ an adaptive management framework to advance the science
of restoration while working to achieve project goals. Adaptive management couples
predictions on what is expected to occur in a restoration project, with appropriate
monitoring to discover what did occur, and stipulates that management actions be
revised to align the two. It provides a flexible approach to learning so that the most
effective and sustainable restoration strategies can be implemented (NRC, 2004).
4 The best restoration projects have been designed to add to our scientific understanding
of ecosystems and their functions, and to provide social and economic benefits such as
water supply enhancement, or species preservation. Adopting an experimental
approach to restoration, in which alternative approaches are tested systematically and
cause and effect relationships are explored, moves the science of restoration forward
more rapidly. Adaptive, science-based restoration has been laid out as a series of steps
including: 1—making project goals explicit; 2—basing project design on the most
current ecological knowledge; 3—assessing the response of the system quantitatively by
collecting data both before and after the project is implemented; and 4—analyzing the
data to determine whether project goals are being met (Zedler, 2005).
5 Adaptive management in restoration is particularly valuable for projects centered on
unique, large-scale ecosystems such as the Florida Everglades or the Chesapeake Bay.
The Everglades, a once vast mosaic of interconnected habitats, has experienced nearly
150 years of drainage, channelization and water control (NRC, 2012). The Chesapeake
Bay, the largest and most diverse estuary in the U.S., is threatened by nutrient and
sediment inputs that have substantially altered its ecological condition, leading to
harmful algal blooms and reduction of fish populations (NRC, 2011). Adaptive
management actions in both ecosystems recognize that continued assessment and
feedback will help fill critical knowledge gaps, acknowledge tradeoffs in decision-
making, and ultimately maximize restoration success, leading to more successful
restoration efforts elsewhere.
BIBLIOGRAPHY
National Research Council [NRC] (2004). Adaptive Management for Water Resources Project Planning.
Washington, D.C. National Academies Press.
National Research Council (2011). Achieving Nutrient and Sediment Reduction Goals in the Chesapeake
Bay. Washington, D.C.: National Academies Press.
National Research Council (2012). Progress Toward Restoring the Everglades. Washington, D.C.:
National Academies Press.
S.A.P.I.EN.S, 7.2 | 2014
3

Zedler, J.B. (2005). Restoring wetland plant diversity: a comparison of existing and adaptive
approaches. Wetland Ecology and Management 13: 5-14.
AUTHORS
SIOBHAN FENNESSY
Kenyon College and member, National Research Council Water Science and Technology Board
JEFFREY JACOBS
Director, National Research Council Water Science and Technology Board
S.A.P.I.EN.S, 7.2 | 2014
4
300,000 Hectares Restored inShinyanga, Tanzania — but what didit really take to achieve thisrestoration?
Edmund Barrow
Gaëll Mainguy (éd.)
NOTE DE L’ÉDITEUR
This manuscript was published as part of a special issue on the subject of largescale
restoration of ecosystems. This manuscript was reviewed by two anonymous referees.
S.A.P.I.EN.S, 7.2 | 2014
5
Box 1. Facts and Figures: Shinyanga Ecosystem Restoration
* Location: Shinyanga region is in north Tanzania, and south of Lake Victoria; the region has an
area of approximately 50,000 sq.km.
* Ecosystems: Heavily modified Miombo and Acacia woodland ecosystems (mostly converted to
other forms of use).
* Size of Community: Approximately 833 villages with a population of 2.25 million people.
* Restored Area: Between 1986 & 2004 approx. 300,000 hectare (& probably considerably more by
2014) – most farmers had their own restored patches together with restored village forests.
* Budget (estimate over 25 years): Approx. US$ 1.9 million, or approx. $6.4 per restored Ha (figures
based on estimates of investment).
* Instutional and Technical Partners: Government of Tanzania (Ministry of Natural Resources
and Tourism), Government of Norway, Shinyanga Regional, District and Village Governments,
variety of NGO’s, ICRAF, IUCN.
* Main Objectives and Benefits: Restore goods and services of Miombo and Acacia woodlands in
the region; support equitable community and village ownership and management of woodlands.
Restoration contributes $14 per person per month across the whole region (see Table 1).
Background
1 Shinyanga region, in north Tanzania (and south of Lake Victoria), is one of the
country’s poorer regions, has over 2.25 million people with an average growth rate of
2.8% p.a. (1990s), and covers 50,000 square kilometres with a population density of 42
people per square kilometre. The high population density, combined with the people’s
agro-pastoral land use depending on livestock, subsistence, and cash cropping,
exacerbated already serious problems of land clearing both prior to, and after 1986
(Barrow et al., 1988; Kilihama, 1994; Maro, 1995; Mlenge, 2005; Otsyina et al., 1993). The
region has an average annual rainfall of 600-800 mm, which is erratic and poorly
distributed. The natural vegetation in Shinyanga historically consisted of extensive
Miombo and Acacia woodlands (Burtt, 1942; Malcolm, 1953).
2 Shinyanga by 1985 represented an ecosystem in transition, and was called the “Desert
of Tanzania” by President Julius Nyerere (Ghazi et al., 2005). Woodlands were cleared to
eradicate tsetse fly, create land and space for agriculture and cash cropping, and cater
for the needs of a growing population. As a result the system was close to collapse, and
ecosystem conversion came at a cost. The goods and services that trees and woodlands
provided were lost. Fuelwood took between 2-4 hours to collect. The end of dry season
forage so badly needed by oxen was no longer readily available, thereby compromising
land cultivation. Wild fruit and medicinal plants were difficult to find. In short, all
those things vital for the livelihoods of the Sukuma people were disappearing.
The “What” — 300,000 plus hectares restored
3 In response, in 1986, the Government of Tanzania started the Shinyanga Soil
Conservation Programme, or HASHI (Swahili: Hifadhi Ardhi Shinyanga) (Barrow et al. ,
1988). This helped establish the basis for restoration and enhancing the resilience of
S.A.P.I.EN.S, 7.2 | 2014
6
the overall system. Resilience refers to the capacity of a system to absorb disturbance
and reorganize while undergoing change so as to still retain essentially the same
function, structure and feedbacks, and therefore identity, that is, the capacity to
change in order to maintain the same identity (Folke et al., 2010). The Government of
Tanzania was the major donor, with additional funding from the Government of
Norway. The key vehicle for restoration was “Ngitili” or “enclosures” or “fodder
reserves” in the Sukuma language (Malcolm, 1953).
4 During a detailed survey (late 1990s) of a sample of 172 villages, there were 18,607
Ngitili (group or village, household or individual) covering an area of about 78,122 ha
(Maro, 1995). The average size of group or village Ngitili was 164 ha, while the average
size of the individual Ngitili was 2.3 ha Ninety per cent of the people in the 833 villages
of Shinyanga had their own Ngitili. By 2004, approximately 300,000 ha of Ngitili had
been restored (Table 1). This resulted in a mosaic of woodlands, savannahs and
agricultural land without tsetse. The HASHI experience went way beyond the dreams of
many of the early proponents. This was acknowledged at the Johannesburg World
Summit on Sustainable Development (2002), where the HASHI programme was selected
as one of the Equator Initiative Award winners.
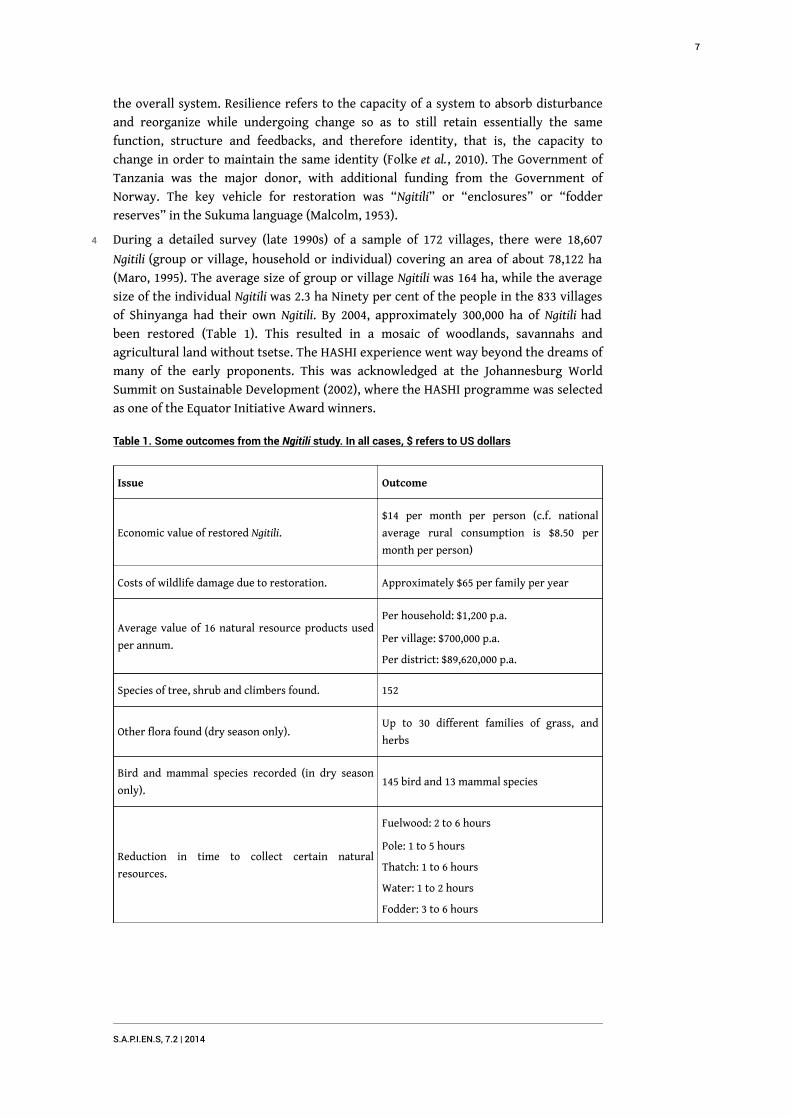
Table 1. Some outcomes from the Ngitili study. In all cases, $ refers to US dollars
Issue Outcome
Economic value of restored Ngitili.
$14 per month per person (c.f. national
average rural consumption is $8.50 per
month per person)
Costs of wildlife damage due to restoration. Approximately $65 per family per year
Average value of 16 natural resource products used
per annum.
Per household: $1,200 p.a.
Per village: $700,000 p.a.
Per district: $89,620,000 p.a.
Species of tree, shrub and climbers found. 152
Other flora found (dry season only).Up to 30 different families of grass, and
herbs
Bird and mammal species recorded (in dry season
only).145 bird and 13 mammal species
Reduction in time to collect certain natural
resources.
Fuelwood: 2 to 6 hours
Pole: 1 to 5 hours
Thatch: 1 to 6 hours
Water: 1 to 2 hours
Fodder: 3 to 6 hours
S.A.P.I.EN.S, 7.2 | 2014
7
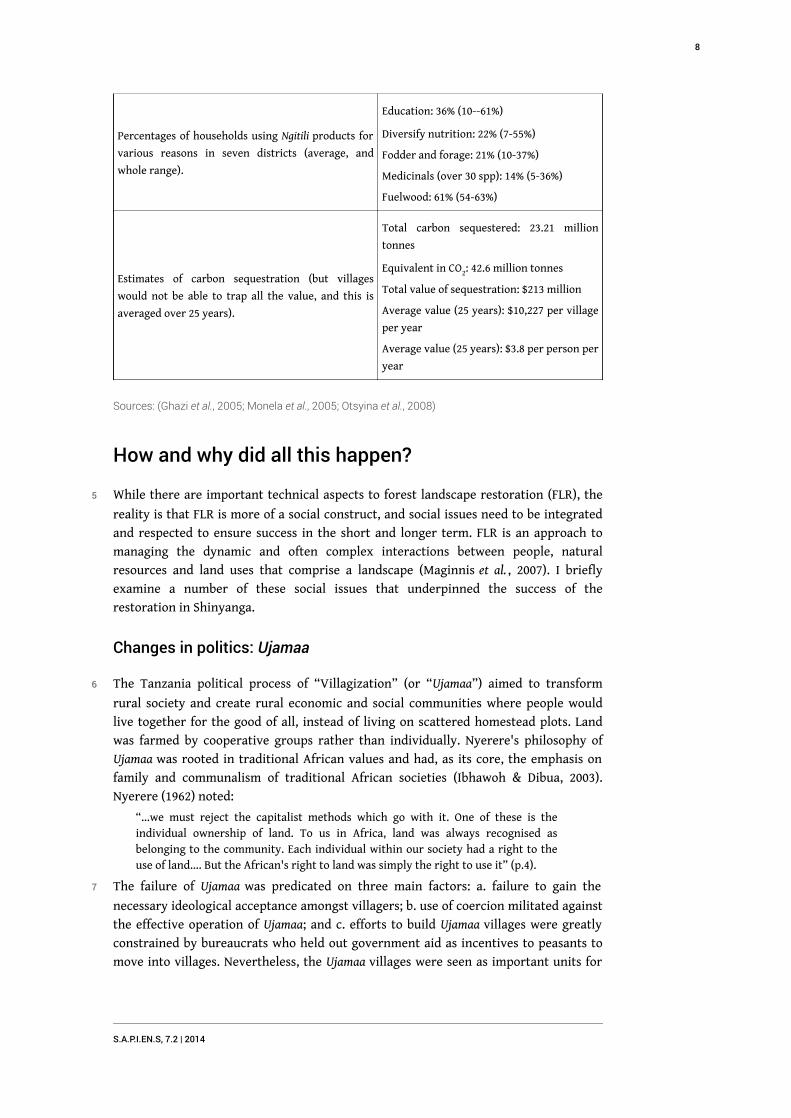
Percentages of households using Ngitili products for
various reasons in seven districts (average, and
whole range).
Education: 36% (10--61%)
Diversify nutrition: 22% (7-55%)
Fodder and forage: 21% (10-37%)
Medicinals (over 30 spp): 14% (5-36%)
Fuelwood: 61% (54-63%)
Estimates of carbon sequestration (but villages
would not be able to trap all the value, and this is
averaged over 25 years).
Total carbon sequestered: 23.21 million
tonnes
Equivalent in CO2: 42.6 million tonnes
Total value of sequestration: $213 million
Average value (25 years): $10,227 per village
per year
Average value (25 years): $3.8 per person per
year
Sources: (Ghazi et al., 2005; Monela et al., 2005; Otsyina et al., 2008)
How and why did all this happen?
5 While there are important technical aspects to forest landscape restoration (FLR), the
reality is that FLR is more of a social construct, and social issues need to be integrated
and respected to ensure success in the short and longer term. FLR is an approach to
managing the dynamic and often complex interactions between people, natural
resources and land uses that comprise a landscape (Maginnis et al. , 2007). I briefly
examine a number of these social issues that underpinned the success of the
restoration in Shinyanga.
Changes in politics: Ujamaa
6 The Tanzania political process of “Villagization” (or “Ujamaa”) aimed to transform
rural society and create rural economic and social communities where people would
live together for the good of all, instead of living on scattered homestead plots. Land
was farmed by cooperative groups rather than individually. Nyerere's philosophy of
Ujamaa was rooted in traditional African values and had, as its core, the emphasis on
family and communalism of traditional African societies (Ibhawoh & Dibua, 2003).
Nyerere (1962) noted:
“…we must reject the capitalist methods which go with it. One of these is the
individual ownership of land. To us in Africa, land was always recognised as
belonging to the community. Each individual within our society had a right to the
use of land…. But the African's right to land was simply the right to use it” (p.4).
7 The failure of Ujamaa was predicated on three main factors: a. failure to gain the
necessary ideological acceptance amongst villagers; b. use of coercion militated against
the effective operation of Ujamaa; and c. efforts to build Ujamaa villages were greatly
constrained by bureaucrats who held out government aid as incentives to peasants to
move into villages. Nevertheless, the Ujamaa villages were seen as important units for
S.A.P.I.EN.S, 7.2 | 2014
8
the provision of social services to the people, and was also a development strategy,
based on a self-reliance (Ibhawoh & Dibua, 2003).
8 Since the 1960s, Ujamaa did much to undermine existing land use and further
exacerbate the clearance of woodlands. Under Ujamaa, land was nationalized and
people lost rights to tree and forest products, thus removing incentives to conserve
them. It serves as an example of how even well-intentioned policies can have serious
negative results, as villagization no longer encouraged the management of woodlands
and Ngitili. Indeed many Ngitili were destroyed during this period as the process of
villagization undermined traditional institutions and practices (Monela et al., 2005).
9 Early attempts at tree planting largely failed, as they lacked local ownership and were
top-down in implementation. By 1987, this started to change, as policies that
encouraged forest degradation were replaced by supportive ones, and transformed
pressures to degrade the environment into incentives to restore it. Access to, and
control over resources increased the willingness of individuals and groups to restore
and manage them sustainably. This policy change was one of the keys to unleashing the
restoration that subsequently happened. While tenure changes were a fundamental
building block, on their own such changes would not have been sufficient.
Policy change: Village and Forests
10 Since HASHI started, there has been an increasingly enabling policy and legal
framework for natural resource management in Tanzania, including those relating to
forestry, land tenure and local government reform. This included linking land tenure
with forest policy reform, which created the enabling environment for local (farmer,
village, group) security of rights and responsibilities to invest for the longer term
(Alden Wily & Mbaya, 2001). The HASHI programme was well grounded in government
policies, but more than that, official government approaches started to respect and
integrate the importance of local knowledge and local institutions. In the early days of
participatory processes including the use of Participatory Rural Appraisal (PRA), HASHI
was an early adopter — in a period where “top-down” and expert driven development
was still more the norm (Chambers, 1983). The increased local interest in natural
resource management, for improving Ngitilis was also supported by the decision to take
a longterm (nearly 25 years) approach and investment by the Governments of Tanzania
and Norway.
Local need: recognized loss of tree products
11 By 1986 the people of Shinyanga had started to understand the impacts of the
woodland clearance of the previous decades. This included losses of important products
(food sources for livestock, tree products for household use, medicinals), increased
levels of efforts to collect key household needs (fuelwood, medicinals, water). These
pressures were felt particularly by women. Local need for the products of Ngitili became
increasingly important and helped drive local ownership of what needed to be done.
This in turn enhanced the adaptive capacities of the Sukuma people and their
institutions, and the importance of restoring diverse ecosystems and their services.
12 The Sukuma agro-pastoralists (and their customary institutions) are the main
stakeholders, together with village, district, regional and national government officials,
S.A.P.I.EN.S, 7.2 | 2014
9
and Non-Governmental Organizations and community groups. The private sector was
not much involved — though many of the products from restored Ngitili were marketed
through the private sector at local and regional levels. But there was a significant
change as the private sector (at the local level) engaged with the production of tree
seedlings (Box 2).
Box 2.
In 1986, there was one Government tree nursery in Shinyanga region producing approximately one
million mainly exotic tree seedlings per annum. Many of these seedlings were unwanted and
unplanted at the village level. By 2004 there were over 1,500 tree nurseries spread all over the
region — as there was demand for seedlings, mostly indigenous, and a willingness to pay. Local
entrepreneurs at the village and district levels had their own nurseries and were selling seedlings.
Meanwhile the government nursery produced about 10,000 seedlings mainly for research.
Multiple benefit flows (people, gender, livestock, education, health)
13 Table 1 demonstrates the multiplicity of benefits from restored Ngitili, while Box 3
reflects local comments about what the restoration meant to them. Other Sukuma
agro-pastoralists pointed out that trees and catchment conservation improved water
quality. Restored woodlands provided fodder for oxen at the critical end of dry season
times. Revenues from the sale of tree products, such as honey and poles, helped pay for
children’s schooling. The multiplicity of tree goods (fuel, building timber, fruits, gum,
medicines, fodder) and services (water catchment, erosion reduction, cultural) spread
the risk of crop failure and enhanced resilience. This in turn helped diversify the local
economy, added variety to the diet (and improved nutrition), provided for contingency
needs (in the event that, for example, one income stream should fail), provided cash
needs (education, home improvement), and enabled local people to re-enter the local
markets to trade in tree products (medicinals, honey, fruits for example).
Box 3.
“Trees gave birth to livestock,” says one villager, referring to the fact that the sale of tree products
allowed him to buy livestock. “I now only spend twenty minutes collecting fuelwood. In the past I spent
between two to four hours collecting fuel” says a Sukuma lady as she now uses fuelwood harvested
from the family Ngitili. In a number of villages the sale of Ngitili products “built our teachers house”,
and “financed my two sons’ University Education”.
14 There were clear benefits to women (Table 1), who use many of these products, as the
time taken to collect fuelwood, fruits and wild foods was dramatically reduced, thereby
enabling women to focus more quality time on the home and their children. While
gender inequalities may often be pervasive, and even ‘gender-neutral’ programs may
deepen inequalities (Bandiaky, 2007), the HASHI programme did produce important
benefits for women. Gender-responsive forestry policies need to consider a wide range
of issues, including ownership, usufruct rights, access to forest-generated income,
participation in decision-making, and traditional knowledge (Martin, 2004). It would
seem that the involvement of women and being able to address gender related issues in
S.A.P.I.EN.S, 7.2 | 2014
10
HASHI paid dividends — as it is very clear (Table 1) that women gained large benefits
from the restoration.
Local knowledge
15 HASHI relied on the rich local knowledge of the Sukuma people about their natural
resources and ways of managing them. Ngitili were traditionally used for conservation
and restoration of rangelands, and governed under customary law (Barrow & Mlenge,
2003; Malcolm, 1953). The traditional knowledge and institutions for managing their
natural resources combined with supportive village governments, was key to creating
the right management framework, and building on such local knowledge — not
replacing it. Post Ujamaa, the traditional knowledge about the importance of trees and
reserved grazing areas was still known, and there were still residual miombo and acacia
trees as a basis for restoration (Ghazi et al., 2005; Monela et al., 2005).
16 HASHI recognized the importance of Ngitili, and the traditional knowledge as the basis
for the restoration. Unlike many programmes of the time, the empowering approach of
HASHI in promoting Ngitili as the vehicle for restoration was critical as this increased
local people’s ownership over, and capacity to manage their own natural resources
(Kaale et al., 2002). It enhanced the adaptive capacities of the communities in Shinyanga
(institutions, respect of knowledge, local ownership). In order to protect and restore
those goods and services, participatory planning including women’s groups, youth,
village government, and individual farmers, was essential to try and ensure equitable
forest management and to try to avoid elite capture.
Respect for local institutions
17 The strength, robustness, and legitimacy of local institutions for forest management
are key to the success of decentralization. Local institutions can provide efficient
monitoring and sanctioning (Bromley et al. , 1992; Ostrom, 1990). However, the
establishment or strengthening of community institutions encounters challenges such
as:
defining boundaries—which can lead to a resurgence of otherwise dormant conflicts;
gaining official recognition and relevant powers—which can determine their relative
importance;
introducing responsive and accountable local government systems—which can conflict with
the recognition of traditional authorities;
recognizing heterogeneity—which can raise intra-village or local power struggles; and
creating equitable gender representation—where equal representation does not necessarily
result in equal participation in decision-making.
18 By 1986, it was clear that nearly all the aspects of resilience had been lost, including the
institutions of management (Ngitili, local guards or Sungusungu, and the local
management institution of Dagashida). But knowledge of these important institutions
had not been lost. The HASHI programme recognized, and legitimated the importance
of the traditional practices (knowledge, institutions) of managing forests with Ngitili,
and used the traditional knowledge as the basis for the restoration. It is clear that the
social and ecological memory is important, as the social memory and the genetic
repository of the Miombo and Acacia woodlands was an important additional factor.
•
•
•
•
•
S.A.P.I.EN.S, 7.2 | 2014
11
19 The success of the restoration (ecosystem outcome) was a result of local people
restoring ecosystem functionality as a livelihood strategy. Local environmental
knowledge was important. The reinvigoration of traditional institutional arrangements
(Ngitili, Dagashida and S ungusungu) was essential for demonstrating that adaptive
capacities, though weakened, had not been lost (Mlenge, 2005). One major contribution
of the HASHI programme was allowing traditional institutions to function, which
worked by removing constraints (Barrow & Mlenge, 2008).
Role of personalities and champions
20 The HASHI staff worked closely with both district government staff and village
government (Ghazi et al. , 2005). Early on, though, more traditional top down
approaches were used. In the early stages of restoration, HASHI provided hundreds of
thousands of mostly exotic seedlings, from one central tree nursery. Few of these were
planted. The villagers told HASHI experts, “we want to plant our trees, not yours”
(pers. comm., W. Mlenge, 1987).
21 The HASHI programme leader made a very important shift in focus: rather than telling
what villagers should do, he started to understand and respect their detailed local
knowledge, ownership rights, and customary institutions. At a time of generally “top-
down development”, such empowering and participatory approaches, though well
justified, were fraught with risk. The fact that these now seemingly simple risks were
taken by the HASHI project leader and his staff is testament to the importance they
attributed for having such approaches. These relatively simple decisions demonstrate
the importance champions and personalities can play, and helped to lay the foundation
for overall success. At a time when participatory approaches were in their infancy,
most decision-making was technical and expert-driven. The importance of the right
personalities at the right time was another critical success factor, albeit one that
cannot be planned for.
Important conservation gains can also be achieved
22 At a time when conservation is increasingly being asked to justify itself in the context
of livelihood security, poverty reduction and the Millennium Development Goals (and
now the Sustainable Development Goals), the HASHI experience offers refreshing and
detailed insights into the reasons for considering biodiversity conservation as a key
component of livelihood security and poverty reduction. Restored natural trees and
woodlands are important livelihood and economic assets. But in achieving significant
livelihood outcomes, it is clear that large areas of biodiversity were restored in the
context of underlying livelihood objectives (Table 1). It demonstrates that natural
resource assets are more important in terms of livelihood security and economic
benefits than is generally assumed. There is a clear message here for government
investment in Poverty Reduction Strategy implementation, viz that the environmental
goods and services have to be more clearly taken into account and invested in at the
local, district and national levels. Further, and though not part of the original
objectives, Ngitili also made a significant contribution to carbon sequestration (Table 1)
as well as being important for risk management and resilience enhancement.
S.A.P.I.EN.S, 7.2 | 2014
12
But gains can be fragile: elite capture
23 Yet within this success there are dangers that need to be acknowledged, understood
and, where possible, mitigated. Elite capture, where resources designated for the
benefit of the larger population are usurped by more powerful individuals — be it
economic, political, educational, ethnic, or otherwise (Dutta, 2009) — is one such
change. There are examples of where the powerful and rich try to usurp the process for
their own benefit, and consolidate and further strengthen their own rights at the
expense of the less powerful. This can create landlessness and inequity, or differential
benefit accrual and wealth capture, as men may benefit more than women, and those
with large land holdings can benefit disproportionately to those with smaller holdings
(Shepherd, 2008). This is another kind of rigidity trap known as ‘success to the
successful’ (Meadows, 2008), where from a development perspective, the villages and
peoples of Shinyanga need to know how they can address such power shifts, for
example by ensuring village government is representative and downwardly
accountable to the villagers (Ribot, 2004). This implies the need for careful monitoring
of unintended consequences, the importance of checks and balances, and the need for a
self-critical approach.
24 Cross-scale interactions by powerful stakeholders have the potential to undermine
trust in resource management arrangements (Adger et al. , 2006). If government
regulators, for example, mobilize information and resources to reinforce their
authority, this may disempower other stakeholders such as resource users. To counter
this at the local level, user groups need to create and have their own social and political
capital.
25 Even before the restoration started, social structures were not equitable, and better-off
households were able to capture a bigger slice of the restoration benefits compared to
the poorer (with little or no land) or weaker (women). These differences were
recognized, and efforts were made to improve equity, where, for example Ngitili were
used as one of the strategies through which some communities indirectly cushion the
vulnerability of households classified as poor, e.g. the elderly, widows, and households
with no assets (Monela et al., 2005).
26 Successful processes such as Ngitili cannot be left to take care of themselves. Folke et al.
(2009: 105, Figure 5.1) summarize the importance of learning and feedback loops to
help pick up such issues. Table 2 articulates these learning and feedback loops in the
case of Shinyanga. If balance and equity are to be achieved, they need to be constantly
re-negotiated so that the poorer and less powerful can also improve their livelihoods.
27 Shepherd (2008) stated that “poor women explained to us that wealthy men were
rapidly acquiring land for their private Ngitili forests (for grazing their cattle) while
too little was being set aside for communal Ngitili for the needs of poorer users” (p.3).
Putting in place participatory monitoring (to assure that some of those danger signs
are picked up and addressed early) and evaluation (so that external perspectives can
help point out potential problem areas together with the means to address them) are
important in the longer term and beyond the project cycle. This demonstrates the
importance of continued interaction, and ensuring that there are mechanisms to
ensure equity both within the family (gender), and within the village (to reduce elite
capture).
S.A.P.I.EN.S, 7.2 | 2014
13

Table 2. Learning and Feedback Loops in Shinyanga: a Continuous Process
Over the nearly 30 years of the HASHI programme, learning has been a central theme at village,
government and NGO levels. Much of the learning originated in the recognition of the rich local
knowledge and institutional base of the Sukuma people. From the first learning that the people
wanted to plant/restore “their” trees as opposed to those of the Government, this fostered a
culture of “learning from the people, building on what they know” (W. Mlenge, personal
communication, 1987).
Loop 1: Government Forest Authority produced many (over one million) mostly exotic trees, which
were, in the main, left unplanted by villages and people.
Learning: Listen to and respect what trees local people want to plant and restore, build on
importance of local institutions (Ngitili, traditional Sukuma guards, or Sungsungu).
Loop 2: HASHI support for natural restoration and tree planting using species people wanted,
respecting local institutions, and ensuring that such knowledge and institutional systems are
respected by government.
Learning: Success can sow the seeds for its demise. As the restoration increased in scale and scope,
governance becomes an issue as land, hitherto with little value, assumed significant value —
resulting in elite capture becoming an important issue to deal with and manage.
Loop 3: Local governance to respect farmers, groups and villages restoration is still an issue, and
could be exacerbated by climate change impacts. Restoration now spread beyond the region to
neighbouring regions.
Learning: Need for improved tenure and secure rights for local people, as well as enhanced legal
recourse for such people, combined with the importance of downwardly accountable
representative government (especially at district and village levels).
28 Fair negotiated tenure rights would appear central to fostering equity, and reducing
incidences of elite capture. Here ‘institutional choice’ matters (Ribot et al. , 2008).
Donors, governments and NGOs may selectively engage elite elements of civil society,
and so reinforce existing hierarchies of exclusions. Sometimes customary authorities
can compromise or enhance representation. Choices of local partners and the structure
of local representation influence the formation and consolidation of accountable and
responsive local government.
Conclusions and key lessons
29 Natural resources are important livelihood options to meet cash needs (education,
building), for fuel and building timber, and to provide valuable medicinals at the local
levels. These are also key qualities for risk management and resilience enhancement in
that: a. there is diversity (different products); b. there are governance systems that are
self-organizing (village government, traditional institutions); c. the techniques are both
sustainable and owned locally (types of restoration, methods used); and d. there is
learning and adaptation (different types used and scales of Ngitili). The main outcomes
were largely a result of building social capital (appropriate local institutions which
enhanced cooperation and built adaptive capacities), restoring the natural capital
S.A.P.I.EN.S, 7.2 | 2014
14
(ecosystem functionality), and developing transforming structures (policies that
supported traditional knowledge and local institutions) (Barrow & Mlenge, 2008).
30 The Ngitili case is an example of trends that will become more common: if resources
acquire greater value, there will be greater competition for ownership of them. The
responses need to include improved tenure and improved legal recourse for the poor,
or we shall see increased injustice and impoverishment. Combined with ensuring
representation and downwardly accountable local government at all levels (but
especially district and village), local rights and authority to act is the way that people
can have a chance of adapting successfully in increasingly uncertain times. Community
action can lead to significantly improved ecosystems, even if the goal was not
ecosystem restoration.
31 The Ngitili example moved forest management from reserved forests to where even the
smallest Ngitili is recognized as important. The main principles underlying Ngitili are
simple: common sense, as this relates to forage and tree needs of the Sukuma people, so
it is easy to adapt and replicate, which has now happened in at least two neighbouring
regions (Mwanza and Tabora). But local ownership is key. Outsiders can play a
supportive role (policy, technical, facilitation) in a context that embraces local
knowledge and institutions in combination with local government institutions. This
enables trade-offs to be made at the local level, supports local level decision-making,
and recognizes the role that champions (often modest or even hidden) play at different
levels.
BIBLIOGRAPHIE
Adger, N., K. Brown & E. Tomkins (2006). The political economy of cross-scale networks in
resource co-management. Ecology and Society 10(2): 9.
Alden Wily, L. & S. Mbaya (2001). Land, People and Forests in Eastern and Southern Africa at the
Beginning of the 21st Century. The Impact of Land Relations on the role of Communities in Forest Future.
Nairobi, Kenya: IUCN Eastern Africa Programme.
Bandiaky, S. (2007). Engendering exclusion in Senegal's democratic decentralization:
subordinating women through participatory natural resource management. Conservation and
Society 6(1): 62-73.
Barrow, E., P. Brandstrom, M. Kabelele & I. Kikula (1988). Soil Conservation and Afforestation in
Shinyanga Region: Potentials and Constraints. Mission Report to NORAD, Dar-es-Salaam, Tanzania.
Nairobi: Norad, Tanzania.
Barrow, E. & W. Mlenge (2003, May). Trees as key to pastoralist risk management in semi-arid
landscapes in Shinyanga, Tanzania, and Turkana, Kenya. Paper presented at the International
Conference on Rural Livelihoods, Forest and Biodiversity, 26-30 May 2003, Bonn, Germany.
Barrow, E. & W. Mlenge (2008). Case Study 2: Forest Restoration in Shinyanga, Tanzania. In:
Fisher, R.J., S. Maginnis, W. Jackson, E. Barrow et al. (Eds.) Linking Conservation and Poverty
Reduction: Landscapes, People and Power, pp. 53-61. London: Earthscan.
S.A.P.I.EN.S, 7.2 | 2014
15
Bromley, D., D. Feeny, S. McKean, P. Peters et al. (1992). Making the Commons Work: Theory, Practice,
and Policy. San Francisco: Institute of Contemporary Studies Press.
Burtt, B.D. (1942). East African Vegetation Communities. J. Ecology XXX(1): 67-146.
Chambers, R. (1983). Rural Development: Putting the Last First. London: Longman.
Dutta, D. (2009). Elite Capture and Corruption: Concepts and Definitions. India: National Council of
Applied Economic Research.
Folke, C., R. Carpenter, B. Walker, M. Scheffer et al. (2010). Resilience Thinking: Integrating
Resilience, Adaptability and Transformability. Ecology and Society 15(4): 20.
Folke, C., F. Stuart Chapin III & P. Olsson (2009). Transformations in Ecosystem Stewardship. In:
Stuart Chapin III, F., G.P. Kofinas & C. Folke (Eds.) Principles of Ecoystem Stewardship: Resilience-
Based Natural Resource Managagement in a Changing World, pp. 103-125. New York: Springer.
Ghazi, P., E. Barrow & G. Monela (2005). Regenerating Woodlands: Tanzania's HASHI project. In :
World Resources Institute (Ed.) The Wealth of the Poor — Managing Ecosystems to Fight Poverty, pp.
131-138. New York: World Resources Insitute in collaboration with UNDP.
Ibhawoh, B. & J. Dibua (2003). Deconstructing Ujamaa: the legacy of Julius Nyerere in the quest
for social and economic development in Africa. Africa Journal of Political Science 8(1): 59-83.
Kaale, B., W. Mlenge & E. Barrow (2002, February). The potential of Ngitili for forest landscape
restoration in Shinyanga Region — a Tanzania case study. Paper presented at the International Expert
Meeting on Forest Landscape Restoration, 27-28 February 2002, Heredia, Costa Rica.
Kilihama, F.B. (1994). Trees and Indigenous Ecological Knowledge about Agroforestry Practices in the
Rangelands of Shinyanga Region, Tanzania. University of Wales, Bangor.
Maginnis, S., J. Rietbergen-McCracken & W. Jackson (2007). Introduction — What is FLR. In :
Rietbergen-McCracken, J., S. Maginnis & A. Sarre (Eds.) The Forest Landscape Restoration Handbook,
pp. 1-4. London: Earthscan.
Malcolm, D.W. (1953). Sukumaland, An African People and Their Country: A Study of Land Use in
Tanzania. London: OUP.
Maro, R.S. (1995). In Situ Conservation of Natural Vegetation for Sustainable Production in Agro-Pastoral
Systems. A Case Study of Shinyanga, Tanzania. Agriculture University of Norway, Aas.
Martin, A. (2004). Forestry Fact Sheet. Available from http://genderandenvironment.org/admin/
admin_biblioteca/documentos/
Meadows, D.H. (2008). Thinking in Systems: A Primer. Vermount: Chelsea Green Publishing.
Mlenge, W. (2005). Ngitili: An Indigenous Natural Resources Management System in Shinyanga,
Tanzania. Nairobi: Arid Lands Information Network - Eastern Africa.
Monela, G.C., S.A.O. Chamshama, R. Mwaipopo & D.M. Gamassa (2005). A Study on the Social,
Economic and Environmental Impacts of Forest Landscape Restoration in Shinyanga Region, Tanzania (pp.
xvii +205). Dar-es-Salaam, Tanzania: Forestry and Beekeeping Division of the Ministry of Natural
Resources and Tourism, United Republic of Tanzania, and IUCN — The World Conservation Union
Eastern Africa Regional Office.
Nyerere, J. (1962). The basis for African socialism. Government Printer, Dar-es-Salaam, Tanzania.
Ostrom, E. (1990). Governing the Commons. The Evolution of Institutions for Collective Action.
Cambridge: Cambridge University Press.
S.A.P.I.EN.S, 7.2 | 2014
16
Otsyina, R., S. Minae & D. Asenga (1993). The Potential of Ngitili as a Traditional Agroforestry System
among the Sukuma of Tanzania. Nairobi: ICRAF.
Otsyina, R., C. Rubanza & E. Zahabu (2008). Contribution of Tree Planting and Conservation Activities to
Carbon Offsets in Shinyanga. Dar-es-Salaam.
Ribot, J. (2004). Waiting for Democracy in the Politics of Choice in Natural Resource Decentralization.
Washington: WRI.
Ribot, J., C. Ashwini & T. Lakina (2008). Institutional choice and recognition in the formation and
consolidiation of local democracy. Conservation and Society 6(1): 1-11.
Shepherd, G. (2008). Forest restoration, rights and power: what's wrong in the Ngitili forests of
Shinyanga? Arborvitae, IUCN 36: 3.
RÉSUMÉS
This paper presents ecosystem (Miombo and Acacia woodland) restoration that has taken place
in Shinyanga, Tanzania since 1985. Prior to 1985, the region had been degraded of its Acacia and
Miombo woodlands (as part of tsetse fly eradication and cash crop based agricultural expansion).
As a result, these two ecosystems nearly collapsed. By 2004, more than 300,000 ha of woodland
had been restored across the 833 villages of the region with an economic value of US$14 per
person per month. Nearly every family had their own restored patch of woodland, while groups
and villages had much larger areas of restored woodlands. While the details of this large scale
ecosystem restoration are reasonably well known, the underlying reasons for the success of the
restoration are less well known. They go way beyond the technicalities of ecosystem restoration.
The case study explores how issues of personalities, enabling policy, decentralized and
participatory governance, gender, traditional knowledge and institutions, contribute to
woodland restoration (where all scales count — from small family forests to larger village
forests). Both the more technical aspects of ecosystem restoration and all the socio-political
aspects were central to this success. However even these issues are part of ongoing processes of
negotiating and re-negotiating local level governance and management arrangements. Overall
the combination of the ecosystem restoration and governance arrangement resulted in more
resilient communities, land use and ecosystems.
INDEX
Keywords : Forest landscape restoration, Tanzania, traditional knowledge, policy, multiple
benefits, governance, champions, elite capture, livelihood and conservation benefits
AUTEURS
EDMUND BARROW
Director of IUCN’s Global Ecosystem Management Programme, IUCN, Rue Mauverney 28, 1196
Gland, Switzerland, E-mail: [email protected]
S.A.P.I.EN.S, 7.2 | 2014
17
CASE STUDY: Community BasedEcological Mangrove Rehabilitation(CBEMR) in IndonesiaFrom small (12-33 ha) to medium scales (400 ha) with pathways foradoption at larger scales (>5000 ha)
Ben Brown, Ratna Fadillah, Yusran Nurdin, Iona Soulsby et Rio Ahmad
Gaëll Mainguy (éd.)
NOTE DE L’ÉDITEUR
This manuscript was published as part of a special issue on the subject of largescale
restoration of ecosystems. This manuscript was reviewed by three anonymous referees.
Facts and Figures
Location
1 Tanakeke Island is located just off the mainland of South Sulawesi Province, Indonesia
(Figure 1). A coral atoll, the island exhibits coral reef, seagrass and over-wash
mangrove forest ecosystems, with a small proportion of terrestrial area. The main
livelihood of most islanders is seaweed farming which takes place in expansive sub-
tidal lagoons. Fishing along the reefs and out to sea is undertaken by the entire
community of 10 073 inhabitants.1 During the 1990s, 1200 ha of the island’s 1776 ha of
mangrove forest were converted to shrimp/milkfish aquaculture ponds (Ukkas, 2011).
Of this total, 800 ha are community owned – yet largely disused – as Tanakeke Islanders
have difficulty purchasing external inputs, maintaining dike walls and productivity,
and have largely converted to seaweed mariculture. Tenure over 400 ha of converted
mangrove forests has been granted to the Ministry of Transmigration, and as such has
not yet been considered for mangrove rehabilitation (ibid.). The remaining 576 ha of
S.A.P.I.EN.S, 7.2 | 2014
18

mangroves is frequently clear-felled, for charcoal production, fuelwood, construction
poles, fishing equipment and structural supports for seaweed mariculture.
Figure 1. Tanakeke Island, South Sulawesi
A: This landsat photo was taken in 1976, depicting 1776 hectares of intact over-wash mangroveforest. (Source: Landsat.org, Global Observatory for Ecosystem Services, Michigan State University,http://landsat.org.)
B: The recent Quickbird image reveals approx. 1200 hectares of conversion to aquaculture ponds,which took place in the 1990s and early part of the 21st century. The inset indicates the location ofTanakeke approximately 12 km off the southeast corner of South Sulawesi.
Source: Quickbird Satellite Image. Longmont, Colorado : Digital Globe, 2010
2 Of the 800 ha of community owned ponds, 400 ha were made available for Ecological
Mangrove Rehabilitation (EMR) (Lewis, 2005, 2009b) over a four year period, the
process and results of which are discussed below.
3 Social organising and physical work were initiated and implemented by Mangrove
Action Project – Indonesia as part of the 4.5 year, USD 7.7 million Restoring Coastal
Livelihood (RCL) project funded by the Canadian International Development Agency
(CIDA) and OXFAM-GB. Yayasan Konservasi Laut, a local NGO partner based in
Makassar, provided community organising and policy assistance. Numerous
government agencies were involved in terms of coordination, training, and policy
development at four levels:
Village level: Village Government, Community Representative Board (BPD);
Sub-district/District level: Fisheries Dept., Forestry Dept., Planning Dept., Social Agency,
Technical Outreach and Extension Agency (PPL), Multi-stakeholder Mangrove Management
Working Group (KKMD);
Provincial level: Fisheries Dept, Forestry Dept, Planning, Technical Outreach and Extension
Agency (PPL), KKMD;
National level: Ministry of Environment, Ministry of Forestry, Mangrove Management
Agency (BPHM I), Multi-stakeholder Mangrove Management Working Group (KKMN).
4 The University of Hasanuddin provided technical support, background studies,
guidance and eight university undergraduate and graduate volunteers. Additional, on-
going technical support is being provided by National University of Singapore –
Geography Department (modeling, substrate elevation measurements) and Charles
Darwin University – Research Institute for Environment and Livelihoods (carbon stock
assessment, livelihood monitoring guidance).
•
•
•
•
S.A.P.I.EN.S, 7.2 | 2014
19
Main Objectives
Improved hydrology and promotion of natural revegetation in 400 ha of disused aquaculture
ponds with minimal need for planting mangroves.
1250 – 3750 volunteer (not planted) seedlings established and growing healthy (compared to
benchmark) three years after initial hydrological rehabilitation.
Re-establishment of the natural biodiversity of mangrove fauna (species and community
associations) – based on previous surveys and interviews with elders.
Development of community based mangrove management regulations; primarily delineating
sustainable timber harvest practices and zones, as well as village conservation forests (hutan
pangandriang).
Improved community awareness and vigilance through formation of forest management
learning groups (FMLGs) and “Womangrove” groups, development of sustainable livelihood
alternatives and support of environmental education for school children.
Formation of a KKMD at the district level with a long-term mandate to guide conservation
and sustainable utilisation of Tanakeke Island’s mangrove ecosystem.
Legitimisation of village community management plans by the KKMD.
Benefits to Community
Storm protection. Villages on the Western end of the island have experienced extreme
flooding events and erosion of landforms after conversion of mangroves to aquaculture.
Enhanced fisheries. Although not scientifically monitored, communities are currently
monitoring crab, shrimp and fish populations in tidal creeks twice a year through
participatory monitoring. Fisheries studies will be built into future projects, with the intent
of re-establishing 75% of a functional fisheries equivalent to the mangrove area within seven
years of restoration.
Improved growth of tree biomass. Current clear-felling practices (on 6-8 year cycles) and dense
re-growth have resulted in low overall biomass production.
Increased resilience of the mangrove system due to enhanced biodiversity; especially re-
establishment of mangrove species at lower intertidal elevations (Sonneratia alba, Avicennia
marina and A. alba).
Development of non-timber forest products for subsistence use and local markets.
•
•
•
•
•
•
•
•
•
•
•
•
S.A.P.I.EN.S, 7.2 | 2014
20
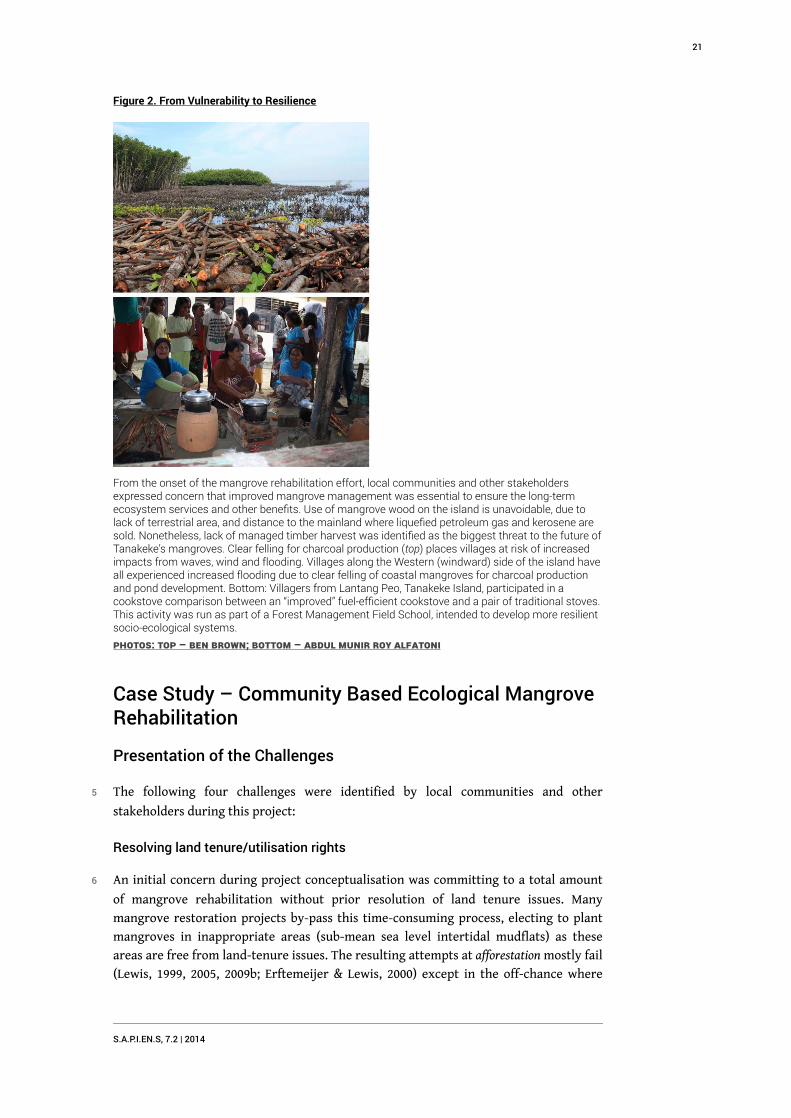
Figure 2. From Vulnerability to Resilience
From the onset of the mangrove rehabilitation effort, local communities and other stakeholdersexpressed concern that improved mangrove management was essential to ensure the long-termecosystem services and other benefits. Use of mangrove wood on the island is unavoidable, due tolack of terrestrial area, and distance to the mainland where liquefied petroleum gas and kerosene aresold. Nonetheless, lack of managed timber harvest was identified as the biggest threat to the future ofTanakeke’s mangroves. Clear felling for charcoal production (top) places villages at risk of increasedimpacts from waves, wind and flooding. Villages along the Western (windward) side of the island haveall experienced increased flooding due to clear felling of coastal mangroves for charcoal productionand pond development. Bottom: Villagers from Lantang Peo, Tanakeke Island, participated in acookstove comparison between an “improved” fuel-efficient cookstove and a pair of traditional stoves.This activity was run as part of a Forest Management Field School, intended to develop more resilientsocio-ecological systems.
Photos: top – Ben Brown; bottom – Abdul Munir Roy Alfatoni
Case Study – Community Based Ecological MangroveRehabilitation
Presentation of the Challenges
5 The following four challenges were identified by local communities and other
stakeholders during this project:
Resolving land tenure/utilisation rights
6 An initial concern during project conceptualisation was committing to a total amount
of mangrove rehabilitation without prior resolution of land tenure issues. Many
mangrove restoration projects by-pass this time-consuming process, electing to plant
mangroves in inappropriate areas (sub-mean sea level intertidal mudflats) as these
areas are free from land-tenure issues. The resulting attempts at afforestation mostly fail
(Lewis, 1999, 2005, 2009b; Erftemeijer & Lewis, 2000) except in the off-chance where
S.A.P.I.EN.S, 7.2 | 2014
21
significant sedimentation is occurring, which raises the substrate level to or above
mean sea level.
7 An initial visit to the provincial forestry department of South Sulawesi clarified that
both forested lands and aquaculture ponds on Tanakeke Island fell outside of their
direct jurisdiction, and were rather, under the jurisdiction of the district Bureau of
Land Management (Badan Pertanahan – Takalar), who issue private ownership
certificates. Of the 800 ha of community owned ponds, less than half had formal
certificates, but all 800 were recognised by traditional ownership. An additional 400 ha
of ponds had been developed for aquaculture by the Ministry of Transmigration, but
were not considered for rehabilitation under the RCL as they are still actively managed.
8 The majority of coastal community members in each of the six partnering villages,
either with or without formal ownership, were eager to rehabilitate disused ponds,
although some owners wished to revitalise their ponds for aquaculture. It was also
common that additional land owners pledge their ponds for rehabilitation, in year two
after initial rehabilitation in each village.
9 Pond owners, both formal and informal, required assurances that once rehabilitated to
mangroves, they would maintain land ownership over their areas, fearing that restored
forests might subsequently be claimed by the district or provincial forest department.
This issue was resolved through a series of public forums which led to the development
of community forestry management plans, where legal title over rehabilitated forests
was declared to be retained by individual owners, with the following conditions:
Rehabilitated lands may not be clear-cut in the future. Timber harvest would be allowed in
accordance with village forestry management plans (see Figure 2).
Access to non-timber forest products including fisheries products is to be open to all
community members.
Landowners will no longer be required to pay land or aquaculture taxes, as their ownership
certificates are now classified as conservation/sustainable utilisation easements.
Traditional owners without certificates will be assisted by the project and the newly formed
district level KKMD to register their lands with the Bureau of Land Management and tax
office.
Each village will designate a hutan pangandriang, which is a strict reserve for ecological
services.
10 These stipulations also provide communities with long-term assurance that mangroves
will not be encroached upon or degraded by outside stakeholders.
Challenge to normative, project-oriented, over-simplified planting practices
11 As stated above, the majority of mangrove “restoration” projects in this region of the
world involve preparing seedlings in polybags or direct root propagules (usually of the
genus Rhizophora), which are then hand-planted in straight rows at spacings of less than
a metre. Little attention is paid to planting appropriate substrate elevations (between
mean sea level and high mean water spring). Fences are sometimes constructed to
protect against livestock grazing. Little to no monitoring is undertaken, and mortality
is often blamed on livestock, poor planting practices, poor planting material, pests, or
high waves/currents.
12 Overcoming this was achieved through EMR workshops, after which workshop
participants prepared mechanisms to build community awareness about the EMR
•
•
•
•
•
S.A.P.I.EN.S, 7.2 | 2014
22

process (described in section 2.0). A study tour to a previous successful EMR site
(Tiwoho, North Sulawesi) was also used to build consensus for the EMR process.
Developing near-term sustainable livelihood assistance while communities wait
for mangrove recovery.
13 Coastal communities in Indonesia often consider themselves poor, due to lack of cash
savings, although many have substantial capital assets (home, boat, farmland,
fishponds, etc.). Many rural coastal community members, however, are genuinely poor,
with incomes of less than $2 a day in the four RCL work districts. Livelihood assistance
in this project took two major forms: 1) improved management of existing natural
resource based livelihoods (often reducing reliance on external inputs) and 2)
development of alternative livelihoods. Without a livelihoods focus, it was feared that
communities would be less supportive of mangrove rehabilitation efforts, especially
leeward communities which were not directly threatened by the strong winds and
waves experienced on the windward side of the island.
Building gender awareness, ensuring equal female participation throughout
process,
14 Women are responsible for half of the food production and collection on Tanakeke
Island, yet do not have formal title to land, and are often excluded from decision-
making (Restoring Coastal Livelihoods, 2012). Prior to the project, male stakeholders all
too easily discounted female participation in mangrove rehabilitation and management
programs. A concerted effort, not only to involve women equally as participants, but to
involve all project participants in gender awareness trainings and activities was
required. Today, “Womangrove” groups have a strong voice in how mangrove
resources will be managed and used on the island, with gender sensitivity embedded in
all programs, government meetings, processes and regulations. Representatives of four
out of six Womangrove groups on Tanakeke are members of the KKMD.
Description of the Pool of Expertise
15 Mangrove Action Project (MAP) learned the principles of EMR and strategic breaching
of pond walls from a pioneer in the field, Roy R. Lewis III of Florida, USA, who has
served as lead practitioner on several thousand hectares of mangrove rehabilitation in
the USA and Latin America as well as leading technical trainings in Asia (Lewis 2005,
2009a,b) Ben Brown of MAP-Indonesia has led ten EMR trainings in Southeast Asia, and
designed successful EMR projects in North Sumatera (10 ha), Riau (33 ha), and North
Sulawesi (12 ha) prior to the 400 ha of EMR on Tanakeke Island. The MAP-Indonesia
EMR team consists of three full-time ecology staff, three full time community
organisers, eight university volunteers, and twelve villagers from Tanakeke Island
trained in community organising. This gender-balanced team is assisted by technical,
planning and regulatory government agencies from the sub-district and district level,
and technical extensionists from district and provincial level.
16 Additional technical support is being provided by a pair of regional universities. Ph.D.
Dan Friess of National University of Singapore – Geography Division and his student
Rachel Oh are assisting with substrate elevation measurements and modeling. Ph.D.
S.A.P.I.EN.S, 7.2 | 2014
23

Lindsay Hutley and Clint Cameron from Charles Darwin University – Research Institute
for Environmental and Livelihoods (CDU-RIEL) are assisting with a carbon stock
assessment, while Ph.D. Natasha Stacey, also of CDU-RIEL is assisting with livelihoods
and social welfare indicators.
Funding Resources and Mechanisms
17 The RCL project totals CAD 7.7 million, funded 90% by CIDA and 10% by OXFAM-GB who
also facilitate the project out of Makassar, South Sulawesi. The project works in four
districts in South Sulawesi: Takalar, Maros, Pangkep and Barru. Among its goals are 400
ha of mangrove rehabilitation and 2000 ha of improved management of intertidal
resources. Mangrove rehabilitation at Tanakeke Island totals 400 ha with an additional
25 ha being implemented on the mainland in the district of Maros. The total cost of 425
ha of mangrove rehabilitation is USD 440,000 (including physical rehabilitation,
community organising and governance work) plus USD 150,000 to support MAP staff
assigned to EMR over a four-year period. This works out to a project total of 425 ha of
restoration at a cost of USD 590,000 or $1388/ha.
18 The value of mangroves, once restored, has not yet been determined. A participatory
Total Economic Valuation2 is being carried out on Panikiang Island, which serves as the
nearest reference forest for Tanakeke, three districts to the North in the Barru District.
19 A KKMD is being formed at the district level in Takalar, enabled by Presidential Decree
73, 2012 and described in the National Mangrove Strategy. The KKMD will be able to
access short and medium term government budgets in order to continue support of
rehabilitation, monitoring and management activities, being termed Adaptive
Collaborative Management. No form of carbon finance has yet been considered for this
site.
Regulatory Context: Facilitating Actions or Constraints
20 Both a bottom-up and top-down approach was used in this project. Community leaders
in each village helped identify poor and vulnerable community members who comprise
at least 75% of any activity group. Initial activities include; EMR, livelihoods
development (through a program called Coastal Field School), and literacy programs.
After these activities were run for one or more seasons, community members became
engaged in a process to designate community based mangrove management
regulations. This activity eventually became formalised as a Forest Management Field
School participated in by FMLGs. A pair of curricula for this had originally been created
by the Regional Community Forestry Training Center (RECOFTC) based in Bangkok in
2002, and translated into Bahasa Indonesia for the purposes of dissemination
(Miagostovich, 2002b, 2002c). Currently these curricula are being used to build the
capacity of forestry extensionists (called PPL) at the sub-district and district levels.
21 After 1-2 years in FMLGs, group members gain audiences with government officials to
present their community forestry management plans for formal government
acknowledgement. These government officials are prepared beforehand, during office
and field visits, and participation in trainings, workshops and seminars.
22 Regarding the top-down approach, MAP met with national level government officials
tasked with mangrove management and coastal community welfare. Most prominent
S.A.P.I.EN.S, 7.2 | 2014
24

amongst these were agencies such as the Directorate General of Watersheds and Social
Forests, the Office of Mangrove Management (BPHM) and the National Mangrove
Working Group (KKMN). In 2013, the head of BPHM Region I visited South Sulawesi for
a public consultation to adapt the National Mangrove Strategy, to fit the needs of the
Province. Subsequently, a regional KKMD was formed at the Provincial level, with
management of Tanakeke Island and promotion of EMR explicitly mentioned in three
points of an eleven point agenda. In late 2013, a district level KKMD was initiated in
Takalar District to more adequately address the specific mangrove management needs
of Tanakeke Island. Members of FMLGs and Womangrove groups both continue to
participate in the District KKMD.
Details of Restoration Plans and Results
23 The EMR process, as developed by R.R. Lewis and Mangrove Action Project contains six
steps (Lewis, 2005, 2009a,b; Brown & Lewis, 2006):
Ecological assessment (autecology and community associations in reference forest and the
rehabilitation site).
Hydrological assessment (in reference forest and the rehabilitation site).
Disturbance Assessment.
Land ownership resolution, planning & design.
Implementation.
Monitoring and Mid-course corrections.
24 This general pattern was followed during the projects in Tanakeke, but in practice
required the addition of numerous sub-steps (up to 22), predominantly dealing with
community organising. Below we present a process involving nine major steps, which
takes into consideration the evolution of the process as mangrove rehabilitation efforts
expanded from an initial site to six villages over four years.
Step One: Rapid Assessments
25 Experienced mangrove rehabilitation practitioners meet with village leaders and walk
around the perimeter of the mangrove area, occasionally transecting the area to gain a
quick understanding for the potential of rehabilitation. On Tanakeke Island this
process began in Lantang Peo village. A quick walk revealed approximately 45 ha of
aquaculture ponds adjacent to the village. Ponds on the outskirts of the aquaculture
complex were largely disused (for approximately 6 years), and showed excellent levels
of natural colonisation, due to lack of dike wall maintenance. These ponds served as
chronoseres, aiding in the understanding of local natural revegetation processes and
thus natural breaching of pond walls. The “empty” ponds in the middle were recently
disused (fewer than three years beforehand), mostly unvegetated (<550 plants/ha) and
were not excavated, so that substrate levels in the middle of the ponds were adequate
for seedling colonisation, although deeper troughs adjacent to dike walls filled with
fluid mud were unable to support colonisation. It was rapidly assessed that species
normally located at lower elevations in the intertidal zone (Sonneratia alba, Avicennia
marina) were largely absent from the site, having been removed historically due to
community preference for Rhizophora species. Subsequently, the lower extent of the
1.
2.
3.
4.
5.
6.
S.A.P.I.EN.S, 7.2 | 2014
25
mangroves (coastal mangrove zone) was missing, as Rhizophora mangroves were not
able to colonise these lower substrate elevations with higher wave energy.
26 In terms of community willingness to be involved in mangrove rehabilitation, within 36
hours of the initial field visit, 30 pond owners had pledged 30 ha of disused ponds for
rehabilitation. The majority of community members had given up on aquaculture,
switching their main livelihood to the mariculture of carageenan seaweeds. The
community was well aware of the benefits of mangroves, and wished their forests back,
for fisheries production, timber, and storm protection. Planting projects, however,
initiated by the government in the past, had been largely unsuccessful. Determining
why required more deliberate assessment.
27 This pattern of rapid community support for mangrove rehabilitation continued
throughout the project in the next five villages, assisted by testimonials from the
villagers of Lantang Peo, including the village head, Daeng Opu.
Step Two: Social Assessments
28 It was the intent of the project to provide equal opportunity to women and to
vulnerable and poor community members. As such, village leaders were asked to assist
in identification of vulnerable community members, who were to make up at least 75%
of all program participants, with greater than 50% women. The following assessments
were undertaken in a variety of settings including community meetings, field schools
and other activities:
stakeholder analysis;
gender analysis;
gendered seasonal calendar;
land tenure/ownership survey.
Step Three: EMR Technical Training
29 Three EMR technical trainings were run over the course of four years with members of
all six participating villages. Trainings ran for four days and covered the major points
of EMR including: a review of past projects; a review of the environmental needs of
mangroves; field surveys of hydrology, ecology and disturbance; mapping exercises;
development of a draft rehabilitation plan; and draft community organising plan and
monitoring.
Step Four: Baseline Surveys
30 MAP-Indonesia has developed a baseline survey and monitoring methodology
described in detail in section 3.6. These surveys were informed by methods from a time
zero survey developed for the Cross Bayou Restoration project (Florida Dept. of Env.
Protection, 1999), as well as the “Long Plot Method For Determining Biomass,”
developed by Norm Duke and colleagues at James Cook University. (TropWATER, 2013)
Step Five: Stakeholder Meetings and Design
31 Informal discussions, focus group discussions, and community meetings (musyawarah)
are run quite often in the build-up to a community based EMR effort. During the initial
project in Lantang Peo, government was minimally consulted. Over time, government
•
•
•
•
S.A.P.I.EN.S, 7.2 | 2014
26
agents are increasingly involved, to the point where formal multi-stakeholder forums
are initiated. Ramping up government involvement over time is intentional, in order to
provide community members with opportunities to build skills, knowledge and
experience to a point where they are empowered enough to meet with government
officials on equal footing.
Step Six: Implementation
32 All six mangrove rehabilitation projects on Tanakeke Island involved:
Local community labor with hand tools;
Strategic Breaching of Dike Walls (Brown & Lewis, 2006);
Creation of tidal channels;
Periodic hand distribution of all native propagules into the rehabilitation area;
Planting trials;
Mounding trials (increasing substrate height with fill from dike walls. Occasional inclusion
of beach wrack, charcoal or bamboo into the substrate.
33 No substantial addition of fill, or erosion control measures were attempted in the
Tanakeke project. Some amount of hand-planting is taking place in certain villages, up
to 10% of any given village site.
34 Heavy machinery was not used on Tanakeke Island, due to distance from the mainland
and lack of excavated ponds to repair. The 25 ha trial in Maros District, scheduled for
2014, will use heavy machinery to selectively breach dike walls, dig tidal channels and
created mounded areas, in combination with local labor and hand tools.
Step Seven: As-built Surveys and Monitoring
35 Described below in 3.6.
Step Eight: Development of Forest Management Learning Groups
36 MAP-Indonesia translated a pair of training manuals from the RECOFTC on
development of FMLGs (Miagostovich, 2002b, 2002c). These curricula use the field
school methodology, which was already familiar to community participants and
extensionists in South Sulawesi, who took part in the RCL Coastal Field School program,
as well as prior farmer field school programs in the region.
37 The long term objectives of FMLGs are (Miagostovich, 2002a):
Identifying, generating and testing locally appropriate forest management practices to
ensure local users’ needs are being met;
Improving the capacities, knowledge and confidence of users to more actively manage local
forest area to satisfy local needs;
Strengthening the capacities, knowledge, analytical skills and confidence of facilitators in
working with local forest users;
Improving the relations between users and forest department staff.
Gradually improving existing management plans to ensure that they are addressing the
changing needs of local people;
Generating locally developed information and create opportunities for networking and the
spread of locally appropriate information.
•
•
•
•
•
•
•
•
•
•
•
•
S.A.P.I.EN.S, 7.2 | 2014
27
Step Nine: Mid-course Corrections
38 Mid-course corrections are informed by analysis of data collected during both
participatory and academic monitoring activities (see section 3.6). Communities and
mangrove rehabilitation practitioners determine appropriate mid-course corrections
during community meetings. Common mid-course corrections on Lantang Peo
included:
Hand-digging perpendicular branches on tidal channels;
Connecting tidal channels;
Closing off select dike wall breaches to increase flows and (scouring effect) through primary
channels;
Continued propagule dispersal;
Augmentation planting;
Creating mounded areas above MSL.
39 A search for halophytic grass species growing near mean sea level was undertaken but
unsuccessful. In other projects, planting of halophytic grasses is used to stabilise
substrates, capture mangrove propagules, and enhance edaphic conditions for
mangrove colonisation (Friess et al., 2011; Lewis & Dunstan, 1975).
Monitoring Methods
40 A pair of monitoring methods are employed in this project, both academic and
community-based/participatory.
Academic Monitoring
41 Academic monitoring consists of baseline surveys, as-built surveys and periodic
monitoring, undertaken by a team of community members, MAP staff and volunteers
from University of Hasanuddin.
42 Baseline surveys include autecology, community associations, hydrological features,
disturbances and land ownership. As-built surveys rectify the mangrove rehabilitation
plan using a GPS to place ecological and hydrological repairs on a site map. Monitoring
of vegetation and development of tidal channels uses the following method.
43 Prior to rehabilitation of each site, ten 20m x 5m vegetation plots (Duke et al., 2013)
were permanently established shore-left in a random stratified design. Within each
100m2 plot, total counts of trees (dbh3 > 2.5 cm, height > 130 cm), saplings (dbh < 2.5 cm,
height > 100 cm) and seedlings (height < 100 cm) of each species were determined. Girth
of each tree was recorded using a tape measure and from this the cross-sectional area,
or basal area (BA), was calculated to give an indication of growth and dominance. Tree
height was recorded using an extendable height stick. Heights of the first ten saplings
and seedlings encountered were recorded.
44 All current and historical water flows were mapped using a GPS tracking device and
personal interviews with village elders. Measurements were repeated at quarterly
intervals during the first year, semi-annually two and three years after the initial
intervention, and annually thereafter (planned and funded for a total period of five to
seven years depending on the starting time of the intervention).
•
•
•
•
•
•
S.A.P.I.EN.S, 7.2 | 2014
28

45 To reduce variability caused by small areas of localised high recruitment (on dike walls
and previously abandoned ponds), only plots located in “empty” (< 550 trees per ha
before rehabilitation), recently disused (< 3 years) shrimp ponds were used in data
analyses. The relationship between average stem densities over time were examined
per site using a correlation analysis. Changes in mangrove densities between the
baseline survey and most recent survey were analyzed with paired student t-tests using
“months since rehabilitation” and “average densities” as group factors at 95%
confidence levels.
Participatory Monitoring
46 Participatory monitoring was developed as a community organising activity, to engage
the local community in tracking the success or failure of their efforts, and in
prescribing mid-course corrections. A simplified, highly graphic data sheet was created
to allow all community members to participate, even those uncomfortable with
reading. An example of the data sheet is provided in Figure 3. Community organisers
and members of the academic monitoring team lead community groups in indoor
discussions about monitoring, and then head to the field for full day monitoring events,
twice a year. The results of each event are discussed and saved for comparison over
time.
S.A.P.I.EN.S, 7.2 | 2014
29
Figure 3. Two levels of mangrove rehabilitation monitoring: 1) academic and 2) participatory
A: The academic EMR monitoring team working on a long-plot at a 10 month old site in Balang DatuPesisir. Monitoring in the first year takes place quarterly, semi-annually in years 2 and 3, and annuallythereafter for a total period of at least 5 years. (Photo: Ben Brown.) B: Participatory monitoring takesplace twice a year. Here a community member records data in front of the group immediately afterreturning from the field. (Photo: Rio Ahmad.) C: The participatory monitoring data sheets are graphicand user friendly. They qualitatively track the amount and diversity of vegetation and select biota, aswell as the condition of dike walls and drainage channels forming in the rehab area.
Source: RCL Project Data Sheet
Governance: Forms of Cooperation, Innovations etc.
47 As described above, Presidential Decree No. 72, 2012 put forth a National Mangrove
Strategy, in which multi-stakeholder boards were called for at the national, provincial
and district levels (known as KKMN and KKMD respectively). This project had both a
bottom-up and top-down approach. Grassroots development of community skills,
knowledge and experience in mangrove rehabilitation and mangrove resource
management was accomplished through EMR, Coastal Field Schools and environmental
education programs. The project also actively initiated the development of a multi-
stakeholder forum, which, although mandated by central government, was slow in
forming at the provincial level. Providing real-life examples of mangrove management
for the working group to “champion,” enabled the more earnest development of the
KKMD, and set the stage for equitable participation by community practitioners.
48 Improving the capacity of forestry and fisheries extension agents ensures that
increased collaboration will take place in the field, between government and
community. Formalisation of this process involved development of Coastal Field
School, FMLG and EMR curricula as well as training of trainer programs.
S.A.P.I.EN.S, 7.2 | 2014
30
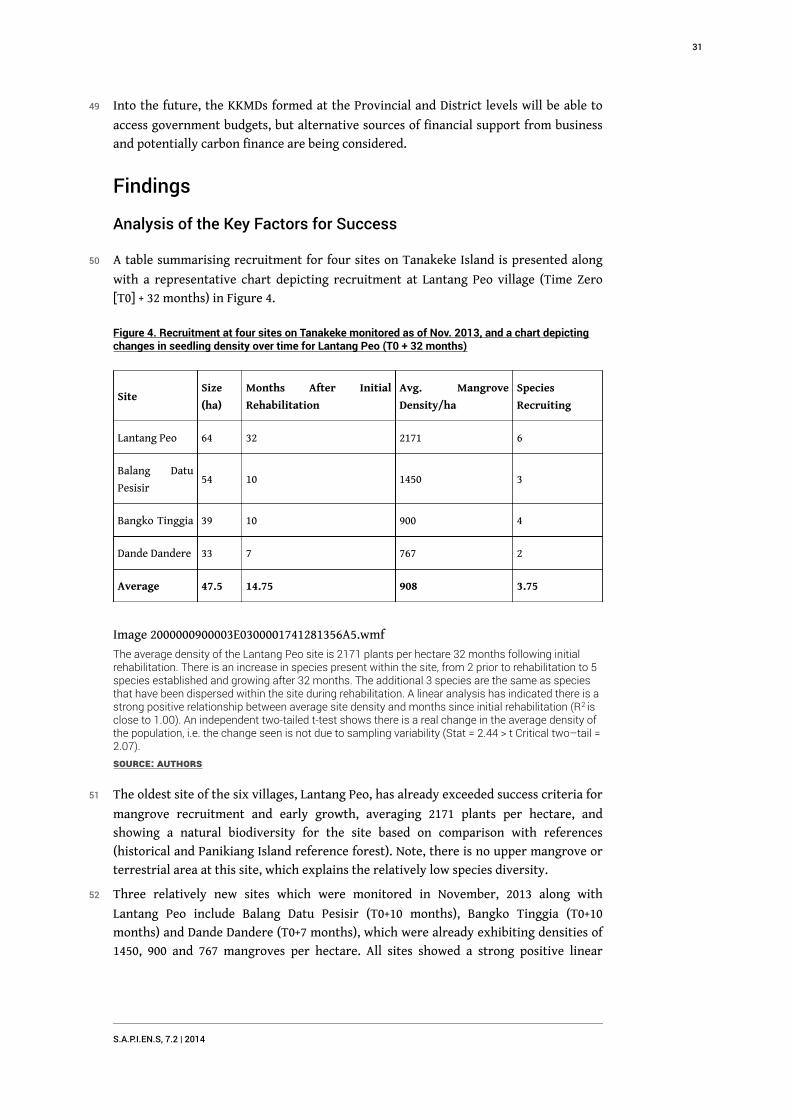
49 Into the future, the KKMDs formed at the Provincial and District levels will be able to
access government budgets, but alternative sources of financial support from business
and potentially carbon finance are being considered.
Findings
Analysis of the Key Factors for Success
50 A table summarising recruitment for four sites on Tanakeke Island is presented along
with a representative chart depicting recruitment at Lantang Peo village (Time Zero
[T0] + 32 months) in Figure 4.
Figure 4. Recruitment at four sites on Tanakeke monitored as of Nov. 2013, and a chart depictingchanges in seedling density over time for Lantang Peo (T0 + 32 months)
SiteSize
(ha)
Months After Initial
Rehabilitation
Avg. Mangrove
Density/ha
Species
Recruiting
Lantang Peo 64 32 2171 6
Balang Datu
Pesisir54 10 1450 3
Bangko Tinggia 39 10 900 4
Dande Dandere 33 7 767 2
Average 47.5 14.75 908 3.75
Image 2000000900003E0300001741281356A5.wmf
The average density of the Lantang Peo site is 2171 plants per hectare 32 months following initialrehabilitation. There is an increase in species present within the site, from 2 prior to rehabilitation to 5species established and growing after 32 months. The additional 3 species are the same as speciesthat have been dispersed within the site during rehabilitation. A linear analysis has indicated there is astrong positive relationship between average site density and months since initial rehabilitation (R2 isclose to 1.00). An independent two-tailed t-test shows there is a real change in the average density ofthe population, i.e. the change seen is not due to sampling variability (Stat = 2.44 > t Critical two–tail =2.07).
Source: Authors
51 The oldest site of the six villages, Lantang Peo, has already exceeded success criteria for
mangrove recruitment and early growth, averaging 2171 plants per hectare, and
showing a natural biodiversity for the site based on comparison with references
(historical and Panikiang Island reference forest). Note, there is no upper mangrove or
terrestrial area at this site, which explains the relatively low species diversity.
52 Three relatively new sites which were monitored in November, 2013 along with
Lantang Peo include Balang Datu Pesisir (T0+10 months), Bangko Tinggia (T0+10
months) and Dande Dandere (T0+7 months), which were already exhibiting densities of
1450, 900 and 767 mangroves per hectare. All sites showed a strong positive linear
S.A.P.I.EN.S, 7.2 | 2014
31
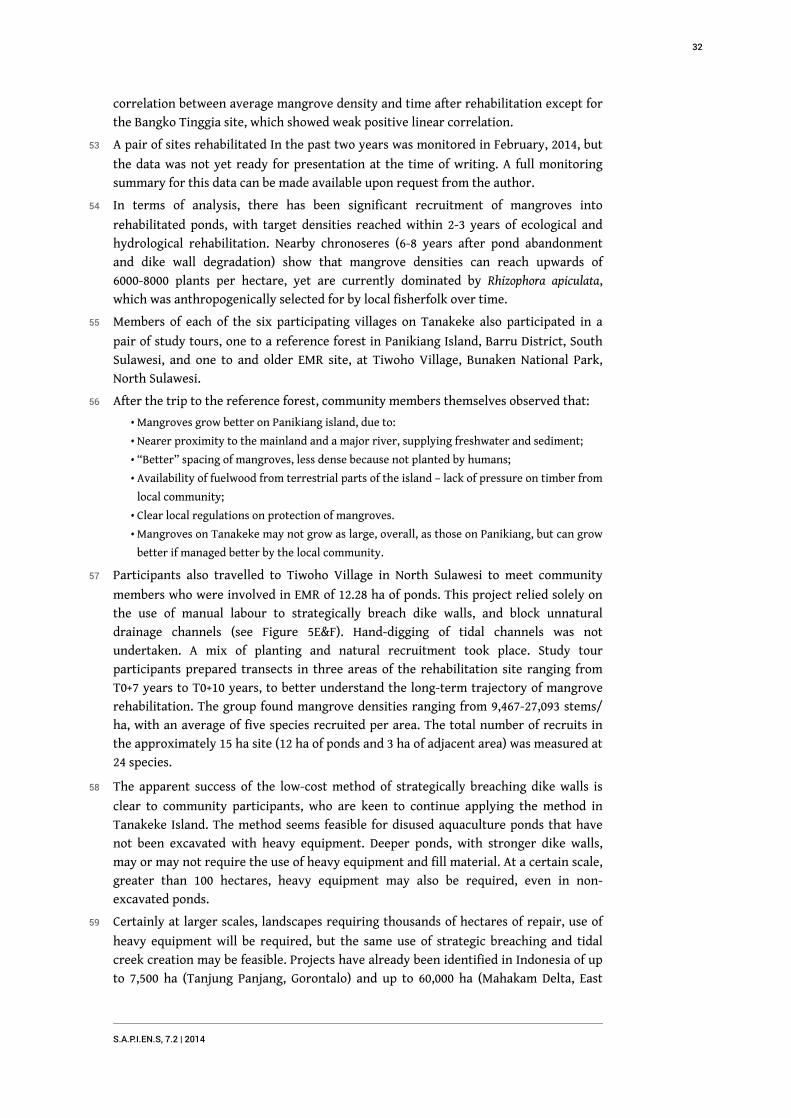
correlation between average mangrove density and time after rehabilitation except for
the Bangko Tinggia site, which showed weak positive linear correlation.
53 A pair of sites rehabilitated In the past two years was monitored in February, 2014, but
the data was not yet ready for presentation at the time of writing. A full monitoring
summary for this data can be made available upon request from the author.
54 In terms of analysis, there has been significant recruitment of mangroves into
rehabilitated ponds, with target densities reached within 2-3 years of ecological and
hydrological rehabilitation. Nearby chronoseres (6-8 years after pond abandonment
and dike wall degradation) show that mangrove densities can reach upwards of
6000-8000 plants per hectare, yet are currently dominated by Rhizophora apiculata,
which was anthropogenically selected for by local fisherfolk over time.
55 Members of each of the six participating villages on Tanakeke also participated in a
pair of study tours, one to a reference forest in Panikiang Island, Barru District, South
Sulawesi, and one to and older EMR site, at Tiwoho Village, Bunaken National Park,
North Sulawesi.
56 After the trip to the reference forest, community members themselves observed that:
Mangroves grow better on Panikiang island, due to:
Nearer proximity to the mainland and a major river, supplying freshwater and sediment;
“Better” spacing of mangroves, less dense because not planted by humans;
Availability of fuelwood from terrestrial parts of the island – lack of pressure on timber from
local community;
Clear local regulations on protection of mangroves.
Mangroves on Tanakeke may not grow as large, overall, as those on Panikiang, but can grow
better if managed better by the local community.
57 Participants also travelled to Tiwoho Village in North Sulawesi to meet community
members who were involved in EMR of 12.28 ha of ponds. This project relied solely on
the use of manual labour to strategically breach dike walls, and block unnatural
drainage channels (see Figure 5E&F). Hand-digging of tidal channels was not
undertaken. A mix of planting and natural recruitment took place. Study tour
participants prepared transects in three areas of the rehabilitation site ranging from
T0+7 years to T0+10 years, to better understand the long-term trajectory of mangrove
rehabilitation. The group found mangrove densities ranging from 9,467-27,093 stems/
ha, with an average of five species recruited per area. The total number of recruits in
the approximately 15 ha site (12 ha of ponds and 3 ha of adjacent area) was measured at
24 species.
58 The apparent success of the low-cost method of strategically breaching dike walls is
clear to community participants, who are keen to continue applying the method in
Tanakeke Island. The method seems feasible for disused aquaculture ponds that have
not been excavated with heavy equipment. Deeper ponds, with stronger dike walls,
may or may not require the use of heavy equipment and fill material. At a certain scale,
greater than 100 hectares, heavy equipment may also be required, even in non-
excavated ponds.
59 Certainly at larger scales, landscapes requiring thousands of hectares of repair, use of
heavy equipment will be required, but the same use of strategic breaching and tidal
creek creation may be feasible. Projects have already been identified in Indonesia of up
to 7,500 ha (Tanjung Panjang, Gorontalo) and up to 60,000 ha (Mahakam Delta, East
•
•
•
•
•
•
S.A.P.I.EN.S, 7.2 | 2014
32
Kalimantan). Political will of local stakeholders to rehabilitate a portion of disused
ponds has already been established, and EMR and Strategic Breaching of Pond Walls —
with a high degree of genuine community involvement — are recommended as best
practice approaches.
Figure 5. Community Based EMR in South and North Sulawesi.
A: Members of a “Womangrove” group hand-dig a 1.2 km tidal channel, to facilitate drainage ofdisused shrimp ponds at Lantang Peo village, Tanakeke Island, as part of mid-course corrections 12months after initial rehabilitation. B: The resultant, meandering tidal channel. Material on the side ofthe channel was eventually moved away into island-like mounds in the middle of ponds. C: Naturalrecruitment of Sonneratia alba and Rhizophora apiculata 32 months after initial rehabilitation. D: Themiddles of some ponds are being recruited as well, again by Sonneratia alba and Rhizophora apiculata.E: Villagers from Tiwoho, North Sulawesi spent several weeks in the shrimp ponds (abandoned since1991), filling in man-made drainage channels, and strategically breaching fish pond dike walls. F: Thesite had been hand planted by the government 6 times over a nine year period, with total mortality ineach instance. After hydrological improvements, mangroves grew back in three major sections, todensities ranging from roughly 5000 - 20,000 seedlings per hectare. A biodiversity survey revealed 32species of true mangroves in and adjacent to the mangrove rehabilitation area.
Source: All photos by Ben Brown
Knowledge Gaps
Low cost methods for substrate elevation measurement at large-scale;
Sizing tidal channels during restoration;
Solutions for enhancing recruitment in fluid substrates;
Calculating rates of sedimentation with low-cost methods;
Developing benthic macroinvertebrate indicators;
How to convince government, aid projects, to abandoned simple planting practices;
Clear cost benefit analysis of mangrove vs. aquaculture.
•
•
•
•
•
•
•
S.A.P.I.EN.S, 7.2 | 2014
33

Main Challenges and Innovations
Achieving low-cost, effective rehabilitation.
Developing rural coastal community awareness and capacities to the point where they were
empowered and experienced enough to engage government agents in meaningful and
productive dialogue.
Engagement of men and women alike in gender analysis and gender sensitisation trainings
and development of “Womangrove” groups to ensure high quality female participation in
rehabilitation and future management.
Key hydrological innovations strategic breaching, hand dug drainage channels.
Key ecological innovations; human assisted propagule distribution, especially of pioneering
species which were anthropogenically selected against during 75+ years of logging.
Integration of methods into National Mangrove Strategy through Multi-stakeholder
Mangrove Working Groups (KKMN and KKMD).
Establishing meaningful demonstrations at scale (25 ha and 400 ha) to be able to engage
government and other stakeholders to undertake large-scale efforts (7500 ha - Tanjung
Panjang, Gorontalo Province to 60,000 ha – Mahakam Delta, East Kalimantan Province).
BIBLIOGRAPHIE
Brown, B. & R.R. Lewis (2006). Five Steps to Successful Ecological Restoration of Mangroves. Lewis, R. et
al. (Eds.) Yogyakarta, Indonesia: Yayasan Akar Rumput Laut (YARL) and the Mangrove Action
Project.
Duke, N.C., J. Mackenzie & A. Wood (2013). Preliminary assessment of biomass and carbon content of
mangroves in Solomon Islands, Vanuatu, Fiji, Tonga and Samoa. Centre for Tropical Water & Aquatic
Ecosystem Research (TropWATER) Report 13/24, James Cook University, Townsville,
Erftemeijer, P.L.A. & R.R. Lewis (2000). Planting mangroves on intertidal mudflats: habitat
restoration or habitat conversion? In: Enhancing Coastal Ecosystems Restoration for the 21st Century.
Proceedings of the ECOTONE VIII Seminar, Ranong, Thailand, 23-28 May 1999, pp. 156-165.
Bangkok: Royal Forest Department of Thailand.
Florida Department of Environmental Protection (1999). Time zero report for the Cross Bayou
mangrove restoration site. Prepared by R. R. Lewis III for The Cross Bayou Project Review Group.
Pinellas County, Florida.
Friess, D.A. et al. (2011). Are all intertidal wetlands naturally created equal? Bottlenecks,
thresholds and knowledge gaps to mangrove and saltmarsh ecosystems. Biological Review. doi:
10.1111/j.1469-185X.2011.00198.x Cambridge Philosophical Society
IUCN Ecosystems and Livelihoods Group (2006). Valuation, rehabilitation and conservation of
mangroves in tsunami affected areas of Hambantota, Sri Lanka: Economic valuation of tsunami affected
mangroves. Ranasinghe, T. & M. Kallesoe. Sri Lanka: The World Conservation Union (IUCN)
Ecosystems and Livelihoods Group Asia.
•
•
•
•
•
•
•
S.A.P.I.EN.S, 7.2 | 2014
34
Lewis, R.R. & F.M. Dunstan (1975). The possible role of Spartina alterniflora loisel in establishment
of mangroves in Florida. In: Proceedings of the Second Annual Conference on Restoration of Coastal
Vegetation in Florida. Tampa, Florida: Hillsborough Community College.
Lewis, R.R. (1999). Key concepts in successful ecological restoration of mangrove forests. In:
Proceedings of the TCE-Workshop No. II, Coastal Environmental Improvement in Mangrove/Wetland
Ecosystems, 18-23 August 1998, pp. 19-32. Bangkok: Danish-SE Asian Collaboration on Tropical
Coastal Ecosystems (TCE) Research and Training.
Lewis, R.R. (2005). Ecological engineering for successful management and restoration of
mangrove forests. Ecological Engineering 24: 403–418.
Lewis, R.R. (2009a). Mangrove field of dreams: If you build it, they will come. Society of Wetland
Scientists – SWS Research Brief. No 2009-0005
Lewis, R.R. (2009b). Methods and criteria for successful mangrove forest restoration. In: Perillo,
G.M.E., E. Wolanski, D.R. Cahoon & M.M. Brinson (Eds.) Coastal Wetlands: An Integrated Ecosystem
Approach, pp. 787-800. Elsevier Press.
Miagostovich, M. (2002a). Building forest users’ capacity to develop silvicultural practices. In:
International Learning Workshop on Farmer Field Schools (FFS): Emerging Issues and Challenges, 21-25
October 2002, pp.413-434. Yogyakarta, Indonesia
Miagostovich, M. (2002b). Forest Management Learning Group (FMLG) - The Facilitator’s Field Manual.
Bangkok: Regional Community Forestry Training Center for Asia and the Pacific (RECOFTC)
Miagostovich, M. (2002c). Forest Management Learning Group (FMLG) - The Trainer’s Manual. Bangkok:
Regional Community Forestry Training Center for Asia and the Pacific (RECOFTC)
Restoring Coastal Livelihoods (2011). Kajian Risilian [Resilience Assessment]. Situational and
Contextual Field Assessment and Analysis Restoring Coastal Livelihoods Project.Prepared by
Jajang Agus Sonjaya. Makassar, Indonesia.
TropWATER (2013). Preliminary assessment of biomass and carbon content of mangroves in Solomon
Islands, Vanuatu, Fiji, Tonga and Samoa. A Report for the MESCAL Project, IUCN Oceania Office, Suva
Report No. 13/24 May 2013. Prepared by Duke, N.C, J. Mackenzie and A. Wood. Centre for Tropical
Water & Aquatic Ecosystem Research (TropWATER). James Cook University, Townsville,
Australia. 37 pp. http://research.jcu.edu.au/research/tropwater/resources/
13%2024%20mangrove%20biomass%20and%20carbon.pdf
Ukkas, M. (2011, July). Status of Tanakeke Island mangroves and livelihoods since aquaculture
development. Paper presented at Restoring Coastal Livelihoods Regional Seminar on Ecological
Mangrove Rehabilitation, July 18-22, 2011, Makassar, Indonesia.
NOTES
1. South Sulawesi Department of Statistics – 2010 Census
2. Following the methodology provided in IUCN Ecosystems & Livelihoods Group (2006).
3. Diameter at breast height
S.A.P.I.EN.S, 7.2 | 2014
35
RÉSUMÉS
While successful examples of large-scale (5 000-10 000 ha) ecological wetland/mangrove
rehabilitation projects exist worldwide, mangrove rehabilitation efforts in Indonesia, both large
and small, have mainly failed. The majority of projects (both government programs and non-
government initiatives) have oversimplified the technical processes of mangrove rehabilitation,
favouring the direct planting of a restricted subset of mangrove species (from the family
Rhizophoracea), commonly in the lower half of the intertidal system (from Mean Sea Level down
to Lowest Atmospheric Tide) where mangroves, by and large, do not naturally grow. Aside from
lack of appropriate technical assessment, these lower inter-tidal mudflats are often targeted for
rehabilitation because true degraded mangrove forests are frequently linked to tenurial issues
that require significant effort and investment to resolve.
Ecological Mangrove Rehabilitation (EMR) has been implemented and well documented for the
past several decades in New World mangrove systems (Lewis, 2005, 2009b) and was selected as a
best practice for adaptation and trials in Indonesia. Whereas in the US, the five-step process
primarily focuses on biophysical assessments and eco-hydrological repair, when applied to the
Indonesian scenario, EMR requires both lower-cost biophysical approaches and greater attention
to socio-cultural-political approaches common in sustainable development and coastal resource
management programs.
The adaptation of EMR was initially tested in small-scale projects, ranging from 12-33 ha in sites
from the islands of Sumatera and Sulawesi. Biophysical adaptations included use of low-cost
biophysical assessment methods, reliance on manual labour, strategic breaching of aquaculture
ponds dike walls, manual construction of tidal channels, and human assisted propagule dispersal
while socio-political adaptations included land tenure settlement, increased use of training of
trainers programs, gender assessments and sensitisation, enhanced community organising,
coordination with numerous government agencies and participatory monitoring. Initial projects
succeeded in rehabilitating mangrove coverage and diversity, while catalysing community-based
or collaborative management. The most recent Community Based Ecological Mangrove
Rehabilitation (CBEMR) project took place on Tanakeke Island, South Sulawesi, where 1776 ha of
mangroves were reduced to approximately 576 ha over two decades due to development of 1200
ha of aquaculture ponds. At least 800 ha of ponds on the island were disused as of the start of a
four-year project to restore 400 ha at a cost of US$590,000 and initiate adaptive collaborative
management. Local communities from six villages willingly made their ponds available for
rehabilitation, as their main livelihood had switched to seaweed mariculture and they recognised
the urgent need to restore mangrove coverage for fisheries value and storm protection. The
initial site restored (43 ha) has naturally recruited to an average density of 2171 stems/ha., 32
months after initial restoration. Three more recent sites have already demonstrated natural
recruitment between 767-1450 seedlings within 7-10 months after restoration. Local
communities have developed mangrove management groups and regulations for both remnant
mangrove forests and rehabilitation areas, which have been acknowledged at higher levels of
government. The implementation of gender analyses, gender sensitisation and the development
of Womangrove groups have been crucial to ensure the equal involvement of women in the
process of mangrove rehabilitation and management. The process of CBEMR at this point is being
considered for upscaling and replication, and has been included as a best practice in both the
South Sulawesi Provincial and Indonesian National Mangrove Strategies. The CBEMR process has
been recommended by the Ministry of Forests – Natural and Protected Forest Management
Agency (PHKA) as a requisite practice to restore the 4000 ha in the Tanjung Panjang Nature
Reserve in Gorontalo Province, which nearly completely and illegally converted to aquaculture
S.A.P.I.EN.S, 7.2 | 2014
36

ponds over the past two decades. CBEMR and strategic breaching is also being considered for
restoration in Indonesia’s largest contiguous converted mangrove forest, which includes 60 000
ha of largely abandoned and disused shrimp ponds in the Mahakam Delta, East Kalimantan. The
proven effectiveness of the CBEMR process at small and medium scales relies on its ability to
resolve both biophysical and socio-political issues underscoring mangrove forest degradation in
Indonesia. If and when this is applied to large-scale restoration, it is sure that continued
attention will need to be paid to both biophysical and socio-political approaches.
INDEX
Keywords : Community-Based, Collaborative, Ecological Mangrove Rehabilitation, Indonesia
S.A.P.I.EN.S, 7.2 | 2014
37
Participatory governance of MarineProtected Areas: a politicalchallenge, an ethical imperative,different trajectoriesSenegal case studies
Marie-Christine Cormier-Salem
Gaëll Mainguy (éd.)
NOTE DE L’ÉDITEUR
This manuscript was published as part of a special issue on the subject of largescale
restoration of ecosystems. This manuscript was reviewed by four anonymous referees.
This paper is a revised version of a book chapter originally published in french by the
IRD (Cormier-Salem, 2014, in press)
Introduction
1 Despite an international consensus in favour of increasing the number of Marine
Protected Areas (MPA) and enlarging them (Bonnin et al., in press), controversy
surrounds their effectiveness and legitimacy, especially in the context of developing
countries. This is particularly true in Africa, a continent scarred by varying levels of
conflict, ecological crisis, impoverishment and State disengagement (De Santo, 2013). In
terms of their ecological effectiveness, questions are repeatedly raised concerning the
minimal size, boundaries and configurations of MPA (Agardy et al., 2011). In terms of
their economic and social legitimacy, spatial and social justice and amenities for local
communities are recurring issues (Potts et al., 2014; Trimble et al., 2014). According to
Charles and Wilson (2009), it is possible to identify ten conditions that determine their
success: attachment to place; high level of participation; effective governance; co-
S.A.P.I.EN.S, 7.2 | 2014
38
building of knowledge (scientific vs vernacular or local); the role of rights and customs;
consequences of displacement of communities; costs and benefits; the place of the MPA
in the larger region.
2 On the assumption that the resilience of socio-ecosystems owes less to the management
of resources, strictly speaking, than to the governance of the regions, this article will
focus on two of the points highlighted by Charles and Wilson, namely effective
governance and participation, and the close links between them. What is “good”
governance? Is participation by the local population effective? To what extent are the
local or indigenous people key players in the governance of MPA? We will study the
MPA policies implemented in Senegal. After considering the way concepts and
management of the coastal areas and their resources have developed—from the
creation of sanctuaries for flagship species to the co-management of MPA—we will
explain why we regard Senegal as a pioneer in the adoption of these new paradigms,
before analysing the problems and limitations inherent in operationalising these
models. Three case studies will be used: the Saint Louis MPA, the Bamboung
Community-Managed MPA in the Saloum Delta and the Mangagoulack ICCA
(Indigenous and Community Conserved Area) in Casamance.
3 Our mainly empirical methodology is based on a set of surveys conducted since 2005
along the West African coast, and Senegal in particular. Individual and group
interviews were followed up by regular monitoring and contacts with Parks officials
and protected areas and with local populations from 20091. The purpose of these
surveys was to identify and characterise the stakeholders involved in governance of the
coastal area and their relationships with one another (decision-makers, managers,
users, private and public operators, NGOs, scientists, etc.) and to gain an understanding
of the knowledge, practices and institutions mobilised in this governance (values
attributed to biodiversity, old and new systems of access and use, informal and formal
agreements, standards and mechanisms) as well as conflicts and the methods used to
resolve them, focusing not only on heritage-related, territorial and identity-related
claims, but also old and new systems of mutual aid and alliance. Analysis of this
empirical body of work is supplemented by theoretical consideration of concepts based
on a bibliographical analysis of various written sources (from government reports to
scientific articles). This article will not attempt to summarise these, since the subject is
so broad and has given rise to numerous scientific works (Cormier-Salem, 2006a; Weigel
et al., 2007; Borrini-Feyerabend et al., 2009b; Dahou, 2010; Touré, 2011; Lavigne Delville,
2011; Ingold, 2014).
Towards sustainable and shared governance of MPA:institutional articulations and coordination betweenstakeholders
New paradigms
4 The context has changed since the first marine sanctuaries were created to provide
integral protection for emblematic species. New challenges have arisen, particularly in
terms of the concept of sustainable development, which entered the media spotlight
after the Brundtland report and was formalised at the Rio Earth Summit in 1992. Article
8 (j) of the Convention on Biological Diversity, concerning the problem of in situ
S.A.P.I.EN.S, 7.2 | 2014
39

conservation, recommends including consideration of “the knowledge, innovations and
practices of indigenous and local communities”. This article has been on the agenda of
all the Party Conferences since 1996. The reference to traditional ecological knowledge
has become an intrinsic part of ecologically correct discussion. It goes without saying
that the challenges are immense: “indigenous and local communities” are now seen as
the primary beneficiaries of shared advantages. Links have been officially established
between local practices, biodiversity conservation and sustainable management,
joining the many social science studies which criticised Hardin’s theory and stressed
the relevance of community management methods. As well as clear recognition of the
right of communities to manage, i.e. to control the resources in their own region as part
of a move towards governance, which is replacing co-management strategies (Berkes,
1989; Ostrom, 1990; Agrawal, 2005), cultural diversity is also recognised as a key aspect
of biodiversity. Across the world, areas of megabiodiversity are often located in places
where poor and marginalised communities live. The survival of these peoples and the
maintenance of their practices appear to be essential components of diversity
conservation (Posey, 1996). Accordingly, the identity and territorial claims of these
minorities include a recognition not only of their cultural and political uniqueness but
also of their privileged links with their environment and the associated biodiversity
(Cormier-Salem & Roussel, 2002).
5 The evolving nature of these issues is clearly visible in the area of international
negotiations. Was not the fight against poverty also the leitmotif of the Johannesburg
Sustainable Development World Summit in August 2002, ten years after the Rio Earth
Summit? Calls for equity and respect for cultural differences have been reiterated loud
and clear. We have yet to ensure that these are put into practice.
6 With the way now open for the construction of local heritages, a number of practical,
political and ethical problems arise. How can we preserve migratory species that do not
recognise national borders, such as migratory birds or schools of fish? We need to
acknowledge the multitude of local heritages and create a regional network of
protection areas and corridors. Recognising that MPA are not islands (Janzen, 1983), all
policies endeavour to one degree or another to factor in the ecological and social
interdependencies underpinning these regional projects, as well as regional solidarities
(Bonnin & Rodary, 2008; Mathevet et al., 2010).
7 Although these concepts of solidarity (ecological/social/regional), environmental
justice, shared governance, etc. are rapidly gaining ground, changes in standards of
public action and particularly the level of acceptance of the MPA by local communities,
recognition of local rules and agreements and the actual sharing of the advantages
created as a result of biodiversity conservation are all open to question (see Nagoya
Protocol; see MEA framework with reaffirmed links between the preservation of
ecosystem services and the well-being of the populations; see ecotourism initiatives,
promotion of local products, etc.).
8 When it comes to natural resources, in West Africa the pendulum has swung between
centralised and decentralised, state and community, private, public and participatory
management since the 1960s. Newly independent States took over from colonial
administrations and reaffirmed ownership of so-called empty or common land. Since
the 1980s however, numerous failures and conflicts caused by a lack of public services
on the one hand and land tenure insecurity on the other have led to the
implementation of new methods of collective action (Blundo, 2002; Dahou, 2010;
S.A.P.I.EN.S, 7.2 | 2014
40
Lavigne Delville, 2011). Decentralisation and deconcentration policies aim to transfer
the management of resources to the local communities, who are considered to have a
vested interest in their preservation since they depend on them for their continued
existence and are therefore in the best position to ensure compliance with the rules.
The co-management of protected areas meets a requirement not merely for economic
efficiency (principle of subsidiarity) and political efficiency (primacy of social control
over administrative control), but also social justice, restoring the rights of the
communities and ensuring that they receive an equal share of the benefits derived
from nature. Over and above the consideration of the territorial and identity claims of
the local communities, governance, which has gone hand in hand with sustainable
development since the 1990s, is a system of institutional articulations, negotiation and
conflict resolution (Cormier-Salem, 2007). Participation in governance encompasses
various concepts, which often overlap but are nevertheless very different in terms of
collective decision processes, ranging from simple consultation to coordination and
negotiation (Thouzard, 2006). These methods are implemented at different spatial-
temporal levels, mobilise different players, and occur in different stages. These terms
often slot together or succeed one another as the process develops. According to
Mermet (2012), negotiation is “a decision system in which players who are
interdependent but have different interests or views engage in dialogue in order to
seek a mutually agreeable solution.” We will examine the operationality of this
definition and these new models based on the coastal biodiversity conservation policies
in place in Senegal.
A pioneer in MPA governance: Senegal
9 In Senegal, as in the rest of the world, the first MPA fulfilled a pressing need to protect
so-called heritage animal species included on the IUCN red lists and in several
international conventions, such as the 1979 Bonn conventions on the protection of
migratory species (avifauna, ichtyofauna and marine mammals) and the habitats that
shelter them, mangrove swamps to the fore. The first Senegalese coastal areas (there
are no marine areas as such) to be classified, in 1971, were migratory bird habitats.
Initially Ramsar sites, they later became a UNESCO Biosphere Reserve (Saloum Delta
with Bird Island in Senegal) and National Parks (Barbary Spit and Djoudj in the Senegal
River Delta and Madeleine Island off Dakar) (see Figure 1) (Cormier-Salem, 2006a).
S.A.P.I.EN.S, 7.2 | 2014
41
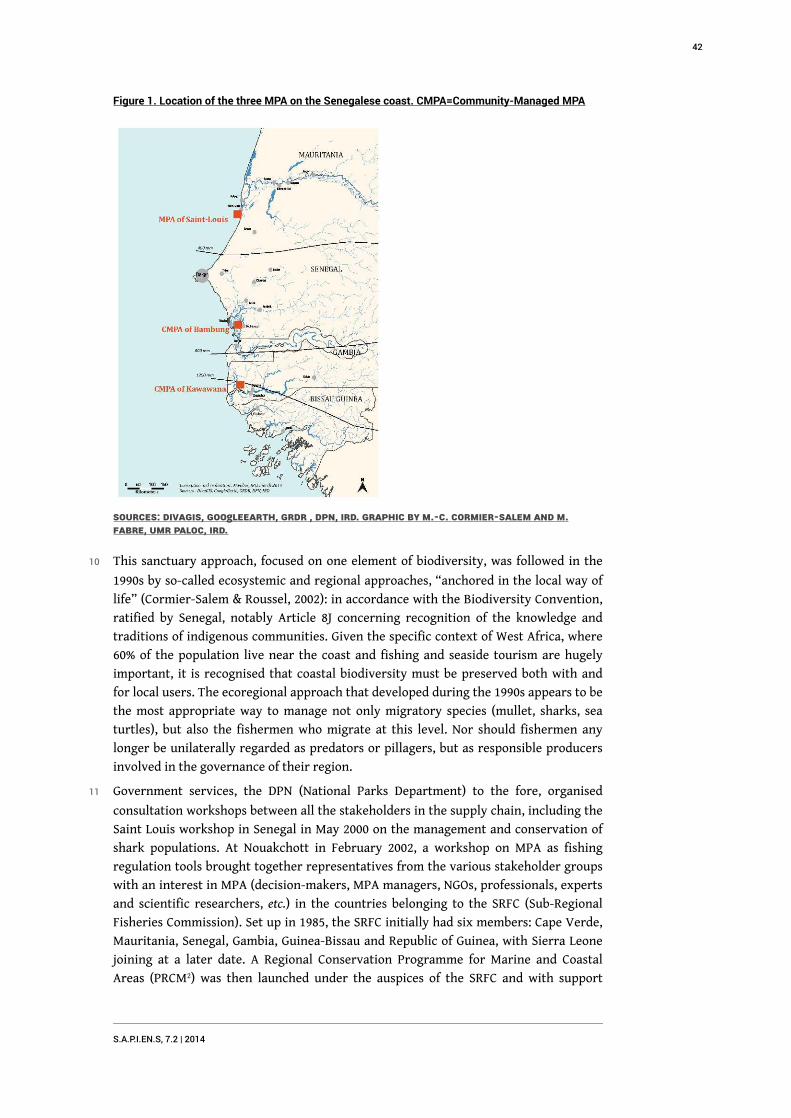
Figure 1. Location of the three MPA on the Senegalese coast. CMPA=Community-Managed MPA
Sources: DivaGIS, GoogleEarth, GRDR , DPN, IRD. Graphic by M.-C. Cormier-Salem and M.Fabre, UMR PALOC, IRD.
10 This sanctuary approach, focused on one element of biodiversity, was followed in the
1990s by so-called ecosystemic and regional approaches, “anchored in the local way of
life” (Cormier-Salem & Roussel, 2002): in accordance with the Biodiversity Convention,
ratified by Senegal, notably Article 8J concerning recognition of the knowledge and
traditions of indigenous communities. Given the specific context of West Africa, where
60% of the population live near the coast and fishing and seaside tourism are hugely
important, it is recognised that coastal biodiversity must be preserved both with and
for local users. The ecoregional approach that developed during the 1990s appears to be
the most appropriate way to manage not only migratory species (mullet, sharks, sea
turtles), but also the fishermen who migrate at this level. Nor should fishermen any
longer be unilaterally regarded as predators or pillagers, but as responsible producers
involved in the governance of their region.
11 Government services, the DPN (National Parks Department) to the fore, organised
consultation workshops between all the stakeholders in the supply chain, including the
Saint Louis workshop in Senegal in May 2000 on the management and conservation of
shark populations. At Nouakchott in February 2002, a workshop on MPA as fishing
regulation tools brought together representatives from the various stakeholder groups
with an interest in MPA (decision-makers, MPA managers, NGOs, professionals, experts
and scientific researchers, etc.) in the countries belonging to the SRFC (Sub-Regional
Fisheries Commission). Set up in 1985, the SRFC initially had six members: Cape Verde,
Mauritania, Senegal, Gambia, Guinea-Bissau and Republic of Guinea, with Sierra Leone
joining at a later date. A Regional Conservation Programme for Marine and Coastal
Areas (PRCM2) was then launched under the auspices of the SRFC and with support
S.A.P.I.EN.S, 7.2 | 2014
42
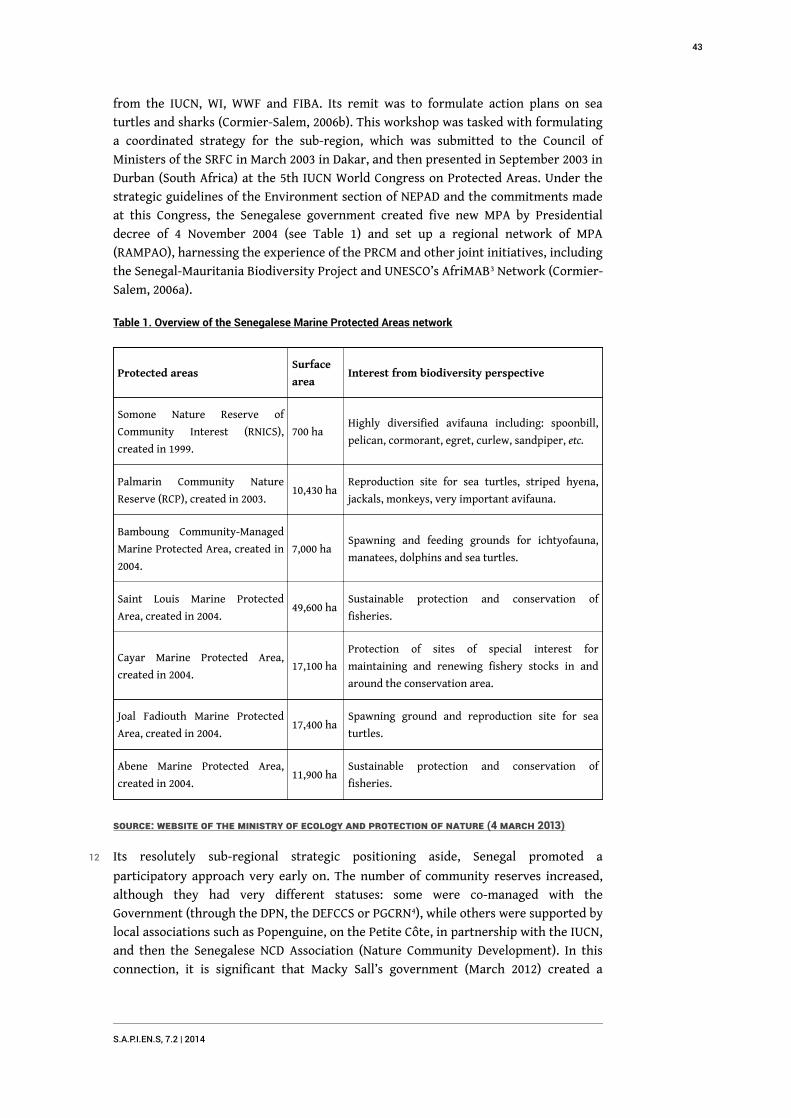
from the IUCN, WI, WWF and FIBA. Its remit was to formulate action plans on sea
turtles and sharks (Cormier-Salem, 2006b). This workshop was tasked with formulating
a coordinated strategy for the sub-region, which was submitted to the Council of
Ministers of the SRFC in March 2003 in Dakar, and then presented in September 2003 in
Durban (South Africa) at the 5th IUCN World Congress on Protected Areas. Under the
strategic guidelines of the Environment section of NEPAD and the commitments made
at this Congress, the Senegalese government created five new MPA by Presidential
decree of 4 November 2004 (see Table 1) and set up a regional network of MPA
(RAMPAO), harnessing the experience of the PRCM and other joint initiatives, including
the Senegal-Mauritania Biodiversity Project and UNESCO’s AfriMAB3 Network (Cormier-
Salem, 2006a).
Table 1. Overview of the Senegalese Marine Protected Areas network
Protected areas Surface
areaInterest from biodiversity perspective
Somone Nature Reserve of
Community Interest (RNICS),
created in 1999.
700 haHighly diversified avifauna including: spoonbill,
pelican, cormorant, egret, curlew, sandpiper, etc.
Palmarin Community Nature
Reserve (RCP), created in 2003.10,430 ha
Reproduction site for sea turtles, striped hyena,
jackals, monkeys, very important avifauna.
Bamboung Community-Managed
Marine Protected Area, created in
2004.
7,000 haSpawning and feeding grounds for ichtyofauna,
manatees, dolphins and sea turtles.
Saint Louis Marine Protected
Area, created in 2004.49,600 ha
Sustainable protection and conservation of
fisheries.
Cayar Marine Protected Area,
created in 2004.17,100 ha
Protection of sites of special interest for
maintaining and renewing fishery stocks in and
around the conservation area.
Joal Fadiouth Marine Protected
Area, created in 2004.17,400 ha
Spawning ground and reproduction site for sea
turtles.
Abene Marine Protected Area,
created in 2004.11,900 ha
Sustainable protection and conservation of
fisheries.
Source: Website of the Ministry of Ecology and Protection of Nature (4 March 2013)
12 Its resolutely sub-regional strategic positioning aside, Senegal promoted a
participatory approach very early on. The number of community reserves increased,
although they had very different statuses: some were co-managed with the
Government (through the DPN, the DEFCCS or PGCRN4), while others were supported by
local associations such as Popenguine, on the Petite Côte, in partnership with the IUCN,
and then the Senegalese NCD Association (Nature Community Development). In this
connection, it is significant that Macky Sall’s government (March 2012) created a
S.A.P.I.EN.S, 7.2 | 2014
43
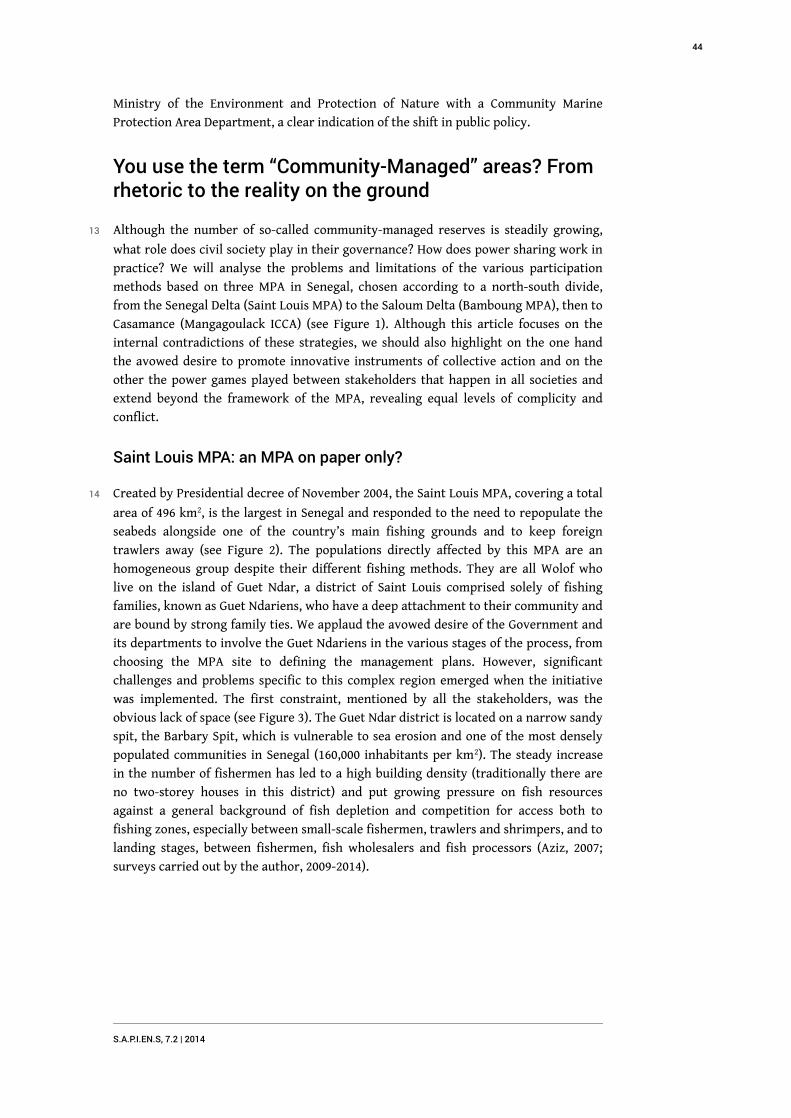
Ministry of the Environment and Protection of Nature with a Community Marine
Protection Area Department, a clear indication of the shift in public policy.
You use the term “Community-Managed” areas? Fromrhetoric to the reality on the ground
13 Although the number of so-called community-managed reserves is steadily growing,
what role does civil society play in their governance? How does power sharing work in
practice? We will analyse the problems and limitations of the various participation
methods based on three MPA in Senegal, chosen according to a north-south divide,
from the Senegal Delta (Saint Louis MPA) to the Saloum Delta (Bamboung MPA), then to
Casamance (Mangagoulack ICCA) (see Figure 1). Although this article focuses on the
internal contradictions of these strategies, we should also highlight on the one hand
the avowed desire to promote innovative instruments of collective action and on the
other the power games played between stakeholders that happen in all societies and
extend beyond the framework of the MPA, revealing equal levels of complicity and
conflict.
Saint Louis MPA: an MPA on paper only?
14 Created by Presidential decree of November 2004, the Saint Louis MPA, covering a total
area of 496 km2, is the largest in Senegal and responded to the need to repopulate the
seabeds alongside one of the country’s main fishing grounds and to keep foreign
trawlers away (see Figure 2). The populations directly affected by this MPA are an
homogeneous group despite their different fishing methods. They are all Wolof who
live on the island of Guet Ndar, a district of Saint Louis comprised solely of fishing
families, known as Guet Ndariens, who have a deep attachment to their community and
are bound by strong family ties. We applaud the avowed desire of the Government and
its departments to involve the Guet Ndariens in the various stages of the process, from
choosing the MPA site to defining the management plans. However, significant
challenges and problems specific to this complex region emerged when the initiative
was implemented. The first constraint, mentioned by all the stakeholders, was the
obvious lack of space (see Figure 3). The Guet Ndar district is located on a narrow sandy
spit, the Barbary Spit, which is vulnerable to sea erosion and one of the most densely
populated communities in Senegal (160,000 inhabitants per km2). The steady increase
in the number of fishermen has led to a high building density (traditionally there are
no two-storey houses in this district) and put growing pressure on fish resources
against a general background of fish depletion and competition for access both to
fishing zones, especially between small-scale fishermen, trawlers and shrimpers, and to
landing stages, between fishermen, fish wholesalers and fish processors (Aziz, 2007;
surveys carried out by the author, 2009-2014).
S.A.P.I.EN.S, 7.2 | 2014
44
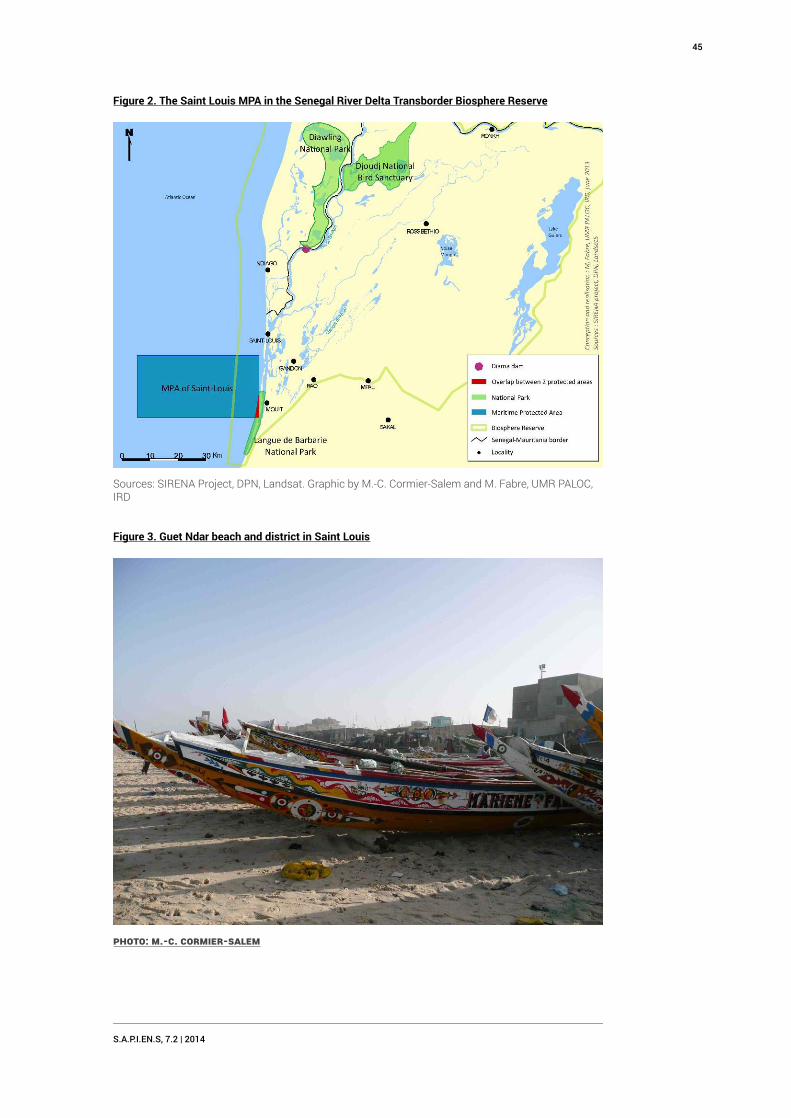
Figure 2. The Saint Louis MPA in the Senegal River Delta Transborder Biosphere Reserve
Sources: SIRENA Project, DPN, Landsat. Graphic by M.-C. Cormier-Salem and M. Fabre, UMR PALOC,IRD
Figure 3. Guet Ndar beach and district in Saint Louis
Photo: M.-C. Cormier-Salem
S.A.P.I.EN.S, 7.2 | 2014
45
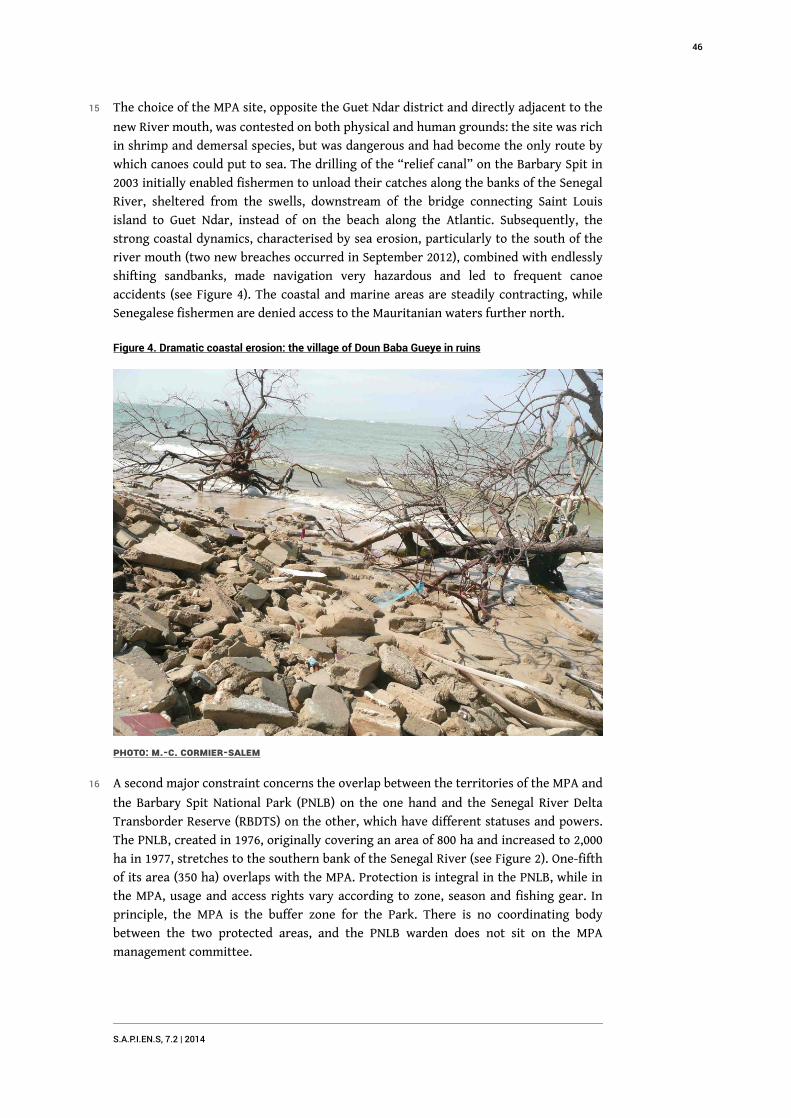
15 The choice of the MPA site, opposite the Guet Ndar district and directly adjacent to the
new River mouth, was contested on both physical and human grounds: the site was rich
in shrimp and demersal species, but was dangerous and had become the only route by
which canoes could put to sea. The drilling of the “relief canal” on the Barbary Spit in
2003 initially enabled fishermen to unload their catches along the banks of the Senegal
River, sheltered from the swells, downstream of the bridge connecting Saint Louis
island to Guet Ndar, instead of on the beach along the Atlantic. Subsequently, the
strong coastal dynamics, characterised by sea erosion, particularly to the south of the
river mouth (two new breaches occurred in September 2012), combined with endlessly
shifting sandbanks, made navigation very hazardous and led to frequent canoe
accidents (see Figure 4). The coastal and marine areas are steadily contracting, while
Senegalese fishermen are denied access to the Mauritanian waters further north.
Figure 4. Dramatic coastal erosion: the village of Doun Baba Gueye in ruins
Photo: M.-C. Cormier-Salem
16 A second major constraint concerns the overlap between the territories of the MPA and
the Barbary Spit National Park (PNLB) on the one hand and the Senegal River Delta
Transborder Reserve (RBDTS) on the other, which have different statuses and powers.
The PNLB, created in 1976, originally covering an area of 800 ha and increased to 2,000
ha in 1977, stretches to the southern bank of the Senegal River (see Figure 2). One-fifth
of its area (350 ha) overlaps with the MPA. Protection is integral in the PNLB, while in
the MPA, usage and access rights vary according to zone, season and fishing gear. In
principle, the MPA is the buffer zone for the Park. There is no coordinating body
between the two protected areas, and the PNLB warden does not sit on the MPA
management committee.
S.A.P.I.EN.S, 7.2 | 2014
46
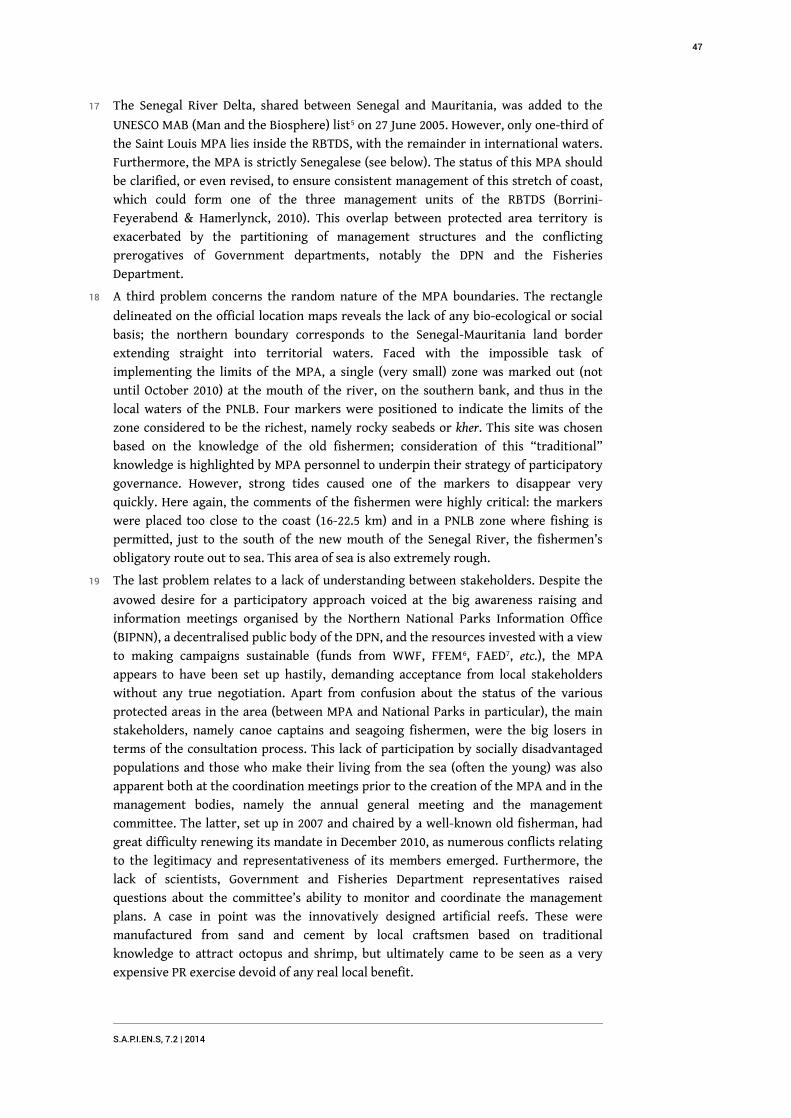
17 The Senegal River Delta, shared between Senegal and Mauritania, was added to the
UNESCO MAB (Man and the Biosphere) list5 on 27 June 2005. However, only one-third of
the Saint Louis MPA lies inside the RBTDS, with the remainder in international waters.
Furthermore, the MPA is strictly Senegalese (see below). The status of this MPA should
be clarified, or even revised, to ensure consistent management of this stretch of coast,
which could form one of the three management units of the RBTDS (Borrini-
Feyerabend & Hamerlynck, 2010). This overlap between protected area territory is
exacerbated by the partitioning of management structures and the conflicting
prerogatives of Government departments, notably the DPN and the Fisheries
Department.
18 A third problem concerns the random nature of the MPA boundaries. The rectangle
delineated on the official location maps reveals the lack of any bio-ecological or social
basis; the northern boundary corresponds to the Senegal-Mauritania land border
extending straight into territorial waters. Faced with the impossible task of
implementing the limits of the MPA, a single (very small) zone was marked out (not
until October 2010) at the mouth of the river, on the southern bank, and thus in the
local waters of the PNLB. Four markers were positioned to indicate the limits of the
zone considered to be the richest, namely rocky seabeds or kher. This site was chosen
based on the knowledge of the old fishermen; consideration of this “traditional”
knowledge is highlighted by MPA personnel to underpin their strategy of participatory
governance. However, strong tides caused one of the markers to disappear very
quickly. Here again, the comments of the fishermen were highly critical: the markers
were placed too close to the coast (16-22.5 km) and in a PNLB zone where fishing is
permitted, just to the south of the new mouth of the Senegal River, the fishermen’s
obligatory route out to sea. This area of sea is also extremely rough.
19 The last problem relates to a lack of understanding between stakeholders. Despite the
avowed desire for a participatory approach voiced at the big awareness raising and
information meetings organised by the Northern National Parks Information Office
(BIPNN), a decentralised public body of the DPN, and the resources invested with a view
to making campaigns sustainable (funds from WWF, FFEM6, FAED7, etc.), the MPA
appears to have been set up hastily, demanding acceptance from local stakeholders
without any true negotiation. Apart from confusion about the status of the various
protected areas in the area (between MPA and National Parks in particular), the main
stakeholders, namely canoe captains and seagoing fishermen, were the big losers in
terms of the consultation process. This lack of participation by socially disadvantaged
populations and those who make their living from the sea (often the young) was also
apparent both at the coordination meetings prior to the creation of the MPA and in the
management bodies, namely the annual general meeting and the management
committee. The latter, set up in 2007 and chaired by a well-known old fisherman, had
great difficulty renewing its mandate in December 2010, as numerous conflicts relating
to the legitimacy and representativeness of its members emerged. Furthermore, the
lack of scientists, Government and Fisheries Department representatives raised
questions about the committee’s ability to monitor and coordinate the management
plans. A case in point was the innovatively designed artificial reefs. These were
manufactured from sand and cement by local craftsmen based on traditional
knowledge to attract octopus and shrimp, but ultimately came to be seen as a very
expensive PR exercise devoid of any real local benefit.
S.A.P.I.EN.S, 7.2 | 2014
47

20 Lastly, to say nothing of the problems experienced when implementing the initiative
due to the lack of infrastructure and Fisheries surveillance post equipment8, the MPA
caused heightened tensions with the Guet Ndarien community. According to our own
surveys (2011 and 2014), the majority of fishermen objected to the MPA in a very tense
atmosphere compounded by restrictions on fishing trips, a long hiatus in the
distribution of permits allowing Senegalese fishermen to fish in Mauritanian waters
and a rotation system for fishing trips (alternate days) in a bid to limit pressure on
Senegalese waters. The opinions of the fishermen appeared to vary however depending
on their fishing methods. According to Aziz (2007), driftnet and line fishermen were the
most strongly opposed to the MPA owing to their lack of options: fishing was all they
knew and they could only fish in the MPA. Fishermen using purse-seine nets did not
believe the MPA was a suitable vehicle for managing the mobile (deep-sea) fisheries
shared with Mauritania. They wanted access to Mauritanian waters and stressed the
positive role of the MPA in prohibiting trawler access to the area in particular. The
position of fishermen who go on long fishing trips in their ice canoes or work with fish
collection boats (their canoes are towed by the boat owners, enabling them to reach
rocky seabeds remote from the coast and inaccessible to trawlers) was more
ambiguous. Since they only pass through the MPA, they had no interest in it and did
not object to total protection of the coastal habitats, which would enable the seabeds to
be repopulated.
The Bamboung Community-Managed Marine Protected Area in the
Saloum Delta: an exclusive preserve
21 The Saloum Delta, site of Bamboung Community-Managed MPA, comprises three sea
inlets: Saloum to the north, Diombos in the centre (of which the Bamboung bolong is a
tributary) and Bandiala to the south. In order to understand the distinctive nature of
this MPA, it is necessary to define its environment as per Charles and Wilson (2009), in
other words its socio-spatial characteristics, since this territory is so strongly disputed
and its assets are the subject of contradictory claims (Cormier-Salem, 2000, 2006; Dahou
& Abdel Wedoud, 2007; Dahou, 2008).
22 The first factor to consider is the heterogeneous nature of the rural communities and
the diverse range of resource management strategies and practices. Schematically, the
islands between Saloum and Diombos, which make up Gandoul, are inhabited by Serer
Niominka, very early specialists in navigation and sea fishing. They are (full-time)
professional fishermen who travel long distances and stay in fishing stations in the
Delta or outside the Delta (in Casamance, Guinea Bissau, etc.) for months or even years
at a time. These islands have seen a mass exodus of young people, who were some of
the first to attempt the hazardous crossing to Europe by canoe. These migrations have
complex repercussions in terms of lineage solidarity and social and economic
recomposition (analysis of which exceeds the scope of this chapter, see Dahou, 2008;
Cormier-Salem et al., 2010). The islands between Diombos and Bandiala, Betanti and
Niombato, are mainly inhabited by Soce, natives of Gabou (consequently close to the
Manding) and still largely farmers (Cormier-Salem et al., 2010). The Rural Community of
Toubacouta, where Bamboung MPA is located, contains large numbers of foreigners
who have settled there over the years. Among them are Jola palm wine growers, Malian
and Burkina Faso fish smokers, Lebou fishermen, Wolof traders, French tourist
S.A.P.I.EN.S, 7.2 | 2014
48
operators, etc.. Unlike Guet Ndar, the community includes a wide variety of “local”
stakeholders, of different origins, activities and statuses.
23 The second factor to consider is the overlap of protected areas that have different
statuses (see Figure 5). The Saloum Delta National Park comprises the Fathala forest
and islands and islets partially colonised by mangroves. When it was created in 1976, it
covered 76 km2. In 1981 the protected area was extended to 180 km2 and classified as a
Biosphere Reserve based on the UNESCO model, containing three zones (central,
peripheral and buffer). The Saloum Delta National Park is the central zone of the
Biosphere Reserve of the Saloum Delta (RBDS). The RBDS was added to the list of
Ramsar sites in 1984. It covers an area of between 240 and 260 km2, the boundaries of
the protected land areas being somewhat fluid (Cormier-Salem, 2006). Finally, the
Saloum Delta was added to UNESCO’s list of world heritage sites in 2011. This rush
towards heritage preservation coincided with an overlap of powers between
Government departments, which as in the case of Saint Louis, led to legitimacy
conflicts, exacerbated by the amphibian nature of the environment. The 1962 National
Domain Act for example transferred ownership of the marine environment and control
of fishing activities to the DPN (Cormier-Salem, 2000). This also coincided with the
hijacking and monopolisation of public funds for private purposes, as shown by the
proliferation of tourist camps and associations, NGOs, management committees, beach
committees, etc. and other operators seeking a “green” windfall. Whether one criticises
the non-governmentality or under-administration of these MPA (Nguinguiri, 2003) or
their “over-government” (Diallo, 2012), the multiplicity and incompatibility of the legal
and regulatory references in the RBDS (Dahou & Weigel, 2005) or the hybridisation of
the rules of access and use (Diallo, 2012), there can be no doubt that coordination
between stakeholders is extremely difficult due to the large number of institutions
involved, and the creation of a community-managed integral reserve like Bamboung
MPA is a real challenge.
S.A.P.I.EN.S, 7.2 | 2014
49
Figure 5. The Bamboung Community-Managed MPA in the Biosphere Reserve in the Saloum Delta
Sources: Directorate of Geographic and Cartographic Works, Senegal; Centre forEcological Monitoring; SIRENA Project; Landsat. Graphic by M.-C. Cormier-Salem and M.Fabre, UMR PALOC, IRD
24 Created by the same Presidential decree of November 2004 as the Saint Louis MPA, the
Bamboung MPA, covering an area of 70 km2, led to the closure of the Bamboung bolong,
which forms the central integral protection zone of this area. The MPA is bounded to
the north by the Diombos sea inlet, and to the south by the Diogaye and Kabaye forests.
It was initiated and driven by a Senegalese marine environment protection association,
the Oceanium Dakar, as part of the Narou Heuleuk project, and funded by the FFEM. The
site, a known spawning and feeding ground for many estuarine species (ichtyofauna,
manatees, dolphins, sea turtles), was chosen by a team of biologists who were also put
in charge of monitoring it. The MPA was created following a consultation process
involving fourteen villages in the Toubacouta Rural Community; from the outset the
aim was to promote income-generating activities for these villages by establishing an
ecotourist camp, Keur Bamboung, and recruiting and training eco-guards and eco-
guides from each village.
25 Although the locally elected representatives of this villages clearly supported this
initiative, the same could not be said for the population as a whole, especially the
women trading in shellfish who believed that the fruits of the mangrove swamps
(oysters, ark clams, yeet and Cymbium) would rot unless gathered; nor the Niominka
fishermen from the Gandoul islands (villages of Bassul, Diogan, etc.) who “traditionally”
set up camp in this area and for whom the bolong was a favoured fishing location (see
Figure 6). Thus, unlike the Saint Louis MPA, governance in Bamboung MPA is
participatory but exclusive, i.e. solely benefiting the villages along the Bamboung
bolong, although these villagers are not indigenous and do not form a homogeneous
group (e.g. the village of Sippo includes Soce, Jola, Bambara, Wolof, many of whom are
not indigenous but assimilated or living together in harmony). The “enclosure”9 of the
S.A.P.I.EN.S, 7.2 | 2014
50

Bamboung bolong was condemned by the professional Niominka fishermen, who
regarded themselves as the only true indigenous population. Ethnic one-upmanship
was compounded by legal one-upmanship (Dahou & Abdel Wedoud, 2007), as the
Niominkas’ “right of the axe” (or first farmers) clashed with the right of the original
Soce inhabitants. The permanent or temporary closure of the Bamboung bolong was a
further bone of contention: apparently some villagers initially accepted the closure
because they thought it would only be temporary. Others deliberately chose the
Bamboung bolong to protect their resources and preserve them from outsiders, be they
neighbours or foreigners. Given the previous and now renewed abundance of fish in
this site following its biological rest period, there is now no question of re-opening it.
Opening the bolong for shellfish collection is the only option that might be considered.
Figure 6. Local governance, an uncertain pathway to participatory democracy: a bridge in theSaloum Delta
Photo: M.-C. Cormier-Salem
26 Another issue of a more ethical nature concerns the eco-tourist camp at Keur
Bamboung, which is based less on fair tourism than tourism “in” nature. The camp is
not self-managed by the villagers. The local economic benefits are limited, most of the
few jobs it provides (around twenty in total) being menial positions (cooks, maids,
oarsman, excluding the volunteer eco-guides and eco-guards who are paid at the end of
the mission), while the estimated population of the fourteen peripheral villages which
joined the MPA is 30,000. It is surprising that besides canoe and kayak excursions into
the mangrove swamps and nature trails through the bush, the open air activities on
offer also include recreational fishing. Tourists are granted rights that are denied to
the locals, even to cater for their own fish consumption (Sarr et al., 2009).
27 Lastly, the lack of transparency in the management of the MPA and in particular the
unequal distribution of the camp profits serve to heighten tensions: following the
S.A.P.I.EN.S, 7.2 | 2014
51
general meeting held in Toubakouta in December 2013, a steering committee was set up
to clarify the status of this MPA; the mandates of the management committee officers
were renewed, with broad representation of all the stakeholders. This should facilitate
communication between the bodies and make coordination easier.
The Kawawana ICCA in Casamance: NIMBY!
28 The establishment and governance of the Community Conserved Area (ICCA) of the
Rural Community of Mangagoulack, known as Kawawana10, are very different from
those of the other MPA. Kawawana was created on the initiative of an association of
fishermen in this RC, supported by the American NGO CENESTA (GEF funding) and
FIBA11, which funded the “Kawawana on the move!” study conducted by scientists and
Oceanium, all active supporters of the concept of participatory biodiversity
conservation (Borrinni-Feyerabend et al., 2009a). Kawawana is an institutional
innovation that officially recognises ancient rights of use and access to the bolongs and
spaces of amphibian areas (Cormier-Salem, 1992).
29 It was created in 2004 by a decree of the governor of Ziguinchor province after a
lengthy process of application for official recognition (the file was submitted four
times). The governor attended the plenary session as well as visiting the various
regional technical departments (which were permitted to have their say). The decree
only came into force after ratification by the Fisheries Department. The regional
council order establishing Kawawana made provision for the transfer of skills.
However, Kawawana is not co-managed with the State and its departments: it is an
independent organisation that carries out surveillance and ensures compliance with
bans, but cannot apply sanctions. Some fishermen have received training from the
Fisheries Department but are not certified; if they catch offenders red-handed, they
have to take action through the officials of the Fisheries department.
30 The Kawawana association of fishermen had 135 members in 2004 and 200 in 2011. It is
made up entirely of Diola fishermen from the Mangagoulack Rural Community, which
includes eight villages (Boutène, Affiniam, Diattok, Tendouck, Boutegol, Mangagoulack,
Elana and Bode) and one hamlet (Djilapao). It is headed by Salatou Sambou, president of
the community association of Mangagoulack RC, who hails from the village of
Mangagoulack.
31 Unlike Bamboung, which is more or less enclosed and continuous, Kawawana is not a
delineated area, but has been zoned to follow the outline of the bolongs (see Figure 7).
Three zones were defined, symbolised by colours (red, orange and yellow). Usage rights
subject to varying levels of restrictions and ad hoc sanctions were assigned to each
(ranging from warnings through seizure of equipment and produce to fines). The
central yellow zone—the Tendouck bolong, an essential transport route between
Ziguinchor and the villages of Boulouf—has the fewest restrictions. Fishing with
outboard motors, fishing with non-selective or illegal equipment such as monofilament
nets, and the gathering of green timber are all banned, while the transport of people
and goods (timber, fish, etc.) and the gathering of oysters and deadwood are permitted.
In the eastern or orange zone, the many-branched bolongs of the villages are an
important farming area for the residents of the RC (timber, oysters, salt, fish). In
addition to the practices banned in the yellow zone, it is also forbidden to sell fishing
produce outside the villages of the RC. Only residents of the RC are permitted to gather
S.A.P.I.EN.S, 7.2 | 2014
52

and freely sell oysters and deadwood; foreigners are also permitted to fish subject to
obtaining authorisation through a warden who must inform the chief of the village in
which the fisherman intends to set up camp. The western or red area corresponds to
the Mitij bolong, which is a sacred bolong where activities of any kind are strictly
forbidden (see Figure 7).
Figure 7. The Kawawana ICCA in Casamance
Source: Borrini-Feyerabend et al., 2009a, CIRAD, Google Earth, CSE. Graphic by M.-C.Cormier-Salem and M. Fabre, UMR PALOC, IRD
S.A.P.I.EN.S, 7.2 | 2014
53
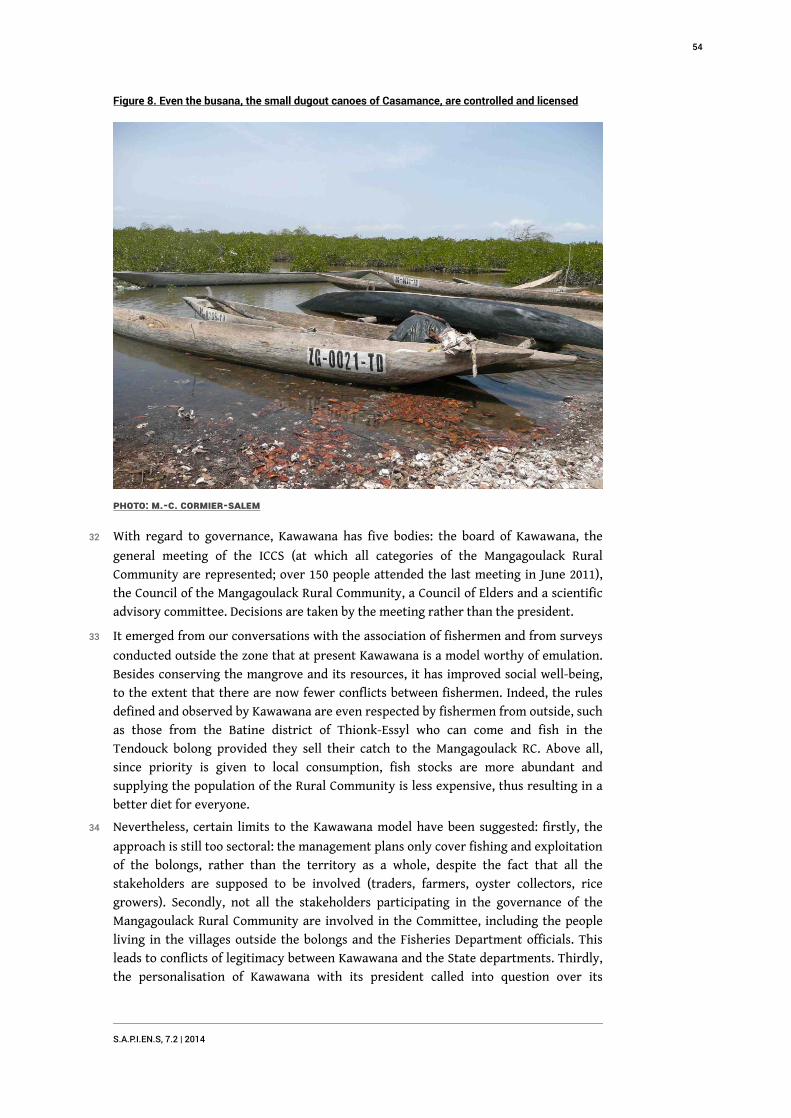
Figure 8. Even the busana, the small dugout canoes of Casamance, are controlled and licensed
Photo: M.-C. Cormier-Salem
32 With regard to governance, Kawawana has five bodies: the board of Kawawana, the
general meeting of the ICCS (at which all categories of the Mangagoulack Rural
Community are represented; over 150 people attended the last meeting in June 2011),
the Council of the Mangagoulack Rural Community, a Council of Elders and a scientific
advisory committee. Decisions are taken by the meeting rather than the president.
33 It emerged from our conversations with the association of fishermen and from surveys
conducted outside the zone that at present Kawawana is a model worthy of emulation.
Besides conserving the mangrove and its resources, it has improved social well-being,
to the extent that there are now fewer conflicts between fishermen. Indeed, the rules
defined and observed by Kawawana are even respected by fishermen from outside, such
as those from the Batine district of Thionk-Essyl who can come and fish in the
Tendouck bolong provided they sell their catch to the Mangagoulack RC. Above all,
since priority is given to local consumption, fish stocks are more abundant and
supplying the population of the Rural Community is less expensive, thus resulting in a
better diet for everyone.
34 Nevertheless, certain limits to the Kawawana model have been suggested: firstly, the
approach is still too sectoral: the management plans only cover fishing and exploitation
of the bolongs, rather than the territory as a whole, despite the fact that all the
stakeholders are supposed to be involved (traders, farmers, oyster collectors, rice
growers). Secondly, not all the stakeholders participating in the governance of the
Mangagoulack Rural Community are involved in the Committee, including the people
living in the villages outside the bolongs and the Fisheries Department officials. This
leads to conflicts of legitimacy between Kawawana and the State departments. Thirdly,
the personalisation of Kawawana with its president called into question over its
S.A.P.I.EN.S, 7.2 | 2014
54
longevity. Lastly, since the ultimate aim is to halt the mass exodus of young people, an
age-old phenomenon that has been exacerbated by insecurity and several years of civil
war, activities need to be diversified still further. Clear interest has been expressed in
processing plants (smoking, drying), on-site marketing to promote local industries, one
or more eco-tourist camps and, lastly, saline solar ponds.
35 Other Rural Communities (Thionk-Essil, Tiobon, Bandial, Petit Kassa, Tobor, etc.) are
interested in adopting a similar approach, but there is a case for questioning whether
transferring this model is appropriate, particularly in terms of territorial solidarity.
Increased local recognition of territories and heritages could lead to partitioning, land
enclosures and a withdrawal into communities. “Non-indigenous” people, ejected from
community land, will have no choice but to restrict their fishing to “non-heritage”
areas and species, a state of affairs aptly summed up by the widely used term NIMBY
(Not In My Back Yard).
Conclusion: between participatory democracy andspatial injustice
36 Protected marine areas, regarded by some as fishery management tools, by others as
maintenance tools for ecosystem services and by yet others as instruments of regional
governance, continue to divide opinion among scientists, managers and decision-
makers concerning their appropriateness. This term encompasses notions of
effectiveness and legitimacy (ecological, economic and social) and has led to the
promotion of “community-managed” MPA in a bid to make them acceptable. In fact,
sustainable management of resources or reasonable use of the environment’s natural
diversity is less important than local governance and the regulation of social
relationships (Weber, 1996). As the three community-managed MPA in Senegal (Saint
Louis, Bamboung and Kawawana) demonstrate, the definition of “good” governance is
open to question. The strategies implemented in Senegal highlight the diverse methods
used to encourage participation by “local” stakeholders (from coordination to
negotiation, membership and decision-making) and the trajectories of governance.
Apart from the limitations already discussed and specific to each case studied, it is clear
that in the end, decision-making remains the prerogative of certain individuals, leaders
or “important people” whose legitimacy is based on their knowledge and more
importantly, on their religious, economic or sociopolitical power. The heightening of
tensions (between groups and categories of stakeholders) and the onset of power games
following the emergence of new stakeholders (heritage mediators) and new networks
(via NGOs) indicate the problems associated with the transition from State
management to local governance and explain the current tendency to return to
centralised management and privatisation of resources or enclosure of land. In the
context of developing countries (disengagement from the State, impoverishment and
rising inequalities, difficult balance between global and local standards, etc.), there is a
case for questioning the place of participatory democracy in public policies on regional
development. We may well cast a critical eye over the new methods of collective action,
but that should not stop us welcoming the innovations (technological, institutional,
economic, legal) they bring with them and the mobilisation of stakeholders in new
arenas. These factors may indeed reveal or even exacerbate conflicts, but they also
S.A.P.I.EN.S, 7.2 | 2014
55

enable knowledge to be shared, rules to be redefined and social connections and
networks to be reactivated (Beuret & Cadoret, 2010; Ostrom, 2011).
BIBLIOGRAPHIE
Agardy, T., G. Notarbartolo di Sciara & P. Christie (2011). Mind the gap: Addressing the
shortcomings of marine protected areas through large scale marine spatial planning. Marine
Policy 35: 226-232.
Agrawal, A. (2005). Environmentality. Technologies of Government and the Making of Subjects. London:
Duke University Press.
Aziz, S.A. (2007). Contribution à la mise en place d’un dispositif de gestion concertée de l’Aire Marine
Protégée de Saint Louis au Sénégal. [Contribution to the establishment of a concerted management plan for
the Marine Protected Area of Saint Louis in Senegal.]. Engineering degree thesis, Montpellier Sup’Agro
Institute for Hot Regions / WWF West African Marine Environments, Dakar.
Berkes, F. (Ed.) (1989). Common Property Resources. Ecology and Community-Based Sustainable
Development. London: Belhaven Press.
Beuret, J.E. & A. Cadoret (2010). Gérer ensemble les territoires. Vers une démocratie coopérative.
[Managing territories together. Towards a cooperative democracy.] Paris: Charles Léopold Mayer.
Blundo, G. (2002). La gouvernance, entre technique de gouvernement et outil d'exploration
empirique. [Governance, between technique of government and tool for empirical exploration.]
Bulletin de l’APAD: 23-24.
Bonnin, M. & E. Rodary (2008). Gouvernance et connectivité écologique. Vers une responsabilité
partagée de la conservation de la nature. [Governance and ecological connectivity. Towards
shared responsibility in nature conservation.] In: Eberhard, C. (Ed.) Traduire nos responsabilites
planetaires. Recomposer nos paysages juridiques [Translating our planetary responsabilities.
Reconstructing the legal landscape.], pp.567-81. Brussels: Bruylant.
Bonnin, M., R. Laë & M. Behnassi (in press). Les Aires Marines Protégées en question. Défis Scientifiques
et Enjeux Sociétaux. [Marine Protected Areas in Question. Scientific Challenges and Social Issues.] IRD.
Borrini-Feyerabend, G., C. Chatelain C. & P. Tous (2009a). Kawawana en marche ! Rapport pour
l’Association des Pêcheurs de la Communauté Rurale de Mangagoulack. [Kawawana on the move!
Report for the Fishers’ Association of the Rural Community of Mangagoulack.] CENESTA, PNUD/
FEM/SGP and FIBA.
Borrini-Feyerabend, G., M. Pimbert, M.T. Farvar, A. Kothari & Y. Renard (2009b). Partager le
pouvoir: cogestion des ressources naturelles et gouvernance partagée de par le monde. [Sharing the power:
co-management of natural resources and shared governance throughout the world.] IIED.
Borrini-Feyerabend, G. & O. Hamerlynck (2010). Réserve de Biosphère Transfrontière du Delta du
Sénégal. Proposition de Gouvernance Partagée. [Senegal River Delta Transborder Biosphere Reserve.
Proposition for Shared Governance.] SIRENES Participative Management Project, Phase 2 of the
PRCM12. Nouakchott/Dakar: PRCM/IUCN/CEESP.
S.A.P.I.EN.S, 7.2 | 2014
56
Charles, A. & L. Wilson (2009). Human dimensions of marine protected areas. ICES Journal of
Marine Science 66(1): 6-15.
Cormier-Salem, M.-C. & B. Roussel (2002). Patrimoines et savoirs naturalistes locaux. [Heritage
areas and local naturalist knowledge.] In: Martin, J.Y. (Ed.) Développement durable ? Doctrines,
pratiques, évaluations [Sustainable development? Doctrines, practice, analysis.], pp. 125-142. Paris, IRD.
Cormier-Salem, M.-C. (1992). Gestion et évolution des espaces aquatiques: la Casamance. [Management
and evolution of aquatic spaces: Casamance.] Paris: Orstom.
Cormier-Salem, M.-C. (2000). Appropriation des ressources, enjeu foncier et espace halieutique
sur le littoral ouest-africain. [Appropriation of resources, real estate issues and fishing space on
the west African coast.] In: Chauveau, J.P., E. Jul-Larsen & C. Chaboud (Eds.),Les pêches piroguières
en Afrique de l’Ouest. Pouvoirs, mobilités, marchés. [Canoe fishing in West Africa. Possibilities, instabilities,
markets.] pp. 205-29. Paris: Karthala-CMI-IRD.
Cormier-Salem, M.-C. (2006a). Vers de nouveaux territoires de la conservation. Exemple des
littoraux ouest-africains. [Towards new conservation territories. The example of the West
African coast.] Annales de géographie 651(5): 597-617.
Cormier-Salem, M.-C. (2006b). Requins, raies et autres chimères en marche vers le patrimoine.
[Sharks, rays and other chimaera, steps towards heritage areas.] In: Chaussade, J. & J. Guillaume
(Eds.) Pêche et Aquaculture. Pour une Exploitation Durable des Ressources Vivantes de la Mer et du Littora,
pp. 141-60. Rennes : Presses universitaires de Rennes.
Cormier-Salem, M.-C. (2007). Enjeux du développement durable dans les pays du Sud: du discours
à la pratique. [Issues in sustainable development in southern countries: from discourse to
practice.] In: Veyret, Y. (Ed.) Le développement durable [Sustainable development], Ch.18, pp. 367-385.
Paris: SEDES, Capes-Agrégation Géographie.
Cormier-Salem, M.-C., C. Bernatets & O. Sarr (2010). Mangrove system sustainability. Public
incentives and local strategies in West Africa. In: Hoanh, C.T. et al. (Eds.) Tropical Deltas and Coastal
Zones: Food Production, Communities and Environment at the Land-Water Interface, Ch.30, pp. 409-421.
Wallingford: CAB International.
Cormier-Salem, M.-C. (2014, in press). De la conservation à la concertation. Quelles AMP pour
quelle gouvernance territoriale? [From conservation to negotation. Which MPA for which
regional governance?] In: Bonnin, M., R. Laë & M. Behnassi (Eds.) Les Aires Marines Protégées en
question. Défis scientifiques et enjeux sociétaux. IRD.
Dahou, T. & O.C. Abdel Wedoud (2007). L’autochtonie dans les Aires Marines Protégées. Terrain de
conflits en Mauritanie et au Sénégal. [Indigenity in Marine Protected Areas. Disputed territory in
Mauritania and Senegal.] Politique africaine 108:173-190.
Dahou, T. (2008). L’“itinérance” des Sereer Niominka. De l’international au local ? [The
“itinerance” of the Sereer Niominka. From international to local?] In: DiopP, M.-C. (Ed.) Le Sénégal
des migrations, pp. 321-42. Paris: Karthala.
Dahou, T. (2010). Gérer les ressources sans gouverner les hommes, le dilemme des aires marines
protégées (Saloum Sénégal). [Managing resources without governing people, the dilemma of
marine protected areas (Saloum Senegal).] Anthropologie et sociétés 34(1).
Dahou, T. & Weigel, J.Y. (2005). La gouvernance environnementale au miroir de politiques
publiques. Le cas des aires marines protégées ouest-africaines. [Environmental governance
reflected in public politics. The case of west-African marine protected areas.] Afrique
Contemporaine 1(213): 217-231.
S.A.P.I.EN.S, 7.2 | 2014
57
De Santo, E. M. (2013). Missing marine protected area (MPA) targets: How the push for quantity
over quality undermines sustainability and social justice. Journal of Environmental Management,
124, : 137-146.
Diallo, M. (2012). Gouverner un patrimoine naturel dans le Delta du Saloum: entre logiques de
conservation, conflits d’intérêts et stratégies d'acteurs. [Governing a natural heritage area in the Saloum
Delta: between the rationale of conservation, conflicts of interest and strategies of stakeholders.] Masters II
thesis, EHESS, Marseille.
Ingold, K. (2014, in press). How involved are they really? A comparative network analysis of the
institutional drivers of local actor inclusion. Land Use Policy URL: dx.doi.org/10.1016/j.landusepol.
2014.01.013.
Janzen, D.H. (1983). No park is an island, increase in interference from outside as park size
decreases. Oikos 41: 402–410.
Lavigne Delville, P. (2011). Du nouveau dans la “participation” au développement? Impératif
délibératif, populisme bureaucratique et participation cachée. [Back to “participation” in
development? Debating imperatives, bureaucratic populism and hidden participation.] In: Jul-
Larsen, E et al. (Eds.) Une anthropologie entre pouvoirs et histoire. Conversations autour de l’œuvre de
Jean-Pierre Chauveau, pp. 160-87. Paris/Marseille/Uppsala: Karthala-IRD-APAD.
Mathevet R., J.D. Thompson, O. Delanoé, M. Cheylan et al. (2010). La solidarité écologique: un
nouveau concept pour la gestion intégrée des parcs nationaux et des territoires. [Ecological
solidarity: a new concept for integrated management of national parks and territories.] Natures
Sciences Sociétés 18: 424–433.
Mermet, L. (2012). Un tramway pour Cancun: quelles perspectives pour la recherche en
négociation sur les dossiers environnementuax complexes ? [A tramway for Cancun: some
perspectives for research into negotiation of complex environmental cases?] Négociations 1(17):
63-75.
Nguinguiri, J.C. (2003). Gouvernance des aires protégées: l’importance des normes pratiques de
régulation de la gestion locale pour la faisabilité des réformes dans le bassin du Congo.
[Governance of protected areas: the importance of practical standards of local management
regulation for the feasibility of reforms in the Congo basin.] Bulletin de l’APAD 26.
Ostrom, E. (1990). Governing the Commons: the Evolution of Institutions for Collective Action.
Cambridge: Cambridge University Press.
Ostrom, E. (2011). Background on the institutional analysis and development framework. Policy
Studies Journal 39(1):7–27.
Posey D. (1996). Provisions and mechanisms of the convention on biological diversity for access to
traditional technologies and benefit sharing for indigenous and local communities embodying traditional
lifestyles. OCEES Research Paper. Oxford Center for the Environment, Ethics and Society.
Potts, T., D. Burdon, E. Jackson, J. Atkins et al. (2014). Do marine protected areas deliver flows of
ecosystem services to support human welfare? Marine Policy 44: 139-148.
Sarr, O., M.-C. Cormier-Salem, C. Bernatets & S. Boulay (2009). Is ecotourism in marine protected
areas a relevant way for sharing benefits from biodiversity conservation? A case study in West
Africa. In: Krause, A. & E. Weir (Eds.) Ecotourism: Management, Development and Impact. Tourism and
Hospitality Development and Management series, pp.159-79. Nova Science Publishers.
Thouzard, H. (2006). Consultation, concertation, négociation. Une courte note théorique.
[Consultation, dialogue, negotiation. A short theoretical note.] Négociations 1(5): 67-74.
S.A.P.I.EN.S, 7.2 | 2014
58
Touré, E-H. (2011). Les conventions locales pour la gestion des ressources naturelles au Sénégal:
entre autonomisation et problèmes d'appropriation. [Local conventions for management of
natural resources in Senegal: between autonomy and problems of appropriation.] VertigO 11(1).
URL: http://vertigo.revues.org/10863; DOI: 10.4000/vertigo.10863
Trimble, M., L.G. de Araujo & C.S. Seixas (2014). One party does not tango! Fishers' non-
participation as a barrier to co-management in Paraty, Brazil. Ocean & Coastal Management 92:
9-18.
Weber, J. (1996). Conservation, développement et coordination: peut-on gérer biologiquement le social ?
[Conservation, development and coordination: can social issues be managed biologically?] Paper
presented at the Panafrican Symposium, Gestion Communautaire des ressources naturelles
renouvelables et développement durable [Community management of renewable natural
resources and sustainable development], 24-27 June 1996, Harare, Zimbabwe.
Weigel, J.-Y., B. Cazalet & S. Mohamed Saleck (2007). Les aires marines protégées d’Afrique de l’Ouest.
Gouvernance et Politiques publiques. [West African marine protected areas. Governance and public policy.]
University of Perpignan, Princeton University Press & IRD.
NOTES
1. These programmes were undertaken at the IRD (Institut de Recherche pour le Developpement, the
French Institute for Development Research, www.ird.fr) in collaboration with the National
Museum of Natural History, under the banner of a joint research unit (UMR) called “PALOC”
(“Local heritages”, www.paloc.fr). The programme was supported by the National Research
Agency (ANR) for Biodiversity and the International Joint Research Laboratory (LMI) “PATEO”
(“Water resources, patrimonies and territories”).
2. In French, Programme Régional pour la Conservation des zones Côtières et Marines.
3. A network within UNESCO’s Man And Biosphere programme, focussing on Africa.
4. DPN: National Parks Department; DEFCC: Water, Forest, Hunting and Soil Conservation
Department; PCGRN: Natural Resources Community-Managed Management Project.
5. Inscription on such a list is the formal procedure for recognising the remarkable nature of an
area and attributing it a protected status at an interantional level. A state such as Senegal has to
elaborate a consistent report to justify this inscription and give guarantees they will respect
their duties for protecting this area.
6. French Global Environment Facility (in French, Fonds Français pour l'Environnement Mondial).
7. Fund Supporting the Environment and Development (in French, Fonds d’Appui à l’Environnement
et au Développement).
8. At the time of our visit, none of the surveillance post equipment was working – neither the
radars and radios nor the patrol boat.
9. This very strong term, used by the president of the association of women who gather shellfish
in one of the villages in Gandoul, condemns the land privatisation promoted by the Bamboung
MPA.
10. KAWAWANA is the acronym for Kapoye Wafwolale Wata Nanang, a Diola expression meaning
“Our heritage, for us all to preserve.”
11. International Foundation of the Banc d’Arguin (in French, Fondation Internationale du Banc
d’Arguin).
12. Regional Marine and Coastal Conservation Programme for West Africa
S.A.P.I.EN.S, 7.2 | 2014
59

RÉSUMÉS
The procedure for designating and establishing Marine Protected Areas (MPA) has changed
profoundly since the 1990s, as a consequence of global changes and new dictates related to
biodiversity conservation and sustainable development. Far beyond protection of flagship species
such as marine turtles and large marine mammals, the goal is now to conserve and even increase
the services associated with coastal ecosystems to the benefit of all stakeholders. References to
community management of resources, territorial solidarity, or environmental justice have
become common. The political processes undertaken have nevertheless taken a range of
different trajectories, since the stakeholders (private, public, NGOs, local collectives) have
different interests; their standards and rules are often incompatible; the efficacy of the
negotiation process is debatable. In this article, after questioning the legitimacy of MPA (to what
extent are they useful tools ? —in responding to what aims?), the difficulties of putting into
practice this new paradigm of participative governance is analysed and illustrated using three
case studies of coastal Senegalese MPAs and the consequences of local intervention: the Saint
Louis MPA, the Bamboung Community-Managed MPA in the Saloum Delta, and the Mangagoulack
ICCA (Indigenous and Community Conserved Area) in Casamance. In conclusion, the principal
lessons and perspectives of these approaches are presented.
INDEX
Keywords : Biodiversity conservation, Marine Protected Area, Local communities, Participation,
Co-management, Governance, Spatial justice
AUTEURS
MARIE-CHRISTINE CORMIER-SALEM
DR IRD, UMR 208 PALOC IRD/MNHN, Dakar, Senegal, E-mail: [email protected]
S.A.P.I.EN.S, 7.2 | 2014
60
Restoration of rice landscapebiodiversity by farmers in Vietnamthrough education and motivationusing media
K.L. Heong, M.M. Escalada, H.V. Chien et L.Q. Cuong
Gaëll Mainguy (éd.)
NOTE DE L’ÉDITEUR
This manuscript was published as part of a special issue on the subject of largescale
restoration of ecosystems. This manuscript was reviewed by two anonymous referees.
Introduction
1 Rice in Vietnam is grown under intensive cultivation conditions to maximize
production. Farmers usually grow two crops a year and in some cases three crops in
large continuous areas, applying high levels of chemical fertilizers and pesticides. Pests
are often considered to be major constraints to yields and the farmers’ main control
tactic is spraying pesticides. Because of poor spray equipment and poor knowledge, a
large proportion of farmers’ sprays are misused (Heong & Escalada, 1997; Bandong et
al., 2002). Farmers tend to focus on highly visible leaf damage like that caused by the
leaf-feeding caterpillars in the early crop stages. However, this damage has little effect
on yields because of plant compensation (Graf et al., 1992). These early season sprays
instead destroy biodiversity and biological control ecosystem services and make the
rice more vulnerable to more destructive secondary pests such as planthoppers (Way &
Heong, 1994; Heong & Schoenly, 1998; Heong, 2009). Believing that rice pests breed in
neighboring habitats, farmers also tend to spray these habitats with pesticides.
However, the most important rice pests are monophagous and thus such practices are
S.A.P.I.EN.S, 7.2 | 2014
61
of no use, and do more harm by destroying the rich biodiversity of resident predators
and parasitoids.
2 Mass media campaigns to motivate rice farmers for change have been highly successful
in Vietnam. The campaign to reduce early season spraying has helped in reducing
farmers’ loss aversion attitudes and thus also insecticide sprays by 53% (Escalada et al.,
1999; Heong et al., 1998). In a follow up campaign advocating farmers to reduce
insecticide sprays, seed and fertilizer rates (locally named “Three Reductions, Three
Gains”), farmers reduced their seed and fertilizer rates by 10% and 7% respectively and
their insecticide sprays by 33% (Huan et al., 2008). High seed rates used by rice farmers
have been known to promote denser crop canopy which coupled with high fertilizer
rates and insecticide use have been known to promote pest and disease development
(Huan et al., 2005). In 2004, a drama program developed using entertainment-education
principles (Singhal & Rogers, 1999) was launched. This program, called locally “My
Homeland Story”, consisted of 104 twenty-minute episodes broadcast weekly and
depicting the daily struggles of village families in rice cultivation, managing pests,
dangers of pesticides, social and family lives. An evaluation survey of farmers,
conducted six months after the completion of the program, showed that farmers who
had listened to at least two episodes of the program reduced their insecticide sprays by
60%, their fertilizer and seed rates by 9% and 33% respectively (Heong et al., 2008).
3 Encouraged by these successes, we embarked on a TV series to educate and motivate
rice farmers to restore biodiversity and ecosystem services by reducing insecticide use
and growing nectar rich flowering plants on the rice bunds and margins (Figure 1). The
flora on the bunds provide Shelter, Nectar, Alternate hosts and Pollen (abbreviated
SNAP) to conserve the natural enemy fauna to protect the rice crop (Gurr et al., 2012).
For instance, mymarid parasitoids of planthoppers live on alternative hosts on the
bunds (see review by Gurr et al., 2010), crickets that are ferocious predators of pest eggs
breed in bund habitats dominated by Bracharia mutica and forage in rice fields at night
(de Kraker et al., 1999), and spiders also use such habitats for shelter and breeding (Yu
et al., 2002). Coupled with withholding insecticide sprays in the early crop stages,
biological control services are further enhanced. These practices are referred to as
“ecological engineering” and the Ecological Engineering TV series (locally known as
Cong Nghe Sinh Thai)1 was developed using entertainment education concepts. The
present paper describes the development of the TV series, the motivating messages, the
evaluation survey and changes in the key variables monitored.
S.A.P.I.EN.S, 7.2 | 2014
62
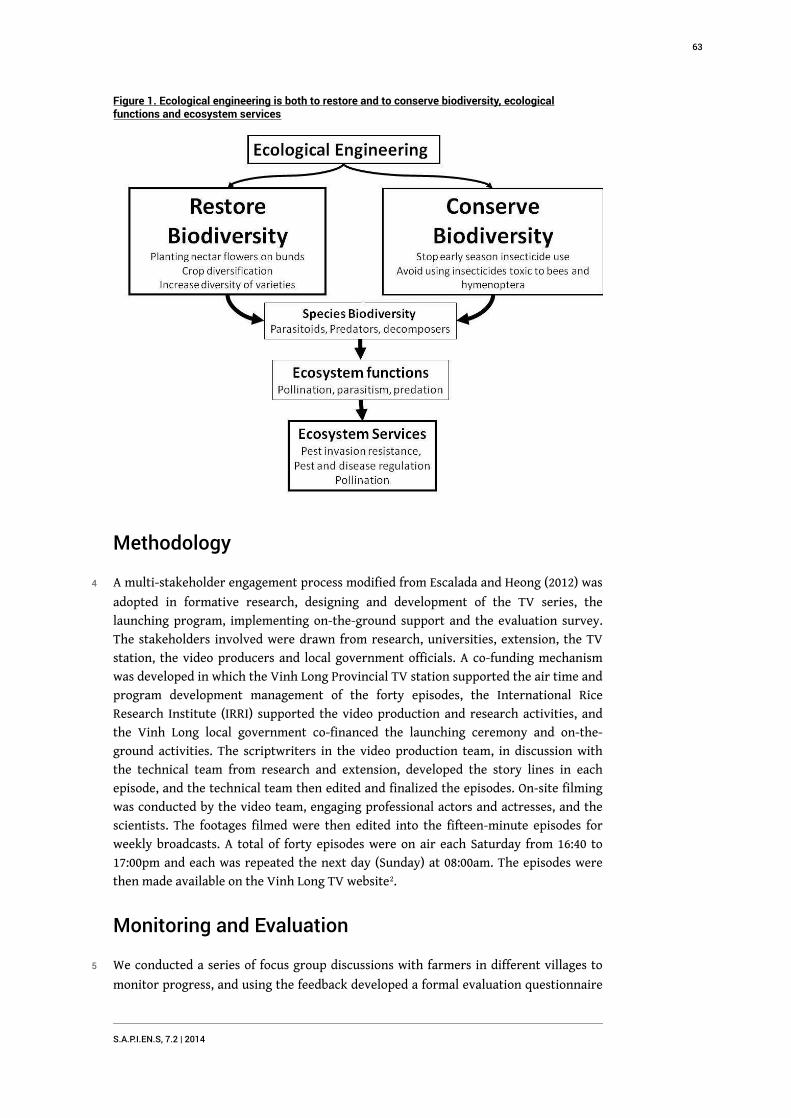
Figure 1. Ecological engineering is both to restore and to conserve biodiversity, ecologicalfunctions and ecosystem services
Methodology
4 A multi-stakeholder engagement process modified from Escalada and Heong (2012) was
adopted in formative research, designing and development of the TV series, the
launching program, implementing on-the-ground support and the evaluation survey.
The stakeholders involved were drawn from research, universities, extension, the TV
station, the video producers and local government officials. A co-funding mechanism
was developed in which the Vinh Long Provincial TV station supported the air time and
program development management of the forty episodes, the International Rice
Research Institute (IRRI) supported the video production and research activities, and
the Vinh Long local government co-financed the launching ceremony and on-the-
ground activities. The scriptwriters in the video production team, in discussion with
the technical team from research and extension, developed the story lines in each
episode, and the technical team then edited and finalized the episodes. On-site filming
was conducted by the video team, engaging professional actors and actresses, and the
scientists. The footages filmed were then edited into the fifteen-minute episodes for
weekly broadcasts. A total of forty episodes were on air each Saturday from 16:40 to
17:00pm and each was repeated the next day (Sunday) at 08:00am. The episodes were
then made available on the Vinh Long TV website2.
Monitoring and Evaluation
5 We conducted a series of focus group discussions with farmers in different villages to
monitor progress, and using the feedback developed a formal evaluation questionnaire
S.A.P.I.EN.S, 7.2 | 2014
63
that was translated into Vietnamese and pretested. We employed local university
students and trained them to conduct the survey of the 593 farmer households in three
provinces. The structured survey instrument was in three parts: i—basic profile
information of respondents; ii—the related crop production practices and the
respondents’ beliefs with regard to pest control; iii—ecological engineering practices
and their perceived barriers to adoption. The completed questionnaires were then
encoded using the spreadsheet program Excel, the data cleaned and uploaded into SPSS
version 15 for analyses.
6 In the evaluation survey, we introduced belief statements and asked farmers to score
how true they were using a response cue card of scores from 1 to 5, where 1 =
“Definitely not true”, 2 = “In most cases not true”, 3 = “Maybe true”, 4 = “In most cases
true” and 5 = “Always true”. We conducted reliability assessments using Cronbach’s
alpha (Bland & Altman, 1997) to examine for consistency and reliability of the belief
statements. The reliability analysis was used to study the properties of a measurement
scale and the items that compose the sum of scores. It provides information about the
relationships between individual items in the scale and computes the Cronbach alpha
that evaluates for internal consistency. The closer the Cronbach’s alpha is to 1, the
higher is the internal consistency (Gliem & Gliem, 2003). It is widely accepted that if the
alpha value is 0.70 or higher for a set of items, it can be considered reliable (Santos,
1999). The belief scores were computed into an index using the equation below:
7 (equation 1)
8 The index varies from zero to 1.0, where zero indicates the most constraining and
unfavorable while 1.0 indicates the most favorable.
9 We constructed two indices from the belief scores using equation 1 and used them to
compare differences in viewers and non-viewers. In addition we compared farmers’
responses to key belief statements of the two groups.
Results
10 Of the 593 farmers interviewed, about 41% had not watched any of the TV series
episodes (non-viewers). Most farmers (60%) watched five or fewer episodes and only 7%
had watched more than fifteen episodes. Farmers who had viewed the TV series
sprayed significantly less insecticide (19% less), used less nitrogen fertilizer (6% less),
used lower seed rates (12% less) and applied their first insecticide sprays later in the
season. The yields of viewers were marginally higher than those of non-viewers
(difference of 0.2 t/ha) (see Appendix 1 for details).
11 Farmers who had watched the TV series could recall what they learned from the series.
Table 1 shows the most common lessons farmers cited. Although the idea of growing
nectar flowers on the bunds for pest management was only launched in 2011, a higher
proportion of TV series viewers had recalled the various lessons they had learned.
Table 1. TV series viewers’ recall of what they had learned and benefits from the TV series
What farmers learned from the TV series % farmers recalling*
Nectar flowers can attract natural enemies to help pest control. 29.9
S.A.P.I.EN.S, 7.2 | 2014
64

Nectar flowers can help reduce insecticide use. 14.8
Flowers on the bunds can help protect the environment. 11.3
Flowers help to beautify the rural landscape. 10.1
Applying “three reductions, three gains”** (Huan et al., 2008). 13.3
If insecticides are to be used, apply them correctly. 11.9
Techniques in flower growing. 9.6
Benefits farmers recalled
Helped in reducing production costs. 52.2
Helped in reducing chemical inputs. 29.4
Improved environmental protection. 28.0
Increased net incomes. 34.6
Increased natural enemies. 27.7
Reduced pest infestations. 13.0
Reducing labor in pesticide spraying. 11.2
* Note that multiple responses were possible: each farmer may have recalled more than one of thelessons or benefits, ** Three reductions, three gains” was a program launched by the Ministry ofAgriculture and Rural Development of Vietnam in 2004 to motivate rice farmers to reduce seed andfertilizer rates and insecticide sprays.
Details in Huan et al. (2008)
12 In addition, the TV series viewers cited various benefits they had obtained from the TV
educational series. A high proportion cited reducing production cost, chemical inputs,
increasing net incomes and reducing labor costs as benefits.
Belief indices
13 We computed two indices from the belief statements. Those related to ecological
engineering beliefs (EEInd) and those related to perceived belief barriers (PBInd) and
compared differences between viewers and non-viewers (see Appendix 2 for details).
14 Perceived barrier attitudes may obstruct or favor the actual adoption even if behavioral
and subjective norm attitudes may be favorable. Health communication research has
shown that the lack of perceived behavioral control can impede adoption of healthy
lifestyle practices (Glanz et al., 2002). For instance a common perceived barrier to
joining a gym is that it is expensive despite increased knowledge of the benefits of
physical activities.
15 There were highly significant differences in both indices between viewers and non-
viewers. Viewers scored higher (0.73) indicating that their attitudes towards ecological
S.A.P.I.EN.S, 7.2 | 2014
65
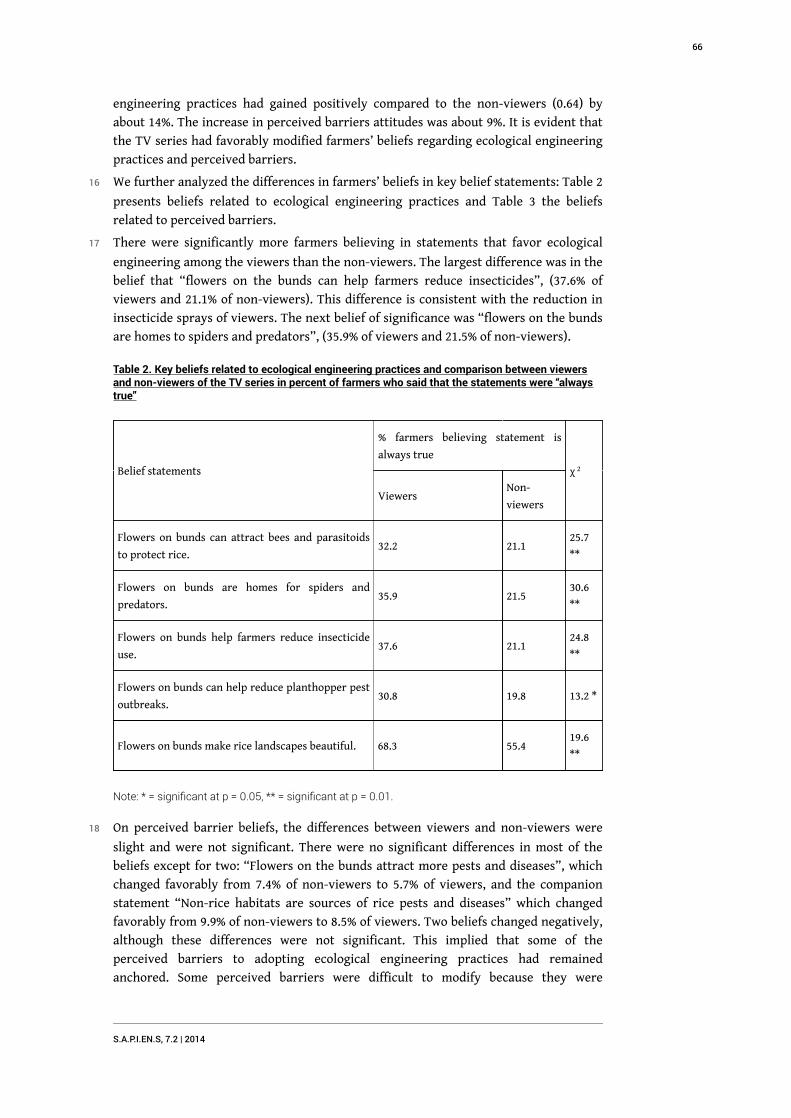
engineering practices had gained positively compared to the non-viewers (0.64) by
about 14%. The increase in perceived barriers attitudes was about 9%. It is evident that
the TV series had favorably modified farmers’ beliefs regarding ecological engineering
practices and perceived barriers.
16 We further analyzed the differences in farmers’ beliefs in key belief statements: Table 2
presents beliefs related to ecological engineering practices and Table 3 the beliefs
related to perceived barriers.
17 There were significantly more farmers believing in statements that favor ecological
engineering among the viewers than the non-viewers. The largest difference was in the
belief that “flowers on the bunds can help farmers reduce insecticides”, (37.6% of
viewers and 21.1% of non-viewers). This difference is consistent with the reduction in
insecticide sprays of viewers. The next belief of significance was “flowers on the bunds
are homes to spiders and predators”, (35.9% of viewers and 21.5% of non-viewers).
Table 2. Key beliefs related to ecological engineering practices and comparison between viewersand non-viewers of the TV series in percent of farmers who said that the statements were “alwaystrue”
Belief statements
% farmers believing statement is
always true
χ 2
ViewersNon-
viewers
Flowers on bunds can attract bees and parasitoids
to protect rice.32.2 21.1
25.7
**
Flowers on bunds are homes for spiders and
predators.35.9 21.5
30.6
**
Flowers on bunds help farmers reduce insecticide
use.37.6 21.1
24.8
**
Flowers on bunds can help reduce planthopper pest
outbreaks.30.8 19.8 13.2 *
Flowers on bunds make rice landscapes beautiful. 68.3 55.419.6
**
Note: * = significant at p = 0.05, ** = significant at p = 0.01.
18 On perceived barrier beliefs, the differences between viewers and non-viewers were
slight and were not significant. There were no significant differences in most of the
beliefs except for two: “Flowers on the bunds attract more pests and diseases”, which
changed favorably from 7.4% of non-viewers to 5.7% of viewers, and the companion
statement “Non-rice habitats are sources of rice pests and diseases” which changed
favorably from 9.9% of non-viewers to 8.5% of viewers. Two beliefs changed negatively,
although these differences were not significant. This implied that some of the
perceived barriers to adopting ecological engineering practices had remained
anchored. Some perceived barriers were difficult to modify because they were
S.A.P.I.EN.S, 7.2 | 2014
66

concerned about the physical conditions of their fields, like “the bunds are too
narrow”.
Table 3. Comparison of key perceived barrier beliefs between viewers and non-viewers of the TVseries in percent of farmers who said that the statements were “always true”
Belief statements
% farmers believing statement is
always true
χ 2
ViewersNon-
viewers
Flowers on bunds attract more pests and disease
to rice.5.7 7.4
21.0
**
Non-rice habitats are sources of rice pests and
diseases.8.5 9.9
28.9
**
Flowers on bunds will die when we burn straw
after harvest.30.8 35.5 2.3 ns
Bunds are for walking and planted flowers will not
survive.16.5 15.7 2.3 ns
Bunds are too narrow, no place to grow flowers. 20.8 18.6 5.7 ns
Note: ns = not significant, * = significant at p = 0.05, ** = significant at p = 0.01
Discussion
19 The comparison of beliefs and practices between viewers and non-viewers of the TV
series revealed some evidence of change. The TV episodes had focused on providing
information and motivation for farmers to modify their beliefs, adopt the growing of
flowering plants on the bunds and reduce seed and fertilizer rates and insecticide
sprays. There are significant reductions in these inputs among viewer farmers, and
they also had slightly higher yields. Since farmers’ adoption is the net outcome of
several key belief attributes, we computed two indices to compare viewers and non-
viewers. We found that farmers’ attitudes towards ecological engineering practices
were favorably improved among the viewers. In addition, significantly more viewers
had favorable attitudes towards insecticide reduction and growing of nectar-rich
flowers. The perceived barrier index among viewers was also favorably increased,
although this index had remained just slightly above 0.5, an indicator of indifference. It
was quite apparent that some perceived barriers could not be modified, such as “bunds
are too narrow”. The TV series had a stronger effect on farmers’ beliefs in insecticide
use, and this was reflected in significant reductions in insecticide use. Some beliefs
related to the growing of flowers on the bunds were also favorably modified. However,
unless some of the key perceived barriers could be overcome or additional motivation
introduced, like paying farmers for environmental services (FAO, 2007), adoption of
flower growing on the bunds as an ecological engineering method would probably not
S.A.P.I.EN.S, 7.2 | 2014
67
increase markedly. Among the issues that would need to be addressed are the bunds’
width and straw burning. Ideally, we should consider modifying the geometry of the
rice landscape with a well-balanced mosaic of paddy fields and other habitats to
maximize biological control. However, since most rice fields had been established
decades ago, only small adjustments are possible, but a well-balanced landscape should
be considered and form the basis of new rice land developments.
20 The TV series did succeed in initiating changes in farmers’ beliefs. Among the main
factors that contributed to the success were the engagement and participation of key
stakeholders. To ensure that we had quality partnerships, we used decision theories
and sociological tools and a six phase engagement process (Escalada & Heong, 2012).
The process focused on jointly identifying the issues, needs and opportunities,
developing and evaluating intervention options and prototype materials, and
developing hypotheses, instruments and data for evaluation. In the first three phases,
partners participated in focus group discussions and scoping studies to assess issues,
needs and key opportunities in terms of communication. For instance, partners found
that farmers were unable to see, understand or appreciate parasitism, but they knew
and appreciated bees. This was discussed in a workshop and since parasitism by
hymenopteran parasitoids is believed to be a vital function for biological control
services (Gurr et al., 2010) we “distilled” science knowledge into simple rules. For
example, parasitoids were called “small bees” that “eat pests” and should therefore be
conserved. The cluster of simple rules that partners developed was “Flowers along
bunds bring in bees and their relatives”; “The bee relatives attack eggs that
planthoppers lay”; and “Insecticides will kill bees and their relatives”.
21 In the fourth phase, farmers were invited to evaluate the growing of nectar flowers on
bunds, and through further focus group discussions with participating farmers we
developed deeper understanding of their beliefs on the practices and the barriers to
adoption. Phase five focused on developing key communication messages for the TV
series. The three main messages developed were:
Flowers in rice environments attract and support bees and beneficial insects to protect rice
from invading planthoppers.
Insecticide use is reduced to avoid killing bees and beneficial insects.
Incomes are increased.
22 The brand name of “Cong Nghe Sinh Thai” was also developed by partners in this phase
(Escalada & Heong, 2012). The TV series was launched in a formal event broadcast live
nationwide over Vinh Long TV, and followed by other publicity activities to popularize
the series. The final phase was the evaluation of the impact of the TV series on farmers’
beliefs and practices where partners jointly conducted the survey and shared the
results. The six phase multi-stakeholder participatory process helped to engage
stakeholders in all stages of the development of the approach and gained buy-in from
policy makers, research, extension and farmers.
23 An important challenge will be the longer-term sustainability of the TV series. The
radio soap opera launched in 2004 was on air for 104 episodes and a continuation
program supported through a World Bank Development Market Place Award broadcast
another 135 episodes. The present TV series has been on air for forty episodes and we
expect a continuation of the series for another twenty episodes funded by a German
project called LEGATO. The challenge now is to mainstream such programs into the TV
1.
2.
3.
S.A.P.I.EN.S, 7.2 | 2014
68
station’s regular programming. To maintain a long TV series will require funding. A
further threat to sustain the gains made by the TV series is “advertising piracy” where
the TV series is being used to advertise new pesticides.
Acknowledgements
24 The authors are grateful to Dr Guy Trébuil for his continuous encouragement and
facilitation for us to write up the case study for publication, the deputy director of Vinh
Long TV station for agreeing to broadcast the series with minimal air time costs. This
project was made possible by funding provided by an Asian Development Bank (ADB)
regional research and development technical assistance (RDTA) to the International
Rice Research Institute (IRRI).
BIBLIOGRAPHIE
Ajzen, I. (1991). The theory of planned behavior. Organizational Behavior and Human Decision
Processes 50: 179–211. doi:10.1016/0749-5978(91)90020-T
Bandong, J.P., B.L. Canapi, C.G. dela Cruz & J.A. Litsinger (2002). Insecticide decision protocols: a
case study of untrained Filipino rice farmers. Crop Protection 21: 803-816.
Bland, J.M. & D.G. Altman (1997). Statisitcs notes: Cronbach’s alpha. BMJ 314: 572. doi: http://
dx.doi.org/10.1136/bmj.314.7080.572.
Escalada, M.M. & K.L. Heong (2012). Using decision theory and sociological tools to facilitate
adoption of biodiversity-based pest management strategies. In: Gurr, G.M., S.D. Wratten & W.E.
Snyder (Eds). Biodiversity and Insect Pests: Key Issues for Sustainable Management, pp. 199-213.
Oxford, UK: Wiley-Blackwell.
Escalada, M.M., K.L. Heong, N.H. Huan & V. Mai (1999). Communications and behavior change in
rice farmers' pest management: The case of using mass media in Vietnam. Journal of Applied
Communications 83: 7-26.
Food and Agriculture Organization [FAO] (2007). State of Food and Agriculture 2007 – Paying
farmers for environmental services. Rome: FAO.
Glanz, K., B.K. Rimer & F.M. Lewis (2002). Health Behavior and Health Education: Theory,
Research and Practice. San Francisco: Wiley & Sons.
Gliem, J.A. & R.R. Gliem (2003, October). Calculating, interpreting, and reporting Cronbach’s alpha
reliability coefficients for Likert-type scales. Paper presented at the Midwest Research-to-
Practice Conference in Adult, Continuing, and Community Education, October 8-10 2003, The
Ohio State University, Columbus, Ohio.
Graf, B., R. Lamb, K.L. Heong & L.T. Fabellar (1992). A simulation model for the population
dynamics of the rice leaffolders (Lepidoptera: Pyralidae) and their interactions with rice. Journal
of Applied Ecology 29: 558-570.
S.A.P.I.EN.S, 7.2 | 2014
69
Gurr, G.M., J. Liu, D.M.Y. Read, J.L.A. Catindig et al. (2010). Parasitoids of Asian rice planthopper
(Hemiptera: Delphacidae) pests and prospects for enhancing biological control. Annals of Applied
Biology 158: 149-176. doi:10.1111/j.1744-7348.2010.00455.x
Gurr, G.M., K.L. Heong, J.A. Cheng & J. Catindig (2012). Ecological engineering against insect pests
in Asian irrigated rice. In: Gurr, G.M., S.D. Wratten & W.E. Snyder (Eds). Biodiversity and Insect
Pests: Key Issues for Sustainable Management, pp. 214-29. Oxford, UK: Wiley-Blackwell.
Heong, K.L. (2009). Are planthopper problems due to breakdown in ecosystem services? In:
Heong, K.L. & B. Hardy (Eds.) Planthoppers – New Threats to the Sustainability of Intensive Rice
Production Systems in Asia, pp. 221-32. Los Banos, Philippines: International Rice Research
Institute.
Heong, K.L. & M.M. Escalada (1997). Pest Management Practices of Rice Farmers in Asia. Los
Baños, Philippines: International Rice Research Institute.
Heong, K.L., M.M. Escalada, N.H. Huan & V. Mai (1998). Use of communication media in changing
rice farmers' pest management in South Vietnam. Crop Protection 17(5): 413-25.
Heong K.L., M.M. Escalada, N.H. Huan, V.H. Ky Ba et al. (2008). Entertainment-education and rice
pest management: a radio soap opera in Vietnam. Crop Protection 27: 1392-7.
Heong, K.L. & K.G. Schoenly (1998). Impact of insecticides on herbivore-natural enemy
communities in tropical rice ecosystems. In: Haskell, P.T. & P. McEwen (Eds.) Ecotoxicology:
Pesticides and Beneficial Organisms, pp. 381-402. London: Chapman and Hall.
Huan, N.H., L.V. Thiet, H.V. Chien & K.L. Heong (2005). Farmers’ evaluation of reducing pesticides,
fertilizers and seed rates in rice farming through participatory research in the Mekong Delta,
Vietnam. Crop Protection 24: 457-464.
Huan, N.H., H.V. Chien, P.V. Quynh, P.S. Tan et al. (2008). Motivating rice farmers in the Mekong
Delta to modify pest management and related practices through mass media. J International Pest
Management 54: 339-346. de Kraker, J., A. Van Huis, J.C. Van Lenteren, K.L. Heong & R. Rabbinge
(1999). Egg mortality of rice leaffolders Cnaphalocrocis medinalis and Marasmia patnalis in
irrigated rice fields. BioControl 44: 449-71.
Santos, R.A. (1999). Cronbach’s alpha: A tool for assessing the reliability of scales. Journal of
Extension 37(2): Tools of the Trade—2TOT3.
Singhal, A. & E.M. Rogers (1999). Entertainment–Education—A Communication Strategy for Social
Change. New Jersey: Lawrence Erlbaum Publishers.
Way, M.J. & K.L. Heong (1994). The role of biodiversity in the dynamics and management of insect
pests of tropical irrigated rice—a review. Bulletin of Entomological Research 84: 567-87.
Yu, X.-P., X.-S. Zheng, H.-X. Xu, Z.-X. Lu, J.-M. Chen & L.-Y. Tao (2002). A study on the dispersal of
lycosid spider, Pirata subpiraticus between rice and Zizania fields. Acta Entomologica Sinica 45:
636-40.
ANNEXES
Appendix 1. Profiles of viewers and non-viewers, their input practices and yields.
Parameters Viewers Non viewers F values Sig
S.A.P.I.EN.S, 7.2 | 2014
70
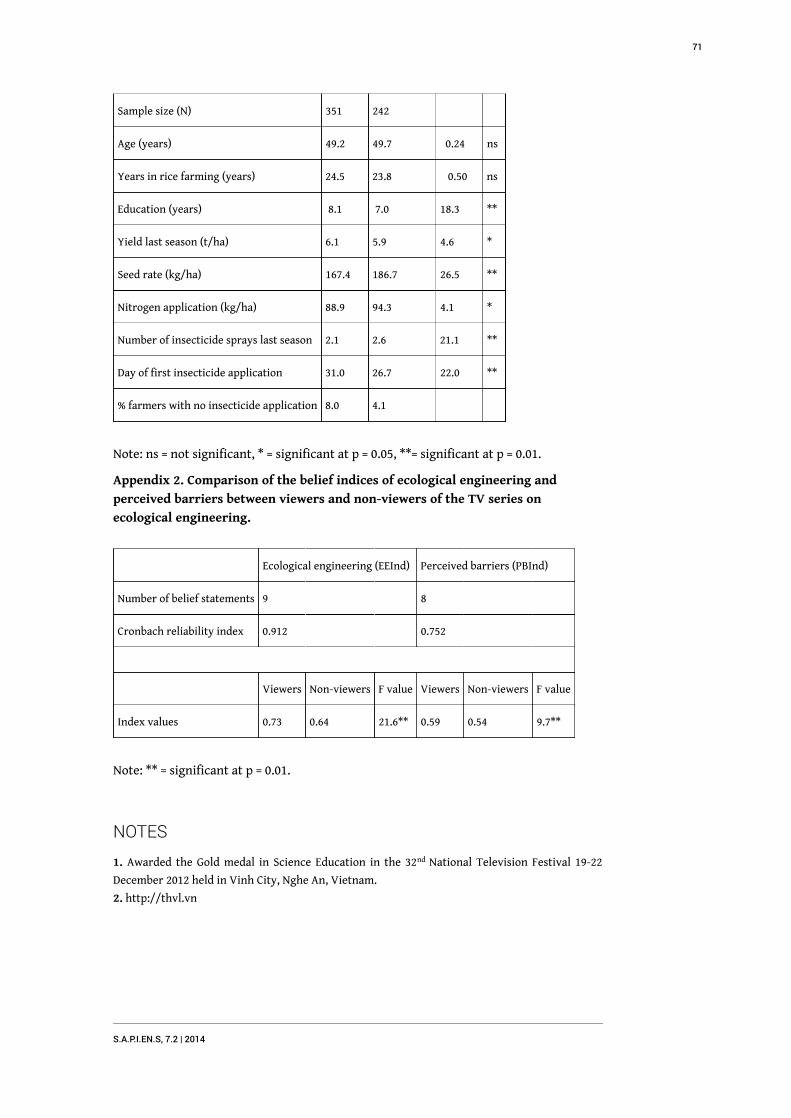
Sample size (N) 351 242
Age (years) 49.2 49.7 0.24 ns
Years in rice farming (years) 24.5 23.8 0.50 ns
Education (years) 8.1 7.0 18.3 **
Yield last season (t/ha) 6.1 5.9 4.6 *
Seed rate (kg/ha) 167.4 186.7 26.5 **
Nitrogen application (kg/ha) 88.9 94.3 4.1 *
Number of insecticide sprays last season 2.1 2.6 21.1 **
Day of first insecticide application 31.0 26.7 22.0 **
% farmers with no insecticide application 8.0 4.1
Note: ns = not significant, * = significant at p = 0.05, **= significant at p = 0.01.
Appendix 2. Comparison of the belief indices of ecological engineering and
perceived barriers between viewers and non-viewers of the TV series on
ecological engineering.
Ecological engineering (EEInd) Perceived barriers (PBInd)
Number of belief statements 9 8
Cronbach reliability index 0.912 0.752
Viewers Non-viewers F value Viewers Non-viewers F value
Index values 0.73 0.64 21.6** 0.59 0.54 9.7**
Note: ** = significant at p = 0.01.
NOTES
1. Awarded the Gold medal in Science Education in the 32nd National Television Festival 19-22
December 2012 held in Vinh City, Nghe An, Vietnam.
2. http://thvl.vn
S.A.P.I.EN.S, 7.2 | 2014
71
RÉSUMÉS
A TV series using entertainment-education principles and broadcast over Vinh Long Television
station in Vietnam helped changed rice farmers’ beliefs and pest management practices. The
evaluation survey conducted two months after the end of the broadcast showed that farmers
sprayed significantly less insecticides (19% less), used less nitrogen fertilizer (6% less), and used
lower seed rates (12% less). In addition, there were significantly more farmers believing in
statements that favor ecological engineering among the viewers than the non-viewers. Viewers
scored higher in the belief index compared to the non-viewers by about 14%, indicating that
their attitudes towards ecological engineering practices had gained positively. Although there
was about a 9% increase in favor of ecological engineering adoption, there are at least two
barriers that remain unchanged.
The TV series had succeeded in initiating changes in farmers’ beliefs and adoption of ecological
engineering practices. This might be due to entertainment-education content and the
engagement of key stakeholders and partners in the project process. Decision theories and
sociological tools and a six phase engagement process were used to ensure quality partnerships.
INDEX
Keywords : Rice, Entertainment-education, Vietnam, Ecological engineering, Pest management,
Perceived barriers
AUTEURS
K.L. HEONG
International Rice Research Institute, Los Banos, Philippines, Current affiliation – Centre for Agro
Biosciences International (CABI), Serdang, Malaysia.
M.M. ESCALADA
Visayas State University, Baybay, Leyte, Philippines
H.V. CHIEN
Southern Regional Plant Protection Center, Long Dinh, Vietnam
L.Q. CUONG
Southern Regional Plant Protection Center, Long Dinh, Vietnam
S.A.P.I.EN.S, 7.2 | 2014
72

Oregon’s Restoration Economy: Howinvesting in natural assets benefitscommunities and the regionaleconomy
Cathy P. Kellon et Taylor Hesselgrave
Gaëll Mainguy (éd.)
NOTE DE L’ÉDITEUR
This manuscript was published as part of a special issue on the subject of largescale
restoration of ecosystems. This manuscript was reviewed by two anonymous referees.
S.A.P.I.EN.S, 7.2 | 2014
73
Box 1. facts and figures
* Location: USA; Pacific Northwest; Oregon State
* Ecosystems: River basins covering nine Level III ecoregions: Coast Range, Willamette Valley,
Cascade Mountains, Eastern Cascades Slopes and Foothills, Columbia Plateau, Blue Mountains,
Snake River Plain, Klamath Mountains, Northern Basin and Range Desert. Source: For more
information, see Environmental Protection Agency, Western Ecology Division, Ecoregion Maps and
GIS Resources: http://www.epa.gov/wed/pages/ecoregions/level_iii_iv.htm (Accessed April 11,
2014).
* Population: 3.9 million people in the state of Oregon, U.S.
* Size of Restored Area: 2,314 miles of riparian habitat improved; 642 miles of in-stream habitat
treated; 686,570 acres of uplands improved; 37,122 acres of wetlands improved; 2,043 stream miles
reopened to access by anadromous species.
* Budget: $411.4 million dollars invested in 6,740 watershed restoration projects.
* Study Period/Duration: 2001-2010
* Partners: University of Oregon Ecosystem Workforce Program, Oregon Watershed Enhancement
Board, U.S. Forest Service, National Oceanic and Atmospheric Administration Restoration Center
* Study Objectives: Quantify the market benefits of watershed restoration expenditures in order to
build public support for habitat restoration.
Introduction
1 Watershed restoration is the practice of restoring degraded aquatic and terrestrial
habitats to functional, self-sustaining conditions. More than one billion dollars is spent
on river restoration each year (Bernhardt et al., 2005) as restored watersheds provide
an array of generation-spanning ecosystem services and benefits (MEA, 2005). However,
measuring all ecological, health, cultural and economic impacts of restoration is
difficult, costly, and uncertain. As such, reported watershed restoration outcomes tend
to be easily quantified, project implementation metrics such as the numbers of stream
miles improved or acres treated. However, in today’s fiscal climate it is more important
than ever to demonstrate the multiple ways that conservation work benefits not just
the environment but also our economy. Recently, Nielsen-Pincus & Moseley (2010)
produced economic multipliers specific to watershed restoration in the state of Oregon,
making it possible to estimate the economic activity stimulated by restoration
investments.
2 This paper uses the multipliers from Nielsen-Pincus and Moseley (2010) to examine the
employment and economic impacts of watershed restoration expenditures in Oregon,
and to discuss the utility of these estimates in reaching conservation policy goals.
Ecotrust1, a nonprofit in Portland, Oregon, undertook this assessment in order to
daylight the market benefits of salmon habitat restoration. Our mission is to inspire
fresh thinking that creates economic opportunity, social equity and environmental
wellbeing; and we assume that by quantifying restoration benefits we can build public
support for, and improve public policies in favor of, watershed restoration.
S.A.P.I.EN.S, 7.2 | 2014
74
Background on restoration and economics
3 In order to restore ecosystems at a meaningful scale, conservationists and researchers
must make the social and economic benefits of doing so more explicit (Knight et al.,
2006; Holl & Howarth, 2000). This is felt most keenly during adverse economic
conditions when debates over shrinking public budgets devolve into zero-sum game
arguments; namely, spending money on environmental protection or enhancement is a
sacrifice to economic growth. Even though the need for ecosystem restoration is
usually a consequence of economic activity, the resources provided to carry it out are
influenced by current economic circumstances (Edwards & Abivardi, 1997).
Nonetheless, a recent survey of over a thousand peer-reviewed restoration papers
found that restoration practitioners are failing to draw links between ecological and
socioeconomic benefits, underselling the evidence that restoration is a worthwhile
investment for society (Aronson et al., 2010).
Estimating the benefits of protected or restored habitat
4 As the majority of the goods and services provided by nature are not valued in the
formal market economy, economists have created novel approaches to incorporate
environmental benefits into economic analyses, such as the Total Economic Valuation
(TEV) framework, see Pearce et al. (1989). TEV is comprised of both use values (direct,
indirect and option) and non-use values (bequest and existence) that together
constitute the total economic value of the natural resource or ecosystem in question.
However, the majority of TEV studies address only one use value, such as air
purification services, rather than providing a complete estimate for all use and non-use
values. TEV studies utilize a variety of non-market valuation methods such as hedonic
pricing, travel cost, contingent valuation, and experimental choice analyses. Robbins &
Daniels (2012) provide an excellent overview of these methods in the context of
restoration, and De Groot et al. (2013) conducted a synthesis cost-benefit analysis on a
range of ecosystem restoration projects, finding that the majority of projects were not
only profitable but were also high-yielding investments.
5 The contribution of such economic studies to the field of restoration is critical to
furthering knowledge and uniting disciplines. However, it is important to recognize
their limitations. TEV studies are long-term, expensive efforts that need to be carefully
and correctly designed to produce relevant results. Even with adequate time and
resources, such studies can be highly sensitive to key assumptions, biases, and inherent
uncertainties; if improperly executed, results may be unreliable (Schultz et al., 2012).
Estimating the economic impacts generated by habitat restoration
project expenditures
6 Recently, economic thinking about restoration has expanded to examine the short-
term, market benefits that restoration expenditures stimulate in local communities
(e.g. see Edwards et al. 2013). These types of analyses are identical to those undertaken
to assess the economic impact of federal investments in construction projects, for
example. As in traditional construction, restoration project expenditures are made as
payments to contractors, payments for equipment and materials, and as wages to
S.A.P.I.EN.S, 7.2 | 2014
75
personnel managing and performing the restoration work. These businesses and
employees in turn circulate that money throughout the economy as they supply their
own business and labor needs, stimulating further economic activity. In economics this
process is called the ‘ripple’ or ‘multiplier effect’, as the initial outlay of spending
ripples and multiplies throughout various sectors of the economy related directly and
indirectly to the project. Economists use input-output (I-O) modeling or the economic
multipliers derived from I-O models to conduct these analyses and it is the basis for the
following case study. For more information on I-O models, see Annex A.
Case study: Restoration and the local economy inOregon
7 In the western United States, billions of dollars have been spent over recent decades to
recover anadromous salmon species listed under the federal Endangered Species Act
(ESA). Broad support and participation from the private and public sectors is needed to
address the limiting factors to salmon viability, especially the improvement of stream
and watershed health. In Oregon, there is strong state-led support of watershed
restoration. The state generates restoration funding from state lottery funds and sales
of salmon license plates and pools this with federal allocations for salmon recovery.2
The Oregon Watershed Enhancement Board (OWEB), a state agency, manages these
funds and makes grants available to local watershed councils, tribes, soil and water
conservation districts, and other groups for on-the-ground restoration projects. Most
projects are designed to recover watershed processes like habitat connectivity and
floodplain dynamics. Landowners and other private citizens, community organizations,
interest groups, and all levels of government are involved in project organization,
design and implementation.3
8 This paper examines the employment and economic impacts of watershed restoration
expenditures made in Oregon over the ten year period of 2001–2010, using economic
multipliers to determine the total direct, indirect, and induced impacts resulting from
these investments.
Methods
9 Project data were gathered using the OWEB’s Oregon Watershed Restoration Inventory
(OWRI)4, an extensive public database documenting watershed projects around the
state. For the period of 1995-2009, the OWRI has descriptive information on 13,625
projects.
10 We queried the OWRI for watershed restoration projects that:
were completed in Oregon during the ten year period of 2001–2010;
included cash expenditures (excluding projects supported solely with in-kind contributions);
and
listed specific restoration activities, such as “riparian vegetation enhancement” or “fish
passage barrier removal”, with associated total expenditure data.
11 A total of 6,740 watershed restoration projects were returned.5 All project expenditures
were converted to 2010 dollars using the Bureau of Economic Analysis’s implicit price
1.
2.
3.
S.A.P.I.EN.S, 7.2 | 2014
76
deflators for government consumption expenditures and gross investment. In-kind
funding, while critical to restoration efforts, was not included in this analysis.
12 To determine the economic impacts of restoration investments, we used multipliers
supplied by Nielsen-Pincus & Moseley (2010) who examined the employment and
economic impacts of public investment in forest and watershed restoration in Oregon.
Type I multipliers measure only the direct and indirect effects while Type II multipliers
measure the direct, indirect and induced effects of the investment. For more
information about economic and employment multipliers, see Annex A.
13 First, all project expenditures were totaled by the restoration activity categories used
by OWRI and Nielsen-Pincus & Moseley (2010), described as follows:
Fish Passage — removal of barriers to fish passage such as culverts and dams;
In-stream — enhancement of stream habitat and function;
Riparian — enhancement and restoration of native riparian vegetation;
Road — inventory, construction, reparation, or decommission of roads;
Upland — agricultural water management, juniper management, and noxious weed
treatments;
Urban — urban centered actions removing sources of watershed pollution;
Wetland — restoration of wetland and estuarine habitat;
Combined — a diverse combination of some of the above project types.
14 Then, the associated multipliers (see Table 1) were applied to the totaled expenditures
in each respective activity category. Where projects included multiple activities, the
relevant multiplier was applied to the portion of total expenditures associated with
that activity. Because multipliers for road and urban projects were not developed by
Nielsen-Pincus & Moseley (2010), we used the “Combined” multiplier.
15 Table 1 details the economic multipliers and employment effects estimated by Nielsen-
Pincus & Moseley’s (2010) stimulated per $1 million invested. Jobs supported may be
full-time, part-time, temporary, seasonal, or permanent.
Table 1. Economic multipliers and employment effects
Economic multipliersEmployment effects per
$1 million invested
Restoration Activity Type I Type II Direct + Indirect Direct + Indirect + Induced
Fish passage 1.8 2.3 10.6 15.2
In-stream 1.7 2.2 10.5 14.7
Riparian 1.7 2.4 17.5 23.1
Upland 2 2.6 10.8 15
Wetland 1.8 2.4 12.5 17.6
Other/Combined 1.8 2.3 10.4 14.7
Source: Nielsen-Pincus & Moseley (2010)
•
•
•
•
•
•
•
•
S.A.P.I.EN.S, 7.2 | 2014
77
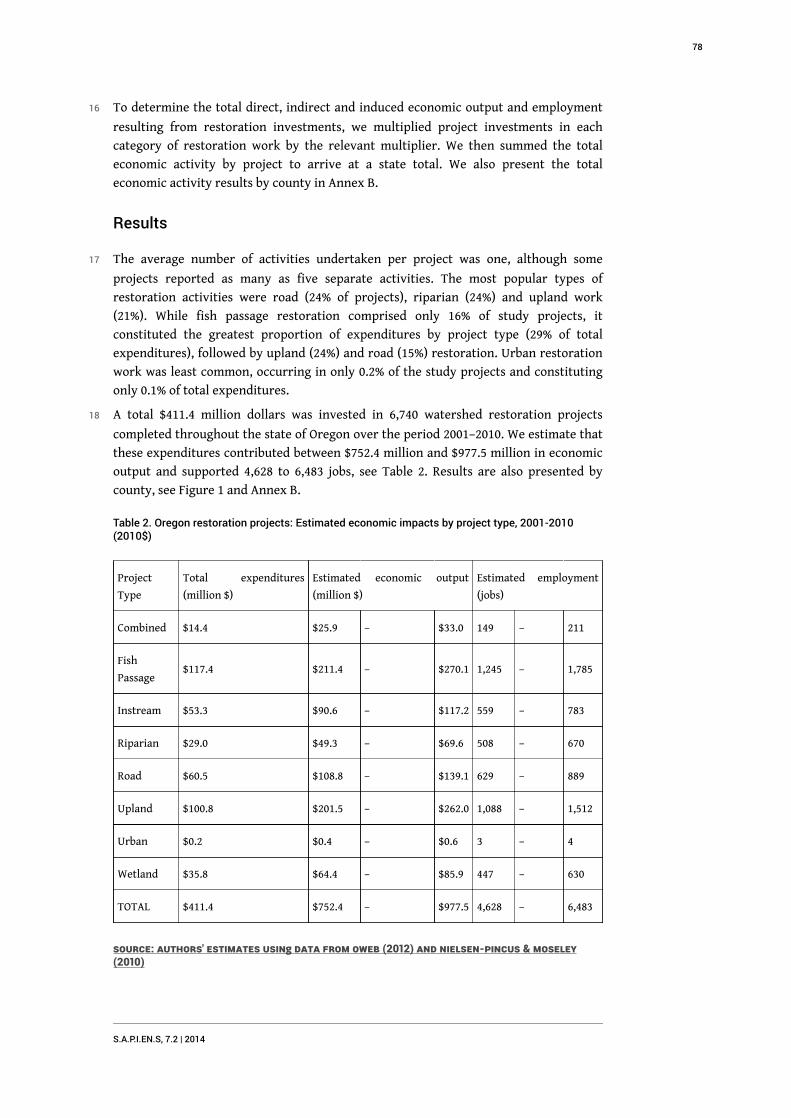
16 To determine the total direct, indirect and induced economic output and employment
resulting from restoration investments, we multiplied project investments in each
category of restoration work by the relevant multiplier. We then summed the total
economic activity by project to arrive at a state total. We also present the total
economic activity results by county in Annex B.
Results
17 The average number of activities undertaken per project was one, although some
projects reported as many as five separate activities. The most popular types of
restoration activities were road (24% of projects), riparian (24%) and upland work
(21%). While fish passage restoration comprised only 16% of study projects, it
constituted the greatest proportion of expenditures by project type (29% of total
expenditures), followed by upland (24%) and road (15%) restoration. Urban restoration
work was least common, occurring in only 0.2% of the study projects and constituting
only 0.1% of total expenditures.
18 A total $411.4 million dollars was invested in 6,740 watershed restoration projects
completed throughout the state of Oregon over the period 2001–2010. We estimate that
these expenditures contributed between $752.4 million and $977.5 million in economic
output and supported 4,628 to 6,483 jobs, see Table 2. Results are also presented by
county, see Figure 1 and Annex B.
Table 2. Oregon restoration projects: Estimated economic impacts by project type, 2001-2010(2010$)
Project
Type
Total expenditures
(million $)
Estimated economic output
(million $)
Estimated employment
(jobs)
Combined $14.4 $25.9 – $33.0 149 – 211
Fish
Passage$117.4 $211.4 – $270.1 1,245 – 1,785
Instream $53.3 $90.6 – $117.2 559 – 783
Riparian $29.0 $49.3 – $69.6 508 – 670
Road $60.5 $108.8 – $139.1 629 – 889
Upland $100.8 $201.5 – $262.0 1,088 – 1,512
Urban $0.2 $0.4 – $0.6 3 – 4
Wetland $35.8 $64.4 – $85.9 447 – 630
TOTAL $411.4 $752.4 – $977.5 4,628 – 6,483
Source: Authors' estimates using data from OWEB (2012) and Nielsen-Pincus & Moseley(2010)
S.A.P.I.EN.S, 7.2 | 2014
78
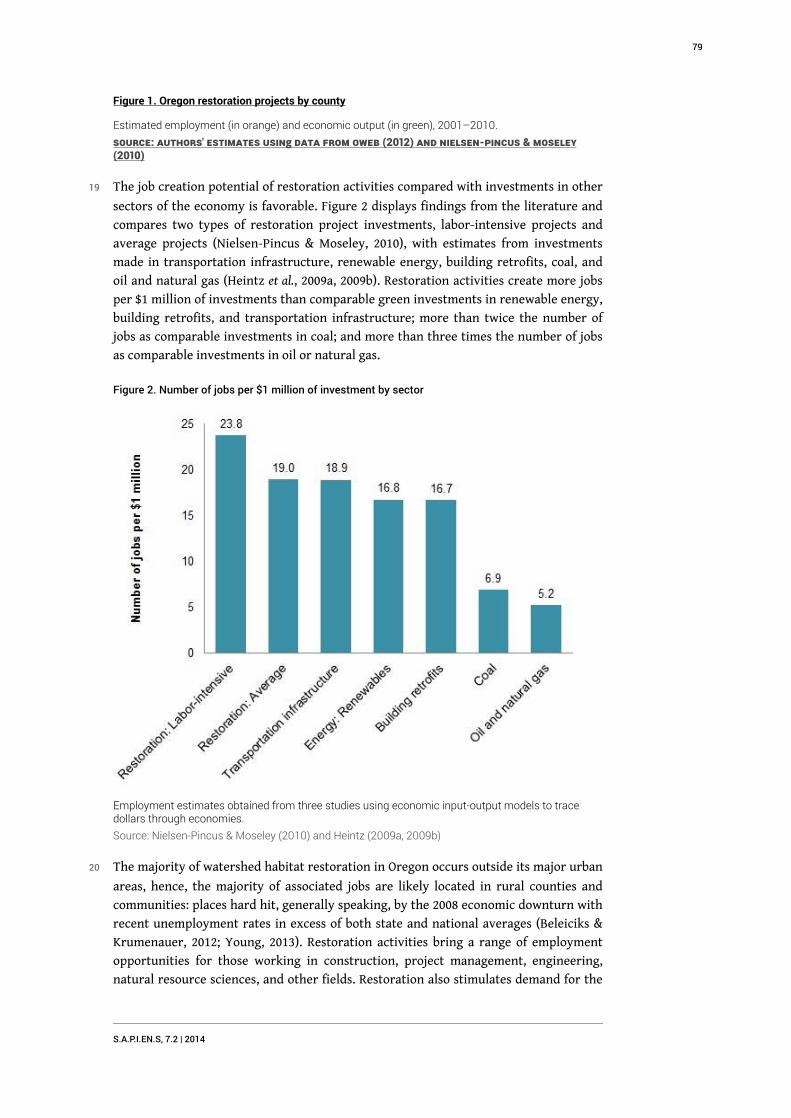
Figure 1. Oregon restoration projects by county
Estimated employment (in orange) and economic output (in green), 2001–2010.
Source: Authors' estimates using data from OWEB (2012) and Nielsen-Pincus & Moseley(2010)
19 The job creation potential of restoration activities compared with investments in other
sectors of the economy is favorable. Figure 2 displays findings from the literature and
compares two types of restoration project investments, labor-intensive projects and
average projects (Nielsen-Pincus & Moseley, 2010), with estimates from investments
made in transportation infrastructure, renewable energy, building retrofits, coal, and
oil and natural gas (Heintz et al., 2009a, 2009b). Restoration activities create more jobs
per $1 million of investments than comparable green investments in renewable energy,
building retrofits, and transportation infrastructure; more than twice the number of
jobs as comparable investments in coal; and more than three times the number of jobs
as comparable investments in oil or natural gas.
Figure 2. Number of jobs per $1 million of investment by sector
Employment estimates obtained from three studies using economic input-output models to tracedollars through economies.
Source: Nielsen-Pincus & Moseley (2010) and Heintz (2009a, 2009b)
20 The majority of watershed habitat restoration in Oregon occurs outside its major urban
areas, hence, the majority of associated jobs are likely located in rural counties and
communities: places hard hit, generally speaking, by the 2008 economic downturn with
recent unemployment rates in excess of both state and national averages (Beleiciks &
Krumenauer, 2012; Young, 2013). Restoration activities bring a range of employment
opportunities for those working in construction, project management, engineering,
natural resource sciences, and other fields. Restoration also stimulates demand for the
S.A.P.I.EN.S, 7.2 | 2014
79

products and services of local businesses such as plant nurseries, heavy equipment
companies, and rock and gravel companies. In addition, these dollars tend to stay in the
local economy: Hibbard and Lurie (2006) found that approximately 80% of OWEB’s
restoration investments stay in the county where the project is located.
Discussion: The utility of estimating the economicimpact of restoration
21 There is a systemic lack of acknowledgement of the value of functional ecosystems
within our market economy, which arguably contributes to flawed decision making
(EFTEC, 2005; Hurd, 2009). Intuitively, in the face of shrinking public budgets and
difficult decisions about the distribution of scarce resources, it is useful, if not essential,
to make the economic case for restoration. This is especially salient to those of us in the
conservation nonprofit sector. As practitioners, with our own limited resources, we
wish to know what kinds of information and outreach strategies are effective in the
pursuit of improved environmental and social welfare.
22 Ecotrust created a four-page brochure6 to publicize the findings of this report. We
defined the target audience as elected officials and government staff, especially those
responsible for budget allocations of restoration funds. The information and brochure
have been presented to local and national audiences at several non-academic
conferences, in a national earned media campaign in collaboration with NOAA
Restoration Center, via social media networks, and in numerous individual meetings
with restoration stakeholders and public decision-makers. To date, the reception has
been overwhelmingly positive, from across the country and the political spectrum.
23 Since release of the brochure, Ecotrust staff and researchers at the University of
Oregon regularly receive inquiries as to the possibility of extending this type of
analysis to other regions. We enthusiastically support continued research into and
development of such economic tools, as organizations like ours are subsequent
consumers and purveyors. Yet, we argue that there is an equally pressing, concomitant
need to study the impact of this information on individuals and institutions.
24 While we have found that quantifying and communicating the economic gains of
watershed restoration reframes the conversation with key stakeholders, it is not clear
whether this translates into lasting, favorable outcomes, be those demonstrable
changes in public opinion or other, more practical support in the form of greater
private landowner participation in restoration projects; changed policies that
recognize watershed restoration as an investment strategy in rural economies and
green infrastructure; or increased federal or state budgets for restoration.
25 We recognize that establishing causality with respect to policy outcomes or behavioral
change is a complicated endeavor. However, there is much to be explored in terms of
changed perception or attitude. For example, are common economic impact metrics,
such as number of jobs, more persuasive than intergenerational benefit claims because
they avoid the associated pitfalls of temporal discounting? Or by providing data on the
market benefits of environmental restoration, are perceived trade-offs diminished,
thereby minimizing the psychological burden for decision-makers? Regardless, it is
probably safe to assume that funding will continue to fall short of the amount needed
S.A.P.I.EN.S, 7.2 | 2014
80
for large-scale ecosystem restoration. Hence, we stand to increase our collective impact
with an improved understanding of the influence of different economic arguments.
Conclusions
26 The act of restoring watershed health provides local jobs and bolsters regional
economies. In our case study analysis, we estimated that $411.4 million in watershed
restoration expenditures made over ten years in the state of Oregon generated up to
$977.5 million in economic output and supported up to 6,483 jobs.
27 Beyond short-term market impacts, it is important to remember that a critical
assessment of restoration’s value would not be complete without considering its
primary intended benefits to ecosystem health. Restoration investments continue to
accrue and pay out over time with long-term improvements in wildlife populations and
aquatic and terrestrial habitat. And intact watersheds create enduring benefits, from
enhanced fishing opportunities to the provision of critical ecosystem services, which
are vital to the welfare of communities and cultures.
28 We believe that meaningfully characterizing and effectively communicating the
interdependencies of ecosystems and economies is critical to addressing the immense
environmental challenges of the 21st century. Whether our aim is the recovery of wild
salmon in the western United States or the abatement of greenhouse gas emissions,
alternative models of economic development that properly value for functioning
ecosystems need to be expanded and strengthened. By applying common economic
impact assessment techniques to environmental conservation activities, we are
hopefully aiding in the transition to a more reliable prosperity. In addition to
replicating these kinds of economic impact studies, there is much to gain from more
rigorous exploration of how making the economic case for environmental wellbeing is
an imperative for achieving modern environmental goals.
Acknowledgements
29 The authors would like to thank the Ecosystem Workforce Program at the University of
Oregon, especially Cassandra Moseley and Max Nielson-Pincus, for their good work
developing the multipliers used in this study and advising us in our application of their
research; Bobbi Riggers of the Oregon Watershed Restoration Inventory database
system for her assistance in querying and interpreting restoration project information;
all the Whole Watershed Restoration Initiative partners, especially Ken Bierly of the
Oregon Watershed Enhancement Board, Megan Callahan Grant and Lauren Senkyr of
NOAA’s Restoration Center, and Scott Peets and Jim Capurso of the U.S. Forest Service
for their support of this work; Kristen Sheeran and Carolyn Holland of Ecotrust for co-
funding the study and brochure; Kate Carone of Ecotrust for her editorial and
intellectual support; and the many dedicated, talented individuals who plan, design,
implement, and monitor salmon habitat restoration projects.
S.A.P.I.EN.S, 7.2 | 2014
81
BIBLIOGRAPHIE
Aronson, J. et al. (2010). Are socioeconomic benefits of restoration adequately quantified? A meta-
analysis of recent papers (2000–2008) in Restoration Ecology and 12 other scientific journals.
Restoration Ecology 18: 143–154.
Beleiciks, N. & G. Krumenauer (2012, November 19). Key workforce challenges: More severe in
Oregon's rural areas. Published online on 19th November 2012 by Oregon Employment
Department at: http://www.qualityinfo.org/olmisj/ArticleReader?itemid=00008442. Accessed
Dec. 9, 2012.
Bernhardt, E.S., M.A. Palmer, J.D. Allan, G. Alexander, S. Brooks, J. Carr et al. (2005). Synthesizing
U.S. river restoration. Science 308: 636-637.
De Groot, R.S., J. Blignaut, S. Van Der Ploeg, J. Aronson, T. Elmqvist & J. Farley (2013). Benefits of
investing in ecosystem restoration. Conservation Ecology 27: 1286–1293.
Edwards, P.J. & C. Abivardi (1997). Ecological engineering and sustainable development. In:
Urbanska, K.M., N.R. Webb & P.J. Edwards (Eds.) Restoration Ecology and Sustainable Development,
pp. 325-352. New York, NY: Cambridge University Press.
Edwards, P.E.T., A.E. Sutton-Greir & G.E. Coyle (2013). Investing in nature: Restoring coastal
habitat blue infrastructure and green job creation. Marine Policy 38: 65–71.
Economics for the Environment Consultancy [EFTEC] (2005). The economic, social and ecological
value of ecosystem services: A literature review. Prepared for the Department for Environment, Food
and Rural Affairs (DEFRA). London, UK: EFTEC.
Heintz, H., R. Pollin & H. Garrett-Peltier (2009a). How infrastructure investments support the U.S.
economy. Amherst, University of Massachusetts: Political Economy Research Institute. URL:
http://www.peri.umass.edu/236/hash/efc9f7456a/publication/333/
Heintz, H., R. Pollin & H. Garrett-Peltier (2009b). The economic benefits of investing in clean energy:
How the economic stimulus program and new legislation can boost U.S. economic growth and employment.
Amherst, University of Massachusetts: Political Economy Research Institute. URL: http://
www.peri.umass.edu/economic_benefits/
Holl, K.D. & R.B. Howarth (2012). Paying for restoration. Restoration Ecology 8(3): 260-267.
Hibbard, M. & S. Lurie (2006). Some community socio-economic benefits of watershed councils: A
case study from Oregon. Journal of Environmental Planning and Management 49: 891-908.
Hurd, J (2009). Economic benefits of watershed restoration. In: The Political Economy of Watershed
Restoration Series. Missoula, MT: Wildlands, CPR. URL: http://www.wildlandscpr.org/files/
Economic_Benefits_1.pdf
Knight, A.T., R.M. Cowling & B.M. Campbell (2006). An operational model for implementing
conservation action. Conservation Biology 20: 408–419.
Millennium Ecosystem Assessment [MEA] (2005). Ecosystems and Human Well-Being: A Framework for
Assessment. Washington D.C.: Island Press. URL: http://www.maweb.org
Nielsen-Pincus, M. & C. Moseley (2010). Economic and employment impacts of forest and watershed
restoration in Oregon. Working Paper Number 24. Eugene, Oregon: Ecosystem Workforce Program,
University of Oregon. URL: http://ewp.uoregon.edu/sites/ewp.uoregon.edu/files/downloads/
WP24.pdf
S.A.P.I.EN.S, 7.2 | 2014
82
Pearce, D., A. Markandya & E.B. Barbier (1989). Blueprint for a Green Economy. London, U.K.:
Earthscan Publications.
Robbins, A.S.T. & J.M. Daniels (2012). Restoration and economics: A union waiting to happen?
Restoration Ecology 20(1): 10-17.
Schultz, E.T., R.J. Johnston, K. Segerson & E.Y. Besedin (2012). Integrating ecology and economics
for restoration: Using ecological indicators in valuation of ecosystem services. Restoration Ecology
20(3): 304-310.
Young, M (2013, March 25). Joblessness in Oregon, county by county. The Oregonian. Retrieved
from http://www.oregonlive.com/money/index.ssf/2013/03/
joblessness_in_oregon_county_b.html
ANNEXES
Annex A: Economic Multipliers
Input-Output (I-O) models are quantitative economic models that represent the
interdependencies between different sectors of regional economies using complex
matrix operations. The matrices are comprised of regional and national accounts
relating the production of commodities by industry and the use and distribution of
commodities by intermediate and final users. The integrated economic data underlying
the I-O accounts originate from a variety of sources regarding industry purchasing
patterns, employment and earnings statistics, regional supply capacities, and more.
The underlying data of an I-O model is specific to the timeframe in which the data was
collected.
The key concepts underlying I-O models have been built upon by several economists
over several decades. I-O models are the most comprehensive economic accounts at the
level of the whole economy, and they are used in the calculation of important accounts
of the economy such as measures of gross domestic product (GDP), and other national
income and product accounts (NIPAs) by the U.S. Department of Commerce.
When a final-demand dollar enters the regional economy, some of it remains and is
used to purchase other regional commodities, while a portion leaves the economy in
the form of savings or to purchase commodities produced outside the region, imports.
To conduct an analysis of a change in final demand, the user inputs the expected
change into the existing I-O model; the I-O model tracks the circulation of these dollars
throughout the economic structure of the regional economy, running subsequent,
iterative impact rounds until the initial dollars no longer remain in the economy, and
then outputs the estimated final effects of the inputted change in final demand. In
other words, the initial change in final demand is multiplied throughout the economic
model to estimate the direct, indirect and induced output, income, and employment
effects (explained further below). In this process, the I-O model effectively utilizes and
creates economic multiplier(s) specific to the analysis. Once the economic multipliers
specific to the analysis and the region are known, as in the case of this study, it is
possible to conduct similar, though perhaps less comprehensive, analyses using only
the economic multipliers and not the entire I-O model itself.
S.A.P.I.EN.S, 7.2 | 2014
83
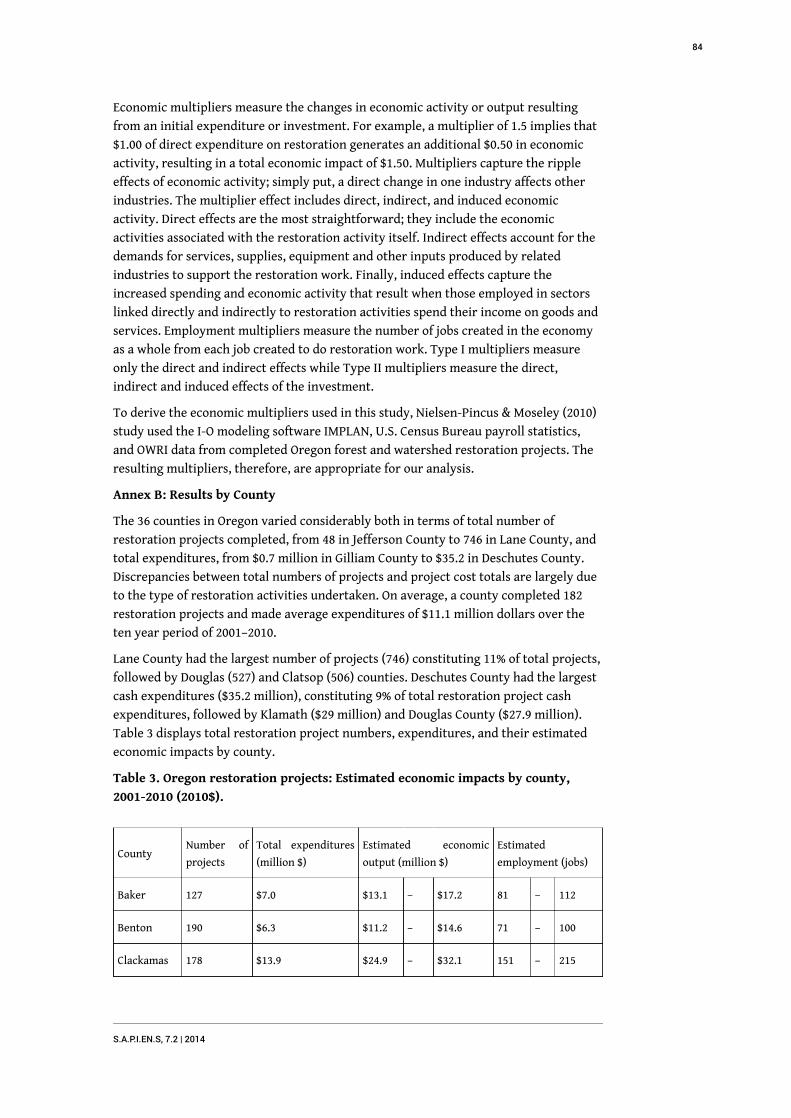
Economic multipliers measure the changes in economic activity or output resulting
from an initial expenditure or investment. For example, a multiplier of 1.5 implies that
$1.00 of direct expenditure on restoration generates an additional $0.50 in economic
activity, resulting in a total economic impact of $1.50. Multipliers capture the ripple
effects of economic activity; simply put, a direct change in one industry affects other
industries. The multiplier effect includes direct, indirect, and induced economic
activity. Direct effects are the most straightforward; they include the economic
activities associated with the restoration activity itself. Indirect effects account for the
demands for services, supplies, equipment and other inputs produced by related
industries to support the restoration work. Finally, induced effects capture the
increased spending and economic activity that result when those employed in sectors
linked directly and indirectly to restoration activities spend their income on goods and
services. Employment multipliers measure the number of jobs created in the economy
as a whole from each job created to do restoration work. Type I multipliers measure
only the direct and indirect effects while Type II multipliers measure the direct,
indirect and induced effects of the investment.
To derive the economic multipliers used in this study, Nielsen-Pincus & Moseley (2010)
study used the I-O modeling software IMPLAN, U.S. Census Bureau payroll statistics,
and OWRI data from completed Oregon forest and watershed restoration projects. The
resulting multipliers, therefore, are appropriate for our analysis.
Annex B: Results by County
The 36 counties in Oregon varied considerably both in terms of total number of
restoration projects completed, from 48 in Jefferson County to 746 in Lane County, and
total expenditures, from $0.7 million in Gilliam County to $35.2 in Deschutes County.
Discrepancies between total numbers of projects and project cost totals are largely due
to the type of restoration activities undertaken. On average, a county completed 182
restoration projects and made average expenditures of $11.1 million dollars over the
ten year period of 2001–2010.
Lane County had the largest number of projects (746) constituting 11% of total projects,
followed by Douglas (527) and Clatsop (506) counties. Deschutes County had the largest
cash expenditures ($35.2 million), constituting 9% of total restoration project cash
expenditures, followed by Klamath ($29 million) and Douglas County ($27.9 million).
Table 3 displays total restoration project numbers, expenditures, and their estimated
economic impacts by county.
Table 3. Oregon restoration projects: Estimated economic impacts by county,
2001-2010 (2010$).
CountyNumber of
projects
Total expenditures
(million $)
Estimated economic
output (million $)
Estimated
employment (jobs)
Baker 127 $7.0 $13.1 – $17.2 81 – 112
Benton 190 $6.3 $11.2 – $14.6 71 – 100
Clackamas 178 $13.9 $24.9 – $32.1 151 – 215
S.A.P.I.EN.S, 7.2 | 2014
84
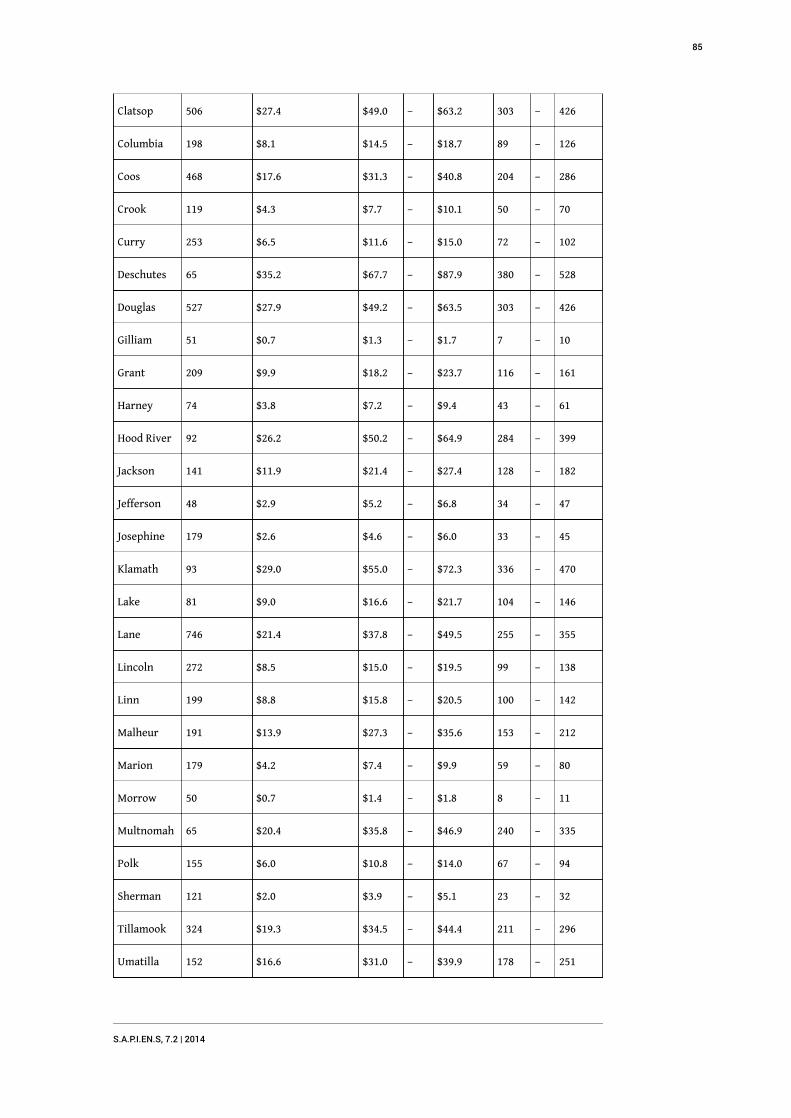
Clatsop 506 $27.4 $49.0 – $63.2 303 – 426
Columbia 198 $8.1 $14.5 – $18.7 89 – 126
Coos 468 $17.6 $31.3 – $40.8 204 – 286
Crook 119 $4.3 $7.7 – $10.1 50 – 70
Curry 253 $6.5 $11.6 – $15.0 72 – 102
Deschutes 65 $35.2 $67.7 – $87.9 380 – 528
Douglas 527 $27.9 $49.2 – $63.5 303 – 426
Gilliam 51 $0.7 $1.3 – $1.7 7 – 10
Grant 209 $9.9 $18.2 – $23.7 116 – 161
Harney 74 $3.8 $7.2 – $9.4 43 – 61
Hood River 92 $26.2 $50.2 – $64.9 284 – 399
Jackson 141 $11.9 $21.4 – $27.4 128 – 182
Jefferson 48 $2.9 $5.2 – $6.8 34 – 47
Josephine 179 $2.6 $4.6 – $6.0 33 – 45
Klamath 93 $29.0 $55.0 – $72.3 336 – 470
Lake 81 $9.0 $16.6 – $21.7 104 – 146
Lane 746 $21.4 $37.8 – $49.5 255 – 355
Lincoln 272 $8.5 $15.0 – $19.5 99 – 138
Linn 199 $8.8 $15.8 – $20.5 100 – 142
Malheur 191 $13.9 $27.3 – $35.6 153 – 212
Marion 179 $4.2 $7.4 – $9.9 59 – 80
Morrow 50 $0.7 $1.4 – $1.8 8 – 11
Multnomah 65 $20.4 $35.8 – $46.9 240 – 335
Polk 155 $6.0 $10.8 – $14.0 67 – 94
Sherman 121 $2.0 $3.9 – $5.1 23 – 32
Tillamook 324 $19.3 $34.5 – $44.4 211 – 296
Umatilla 152 $16.6 $31.0 – $39.9 178 – 251
S.A.P.I.EN.S, 7.2 | 2014
85
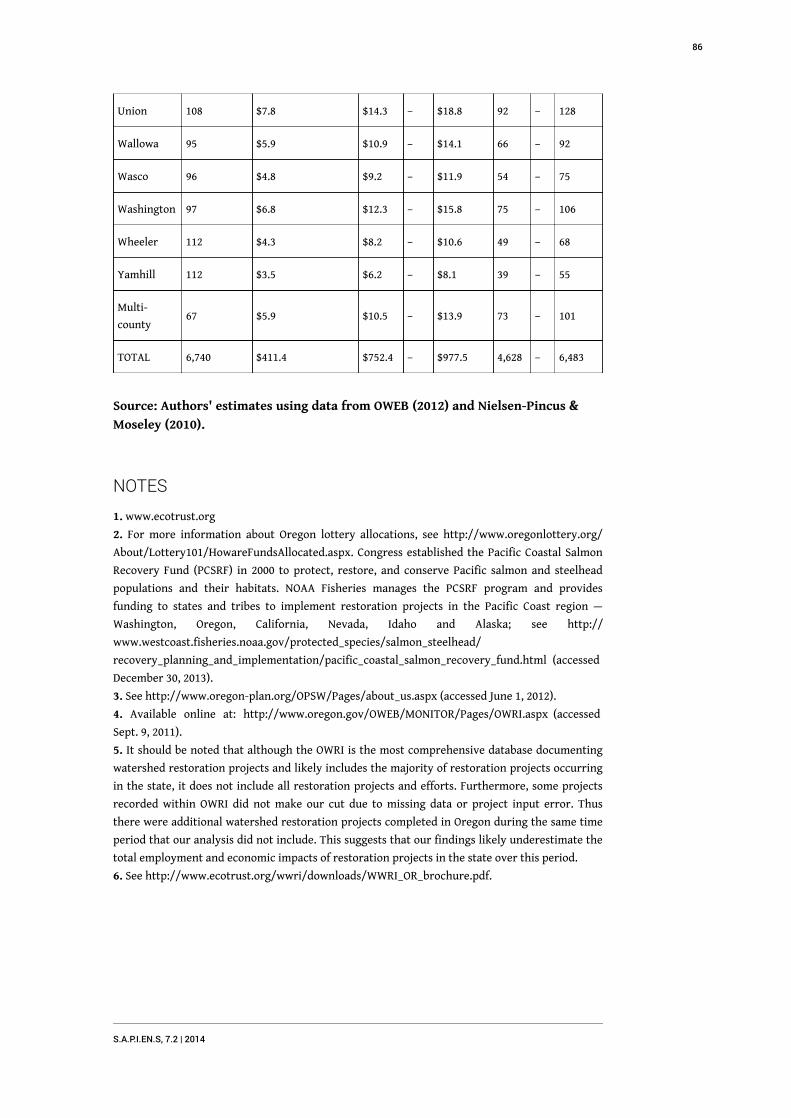
Union 108 $7.8 $14.3 – $18.8 92 – 128
Wallowa 95 $5.9 $10.9 – $14.1 66 – 92
Wasco 96 $4.8 $9.2 – $11.9 54 – 75
Washington 97 $6.8 $12.3 – $15.8 75 – 106
Wheeler 112 $4.3 $8.2 – $10.6 49 – 68
Yamhill 112 $3.5 $6.2 – $8.1 39 – 55
Multi-
county67 $5.9 $10.5 – $13.9 73 – 101
TOTAL 6,740 $411.4 $752.4 – $977.5 4,628 – 6,483
Source: Authors' estimates using data from OWEB (2012) and Nielsen-Pincus &
Moseley (2010).
NOTES
1. www.ecotrust.org
2. For more information about Oregon lottery allocations, see http://www.oregonlottery.org/
About/Lottery101/HowareFundsAllocated.aspx. Congress established the Pacific Coastal Salmon
Recovery Fund (PCSRF) in 2000 to protect, restore, and conserve Pacific salmon and steelhead
populations and their habitats. NOAA Fisheries manages the PCSRF program and provides
funding to states and tribes to implement restoration projects in the Pacific Coast region —
Washington, Oregon, California, Nevada, Idaho and Alaska; see http://
www.westcoast.fisheries.noaa.gov/protected_species/salmon_steelhead/
recovery_planning_and_implementation/pacific_coastal_salmon_recovery_fund.html (accessed
December 30, 2013).
3. See http://www.oregon-plan.org/OPSW/Pages/about_us.aspx (accessed June 1, 2012).
4. Available online at: http://www.oregon.gov/OWEB/MONITOR/Pages/OWRI.aspx (accessed
Sept. 9, 2011).
5. It should be noted that although the OWRI is the most comprehensive database documenting
watershed restoration projects and likely includes the majority of restoration projects occurring
in the state, it does not include all restoration projects and efforts. Furthermore, some projects
recorded within OWRI did not make our cut due to missing data or project input error. Thus
there were additional watershed restoration projects completed in Oregon during the same time
period that our analysis did not include. This suggests that our findings likely underestimate the
total employment and economic impacts of restoration projects in the state over this period.
6. See http://www.ecotrust.org/wwri/downloads/WWRI_OR_brochure.pdf.
S.A.P.I.EN.S, 7.2 | 2014
86

RÉSUMÉS
For nearly twenty years in the western United States, billions of dollars have been spent to
recover anadromous salmon species listed under the federal Endangered Species Act. Broad
support and participation from the private and public sectors is needed to address the limiting
factors to salmon viability, especially the improvement of stream and watershed health.
However, in today’s fiscal and political climate it is more important than ever to demonstrate the
multiple ways that conservation work benefits not just the environment but also our economy.
This paper examines the employment and economic impacts of watershed restoration
expenditures made in Oregon from 2001–2010, making use of multipliers developed by the
University of Oregon’s Ecosystem Workforce Program. We collected data on salmon habitat
restoration projects from a statewide database system, the Oregon Watershed Restoration
Inventory, and grouped project activities according to the University of Oregon restoration
employment and economic multiplier categories. To determine the total direct, indirect, and
induced economic output and employment resulting from restoration investments, we multiplied
the total project investment in each category of restoration work by the relevant multiplier. We
then summed the total economic activity by project type to arrive at a total per county and the
state.
We found that a total of US$411.4 million was invested in 6,740 watershed restoration projects
throughout the state of Oregon from 2001 to 2010, resulting in the generation of between $752.4
million and $977.5 million in economic output and 4,628 to 6,483 jobs. The jobs created by
restoration activities are located mostly in rural areas, in communities hard hit by the economic
downturn. Restoration activities bring a range of employment opportunities for people in
construction, engineering, natural resource sciences, and other fields. The job creation potential
of restoration activities compared with investments in other sectors of the economy is favorable.
Restoration also stimulates demand for the products and services of local businesses such as
plant nurseries, heavy equipment companies, and rock and gravel companies. Unlike in other
economic sectors, restoration jobs can’t be outsourced to distant locations, so these dollars tend
to stay in the local and state economy. Restoration investments also continue to accrue and pay
out over time. Long-term improvements in habitat create enduring benefits, from enhanced
recreational and fishing opportunities to the provision of critical ecosystem services.
These findings are good news to the people of Oregon and there is tremendous opportunity to
extend and replicate this work to other regions. Being able to effectively communicate the
interdependencies of ecosystems and economies is critical to addressing the immense challenges
of the 21st century. As long as we continue to frame trade-offs in simplistic terms like jobs versus
the environment, we will be relegated to making incremental change. Whether our aim is the
recovery of wild salmon in the Western United States or the abatement of greenhouse gas
emissions; alternative models for economic development need to be redoubled. We have found
that quantifying and presenting the economic benefits of watershed restoration reframes the
conversation and opens doors to new alliances.
INDEX
Keywords : Restoration, Habitat, Salmon, Economics, Jobs, United States
S.A.P.I.EN.S, 7.2 | 2014
87

AUTEURS
CATHY P. KELLON
Director, Water & Watersheds Program, E-mail: [email protected], Ecotrust, 721 NW Ninth
Avenue, Suite 200, Portland, Oregon 97209, www.ecotrust.org
TAYLOR HESSELGRAVE
Economist & Project Manager, E-mail: [email protected], Ecotrust, 721 NW Ninth
Avenue, Suite 200, Portland, Oregon 97209, www.ecotrust.org
S.A.P.I.EN.S, 7.2 | 2014
88

A 10-year ecosystem restorationcommunity of practice tracks large-scale restoration trends
Robert Daoust, Terry Doss, Mark Gorman, Matt Harwell et Cheryl Ulrich
Gaëll Mainguy (éd.)
NOTE DE L’ÉDITEUR
This manuscript was published as part of a special issue on the subject of largescale
restoration of ecosystems. This manuscript was reviewed by four anonymous referees.
NOTE DE L'AUTEUR
This manuscript was prepared by the inaugural Board of the Large-scale Ecosystem
Restoration Section of the Society for Ecological Restoration.
Evolution of a Community of Practice for Large-scaleEcosystem Restoration
1 In 2004, an effort was undertaken to bring together engineers, managers, planners,
policy-makers and scientists — all identifiable as restoration practitioners — at the first
National Conference on Ecosystem Restoration1 (NCER) under the leadership of the U.S.
Geological Survey and the U.S. Army Corps of Engineers. This forum focused initially on
a number of large-scale, federally funded ecosystem restoration projects in the United
States (including Glen Canyon, Everglades, San Francisco Bay/Delta, Chesapeake Bay,
Great Lakes, Louisiana Coastal Area, Puget Sound, and the Upper Mississippi River),
with ecosystem restoration practitioners from other ecosystems welcome. The overall
objectives of these efforts were to disseminate information regarding large-scale
S.A.P.I.EN.S, 7.2 | 2014
89
ecosystem restoration efforts, so that those efforts would be more prominent in
practitioners’ thoughts, and incorporated into their research considerations and plans,
and to help foster information and knowledge exchange on large-scale ecosystem
restoration. The forum started with some fundamental questions for ecosystem
restoration practitioners, such as “Are there local, regional and national policies
guiding restoration?” Additionally, these conferences presented information on
important restoration trends and real-time results. The conference was considered
“successful” from an information sharing perspective such that the organizers
committed to holding biennial conferences in the future to continue dialogue and
expand discussions on restoration themes.
2 Recognizing a need for long-term sustainability of the conference and its purpose,
within five years (at the 3rd National Conference), conference planners focused on
identifying a long-term organizational path forward, exploring governance options
ranging from forming a stand-alone organization to merging with another society. The
impetus was to identify a self-supporting entity that included more restoration
programs, organizations, and academic communities to support efforts to reach a
greater number of restoration practitioners. At this point the National Coalition for
Ecosystem Restoration was formed and formal conversations about the fate and
organizational structure of NCER were initiated.
3 Between 2009 and 2011, NCER engaged the Society for Ecological Restoration2 (SER) and
America’s Great Waters Coalition (a newly formed coalition, existing independently
from NCER)3 (Ulrich, 2012). By 2013, NCER members had reached agreement with the
Board of SER and a new SER Section, the Large-scale Ecological Restoration Section
(LERS) was formed. As the LERS umbrella organization, SER is dedicated to reversing
ecological degradation and restoring the earth’s ecological balance for the benefit of
humans and nature. Their guiding principles are that ecological restoration: is an
engaging and inclusive process; requires the integration of knowledge and practice; is
relevant and essential to the formation and implementation of related federal and state
policy by elected officials and policymakers; and is practiced locally with global
implications.
4 The mission of the LERS community of practice is to:
advance public education and enlightenment concerning large-scale ecosystem resources;
provide a forum for an interchange of ideas, approaches, lessons learned, and data
developed relevant to planning, policy, science, and engineering of large-scale ecosystem
restoration;
develop and encourage large-scale ecosystem restoration as a discipline by supporting
student education, curriculum development, and research; and
encourage and evaluate the educational, scientific, engineering, and technological
development and advancement of all branches of large-scale ecosystem restoration and
practice.
5 Over the past decade, this large-scale ecosystem restoration communication effort has
focused on a large range of thematic topics; here we outline some of the larger
historical themes and outline some future directions for the new LERS Section of SER.
This community of practice has also engaged in a number of additional themes not
presented here, including examining funding trends and restoration implementation
trends (Hassett et al., 2005).
•
•
•
•
S.A.P.I.EN.S, 7.2 | 2014
90
Tracking a Decade of Restoration Themes
Defining Success
6 Defining ecosystem restoration “success” was an initial main theme a decade ago, since
the definition of actual restoration goals and objectives would allow for adaptive
management of restoration projects, as well as determining if funding appropriated
toward those projects was being efficiently prioritized. In part, this focus was a
function of the relative young age of many of the federally funded restoration projects
a decade ago. The other major driver of this was the first forum focused on identifying
similarities and differences across projects throughout the U.S. — often through
sessions that brought examples from different restoration programs. For example, in
Everglades restoration, a large part of this dialogue focused on whether defining
success involved achieving a ‘Xerox reduction’ of the original ecosystem, or success
defined through a ‘cookie cutter’ approach by restoring a particular habitat or parcel of
land to historical ecosystem attributes (USACE & SFWMD, 1999).
7 At present, most current dialogue is evolving away from the basic question of “What is
success?” towards adaptively redefining “How do we successfully restore an
ecosystem?” One example of this type of dialogue surrounds the work of the Mississippi
River-Gulf of Mexico Watershed Nutrient Task Force. This Task Force is designed to
facilitate the cooperative actions of federal agencies, states, and tribes within the
Mississippi/Atchafalaya River Basin to reduce the size of the Gulf hypoxic zone, while
protecting and restoring the human and natural resources of the Mississippi River
Basin (“the Coastal Goal”). Early efforts to do so have fallen far short of goals the Task
Force set (Mississippi River/Gulf of Mexico Watershed Nutrient Task Force, 2008). In
2013 a number of aspects of the program were reevaluated, including the need to
explore the benefits of supplementing the Coastal Goal with other, more readily
achievable, incremental measures to track nutrient reduction activities and nutrient
load reduction results towards addressing the longer-term restoration goal (Mississippi
River/Gulf of Mexico Watershed Nutrient Task Force, 2013). This represents a different
scale of discussion among practitioners for articulating restoration goals than smaller,
but not less important, restoration projects (e.g. Matthews et al., 2009). One potential
future area this discussion thread may take may be how to define success for novel
ecosystems (see below).
Adaptive Management
8 Adaptive management (AM) has been a long-standing theme for this group of
restoration practitioners. Adaptive management in ecosystem restoration focuses on
developing a structured approach to address uncertainties, test hypotheses, and link
science to decision making to allow for making adjustments to restoration
implementation in order to improve the probability of restoration success. Much of this
dialogue has focused on authorities and establishing frameworks for implementing
adaptive management under existing regulatory authorities, individual agency
mandates, and with complicated interagency organizational structures. This discussion
thread has involved an extensive dialogue between scientists, planners and managers,
including discussion on how to implement new policy and guidance such as that from
the National Research Council (National Research Council, 2004), the U.S. Department
S.A.P.I.EN.S, 7.2 | 2014
91
of Interior (Williams et al., 2007), and the U.S. Army Corps of Engineers (USACE, 2009).
One example of the importance of the LERS community of practice is in emphasizing
the sharing of lessons learned such as the development and articulation of the key AM
lessons learned from the first decade of Everglades restoration (e.g. LoSchiavo et al.,
2013). Because establishing AM frameworks takes a long period of time, AM will
continue to be a major theme for this group of practitioners with future focus on
completing the adaptive management feedback loop to adjusting restoration
implementation to improve success.
Adaptive Governance
9 Adaptive governance has been a recurring theme. The role of adaptive governance
(Folke et al., 2005; Olsson, 2006) is to establish and promote frameworks by which
decision-makers can discuss, identify, and approve decisions to adjust management
policies, plans, and actions. As the discussion on AM has evolved over time, most
restoration programs have recognized the challenges with implementing AM within
their existing management and planning structures (e.g. Chadzon et al., 2009; Calmon et
al., 2011). As a result a number of senior scientists, planners, and managers brought
detailed focus to the need to advance adaptive governance. Scholz and Stiftel (2005)
defined five critical challenges for governance models: 1—representation; 2—
deliberative process design; 3—scientific learning; 4—public learning; and 5—problem
responsiveness. Governance models can be a complex topic (e.g. one adaptive
governance challenge is implementing AM with clear linkages between science and
management) and likely to remain a theme for LERS in the future. LERS will also need
to focus on overcoming significant challenges to effectively implementing adaptive
governance; among them the all-too-prevalent political fragmentation of authority, as
well as determining how policy makers can develop and use scientific knowledge
effectively.
Linking Science with Management Decision Making
10 The interface between science and management has been an undercurrent theme for
the past decade of this group. Early on, this forum helped create an atmosphere that
fostered collaboration between restoration scientists and managers to work beyond a
mentality of "If the managers would just get out of the way or listen to what the
scientists say to do, we would be restoring ecosystems faster" and “pointy-headed
scientists don’t produce anything useful.” The focus then became a two-part dialog: 1
—“What science information do the decision makers need?”; and 2—“What is the
management relevance/implication of the science?” For the Everglades restoration
example, practitioners leveraged the NCER community to help advance their work on
communication tools, advancing from the early calls for effective science to be brought
to the restoration planning table (e.g. Harwell, 1998) to specific indicators that are used
by policy makers in making large-scale ecosystem restoration decisions (e.g. Doren et
al., 2009; Smith, 2011; USACE & SFWMD, 2011). The future direction of this theme with
LERS may include exploring principles of strategic communication, based upon three
pillars: message; audience; and vehicle (the communication format) to inform a broader
audience of decision-makers (e.g. agency program and technical managers, Congress
and state legislatures, and the general public).
S.A.P.I.EN.S, 7.2 | 2014
92
Current and Future Themes
11 Here we highlight a few areas of current and future themes this community of practice
are likely to engage, including novel ecosystems, ecosystem goods and services, urban
ecosystem restoration, climate change and ecosystem resilience, and sustainability.
However, these themes are not intended to be exhaustive. The new LERS section of the
Society for Ecological Restoration is working to identify additional themes and this may
include the call to develop thorough reviews of congruence or mismatches between the
practitioner community and the academic literature for a particular theme (e.g.
advancing synthesis work from Holl et al., 2003 and Doyle & Drew, 2008).
Novel Ecosystems
12 Most ecosystems are now sufficiently altered in structure and function so as to qualify
as novel ecosystems; systems that include different species and functions require us to
change how we approach conservation, restoration and environmental management
(i.e. such systems may be effectively immune to traditional, practical restorative
efforts) (Seastedt et al., 2005; Hobbs et al., 2009). An ongoing dialogue among
practitioners regarding the ecological, ethical, social, cultural, and political natures of
novel ecosystems will be central to determining how to intervene in them effectively
and responsibly.
Ecosystem Goods and Services
13 Valuation of ecosystem goods and services is a difficult and sometimes controversial
undertaking and the literature is replete with example valuations (e.g. MEA, 2005).
Ecologists and economists have often been criticized for trying to place a monetary
value on nature often in the absence of credible data to back up the attempt, and recent
research has focused on clarifying final (actual) ecosystem services with ecological-
based functions that provide an indirect benefit (e.g. Johnston & Russell, 2011).
Nonetheless, federal and state agencies charged with protecting and managing natural
resources often make difficult spending decisions that involve cost-benefit analyses
that should include the monetary value (benefit) of the natural resources being
protected or restored. Therefore, an ongoing discussion regarding ecosystem economic
valuation will prove to be useful in advancing related policies and activities that
protect or restore ecosystems and their services. One recent example is the call for
attention to ecosystem goods and services as a part of the scientific effort to
understand the impact to the Gulf of Mexico after the Deepwater Horizon oil spill in 2010
(National Research Council, 2013).
Urban Ecosystem Restoration
14 Ecological restoration often aims to recreate past (i.e. ‘pre-settlement’) ecosystem
conditions; a goal that is effectively impossible in urban areas where human activities
have eliminated that possibility in most cases. Urban ecosystem restoration may also
involve a different type of attention to utilizing regulatory tools (e.g. Lord et al., 2002).
S.A.P.I.EN.S, 7.2 | 2014
93
Drawing on past efforts, and upon the results of ongoing and future research, a future
objective of our work can be to help project managers determine what kind of
restoration is desirable and possible in an urban setting.
Climate Change and Ecosystem Resilience
15 The intersection between the dynamism of climate change and ecological impacts (e.g.
Harris et al., 2006; National Research Council, 2008) and activities by natural resource
managers (e.g. Scarlett, 2010) is a current area getting significant attention. Addressing
climate change, including the focus on enhancing ecosystem resilience and
development of climate adaptation plans (CEQ, 2011; U.S. Army Engineer Institute for
Water Resources, 2013a, 2013b) in restoration efforts will likely remain a large theme
for this group of restoration practitioners.
Sustainability and Large-scale Ecosystem RestorationPractitioners
16 All large-scale ecosystem restoration programs emphasize the importance of
maintaining longevity in effort, commitment, resources and science monitoring. Many
tie long-term objectives to maintaining ecosystem resilience, improving ecosystem
services, and improving sustainability of the natural system. Similarly, maintaining and
enhancing a community of practice increases the chance for long-term, sustainable
ecosystem restoration efforts. Sharing lessons learned across programs, providing
guidance to new programs, and fostering scaling of important restoration practices to
restoration programs of different sizes will be invaluable for sustainability of
restoration science (e.g. LoSchiavo et al., 2013). With potential decreases in funding
and/or increasing demands for resources to be spread across multiple restoration
programs, scientists, practitioners, planners and managers engaged with the work of
the LERS Section of the Society for Ecological Restoration will better anchor their
arguments to provide longevity, and ultimately sustainability of their restoration
efforts. LERS aims to contribute towards other “restoration knowledge hubs” (Menz et
al., 2013).
Conclusions
17 The large-scale ecosystem issues that society faces today are multi-jurisdictional,
multifaceted, intergenerational and interconnected, and none will be adequately
solved, let alone understood, unless the scientific community embraces a way of
thinking, planning and implementing that also is multi-jurisdictional, multifaceted,
intergenerational and interconnected. The new LERS section of the Society for
Ecological Restoration stands poised to facilitate the development of just such a
perspective, by advancing public education, providing a forum for information
exchange, supporting student education, curriculum development, and research, and
nurturing the development and advancement of all branches of large-scale ecosystem
restoration and practice.
S.A.P.I.EN.S, 7.2 | 2014
94
Acknowledgements
18 The journey to establish this community of practice encompassed two important five-
year windows. We wish to acknowledge the level of organic enthusiasm by all those
involved in the first five years of NCER to set up the National Community, including the
wisdom, perseverance, and infectious enthusiasm of Dr. G. Ronnie Best (U.S. Geological
Survey, retired) who helped lead the effort to respond to former U.S. Army Corps of
Engineer’s Chief, Lieutenant General Robert Flowers and his call for better integration
and sharing of scientific information and communication of that information for use in
resource management decisions. We appreciate the many people involved with the
active dialogue and efforts in the past five years to bring the Large-scale Ecosystem
Restoration Section into existence. We also thank the America’s Great Waters Coalition
and the Society for Ecological Restoration for wisdom and advice on our journey. We
wish to thank several anonymous reviewers for useful comments on this manuscript.
The opinions expressed herein do not necessarily represent the views or policies of
organizations of the authors. The contents do not necessarily reflect the views of the
USEPA, nor does mention of trade names or commercial products or websites
constitute endorsement or recommendation for use.
BIBLIOGRAPHIE
Calmon, M., P.H.S. Brancalion, A. Paese, J. Aronson et al. (2011). Emerging threats and
opportunities for large-scale ecological restoration in the Atlantic forest of Brazil. Restoration
Ecology 19:154-158.
Chazdon, R., C.A. Harvey, O. Komar, M. Van Breugel et al. (2009). Beyond reserves: A research
agenda for conserving biodiversity in tropical cultural landscapes. Biotropica 41:141-153.
Council on Environmental Quality [CEQ] (2011). National action plan: Priorities for managing
freshwater resources in a changing climate. Washington, DC: Council on Environmental Quality. URL:
http://www.whitehouse.gov/sites/default/files/microsites/ceq/2011_national_action_plan.pdf
Doren, R.F., J.C. Trexler, A.D. Gottlieb & M.C. Harwell (2009). Ecological indicators for system-wide
assessment of the greater Everglades ecosystem restoration program. Ecological Indicators 9(6): S2-
S16.
Doyle, M. & C.A. Drew (2008). Large-Scale Ecosystem Restoration. Washington DC: Island Press.
Folke, C., T. Hahn, P. Olsson & J. Norberg (2005). Adaptive governance of social-ecological
systems. Annual Review of Environmental Resources 30: 441-73.
Harris, J.A., R.J. Hobbs, E. Higgs & J. Aronson (2006). Ecological restoration and global climate
change. Restoration Ecology 14(2): 170-176.
Harwell, M.A. (1998). Science and environmental decision making in South Florida. Ecological
Applications 8(3): 580-590.
S.A.P.I.EN.S, 7.2 | 2014
95
Hassett, B., M. Palmer, E. Bernhardt, S. Smith, J. Carr et al. (2005). Restoring watersheds project by
project: Trends in Chesapeake Bay tributary restoration. Frontiers in Ecology 3: 259-267.
Hobbs, R.J., E. Higgs & J.A. Harris (2009). Novel ecosystems: Implications for conservation and
restoration. Trends in Ecology and Evolution 24(11): 599-605.
Holl, K.D., E.E. Crone & C.B. Schultz (2003). Landscape restoration: Moving from generalities to
methodologies. BioScience 53: 491-502.
Johnston, R.J. & M. Russell (2011). An operational structure for clarity in ecosystem services.
Ecological Economics 70(12): 2243-2249.
Lord, C.P., E. Strauss & A. Toffler (2002). Natural cities: Urban ecology and the restoration of
urban ecosystems. Virginia Environmental Law Journal 21: 317.
LoSchiavo, A.J., G.R. Best, R.E. Burns, S. Gray et al. (2013). Lessons learned from the first decade of
adaptive management in comprehensive Everglades restoration. Ecology and Society 18(4): 70.
Matthews, J.W., A.L. Peralta, D.N. Flanagan, P.M. Baldwin et al. (2009). Relative influence of
landscape vs. local factors on plant community assembly in restored wetlands. Ecological
Applications 19: 2108-2123.
Menz, M.H.M., K.W. Dixon & R.J. Hobbs (2013). Hurdles and opportunities for landscape-scale
restoration. Science 339: 526-527.
Millennium Ecosystem Assessment [MEA] (2005). Ecosystems and Human Well-Being: Synthesis.
Washington, DC: Island Press.
Mississippi River/Gulf of Mexico Watershed Nutrient Task Force (2008). Gulf hypoxia action plan
2008 for reducing, mitigating, and controlling hypoxia in the northern Gulf of Mexico and improving water
quality in the Mississippi River basin. Washington, DC: Mississippi River/Gulf of Mexico Watershed
Nutrient Task Force. URL: http://water.epa.gov/type/watersheds/named/msbasin/upload/
2008_8msbasin_ghap2008_update082608.pdf
Mississippi River/Gulf of Mexico Watershed Nutrient Task Force (2013). Reassessment 2013 –
Assessing progress made since 2008. Washington, DC: Mississippi River/Gulf of Mexico Watershed
Nutrient Task Force. URL: http://water.epa.gov/type/watersheds/named/msbasin/upload/
hypoxia_reassessment_508.pdf
National Research Council (2004). Adaptive management for water resources project planning.
Washington, DC: National Academies Press. URL: http://www.nap.edu/catalog.php?
record_id=10972
National Research Council (2008). Ecological impacts of climate change. Washington, DC: National
Academies Press. URL: http://www.nap.edu/catalog.php?record_id=12491
National Research Council (2013). An ecosystem services approach to assessing the impacts of the
Deepwater Horizon oil spill in the Gulf of Mexico. Washington, DC: National Academies Press. URL:
http://www.nap.edu/catalog.php?record_id=18387
Olsson, P., L.H. Gunderson, S.R. Carpenter, P. Ryan et al. (2006). Shooting the rapids: Navigating
transitions to adaptive governance of social-ecological systems. Ecology and Society 11(1): 18.
Scarlett, L. (2010). Climate change effects: The intersection of science, policy, and resource
management in the USA. Journal of the North American Benthological Society 29(3): 892-903.
Scholz, J.T. & B. Stiftel (Eds.) (2005). Adaptive Governance and Water Conflict: New Institutions for
Collaborative Planning. Washington, DC: Resources for the Future Press.
S.A.P.I.EN.S, 7.2 | 2014
96
Seastedt, T.R., R.J. Hobbs, & K.N. Suding (2008). Management of novel ecosystems: Are novel
approaches required? Frontiers in Ecology and the Environment 6: 547–553.
Smith, C.B. (2011). Adaptive management on the central Platte River – Science, engineering, and
decision analysis to assist in the recovery of four species. Journal of Environmental Management 92:
1414-1419.
Ulrich, C. (2012, April 9). Taking ecosystem restoration to the next level – National Community
for Ecosystem Restoration and Society for Ecological Restoration. Livebetter Magazine 19.
U.S. Army Corps of Engineers [USACE] (2009). Implementation guidance for Section 2039 of the Water
Resources Development Act of 2007 (WRDA 2007): Monitoring ecosystem restoration. CECW-PB.
Jacksonville, FL: U.S. Army Corps of Engineers. URL: http://planning.usace.army.mil/toolbox/
library/WRDA/wrda07Sec2039a.pdf
U.S. Army Corps of Engineers & South Florida Water Management District [USACE & SFWMD]
(1999). Central and Southern Florida Project comprehensive review study. Final integrated feasibility
report and programmatic environmental impact statement. CESAD-ET-P. Jacksonville, FL: U.S. Army
Corps of Engineers, Jacksonville District and West Palm Beach, FL: South Florida Water
Management District. URL: http://www.evergladesplan.org/docs/comp_plan_apr99/
summary.pdf
U.S. Army Corps of Engineers & South Florida Water Management District [USACE & SFWMD]
(2011). CERP Guidance Memorandum 56: Formal guidance to integrate AM into CERP program and project
management. Jacksonville, FL: U.S. Army Corps of Engineers, Jacksonville District and West Palm
Beach, FL: South Florida Water Management District. URL: http://www.cerpzone.org/
documents/cgm/CGM_56_Adaptive_Management.pdf
U.S. Army Engineer Institute for Water Resources (2013a). Benchmarks for incorporating adaptive
management into water project designs, operational procedures, and planning strategies. Report 1 – Federal
agency inventory of adaptive management practices and policies. 2013-R-11. Alexandria, VA: U.S. Army
Engineer Institute for Water Resources. URL: http://www.iwr.usace.army.mil/Portals/70/docs/
iwrreports/2013-R-11_Benchmarks_Adaptive_Mgmt_Report_1.pdf
U.S. Army Engineer Institute for Water Resources (2013b). Benchmarks for incorporating adaptive
management into water project designs, operational procedures, and planning strategies. Report 2 –
Recommendations for Federal agency implementation of adaptive management for climate change
adaptation. 2013-R-11. Alexandria, VA: U.S. Army Engineer Institute for Water Resources. URL:
http://www.iwr.usace.army.mil/Portals/70/docs/iwrreports/2013-
R-12_Benchmarks_Adaptive_Mgmt_Report_2.pdf
Williams, B.K., R.C. Szaro & C.D. Shapiro (2009). Adaptive management: The U.S. Department of the
Interior technical guide. Washington, DC: Adaptive Management Working Group, U.S. Department
of the Interior.
NOTES
1. http://conference.ifas.ufl.edu/ecosystem/index.html
2. http://ser.org/
3. http://greatwaterscoalition.org/
S.A.P.I.EN.S, 7.2 | 2014
97
RÉSUMÉS
In 2004, a group of large-scale ecosystem restoration practitioners across the United States
convened to start the process of sharing restoration science, management, and best practices
under the auspices of a traditional conference umbrella. This forum allowed scientists and
decision makers to interact in a new type of setting, with science being presented from a
perspective that informed ecosystem restoration decisions, and decision makers articulating
their decision needs in a manner that informed the types of science questions that needed to be
addressed. From that beginning, a core ecosystem restoration practitioner group has formed a
community of practice that continues to build and maintain momentum for this type of
ecosystem restoration engagement. In the fall of 2013, this community of practice became
permanently organized as the Large-scale Ecosystem Restoration Section within the Society for
Ecological Restoration. Over the past decade, this community has evaluated and expanded upon
ecosystem restoration themes ranging from defining and measuring success, adaptive
management, adaptive governance, and linking science with management decision-making.
Current and future themes include novel ecosystems, ecosystem goods and services, urban
ecosystem restoration, and climate change and ecosystem resilience.
INDEX
Keywords : Community of practice, Restoration practitioners, Large-scale ecosystem restoration
AUTEURS
ROBERT DAOUST
ARCADIS US, Inc., Plantation, FL 33324 USA, E-mail: [email protected]
TERRY DOSS
BioHabitats, Inc., Glen Ridge, NJ 07028 USA
MARK GORMAN
Northeast‐Midwest Institute, Washington, DC 20001 USA
MATT HARWELL
US Environmental Protection Agency, Gulf Breeze, FL 34561 USA
CHERYL ULRICH
LERS pro-tem President, Atlantic Beach, FL 32233 USA
S.A.P.I.EN.S, 7.2 | 2014
98
Transborder Drylands Restoration:Vision and Reality After ThreeDecades of Innovative Partnershipson the U.S.-Mexico Border
Tom Barry
Gaëll Mainguy (éd.)
NOTE DE L’ÉDITEUR
This manuscript was published as part of a special issue on the subject of largescale
restoration of ecosystems. This manuscript was reviewed by four anonymous referees.
S.A.P.I.EN.S, 7.2 | 2014
99
Box 1. Facts and Figures: Overview of CLO’s Transborder Drylands Restoration on Mexico Border
* Location: U.S.-Mexico borderlands in southeastern Arizona and northeastern Sonora and
northwestern Chihuahua, including the upper watershed of the Río Yaqui.
* Scale of Restoration Area: More than 4000 sq. kilometres subject to range of conservation and
restoration programs, within which 748 sq. kilometres being actively restored by Cuenca Los Ojos
(CLO).
* Biotic Provinces: Nearctic, Neotropical, Chihuahuan Desert and Sonoran Desert, encompassing
seven major ecological communities found in the 1100-2500 m elevation range on CLO ranches in
Mexico.
* Duration of Restoration Operations: Since 1983 on CLO’s Arizona ranches, and since 1999 at its
Mexican ranches.
* Budget: Private funding for CLO restoration projects, while Malpai Borderlands Group relies on
foundation funding for its conservation easements and U.S. Fish and Wildlife Service depends on
federal funding.
* Partners: Array of dozens of private and public partners including U.S. and Mexican NGOs
(including Naturalia, Border Restoration, The Nature Conservancy, Sky Island Alliance and Pro-
Natura) and U.S. and Mexican government agencies (including SEMARNAT, CONAP, USFWS, and
NRCS).
* Area Biodiversity: 8 native fishes, neotropical bird migration route involving 380 species, 77
known grasses, and over 80 mammals.
* Main Objectives: Habitat recovery, increased biodiversity, watershed restoration, rise of
restoration economy, and restoration of wildlife corridor with a special focus at Rancho San
Bernardino on slowing and distributing waters from flash floods, restoring grasslands, and refilling
deeply incised arroyos.
* Main Benefits: Rise in water table, restoration of desert wetlands from 4% to 15% of its original
size, revegetation of 3,500 hectares with native grasses, creation of five miles of perennial river
flow, and increased diversity including reintroduction of threatened species. Construction of more
than 40,000 rock check dams, 50 large wire gabion dams, and 50 large berms for erosion control
and water-harvesting, resulting in 809 hectares of new riparian vegetation.
Introduction
1 The restoration of arid and semi-arid ecosystems merits increased global attention
because of their global expanse — constituting at least 40% of the planet’s land surface
— and accelerating degradation (Adeel et al., 2005; FAO, 2001; Lal, 2005). But there is no
consensus on a clear path forward — in part because of the scarcity of models and in
part because of the vigorous debates about restoration and degradation thresholds
(Bestelmeyer et al., 2013).
2 When targeted landscapes span fortified international borders or zones characterized
by widespread illegal activity, the complexities and challenges of drylands restoration
strategies are compounded. A case study of such a situation is described here: Cuenca
Los Ojos (CLO) is restoring severely altered riparian areas and aridlands on the Mexico-
U.S. border. At a time when the U.S. government is fortifying its southwest border, CLO
is advancing an alternative paradigm that advocates restoring transborder ecosystems
and generating sustainable cross-border economies.
S.A.P.I.EN.S, 7.2 | 2014
100
Cuenca Los Ojos (CLO) Description
3 The Cuenca Los Ojos foundation is a nonprofit project created by Valer and Josiah
Austin whose institutional mission is “to preserve and restore the biodiversity of the
borderland region through land protection, habitat restoration, and wildlife
reintroduction”1.
4 The Austins moved from New York City in 1983 to begin ranching in southeastern
Arizona. The El Coronado Ranch, which is situated on the western flanks of the
Chiricahua Mountains in the borderland area, was badly eroded and overgrazed,
prompting the Austins to reduce cattle grazing and initiate land-restoration projects.
Their restoration strategy primarily involved erosion control and water harvesting
techniques on their Arizona ranches, which encompass some 32 000 hectares.
5 Traces of pre-Columbian indigenous communities remain throughout the transborder
region in the form of thousands of trincheras (rock check dams), primarily used to
increase cultivable land and to ensure year-round supplies of drinking water, while also
stemming erosion2. Although initially the Austins relied almost exclusively on trincheras
for erosion control and water harvesting, over the past fifteen years they have also
been erecting larger erosion control structures built with gabions (rock-filled baskets
formed by a mesh of galvanized wire). Gabion check dams function like trincheras in
trapping water-borne sediment while slowing down the rush of storm water down
arroyos and streams. Also like trincheras, gabion dams eventually fade into the
landscape as they become covered by alluvium and vegetation. Since the early 1980s,
the Austins estimate they have erected more than 40,000 trincheras, earthen berms, and
gabions on their U.S. and Mexico properties.
6 Institutionalizing their commitment to land restoration, the Austins founded Cuenca
Los Ojos (meaning “basin of springs”) and the civil association Cuenca Los Ojos, A.C. in
Mexico. CLO is the institutional instrument to manage their restoration projects and to
attract funds to maintain this restoration work. Recognizing that their vision of
reviving regional biodiversity and wildlife corridors couldn’t be fully realized without
restorative projects south of the border, the Austins purchased Rancho San Bernardino
in 1999, and they currently own 42 500 hectares along Mexico’s northern border (see
Figure 1).
S.A.P.I.EN.S, 7.2 | 2014
101
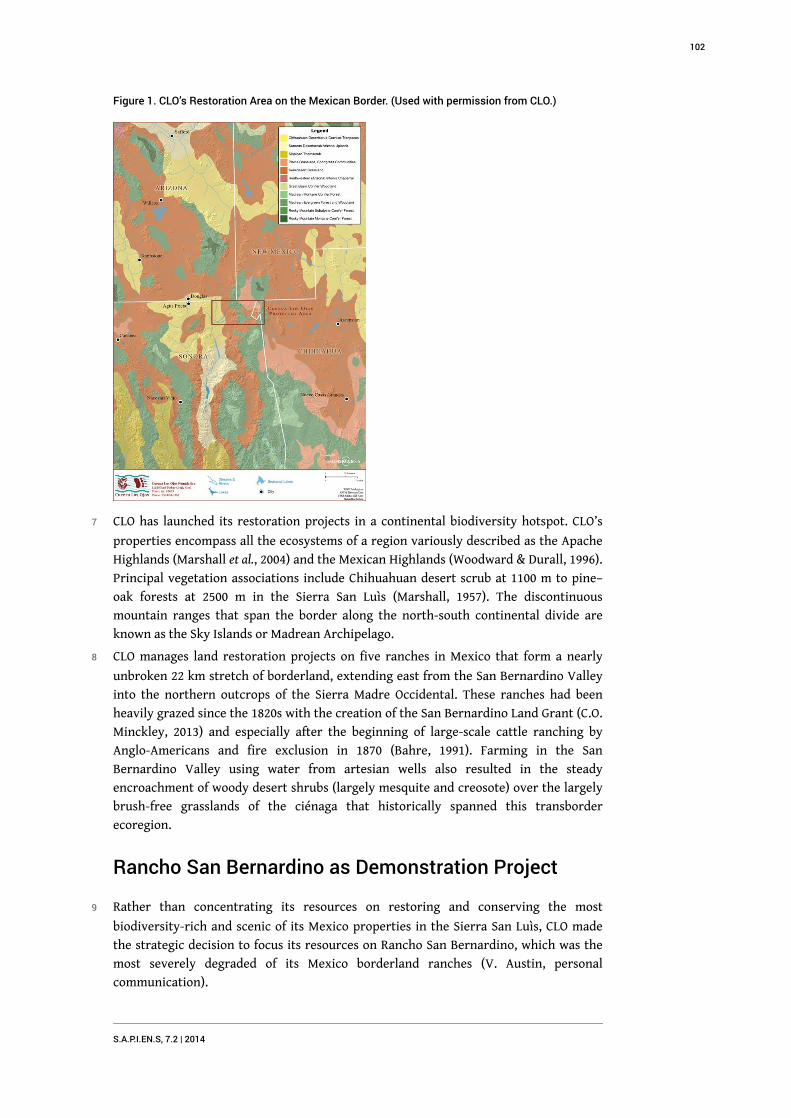
Figure 1. CLO’s Restoration Area on the Mexican Border. (Used with permission from CLO.)
7 CLO has launched its restoration projects in a continental biodiversity hotspot. CLO’s
properties encompass all the ecosystems of a region variously described as the Apache
Highlands (Marshall et al., 2004) and the Mexican Highlands (Woodward & Durall, 1996).
Principal vegetation associations include Chihuahuan desert scrub at 1100 m to pine–
oak forests at 2500 m in the Sierra San Luìs (Marshall, 1957). The discontinuous
mountain ranges that span the border along the north-south continental divide are
known as the Sky Islands or Madrean Archipelago.
8 CLO manages land restoration projects on five ranches in Mexico that form a nearly
unbroken 22 km stretch of borderland, extending east from the San Bernardino Valley
into the northern outcrops of the Sierra Madre Occidental. These ranches had been
heavily grazed since the 1820s with the creation of the San Bernardino Land Grant (C.O.
Minckley, 2013) and especially after the beginning of large-scale cattle ranching by
Anglo-Americans and fire exclusion in 1870 (Bahre, 1991). Farming in the San
Bernardino Valley using water from artesian wells also resulted in the steady
encroachment of woody desert shrubs (largely mesquite and creosote) over the largely
brush-free grasslands of the ciénaga that historically spanned this transborder
ecoregion.
Rancho San Bernardino as Demonstration Project
9 Rather than concentrating its resources on restoring and conserving the most
biodiversity-rich and scenic of its Mexico properties in the Sierra San Luìs, CLO made
the strategic decision to focus its resources on Rancho San Bernardino, which was the
most severely degraded of its Mexico borderland ranches (V. Austin, personal
communication).
S.A.P.I.EN.S, 7.2 | 2014
102
10 Rancho San Bernardino sits at the junction of the Sonoran and Chihuahuan Deserts and
the Mexican subtropics and the Great Plains grasslands (Spector, 2002). The headwaters
or important tributaries of the Río Yaqui pass through Rancho San Bernardino and
other CLO’s Mexico properties. The Río Yaqui is the largest river system west of the
Continental Divide in northwestern Mexico and flows nearly 400 miles southwest
through Sonora, finally emptying into the Sea of Cortez. Rancho San Bernardino
provides a valuable opportunity to assess both riparian and grassland restoration. The
San Bernardino Ranch and the adjacent San Bernardino National Wildlife Refuge on the
north side of the border encompass the uppermost extent of the Río Yaqui watershed,
and subsurface pumping of the aquifer is not practised elsewhere in this area.
11 Overgrazing, alfalfa farming, and gravel mining on the ranch and around its perimeter
since the late 1880s dramatically degraded the landscape and lowered the water table
by as much as 9 m in some sections (R.L. Minckley, 2013; Minckley & Brunelle, 2007).
Soon after the Austins purchased Rancho San Bernardino, CLO removed the cattle and
began its extensive erosion control projects. CLO’s Rancho San Bernardino restoration
project is a natural landscape scale ecological experiment, which aims to return areas
that are currently hardpan scrublands to their former status in the mid-1800s as a
mosaic of grassland, desert, and riparian habitat (Bahre, 1995; Marrs-Smith, 1983;
Humphries, 1987).
12 CLO targeted Rancho San Bernardino for two main reasons: 1, to demonstrate how
closely monitored erosion control techniques can restore surface water flows and
groundwater reserves even in a landscape sundered by deeply incised channels, and 2,
to restore the critical function of the San Bernardino Valley in the sustainability of the
Río Yaqui watershed and associated transborder wildlife corridor.
13 The successes, shortcomings, and challenges of the restoration projects on Rancho San
Bernardino are instructive for possible future restoration projects in the imperiled
desert habitats of the U.S.-Mexico transborder West. This case study can also point to
the possibilities of successful cross-border restoration efforts in conflictive drylands
regions around the planet.
Methodology and Monitoring of CLO’s RestorationEfforts
14 CLO is simultaneously pursing a wide range of restoration techniques on Rancho San
Bernardino including the installation of a variety of erosion control structures,
cultivation of native grasses for seed, restoration of grasslands through shrub removal
and planting native grasses, and fostering biodiversity. CLO is also leading the way
forward in Mexico with respect to advocating the use of prescribed burns in sustainable
land practices. U.S. Fish and Wildlife Service refuge manager Radke, 2013) reported
that, "Grassland restoration is being accomplished through prescribed burning and
removal of invasive mesquite trees, providing benefits to resident and migratory
wildlife" (p.6).
15 CLO’s primary focus, however, is on restorative strategies intended to facilitate the
filtration of water into the soil, thereby recreating a historical landscape characterized
by perennial surface flows, a vast cross-border ciénaga, and groundwater that can be
tapped by native desert grasses.
S.A.P.I.EN.S, 7.2 | 2014
103
16 Valer Austin, who directs CLO’s restoration efforts in Mexico, has relied primarily on
empirical knowledge gained by fifteen years of erosion control and water-harvesting
efforts on the Austins’ ranches north of the border. The restoration techniques on
Rancho San Bernardino have also been informed by close observation of the
conservation and restoration practices on the two USFWS refuges that adjoin CLO
properties. On a February 6, 2012 visit to CLO’s Mexico ranches, Valer Austin stresses
that the key to successful land restoration is the acquired ability to “read the land” and
observe how humans and forces of nature have altered the landscape. This empiricism
also includes “an unwavering determination to get sustainable land management right,
and to be constantly learning from your mistakes” (V. Austin, personal
communication).
17 CLO, however, is committed to the scientific evaluation of its restoration projects, and
has collaborated with scores of researchers and scholars from U.S. and Mexican
institutions. In its mission statement3, CLO stresses its commitment to “scientific
research and sustainable resource management techniques”, and it has hosted more
than 100 researchers at its ranch headquarters. Rancho San Bernardino is becoming a
focal point of research about the drylands restoration, including the effectiveness of
gabion dams.
18 The erection of erosion control structures has a long history marked by many failures
(Peterson & Hadley, 1960; Peterson & Branson, 1962), and some environmental experts
warn that check dams and gabions should have no place in stream and land restoration,
noting that extreme weather events regularly destroy well-intentioned erosion control
structures, resulting in greater flood damage (Zeedyk & Clothier, 2012).
19 There is no playbook of large-scale drylands restoration that CLO could depend on to
guide much of its work, especially with respect to erosion control and aggradation of
deeply incised channels. Gabion dams on Rancho San Bernardino are constructed in
incised channels that are on average six metres deep and can be as wide as 100 metres.
Erosion control structures also include earthen berms as wide as 900 metres, and
cement spillways with reservoirs.
20 There is a long record of successes and failures of erosion control structures in
networks of small gullies. DeLong and Henderson (2012) noted, however, that “we are
unaware of a comparable attempt to use gabions and berms for the sole purpose of
ecological restoration along >10 km of arroyo channels draining watersheds on the
order of ~400 km2 and larger.”
21 Research to develop detailed topographic surveys using terrestrial and airborne laser
detection and remote sensing, coupled with hydrological modeling, field observation,
and stream-flow sensors is providing data on the impacts of restoration efforts on
sediment and hydrology (Delong & Henderson, 2012; Henderson & DeLong, 2012;
Jemison et al., 2012).
22 Remote sensing monitoring by the U.S. Geological Survey of Rancho San Bernardino
shows vegetation growth around gabions and berms despite documented drought.4
Comparing gabions used for urban flood control in the Mexican border city of Nogales
with those at San Bernardino, researchers with the U.S. Geological Survey and the
University of Arizona posited that the success or failure of gabion structures is closely
related to the goals of installation, noting that the gabion dams on Rancho San
Bernardino were constructed for riparian restoration not flood control (Gass et al.,
S.A.P.I.EN.S, 7.2 | 2014
104
2013). USGS members observed that a combination of restorative practices “has
successfully restored ecosystem function to riparian corridors in this once lost, but not
forgotten cieñega wetlands” (L. Norman, personal communication, March 2014).
23 DeLong and Henderson (2012) concluded that the interactions between engineering,
sedimentation, flood hydrology, and vegetation growth contribute to the resilience of
the erosion control techniques at Rancho San Bernardino, working together to prevent
a serious failure of the gabion dams. DeLong, who has been monitoring erosion control
at the San Bernardino Ranch since 2007, observed that “some of these techniques can
be more broadly applied to stabilize subsurface and surface water resources
throughout other dry regions”5. DeLong and Henderson (2012) suggested that the
continuing quantification of restoration efforts at San Bernardino “may prove useful in
guiding similar large-scale ecological restoration efforts in degraded dryland
landscapes.”
24 Despite the drought — including the declining winter precipitation in the Chiricahua
Mountains — water is returning to this degraded landscape (Broska, 2009). In large
part, the reduction of the erosive scouring of the landscape during extreme rain events
during the monsoon seasons is increasing the availability of seasonal and permanent
water (Radke, 2013). When hosting a delegation of some twenty visiting ranchers from
neighboring Chihuahua at the San Bernardino Ranch on October 12, 2013, Valer Austin
explained that the end objective of the gabions and trincheras was not to collect surface
water but rather to restore a landscape that absorbs rather than sheds water — “to
function like a sponge” (V. Austin, personal communication).
25 Among the signature achievements of CLO and the Rancho San Bernardino restoration
project is the recolonizing of the upstream and downstream wetlands with native fish
without the need for active reintroduction projects (Radke, 2013). Surveys during
2008-2011 documented the presence of six of the eight Río Yaqui native fishes in the
San Bernardino Creek, pointing to the success of CLO’s restoration work in slowing
erosion, raising groundwater levels, and giving rise to dense stands of cattail and
bulrush along the once barren creek (C.O. Minckley, 2013).
26 Researchers from the Universidad de Sonora have documented the increasing
biodiversity on Rancho San Bernardino as part of a plan to have the ranch designated
as a privately owned wildlife reserve. The researchers concluded that the “huge
change” at the ranch — which has a “history of agriculture and livestock exploitation
beyond the capacity of recovery” — in the retention of sediment and water has resulted
in the attraction of many diverse species of mammals and birds. Monitoring over short
periods documented the presence of 85 bird species (Cárdenas-García & Olguín-Villa,
2013) and 26 species of mammals (Bonillas-Monge & Valdez-Coronel, 2013).
Cattle and Drylands Restoration
27 The impact of livestock on the aridlands of this transborder region is a subject of
debate amongst environmentalists, government agencies, and the ranching
community. To a large degree, this debate is about differing philosophies and priorities.
Environmentalists who prioritise biodiversity and the restoration of natural habitats
generally oppose grazing cattle on public lands and in stressed ecosystems (Brown &
McDonald, 1995). Others, including sectors of the environmentalist community, argue
that livestock can play a critical role in maintaining and restoring healthy desert
S.A.P.I.EN.S, 7.2 | 2014
105
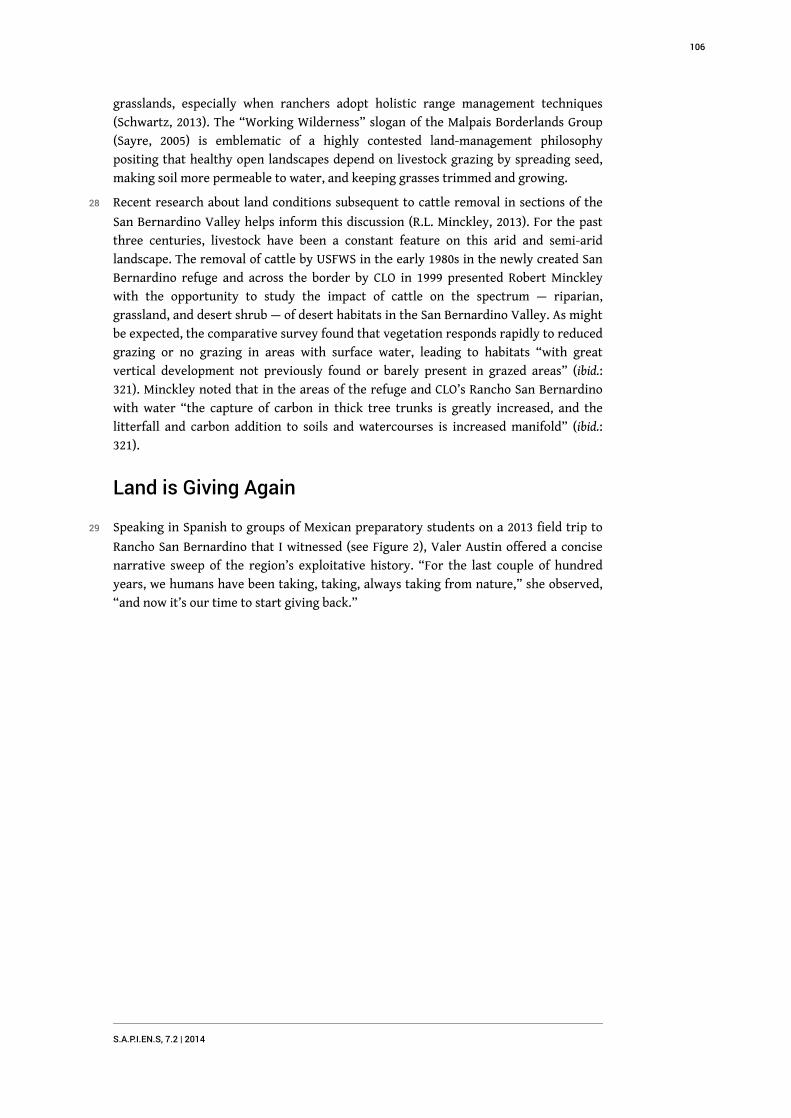
grasslands, especially when ranchers adopt holistic range management techniques
(Schwartz, 2013). The “Working Wilderness” slogan of the Malpais Borderlands Group
(Sayre, 2005) is emblematic of a highly contested land-management philosophy
positing that healthy open landscapes depend on livestock grazing by spreading seed,
making soil more permeable to water, and keeping grasses trimmed and growing.
28 Recent research about land conditions subsequent to cattle removal in sections of the
San Bernardino Valley helps inform this discussion (R.L. Minckley, 2013). For the past
three centuries, livestock have been a constant feature on this arid and semi-arid
landscape. The removal of cattle by USFWS in the early 1980s in the newly created San
Bernardino refuge and across the border by CLO in 1999 presented Robert Minckley
with the opportunity to study the impact of cattle on the spectrum — riparian,
grassland, and desert shrub — of desert habitats in the San Bernardino Valley. As might
be expected, the comparative survey found that vegetation responds rapidly to reduced
grazing or no grazing in areas with surface water, leading to habitats “with great
vertical development not previously found or barely present in grazed areas” (ibid.:
321). Minckley noted that in the areas of the refuge and CLO’s Rancho San Bernardino
with water “the capture of carbon in thick tree trunks is greatly increased, and the
litterfall and carbon addition to soils and watercourses is increased manifold” (ibid.:
321).
Land is Giving Again
29 Speaking in Spanish to groups of Mexican preparatory students on a 2013 field trip to
Rancho San Bernardino that I witnessed (see Figure 2), Valer Austin offered a concise
narrative sweep of the region’s exploitative history. “For the last couple of hundred
years, we humans have been taking, taking, always taking from nature,” she observed,
“and now it’s our time to start giving back.”
S.A.P.I.EN.S, 7.2 | 2014
106

Figure 2. Rancho San Bernadino.
In a deeply incised arroyo, CLO's Valer Austin explains how to "read the land" to Mexican students on afield trip to Rancho San Bernardino.
Photo: Tom Barry.
30 CLO has increasingly insisted that sustainability strategies must extend beyond a
narrow focus on land protection. Conservation and restoration efforts should “address
the environmental, social and economic challenges of the region in a strategic and
integrated fashion” (CLO, 2008: 2) Furthermore, “The area needs to be protected as a
wildlife corridor…. [But] the border region should also be an area of rich cultural
exchange between people of two nations. Instead it has become a zone of contention.”
CLO says that it “hopes that this effort would be seen as an alternative to the many top-
down, security-driven actions being implemented by the U.S. government on the
border at great cost to local communities, the environment, and cross-border
cooperation” (ibid.: 3).
31 As the land heals from overgrazing and interventionist restorative techniques, CLO is
reaching out to its Sonoran and Chihuahua neighbors with proposals to participate in
Borderlands Restoration, a CLO partner, terms “community-based collaborative” land
restoration” (Pulliam, nd). These collaborative initiatives include a partnership with
Don Cuco Sotol, which produces and markets sotol liquor. CLO invited the family
enterprise with an international market to harvest fleshy hearts of the agave-like sotol
plant in the Sierra San Luìs. In return, the family has agreed to take measures to ensure
that the natural rates of sotol growth are maintained.
32 CLO is also cultivating native grasses and experimenting with seed harvesting with the
intention of fostering a social enterprise that markets these native grass seeds — which
currently are only available from U.S. distributors. CLO, working closely with
Borderlands Restoration L3C, is also exploring plans to cultivate and distribute desert
S.A.P.I.EN.S, 7.2 | 2014
107
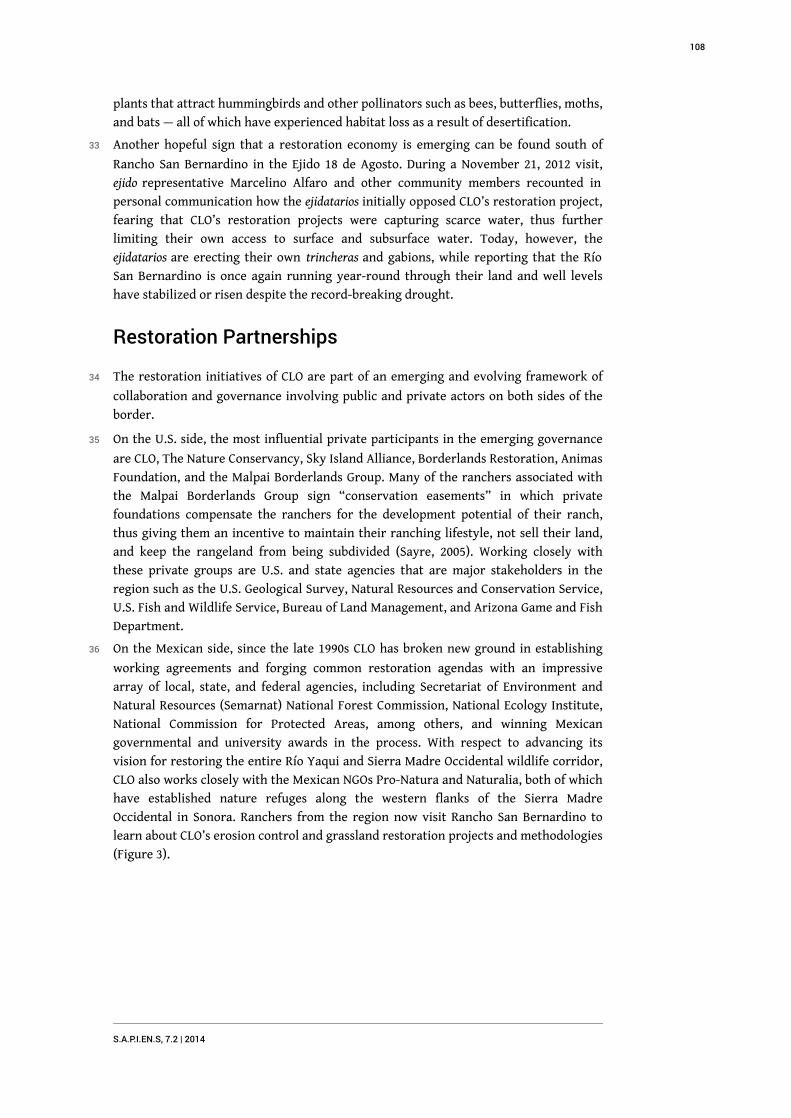
plants that attract hummingbirds and other pollinators such as bees, butterflies, moths,
and bats — all of which have experienced habitat loss as a result of desertification.
33 Another hopeful sign that a restoration economy is emerging can be found south of
Rancho San Bernardino in the Ejido 18 de Agosto. During a November 21, 2012 visit,
ejido representative Marcelino Alfaro and other community members recounted in
personal communication how the ejidatarios initially opposed CLO’s restoration project,
fearing that CLO’s restoration projects were capturing scarce water, thus further
limiting their own access to surface and subsurface water. Today, however, the
ejidatarios are erecting their own trincheras and gabions, while reporting that the Río
San Bernardino is once again running year-round through their land and well levels
have stabilized or risen despite the record-breaking drought.
Restoration Partnerships
34 The restoration initiatives of CLO are part of an emerging and evolving framework of
collaboration and governance involving public and private actors on both sides of the
border.
35 On the U.S. side, the most influential private participants in the emerging governance
are CLO, The Nature Conservancy, Sky Island Alliance, Borderlands Restoration, Animas
Foundation, and the Malpai Borderlands Group. Many of the ranchers associated with
the Malpai Borderlands Group sign “conservation easements” in which private
foundations compensate the ranchers for the development potential of their ranch,
thus giving them an incentive to maintain their ranching lifestyle, not sell their land,
and keep the rangeland from being subdivided (Sayre, 2005). Working closely with
these private groups are U.S. and state agencies that are major stakeholders in the
region such as the U.S. Geological Survey, Natural Resources and Conservation Service,
U.S. Fish and Wildlife Service, Bureau of Land Management, and Arizona Game and Fish
Department.
36 On the Mexican side, since the late 1990s CLO has broken new ground in establishing
working agreements and forging common restoration agendas with an impressive
array of local, state, and federal agencies, including Secretariat of Environment and
Natural Resources (Semarnat) National Forest Commission, National Ecology Institute,
National Commission for Protected Areas, among others, and winning Mexican
governmental and university awards in the process. With respect to advancing its
vision for restoring the entire Río Yaqui and Sierra Madre Occidental wildlife corridor,
CLO also works closely with the Mexican NGOs Pro-Natura and Naturalia, both of which
have established nature refuges along the western flanks of the Sierra Madre
Occidental in Sonora. Ranchers from the region now visit Rancho San Bernardino to
learn about CLO’s erosion control and grassland restoration projects and methodologies
(Figure 3).
S.A.P.I.EN.S, 7.2 | 2014
108
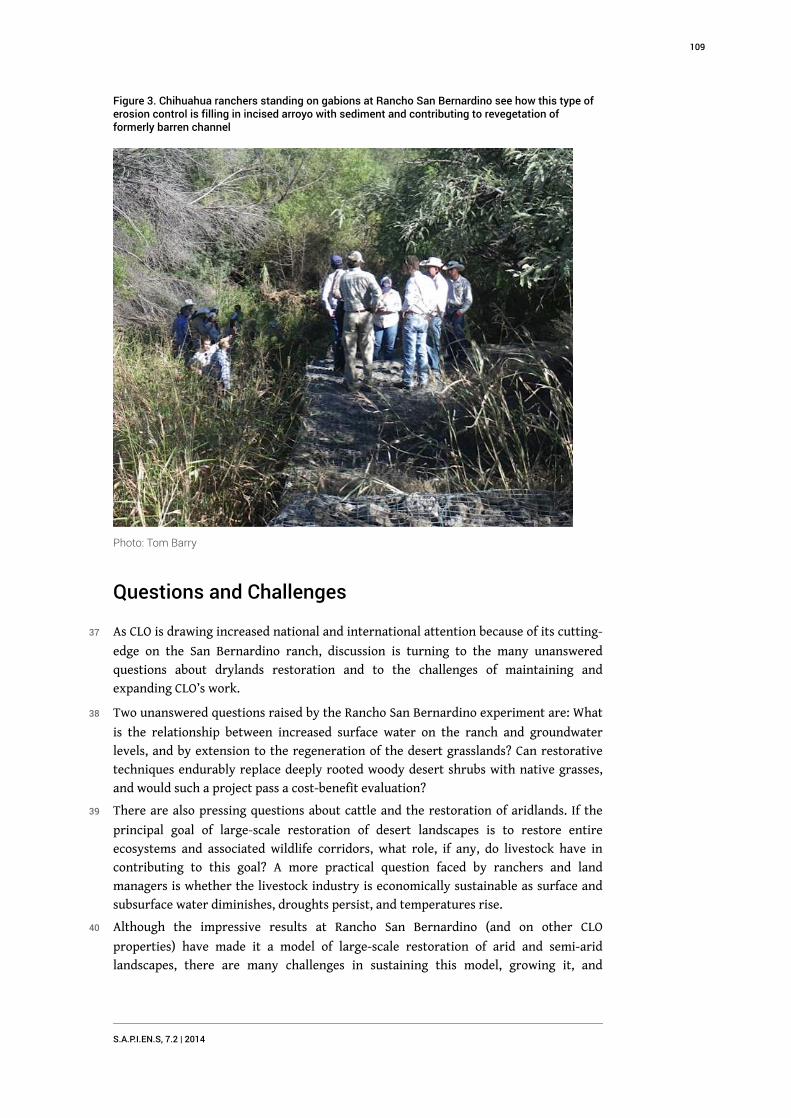
Figure 3. Chihuahua ranchers standing on gabions at Rancho San Bernardino see how this type oferosion control is filling in incised arroyo with sediment and contributing to revegetation offormerly barren channel
Photo: Tom Barry
Questions and Challenges
37 As CLO is drawing increased national and international attention because of its cutting-
edge on the San Bernardino ranch, discussion is turning to the many unanswered
questions about drylands restoration and to the challenges of maintaining and
expanding CLO’s work.
38 Two unanswered questions raised by the Rancho San Bernardino experiment are: What
is the relationship between increased surface water on the ranch and groundwater
levels, and by extension to the regeneration of the desert grasslands? Can restorative
techniques endurably replace deeply rooted woody desert shrubs with native grasses,
and would such a project pass a cost-benefit evaluation?
39 There are also pressing questions about cattle and the restoration of aridlands. If the
principal goal of large-scale restoration of desert landscapes is to restore entire
ecosystems and associated wildlife corridors, what role, if any, do livestock have in
contributing to this goal? A more practical question faced by ranchers and land
managers is whether the livestock industry is economically sustainable as surface and
subsurface water diminishes, droughts persist, and temperatures rise.
40 Although the impressive results at Rancho San Bernardino (and on other CLO
properties) have made it a model of large-scale restoration of arid and semi-arid
landscapes, there are many challenges in sustaining this model, growing it, and
S.A.P.I.EN.S, 7.2 | 2014
109
replicating it in other regions. These challenges largely revolve around questions about
political will, institutional frameworks, and finances.
41 For the most part, the successes (and shortcomings) of the experiment are almost
wholly dependent on the vision, determination, and economic resources of the CLO
principals. Can governmental and nongovernmental entities overcome the border
divide and create cross-border frameworks and funding mechanisms for maintaining
CLO restoration projects well into the future? Can Rancho San Bernardino serve as a
pilot project for an ecoregion-wide restoration strategy with diverse biodiversity,
carbon sequestration, and sustainable economy goals? If so, what would be the
governance frameworks and funding sources for this transborder land restoration? Can
transborder collaboration on land restoration and on building restoration economies
supplant border security as a more constructive borderlands paradigm?
42 Most casual observers of degraded arid and semi-arid landscapes in the southwestern
United States and northwestern Mexico dismiss these drylands as “badlands” or
wastelands with little ecological or economic worth. A visit to the San Bernardino
Valley — and especially to the land restoration projects of CLO and the neighboring
USFWS refuges – would surely alter that impression. Monitoring of these projects by
scores of scientists and scholars is also creating a new body of knowledge and literature
on drylands restoration that will prove valuable to other large-scale drylands
restoration projects around the globe.
BIBLIOGRAPHIE
Adeel, Z. et al. (2005). Millennium Ecosystem Assessment. Ecosystems and Human Well-being:
Desertification Synthesis. Washington, DC: World Resources Institute.
Bahre, C.J. (1991). A Legacy of Change: Historic Impact on Vegetation in the Arizona Borderlands.
Tucson, Arizona: University of Arizona Press.
Bahre, C.J. (1995). Human impacts on the grasslands of southeastern Arizona. In: McClaran, M.P.
& T.R. Devender (Eds.) The Desert Grassland, pp.230-64. Tucson, Arizona: The University of
Arizona Press.
Bestelmeyer B.T. et al. (2013). A test of critical thresholds and their indicators in a
desertification-prone ecosystem: more resilience than we thought. Ecol. Lett. 16: 339–345.
Available: http://www.ncbi.nlm.nih.gov/pubmed/23216915. Accessed 3 February 2014.
Bonillas-Monge, M.E. & C.M Valdez-Coronel (2013). Richness of mammals on the San Bernardino
Ranch in the Municipality of Agua Prieta, Sonora, Mexico. In: Gottfried, G. et al. (Eds.) Merging
Science and Management in a Rapidly Changing World: Biodiversity and Management of the
Madrean Archipelago III and 7th Conference on Research and Resource Management in the
Southwestern Deserts, pp.316-321. Fort Collins, Colorado: U.S. Department of Agriculture, Forest
Service, Rocky Mountain Research Station.
S.A.P.I.EN.S, 7.2 | 2014
110
Broska, J. (2009). Water resources of the San Bernardino National Wildlife Refuge, San Bernardino
Valley, Arizona. Research Paper. Albuquerque, New Mexico: U.S Department of Interior, Fish and
Wildlife Service.
Brown, J.H. & W. McDonald (1995). Livestock grazing and conservation on southwestern
rangelands. Conservation Biology 6: 1644-1647.
Cárdenas-García, M. & M. Olguín-Villa (2013). Bird list of San Bernardino Ranch in Agua Prieta,
Sonora, Mexico. In: Gottfried, G. et al. (Eds.) Merging Science and Management in a Rapidly
Changing World: Biodiversity and Management of the Madrean Archipelago III and 7th
Conference on Research and Resource Management in the Southwestern Deserts, pp.316-321.
Fort Collins, Colorado: U.S. Department of Agriculture, Forest Service, Rocky Mountain Research
Station.
Cuenca Los Ojos [CLO] (2008). Bi-national borderlands ecological restoration program. Prepared
for Cuenca Los Ojos Planning and Implementation Meeting, Rancho San Bernardino, Nov. 17-19,
2008.
DeLong, S. & W. Henderson (2012). Can erosion control structures in large dryland arroyo
channels lead to resilient riparian and cienega restoration? Observations from LiDAR, monitoring
and modeling at Rancho San Bernardino, Sonora, MX (#EP23C-0825). Poster presented at the
American Geophysical Union (AGU), Fall meeting, San Francisco, California. http://
fallmeeting.agu.org/2012/eposters/eposter/ep23c-0825/.
Food and Agriculture Organization [FAO] (2001). Soil Carbon Sequestration for Improved Land
Management. World Soil Resources Reports 96. Rome, Italy: FAO.
Gass, L., L.M. Norman, M.L. Villarreal, C. Tolle, M. Coe & P. Jamwal (2013, April). A test of methods
to measure vegetation change adjacent to gabions in Sonora, Mexico using Landsat imagery.
Poster presented at the Santa Cruz River Research Days, 15-16 April 2013, Tucson, Arizona.
Retrieved from http://www.sonoraninstitute.org/images/stories/pdfs/Presentations/
SCRResearchDays/2013/scrrd2013_gass_poster.pdf
Henderson, W.M. & S. DeLong (2012, December). Evaluating dryland ecological and river
restoration using repeat LiDAR and hydrological monitoring (#EP31C-0831). Paper presented at
the American Geophysical Union (AGU) Fall meeting, 3-7 December 2012, San Francisco,
California.
Humphreys, R.R. (1987). 90 Years and 535 Miles: Vegetation Changes Along the Mexican Border.
Albuquerque, New Mexico: University of New Mexico Press.
Jemison, N. et al. (2012, December). Evaluation of arroyo channel restoration efforts using
hydrological modeling: Rancho San Bernardino, Sonora, MX (#EP31A-0790). Paper presented at
the American Geophysical Union (AGU) Fall meeting, 3-7 December 2012, San Francisco,
California.
Lal, R. (2001). Potential of desertification control to sequester carbon and mitigate the
greenhouse effect. Climatic Change 51(1): 35-72.
Marrs-Smith, G. (1983). Vegetation and flora of the San Bernardino Ranch, Cochise County,
Arizona. M.S. Thesis. Tempe, Arizona: Arizona State University.
Marshall, J. (1957). Birds of the pine-oak woodland in southern Arizona and adjacent Mexico.
Pacific Coast Avifauna 32: 1-125.
Marshall, R. et al. (2004). An ecological analysis of conservation priorities in the Apache
Highlands Ecoregion. Report prepared by The Nature Conservancy of Arizona, Instituto del Medio
S.A.P.I.EN.S, 7.2 | 2014
111
Ambiente y el Desarrollo Sustentable del Estado de Sonora. http://skyislandaction.org/SIAC-
Library/Apache%20Highlands%20Report%20no%20ArcView%20figs.pdf
Minckley, C.O. (2013). Observations on the seasonal distribution of native fish in a 10-kilometer
reach of San Bernardino Creek, Sonora, Mexico. In: Gottfried, G. et al. (Eds.) Merging Science and
Management in a Rapidly Changing World: Biodiversity and Management of the Madrean
Archipelago III and 7th Conference on Research and Resource Management in the Southwestern
Deserts, pp.316-321. Fort Collins, Colorado: U.S. Department of Agriculture, Forest Service, Rocky
Mountain Research Station.
Minckley, R.L. (2013). Trajectory and rate of desert vegetation response following cattle removal.
In: Gottfried, G. et al. (Eds.) Merging Science and Management in a Rapidly Changing World:
Biodiversity and Management of the Madrean Archipelago III and 7th Conference on Research and
Resource Management in the Southwestern Deserts, pp.124-126. Fort Collins, Colorado: U.S.
Department of Agriculture, Forest Service, Rocky Mountain Research Station.
Minckley T.A. & A. Brunelle (2007). Paleohydrology and growth of a desert cienega. Journal of
Arid Environments 69: 1–12.
Peterson, H. V. & F. A. Branson (1962). Effects of land treatments on erosion and vegetation on
range lands in parts of Arizona and New Mexico. Journal of Range Management 15(4): 220-6.
Peterson, H.V. & R.F. Hadley (1960). Effectiveness of erosion abatement practices on semiarid
rangelands in western United States. International Association of Scientific Hydrology
Publication 53: 182-191.
Pulliam, R.H. (nd). Call for a Sky Island Corridor Initiative. A White Paper Prepared by
Borderlands Restoration, L3C.
Radke, W.R. (2013) National wildlife management on the United States/Mexico border. In:
Gottfried, G. et al. (Eds.) Merging Science and Management in a Rapidly Changing World:
Biodiversity and Management of the Madrean Archipelago III and 7th Conference on Research and
Resource Management in the Southwestern Deserts, pp.5-9. Fort Collins, Colorado: U.S.
Department of Agriculture, Forest Service, Rocky Mountain Research Station.
Sayre, N. (2005) Working Wilderness: The Malpai Borderlands Group and the Future of the
Western Range. Tucson, Arizona: Rio Nuevo Publishers.
Schwartz, J.D. (2013). Cows Save the Planet and Other Improbable Ways of Restoring Soil to Heal
the Earth. White River Junction, Vermont: Chelsea Green Publishing.
Spector, S. (2002). Biogeographic crossroads as priority areas for biodiversity conservation.
Conservation Biology 16: 1480-1487.
Woodward, D.G. & R. Durall (1996). United States-Mexico Border Area, as Delineated by a Shared-
water Resources Perspective. Fact Sheet 1. U.S. Department of the Interior.
Zeedyk, B. & V. Clothier. (2012). Let the Water Do the Work: Induced Meandering and Evolving
Method for Restoring Incised Channels. Santa Fe, New Mexico: Quivara Coalition.
NOTES
1. http://www.cuencalosojos.org/
2. “In Flight: Adriel Heisey’s Images of Trincheras Archaeology” - An Exhibition of Arizona State
Museum and the Mexican National Institute of Anthropology and History. http://
www.statemuseum.arizona.edu/exhibits/heisey/index.shtml.
S.A.P.I.EN.S, 7.2 | 2014
112
3. See http://www.cuencalosojos.org/
4. http://geography.wr.usgs.gov/science/aridlands/SanBernardino.html
5. Ruben Layne Ruiz, “San Bernardino Example: Dr. Steve DeLong talks about water restoration
on Rancho San Bernardino, Sept 17, 2013,” at: http://youtu.be/yTMoJbRhGCI
RÉSUMÉS
Cuenca Los Ojos (CLO) is a private organization dedicated to large-scale restoration of degraded
arid and semi-arid ecosystems. Incorporated both in Mexico and in the United States, CLO has
land-restoration projects that span 748 square kilometres in the Mexico-U.S. borderlands region.
This case study focuses on CLO’s restorative operations on the Mexican side of this increasingly
fortified border region. It examines the progress, shortcomings, and challenges of the restoration
underway on the 10 000 hectares of Rancho San Bernardino, which abuts the international
border in northeastern Sonora. CLO’s achievements over the past 15 years — in controlling
erosion, refilling and vegetating deeply incised arroyos, increasing surface and subsurface water,
and expanding biodiversity — point to the value of considering the Rancho San Bernardino
experiment as a global model. That this experiment has coincided with a prolonged drought also
marks it as a model for drylands restoration in the hotter, drier conditions predicted with
climate change. Similar large-scale restoration projects might also benefit from a review of CLO’s
strategies for fostering cross-border cooperation, building multisectoral alliances among private
and governmental participants, restoring transborder wildlife corridors, and creating links
between land restoration and emerging restoration economies.
INDEX
Keywords : Drylands, Restoration, Border, Sonora, Arizona
AUTEURS
TOM BARRY
Center for International Policy, 2000 M Street, Suite 720, Washington, DC 20036, 8 Hillside Street,
Pinos Altos, NM 88053, E-mail: [email protected]
S.A.P.I.EN.S, 7.2 | 2014
113