distribution of recent dinocyst assemblages in the western barents sea
TRANSCRIPT

109
Distribution of recent dinocyst assemblages in the western Barents Sea
Sandrine Solignac*1,2, Kari Grøsfjeld3, Jacques Giraudeau4, Anne de Vernal2
Sandrine Solignac*, Kari Grøsfjeld, Jacques Giraudeau, Anne de Vernal. Distribution of modern dinocyst assemblages in the western Barents Sea. Norwegian Journal of Geology, Vol. 89, pp. 109-119, Trondheim 2009. ISSN 029-196X.
Dinoflagellate cyst (dinocyst) assemblages were analyzed in 43 surface sediment samples from the Barents Sea. They can be divided into five major assemblage types, the distribution of which can clearly be linked to the overlying water masses. Notably, a very clear distinction between sites influ-enced by Atlantic water and Arctic water, respectively, is seen in the change in dominance from O. centrocarpum s.l. to I. minutum and is strongly related to sea-surface temperature. More subtle hydrographical features are also recorded in the assemblages, as can be seen from the spatially cohe-rent distribution of the Atlantic assemblages, which allows discrimination between the Norwegian Coastal Current zone, the Norwegian Atlantic Current zone and two regions of modified Norwegian Atlantic Current waters. Here sea-surface temperature does not seem to be the primary para-meter controlling the distribution of the assemblages. Multivariate analyses suggest that the assemblages are associated with the stratification and productivity annual cycles. Cysts of P. dalei seem to favour stratified environments, while O. centrocarpum s.l. might be more adapted to unstable conditions. Cysts of P. dalei are also associated with early spring stratification and productivity, whereas other species such as S. ramosus are related to late spring/summer productivity and stratification.
1 Department of Earth Sciences, University of Aarhus, Høegh-Guldbergs Gade 2, DK 8000 Aarhus C, Denmark2 GEOTOP, Université du Québec à Montréal, C.P. 8888, Succursale Centre-ville, Montréal, QC, H3C 3P8, Canada3 Geological Survey of Norway, N-7021 Trondheim, Norway4 Environnements et Paléoenvironnements Océaniques, UMR CNRS 5805, Université Bordeaux 1, Avenue des Facultés, 33405 Talence cedex, France
* Corresponding author: [email protected] Department of Earth Sciences, University of Aarhus, Høegh-Guldbergs Gade 2, DK 8000 Aar-hus C, Denmark
1. Introduction
The Barents Sea plays a major role in the oceanic system, as it is one of the main areas of water exchange between the Atlantic and Arctic oceans. The relative strength of Atlantic and Arctic fluxes can vary considerably on vari-ous time scales, having impacts on the global circulation through their role in the Arctic Ocean freshwater budget and also on the local hydrography and productivity of the Barents Sea. An example of these local impacts is the fluctuations of the position of the ice edge in the north-ern Barents Sea, which can shift over several hundreds of kilometres from one year to another (Loeng, 1991; Glo-ersen et al., 1992).
The Barents Sea is one of the most productive polar seas (Kögeler & Rey, 1999) and is of major importance for the fishery industries of the region (Olsen et al., 2003). Pro-ductivity is intricately linked to physico-chemical oce-anic processes such as the volume of inflowing Atlantic waters, the presence or absence of sea-ice and melt water, radiation, light, mixed layer depth and nutrient availabil-ity (e.g. Engelsen et al., 2002).
The strong hydrological gradients of the Barents Sea result in distinct regimes of productivity and different phytoplankton communities (e.g., Kögeler & Rey, 1999). The fossil remains of these communities could thus pro-vide useful information on the past variations of the water masses. Notably, among various micropaleonto-logical tracers, it has been shown in numerous previous studies that dinoflagellate cysts (or dinocysts) recovered from surface sediments are strongly related to the overly-ing water masses (e.g., de Vernal et al., 2005 and refer-ences therein). Moreover, their high resistance to disso-lution and their abundance and diversity in harsh condi-tions make them useful proxies for the reconstruction of past high-latitude environments such as the Barents Sea (e.g., de Vernal et al., 2001).
Our goal here is to assess to what extent dinoflagellate cyst (or dinocyst) assemblages from recent sediments reflect the hydrographic conditions and productivity in overlying water masses of the Barents Sea, and possibly to improve our knowledge of the ecological requirements of the various species.
NORWEGIAN JOURNAL OF GEOLOGY Distribution of recent dinocyst assemblages in the western Barents Sea
110
2. Oceanographic setting
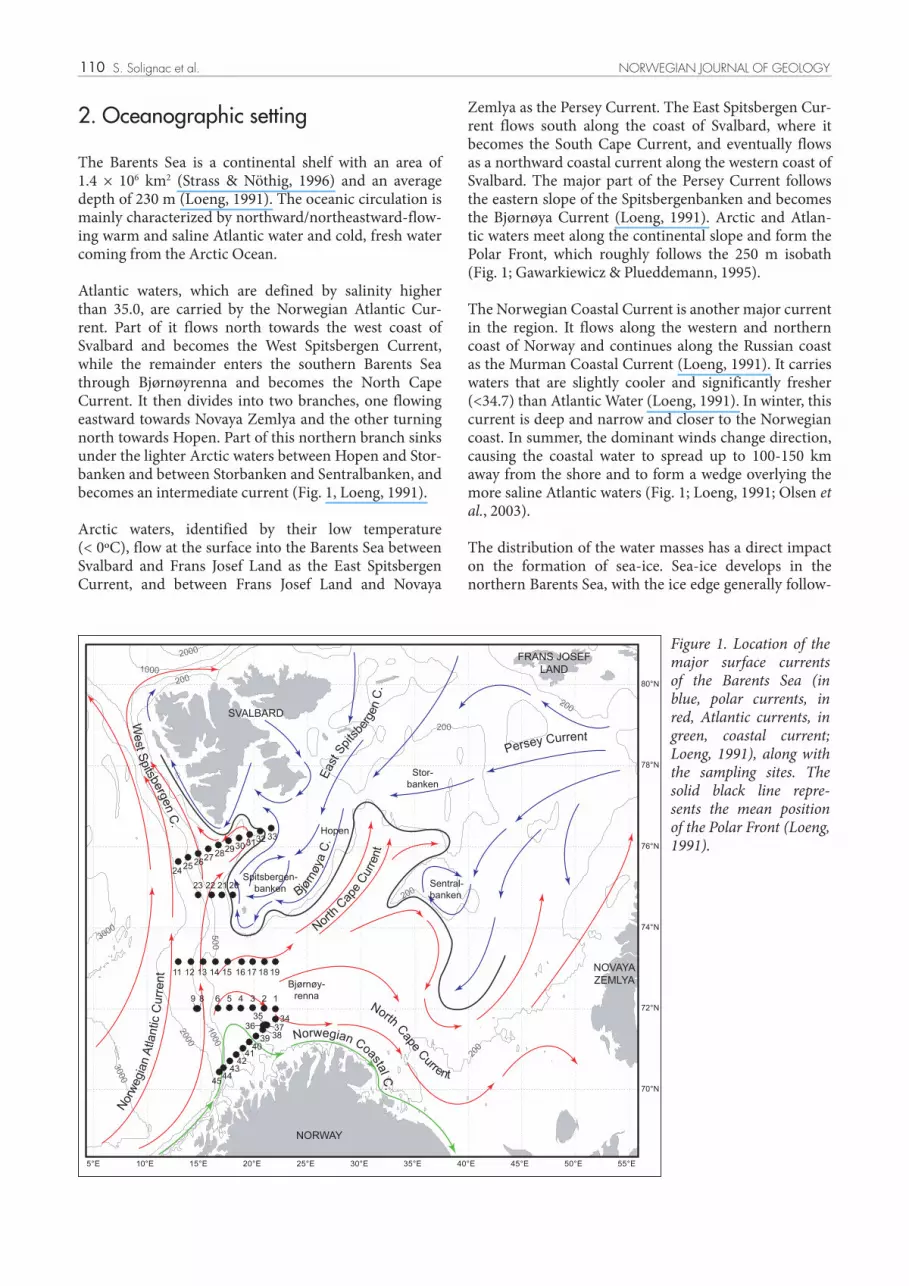
The Barents Sea is a continental shelf with an area of 1.4 × 10⁶ km2 (Strass & Nöthig, 1996) and an average depth of 230 m (Loeng, 1991). The oceanic circulation is mainly characterized by northward/northeastward-flow-ing warm and saline Atlantic water and cold, fresh water coming from the Arctic Ocean.
Atlantic waters, which are defined by salinity higher than 35.0, are carried by the Norwegian Atlantic Cur-rent. Part of it flows north towards the west coast of Svalbard and becomes the West Spitsbergen Current, while the remainder enters the southern Barents Sea through Bjørnøyrenna and becomes the North Cape Current. It then divides into two branches, one flowing eastward towards Novaya Zemlya and the other turning north towards Hopen. Part of this northern branch sinks under the lighter Arctic waters between Hopen and Stor-banken and between Storbanken and Sentralbanken, and becomes an intermediate current (Fig. 1, Loeng, 1991).
Arctic waters, identified by their low temperature (< 0ºC), flow at the surface into the Barents Sea between Svalbard and Frans Josef Land as the East Spitsbergen Current, and between Frans Josef Land and Novaya
Zemlya as the Persey Current. The East Spitsbergen Cur-rent flows south along the coast of Svalbard, where it becomes the South Cape Current, and eventually flows as a northward coastal current along the western coast of Svalbard. The major part of the Persey Current follows the eastern slope of the Spitsbergenbanken and becomes the Bjørnøya Current (Loeng, 1991). Arctic and Atlan-tic waters meet along the continental slope and form the Polar Front, which roughly follows the 250 m isobath (Fig. 1; Gawarkiewicz & Plueddemann, 1995).
The Norwegian Coastal Current is another major current in the region. It flows along the western and northern coast of Norway and continues along the Russian coast as the Murman Coastal Current (Loeng, 1991). It carries waters that are slightly cooler and significantly fresher (<34.7) than Atlantic Water (Loeng, 1991). In winter, this current is deep and narrow and closer to the Norwegian coast. In summer, the dominant winds change direction, causing the coastal water to spread up to 100-150 km away from the shore and to form a wedge overlying the more saline Atlantic waters (Fig. 1; Loeng, 1991; Olsen et al., 2003).
The distribution of the water masses has a direct impact on the formation of sea-ice. Sea-ice develops in the northern Barents Sea, with the ice edge generally follow-
Figure 1. Location of the major surface currents of the Barents Sea (in blue, polar currents, in red, Atlantic currents, in green, coastal current; Loeng, 1991), along with the sampling sites. The solid black line repre-sents the mean position of the Polar Front (Loeng, 1991).
SVALBARD
NORWAY
FRANS JOSEFLAND
NOVAYAZEMLYA
Sentral-banken
Stor-banken
Bjørnøy-renna
Spitsbergen-banken
55°E45°E35°E25°E15°E5°E 50°E40°E30°E20°E10°E
80°N
78°N
76°N
74°N
72°N
70°N
24252627
28293031
3332
21 2023 22
12 1311 14 15 16 17 18 19
1234569 8
343536 37
383940
4142
434445
Hopen
North Cape Current
North
CapeCurrent
PerseyCurrent
EastSpits
bergenC.
NorwegianAtlanticCurrent
West Spitsbergen
C.
Norwegian Coastal C.
BjørnøyaC.
2000
2000
3000
3000
200
200
200
200
200
500
1000
1000
S. Solignac et al. NORWEGIAN JOURNAL OF GEOLOGY

111
ing the Polar Front. The exact position of the ice edge, however, can vary by hundreds of kilometres interannu-ally and also on longer, multidecadal timescales (Glo-ersen et al., 1992; Divine & Dick, 2006), due to variable inflows of Atlantic waters and/or atmospheric processes such as the North Atlantic Oscillation (NAO; Loeng, 1991; Vinje, 2001). On average, in the northern Barents Sea, freezing starts in September, and the maximum sea-ice cover (concentrations of 70%) is reached in April. Melting starts in May and the entire Barents Sea is ice free from about July to September (Kögeler & Rey, 1999). The southern Barents Sea is usually devoid of sea-ice all year long due to the presence of Atlantic Water, but in some extreme years, sea-ice can drift south of the Polar Front (Loeng, 1991; Olsen et al., 2003).
The various currents and the presence/absence of sea-ice result in distinct vertical stratification regimes across the Barents Sea. In winter, the water masses are deeply mixed due to cooling (200-300 m in Atlantic waters, 150 m in Arctic waters; Loeng, 1991). In spring, different mecha-nisms account for the stabilisation of the water column.When sea-ice drifts south of the Polar Front in years of severe climatic conditions, ice melts because of the warm Atlantic waters and stabilizes the water column early in the year with a low-salinity upper layer. North of the Polar Front, increasing air temperatures allow the sea-ice to melt in April-May and to form a well-mixed melt-water layer which extends down to 15-20 m in summer. In both scenarios of sea-ice melting (south and north of the Polar Front), the low-salinity layer is separated from the underlying (and weakly stratified) waters by a thin (5-15m) transition layer (Loeng, 1991).
In the ice-free Atlantic waters, stratification starts in spring with the increase of solar radiation and evolves very slowly. In summer, warming of the water mass reaches down to 50-60 m, underneath a homogenous surface layer 10 m thick (Loeng, 1991).
Waters from the Norwegian Coastal Current are strati-fied throughout the years, although the stability is weak in winter. It strengthens in spring through the lat-eral spreading of fresh coastal waters and temperature increase (Loeng, 1991; Kögeler & Rey, 1999; Olsen et al., 2003).
These different stratification regimes have consequences for phytoplankton development. At the ice edge mar-ginal zone, the spring bloom starts when ice melts and retreats (April-May). The stable low-salinity surface layer allows the phytoplankton to remain in the photic zone; however, the strong pycnocline also prevents the renewal of the nutrient pool and the bloom stops abruptly when nutrients are depleted (Kögeler & Rey, 1999). Along the coast of Norway, the spring bloom starts as early as in the ice marginal zone. It is not as strong as in the marginal zone, but nutrient supplies from the coast sustain sum-mer/autumn productivity through local blooms. In con-
trast, in Atlantic waters, which evolve slowly from deeply mixed in winter to stratified in spring, the spring bloom starts later (late May-early June) than in the ice marginal zone, and develops during the summer, with the weaker and deeper mixed layer allowing the exchange of nutri-ents with deeper water masses (Kögeler & Rey, 1999).
3. Material and methods
The study region is located between northern Norway and Svalbard, at the western limit of the Barents Sea. Surface sediment samples were collected with a multi-corer in August 2004 onboard RV Haakon Mosby along 5 transects (Fig. 1, Knies et al., 2006). Location and water depth of each site are given in Table 1.
Dinocyst assemblages were analyzed on 43 samples. Between 1 and 5 cm3 of sediment (2.3 to 12.5 g of dry sediment) were chemically treated with cold 10%, 20% and 50% HCl and 40% and 70% HF at the UMR EPOC laboratory (University of Bordeaux) following a standard protocol, slightly modified from de Vernal et al. (1999). Lycopodium tablets were added in order to calculate con-centrations of dinocysts. A minimum of 300 cysts were counted in each sample and identified following the nomenclature of Rochon et al. (1999) and Head et al. (2001). Here Operculodinium centrocarpum s.l. includes both long- and short-process forms of Operculodinium centrocarpum sensu Wall and Dale 1966 and Operculo-dinium centrocarpum – Arctic morphotype (de Vernal et al., 2001). Spiniferites elongatus s.l. includes Spiniferites elongatus and Spiniferites frigidus. Brigantedinium spp. includes Brigantedinium simplex and Brigantedinium caracoense.
Multivariate analyses were performed on the relative abundances of the species found in the 43 samples in order to bring out a potential structure in the distribu-tion of the assemblages. A preliminary detrented canoni-cal analysis (DCA) yielded a gradient length smaller than 2, indicating that linear multivariate analyses were better suited to the data than unimodal ones (Ter Braak & Smi-lauer, 1998).
Consequently, we performed a redundancy analy-sis (RDA) on the dataset. The RDA is a direct gradient analysis, allowing the identification of the environmen-tal parameters controlling the composition of the assem-blages (Ter Braak, 1986). It requires a set of environmen-tal data to be tested along with the assemblage data. Here we selected, based on previous studies (de Vernal et al., 2005; Vink et al., 2003; Marret et al., 2004; Solignac et al., 2008; Radi et al., 2008), sea-ice cover duration (NSIDC, 2003), sea-surface temperature and salinity (NODC, 2001), productivity (Antoine et al., 1996), stratification and the distance from the sites to the shore. The seasonal average was taken for temperature and salinity (winter:
NORWEGIAN JOURNAL OF GEOLOGY Distribution of recent dinocyst assemblages in the western Barents Sea

112
January to March, spring: April to June, summer: July to September, fall: October to December), but since pro-ductivity and stratification can vary significantly over a short period in spring/summer, monthly values were preferred to seasonal values for these two parameters. No productivity data were available for November, Decem-ber and January (Antoine et al., 1996). Stratification was assessed through the Brunt-Väisälä frequency (e.g., Vink et al., 2003). This frequency (N) is a measure of the dif-ference in density between two fluid layers. Higher val-ues of N indicate a greater density difference, and thus more stratified waters, while near-zero and negative N values indicate unstable conditions and conditions favourable to convection, respectively. It was computed from the NODC World Atlas (2001) temperature and salinity values, with the use of the software Ocean Data Viewer (Schlitzer, 2008).
4. Results
In total, 24 dinocyst taxa were observed in the surface samples (Fig. 2a), but only 5 to 7 of them occur regularly and contribute to a significant part of the assemblages, making the diversity in terms of species rather moderate. O. centrocarpum s.l. is clearly dominant in most of the samples, except for those from the northern transects, in which Islandinium minutum is the most common spe-cies.Accordingly, the first axis of the RDA explains 66.5%
of the total variance and shows a very clear opposition between O. centrocarpum-dominated assemblages and I. minutum-dominated assemblages. The second principal component, which captures 13.8% of the total variance, separates assemblages comprising significant percent-ages of cysts of Pentapharsodinium dalei and, to a lesser extent, S. elongatus s.l., from the remaining assemblages (Fig. 2a).
The first axis of the RDA depicts a strong negative cor-relation with winter and spring temperature (Fig. 2b). It is also correlated negatively with October stratifica-tion and August/September productivity, and positively with April, June and July stratification. The second axis is correlated positively to October stratification, and nega-tively to February, August and September productivity (Fig. 2b).
Together, the first two axes allow 5 major types of assem-blages (Fig. 3a) to be defined, with only assemblage I being dominated by I. minutum. A subtle distinction can be made between assemblages with lower (assemblage Ia) and higher (Ib) percentages of cysts of P. dalei and S. elongatus s.l. Other species include O. centrocarpum s.l., Brigantedinium spp. and Nematosphaeropsis labyrinthus. The dinocyst concentrations in this group are amongst the lowest of the database (9×10³ dinocyst.g-1 on average).
Inversely, assemblages II to V are all dominated by ubiquitous taxa O. centrocarpum s.l. The distinction between the four groups is based on the relative
S. Solignac et al. NORWEGIAN JOURNAL OF GEOLOGY
Table 1. Location and water depth of the 43 surface samples.Sample Longitude E Latitude N Water depth (m) Sample Longitude E Latitude N Water depth (m)
1 22°00.09’ 72°00.03’ 367 25 13°49.80’ 75°44.60’ 8072 20°55.12’ 72°01.24’ 371 26 14°46.00’ 75°50.00’ 3703 19°51.00’ 72°01.30’ 324 27 15°42.70’ 75°56.70’ 3694 18°46.00’ 72°01.00’ 315 28 16°40.00’ 76°02.50’ 3285 17°41.50’ 72°01.30’ 296 29 17°37.00’ 76°08.80’ 3096 16°36.70’ 72°01.20’ 362 30 18°35.00’ 76°13.20’ 2578 14°43.50’ 72°00.30’ 1260 31 19°34.10’ 76°18.20’ 2589 14°37.00’ 72°00.30’ 1317 32 20°34.50’ 76°23.00’ 22811 12°56.30’ 73°10.00’ 1499 33 21°35.70’ 76°27.70’ 26212 14°05.10’ 73°10.00’ 1030 34 22°00.00’ 71°45.00’ 35613 15°14.00’ 73°10.00’ 485 35 21°03.80’ 71°36.70’ 31914 16°23.00’ 73°10.00’ 475 36 20°51.40’ 71°35.60’ 32015 17°32.20’ 73°10.00’ 460 37 21°11.40’ 71°35.70’ 33516 18°49.00’ 73°10.10’ 423 38 20°48.60’ 71°28.80’ 31017 19°50.90’ 73°10.00’ 441 39 20°10.80’ 71°19.80’ 23418 20°57.00’ 73°10.00’ 463 40 19°33.40’ 71°11.00’ 22519 21°59.90’ 73°10.00’ 444 41 18°56.60’ 71°01.60’ 19920 18°01.00’ 74°48.70’ 296 42 18°20.20’ 70°52.10’ 17321 17°00.00’ 74°48.70’ 280 43 17°44.70’ 70°42.70’ 27322 16°02.00’ 74°48.70’ 356 44 17°07.70’ 70°32.60’ 70623 14°46.80’ 74°48.60’ 1507 45 16°44.50’ 70°26.30’ 150024 12°55.20’ 75°38.20’ 1500

113
Figure 22a. Species scores on the first two axes of the RDA performed on the 43 dinocyst assemblages. Names in smaller characters indicate minor spe-cies.
2b. Scores of envi-ronmental variables. N: Brunt-Väisälä frequency, S: sali-nity, T: temperature, Prod: productivity. Only the variables that have a statis-tically significant influence (p<0.01) on the assemblages are represented with arrows. The other variables are repre-sented with dots. A small angle between two arrows indicates high positive corre-lation, a 90º angle, no correlation, and opposite directions, a negative correlation. The same applies for the angles between the arrows and the axes.
2c. Sample scores.
P. schwartzii
Q. concreta
V. calvum
T. applanatum
Protoperidinioids
Dubridinium spp.
Brigantedinium spp.
I. minutum
cysts of P. dalei
Spiniferites spp. O. janduchenei
I. sphaericum I. patulum
I. pallidum
B. tepikiense
A. choane
2a.
S. mirabilis S. ramosus
S. elongatus s.l.
O. centrocarpum s.l.
N. labyrinthus
Echinidinium spp. I.? cezare
S. quanta
-1.2
-1
-0.8
-0.6
-0.4
-0.2
0
0.2
-1 -0.8 -0.6 -0.4 -0.2 0 0.2 0.4 0.6 0.8 1
2b.
Prod Oct
Prod Sep
Prod Aug
Prod Jul
Prod Jul
Prod May
Prod Apr Prod Mar
Prod Feb
N Dec
N Oct N Sep
N Aug
N Jul
N Jun
N May
N Apr N Mar
N Feb N Jan
Sea-ice S fall
S sum S spring S win
T fall T sum
T spring
T win
distance
-0.5
-0.4
-0.3
-0.2
-0.1
0
0.1
0.2
0.3
0.4
0.5
-1 -0.8 -0.6 -0.4 -0.2 0 0.2 0.4 0.6 0.8 1
2c.
-2
-1.5
-1
-0.5
0
0.5
1
1.5
2
-2.5 -2 -1.5 -1 -0.5 0 0.5 1 1.5 2 2.5
45 42
8 44
43 9
11
41 12
2 15
40
23 14
4 3 5
6 36 1 35
38 37
34 39
18
16 25 19
17
20
21 28
27 29 33
22 31 32 26
30
13 24
NORWEGIAN JOURNAL OF GEOLOGY Distribution of recent dinocyst assemblages in the western Barents Sea

114
abundance of cysts of P. dalei and other secondary species (N. labyrinthus, S. elongatus s.l., S. ramosus). Assemblage II is the most overwhelmingly O. centrocarpum-dominated assemblage, with weak percentages of N. labyrinthus, S. elongatus and S. ramosus. It is also characterized by the highest cyst concentrations (4.5×10⁴ cyst.g-1 on average). S. ramosus increases slightly and cysts of P. dalei appear in assemblage III. S. ramosus then reaches its highest percentages in assemblage IV, along with an increase in cysts of P. dalei and S. elongatus. Assemblage V is characterized by the disappearance of S. ramosus and the highest relative abundances of cysts of P. dalei (~10-20%) of all samples (Fig. 3a). These variations are of particular interest, as they might shed light on the ecology of these species.
5. Discussion
5.1. Spatial distribution of the assemblages
The opposition between O. centrocarpum- and I. minu-tum-dominated assemblages in the region has long been recognized by various authors. I. minutum is a species commonly found in cold waters (Rochon et al., 1999, Head et al., 2001; Voronina et al., 2001; Grøsfjeld et al., this issue), which is consistent with the samples with high percentages of this species being collected in the regions under the influence of Arctic water and with a sea-ice cover lasting more than 2 months (NODC, 2001; Fig. 3a, 3b and 4a). It is clearly implied as well by the strong anti-correlation between the first axis of the RDA and sea-surface temperature (Fig. 2b). The I. minu-tum-dominated assemblages thus reflect the influence of Arctic water masses. This is further reflected within the Assemblage I group, where the sites with the high-est temperatures and lowest sea-ice cover (HM St 21, 22, 26, and to a lesser extent 20) are characterized by lower percentages of I. minutum (Fig. 3a), in favour of O. cen-trocarpum and/or S. elongatus s.l.
Inversely, O. centrocarpum-dominated assemblages have been observed in previous studies on nearby regions, and indicate the influence of the warm Norwegian Current or Norwegian Coastal Current (Harland, 1982; Boess-enkool et al., 2001; Voronina et al., 2001; Grøsfjeld et al., this issue). These assemblages also all comprise between 5 and 10% of N. labyrinthus, which again is indicative of subpolar to temperate waters (e.g., Boessenkool et al., 2001). The most prominent feature of the Barents Sea, i.e., the presence of water masses of both polar and Atlantic origin, is thus well observed in the recent assem-blages, which is to be expected considering the very con-trasting characteristics of the two water mass types.
A closer look at the four Atlantic-derived assemblages, however, suggests that even subtle differences in the water masses are reflected in the dinocyst record. Indeed,
the distribution of the various assemblages is generally spatially coherent (Fig. 3b) and highlights some of the features of the regional hydrography.
The distribution of assemblage IV, which is characterized by the highest percentages of Spiniferites species and sig-nificant amounts of cysts of P. dalei, is especially clear. It is mainly confined to the southwestern sites, which is, as can be seen from the lower salinity (NODC, 2001; Fig. 4a), influenced by the wedge formed by the fresher Nor-wegian Coastal Current.
Assemblages II and III are found in the path of the North Cape Current and the Norwegian Atlantic Cur-rent, respectively, with the main difference between them being the near absence of cysts of P. dalei in assem-blage II. Sea-surface temperatures are slightly higher on average for assemblage II, whereas salinities are lower (NODC, 2001; Fig. 4a), due to the proximity of the Nor-wegian Coastal Current. Assemblage II might thus cor-respond to modified, fresher Atlantic water, while assem-blage III is associated with a “purer” Norwegian Atlan-tic Current signal. The same conclusion can be drawn from the comparison of assemblages III and V, which form the eastern and western halves of the central tran-sect, respectively (Fig. 3b). The shift from assemblage III, which has relatively low abundances of S. elongatus s.l., S. ramosus and cysts of P. dalei, to assemblage V, in which cysts of P. dalei reach their highest percentages, corre-sponds to a slight drop in the surface temperature and salinity (NODC, 2001; Fig. 4a). This might indicate again that assemblage III lies closer to the core of the north-ward flowing Norwegian Current. Assemblage V, on the other hand, corresponds to modified, cooler and fresher Atlantic water.
5.2. Factors controlling the distribution of the assemblages
Hence, each assemblage can be associated with a spe-cific water mass. However, it is more difficult to identify which environmental parameter is responsible for the shifts in assemblages, or to isolate one particular species and relate it to a specific parameter. For example, among the Atlantic assemblages, cysts of P. dalei are abundant in the high-salinity, lower-temperature zone of assemblage V (Fig. 3a), but they also appear in assemblage IV from the low-salinity, warm Norwegian Coastal Current.
In order to better understand the distribution of the dinocyst assemblages, we performed a second RDA, this time after removing the I. minutum-dominated samples, so as to focus on the Atlantic water ones. The first axis of this RDA (49.1%) separates sites with significant per-centages of cysts of P. dalei from the others, while the second axis (20.5%) highlights samples with higher pro-portions of S. ramosus (Fig. 5a).
Sites with cysts of P. dalei lie on the positive side of the
S. Solignac et al. NORWEGIAN JOURNAL OF GEOLOGY

115NORWEGIAN JOURNAL OF GEOLOGY Distribution of recent dinocyst assemblages in the western Barents Sea
Figure 33a. Dinocyst assemblages encountered in the stu-died area. The different assemblages are based on the first two axes of the RDA, which together explain 80.2% of the variance. Note that some of the minor species are not on the graph for more clarity.
3b. Distribution of the 5 assemblages in the Barents Sea.
Site Axis 1 Axis 2 - 3 3 - 1 1 - 3 3 - 1 1 0 5 0 5 0 1 0 4 0 1 0 0 4 0 0 1 0 4 0 1 0 4 0 5 0 3 0 1 0 0 1 0 0 4 0 0 5 0 5
3 0 2 6 3 2 3 1 2 2 3 3 2 9 2 7 2 8 2 1 2 0 3 9 3 4 3 7 3 8 3 5
1 6
3 6 5 3 4
1 4 2 3 4 0
1 5 1 3
2 4 2
1 2 4 1 1 1
9 4 3 4 4
8 4 2 4 5 1 7 1 9 2 5 1 6 1 8
B
e s n e i k i p e t . I
m u d i l l a p . N
s u h t n i r y b a l . O
m u p r a c o r t n e c .
s . l .
S
s u t a g n o l e .
s . l .
S
s u s o m
a r . S
s i l i b a r i m . f o s t s y c P
i e l a d .
I
m u t u n i m . B
m u i n i d e t n a g i r
. p p s
S a t n a u q .
0 1 0 0 0 0 0
C o n c e n t r a t i o n dinocyst.g -1
Ia
Ib
II
III
IV
V
3a.
24 25 26 27 28 29 30 31 33 32
21 20 23 22
12 13 11 14 15 16 17 18 19
1 2 3 4 5 6 9 8
34 35 36 37
38 39 40
41 42
43 44 45
Ia Ib
V
II III IV
2 5 ° E 1 5 ° E 2 0 ° E 10 ° E
78 ° N
76 ° N
74 ° N
72 ° N
70 ° N
3b.
3a
3b

116 S. Solignac et al. NORWEGIAN JOURNAL OF GEOLOGY
Figure 4
4a. Seasonal sea-surface temperature and salinity (NODC, 2001) and sea-ice cover extent (NSIDC, 2003) for each of the sites.
4b. Monthly Brunt-Väisälä frequencies for each of the sites.
4c. Monthly producti-vity for each of the sites (Antoine et al., 1996) and distance between the sites and the shore. Note that no producti-vity data were available from November to Janu-ary.
Note the different hori-zontal scales to empha-size the contrasts bet-ween the assemblages. Major species of each assemblage are indica-ted on the left (in bold, dominating species; secondary species are listed by order of impor-tance).
T win (ºC) T spring (ºC) T sum (ºC) T fall (ºC) S win S spring S sum S fall Sea-ice cover
(mo.yr-1) - 2 7 0 0 9 0 1 2 0 9 3 4 . 2 5 3 5 . 2 5 3 4 . 2 5 3 5 . 2 5 3 3 . 5 3 5 . 0 3 3 . 5 3 5 . 0 0
3 0 2 6 3 2 3 1 2 2 3 3 2 9 2 7 2 8 2 1 2 0 3 9 3 4 3 7 3 8 3 5
1 6
3 6 5 3 4
1 4 2 3 4 0
1 5 1 3
2 4 2
1 2 4 1 1 1
9 4 3 4 4
8 4 2 4 5 1 7 1 9 2 5 1 6 1 8
Ia
Ib
II
III
IV
V
I. minutum O. centrocarpum Brigantedinium spp.
I. minutum O. centrocarpum Brigantedinium spp. P. dalei S. elongatus
O. centrocarpum S. elongatus N. labyrinthus
O. centrocarpum
S. elongatus
N. labyrinthus P. dalei
S. ramosus
O. centrocarpum P. dalei S. ramosus
N. labyrinthus S. elongatus O. centrocarpum P. dalei N. labyrinthus S. elongatus
January February March April May June July August September October November December - 1 6 - 1 6 0 6 0 6 0 6 0 1 0 0 1 0 0 1 0 - 1 6 - 1 6 0 7 0 7
Brunt-Väisälä frequency (cycles.h -1 )
3 0 2 6 3 2 3 1 2 2 3 3 2 9 2 7 2 8 2 1 2 0 3 9 3 4 3 7 3 8 3 5
1 6
3 6 5 3 4
1 4 2 3 4 0
1 5 1 3
2 4 2
1 2 4 1 1 1
9 4 3 4 4
8 4 2 4 5 1 7 1 9 2 5 1 6 1 8
Ia
Ib
II
III
IV
V
I. minutum O. centrocarpum Brigantedinium spp.
I. minutum O. centrocarpum Brigantedinium spp. P. dalei S. elongatus
O. centrocarpum S. elongatus N. labyrinthus
O. centrocarpum
S. elongatus
N. labyrinthus P. dalei
S. ramosus
O. centrocarpum P. dalei S. ramosus
N. labyrinthus S. elongatus O. centrocarpum P. dalei N. labyrinthus S. elongatus
F e b. M a rch A pril M a y J u ne J u ly August S e pt. O c t. 0 1 0 0 2 0 0 4 0 0 7 0 0 4 0 0 4 0 0 2 0 0 1 0 0 1 0
Productivity (g.C.m -2 )
3 0 2 6 3 2 3 1 2 2 3 3 2 9 2 7 2 8 2 1 2 0 3 9 3 4 3 7 3 8 3 5
1 6
3 6 5 3 4
1 4 2 3 4 0
1 5 1 3
2 4 2
1 2 4 1 1 1
9 4 3 4 4
8 4 2 4 5 1 7 1 9 2 5 1 6 1 8
Ia
Ib
II
III
IV
V
I. minutum O. centrocarpum Brigantedinium spp.
I. minutum O. centrocarpum Brigantedinium spp. P. dalei S. elongatus
O. centrocarpum S. elongatus N. labyrinthus
O. centrocarpum
S. elongatus
N. labyrinthus P. dalei
S. ramosus
O. centrocarpum P. dalei S. ramosus
N. labyrinthus S. elongatus O. centrocarpum P. dalei N. labyrinthus S. elongatus
Distanceto the shore (km)
0 300
4a
4b
4c

117NORWEGIAN JOURNAL OF GEOLOGY Distribution of recent dinocyst assemblages in the western Barents Sea
5a.
Echinidinium spp.
P. schwartzii
Q. concreta
V. calvum
T. applanatum
S. quanta
Protoperidinioids
Dubridinium spp.
Brigantedinium spp.
I. minutum
cysts of P. dalei
Spiniferites spp.
S. mirabilis
S. ramosus
S. elongatus s.l.
O. janduchenei O. centrocarpum s.l.
N. labyrinthus
I. sphaericum
I. patulum I. pallidum
B. tepikiense
A. choane
-1
-0.8
-0.6
-0.4
-0.2
0
0.2
0.4
0.6
0.8
1
-1 -0.8 -0.6 -0.4 -0.2 0 0.2 0.4 0.6 0.8 1
5b.
Prod Oct
Prod Sep Prod Aug
Prod July Prod June
Prod May
Prod Apr Prod Mar
N Dec
N Nov
N Oct
N Sep
N Aug
N Jul
N Jun
N May
N Apr
N Mar
N Feb
N Jan
Sea-ice
S fall S sum
S spring
S win
T fall
T sum
T spring
T win
distance
-0.8
-0.6
-0.4
-0.2
0
0.2
0.4
0.6
0.8
-0.8 -0.6 -0.4 -0.2 0 0.2 0.4 0.6 0.8
5c.
1 7
1 9
2 5
1 6 1 8
3 9
3 4
3 7 3 8
3 5 1 3 6
6
5
3
4
1 4
2 3 4 0
1 5
1 3
2 4
2
1 2
4 1
1 1
9 4 3
4 4
8
4 2 4 5
-2.5
-2
-1.5
-1
-0.5
0
0.5
1
1.5
2
2.5
-2 -1.5 -1 -0.5 0 0.5 1 1.5 2
5a
5b
5c
Figure 5
5a. Species scores on the first two axes of the RDA perfor-med on the dinocyst assemblages after excluding those of zone I. Names in smaller characters indicate minor spe-cies.
5b. Scores of envi-ronmental variables. Only the variables that have a statis-tically significant influence (p<0.01) on the assemblages are represented with arrows. The other variables are repre-sented with dots.
5c. Sample scores.

118 S. Solignac et al. NORWEGIAN JOURNAL OF GEOLOGY
for example south of the Polar Front or in the Norwegian Coastal Current, cysts of P. dalei develop (assemblages IV and V, and to a lesser extent III). In cases where strati-fication increases significantly in summer, and/or when sea-surface temperatures are warm enough, such as in the Norwegian Coastal Current, S. ramosus appears (assemblage IV). When stratification starts only later in the year (May-June), O. centrocarpum s.l. develops, at the expense of the other species.
6. Conclusions
The dinocyst assemblages from 43 Barents Sea surface sediment samples show an excellent agreement with the overlying water masses. The most striking feature is the transition from O. centrocarpum-dominated to I. minutum-dominated assemblages as the sea-surface conditions evolve from Atlantic-like (warm and saline) to Arctic-like (cold, fresh with a seasonal sea-ice cover) characteristics.
While the clear distinction between Atlantic and more Arctic assemblages is not surprising due to the very con-trasting characteristics of these two environments, it is interesting to note that even assemblages within the Atlantic group vary (although in a subtle way) accord-ing to the overlying water masses. Here the sea-surface temperature does not seem to be the predominant factor controlling the distribution of the assemblages. Rather, relationships with productivity and stratification suggest that some species, such as cysts of P. dalei, might prefer stratified environments. Inversely, O. centrocarpum s.l. might be better adapted to unstable environments than other species. The timing of stratification and produc-tivity seems to be important as well, as some species are associated with early spring stratification and productiv-ity (cysts of P. dalei), whereas others are rather linked to late spring/summer productivity and stratification (S. ramosus), at least in the studied region.
Acknowledgements The authors would like to thank Jochen Knies, Nor-wegian Geological Survey (NGU, Trondheim, Norway) for access to the surface samples, and Frédérique Eynaud and Fabienne Marret for their helpful comments on the manuscript. This study was supported by the Natural Sciences and Engineering Research Council of Canada (NSERC), the Fonds québécois de la recherche sur la nature et les tech-nologies (FQRNT) and the Aurora mobility exchange programme, funded by the Research Council of Norway and the French Ministry of Education, Research and Technology
first axis, along with environmental parameters related to stratification (significant correlations with April and June stratification) and productivity (significant corre-lations with March and July productivity; Fig. 5b). Sites with high percentages of S. ramosus lie on the positive side of the second axis, next to late-year productivity parameters (significant correlation with October pro-ductivity).
Samples with high percentages of P. dalei thus seem to develop in water masses that are stratified early in the year. This can be seen through a visual examination of Fig. 4b, which shows that sites in which cysts of P. dalei are absent and O. centrocarpum s.l. reaches its highest abundance (top sites of assemblage II) are characterized by the lowest March and April N values, suggesting that a minimum early spring stratification is needed for P. dalei to develop. Inversely, O. centrocarpum might be bet-ter adapted to less stable conditions than other dinocyst species, which agrees with previous studies (e.g., Boess-enkool et al., 2001; Dale et al., 2002).
As seen from the RDA results (Fig. 5a), a subdivision of the sites with cysts of P. dalei can be made based on the abundance of S. ramosus, which seems to be related to the annual productivity cycle. Sites with lower percentages of S. ramosus, such as those of assemblage V, are associ-ated with the highest late winter/early spring (March to May) productivity values (Fig. 4c), and also with lower sea-surface temperatures (Fig. 4a). This could be due to the closer proximity of the Polar Front compared with the other Atlantic assemblages, and the occasional drift of sea-ice, allowing an early onset of water column stabil-ity but a quick depletion of the nutrient pool as well. This would bear some resemblance with assemblages with high proportions of cysts of P. dalei from the Iceland Sea, where winter and spring productivity is higher than in adjacent seas (Marret et al., 2004; Solignac et al., 2008).
S. ramosus peaks in assemblage IV, which is character-ized by the highest late spring, summer and October pro-ductivity values (Fig. 4c) and by the highest sea-surface temperatures (Fig. 4a). This is coherent with productivity in the Norwegian Coastal Current, which starts in April-May and remains high in summer and fall (Kögeler & Rey, 1999; Olsen et al., 2003; see section 2). N values of assemblage IV (Fig. 4b) are also coherent with the Nor-wegian Coastal Current zone being relatively stratified all year round (Loeng, 1991).
The distribution of the various Atlantic assemblages in the Barents Sea seems therefore to be controlled by a combination of stratification, productivity and sea-sur-face temperature, with the timing of the stratification and productivity being particularly important. It could be hypothesized that the assemblages found in the sur-face sediments reflect in some way the species succession throughout the productive seasons. When the water col-umn is stratified early enough in spring (March-April),

119NORWEGIAN JOURNAL OF GEOLOGY Distribution of recent dinocyst assemblages in the western Barents Sea
of Palaeobotany and Palynology 128, 35-53.National Oceanographic Data Centre (NODC) 2001: World ocean
atlas. http://www.nodc.noaa.gov/OC5/WOD01/pr_wod01.htmlNational Snow and Ice Data Center (NSIDC) 2003: Arctic and
Southern Ocean sea ice concentrations, http://nsidc.org/data/docs/noaa/g00799_arctic_southern_sea_ice/index.html, Boulder, Colo-rado
Olsen, A., Johannessen, T. & Rey, F. 2003: On the nature of the fac-tors that control spring bloom development at the entrance to the Barents Sea and their interannual variability. Sarsia 88, 379-393.
Radi, T., de Vernal, A. & Diessel, C.F.K. 2008: Dinocysts as proxy of primary productivity in mid-high latitudes of the northern hemis-phere. Marine Micropaleontology 68, 84-114.
Rochon, A., de Vernal, A., Turon, J.-L., Matthiessen, J. & Head, M.J. 1999: Distribution of recent dinoflagellate cysts in surface sedi-ments from the North Atlantic ocean and adjacent seas in relation to sea-surface parameters. American Association of Stratigraphic Palynologists Contribution Series 35, Houston, TX.
Schlitzer, R. 2008: Ocean Data View, http://odv.awi.de.Solignac, S., de Vernal, A. & Giraudeau, J. 2008: Comparison of cocco-
lith and dinocyst assemblages in the northern North Atlantic: How well do they relate with surface hydrography? Marine Micropaleon-tology 68, 115-135.
Strass, V.H. & Nöthig, E.-M. 1996: Seasonal shifts in ice edge phyto-plankton blooms in the Barents Sea related to the water column stability. Polar Biology 16, 409-422.
Ter Braak, C.J.F. 1986: Canonical correspondence analysis: a new eigenvector technique for multivariate direct gradient analysis. Ecology 67, 1167–1179.
Ter Braak, C.J.F. & Smilauer, P. 1998: CANOCO reference manual and user’s guide to CANOCO for Windows: Software for canonical community ordination (version 4). Centre for Biometry, Wagenin-gen.
Vinje, T. 2001: Anomalies and trends of sea-ice extent and atmosphe-ric circulation in the Nordic Seas during the period 1864-1998. Journal of Climate 14, 255-267.
Vink, A., Baumann, K.-H., Böckel, B., Esper, O., Kinkel, H., Volbers, A., Willems, H. & Zonneveld, K.A.F. 2003: Coccolithophorid and dinoflagellate synecology in the South and Equatorial Atlantic: Improving the paleoecological significance of phytoplanktonic microfossils. In: Wefer, G., Mulitza, S. & Ratmeyer, V. (eds): The South Atlantic in the Late Quaternary: Reconstruction of Material Budgets and Current Systems, 101-120. Springer-Verlag Berlin Hei-delberg New York Tokyo.
Voronina, E., Polyak, L., de Vernal, A. & Peyron, O. 2001: Holocene variations of sea-surface conditions in the southeastern Barents Sea, reconstructed from dinoflagellate cyst assemblages. Journal of Quaternary Science 16, 717-726.
References
Antoine, D., André, J.M. & Morel, A. 1996: Oceanic primary produc-tion. 2. Estimation at global scale from satellite (coastal zone colour scanner) chlorophyll. Global Biogeochemical Cycles 10, 57-69.
Boessenkool, K.P., van Gelder, M.-J., Brinkhuis, H. & Troelstra, S. 2001: Distribution of organic-walled dinoflagellate cysts in surface sediments from transects across the Polar Front offshore southeast Greenland. Journal of Quaternary Science 16, 661-666.
Dale, B., Dale, A.L., Janssen, J.H.F. 2002: Dinoflagellate cysts as envi-ronmental indicators in surface sediments from the Congo deep-sea fan and adjacent regions. Palaeogeography, Palaeoclimatology, Palaeoecology 185, 309-338.
de Vernal, A., Henry, M. & Bilodeau, G. 1999: Technique de prépara-tion et d’analyse en micropaléontologie. Les Cahiers du GEOTOP 3. Unpublished report, Université du Québec à Montréal.
de Vernal, A., Henry, M., Matthiessen, J., Mudie, P.J., Rochon, A., Boessenkool, K.P., Eynaud, F., Grøsfjeld, K., Guiot, J., Hamel, D., Harland, R., Head, M.J., Kunz-Pirrung, M., Levac, E., Loucheur, V., Peyron, O., Pospelova, V., Radi, T., Turon, J.-L. & Voronina, E. 2001: Dinoflagellate cyst assemblages as tracers of sea-surface con-ditions in the northern North Atlantic, Arctic and sub-Arctic seas: the new ‘n=677’ data base and its application for quantitative pala-eoceanographic reconstruction. Journal of Quaternary Science 16, 681-698.
de Vernal, A., Eynaud, F., Henry, M., Hillaire-Marcel, C., Londeix, L., Mangin, S., Matthiessen, J., Marret, F., Radi, T., Rochon, A., Solig-nac, S. & Turon, J.-L. 2005: Reconstruction of sea-surface condi-tions at middle to high latitudes of the Northern Hemisphere during the Last Glacial Maximum (LGM) based on dinoflagellate cyst assemblages. Quaternary Science Reviews 24, 897–924.
Divine, D.V. & Dick, C. 2006: Historical variability of sea ice edge position in the Nordic Seas. Journal of Geophysical Research 111, C01001, doi:10.1029/2004JC002851.
Engelsen, O., Hegseth, E.N., Hop, H., Hansen, E. & Falk-Petersen, S. 2002: Spatial variability of chlorophyll-a in the Marginal Ice Zone of the Barents Sea, with relations to sea ice and oceanographic con-ditions. Journal of Marine Systems 35, 79-97.
Gawarkiewicz, G. & Plueddemmann, A.J. 1995: Topography control of thermohaline frontal structure in the Barents Sea Polar Front on the south flank of Spitsbergen Bank. Journal of Geophysical Rese-arch 100, 4509-4524.
Gloersen, P., Campbell, W.J., Cavalieri, D.J., Comaso, J.C., Parkinson, C.L., Zwalley, H.J. 1992: Arctic and Antarctic sea ice, 1978-1987. Satellite Passes: Microwave Observations and Analysis. Scientific and Technical Program NASA, Washington.
Grøsfjeld, K., Knies, J., Harland, R. & Howe, J., this issue: Dinocysts as indicators of climate change in the Arctic. Results from seabed samples collected inshore and offshore Svalbard during 2001.
Harland, R. 1982: Recent dinoflagellate cyst assemblages from the southern Barents Sea. Palynology 6, 9-18.
Head, M.J., Harland, R. & Matthiessen, J. 2001: Cold marine indicators of the late Quaternary: the new dinoflagellate cyst genus Islandi-nium and related morphotypes. Journal of Quaternary Science 16, 621-636.
Knies, J., Jensen, H.K.B., Finne, T.E., Lepland, A. & Sæther, O.M. 2006: Sediment composition and heavy metal distribution in Barents Sea surface samples: Results from Institute of Marine Research 2003 and 2004 cruises. NGU Report 2006.067, Trondheim, Norway.
Kögeler, J. & Rey, F. 1999: Ocean colour and the spatial and seasonal distribution of phytoplankton in the Barents Sea. International Journal of Remote Sensing 20, 1303-1318.
Loeng, H. 1991: Features of the physical oceanographic conditions of the Barents Sea. Polar Research 10, 5-18.
Marret, F., Eiriksson, J., Knudsen, K.L., Turon, J.-L. & Scourse, J.D. 2004: Distribution of dinoflagellate cyst assemblages in surface sediments from the northern and western shelf of Iceland. Review