disconnection of network hubs and cognitive impairment after traumatic brain injury
TRANSCRIPT
Disconnection of network hubs and cognitiveimpairment after traumatic brain injury
Erik D. Fagerholm,* Peter J. Hellyer,* Gregory Scott, Robert Leech and David J. Sharp
*These authors contributed equally to this work.
Traumatic brain injury affects brain connectivity by producing traumatic axonal injury. This disrupts the function of large-scale
networks that support cognition. The best way to describe this relationship is unclear, but one elegant approach is to view
networks as graphs. Brain regions become nodes in the graph, and white matter tracts the connections. The overall effect of an
injury can then be estimated by calculating graph metrics of network structure and function. Here we test which graph metrics
best predict the presence of traumatic axonal injury, as well as which are most highly associated with cognitive impairment. A
comprehensive range of graph metrics was calculated from structural connectivity measures for 52 patients with traumatic brain
injury, 21 of whom had microbleed evidence of traumatic axonal injury, and 25 age-matched controls. White matter connections
between 165 grey matter brain regions were defined using tractography, and structural connectivity matrices calculated from
skeletonized diffusion tensor imaging data. This technique estimates injury at the centre of tract, but is insensitive to damage at
tract edges. Graph metrics were calculated from the resulting connectivity matrices and machine-learning techniques used to select
the metrics that best predicted the presence of traumatic brain injury. In addition, we used regularization and variable selection
via the elastic net to predict patient behaviour on tests of information processing speed, executive function and associative
memory. Support vector machines trained with graph metrics of white matter connectivity matrices from the microbleed group
were able to identify patients with a history of traumatic brain injury with 93.4% accuracy, a result robust to different ways of
sampling the data. Graph metrics were significantly associated with cognitive performance: information processing speed
(R2 = 0.64), executive function (R2 = 0.56) and associative memory (R2 = 0.25). These results were then replicated in a separate
group of patients without microbleeds. The most influential graph metrics were betweenness centrality and eigenvector centrality,
which provide measures of the extent to which a given brain region connects other regions in the network. Reductions in
betweenness centrality and eigenvector centrality were particularly evident within hub regions including the cingulate cortex
and caudate. Our results demonstrate that betweenness centrality and eigenvector centrality are reduced within network hubs,
due to the impact of traumatic axonal injury on network connections. The dominance of betweenness centrality and eigenvector
centrality suggests that cognitive impairment after traumatic brain injury results from the disconnection of network hubs by
traumatic axonal injury.
Computational, Cognitive, and Clinical Neuroimaging Laboratory, Division of Brain Sciences, Faculty of Medicine, ImperialCollege London, Hammersmith Hospital Campus, London, UK
Correspondence to: David J. Sharp,
Computational, Cognitive, and Clinical Neuroimaging Laboratory,
3rd Floor, Burlington Danes Building,
Hammersmith Hospital, Du Cane Road,
London, W12 0NN,
UK
E-mail: [email protected]
doi:10.1093/brain/awv075 BRAIN 2015: Page 1 of 14 | 1
Received July 24, 2014. Revised January 13, 2015. Accepted January 21, 2015.
� The Author (2015). Published by Oxford University Press on behalf of the Guarantors of Brain.
This is an Open Access article distributed under the terms of the Creative Commons Attribution Non-Commercial License (http://creativecommons.org/licenses/by-nc/4.0/), which permits
non-commercial re-use, distribution, and reproduction in any medium, provided the original work is properly cited. For commercial re-use, please contact [email protected]
Brain Advance Access published March 25, 2015by guest on M
arch 26, 2015D
ownloaded from
Keywords: traumatic brain injury; diffusion tensor imaging; betweenness centrality; network hubs; graph theory
Abbreviations: DTI = diffusion tensor imaging; SVM = support vector machine; TBI = traumatic brain injury; TBSS = tract-basedspatial statistics
IntroductionTraumatic brain injury (TBI) often results in traumatic
axonal injury, which damages long-distance white matter
connections (Johnson et al., 2013). Patterns of white matter
damage following TBI can be measured using diffusion
tensor imaging (DTI) (Basser et al., 1994; Kinnunen
et al., 2011; Bonnelle et al., 2012). Damage to specific
white matter tracts is sometimes associated with specific
cognitive problems following TBI (Kinnunen et al., 2011).
However, patterns of traumatic axonal injury are generally
widespread and highly variable across individuals (Sidaros
et al., 2008; Kinnunen et al., 2011; Hellyer et al., 2013).
This can produce complex effects on brain network func-
tion (Sharp et al., 2014). Therefore, understanding the ef-
fects of traumatic axonal injury on brain function and
behaviour is likely to require a detailed investigation of
the global effects of traumatic axonal injury on brain
connectivity.
One elegant approach to studying the structure and func-
tion of brain networks is to represent connections between
regions in a graphical form. A complex collection of graph
metrics has been developed to describe the connective prop-
erties of ‘nodes’ within such graphs (Rubinov and Sporns,
2010). Recently, these approaches have begun to be applied
to studies of the effects of TBI (Nakamura et al., 2009;
Caeyenberghs et al., 2014; Han et al., 2014). Hubs of in-
formation exchange within the brain are abnormal across a
range of disease states and may be particularly vulnerable
to the effects of traumatic axonal injury, as diffuse damage
to white matter tracts has a differentially large effect on
highly connected regions (Pandit et al., 2013; Crossley
et al., 2014). Betweenness centrality is a measure of the
fraction of shortest paths in a network that pass through
a given node (Fig. 1A–C). Hubs tend to have high values of
betweenness centrality, as they efficiently connect other
brain regions, and the betweenness centrality of hubs is
reduced when they lose connectivity with other parts of
the network. Eigenvector centrality is a self-referential
metric that assigns a high level of importance to nodes if
they are connected to other nodes that are themselves
highly connected. The eigenvector centrality of a node is
decreased if its neighbours lose connectivity with their local
hubs (Fig. 1D).
It is unclear which graph metrics are the most neurologic-
ally informative and how these relate to cognitive impair-
ment after TBI (Rubinov and Sporns, 2010). We have
previously studied the graph theoretical properties of
brain network activity after TBI using functional MRI,
showing reductions in betweenness centrality after TBI
within the posterior cingulate cortex—a major hub region
(Pandit et al., 2013). Here, we extend this work by com-
prehensively examining the graph theoretical properties of
network structure after TBI, with the integrity of network
connections defined using DTI.
We used a method of estimating traumatic axonal injury
after TBI that does not involve tractography in patients,
and so is robust to the artefacts in tracts produced in pa-
tients with low fractional anisotropy (Squarcina et al.,
2012). We tested the hypotheses that changes in graph
metrics following traumatic axonal injury would: (i) accur-
ately differentiate patients with a previous history of TBI
from healthy age-matched controls; and (ii) predict the
extent of clinically significant cognitive impairment com-
monly seen following TBI. We began by mapping the loca-
tion of traumatic axonal injury in a similar way to previous
work (Kinnunen et al., 2011), an important initial step in
interpreting the subsequent graph theoretical results. We
hypothesized that traumatic axonal injury would impact
most severely on the structural connections of hubs, defined
in this study as brain regions showing high betweenness
centrality. Therefore, we also expected to see graph metrics
that describe the degree to which brain regions act as hubs
as being the most discriminatory in patient/control classifi-
cation, and as being the most predictive of neuropsycho-
logical outcome.
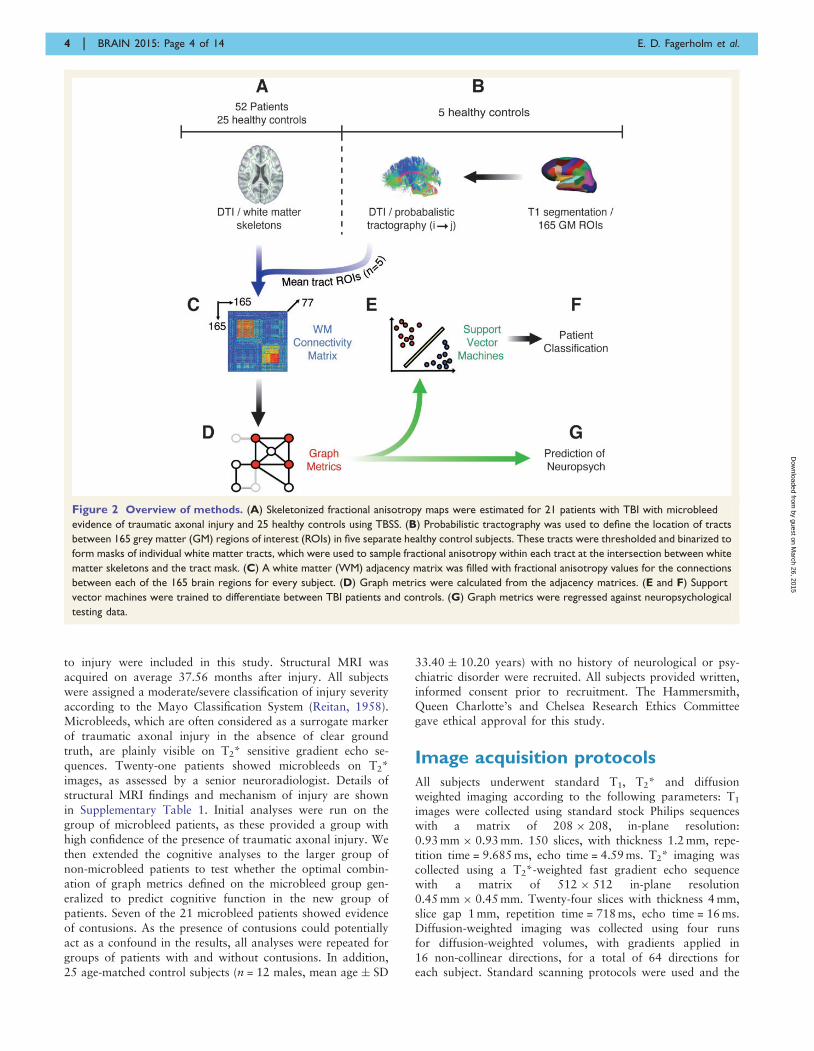
Materials and methodsA high-level overview of our methods is provided in Fig. 2.Probabilistic tractography of DTI, performed in an independ-ent group of five healthy control subjects, was initially used todefine an atlas of masks covering the location of �11 000tracts between 165 cortical and subcortical grey matter regions(Fig. 2B). This tract atlas was applied to fractional anisotropymaps preprocessed with tract-based spatial statistics (TBSS) fora separate set of 25 healthy controls and 52 patients with TBI,21 of whom were assessed as having likely traumatic axonalinjury on the basis of the presence of microbleeds on T2*imaging (Fig. 2A) (Smith et al., 2006). In this way, an individ-ual 165-region white matter connectivity matrix was producedfor each subject (Fig. 2C). Graph metrics were calculated fromthese connectivity matrices using the Brain ConnectivityToolbox (Rubinov and Sporns, 2010). The metrics were thenused as: (i) training variables in support vector machines(SVMs) (Fig. 2E) for patient/control differentiation (Fig. 2F);and (ii) predictor variables for regression analysis of neuropsy-chological outcome following TBI (Fig. 2G).
Subjects
Fifty-two TBI patients (n = 35 males, mean age � SD36.90 � 11.75 years) with no present or previous drug or al-cohol abuse and no neurological or psychiatric disorders prior
2 | BRAIN 2015: Page 2 of 14 E. D. Fagerholm et al.
by guest on March 26, 2015
Dow
nloaded from
Betweenness centralityof red node
Hubdisconnections
1
Betweenness centrality
Nodisconnections
2Peripheral
disconnections
3
1
2
3
151 0.1
0.4219
1514B
etw
eenn
ess
cent
ralit
y
~~
A
B
0.9
~~
~~
Number of shortest paths connectingwhite nodes that pass through red node
Total number of shortest pathsconnecting white nodes
C
R
D
Hubdisconnections
1
Eigenvector centrality
Nodisconnections
2Peripheral
disconnections
3
No effect
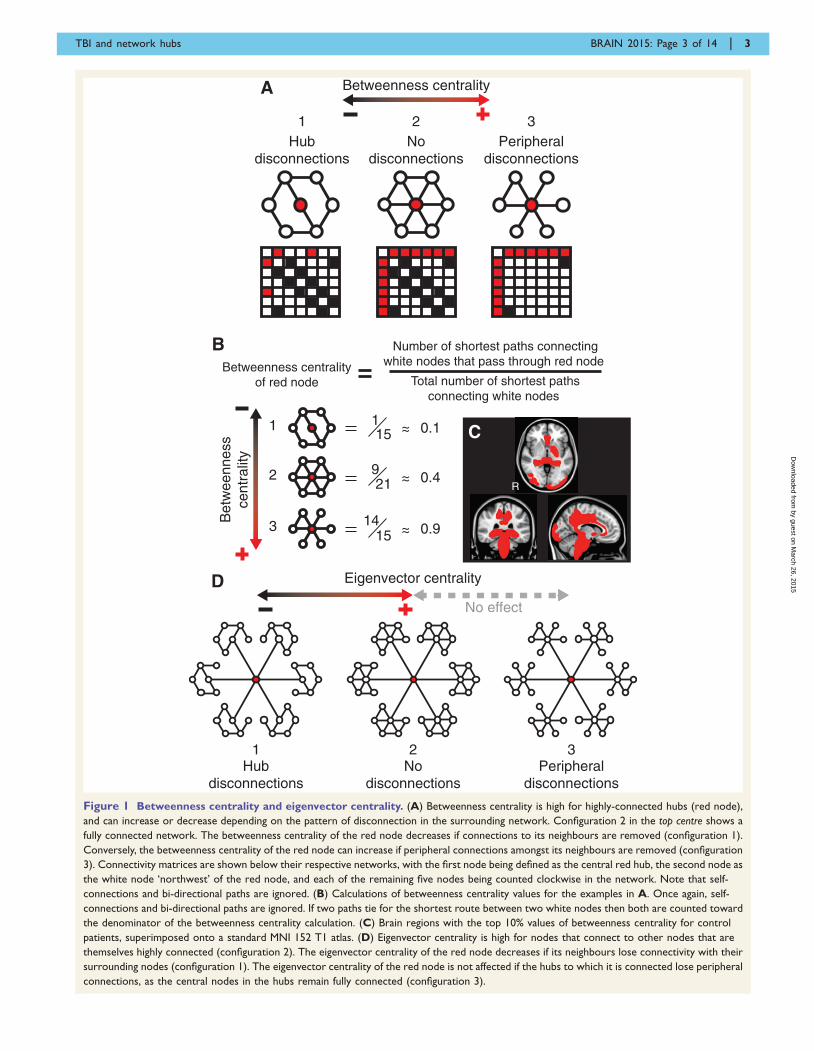
Figure 1 Betweenness centrality and eigenvector centrality. (A) Betweenness centrality is high for highly-connected hubs (red node),
and can increase or decrease depending on the pattern of disconnection in the surrounding network. Configuration 2 in the top centre shows a
fully connected network. The betweenness centrality of the red node decreases if connections to its neighbours are removed (configuration 1).
Conversely, the betweenness centrality of the red node can increase if peripheral connections amongst its neighbours are removed (configuration
3). Connectivity matrices are shown below their respective networks, with the first node being defined as the central red hub, the second node as
the white node ‘northwest’ of the red node, and each of the remaining five nodes being counted clockwise in the network. Note that self-
connections and bi-directional paths are ignored. (B) Calculations of betweenness centrality values for the examples in A. Once again, self-
connections and bi-directional paths are ignored. If two paths tie for the shortest route between two white nodes then both are counted toward
the denominator of the betweenness centrality calculation. (C) Brain regions with the top 10% values of betweenness centrality for control
patients, superimposed onto a standard MNI 152 T1 atlas. (D) Eigenvector centrality is high for nodes that connect to other nodes that are
themselves highly connected (configuration 2). The eigenvector centrality of the red node decreases if its neighbours lose connectivity with their
surrounding nodes (configuration 1). The eigenvector centrality of the red node is not affected if the hubs to which it is connected lose peripheral
connections, as the central nodes in the hubs remain fully connected (configuration 3).
TBI and network hubs BRAIN 2015: Page 3 of 14 | 3
by guest on March 26, 2015
Dow
nloaded from
to injury were included in this study. Structural MRI wasacquired on average 37.56 months after injury. All subjectswere assigned a moderate/severe classification of injury severityaccording to the Mayo Classification System (Reitan, 1958).Microbleeds, which are often considered as a surrogate markerof traumatic axonal injury in the absence of clear groundtruth, are plainly visible on T2* sensitive gradient echo se-quences. Twenty-one patients showed microbleeds on T2*images, as assessed by a senior neuroradiologist. Details ofstructural MRI findings and mechanism of injury are shownin Supplementary Table 1. Initial analyses were run on thegroup of microbleed patients, as these provided a group withhigh confidence of the presence of traumatic axonal injury. Wethen extended the cognitive analyses to the larger group ofnon-microbleed patients to test whether the optimal combin-ation of graph metrics defined on the microbleed group gen-eralized to predict cognitive function in the new group ofpatients. Seven of the 21 microbleed patients showed evidenceof contusions. As the presence of contusions could potentiallyact as a confound in the results, all analyses were repeated forgroups of patients with and without contusions. In addition,25 age-matched control subjects (n = 12 males, mean age � SD
33.40 � 10.20 years) with no history of neurological or psy-chiatric disorder were recruited. All subjects provided written,informed consent prior to recruitment. The Hammersmith,Queen Charlotte’s and Chelsea Research Ethics Committeegave ethical approval for this study.
Image acquisition protocols
All subjects underwent standard T1, T2* and diffusionweighted imaging according to the following parameters: T1
images were collected using standard stock Philips sequenceswith a matrix of 208 � 208, in-plane resolution:0.93 mm � 0.93 mm. 150 slices, with thickness 1.2 mm, repe-tition time = 9.685 ms, echo time = 4.59 ms. T2* imaging wascollected using a T2*-weighted fast gradient echo sequencewith a matrix of 512 � 512 in-plane resolution0.45 mm � 0.45 mm. Twenty-four slices with thickness 4 mm,slice gap 1 mm, repetition time = 718 ms, echo time = 16 ms.Diffusion-weighted imaging was collected using four runsfor diffusion-weighted volumes, with gradients applied in16 non-collinear directions, for a total of 64 directions foreach subject. Standard scanning protocols were used and the
Figure 2 Overview of methods. (A) Skeletonized fractional anisotropy maps were estimated for 21 patients with TBI with microbleed
evidence of traumatic axonal injury and 25 healthy controls using TBSS. (B) Probabilistic tractography was used to define the location of tracts
between 165 grey matter (GM) regions of interest (ROIs) in five separate healthy control subjects. These tracts were thresholded and binarized to
form masks of individual white matter tracts, which were used to sample fractional anisotropy within each tract at the intersection between white
matter skeletons and the tract mask. (C) A white matter (WM) adjacency matrix was filled with fractional anisotropy values for the connections
between each of the 165 brain regions for every subject. (D) Graph metrics were calculated from the adjacency matrices. (E and F) Support
vector machines were trained to differentiate between TBI patients and controls. (G) Graph metrics were regressed against neuropsychological
testing data.
4 | BRAIN 2015: Page 4 of 14 E. D. Fagerholm et al.
by guest on March 26, 2015
Dow
nloaded from
following settings applied for all scans: b-value = 1000, fourimages with no diffusion weighting (b = 0 s/mm2) were inter-leaved between blocks of 16 diffusion directions, 73 contigu-ous slices, slice thickness = 2 mm, matrix 128 � 128 (voxelsize = 1.75 � 1.75 � 2 mm3) and field view 224 mm. All ima-ging data were obtained with a Philips Intera 3.0 T MRI scan-ner with an 8-channel array head coil. Sensitivity encoding(SENSE) was used with an under-sampling factor of 2.
Neuropsychological assessment
Patients and a subset of healthy controls underwent a detailedbattery of standardized neuropsychological tests either on thesame day or within a few days of their MRI scanning. In thisstudy we focused our analysis on three measures of cognitivefunction: (i) information processing speed using accurate re-sponse median reaction times in a visual choice reactiontask; (ii) executive function using the Trail Making Test alter-nating switch-cost index; and (iii) associative memory usingthe immediate recall measure of the People Test of the Doorsand People Test (Reitan, 1958; Baddeley et al., 1994; Hellyeret al., 2013). We selected these particular tests because they aresensitive to cognitive impairment following TBI and becausewe have previously studied them extensively in relation to TBI(Kinnunen et al., 2011; Hellyer et al., 2013).
Probabilistic tractography
Abnormalities in DTI measures produced by TBI can bias theestimation of tractography in patient groups (Squarcina et al.,2012). Therefore, to generate an unbiased atlas of tracts, weperformed probabilistic tractography between 165 cortical andsubcortical grey matter regions in an independent group of fivehealthy control subjects (n = 2 males, mean age � SD31.00 � 12.06 years) (Fig. 2B). The same T1 and DTI se-quences as reported for the main study were acquired on thesame scanner. All subjects gave informed consent.
Briefly, structural T1 images were segmented into 165 cor-tical and subcortical grey matter masks according to theDesikan-Kilaney grey matter atlas, using Freesurfer (Desikanet al., 2006; Greve and Fischl, 2009). Grey matter masks weretransformed to native diffusion space by application of anaffine registration between T1 and diffusion space, calculatedusing boundary-based registration from Freesurfer (Greve andFischl, 2009). Each of these masks was used as a seed andtarget region for probabilistic tractography performed, usinga two-crossing fibre model in Probtrack (Behrens et al., 2003).For each mask/target pair, 5000 streamlines were randomlyseeded from each voxel within the seed mask. Only streamlinesthat reached any voxel within the target mask were retained.This process was iterated over each seed/target pair. Where noseed streamline reached any target voxel, probability distribu-tions were discarded, resulting in an atlas for each subjectcontaining a total of 11 604 tracts (5476 interhemispheric,6128 within hemispheres). For each subject, each of thesetracts was projected into MNI-152 space using FLIRT andaveraged across the group, generating a mean distributionfor the location of each tract across the five control subjects.To create masks from which fractional anisotropy could besampled in the patient/control experimental groups, thesetract distributions were thresholded and binarized such thatthe top 5% strongest voxels within the distribution were
retained, providing a conservative estimate of the location ofthe tracts within MNI-152 space.
Estimation of individual connectivitymatrices
Diffusion imaging for patients and age-matched controls werepreprocessed according to standard protocols using the FMRIBDiffusion Toolbox (FDT) (Behrens et al., 2003). As a first step,a tensor model was fitted to the raw diffusion data (using theFDT) to create fractional anisotropy images, which were thenbrain-extracted using the brain extraction tool (BET) (Smith,2002). The FMRIB non-linear registration tool was then usedin aligning the fractional anisotropy data from all subjects intoa common space using a b-spline representation of the regis-tration warp field (Rueckert et al., 1999; Andersson et al.,2007). Next, the thinned mean fractional anisotropy imageswere used to create a mean skeleton, representing the centresof all tracts common to the group. The tract atlas generated byprobabilistic tractography was then projected through individ-ual skeletons in MNI-152 standard space and the mean frac-tional anisotropy at the intersection of the tract and maskcalculated, allowing for the estimation of individual connect-ivity matrices (Squarcina et al., 2012).
We explored the effects of varying network sparsity bythresholding the fractional anisotropy matrices generated forpatients and controls at different levels. Matrices were thresh-olded in terms of standard deviations of fractional anisotropyvalues below the mean of the control group. A range of stand-ard deviation multiples was used, from 0.5 to 5.0 in steps of0.5 (i.e. decreasing penalization with increasing threshold).Connections from each individual’s connectivity matrix thatwere smaller than the given threshold were set to 0. The in-clusion of the weakest fractional anisotropy values in connect-ivity matrices may sometimes result in overfitting due toincreased noise levels (Li et al., 2013). As such, we ran ouranalyses for a range of different thresholds, in order to dem-onstrate that the results remained consistent once the weakerfractional anisotropy values were eliminated from the data.
Furthermore, we tested the robustness of results using differ-ent initial parcellation schemes. These were created by combin-ing pairs of adjacent regions to generate a scheme withapproximately half the number of regions. Average fractionalanisotropy values for the tracts from the new combined re-gions were then re-estimated. As all regions have more thanone neighbour in the original parcellation scheme, the adjacentregions used to create the new averaged scheme were selectedat random. This process was performed twice with differentrandomly selected adjacent regions. This resulted in two newsets of connectivity matrices (sizes 91 � 91 and 92 � 92) forall subjects.
Voxelwise diffusion tensor imaginganalysis
Voxelwise analysis of the fractional anisotropy was carried outusing TBSS in the FMRIB Software Library Diffusion Toolkit(Smith et al., 2004). Briefly, the steps involved in TBSS pre-processing were as follows: (i) all subjects’ fractional anisot-ropy data were aligned into a common space using the FMRIBnon-linear registration tool, which uses a b-spline
TBI and network hubs BRAIN 2015: Page 5 of 14 | 5
by guest on March 26, 2015
Dow
nloaded from
representation of the registration warp field; (ii) the groupmean registered fractional anisotropy image was thinned tocreate a mean fractional anisotropy skeleton that representsthe centres of all tracts common to the group; and (iii) eachsubject’s aligned fractional anisotropy data were then projectedonto this skeleton. Non-parametric permutation-based statis-tics were used to explore differences in fractional anisotropybetween patients and controls, using FMRIB’s randomize func-tion with 5000 unique permutations (Smith, 2002). Multiplecomparison correction was performed using threshold-freecluster enhancement and thresholded at P5 0.05 for presen-tation. A detailed description of the voxelwise analysis of thisgroup of patients has previously been presented (Hellyer et al.,2013).
Graph theoretical analysis
A total of 24 graph metrics (Fig. 2D) were calculated from thewhite matter connectivity matrices (Fig. 2C). Only graph met-rics applicable to undirected connectivity matrices were used,as fractional anisotropy does not provide information aboutthe directionality of water diffusion. It is unknown, a priori,whether binary or weighted metrics are more useful for accur-ate classification. Weighted connections reflect more informa-tion about the range of fractional anisotropy values, whereasbinary metrics make fewer assumptions about the relationshipbetween fractional anisotropy and graph topology. Given thisuncertainty, both binary and weighted versions of applicablemetrics were included in the analyses.
Summaries of all graph metrics used in this study are pro-vided in Supplementary Table 2 and more in-depth descrip-tions of the metrics in the Supplementary material. In brief,the simplest graph metric is ‘degree’, defined as the number ofneighbours connected to a given node (Gottlich et al., 2013;Jan et al., 2013; Vives-Gilabert et al., 2013). ‘Strength’ is clo-sely related to degree, but with the weightings (here meanfractional anisotropy values) of the connections taken into ac-count (Hwang et al., 2013; Goni et al., 2014; Xue et al.,2014). A number of graph metrics build upon the concept of‘path length’. If nodes A and B are separated by one othernode C, then the path length between A and B is equal to 2(regardless of physical distance), as a total of two edges mustbe traversed. ‘Betweenness centrality’ is a metric that dependsupon the deconstruction of a graph into path lengths and isdefined as the ratio of the number of shortest paths passingthrough a given node to the total number of shortest pathsbetween all other nodes in the network. Another measure ofnetwork hubs that has gained considerable attention in recentyears with the rise of the page-rank algorithms of internetsearch engines is ‘eigenvector centrality’. This is a self-referen-tial metric that assigns a high level of importance to a node ifit is connected to other nodes that are themselves important.
Support vector machine analysis:identification of TBI
We investigated which graph metrics produced the most ac-curate classification of patients and controls. This was per-formed using SVMs implemented in the LIBSVMclassification library (Platt, 1999; Chang and Lin, 2011). Weused a linear kernel, as this allows for interpretation of the
weight vector (i.e. the relative importance of each feature inthe prediction), which was subsequently used to rank the im-portance of the metrics in identifying TBI. SVMs were initiallytrained using all 24 (network average) graph metrics, asderived from white matter connectivity matrices. To identifythe most informative metrics, after each round of SVM train-ing, the least important metric (in terms of its weight vector)was removed and a new SVM trained with the remaining met-rics. This process was repeated until only a single metric re-mained. The accuracy of the classifier was recorded at eachstepwise removal. Data from healthy controls and patientswith microbleeds were used to train the SVMs. We used re-peated random subsampling validation, with a random selec-tion of n subjects removed from both the patient and controlgroup for each machine, repeated 1000 times for each n from1 to 10. We tested a range of training/validation split sizesbecause leave-one-out cross-validation methods, although lowin bias, are sometimes associated with high degrees of variance(Cawley, 2006).
We then investigated which brain regions were the mostimportant for the identification of TBI. This was achieved bycalculating the vector output (i.e. 165 values per subject) of themost influential metric in the combination of metrics with thehighest classification accuracy. This resulted in one value of thegraph metric being assigned to each of the 165 brain regionsacross all subjects. We then performed a t-test across brainregions to assess which of the 165 brain regions were signifi-cantly different (in terms of their graph metric outputs) be-tween patients and controls. Each t-test was performed at asignificance level of 5%. Multiple comparison correction wasperformed via the false discovery rate (FDR) method, at asignificance level of 5%.
Prediction of cognitive outcome
Next, we explored whether graph metrics could be used topredict cognitive outcome following TBI. We used variableselection via the elastic net at various degrees of regularizationto associate linearly independent graph metrics with each ofthe three behavioural measures considered, using theMATLAB Statistics Toolbox (MathWorks; Zou and Hastie,2005). Model accuracy was assessed by the explained varianceand statistical significance of the model with the minimummean squared error. We then investigated the influence of in-dividual brain regions in predicting clinical outcome. This wasachieved by using variable selection and regularization via theelastic net for the vector output of the most influential metric(i.e. with the highest regression coefficient) against neuropsy-chological testing data. We used an elastic net fit with � = 0.5and 10-fold cross-validation and display results for a range ofthe Lambda shrinkage parameter. Further details on the elasticnet are provided in the Supplementary material. This allowedus to track the effect that increasing penalization has on therelative importance of graph metrics in predicting cognitiveoutcome. The exclusion of a certain graph metric at onevalue of Lambda does not necessarily mean that it is redun-dant across all models, as a change in the shrinkage parameterLambda may result in it reappearing in a different combin-ation of metrics. This is advantageous, as the exclusion of agraph metric at one value of Lambda does not mean it is ‘lost’going forward, as would be the case with stepwise regressiontechniques. Rather, we were able to treat each new level of
6 | BRAIN 2015: Page 6 of 14 E. D. Fagerholm et al.
by guest on March 26, 2015
Dow
nloaded from
shrinkage in a ‘blind’ manner and assess the relative import-ance of the non-redundant metrics within each new model.The cross-validation technique allows us to track the meansquared error of the elastic net fitting across the exploredrange of Lambda. We can thereby arrive at an optimal valueof Lambda, for which the associated combination of graphmetrics achieves minimum mean squared error. Regressionwas performed first for the subset of healthy controls and pa-tients with microbleeds for which neuropsychological testingdata were available (choice reaction task: n = 28, executivefunction: n = 29, associative memory: n = 29), and then separ-ately for the subset of controls and the larger group of patientswithout microbleeds for which neuropsychological testing datawere available (choice reaction task: n = 40, executive function:n = 50, associative memory: n = 52).
Definition of network hubs
Next we wished to explicitly test the hypothesis that the brainregions identified in the analyses function as network hubs. Assuch, we identified the regions with the highest values ofbetweenness centrality in the healthy control group. Networkhubs were defined as being in the top 10% of betweennesscentrality values for all of the regions investigated.
Results
Evidence of traumatic axonal injury inthe patient group
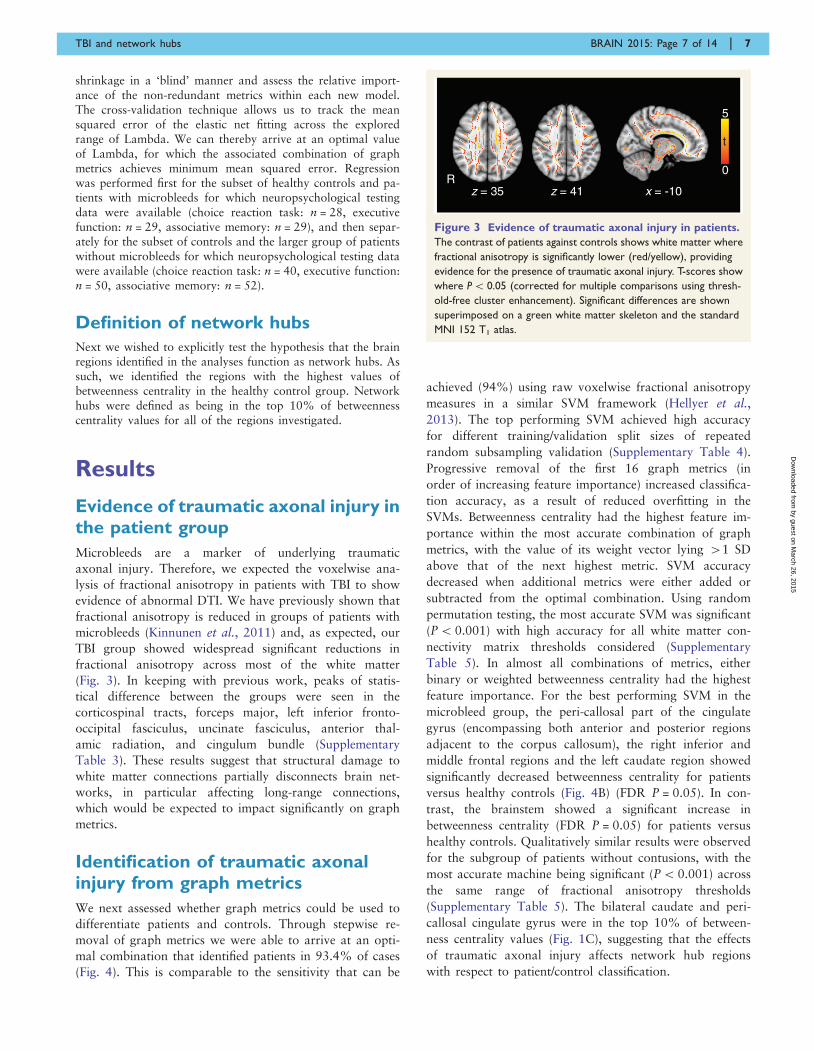
Microbleeds are a marker of underlying traumatic
axonal injury. Therefore, we expected the voxelwise ana-
lysis of fractional anisotropy in patients with TBI to show
evidence of abnormal DTI. We have previously shown that
fractional anisotropy is reduced in groups of patients with
microbleeds (Kinnunen et al., 2011) and, as expected, our
TBI group showed widespread significant reductions in
fractional anisotropy across most of the white matter
(Fig. 3). In keeping with previous work, peaks of statis-
tical difference between the groups were seen in the
corticospinal tracts, forceps major, left inferior fronto-
occipital fasciculus, uncinate fasciculus, anterior thal-
amic radiation, and cingulum bundle (Supplementary
Table 3). These results suggest that structural damage to
white matter connections partially disconnects brain net-
works, in particular affecting long-range connections,
which would be expected to impact significantly on graph
metrics.
Identification of traumatic axonalinjury from graph metrics
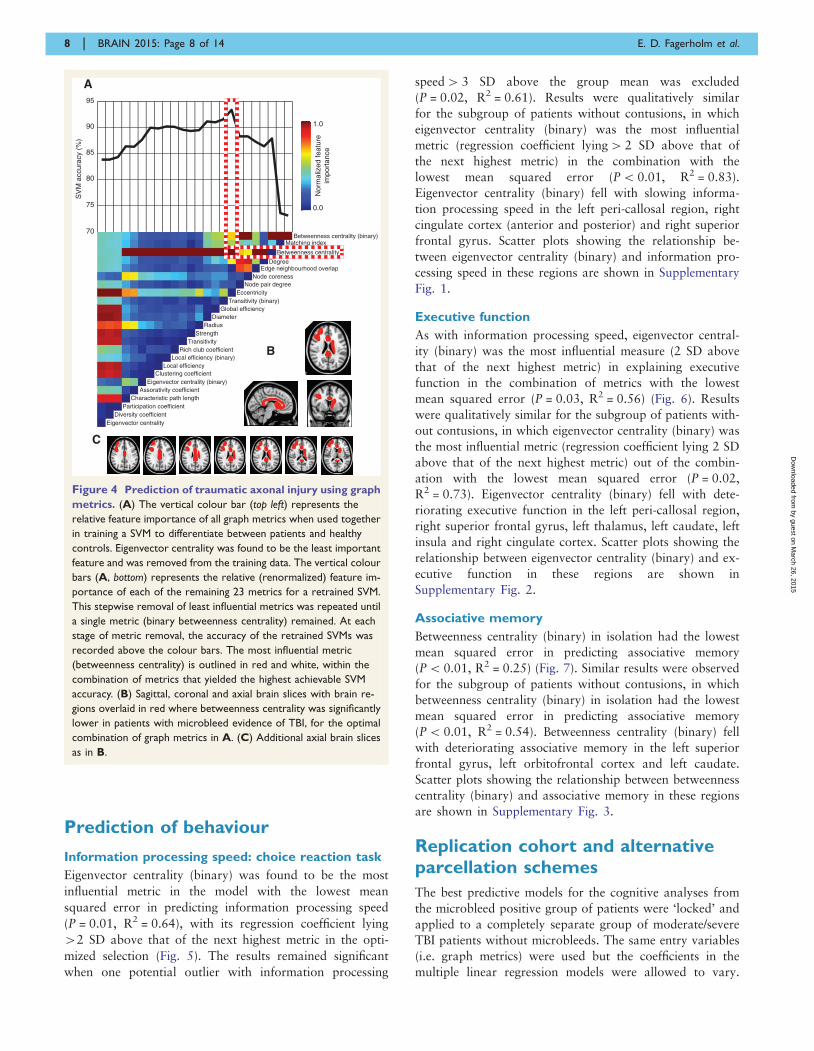
We next assessed whether graph metrics could be used to
differentiate patients and controls. Through stepwise re-
moval of graph metrics we were able to arrive at an opti-
mal combination that identified patients in 93.4% of cases
(Fig. 4). This is comparable to the sensitivity that can be
achieved (94%) using raw voxelwise fractional anisotropy
measures in a similar SVM framework (Hellyer et al.,
2013). The top performing SVM achieved high accuracy
for different training/validation split sizes of repeated
random subsampling validation (Supplementary Table 4).
Progressive removal of the first 16 graph metrics (in
order of increasing feature importance) increased classifica-
tion accuracy, as a result of reduced overfitting in the
SVMs. Betweenness centrality had the highest feature im-
portance within the most accurate combination of graph
metrics, with the value of its weight vector lying 41 SD
above that of the next highest metric. SVM accuracy
decreased when additional metrics were either added or
subtracted from the optimal combination. Using random
permutation testing, the most accurate SVM was significant
(P5 0.001) with high accuracy for all white matter con-
nectivity matrix thresholds considered (Supplementary
Table 5). In almost all combinations of metrics, either
binary or weighted betweenness centrality had the highest
feature importance. For the best performing SVM in the
microbleed group, the peri-callosal part of the cingulate
gyrus (encompassing both anterior and posterior regions
adjacent to the corpus callosum), the right inferior and
middle frontal regions and the left caudate region showed
significantly decreased betweenness centrality for patients
versus healthy controls (Fig. 4B) (FDR P = 0.05). In con-
trast, the brainstem showed a significant increase in
betweenness centrality (FDR P = 0.05) for patients versus
healthy controls. Qualitatively similar results were observed
for the subgroup of patients without contusions, with the
most accurate machine being significant (P5 0.001) across
the same range of fractional anisotropy thresholds
(Supplementary Table 5). The bilateral caudate and peri-
callosal cingulate gyrus were in the top 10% of between-
ness centrality values (Fig. 1C), suggesting that the effects
of traumatic axonal injury affects network hub regions
with respect to patient/control classification.
5
0
z = 41z = 35 x = -10
t
R
Figure 3 Evidence of traumatic axonal injury in patients.
The contrast of patients against controls shows white matter where
fractional anisotropy is significantly lower (red/yellow), providing
evidence for the presence of traumatic axonal injury. T-scores show
where P5 0.05 (corrected for multiple comparisons using thresh-
old-free cluster enhancement). Significant differences are shown
superimposed on a green white matter skeleton and the standard
MNI 152 T1 atlas.
TBI and network hubs BRAIN 2015: Page 7 of 14 | 7
by guest on March 26, 2015
Dow
nloaded from
Prediction of behaviour
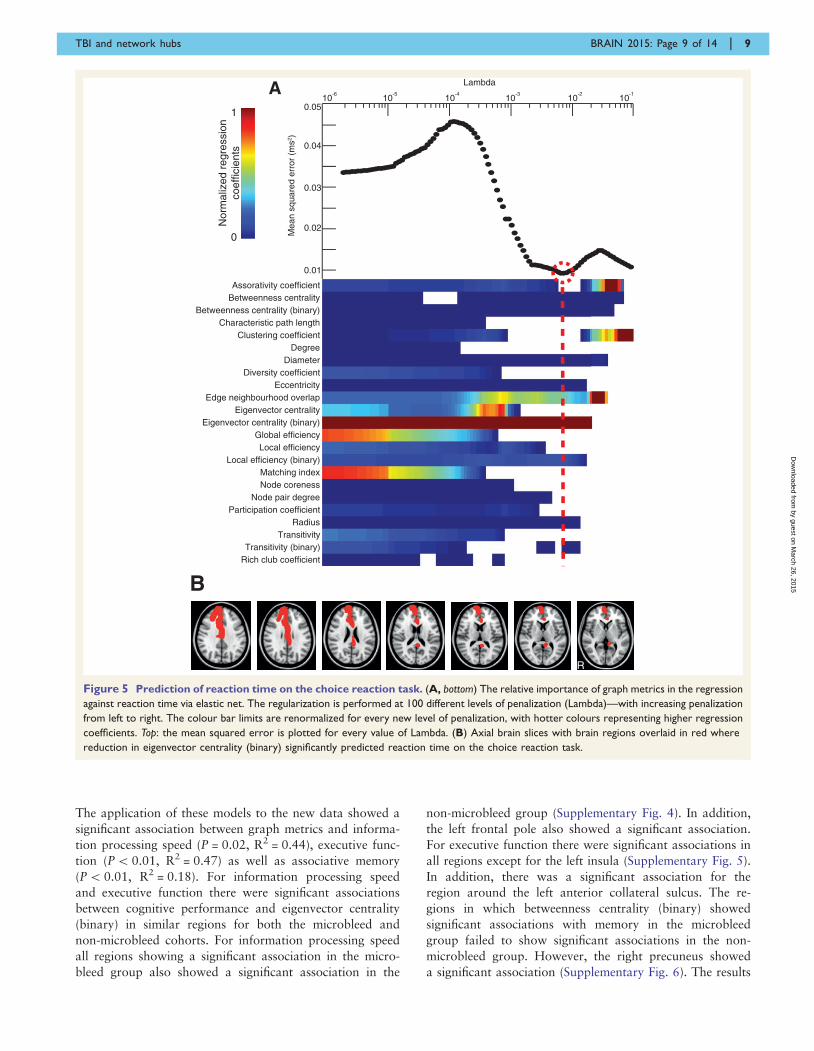
Information processing speed: choice reaction task
Eigenvector centrality (binary) was found to be the most
influential metric in the model with the lowest mean
squared error in predicting information processing speed
(P = 0.01, R2 = 0.64), with its regression coefficient lying
42 SD above that of the next highest metric in the opti-
mized selection (Fig. 5). The results remained significant
when one potential outlier with information processing
speed4 3 SD above the group mean was excluded
(P = 0.02, R2 = 0.61). Results were qualitatively similar
for the subgroup of patients without contusions, in which
eigenvector centrality (binary) was the most influential
metric (regression coefficient lying4 2 SD above that of
the next highest metric) in the combination with the
lowest mean squared error (P5 0.01, R2 = 0.83).
Eigenvector centrality (binary) fell with slowing informa-
tion processing speed in the left peri-callosal region, right
cingulate cortex (anterior and posterior) and right superior
frontal gyrus. Scatter plots showing the relationship be-
tween eigenvector centrality (binary) and information pro-
cessing speed in these regions are shown in Supplementary
Fig. 1.
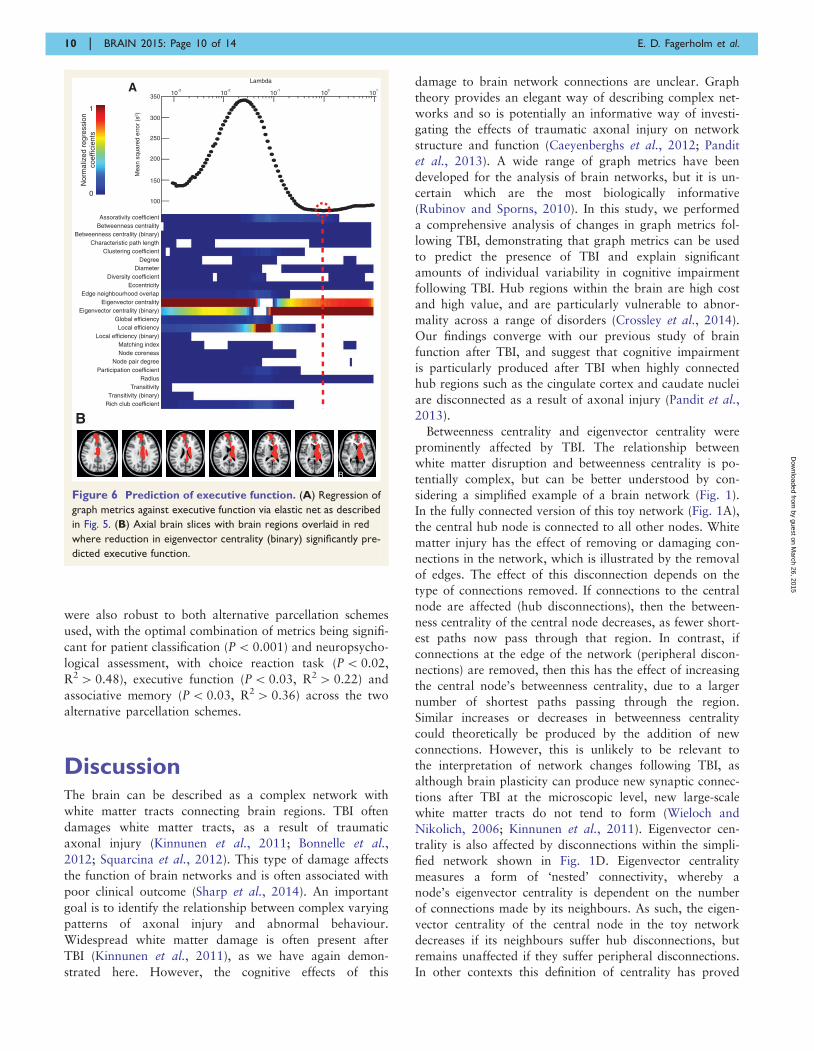
Executive function
As with information processing speed, eigenvector central-
ity (binary) was the most influential measure (2 SD above
that of the next highest metric) in explaining executive
function in the combination of metrics with the lowest
mean squared error (P = 0.03, R2 = 0.56) (Fig. 6). Results
were qualitatively similar for the subgroup of patients with-
out contusions, in which eigenvector centrality (binary) was
the most influential metric (regression coefficient lying 2 SD
above that of the next highest metric) out of the combin-
ation with the lowest mean squared error (P = 0.02,
R2 = 0.73). Eigenvector centrality (binary) fell with dete-
riorating executive function in the left peri-callosal region,
right superior frontal gyrus, left thalamus, left caudate, left
insula and right cingulate cortex. Scatter plots showing the
relationship between eigenvector centrality (binary) and ex-
ecutive function in these regions are shown in
Supplementary Fig. 2.
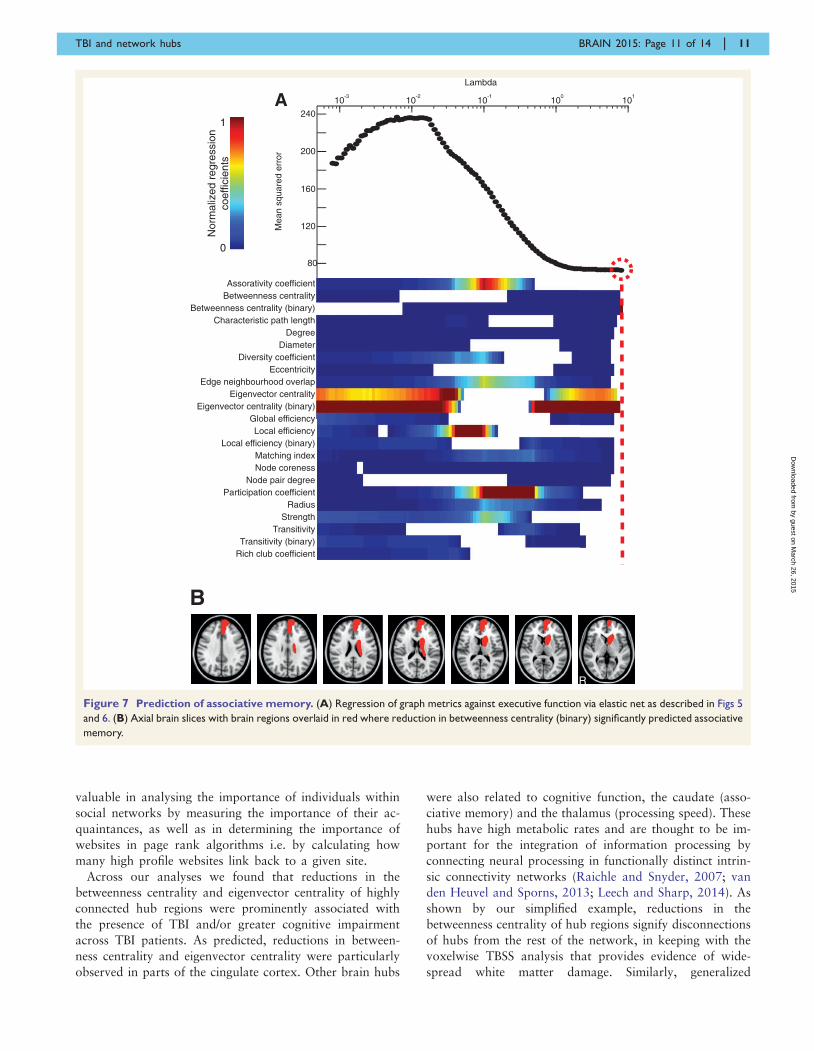
Associative memory
Betweenness centrality (binary) in isolation had the lowest
mean squared error in predicting associative memory
(P5 0.01, R2 = 0.25) (Fig. 7). Similar results were observed
for the subgroup of patients without contusions, in which
betweenness centrality (binary) in isolation had the lowest
mean squared error in predicting associative memory
(P5 0.01, R2 = 0.54). Betweenness centrality (binary) fell
with deteriorating associative memory in the left superior
frontal gyrus, left orbitofrontal cortex and left caudate.
Scatter plots showing the relationship between betweenness
centrality (binary) and associative memory in these regions
are shown in Supplementary Fig. 3.
Replication cohort and alternativeparcellation schemes
The best predictive models for the cognitive analyses from
the microbleed positive group of patients were ‘locked’ and
applied to a completely separate group of moderate/severe
TBI patients without microbleeds. The same entry variables
(i.e. graph metrics) were used but the coefficients in the
multiple linear regression models were allowed to vary.
AS
VM
acc
urac
y (%
)
70
95
Nor
mal
ized
feat
ure
impo
rtan
ce
1.0
0.0
Betweenness centrality (binary)Matching index
Betweenness centrality
DegreeEdge neighbourhood overlap
Node corenessNode pair degree
EccentricityTransitivity (binary)
Global efficiencyDiameter
RadiusStrength
TransitivityRich club coefficient
Local efficiency (binary)Local efficiency
Clustering coefficientEigenvector centrality (binary)
Assorativity coefficientCharacteristic path length
Participation coefficientDiversity coefficient
Eigenvector centrality
75
80
85
90
C
R
B
Figure 4 Prediction of traumatic axonal injury using graph
metrics. (A) The vertical colour bar (top left) represents the
relative feature importance of all graph metrics when used together
in training a SVM to differentiate between patients and healthy
controls. Eigenvector centrality was found to be the least important
feature and was removed from the training data. The vertical colour
bars (A, bottom) represents the relative (renormalized) feature im-
portance of each of the remaining 23 metrics for a retrained SVM.
This stepwise removal of least influential metrics was repeated until
a single metric (binary betweenness centrality) remained. At each
stage of metric removal, the accuracy of the retrained SVMs was
recorded above the colour bars. The most influential metric
(betweenness centrality) is outlined in red and white, within the
combination of metrics that yielded the highest achievable SVM
accuracy. (B) Sagittal, coronal and axial brain slices with brain re-
gions overlaid in red where betweenness centrality was significantly
lower in patients with microbleed evidence of TBI, for the optimal
combination of graph metrics in A. (C) Additional axial brain slices
as in B.
8 | BRAIN 2015: Page 8 of 14 E. D. Fagerholm et al.
by guest on March 26, 2015
Dow
nloaded from
The application of these models to the new data showed a
significant association between graph metrics and informa-
tion processing speed (P = 0.02, R2 = 0.44), executive func-
tion (P5 0.01, R2 = 0.47) as well as associative memory
(P50.01, R2 = 0.18). For information processing speed
and executive function there were significant associations
between cognitive performance and eigenvector centrality
(binary) in similar regions for both the microbleed and
non-microbleed cohorts. For information processing speed
all regions showing a significant association in the micro-
bleed group also showed a significant association in the
non-microbleed group (Supplementary Fig. 4). In addition,
the left frontal pole also showed a significant association.
For executive function there were significant associations in
all regions except for the left insula (Supplementary Fig. 5).
In addition, there was a significant association for the
region around the left anterior collateral sulcus. The re-
gions in which betweenness centrality (binary) showed
significant associations with memory in the microbleed
group failed to show significant associations in the non-
microbleed group. However, the right precuneus showed
a significant association (Supplementary Fig. 6). The results
A
Nor
mal
ized
reg
ress
ion
coef
ficie
nts
Betweenness centrality (binary)
Matching index
Betweenness centrality
Degree
Edge neighbourhood overlap
Node corenessNode pair degree
Eccentricity
Transitivity (binary)
Global efficiency
Diameter
RadiusTransitivity
Rich club coefficient
Local efficiency (binary)Local efficiency
Clustering coefficient
Eigenvector centrality (binary)
Assorativity coefficient
Characteristic path length
Participation coefficient
Diversity coefficient
Eigenvector centrality
0
1
0.01
0.02
0.03
0.04
Mea
n sq
uare
d er
ror
(ms2 )
10-6
10-5
10-4
10-3
10-2
10-1
Lambda
0.05
B
R
Figure 5 Prediction of reaction time on the choice reaction task. (A, bottom) The relative importance of graph metrics in the regression
against reaction time via elastic net. The regularization is performed at 100 different levels of penalization (Lambda)—with increasing penalization
from left to right. The colour bar limits are renormalized for every new level of penalization, with hotter colours representing higher regression
coefficients. Top: the mean squared error is plotted for every value of Lambda. (B) Axial brain slices with brain regions overlaid in red where
reduction in eigenvector centrality (binary) significantly predicted reaction time on the choice reaction task.
TBI and network hubs BRAIN 2015: Page 9 of 14 | 9
by guest on March 26, 2015
Dow
nloaded from
were also robust to both alternative parcellation schemes
used, with the optimal combination of metrics being signifi-
cant for patient classification (P5 0.001) and neuropsycho-
logical assessment, with choice reaction task (P5 0.02,
R24 0.48), executive function (P5 0.03, R24 0.22) and
associative memory (P5 0.03, R24 0.36) across the two
alternative parcellation schemes.
DiscussionThe brain can be described as a complex network with
white matter tracts connecting brain regions. TBI often
damages white matter tracts, as a result of traumatic
axonal injury (Kinnunen et al., 2011; Bonnelle et al.,
2012; Squarcina et al., 2012). This type of damage affects
the function of brain networks and is often associated with
poor clinical outcome (Sharp et al., 2014). An important
goal is to identify the relationship between complex varying
patterns of axonal injury and abnormal behaviour.
Widespread white matter damage is often present after
TBI (Kinnunen et al., 2011), as we have again demon-
strated here. However, the cognitive effects of this
damage to brain network connections are unclear. Graph
theory provides an elegant way of describing complex net-
works and so is potentially an informative way of investi-
gating the effects of traumatic axonal injury on network
structure and function (Caeyenberghs et al., 2012; Pandit
et al., 2013). A wide range of graph metrics have been
developed for the analysis of brain networks, but it is un-
certain which are the most biologically informative
(Rubinov and Sporns, 2010). In this study, we performed
a comprehensive analysis of changes in graph metrics fol-
lowing TBI, demonstrating that graph metrics can be used
to predict the presence of TBI and explain significant
amounts of individual variability in cognitive impairment
following TBI. Hub regions within the brain are high cost
and high value, and are particularly vulnerable to abnor-
mality across a range of disorders (Crossley et al., 2014).
Our findings converge with our previous study of brain
function after TBI, and suggest that cognitive impairment
is particularly produced after TBI when highly connected
hub regions such as the cingulate cortex and caudate nuclei
are disconnected as a result of axonal injury (Pandit et al.,
2013).
Betweenness centrality and eigenvector centrality were
prominently affected by TBI. The relationship between
white matter disruption and betweenness centrality is po-
tentially complex, but can be better understood by con-
sidering a simplified example of a brain network (Fig. 1).
In the fully connected version of this toy network (Fig. 1A),
the central hub node is connected to all other nodes. White
matter injury has the effect of removing or damaging con-
nections in the network, which is illustrated by the removal
of edges. The effect of this disconnection depends on the
type of connections removed. If connections to the central
node are affected (hub disconnections), then the between-
ness centrality of the central node decreases, as fewer short-
est paths now pass through that region. In contrast, if
connections at the edge of the network (peripheral discon-
nections) are removed, then this has the effect of increasing
the central node’s betweenness centrality, due to a larger
number of shortest paths passing through the region.
Similar increases or decreases in betweenness centrality
could theoretically be produced by the addition of new
connections. However, this is unlikely to be relevant to
the interpretation of network changes following TBI, as
although brain plasticity can produce new synaptic connec-
tions after TBI at the microscopic level, new large-scale
white matter tracts do not tend to form (Wieloch and
Nikolich, 2006; Kinnunen et al., 2011). Eigenvector cen-
trality is also affected by disconnections within the simpli-
fied network shown in Fig. 1D. Eigenvector centrality
measures a form of ‘nested’ connectivity, whereby a
node’s eigenvector centrality is dependent on the number
of connections made by its neighbours. As such, the eigen-
vector centrality of the central node in the toy network
decreases if its neighbours suffer hub disconnections, but
remains unaffected if they suffer peripheral disconnections.
In other contexts this definition of centrality has proved
Nor
mal
ized
reg
ress
ion
coef
ficie
nts
0
1
A
Betweenness centrality (binary)
Matching index
Betweenness centrality
Degree
Edge neighbourhood overlap
Node corenessNode pair degree
Eccentricity
Transitivity (binary)
Global efficiency
Diameter
RadiusTransitivity
Rich club coefficient
Local efficiency (binary)Local efficiency
Clustering coefficient
Eigenvector centrality (binary)
Assorativity coefficient
Characteristic path length
Participation coefficient
Diversity coefficient
Eigenvector centrality
100
Mea
n sq
uare
d er
ror
(s2 )
150
200
250
300
350 10-3
10-2
10-1
100
101
Lambda
B
R
Figure 6 Prediction of executive function. (A) Regression of
graph metrics against executive function via elastic net as described
in Fig. 5. (B) Axial brain slices with brain regions overlaid in red
where reduction in eigenvector centrality (binary) significantly pre-
dicted executive function.
10 | BRAIN 2015: Page 10 of 14 E. D. Fagerholm et al.
by guest on March 26, 2015
Dow
nloaded from
valuable in analysing the importance of individuals within
social networks by measuring the importance of their ac-
quaintances, as well as in determining the importance of
websites in page rank algorithms i.e. by calculating how
many high profile websites link back to a given site.
Across our analyses we found that reductions in the
betweenness centrality and eigenvector centrality of highly
connected hub regions were prominently associated with
the presence of TBI and/or greater cognitive impairment
across TBI patients. As predicted, reductions in between-
ness centrality and eigenvector centrality were particularly
observed in parts of the cingulate cortex. Other brain hubs
were also related to cognitive function, the caudate (asso-
ciative memory) and the thalamus (processing speed). These
hubs have high metabolic rates and are thought to be im-
portant for the integration of information processing by
connecting neural processing in functionally distinct intrin-
sic connectivity networks (Raichle and Snyder, 2007; van
den Heuvel and Sporns, 2013; Leech and Sharp, 2014). As
shown by our simplified example, reductions in the
betweenness centrality of hub regions signify disconnections
of hubs from the rest of the network, in keeping with the
voxelwise TBSS analysis that provides evidence of wide-
spread white matter damage. Similarly, generalized
Nor
mal
ized
reg
ress
ion
coef
ficie
nts
0
1
Mea
n sq
uare
d er
ror
A
Betweenness centrality (binary)
Matching index
Betweenness centrality
Degree
Edge neighbourhood overlap
Node corenessNode pair degree
Eccentricity
Transitivity (binary)
Global efficiency
Diameter
Radius
Transitivity
Rich club coefficient
Local efficiency (binary)Local efficiency
Eigenvector centrality (binary)
Assorativity coefficient
Characteristic path length
Participation coefficient
Diversity coefficient
Eigenvector centrality
80
10-3
10-2
10-1
100
101
Lambda
120
160
200
240
Strength
B
R
Figure 7 Prediction of associative memory. (A) Regression of graph metrics against executive function via elastic net as described in Figs 5
and 6. (B) Axial brain slices with brain regions overlaid in red where reduction in betweenness centrality (binary) significantly predicted associative
memory.
TBI and network hubs BRAIN 2015: Page 11 of 14 | 11
by guest on March 26, 2015
Dow
nloaded from
disconnection of hubs would reduce eigenvector centrality.
As network hubs are a central part of a high-capacity back-
bone for global brain communication, damage to their con-
nections would have the effect of reducing the ability of the
brain to efficiently transmit information, by increasing the
number of connections it takes for one region to commu-
nicate with another (van den Heuvel et al., 2012).
Therefore, our results suggest that the relative disconnec-
tion of network hubs by traumatic axonal injury is an im-
portant mechanism by which long-term cognitive
impairment in the domains of information processing,
memory and information processing speed are produced.
The brainstem showed an increase in betweenness cen-
trality in following TBI. This is a highly connected region
that participates in a large number of shortest paths be-
tween other brain regions, and therefore should be
viewed as a network hub (Fig. 1C). The brainstem’s
betweenness centrality may increase as a result of traumatic
axonal injury on other nodes which are situated more cen-
trally in the graph. If more of the shortest paths between
other regions are damaged as a result of traumatic axonal
injury, it is possible that a larger number of shortest paths
may pass through the brainstem post injury. This effect
might be accentuated by the eccentric position of the brain-
stem in the graph, as illustrated by the effect of peripheral
disconnection in our simplified model (Fig. 1A and B).
We have previously shown, in an overlapping group of
subjects, that the betweenness centrality of the posterior
cingulate cortex is reduced following TBI in graphs gener-
ated from functional MRI data (Pandit et al., 2013). In this
study, connectivity was assessed between regions involved
in cognitive control, rather than across the whole brain. A
similar graph theoretical analysis to the current study
showed evidence for a shift away from a small-world archi-
tecture, with reduced network efficiency and increased path
lengths, associated with a marked reduction in betweenness
centrality within the posterior cingulate cortex. In the cur-
rent work, our results provide convergent evidence from
measures of structural connectivity for the importance of
betweenness centrality as a measure of network dysfunction
after TBI, and also highlight the importance of disruption
to the cingulate cortex region in the long-term effects of
TBI. Structural and functional connectivity are highly
related, with regions showing dense white matter connec-
tions being likely to exhibit highly synchronized brain ac-
tivity (high functional connectivity) (van den Heuvel et al.,
2009). Therefore, changes in betweenness centrality seen in
functional brain networks are likely to reflect the under-
lying structural disconnection of the same regions produced
by traumatic axonal injury.
Our results are broadly in keeping with another recent
study that used graph theoretical analysis of DTI data to
demonstrate cognitively important network abnormalities
after TBI (Caeyenberghs et al., 2014). Their results also
suggested that TBI showed network features in keeping
with a less efficient capacity to integrate information
across the brain. We extend this work by using machine
learning techniques to identify the most biologically import-
ant graph metrics in a data-driven way. We also explicitly
explore the relationship between changes in graph metrics,
and the extent to which affected regions are indeed func-
tioning as network hubs. Finally, we use a distinct way of
assessing underlying fractional anisotropy, which is less
prone to artefacts than other existing methods.
The graph theoretical results we explored are dependent
on the accuracy of the underlying DTI analyses. A particu-
larly important factor is how accurately the amount of
damage in each white matter tract can be estimated in
the TBI patients. Graph analysis can be calculated from
connectivity matrices derived from tractography performed
in individual patients. This approach has the potential limi-
tation that tractography may fail or produce spurious re-
sults when tracts are damaged, as low fractional anisotropy
values generate significantly increased uncertainty for the
tractography algorithms (Hua et al., 2008; Squarcina
et al., 2012). To avoid this confound, we used a method
for estimating tract structure that does not involve tracto-
graphy performed in the patient group, but instead involves
the generation of tract templates in an independent group
of healthy controls, which may then be used as a mask to
sample fractional anisotropy in the patient population
(Squarcina et al., 2012). This approach depends on accur-
ate registration between standard and patient space, which
we achieve using non-linear registration algorithms that we
have previously found to be highly accurate when applied
to DTI data (Bonnelle et al., 2012).
A potential limitation in our study is the presence of partial
volume effects, which are present if the registration of indi-
vidual images into standard space is not sufficiently accurate.
We deal with this issue by using TBSS to skeletonize the
white matter tracts, thereby minimizing the chance of partial
volume effects, due to the fact that only the centres of the
tracts are being included in the analysis. However, by deal-
ing with one potential limitation in this way, we produce a
second. Axonal injury can occur at the boundaries between
grey and white matter, and this will not be identified by our
TBSS analysis. This could lead to an overestimation of tract
integrity, as areas of damage are not identified. It will be
important for further work to investigate this possibility
using alternative methods. A further issue is the presence
of cortical contusions in some of the patients. To rule out
any related confound, we conducted our main analyses both
with and without contusion patients, resulting in qualita-
tively similar results, showing the consistent importance of
both betweenness centrality and eigenvector centrality in the
context of this work. It is also possible that the machine
learning techniques produce a solution that is only relevant
to the group of subjects used in the training phase. However,
the results were robust to varying the number of subjects left
out in the cross-validation, making this less likely to be a
major issue. We also locked the best performing combin-
ation of graph metrics in the cognitive analyses and applied
them to a completely new set of patients. A significant rela-
tionship remained for all neuropsychological testing data,
12 | BRAIN 2015: Page 12 of 14 E. D. Fagerholm et al.
by guest on March 26, 2015
Dow
nloaded from
suggesting that the findings were generalizable. The weighted
and binary forms of betweenness centrality and eigenvector
centrality are distinct measures and were important in the
prediction of TBI and the association with neuropsycho-
logical variables, respectively. However, the distinction be-
tween the binary and weighted versions of these metrics
cannot be easily interpreted in terms of any biological sig-
nificance in this study, due to the high degree of correlation
between the two metrics (P5 0.001).
In conclusion, our study demonstrates the importance of
hub-based metrics such as betweenness centrality and eigen-
vector centrality as measure of network disconnection after
TBI. Hub regions within the brain, which are important for
integrating information processing, show reduced between-
ness centrality, which in turn is related to the degree of dis-
connection of the hubs from the rest of the brain as a result
of traumatic axonal injury. Combinations of graph metrics
were able to explain large amounts of individual variability
in all three cognitive domains studied, suggesting that graph
metrics describing structural brain connectivity could prove
to be a useful description of the underlying cause for cogni-
tive impairments produced by TBI.
AcknowledgementsWe thank the subjects who took part in this study.
FundingThe work has been supported by an MRC (UK) Clinician
Scientist Fellowship (D.J.S.) and a National Institute of
Health Research Professorship - RP-011-048 (D.J.S.). The
research was also supported by the National Institute for
Health Research (NIHR) Imperial Biomedical Research
Centre. The views expressed are those of the authors and
not necessarily those of the NHS, the NIHR or the
Department of Health. This work is also supported by an
MRC DTA studentship (E.D.F.).
Supplementary materialSupplementary material is available at Brain online.
ReferencesAndersson JL, Jenkinson M, Smith S. Non-linear registration, aka
Spatial normalisation FMRIB technical report TR07JA2. Oxford,
UK: FMRIB Analysis Group of the University of Oxford; 2007.
Baddeley AD, Emslie H, Nimmo-Smith I. Doors and people: a test of
visual and verbal recall and recognition. Bury St Edmunds, Suffolk,
UK: Thames Valley Test Company; 1994.
Basser PJ, Mattiello J, LeBihan D. MR diffusion tensor spectroscopy
and imaging. Biophys J 1994; 66: 259–67.
Behrens TE, Woolrich MW, Jenkinson M, Johansen-Berg H,
Nunes RG, Clare S, et al. Characterization and propagation of
uncertainty in diffusion-weighted MR imaging. Magn Reson Med
2003; 50: 1077–88.
Bonnelle V, Ham TE, Leech R, Kinnunen KM, Mehta MA,
Greenwood RJ, et al. Salience network integrity predicts default
mode network function after traumatic brain injury. Proc Natl
Acad Sci USA 2012; 109: 4690–5.
Caeyenberghs K, Leemans A, Heitger MH, Leunissen I, Dhollander T,
Sunaert S, et al. Graph analysis of functional brain networks for
cognitive control of action in traumatic brain injury. Brain 2012;
135 (Pt 4): 1293–307.
Caeyenberghs K, Leemans A, Leunissen I, Gooijers J, Michiels K,
Sunaert S, et al. Altered structural networks and executive deficits
in traumatic brain injury patients. Brain Struct Funct 2014; 219:
193–209.
Cawley GC. Leave-one-out cross-validation based model selection
criteria for weighted LS-SVMs. Proceedings of the International
Joint Conference on Neural Networks (IJCNN-2006), New York,
USA. 2006. p. 1661–8.
Chang C-C, Lin C-J. LIBSVM: a library for support vector machines.
ACM Trans Instell Syst Technol 2011; 2: 27.
Crossley NA, Mechelli A, Scott J, Carletti F, Fox PT, McGuire P, et al.
The hubs of the human connectome are generally
implicated in the anatomy of brain disorders. Brain 2014; 137
(Pt 8): 2382–95.
Desikan RS, Segonne F, Fischl B, Quinn BT, Dickerson BC, Blacker D,
et al. An automated labeling system for subdividing the human cere-
bral cortex on MRI scans into gyral based regions of interest.
Neuroimage 2006; 31: 968–80.
Goni J, van den Heuvel MP, Avena-Koenigsberger A, de
Mendizabal NV, Betzel RF, Griffa A, et al. Resting-brain functional
connectivity predicted by analytic measures of network communica-
tion. Proc Natl Acad Sci USA 2014; 111: 833–8.
Gottlich M, Munte TF, Heldmann M, Kasten M, Hagenah J,
Kramer UM. Altered resting state brain networks in Parkinson’s
Disease. PLoS One 2013; 8: e77336.
Greve DN, Fischl B. Accurate and robust brain image alignment using
boundary-based registration. Neuroimage 2009; 48: 63–72.
Han K, Mac Donald CL, Johnson AM, Barnes Y, Wierzechowski L,
Zonies D, et al. Disrupted modular organization of resting-state
cortical functional connectivity in U.S. military personnel following
concussive ‘mild’ blast-related traumatic brain injury. Neuroimage
2014; 84: 76–96.Hellyer PJ, Leech R, Ham TE, Bonnelle V, Sharp DJ. Individual pre-
diction of white matter injury following traumatic brain injury. Ann
Neurol 2013; 73: 489–99.
Hua K, Zhang J, Wakana S, Jiang H, Li X, Reich DS, et al. Tract
probability maps in stereotaxic spaces: analyses of white matter
anatomy and tract-specific quantification. Neuroimage 2008; 39:
336–47.Hwang K, Hallquist MN, Luna B. The development of hub architec-
ture in the human functional brain network. Cereb Cortex 2013; 23:
2380–93.Jan H, Chao Y-P, Cho K-H, Kuo L-W. Investigating the effects of
streamline-based fiber tractography on matrix scaling in brain con-
nective network. Engineering in Medicine and Biology Society
(EMBC), 2013 35th Annual International Conference of the IEEE;
2013. p. 523–6.
Johnson VE, Stewart W, Smith DH. Axonal pathology in traumatic
brain injury. Exp Neurol 2013; 246: 35–43.Kinnunen KM, Greenwood R, Powell JH, Leech R, Hawkins PC,
Bonnelle V, et al. White matter damage and cognitive impairment
after traumatic brain injury. Brain 2011; 134 (Pt 2): 449–63.Leech R, Sharp DJ. The role of the posterior cingulate cortex in cog-
nition and disease. Brain 2014; 137 (Pt 1): 12–32.
Li Y, Qin Y, Chen X, Li W. Exploring the functional brain network of
Alzheimer’s disease: based on the computational experiment. PLoS
One 2013; 8: e73186.
TBI and network hubs BRAIN 2015: Page 13 of 14 | 13
by guest on March 26, 2015
Dow
nloaded from
Nakamura T, Hillary FG, Biswal BB. Resting network plasticity fol-lowing brain injury. PLoS One 2009; 4: e8220.
Pandit AS, Expert P, Lambiotte R, Bonnelle V, Leech R,
Turkheimer FE, et al. Traumatic brain injury impairs small-world
topology. Neurology 2013; 80: 1826–33.Platt JC. Probabilistic outputs for support vector machines and com-
parisons to regularized likelihood methods. Advances in large
margin classifiers. PA, USA: Citeseer; 1999.
Raichle ME, Snyder AZ. A default mode of brain function: a briefhistory of an evolving idea. Neuroimage 2007; 37: 1083–90discus-
sion 97–9.
Reitan RM. Validity of the Trail Making Test as an indicator of or-ganic brain damage. Percept Mot Skills 1958; 8: 271–6.
Rubinov M, Sporns O. Complex network measures of brain connect-
ivity: uses and interpretations. Neuroimage 2010; 52: 1059–69.
Rueckert D, Sonoda LI, Hayes C, Hill DL, Leach MO, Hawkes DJ.Nonrigid registration using free-form deformations: application to
breast MR images. IEEE Trans Med Imaging 1999; 18: 712–21.
Sharp DJ, Scott G, Leech R. Network dysfunction after traumatic
brain injury. Nat Rev Neurol 2014; 10: 156–66.Sidaros A, Engberg AW, Sidaros K, Liptrot MG, Herning M,
Petersen P, et al. Diffusion tensor imaging during recovery from
severe traumatic brain injury and relation to clinical outcome: a
longitudinal study. Brain 2008; 131 (Pt 2): 559–72.Smith SM. Fast robust automated brain extraction. Hum Brain Mapp
2002; 17: 143–55.
Smith SM, Jenkinson M, Johansen-Berg H, Rueckert D, Nichols TE,Mackay CE, et al. Tract-based spatial statistics: voxelwise ana-
lysis of multi-subject diffusion data. Neuroimage 2006; 31:
1487–505.
Smith SM, Jenkinson M, Woolrich MW, Beckmann CF, Behrens TE,
Johansen-Berg H, et al. Advances in functional and structural MR
image analysis and implementation as FSL. Neuroimage 2004; ; 23
((Suppl 1): S208–19.
Squarcina L, Bertoldo A, Ham TE, Heckemann R, Sharp DJ. A robust
method for investigating thalamic white matter tracts after traumatic
brain injury. Neuroimage 2012; 63: 779–88.
van den Heuvel MP, Kahn RS, Goni J, Sporns O. High-cost, high-
capacity backbone for global brain communication. Proc Natl Acad
Sci USA 2012; 109: 11372–7.
van den Heuvel MP, Mandl RC, Kahn RS, Hulshoff Pol HE.
Functionally linked resting-state networks reflect the underlying
structural connectivity architecture of the human brain. Hum
Brain Mapp 2009; 30: 3127–41.
van den Heuvel MP, Sporns O. An anatomical substrate for integra-
tion among functional networks in human cortex. J Neurosci 2013;
33: 14489–500.
Vives-Gilabert Y, Abdulkadir A, Kaller CP, Mader W, Wolf RC,
Schelter B, et al. Detection of preclinical neural dysfunction from
functional connectivity graphs derived from task fMRI. An example
from degeneration. Psychiatry Res 2013; 214: 322–30.
Wieloch T, Nikolich K. Mechanisms of neural plasticity following
brain injury. Curr Opin Neurobiol 2006; 16: 258–64.
Xue K, Luo C, Zhang D, Yang T, Li J, Gong D, et al. Diffusion tensor
tractography reveals disrupted structural connectivity in childhood
absence epilepsy. Epilepsy Res 2014; 108: 125–38.
Zou H, Hastie T. Regularization and variable selection via the elastic
net. J R Stat Soc B 2005; 67: 301–20.
14 | BRAIN 2015: Page 14 of 14 E. D. Fagerholm et al.
by guest on March 26, 2015
Dow
nloaded from