disclaimer - the city of san antonio
TRANSCRIPT
Disclaimer
This Comprehensive Annual Financial Report (CAFR) of the City of San Antonio contained on the City’s web pages is historical information as of September 30, 2016. The information in the CAFR has not been updated for developments subsequent to the date of the independent auditor’s report.
The City has taken reasonable security measures to protect the integrity of its website and information posted thereon. However, no website can fully ensure against infiltration. Absent any unauthorized act that deletes, edits, or somehow manipulates the words or data, this publication represents the presentation of the City of San Antonio’s CAFR dated September 30, 2016.
This online document has been formatted for two-sided printing.
City of San Antonio, Texas
FY2016
CITY OF SAN ANTONIO, TEXAS
Comprehensive Annual Financial Report & Other Reports Year-Ended September 30, 2016
Incorporated December 14, 1837 Charter Adopted October 2, 1951
Council – Manager Form of Government
Prepared by: DEPARTMENT OF FINANCE
Ben Gorzell Jr., CPA Chief Financial Officer Troy Elliott, CPA Deputy Chief Financial Officer Melanie Seale, CPA Assistant Director Victoria Roeder Controller Elizabeth Drouillard, CPA Financial Reporting Manager
Kimberly Nuñez Financial Reporting Manager Jay Blackwell General Ledger Manager
Cassie Arebalos Financial Reporting
Augustine Fannah Jason Herrera Joseph Kobilka, CPA Mary Lara Theresa LittlefieldMark Ramirez Haley Smith Patrice Wallace Wendi Woods
Carlos Beechner General Ledger
Janet Cruz Denise Fuller Gerry Gavia Joe Vasquez With Assistance From:
Margaret Villegas, Assistant Director Financial Services
Cappi Arriola, Financial Management Administrator Tina Murillo, Tax Assessor Administrator Alejandro Tijerina, Financial Manager Mike Martinez, Collections Manager
Veronica Carrillo, Fiscal Operations Administrator Accounting Services
Juanita Mack, CPA, Disbursement & Receivable Administrator Marilyn Canales, Billing & Accounts Receivable Manager Kay Grant, Accounts Payable Manager Joni James, Payroll Administrator Department Fiscal Administrators
Russell Huff, CPA, Assistant Director Public Utilities
Jeff Pullin, Public Utilities Administrator
Member of the Government Finance Officers Association of the United States and Canada

INTRODUCTORY SECTION
INTRODUCTORYSECTION
CITY OF SAN ANTONIO, TEXAS
Comprehensive Annual Financial Report & Other Reports Table of Contents Year-Ended September 30, 2016
TITLE PAGE
INTRODUCTORY SECTION
Table of Contents Letter of Transmittal _______________________________________________________________________ i-xvi Certificate of Achievement for Excellence in Financial Reporting ____________________________________ xvii City of San Antonio Mayor and City Council _____________________________________________________ xviii Organizational Chart _______________________________________________________________________ xix
FINANCIAL SECTION
Independent Auditor’s Report Management’s Discussion and Analysis (Required Supplementary Information) (Unaudited) ____________ 1 Basic Financial Statements: Government-wide Financial Statements: Statement of Net Position ______________________________________________________________ 12 Statement of Activities ________________________________________________________________ 13 Fund Financial Statements: Governmental Funds Financial Statements: Balance Sheet _____________________________________________________________________ 14 Reconciliation of the Balance Sheet to the Statement of Net Position – Governmental Funds _______ 15 Statement of Revenues, Expenditures, and Changes in Fund Balances _________________________ 16 Reconciliation of the Statement of Revenues, Expenditures, and Changes in Fund Balances of Governmental Funds to the Statement of Activities ___________________________________ 17 Proprietary Funds Financial Statements: Statement of Net Position ____________________________________________________________ 18 Statement of Revenues, Expenses, and Changes in Net Position ______________________________ 19 Statement of Cash Flows _____________________________________________________________ 20 Fiduciary Funds Financial Statements: Statement of Fiduciary Net Position/Balance Sheet ________________________________________ 21 Statement of Changes in Fiduciary Net Position ___________________________________________ 22 Discretely Presented Component Units Financial Statements: Statement of Net Position ____________________________________________________________ 23 Statement of Activities ______________________________________________________________ 24 Notes to Financial Statements ____________________________________________________________ 25
CITY OF SAN ANTONIO, TEXAS
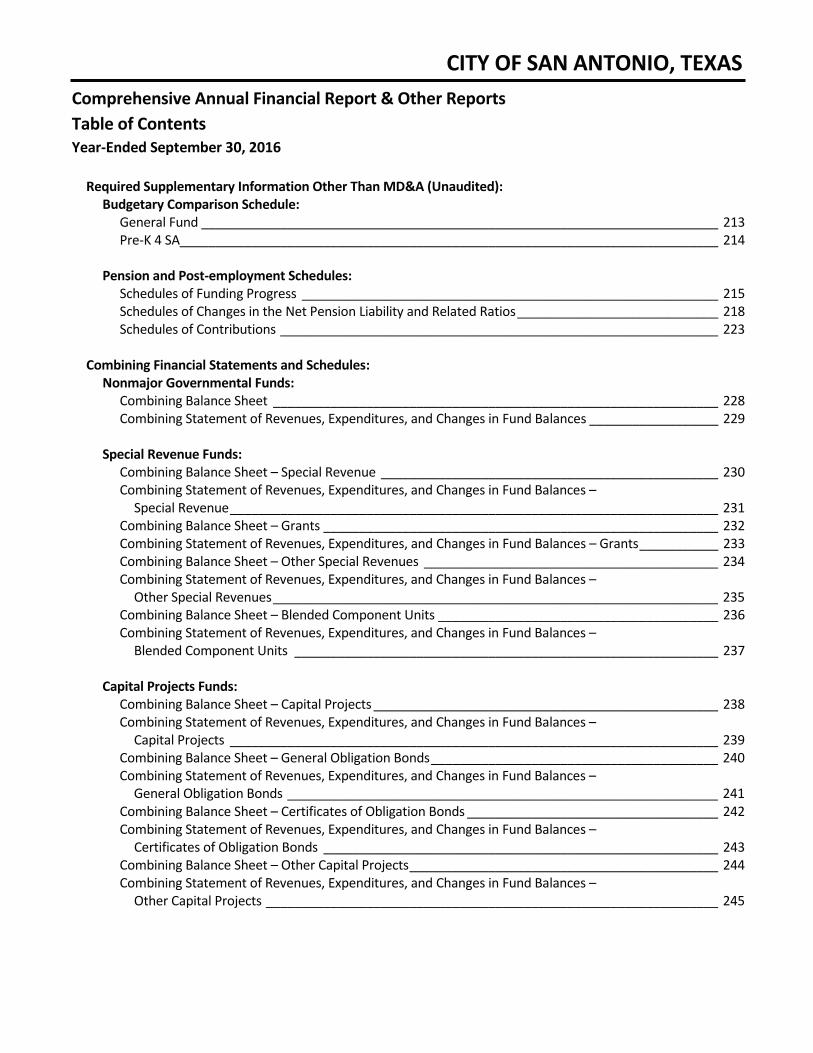
Comprehensive Annual Financial Report & Other Reports Table of Contents Year-Ended September 30, 2016 Required Supplementary Information Other Than MD&A (Unaudited): Budgetary Comparison Schedule: General Fund ________________________________________________________________________ 213 Pre-K 4 SA___________________________________________________________________________ 214 Pension and Post-employment Schedules: Schedules of Funding Progress __________________________________________________________ 215 Schedules of Changes in the Net Pension Liability and Related Ratios ____________________________ 218 Schedules of Contributions _____________________________________________________________ 223 Combining Financial Statements and Schedules: Nonmajor Governmental Funds: Combining Balance Sheet ______________________________________________________________ 228 Combining Statement of Revenues, Expenditures, and Changes in Fund Balances __________________ 229 Special Revenue Funds: Combining Balance Sheet – Special Revenue _______________________________________________ 230 Combining Statement of Revenues, Expenditures, and Changes in Fund Balances – Special Revenue ____________________________________________________________________ 231 Combining Balance Sheet – Grants _______________________________________________________ 232 Combining Statement of Revenues, Expenditures, and Changes in Fund Balances – Grants ___________ 233 Combining Balance Sheet – Other Special Revenues _________________________________________ 234 Combining Statement of Revenues, Expenditures, and Changes in Fund Balances – Other Special Revenues ______________________________________________________________ 235 Combining Balance Sheet – Blended Component Units _______________________________________ 236 Combining Statement of Revenues, Expenditures, and Changes in Fund Balances – Blended Component Units ___________________________________________________________ 237 Capital Projects Funds: Combining Balance Sheet – Capital Projects ________________________________________________ 238 Combining Statement of Revenues, Expenditures, and Changes in Fund Balances – Capital Projects ____________________________________________________________________ 239 Combining Balance Sheet – General Obligation Bonds ________________________________________ 240 Combining Statement of Revenues, Expenditures, and Changes in Fund Balances – General Obligation Bonds ____________________________________________________________ 241 Combining Balance Sheet – Certificates of Obligation Bonds ___________________________________ 242 Combining Statement of Revenues, Expenditures, and Changes in Fund Balances – Certificates of Obligation Bonds _______________________________________________________ 243 Combining Balance Sheet – Other Capital Projects ___________________________________________ 244 Combining Statement of Revenues, Expenditures, and Changes in Fund Balances – Other Capital Projects _______________________________________________________________ 245
CITY OF SAN ANTONIO, TEXAS
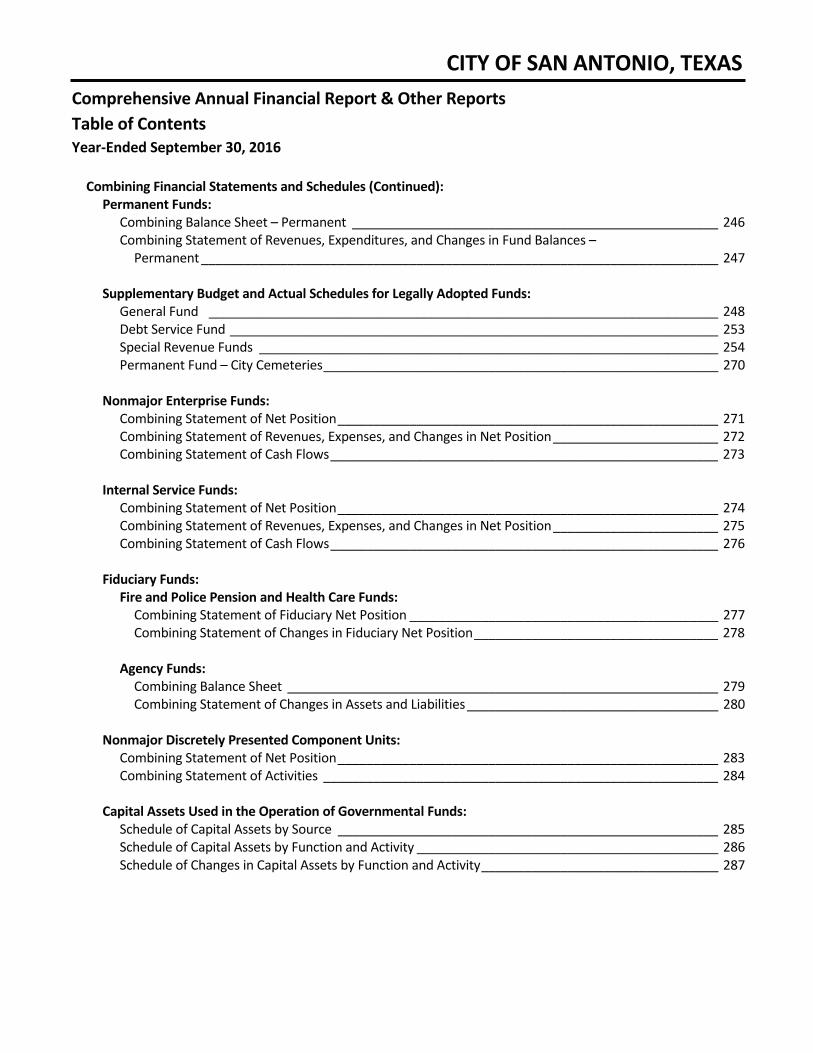
Comprehensive Annual Financial Report & Other Reports Table of Contents Year-Ended September 30, 2016 Combining Financial Statements and Schedules (Continued): Permanent Funds: Combining Balance Sheet – Permanent ___________________________________________________ 246 Combining Statement of Revenues, Expenditures, and Changes in Fund Balances – Permanent ________________________________________________________________________ 247 Supplementary Budget and Actual Schedules for Legally Adopted Funds: General Fund _______________________________________________________________________ 248 Debt Service Fund ____________________________________________________________________ 253 Special Revenue Funds ________________________________________________________________ 254 Permanent Fund – City Cemeteries _______________________________________________________ 270 Nonmajor Enterprise Funds: Combining Statement of Net Position _____________________________________________________ 271 Combining Statement of Revenues, Expenses, and Changes in Net Position _______________________ 272 Combining Statement of Cash Flows ______________________________________________________ 273 Internal Service Funds: Combining Statement of Net Position _____________________________________________________ 274 Combining Statement of Revenues, Expenses, and Changes in Net Position _______________________ 275 Combining Statement of Cash Flows ______________________________________________________ 276 Fiduciary Funds: Fire and Police Pension and Health Care Funds: Combining Statement of Fiduciary Net Position ___________________________________________ 277 Combining Statement of Changes in Fiduciary Net Position __________________________________ 278 Agency Funds: Combining Balance Sheet ____________________________________________________________ 279 Combining Statement of Changes in Assets and Liabilities ___________________________________ 280 Nonmajor Discretely Presented Component Units: Combining Statement of Net Position _____________________________________________________ 283 Combining Statement of Activities _______________________________________________________ 284 Capital Assets Used in the Operation of Governmental Funds: Schedule of Capital Assets by Source _____________________________________________________ 285 Schedule of Capital Assets by Function and Activity __________________________________________ 286 Schedule of Changes in Capital Assets by Function and Activity _________________________________ 287
CITY OF SAN ANTONIO, TEXAS
Comprehensive Annual Financial Report & Other Reports Table of Contents Year-Ended September 30, 2016
STATISTICAL SECTION (UNAUDITED)
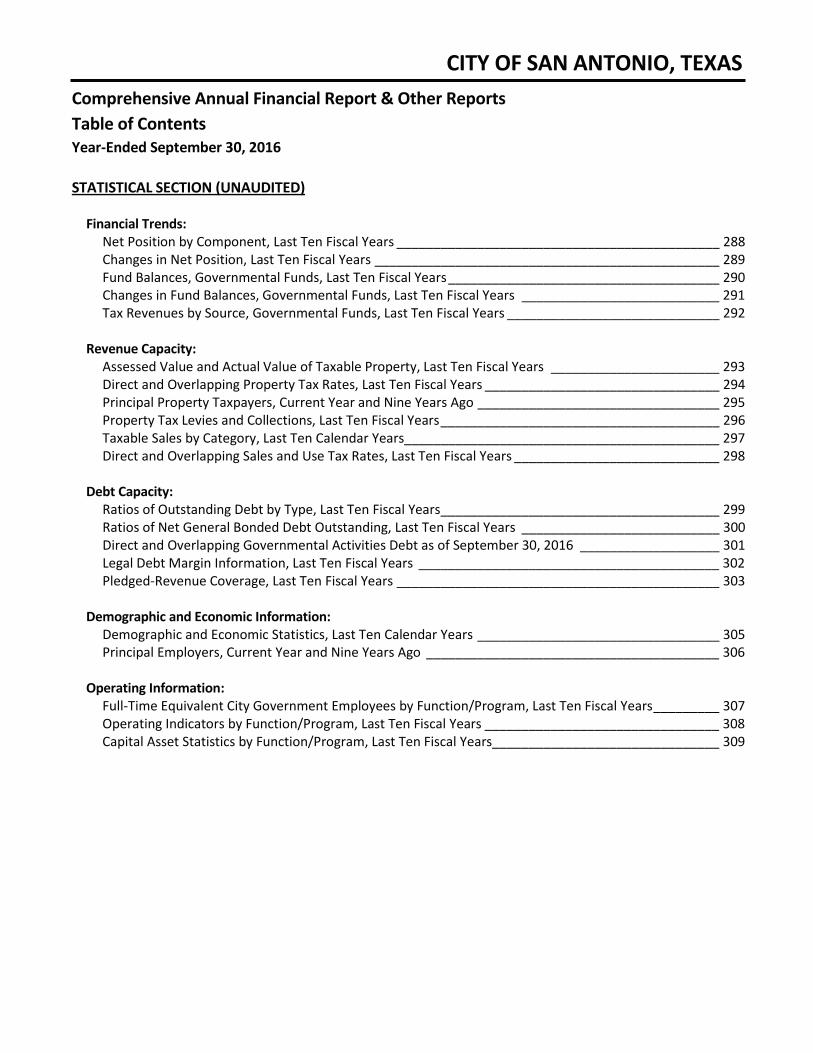
Financial Trends: Net Position by Component, Last Ten Fiscal Years ____________________________________________ 288 Changes in Net Position, Last Ten Fiscal Years _______________________________________________ 289 Fund Balances, Governmental Funds, Last Ten Fiscal Years _____________________________________ 290 Changes in Fund Balances, Governmental Funds, Last Ten Fiscal Years ___________________________ 291 Tax Revenues by Source, Governmental Funds, Last Ten Fiscal Years _____________________________ 292 Revenue Capacity: Assessed Value and Actual Value of Taxable Property, Last Ten Fiscal Years _______________________ 293 Direct and Overlapping Property Tax Rates, Last Ten Fiscal Years ________________________________ 294 Principal Property Taxpayers, Current Year and Nine Years Ago _________________________________ 295 Property Tax Levies and Collections, Last Ten Fiscal Years ______________________________________ 296 Taxable Sales by Category, Last Ten Calendar Years___________________________________________ 297 Direct and Overlapping Sales and Use Tax Rates, Last Ten Fiscal Years ____________________________ 298 Debt Capacity: Ratios of Outstanding Debt by Type, Last Ten Fiscal Years ______________________________________ 299 Ratios of Net General Bonded Debt Outstanding, Last Ten Fiscal Years ___________________________ 300 Direct and Overlapping Governmental Activities Debt as of September 30, 2016 ___________________ 301 Legal Debt Margin Information, Last Ten Fiscal Years _________________________________________ 302 Pledged-Revenue Coverage, Last Ten Fiscal Years ____________________________________________ 303 Demographic and Economic Information: Demographic and Economic Statistics, Last Ten Calendar Years _________________________________ 305 Principal Employers, Current Year and Nine Years Ago ________________________________________ 306 Operating Information: Full-Time Equivalent City Government Employees by Function/Program, Last Ten Fiscal Years _________ 307 Operating Indicators by Function/Program, Last Ten Fiscal Years ________________________________ 308 Capital Asset Statistics by Function/Program, Last Ten Fiscal Years_______________________________ 309
CITY OF SAN ANTONIO, TEXAS
Comprehensive Annual Financial Report & Other Reports Table of Contents Year-Ended September 30, 2016
FEDERAL SECTION
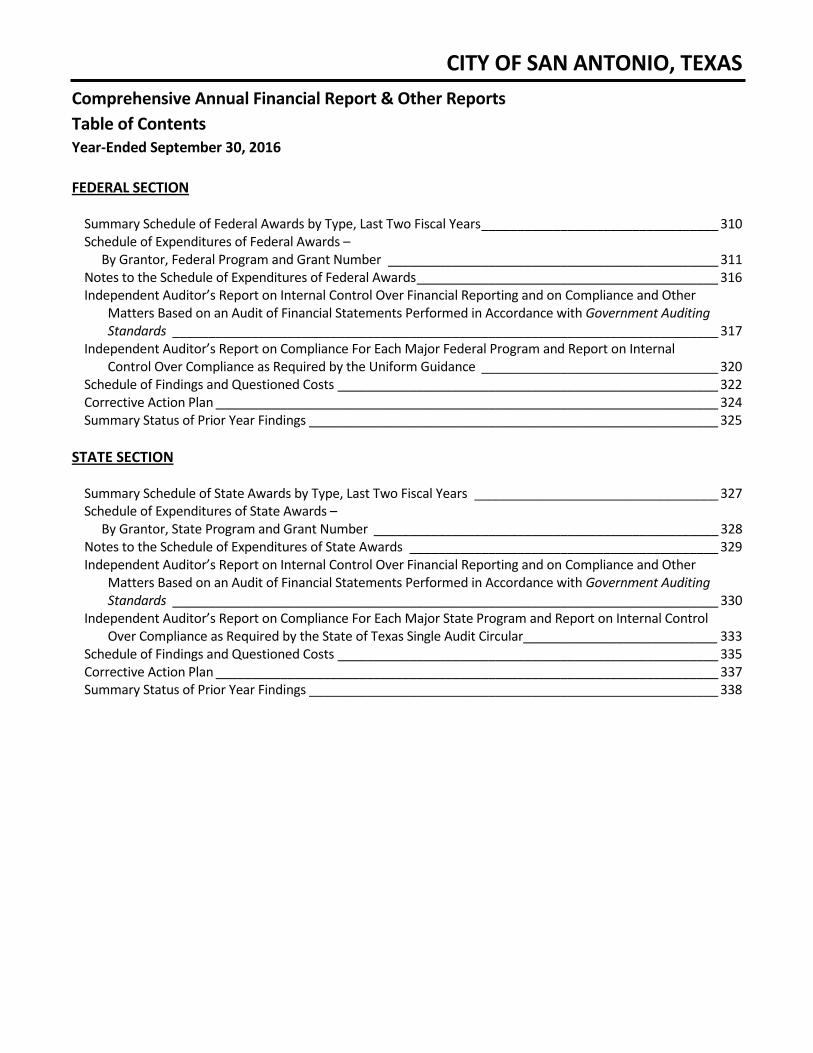
Summary Schedule of Federal Awards by Type, Last Two Fiscal Years _________________________________ 310 Schedule of Expenditures of Federal Awards – By Grantor, Federal Program and Grant Number ______________________________________________ 311 Notes to the Schedule of Expenditures of Federal Awards __________________________________________ 316 Independent Auditor’s Report on Internal Control Over Financial Reporting and on Compliance and Other
Matters Based on an Audit of Financial Statements Performed in Accordance with Government Auditing Standards ____________________________________________________________________________ 317
Independent Auditor’s Report on Compliance For Each Major Federal Program and Report on Internal Control Over Compliance as Required by the Uniform Guidance _________________________________ 320
Schedule of Findings and Questioned Costs _____________________________________________________ 322 Corrective Action Plan ______________________________________________________________________ 324 Summary Status of Prior Year Findings _________________________________________________________ 325
STATE SECTION
Summary Schedule of State Awards by Type, Last Two Fiscal Years __________________________________ 327 Schedule of Expenditures of State Awards – By Grantor, State Program and Grant Number ________________________________________________ 328 Notes to the Schedule of Expenditures of State Awards ___________________________________________ 329 Independent Auditor’s Report on Internal Control Over Financial Reporting and on Compliance and Other
Matters Based on an Audit of Financial Statements Performed in Accordance with Government Auditing Standards ____________________________________________________________________________ 330
Independent Auditor’s Report on Compliance For Each Major State Program and Report on Internal Control Over Compliance as Required by the State of Texas Single Audit Circular ___________________________ 333
Schedule of Findings and Questioned Costs _____________________________________________________ 335 Corrective Action Plan ______________________________________________________________________ 337 Summary Status of Prior Year Findings _________________________________________________________ 338
Letter of Transmittal
CITY OF SAN ANTONIO
March 9, 2017 To the Honorable Mayor, City Council and City Manager: It is my pleasure to present the City of San Antonio’s (City) Comprehensive Annual Financial Report (CAFR) and Other Reports for the fiscal year-ended September 30, 2016. These financial statements were prepared by the City’s Finance Department and audited by the public accounting firm of Padgett Stratemann & Co., LLP. As reflected in the Independent Auditor’s Report, the City’s financial statements are presented fairly in all material respects in accordance with generally accepted accounting principles (GAAP) in the United States. Responsibility for both the accuracy of the presented data and the completeness and fairness of the presentation, including all disclosures, rests with the management of the City. Management’s Discussion and Analysis (MD&A), beginning on page one, provides a narrative introduction, overview, and analysis of the basic financial statements. This transmittal letter complements the MD&A and should be read in conjunction with it.
CITY PROFILE The City provides a vast array of municipal services. The full range of services provided to its constituents includes ongoing programs to provide health, welfare, education, cultural, and recreational services; maintenance and construction of streets and drainage; public safety through police and fire protection; and urban redevelopment and housing. The City also considers the promotion of convention and tourism and participation in economic development programs as high priorities. The funding sources from which these services are provided include ad valorem, sales and use, and hotel occupancy tax receipts; revenue payments from the City’s municipally-owned utilities; grants; user fees; bond proceeds; tax increment financing; and other sources. The City has 26 component units that are considered part of the City’s operations and, therefore, included in its annual financial statements. Thirteen of these entities are blended component units of the City; two entities are fiduciary, while the remaining 11 entities are discretely presented. Based on the size and significance of four component units (CPS Energy, San Antonio Water System, San Antonio Fire and Police Pension Fund, and San Antonio Fire and Police Retiree Health Care Fund), the City has included excerpts of these entities’ footnotes within the CAFR. For additional details on each of these entities and the basis for their respective presentation in our financial report, please refer to the Financial Section, Note 1 Summary of Significant Accounting Policies. The City additionally has one joint venture, which is also disclosed in Note 1. The City is a home rule city that was incorporated in 1837 and chartered in 1951. The City Charter provides for a Council-Manager form of government, subject only to the limitations imposed by the Texas Constitution and the City Charter. All powers of the City are vested in an elective Council (the City Council), which enacts legislation, adopts budgets, and determines policy. The City Council is comprised of 11 members, with ten members elected from single-member districts, and the Mayor elected at-large. The term of the office of the Mayor or a member of the City Council is limited to four full two-year terms. The City Council also appoints a City Manager who executes the laws and administers the government of the City and serves as the City’s Chief Executive Officer.
- ii -
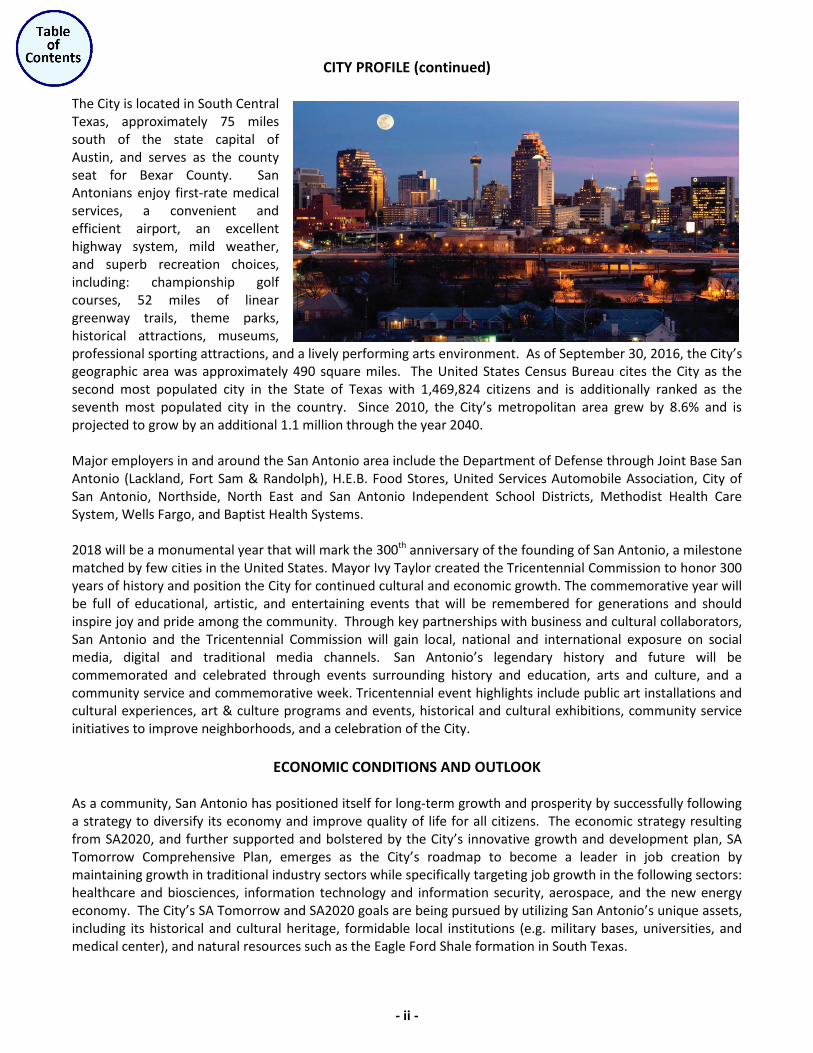
CITY PROFILE (continued) The City is located in South Central Texas, approximately 75 miles south of the state capital of Austin, and serves as the county seat for Bexar County. San Antonians enjoy first-rate medical services, a convenient and efficient airport, an excellent highway system, mild weather, and superb recreation choices, including: championship golf courses, 52 miles of linear greenway trails, theme parks, historical attractions, museums, professional sporting attractions, and a lively performing arts environment. As of September 30, 2016, the City’s geographic area was approximately 490 square miles. The United States Census Bureau cites the City as the second most populated city in the State of Texas with 1,469,824 citizens and is additionally ranked as the seventh most populated city in the country. Since 2010, the City’s metropolitan area grew by 8.6% and is projected to grow by an additional 1.1 million through the year 2040. Major employers in and around the San Antonio area include the Department of Defense through Joint Base San Antonio (Lackland, Fort Sam & Randolph), H.E.B. Food Stores, United Services Automobile Association, City of San Antonio, Northside, North East and San Antonio Independent School Districts, Methodist Health Care System, Wells Fargo, and Baptist Health Systems. 2018 will be a monumental year that will mark the 300th anniversary of the founding of San Antonio, a milestone matched by few cities in the United States. Mayor Ivy Taylor created the Tricentennial Commission to honor 300 years of history and position the City for continued cultural and economic growth. The commemorative year will be full of educational, artistic, and entertaining events that will be remembered for generations and should inspire joy and pride among the community. Through key partnerships with business and cultural collaborators, San Antonio and the Tricentennial Commission will gain local, national and international exposure on social media, digital and traditional media channels. San Antonio’s legendary history and future will be commemorated and celebrated through events surrounding history and education, arts and culture, and a community service and commemorative week. Tricentennial event highlights include public art installations and cultural experiences, art & culture programs and events, historical and cultural exhibitions, community service initiatives to improve neighborhoods, and a celebration of the City.
ECONOMIC CONDITIONS AND OUTLOOK
As a community, San Antonio has positioned itself for long-term growth and prosperity by successfully following a strategy to diversify its economy and improve quality of life for all citizens. The economic strategy resulting from SA2020, and further supported and bolstered by the City’s innovative growth and development plan, SA Tomorrow Comprehensive Plan, emerges as the City’s roadmap to become a leader in job creation by maintaining growth in traditional industry sectors while specifically targeting job growth in the following sectors: healthcare and biosciences, information technology and information security, aerospace, and the new energy economy. The City’s SA Tomorrow and SA2020 goals are being pursued by utilizing San Antonio’s unique assets, including its historical and cultural heritage, formidable local institutions (e.g. military bases, universities, and medical center), and natural resources such as the Eagle Ford Shale formation in South Texas.
- iii -
ECONOMIC CONDITIONS AND OUTLOOK (continued)
San Antonio’s housing market remained very strong in 2016. According to the October 2016 Multiple Listing Service report by the San Antonio Board of REALTORS®, the average price of a single-family residential home in October 2016 rose to $240,919, an 4.9% increase from last year, and the median rose to $202,300, a 8.2% increase from October 2015. San Antonio’s average unemployment rate for fiscal year 2016 was 3.5% compared to the national rate of 4.9%. The City’s resilient economy was fueled by several targeted industry projects in fiscal year 2016. The City utilized a combination of tax abatements, grant agreements, impact fee waivers, and nominations for State project designations that assisted in enticing businesses to move to or remain in San Antonio. In 2016, the City, in partnership with the San Antonio Economic Development Foundation (SAEDF), worked with 25 companies to create and/or retain 4,482 jobs in San Antonio and Bexar County. The City is constantly looking for efforts to support economic development opportunities. In fiscal year 2016, $4.1 million was appropriated in economic development incentive funds to retain, expand, and attract job-creating businesses. Some of the funding was disbursed to attract an advanced manufacturing company and several targeted IT start-up businesses, all in the downtown area. Additional funding was budgeted for Port SA to attract cyber security businesses into the former Kelly Air Force base. With continued interest in investment and development in our Center City, there has been an increased interest in the private sector to utilize all available incentives including State and Federal Historic Tax Credits. In an effort to expand the number of downtown properties that are eligible to receive these credits, the City launched an initiative to survey and nominate over 200 properties for listing in the National Register of Historic Places. The resulting nomination for the San Antonio Downtown and River Walk National Register District means that 197 contributing buildings can now apply for Historic Tax Credits, which are proven to be a powerful economic development tool. Prior to this effort, individual property owners were required to self-list their properties prior to beginning a project. Not only could this process prove lengthy and cumbersome, many historic-aged buildings lacked the architectural integrity to be considered eligible for an individual listing. The creation of the district allows for many contributing properties to now be listed as a group where they might not have otherwise been individually eligible.
MAJOR INITIATIVES – EDUCATION Established in the 2013-2014 school year, Pre-K 4 SA aims to change the educational trajectory of four-year-olds, inspiring students to develop a love of learning and become engaged, 21st century citizens. Pre-K 4 SA achieves this goal through key program components that include the operation of four Education Centers, family outreach and engagement initiatives, research and innovation, comprehensive professional learning, competitive grants, and an ongoing public dialogue. The start of 2016-2017 school year marked the beginning of all four Education Centers operating at full capacity. The Pre-K 4 SA curriculum draws from research-validated approaches supported by the National Association for the Education of Young Children to provide the highest quality instruction in all Pre-K 4 SA classrooms. The Pre-K 4 SA Program Standards serve as the framework for the curriculum, which responds to the unique learning and developmental needs of young children. Each decision about the curriculum is made in light of what is developmentally, culturally, and individually appropriate for the particular children being served. The Pre-K 4 SA curriculum supports active learning, addresses Texas Pre-K guidelines, and builds on the interests of children.
- iv -
MAJOR INITIATIVES – EDUCATION (continued)
In fiscal year 2016, Pre-K 4 SA was evaluated by San Antonio-based firm Edvance Research to assess the overall effectiveness of the education program by measuring student growth in six domains: cognitive, math, literacy, oral-language, physical, and social-emotional. The researchers found that although Pre-K 4 SA students entered the program significantly below national norms in all domain areas, by the end of the program, students exceeded the national norm in the cognitive, math and literacy domains and met national averages in the oral-language, physical, and social-emotional domains. These results indicate Pre-K 4 SA is highly successful in helping children develop kindergarten readiness.
Pre-K 4 SA extended its reach beyond the four Education Centers to serve students, families, and educators in early childhood programs throughout the city through the Competitive Grants Program (CGP). Fully funded by sales tax revenues, the purpose of the CGP is to expand access and enhance quality in San Antonio’s early childhood programs. In November 2015, Pre-K 4 SA released a request for proposals for the first year of the CGP. Fifteen organizations were awarded a total of $4.2 million in grants to public/charter schools, private/parochial schools, and child development centers. Of the awarded organizations, 75.0% of sites are located within Loop 410, and three sites are located on the Eastside within the U.S. Department of Housing and Urban Development designated “Promise Zone.”
MAJOR INITIATIVES – CAPITAL PROGRAMS
During the May 2012 election, citizens of San Antonio voted for and approved a $596 million General Obligation Bond Program. The 2012 General Obligation Bond Program, a five year program, is the City’s largest bond program in history. There are 41 projects set for streets, bridges, and sidewalks; 17 projects set for drainage and flood control; 68 projects set for parks and recreation; 11 projects set for library, museum, and cultural arts facilities; and three projects set for public safety facilities. All of the $596 million approved has been issued. In May 2015, voters approved, for the fourth time, a 1/8-of-a-cent addition to the local sales tax to fund two environmental initiatives. One initiative acquires property and develops linear greenway trails in flood zones along City-owned creeks. Currently, there are 52 miles of linear greenway trails available for public enjoyment with another 32 miles in design or construction. The other initiative provides funds to purchase sensitive properties located over the Edwards Aquifer which is the City’s largest source of drinking water. Over 137 thousand acres have been protected. In June 2016, City Council added to that protected land by authorizing the purchase of 165 acres of the Steubing Ranch, which is one of the last large, undeveloped tracts over the Edwards Aquifer recharge zone. Most of the land will be preserved for green space. Additionally, the City executed a contract for an option to purchase an additional 39 acres for open space and recreational park purposes such as baseball fields and soccer pitches. The U.S. House Committee on Transportation and Infrastructure approved just over $144 million in funding in May 2016 for a new federal courthouse to be constructed by the United States General Services Administration (GSA). The new John H. Wood Federal Courthouse will be located on the site of the former San Antonio Police Headquarters at 214 West Nueva Street and will have eight courtrooms and 83 parking spaces. Prior to funding being approved, the City and GSA negotiated a land swap; GSA will acquire the lot from the City for the new courthouse in exchange for the land the current courthouse occupies in Hemisfair. The movement of the courthouse allows for continued development in line with the current revitalization efforts for Hemisfair.
- v -
MAJOR INITIATIVES – CAPITAL PROGRAMS (continued)
Phase 1 of the $175 million San Pedro Creek Improvements Project broke ground in September 2016, beginning the transformation of a vital piece of San Antonio’s history. The primary goal of the project is to contain the 100-year floodplain by deepening and widening the existing channel, all while transforming San Pedro Creek into a culture park commemorating the blending of cultures, color, and craft that makes San Antonio unique. The location within downtown is expected to have a substantial economic impact, including over 2,100 new housing units, the restoration of the Alameda Theater, and other potential development activities in the area. The San Antonio International Airport experienced a record year in passengers in 2016 with over 8.5 million passengers, which was up 1.6% over the last year. The Airport currently serves 37 domestic and international non-stop destinations on 10 airlines. In 2016, Frontier Airlines announced service to Philadelphia, Denver, Atlanta and Las Vegas. Additionally, Southwest Airlines announced new service to Kansas City. In May 2016, City Council authorized new revisions to the air service development incentive program to provide more flexibility to attract new international service to the Airport. The Airport continues to work with the business community to attract and grow air service. At the San Antonio International Airport, the design for the expansion of the Customs and Border Patrol space from 25,197 to 38,000 square feet is complete with construction expected to begin in early 2017. This facility is used to process international passengers arriving on commercial aircraft, and the improvement will increase the volume of arriving passengers from 300 per hour to 800 per hour. Construction of the Consolidated Rental Car Facility (CONRAC) at the San Antonio International Airport is 50.0% complete with access to the public parking levels one and two to be opened in spring 2017. This seven story, 1.8 million square foot facility will improve the rental car experience for millions of the City’s visitors by centralizing the car rental facilities in one location on airport property, as well as replacing the Airport’s short term public parking garage. Construction of the facility is funded by a customer facility charge included on all airport car rental transactions. The project has been accelerated for an early completion with substantial completion in summer 2017 and full public occupancy by the 2017 holiday season. Additionally, construction of a General Aviation Federal Inspection Facility for Customs and Border Patrol is more than 40.0% underway with a planned February 2017 completion and occupancy date. This nearly five thousand square foot facility will be used to clear passengers arriving from foreign countries on smaller, private, and corporate aircraft.
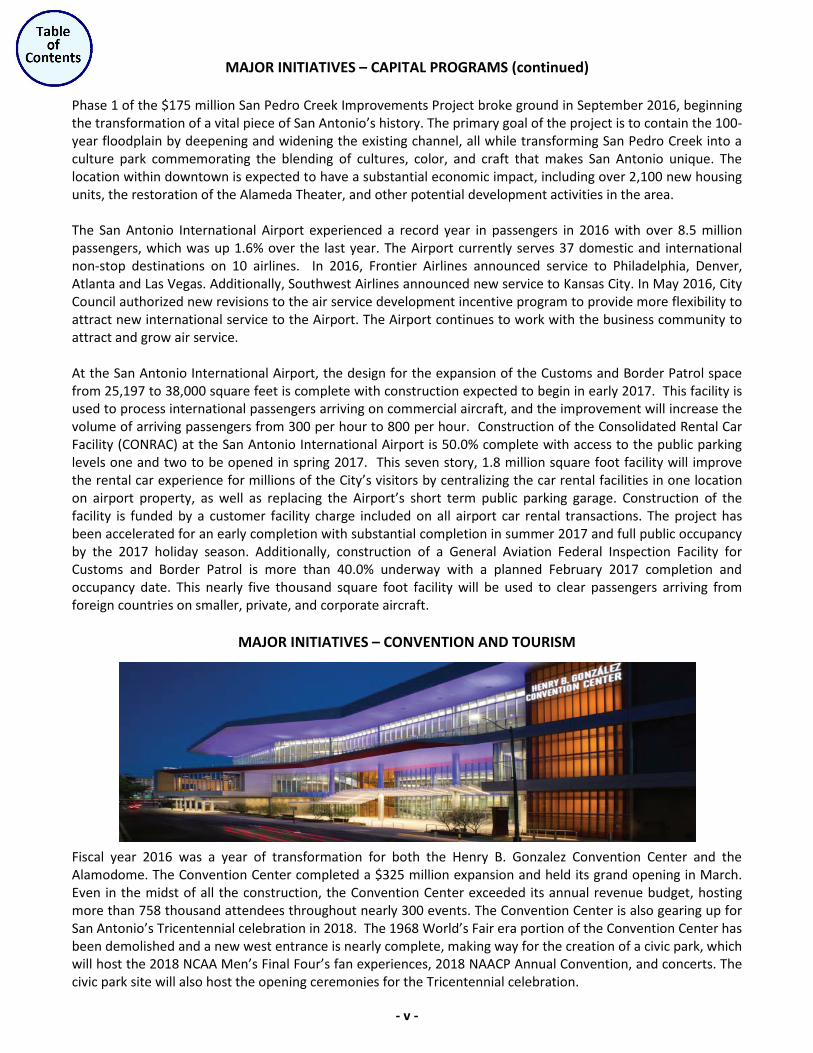
MAJOR INITIATIVES – CONVENTION AND TOURISM Fiscal year 2016 was a year of transformation for both the Henry B. Gonzalez Convention Center and the Alamodome. The Convention Center completed a $325 million expansion and held its grand opening in March. Even in the midst of all the construction, the Convention Center exceeded its annual revenue budget, hosting more than 758 thousand attendees throughout nearly 300 events. The Convention Center is also gearing up for San Antonio’s Tricentennial celebration in 2018. The 1968 World’s Fair era portion of the Convention Center has been demolished and a new west entrance is nearly complete, making way for the creation of a civic park, which will host the 2018 NCAA Men’s Final Four’s fan experiences, 2018 NAACP Annual Convention, and concerts. The civic park site will also host the opening ceremonies for the Tricentennial celebration.
- vi -
MAJOR INITIATIVES – CONVENTION AND TOURISM (continued)
For 23 years in a row the City’s Alamodome has hosted the Alamo Bowl. On January 3, 2016, the Valero Alamo Bowl saw a sellout crowd of 64,569 for the dramatic matchup between #11 Texas Christian University (TCU) and #15 Oregon, with TCU winning 47-41 in triple overtime. The Alamo Bowl has a significant annual impact on the local economy; for the 2016 Alamo Bowl, there was direct visitor spending of $25 million, with a total economic impact of $45.8 million. Following the Alamo Bowl, the Alamodome began a $53.9 million improvement project – the largest in its 24-year history. The initial portion of the Alamodome improvement project, renovating the North Plaza to create space for pre-game/event activities, was completed in time for the Alamodome to host the Shamrock Series - Army vs. Notre Dame Football Game in November 2016. San Antonio is the only city to have the honor of hosting two of Notre Dame’s traveling home games. The remaining Alamodome improvements will be completed in late 2017 in order to host the NCAA Men’s Final Four Basketball tournament. Convention and Sports Facilities leadership continues to work on the major initiative of restructuring the Convention & Visitors Bureau (CVB). With City Council’s approval, the CVB has begun the transition from a governmental agency into an independent nonprofit organization – Visit San Antonio (VSA). The conversion to a nonprofit allows VSA to respond more quickly to changing market conditions, as well as positioning San Antonio as a go-to destination for meetings, events, and conferences in the newly renovated Convention Center and Alamodome; a bucket list location for millennials seeking culture, cuisine and a lively nightlife; and a continued choice for families attracted to the history and broad spectrum of activities San Antonio has to offer.
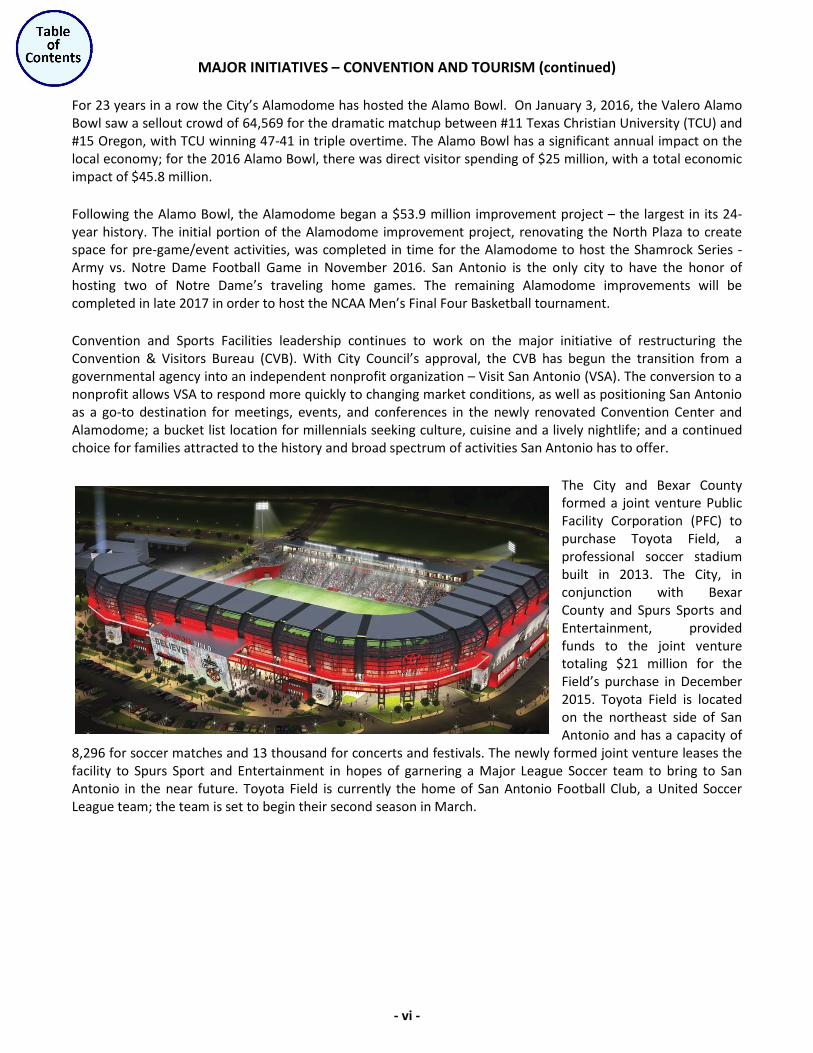
The City and Bexar County formed a joint venture Public Facility Corporation (PFC) to purchase Toyota Field, a professional soccer stadium built in 2013. The City, in conjunction with Bexar County and Spurs Sports and Entertainment, provided funds to the joint venture totaling $21 million for the Field’s purchase in December 2015. Toyota Field is located on the northeast side of San Antonio and has a capacity of
8,296 for soccer matches and 13 thousand for concerts and festivals. The newly formed joint venture leases the facility to Spurs Sport and Entertainment in hopes of garnering a Major League Soccer team to bring to San Antonio in the near future. Toyota Field is currently the home of San Antonio Football Club, a United Soccer League team; the team is set to begin their second season in March.
- vii -
MAJOR INITIATIVES – CONVENTION AND TOURISM (continued)
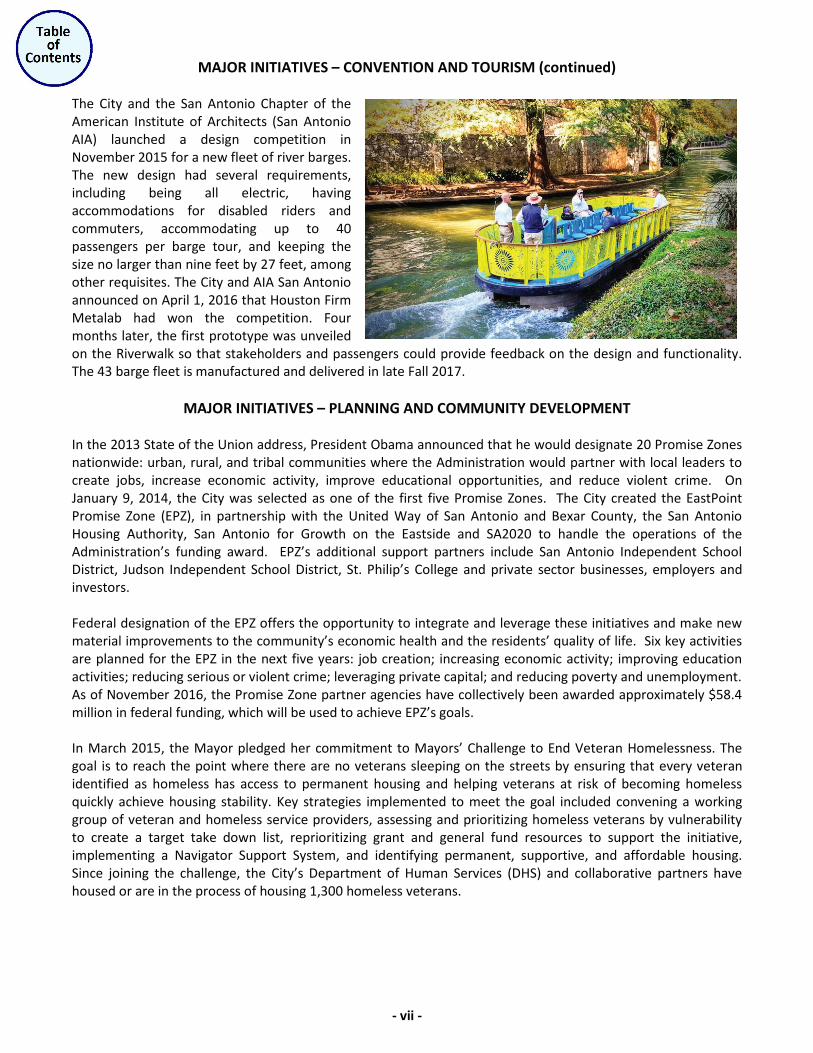
The City and the San Antonio Chapter of the American Institute of Architects (San Antonio AIA) launched a design competition in November 2015 for a new fleet of river barges. The new design had several requirements, including being all electric, having accommodations for disabled riders and commuters, accommodating up to 40 passengers per barge tour, and keeping the size no larger than nine feet by 27 feet, among other requisites. The City and AIA San Antonio announced on April 1, 2016 that Houston Firm Metalab had won the competition. Four months later, the first prototype was unveiled on the Riverwalk so that stakeholders and passengers could provide feedback on the design and functionality. The 43 barge fleet is manufactured and delivered in late Fall 2017.
MAJOR INITIATIVES – PLANNING AND COMMUNITY DEVELOPMENT In the 2013 State of the Union address, President Obama announced that he would designate 20 Promise Zones nationwide: urban, rural, and tribal communities where the Administration would partner with local leaders to create jobs, increase economic activity, improve educational opportunities, and reduce violent crime. On January 9, 2014, the City was selected as one of the first five Promise Zones. The City created the EastPoint Promise Zone (EPZ), in partnership with the United Way of San Antonio and Bexar County, the San Antonio Housing Authority, San Antonio for Growth on the Eastside and SA2020 to handle the operations of the Administration’s funding award. EPZ’s additional support partners include San Antonio Independent School District, Judson Independent School District, St. Philip’s College and private sector businesses, employers and investors. Federal designation of the EPZ offers the opportunity to integrate and leverage these initiatives and make new material improvements to the community’s economic health and the residents’ quality of life. Six key activities are planned for the EPZ in the next five years: job creation; increasing economic activity; improving education activities; reducing serious or violent crime; leveraging private capital; and reducing poverty and unemployment. As of November 2016, the Promise Zone partner agencies have collectively been awarded approximately $58.4 million in federal funding, which will be used to achieve EPZ’s goals. In March 2015, the Mayor pledged her commitment to Mayors’ Challenge to End Veteran Homelessness. The goal is to reach the point where there are no veterans sleeping on the streets by ensuring that every veteran identified as homeless has access to permanent housing and helping veterans at risk of becoming homeless quickly achieve housing stability. Key strategies implemented to meet the goal included convening a working group of veteran and homeless service providers, assessing and prioritizing homeless veterans by vulnerability to create a target take down list, reprioritizing grant and general fund resources to support the initiative, implementing a Navigator Support System, and identifying permanent, supportive, and affordable housing. Since joining the challenge, the City’s Department of Human Services (DHS) and collaborative partners have housed or are in the process of housing 1,300 homeless veterans.

- viii -
MAJOR INITIATIVES – PLANNING AND COMMUNITY DEVELOPMENT (continued)
On May 6, 2016, the City received notification from the United States Interagency Council on Homelessness confirming that San Antonio met the objectives to declare an end to veteran homelessness. The City and its collaborative partners have housed or are in the process of housing 1,300 homeless veterans and will continue to work to ensure that veterans at risk of homelessness or those that become homeless have rapid access to housing and supportive services. The City and its San Antonio collaborative partners will continue coordinating veteran working group efforts to intake and triage homeless veterans to identify needed resources, work with local landlords to identify available housing resources, expand system of Community Navigators, and work with the business community and landlords to increase available housing stock.
SA Tomorrow, a collaborative process involving local governments, businesses, advocacy groups, the military, and local citizens, represents an innovative, three-pronged planning effort to guide the City toward smart, sustainable growth. SA Tomorrow was started with the vision established through the SA2020 process and allows City leadership to understand and incorporate critical issues from three separate but interrelated plans (a Comprehensive Plan, Sustainability Plan, and Multimodal Transportation Plan) into a consolidated plan that gives policy direction and guidance through the year 2040 ensuring every aspect of day-to-day life is addressed: streets and connectivity, housing, green and healthy neighborhoods, public facilities and community safety, historic preservation, military affairs, natural resources, energy, water supply, jobs, economic competitiveness, education and more. In 2017, the City will begin to transition from the goals in the SA2020 report to a focus on the updated goals and policies in the City’s new Comprehensive Plan, which also recommends that the City capitalize on the unique economic geography (polycentric employment centers), further economic diversification, workforce development, and business attraction and retention. The SA Tomorrow Comprehensive Plan can be found at www.sacompplan.com.
MAJOR INITIATIVES – PRIVATE PUBLIC PARTNERSHIPS
As the population of the City continues to grow, there is an increasing need to revitalize its urban core and for the development and construction of new public facilities. In order to assist local governmental entities to meet their growing infrastructure needs, the State of Texas has enacted the Public and Private Facilities and Infrastructure Act to allow greater use of public-private partnerships (P3). The City implemented a P3 program with a goal to encourage redevelopment of underdeveloped and underutilized properties; share risk and expense between the City and the contracting private entity; and participate in cash flow performance by organizing public-private partnerships. Through this contractual agreement, the assets and professional skills of each sector (public and private) are shared to deliver a facility and/or service for the use of the general public and each sector shares in the potential risks of the timely and efficient delivery of the service or facility. The City is working with various developers on P3 projects such as the Frost P3, Red Berry Estate P3, and Hemisfair Park P3s.
- ix -
MAJOR INITIATIVES – PRIVATE PUBLIC PARTNERSHIPS (continued)
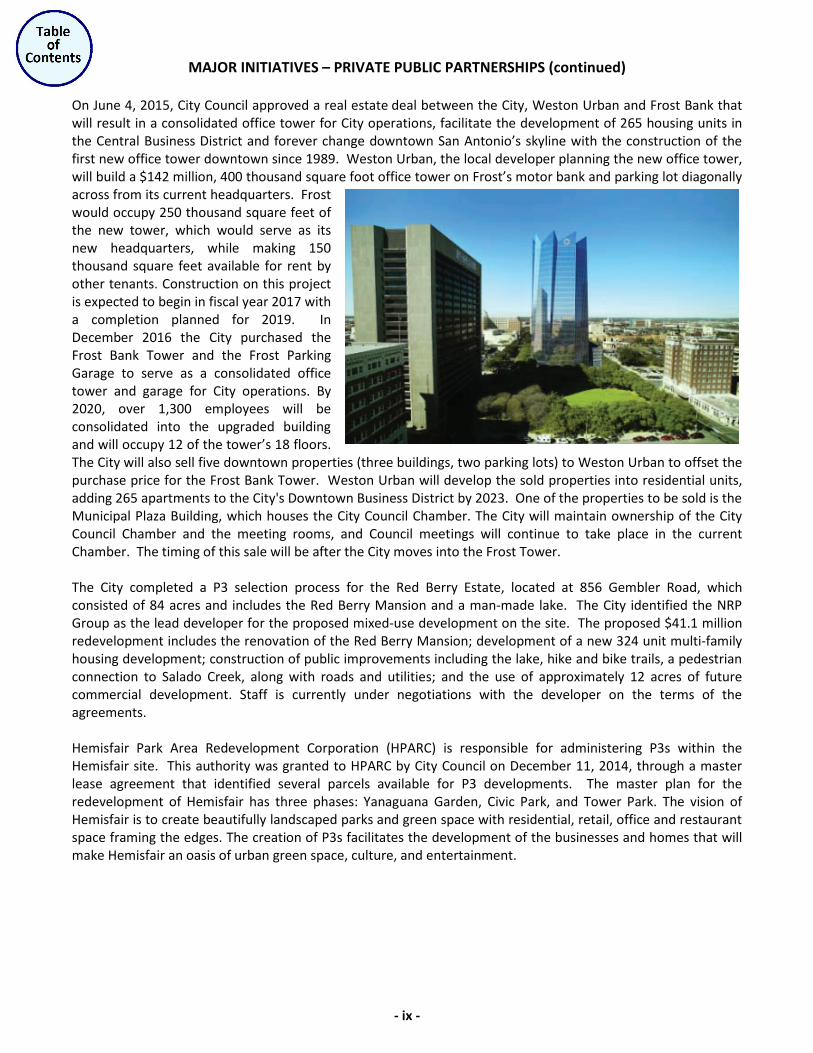
On June 4, 2015, City Council approved a real estate deal between the City, Weston Urban and Frost Bank that will result in a consolidated office tower for City operations, facilitate the development of 265 housing units in the Central Business District and forever change downtown San Antonio’s skyline with the construction of the first new office tower downtown since 1989. Weston Urban, the local developer planning the new office tower, will build a $142 million, 400 thousand square foot office tower on Frost’s motor bank and parking lot diagonally across from its current headquarters. Frost would occupy 250 thousand square feet of the new tower, which would serve as its new headquarters, while making 150 thousand square feet available for rent by other tenants. Construction on this project is expected to begin in fiscal year 2017 with a completion planned for 2019. In December 2016 the City purchased the Frost Bank Tower and the Frost Parking Garage to serve as a consolidated office tower and garage for City operations. By 2020, over 1,300 employees will be consolidated into the upgraded building and will occupy 12 of the tower’s 18 floors. The City will also sell five downtown properties (three buildings, two parking lots) to Weston Urban to offset the purchase price for the Frost Bank Tower. Weston Urban will develop the sold properties into residential units, adding 265 apartments to the City's Downtown Business District by 2023. One of the properties to be sold is the Municipal Plaza Building, which houses the City Council Chamber. The City will maintain ownership of the City Council Chamber and the meeting rooms, and Council meetings will continue to take place in the current Chamber. The timing of this sale will be after the City moves into the Frost Tower. The City completed a P3 selection process for the Red Berry Estate, located at 856 Gembler Road, which consisted of 84 acres and includes the Red Berry Mansion and a man-made lake. The City identified the NRP Group as the lead developer for the proposed mixed-use development on the site. The proposed $41.1 million redevelopment includes the renovation of the Red Berry Mansion; development of a new 324 unit multi-family housing development; construction of public improvements including the lake, hike and bike trails, a pedestrian connection to Salado Creek, along with roads and utilities; and the use of approximately 12 acres of future commercial development. Staff is currently under negotiations with the developer on the terms of the agreements. Hemisfair Park Area Redevelopment Corporation (HPARC) is responsible for administering P3s within the Hemisfair site. This authority was granted to HPARC by City Council on December 11, 2014, through a master lease agreement that identified several parcels available for P3 developments. The master plan for the redevelopment of Hemisfair has three phases: Yanaguana Garden, Civic Park, and Tower Park. The vision of Hemisfair is to create beautifully landscaped parks and green space with residential, retail, office and restaurant space framing the edges. The creation of P3s facilitates the development of the businesses and homes that will make Hemisfair an oasis of urban green space, culture, and entertainment.
- x -
MAJOR INITIATIVES – PRIVATE PUBLIC PARTNERSHIPS (continued)
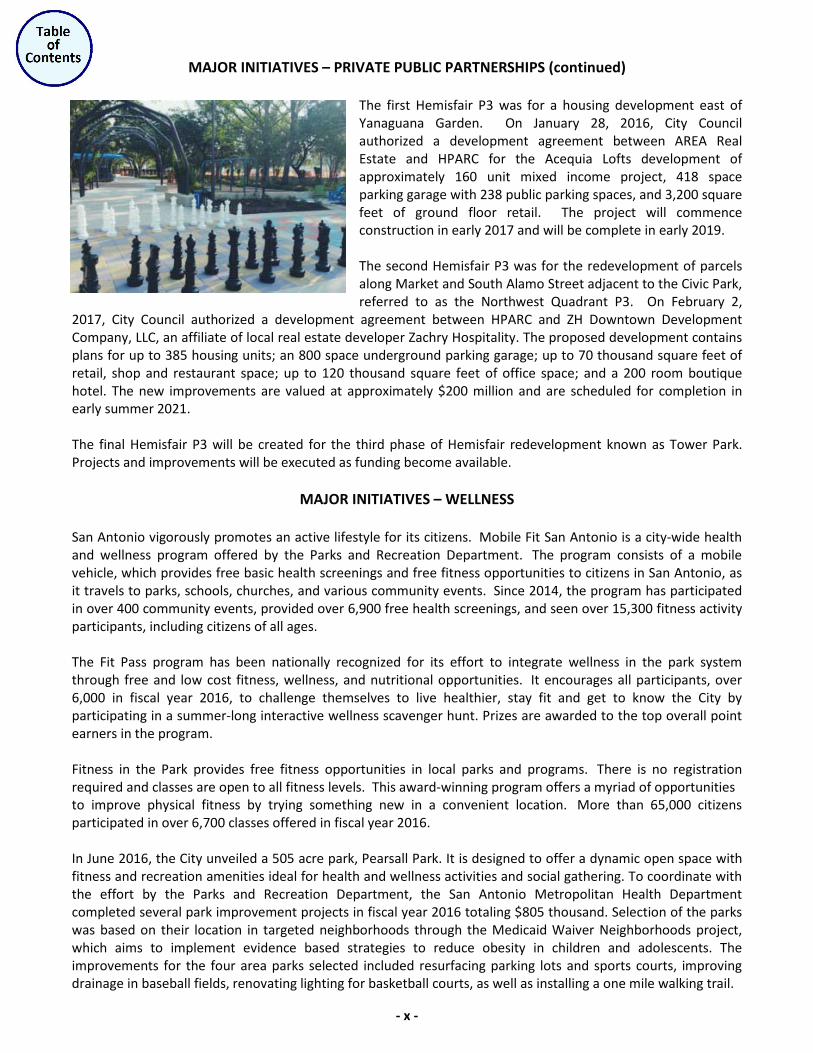
The first Hemisfair P3 was for a housing development east of Yanaguana Garden. On January 28, 2016, City Council authorized a development agreement between AREA Real Estate and HPARC for the Acequia Lofts development of approximately 160 unit mixed income project, 418 space parking garage with 238 public parking spaces, and 3,200 square feet of ground floor retail. The project will commence construction in early 2017 and will be complete in early 2019. The second Hemisfair P3 was for the redevelopment of parcels along Market and South Alamo Street adjacent to the Civic Park, referred to as the Northwest Quadrant P3. On February 2,
2017, City Council authorized a development agreement between HPARC and ZH Downtown Development Company, LLC, an affiliate of local real estate developer Zachry Hospitality. The proposed development contains plans for up to 385 housing units; an 800 space underground parking garage; up to 70 thousand square feet of retail, shop and restaurant space; up to 120 thousand square feet of office space; and a 200 room boutique hotel. The new improvements are valued at approximately $200 million and are scheduled for completion in early summer 2021. The final Hemisfair P3 will be created for the third phase of Hemisfair redevelopment known as Tower Park. Projects and improvements will be executed as funding become available.
MAJOR INITIATIVES – WELLNESS San Antonio vigorously promotes an active lifestyle for its citizens. Mobile Fit San Antonio is a city-wide health and wellness program offered by the Parks and Recreation Department. The program consists of a mobile vehicle, which provides free basic health screenings and free fitness opportunities to citizens in San Antonio, as it travels to parks, schools, churches, and various community events. Since 2014, the program has participated in over 400 community events, provided over 6,900 free health screenings, and seen over 15,300 fitness activity participants, including citizens of all ages. The Fit Pass program has been nationally recognized for its effort to integrate wellness in the park system through free and low cost fitness, wellness, and nutritional opportunities. It encourages all participants, over 6,000 in fiscal year 2016, to challenge themselves to live healthier, stay fit and get to know the City by participating in a summer-long interactive wellness scavenger hunt. Prizes are awarded to the top overall point earners in the program. Fitness in the Park provides free fitness opportunities in local parks and programs. There is no registration required and classes are open to all fitness levels. This award-winning program offers a myriad of opportunities to improve physical fitness by trying something new in a convenient location. More than 65,000 citizens participated in over 6,700 classes offered in fiscal year 2016. In June 2016, the City unveiled a 505 acre park, Pearsall Park. It is designed to offer a dynamic open space with fitness and recreation amenities ideal for health and wellness activities and social gathering. To coordinate with the effort by the Parks and Recreation Department, the San Antonio Metropolitan Health Department completed several park improvement projects in fiscal year 2016 totaling $805 thousand. Selection of the parks was based on their location in targeted neighborhoods through the Medicaid Waiver Neighborhoods project, which aims to implement evidence based strategies to reduce obesity in children and adolescents. The improvements for the four area parks selected included resurfacing parking lots and sports courts, improving drainage in baseball fields, renovating lighting for basketball courts, as well as installing a one mile walking trail.
- xi -
MAJOR INITIATIVES – WORKFORCE DEVELOPMENT Mayor Ivy Taylor and County Judge Nelson Wolff hosted a workforce summit to create a comprehensive, industry-lead workforce effort that is overseen by a prominent group of industry leaders. This effort was called San Antonio - Talent for Economic Competitiveness (SA-TEC) Initiative. SA-TEC was an alignment and integration model developed from best practices and proven industry-led efforts. During Mayor Ivy Taylor’s 2016 United State of the City address in March 2016, she announced that SA-TEC would combine efforts with SA Works, an industry-led collective impact model developed from national best practices, and would lead the City’s workforce development efforts. To date, SA Works has successfully engaged a number of key partners such as industry leaders, independent school districts, institutions of higher education and community based organizations that have each assisted SA Works in providing internships, job shadowing opportunities and other work-based learning opportunities for high school and college students and educators. As SA Works transitions to SAEDF, their mission and activities will expand. The new relationship with SA Works will enhance SAEDF’s mission to ensure the City and Bexar County reach their full potential for economic prosperity through business growth and expansion. This will continue to fulfill the goals of Forefront SA, the community’s five-year strategic plan for economic development.
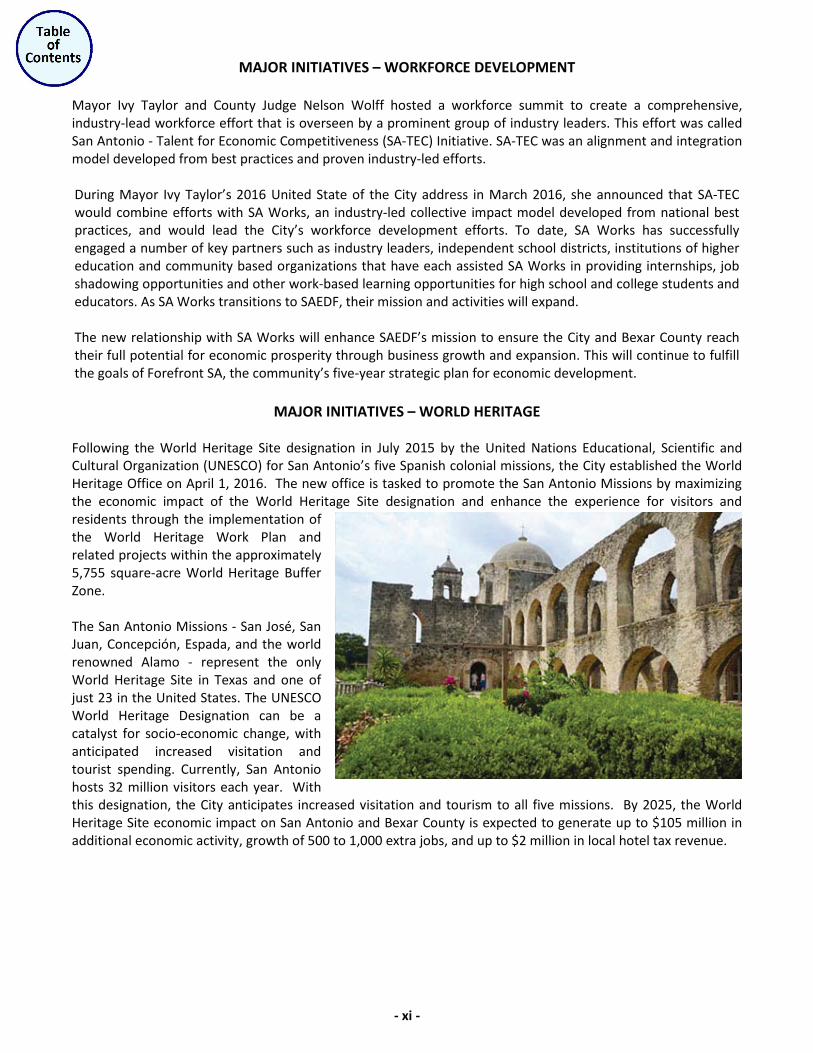
MAJOR INITIATIVES – WORLD HERITAGE Following the World Heritage Site designation in July 2015 by the United Nations Educational, Scientific and Cultural Organization (UNESCO) for San Antonio’s five Spanish colonial missions, the City established the World Heritage Office on April 1, 2016. The new office is tasked to promote the San Antonio Missions by maximizing the economic impact of the World Heritage Site designation and enhance the experience for visitors and residents through the implementation of the World Heritage Work Plan and related projects within the approximately 5,755 square-acre World Heritage Buffer Zone. The San Antonio Missions - San José, San Juan, Concepción, Espada, and the world renowned Alamo - represent the only World Heritage Site in Texas and one of just 23 in the United States. The UNESCO World Heritage Designation can be a catalyst for socio-economic change, with anticipated increased visitation and tourist spending. Currently, San Antonio hosts 32 million visitors each year. With this designation, the City anticipates increased visitation and tourism to all five missions. By 2025, the World Heritage Site economic impact on San Antonio and Bexar County is expected to generate up to $105 million in additional economic activity, growth of 500 to 1,000 extra jobs, and up to $2 million in local hotel tax revenue.
- xii -
MAJOR INITIATIVES – WORLD HERITAGE (continued) The Texas General Land Office, the City, and the private Alamo Endowment signed a Cooperative Agreement on October 15, 2015 to fund and oversee the development of a joint master plan for the Alamo Historic District and Alamo Complex, known as Reimagine the Alamo. Formed to manage implementation of the plan, the Alamo Management Committee (AMC) consists of two representatives from each of the three entities. In March 2016, the AMC selected Preservation Design Partnership (PDP), led by Dr. George C. Skarmeas, to be the Alamo Master Planner. In November 2016, the AMC and Dr. Skarmeas presented the first round of master plan concepts: recapture the historic footprint of the Alamo; reclaim the plaza courtyard and create a sense of reverence and respect on the historic battlefield; build a new world-class Visitor Center and Museum; and create a greater connection to the rest of downtown San Antonio. The hope is that by removing vehicular traffic and renovating the complex so that the original footprint is more evident, visitors will experience and understand the full history of the Alamo. For more details, visit reimaginethealamo.org.
FINANCIAL INFORMATION The management of the City is responsible for establishing a system of internal controls that are designed to provide reasonable assurance that assets are protected from loss, theft, or misuse. The City’s accounting system supports the internal controls and procedures, which provide reliable financial records for preparing financial statements in conformity with GAAP. The internal control structure provides reasonable assurance that the City’s assets are safeguarded as well as the reliability of financial records for preparing financial statements. The concept of reasonable assurance first recognizes that the cost of a control should not exceed the benefits likely to be derived. Secondarily, the evaluation of costs and benefits require estimates and judgments by management. Budgetary compliance is a significant tool for managing and controlling governmental activities, as well as ensuring conformance with the City’s budgetary limits and specifications. The objective of budgetary controls is to ensure compliance with legal provisions embodied in the annual appropriated budget approved by City Council. Levels of budgetary control, that is the levels at which expenditures cannot legally exceed appropriated amounts, are established at the department level within individual funds. The City utilizes an encumbrance system of accounting as one mechanism to accomplish effective budgetary control. Encumbered amounts lapse at year end and are generally appropriated as part of the following year’s budget. Another budgetary control is the monthly revenue and expenditure report summarizing by department budget and actual balances with variances that are generated and reviewed by the Office of Management and Budget (OMB), Finance and the City Manager’s Office. Each quarter, OMB and Finance meet with department representatives to assess departments’ expenditures based on actual to date and projected expenditures for the remainder of the fiscal year. The projected expenditures are compared against the legally adopted budget for analysis and are presented to the City Manager’s Office and City Council. During the mid-year budget review, an additional step is added related to formal budget adjustment recommendations that are made to City Council for adoption to modify the original budget. At fiscal year-end, as part of the annual review and close-out process, Council is provided information and recommendations to again approve desired budget adjustments and carryforwards for the next fiscal year. The City further implemented available budget controls within its system of record for capital projects and grants. The system warns when cumulative expenditures are within 75.0% of total budget and will not allow the processing of non-payroll transactions in excess of the budget.
- xiii -
FINANCIAL INFORMATION (continued)
Each year the City prepares a five-year financial forecast (Forecast) prior to the adoption of the annual operating budget. The Forecast is a financial and budgetary planning tool that provides a current and long-range assessment of financial conditions and costs for City services. The Forecast includes the identification of service delivery policy issues that will be encountered in the next five years and that will have a fiscal impact upon the City’s program of services. The Forecast also examines the local and national economic conditions that have an impact on the City’s economy and, ultimately, its budget. The Forecast serves as a foundation for development of the proposed budget by projecting revenues and anticipated expenditures under a defined set of assumptions. The Forecast provides the Council and staff the opportunity to identify financial issues in sufficient time to develop a proactive strategy in order to address emerging strategic issues. The annual budget serves as the foundation for the City’s financial planning and control. The development of the City’s annual budget begins in May, when all departments of the City are required to submit potential reductions and additional appropriation requests to the Office of Management and Budget. During this period, OMB reviews department’s base budgets, potential reductions and additional appropriation requests with each department and Executive Leadership Team members to develop budget recommendations for the City Manager’s consideration. After obtaining the priorities of the community through community meetings and meet-ups, holding the City Council Goal Setting Session to establish priorities for the upcoming budget, and conducting reviews of department budgets with the City Manager, the City Manager presents the proposed budget to the City Council for review in early August. The proposed budget represents the City staff’s professional recommendation to utilize revenues and expenditures in order to achieve a balanced budget, while optimizing City service deliveries, and addressing priorities of the City Council and residents. The fiscal year 2016 Budget addressed financial policies and service priorities that were established by City Council during the Goal Setting Session in June. The financial policies included the following: maintaining the General Fund budgeted financial reserves at 10.0% and targeting an available General Fund balance of 15.0%; maintain Public Safety budgets at 66.0% of General Fund; and maintain the City’s AAA Bond Rating. The fiscal year 2016 Budget addressed several service priorities discussed during the Goal Setting Session to include increasing funds for streets, sidewalks and drainage. The City also continues its commitment to efficient and prioritized service delivery by leveraging operational improvements and investments in technology and will continue to utilize the Office of Innovation to perform efficiency initiatives across the City to assist in finding new areas of improvements to leverage. After the Budget was proposed, several budget work sessions were held to provide City Council an opportunity to review the proposed service program details included in the proposed budget. Additionally, the City held five Community Budget Open House meetings and two City-Wide Public Hearings after the fiscal year 2016 Budget was proposed for community input. The City is required to hold at least one public hearing on the proposed budget during the period of its consideration. On Thursday, September 15, 2016, City Council adopted the fiscal year 2016 Operating and Capital Budget. City Council must adopt a final budget each year no later than September 27th. The appropriated budget is prepared by fund (e.g., General Fund) and department (e.g., Finance Department). The legal level of budgetary control is approved by City Council at the individual fund and departmental level. Expenditures by department and major category (personnel, non-personnel, and capital outlay) are further defined in the budget document.
- xiv -
FINANCIAL INFORMATION (continued)
The City Manager or designee may revise the approved department expenditure allotments during the fiscal year, but in no event shall the aggregate departmental expenditure allotment exceed the appropriation available to the department unless approved by City Council. The City Council may at any time transfer any unencumbered appropriation balance or any portion thereof within a department office or agency to another upon written recommendation by the City Manager. As a means of managing the City’s financial standing, the City established and maintains a budgeted financial reserve within the General Fund. The financial reserve provides budgetary flexibility for unexpected events, financial emergencies, and the usual fluctuation in revenue-expenditure patterns. In fiscal year 2016 the City’s budgeted reserve was 10.0% and the two year budgeted financial reserve was increased to 5.0%. Since 2005, the City has increased its financial reserves from 3.4% of total appropriations to 10.0% of total resources in fiscal year 2016. The total Budgeted Financial reserve for fiscal year 2016 is $109.6 million. The contingency reserve for the General Fund is $1.0 million. Additionally, the City maintained the Public Safety budgets at 66.0% of General Fund. The City continues to evaluate the financial reserve policy as a means of fiscal prudence in consideration with City operations, implications to the City’s credit rating, and City Council priorities in order to maintain a strong and solid financial position coupled with flexibility to adapt to changing economic conditions. The City further utilizes a comprehensive debt management financial planning program, which is updated annually and is a major component of the City’s financial planning. The model projects financing needs, measuring and assessing the cost and timing of each debt issuance. It involves comprehensive financial analysis, which utilizes computer modeling, and incorporates variables such as interest rate sensitivity, assessed value changes, annexations and current ad valorem tax collection rates. Use of this financial management tool has assisted the City in meeting its financing needs by facilitating timely and thorough planning, thus allowing the City to capitalize on market opportunities.
GRANT FUNDS
The City also actively seeks and applies for Federal and State grants that are in line with the City’s core operations or initiatives, as an additional tool in providing services to the citizens of San Antonio. In 2016, the City was awarded $80.0 million in Federal assistance and $18.6 million in State assistance for a total of $98.6 million. The City would have been unable to undertake the construction of public improvements and the operation of programs without the support of these grants.
AWARDS
The City maintains a strong financial position with the three major rating agencies - Fitch, Moody’s, and Standard & Poors, re-affirming, for the seventh year in a row, an ‘AAA’, ‘Aaa’, and ‘AAA’ general obligation bond rating, respectively. These ratings were maintained despite stricter grading requirements implemented by some rating agencies. The City is the only city with a population of more than 1 million to receive an ‘AAA’ or ‘Aaa’ rating from the three major rating agencies. The ‘AAA’ or ‘Aaa’ bond rating is the highest credit rating that an entity can receive. OMB received the Annual Distinguished Budget Award from the Government Finance Officers Association, recognizing outstanding achievement in preparation of the 2016 Operating and Capital Budget for the 33rd consecutive year.
- xv -
AWARDS (continued)
OMB additionally received the Performance Measurement Certificate of Excellence Award for the 5th year in a row from the International City/County Management Association (ICMA). San Antonio is one of 34 jurisdictions receiving this highest level of recognition this year. According to the ICMA, “Jurisdictions meeting the qualifications have demonstrated leadership in continuous improvement and community engagement, and they serve as examples for other governments to follow.” The Finance Department received the Achievement of Excellence in Procurement (AEP) award for the 19th consecutive year in recognition of organizational excellence in public procurement.
CERTIFICATE OF ACHIEVEMENT FOR EXCELLENCE IN FINANCIAL REPORTING The Government Finance Officers Association of the United States and Canada (GFOA) awarded a Certificate of Achievement for Excellence in Financial Reporting to the City for its CAFR for the fiscal year-ended September 30, 2015. This was the 40th consecutive year that the government has achieved this prestigious award. In order to be awarded a Certificate of Achievement, a government must publish an easily readable and efficiently organized CAFR. This report satisfies both GAAP and applicable legal requirements. A Certificate of Achievement is valid for a period of one year only. We believe that our current CAFR continues to meet the Certificate of Achievement Program’s requirements, and we are submitting it to the GFOA to determine its eligibility for another certificate.
INDEPENDENT AUDITS
State statutes and the City’s Charter require that an annual audit by an independent certified public accountant be conducted. The City selected the accounting firm Padgett Stratemann & Co., LLP. In addition to meeting the requirements set forth in State statutes and the City’s Charter, the audit was also designed to meet the requirements of the Single Audit Act Amendments of 1996, Title 2 U.S. Code of Federal Regulation Uniform Administrative Requirements, Cost Principles, and Audit Requirements for Federal Awards, Audit of State and Local Government and Nonprofit Organizations and State of Texas Single Audit Circular. The Independent Auditor’s Report on the basic financial statements, Management’s Discussion and Analysis, required supplementary information, required disclosures and schedules are included in the Financial Section of this CAFR. The Federal Single Audit Report has been prepared in accordance with the cost principles contained in Title 2 U.S. Code of Federal Regulations Part 200, Uniform Administrative Requirements, Cost Principles, and Audit Requirements for Federal Awards. The State Single Audit Report has been prepared in accordance with the State of Texas Single Audit Circular. The reports are comprised of the Schedules of Expenditures of Federal and State Awards, respectively, Independent Auditor’s Report on Internal Control over Financial Reporting and on Compliance and Other Matters Based on an Audit of Financial Statements Performed in Accordance with Government Auditing Standards, Independent Auditor’s Report on Compliance for each Major Federal Program and on Internal Control Over Compliance as Required by the Uniform Guidance, Independent Auditor’s Report on Compliance for each Major State Program and on Internal Control Over Compliance as Required by the State of Texas Single Audit Circular, the Schedule of Findings and Questioned Costs, Corrective Action Plans, and the Summary Status of Prior Year Findings for both the Federal and State Single Audits.
- xvi -
ACKNOWLEDGEMENTS The preparation of this report could not have been accomplished without the dedicated services of the entire staff of the Controller’s Office in the Finance Department. Much time and effort in preparation of this report lies in the Controller’s Office, with support from OMB, Department Fiscal Administrators, the Finance Department, and other financial staff throughout the City. I would like to express my appreciation to all who assisted in this effort. We acknowledge the thorough, professional, and timely manner in which our independent auditor, Padgett Stratemann & Co., LLP, conducted the audit. In closing, please accept my sincere gratitude to the Mayor and City Council, City Manager, Deputy City Managers, Assistant City Managers, and their staff for their continued support. Respectfully submitted,
Ben Gorzell Jr., CPA Chief Financial Officer
xv
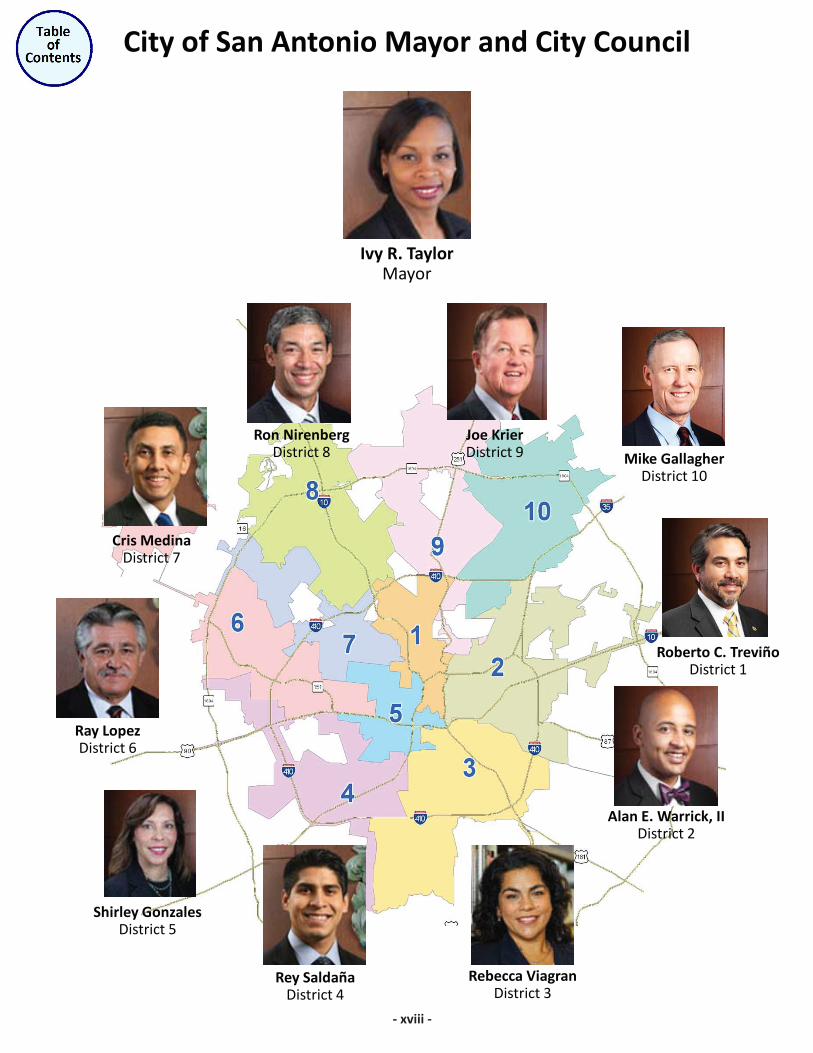
Shirley Gonzales District 5
Rey Saldaña District 4
Rebecca Viagran District 3
Alan E. Warrick, II District 2
Mike Gallagher District 10
Joe Krier District 9
Ron Nirenberg District 8
Ray Lopez District 6
City of San Antonio Mayor and City Council
Ivy R. Taylor Mayor
Roberto C. Treviño District 1
Cris Medina District 7
xviii
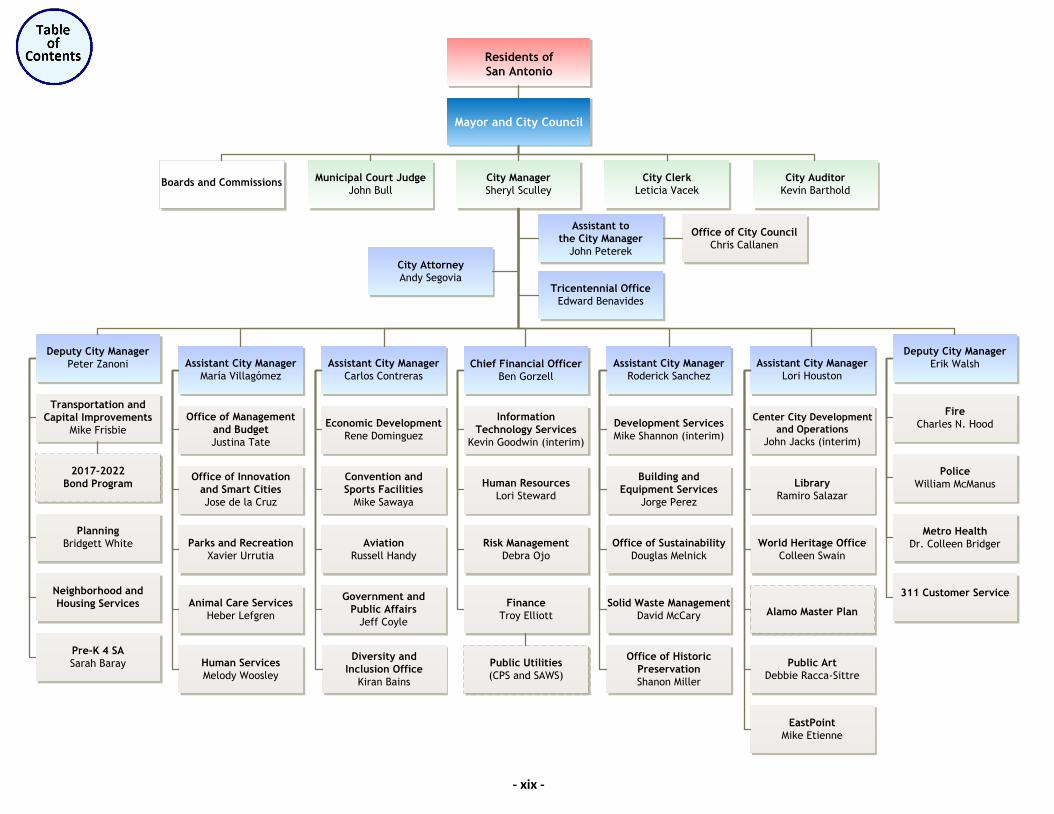
Residents of
San Antonio
Boards and Commissions
Municipal Court Judge
John Bull
City Auditor
Kevin Barthold
City Clerk
Leticia Vacek
City Manager
Sheryl Sculley
Chief Financial Officer
Ben Gorzell
Information
Technology Services
Kevin Goodwin (interim)
Human Resources
Lori Steward
Finance
Troy Elliott
Public Utilities
(CPS and SAWS)
Assistant City Manager
Carlos Contreras
Government and
Public Affairs
Jeff Coyle
Convention and
Sports Facilities
Mike Sawaya
Economic Development
Rene Dominguez
Aviation
Russell Handy
Tricentennial Office
Edward Benavides
Deputy City Manager
Erik Walsh
Fire
Charles N. Hood
Metro Health
Dr. Colleen Bridger
311 Customer Service
Police
William McManus
Assistant to
the City Manager
John Peterek
Office of City Council
Chris Callanen
Assistant City Manager
Lori Houston
EastPoint
Mike Etienne
Public Art
Debbie Racca-Sittre
Center City Development
and Operations
John Jacks (interim)
Library
Ramiro Salazar
Alamo Master Plan
World Heritage Office
Colleen Swain
Assistant City Manager
María Villagómez
Human Services
Melody Woosley
Office of Innovation
and Smart Cities
Jose de la Cruz
Office of Management
and Budget
Justina Tate
Animal Care Services
Heber Lefgren
City Attorney
Andy Segovia
Deputy City Manager
Peter Zanoni
Pre-K 4 SA
Sarah Baray
Planning
Bridgett White
Neighborhood and
Housing Services
2017-2022
Bond Program
Transportation and
Capital Improvements
Mike Frisbie
Diversity and
Inclusion Office
Kiran Bains
Parks and Recreation
Xavier Urrutia
CITY OF SAN ANTONIOOrganizational Chart
Effective February 2, 2017
Mayor and City Council
Assistant City Manager
Roderick Sanchez
Solid Waste Management
David McCary
Building and
Equipment Services
Jorge Perez
Development Services
Mike Shannon (interim)
Office of Sustainability
Douglas Melnick
Office of Historic
Preservation
Shanon Miller
Risk Management
Debra Ojo
- xix -

FINANCIAL SECTION
FINANCIALSECTION
Independent Auditor’s Report
AUSTIN HOUSTON SAN ANTONIO811 BARTON SPRINGS ROAD, SUITE 550 1980 POST OAK BOULEVARD, SUITE 1100 100 N.E. LOOP 410, SUITE 1100 TOLL FREE: 800 879 4966AUSTIN, TEXAS 78704 HOUSTON, TEXAS 77056 SAN ANTONIO, TEXAS 78216 WEB: PADGETT CPA.COM512 476 0717 713 335 8630 210 828 6281
Independent Auditor’s Report
To the Honorable Mayor and Members of the City CouncilCity of San Antonio, Texas
Report on the Financial Statements
Wehave audited the accompanying financial statements of the governmental activities, the business typeactivities, the aggregate discretely presented component units, each major fund, and the aggregateremaining fund information of the City of San Antonio, Texas (the “City”) as of and for the year endedSeptember 30, 2016, and the related notes to the financial statements, which collectively comprise theCity’s basic financial statements as listed in the table of contents.
Management’s Responsibility for the Financial Statements
Management is responsible for the preparation and fair presentation of these financial statements inaccordance with accounting principles generally accepted in the United States of America; this includesthe design, implementation, and maintenance of internal control relevant to the preparation and fairpresentation of financial statements that are free from material misstatement, whether due to fraud orerror.
Auditor’s Responsibility
Our responsibility is to express opinions on these financial statements based on our audit. We did notaudit the financial statements of HemisFair Park Area Redevelopment Corporation; San Antonio EconomicDevelopment Corporation; Westside Development Corporation; San Antonio Fire and Police PensionFund; or the San Antonio Fire and Police Retiree Health Care Fund; blended and fiduciary componentunits, which represent 75%, 84%, and 9%, respectively, of the assets and deferred outflows, netposition/fund balances, and revenues/additions of the aggregate remaining fund information. We alsodid not audit Brooks Development Authority, CPS Energy; SA Energy Acquisition Public FacilityCorporation; San Antonio Housing Trust Finance Corporation; San Antonio Housing Trust Foundation, Inc.;or San Antonio Housing Trust Public Facility Corporation; discretely presented component units, whichrepresent 66%, 57%, and 79%, respectively, of the assets and deferred outflows, net position, andrevenues of the discretely presented component units. Those financial statements were audited by otherauditors whose reports have been furnished to us, and our opinion, insofar as it relates to the amountsincluded for those component units, is based solely on the report of the other auditors. We conductedour audit in accordance with auditing standards generally accepted in the United States of America andthe standards applicable to financial audits contained in Government Auditing Standards, issued by theComptroller General of the United States. Those standards require that we plan and perform the audit toobtain reasonable assurance about whether the financial statements are free from materialmisstatement. The financial statements of CPS Energy, SA Energy Acquisition Public Facility Corporation,
San Antonio Economic Development Corporation, Westside Development Corporation, San AntonioHousing Trust Finance Corporation, San Antonio Housing Trust Public Facility Corporation, and SanAntonio Water System – District Special Project, audited separately by other auditors, were not auditedin accordance with Government Auditing Standards.
An audit involves performing procedures to obtain audit evidence about the amounts and disclosures inthe financial statements. The procedures selected depend on the auditor’s judgment, including theassessment of the risks of material misstatement of the financial statements, whether due to fraud orerror. In making those risk assessments, the auditor considers internal control relevant to the City’spreparation and fair presentation of the financial statements in order to design audit procedures that areappropriate in the circumstances, but not for the purpose of expressing an opinion on the effectivenessof the City’s internal control. Accordingly, we express no such opinion. An audit also includes evaluatingthe appropriateness of accounting policies used and the reasonableness of significant accountingestimates made by management, as well as evaluating the overall presentation of the financialstatements.
We believe that the audit evidence we have obtained is sufficient and appropriate to provide a basis forour audit opinions.
Opinions
In our opinion, based on our audit and the reports of other auditors, the financial statements referred toabove present fairly, in all material respects, the respective financial position of the governmentalactivities, the business type activities, the aggregate discretely presented component units, each majorfund, and the aggregate remaining fund information of the City as of September 30, 2016, and therespective changes in financial position and, where applicable, cash flows thereof for the year then ended,in conformity with accounting principles generally accepted in the United States of America.
Emphasis of Matter
As described in Note 1 to the financial statements, effective October 1, 2015, the City implementedGovernmental Accounting Standards Board (“GASB”) Statement No. 72, Fair Value Measurement andApplication; GASB Statement No. 73, Accounting and Financial Reporting for Pensions and Related Assetsthat are not within the Scope of GASB 68, and Amendments to Certain Provisions of GASB Statements 67and 68; GASB Statement No. 76, The Hierarchy of Generally Accepted Accounting Principle for State andLocal Governments; and GASB Statement No. 79, Certain External Investment Pools and Pool Participants.Our opinions are not modified with respect to these matters.
As described in Note 18 to the financial statements, the City restated beginning net position for the AirportFund and business type activities to correct the accounting for certain reimbursement for project costsfrom bond proceeds. Our opinions are not modified with respect to this matter.
As described in Note 1 to the financial statements, the Fire and Police Pension Fund and Fire and PoliceRetiree Health Care Fund fiscal year changed from a September 30th year end to a December 31st yearend. As a result, the December 31, 2015 audit results presented in the financial statements reflect a threemonth period. Additionally, this fiscal year change required the City to change their measurement datefor the net pension liability related to the Fire and Police Pension Pan from a September 30th date toDecember 31. As a result, the City reported 15 months of pension expense related to this plan. Ouropinions are not modified with respect to this matter.
Other Matters
Required Supplementary Information
Accounting principles generally accepted in the United States of America require that the Management’sDiscussion and Analysis, Budgetary Comparison Schedule – General Fund, Budgetary ComparisonSchedule – Pre K 4 SA, Schedule of Funding Progress, Schedule of Changes in the Net Pension Liability andRelated Ratios, and Schedule of Contributions, as listed in the table of contents, as well as notes torequired supplementary information, be presented to supplement the basic financial statements. Suchinformation, although not a part of the basic financial statements, is required by GASB, who considers itto be an essential part of financial reporting for placing the basic financial statements in an appropriateoperational, economic, or historical context. We have applied certain limited procedures to the requiredsupplementary information in accordance with auditing standards generally accepted in the United Statesof America, which consisted of inquiries of management about the methods of preparing the informationand comparing the information for consistency with management’s responses to our inquiries, the basicfinancial statements, and other knowledge we obtained during our audit of the basic financial statements.We do not express an opinion or provide any assurance on the information because the limitedprocedures do not provide us with sufficient evidence to express an opinion or provide any assurance.
Other Information
Our audit was conducted for the purpose of forming opinions on the financial statements that collectivelycomprise the City’s basic financial statements. The Combining Financial Statements and Schedules,Supplementary Budget and Actual Schedules for Legally Adopted Funds, Capital Assets Used in theOperation of Governmental Funds, Schedule of Expenditures of Federal Awards, as required by Title 2 U.S.Code of Federal Regulations Part 200, Uniform Administrative Requirements, Cost Principles, and AuditRequirements for Federal Awards, and Schedule of Expenditures of State Awards, as required by the Stateof Texas Single Audit Circular, and other information, such as the Introductory Section and the StatisticalSection, as listed in the table of contents, are presented for purposes of additional analysis and are not arequired part of the basic financial statements.
The Combining Financial Statements and Schedules, Supplementary Budget and Actual Schedules forLegally Adopted Funds, Capital Assets Used in the Operation of Governmental Funds, Schedule ofExpenditures of Federal Awards, and Schedule of Expenditures of State Awards are the responsibility ofmanagement and were derived from, and relate directly to, the underlying accounting and other recordsused to prepare the basic financial statements. Such information has been subjected to the auditingprocedures applied in the audit of the basic financial statements and certain additional procedures,including comparing and reconciling such information directly to the underlying accounting and otherrecords used to prepare the basic financial statements or to the basic financial statements themselves,
and other additional procedures in accordance with auditing standards generally accepted in the UnitedStates of America. In our opinion, the Combining Financial Statements and Schedules, SupplementaryBudget and Actual Schedules for Legally Adopted Funds, Capital Assets Used in the Operation ofGovernmental Funds, Schedule of Expenditures of Federal Awards, and Schedule of Expenditures of StateAwards are fairly stated, in all material respects, in relation to the basic financial statements as a whole.
The Introductory and Statistical Sections have not been subjected to the auditing procedures applied inthe audit of the basic financial statements and, accordingly, we do not express an opinion or provide anyassurance on them.
Other Reporting Required by Government Auditing Standards
In accordance with Government Auditing Standards, we have also issued our report dated March 9, 2017on our consideration of the City’s internal control over financial reporting and on our tests of itscompliance with certain provisions of laws, regulations, contracts, and grant agreements and othermatters. The purpose of that report is to describe the scope of our testing of internal control over financialreporting and compliance and the results of that testing, and not to provide an opinion on internal controlover financial reporting or on compliance. That report is an integral part of an audit performed inaccordance with Government Auditing Standards in considering City’s internal control over financialreporting and compliance.
San Antonio, TexasMarch 9, 2017

Management’s Discussion and
Analysis(Required Supplementary Information)
(Unaudited)
- 1 -
The City of San Antonio (City) presents the following discussion and analysis of the City’s financial performance during the fiscal year-ended September 30, 2016. This discussion and analysis is intended to assist readers in focusing on significant financial issues and changes in the City’s financial position, and identifying any significant variances from the adopted budget. We encourage readers to consider the information presented here in conjunction with additional information that we have furnished in our letter of transmittal and the financial statements provided in this report. All amounts, unless otherwise indicated, are expressed in thousands of dollars.
Financial Highlights
The assets and deferred outflows of the City exceeded its liabilities and deferred inflows by $2,548,108 which is a decrease of $33,773 from prior year’s net position. A deficit ending balance of ($633,793) in unrestricted net position is primarily due to the City’s net pension liability of $1,136,843 less $347,833 related to unamortized deferred inflows and outflows.
At the end of the current fiscal year, the City’s governmental funds reported combined ending fund balances of $1,005,969, a decrease of $99,035 compared to the fiscal year 2015 fund balance. Of this amount, $18,316 is nonspendable, $645,453 is restricted in use, $121,645 has been committed, $38,961 is assigned and $181,594 is unassigned.
The establishment and maintenance of appropriate reserves within the General Fund is critical to prudent financial management. At the end of the current fiscal year, unassigned fund balance for the General Fund was $192,072 which is 18.7% of the total General Fund expenditures. The unassigned fund balance represents $109,630 in financial reserves. City Council approved financial policies which require the City to maintain a 10% budgeted financial reserve. In addition at the end of fiscal year 2016, $69,732, or 5% of revenues, was reserved for a two-year balanced budget. The General Fund available ending balance is $7,134 better than anticipated when compared to re-estimated fiscal year 2016 budget. The remaining $5,576 of the unassigned fund balance is GASB 54 balances, which are other funds reported within the General Fund.
Overview of the Financial Statements
This discussion and analysis is intended to serve as the introduction to the City’s basic financial statements, which have three components: 1) government-wide financial statements, 2) fund financial statements, and 3) notes to the financial statements.
Government-wide Financial Statements
The government-wide financial statements are designed to provide readers with a broad overview of the City’s finances, in a manner similar to private-sector business financial presentation. The statement of net position reports the difference between assets, deferred outflows, liabilities and deferred inflows as net position. Over time, increases or decreases in net position may help determine whether the financial position of the City is improving or deteriorating. The statement of activities presents information showing how the government’s net position changed during the fiscal year. Changes in net position are recorded when the underlying event giving rise to the change occurs regardless of the timing of the cash flows. Therefore, revenues and expenses reported in this statement for some items will not result in cash flows until future fiscal periods (e.g., uncollected taxes and earned but unused vacation
Management’s Discussion and Analysis
- 2 -
leave). Both of the government-wide financial statements distinguish functions of the City that are principally supported by taxes and intergovernmental revenues (governmental activities) from other functions that are intended to recover all or a significant portion of their costs through user fees or charges (business-type activities). Governmental activities include general government, public safety, public works, sanitation, health services, culture and recreation, convention and tourism, urban redevelopment and housing, welfare, education, and economic development and opportunity. The business-type activities of the City include the Airport System, Development Services, Market Square, Parking System, and Solid Waste Management. In addition, the basic financial statements provide information regarding the City’s legally separate discretely presented component units. Discretely presented component unit financial information is reported separately from the primary government in the government-wide financial statements.
Fund Financial Statements
The accounts of the City are organized on the basis of funds, each of which is considered a separate accounting entity. Government resources are allocated to and accounted for in individual funds based upon the purposes for which they are to be spent and the means by which spending activities are controlled. Fund financial statements are used to present financial information detailing resources that have been identified for specific activities. The focus of the fund financial statements is on the City’s major funds, although nonmajor funds are also presented in aggregate and further detailed in the supplementary statements. The City uses fund accounting to ensure and demonstrate compliance with requirements placed on resources. Funds are divided into three categories: governmental, proprietary, and fiduciary. Fund financial statements allow the City to present information regarding fiduciary funds, since they are not reported in the government-wide financial statements. Governmental Funds – Governmental funds are used for essentially the same functions reported in the governmental activities in the government-wide financial statements. However, unlike the government-wide statement, governmental fund financial statements focus on the near-term inflows and outflows of spendable resources, as well as on balances of spendable resources available at the end of the fiscal year. Such information may be useful in evaluating a government’s near-term financing requirements. As the focus of governmental funds is narrower than that of the government-wide financial statements, it is useful to compare the information presented in the governmental funds with similar information presented for governmental activities in the government-wide financial statements. By doing so, readers may better understand the long-term impact of the government’s near-term financing decisions. Both the governmental fund balance sheet and the governmental fund statement of revenues, expenditures, and changes in fund balances provide a reconciliation to facilitate this comparison between governmental funds and governmental activities. The City maintains five individual governmental fund types for financial reporting purposes. The governmental fund types are General Fund, Special Revenue Funds, Capital Projects Funds, Debt Service Funds, and Permanent Funds. Information is presented separately in the governmental fund balance sheet and in the governmental fund statement of revenues, expenditures, and changes in fund balances for the General Fund, Debt Service, San Antonio Early Childhood Education Municipal Development Corporation (Pre-K 4 SA), Convention Center Hotel Finance Corporation (CCHFC), 2012 General Obligation Bonds, and General Obligation Projects Fund, all of which are considered to be major funds. Data from the other funds are combined into a single, aggregated presentation labeled “Nonmajor Governmental Funds.” Individual fund data for each nonmajor governmental fund is provided in the form of combining statements elsewhere in this report. Proprietary Funds – The City maintains two types of proprietary funds. Enterprise Funds are used to report the functions presented in business-type activities in the government-wide financial statements. The City uses enterprise funds to account for its Airport System, Development Services, Market Square, Parking System, and Solid Waste Management. Internal Service Funds are used to accumulate and allocate costs internally among the City’s various functions, including, self-insurance programs, information services, other internal services, and capital improvements management services. The services provided by these funds predominantly support the governmental rather than the
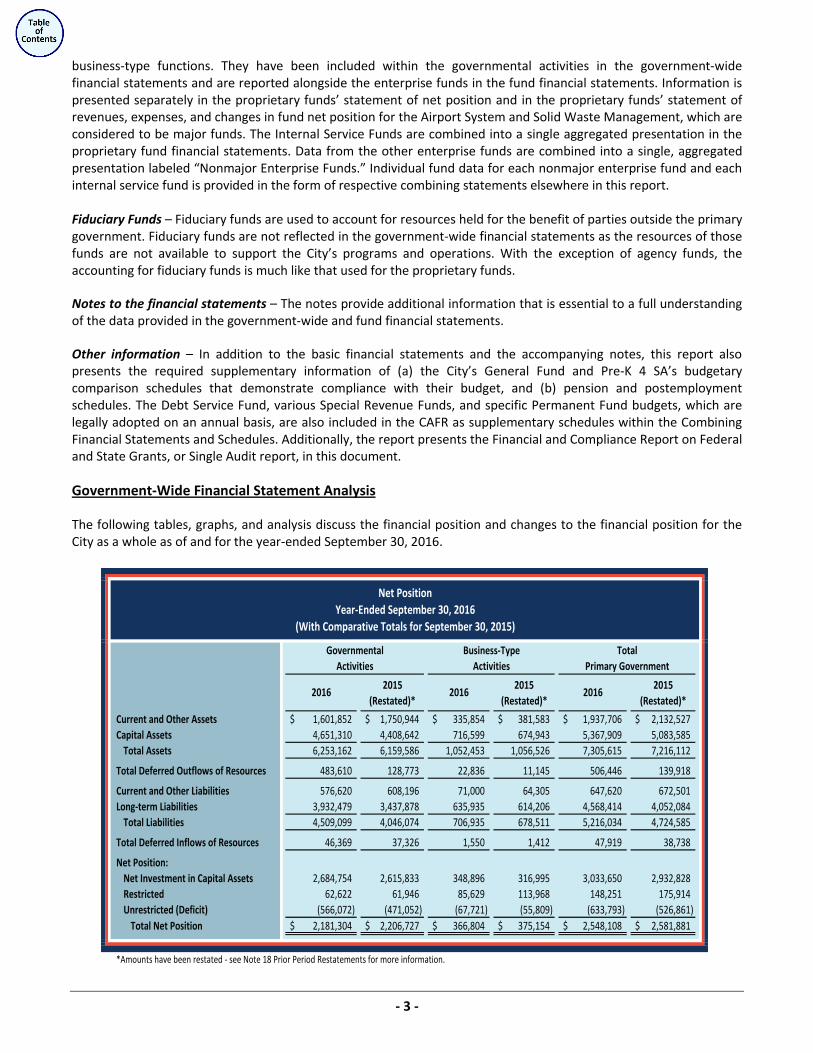
- 3 -
business-type functions. They have been included within the governmental activities in the government-wide financial statements and are reported alongside the enterprise funds in the fund financial statements. Information is presented separately in the proprietary funds’ statement of net position and in the proprietary funds’ statement of revenues, expenses, and changes in fund net position for the Airport System and Solid Waste Management, which are considered to be major funds. The Internal Service Funds are combined into a single aggregated presentation in the proprietary fund financial statements. Data from the other enterprise funds are combined into a single, aggregated presentation labeled “Nonmajor Enterprise Funds.” Individual fund data for each nonmajor enterprise fund and each internal service fund is provided in the form of respective combining statements elsewhere in this report. Fiduciary Funds – Fiduciary funds are used to account for resources held for the benefit of parties outside the primary government. Fiduciary funds are not reflected in the government-wide financial statements as the resources of those funds are not available to support the City’s programs and operations. With the exception of agency funds, the accounting for fiduciary funds is much like that used for the proprietary funds. Notes to the financial statements – The notes provide additional information that is essential to a full understanding of the data provided in the government-wide and fund financial statements. Other information – In addition to the basic financial statements and the accompanying notes, this report also presents the required supplementary information of (a) the City’s General Fund and Pre-K 4 SA’s budgetary comparison schedules that demonstrate compliance with their budget, and (b) pension and postemployment schedules. The Debt Service Fund, various Special Revenue Funds, and specific Permanent Fund budgets, which are legally adopted on an annual basis, are also included in the CAFR as supplementary schedules within the Combining Financial Statements and Schedules. Additionally, the report presents the Financial and Compliance Report on Federal and State Grants, or Single Audit report, in this document.
Government-Wide Financial Statement Analysis
The following tables, graphs, and analysis discuss the financial position and changes to the financial position for the City as a whole as of and for the year-ended September 30, 2016.
2015 2015 2015(Restated)* (Restated)* (Restated)*
Current and Other Assets 1,601,852$ 1,750,944$ 335,854$ 381,583$ 1,937,706$ 2,132,527$ Capital Assets 4,651,310 4,408,642 716,599 674,943 5,367,909 5,083,585
Total Assets 6,253,162 6,159,586 1,052,453 1,056,526 7,305,615 7,216,112
Total Deferred Outflows of Resources 483,610 128,773 22,836 11,145 506,446 139,918
Current and Other Liabilities 576,620 608,196 71,000 64,305 647,620 672,501 Long-term Liabilities 3,932,479 3,437,878 635,935 614,206 4,568,414 4,052,084
Total Liabilities 4,509,099 4,046,074 706,935 678,511 5,216,034 4,724,585
Total Deferred Inflows of Resources 46,369 37,326 1,550 1,412 47,919 38,738
Net Position:Net Investment in Capital Assets 2,684,754 2,615,833 348,896 316,995 3,033,650 2,932,828 Restricted 62,622 61,946 85,629 113,968 148,251 175,914 Unrestricted (Deficit) (566,072) (471,052) (67,721) (55,809) (633,793) (526,861)
Total Net Position 2,181,304$ 2,206,727$ 366,804$ 375,154$ 2,548,108$ 2,581,881$
*Amounts have been restated - see Note 18 Prior Period Restatements for more information.
2016 2016 2016
Activities Activities Primary Government
Net PositionYear-Ended September 30, 2016
(With Comparative Totals for September 30, 2015)
Governmental Business-Type Total
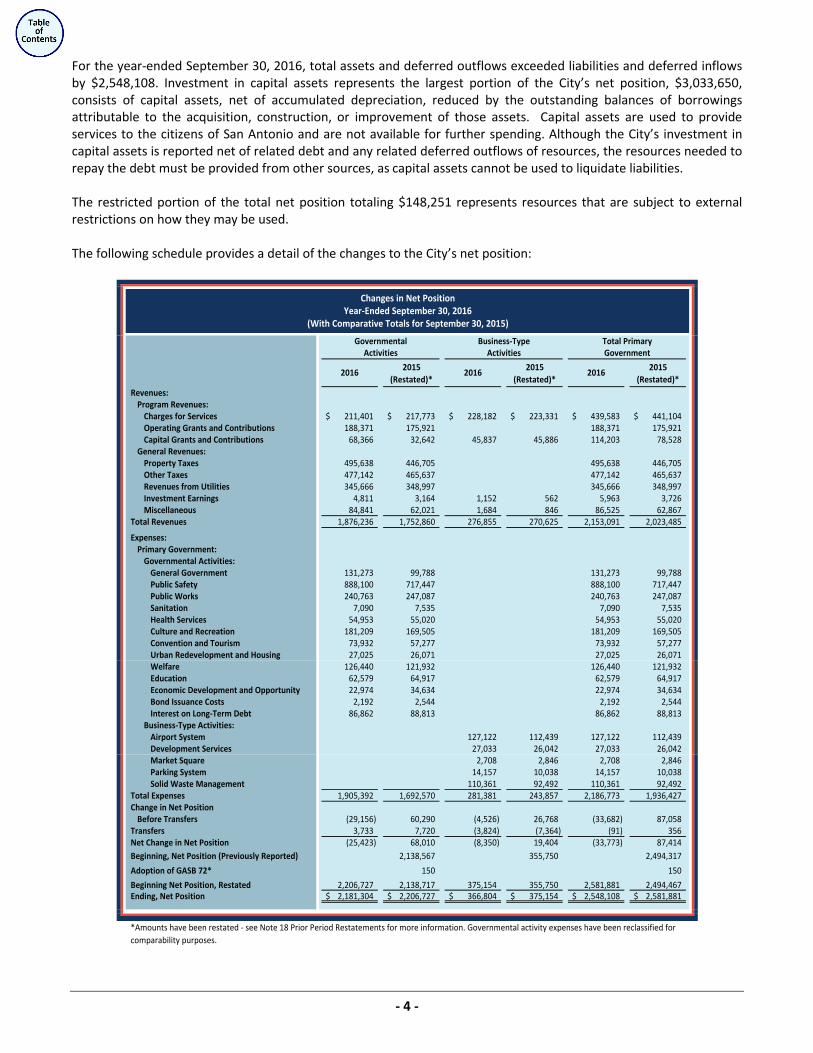
- 4 -
For the year-ended September 30, 2016, total assets and deferred outflows exceeded liabilities and deferred inflows by $2,548,108. Investment in capital assets represents the largest portion of the City’s net position, $3,033,650, consists of capital assets, net of accumulated depreciation, reduced by the outstanding balances of borrowings attributable to the acquisition, construction, or improvement of those assets. Capital assets are used to provide services to the citizens of San Antonio and are not available for further spending. Although the City’s investment in capital assets is reported net of related debt and any related deferred outflows of resources, the resources needed to repay the debt must be provided from other sources, as capital assets cannot be used to liquidate liabilities. The restricted portion of the total net position totaling $148,251 represents resources that are subject to external restrictions on how they may be used. The following schedule provides a detail of the changes to the City’s net position:
2015 2015 2015(Restated)* (Restated)* (Restated)*
Revenues:Program Revenues:
Charges for Services 211,401$ 217,773$ 228,182$ 223,331$ 439,583$ 441,104$ Operating Grants and Contributions 188,371 175,921 188,371 175,921 Capital Grants and Contributions 68,366 32,642 45,837 45,886 114,203 78,528
General Revenues:Property Taxes 495,638 446,705 495,638 446,705 Other Taxes 477,142 465,637 477,142 465,637 Revenues from Utilities 345,666 348,997 345,666 348,997 Investment Earnings 4,811 3,164 1,152 562 5,963 3,726 Miscellaneous 84,841 62,021 1,684 846 86,525 62,867
Total Revenues 1,876,236 1,752,860 276,855 270,625 2,153,091 2,023,485
Expenses:Primary Government:
Governmental Activities:General Government 131,273 99,788 131,273 99,788 Public Safety 888,100 717,447 888,100 717,447 Public Works 240,763 247,087 240,763 247,087 Sanitation 7,090 7,535 7,090 7,535 Health Services 54,953 55,020 54,953 55,020 Culture and Recreation 181,209 169,505 181,209 169,505 Convention and Tourism 73,932 57,277 73,932 57,277 Urban Redevelopment and Housing 27,025 26,071 27,025 26,071 Welfare 126,440 121,932 126,440 121,932 Education 62,579 64,917 62,579 64,917 Economic Development and Opportunity 22,974 34,634 22,974 34,634 Bond Issuance Costs 2,192 2,544 2,192 2,544 Interest on Long-Term Debt 86,862 88,813 86,862 88,813
Business-Type Activities:Airport System 127,122 112,439 127,122 112,439 Development Services 27,033 26,042 27,033 26,042 Market Square 2,708 2,846 2,708 2,846 Parking System 14,157 10,038 14,157 10,038 Solid Waste Management 110,361 92,492 110,361 92,492
Total Expenses 1,905,392 1,692,570 281,381 243,857 2,186,773 1,936,427 Change in Net Position
Before Transfers (29,156) 60,290 (4,526) 26,768 (33,682) 87,058 Transfers 3,733 7,720 (3,824) (7,364) (91) 356 Net Change in Net Position (25,423) 68,010 (8,350) 19,404 (33,773) 87,414 Beginning, Net Position (Previously Reported) 2,138,567 355,750 2,494,317
Adoption of GASB 72* 150 150
Beginning Net Position, Restated 2,206,727 2,138,717 375,154 355,750 2,581,881 2,494,467 Ending, Net Position 2,181,304$ 2,206,727$ 366,804$ 375,154$ 2,548,108$ 2,581,881$
*Amounts have been restated - see Note 18 Prior Period Restatements for more information. Governmental activity expenses have been reclassified for comparability purposes.
2016 2016 2016
Activities Activities Government
Changes in Net PositionYear-Ended September 30, 2016
(With Comparative Totals for September 30, 2015)
Governmental Business-Type Total Primary
- 5 -
The City’s total revenues were $2,153,091 for fiscal year-ended September 30, 2016. Revenues from Governmental Activities totaled $1,876,236 (87.1%) and revenues from Business-Type activities totaled $276,855 (12.9%). Expenses for the City totaled $2,186,773. Of total expenses, Governmental Activity expenses totaled $1,905,392 (87.1%) and Business-Type expenses totaled $281,381 (12.9%).
Governmental Activities
Program revenues for the City’s Governmental Activities totaled $468,138, which is $41,802 higher than the previous fiscal year’s balance of $426,336. General revenues for the City’s Governmental Activities totaled $1,408,098 compared to $1,326,524 in the prior year. General revenues represented 65.5% of the City’s total revenue, while program revenues provided 34.5% of revenue received in fiscal year 2016. Expenses for Governmental Activities were $1,905,392 compared to prior year’s expenses of $1,692,570. The City’s net position in governmental activities decreased by $25,423. The following analysis highlights the more significant changes:
Charges for Services revenues decreased by $6,372. Revenues from the Ambulance Supplemental Payment program decreased by $7,911, primarily as a result of the State processing payments for claim years 2013 and 2014, resulting in the recording of two years of claim supplements in fiscal year 2015. This decrease is partially offset against the increase in revenues the City received for both Riverbarge and wrecker services due to the fee increases implemented with the new contracts in fiscal year 2016.
Capital Grant and Contribution revenues increased by $35,724. Contributions from Bexar County, CPS Energy, and SAWS were utilized to fund infrastructure for street and drainage projects such as Hausman Road, Seeling Channel Phase II Drainage, Ray Ellison, Blanco Road Phase II, Cherry Street, Theo Avenue and Malone Avenue Corridors.
Property Tax Revenues increased by $48,933 due to an 11.0% increase in the net taxable property value, while the City’s property tax rate decreased from 56.569 to 55.827 cents per $100 of valuation in fiscal year 2016.
Other Taxes Revenues increased by $11,505 primarily in the General Sales and Use Tax, reflecting a continued consumer confidence in the San Antonio area. An increase in hotel room rate and demand increased Hotel Occupancy Taxes by $2,117 from the prior year.
Miscellaneous Revenues increased by $22,820. The General Fund recognized increases of $1,900 for the sale of the German English School and $1,161 for the recovery of prior year expenditures from the City’s Fleet Operations Department. The Medicaid Waiver fund recognized an increase of $2,000 for operational support from the Texas Department of State Health Services due to the City successfully meeting its metrics as dictated by the program. Convention and Visitor Facilities recognized $2,600 one-time contributions from the RK Group and SMG Savor for its food and beverage contracts. Additionally, revenues increased by $2,655 in the Equipment and Renewal Replacement Fund for the sale of older vehicles due to higher vehicle replacement volume. The City received donated land from Bexar County in the amount of $7,040 for the Laddie I and II Detention Ponds.
The increase of $31,485 in General Government expenses is primarily attributed to a portion of the Henry B. Gonzalez Convention Center being impaired in connection with the opening of the newly transformed Convention Center.
The increase of $170,653 in Public Safety expenses is attributed primarily to the increase in pension related expenses for both police and fire personnel. Other factors contributing to the increase include the flex medical assessment required to fund uniformed employees health costs increased from $16 to $19 per employee; retiree payouts increased $3,260, and overtime in the Fire Department increased $2,160 primarily due to vacancies in the department.
Public Works reflected a decrease of $6,324 due to one-time expenses incurred in fiscal year 2015 for the Witte Museum and repairs and maintenance on street projects.
- 6 -
The $11,660 decrease in Economic Development Opportunity expenditures is mainly attributed to the termination of the Bexar County CIED program and decreased expenditures for new business incentive payments.
Business-Type Activities
Program revenues for the City’s Business-Type Activities totaled $274,019, which is $4,802 higher than the previous fiscal year. The remaining revenues were a result of investment earnings and other miscellaneous items. Expenses for Business-Type Activities were $281,381 compared to prior year’s expenses of $243,857. Business-Type Activities decreased the City’s net position by $8,350 primarily because of the following:
Charges for Services for business-type activities increased by $4,851. The Airport recognized an increase in airline building rental and property leases from tenants such as Fed Ex, Hallmark, and VT Aerospace. In addition, passenger flow from enplanements and deplanements increased by 2.0% when compared to prior year. Solid Waste Management revenues increased by $1,620 due to the new Pay As You Throw program implemented in fiscal year 2016.
Airport reflected an increase in expenses of $14,683 due to continued construction and expenses related to Consolidated Rental Car and Public Parking Facility (CONRAC).
Solid Waste Management reflected a $17,869 increase in expenses due to the implementation of the Pay As You Throw program. The associated expenses include increased staffing, vehicle replacements, and the purchase of recycle and trash containers.
Financial Analysis of Governmental Funds
Activities of the Primary Government’s General Fund, Special Revenue Funds, Debt Service Fund, and Capital Projects Funds are considered general government functions. The General Fund is the City’s primary operating fund. Special Revenue Funds are used to account for the proceeds of specific revenue sources that are restricted or committed to expenditures for specific purposes other than debt service or capital projects. The Debt Service Fund is used to account for financial activity related to the City’s general bonded indebtedness, as well as other long-term obligations. The Capital Projects Funds are used to account for financial activity related to the City indebtedness for Capital Projects, other agency contributions, and the operating activities of those projects. Revenues from taxes increased by $60,423, which is primarily attributable to: (1) a $8,862 increase in general sales and use tax revenues, (2) a $48,918 increase in property tax revenues, and (3) a $2,117 increase in occupancy taxes. The increase in general sales and use taxes and occupancy taxes are a result of a continued consumer confidence in the San Antonio area and an increased activity associated with tourism and convention, while the increase in property taxes is due to higher property valuations and new improvements increasing the levy.
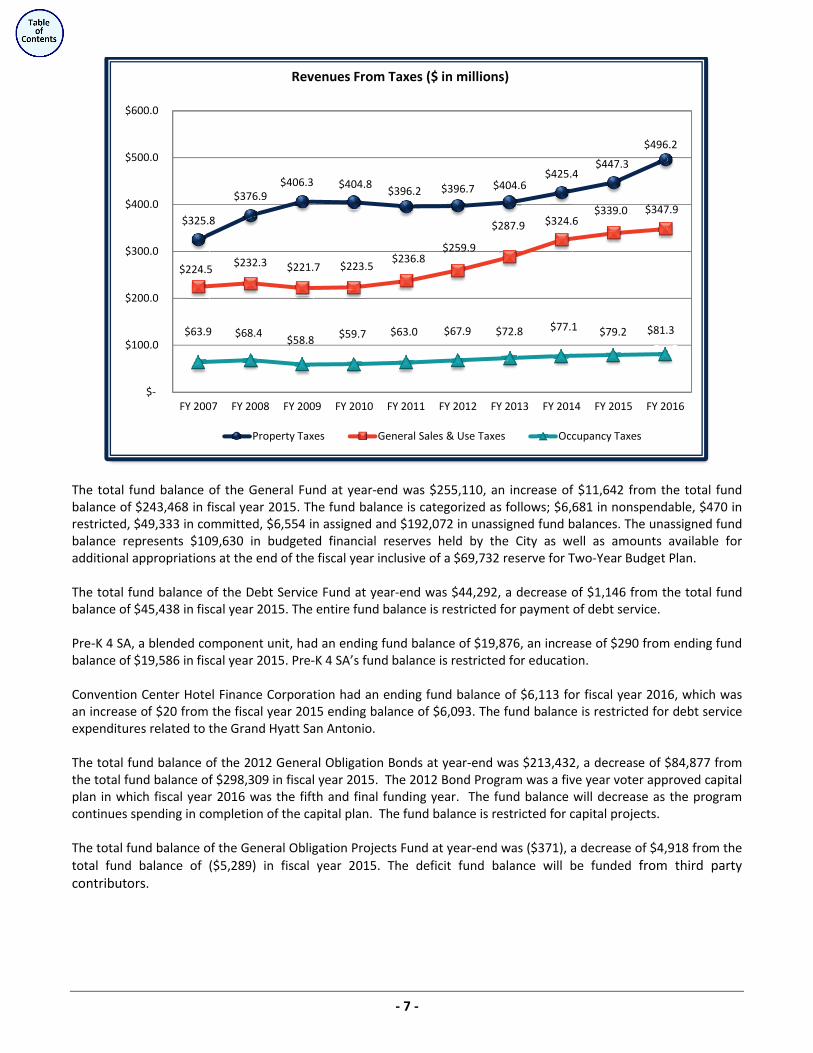
- 7 -
The total fund balance of the General Fund at year-end was $255,110, an increase of $11,642 from the total fund balance of $243,468 in fiscal year 2015. The fund balance is categorized as follows; $6,681 in nonspendable, $470 in restricted, $49,333 in committed, $6,554 in assigned and $192,072 in unassigned fund balances. The unassigned fund balance represents $109,630 in budgeted financial reserves held by the City as well as amounts available for additional appropriations at the end of the fiscal year inclusive of a $69,732 reserve for Two-Year Budget Plan.
The total fund balance of the Debt Service Fund at year-end was $44,292, a decrease of $1,146 from the total fund balance of $45,438 in fiscal year 2015. The entire fund balance is restricted for payment of debt service. Pre-K 4 SA, a blended component unit, had an ending fund balance of $19,876, an increase of $290 from ending fund balance of $19,586 in fiscal year 2015. Pre-K 4 SA’s fund balance is restricted for education.
Convention Center Hotel Finance Corporation had an ending fund balance of $6,113 for fiscal year 2016, which was an increase of $20 from the fiscal year 2015 ending balance of $6,093. The fund balance is restricted for debt service expenditures related to the Grand Hyatt San Antonio.
The total fund balance of the 2012 General Obligation Bonds at year-end was $213,432, a decrease of $84,877 from the total fund balance of $298,309 in fiscal year 2015. The 2012 Bond Program was a five year voter approved capital plan in which fiscal year 2016 was the fifth and final funding year. The fund balance will decrease as the program continues spending in completion of the capital plan. The fund balance is restricted for capital projects.
The total fund balance of the General Obligation Projects Fund at year-end was ($371), a decrease of $4,918 from the total fund balance of ($5,289) in fiscal year 2015. The deficit fund balance will be funded from third party contributors.
$325.8
$376.9 $406.3 $404.8
$396.2 $396.7 $404.6 $425.4
$447.3
$496.2
$224.5 $232.3 $221.7 $223.5 $236.8
$259.9
$287.9 $324.6 $339.0 $347.9
$63.9 $68.4 $58.8 $59.7 $63.0 $67.9 $72.8 $77.1 $79.2 $81.3
$-
$100.0
$200.0
$300.0
$400.0
$500.0
$600.0
FY 2007 FY 2008 FY 2009 FY 2010 FY 2011 FY 2012 FY 2013 FY 2014 FY 2015 FY 2016
Revenues From Taxes ($ in millions)
Property Taxes General Sales & Use Taxes Occupancy Taxes
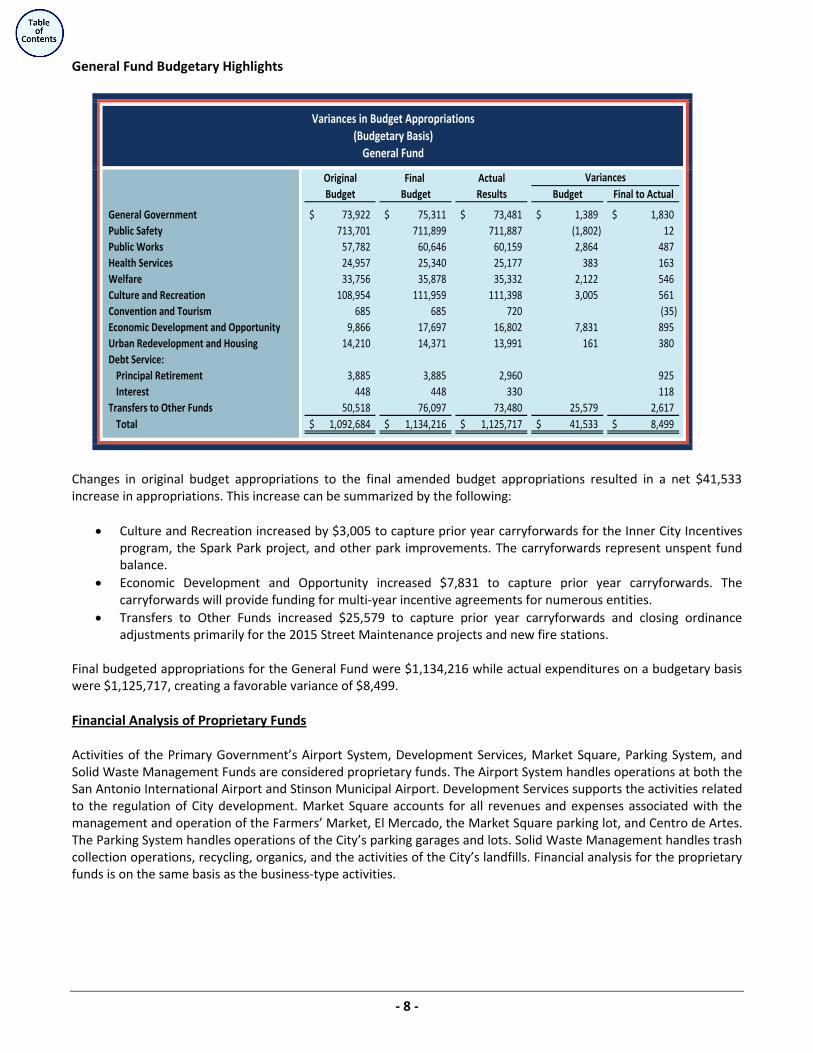
- 8 -
General Fund Budgetary Highlights
Original Final ActualBudget Budget Results Budget Final to Actual
General Government 73,922$ 75,311$ 73,481$ 1,389$ 1,830$ Public Safety 713,701 711,899 711,887 (1,802) 12 Public Works 57,782 60,646 60,159 2,864 487 Health Services 24,957 25,340 25,177 383 163 Welfare 33,756 35,878 35,332 2,122 546 Culture and Recreation 108,954 111,959 111,398 3,005 561 Convention and Tourism 685 685 720 (35) Economic Development and Opportunity 9,866 17,697 16,802 7,831 895 Urban Redevelopment and Housing 14,210 14,371 13,991 161 380 Debt Service:
Principal Retirement 3,885 3,885 2,960 925 Interest 448 448 330 118
Transfers to Other Funds 50,518 76,097 73,480 25,579 2,617 Total 1,092,684$ 1,134,216$ 1,125,717$ 41,533$ 8,499$
Variances in Budget Appropriations(Budgetary Basis)
General Fund
Variances
Changes in original budget appropriations to the final amended budget appropriations resulted in a net $41,533 increase in appropriations. This increase can be summarized by the following:
Culture and Recreation increased by $3,005 to capture prior year carryforwards for the Inner City Incentives program, the Spark Park project, and other park improvements. The carryforwards represent unspent fund balance. Economic Development and Opportunity increased $7,831 to capture prior year carryforwards. The carryforwards will provide funding for multi-year incentive agreements for numerous entities. Transfers to Other Funds increased $25,579 to capture prior year carryforwards and closing ordinance adjustments primarily for the 2015 Street Maintenance projects and new fire stations.
Final budgeted appropriations for the General Fund were $1,134,216 while actual expenditures on a budgetary basis were $1,125,717, creating a favorable variance of $8,499.
Financial Analysis of Proprietary Funds
Activities of the Primary Government’s Airport System, Development Services, Market Square, Parking System, and Solid Waste Management Funds are considered proprietary funds. The Airport System handles operations at both the San Antonio International Airport and Stinson Municipal Airport. Development Services supports the activities related to the regulation of City development. Market Square accounts for all revenues and expenses associated with the management and operation of the Farmers’ Market, El Mercado, the Market Square parking lot, and Centro de Artes. The Parking System handles operations of the City’s parking garages and lots. Solid Waste Management handles trash collection operations, recycling, organics, and the activities of the City’s landfills. Financial analysis for the proprietary funds is on the same basis as the business-type activities.
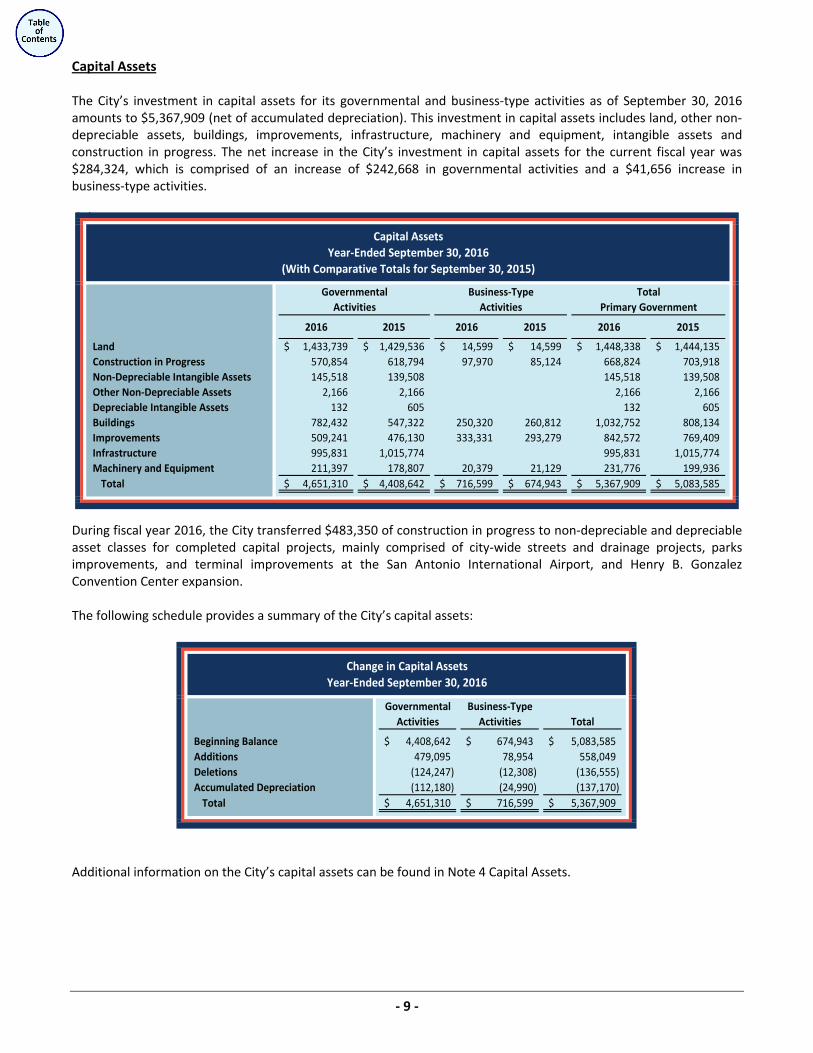
- 9 -
Capital Assets
The City’s investment in capital assets for its governmental and business-type activities as of September 30, 2016 amounts to $5,367,909 (net of accumulated depreciation). This investment in capital assets includes land, other non-depreciable assets, buildings, improvements, infrastructure, machinery and equipment, intangible assets and construction in progress. The net increase in the City’s investment in capital assets for the current fiscal year was $284,324, which is comprised of an increase of $242,668 in governmental activities and a $41,656 increase in business-type activities.
` ```
2016 2015 2016 2015 2016 2015
Land 1,433,739$ 1,429,536$ 14,599$ 14,599$ 1,448,338$ 1,444,135$ Construction in Progress 570,854 618,794 97,970 85,124 668,824 703,918 Non-Depreciable Intangible Assets 145,518 139,508 145,518 139,508 Other Non-Depreciable Assets 2,166 2,166 2,166 2,166 Depreciable Intangible Assets 132 605 132 605 Buildings 782,432 547,322 250,320 260,812 1,032,752 808,134 Improvements 509,241 476,130 333,331 293,279 842,572 769,409 Infrastructure 995,831 1,015,774 995,831 1,015,774 Machinery and Equipment 211,397 178,807 20,379 21,129 231,776 199,936
Total 4,651,310$ 4,408,642$ 716,599$ 674,943$ 5,367,909$ 5,083,585$
Activities Activities Primary Government
Capital AssetsYear-Ended September 30, 2016
(With Comparative Totals for September 30, 2015)
Governmental Business-Type Total
During fiscal year 2016, the City transferred $483,350 of construction in progress to non-depreciable and depreciable asset classes for completed capital projects, mainly comprised of city-wide streets and drainage projects, parks improvements, and terminal improvements at the San Antonio International Airport, and Henry B. Gonzalez Convention Center expansion. The following schedule provides a summary of the City’s capital assets:
Governmental Business-TypeActivities Activities Total
Beginning Balance 4,408,642$ 674,943$ 5,083,585$ Additions 479,095 78,954 558,049 Deletions (124,247) (12,308) (136,555) Accumulated Depreciation (112,180) (24,990) (137,170)
Total 4,651,310$ 716,599$ 5,367,909$
Change in Capital AssetsYear-Ended September 30, 2016
Additional information on the City’s capital assets can be found in Note 4 Capital Assets.
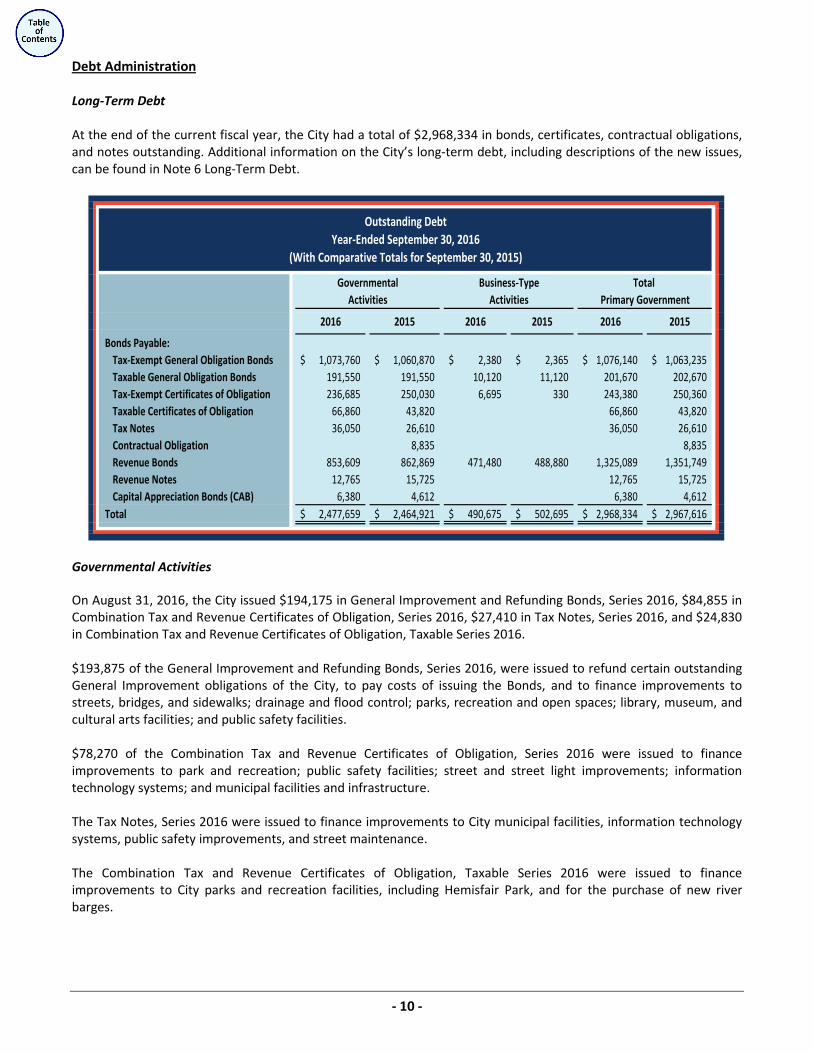
- 10 -
Debt Administration
Long-Term Debt At the end of the current fiscal year, the City had a total of $2,968,334 in bonds, certificates, contractual obligations, and notes outstanding. Additional information on the City’s long-term debt, including descriptions of the new issues, can be found in Note 6 Long-Term Debt.
2016 2015 2016 2015 2016 2015
Bonds Payable:Tax-Exempt General Obligation Bonds 1,073,760$ 1,060,870$ 2,380$ 2,365$ 1,076,140$ 1,063,235$ Taxable General Obligation Bonds 191,550 191,550 10,120 11,120 201,670 202,670 Tax-Exempt Certificates of Obligation 236,685 250,030 6,695 330 243,380 250,360 Taxable Certificates of Obligation 66,860 43,820 66,860 43,820 Tax Notes 36,050 26,610 36,050 26,610 Contractual Obligation 8,835 8,835 Revenue Bonds 853,609 862,869 471,480 488,880 1,325,089 1,351,749 Revenue Notes 12,765 15,725 12,765 15,725 Capital Appreciation Bonds (CAB) 6,380 4,612 6,380 4,612
Total 2,477,659$ 2,464,921$ 490,675$ 502,695$ 2,968,334$ 2,967,616$
Primary Government
(With Comparative Totals for September 30, 2015)Year-Ended September 30, 2016
Outstanding Debt
Business-TypeActivities Activities
Governmental Total
Governmental Activities On August 31, 2016, the City issued $194,175 in General Improvement and Refunding Bonds, Series 2016, $84,855 in Combination Tax and Revenue Certificates of Obligation, Series 2016, $27,410 in Tax Notes, Series 2016, and $24,830 in Combination Tax and Revenue Certificates of Obligation, Taxable Series 2016. $193,875 of the General Improvement and Refunding Bonds, Series 2016, were issued to refund certain outstanding General Improvement obligations of the City, to pay costs of issuing the Bonds, and to finance improvements to streets, bridges, and sidewalks; drainage and flood control; parks, recreation and open spaces; library, museum, and cultural arts facilities; and public safety facilities. $78,270 of the Combination Tax and Revenue Certificates of Obligation, Series 2016 were issued to finance improvements to park and recreation; public safety facilities; street and street light improvements; information technology systems; and municipal facilities and infrastructure. The Tax Notes, Series 2016 were issued to finance improvements to City municipal facilities, information technology systems, public safety improvements, and street maintenance. The Combination Tax and Revenue Certificates of Obligation, Taxable Series 2016 were issued to finance improvements to City parks and recreation facilities, including Hemisfair Park, and for the purchase of new river barges.
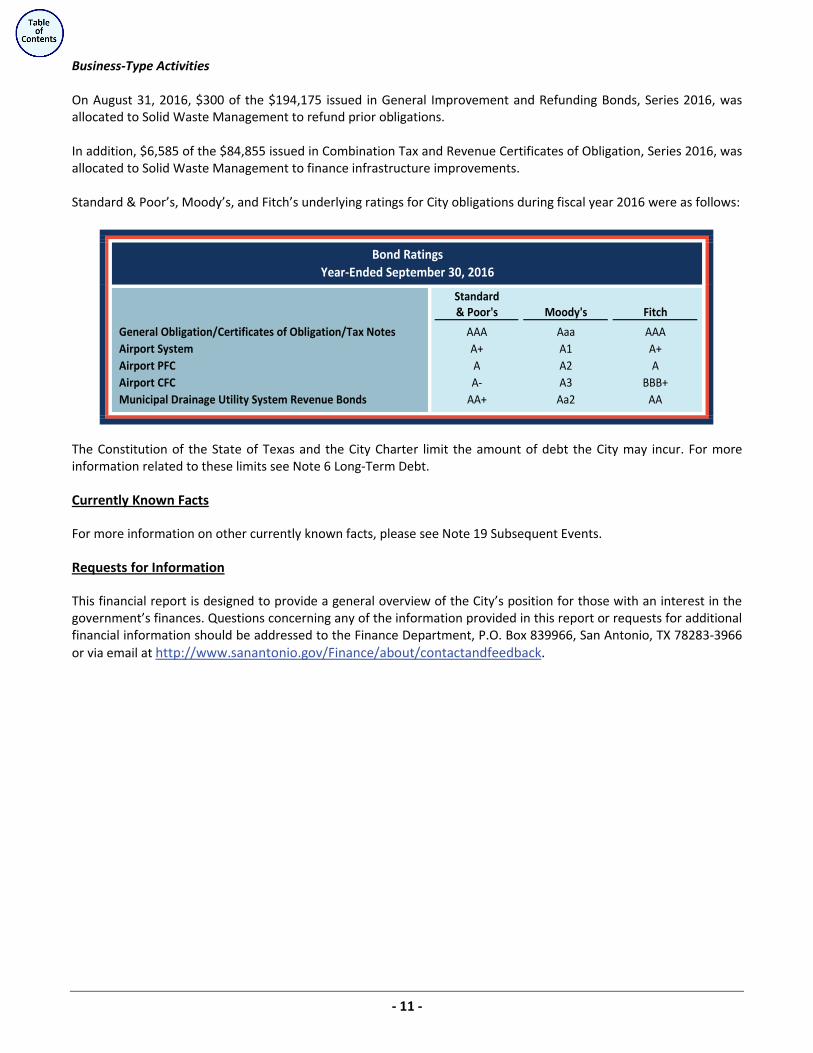
- 11 -
Business-Type Activities On August 31, 2016, $300 of the $194,175 issued in General Improvement and Refunding Bonds, Series 2016, was allocated to Solid Waste Management to refund prior obligations. In addition, $6,585 of the $84,855 issued in Combination Tax and Revenue Certificates of Obligation, Series 2016, was allocated to Solid Waste Management to finance infrastructure improvements. Standard & Poor’s, Moody’s, and Fitch’s underlying ratings for City obligations during fiscal year 2016 were as follows:
Standard& Poor's Moody's Fitch
General Obligation/Certificates of Obligation/Tax Notes AAA Aaa AAAAirport System A+ A1 A+Airport PFC A A2 AAirport CFC A- A3 BBB+Municipal Drainage Utility System Revenue Bonds AA+ Aa2 AA
Bond RatingsYear-Ended September 30, 2016
The Constitution of the State of Texas and the City Charter limit the amount of debt the City may incur. For more information related to these limits see Note 6 Long-Term Debt.
Currently Known Facts
For more information on other currently known facts, please see Note 19 Subsequent Events.
Requests for Information
This financial report is designed to provide a general overview of the City’s position for those with an interest in the government’s finances. Questions concerning any of the information provided in this report or requests for additional financial information should be addressed to the Finance Department, P.O. Box 839966, San Antonio, TX 78283-3966 or via email at http://www.sanantonio.gov/Finance/about/contactandfeedback.

Basic Financial Statements
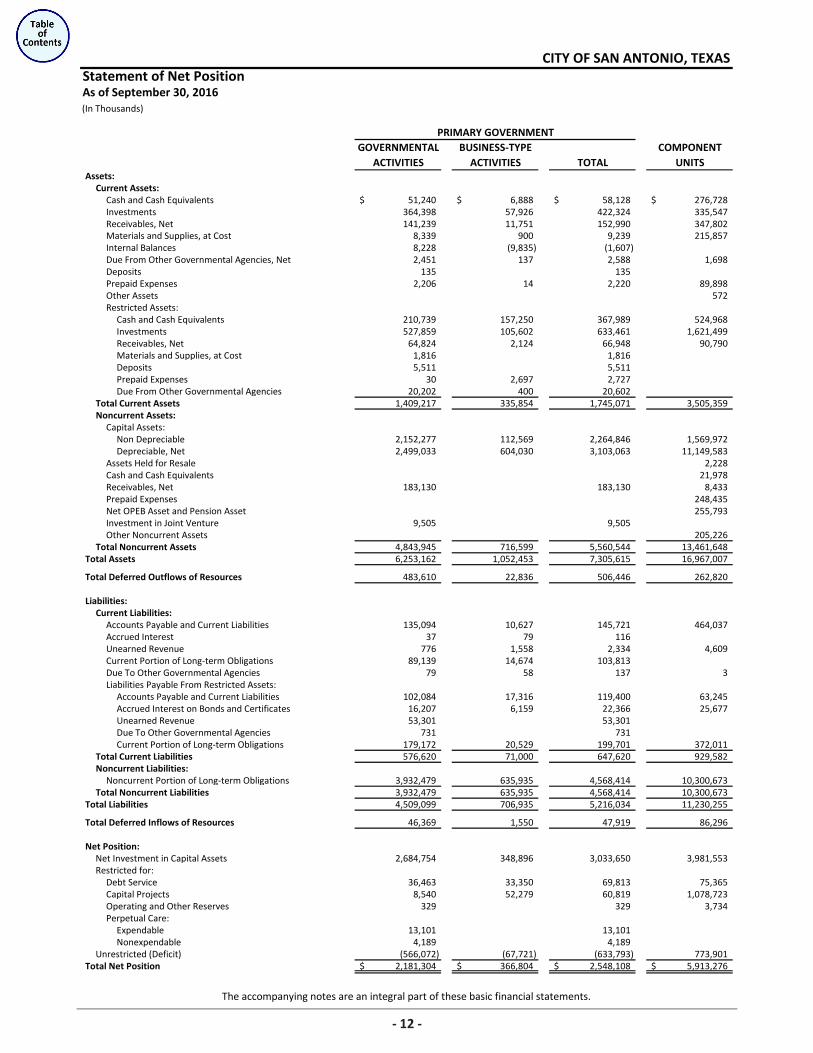
The accompanying notes are an integral part of these basic financial statements.
GOVERNMENTAL BUSINESS-TYPE COMPONENTACTIVITIES ACTIVITIES TOTAL UNITS
Assets: Current Assets:
Cash and Cash Equivalents 51,240$ 6,888$ 58,128$ 276,728$ Investments 364,398 57,926 422,324 335,547 Receivables, Net 141,239 11,751 152,990 347,802 Materials and Supplies, at Cost 8,339 900 9,239 215,857 Internal Balances 8,228 (9,835) (1,607) Due From Other Governmental Agencies, Net 2,451 137 2,588 1,698 Deposits 135 135 Prepaid Expenses 2,206 14 2,220 89,898 Other Assets 572 Restricted Assets:
Cash and Cash Equivalents 210,739 157,250 367,989 524,968 Investments 527,859 105,602 633,461 1,621,499 Receivables, Net 64,824 2,124 66,948 90,790 Materials and Supplies, at Cost 1,816 1,816 Deposits 5,511 5,511 Prepaid Expenses 30 2,697 2,727 Due From Other Governmental Agencies 20,202 400 20,602
Total Current Assets 1,409,217 335,854 1,745,071 3,505,359 Noncurrent Assets:
Capital Assets: Non Depreciable 2,152,277 112,569 2,264,846 1,569,972 Depreciable, Net 2,499,033 604,030 3,103,063 11,149,583
Assets Held for Resale 2,228 Cash and Cash Equivalents 21,978 Receivables, Net 183,130 183,130 8,433 Prepaid Expenses 248,435 Net OPEB Asset and Pension Asset 255,793 Investment in Joint Venture 9,505 9,505 Other Noncurrent Assets 205,226
Total Noncurrent Assets 4,843,945 716,599 5,560,544 13,461,648 Total Assets 6,253,162 1,052,453 7,305,615 16,967,007
Total Deferred Outflows of Resources 483,610 22,836 506,446 262,820
Liabilities:Current Liabilities:
Accounts Payable and Current Liabilities 135,094 10,627 145,721 464,037 Accrued Interest 37 79 116 Unearned Revenue 776 1,558 2,334 4,609 Current Portion of Long-term Obligations 89,139 14,674 103,813 Due To Other Governmental Agencies 79 58 137 3 Liabilities Payable From Restricted Assets:
Accounts Payable and Current Liabilities 102,084 17,316 119,400 63,245 Accrued Interest on Bonds and Certificates 16,207 6,159 22,366 25,677 Unearned Revenue 53,301 53,301 Due To Other Governmental Agencies 731 731 Current Portion of Long-term Obligations 179,172 20,529 199,701 372,011
Total Current Liabilities 576,620 71,000 647,620 929,582 Noncurrent Liabilities:
Noncurrent Portion of Long-term Obligations 3,932,479 635,935 4,568,414 10,300,673 Total Noncurrent Liabilities 3,932,479 635,935 4,568,414 10,300,673
Total Liabilities 4,509,099 706,935 5,216,034 11,230,255
Total Deferred Inflows of Resources 46,369 1,550 47,919 86,296
Net Position:Net Investment in Capital Assets 2,684,754 348,896 3,033,650 3,981,553 Restricted for:
Debt Service 36,463 33,350 69,813 75,365 Capital Projects 8,540 52,279 60,819 1,078,723 Operating and Other Reserves 329 329 3,734 Perpetual Care:
Expendable 13,101 13,101 Nonexpendable 4,189 4,189
Unrestricted (Deficit) (566,072) (67,721) (633,793) 773,901 Total Net Position 2,181,304$ 366,804$ 2,548,108$ 5,913,276$
CITY OF SAN ANTONIO, TEXAS
As of September 30, 2016(In Thousands)
PRIMARY GOVERNMENT
Statement of Net Position
12
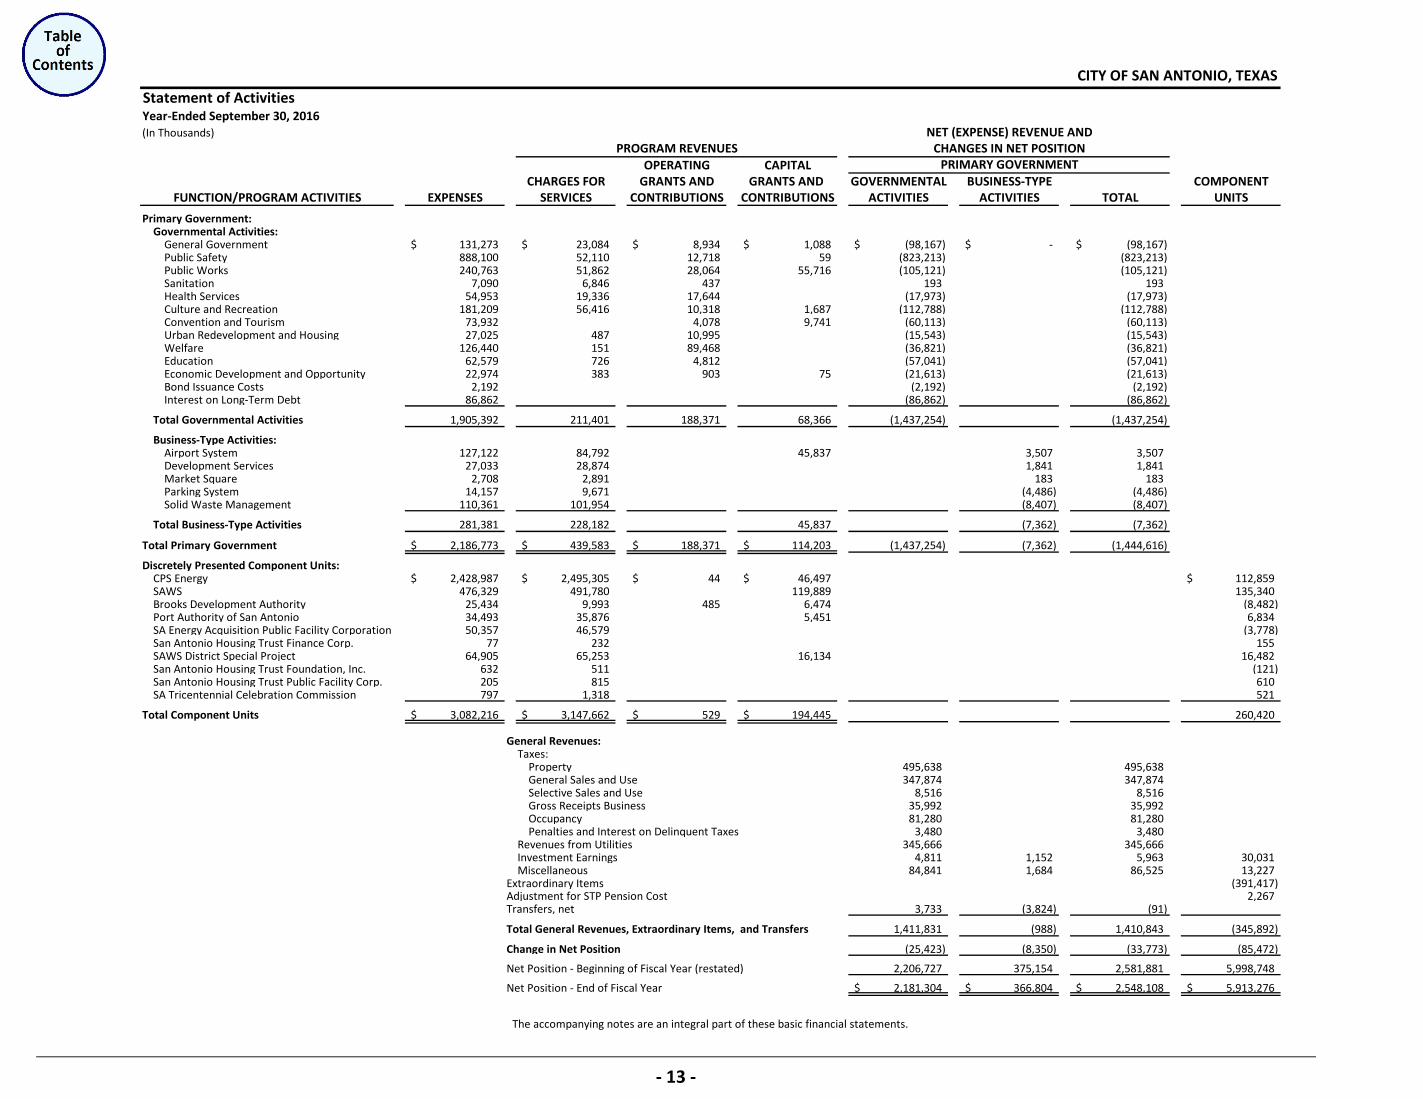
The accompanying notes are an integral part of these basic financial statements.
Statement of ActivitiesYear-Ended September 30, 2016(In Thousands)
OPERATING CAPITALCHARGES FOR GRANTS AND GRANTS AND GOVERNMENTAL BUSINESS-TYPE COMPONENT
FUNCTION/PROGRAM ACTIVITIES EXPENSES SERVICES CONTRIBUTIONS CONTRIBUTIONS ACTIVITIES ACTIVITIES TOTAL UNITS
Primary Government: Governmental Activities:
General Government 131,273$ 23,084$ 8,934$ 1,088$ (98,167)$ -$ (98,167)$ Public Safety 888,100 52,110 12,718 59 (823,213) (823,213) Public Works 240,763 51,862 28,064 55,716 (105,121) (105,121) Sanitation 7,090 6,846 437 193 193 Health Services 54,953 19,336 17,644 (17,973) (17,973) Culture and Recreation 181,209 56,416 10,318 1,687 (112,788) (112,788) Convention and Tourism 73,932 4,078 9,741 (60,113) (60,113) Urban Redevelopment and Housing 27,025 487 10,995 (15,543) (15,543) Welfare 126,440 151 89,468 (36,821) (36,821) Education 62,579 726 4,812 (57,041) (57,041) Economic Development and Opportunity 22,974 383 903 75 (21,613) (21,613) Bond Issuance Costs 2,192 (2,192) (2,192) Interest on Long-Term Debt 86,862 (86,862) (86,862)
Total Governmental Activities 1,905,392 211,401 188,371 68,366 (1,437,254) (1,437,254)
Business-Type Activities:Airport System 127,122 84,792 45,837 3,507 3,507 Development Services 27,033 28,874 1,841 1,841 Market Square 2,708 2,891 183 183 Parking System 14,157 9,671 (4,486) (4,486) Solid Waste Management 110,361 101,954 (8,407) (8,407)
Total Business-Type Activities 281,381 228,182 45,837 (7,362) (7,362)
Total Primary Government 2,186,773$ 439,583$ 188,371$ 114,203$ (1,437,254) (7,362) (1,444,616)
Discretely Presented Component Units:CPS Energy 2,428,987$ 2,495,305$ 44$ 46,497$ 112,859$ SAWS 476,329 491,780 119,889 135,340 Brooks Development Authority 25,434 9,993 485 6,474 (8,482) Port Authority of San Antonio 34,493 35,876 5,451 6,834 SA Energy Acquisition Public Facility Corporation 50,357 46,579 (3,778) San Antonio Housing Trust Finance Corp. 77 232 155 SAWS District Special Project 64,905 65,253 16,134 16,482 San Antonio Housing Trust Foundation, Inc. 632 511 (121) San Antonio Housing Trust Public Facility Corp. 205 815 610 SA Tricentennial Celebration Commission 797 1,318 521
Total Component Units 3,082,216$ 3,147,662$ 529$ 194,445$ 260,420
General Revenues:Taxes:
Property 495,638 495,638 General Sales and Use 347,874 347,874 Selective Sales and Use 8,516 8,516 Gross Receipts Business 35,992 35,992 Occupancy 81,280 81,280 Penalties and Interest on Delinquent Taxes 3,480 3,480
Revenues from Utilities 345,666 345,666 Investment Earnings 4,811 1,152 5,963 30,031 Miscellaneous 84,841 1,684 86,525 13,227
Extraordinary Items (391,417) Adjustment for STP Pension Cost 2,267 Transfers, net 3,733 (3,824) (91)
Total General Revenues, Extraordinary Items, and Transfers 1,411,831 (988) 1,410,843 (345,892)
Change in Net Position (25,423) (8,350) (33,773) (85,472)
Net Position - Beginning of Fiscal Year (restated) 2,206,727 375,154 2,581,881 5,998,748
Net Position - End of Fiscal Year 2,181,304$ 366,804$ 2,548,108$ 5,913,276$
CHANGES IN NET POSITIONPRIMARY GOVERNMENT
PROGRAM REVENUES
CITY OF SAN ANTONIO, TEXAS
NET (EXPENSE) REVENUE AND
‐ 13 ‐
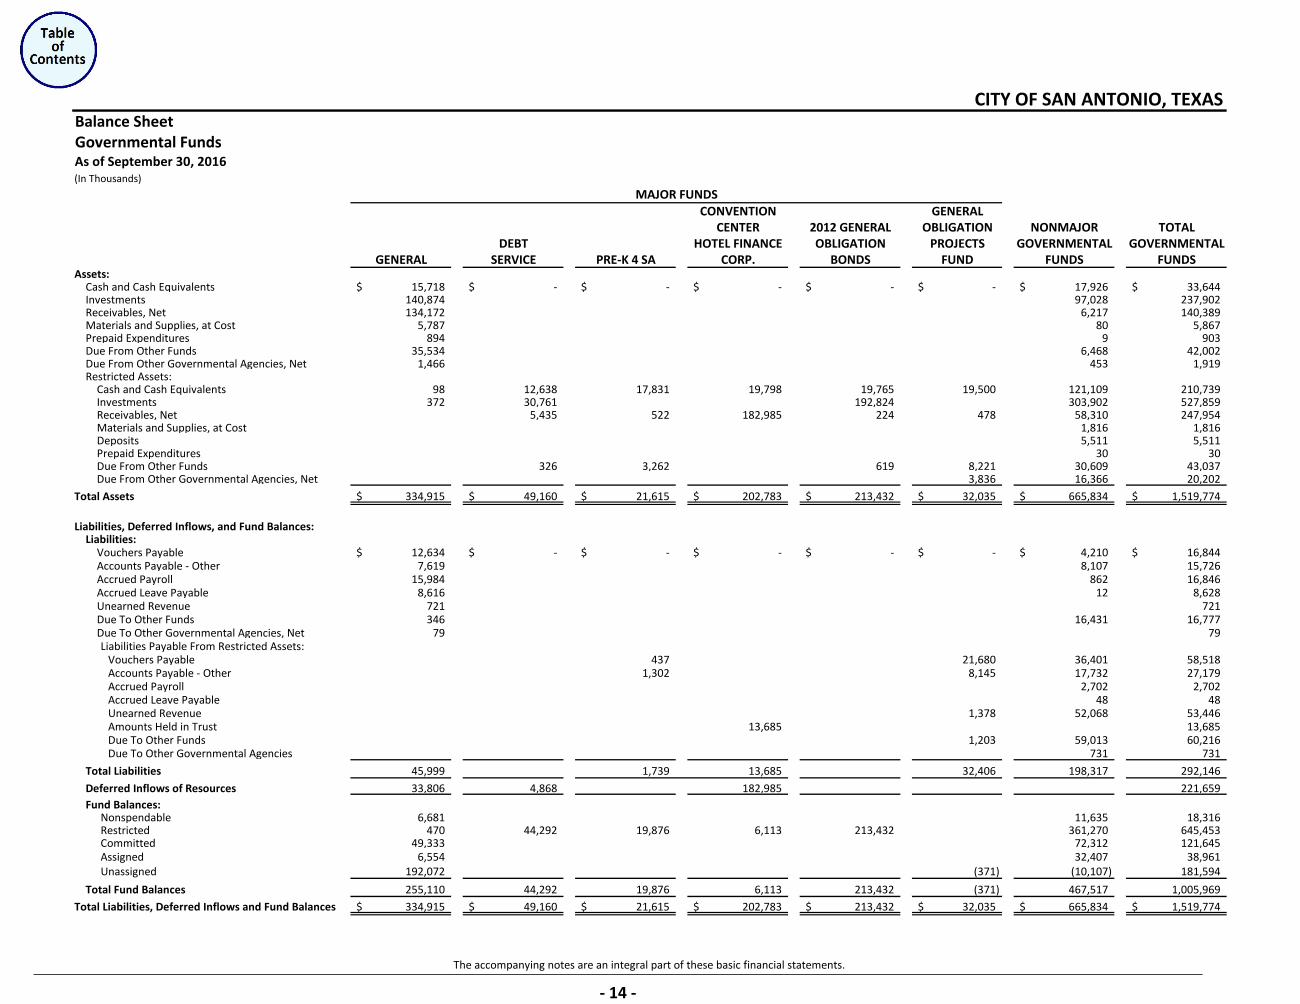
The accompanying notes are an integral part of these basic financial statements.
Balance SheetGovernmental FundsAs of September 30, 2016(In Thousands)
CONVENTION GENERALCENTER 2012 GENERAL OBLIGATION NONMAJOR TOTAL
DEBT HOTEL FINANCE OBLIGATION PROJECTS GOVERNMENTAL GOVERNMENTALGENERAL SERVICE PRE-K 4 SA CORP. BONDS FUND FUNDS FUNDS
Assets:Cash and Cash Equivalents 15,718$ -$ -$ -$ -$ -$ 17,926$ 33,644$ Investments 140,874 97,028 237,902 Receivables, Net 134,172 6,217 140,389 Materials and Supplies, at Cost 5,787 80 5,867 Prepaid Expenditures 894 9 903 Due From Other Funds 35,534 6,468 42,002 Due From Other Governmental Agencies, Net 1,466 453 1,919 Restricted Assets:
Cash and Cash Equivalents 98 12,638 17,831 19,798 19,765 19,500 121,109 210,739 Investments 372 30,761 192,824 303,902 527,859 Receivables, Net 5,435 522 182,985 224 478 58,310 247,954 Materials and Supplies, at Cost 1,816 1,816 Deposits 5,511 5,511 Prepaid Expenditures 30 30 Due From Other Funds 326 3,262 619 8,221 30,609 43,037 Due From Other Governmental Agencies, Net 3,836 16,366 20,202
Total Assets 334,915$ 49,160$ 21,615$ 202,783$ 213,432$ 32,035$ 665,834$ 1,519,774$
Liabilities, Deferred Inflows, and Fund Balances:Liabilities:
Vouchers Payable 12,634$ -$ -$ -$ -$ -$ 4,210$ 16,844$ Accounts Payable - Other 7,619 8,107 15,726 Accrued Payroll 15,984 862 16,846 Accrued Leave Payable 8,616 12 8,628 Unearned Revenue 721 721 Due To Other Funds 346 16,431 16,777 Due To Other Governmental Agencies, Net 79 79 Liabilities Payable From Restricted Assets:
Vouchers Payable 437 21,680 36,401 58,518 Accounts Payable - Other 1,302 8,145 17,732 27,179 Accrued Payroll 2,702 2,702 Accrued Leave Payable 48 48 Unearned Revenue 1,378 52,068 53,446 Amounts Held in Trust 13,685 13,685 Due To Other Funds 1,203 59,013 60,216 Due To Other Governmental Agencies 731 731
Total Liabilities 45,999 1,739 13,685 32,406 198,317 292,146
Deferred Inflows of Resources 33,806 4,868 182,985 221,659 Fund Balances:
Nonspendable 6,681 11,635 18,316 Restricted 470 44,292 19,876 6,113 213,432 361,270 645,453 Committed 49,333 72,312 121,645 Assigned 6,554 32,407 38,961 Unassigned 192,072 (371) (10,107) 181,594
Total Fund Balances 255,110 44,292 19,876 6,113 213,432 (371) 467,517 1,005,969 Total Liabilities, Deferred Inflows and Fund Balances 334,915$ 49,160$ 21,615$ 202,783$ 213,432$ 32,035$ 665,834$ 1,519,774$
CITY OF SAN ANTONIO, TEXAS
MAJOR FUNDS
‐ 14 ‐
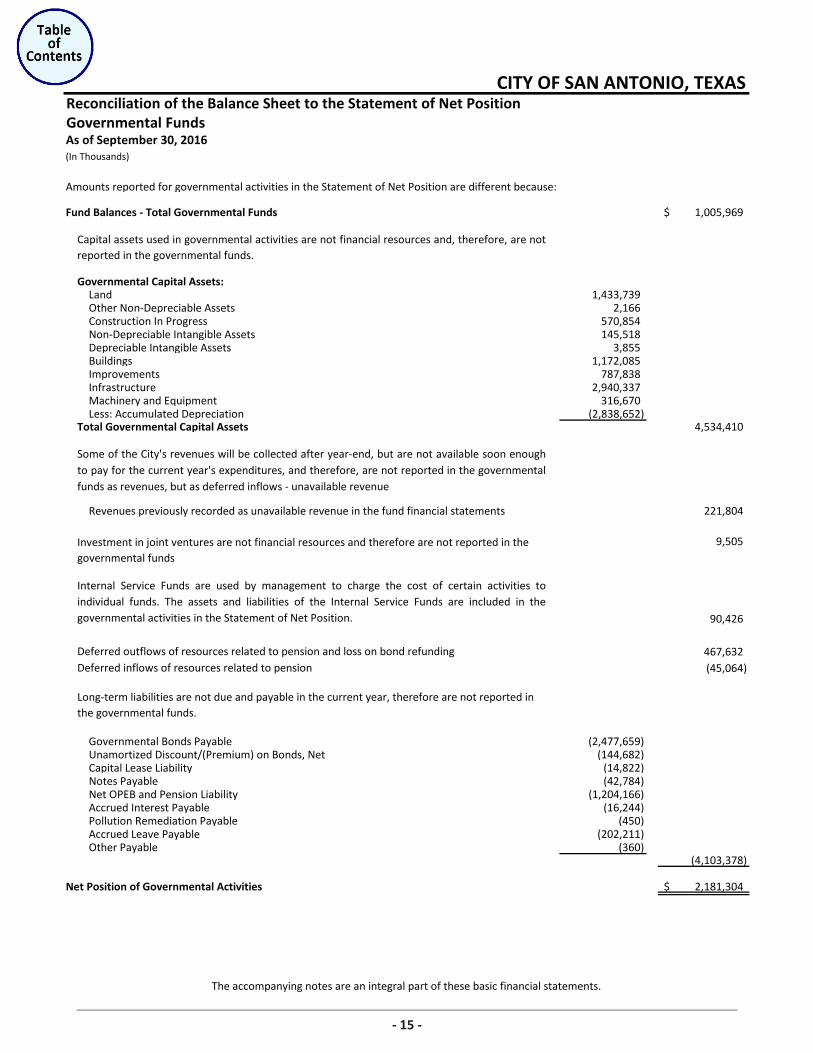
The accompanying notes are an integral part of these basic financial statements.
Reconciliation of the Balance Sheet to the Statement of Net PositionGovernmental Funds
(In Thousands)
Amounts reported for governmental activities in the Statement of Net Position are different because:
Fund Balances - Total Governmental Funds 1,005,969$
Governmental Capital Assets:Land 1,433,739Other Non-Depreciable Assets 2,166Construction In Progress 570,854Non-Depreciable Intangible Assets 145,518Depreciable Intangible Assets 3,855Buildings 1,172,085Improvements 787,838Infrastructure 2,940,337Machinery and Equipment 316,670Less: Accumulated Depreciation (2,838,652)
Total Governmental Capital Assets 4,534,410
Revenues previously recorded as unavailable revenue in the fund financial statements 221,804
9,505
90,426
467,632 (45,064)
Governmental Bonds Payable (2,477,659)Unamortized Discount/(Premium) on Bonds, Net (144,682)Capital Lease Liability (14,822)Notes Payable (42,784)Net OPEB and Pension Liability (1,204,166)Accrued Interest Payable (16,244)Pollution Remediation Payable (450)Accrued Leave Payable (202,211)Other Payable (360)
(4,103,378)
Net Position of Governmental Activities 2,181,304$
Long-term liabilities are not due and payable in the current year, therefore are not reported in the governmental funds.
CITY OF SAN ANTONIO, TEXAS
As of September 30, 2016
Capital assets used in governmental activities are not financial resources and, therefore, are notreported in the governmental funds.
Some of the City's revenues will be collected after year-end, but are not available soon enoughto pay for the current year's expenditures, and therefore, are not reported in the governmentalfunds as revenues, but as deferred inflows - unavailable revenue
Internal Service Funds are used by management to charge the cost of certain activities toindividual funds. The assets and liabilities of the Internal Service Funds are included in thegovernmental activities in the Statement of Net Position.
Deferred outflows of resources related to pension and loss on bond refundingDeferred inflows of resources related to pension
Investment in joint ventures are not financial resources and therefore are not reported in the governmental funds
15
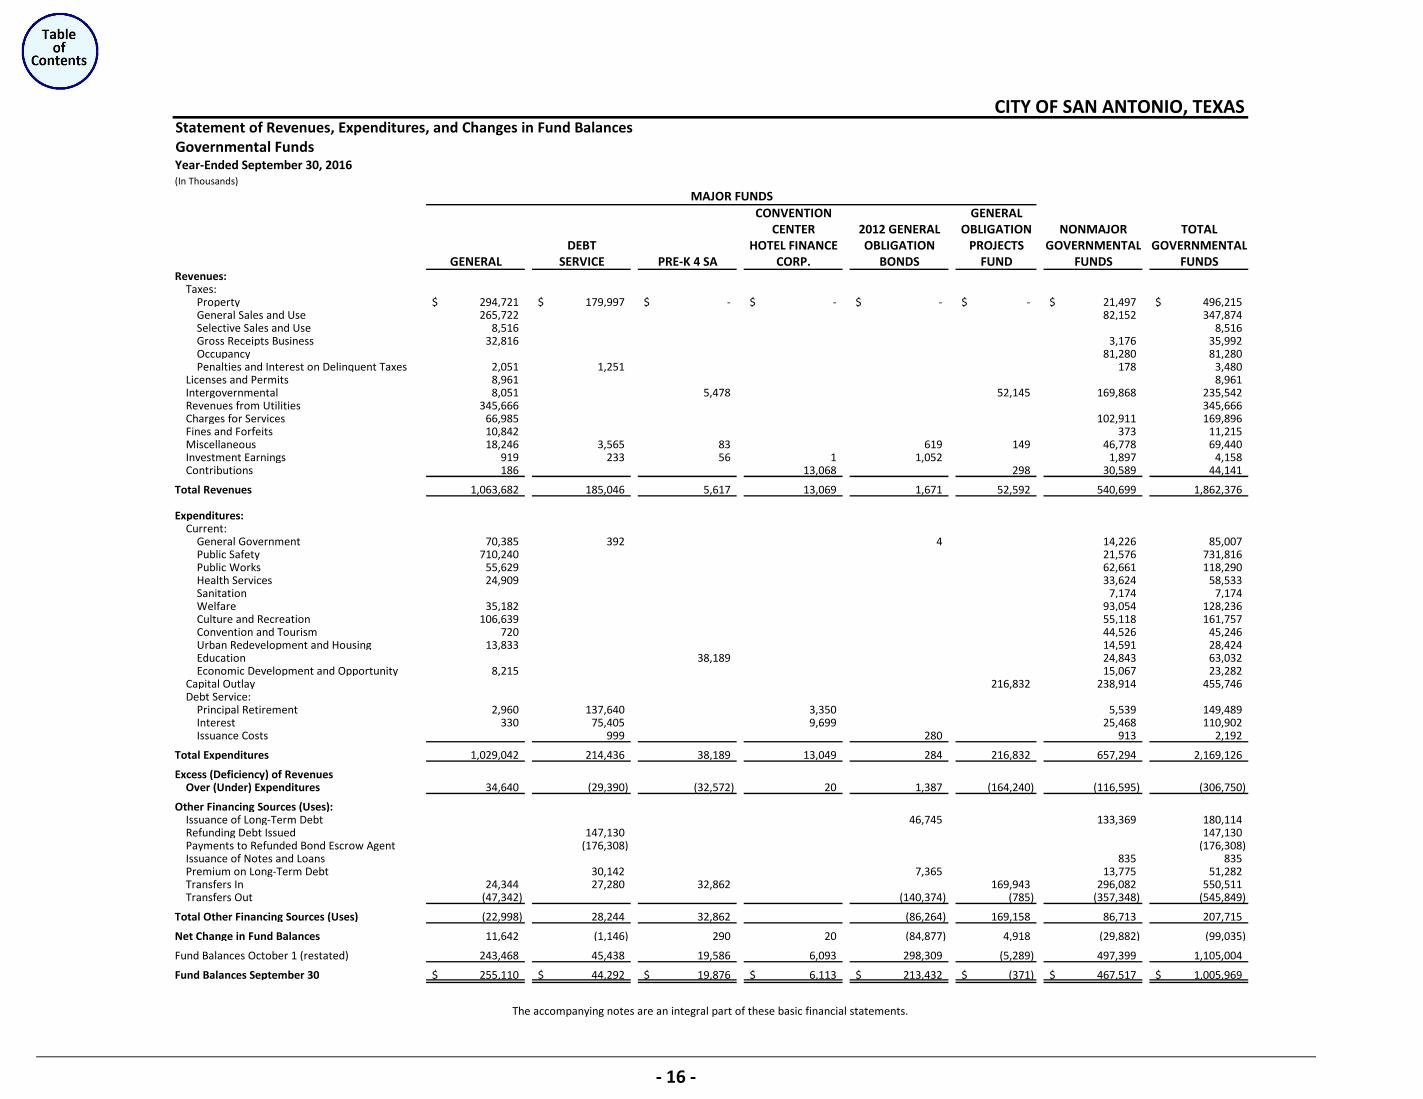
The accompanying notes are an integral part of these basic financial statements.
Statement of Revenues, Expenditures, and Changes in Fund BalancesGovernmental FundsYear-Ended September 30, 2016(In Thousands)
CONVENTION GENERALCENTER 2012 GENERAL OBLIGATION NONMAJOR TOTAL
DEBT HOTEL FINANCE OBLIGATION PROJECTS GOVERNMENTAL GOVERNMENTALGENERAL SERVICE PRE-K 4 SA CORP. BONDS FUND FUNDS FUNDS
Revenues:Taxes:
Property 294,721$ 179,997$ -$ -$ -$ -$ 21,497$ 496,215$ General Sales and Use 265,722 82,152 347,874 Selective Sales and Use 8,516 8,516 Gross Receipts Business 32,816 3,176 35,992 Occupancy 81,280 81,280 Penalties and Interest on Delinquent Taxes 2,051 1,251 178 3,480
Licenses and Permits 8,961 8,961 Intergovernmental 8,051 5,478 52,145 169,868 235,542 Revenues from Utilities 345,666 345,666 Charges for Services 66,985 102,911 169,896 Fines and Forfeits 10,842 373 11,215 Miscellaneous 18,246 3,565 83 619 149 46,778 69,440 Investment Earnings 919 233 56 1 1,052 1,897 4,158 Contributions 186 13,068 298 30,589 44,141
Total Revenues 1,063,682 185,046 5,617 13,069 1,671 52,592 540,699 1,862,376
Expenditures:Current:
General Government 70,385 392 4 14,226 85,007 Public Safety 710,240 21,576 731,816 Public Works 55,629 62,661 118,290 Health Services 24,909 33,624 58,533 Sanitation 7,174 7,174 Welfare 35,182 93,054 128,236 Culture and Recreation 106,639 55,118 161,757 Convention and Tourism 720 44,526 45,246 Urban Redevelopment and Housing 13,833 14,591 28,424 Education 38,189 24,843 63,032 Economic Development and Opportunity 8,215 15,067 23,282
Capital Outlay 216,832 238,914 455,746 Debt Service:
Principal Retirement 2,960 137,640 3,350 5,539 149,489 Interest 330 75,405 9,699 25,468 110,902 Issuance Costs 999 280 913 2,192
Total Expenditures 1,029,042 214,436 38,189 13,049 284 216,832 657,294 2,169,126
Excess (Deficiency) of RevenuesOver (Under) Expenditures 34,640 (29,390) (32,572) 20 1,387 (164,240) (116,595) (306,750)
Other Financing Sources (Uses):Issuance of Long-Term Debt 46,745 133,369 180,114 Refunding Debt Issued 147,130 147,130 Payments to Refunded Bond Escrow Agent (176,308) (176,308) Issuance of Notes and Loans 835 835 Premium on Long-Term Debt 30,142 7,365 13,775 51,282 Transfers In 24,344 27,280 32,862 169,943 296,082 550,511 Transfers Out (47,342) (140,374) (785) (357,348) (545,849)
Total Other Financing Sources (Uses) (22,998) 28,244 32,862 (86,264) 169,158 86,713 207,715
Net Change in Fund Balances 11,642 (1,146) 290 20 (84,877) 4,918 (29,882) (99,035)
Fund Balances October 1 (restated) 243,468 45,438 19,586 6,093 298,309 (5,289) 497,399 1,105,004
Fund Balances September 30 255,110$ 44,292$ 19,876$ 6,113$ 213,432$ (371)$ 467,517$ 1,005,969$
CITY OF SAN ANTONIO, TEXAS
MAJOR FUNDS
‐ 16 ‐
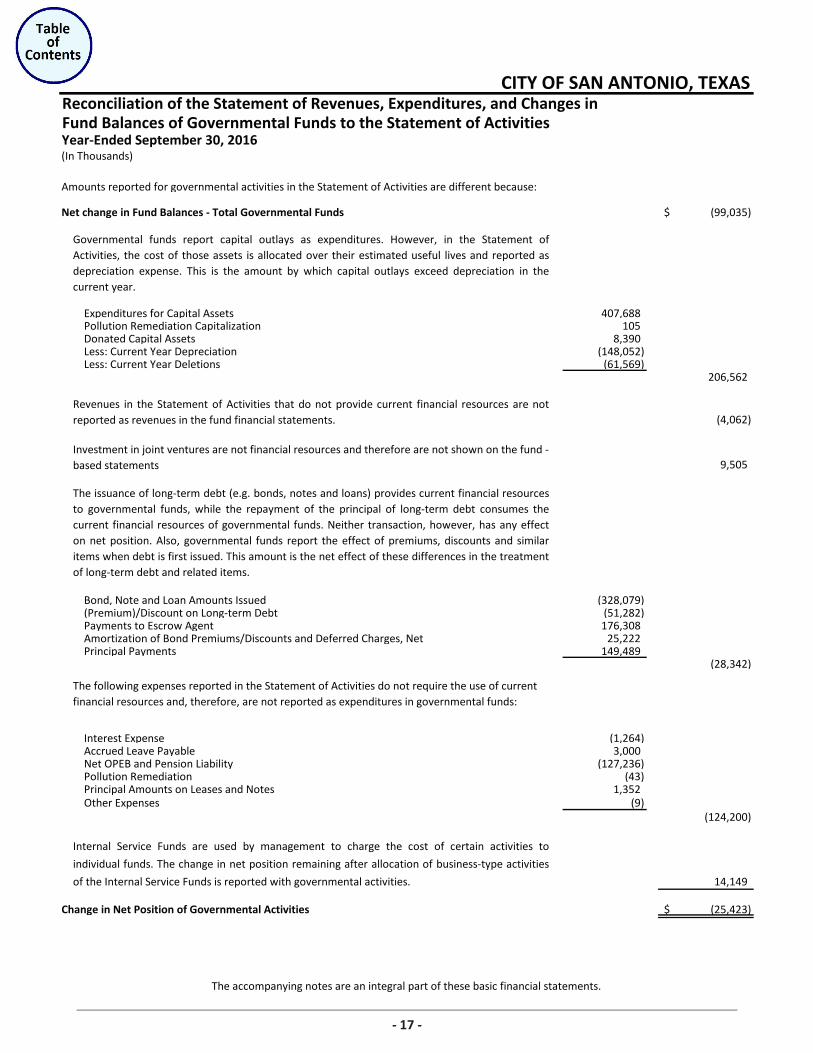
The accompanying notes are an integral part of these basic financial statements.
Reconciliation of the Statement of Revenues, Expenditures, and Changes in Fund Balances of Governmental Funds to the Statement of Activities
Amounts reported for governmental activities in the Statement of Activities are different because:
Net change in Fund Balances - Total Governmental Funds (99,035)$
Expenditures for Capital Assets 407,688 Pollution Remediation Capitalization 105 Donated Capital Assets 8,390 Less: Current Year Depreciation (148,052) Less: Current Year Deletions (61,569)
206,562
(4,062)
Investment in joint ventures are not financial resources and therefore are not shown on the fund - based statements 9,505
Bond, Note and Loan Amounts Issued (328,079) (Premium)/Discount on Long-term Debt (51,282) Payments to Escrow Agent 176,308 Amortization of Bond Premiums/Discounts and Deferred Charges, Net 25,222 Principal Payments 149,489
(28,342)
Interest Expense (1,264) Accrued Leave Payable 3,000 Net OPEB and Pension Liability (127,236) Pollution Remediation (43) Principal Amounts on Leases and Notes 1,352 Other Expenses (9)
(124,200)
Internal Service Funds are used by management to charge the cost of certain activities to
individual funds. The change in net position remaining after allocation of business-type activities
of the Internal Service Funds is reported with governmental activities. 14,149
Change in Net Position of Governmental Activities (25,423)$
The following expenses reported in the Statement of Activities do not require the use of current financial resources and, therefore, are not reported as expenditures in governmental funds:
CITY OF SAN ANTONIO, TEXAS
The issuance of long-term debt (e.g. bonds, notes and loans) provides current financial resourcesto governmental funds, while the repayment of the principal of long-term debt consumes thecurrent financial resources of governmental funds. Neither transaction, however, has any effecton net position. Also, governmental funds report the effect of premiums, discounts and similaritems when debt is first issued. This amount is the net effect of these differences in the treatmentof long-term debt and related items.
Governmental funds report capital outlays as expenditures. However, in the Statement ofActivities, the cost of those assets is allocated over their estimated useful lives and reported asdepreciation expense. This is the amount by which capital outlays exceed depreciation in thecurrent year.
Revenues in the Statement of Activities that do not provide current financial resources are notreported as revenues in the fund financial statements.
(In Thousands)Year-Ended September 30, 2016
17
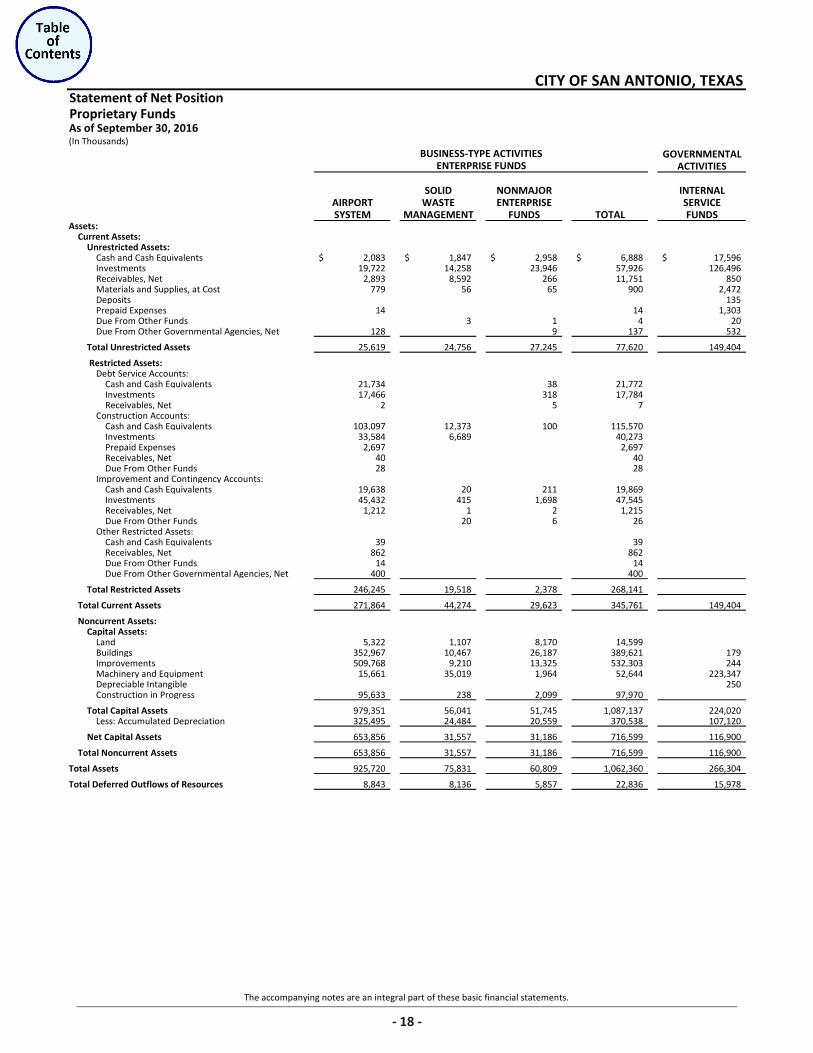
The accompanying notes are an integral part of these basic financial statements.
Statement of Net PositionProprietary Funds
GOVERNMENTALACTIVITIES
SOLID NONMAJOR INTERNALAIRPORT WASTE ENTERPRISE SERVICESYSTEM MANAGEMENT FUNDS TOTAL FUNDS
Assets:Current Assets:
Unrestricted Assets:Cash and Cash Equivalents 2,083$ 1,847$ 2,958$ 6,888$ 17,596$ Investments 19,722 14,258 23,946 57,926 126,496 Receivables, Net 2,893 8,592 266 11,751 850 Materials and Supplies, at Cost 779 56 65 900 2,472 Deposits 135 Prepaid Expenses 14 14 1,303 Due From Other Funds 3 1 4 20 Due From Other Governmental Agencies, Net 128 9 137 532
Total Unrestricted Assets 25,619 24,756 27,245 77,620 149,404
Restricted Assets: Debt Service Accounts:
Cash and Cash Equivalents 21,734 38 21,772 Investments 17,466 318 17,784 Receivables, Net 2 5 7
Construction Accounts: Cash and Cash Equivalents 103,097 12,373 100 115,570 Investments 33,584 6,689 40,273 Prepaid Expenses 2,697 2,697 Receivables, Net 40 40 Due From Other Funds 28 28
Improvement and Contingency Accounts: Cash and Cash Equivalents 19,638 20 211 19,869 Investments 45,432 415 1,698 47,545 Receivables, Net 1,212 1 2 1,215 Due From Other Funds 20 6 26
Other Restricted Assets: Cash and Cash Equivalents 39 39 Receivables, Net 862 862 Due From Other Funds 14 14 Due From Other Governmental Agencies, Net 400 400
Total Restricted Assets 246,245 19,518 2,378 268,141
Total Current Assets 271,864 44,274 29,623 345,761 149,404
Noncurrent Assets: Capital Assets:
Land 5,322 1,107 8,170 14,599 Buildings 352,967 10,467 26,187 389,621 179 Improvements 509,768 9,210 13,325 532,303 244 Machinery and Equipment 15,661 35,019 1,964 52,644 223,347 Depreciable Intangible 250 Construction in Progress 95,633 238 2,099 97,970
Total Capital Assets 979,351 56,041 51,745 1,087,137 224,020 Less: Accumulated Depreciation 325,495 24,484 20,559 370,538 107,120
Net Capital Assets 653,856 31,557 31,186 716,599 116,900
Total Noncurrent Assets 653,856 31,557 31,186 716,599 116,900
Total Assets 925,720 75,831 60,809 1,062,360 266,304
Total Deferred Outflows of Resources 8,843 8,136 5,857 22,836 15,978
CITY OF SAN ANTONIO, TEXAS
BUSINESS-TYPE ACTIVITIESENTERPRISE FUNDS
(In Thousands)As of September 30, 2016
18
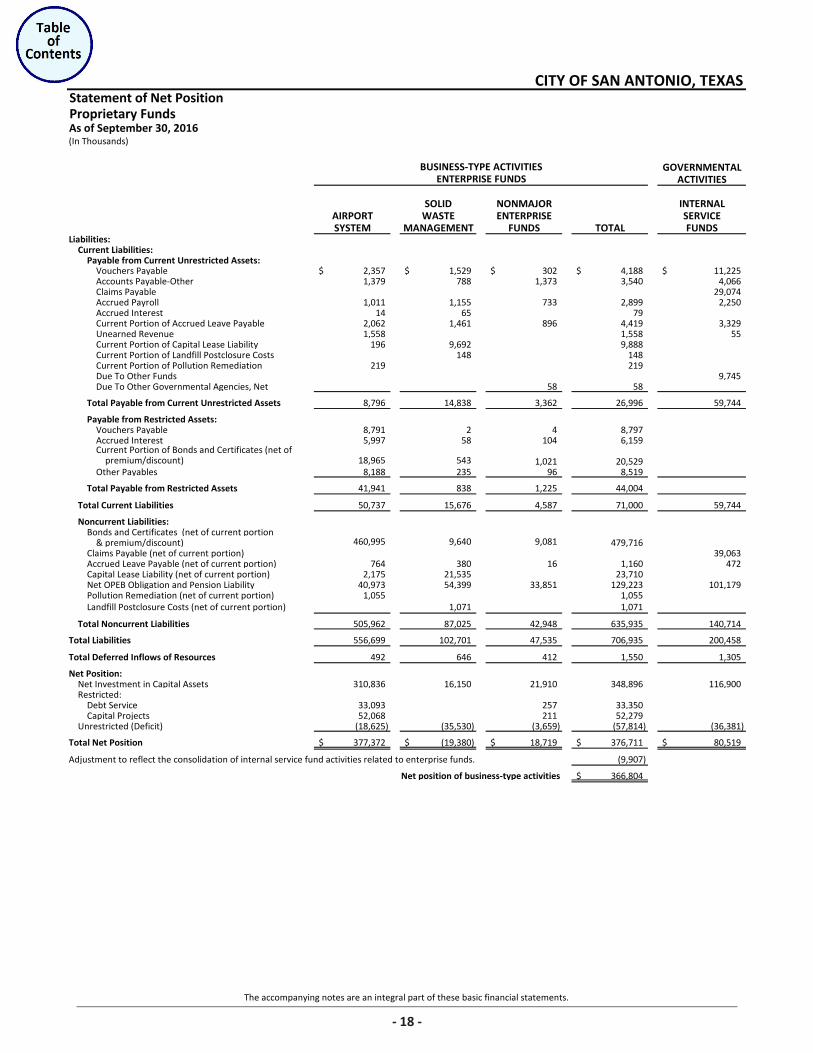
The accompanying notes are an integral part of these basic financial statements.
Statement of Net PositionProprietary Funds
GOVERNMENTALACTIVITIES
SOLID NONMAJOR INTERNALAIRPORT WASTE ENTERPRISE SERVICESYSTEM MANAGEMENT FUNDS TOTAL FUNDS
Liabilities:Current Liabilities:
Payable from Current Unrestricted Assets:Vouchers Payable 2,357$ 1,529$ 302$ 4,188$ 11,225$ Accounts Payable-Other 1,379 788 1,373 3,540 4,066 Claims Payable 29,074 Accrued Payroll 1,011 1,155 733 2,899 2,250 Accrued Interest 14 65 79 Current Portion of Accrued Leave Payable 2,062 1,461 896 4,419 3,329 Unearned Revenue 1,558 1,558 55 Current Portion of Capital Lease Liability 196 9,692 9,888 Current Portion of Landfill Postclosure Costs 148 148 Current Portion of Pollution Remediation 219 219 Due To Other Funds 9,745 Due To Other Governmental Agencies, Net 58 58
Total Payable from Current Unrestricted Assets 8,796 14,838 3,362 26,996 59,744
Payable from Restricted Assets:Vouchers Payable 8,791 2 4 8,797 Accrued Interest 5,997 58 104 6,159 Current Portion of Bonds and Certificates (net of
premium/discount) 18,965 543 1,021 20,529 Other Payables 8,188 235 96 8,519
Total Payable from Restricted Assets 41,941 838 1,225 44,004
Total Current Liabilities 50,737 15,676 4,587 71,000 59,744
Noncurrent Liabilities:Bonds and Certificates (net of current portion
& premium/discount) 460,995 9,640 9,081 479,716 Claims Payable (net of current portion) 39,063 Accrued Leave Payable (net of current portion) 764 380 16 1,160 472 Capital Lease Liability (net of current portion) 2,175 21,535 23,710 Net OPEB Obligation and Pension Liability 40,973 54,399 33,851 129,223 101,179 Pollution Remediation (net of current portion) 1,055 1,055 Landfill Postclosure Costs (net of current portion) 1,071 1,071
Total Noncurrent Liabilities 505,962 87,025 42,948 635,935 140,714
Total Liabilities 556,699 102,701 47,535 706,935 200,458
Total Deferred Inflows of Resources 492 646 412 1,550 1,305
Net Position:Net Investment in Capital Assets 310,836 16,150 21,910 348,896 116,900 Restricted:
Debt Service 33,093 257 33,350 Capital Projects 52,068 211 52,279
Unrestricted (Deficit) (18,625) (35,530) (3,659) (57,814) (36,381)
Total Net Position 377,372$ (19,380)$ 18,719$ 376,711$ 80,519$
Adjustment to reflect the consolidation of internal service fund activities related to enterprise funds. (9,907)
Net position of business-type activities 366,804$
BUSINESS-TYPE ACTIVITIESENTERPRISE FUNDS
CITY OF SAN ANTONIO, TEXAS
As of September 30, 2016(In Thousands)
18
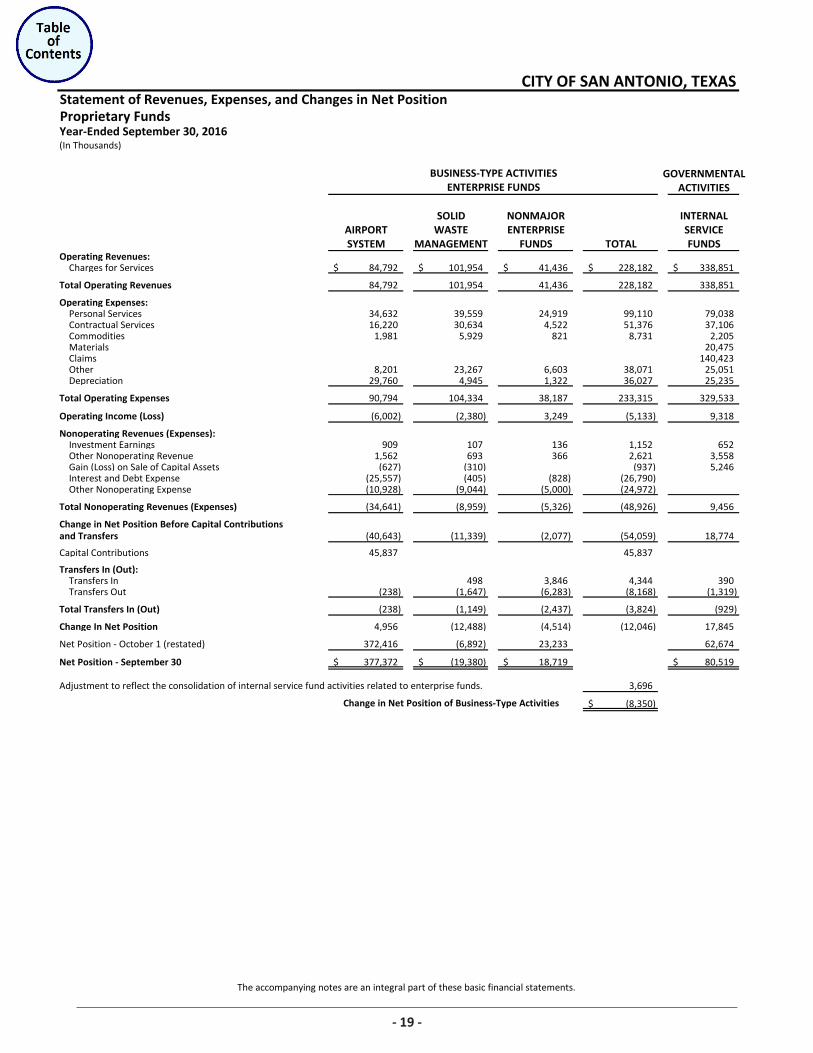
The accompanying notes are an integral part of these basic financial statements.
Statement of Revenues, Expenses, and Changes in Net PositionProprietary Funds
GOVERNMENTALACTIVITIES
SOLID NONMAJOR INTERNALAIRPORT WASTE ENTERPRISE SERVICESYSTEM MANAGEMENT FUNDS TOTAL FUNDS
Operating Revenues:Charges for Services 84,792$ 101,954$ 41,436$ 228,182$ 338,851$
Total Operating Revenues 84,792 101,954 41,436 228,182 338,851
Operating Expenses:Personal Services 34,632 39,559 24,919 99,110 79,038 Contractual Services 16,220 30,634 4,522 51,376 37,106 Commodities 1,981 5,929 821 8,731 2,205 Materials 20,475 Claims 140,423 Other 8,201 23,267 6,603 38,071 25,051 Depreciation 29,760 4,945 1,322 36,027 25,235
Total Operating Expenses 90,794 104,334 38,187 233,315 329,533
Operating Income (Loss) (6,002) (2,380) 3,249 (5,133) 9,318
Nonoperating Revenues (Expenses):Investment Earnings 909 107 136 1,152 652 Other Nonoperating Revenue 1,562 693 366 2,621 3,558 Gain (Loss) on Sale of Capital Assets (627) (310) (937) 5,246 Interest and Debt Expense (25,557) (405) (828) (26,790) Other Nonoperating Expense (10,928) (9,044) (5,000) (24,972)
Total Nonoperating Revenues (Expenses) (34,641) (8,959) (5,326) (48,926) 9,456
Change in Net Position Before Capital Contributionsand Transfers (40,643) (11,339) (2,077) (54,059) 18,774
Capital Contributions 45,837 45,837
Transfers In (Out):Transfers In 498 3,846 4,344 390 Transfers Out (238) (1,647) (6,283) (8,168) (1,319)
Total Transfers In (Out) (238) (1,149) (2,437) (3,824) (929)
Change In Net Position 4,956 (12,488) (4,514) (12,046) 17,845
Net Position - October 1 (restated) 372,416 (6,892) 23,233 62,674
Net Position - September 30 377,372$ (19,380)$ 18,719$ 80,519$
Adjustment to reflect the consolidation of internal service fund activities related to enterprise funds. 3,696
(8,350)$ Change in Net Position of Business-Type Activities
BUSINESS-TYPE ACTIVITIESENTERPRISE FUNDS
CITY OF SAN ANTONIO, TEXAS
Year-Ended September 30, 2016(In Thousands)
19
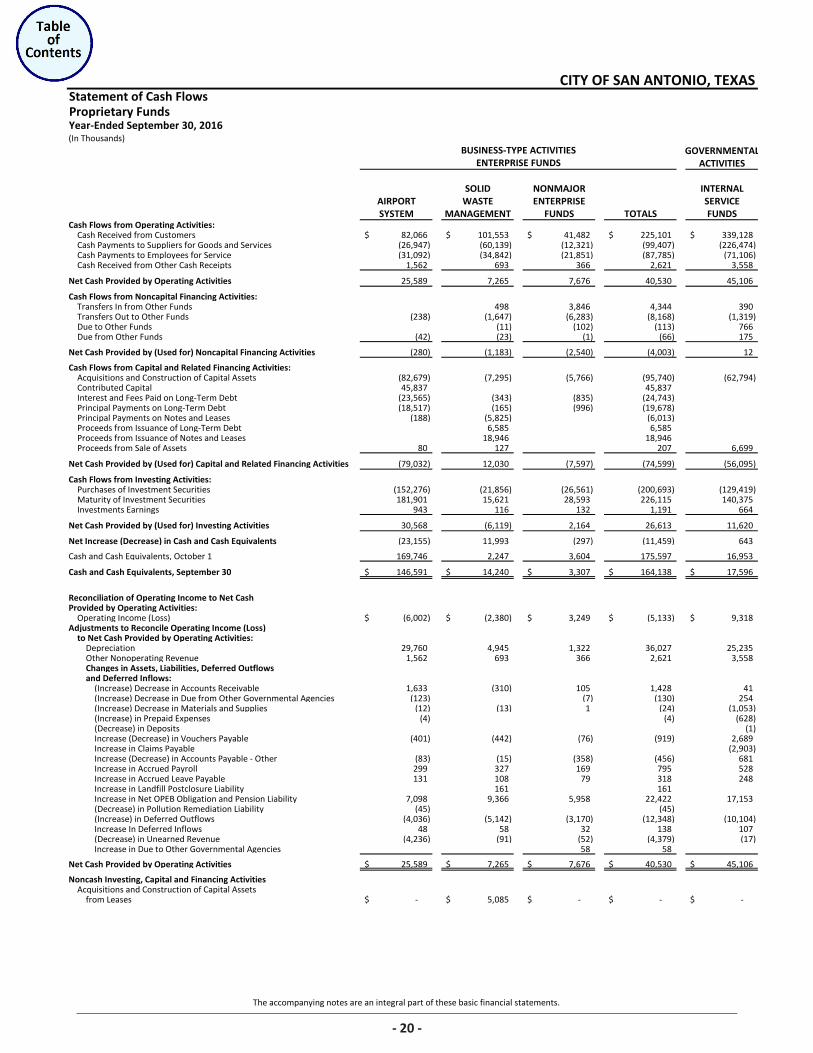
The accompanying notes are an integral part of these basic financial statements.
Statement of Cash FlowsProprietary Funds
(In Thousands)GOVERNMENTAL
ACTIVITIES
SOLID NONMAJOR INTERNALAIRPORT WASTE ENTERPRISE SERVICESYSTEM MANAGEMENT FUNDS TOTALS FUNDS
Cash Flows from Operating Activities:Cash Received from Customers 82,066$ 101,553$ 41,482$ 225,101$ 339,128$ Cash Payments to Suppliers for Goods and Services (26,947) (60,139) (12,321) (99,407) (226,474) Cash Payments to Employees for Service (31,092) (34,842) (21,851) (87,785) (71,106) Cash Received from Other Cash Receipts 1,562 693 366 2,621 3,558
Net Cash Provided by Operating Activities 25,589 7,265 7,676 40,530 45,106
Cash Flows from Noncapital Financing Activities:Transfers In from Other Funds 498 3,846 4,344 390 Transfers Out to Other Funds (238) (1,647) (6,283) (8,168) (1,319) Due to Other Funds (11) (102) (113) 766 Due from Other Funds (42) (23) (1) (66) 175
Net Cash Provided by (Used for) Noncapital Financing Activities (280) (1,183) (2,540) (4,003) 12
Cash Flows from Capital and Related Financing Activities:Acquisitions and Construction of Capital Assets (82,679) (7,295) (5,766) (95,740) (62,794) Contributed Capital 45,837 45,837 Interest and Fees Paid on Long-Term Debt (23,565) (343) (835) (24,743) Principal Payments on Long-Term Debt (18,517) (165) (996) (19,678) Principal Payments on Notes and Leases (188) (5,825) (6,013) Proceeds from Issuance of Long-Term Debt 6,585 6,585 Proceeds from Issuance of Notes and Leases 18,946 18,946 Proceeds from Sale of Assets 80 127 207 6,699
Net Cash Provided by (Used for) Capital and Related Financing Activities (79,032) 12,030 (7,597) (74,599) (56,095)
Cash Flows from Investing Activities:Purchases of Investment Securities (152,276) (21,856) (26,561) (200,693) (129,419) Maturity of Investment Securities 181,901 15,621 28,593 226,115 140,375 Investments Earnings 943 116 132 1,191 664
Net Cash Provided by (Used for) Investing Activities 30,568 (6,119) 2,164 26,613 11,620
Net Increase (Decrease) in Cash and Cash Equivalents (23,155) 11,993 (297) (11,459) 643
Cash and Cash Equivalents, October 1 169,746 2,247 3,604 175,597 16,953
Cash and Cash Equivalents, September 30 146,591$ 14,240$ 3,307$ 164,138$ 17,596$
Reconciliation of Operating Income to Net CashProvided by Operating Activities:
Operating Income (Loss) (6,002)$ (2,380)$ 3,249$ (5,133)$ 9,318$ Adjustments to Reconcile Operating Income (Loss)
to Net Cash Provided by Operating Activities: Depreciation 29,760 4,945 1,322 36,027 25,235 Other Nonoperating Revenue 1,562 693 366 2,621 3,558 Changes in Assets, Liabilities, Deferred Outflows and Deferred Inflows:
(Increase) Decrease in Accounts Receivable 1,633 (310) 105 1,428 41 (Increase) Decrease in Due from Other Governmental Agencies (123) (7) (130) 254 (Increase) Decrease in Materials and Supplies (12) (13) 1 (24) (1,053) (Increase) in Prepaid Expenses (4) (4) (628) (Decrease) in Deposits (1) Increase (Decrease) in Vouchers Payable (401) (442) (76) (919) 2,689 Increase in Claims Payable (2,903) Increase (Decrease) in Accounts Payable - Other (83) (15) (358) (456) 681 Increase in Accrued Payroll 299 327 169 795 528 Increase in Accrued Leave Payable 131 108 79 318 248 Increase in Landfill Postclosure Liability 161 161 Increase in Net OPEB Obligation and Pension Liability 7,098 9,366 5,958 22,422 17,153 (Decrease) in Pollution Remediation Liability (45) (45) (Increase) in Deferred Outflows (4,036) (5,142) (3,170) (12,348) (10,104) Increase In Deferred Inflows 48 58 32 138 107 (Decrease) in Unearned Revenue (4,236) (91) (52) (4,379) (17) Increase in Due to Other Governmental Agencies 58 58
Net Cash Provided by Operating Activities 25,589$ 7,265$ 7,676$ 40,530$ 45,106$
Noncash Investing, Capital and Financing ActivitiesAcquisitions and Construction of Capital Assets
from Leases -$ 5,085$ -$ -$ -$
BUSINESS-TYPE ACTIVITIESENTERPRISE FUNDS
CITY OF SAN ANTONIO, TEXAS
Year-Ended September 30, 2016
20
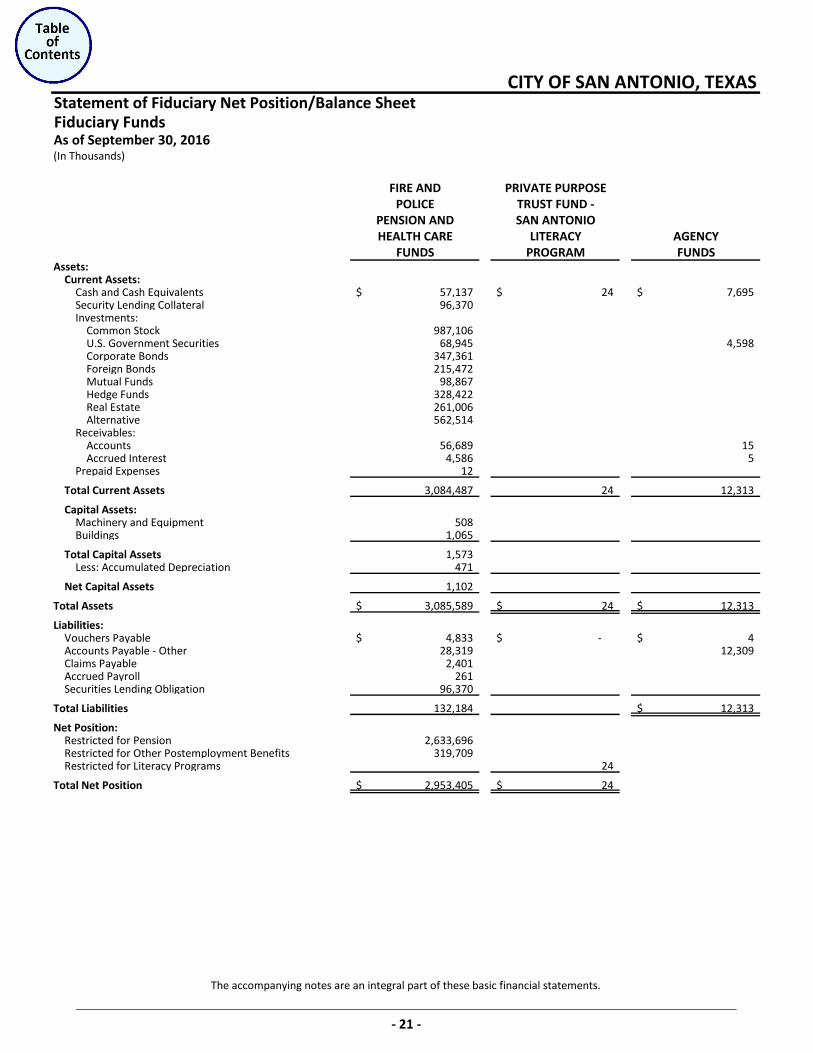
The accompanying notes are an integral part of these basic financial statements.
Statement of Fiduciary Net Position/Balance SheetFiduciary FundsAs of September 30, 2016(In Thousands)
FIRE AND PRIVATE PURPOSEPOLICE TRUST FUND -
PENSION AND SAN ANTONIOHEALTH CARE LITERACY AGENCY
FUNDS PROGRAM FUNDSAssets:
Current Assets:Cash and Cash Equivalents 57,137$ 24$ 7,695$ Security Lending Collateral 96,370 Investments:
Common Stock 987,106 U.S. Government Securities 68,945 4,598 Corporate Bonds 347,361 Foreign Bonds 215,472 Mutual Funds 98,867 Hedge Funds 328,422 Real Estate 261,006 Alternative 562,514
Receivables:Accounts 56,689 15 Accrued Interest 4,586 5
Prepaid Expenses 12
Total Current Assets 3,084,487 24 12,313
Capital Assets:Machinery and Equipment 508 Buildings 1,065
Total Capital Assets 1,573 Less: Accumulated Depreciation 471
Net Capital Assets 1,102
Total Assets 3,085,589$ 24$ 12,313$
Liabilities:Vouchers Payable 4,833$ -$ 4$ Accounts Payable - Other 28,319 12,309 Claims Payable 2,401 Accrued Payroll 261 Securities Lending Obligation 96,370
Total Liabilities 132,184 12,313$
Net Position:Restricted for Pension 2,633,696 Restricted for Other Postemployment Benefits 319,709 Restricted for Literacy Programs 24
Total Net Position 2,953,405$ 24$
CITY OF SAN ANTONIO, TEXAS
‐ 21 ‐
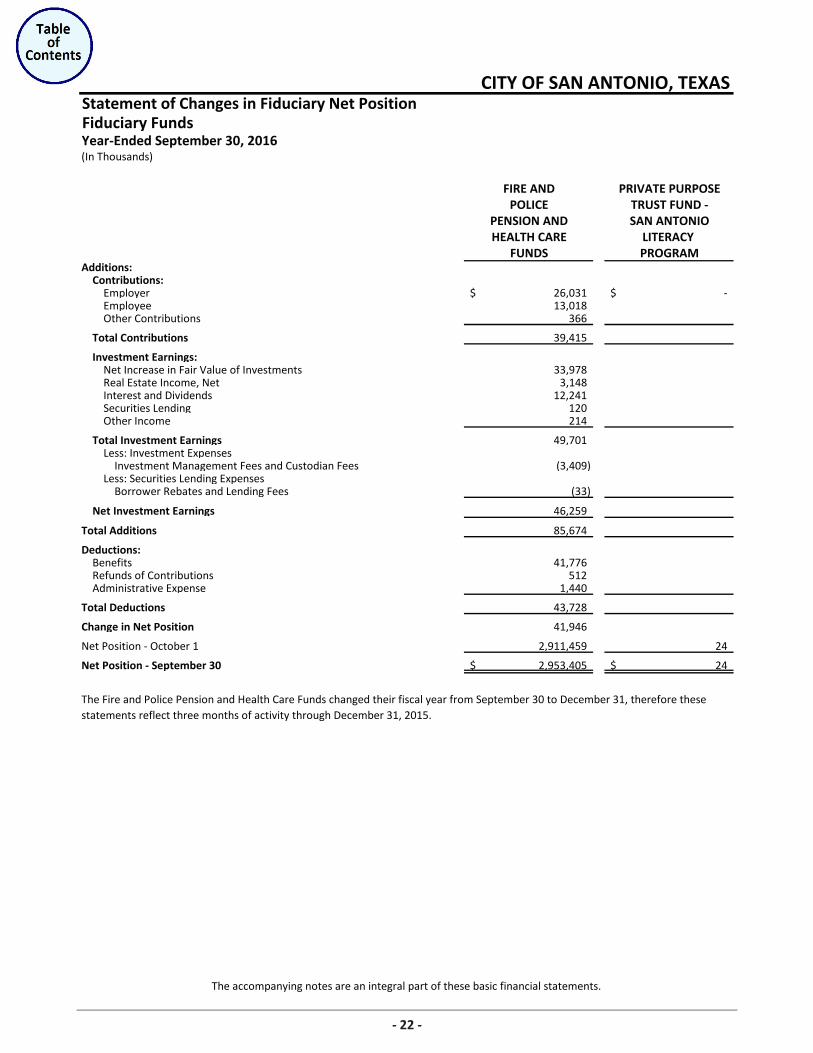
The accompanying notes are an integral part of these basic financial statements.
Statement of Changes in Fiduciary Net PositionFiduciary FundsYear-Ended September 30, 2016(In Thousands)
FIRE AND PRIVATE PURPOSEPOLICE TRUST FUND -
PENSION AND SAN ANTONIOHEALTH CARE LITERACY
FUNDS PROGRAMAdditions:
Contributions:Employer 26,031$ -$ Employee 13,018 Other Contributions 366
Total Contributions 39,415
Investment Earnings:Net Increase in Fair Value of Investments 33,978 Real Estate Income, Net 3,148 Interest and Dividends 12,241 Securities Lending 120 Other Income 214
Total Investment Earnings 49,701 Less: Investment Expenses
Investment Management Fees and Custodian Fees (3,409) Less: Securities Lending Expenses
Borrower Rebates and Lending Fees (33)
Net Investment Earnings 46,259
Total Additions 85,674
Deductions:Benefits 41,776 Refunds of Contributions 512 Administrative Expense 1,440
Total Deductions 43,728
Change in Net Position 41,946
Net Position - October 1 2,911,459 24
Net Position - September 30 2,953,405$ 24$
CITY OF SAN ANTONIO, TEXAS
The Fire and Police Pension and Health Care Funds changed their fiscal year from September 30 to December 31, therefore these statements reflect three months of activity through December 31, 2015.
22
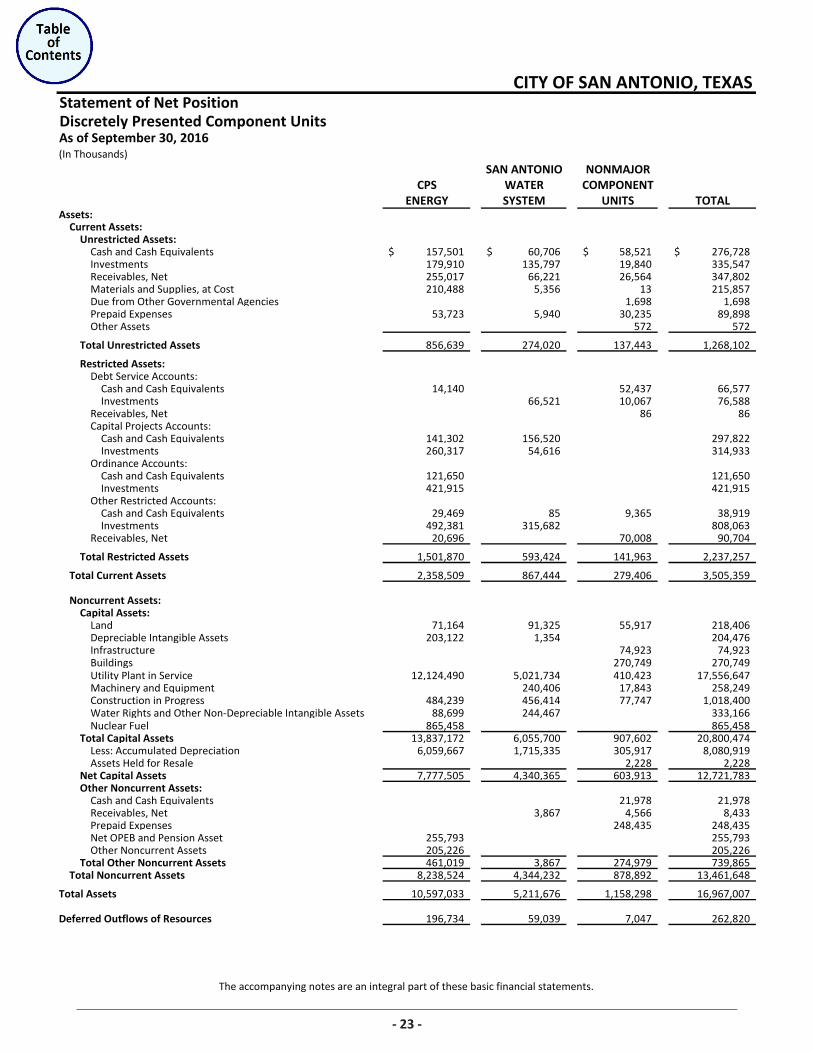
The accompanying notes are an integral part of these basic financial statements.
Statement of Net PositionDiscretely Presented Component Units
(In Thousands)SAN ANTONIO NONMAJOR
CPS WATER COMPONENTENERGY SYSTEM UNITS TOTAL
Assets:Current Assets:
Unrestricted Assets:Cash and Cash Equivalents 157,501$ 60,706$ 58,521$ 276,728$ Investments 179,910 135,797 19,840 335,547 Receivables, Net 255,017 66,221 26,564 347,802 Materials and Supplies, at Cost 210,488 5,356 13 215,857 Due from Other Governmental Agencies 1,698 1,698 Prepaid Expenses 53,723 5,940 30,235 89,898 Other Assets 572 572
Total Unrestricted Assets 856,639 274,020 137,443 1,268,102
Restricted Assets:Debt Service Accounts:
Cash and Cash Equivalents 14,140 52,437 66,577 Investments 66,521 10,067 76,588
Receivables, Net 86 86 Capital Projects Accounts:
Cash and Cash Equivalents 141,302 156,520 297,822 Investments 260,317 54,616 314,933
Ordinance Accounts: Cash and Cash Equivalents 121,650 121,650 Investments 421,915 421,915
Other Restricted Accounts: Cash and Cash Equivalents 29,469 85 9,365 38,919 Investments 492,381 315,682 808,063
Receivables, Net 20,696 70,008 90,704
Total Restricted Assets 1,501,870 593,424 141,963 2,237,257
Total Current Assets 2,358,509 867,444 279,406 3,505,359
Noncurrent Assets:Capital Assets:
Land 71,164 91,325 55,917 218,406 Depreciable Intangible Assets 203,122 1,354 204,476 Infrastructure 74,923 74,923 Buildings 270,749 270,749 Utility Plant in Service 12,124,490 5,021,734 410,423 17,556,647 Machinery and Equipment 240,406 17,843 258,249 Construction in Progress 484,239 456,414 77,747 1,018,400 Water Rights and Other Non-Depreciable Intangible Assets 88,699 244,467 333,166 Nuclear Fuel 865,458 865,458
Total Capital Assets 13,837,172 6,055,700 907,602 20,800,474 Less: Accumulated Depreciation 6,059,667 1,715,335 305,917 8,080,919 Assets Held for Resale 2,228 2,228
Net Capital Assets 7,777,505 4,340,365 603,913 12,721,783 Other Noncurrent Assets:
Cash and Cash Equivalents 21,978 21,978 Receivables, Net 3,867 4,566 8,433 Prepaid Expenses 248,435 248,435 Net OPEB and Pension Asset 255,793 255,793 Other Noncurrent Assets 205,226 205,226
Total Other Noncurrent Assets 461,019 3,867 274,979 739,865 Total Noncurrent Assets 8,238,524 4,344,232 878,892 13,461,648
Total Assets 10,597,033 5,211,676 1,158,298 16,967,007
Deferred Outflows of Resources 196,734 59,039 7,047 262,820
CITY OF SAN ANTONIO, TEXAS
As of September 30, 2016
23
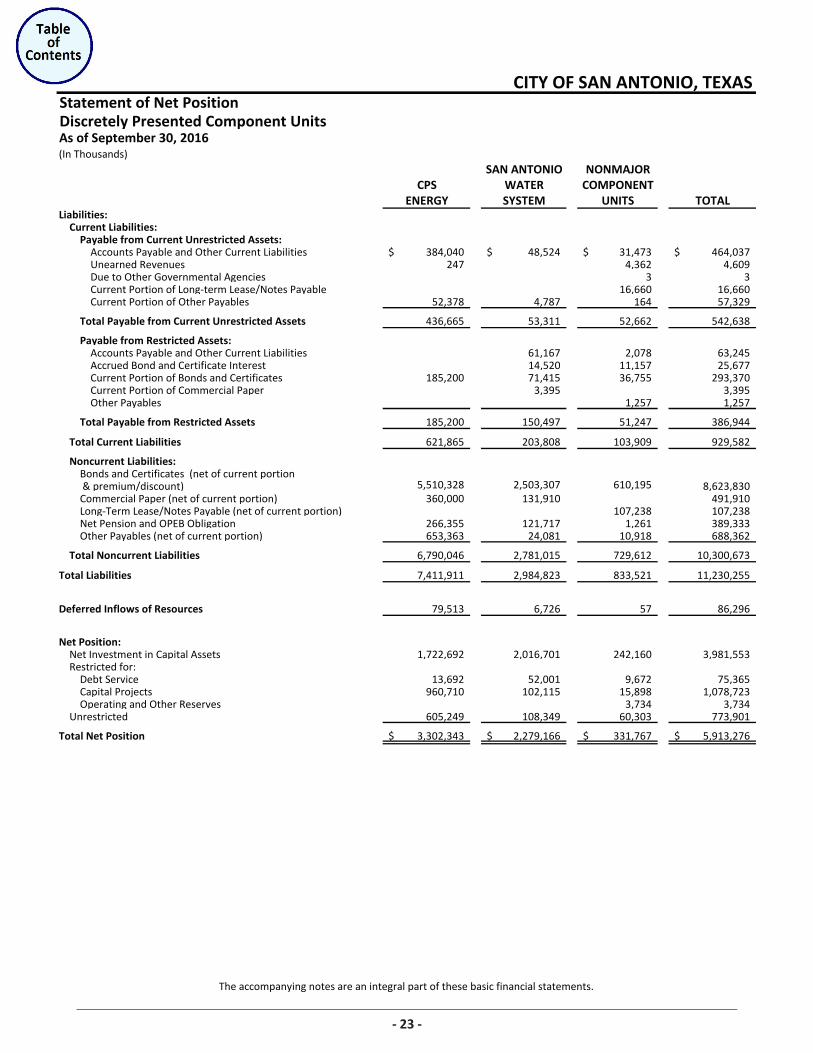
The accompanying notes are an integral part of these basic financial statements.
Statement of Net PositionDiscretely Presented Component Units
(In Thousands)SAN ANTONIO NONMAJOR
CPS WATER COMPONENTENERGY SYSTEM UNITS TOTAL
Liabilities:Current Liabilities:
Payable from Current Unrestricted Assets:Accounts Payable and Other Current Liabilities 384,040$ 48,524$ 31,473$ 464,037$ Unearned Revenues 247 4,362 4,609 Due to Other Governmental Agencies 3 3 Current Portion of Long-term Lease/Notes Payable 16,660 16,660 Current Portion of Other Payables 52,378 4,787 164 57,329
Total Payable from Current Unrestricted Assets 436,665 53,311 52,662 542,638
Payable from Restricted Assets:Accounts Payable and Other Current Liabilities 61,167 2,078 63,245 Accrued Bond and Certificate Interest 14,520 11,157 25,677 Current Portion of Bonds and Certificates 185,200 71,415 36,755 293,370 Current Portion of Commercial Paper 3,395 3,395 Other Payables 1,257 1,257
Total Payable from Restricted Assets 185,200 150,497 51,247 386,944
Total Current Liabilities 621,865 203,808 103,909 929,582
Noncurrent Liabilities:Bonds and Certificates (net of current portion & premium/discount) 5,510,328 2,503,307 610,195 8,623,830 Commercial Paper (net of current portion) 360,000 131,910 491,910 Long-Term Lease/Notes Payable (net of current portion) 107,238 107,238 Net Pension and OPEB Obligation 266,355 121,717 1,261 389,333 Other Payables (net of current portion) 653,363 24,081 10,918 688,362
Total Noncurrent Liabilities 6,790,046 2,781,015 729,612 10,300,673
Total Liabilities 7,411,911 2,984,823 833,521 11,230,255
Deferred Inflows of Resources 79,513 6,726 57 86,296
Net Position:Net Investment in Capital Assets 1,722,692 2,016,701 242,160 3,981,553 Restricted for:
Debt Service 13,692 52,001 9,672 75,365 Capital Projects 960,710 102,115 15,898 1,078,723 Operating and Other Reserves 3,734 3,734
Unrestricted 605,249 108,349 60,303 773,901
Total Net Position 3,302,343$ 2,279,166$ 331,767$ 5,913,276$
As of September 30, 2016
CITY OF SAN ANTONIO, TEXAS
23
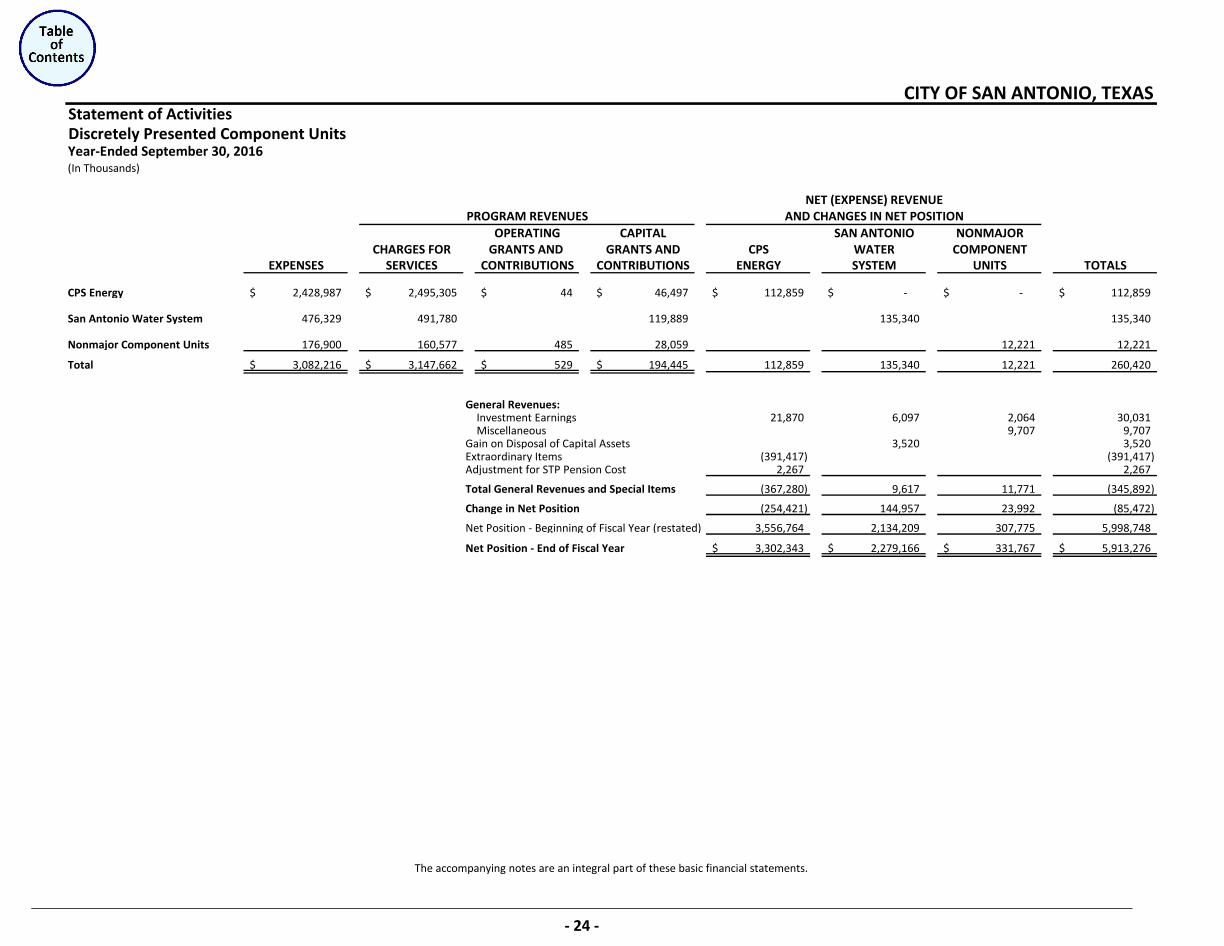
The accompanying notes are an integral part of these basic financial statements.
Statement of ActivitiesDiscretely Presented Component Units
(In Thousands)
OPERATING CAPITAL SAN ANTONIO NONMAJORCHARGES FOR GRANTS AND GRANTS AND CPS WATER COMPONENT
EXPENSES SERVICES CONTRIBUTIONS CONTRIBUTIONS ENERGY SYSTEM UNITS TOTALS
CPS Energy 2,428,987$ 2,495,305$ 44$ 46,497$ 112,859$ -$ -$ 112,859$
San Antonio Water System 476,329 491,780 119,889 135,340 135,340
Nonmajor Component Units 176,900 160,577 485 28,059 12,221 12,221
Total 3,082,216$ 3,147,662$ 529$ 194,445$ 112,859 135,340 12,221 260,420
General Revenues:Investment Earnings 21,870 6,097 2,064 30,031 Miscellaneous 9,707 9,707
Gain on Disposal of Capital Assets 3,520 3,520 Extraordinary Items (391,417) (391,417) Adjustment for STP Pension Cost 2,267 2,267
Total General Revenues and Special Items (367,280) 9,617 11,771 (345,892)
Change in Net Position (254,421) 144,957 23,992 (85,472)
Net Position - Beginning of Fiscal Year (restated) 3,556,764 2,134,209 307,775 5,998,748
Net Position - End of Fiscal Year 3,302,343$ 2,279,166$ 331,767$ 5,913,276$
NET (EXPENSE) REVENUEAND CHANGES IN NET POSITIONPROGRAM REVENUES
Year-Ended September 30, 2016
CITY OF SAN ANTONIO, TEXAS
‐ 24 ‐
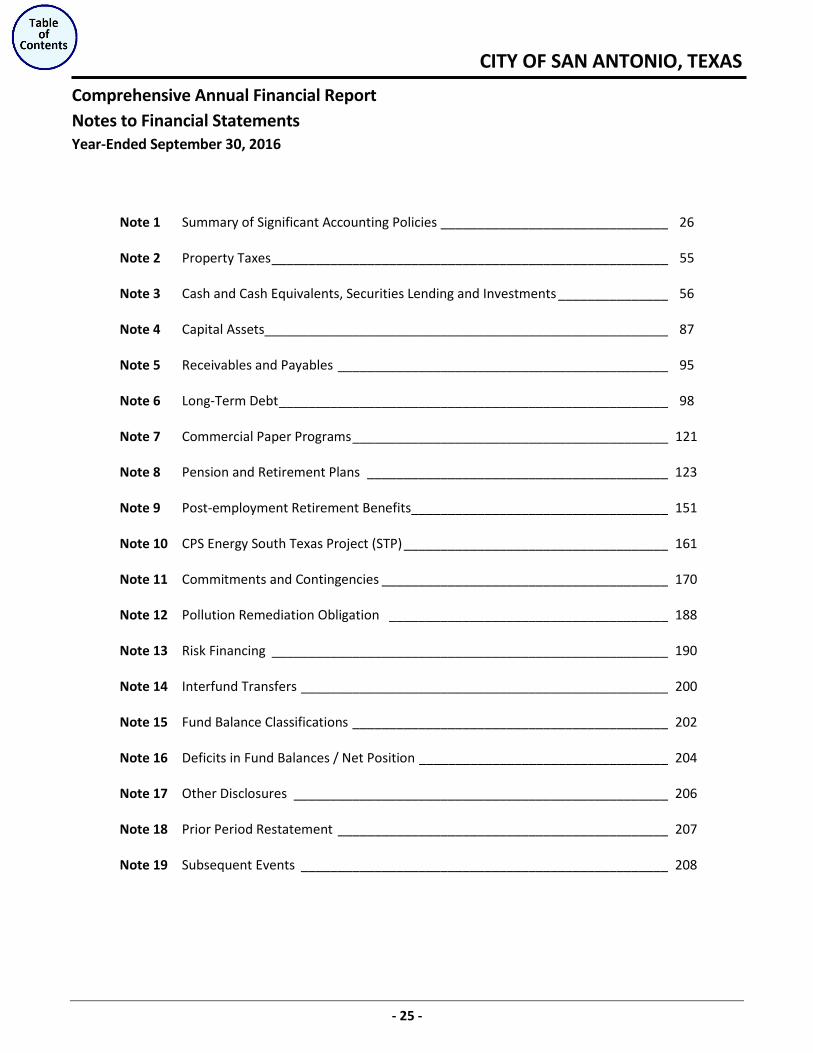
CITY OF SAN ANTONIO, TEXAS
- 25 -
Comprehensive Annual Financial Report Notes to Financial Statements Year-Ended September 30, 2016
Note 1 Summary of Significant Accounting Policies _______________________________ 26 Note 2 Property Taxes ______________________________________________________ 55 Note 3 Cash and Cash Equivalents, Securities Lending and Investments _______________ 56 Note 4 Capital Assets _______________________________________________________ 87 Note 5 Receivables and Payables _____________________________________________ 95 Note 6 Long-Term Debt _____________________________________________________ 98 Note 7 Commercial Paper Programs ___________________________________________ 121 Note 8 Pension and Retirement Plans _________________________________________ 123 Note 9 Post-employment Retirement Benefits ___________________________________ 151 Note 10 CPS Energy South Texas Project (STP) ____________________________________ 161 Note 11 Commitments and Contingencies _______________________________________ 170 Note 12 Pollution Remediation Obligation ______________________________________ 188 Note 13 Risk Financing ______________________________________________________ 190 Note 14 Interfund Transfers __________________________________________________ 200
Note 15 Fund Balance Classifications ___________________________________________ 202
Note 16 Deficits in Fund Balances / Net Position __________________________________ 204 Note 17 Other Disclosures ___________________________________________________ 206 Note 18 Prior Period Restatement _____________________________________________ 207 Note 19 Subsequent Events __________________________________________________ 208
Notes to Financial Statements
Year-Ended September 30, 2016 - 26 - Amounts are expressed in thousands
Note 1 Summary of Significant Accounting Policies The financial statements of the City of San Antonio (the City) have been prepared in conformity with U.S. generally accepted accounting principles (GAAP) for local governmental units. The Governmental Accounting Standards Board (GASB) is the accepted body for establishing governmental accounting and financial reporting standards. The following is a summary of significant accounting policies of the City.
Reporting Entity In the evaluation of how to define the City for financial reporting purposes, management considered all potential component units. The decision to include a potential component unit in the reporting entity was made by applying the criteria set forth in GASB Statement No. 61, The Financial Reporting Entity: Omnibus — an amendment of GASB Statements No. 14 and No. 34. The underlying concept of the Statement is improving guidance for including, presenting, and disclosing information about component units and equity interest transactions of a financial reporting entity. The financial reporting entity consists of: (a) the primary government (in these financial statements the primary government is the City), (b) component units, which are legally separate organizations for which the City is financially accountable or the services rendered by the component unit are provided entirely or almost entirely to the City (blended), (c) component units, which are fiduciary in nature such as certain public employee retirement systems or pension trust funds with the City (fiduciary), and (d) component units, the nature and significance of their relationship with the City is such that exclusion from the reporting entity’s financial statements would be misleading or incomplete (discretely presented). Using the criteria of GASB Statement No. 61 outlined below, potential component units were evaluated for inclusion in or exclusion from the reporting entity, whether the organizations were financially accountable or not, and were further evaluated for financial statement presentation. Based on their individual relationships with the City, some component unit financial statements were blended as though they are part of the City and others were discretely presented. The following criteria (as set forth in GASB Statement No. 61) were used in the evaluation of potential component units of the City: 1) Legally separate 2) Financial accountability a) Appointment of a voting majority b) Imposition of will c) Financial benefit to or burden on the City d) Fiscal dependency with financial benefit to or burden on the City 3) The relationship with the City is such that exclusion would cause these financial statements to be misleading or
incomplete 4) Service rendered by the potential component unit is provided entirely or almost entirely to the City 5) The City or its component units, are entitled to, or have the ability to access the majority of the resources
received or held by the separate organization.
The criteria outlined above were excerpted from GASB Statement No. 61. For a more detailed explanation of the criteria established by the Statements, refer to the Codification of Governmental Accounting and Financial Reporting Standards, as of June 30, 2016, published by GASB, Section-2600. GASB Statement No. 39, Determining Whether Certain Organizations Are Component Units, further clarifies that a “not for profit” may not be financially accountable to the City, but may be considered a component unit based on the nature and significance of its relationship with the City. Predicated upon the application of the criteria outlined above, the following is a brief overview of component units included in the reporting entity.
Notes to Financial Statements
Year-Ended September 30, 2016 - 27 - Amounts are expressed in thousands
Note 1 Summary of Significant Accounting Policies (Continued) Blended Component Units The relationships among the following component units and the City meet the criteria, as set forth in GASB Statement No. 61, for inclusion in the reporting entity and are such that the financial statements are blended with those of the City. Following is a brief description of the City’s blended component units:
San Antonio Early Childhood
Education Municipal Development Corporation dba
Pre-K 4 SA P.O. Box 839966
San Antonio, TX 78283-3966 Contact: Sarah Baray
Telephone No. (210) 206-2740
The San Antonio Early Childhood Education Municipal Development Corporation dba Pre-K 4 SA was established in fiscal year 2012 in accordance with state laws for the purpose of, and to act on behalf of the City, developing and running authorized programs for early childhood education services. Pre-K 4 SA is governed by a board of trustees appointed by the City Council. Pre-K 4 SA’s debt, including leases, is expected to be repaid almost entirely with the resources of the City, a 1/8 cent sales tax increase approved by San Antonio residents. The City has the ability to impose its will.
Convention Center Hotel Finance Corporation
P.O. Box 839966 San Antonio, TX 78283-3966 Contact: Margaret Villegas
Telephone No. (210) 207-5734
The Convention Center Hotel Finance Corporation (CCHFC) was established in fiscal year 2005 in accordance with state laws for the purposes of, and to act on behalf of the City in, local economic development to stimulate business and commercial activity in the City. The CCHFC is governed by a board of directors, which is comprised of the City Council of San Antonio (City Council). CCHFC’s governing board is substantially the same as the City’s governing board, and CCHFC met the financial benefit/burden criteria.
Hemisfair Park Area
Redevelopment Corporation c/o City of San Antonio
434 S. Alamo Street San Antonio, TX 78205
Contact: Omar Gonzalez Telephone No. (210) 560-5733
Municipal Golf Association – San Antonio
2315 Avenue B San Antonio, TX 78215
Contact: James E. Roschek Telephone No. (210) 268-5110
The Hemisfair Park Area Redevelopment Corporation (HPARC) was established in fiscal year 2009 in accordance with state laws for the purposes of, and to act on behalf of the City in, assisting with acquiring property, planning, developing, constructing, managing and financing projects within Hemisfair Park and its surrounding area in order to promote economic development, employment, and to stimulate business, housing, tourism, and commercial activity within the City. The HPARC is governed by 11 members appointed by the City Council and it provides services entirely to the City. The City has the ability to impose its will. Municipal Golf Association – San Antonio (MGA-SA) was established in fiscal year 2007 in accordance with state laws for the purposes of, and to act on behalf of the City in, operating and promoting the City’s municipal golf facilities. MGA-SA is governed by a 15 member board of directors, which is comprised of seven members selected by MGA-SA according to the approved process contained in its by-laws; two ex-officio member positions from City staff who are appointed by the City Manager; and six members appointed by the City Council. MGA-SA provides services entirely to the City and met the fiscal dependency and financial benefit/burden criteria.
Notes to Financial Statements
Year-Ended September 30, 2016 - 28 - Amounts are expressed in thousands
Note 1 Summary of Significant Accounting Policies (Continued)
Blended Component Units (Continued)
San Antonio Economic Development Corporation
100 W. Houston St., 19th Floor San Antonio, TX 78205
Contact: Rene Dominguez Telephone No. (210) 207-8080
San Antonio Education Facilities Corporation
100 W. Houston St., 19th Floor San Antonio, TX 78205
Contact: Rene Dominguez Telephone No. (210) 207-8080
The San Antonio Economic Development Corporation (EDC) was established in fiscal year 2010 as a nonprofit corporation to promote, assist, and enhance economic development activities for the City. EDC was organized for the purposes of undertaking any statute-authorized projects to benefit and accomplish the public purpose of promoting economic development in the City. The affairs of EDC are managed by a board of directors appointed by the City Council. The City Council may remove a director at any time without cause. EDC's budget is not effective until approved by the City Council. EDC provides services entirely to the City, as contracts or agreements cannot be executed without City Council approval. EDC also met the fiscal dependency and financial benefit/burden criteria, and the City has the ability to impose its will. The San Antonio Education Facilities Corporation (EFC), formerly the City of San Antonio Higher Education Authority, was established in 1984 in accordance with state laws for the purpose of aiding nonprofit institutions of higher education in providing educational, housing, and other related facilities in accordance with, and subject to, the provisions of Section 53.35 (b) Texas Education Code (the Code), all to be done on behalf of the City and its duly constituted authority and instrumentality. The Code authorizes EFC to issue revenue bonds, for which the City is not obligated in any manner, to finance qualified projects that meet the purpose of the Code. The EFC is governed by a board of directors, which is comprised of the City Council. The City has the ability to impose its will, and EFC also meets the financial benefit/burden and operational responsibility criteria.
San Antonio Health Facilities Development Corporation
100 W. Houston St., 19th Floor San Antonio, TX 78205
Contact: Rene Dominguez Telephone No. (210) 207-8080
The San Antonio Health Facilities Development Corporation (HFDC) was established by Ordinance No. 55400, dated June 3, 1982, in accordance with state laws for the purposes of, and to act on behalf of the City as, a corporation under the Texas Health Facilities Development Act of 1981. The HFDC is authorized to issue tax-exempt health facility revenue bonds, for which the City is not obligated in any manner, to finance health related projects in support of the promotion, expansion, and improvement of health facilities. The City Council comprises the board of directors that govern HFDC. The City has the ability to impose its will, and HFDC also meets the financial benefit/burden and operational responsibility criteria.
Notes to Financial Statements
Year-Ended September 30, 2016 - 29 - Amounts are expressed in thousands
Note 1 Summary of Significant Accounting Policies (Continued)
Blended Component Units (Continued)
San Antonio Industrial Development Authority
100 W. Houston St., 19th Floor San Antonio, TX 78205
Contact: Rene Dominguez Telephone No. (210) 207-8080
The San Antonio Industrial Development Authority (IDA) was established by Resolution No. 79-48-100, dated October 11, 1979, in accordance with state laws for the purposes of benefiting and accomplishing public purposes of, and to act on behalf of the City as, a corporation under the Development Corporation Act of 1979. The IDA is authorized to issue tax-exempt industrial revenue bonds, for which the City is not obligated in any manner, to finance qualified projects, which may further the promotion and development of commercial, industrial, and manufacturing enterprises to advance and encourage employment and public welfare. The IDA is governed by a board of directors, which is comprised of the City Council of San Antonio. The City has the ability to impose its will, and IDA also meets the financial benefit/burden and operational responsibility criteria.
San Antonio Texas Municipal Facilities Corporation
P.O. Box 839966 San Antonio, TX 78283-3966 Contact: Margaret Villegas
Telephone No. (210) 207-5734
The San Antonio Texas Municipal Facilities Corporation (TMFC) was established in fiscal year 2001 in accordance with state laws for the purposes of, and to act on behalf of the City in, acquiring, constructing, equipping, financing, operating, and maintaining land and other municipal facilities for the City. The TMFC is governed by a board of directors, which is comprised of the City Council of San Antonio. The City can impose its will, and TMFC also meets the operational responsibility criteria.
Starbright
Industrial Development Corporation
P.O. Box 839966 San Antonio, TX 78283-3966 Contact: Margaret Villegas
Telephone No. (210) 207-5734
The Starbright Industrial Development Corporation (SIDC) was established in fiscal year 2003 in accordance with state laws for the purposes of, and to act on behalf of the City in, the promotion and development of commercial, industrial, and manufacturing enterprises, to advance and encourage employment and public welfare, including but not limited to the acquisition of land. The SIDC is governed by a board of directors, which is comprised of the City Council of San Antonio. The City has the ability to impose its will, and SIDC also meets the financial benefit/burden and the operational responsibility criteria.
Texas Public Facilities Corporation
P.O. Box 839966 San Antonio, TX 78283-3966 Contact: Margaret Villegas
Telephone No. (210) 207-5734
Texas Public Facilities Corporation (TPFC) was established in fiscal year 2012 in accordance with state laws for the purpose of, and to act on behalf of the City, in effectuating the buyout of the City’s existing Hotel Revenue Bonds and funding for the expansion of the City’s Convention Center through issuance of 2012 Lease Revenue Bonds. The TPFC is governed by a board of directors, which is comprised of the City Council of San Antonio. The City has the ability to impose its will, and TPFC meets the operational responsibility criteria.
Notes to Financial Statements
Year-Ended September 30, 2016 - 30 - Amounts are expressed in thousands
Note 1 Summary of Significant Accounting Policies (Continued)
Blended Component Units (Continued)
Urban Renewal Agency of the City of San Antonio dba Office of
Urban Redevelopment of San Antonio
c/o City of San Antonio 100 W. Houston St.
San Antonio, TX 78205 Contact: John Jack
Telephone No. (210) 207-2129
The Urban Renewal Agency of the City of San Antonio dba Office of Urban Redevelopment of San Antonio (OUR SA) was created under the provisions of the Urban Renewal Law of the State of Texas. OUR SA is responsible for implementing the City’s Urban Renewal Program and may designate for urban renewal in such areas as it deems advisable, subject to approval by the City Council of San Antonio. OUR SA receives a majority of its operating funds from the City. OUR SA is governed by a six-member board of commissioners appointed by the City Council of San Antonio. OUR SA provides services entirely to the City and has met the fiscal dependency and financial benefit/burden criteria.
Westside Development
Corporation 630 S.W. 41st Street
San Antonio, TX 78237 Contact: Jocelyn Van Coney
Telephone No. (210) 501-0192
Westside Development Corporation (WDC) was established in fiscal year 2006 in accordance with state laws for the purposes of promoting economic development and redevelopment opportunities in the west side of San Antonio. WDC seeks to generate new capital investment, create higher paying jobs, and reduce the poverty level in the area. In addition, WDC functions as a land development corporation that has the power to buy, sell, and accept land as a nonprofit without the restrictions placed upon a municipality. WDC is governed by a board of directors nominated by a City Council committee and appointed by the City Council. The policy-setting oversight authority consists of 17 members, comprised of representatives of key stakeholders and Westside advocates. WDC provides services entirely to the City. The City has the ability to impose its will.
The blended component unit with a different fiscal year-end from the City is Pre-K 4 SA with a fiscal year-end of June 30th.
(The remainder of this page left blank intentionally)
Notes to Financial Statements
Year-Ended September 30, 2016 - 31 - Amounts are expressed in thousands
Note 1 Summary of Significant Accounting Policies (Continued)
Fiduciary Component Units
The relationships among the following component units and the City meet the criteria, as set forth in GASB Statement No. 61, for inclusion in the reporting entity and are such that the financial statements are presented as fiduciary funds of the City. As set forth in GASB Statement No. 34, Basic Financial Statements—and Management's Discussion and Analysis—for State and Local Governments, the City excludes fiduciary funds and component units that are fiduciary in nature from the government-wide financial statements. The City’s component units that are fiduciary in nature are the San Antonio Fire and Police Pension Fund and the San Antonio Fire and Police Retiree Health Care Fund. These component units are presented in the Statements of Fiduciary Net Position and Changes in Fiduciary Net Position.
San Antonio Fire and Police Pension Fund
11603 W. Coker Loop, Ste 201 San Antonio, TX 78216 Contact: Warren Schott
Telephone No. (210) 534-3262
The San Antonio Fire and Police Pension Fund (Pension Fund) is a single employer defined benefit plan established in accordance with state law. The Pension Fund is administered by a nine-member board of trustees, including two members of the City Council, the Mayor or her appointee, two active police officers, two active firefighters, and two uniformed retirees. The City and Pension Fund participants are obligated to make all contributions to the Pension Fund in accordance with rates established by state laws. Benefit levels are also set by state laws. Services rendered by the Pension Fund are exclusively for the benefit of eligible firefighters and police officers, upon retirement. The Pension Fund provides services entirely to the City.
San Antonio Fire and Police Retiree Health Care Fund
11603 W. Coker Loop, Ste 130 San Antonio, TX 78216 Contact: James Bounds
Telephone No. (210) 494-6500
The City of San Antonio Firefighters’ and Police Officers’ Retiree Prefunded Group Health Plan was created in October 1989 in accordance with the provisions of the City’s contracts with the local fire and police unions, respectively, to provide post-employment health care benefits to uniformed employees who retired on or after October 1, 1989. Pursuant to the passage of Senate Bill 1568 in 1997, a separate and distinct statutory trust, the San Antonio Fire and Police Retiree Health Care Fund (Health Fund), was created to provide these post-employment health care benefits for eligible uniformed employees of the City. The Health Fund is administered by a nine-member board of trustees, including two members of the City Council and the Mayor or her appointee. The City, active employees and retirees on behalf of their dependents are obligated to make all contributions to the Health Fund in accordance with rates established by state laws. Benefits are established pursuant to legislation enacted by the State with the Health Fund Board’s ability to modify those benefits within certain parameters. The Health Fund provides services entirely to the City.
It is management’s belief that to exclude essential disclosures from the City’s financial statements as they pertain to the Pension Fund and Health Fund would be misleading. Therefore, relevant disclosures have been included in the City’s financial statements. In fiscal year 2016, the Pension Fund and Health Fund changed their reporting year-ends from September 30th to December 31st; financial information disclosed in the City’s CAFR for both entities is as of December 31, 2015. The Statements of Changes in Fiduciary Net Position reports 3 months of activities based on the fiscal year change.
Notes to Financial Statements
Year-Ended September 30, 2016 - 32 - Amounts are expressed in thousands
Note 1 Summary of Significant Accounting Policies (Continued) Discretely Presented Component Units The relationship among the following component units and the City is such that they meet the criteria, as set forth in GASB Statement No. 61, for inclusion in the reporting entity as discretely presented component units.
Brooks Development Authority 3201 Sidney Brooks
Brooks City-Base, TX 78235-5355 Contact: Milo Nitschke
Telephone No. (210) 678-3306
Brooks Development Authority (BDA) is a special district and political subdivision of the State of Texas. It was established on September 27, 2001 as a defense base development authority in accordance with state laws for the purposes of, and to act on behalf of the City in, improving mission effectiveness, reducing the cost of providing quality installation support through improved capital asset management, and promoting economic development for Brooks Air Force Base and in the surrounding community. An eleven-member board of directors appointed by the City Council governs the BDA for two-year terms and oversees the Brooks Technology and Business Park in support of the Brooks City-Base Project. The City’s ability to impose its will on BDA is through the City Council having the power to remove board members.
CPS Energy P.O. Box 1771
San Antonio, TX 78296-1771 Contact: Gary W. Gold
Telephone No. (210) 353-2523
CPS Energy, a municipally owned utility, provides electricity and natural gas to San Antonio and the surrounding areas. CPS Energy is governed by a board of trustees, which is comprised of four members appointed by the City Council and has the City’s Mayor as an ex-officio member. The user rates for services and charges and the issuance of bonds are approved by the City Council.
SA Energy Acquisition Public Facility Corporation
P.O. Box 1771 San Antonio, TX 78296-1771
Contact: Gary W. Gold Telephone No. (210) 353-2523
SA Energy Acquisition Public Facility Corporation (SAEAPFC) was established in 2007 in accordance with state laws for the purposes of, and to act on behalf of the City in, the financing and acquisition of electric energy and power, oil, gas, coal and other liquid, gaseous or solid hydrocarbon fuels for the electric and gas systems of the City. SAEAPFC is governed by a seven-member board of directors appointed by the City Council for two-year terms. Board members are subject to removal by the City Council for cause or at will. The issuance of bonds is approved by the City Council.
Port Authority of San Antonio
dba Port San Antonio 907 Billy Mitchell Blvd, San Antonio, TX 78226 Contact: Maria Booth
Telephone No. (210) 362-7800
The Port Authority of San Antonio dba Port San Antonio (the Port) is a special district and political subdivision of the State of Texas that was originally established in 1996 as a local development authority under the Development Corp Act of 1979 for the purpose of monitoring the proposed closing of Kelly Air Force Base (Kelly); conducting comprehensive studies of all issues related to the closure, conversion, redevelopment, and future use of Kelly; reviewing all options relative to the most appropriate uses of Kelly and the surrounding area; formulating and adopting a comprehensive plan for the conversion and redevelopment of Kelly and submitting such plan to the appropriate agency or agencies of the federal government; and implementing such plan as it relates to Kelly and the surrounding area. The Port is governed by an eleven-member board of directors, appointed at will by the City Council. The Port is authorized to issue bonds, for which the City is not obligated in any manner, to finance projects as permitted by state laws.
Notes to Financial Statements
Year-Ended September 30, 2016 - 33 - Amounts are expressed in thousands
Note 1 Summary of Significant Accounting Policies (Continued) Discretely Presented Component Units (Continued)
San Antonio Water System
P.O. Box 2449 San Antonio, TX 78298-2449
Contact: Doug Evanson Telephone No. (210) 233-3803
On May 19, 1992, the consolidation of water systems, agencies and activities into one institution through a refunding of the then outstanding water and sewer bonds of the former City Water Board, Alamo Water Conservation and Re-Use District, and the City’s Sewer and Stormwater System, resulted in the creation of the San Antonio Water System (SAWS). The City Council determined that the interests of the citizens and the customers would best be served by placing authority for management and control of SAWS, as consolidated, with a board of trustees. This board of trustees includes the City’s Mayor as an ex-officio member, along with six members appointed by the City Council for four-year staggered terms. The rates for user charges and bond issuance authorizations are approved by the City Council.
San Antonio Water System
District Special Project P.O. Box 2449
San Antonio, TX 78298-2449 Contact: Doug Evanson
Telephone No. (210) 233-3803
On November 8, 2011, voters in the Bexar Metropolitan Water District (BexarMet) voted to dissolve the utility and transfer responsibility to SAWS. As authorized by Senate Bill 341 by the Texas Legislature and approved by the City Council, the San Antonio Water System District Special Project (DSP) operates as a component unit of the City during the transition of BexarMet’s operations into SAWS for a period lasting up to five years. The board of trustees includes the City’s Mayor as an ex-officio member, along with six members appointed by the City Council for four-year staggered terms. The rates for user charges and bond issuance authorizations are approved by the City Council. On January 14, 2016, City Council approved the dissolution of SAWS DSP. Please see Note 19 Subsequent Events for more information.
San Antonio Housing Trust
Finance Corporation 2515 Blanco Rd
San Antonio, TX 78212 Contact: John Kenny
Telephone No. (210) 735-2772
The San Antonio Housing Trust Finance Corporation (HTFC) was established in 1997 under the Texas Housing Finance Corporations Act (the Act), in accordance with state laws for the purposes of, and to act on behalf of the City in, carrying out the purposes of the Act, including the issuance of single family and multi-family revenue bonds. HTFC’s board of directors is appointed by the City Council and consists of five City Council members.
San Antonio Housing Trust Reinvestment Corporation
2515 Blanco Rd San Antonio, TX 78212 Contact: John Kenny
Telephone No. (210) 735-2772
San Antonio Housing Trust Reinvestment Corporation (HTRC) was created to act as a duly constituted authority of the City and is authorized by the City Council to aid, assist, and act on behalf of the City to promote for the common good and general welfare of reinvestment zones. As HTRC had no activity through September 30th, an audit is not deemed necessary in fiscal year 2016.
Notes to Financial Statements
Year-Ended September 30, 2016 - 34 - Amounts are expressed in thousands
Note 1 Summary of Significant Accounting Policies (Continued) Discretely Presented Component Units (Continued)
San Antonio Housing Trust Foundation, Inc. 2515 Blanco Rd.
San Antonio, TX 78212 Contact: John Kenny
Telephone No. (210) 735-2772
San Antonio Housing Trust Foundation, Inc. (HTF) is a nonprofit entity incorporated in 1990 under the laws of the State of Texas. HTF was organized for the purposes of supporting charitable, educational, and scientific undertakings, and specifically for providing housing for low- and middle-income families, promoting public health, safety, convenience, and welfare, revitalizing neighborhoods and the downtown area through appropriate housing activities, and providing administrative and other support for the operations of the City of San Antonio Housing Trust Fund, a Special Revenue Fund of the City. HTF is governed by an eleven-member board of directors appointed by the City Council.
San Antonio Housing Trust Public Facility Corporation
2515 Blanco Rd. San Antonio, TX 78212 Contact: John Kenny
Telephone No. (210) 735-2772
San Antonio Housing Trust Public Facility Corporation (HTPFC) was established in fiscal year 2010 as a nonprofit corporation organized for the purpose of assisting the City in financing, refinancing, or providing public facilities. HTPFC enables housing resources to be better coordinated and directed to accomplish the City’s revitalization goals and gives the City another tool to establish housing in downtown and other areas targeted for development. HTPFC’s board of directors is appointed by the City Council and consists of five City Council members.
San Antonio Tricentennial Celebration Commission
P.O. Box 839966 San Antonio, TX 78283-3966 Contact: Edward Benavides
Telephone No. (210) 207-7080
The San Antonio Tricentennial Celebration Commission (Commission) is a public nonprofit local government entity incorporated in 2015. The Commission was organized for the purpose of aiding and acting on behalf of the City to provide a means of assisting with the planning, developing, identifying potential partners, fundraising, managing, and financing of projects involved with the City’s 300th anniversary celebration scheduled for 2018. All powers of the Commission shall be vested in the Board of Directors. The Board shall consist of not less than 3 nor more than 19 persons, provided that 5 shall come at the recommendation of the Bexar County Commissioners Court. As the Commission had minimal activity through September 30th, the financial information included was not audited in fiscal year 2016.
It is management’s belief that to exclude essential disclosures from the City’s financial statements as they pertain to CPS Energy and SAWS would be misleading. CPS Energy and SAWS have been identified as major discretely presented component units as they both relate to total component units and to the primary government. Therefore, relevant disclosures have been included in the City’s financial statements. SAWS’ and SAWS DSP’s fiscal year-end is December 31, 2015, while CPS Energy’s and SA Energy Acquisition Public Facility Corporation’s fiscal year-end is January 31, 2016. Essential disclosures related to the above mentioned discretely presented, fiduciary, and blended component units are included in the complete financial statements of each of the individual component units. These statements may be obtained at the respective entity’s administrative office.
Notes to Financial Statements
Year-Ended September 30, 2016 - 35 - Amounts are expressed in thousands
Note 1 Summary of Significant Accounting Policies (Continued) Related Organizations The City Council appoints members to the board of commissioners for the Housing Authority of the City of San Antonio (SAHA) and a majority of the board of directors for Keep San Antonio Beautiful, Inc. However, the City’s accountability for these entities does not extend beyond making appointments to their boards and the coordination and approval of strategic plans for SAHA.
Joint Ventures
San Antonio Bexar County Soccer Public Facility Corporation (SABC PFC) was created in fiscal year 2016 as a joint venture between the City and Bexar County to operate Toyota Field, a professional soccer stadium. The SABC PFC is governed by a four member board comprised of two appointees from the City and two from the County. The City and the County contributed $9,500 to SABC PFC and have an ongoing financial interest in SABC PFC of 50.0%. SABC PFC has entered into a lease with San Antonio Football Club Management (SA FC) for the use of Toyota Field for a term of 20 years at an annual lease rental of $100. As part of this agreement, there is a provision requiring reimbursement to City and County of a combined $5,000 should no MLS franchise be awarded to SA FC. In coming years the financial statements can be obtained at the joint entity’s office at: 100 Military Plaza, San Antonio, TX 78205. Basic Financial Statements - GASB Statement No. 34 Government-Wide and Fund Financial Statements – The basic financial statements include three components: (1) government-wide financial statements, (2) fund financial statements, and (3) notes to the financial statements. The government-wide financial statements report information on all non fiduciary activities of the primary government and its component units. MD&A introduces the basic financial statements and provides an analytical overview of the City’s financial activities. Additionally, the effect of interfund activity has been removed from the statements. The Statement of Net Position – Reflects both short-term and long-term assets and liabilities as well as deferred inflows and outflows. In the government-wide Statement of Net Position, governmental activities are reported separately from business-type activities. Governmental activities are supported by taxes and intergovernmental revenues, whereas business-type activities are normally supported by user fees and charges for services. Long-term assets, such as capital assets, long-term obligations, such as debt, and any deferred inflows and outflows are now reported in the governmental activities. The components of Net Position are presented in three separate categories: (1) net investment in capital assets, (2) restricted, and (3) unrestricted. Interfund receivables and payables within governmental and business-type activities have been eliminated in the government-wide Statement of Net Position, which minimizes the duplication within the governmental and business-type activities. The net amount of interfund transfers between governmental and proprietary funds is the balance reported in the Statement of Net Position. Discretely presented component units are also reported in the Statement of Net Position. The Statement of Activities – Reflects both the gross and net cost format. The net cost (by function or business-type activity) is usually covered by general revenues (property tax, sales and use tax, revenues from utilities, etc.). Direct (gross) expenses of a given function or segment are offset by charges for services, operating and capital grants and contributions. Program revenues must be directly associated with the function of program activity. The presentation allows users to determine which functions are self-supporting and which rely on the tax base in order to complete their mission. Internal Service Fund balances, whether positive or negative, have been eliminated against the expenses and program revenues shown in the governmental and business-type activities of the Statement of Activities.
Notes to Financial Statements
Year-Ended September 30, 2016 - 36 - Amounts are expressed in thousands
Note 1 Summary of Significant Accounting Policies (Continued) Fund Accounting A reconciliation detailing the change in net position between the government-wide financial statements and the fund financial statements is presented separately for governmental funds. In order to achieve a break-even result in the Internal Service Fund activity, differences in the basis of accounting and reclassifications are allocated back to user departments. These allocations are reflected in the government-wide statements. Any residual amounts of the Internal Service Funds are reported in the governmental activity column. The proprietary funds have a reconciliation presented in the proprietary funds’ Statement of Net Position and Statement of Revenues, Expenses, and Changes in Net Position related to the Internal Service Fund allocation. The accounts of the City are organized on the basis of funds, each of which is considered a separate accounting entity. The operations of each fund are accounted for with a separate set of self-balancing accounts that comprise its assets and other debits, liabilities, fund balances and other credits, revenues and expenditures, or expenses, as appropriate. Government resources are allocated to and accounted for in individual funds based upon the proceeds of revenue sources, those proceeds’ restrictions or commitments for which they are to be spent and the means by which spending activities are controlled. The City has three types of funds: governmental, proprietary, and fiduciary. The fund financial statements provide more detailed information about the City’s most significant funds but not on the City as a whole. Major governmental and enterprise funds are reported separately in the fund financial statements. Nonmajor funds are aggregated in the fund financial statements and independently presented in the combining statements. The criteria used to determine if a governmental or enterprise fund should be reported as a major fund are as follows: the total assets and deferred outflows of resources, the total liabilities and deferred inflows of resources, revenues or expenditures/expenses of that individual governmental or enterprise fund are at least 10.0% of the corresponding element total for all funds of that category or type (that is, total governmental or total enterprise funds), and the same element that met the 10.0% criterion above in the governmental or enterprise fund is at least 5.0% of the corresponding element total for all governmental and enterprise funds combined. The following is a brief description of the major governmental funds that are separately presented in the fund financial statements:
The General Fund is always presented as a major fund. The Debt Service Fund accounts for the accumulation of resources for, and the payment of, general long-term debt principal, interest, and related costs, except those that are accounted for in enterprise funds. The City has designated Pre-K 4 SA, a blended component unit, as a major fund due to the high-profile nature and fiscal transparency for the program, which was funded by a voter-increased sales tax. The Convention Center Hotel Finance Corporation, a blended component unit, accounts for the receipt and disbursement of resources within the local economy in order to stimulate business and commercial activity in the City. It was created to issue debt for the construction of the Grand Hyatt and to further promote tourism within the City. The 2012 General Obligation Bonds Fund, a capital projects fund, accounts for the receipt and disbursement of $596,000 in bond sales for physical infrastructure development and improvement projects approved by a bond election held on May 13, 2012. The General Obligation Projects Fund, a capital projects fund, accounts for the acquisition or construction of major capital facilities such as streets, drainage, and library and park improvements, where funding is primarily derived from the sale of General Obligation Bonds.
Notes to Financial Statements
Year-Ended September 30, 2016 - 37 - Amounts are expressed in thousands
Note 1 Summary of Significant Accounting Policies (Continued) Fund Accounting (Continued) The following is a brief description of the major enterprise funds that are separately presented in the fund financial statements:
The Airport System accounts for the operation of the San Antonio International Airport and Stinson Municipal Airport. Financing for the Airport System’s operations is provided by user fees, while financing for the Airport System’s capital is primarily funded by City issued revenue bonds (repaid with user fees), grants and facility charges assessed to users. Solid Waste Management accounts for all revenues and expenses associated with the operations and maintenance of the City’s solid waste and environmental management programs, required debt service for outstanding bonds, and construction and management of Solid Waste Management’s assets.
Governmental Funds General Fund is the primary operating fund for the City, which accounts for and reports all financial resources of the general government not accounted for and reported in another fund. Special Revenue Funds are used to account for and report the proceeds of specific revenue sources that are restricted or committed to expenditure for specified purposes other than debt service and capital projects. The specific revenue sources are the foundation for the fund’s designation and are expected to continue to comprise a substantial portion of the inflows reported in the fund. If the fund no longer expects that a substantial portion of the inflows will derive from restricted or committed revenue sources, the fund’s remaining resources and activities are reported in the General Fund. Debt Service Fund is used to account for and report financial resources that are restricted, committed, or assigned to expenditures for principal and interest as well as financial resources that are being accumulated for principal and interest maturing in future years. Capital Projects Funds are used to account for and report financial resources that are restricted, committed, or assigned to expenditures for capital outlays, including the acquisition or construction of capital facilities and other capital assets, except those financed by enterprise funds. Permanent Funds are used to account for and report resources that are restricted to the extent that only earnings, not principal, may be used for purposes that support the reporting government’s programs - that is, for the benefit of the government or its citizenry. The governmental funds that have legally adopted budgets are the General Fund, Debt Service Fund, Special Revenue Funds (excluding HOME Program, Categorical Grant-In-Aid, HUD 108 Loan Program, Community Development Program, American Recovery and Reinvestment Act, Tax Increment Reinvestment Zone, San Antonio Housing Trust, and most Community Services Funds), City Cemeteries, and Pre-K 4 SA.
Notes to Financial Statements
Year-Ended September 30, 2016 - 38 - Amounts are expressed in thousands
Note 1 Summary of Significant Accounting Policies (Continued) Fund Accounting (Continued) Proprietary Funds Enterprise Funds are used to account for and report operations that are financed and operated in a manner similar to private business enterprises, where the intent of the governing body is that the expenses (including depreciation) of providing goods or services to the general public on a continuing basis should be financed or recovered primarily through user charges. Internal Service Funds are used to account for and report the financing of goods or services provided by one department or agency to other departments or agencies of the City, or to other governmental units, on a cost-reimbursement basis. The City's self-insurance programs, data processing programs, other internal service programs, and Capital Improvements Management Services (CIMS) are accounted for in these funds. Fiduciary Funds Trust and Agency Funds are used to account for and report assets held by the City in a trustee capacity or as an agent for individuals, private organizations, and other governmental units. These include the Pension Fund and Health Fund, which account for resources for pension and retiree health care benefits for the City's firefighters and police officers. The Private Purpose Trust Fund includes reporting on funds restricted for the City's literacy programs. The Agency Funds account for the City's sales and use tax to be remitted to the State of Texas, various fees for other governmental entities, unclaimed property, and various deposits held. The Pension Fund, Health Fund, and the Private Purpose Trust Fund are accounted for in essentially the same manner as proprietary funds. Agency Funds are custodial in nature (assets equal liabilities) and do not involve the measurement of results of operations. Measurement Focus and Basis of Accounting Primary Government (City) The government-wide financial statements present information about the City as a whole. Government-wide financial statements exclude both fiduciary funds and fiduciary component units. The Statement of Net Position and the Statement of Activities are reported using the economic resources measurement focus and the accrual basis of accounting. Revenues are recorded when earned and expenses are recorded when a liability is incurred, regardless of the timing of related cash flows. The City recognizes revenue from property taxes in the period for which they were levied. Other taxes and fees are recognized as revenue in the year they are earned. Revenues from grants and similar items are recognized in the fiscal year the qualifying expenditures are made and all other eligibility requirements have been satisfied. Program revenues are presented in the government-wide Statement of Activities. The City reports program revenues in three categories: (1) charges for services, (2) operating grants and contributions, and (3) capital grants and contributions. They are presented separately as a reduction of the total expense to arrive at the net expense of each functional activity. Program revenues are revenues generated by transactions with outside parties who purchase, use, or directly benefit from a program. They also include amounts such as grants and contributions received from outside parties that restrict the use of those resources to specific programs.
Notes to Financial Statements
Year-Ended September 30, 2016 - 39 - Amounts are expressed in thousands
Note 1 Summary of Significant Accounting Policies (Continued) Measurement Focus and Basis of Accounting (Continued) Primary Government (City) (Continued) 1) Charges for services are revenues generated by those who purchase goods or services from the City. Examples
of charges for services include airport landing fees, solid waste collection and disposal fees, and flat rate parking fees. Fines and forfeitures, license and permits and intergovernmental revenues as reported in the General Fund are also reported under charges for services.
2) Operating grants and contributions are those revenues that are restricted in the way they may be spent for operations of a particular program.
3) Capital grants and contributions are also restricted revenues whose resources may only be spent to purchase, build or use capital assets for specified programs.
All governmental funds are accounted for using the current financial resources measurement focus and the modified accrual basis of accounting. This means that only current assets and current liabilities are generally included in their balance sheets, and revenues are recognized in the accounting period in which they become available and measurable. Available means collectible within the current period, or soon enough thereafter, to be used to pay liabilities of the current period. Revenues from property taxes, sales and use taxes, occupancy taxes, gross receipts taxes, municipal court fines and fees, licenses, revenues from utilities, investment earnings, and charges for services are recorded on the modified accrual basis of accounting and, therefore, are considered susceptible to accrual. The City’s availability period is no more than 60 days beyond the end of the fiscal year. Grant revenues are recognized when reimbursable expenditures are made, all other eligibility requirements imposed by the provider have been met, and the City receives reimbursement within 60 days of the fiscal year-end. Grant funds received in advance and delinquent property taxes are recorded as unearned revenue until earned and available. Gross receipts and sales and use taxes are considered available when received by intermediary collecting governments and are recognized at that time. Anticipated refunds of such taxes are recorded as liabilities and reductions of revenue when they are measurable and their validity seems certain. Expenditures are recognized in the accounting period in which the fund liability is incurred; however, accrued leave, debt service expenditures, claims and judgments, arbitrage rebates, pension, post-employment obligations, and pollution remediation are recorded only when the liability is matured. The reported fund balance (net current assets) for each fund is considered a measure of current financial resources. Governmental fund operating statements present increases (revenues and other financing sources) and decreases (expenditures and other financing uses) in net current assets. Accordingly, they are said to present a summary of sources and uses of current financial resources during the period. Special reporting treatments are applied to governmental fund materials and supplies, prepaid expenditures, and deposits to indicate that they do not represent current financial resources, since they do not represent net current assets. Such amounts are generally offset by fund balance nonspendable accounts.
Notes to Financial Statements
Year-Ended September 30, 2016 - 40 - Amounts are expressed in thousands
Note 1 Summary of Significant Accounting Policies (Continued) Measurement Focus and Basis of Accounting (Continued) Primary Government (City) (Continued) Proprietary, Pension, Private Purpose Trust, Health Funds, and governmental and business-type activities are accounted for using the accrual basis of accounting. Their revenues are recognized when they are earned, and their expenses and related liabilities, including claims, judgments, and accrued leave, are recognized when they are incurred. These funds are accounted for on a cost of services or economic resources measurement focus. Consequently, all assets and all liabilities (whether current or noncurrent), as well as deferred inflows and outflows associated with its activity, are included in their Statement of Net Position. The reported proprietary fund net position is segregated into three components: (1) net investment in capital assets, (2) restricted, and (3) unrestricted. Proprietary fund type operating statements present increases (revenues) and decreases (expenses) in net position. Proprietary funds report both operating and nonoperating revenues and expenses in the Statement of Revenues, Expenses, and Changes in Fund Net Position. The City defines operating revenues as those receipts generated by a specified program offering either a good or service. For example, parking garage and surface lot charges are operating revenues of the Parking System. This definition is consistent with GASB Statement No. 9, Reporting Cash Flows of Proprietary and Nonexpendable Trust Funds and Governmental Entities That Use Proprietary Fund Accounting, which defines operating receipts as cash receipts from customers and other cash receipts that do not result from transactions defined as capital and related financing, noncapital financing or investing activities. Operating expenses include personal services, contractual services, commodities, other expenses (such as insurance), and depreciation. Revenues and expenses not fitting the above definitions are considered nonoperating. CPS Energy CPS Energy’s operating revenue includes receipts from energy sales, ancillary services and miscellaneous revenue related to the operation of electric and gas systems. Miscellaneous revenue includes late payment fees and rental income. CPS Energy’s revenues are recorded when earned. Customers’ meters are read or periodically estimated, and bills are prepared monthly based on billing cycles. Rate tariffs include adjustment clauses that permit recovery of electric and gas fuel costs. CPS Energy has used historical information from prior fiscal years as partial basis to estimate and record earned revenue not yet billed. This process has involved an extrapolation of customer usage over the days since the last meter read through the last day of the monthly period. Also included in unbilled revenue are the over/under-recoveries of electric and gas fuel costs and regulatory assessments. CPS Energy’s electric fuel cost adjustment clause also permits recovery of regulatory assessments. Specifically, beginning in March 2000, CPS Energy began recovering assessments from the Public Utility Commission of Texas (PUCT) for transmission access charges and from the Texas Independent System Operator, also known as the Electric Reliability Council of Texas, for its operating costs and other charges applicable to CPS Energy as a wholesale provider of power to other utilities. Regulatory assessments for fiscal year 2016 were $66,965. Operating expenses are recorded as incurred and include those costs that result from the ongoing operations of the electric and gas systems.
Notes to Financial Statements
Year-Ended September 30, 2016 - 41 - Amounts are expressed in thousands
Note 1 Summary of Significant Accounting Policies (Continued) Measurement Focus and Basis of Accounting (Continued) CPS Energy (Continued) Nonoperating revenue consists primarily of investment income, including fair market value adjustments, grant programs and rental income from the sale of communication towers. Certain miscellaneous income amounts from renting general property and providing various services are also recorded as nonoperating revenue when they are not directly identified with the electric or gas systems. CPS Energy accounts for decommissioning by recognizing a liability and expense for a pro rata share of projected decommissioning costs as determined by the most recent finalized cost study. A new cost study is performed every five years, and in years subsequent to the latest study, estimated annual decommissioning expense and an increase in the liability is calculated by applying the effects of inflation and the ratio of years of plant usage to total plant life. Additionally, due to requirements under the Code of Federal Regulations governing nuclear decommissioning trust funds, guidance pertaining to regulated operations provided in GASB Statement No. 62, Codification of Accounting and Financial Reporting Guidance Contained in Pre-November 30, 1989 FASB and AICPA Pronouncements, has been followed. Under this guidance, the zero net position approach is applied in accounting for the Decommissioning Trusts. In accordance with Statement No. 62, the cumulative effect of activity in the Decommissioning Trusts has been recorded as a regulatory liability reported on the Statement of Net Position as Other Payables (net of current portion), since any excess funds are payable to customers. Going forward, prolonged unfavorable economic conditions could result in the assets of the Trusts being less than the estimated decommissioning liability. In that case, instead of an excess as currently exists, there would be a deficit that would be reported as STP decommissioning net costs recoverable. This amount would be receivable from customers. To reflect funding methodology, the Allowance for Funds Used During Construction (AFUDC) rate includes both a debt and an equity component. The blended rate is composed of 50.0% equity and 50.0% debt based on construction funding forecasts. The investment rate is reviewed quarterly to determine if any adjustments are necessary. Alternate AFUDC rates are applied to projects costing more than $100,000, reflecting the method by which they are funded. Periodically, federal grants are made available to CPS Energy as a subrecipient for a portion of grant funds allocated to the State of Texas. Grant receipts are recorded as non-operating income and generally reimburse CPS Energy for costs, recorded as operating expenses, incurred in the administration of the program. This accounting treatment results in no impact to CPS Energy’s net position. Revenues associated with the grant-related programs are exempt from payments of a percentage of gross revenues made to the City. Grant funding received by CPS Energy is subject to review and audit by the grantor agencies. Such audits could lead to requests for reimbursements to the grantor agencies for expenditures disallowed under terms of the grants. Management believes such disallowances, if any, would be immaterial.
Notes to Financial Statements
Year-Ended September 30, 2016 - 42 - Amounts are expressed in thousands
Note 1 Summary of Significant Accounting Policies (Continued) Measurement Focus and Basis of Accounting (Continued) San Antonio Water System (SAWS) SAWS’ revenues are recorded as goods or services are provided. Customers’ meters are read and bills are prepared monthly based on billing cycles. SAWS uses historical information to estimate and record earned revenue not yet billed. SAWS’ principal operating revenues are charges to customers for water supply, water delivery, wastewater, and chilled water and steam services. Operating expenses include the cost of service, administrative expenses, and depreciation on capital assets. All revenues and expenses not meeting this definition are reported as nonoperating revenues and expenses. Nonoperating revenues consist primarily of interest income earned on investments, including the changes in fair value of investments. Nonoperating expenses consist primarily of interest expense, debt related costs, sales of capital assets and payments to the City. Deferred Inflows and Outflows
Deferred inflows of resources represent an acquisition of net position that applies to a future period(s) and so will not be recognized as an inflow of resources (revenue) until that time. Deferred outflows of resources represent a consumption of net position that applies to a future period(s) and so will not be recognized as an outflow of resources (expense/expenditure) until then. Primary Government (City) Deferred outflows of resources in the Statement of Net Position totaled $506,446 consisting of unrealized contributions and losses relating to pension in the amount of $476,057 (governmental activities $456,787 and business-type activities $19,270); and loss on bond refunding of $30,389 (governmental activities $26,823 and business-type activities $3,566). Deferred inflows of resources in the Statement of Net Position consists of unrealized gains related to all pensions totaled $47,919 ($46,369 in governmental activities and $1,550 in business-type activities). Additional information concerning deferred outflows of resources and deferred inflows of resources related to pensions can be found in Note 8 Pension and Retirement Plans. Deferred inflows of resources in the governmental fund financial statements related to the unavailable revenues associated with property taxes, EMS collections, fines and collections totaled $38,674. Additionally the CCHFC has a deferred inflow reported in the governmental fund financial statements for unavailable receipts for a loan from the Grand Hyatt Hotel totaling $182,985. Discretely Presented Component Units CPS Energy – Deferred outflows of resources totaled $196,734, consisting of unrealized pension contributions of $46,000 and losses relating to pension in the amount of $47,202; unrealized losses on fuel hedges of $37,920; and loss on refunding of $65,612. Deferred inflows of resources of $79,513 consists of unrealized gains related to pension totaling $75,006, and the sale of future revenues associated with the sale of the communication towers totaling $4,507.
Notes to Financial Statements
Year-Ended September 30, 2016 - 43 - Amounts are expressed in thousands
Note 1 Summary of Significant Accounting Policies (Continued)
Deferred Inflows and Outflows (Continued)
Discretely Presented Component Units (continued)
SAWS - Deferred outflows of resources totaled $59,039, consisting of an unamortized amount of $27,008; accumulated decrease of fair value of hedging derivatives totaling $16,394; and unrealized pension contributions of $11,843 and losses relating to pension in the amount of $3,794. Deferred inflows of resources of $6,726 consist of unrealized gains related to pension.
Current Year GASB Statement Implementations
In fiscal year 2016, the City implemented the following GASB Statements:
GASB Statement No. 72, Fair Value Measurement and Application, addresses accounting and financial reporting issues related to fair value measurements. This Statement provides guidance for determining a fair value measurement for financial reporting purposes and for applying fair value to certain investments and disclosures related to all fair value measurements. The requirements of this Statement will enhance comparability of financial statements among governments by requiring measurement of certain assets and liabilities at fair value using a consistent and more detailed definition of fair value and accepted valuation techniques. This Statement is effective for financial statements for periods beginning after June 15, 2015. The City implemented this Statement in fiscal year 2016. SAWS, a discretely presented component unit, did not implement GASB 72 in their financial statements included in the City’s fiscal year 2016 financials. SAWS will implement with their audit ending December 31, 2016.
GASB Statement No. 73, Accounting and Financial Reporting for Pensions and Related Assets That Are Not within the Scope of GASB Statement 68, and Amendments to Certain Provisions of GASB Statements 67 and 68, addresses accounting and financial reporting by employers and governmental non-employer contributing entities for pensions that are not within the scope of Statement No. 68. The requirements of this Statement extend the approach to accounting and financial reporting established in Statement No. 68 to all pensions, with modifications as necessary to reflect that for accounting and financial reporting purposes, any assets accumulated for pensions that are provided through pension plans that are not administered through trusts that meet the criteria specified in Statement No. 68 should not be considered pension plan assets. It also requires that information similar to that required by Statement No. 68 be included in notes to financial statements and required supplementary information by all similarly situated employers and non-employer contributing entities. This Statement is effective for financial statements for fiscal years beginning after June 15, 2016 for those entities not within the scope of Statement No. 68; the City is within the scope. The requirements of this Statement that address financial reporting for assets accumulated for purposes of providing those pensions, as well as those whose pension plans are within the scope of Statement No. 67 or Statement No. 68, are effective for fiscal years beginning after June 15, 2015. The City implemented this Statement in fiscal year 2016.
GASB Statement No. 76, The Hierarchy of Generally Accepted Accounting Principles for State and Local Governments, identifies—in the context of the current governmental financial reporting environment—the hierarchy of generally accepted accounting principles (GAAP). The “GAAP hierarchy” consists of the sources of accounting principles used to prepare financial statements of state and local governmental entities in conformity with GAAP and the framework for selecting those principles. This Statement reduces the GAAP hierarchy to two categories of authoritative GAAP and addresses the use of authoritative and non-authoritative literature in the event that the accounting treatment for a transaction or other event is not specified within a source of authoritative GAAP. This Statement supersedes Statement No. 55, The Hierarchy of Generally Accepted Accounting Principles for State and Local Governments. The requirements of this Statement are effective for financial statements for periods beginning after June 15, 2015, and should be applied retroactively. The City implemented this Statement in fiscal year 2016.
Notes to Financial Statements
Year-Ended September 30, 2016 - 44 - Amounts are expressed in thousands
Note 1 Summary of Significant Accounting Policies (Continued) Current Year GASB Statement Implementations (Continued) GASB Statement No. 79, Certain External Investment Pools and Pool Participants, addresses accounting and financial reporting for certain external investment pools and pool participants. Specifically, it establishes criteria for an external investment pool to qualify for making the election to measure all of its investments at amortized cost for financial reporting purposes. An external investment pool qualifies for that reporting if it meets all of the applicable criteria established in this Statement. The requirements of this Statement No. 79 are effective for reporting periods beginning after June 15, 2015, except for the provisions on portfolio quality, custodial credit risk, and shadow pricing. Those provisions are effective for reporting periods beginning after December 15, 2015. Earlier application is encouraged. In the period this Statement is first applied, changes made to comply with this Statement should be applied on a prospective basis. The implementation of Statement No. 79 will have no impact on the City as the City already records its participating investment pool, TexPool, at amortized cost and does not have any restrictions or limitations that require notation in the financial statements. Future GASB Statement Implementations GASB Statement No. 74, Financial Reporting for Postemployment Benefit Plans Other than Pension Plans, addresses the need to improve the usefulness of information about postemployment benefits other than pensions (other postemployment benefits or OPEB) included in the general purpose external financial reports of state and local governmental OPEB plans for making decisions and assessing accountability. This Statement results from a comprehensive review of the effectiveness of existing standards of accounting and financial reporting for all postemployment benefits (pensions and OPEB) with regard to providing decision-useful information, supporting assessments of accountability and interperiod equity, and creating additional transparency. This Statement replaces Statements No. 43, Financial Reporting for Postemployment Benefit Plans Other Than Pension Plans, as amended and No. 57, OPEB Measurements by Agent Employers and Agent Multiple-Employer Plans. It also includes requirements for defined contribution OPEB plans that replace the requirements for those OPEB plans in Statement No. 25, Financial Reporting for Defined Benefit Pension Plans and Note Disclosures for Defined Contribution Plans, as amended, Statement No. 43, and Statement No. 50, Pension Disclosures. This Statement is effective for financial statements for fiscal years beginning after June 15, 2016. The City will implement this Statement in fiscal year 2017. GASB Statement No. 75, Accounting and Financial Reporting for Postemployment Benefits Other Than Pensions, has as its primary objective to improve accounting and financial reporting by state and local governments for postemployment benefits other than pensions (other postemployment benefits or OPEB). It also improves information provided by state and local governmental employers about financial support for OPEB that is provided by other entities. This Statement results from a comprehensive review of the effectiveness of existing standards of accounting and financial reporting for all postemployment benefits (pensions and OPEB) with regard to providing decision-useful information, supporting assessments of accountability and interperiod equity, and creating additional transparency. This Statement replaces the requirements of Statement No. 45, Accounting and Financial Reporting by Employers for Postemployment Benefits Other Than Pensions, as amended, Statement No. 57, OPEB Measurements by Agent Employers and Agent Multiple-Employer Plans, for OPEB, and Statement No. 74, Financial Reporting for Postemployment Benefit Plans Other Than Pension Plans and establishes new accounting and financial reporting requirements for OPEB plans. This Statement is effective for fiscal years beginning after June 15, 2017. The City will implement this Statement in fiscal year 2018.
Notes to Financial Statements
Year-Ended September 30, 2016 - 45 - Amounts are expressed in thousands
Note 1 Summary of Significant Accounting Policies (Continued)
Future GASB Statement Implementations (Continued) GASB Statement No. 77, Tax Abatement Disclosures, requires disclosure of tax abatement information about a reporting government’s own tax abatement agreements and those that are entered into by other governments and that reduce the reporting government’s tax revenues. Various disclosures are required, and they should be organized by major tax abatement program and may disclose information for individual tax abatement agreements within those programs. Requirements of this Statement are effective for financial statements for periods beginning after December 15, 2015. The City will implement this Statement in fiscal year 2017. GASB Statement No. 78, Pensions Provided through Certain Multiple-Employer Defined Benefit Pension Plans,amends the scope and applicability of Statement No. 68 to exclude pensions provided to employees of state or local governmental employers through a cost-sharing multiple-employer defined benefit pension plan that (1) is not a state or local governmental pension plan, (2) is used to provide defined benefit pensions both to employees of state or local governmental employers and to employees of employers that are not state or local governmental employers, and (3) has no predominant state or local governmental employer. Requirements of this Statement are effective for reporting periods beginning after December 15, 2015. The implementation of Statement No. 78 will have no impact on the City. GASB Statement No. 80, Blending Requirements for Certain Component Units, an amendment of GASB Statement No. 14, will improve financial reporting by clarifying the financial statement presentation requirements for certain component units. This Statement amends the blending requirements for the financial statement presentation of component units of all state and local governments. The additional criterion requires blending of a component unit incorporated as a not-for-profit corporation in which the primary government is the sole corporate member, as identified in the component unit’s articles of incorporation or bylaws. The additional criterion does not apply to component units included in the financial reporting entity pursuant to the provisions of Statement No. 39, Determining Whether Certain Organizations Are Component Units. The requirements of this Statement are effective for reporting periods beginning after June 15, 2016. The City will implement this Statement in fiscal year 2017. GASB Statement No. 81, Irrevocable Split-Interest Agreements, will improve accounting and financial reporting for irrevocable split-interest agreements by providing recognition and measurement guidance for situations in which a government is a beneficiary of the agreement. It can be created through trusts—or other legally enforceable agreements with characteristics that are equivalent to split-interest agreements—in which a donor transfers resources to an intermediary to hold and administer for the benefit of a government and at least one other beneficiary. This Statement requires that a government that receives resources pursuant to an irrevocable split-interest agreement recognize assets, liabilities, and deferred inflows of resources at the inception of the agreement. The government must also recognize assets representing its beneficial interests in irrevocable split-interest agreements that are administered by a third party, if the government controls the present service capacity of the beneficial interests and recognize revenue when the resources become applicable to the reporting period. The requirements of this Statement are effective for financial statements for periods beginning after December 15, 2016 and should be applied retroactively. The City will implement this Statement in fiscal year 2018.
Notes to Financial Statements
Year-Ended September 30, 2016 - 46 - Amounts are expressed in thousands
Note 1 Summary of Significant Accounting Policies (Continued) Future GASB Statement Implementations (Continued) GASB Statement No. 82, Pension Issues—an amendment of GASB Statements No. 67, No. 68, and No. 73, will address certain issues that have been raised with respect to Statements No. 67, Financial Reporting for Pension Plans, No. 68, Accounting and Financial Reporting for Pensions, and No. 73, Accounting and Financial Reporting for Pensions and Related Assets That Are Not within the Scope of GASB Statement 68, and Amendments to Certain Provisions of GASB Statements 67 and 68. Specifically, this Statement addresses issues regarding (1) the presentation of payroll-related measures in required supplementary information, (2) the selection of assumptions and the treatment of deviations from the guidance in an Actuarial Standard of Practice for financial reporting purposes, and (3) the classification of payments made by employers to satisfy employee (plan member) contribution requirements. This Statement is effective for reporting periods beginning after June 15, 2016, except for the requirements of this Statement for the selection of assumptions in a circumstance in which an employer’s pension liability is measured as of a date other than the employer’s most recent fiscal year-end. In that circumstance, the requirements for the selection of assumptions are effective for that employer in the first reporting period in which the measurement date of the pension liability is on or after June 15, 2017. The City will implement the required components in this Statement in fiscal year 2017 and 2018. GASB Statement No. 83, Certain Asset Retirement Obligations, addresses accounting and financial reporting for certain asset retirement obligations (AROs). An ARO is a legally enforceable liability associated with the retirement of a tangible capital asset. A government that has legal obligations to perform future asset retirement activities related to its tangible capital assets should recognize a liability based on the guidance in this Statement. This Statement establishes criteria for determining the timing and pattern of recognition of a liability and a corresponding deferred outflow of resources for AROs. This Statement requires that recognition occur when the liability is both incurred and reasonably estimable. The determination of when the liability is incurred should be based on the occurrence of external laws, regulations, contracts, or court judgments, together with the occurrence of an internal event that obligates a government to perform asset retirement activities. This Statement requires the measurement of an ARO to be based on the best estimate of the current value of outlays expected to be incurred. This Statement requires the current value of a government’s AROs to be adjusted for the effects of general inflation or deflation at least annually. The requirements of this Statement are effective for reporting periods beginning after June 15, 2018. The City will implement this Statement in fiscal year 2019. GASB Statement No. 84, Fiduciary Activities establishes criteria for identifying fiduciary activities of all state and local governments. The focus of the criteria generally is on (1) whether a government is controlling the assets of the fiduciary activity and (2) the beneficiaries with whom a fiduciary relationship exists. Separate criteria are included to identify fiduciary component units and postemployment benefit arrangements that are fiduciary activities. Governments with activities meeting the criteria should present a statement of fiduciary net position and a statement of changes in fiduciary net position. An exception to that requirement is provided for a business-type activity that normally expects to hold custodial assets for three months or less. This Statement describes four fiduciary funds that should be reported, if applicable: (1) pension (and other employee benefit) trust funds, (2) investment trust funds, (3) private-purpose trust funds, and (4) custodial funds. Custodial funds generally should report fiduciary activities that are not held in a trust or equivalent arrangement that meets specific criteria. This Statement also provides for recognition of a liability to the beneficiaries in a fiduciary fund when an event has occurred that compels the government to disburse fiduciary resources. The requirements of this Statement are effective for reporting periods beginning after December 15, 2018. Earlier application is encouraged. The City will implement this Statement in fiscal year 2020. The City has not fully determined the effects that implementation of these statements will have on the City’s financial statements.
Notes to Financial Statements
Year-Ended September 30, 2016 - 47 - Amounts are expressed in thousands
Note 1 Summary of Significant Accounting Policies (Continued) Cash and Cash Equivalents and Investments The City's investment practices are governed by state statutes and by the City’s own Investment Policy. City cash is required to be deposited in Federal Deposit Insurance Corporation (FDIC) insured banks located within the State of Texas. A pooled cash and investment strategy is utilized, which enables the City to have one central depository. Investments are pooled into two primary categories: operating funds and debt service funds. The balances in these funds are invested in an aggregate or pooled amount, with principal and interest income distributed to each respective fund on a pro rata basis. In addition, the City may purchase certain investments with the available balance of a specific fund for the sole benefit of such fund. Fair market value of the City’s investments is determined by quoted market prices and valuations using interest rate curves and credit spreads applied to the terms of the debt instrument, while also considering the counterparty rating. The City’s policy with respect to money market investments, which have a remaining maturity of one year or less at the time of purchase, is to report those investments at amortized cost, which approximates fair value. Amortization of premium or accretion of discount is recorded over the term of the investments. As of September 30, 2016, the City’s investment portfolio did not contain any derivative or alternative investment products, nor was it leveraged in any way, except as noted in the Pension Fund and Health Fund. For a listing of authorized investments, see Note 3 Cash and Cash Equivalents and Investments. For purposes of the Statement of Cash Flows, the City considers all highly liquid investments with an original maturity of approximately 90 days or less to be cash equivalents. Materials and Supplies and Prepaid Items Materials and supplies consist principally of expendable items held for consumption and are stated at cost, based on first-in first-out and lower of average cost or market methods. For governmental and proprietary fund types, the "consumption" method is used to account for certain materials and supplies. Under the consumption method, these acquisitions are recorded in materials and supplies accounts and charged as expenditures for governmental funds and as expenses for proprietary funds when used. Prepaid items are goods and services that are paid in advance. These payments reflect costs applicable to future accounting periods and are recorded in both government-wide and fund financial statements. Using the consumption method, prepaid items are charged as expenditures for governmental funds and as expenses for proprietary funds as the goods or services are used.
Capital Assets and Depreciation
Primary Government (City) All capital assets are valued at historical cost or estimated historical cost if actual historical cost is not available. Donated capital assets are valued at their estimated fair value on the date donated. With implementation of GASB Statement No. 72 Fair Value Measurement and Application in fiscal year 2016, donated capital assets, works of art, historical treasures, or capital assets received in a service concession agreement will need to be valued at acquisition value. Capital assets recorded under capital leases are recorded at the present value of future minimum lease payments. Depreciation on all exhaustible capital assets of the City is charged as an expense with accumulated depreciation being reported in the Statement of Net Position. Depreciation is provided over the estimated useful lives of the assets using the straight-line method.
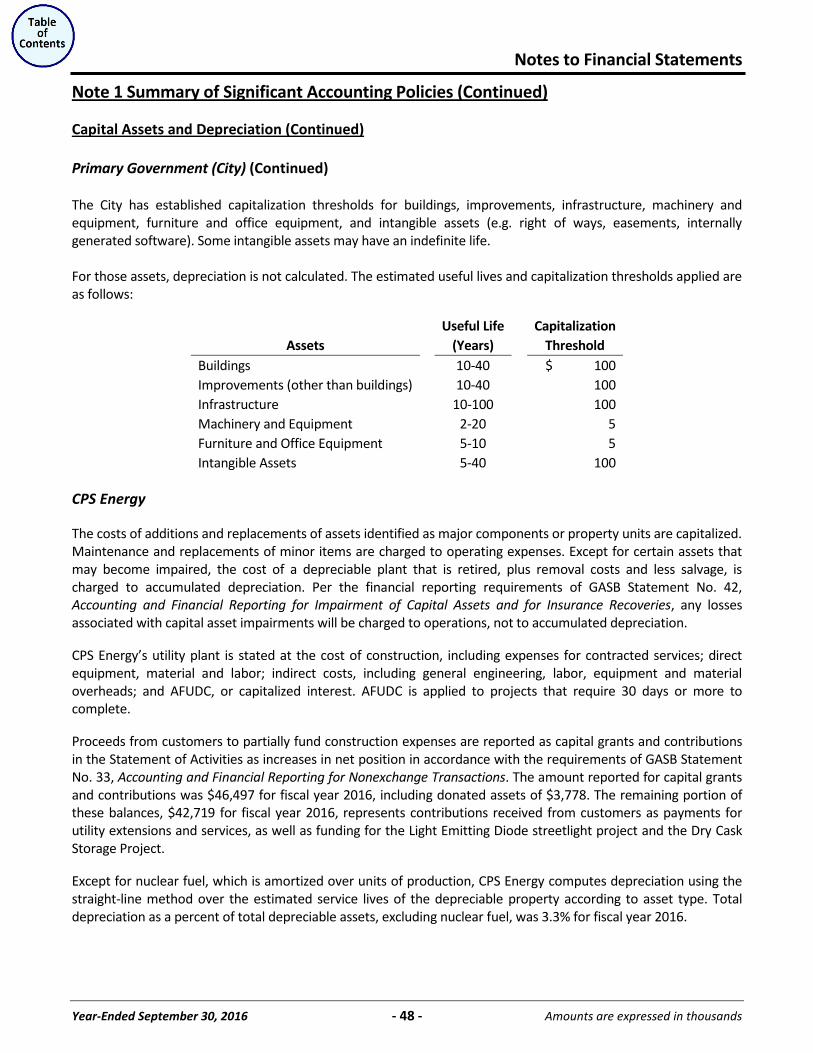
Notes to Financial Statements
Year-Ended September 30, 2016 - 48 - Amounts are expressed in thousands
Note 1 Summary of Significant Accounting Policies (Continued) Capital Assets and Depreciation (Continued) Primary Government (City) (Continued) The City has established capitalization thresholds for buildings, improvements, infrastructure, machinery and equipment, furniture and office equipment, and intangible assets (e.g. right of ways, easements, internally generated software). Some intangible assets may have an indefinite life. For those assets, depreciation is not calculated. The estimated useful lives and capitalization thresholds applied are as follows:
Useful Life Capitalization Assets (Years) Threshold
Buildings 10-40 $ 100 Improvements (other than buildings) 10-40 100 Infrastructure 10-100 100 Machinery and Equipment 2-20 5 Furniture and Office Equipment 5-10 5 Intangible Assets 5-40 100
CPS Energy The costs of additions and replacements of assets identified as major components or property units are capitalized. Maintenance and replacements of minor items are charged to operating expenses. Except for certain assets that may become impaired, the cost of a depreciable plant that is retired, plus removal costs and less salvage, is charged to accumulated depreciation. Per the financial reporting requirements of GASB Statement No. 42, Accounting and Financial Reporting for Impairment of Capital Assets and for Insurance Recoveries, any losses associated with capital asset impairments will be charged to operations, not to accumulated depreciation. CPS Energy’s utility plant is stated at the cost of construction, including expenses for contracted services; direct equipment, material and labor; indirect costs, including general engineering, labor, equipment and material overheads; and AFUDC, or capitalized interest. AFUDC is applied to projects that require 30 days or more to complete. Proceeds from customers to partially fund construction expenses are reported as capital grants and contributions in the Statement of Activities as increases in net position in accordance with the requirements of GASB Statement No. 33, Accounting and Financial Reporting for Nonexchange Transactions. The amount reported for capital grants and contributions was $46,497 for fiscal year 2016, including donated assets of $3,778. The remaining portion of these balances, $42,719 for fiscal year 2016, represents contributions received from customers as payments for utility extensions and services, as well as funding for the Light Emitting Diode streetlight project and the Dry Cask Storage Project. Except for nuclear fuel, which is amortized over units of production, CPS Energy computes depreciation using the straight-line method over the estimated service lives of the depreciable property according to asset type. Total depreciation as a percent of total depreciable assets, excluding nuclear fuel, was 3.3% for fiscal year 2016.
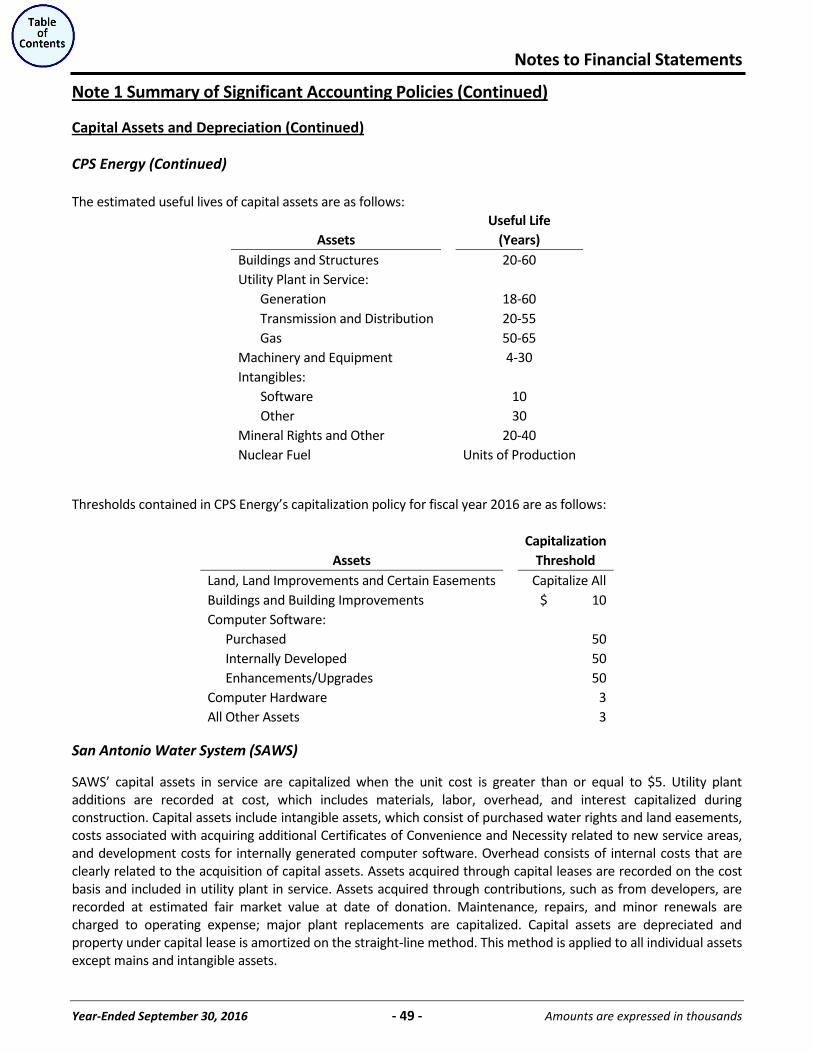
Notes to Financial Statements
Year-Ended September 30, 2016 - 49 - Amounts are expressed in thousands
Note 1 Summary of Significant Accounting Policies (Continued)
Capital Assets and Depreciation (Continued) CPS Energy (Continued) The estimated useful lives of capital assets are as follows:
Useful Life Assets (Years)
Buildings and Structures 20-60 Utility Plant in Service:
Generation 18-60 Transmission and Distribution 20-55 Gas 50-65
Machinery and Equipment 4-30 Intangibles: Software 10 Other 30 Mineral Rights and Other 20-40 Nuclear Fuel Units of Production
Thresholds contained in CPS Energy’s capitalization policy for fiscal year 2016 are as follows:
Capitalization Assets Threshold
Land, Land Improvements and Certain Easements Capitalize All Buildings and Building Improvements $ 10 Computer Software:
Purchased 50 Internally Developed 50 Enhancements/Upgrades 50
Computer Hardware 3 All Other Assets 3
San Antonio Water System (SAWS)
SAWS’ capital assets in service are capitalized when the unit cost is greater than or equal to $5. Utility plant additions are recorded at cost, which includes materials, labor, overhead, and interest capitalized during construction. Capital assets include intangible assets, which consist of purchased water rights and land easements, costs associated with acquiring additional Certificates of Convenience and Necessity related to new service areas, and development costs for internally generated computer software. Overhead consists of internal costs that are clearly related to the acquisition of capital assets. Assets acquired through capital leases are recorded on the cost basis and included in utility plant in service. Assets acquired through contributions, such as from developers, are recorded at estimated fair market value at date of donation. Maintenance, repairs, and minor renewals are charged to operating expense; major plant replacements are capitalized. Capital assets are depreciated and property under capital lease is amortized on the straight-line method. This method is applied to all individual assets except mains and intangible assets.
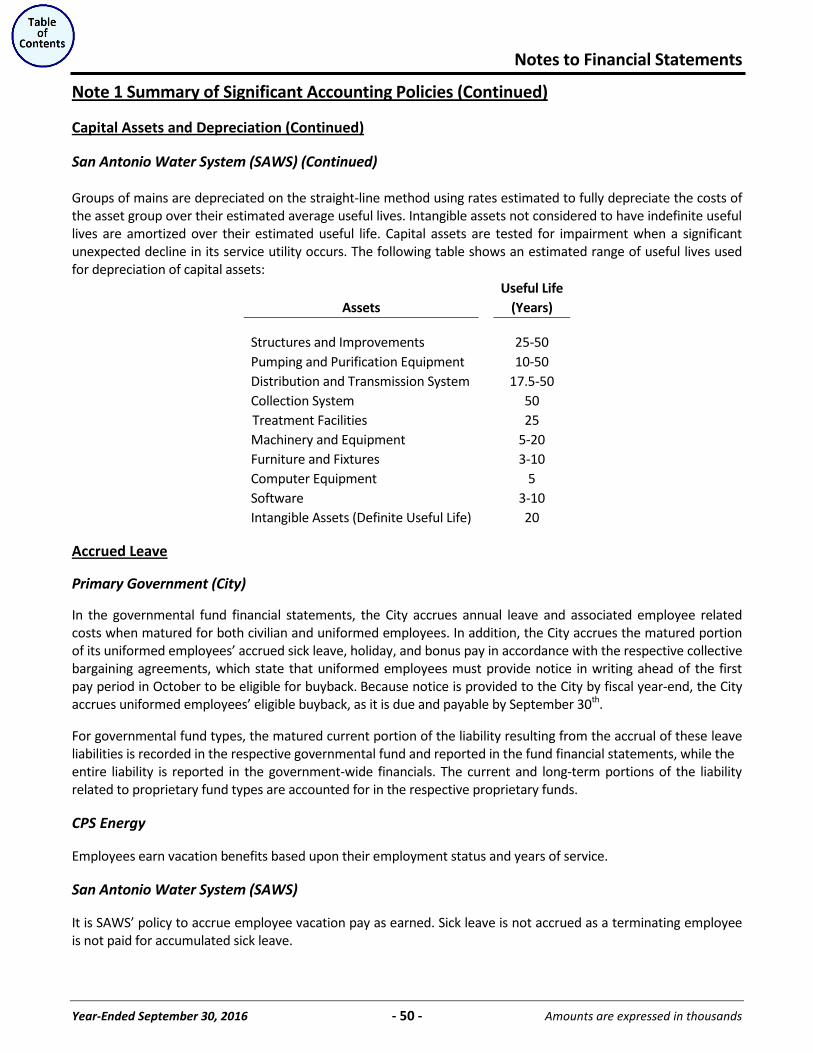
Notes to Financial Statements
Year-Ended September 30, 2016 - 50 - Amounts are expressed in thousands
Note 1 Summary of Significant Accounting Policies (Continued)
Capital Assets and Depreciation (Continued)
San Antonio Water System (SAWS) (Continued) Groups of mains are depreciated on the straight-line method using rates estimated to fully depreciate the costs of the asset group over their estimated average useful lives. Intangible assets not considered to have indefinite useful lives are amortized over their estimated useful life. Capital assets are tested for impairment when a significant unexpected decline in its service utility occurs. The following table shows an estimated range of useful lives used for depreciation of capital assets:
Useful Life Assets (Years)
Structures and Improvements 25-50 Pumping and Purification Equipment 10-50 Distribution and Transmission System 17.5-50 Collection System 50 Treatment Facilities 25 Machinery and Equipment 5-20 Furniture and Fixtures 3-10 Computer Equipment 5 Software 3-10 Intangible Assets (Definite Useful Life) 20
Accrued Leave
Primary Government (City)
In the governmental fund financial statements, the City accrues annual leave and associated employee related costs when matured for both civilian and uniformed employees. In addition, the City accrues the matured portion of its uniformed employees’ accrued sick leave, holiday, and bonus pay in accordance with the respective collective bargaining agreements, which state that uniformed employees must provide notice in writing ahead of the first pay period in October to be eligible for buyback. Because notice is provided to the City by fiscal year-end, the City accrues uniformed employees’ eligible buyback, as it is due and payable by September 30th. For governmental fund types, the matured current portion of the liability resulting from the accrual of these leave liabilities is recorded in the respective governmental fund and reported in the fund financial statements, while the entire liability is reported in the government-wide financials. The current and long-term portions of the liability related to proprietary fund types are accounted for in the respective proprietary funds.
CPS Energy Employees earn vacation benefits based upon their employment status and years of service.
San Antonio Water System (SAWS) It is SAWS’ policy to accrue employee vacation pay as earned. Sick leave is not accrued as a terminating employee is not paid for accumulated sick leave.
Notes to Financial Statements
Year-Ended September 30, 2016 - 51 - Amounts are expressed in thousands
Note 1 Summary of Significant Accounting Policies (Continued) Insurance Activity for the City’s self-insurance programs is recorded in the Internal Service Funds. Assets and obligations related to property and casualty liability, employee health benefits, workers’ compensation, unemployment compensation, and employee wellness are included. The City is insured for property loss on a primary basis through Factory Mutual Insurance Company. The City is completely self-insured for liability claims. Related liabilities are accrued based on the City’s estimates of the aggregate liability for claims made and claims incurred but not reported prior to the end of the fiscal year. The City determines and accrues loss liabilities based on an actuarial assessment of historical claim data and industry trends performed annually. The City also provides employee health insurance, which includes a pro rata share of retiree health benefits, workers’ compensation, and unemployment benefits under its self-insurance programs. The City is a member of the Texas Municipal League Workers’ Compensation Joint Insurance Fund and uses this fund as a mechanism for administering workers’ compensation claims that occurred prior to September 30, 1986. Workers’ compensation claims that occurred after October 1, 1986 are administered by third-party administrators. The City records all workers’ compensation loss contingencies, including claims incurred but not reported. The City determines and accrues workers’ compensation liabilities based on an actuarial assessment of historical claim data and industry trends performed annually. The City has been completely self insured for workers’ compensation claims since May 1, 2013. Employee and retiree health benefit liabilities are determined and accrued based upon the City’s estimates of aggregate liabilities for unpaid benefits utilizing claim lag data from the City’s third-party administrator. The City additionally determines and accrues post-employment liabilities based on an actuarial assessment of historical claim data performed bi-annually and reviewed annually. Current year unpaid benefit liabilities for retirees are netted against the post-employment liability as additional contributions. Regarding unemployment compensation, the City is subject to the State of Texas Employment Commission Act. Under this Act, the City’s method for providing unemployment compensation is to reimburse the State for claims paid by the State. All insurance carriers providing coverage for the City are required to possess an A.M. Best Company rating of A- or better, where A- denotes Excellent. A.M. Best is an industry recognized rating service for insurance companies. For a more detailed explanation of the City’s self-insurance programs, see Note 13 Risk Financing. Pensions For purposes of measuring the net pension liability, deferred outflows of resources and deferred inflows of resources related to pensions, and pension expense, information about the fiduciary net position of the City and additions to/deductions from the City’s fiduciary net position have been determined on the same basis as they are reported by the City. For this purpose, benefit payments (including refunds of employee contributions) are recognized when due and payable in accordance with the benefit terms. Investments are reported at fair value.
Notes to Financial Statements
Year-Ended September 30, 2016 - 52 - Amounts are expressed in thousands
Note 1 Summary of Significant Accounting Policies (Continued) Fund Balance Fund balances are classified as nonspendable, restricted, committed, assigned, and unassigned based on the extent to which the City is bound to observe constraints imposed on the use of the resources in the governmental funds. The classifications are as follows:
Nonspendable – The nonspendable fund balance includes amounts that cannot be spent because they are either not in spendable form or legally or contractually required to be maintained intact. The “not in spendable form” criterion includes items that are not expected to be converted to cash. Restricted – The fund balance is reported as restricted when constraints placed on the use of resources are either externally imposed by creditors (such as through debt covenants), grantors, contributors, or laws or regulation of other governments or imposed by law through enabling legislation. Committed – The committed fund balance includes amounts that can be used only for the specific purposes imposed by formal action (ordinance) of City Council. Those committed amounts cannot be used for other purposes unless City Council removes or changes the specified use by taking the same type of action it employed to previously commit those amounts. Committed fund balance also incorporates contractual obligations to the extent that existing resources in the fund have been specifically committed for use in satisfying those contractual requirements. Assigned – Amounts in the assigned fund balance are intended to be used by the City for specific purposes but do not meet the criteria to be classified as restricted or committed. In the General Fund assigned amounts represent intended uses established by City Council or City Manager, Executive Leadership Team, and Department Directors. Under the City Charter, the City Manager, Executive Leadership Team, and Department Directors are authorized to assign individual amounts up to $50 and City Council is authorized to assign amounts over $50. Unassigned – Unassigned fund balance is the residual classification for the General Fund. This classification represents fund balance that has not been assigned to other funds and does not have a specific purpose. In the governmental funds other than the General Fund, if expenditures incurred exceeded the amounts restricted, committed or assigned, the fund may report a negative unassigned fund balance.
Generally, the City would apply restricted, committed or assigned resources prior to unassigned resources when expenditure is incurred for purposes for which more than one of the classification of fund balance is available. See Note 15 Fund Balance Classifications for more detail. Restricted assets associated with cash and receivables received from restricted sources (grants, bond issuances, legislative items, or other third party restrictions) are categorized as restricted. Allocation of Indirect Expenses The City recovers indirect costs in the General Fund through the application of departmental indirect cost rates. These rates are developed and documented in the City’s departmental indirect cost rate plan. In this plan, each department is classified by function. Indirect costs are budgeted by department and are used as a basis for the City’s actual indirect cost allocation. Base rates are then applied to actual indirect costs recovered, and indirect costs are reclassified to reduce general government expenditures. For fiscal year 2016, general government expenditures were reduced by $16,100, resulting in increased expenditures/expenses in other governmental functions and in business-type activities in the amounts of $4,584 and $11,516, respectively.
Notes to Financial Statements
Year-Ended September 30, 2016 - 53 - Amounts are expressed in thousands
Note 1 Summary of Significant Accounting Policies (Continued) Long-Term Obligations In the government-wide and proprietary fund financial statements, long-term debt and other long-term obligations are reported as liabilities in the Statement of Net Position. Bond premiums and discounts are amortized over the life of the debt. Deferred charges on refunding (the difference between the reacquisition price and the carrying value of the existing debt) are deferred and amortized over the shorter of the life of the original bonds or the life of the refunding bonds. In the fund financial statements, governmental fund types recognize bond premiums and discounts during the period of issuance. The face amount of debt issued is reported as other financing sources. Premiums received on debt issuances are reported as other financing sources while discounts are reported as other financing uses. Elimination of Internal Activity Elimination of internal activity, particularly related to Internal Service Fund and blended component unit transactions, is needed to make the transition from governmental funds to government-wide activities. The overriding objective in eliminating the effects of Internal Service Fund activity is to adjust the internal charges to cause a break-even result. The main objective in eliminating the effect of funding and reimbursement of costs between the primary government and blended component unit is to remove duplication of same activities. Eliminating the effect of Internal Service Fund activity requires the City to look back and adjust the Internal Service Funds’ internal charges. Net income derived from Internal Service Fund activity would cause a pro rata reduction in the charges made to the participating funds/functions. Conversely, an Internal Service Fund net loss would require a pro rata increase in the amounts charged to the participating funds/functions. Therefore, eliminations made to the Statement of Activities remove the doubling up effect of Internal Service Fund activity. The residual internal balances between the governmental and business-type activities are reported in the Statement of Net Position, and the internal balance amounts that exist within the governmental funds or within business-type funds are eliminated. The City reports Internal Service Fund balances in both governmental and business-type activities, based on the pro rata share of the amounts charged to the participating funds/functions. The City has four Internal Service Funds: Other Internal Services, Information Services, Self-Insurance Funds, and CIMS. Other Internal Services and Information Services charge user fees for requested goods or services. Building maintenance charges, a component of the Other Internal Services Fund, are based on the space occupied by departments. Information Services also charges a monthly amount based on the usage by each department. Through the tracking of these charges to the applicable departments, the net income or loss will be allocated back to the user department, based on actual charges incurred. The Self-Insurance Funds and Purchasing, a component of the Other Internal Service Funds, generate their revenues through fixed assessments charged to the various funds each year. The Employee Benefits Fund additionally charges pro rata user fees to employees and retirees. The net income or loss generated by the Self-Insurance Funds and Purchasing are allocated back based on the same allocation by which the revenues are received over time. The CIMS Fund generates revenues by charging a capital administrative fee for projects worked on. The fund additionally generates revenue through reimbursements of costs incurred. The net income or loss generated is allocated back to the user funds based on actual charges incurred.
Notes to Financial Statements
Year-Ended September 30, 2016 - 54 - Amounts are expressed in thousands
Note 1 Summary of Significant Accounting Policies (Continued) Use of Estimates The preparation of financial statements in conformity with generally accepted accounting principles requires management of the City, Pension and Health Fund, CPS Energy, and SAWS to make estimates and assumptions that affect certain reported amounts and disclosures. Accordingly, actual results could differ from those estimates. Application of Restricted and Unrestricted Net Position The City may receive funding from an organization whose expenditures are restricted to certain allowable costs. In situations where both restricted and unrestricted net position are expended to cover allowable expenses, the City will first expend the restricted net position and cover additional costs with unrestricted net position. The City reserves the right to selectively defer the use of restricted assets or reimburse unrestricted net position with allowable restricted assets.
(The remainder of this page left blank intentionally)
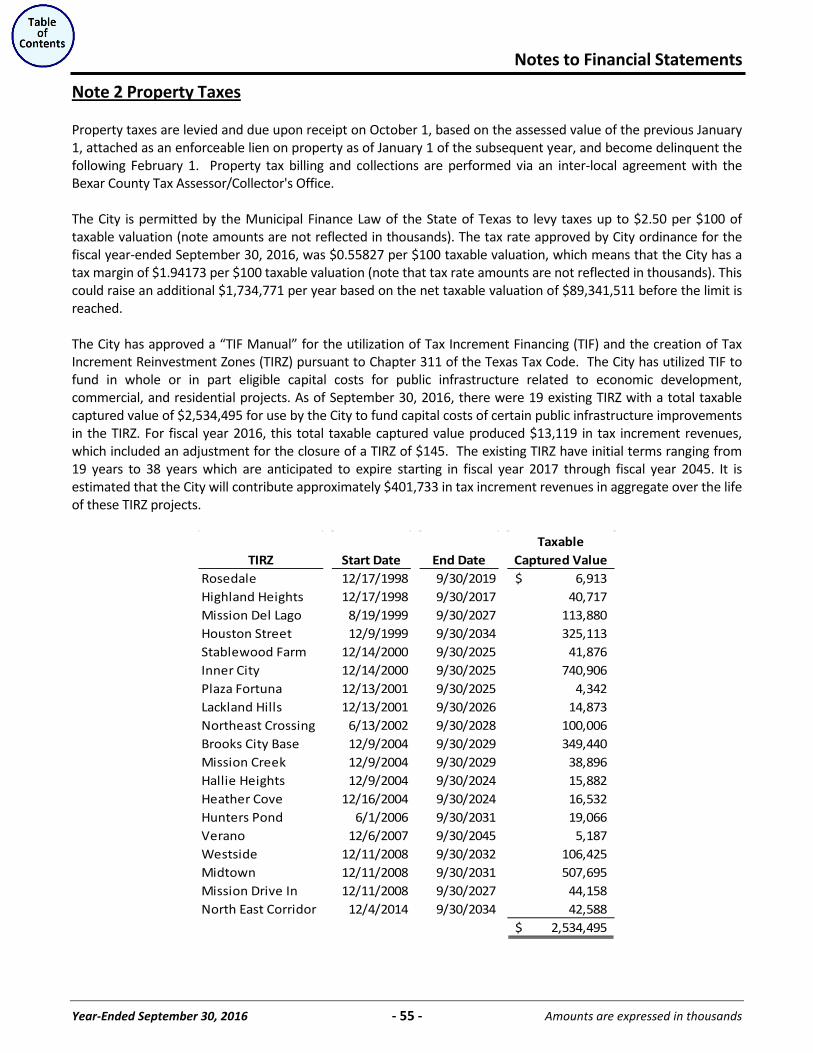
Notes to Financial Statements
Year-Ended September 30, 2016 - 55 - Amounts are expressed in thousands
Note 2 Property Taxes
Property taxes are levied and due upon receipt on October 1, based on the assessed value of the previous January 1, attached as an enforceable lien on property as of January 1 of the subsequent year, and become delinquent the following February 1. Property tax billing and collections are performed via an inter-local agreement with the Bexar County Tax Assessor/Collector's Office. The City is permitted by the Municipal Finance Law of the State of Texas to levy taxes up to $2.50 per $100 of taxable valuation (note amounts are not reflected in thousands). The tax rate approved by City ordinance for the fiscal year-ended September 30, 2016, was $0.55827 per $100 taxable valuation, which means that the City has a tax margin of $1.94173 per $100 taxable valuation (note that tax rate amounts are not reflected in thousands). This could raise an additional $1,734,771 per year based on the net taxable valuation of $89,341,511 before the limit is reached. The City has approved a “TIF Manual” for the utilization of Tax Increment Financing (TIF) and the creation of Tax Increment Reinvestment Zones (TIRZ) pursuant to Chapter 311 of the Texas Tax Code. The City has utilized TIF to fund in whole or in part eligible capital costs for public infrastructure related to economic development, commercial, and residential projects. As of September 30, 2016, there were 19 existing TIRZ with a total taxable captured value of $2,534,495 for use by the City to fund capital costs of certain public infrastructure improvements in the TIRZ. For fiscal year 2016, this total taxable captured value produced $13,119 in tax increment revenues, which included an adjustment for the closure of a TIRZ of $145. The existing TIRZ have initial terms ranging from 19 years to 38 years which are anticipated to expire starting in fiscal year 2017 through fiscal year 2045. It is estimated that the City will contribute approximately $401,733 in tax increment revenues in aggregate over the life of these TIRZ projects.
TIRZ Start Date End DateTaxable
Captured ValueRosedale 12/17/1998 9/30/2019 6,913$ Highland Heights 12/17/1998 9/30/2017 40,717 Mission Del Lago 8/19/1999 9/30/2027 113,880 Houston Street 12/9/1999 9/30/2034 325,113 Stablewood Farm 12/14/2000 9/30/2025 41,876 Inner City 12/14/2000 9/30/2025 740,906 Plaza Fortuna 12/13/2001 9/30/2025 4,342 Lackland Hills 12/13/2001 9/30/2026 14,873 Northeast Crossing 6/13/2002 9/30/2028 100,006 Brooks City Base 12/9/2004 9/30/2029 349,440 Mission Creek 12/9/2004 9/30/2029 38,896 Hallie Heights 12/9/2004 9/30/2024 15,882 Heather Cove 12/16/2004 9/30/2024 16,532 Hunters Pond 6/1/2006 9/30/2031 19,066 Verano 12/6/2007 9/30/2045 5,187 Westside 12/11/2008 9/30/2032 106,425 Midtown 12/11/2008 9/30/2031 507,695 Mission Drive In 12/11/2008 9/30/2027 44,158 North East Corridor 12/4/2014 9/30/2034 42,588
2,534,495$
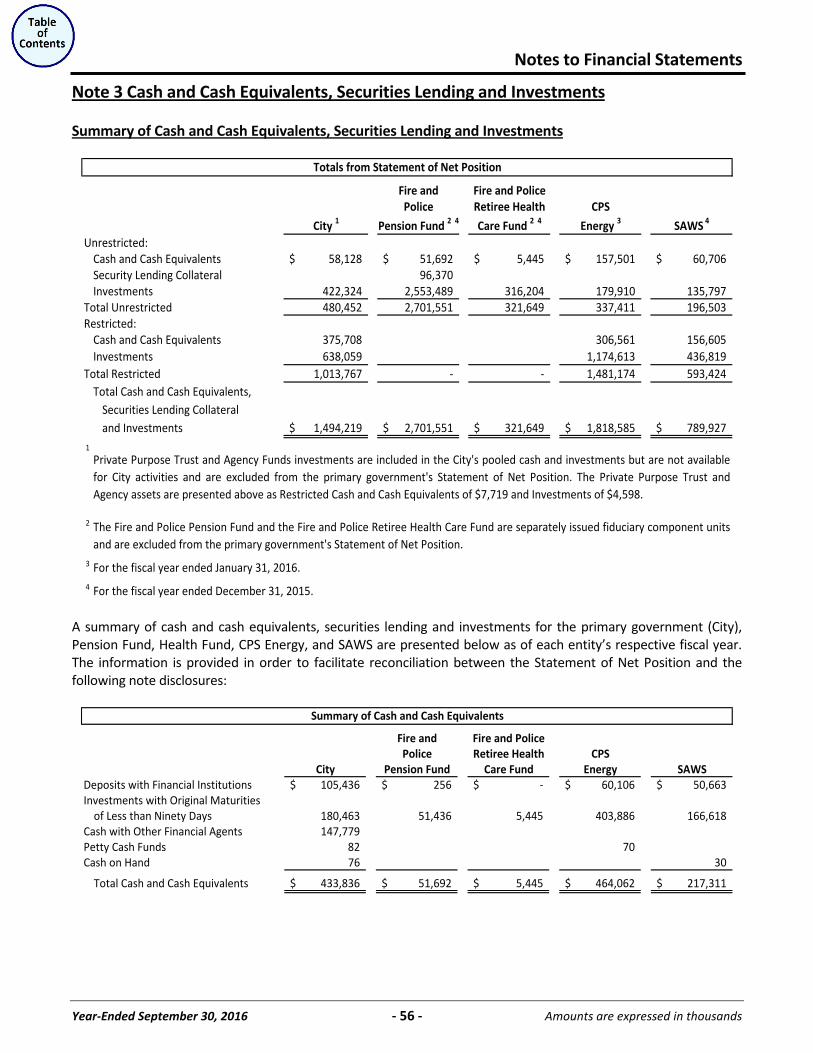
Notes to Financial Statements
Year-Ended September 30, 2016 - 56 - Amounts are expressed in thousands
Note 3 Cash and Cash Equivalents, Securities Lending and Investments
Summary of Cash and Cash Equivalents, Securities Lending and Investments
Fire and Fire and PolicePolice Retiree Health CPS
City 1 Pension Fund 2 4 Care Fund 2 4 Energy 3 SAWS 4
Unrestricted:Cash and Cash Equivalents 58,128$ 51,692$ 5,445$ 157,501$ 60,706$ Security Lending Collateral 96,370 Investments 422,324 2,553,489 316,204 179,910 135,797
Total Unrestricted 480,452 2,701,551 321,649 337,411 196,503 Restricted:
Cash and Cash Equivalents 375,708 306,561 156,605 Investments 638,059 1,174,613 436,819
Total Restricted 1,013,767 - - 1,481,174 593,424 Total Cash and Cash Equivalents,
Securities Lending Collateraland Investments 1,494,219$ 2,701,551$ 321,649$ 1,818,585$ 789,927$
1
2
3 For the fiscal year ended January 31, 2016.4 For the fiscal year ended December 31, 2015.
Private Purpose Trust and Agency Funds investments are included in the City's pooled cash and investments but are not availablefor City activities and are excluded from the primary government's Statement of Net Position. The Private Purpose Trust andAgency assets are presented above as Restricted Cash and Cash Equivalents of $7,719 and Investments of $4,598.
The Fire and Police Pension Fund and the Fire and Police Retiree Health Care Fund are separately issued fiduciary component unitsand are excluded from the primary government's Statement of Net Position.
Totals from Statement of Net Position
A summary of cash and cash equivalents, securities lending and investments for the primary government (City), Pension Fund, Health Fund, CPS Energy, and SAWS are presented below as of each entity’s respective fiscal year. The information is provided in order to facilitate reconciliation between the Statement of Net Position and the following note disclosures:
Fire and Fire and PolicePolice Retiree Health CPS
City Pension Fund Care Fund Energy SAWSDeposits with Financial Institutions 105,436$ 256$ -$ 60,106$ 50,663$ Investments with Original Maturities
of Less than Ninety Days 180,463 51,436 5,445 403,886 166,618 Cash with Other Financial Agents 147,779 Petty Cash Funds 82 70 Cash on Hand 76 30
Total Cash and Cash Equivalents 433,836$ 51,692$ 5,445$ 464,062$ 217,311$
Summary of Cash and Cash Equivalents
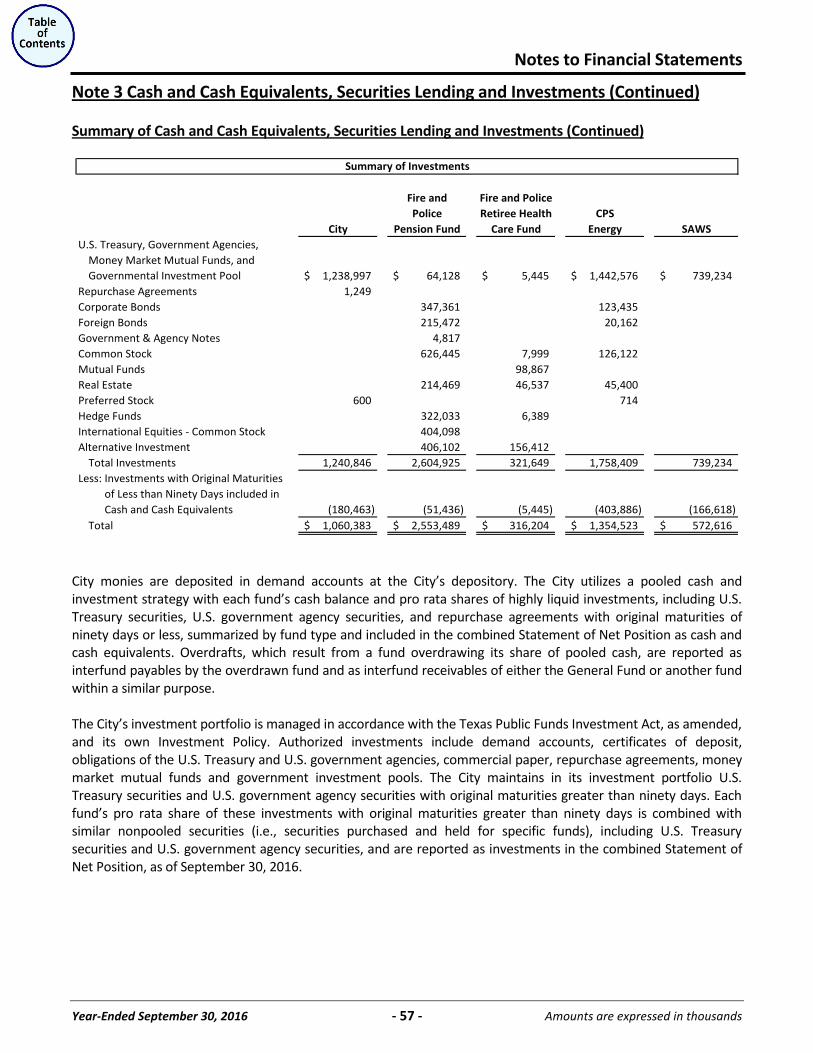
Notes to Financial Statements
Year-Ended September 30, 2016 - 57 - Amounts are expressed in thousands
Note 3 Cash and Cash Equivalents, Securities Lending and Investments (Continued)
Summary of Cash and Cash Equivalents, Securities Lending and Investments (Continued)
Fire and Fire and PolicePolice Retiree Health CPS
City Pension Fund Care Fund Energy SAWSU.S. Treasury, Government Agencies,
Money Market Mutual Funds, andGovernmental Investment Pool 1,238,997$ 64,128$ 5,445$ 1,442,576$ 739,234$
Repurchase Agreements 1,249 Corporate Bonds 347,361 123,435 Foreign Bonds 215,472 20,162 Government & Agency Notes 4,817 Common Stock 626,445 7,999 126,122 Mutual Funds 98,867 Real Estate 214,469 46,537 45,400 Preferred Stock 600 714 Hedge Funds 322,033 6,389 International Equities - Common Stock 404,098 Alternative Investment 406,102 156,412
Total Investments 1,240,846 2,604,925 321,649 1,758,409 739,234 Less: Investments with Original Maturities Less: of Less than Ninety Days included in Less: Cash and Cash Equivalents (180,463) (51,436) (5,445) (403,886) (166,618)
Total 1,060,383$ 2,553,489$ 316,204$ 1,354,523$ 572,616$
Summary of Investments
City monies are deposited in demand accounts at the City’s depository. The City utilizes a pooled cash and investment strategy with each fund’s cash balance and pro rata shares of highly liquid investments, including U.S. Treasury securities, U.S. government agency securities, and repurchase agreements with original maturities of ninety days or less, summarized by fund type and included in the combined Statement of Net Position as cash and cash equivalents. Overdrafts, which result from a fund overdrawing its share of pooled cash, are reported as interfund payables by the overdrawn fund and as interfund receivables of either the General Fund or another fund within a similar purpose. The City’s investment portfolio is managed in accordance with the Texas Public Funds Investment Act, as amended, and its own Investment Policy. Authorized investments include demand accounts, certificates of deposit, obligations of the U.S. Treasury and U.S. government agencies, commercial paper, repurchase agreements, money market mutual funds and government investment pools. The City maintains in its investment portfolio U.S. Treasury securities and U.S. government agency securities with original maturities greater than ninety days. Each fund’s pro rata share of these investments with original maturities greater than ninety days is combined with similar nonpooled securities (i.e., securities purchased and held for specific funds), including U.S. Treasury securities and U.S. government agency securities, and are reported as investments in the combined Statement of Net Position, as of September 30, 2016.
Notes to Financial Statements
Year-Ended September 30, 2016 - 58 - Amounts are expressed in thousands
Note 3 Cash and Cash Equivalents, Securities Lending and Investments (Continued)
Primary Government (City)
The City’s policy with respect to money market investments that have a remaining maturity of one year or less at the time of purchase is to report these investments at amortized cost. Amortized cost approximates fair value for these investments. The increase in fair value for investments of the City with a remaining maturity of greater than one year at the time of purchase was $333 for the year-ended September 30, 2016. The City participates in TexPool, a government investment pool. The TexPool investments consist exclusively of United States government securities, its agencies or instrumentalities, repurchase agreements collateralized by United States government securities, its agencies or instrumentalities, and AAA-rated no-load money market mutual funds. In 2016, the City began participating in TexPool Prime, a government investment pool. The TexPool Prime investments consist exclusively of United States government securities, its agencies or instrumentalities; repurchase agreements collateralized by United States government securities, its agencies or instrumentalities; AAA-rated no-load money market mutual funds; certificates of deposit guaranteed or insured by the Federal Deposit Insurance Company or the National Credit Union Share Insurance Fund; commercial paper rated at least A-1 or P-1 by (i) two Nationally Recognized Statistical Rating Organizations (NRSROs) or (ii) one NRSRO and fully secured by an irrevocable letter of credit by a national or state bank, and securities lending programs that comply with various limitations. The Comptroller of Public Accounts is the sole officer, director, and shareholder of the Texas Treasury Safekeeping Trust Company (the Trust Company), which is authorized to operate TexPool. Federated Investors, Inc. manages the assets under an agreement with the Comptroller, acting on behalf of the Trust Company. The City’s investments managed through TexPool is recorded at amortized cost in accordance with GASB Statement No. 79, Certain External Investment Pools and Pool Participants. GASB Statement No. 79 applies to all state and local governments, including the City, who participates in two external investment pools: TexPool and TexPool Prime government investment pools. The pools do not have any limitations or restrictions on participants’ withdrawals that would have to be noted in the notes to the financial statements. In accordance with GASB Statement No. 40, Deposit and Investment Risk Exposure, the following table and narrative addresses the interest rate risk exposure by investment type, using the weighted average maturity (WAM) method, custodial credit risk, interest rate risk, credit risk, and concentration of credit risk. The City does not hold any foreign securities; therefore, foreign currency risk is not applicable.
(The remainder of this page left blank intentionally)
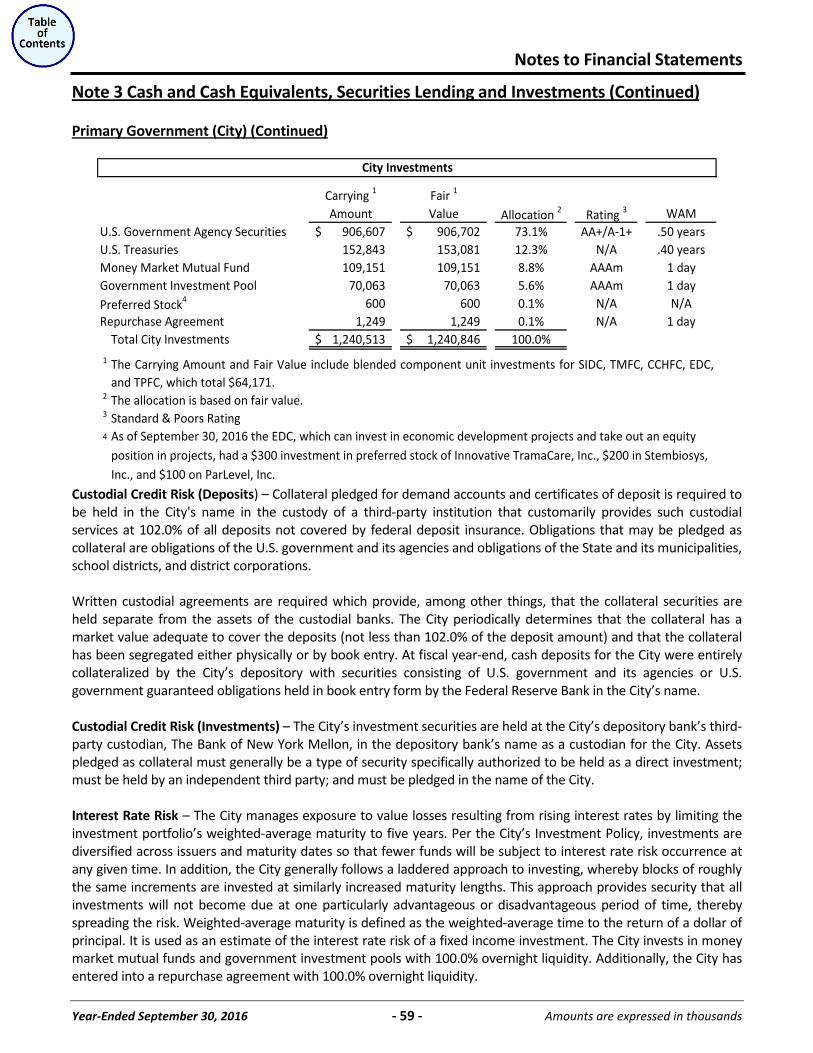
Notes to Financial Statements
Year-Ended September 30, 2016 - 59 - Amounts are expressed in thousands
Note 3 Cash and Cash Equivalents, Securities Lending and Investments (Continued)
Primary Government (City) (Continued)
Carrying 1 Fair 1
Amount Value Allocation 2 Rating 3 WAMU.S. Government Agency Securities 906,607$ 906,702$ 73.1% AA+/A-1+ .50 yearsU.S. Treasuries 152,843 153,081 12.3% N/A .40 yearsMoney Market Mutual Fund 109,151 109,151 8.8% AAAm 1 dayGovernment Investment Pool 70,063 70,063 5.6% AAAm 1 dayPreferred Stock4 600 600 0.1% N/A N/ARepurchase Agreement 1,249 1,249 0.1% N/A 1 day
Total City Investments 1,240,513$ 1,240,846$ 100.0%1
2
3 Standard & Poors Rating4
City Investments
The Carrying Amount and Fair Value include blended component unit investments for SIDC, TMFC, CCHFC, EDC,and TPFC, which total $64,171.The allocation is based on fair value.
As of September 30, 2016 the EDC, which can invest in economic development projects and take out an equity position in projects, had a $300 investment in preferred stock of Innovative TramaCare, Inc., $200 in Stembiosys, Inc., and $100 on ParLevel, Inc.
Custodial Credit Risk (Deposits) – Collateral pledged for demand accounts and certificates of deposit is required to be held in the City's name in the custody of a third-party institution that customarily provides such custodial services at 102.0% of all deposits not covered by federal deposit insurance. Obligations that may be pledged as collateral are obligations of the U.S. government and its agencies and obligations of the State and its municipalities, school districts, and district corporations. Written custodial agreements are required which provide, among other things, that the collateral securities are held separate from the assets of the custodial banks. The City periodically determines that the collateral has a market value adequate to cover the deposits (not less than 102.0% of the deposit amount) and that the collateral has been segregated either physically or by book entry. At fiscal year-end, cash deposits for the City were entirely collateralized by the City’s depository with securities consisting of U.S. government and its agencies or U.S. government guaranteed obligations held in book entry form by the Federal Reserve Bank in the City’s name. Custodial Credit Risk (Investments) – The City’s investment securities are held at the City’s depository bank’s third-party custodian, The Bank of New York Mellon, in the depository bank’s name as a custodian for the City. Assets pledged as collateral must generally be a type of security specifically authorized to be held as a direct investment; must be held by an independent third party; and must be pledged in the name of the City. Interest Rate Risk – The City manages exposure to value losses resulting from rising interest rates by limiting the investment portfolio’s weighted-average maturity to five years. Per the City’s Investment Policy, investments are diversified across issuers and maturity dates so that fewer funds will be subject to interest rate risk occurrence at any given time. In addition, the City generally follows a laddered approach to investing, whereby blocks of roughly the same increments are invested at similarly increased maturity lengths. This approach provides security that all investments will not become due at one particularly advantageous or disadvantageous period of time, thereby spreading the risk. Weighted-average maturity is defined as the weighted-average time to the return of a dollar of principal. It is used as an estimate of the interest rate risk of a fixed income investment. The City invests in money market mutual funds and government investment pools with 100.0% overnight liquidity. Additionally, the City has entered into a repurchase agreement with 100.0% overnight liquidity.
Notes to Financial Statements
Year-Ended September 30, 2016 - 60 - Amounts are expressed in thousands
Note 3 Cash and Cash Equivalents, Securities Lending and Investments (Continued)
Primary Government (City) (Continued)
Credit Risk – The City’s Investment Policy requires the purchase of securities that are of the highest credit quality, based on current ratings provided by nationally recognized credit rating agencies. The City deems investments in U.S. Treasury securities and U.S. government agency securities that are guaranteed to be without credit risk. To limit the City’s credit risk, investments in other debt securities will consist of securities rated ‘A’ or better by at least two nationally recognized rating agencies. As of September 30, 2016, the City’s investment portfolio, with the exception of the repurchase agreement, the money market mutual fund investments, and the government investment pools, consisted only of U.S. Treasury securities and U.S. government agency securities. Investments in U.S. government agency securities, including Federal Home Loan Mortgage Corporation, Federal National Mortgage Association, Federal Home Loan Bank, Federal Agricultural Mortgage Corporation and Federal Farm Credit Bank were rated ‘AA+’ (Long-term) and ‘A-1+’ (Short-term) by Standard & Poor’s. The investments in the money market mutual fund and governmental investment pools were rated ‘AAAm’ by Standard & Poor’s, and the repurchase agreement were greater than 100.0% collateralized with U.S. government agency securities. Concentration of Credit Risk – Although the City’s Investment Policy does not limit the amount of the portfolio invested in any one U.S. government agency, the City manages exposure to concentration of credit risk through diversification. As of September 30, 2016, the U.S. government agency’s 73.1% securities allocation was as follows: Federal National Mortgage Association 10.0%, Federal Home Loan Mortgage Corporation 20.8%, Federal Home Loan Bank 19.8%, Federal Agricultural Mortgage Corporation 20.9%, and Farm Federal Credit Bank 1.6%. Fair Value Measurement – The City records assets and liabilities in accordance with GASB Statement No. 72, Fair Value Measurement and Application, which determines fair value, and establishes a framework for measuring fair value and expands disclosures about fair value measurement. Fair value is defined by Statement No. 72 as the price that would be received to sell an asset or paid to transfer a liability in an orderly transaction between market participants at the measurement date (an exit price). Fair value is a market-based measurement for a particular asset or liability based on assumptions that market participants would use in pricing the asset or liability. Such assumptions include observable and unobservable inputs of market data, as well as assumptions about risk and the risk inherent in the inputs to the valuation technique. As a basis for considering market participant assumptions in fair value measurements, Statement No. 72 establishes a fair value hierarchy that prioritizes the input to valuation techniques used to measure fair value into three broad levels: Level 1 inputs are quoted prices (unadjusted) for identical assets or liabilities in active markets that a government can access at the measurement date. Equity securities and U.S. Government Treasury securities are examples of Level 1 inputs. Level 2 inputs are inputs other than quoted prices included within Level 1 that are observable for the asset or liability, either directly or indirectly. Government agency and mortgage-backed securities are examples of Level 2 inputs. Level 3 inputs are unobservable inputs that reflect the entity’s own assumptions about factors that market participants would use in pricing the asset or liability (including assumptions about risk).
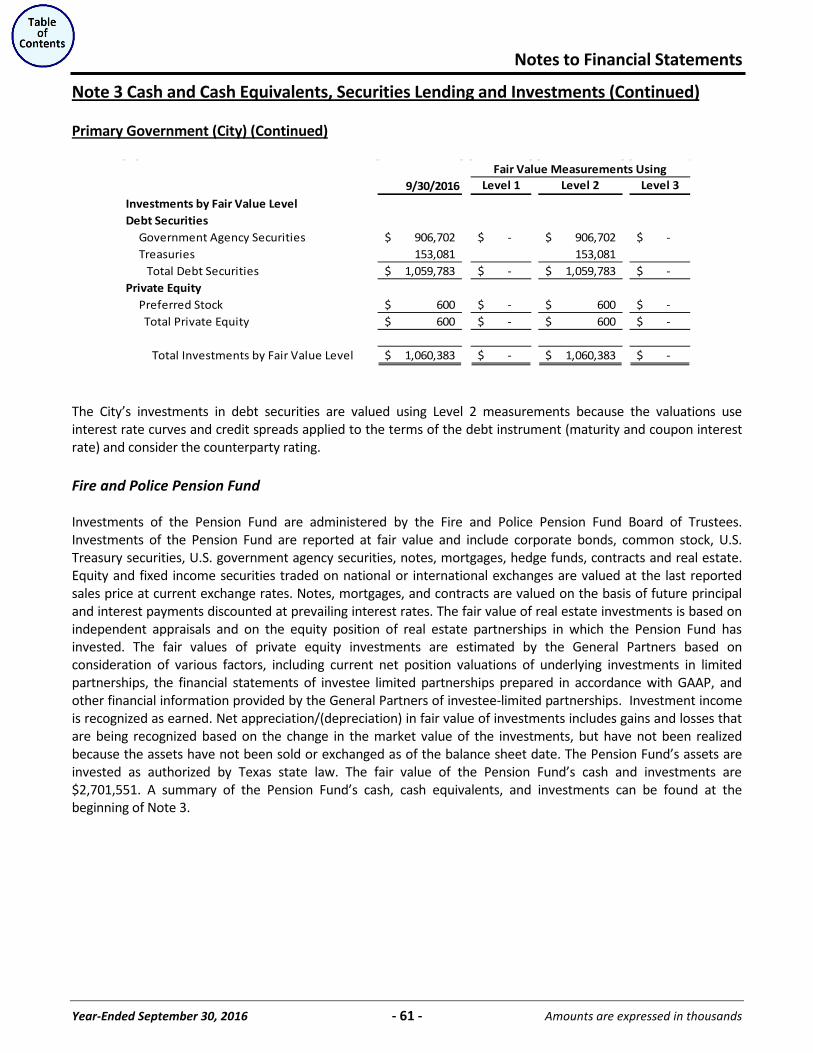
Notes to Financial Statements
Year-Ended September 30, 2016 - 61 - Amounts are expressed in thousands
Note 3 Cash and Cash Equivalents, Securities Lending and Investments (Continued)
Primary Government (City) (Continued)
9/30/2016 Level 1 Level 2 Level 3
Investments by Fair Value LevelDebt Securities
Government Agency Securities 906,702$ -$ 906,702$ -$ Treasuries 153,081 153,081 Total Debt Securities 1,059,783$ -$ 1,059,783$ -$
Private EquityPreferred Stock 600$ -$ 600$ -$ Total Private Equity 600$ -$ 600$ -$
Total Investments by Fair Value Level 1,060,383$ -$ 1,060,383$ -$
Fair Value Measurements Using
The City’s investments in debt securities are valued using Level 2 measurements because the valuations use interest rate curves and credit spreads applied to the terms of the debt instrument (maturity and coupon interest rate) and consider the counterparty rating. Fire and Police Pension Fund Investments of the Pension Fund are administered by the Fire and Police Pension Fund Board of Trustees. Investments of the Pension Fund are reported at fair value and include corporate bonds, common stock, U.S. Treasury securities, U.S. government agency securities, notes, mortgages, hedge funds, contracts and real estate. Equity and fixed income securities traded on national or international exchanges are valued at the last reported sales price at current exchange rates. Notes, mortgages, and contracts are valued on the basis of future principal and interest payments discounted at prevailing interest rates. The fair value of real estate investments is based on independent appraisals and on the equity position of real estate partnerships in which the Pension Fund has invested. The fair values of private equity investments are estimated by the General Partners based on consideration of various factors, including current net position valuations of underlying investments in limited partnerships, the financial statements of investee limited partnerships prepared in accordance with GAAP, and other financial information provided by the General Partners of investee-limited partnerships. Investment income is recognized as earned. Net appreciation/(depreciation) in fair value of investments includes gains and losses that are being recognized based on the change in the market value of the investments, but have not been realized because the assets have not been sold or exchanged as of the balance sheet date. The Pension Fund’s assets are invested as authorized by Texas state law. The fair value of the Pension Fund’s cash and investments are $2,701,551. A summary of the Pension Fund’s cash, cash equivalents, and investments can be found at the beginning of Note 3.
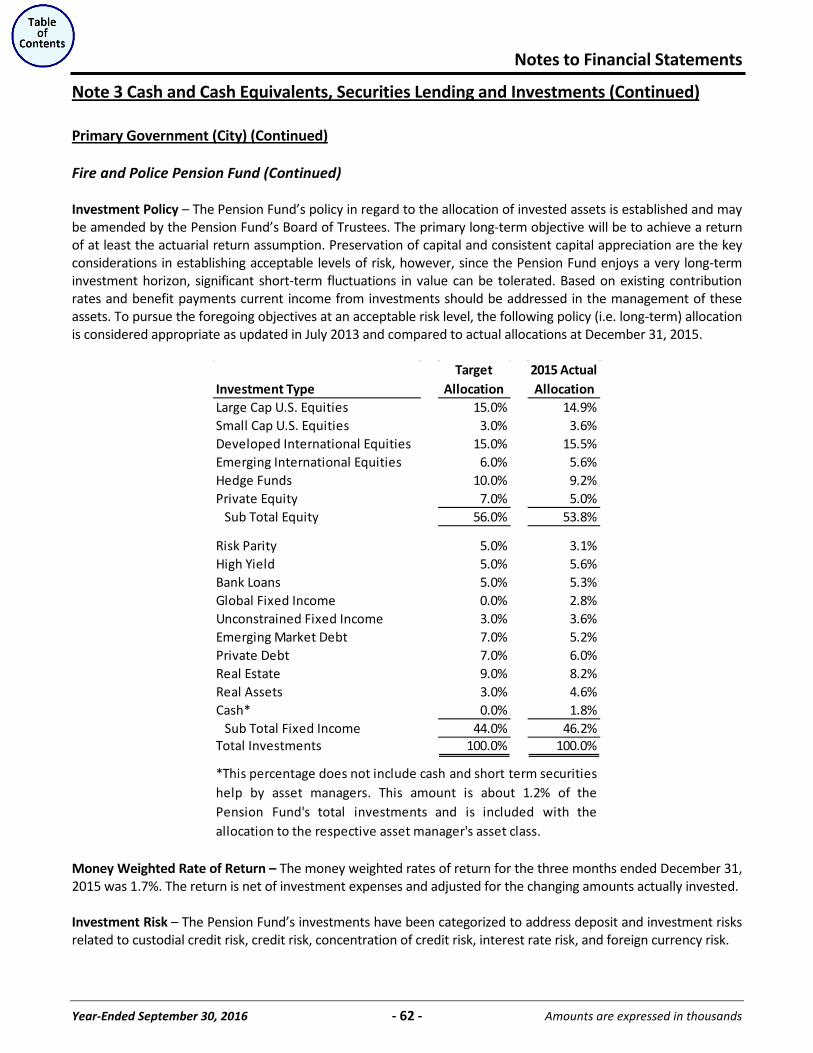
Notes to Financial Statements
Year-Ended September 30, 2016 - 62 - Amounts are expressed in thousands
Note 3 Cash and Cash Equivalents, Securities Lending and Investments (Continued)
Primary Government (City) (Continued)
Fire and Police Pension Fund (Continued) Investment Policy – The Pension Fund’s policy in regard to the allocation of invested assets is established and may be amended by the Pension Fund’s Board of Trustees. The primary long-term objective will be to achieve a return of at least the actuarial return assumption. Preservation of capital and consistent capital appreciation are the key considerations in establishing acceptable levels of risk, however, since the Pension Fund enjoys a very long-term investment horizon, significant short-term fluctuations in value can be tolerated. Based on existing contribution rates and benefit payments current income from investments should be addressed in the management of these assets. To pursue the foregoing objectives at an acceptable risk level, the following policy (i.e. long-term) allocation is considered appropriate as updated in July 2013 and compared to actual allocations at December 31, 2015.
Investment TypeTarget
Allocation2015 Actual Allocation
Large Cap U.S. Equities 15.0% 14.9%Small Cap U.S. Equities 3.0% 3.6%Developed International Equities 15.0% 15.5%Emerging International Equities 6.0% 5.6%Hedge Funds 10.0% 9.2%Private Equity 7.0% 5.0% Sub Total Equity 56.0% 53.8%
Risk Parity 5.0% 3.1%High Yield 5.0% 5.6%Bank Loans 5.0% 5.3%Global Fixed Income 0.0% 2.8%Unconstrained Fixed Income 3.0% 3.6%Emerging Market Debt 7.0% 5.2%Private Debt 7.0% 6.0%Real Estate 9.0% 8.2%Real Assets 3.0% 4.6%Cash* 0.0% 1.8% Sub Total Fixed Income 44.0% 46.2%Total Investments 100.0% 100.0%
*This percentage does not include cash and short term securitieshelp by asset managers. This amount is about 1.2% of thePension Fund's total investments and is included with theallocation to the respective asset manager's asset class.
Money Weighted Rate of Return – The money weighted rates of return for the three months ended December 31, 2015 was 1.7%. The return is net of investment expenses and adjusted for the changing amounts actually invested. Investment Risk – The Pension Fund’s investments have been categorized to address deposit and investment risks related to custodial credit risk, credit risk, concentration of credit risk, interest rate risk, and foreign currency risk.
Notes to Financial Statements
Year-Ended September 30, 2016 - 63 - Amounts are expressed in thousands
Note 3 Cash and Cash Equivalents, Securities Lending and Investments (Continued)
Primary Government (City) (Continued)
Fire and Police Pension Fund (Continued) Credit Risk – Credit Risk is the risk that an issuer will not fulfill its obligations. Using Standard and Poor’s rating system for fixed income securities as of December 31, 2015, 3.0% of the Pension Fund’s bonds were rated ‘AAA’, 5.0% were rated ‘AA’, 7.0% were rated ‘A’, 17.0% were rated ‘BBB’, 22.0% were rated ‘BB’, 28.0% were rated ‘B’, 6.0% were rated ‘CCC’, and 8.0% were unrated or not rated. 4.0% of the securities were invested in US Government and Agencies, which are not rated. Credit risk for derivative instruments held by the Pension Fund results from counterparty risk, which is essentially that the counterparty will be unable to fulfill its obligations, which are then assumed by the Pension Fund. Information regarding the Pension Fund's credit risk related to derivatives is found under the derivatives disclosures. Policies regarding credit risk associated with the Pension Fund's securities lending program are found under the securities lending disclosures. Concentration of Credit Risk – Concentration of credit risk is the risk of loss attributable to the magnitude of the Pension Fund's investment in a single issue. As of December 31, 2015, the Pension Fund did not have any single investment in any one organization which represented greater than 5.0% of plan net position. Custodial Credit Risk – Custodial credit risk for investments is the risk that in the event of a failure of the counterparty, the Pension Fund will not be able to recover the value of the investment or collateral in possession of the counterparty. The Pension Fund does not have an investment policy regarding custodial credit risk. The Pension Fund considers only demand deposits as cash. The Federal Depository Insurance Corporation (FDIC) covered cash on deposit up to $250 at each financial institution. As of December 31, 2015, the Pension Fund had cash deposits held by investment managers in the amount of $637 that were uninsured and uncollateralized. Interest Rate Risk – Interest rate risk is the risk that changes in interest rates of fixed income securities will adversely affect the fair value of an investment. Only the fixed income securities of the Pension Fund are subject to interest rate risk due to the possibility that prevailing interest rates could change before the securities reach maturity. The Pension Fund does not have an investment policy specifically regarding interest rate risk. Investment managers have full discretion in adopting investment strategies to deal with these risks, and all of the Pension Fund’s fixed income portfolios are managed in accordance with guidelines that are specific as to the degree of interest rate risk taken. Securities that are subject to interest rate risk as of December 31, 2015 amount to $580,340 and have a weighted-average maturity (WAM) of 7.4 years. Securities that are subject to interest rate risk are shown in the following table.
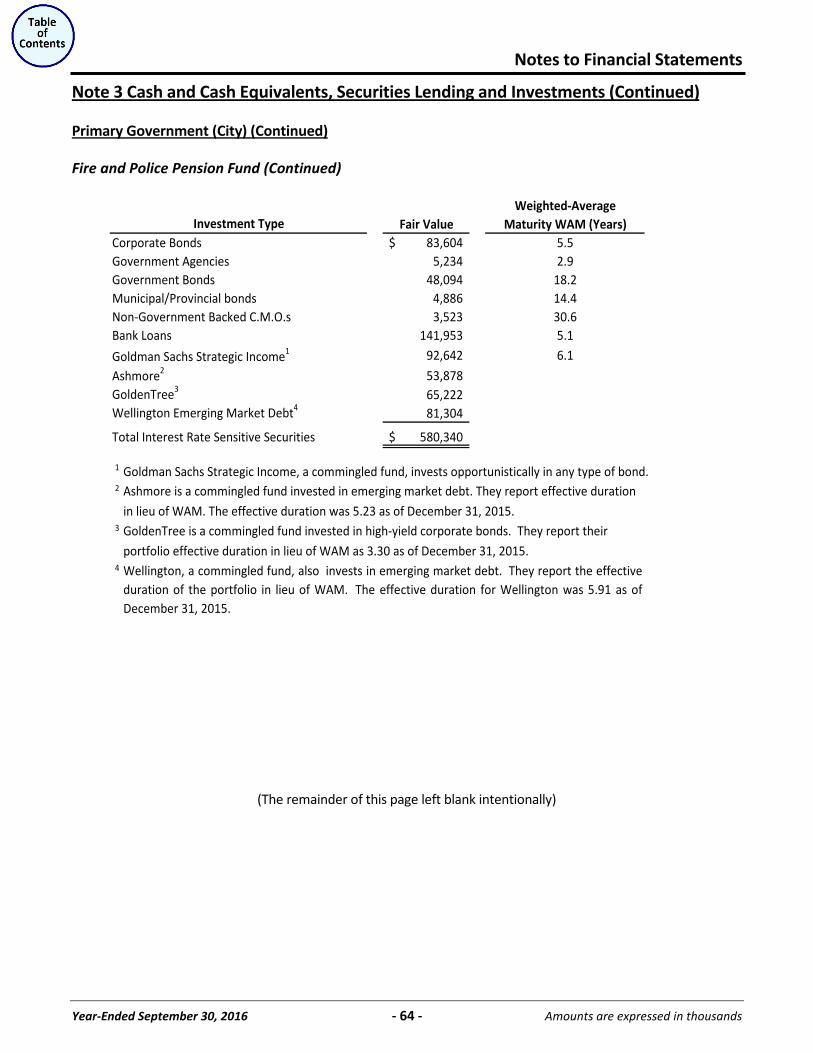
Notes to Financial Statements
Year-Ended September 30, 2016 - 64 - Amounts are expressed in thousands
Note 3 Cash and Cash Equivalents, Securities Lending and Investments (Continued)
Primary Government (City) (Continued)
Fire and Police Pension Fund (Continued)
Weighted-AverageFair Value Maturity WAM (Years)
Corporate Bonds 83,604$ 5.5Government Agencies 5,234 2.9Government Bonds 48,094 18.2Municipal/Provincial bonds 4,886 14.4Non-Government Backed C.M.O.s 3,523 30.6Bank Loans 141,953 5.1
Goldman Sachs Strategic Income1 92,642 6.1
Ashmore2 53,878 GoldenTree3 65,222 Wellington Emerging Market Debt4 81,304
Total Interest Rate Sensitive Securities 580,340$
1 Goldman Sachs Strategic Income, a commingled fund, invests opportunistically in any type of bond.2
3
4 Wellington, a commingled fund, also invests in emerging market debt. They report the effectiveduration of the portfolio in lieu of WAM. The effective duration for Wellington was 5.91 as ofDecember 31, 2015.
GoldenTree is a commingled fund invested in high-yield corporate bonds. They report their portfolio effective duration in lieu of WAM as 3.30 as of December 31, 2015.
Investment Type
Ashmore is a commingled fund invested in emerging market debt. They report effective duration in lieu of WAM. The effective duration was 5.23 as of December 31, 2015.
(The remainder of this page left blank intentionally)
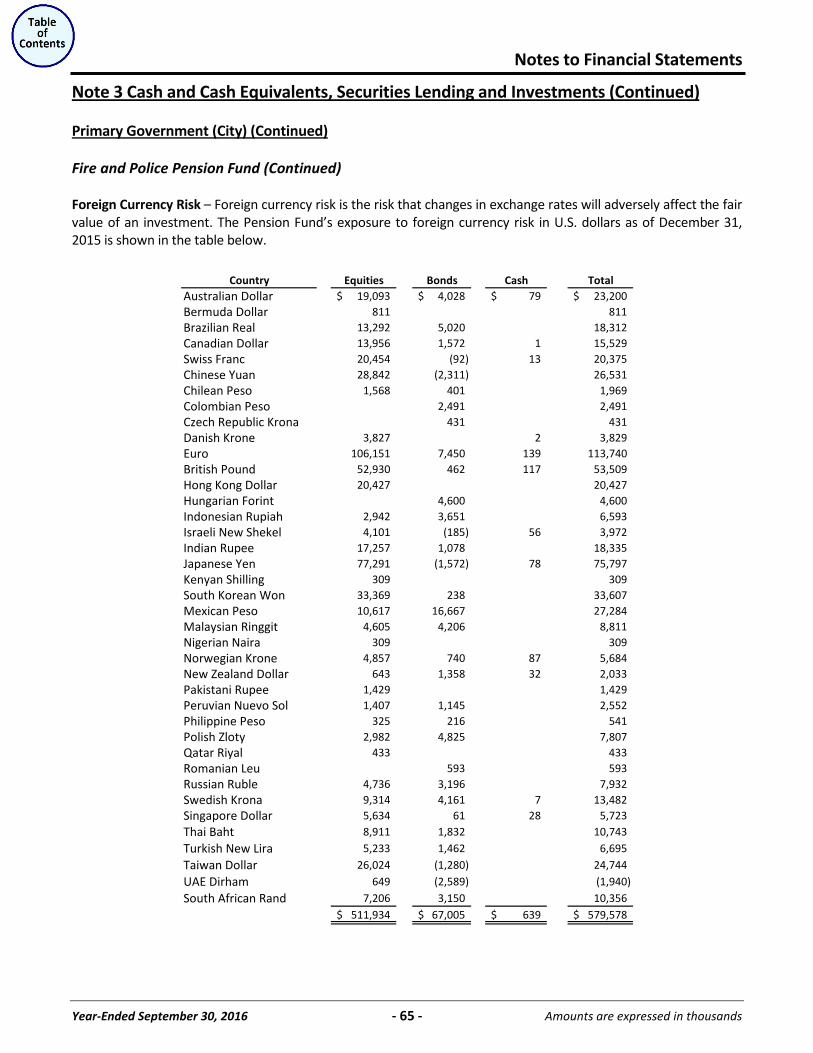
Notes to Financial Statements
Year-Ended September 30, 2016 - 65 - Amounts are expressed in thousands
Note 3 Cash and Cash Equivalents, Securities Lending and Investments (Continued)
Primary Government (City) (Continued)
Fire and Police Pension Fund (Continued) Foreign Currency Risk – Foreign currency risk is the risk that changes in exchange rates will adversely affect the fair value of an investment. The Pension Fund’s exposure to foreign currency risk in U.S. dollars as of December 31, 2015 is shown in the table below.
Country Equities Bonds Cash Total
Australian Dollar 19,093$ 4,028$ 79$ 23,200$ Bermuda Dollar 811 811 Brazilian Real 13,292 5,020 18,312 Canadian Dollar 13,956 1,572 1 15,529 Swiss Franc 20,454 (92) 13 20,375 Chinese Yuan 28,842 (2,311) 26,531 Chilean Peso 1,568 401 1,969 Colombian Peso 2,491 2,491 Czech Republic Krona 431 431 Danish Krone 3,827 2 3,829 Euro 106,151 7,450 139 113,740 British Pound 52,930 462 117 53,509 Hong Kong Dollar 20,427 20,427 Hungarian Forint 4,600 4,600 Indonesian Rupiah 2,942 3,651 6,593 Israeli New Shekel 4,101 (185) 56 3,972 Indian Rupee 17,257 1,078 18,335 Japanese Yen 77,291 (1,572) 78 75,797 Kenyan Shilling 309 309 South Korean Won 33,369 238 33,607 Mexican Peso 10,617 16,667 27,284 Malaysian Ringgit 4,605 4,206 8,811 Nigerian Naira 309 309 Norwegian Krone 4,857 740 87 5,684 New Zealand Dollar 643 1,358 32 2,033 Pakistani Rupee 1,429 1,429 Peruvian Nuevo Sol 1,407 1,145 2,552 Philippine Peso 325 216 541 Polish Zloty 2,982 4,825 7,807 Qatar Riyal 433 433 Romanian Leu 593 593 Russian Ruble 4,736 3,196 7,932 Swedish Krona 9,314 4,161 7 13,482 Singapore Dollar 5,634 61 28 5,723 Thai Baht 8,911 1,832 10,743 Turkish New Lira 5,233 1,462 6,695 Taiwan Dollar 26,024 (1,280) 24,744 UAE Dirham 649 (2,589) (1,940) South African Rand 7,206 3,150 10,356
511,934$ 67,005$ 639$ 579,578$
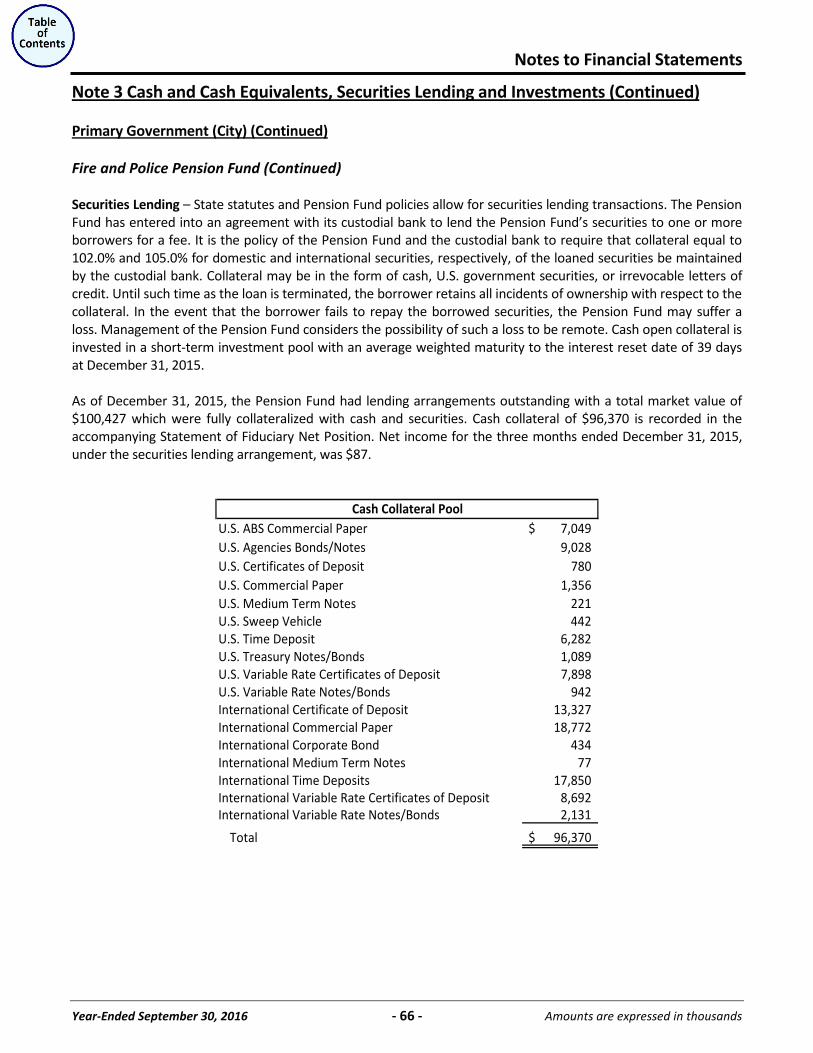
Notes to Financial Statements
Year-Ended September 30, 2016 - 66 - Amounts are expressed in thousands
Note 3 Cash and Cash Equivalents, Securities Lending and Investments (Continued)
Primary Government (City) (Continued)
Fire and Police Pension Fund (Continued) Securities Lending – State statutes and Pension Fund policies allow for securities lending transactions. The Pension Fund has entered into an agreement with its custodial bank to lend the Pension Fund’s securities to one or more borrowers for a fee. It is the policy of the Pension Fund and the custodial bank to require that collateral equal to 102.0% and 105.0% for domestic and international securities, respectively, of the loaned securities be maintained by the custodial bank. Collateral may be in the form of cash, U.S. government securities, or irrevocable letters of credit. Until such time as the loan is terminated, the borrower retains all incidents of ownership with respect to the collateral. In the event that the borrower fails to repay the borrowed securities, the Pension Fund may suffer a loss. Management of the Pension Fund considers the possibility of such a loss to be remote. Cash open collateral is invested in a short-term investment pool with an average weighted maturity to the interest reset date of 39 days at December 31, 2015. As of December 31, 2015, the Pension Fund had lending arrangements outstanding with a total market value of $100,427 which were fully collateralized with cash and securities. Cash collateral of $96,370 is recorded in the accompanying Statement of Fiduciary Net Position. Net income for the three months ended December 31, 2015, under the securities lending arrangement, was $87.
U.S. ABS Commercial Paper 7,049$ U.S. Agencies Bonds/Notes 9,028 U.S. Certificates of Deposit 780 U.S. Commercial Paper 1,356 U.S. Medium Term Notes 221 U.S. Sweep Vehicle 442 U.S. Time Deposit 6,282 U.S. Treasury Notes/Bonds 1,089 U.S. Variable Rate Certificates of Deposit 7,898 U.S. Variable Rate Notes/Bonds 942 International Certificate of Deposit 13,327 International Commercial Paper 18,772 International Corporate Bond 434 International Medium Term Notes 77 International Time Deposits 17,850 International Variable Rate Certificates of Deposit 8,692 International Variable Rate Notes/Bonds 2,131
Total 96,370$
Cash Collateral Pool
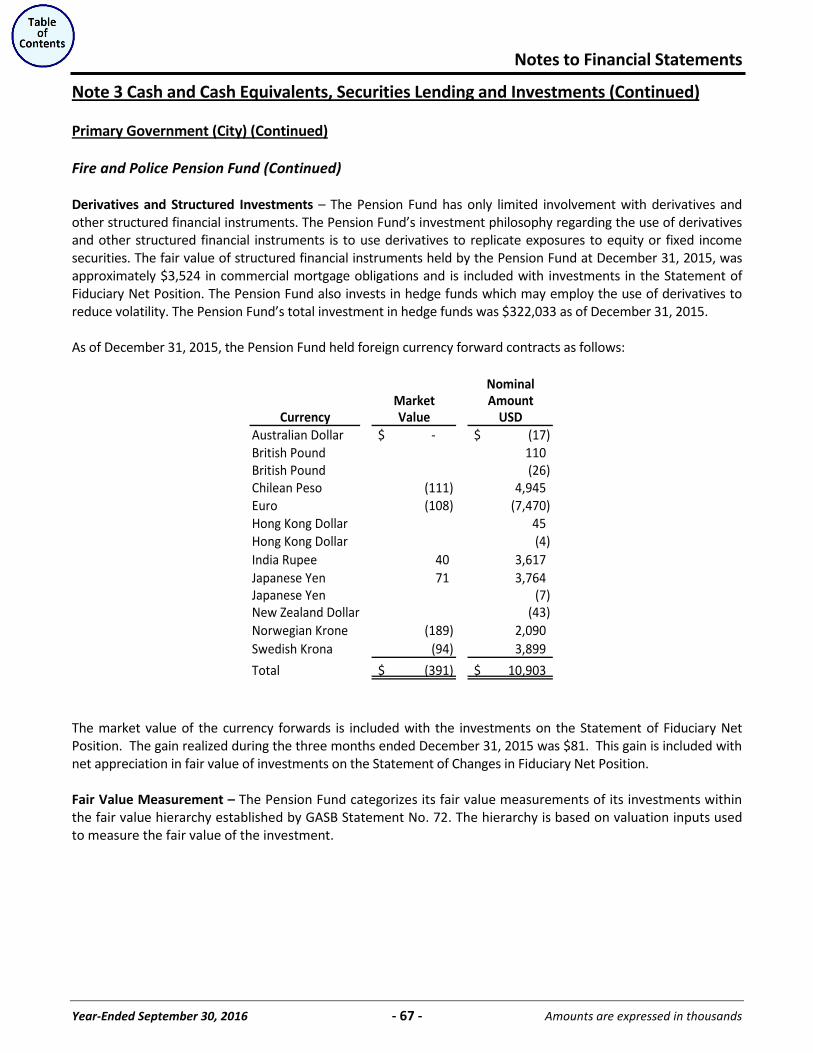
Notes to Financial Statements
Year-Ended September 30, 2016 - 67 - Amounts are expressed in thousands
Note 3 Cash and Cash Equivalents, Securities Lending and Investments (Continued)
Primary Government (City) (Continued)
Fire and Police Pension Fund (Continued) Derivatives and Structured Investments – The Pension Fund has only limited involvement with derivatives and other structured financial instruments. The Pension Fund’s investment philosophy regarding the use of derivatives and other structured financial instruments is to use derivatives to replicate exposures to equity or fixed income securities. The fair value of structured financial instruments held by the Pension Fund at December 31, 2015, was approximately $3,524 in commercial mortgage obligations and is included with investments in the Statement of Fiduciary Net Position. The Pension Fund also invests in hedge funds which may employ the use of derivatives to reduce volatility. The Pension Fund’s total investment in hedge funds was $322,033 as of December 31, 2015. As of December 31, 2015, the Pension Fund held foreign currency forward contracts as follows:
NominalMarket Amount
Currency Value USDAustralian Dollar -$ (17)$ British Pound 110 British Pound (26) Chilean Peso (111) 4,945 Euro (108) (7,470) Hong Kong Dollar 45 Hong Kong Dollar (4) India Rupee 40 3,617 Japanese Yen 71 3,764 Japanese Yen (7) New Zealand Dollar (43) Norwegian Krone (189) 2,090 Swedish Krona (94) 3,899
Total (391)$ 10,903$
The market value of the currency forwards is included with the investments on the Statement of Fiduciary Net Position. The gain realized during the three months ended December 31, 2015 was $81. This gain is included with net appreciation in fair value of investments on the Statement of Changes in Fiduciary Net Position. Fair Value Measurement – The Pension Fund categorizes its fair value measurements of its investments within the fair value hierarchy established by GASB Statement No. 72. The hierarchy is based on valuation inputs used to measure the fair value of the investment.
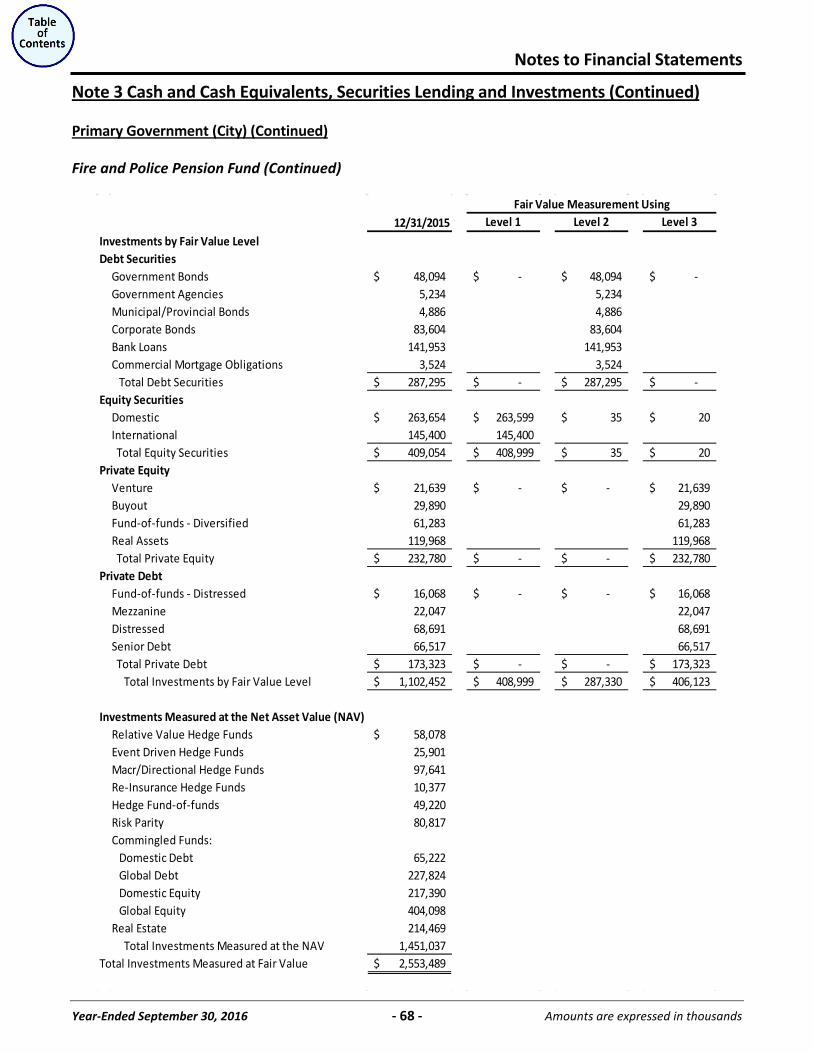
Notes to Financial Statements
Year-Ended September 30, 2016 - 68 - Amounts are expressed in thousands
Note 3 Cash and Cash Equivalents, Securities Lending and Investments (Continued)
Primary Government (City) (Continued)
Fire and Police Pension Fund (Continued)
12/31/2015 Level 1 Level 2 Level 3
Investments by Fair Value LevelDebt Securities
Government Bonds 48,094$ -$ 48,094$ -$ Government Agencies 5,234 5,234 Municipal/Provincial Bonds 4,886 4,886 Corporate Bonds 83,604 83,604 Bank Loans 141,953 141,953 Commercial Mortgage Obligations 3,524 3,524 Total Debt Securities 287,295$ -$ 287,295$ -$
Equity SecuritiesDomestic 263,654$ 263,599$ 35$ 20$ International 145,400 145,400 Total Equity Securities 409,054$ 408,999$ 35$ 20$
Private EquityVenture 21,639$ -$ -$ 21,639$ Buyout 29,890 29,890 Fund-of-funds - Diversified 61,283 61,283 Real Assets 119,968 119,968 Total Private Equity 232,780$ -$ -$ 232,780$
Private DebtFund-of-funds - Distressed 16,068$ -$ -$ 16,068$ Mezzanine 22,047 22,047 Distressed 68,691 68,691 Senior Debt 66,517 66,517 Total Private Debt 173,323$ -$ -$ 173,323$ Total Investments by Fair Value Level 1,102,452$ 408,999$ 287,330$ 406,123$
Investments Measured at the Net Asset Value (NAV)Relative Value Hedge Funds 58,078$ Event Driven Hedge Funds 25,901 Macr/Directional Hedge Funds 97,641 Re-Insurance Hedge Funds 10,377 Hedge Fund-of-funds 49,220 Risk Parity 80,817 Commingled Funds: Domestic Debt 65,222 Global Debt 227,824 Domestic Equity 217,390 Global Equity 404,098 Real Estate 214,469 Total Investments Measured at the NAV 1,451,037
Total Investments Measured at Fair Value 2,553,489$
Fair Value Measurement Using
Notes to Financial Statements
Year-Ended September 30, 2016 - 69 - Amounts are expressed in thousands
Note 3 Cash and Cash Equivalents, Securities Lending and Investments (Continued)
Primary Government (City) (Continued)
Fire and Police Pension Fund (Continued) Debt and Equity Securities – Equity securities classified in Level 1 of the fair value hierarchy are valued using prices quoted in active markets for those securities. Debt and equity securities classified in Level 2 of the fair value hierarchy are valued using a matrix pricing technique. Matrix pricing is used to value securities based on the securities’ relationship to benchmark quoted prices. Equity securities classified in Level 3 of the fair value hierarchy were valued based on theoretical relationships to other assets similar to the ones in the portfolio. Private Equity – The Pension Fund is invested in 34 private equity funds (fund count not reported in thousands) that are diversified across four main types of strategies. There are six venture capital funds, eight buyout funds, 11 real assets funds, and nine diversified fund-of-funds. These investee funds are considered Level 3 in the fair value hierarchy. These investee funds are limited partnerships, and the managing general partner is responsible for determining the fair market value of the underlying investments. The methods used to determine fair value include discounted cash flow, small public company comparison and appraisal. The partnerships have a 10 year life with options to extend beyond the original term by as much as two years in most cases. Original capital commitments to these funds range from $10,000 to $20,000. It is expected that the investee funds will call between 70.0% and 80.0% of the committed capital. In most cases the final commitment is never called because the investee funds start to receive returned capital either from sales of or operations from the underlying investments. As of December 31, 2015, it is estimated that the unfunded commitments were approximately $96,000 of which $37,000 is expected to be called. These investments in the investee funds are diversified across vintage years so the investee funds are in different stages of their life cycles. The Pension Fund’s allocation to this asset class requires that capital that is received from these investments will be reinvested in other investee funds as they become available. Even though these investments could be sold to other investors or secondary funds, the Pension Fund has no intention of doing so, so these investments are considered illiquid. Private Debt – The Pension Fund is invested in 16 private debt funds (fund count not reported in thousands), which include four fund-of-funds focused on distressed debt opportunities, three funds focused on mezzanine lending to companies that have operations that have good growth potential, but limited access to bank loans or public debt or equity markets, five funds focused on loans that are senior in the borrowers’ capital structure, and four funds that concentrate on distressed debt where debt is purchased at a cost that is less than the value of the collateral. These investee funds are considered Level 3 in the fair value hierarchy. These investee funds are limited partnerships, and the managing general partner is responsible for determining the fair market value of the underlying investments. The methods used to determine fair value include discounted cash flows plus the value of any equity that investee funds receive as part of the lending arrangements. The partnerships have a 10 year life with options to extend beyond the original term by as much as two years in most cases. Original capital commitments to these funds range from $10,000 to $20,000. It is expected that the investee funds will call between 70.0% and 80.0% of the committed capital. In most cases the final commitment is never called because the investee funds start to receive repayment from the debt service of the underlying investments and in some cases extra capital from the sale of the equity received when underlying companies are sold or refinanced through public offerings.
Notes to Financial Statements
Year-Ended September 30, 2016 - 70 - Amounts are expressed in thousands
Note 3 Cash and Cash Equivalents, Securities Lending and Investments (Continued)
Primary Government (City) (Continued)
Fire and Police Pension Fund (Continued) As of December 31, 2015, it is estimated that unfunded commitments were approximately $66,000 of which $17,000 is expected to be called. These investments in the investee funds are diversified across vintage years so the investee funds are in different stages of their life cycles. The Pension Fund’s allocation to this asset class requires that capital that is received from these investments will be reinvested in other investee funds as they become available. Even though these investments could be sold to other investors or secondary funds, the Pension Fund has no intention of doing so, so these investments are considered illiquid. Investment Measured at the Net Asset Value – The Pension Fund is also substantially invested in investee funds where fair value is measured at the net asset value (NAV). These funds invest in stocks, bonds, derivatives in some cases and real estate. The stocks, bonds or derivatives, if they were held directly by the Pension Fund, would have readily determinable values that would fit into the fair value levels. Most of these would be in Level 1 or 2. Real estate would fall into Level 3 since there is not usually a ready market for the underlying assets. The investee funds have both active and inactive managers. Inactive managers invest in stocks that are in an index such that the return on the investment equals the return on the index. Active managers will invest in stocks or bonds with intent of either achieving a higher rate of return than the market or one of the indexes, or lowering the amount of the risk involved. The investee funds in this category include hedge funds, a risk parity fund, commingled funds, and real estate funds. Hedge Funds – The Pension Fund’s investments in hedge funds include relative value, event driven, macro/diversified hedge fund-of-funds. These hedge funds all require notice between 30-90 days of the intent to redeem cash from them. They will only redeem cash at the end of calendar quarters. The Pension Fund is invested in four relative value hedge funds (hedge fund count not in thousands). Relative value investing seeks to exploit relationships that are out of normal equilibrium. These investee funds are not concerned with the price of an asset such as a stock or bond by itself, but how that asset’s price relates to other assets that historically display some correlation to the asset. The Pension Fund is invested in seven hedge funds that invest using a macro/directional strategy. These strategies base their investments, such as long and short positions in various equity, fixed income, currency, commodities and futures markets, primarily on the overall economic and political views of various countries, or their macroeconomic principles. The Pension Fund is invested in two event driven hedge funds. Event driven hedge funds invest based on the expectation of a particular event such as a merger or acquisition and how that event is expected to affect the price of the underlying investment. One of the hedge funds that the Pension Fund invests in actually invests alongside a reinsurance company. The Pension Fund has an investment in a hedge fund-of-funds, which invests in a diversified group of underlying hedge funds. In this category there are six hedge fund remnants that are subject to a gate. These gates have been in place since 2008 when the Pension Fund gave notice of redemption. Most of the investments have been returned, but there is no certainty when the remaining investment of $9,620 will be returned. The gates were put in place to prevent having to sell the assets under duress. Risk Parity Fund – The Pension Fund has one investee that is called risk parity which is similar to a hedge fund in that it attempts to mitigate large systemic risks such as hyperinflation, or market corrections by increasing exposure to low risk strategies while decreasing or hedging exposures to investments that are sensitive to those systemic risks.
Notes to Financial Statements
Year-Ended September 30, 2016 - 71 - Amounts are expressed in thousands
Note 3 Cash and Cash Equivalents, Securities Lending and Investments (Continued)
Primary Government (City) (Continued)
Fire and Police Pension Fund (Continued) Commingled Funds – The Pension Fund’s investments in commingled funds consist of bond investors and stock investors. The bond funds invest in domestic high yield bonds, opportunistic global bonds and emerging market bonds. The stock funds are invested in domestic large and small cap stocks and global and emerging market stocks. Commingled funds are chosen for these investments either because of the size of the investment, or because of the transfer of the complexity of investing internationally. Real Estate Funds – Real estate investments are diversified by type of real estate such as residential, commercial office, industrial, and retail. They are also diversified by stage of development such as opportunistic, value added and core properties. Finally they are diversified geographically. Two of the investee managers representing approximately $81,000 were open-ended funds that allow redemptions. The balance of the investee managers were limited partnerships with durations of 10 to 15 years. These limited partnerships do not allow redemptions. They do distribute cash after the investment period, usually two to four years, from operations or sales of underlying properties. These investments are similar to the private equity partnerships and private debt partnerships in that funds are committed at the beginning of the investment and called by the partnerships as purchase opportunities present themselves. Commitments in this category are more likely to be called up. It is likely that 80.0% to 90.0% of the committed capital will ultimately be called. Unfunded commitments in this category were approximately $30,000. Fair value for this asset class is determined by appraisals of the underlying properties. The Pension Fund’s asset allocation requires that when capital is returned it is reinvested in new partnerships so that the percentage allotted to the asset class can be maintained. Like private equity and private debt limited partnerships, it is possible to sell partnership interests to other investors or secondary partnerships at a substantial cost to the Pension Fund. The Pension Fund has no intention of redeeming these investments prior to maturity. Consequently, these investments are considered illiquid. Fire and Police Retiree Health Care Fund The Health Care Fund Board of Trustees administers investments of the Health Fund, a blended component unit. Investments are reported at fair value. Short-term investments are reported at amortized cost, which approximates fair value. Securities traded on national or international exchanges are valued at the last reported sales price at current exchange rates. Investments that do not have an established market value are reported at estimated fair value. Alternative investments are substantially held in the form of nonmarketable limited partnerships interests, private real estate investment trusts, and open-ended hedge funds. These investments are subject to the terms of the respective partnerships’ or other types of governing documents which may limit the Health Fund’s withdrawal to specified times and conditions and restrict the transferability of the Health Fund’s interest. The fair valuation of these investments is based on net position values as set by the partnerships’ fund managers or general partners. These net position values may differ from the value that would have been used had a ready market for the investments existed; accordingly such differences could be material. All investment income, including changes in the fair value of investments, is reported as additions in the Statement of Changes in Fiduciary Net Position.
Notes to Financial Statements
Year-Ended September 30, 2016 - 72 - Amounts are expressed in thousands
Note 3 Cash and Cash Equivalents, Securities Lending and Investments (Continued)
Primary Government (City) (Continued)
Fire and Police Retiree Health Care Fund (Continued) The Health Fund’s assets are invested as authorized by the Investment Policy. The Health Fund utilizes an investment consultant that makes recommendations to the Health Fund as to the appropriate target portfolio weightings among the major asset classes (e.g. stocks, mutual funds, limited liability partnerships, cash, etc.) within the Health Fund. Additionally, the Health Fund has hired certain investment managers to exercise full discretionary authority as to all buy, hold, and sell decisions for each security under management, subject to the guidelines as defined in the Investment Policy. All of the Health Fund’s assets are held by a custodian bank, Frost Bank of San Antonio, Texas. Investments authorized by the Health Fund’s Investment Policy include U.S. equities, including common stocks, securities convertible into common stock, and open or closed end mutual funds; international equity; certain fixed income assets such as corporate bonds and certificates of deposit; commercial paper; private equity; and alternative investments, including real estate, absolute return hedge funds, and natural resources. The cash portion of the Health Fund will be invested in a short-term money market mutual fund administered by the custodian bank. The fair value of the Health Fund’s cash and investments at December 31, 2015 is $321,649. A summary of the Health Fund’s cash, cash equivalents, and investments can be found at the beginning of Note 3. Interest Rate Risk – As a means of limiting its exposure to fair value losses arising from rising interest rates, the Health Fund’s Investment Policy limits the maturities of money market mutual funds to 2 years at time of purchase. At December 31, 2015, the money market fund weighted average to maturity is 31 days. The Health Fund places no limit on maturities of Mutual Funds – Fixed Income. Credit Risk – In accordance with the Health Fund’s Investment Policy, investments in money market mutual fund must be rated at least ‘A-2” by Standard and Poor’s (S&P). At December 31, 2015, the money market mutual fund was rated ‘AAAm’ by S&P. The Health Fund’s investments in Mutual Funds – Fixed Income are not rated by a nationally recognized statistical ranking organization. Custodial Credit Risk (Investments) – The custodial credit risk for investments is the risk that, in the event of failure of the counterparty to an investment transaction, a government will not be able to recover the value of its investment or collateral securities that are in the possession of an outside party. At December 31, 2015, the Health Fund’s common stock investments are held at Frost Bank’s third-party custodian, Bank of New York. Since the investments are maintained separately from the bank’s assets, in the event of failure of the bank, the investments held in trust would not be affected. Concentration of Credit Risk – Concentration risk is the exposure to loss that can result from failing to diversify investments. Accordingly, a government should disclose investments that represent 5.0% or more of its total investments that are invested in a single issuer. Concentration risk does not arise in connection with U.S. government obligations and obligations explicitly guaranteed by the U.S. government; mutual funds; and, similar pooled investments which are designed, in part, to provide diversification. At December 31, 2015, the Health Fund’s investments in Catalyst Fund Limited Partnership II and Catalyst Fund Limited Partnership III respectively amount to $17,156 and $21,950 and respectively represent 5.3% and 6.8% of the Health Fund’s total investments.
Notes to Financial Statements
Year-Ended September 30, 2016 - 73 - Amounts are expressed in thousands
Note 3 Cash and Cash Equivalents, Securities Lending and Investments (Continued)
Primary Government (City) (Continued)
Fire and Police Retiree Health Care Fund (Continued) Foreign Currency Risk – Foreign currency risk is the risk that changes in exchange rates will adversely affect the fair value of an investment. As of December 31, 2015, one of the Health Fund’s investments (an amount of $5,667 or 1.8% of total investments) is exposed to foreign currency risk. The primary currency for this risk is the Euro. Fair Value Measurement – The Health Fund categorizes its fair value measurements of its investments within the fair value hierarchy established by GASB Statement No. 72. The hierarchy is based on valuation inputs used to measure the fair value of the investment. The Health Fund uses the net asset value (NAV) per share as the fair value measurement for its alternative investments since they cannot be traded and, therefore, market-based information regarding their value does not exist. As such, these alternative investments are not categorized according to the fair value hierarchy. At December 31, 2015, the Health Fund's fair value measurements for its investments were as follows:
12/31/2015 Level 1 Level 2 Level 3Investments by Fair Value LevelEquity Securities
U.S. Equity - Common Stock 7,999$ 7,999$ -$ -$ Mutual Fund - Fixed Income 66,057 66,057 Mutual Fund - International Equity 23,151 23,151 Mutual Fund - Common Stock 9,659 9,659
Total Investments by Fair Value Level 106,866$ 106,866$ -$ -$
Investments Measured at the Net Asset Value (NAV)Real Estate Funds 46,537$ Natural Resource Funds 32,272 Hedge Funds - Open-Ended Funds 6,389 Private Equity Funds 105,198 Global & Domestic Equity Funds 18,942
Total Investments Measured at the NAV 209,338$ Total Investments Measured at Fair Value 316,204$
Investments Measured at the NAV Fair ValueUnfunded Commitments
Redemption Frequency
Redemption Notice Period
Real Estate Funds 46,537$ 10,893$ Annually 120 DaysNatural Resource Funds 32,272 2,258 Hedge Funds - Open-Ended Funds 6,389 Annually 90-120 DaysPrivate Equity Funds 105,198 61,083 Global & Domestic Equity Funds 18,942 Monthly 15-30 Days
209,338$ 74,234$
Fair Value Measurement Using
Notes to Financial Statements
Year-Ended September 30, 2016 - 74 - Amounts are expressed in thousands
Note 3 Cash and Cash Equivalents, Securities Lending and Investments (Continued)
Primary Government (City) (Continued)
Fire and Police Retiree Health Care Fund (Continued) Real Estate Funds – The Health Fund is invested in nine real estate funds, which are generally diversified through fund-to-fund strategies. Portfolios include investments in assets and distressed debt for residential and commercial real estate (domestic & international). Fair values have been determined using NAV per share of investments. Real estate investment funds represent 14.7% of the Health Fund's portfolio. One investment fund (representing $15,243 or 32.8% of real estate funds) is redeemable on an annual basis with a 120 day formal notice. The Health Fund receives distributions as the underlying assets of investments are sold/liquidated for the other eight funds. Management estimates that one fund (representing $897 or 1.9% of real estate funds) will be liquidated within one year; two funds (representing $2,189 or 4.7% of real estate funds) will liquidate within three years; two funds (representing $11,242 or 24.2% of real estate funds) will liquidate within five years; and, three funds (representing $16,966 or 36.4% of real estate funds) will liquidate within nine years. Natural Resources Funds – The Health Fund is invested in seven natural resources funds. These funds are limited partnerships that use harvesting and fund-to-fund strategies. Portfolios for these funds include investments in domestic and international commodities; such as, oil, gas, iron, copper, minerals, metals, and energy sources. Fair values have been determined using NAV per share of investments. These natural resources investment funds represent 10.2% of the Health Fund's portfolio, and are not redeemable. The Health Fund receives distributions as the underlying assets of investments are sold/liquidated. Management estimates that two funds (representing $7,416 or 23.0% of the natural resources funds) will liquidate within three years; two funds (representing $10,178 or 31.5% of natural resources funds) will liquidate within five years; and, three funds (representing $14,678 or 45.5% of natural resources funds) will liquidate within nine years.
Hedge Funds - Open-Ended Funds – The Health Fund is invested in three hedge funds. Portfolios for these funds include investments in common stock, preferred stock, United States government obligations, convertible securities, debt instruments, real estate assets, options, futures, swaps, and collateralized debt/securities. Fair values have been determined using NAV per share of investments. These hedge funds represent 2.0% of the Health Fund's portfolio. One of the three hedge funds (representing $3,355 or 52.5% of hedge funds) is eligible for redemption on an annual basis with a 90-120 day formal notice. The remaining two hedge funds are not redeemable. The Health Fund receives distributions as the underlying assets of investments are sold/liquidated. Management estimates the remaining two hedge fund investments ($3,034 or 47.5% of hedge funds) will liquidate within three years. Private Equity Funds – The Health Fund is invested in sixteen private equity investment funds. Strategies for these funds include two buyout funds, seven diverse fund-to-fund funds, two private debt funds, two secondary funds, two venture capital funds, and one special situations fund. Portfolios for these funds include assets in multiple domestic and international industries. These private equity funds represent 33.3% of the Health Fund’s portfolio, and are invested in publicly and privately held Canadian-related assets. Fair values have been determined using NAV per share of investments, and are not redeemable. The Health Fund receives distributions as the underlying assets of investments are sold/liquidated. Management estimates that two funds (representing $8,541 or 8.1% of private equity funds) will liquidate within three years; seven funds (representing $42,859 or 40.8% of private equity funds) will liquidate within five years; and, seven funds (representing $53,798 or 51.1% of private equity funds) will liquidate within nine years.
Notes to Financial Statements
Year-Ended September 30, 2016 - 75 - Amounts are expressed in thousands
Note 3 Cash and Cash Equivalents, Securities Lending and Investments (Continued)
Primary Government (City) (Continued)
Fire and Police Retiree Health Care Fund (Continued) Global & Domestic Equity Funds – The Health Fund is invested in three commingled global and domestic equity funds which consist of investments in bonds, equity and debt instruments. Portfolios for these funds include investments in international emerging markets in various industries. Fair values have been determined using NAV per share of investments. These investment funds represent 6.0% of the Health Fund's portfolio, and are eligible for redemption on a monthly basis with a 15-30 day formal redemption notice. Subscribed Capital Commitments – As of December 31, 2015, the Health Fund had non-binding commitments to invest capital in 28 (not in thousands) investment companies under investment capital subscription agreements. These commitments are subject to periodic calls from the investment companies. The amount of this investment capital committed under the subscription agreements totaled to $74,234. As of December 31, 2015, $9,542 of this total had been called.
CPS Energy
CPS Energy’s investments with a maturity date within one year of the purchase date are reported at amortized cost, which approximates fair value. Amortization of premium and accretion of discount are recorded over the terms of the investments. CPS Energy’s investments with a maturity date of one year or longer from the purchase date are accounted for using fair value. As available, fair values are determined by using generally accepted financial reporting services, publications, and broker/dealer information. The specific identification method is used to determine costs in computing gains or losses on sales of securities. CPS Energy reports all investments of the Decommissioning Trusts at fair market value. Restricted funds are generally for uses other than current operations. They are designated by law, ordinance or contract and are often used to acquire or construct noncurrent assets. Restricted funds consist primarily of unspent bond or commercial paper proceeds, debt service required for the New Series Bonds, Junior Lien Obligations, Tax-Exempt Commercial Paper, the Flexible Rate Revolving Note and funds for future construction or contingencies. This category also includes customer assistance programs where proceeds are received from outside parties. The assets of the Decommissioning Trusts are also considered restricted. Also included in the restricted funds classification is the Repair and Replacement Account, restricted in accordance with CPS Energy’s bond ordinances. CPS Energy’s cash deposits at January 31, 2016 were either insured by federal depository insurance or collateralized by banks. For deposits that were collateralized, the securities were U.S. government, U.S. government agency, or U.S. government-guaranteed obligations held in book entry form by the Federal Reserve Bank of New York or other allowable banks in CPS Energy’s name. Separation – CPS Energy’s cash, cash equivalents and investments can be separated in the following manner: those directly managed by CPS Energy, and those managed through the Decommissioning Trusts. For financial reporting purposes, cash, cash equivalents and investments managed directly by CPS Energy have been consistently measured as of the end of the fiscal year. The Decommissioning Trusts are reported on a calendar-year basis.
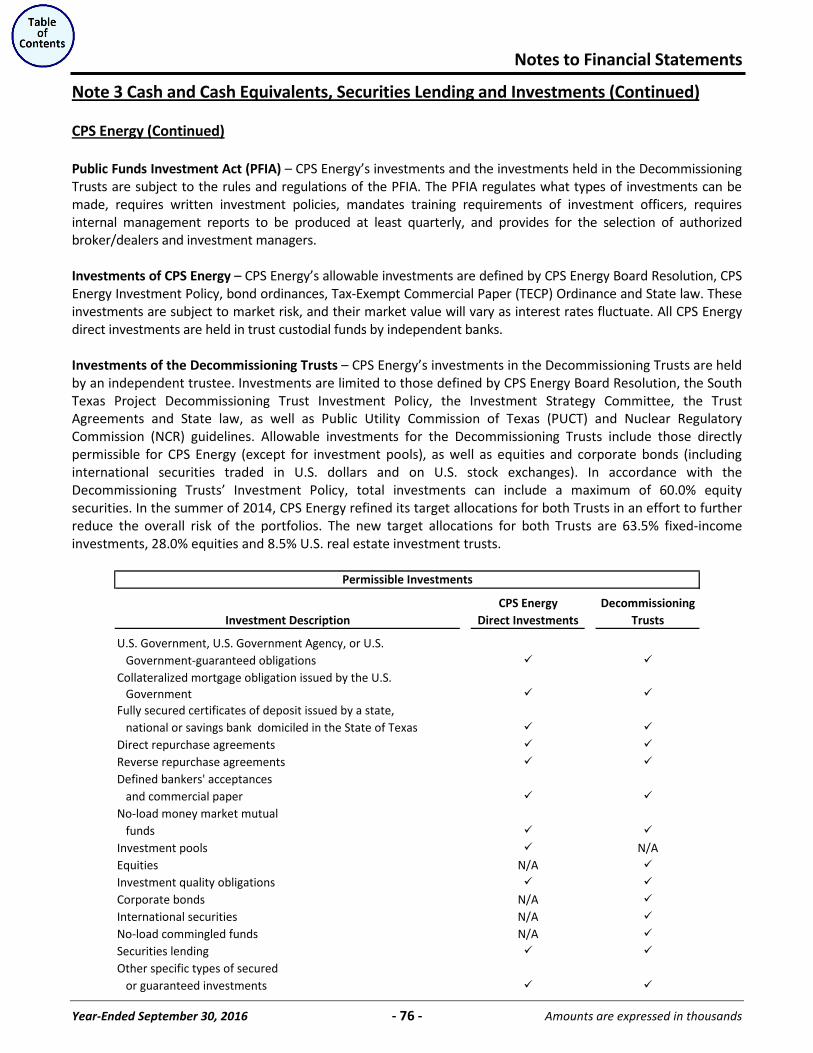
Notes to Financial Statements
Year-Ended September 30, 2016 - 76 - Amounts are expressed in thousands
Note 3 Cash and Cash Equivalents, Securities Lending and Investments (Continued)
CPS Energy (Continued)
Public Funds Investment Act (PFIA) – CPS Energy’s investments and the investments held in the Decommissioning Trusts are subject to the rules and regulations of the PFIA. The PFIA regulates what types of investments can be made, requires written investment policies, mandates training requirements of investment officers, requires internal management reports to be produced at least quarterly, and provides for the selection of authorized broker/dealers and investment managers. Investments of CPS Energy – CPS Energy’s allowable investments are defined by CPS Energy Board Resolution, CPS Energy Investment Policy, bond ordinances, Tax-Exempt Commercial Paper (TECP) Ordinance and State law. These investments are subject to market risk, and their market value will vary as interest rates fluctuate. All CPS Energy direct investments are held in trust custodial funds by independent banks. Investments of the Decommissioning Trusts – CPS Energy’s investments in the Decommissioning Trusts are held by an independent trustee. Investments are limited to those defined by CPS Energy Board Resolution, the South Texas Project Decommissioning Trust Investment Policy, the Investment Strategy Committee, the Trust Agreements and State law, as well as Public Utility Commission of Texas (PUCT) and Nuclear Regulatory Commission (NCR) guidelines. Allowable investments for the Decommissioning Trusts include those directly permissible for CPS Energy (except for investment pools), as well as equities and corporate bonds (including international securities traded in U.S. dollars and on U.S. stock exchanges). In accordance with the Decommissioning Trusts’ Investment Policy, total investments can include a maximum of 60.0% equity securities. In the summer of 2014, CPS Energy refined its target allocations for both Trusts in an effort to further reduce the overall risk of the portfolios. The new target allocations for both Trusts are 63.5% fixed-income investments, 28.0% equities and 8.5% U.S. real estate investment trusts.
CPS Energy DecommissioningInvestment Description Direct Investments Trusts
U.S. Government, U.S. Government Agency, or U.S. Government-guaranteed obligationsCollateralized mortgage obligation issued by the U.S. GovernmentFully secured certificates of deposit issued by a state, national or savings bank domiciled in the State of TexasDirect repurchase agreementsReverse repurchase agreementsDefined bankers' acceptances and commercial paperNo-load money market mutual fundsInvestment pools N/AEquities N/AInvestment quality obligationsCorporate bonds N/AInternational securities N/ANo-load commingled funds N/ASecurities lendingOther specific types of secured or guaranteed investments
Permissible Investments
Notes to Financial Statements
Year-Ended September 30, 2016 - 77 - Amounts are expressed in thousands
Note 3 Cash and Cash Equivalents, Securities Lending and Investments (Continued)
CPS Energy (Continued)
Risk Exposure – CPS Energy’s cash equivalents and fixed-income investments are exposed to interest rate risk, credit risk (including custodial credit risk and concentration of credit risk), and foreign currency risk. Equity investments are exposed to credit risk (including custodial credit risk and concentration of credit risk) and foreign currency risk. Interest rate risk is the exposure to fair market value losses resulting from rising interest rates. Credit risk is the risk that an issuer of an investment will not fulfill its obligations (will be unable to make timely principal and interest payments on the security). Foreign currency risk is the exposure to fair market value losses arising from changes in exchange rates. Cash, cash equivalents, and fixed-income investments are also exposed to inflation, liquidity, political, legal, event, reinvestment and timing (call) risks. Additionally, equity investments are exposed to political, legal, event, market and general economic risks. Due to market fluctuations, it is possible that substantial changes in the market value of investments could occur after the end of the reporting period. CPS Energy’s investments and the investments in the Decommissioning Trusts are managed with a conservative focus. The investment policies are structured to ensure compliance with bond ordinances, the PFIA, the Public Funds Collateral Act, the NRC, the PUCT, other applicable state statutes, and CPS Energy Board of Trustee resolutions relating to investments. CPS Energy identifies and manages risks by following an appropriate investment oversight strategy, establishing and monitoring compliance with investment policies and procedures, and continually monitoring prudent controls over risks. Investment Policies – In accordance with state law, the Decommissioning Trusts’ Investment Policy allows for investment in additional types of securities, such as corporate bonds and equity securities. The policy provides guidelines to ensure all funds are invested in authorized securities in order to earn a reasonable return. The primary emphasis is placed on long-term growth commensurate with the need to preserve the value of the assets and, at the time funds are needed for decommissioning costs, on liquidity. The Investment Policy continues to follow the “prudent person” concept. GASB Statement No. 40 – In accordance with GASB Statement No. 40, additional disclosures have been provided in this Note that address investment exposure to interest rate risk, credit risk (including custodial credit risk and concentration of credit risk), and foreign currency risk, as applicable. CPS Energy’s investments and those in the Decommissioning Trusts do not have custodial credit risk, as all investments are held either by an independent trustee or bank and are in CPS Energy’s or the Decommissioning Trusts’ names. CPS Energy Investments – In accordance with GASB Statement No. 40, the following tables address credit risk and interest rate risk exposure by investment type using the weighted-average maturity (WAM) method. Since CPS Energy does not hold foreign instruments in its direct investments (those held by CPS Energy), foreign currency risk is not applicable. Interest Rate Risk – In accordance with its Investment Policy, CPS Energy manages exposure to fair value losses resulting from rising interest rates by placing a limit on the portfolio’s WAM. The definition of WAM is the weighted-average time to return a dollar of principal based on the investments’ stated final maturity. It is used as an estimate of the interest rate risk of a fixed-income investment. The Investment Policy limits the WAM to three years or less, which allows for the management of risk while optimizing returns. CPS Energy invests securities lending cash collateral and other funds in money market mutual funds that have no fixed maturities.
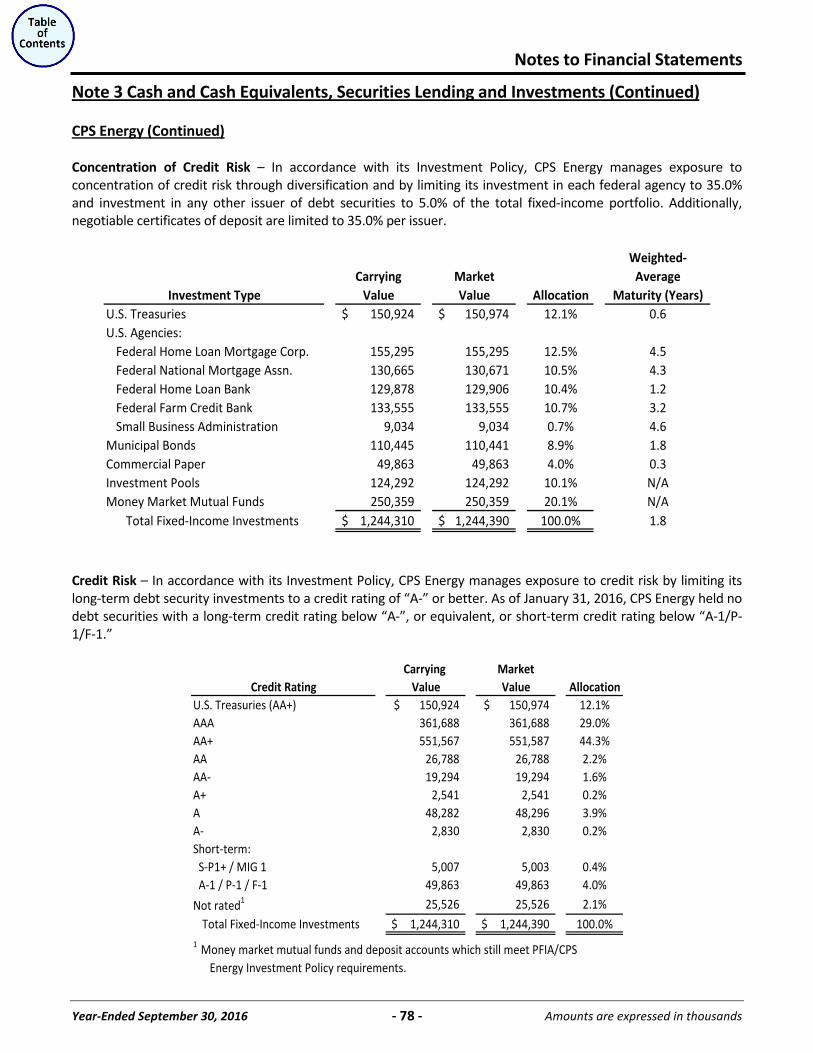
Notes to Financial Statements
Year-Ended September 30, 2016 - 78 - Amounts are expressed in thousands
Note 3 Cash and Cash Equivalents, Securities Lending and Investments (Continued)
CPS Energy (Continued)
Concentration of Credit Risk – In accordance with its Investment Policy, CPS Energy manages exposure to concentration of credit risk through diversification and by limiting its investment in each federal agency to 35.0% and investment in any other issuer of debt securities to 5.0% of the total fixed-income portfolio. Additionally, negotiable certificates of deposit are limited to 35.0% per issuer.
Weighted-Carrying Market Average
Investment Type Value Value Allocation Maturity (Years)U.S. Treasuries 150,924$ 150,974$ 12.1% 0.6U.S. Agencies:
Federal Home Loan Mortgage Corp. 155,295 155,295 12.5% 4.5Federal National Mortgage Assn. 130,665 130,671 10.5% 4.3Federal Home Loan Bank 129,878 129,906 10.4% 1.2Federal Farm Credit Bank 133,555 133,555 10.7% 3.2Small Business Administration 9,034 9,034 0.7% 4.6
Municipal Bonds 110,445 110,441 8.9% 1.8Commercial Paper 49,863 49,863 4.0% 0.3Investment Pools 124,292 124,292 10.1% N/AMoney Market Mutual Funds 250,359 250,359 20.1% N/A
Total Fixed-Income Investments 1,244,310$ 1,244,390$ 100.0% 1.8
Credit Risk – In accordance with its Investment Policy, CPS Energy manages exposure to credit risk by limiting its long-term debt security investments to a credit rating of “A-” or better. As of January 31, 2016, CPS Energy held no debt securities with a long-term credit rating below “A-”, or equivalent, or short-term credit rating below “A-1/P-1/F-1.”
Carrying MarketCredit Rating Value Value Allocation
U.S. Treasuries (AA+) 150,924$ 150,974$ 12.1%AAA 361,688 361,688 29.0%AA+ 551,567 551,587 44.3%AA 26,788 26,788 2.2%AA- 19,294 19,294 1.6%A+ 2,541 2,541 0.2%A 48,282 48,296 3.9%A- 2,830 2,830 0.2%Short-term: S-P1+ / MIG 1 5,007 5,003 0.4% A-1 / P-1 / F-1 49,863 49,863 4.0%
Not rated1 25,526 25,526 2.1%
Total Fixed-Income Investments 1,244,310$ 1,244,390$ 100.0%1 Money market mutual funds and deposit accounts which still meet PFIA/CPS Energy Investment Policy requirements.
Notes to Financial Statements
Year-Ended September 30, 2016 - 79 - Amounts are expressed in thousands
Note 3 Cash and Cash Equivalents, Securities Lending and Investments (Continued)
CPS Energy (Continued)
Decommissioning Trust Investments – As mentioned previously, the Decommissioning Trusts report their assets on a calendar-year basis; therefore, the tables in this section are as of December 31, 2015. These tables address interest rate risk exposure by investment type, credit risk, concentration of credit risk and foreign currency risk. All investments held by the Decommissioning Trusts are long-term in nature and are recorded at fair value. Interest Rate Risk – Generally, the long-term nature of the liabilities and the limited need for daily operating liquidity allow interim fluctuations in market value to occur without jeopardizing the ultimate value of the assets. Where long-term securities are held, the interim market value of assets can be sensitive to changes in interest rates. As the general level of interest rates moves up and down, the interim market value of longer-maturity bonds may change substantially. To mitigate this interest rate risk, a limitation is placed on the weighted-average duration of the fixed-income portfolio. Weighted-average duration is defined as the weighted-average time to return a dollar of principal and interest and also incorporates potential changes in the timing of principal and interest return that may occur as a result of changes in interest rates. It makes assumptions regarding the most likely timing and amounts of variable cash flows and is used as an estimate of the interest rate risk of a fixed-income investment – especially those with payment terms dependent on market interest rates. The overall portfolio duration is limited by the Investment Policy to a deviation of no more than +/- 1.5 years from the weighted-average duration of the Investment Committee’s specified fixed-income index. The specified fixed-income index for the 28% Trust is a blended index that is based on 83.3% Barclays Capital Aggregate, 11.7% Barclays Credit A, and 5.0% Barclays Credit BAA; and the weighted-average duration of that blended index was 5.8 for calendar year 2015. The specified fixed-income index for the 12% Trust is Barclays Capital Aggregate, which was 5.7 for calendar year 2015. Concentration of Credit Risk – In accordance with the Investment Policy, exposure to concentration of credit risk is managed through diversification and by limiting investments in each federal agency to 30.0% and investments in any other single issuer of debt securities to 5.0% of the total fixed-income portfolio (excluding cash collateral from securities lending). Likewise, equity investments are limited to 5.0% of the total portfolio for any one issuer. At December 31, 2015, total other debt securities (corporate and foreign issuers) amounted to 49.4% of the fixed-income portfolio for the 28% Decommissioning Trust and 21.0% for the 12% Decommissioning Trust.
(The remainder of this page left blank intentionally)
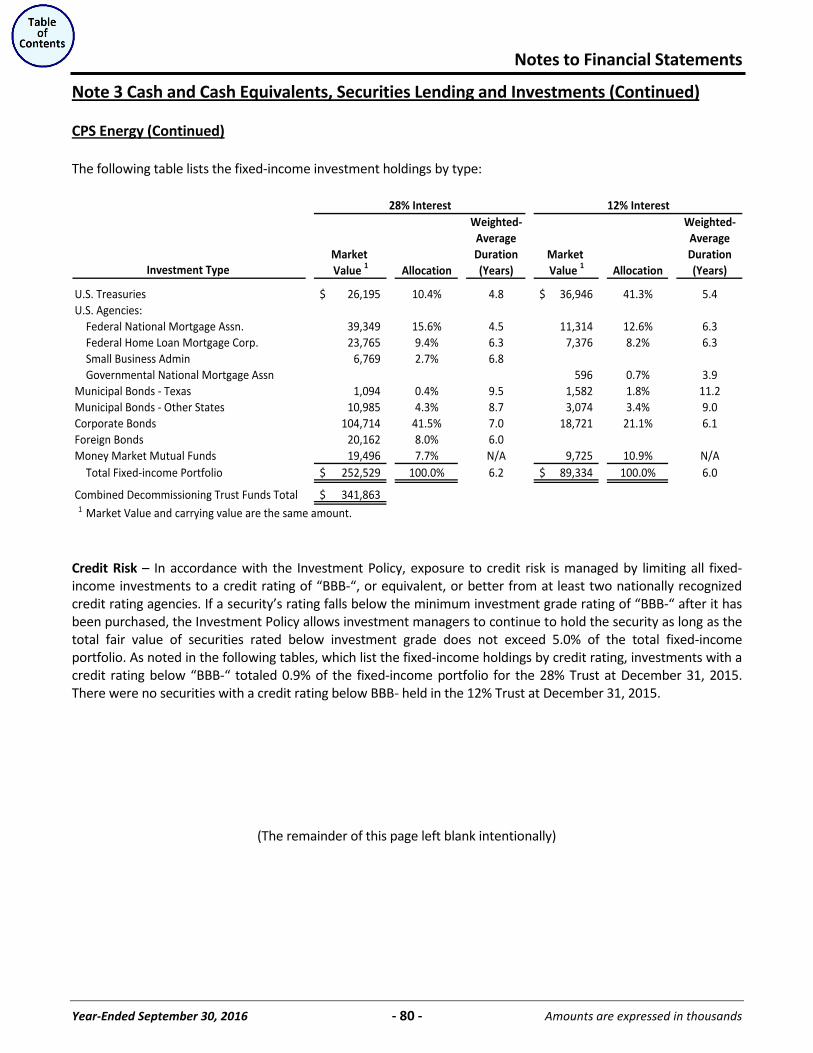
Notes to Financial Statements
Year-Ended September 30, 2016 - 80 - Amounts are expressed in thousands
Note 3 Cash and Cash Equivalents, Securities Lending and Investments (Continued)
CPS Energy (Continued)
The following table lists the fixed-income investment holdings by type:
Weighted- Weighted-Average Average
Market Duration Market DurationValue 1 Allocation (Years) Value 1 Allocation (Years)
U.S. Treasuries 26,195$ 10.4% 4.8 36,946$ 41.3% 5.4U.S. Agencies:
Federal National Mortgage Assn. 39,349 15.6% 4.5 11,314 12.6% 6.3Federal Home Loan Mortgage Corp. 23,765 9.4% 6.3 7,376 8.2% 6.3Small Business Admin 6,769 2.7% 6.8Governmental National Mortgage Assn 596 0.7% 3.9
Municipal Bonds - Texas 1,094 0.4% 9.5 1,582 1.8% 11.2Municipal Bonds - Other States 10,985 4.3% 8.7 3,074 3.4% 9.0Corporate Bonds 104,714 41.5% 7.0 18,721 21.1% 6.1Foreign Bonds 20,162 8.0% 6.0Money Market Mutual Funds 19,496 7.7% N/A 9,725 10.9% N/A
Total Fixed-income Portfolio 252,529$ 100.0% 6.2 89,334$ 100.0% 6.0
Combined Decommissioning Trust Funds Total 341,863$ 1 Market Value and carrying value are the same amount.
Investment Type
28% Interest 12% Interest
Credit Risk – In accordance with the Investment Policy, exposure to credit risk is managed by limiting all fixed-income investments to a credit rating of “BBB-“, or equivalent, or better from at least two nationally recognized credit rating agencies. If a security’s rating falls below the minimum investment grade rating of “BBB-“ after it has been purchased, the Investment Policy allows investment managers to continue to hold the security as long as the total fair value of securities rated below investment grade does not exceed 5.0% of the total fixed-income portfolio. As noted in the following tables, which list the fixed-income holdings by credit rating, investments with a credit rating below “BBB-“ totaled 0.9% of the fixed-income portfolio for the 28% Trust at December 31, 2015. There were no securities with a credit rating below BBB- held in the 12% Trust at December 31, 2015.
(The remainder of this page left blank intentionally)
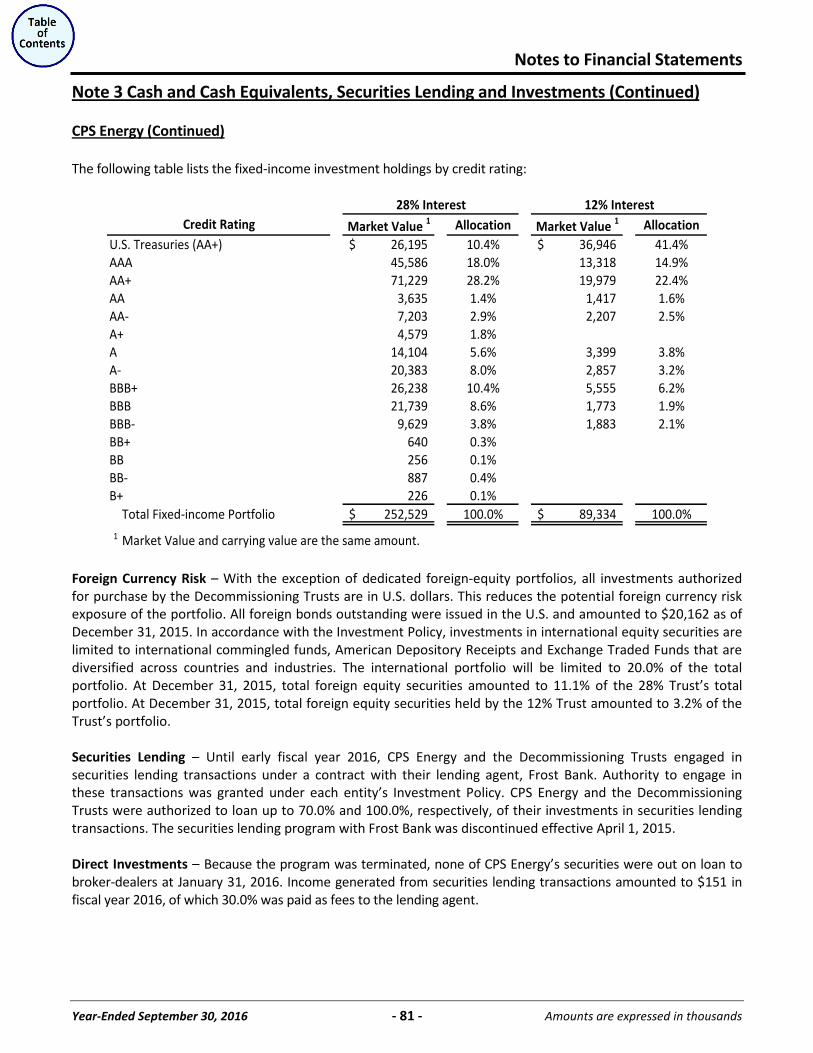
Notes to Financial Statements
Year-Ended September 30, 2016 - 81 - Amounts are expressed in thousands
Note 3 Cash and Cash Equivalents, Securities Lending and Investments (Continued)
CPS Energy (Continued)
The following table lists the fixed-income investment holdings by credit rating:
Market Value 1 Allocation Market Value 1 AllocationU.S. Treasuries (AA+) 26,195$ 10.4% 36,946$ 41.4%AAA 45,586 18.0% 13,318 14.9%AA+ 71,229 28.2% 19,979 22.4%AA 3,635 1.4% 1,417 1.6%AA- 7,203 2.9% 2,207 2.5%A+ 4,579 1.8%A 14,104 5.6% 3,399 3.8%A- 20,383 8.0% 2,857 3.2%BBB+ 26,238 10.4% 5,555 6.2%BBB 21,739 8.6% 1,773 1.9%BBB- 9,629 3.8% 1,883 2.1%BB+ 640 0.3%BB 256 0.1%BB- 887 0.4%B+ 226 0.1%
Total Fixed-income Portfolio 252,529$ 100.0% 89,334$ 100.0%1 Market Value and carrying value are the same amount.
Credit Rating28% Interest 12% Interest
Foreign Currency Risk – With the exception of dedicated foreign-equity portfolios, all investments authorized for purchase by the Decommissioning Trusts are in U.S. dollars. This reduces the potential foreign currency risk exposure of the portfolio. All foreign bonds outstanding were issued in the U.S. and amounted to $20,162 as of December 31, 2015. In accordance with the Investment Policy, investments in international equity securities are limited to international commingled funds, American Depository Receipts and Exchange Traded Funds that are diversified across countries and industries. The international portfolio will be limited to 20.0% of the total portfolio. At December 31, 2015, total foreign equity securities amounted to 11.1% of the 28% Trust’s total portfolio. At December 31, 2015, total foreign equity securities held by the 12% Trust amounted to 3.2% of the Trust’s portfolio. Securities Lending – Until early fiscal year 2016, CPS Energy and the Decommissioning Trusts engaged in securities lending transactions under a contract with their lending agent, Frost Bank. Authority to engage in these transactions was granted under each entity’s Investment Policy. CPS Energy and the Decommissioning Trusts were authorized to loan up to 70.0% and 100.0%, respectively, of their investments in securities lending transactions. The securities lending program with Frost Bank was discontinued effective April 1, 2015. Direct Investments – Because the program was terminated, none of CPS Energy’s securities were out on loan to broker-dealers at January 31, 2016. Income generated from securities lending transactions amounted to $151 in fiscal year 2016, of which 30.0% was paid as fees to the lending agent.
Notes to Financial Statements
Year-Ended September 30, 2016 - 82 - Amounts are expressed in thousands
Note 3 Cash and Cash Equivalents, Securities Lending and Investments (Continued)
CPS Energy (Continued)
Decommissioning Trusts – Because the program was terminated, for the 28% and 12% Decommissioning Trusts at December 31, 2015, none of the Decommissioning Trusts’ securities were out on loan to broker-dealers. Income generated from securities lending transactions for the Decommissioning Trusts’ amounted to $22 and $24, respectively, in calendar year 2015, of which 30.0% was paid as fees to the lending agent. Fair Value Measurement – CPS Energy records assets and liabilities in accordance with GASB Statement No. 72, Fair Value Measurement and Application, which determines fair value, establishes a framework for measuring fair value and expands disclosures about fair value measurement. Valuation methods of the primary fair value measurements disclosed below are as follows: The majority of investments in equity securities are valued using Level 1 measurements. Investments in equity securities are typically valued at the closing price in the principal active market. For equity securities, these markets include published exchanges such as the National Association of Securities Dealers Automated Quotations and the New York Stock Exchange. Foreign equity prices are translated from their trading currency using the currency exchange rate in effect at the close of the principal active market. Most investments in debt securities are valued using Level 2 measurements because the valuations use interest rate curves and credit spreads applied to the terms of the debt instrument (maturity and coupon interest rate) and consider the counterparty credit rating. Commodity derivatives, such as futures, swaps and options, which are ultimately settled using prices at locations quoted through clearinghouses are valued using Level 1 inputs. Options included in this category are those with identical strike price quoted through a clearinghouse. Other commodity derivatives, such as swaps settled using prices at locations other than those quoted through clearinghouses and options with strike prices not identically quoted through a clearinghouse, are valued using Level 2 inputs. For these instruments, fair value is based on internally developed pricing algorithms using observable market quotes for similar derivatives. Pricing inputs are derived from published exchange transactions and other observable data sources.
Financial assets and liabilities are classified in their entirety based on the lowest level of input that is significant to the fair value measurement. CPS Energy’s assessment of the significance of a particular input to the fair value measurement requires judgment and may affect the valuation of fair value assets and liabilities and their place within the fair value hierarchy levels. CPS Energy’s fair value measurements are performed on a recurring basis. The table on the following page presents fair value balances and their levels within the fair value hierarchy as of January 31, 2016. The CPS Energy and Decommissioning Trusts investment balances presented exclude amounts related to money market mutual fund investments, and short-term investments which are recorded at amortized cost. Financial instrument fair value balances are presented in Note 13 Risk Financing.
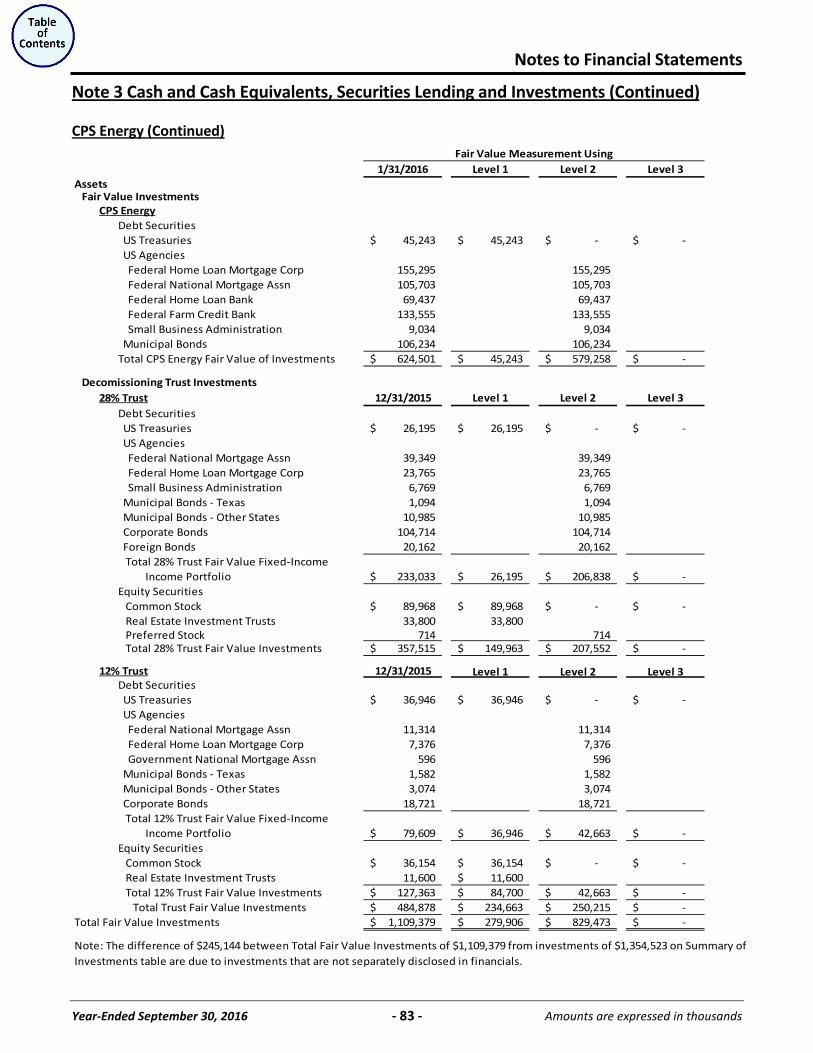
Notes to Financial Statements
Year-Ended September 30, 2016 - 83 - Amounts are expressed in thousands
Note 3 Cash and Cash Equivalents, Securities Lending and Investments (Continued)
1/31/2016 Level 1 Level 2 Level 3Assets Fair Value Investments
CPS EnergyDebt Securities US Treasuries 45,243$ 45,243$ -$ -$ US Agencies Federal Home Loan Mortgage Corp 155,295 155,295 Federal National Mortgage Assn 105,703 105,703 Federal Home Loan Bank 69,437 69,437 Federal Farm Credit Bank 133,555 133,555 Small Business Administration 9,034 9,034 Municipal Bonds 106,234 106,234 Total CPS Energy Fair Value of Investments 624,501$ 45,243$ 579,258$ -$
Decomissioning Trust Investments28% Trust 12/31/2015 Level 1 Level 2 Level 3
Debt Securities US Treasuries 26,195$ 26,195$ -$ -$ US Agencies Federal National Mortgage Assn 39,349 39,349 Federal Home Loan Mortgage Corp 23,765 23,765 Small Business Administration 6,769 6,769 Municipal Bonds - Texas 1,094 1,094 Municipal Bonds - Other States 10,985 10,985 Corporate Bonds 104,714 104,714 Foreign Bonds 20,162 20,162 Total 28% Trust Fair Value Fixed-Income Income Portfolio 233,033$ 26,195$ 206,838$ -$ Equity Securities Common Stock 89,968$ 89,968$ -$ -$ Real Estate Investment Trusts 33,800 33,800 Preferred Stock 714 714 Total 28% Trust Fair Value Investments 357,515$ 149,963$ 207,552$ -$
12% Trust 12/31/2015 Level 1 Level 2 Level 3Debt Securities US Treasuries 36,946$ 36,946$ -$ -$ US Agencies Federal National Mortgage Assn 11,314 11,314 Federal Home Loan Mortgage Corp 7,376 7,376 Government National Mortgage Assn 596 596 Municipal Bonds - Texas 1,582 1,582 Municipal Bonds - Other States 3,074 3,074 Corporate Bonds 18,721 18,721 Total 12% Trust Fair Value Fixed-Income Income Portfolio 79,609$ 36,946$ 42,663$ -$ Equity Securities Common Stock 36,154$ 36,154$ -$ -$ Real Estate Investment Trusts 11,600 11,600$ Total 12% Trust Fair Value Investments 127,363$ 84,700$ 42,663$ -$ Total Trust Fair Value Investments 484,878$ 234,663$ 250,215$ -$
Total Fair Value Investments 1,109,379$ 279,906$ 829,473$ -$
Fair Value Measurement Using
Note: The difference of $245,144 between Total Fair Value Investments of $1,109,379 from investments of $1,354,523 on Summary of Investments table are due to investments that are not separately disclosed in financials.
CPS Energy (Continued)
Notes to Financial Statements
Year-Ended September 30, 2016 - 84 - Amounts are expressed in thousands
Note 3 Cash and Cash Equivalents, Securities Lending and Investments (Continued)
San Antonio Water System (SAWS)
SAWS is permitted by City Ordinance No. 75686, SAWS’ Investment Policy, and Texas state law, to invest in direct obligations of the U.S. or its agencies and instrumentalities. Other allowable investments include direct obligations of the State of Texas or its agencies and instrumentalities; secured certificates of deposit issued by depository institutions that have their main office or a branch office in the State of Texas; defined bankers acceptances and commercial paper; collateralized direct repurchase agreements, reverse repurchase agreements; no-load money market mutual funds; investment pools; municipal bonds; and other types of secured or guaranteed investments. These investments are subject to market risk, interest rate risk, and credit risk, which may affect the value at which these investments are recorded. Under the provisions of GASB Statement No. 31, money market investments, including U.S. Treasury and agency obligations, with a remaining maturity at time of purchase of one year or less are reported at amortized cost, which approximates fair value. Investments other than money market investments are reported at fair value which is based on quoted market prices or quotes from bond broker dealers. A summary of SAWS cash, cash equivalents, and investments can be found at the beginning of Note 3. SAWS has not adopted the new accounting guidance, GASB Statement No. 72, Fair Value Measurement and Application. SAWS will adopt Statement No. 72 in their fiscal year 2016. Custodial Credit Risk (Deposit) – All funds are deposited in demand and savings accounts at Frost Bank, SAWS’ general depository bank. As required by state law, all deposits are fully collateralized and/or are covered by federal depository insurance. At December 31, 2015, the collateral pledged is being held by the Federal Reserve Bank of Boston under SAWS’ name so SAWS incurs no custodial credit risk. As of December 31, 2015, the bank balance of demand and savings account was $52,393 and the reported amount was $50,693 which included $30 of cash on hand. Custodial Credit Risk (Investment) – Investments include securities issued by the United States government and its agencies and instrumentalities along with municipal bonds and funds held in escrow. Securities issued by the U.S. government and its agencies and instrumentalities along with municipal bonds are held in safekeeping by SAWS’ depository bank, Frost Bank and registered as securities of SAWS. Funds held in escrow are Money Market Funds managed by Frost Bank and Bank of New York Mellon and are invested in securities issued by the U.S. government or by U.S. Agencies. Securities Lending – During a portion of 2015, SAWS engaged in securities lending transactions under a contract with its lending agent, Frost Bank. Authority to engage in these transactions is authorized under the Texas Public Funds Investment Act (PFIA) and SAWS Investment Policy. SAWS authorized Frost Bank to loan up to 100.0% of the par value of its eligible investments in securities lending transactions. On March 31, 2015, Frost Bank terminated its security lending program.
GASB Statement No. 28, Accounting and Financial Reporting for Securities Lending Transactions, provides guidance for reporting and disclosing securities lending transactions. This guidance includes reporting securities lending collateral on the Statement of Net Position as an asset, with a corresponding liability for the obligation to repay the collateral.
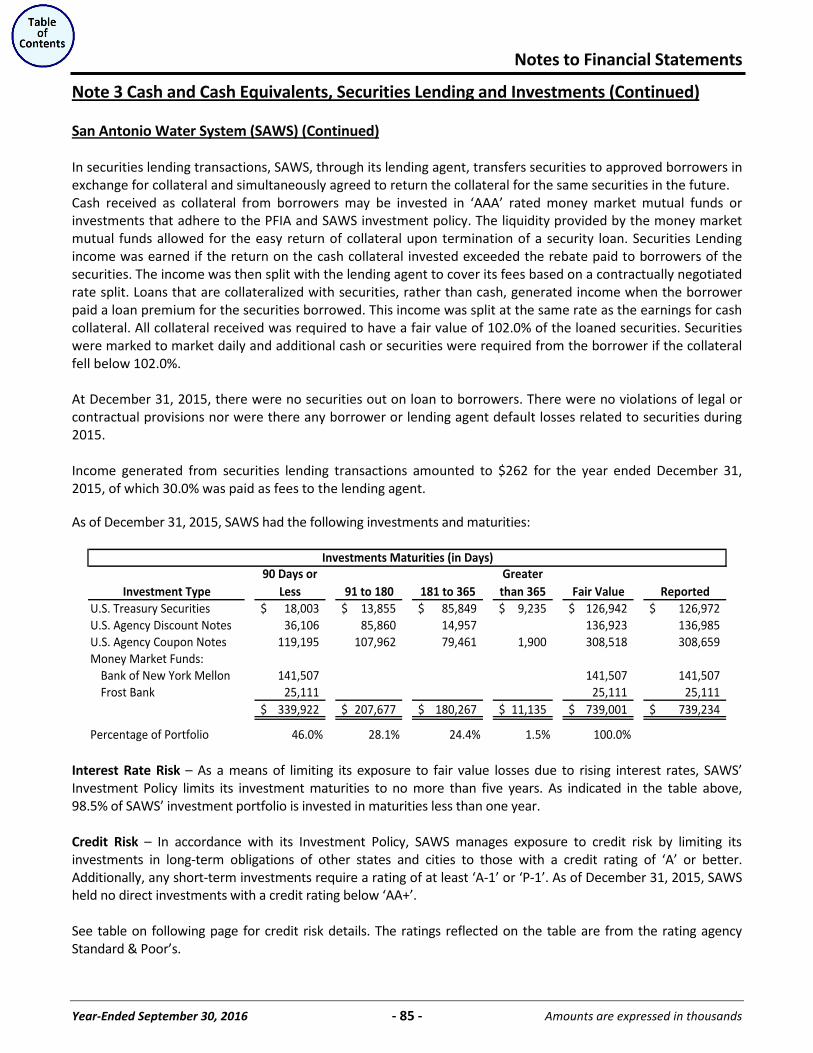
Notes to Financial Statements
Year-Ended September 30, 2016 - 85 - Amounts are expressed in thousands
Note 3 Cash and Cash Equivalents, Securities Lending and Investments (Continued)
San Antonio Water System (SAWS) (Continued)
In securities lending transactions, SAWS, through its lending agent, transfers securities to approved borrowers in exchange for collateral and simultaneously agreed to return the collateral for the same securities in the future. Cash received as collateral from borrowers may be invested in ‘AAA’ rated money market mutual funds or investments that adhere to the PFIA and SAWS investment policy. The liquidity provided by the money market mutual funds allowed for the easy return of collateral upon termination of a security loan. Securities Lending income was earned if the return on the cash collateral invested exceeded the rebate paid to borrowers of the securities. The income was then split with the lending agent to cover its fees based on a contractually negotiated rate split. Loans that are collateralized with securities, rather than cash, generated income when the borrower paid a loan premium for the securities borrowed. This income was split at the same rate as the earnings for cash collateral. All collateral received was required to have a fair value of 102.0% of the loaned securities. Securities were marked to market daily and additional cash or securities were required from the borrower if the collateral fell below 102.0%. At December 31, 2015, there were no securities out on loan to borrowers. There were no violations of legal or contractual provisions nor were there any borrower or lending agent default losses related to securities during 2015. Income generated from securities lending transactions amounted to $262 for the year ended December 31, 2015, of which 30.0% was paid as fees to the lending agent. As of December 31, 2015, SAWS had the following investments and maturities:
Investment Type90 Days or
Less 91 to 180 181 to 365Greater
than 365 Fair Value ReportedU.S. Treasury Securities 18,003$ 13,855$ 85,849$ 9,235$ 126,942$ 126,972$ U.S. Agency Discount Notes 36,106 85,860 14,957 136,923 136,985 U.S. Agency Coupon Notes 119,195 107,962 79,461 1,900 308,518 308,659 Money Market Funds:
Bank of New York Mellon 141,507 141,507 141,507 Frost Bank 25,111 25,111 25,111
339,922$ 207,677$ 180,267$ 11,135$ 739,001$ 739,234$
Percentage of Portfolio 46.0% 28.1% 24.4% 1.5% 100.0%
Investments Maturities (in Days)
Interest Rate Risk – As a means of limiting its exposure to fair value losses due to rising interest rates, SAWS’ Investment Policy limits its investment maturities to no more than five years. As indicated in the table above, 98.5% of SAWS’ investment portfolio is invested in maturities less than one year. Credit Risk – In accordance with its Investment Policy, SAWS manages exposure to credit risk by limiting its investments in long-term obligations of other states and cities to those with a credit rating of ‘A’ or better. Additionally, any short-term investments require a rating of at least ‘A-1’ or ‘P-1’. As of December 31, 2015, SAWS held no direct investments with a credit rating below ‘AA+’. See table on following page for credit risk details. The ratings reflected on the table are from the rating agency Standard & Poor’s.
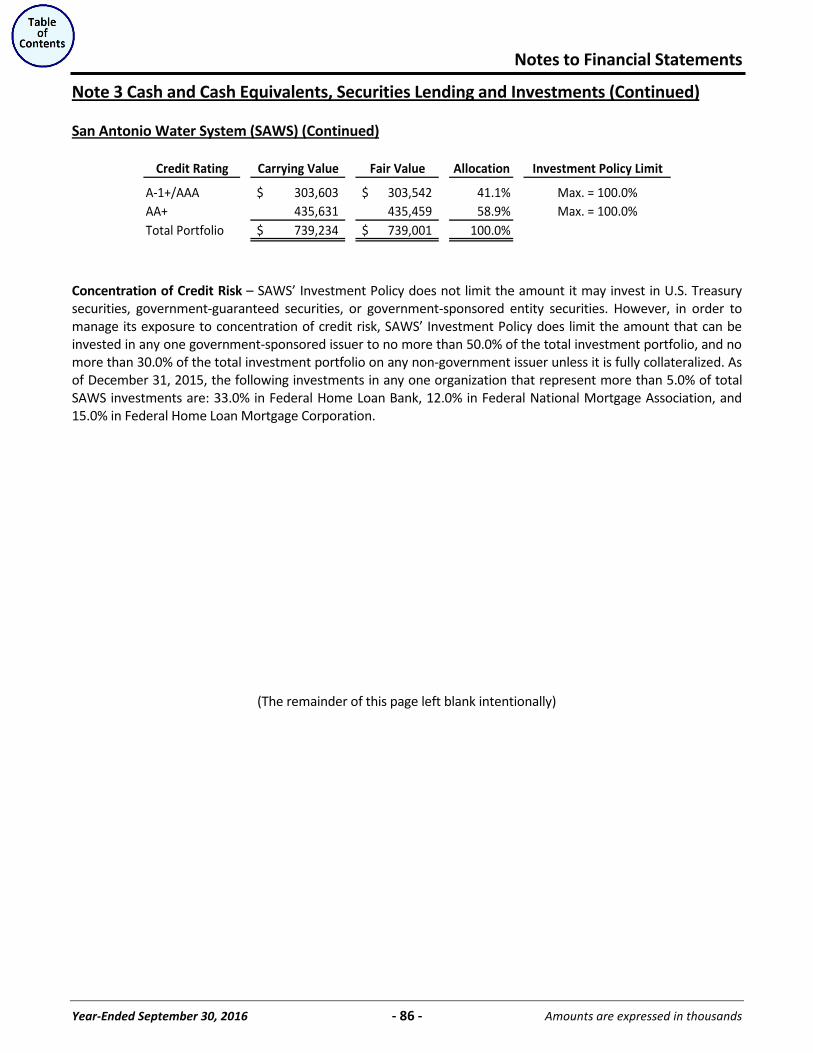
Notes to Financial Statements
Year-Ended September 30, 2016 - 86 - Amounts are expressed in thousands
Note 3 Cash and Cash Equivalents, Securities Lending and Investments (Continued)
San Antonio Water System (SAWS) (Continued)
Credit Rating Carrying Value Fair Value Allocation Investment Policy Limit
A-1+/AAA 303,603$ 303,542$ 41.1% Max. = 100.0%AA+ 435,631 435,459 58.9% Max. = 100.0%Total Portfolio 739,234$ 739,001$ 100.0%
Concentration of Credit Risk – SAWS’ Investment Policy does not limit the amount it may invest in U.S. Treasury securities, government-guaranteed securities, or government-sponsored entity securities. However, in order to manage its exposure to concentration of credit risk, SAWS’ Investment Policy does limit the amount that can be invested in any one government-sponsored issuer to no more than 50.0% of the total investment portfolio, and no more than 30.0% of the total investment portfolio on any non-government issuer unless it is fully collateralized. As of December 31, 2015, the following investments in any one organization that represent more than 5.0% of total SAWS investments are: 33.0% in Federal Home Loan Bank, 12.0% in Federal National Mortgage Association, and 15.0% in Federal Home Loan Mortgage Corporation.
(The remainder of this page left blank intentionally)
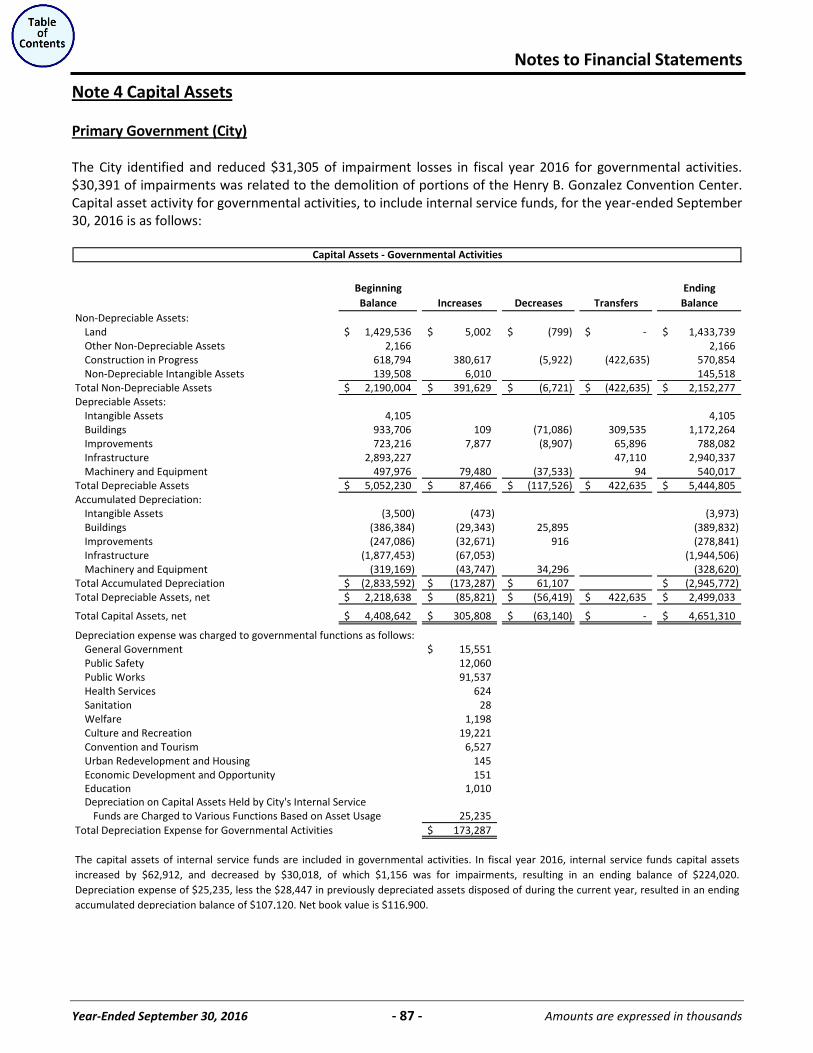
Notes to Financial Statements
Year-Ended September 30, 2016 - 87 - Amounts are expressed in thousands
Note 4 Capital Assets
Primary Government (City)
The City identified and reduced $31,305 of impairment losses in fiscal year 2016 for governmental activities. $30,391 of impairments was related to the demolition of portions of the Henry B. Gonzalez Convention Center. Capital asset activity for governmental activities, to include internal service funds, for the year-ended September 30, 2016 is as follows:
Beginning EndingBalance Increases Decreases Transfers Balance
Non-Depreciable Assets:Land 1,429,536$ 5,002$ (799)$ -$ 1,433,739$ Other Non-Depreciable Assets 2,166 2,166 Construction in Progress 618,794 380,617 (5,922) (422,635) 570,854 Non-Depreciable Intangible Assets 139,508 6,010 145,518
Total Non-Depreciable Assets 2,190,004$ 391,629$ (6,721)$ (422,635)$ 2,152,277$ Depreciable Assets:
Intangible Assets 4,105 4,105 Buildings 933,706 109 (71,086) 309,535 1,172,264 Improvements 723,216 7,877 (8,907) 65,896 788,082 Infrastructure 2,893,227 47,110 2,940,337 Machinery and Equipment 497,976 79,480 (37,533) 94 540,017
Total Depreciable Assets 5,052,230$ 87,466$ (117,526)$ 422,635$ 5,444,805$ Accumulated Depreciation:
Intangible Assets (3,500) (473) (3,973) Buildings (386,384) (29,343) 25,895 (389,832) Improvements (247,086) (32,671) 916 (278,841) Infrastructure (1,877,453) (67,053) (1,944,506) Machinery and Equipment (319,169) (43,747) 34,296 (328,620)
Total Accumulated Depreciation (2,833,592)$ (173,287)$ 61,107$ (2,945,772)$ Total Depreciable Assets, net 2,218,638$ (85,821)$ (56,419)$ 422,635$ 2,499,033$
Total Capital Assets, net 4,408,642$ 305,808$ (63,140)$ -$ 4,651,310$
Depreciation expense was charged to governmental functions as follows:General Government 15,551$ Public Safety 12,060 Public Works 91,537 Health Services 624 Sanitation 28 Welfare 1,198 Culture and Recreation 19,221 Convention and Tourism 6,527 Urban Redevelopment and Housing 145 Economic Development and Opportunity 151 Education 1,010 Depreciation on Capital Assets Held by City's Internal Service
Funds are Charged to Various Functions Based on Asset Usage 25,235 Total Depreciation Expense for Governmental Activities 173,287$
Capital Assets - Governmental Activities
The capital assets of internal service funds are included in governmental activities. In fiscal year 2016, internal service funds capital assetsincreased by $62,912, and decreased by $30,018, of which $1,156 was for impairments, resulting in an ending balance of $224,020.Depreciation expense of $25,235, less the $28,447 in previously depreciated assets disposed of during the current year, resulted in an endingaccumulated depreciation balance of $107,120. Net book value is $116,900.
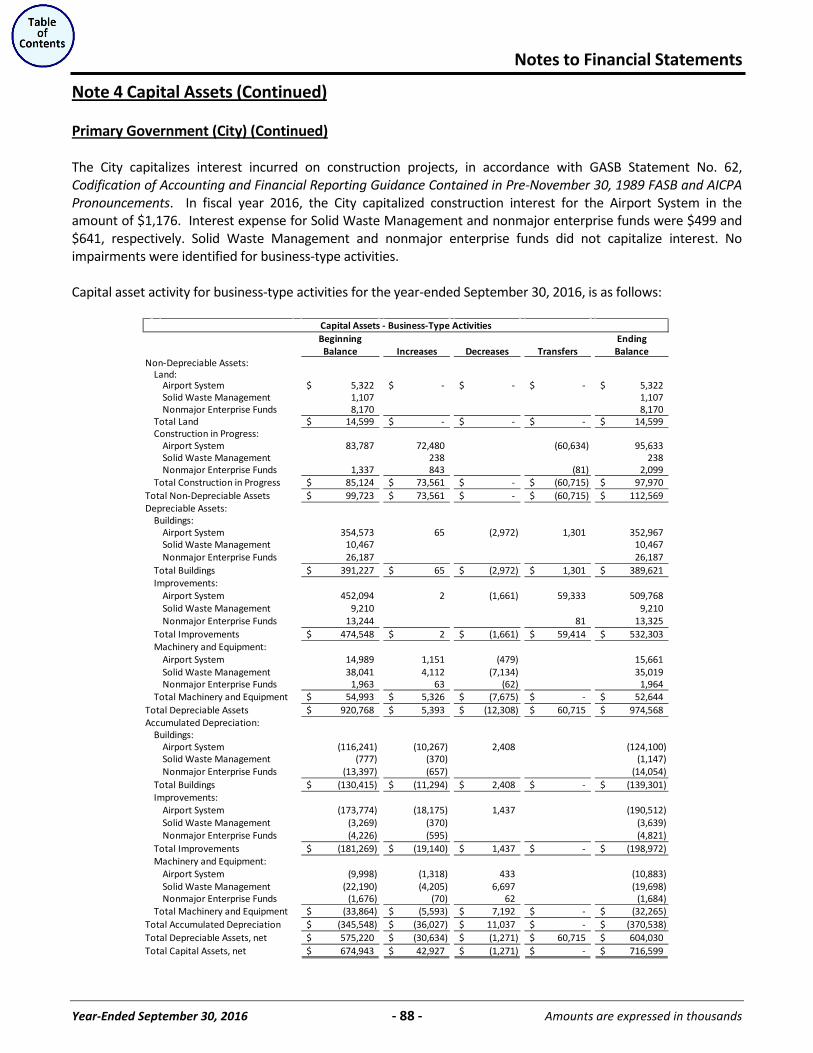
Notes to Financial Statements
Year-Ended September 30, 2016 - 88 - Amounts are expressed in thousands
Note 4 Capital Assets (Continued)
Primary Government (City) (Continued)
The City capitalizes interest incurred on construction projects, in accordance with GASB Statement No. 62, Codification of Accounting and Financial Reporting Guidance Contained in Pre-November 30, 1989 FASB and AICPA Pronouncements. In fiscal year 2016, the City capitalized construction interest for the Airport System in the amount of $1,176. Interest expense for Solid Waste Management and nonmajor enterprise funds were $499 and $641, respectively. Solid Waste Management and nonmajor enterprise funds did not capitalize interest. No impairments were identified for business-type activities. Capital asset activity for business-type activities for the year-ended September 30, 2016, is as follows:
Beginning EndingBalance Increases Decreases Transfers Balance
Non-Depreciable Assets:Land:
Airport System 5,322$ -$ -$ -$ 5,322$ Solid Waste Management 1,107 1,107 Nonmajor Enterprise Funds 8,170 8,170
Total Land 14,599$ -$ -$ -$ 14,599$ Construction in Progress:
Airport System 83,787 72,480 (60,634) 95,633 Solid Waste Management 238 238 Nonmajor Enterprise Funds 1,337 843 (81) 2,099
Total Construction in Progress 85,124$ 73,561$ -$ (60,715)$ 97,970$ Total Non-Depreciable Assets 99,723$ 73,561$ -$ (60,715)$ 112,569$ Depreciable Assets:
Buildings:Airport System 354,573 65 (2,972) 1,301 352,967 Solid Waste Management 10,467 10,467 Nonmajor Enterprise Funds 26,187 26,187
Total Buildings 391,227$ 65$ (2,972)$ 1,301$ 389,621$ Improvements:
Airport System 452,094 2 (1,661) 59,333 509,768 Solid Waste Management 9,210 9,210 Nonmajor Enterprise Funds 13,244 81 13,325
Total Improvements 474,548$ 2$ (1,661)$ 59,414$ 532,303$ Machinery and Equipment:
Airport System 14,989 1,151 (479) 15,661 Solid Waste Management 38,041 4,112 (7,134) 35,019 Nonmajor Enterprise Funds 1,963 63 (62) 1,964
Total Machinery and Equipment 54,993$ 5,326$ (7,675)$ -$ 52,644$ Total Depreciable Assets 920,768$ 5,393$ (12,308)$ 60,715$ 974,568$ Accumulated Depreciation:
Buildings:Airport System (116,241) (10,267) 2,408 (124,100) Solid Waste Management (777) (370) (1,147) Nonmajor Enterprise Funds (13,397) (657) (14,054)
Total Buildings (130,415)$ (11,294)$ 2,408$ -$ (139,301)$ Improvements:
Airport System (173,774) (18,175) 1,437 (190,512) Solid Waste Management (3,269) (370) (3,639) Nonmajor Enterprise Funds (4,226) (595) (4,821)
Total Improvements (181,269)$ (19,140)$ 1,437$ -$ (198,972)$ Machinery and Equipment:
Airport System (9,998) (1,318) 433 (10,883) Solid Waste Management (22,190) (4,205) 6,697 (19,698) Nonmajor Enterprise Funds (1,676) (70) 62 (1,684)
Total Machinery and Equipment (33,864)$ (5,593)$ 7,192$ -$ (32,265)$ Total Accumulated Depreciation (345,548)$ (36,027)$ 11,037$ -$ (370,538)$ Total Depreciable Assets, net 575,220$ (30,634)$ (1,271)$ 60,715$ 604,030$ Total Capital Assets, net 674,943$ 42,927$ (1,271)$ -$ 716,599$
Capital Assets - Business-Type Activities
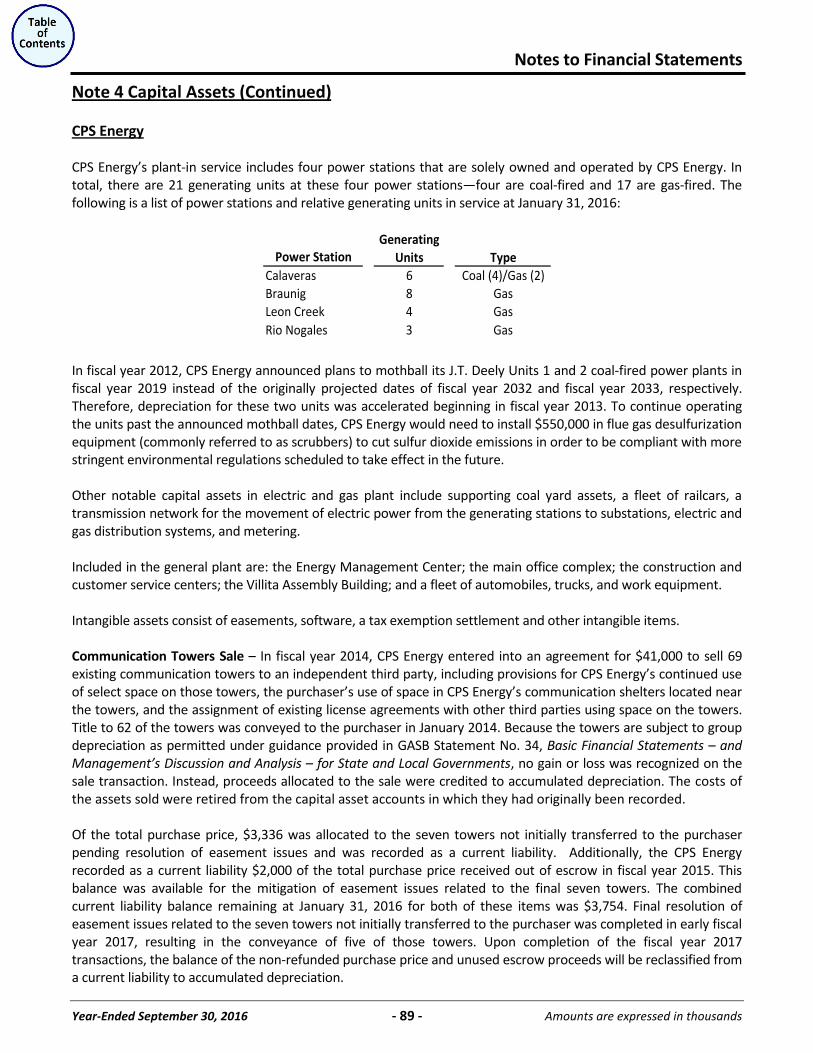
Notes to Financial Statements
Year-Ended September 30, 2016 - 89 - Amounts are expressed in thousands
Note 4 Capital Assets (Continued) CPS Energy CPS Energy’s plant-in service includes four power stations that are solely owned and operated by CPS Energy. In total, there are 21 generating units at these four power stations—four are coal-fired and 17 are gas-fired. The following is a list of power stations and relative generating units in service at January 31, 2016:
GeneratingUnits Type
Calaveras 6 Coal (4)/Gas (2)Braunig 8 GasLeon Creek 4 GasRio Nogales 3 Gas
Power Station
In fiscal year 2012, CPS Energy announced plans to mothball its J.T. Deely Units 1 and 2 coal-fired power plants in fiscal year 2019 instead of the originally projected dates of fiscal year 2032 and fiscal year 2033, respectively. Therefore, depreciation for these two units was accelerated beginning in fiscal year 2013. To continue operating the units past the announced mothball dates, CPS Energy would need to install $550,000 in flue gas desulfurization equipment (commonly referred to as scrubbers) to cut sulfur dioxide emissions in order to be compliant with more stringent environmental regulations scheduled to take effect in the future. Other notable capital assets in electric and gas plant include supporting coal yard assets, a fleet of railcars, a transmission network for the movement of electric power from the generating stations to substations, electric and gas distribution systems, and metering. Included in the general plant are: the Energy Management Center; the main office complex; the construction and customer service centers; the Villita Assembly Building; and a fleet of automobiles, trucks, and work equipment. Intangible assets consist of easements, software, a tax exemption settlement and other intangible items. Communication Towers Sale – In fiscal year 2014, CPS Energy entered into an agreement for $41,000 to sell 69 existing communication towers to an independent third party, including provisions for CPS Energy’s continued use of select space on those towers, the purchaser’s use of space in CPS Energy’s communication shelters located near the towers, and the assignment of existing license agreements with other third parties using space on the towers. Title to 62 of the towers was conveyed to the purchaser in January 2014. Because the towers are subject to group depreciation as permitted under guidance provided in GASB Statement No. 34, Basic Financial Statements – and Management’s Discussion and Analysis – for State and Local Governments, no gain or loss was recognized on the sale transaction. Instead, proceeds allocated to the sale were credited to accumulated depreciation. The costs of the assets sold were retired from the capital asset accounts in which they had originally been recorded. Of the total purchase price, $3,336 was allocated to the seven towers not initially transferred to the purchaser pending resolution of easement issues and was recorded as a current liability. Additionally, the CPS Energy recorded as a current liability $2,000 of the total purchase price received out of escrow in fiscal year 2015. This balance was available for the mitigation of easement issues related to the final seven towers. The combined current liability balance remaining at January 31, 2016 for both of these items was $3,754. Final resolution of easement issues related to the seven towers not initially transferred to the purchaser was completed in early fiscal year 2017, resulting in the conveyance of five of those towers. Upon completion of the fiscal year 2017 transactions, the balance of the non-refunded purchase price and unused escrow proceeds will be reclassified from a current liability to accumulated depreciation.
Notes to Financial Statements
Year-Ended September 30, 2016 - 90 - Amounts are expressed in thousands
Note 4 Capital Assets (Continued) CPS Energy (Continued) Plant Purchase – In the first quarter of fiscal year 2013, taxable senior lien bonds were issued to purchase the Rio Nogales combined-cycle natural gas electric generating plant in Seguin, Texas. The 800-MW plant was being utilized to provide a portion of its power to a third party that had executed a multiyear agreement, which expired September 2015, for an option to call on power from the plant. Any remaining power is available for CPS Energy to sell into the ERCOT market or to utilize to meet its commitments. As of February 1, 2016, CPS Energy integrated the Rio Nogales plant into its rate base to provide generation capacity that will not otherwise be available once J.T. Deely Units 1 and 2 are mothballed. In conjunction with the purchase, CPS Energy entered into a Tax Exemption Settlement Agreement in which CPS Energy agreed to pay $25,504 to certain parties to compromise, terminate claims and settle any disputes relating to exemption of ad valorem taxes involving the parties to this agreement. The payment was recorded as an intangible asset that will be amortized over the life of the agreement, which runs through December 2041. The purchase price of the Rio Nogales plant was allocated to major subsets of assets including land, transmission lines, water treatment facilities, combustion and steam turbines, and switchyard assets. Other than the plant assets, the tax exemption settlement and normal working capital settlements, CPS Energy incurred no other material acquisition costs, nor did CPS Energy assume any material liabilities with the purchase of the plant. Impairments – On October 29, 2007, CPS Energy Board of Trustees approved a resolution enabling CPS Energy to participate in development activities related to new nuclear generation units to be constructed near Bay City, Texas, on a site where STP Units 1 and 2 currently operate. These generation units are referred to as STP Units 3 and 4. At January 31, 2010, CPS Energy held a 50.0% interest in the development. As a result of a litigation settlement with CPS Energy’s partner in the project, Nuclear Innovation North America, Inc. (NINA), CPS Energy’s ownership in STP Units 3 and 4 was reduced from 50.0% to 7.6% effective March 1, 2010. Effective fiscal year 2012, AFUDC is not being recorded for the STP Units 3 and 4 project since efforts have been limited primarily to licensing-related activities. Including AFUDC of $20,975, project costs incurred by CPS Energy to date of $391,417 were previously recorded as construction in progress. In fiscal year 2016, CPS Energy reached the conclusion that STP Units 3 and 4 project had experienced a permanent impairment, and the full investment was written off. The impairment loss was recorded as an extraordinary item on CPS Energy’s Statements of Revenues, Expenses, and Changes in Net Position. For more detailed information on STP Units 3 and 4, see Note 10 CPS Energy South Texas Project, and Note 17 Other Disclosures.
(The remainder of this page left blank intentionally)
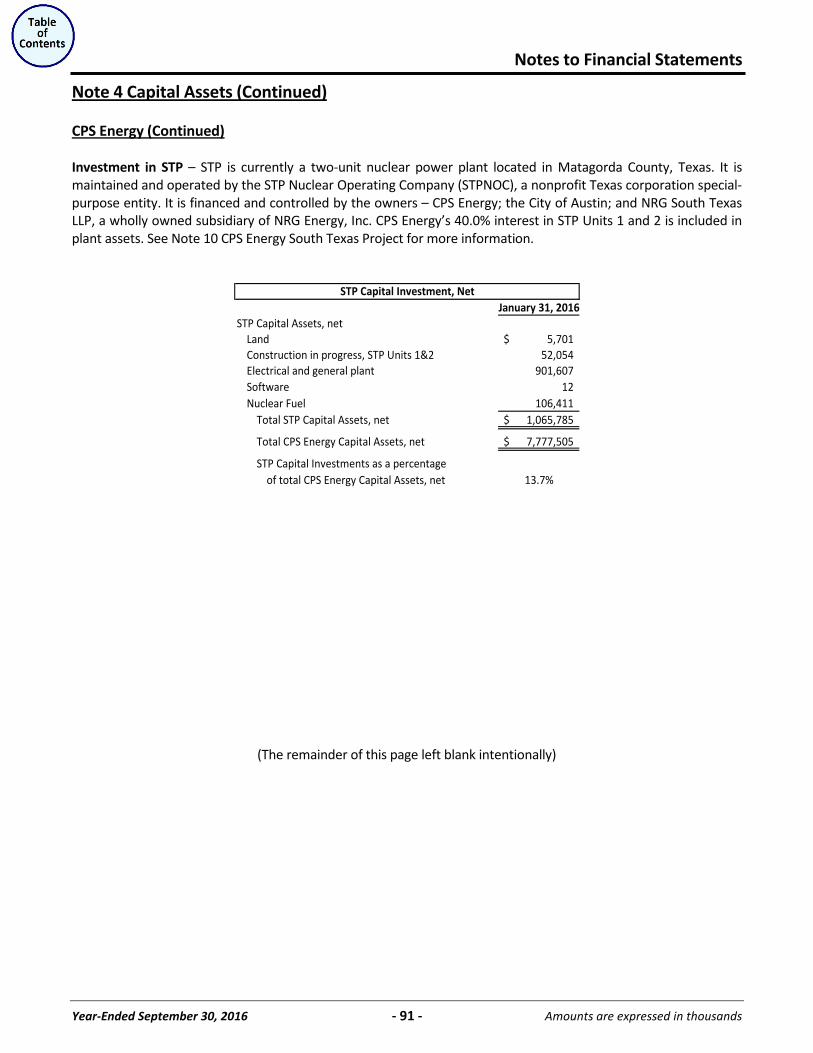
Notes to Financial Statements
Year-Ended September 30, 2016 - 91 - Amounts are expressed in thousands
Note 4 Capital Assets (Continued) CPS Energy (Continued) Investment in STP – STP is currently a two-unit nuclear power plant located in Matagorda County, Texas. It is maintained and operated by the STP Nuclear Operating Company (STPNOC), a nonprofit Texas corporation special-purpose entity. It is financed and controlled by the owners – CPS Energy; the City of Austin; and NRG South Texas LLP, a wholly owned subsidiary of NRG Energy, Inc. CPS Energy’s 40.0% interest in STP Units 1 and 2 is included in plant assets. See Note 10 CPS Energy South Texas Project for more information.
January 31, 2016STP Capital Assets, net
Land 5,701$ Construction in progress, STP Units 1&2 52,054 Electrical and general plant 901,607 Software 12 Nuclear Fuel 106,411
Total STP Capital Assets, net 1,065,785$
Total CPS Energy Capital Assets, net 7,777,505$
STP Capital Investments as a percentageof total CPS Energy Capital Assets, net 13.7%
STP Capital Investment, Net
(The remainder of this page left blank intentionally)
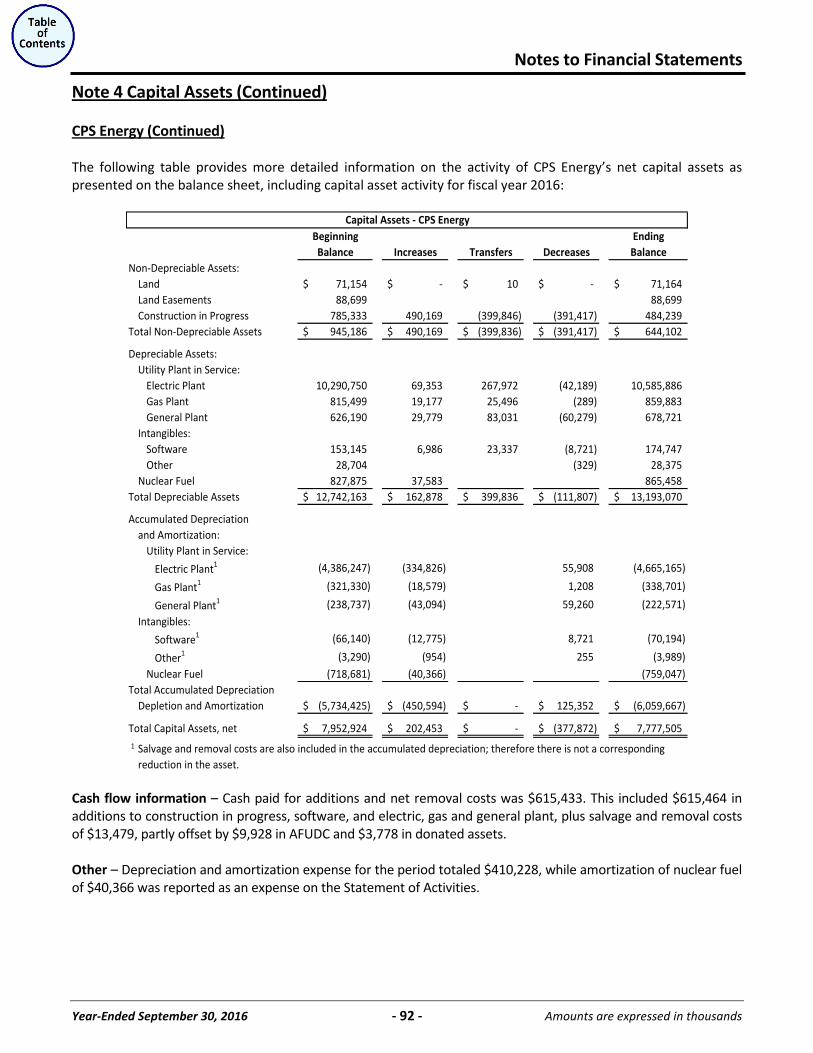
Notes to Financial Statements
Year-Ended September 30, 2016 - 92 - Amounts are expressed in thousands
Note 4 Capital Assets (Continued) CPS Energy (Continued) The following table provides more detailed information on the activity of CPS Energy’s net capital assets as presented on the balance sheet, including capital asset activity for fiscal year 2016:
Beginning EndingBalance Increases Transfers Decreases Balance
Non-Depreciable Assets:Land 71,154$ -$ 10$ -$ 71,164$ Land Easements 88,699 88,699 Construction in Progress 785,333 490,169 (399,846) (391,417) 484,239
Total Non-Depreciable Assets 945,186$ 490,169$ (399,836)$ (391,417)$ 644,102$
Depreciable Assets:Utility Plant in Service:
Electric Plant 10,290,750 69,353 267,972 (42,189) 10,585,886 Gas Plant 815,499 19,177 25,496 (289) 859,883 General Plant 626,190 29,779 83,031 (60,279) 678,721
Intangibles:Software 153,145 6,986 23,337 (8,721) 174,747 Other 28,704 (329) 28,375
Nuclear Fuel 827,875 37,583 865,458 Total Depreciable Assets 12,742,163$ 162,878$ 399,836$ (111,807)$ 13,193,070$
Accumulated Depreciationand Amortization:
Utility Plant in Service:
Electric Plant1 (4,386,247) (334,826) 55,908 (4,665,165)
Gas Plant1 (321,330) (18,579) 1,208 (338,701)
General Plant1 (238,737) (43,094) 59,260 (222,571) Intangibles:
Software1 (66,140) (12,775) 8,721 (70,194)
Other1 (3,290) (954) 255 (3,989) Nuclear Fuel (718,681) (40,366) (759,047)
Total Accumulated DepreciationDepletion and Amortization (5,734,425)$ (450,594)$ -$ 125,352$ (6,059,667)$
Total Capital Assets, net 7,952,924$ 202,453$ -$ (377,872)$ 7,777,505$ 1
Capital Assets - CPS Energy
Salvage and removal costs are also included in the accumulated depreciation; therefore there is not a corresponding reduction in the asset.
Cash flow information – Cash paid for additions and net removal costs was $615,433. This included $615,464 in additions to construction in progress, software, and electric, gas and general plant, plus salvage and removal costs of $13,479, partly offset by $9,928 in AFUDC and $3,778 in donated assets. Other – Depreciation and amortization expense for the period totaled $410,228, while amortization of nuclear fuel of $40,366 was reported as an expense on the Statement of Activities.
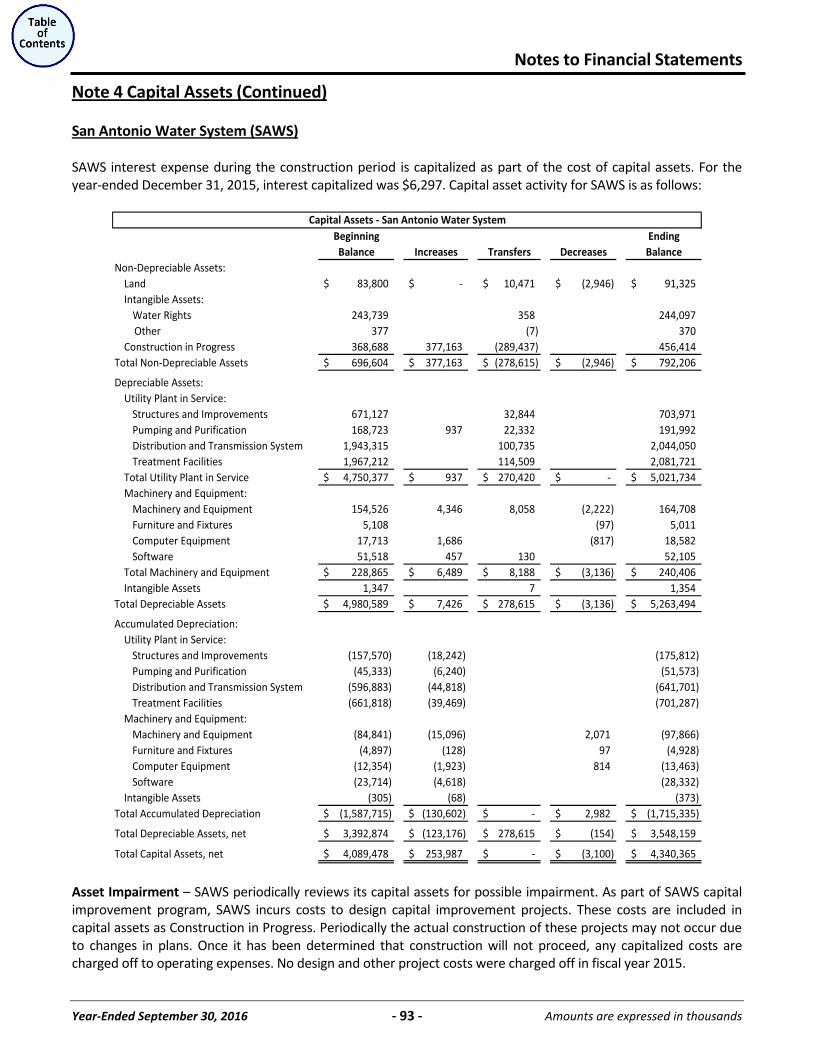
Notes to Financial Statements
Year-Ended September 30, 2016 - 93 - Amounts are expressed in thousands
Note 4 Capital Assets (Continued) San Antonio Water System (SAWS) SAWS interest expense during the construction period is capitalized as part of the cost of capital assets. For the year-ended December 31, 2015, interest capitalized was $6,297. Capital asset activity for SAWS is as follows:
Beginning EndingBalance Increases Transfers Decreases Balance
Non-Depreciable Assets:Land 83,800$ -$ 10,471$ (2,946)$ 91,325$ Intangible Assets:
Water Rights 243,739 358 244,097 Other 377 (7) 370 Construction in Progress 368,688 377,163 (289,437) 456,414
Total Non-Depreciable Assets 696,604$ 377,163$ (278,615)$ (2,946)$ 792,206$
Depreciable Assets:Utility Plant in Service:
Structures and Improvements 671,127 32,844 703,971 Pumping and Purification 168,723 937 22,332 191,992 Distribution and Transmission System 1,943,315 100,735 2,044,050 Treatment Facilities 1,967,212 114,509 2,081,721
Total Utility Plant in Service 4,750,377$ 937$ 270,420$ -$ 5,021,734$ Machinery and Equipment:
Machinery and Equipment 154,526 4,346 8,058 (2,222) 164,708 Furniture and Fixtures 5,108 (97) 5,011 Computer Equipment 17,713 1,686 (817) 18,582 Software 51,518 457 130 52,105
Total Machinery and Equipment 228,865$ 6,489$ 8,188$ (3,136)$ 240,406$ Intangible Assets 1,347 7 1,354
Total Depreciable Assets 4,980,589$ 7,426$ 278,615$ (3,136)$ 5,263,494$
Accumulated Depreciation:Utility Plant in Service:
Structures and Improvements (157,570) (18,242) (175,812) Pumping and Purification (45,333) (6,240) (51,573) Distribution and Transmission System (596,883) (44,818) (641,701) Treatment Facilities (661,818) (39,469) (701,287)
Machinery and Equipment: Machinery and Equipment (84,841) (15,096) 2,071 (97,866) Furniture and Fixtures (4,897) (128) 97 (4,928) Computer Equipment (12,354) (1,923) 814 (13,463) Software (23,714) (4,618) (28,332)
Intangible Assets (305) (68) (373) Total Accumulated Depreciation (1,587,715)$ (130,602)$ -$ 2,982$ (1,715,335)$
Total Depreciable Assets, net 3,392,874$ (123,176)$ 278,615$ (154)$ 3,548,159$
Total Capital Assets, net 4,089,478$ 253,987$ -$ (3,100)$ 4,340,365$
Capital Assets - San Antonio Water System
Asset Impairment – SAWS periodically reviews its capital assets for possible impairment. As part of SAWS capital improvement program, SAWS incurs costs to design capital improvement projects. These costs are included in capital assets as Construction in Progress. Periodically the actual construction of these projects may not occur due to changes in plans. Once it has been determined that construction will not proceed, any capitalized costs are charged off to operating expenses. No design and other project costs were charged off in fiscal year 2015.
Notes to Financial Statements
Year-Ended September 30, 2016 - 94 - Amounts are expressed in thousands
Note 4 Capital Assets (Continued) San Antonio Water System (SAWS) (Continued) SAWS owns a water treatment plant in southwest Bexar County. The treatment plant is operated by SAWS DSP to treat water supplied from the Medina Lake and River. During the height of the recent drought, Medina Lake capacity was greatly diminished leading to poor water quality. As a result, the treatment plant was temporarily idled from April 2013 through August 2015. As a result of heavy rainfall during the summer of 2015, lake levels increased to a peak of nearly 80.0% of capacity. SAWS DSP restarted the treatment plant on September 1, 2015 and treated approximately 500 acre feet (not in thousands) of Medina River water. Water quality concerns persisted and SAWS elected to temporarily idle the treatment plant in October 2015. Additional investments in the treatment process may be required in order to eliminate these water quality concerns in the future. Current available water supplies are expected to be sufficient to meet customers’ demands in the foreseeable future without utilizing the Medina supplies. The book value of the treatment plants at December 31, 2015 was $14,996. SAWS is continuing to depreciate the plant and does not currently believe the plant has been permanently impaired.
(The remainder of this page left blank intentionally)
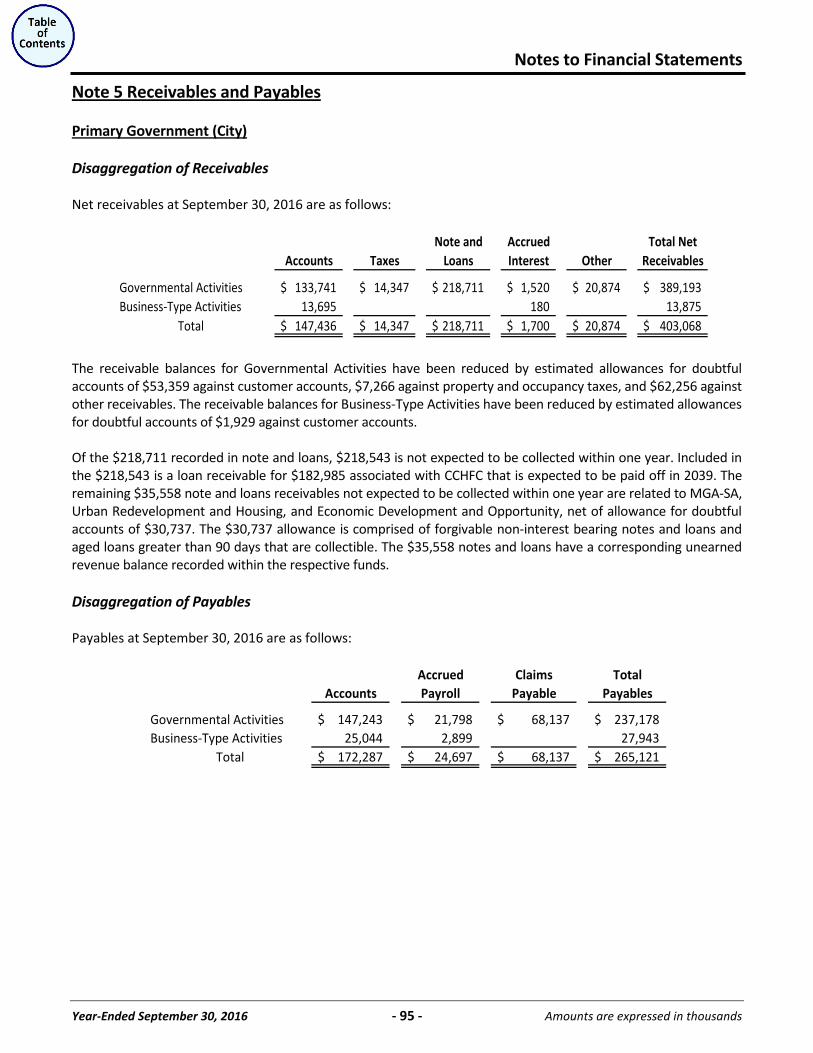
Notes to Financial Statements
Year-Ended September 30, 2016 - 95 - Amounts are expressed in thousands
Note 5 Receivables and Payables
Primary Government (City)
Disaggregation of Receivables Net receivables at September 30, 2016 are as follows:
Note and Accrued Total Net
Accounts Taxes Loans Interest Other Receivables
Governmental Activities 133,741$ 14,347$ 218,711$ 1,520$ 20,874$ 389,193$ Business-Type Activities 13,695 180 13,875
Total 147,436$ 14,347$ 218,711$ 1,700$ 20,874$ 403,068$
The receivable balances for Governmental Activities have been reduced by estimated allowances for doubtful accounts of $53,359 against customer accounts, $7,266 against property and occupancy taxes, and $62,256 against other receivables. The receivable balances for Business-Type Activities have been reduced by estimated allowances for doubtful accounts of $1,929 against customer accounts. Of the $218,711 recorded in note and loans, $218,543 is not expected to be collected within one year. Included in the $218,543 is a loan receivable for $182,985 associated with CCHFC that is expected to be paid off in 2039. The remaining $35,558 note and loans receivables not expected to be collected within one year are related to MGA-SA, Urban Redevelopment and Housing, and Economic Development and Opportunity, net of allowance for doubtful accounts of $30,737. The $30,737 allowance is comprised of forgivable non-interest bearing notes and loans and aged loans greater than 90 days that are collectible. The $35,558 notes and loans have a corresponding unearned revenue balance recorded within the respective funds. Disaggregation of Payables Payables at September 30, 2016 are as follows:
Accrued Claims TotalAccounts Payroll Payable Payables
Governmental Activities 147,243$ 21,798$ 68,137$ 237,178$ Business-Type Activities 25,044 2,899 27,943 Total 172,287$ 24,697$ 68,137$ 265,121$
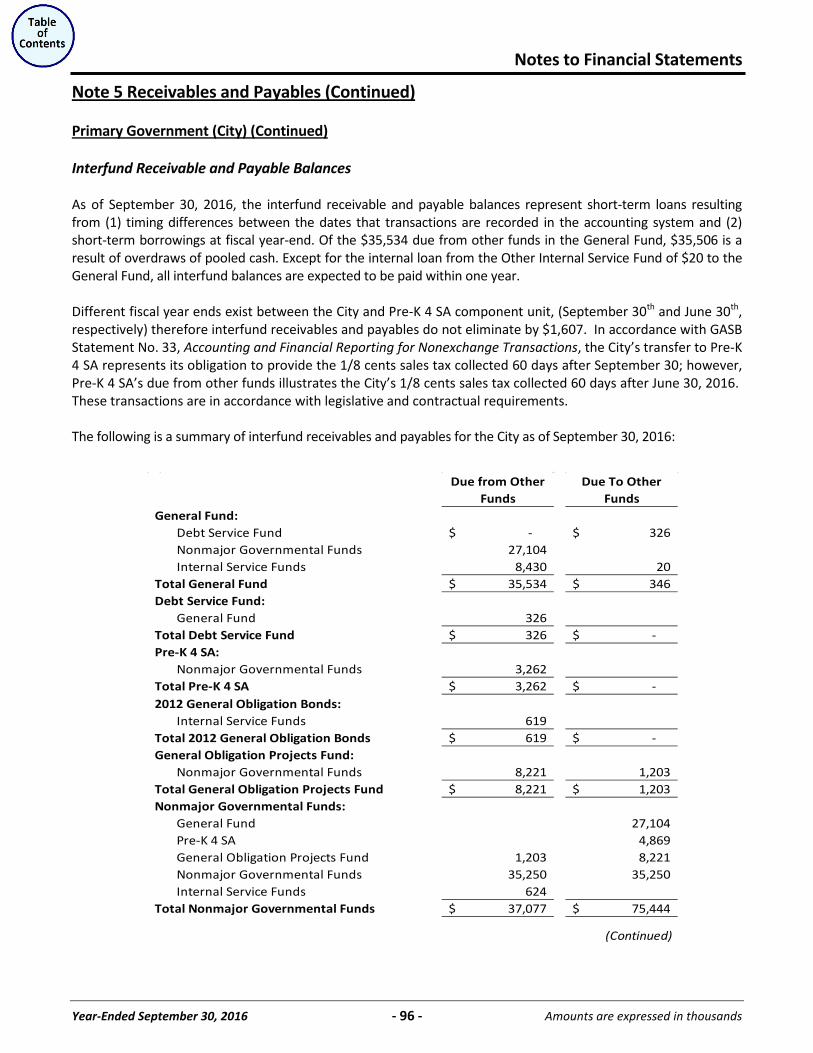
Notes to Financial Statements
Year-Ended September 30, 2016 - 96 - Amounts are expressed in thousands
Note 5 Receivables and Payables (Continued)
Primary Government (City) (Continued)
Interfund Receivable and Payable Balances
As of September 30, 2016, the interfund receivable and payable balances represent short-term loans resulting from (1) timing differences between the dates that transactions are recorded in the accounting system and (2) short-term borrowings at fiscal year-end. Of the $35,534 due from other funds in the General Fund, $35,506 is a result of overdraws of pooled cash. Except for the internal loan from the Other Internal Service Fund of $20 to the General Fund, all interfund balances are expected to be paid within one year. Different fiscal year ends exist between the City and Pre-K 4 SA component unit, (September 30th and June 30th, respectively) therefore interfund receivables and payables do not eliminate by $1,607. In accordance with GASB Statement No. 33, Accounting and Financial Reporting for Nonexchange Transactions, the City’s transfer to Pre-K 4 SA represents its obligation to provide the 1/8 cents sales tax collected 60 days after September 30; however, Pre-K 4 SA’s due from other funds illustrates the City’s 1/8 cents sales tax collected 60 days after June 30, 2016. These transactions are in accordance with legislative and contractual requirements. The following is a summary of interfund receivables and payables for the City as of September 30, 2016:
Due from Other Funds
Due To Other Funds
General Fund:Debt Service Fund -$ 326$ Nonmajor Governmental Funds 27,104 Internal Service Funds 8,430 20
Total General Fund 35,534$ 346$ Debt Service Fund:
General Fund 326 Total Debt Service Fund 326$ -$ Pre-K 4 SA:
Nonmajor Governmental Funds 3,262 Total Pre-K 4 SA 3,262$ -$ 2012 General Obligation Bonds:
Internal Service Funds 619 Total 2012 General Obligation Bonds 619$ -$ General Obligation Projects Fund:
Nonmajor Governmental Funds 8,221 1,203 Total General Obligation Projects Fund 8,221$ 1,203$ Nonmajor Governmental Funds:
General Fund 27,104 Pre-K 4 SA 4,869 General Obligation Projects Fund 1,203 8,221 Nonmajor Governmental Funds 35,250 35,250 Internal Service Funds 624
Total Nonmajor Governmental Funds 37,077$ 75,444$
(Continued)
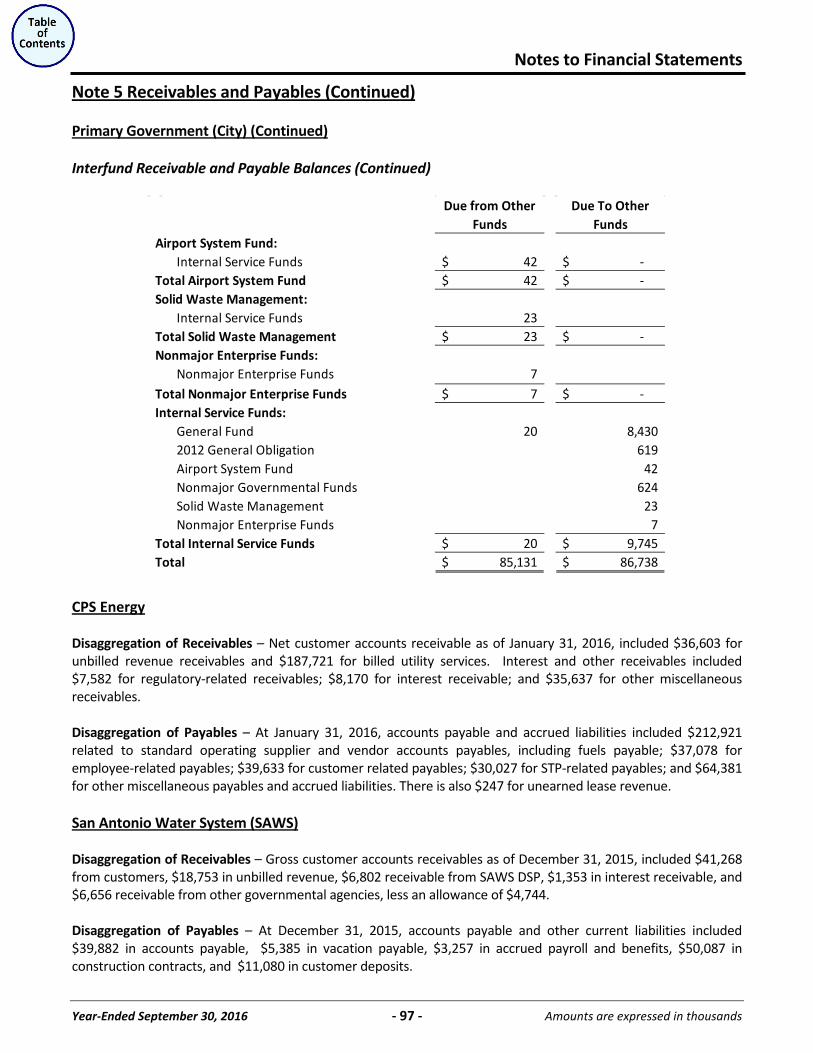
Notes to Financial Statements
Year-Ended September 30, 2016 - 97 - Amounts are expressed in thousands
Note 5 Receivables and Payables (Continued)
Primary Government (City) (Continued)
Interfund Receivable and Payable Balances (Continued)
Due from Other Funds
Due To Other Funds
Airport System Fund:Internal Service Funds 42$ -$
Total Airport System Fund 42$ -$ Solid Waste Management:
Internal Service Funds 23 Total Solid Waste Management 23$ -$ Nonmajor Enterprise Funds:
Nonmajor Enterprise Funds 7 Total Nonmajor Enterprise Funds 7$ -$ Internal Service Funds:
General Fund 20 8,430 2012 General Obligation 619 Airport System Fund 42 Nonmajor Governmental Funds 624 Solid Waste Management 23 Nonmajor Enterprise Funds 7
Total Internal Service Funds 20$ 9,745$ Total 85,131$ 86,738$
CPS Energy
Disaggregation of Receivables – Net customer accounts receivable as of January 31, 2016, included $36,603 for unbilled revenue receivables and $187,721 for billed utility services. Interest and other receivables included $7,582 for regulatory-related receivables; $8,170 for interest receivable; and $35,637 for other miscellaneous receivables. Disaggregation of Payables – At January 31, 2016, accounts payable and accrued liabilities included $212,921 related to standard operating supplier and vendor accounts payables, including fuels payable; $37,078 for employee-related payables; $39,633 for customer related payables; $30,027 for STP-related payables; and $64,381 for other miscellaneous payables and accrued liabilities. There is also $247 for unearned lease revenue.
San Antonio Water System (SAWS)
Disaggregation of Receivables – Gross customer accounts receivables as of December 31, 2015, included $41,268 from customers, $18,753 in unbilled revenue, $6,802 receivable from SAWS DSP, $1,353 in interest receivable, and $6,656 receivable from other governmental agencies, less an allowance of $4,744. Disaggregation of Payables – At December 31, 2015, accounts payable and other current liabilities included $39,882 in accounts payable, $5,385 in vacation payable, $3,257 in accrued payroll and benefits, $50,087 in construction contracts, and $11,080 in customer deposits.
Notes to Financial Statements
Year-Ended September 30, 2016 - 98 - Amounts are expressed in thousands
Note 6 Long-Term Debt
Primary Government (City)
Governmental Activity Long-Term Debt Issuances The City’s debt management and on-going capital improvement financing for infrastructure and “quality of life” purposes resulted in the issuance of additional indebtedness during fiscal year 2016. On August 31, 2016, the City issued $194,175 in General Improvement and Refunding Bonds, Series 2016; $84,855 in Combination Tax and Revenue Certificates of Obligation, Series 2016; $27,410 in Tax Notes, Series 2016; and $24,830 in Combination Tax and Revenue Certificates of Obligation, Taxable Series 2016. The General Improvement and Refunding Bonds, Series 2016 allocated $300 from the refunding obligations to Solid Waste Management and the remaining $193,875 was allocated to governmental activities. The refunding portion of the governmental activities of $147,130 included a premium of $30,142, which was used to fund an escrow account for the redemption, discharge, and defeasance of the refunded obligations. As a result of defeasing the debt, the City will realize a total decrease of $29,929 in debt service payments and total deferred charges of $7,864. Through this defeasance, the City obtained an economic gain (difference between the present value of the debt service payments on the old and new debt) of $34,518. The remaining governmental proceeds of $46,745 included a premium of $7,365, which were issued to finance improvements to streets, bridges, and sidewalks; drainage and flood control; parks, recreation and open spaces; library, museum, and cultural arts facilities; and public safety facilities. The Bonds have maturities ranging from 2017 to 2036, with interest rates ranging from 3.0% to 5.0%. The Combination Tax and Revenue Certificates of Obligation, Series 2016 allocated $6,585 from proceeds to Solid Waste Management and the remaining $78,270 were issued to finance improvements to parks and recreation; public safety facilities; street improvements; street light improvements; information technology systems; and municipal facilities and infrastructure. The proceeds from the Certificates included a premium of $12,125 and have maturities ranging from 2017 to 2036, with interest rates ranging from 2.0% to 5.0%. The Tax Notes, Series 2016 proceeds included a premium of $1,650, which were issued to finance improvements to municipal facilities, information technology systems, public safety improvements, and street maintenance. The Tax Notes have maturities ranging from 2017 to 2019, with interest rates ranging from 3.0% to 5.0%. The Combination Tax and Revenue Certificates of Obligation, Taxable Series 2016 proceeds were issued to finance improvements to City parks and recreation facilities, including Hemisfair Park, and for the purchase of new river barges. The Taxable Certificates have maturities ranging from 2018 to 2036, with interest rates ranging from 0.9% to 3.3%.
Notes to Financial Statements
Year-Ended September 30, 2016 - 99 - Amounts are expressed in thousands
Note 6 Long-Term Debt (Continued)
Primary Government (City) (Continued)
Governmental Activity Long-Term Debt (Continued) Pledges The City of San Antonio’s General Obligation, Certificates of Obligation, Tax Notes, and Public Property Finance Contractual Obligations are pledged by ad-valorem taxes levied upon all taxable property located within the City, within the limitations prescribed by law. The Certificates of Obligations are additionally secured by a lien on and pledge of certain revenues of the City’s municipal parks system not to exceed $1 during the entire period the Certificates of Obligation or interest thereon remains outstanding in order to permit the Certificates of Obligation to be sold for cash. The Municipal Drainage Utility System Revenue Bonds are secured by a lien on Stormwater revenues. Texas Municipal Facility Corporation Lease Revenue Bonds are paid by annually appropriated lease payments made by the City which equal the annual debt service on the Bonds. Convention Center Hotel Finance Coporation Contract Revenue Empowerment Zone Bonds are secured by net operating revenues to be received from the Convention Center Hotel operations. In the event the net operating revenues are insufficient to pay all debt service, City tax revenues will be pledged in the following order of priority: first, from the Convention Center Hotel State HOT revenues; second, from Convention Center Hotel State sales tax revenues; third, from Convention Center Hotel 7.0% local HOT revenues; and fourth, from available 2.0% Expansion HOT revenues. The Starbright Industrial Development Corporation Contract Revenue Bonds are secured with a pledge of utility revenue received by the City from CPS Energy. Texas Public Facilities Corporation Improvement and Refunding Lease Revenue Bonds are paid by annually appropriated lease payments from any money that has not been encumbered to secure the payment of any indebtedness of the City and that may lawfully be used with respect to any payment obligated or permitted under the Lease Agreement, including but not limited to unencumbered and lawfully available revenues derived by the City from Hotel Occupancy Taxes levied by the City, annual ad valorem taxes levied for maintenance and operation purposes, the 1.0% general sales and use tax levied by the City, and transfers from City-owned utility systems. The finance plan is to utilize hotel occupancy taxes and no other sources are intended to be used. The Revenue Notes are secured by a commitment of the City to pay principal and interest on the Notes when due from any and all lawful and available sources, subject to annual appropriation by the City Council of the City. Prior Years’ Defeased Debt In prior years, the City advance refunded, prior to maturity, certain General Obligation Bonds, Revenue Bonds, Certificates of Obligation and Tax Notes. The refunding bonds were utilized to purchase securities, which are direct obligations of the United States of America (the Purchased Securities). The Purchased Securities plus cash were deposited into irrevocable escrow accounts in amounts scheduled to mature in principal amounts that, when added to interest earned on the Purchased Securities plus remaining balances in the escrow fund, are fully sufficient to make timely payment on the principal, premium if any, and interest scheduled to come due on the refunded obligations. The refunded obligations represent a legal defeasance and are no longer a liability of the City; therefore, they are not included in the City’s financial statements. On September 30, 2016, $221,465 of previously defeased bonds was outstanding.
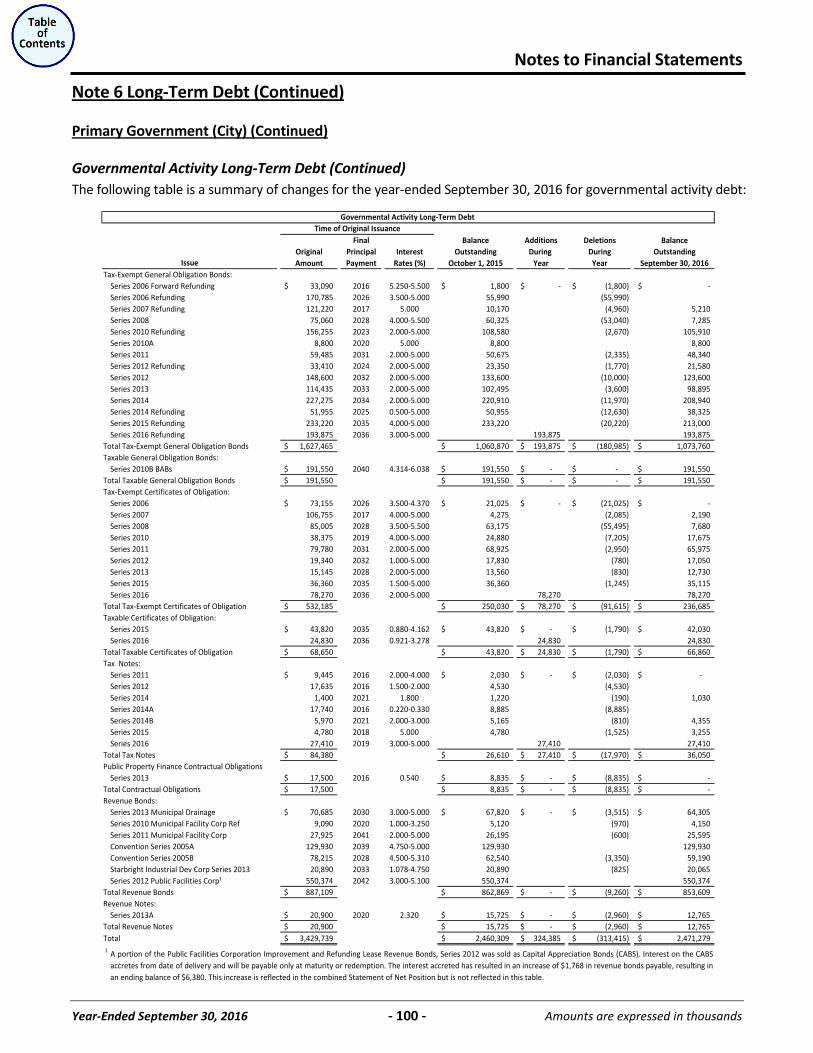
Notes to Financial Statements
Year-Ended September 30, 2016 - 100 - Amounts are expressed in thousands
Note 6 Long-Term Debt (Continued)
Primary Government (City) (Continued)
Governmental Activity Long-Term Debt (Continued) The following table is a summary of changes for the year-ended September 30, 2016 for governmental activity debt:
Final Balance Additions Deletions BalanceOriginal Principal Interest Outstanding During During OutstandingAmount Payment Rates (%) October 1, 2015 Year Year September 30, 2016
Tax-Exempt General Obligation Bonds:Series 2006 Forward Refunding 33,090$ 2016 5.250-5.500 1,800$ -$ (1,800)$ -$ Series 2006 Refunding 170,785 2026 3.500-5.000 55,990 (55,990) Series 2007 Refunding 121,220 2017 5.000 10,170 (4,960) 5,210 Series 2008 75,060 2028 4.000-5.500 60,325 (53,040) 7,285 Series 2010 Refunding 156,255 2023 2.000-5.000 108,580 (2,670) 105,910 Series 2010A 8,800 2020 5.000 8,800 8,800 Series 2011 59,485 2031 2.000-5.000 50,675 (2,335) 48,340 Series 2012 Refunding 33,410 2024 2.000-5.000 23,350 (1,770) 21,580 Series 2012 148,600 2032 2.000-5.000 133,600 (10,000) 123,600 Series 2013 114,435 2033 2.000-5.000 102,495 (3,600) 98,895 Series 2014 227,275 2034 2.000-5.000 220,910 (11,970) 208,940 Series 2014 Refunding 51,955 2025 0.500-5.000 50,955 (12,630) 38,325 Series 2015 Refunding 233,220 2035 4.000-5.000 233,220 (20,220) 213,000 Series 2016 Refunding 193,875 2036 3.000-5.000 193,875 193,875
Total Tax-Exempt General Obligation Bonds 1,627,465$ 1,060,870$ 193,875$ (180,985)$ 1,073,760$ Taxable General Obligation Bonds:
Series 2010B BABs 191,550$ 2040 4.314-6.038 191,550$ -$ -$ 191,550$ Total Taxable General Obligation Bonds 191,550$ 191,550$ -$ -$ 191,550$ Tax-Exempt Certificates of Obligation:
Series 2006 73,155$ 2026 3.500-4.370 21,025$ -$ (21,025)$ -$ Series 2007 106,755 2017 4.000-5.000 4,275 (2,085) 2,190 Series 2008 85,005 2028 3.500-5.500 63,175 (55,495) 7,680 Series 2010 38,375 2019 4.000-5.000 24,880 (7,205) 17,675 Series 2011 79,780 2031 2.000-5.000 68,925 (2,950) 65,975 Series 2012 19,340 2032 1.000-5.000 17,830 (780) 17,050 Series 2013 15,145 2028 2.000-5.000 13,560 (830) 12,730 Series 2015 36,360 2035 1.500-5.000 36,360 (1,245) 35,115 Series 2016 78,270 2036 2.000-5.000 78,270 78,270
Total Tax-Exempt Certificates of Obligation 532,185$ 250,030$ 78,270$ (91,615)$ 236,685$ Taxable Certificates of Obligation:
Series 2015 43,820$ 2035 0.880-4.162 43,820$ -$ (1,790)$ 42,030$ Series 2016 24,830 2036 0.921-3.278 24,830 24,830
Total Taxable Certificates of Obligation 68,650$ 43,820$ 24,830$ (1,790)$ 66,860$ Tax Notes:
Series 2011 9,445$ 2016 2.000-4.000 2,030$ -$ (2,030)$ -$ Series 2012 17,635 2016 1.500-2.000 4,530 (4,530) Series 2014 1,400 2021 1.800 1,220 (190) 1,030 Series 2014A 17,740 2016 0.220-0.330 8,885 (8,885) Series 2014B 5,970 2021 2.000-3.000 5,165 (810) 4,355 Series 2015 4,780 2018 5.000 4,780 (1,525) 3,255 Series 2016 27,410 2019 3.000-5.000 27,410 27,410
Total Tax Notes 84,380$ 26,610$ 27,410$ (17,970)$ 36,050$ Public Property Finance Contractual Obligations
Series 2013 17,500$ 2016 0.540 8,835$ -$ (8,835)$ -$ Total Contractual Obligations 17,500$ 8,835$ -$ (8,835)$ -$ Revenue Bonds:
Series 2013 Municipal Drainage 70,685$ 2030 3.000-5.000 67,820$ -$ (3,515)$ 64,305$ Series 2010 Municipal Facility Corp Ref 9,090 2020 1.000-3.250 5,120 (970) 4,150 Series 2011 Municipal Facility Corp 27,925 2041 2.000-5.000 26,195 (600) 25,595 Convention Series 2005A 129,930 2039 4.750-5.000 129,930 129,930 Convention Series 2005B 78,215 2028 4.500-5.310 62,540 (3,350) 59,190 Starbright Industrial Dev Corp Series 2013 20,890 2033 1.078-4.750 20,890 (825) 20,065 Series 2012 Public Facilities Corp¹ 550,374 2042 3.000-5.100 550,374 550,374
Total Revenue Bonds 887,109$ 862,869$ -$ (9,260)$ 853,609$ Revenue Notes:
Series 2013A 20,900$ 2020 2.320 15,725$ -$ (2,960)$ 12,765$ Total Revenue Notes 20,900$ 15,725$ -$ (2,960)$ 12,765$ Total 3,429,739$ 2,460,309$ 324,385$ (313,415)$ 2,471,279$ 1
Issue
Governmental Activity Long-Term Debt
A portion of the Public Facilities Corporation Improvement and Refunding Lease Revenue Bonds, Series 2012 was sold as Capital Appreciation Bonds (CABS). Interest on the CABSaccretes from date of delivery and will be payable only at maturity or redemption. The interest accreted has resulted in an increase of $1,768 in revenue bonds payable, resulting inan ending balance of $6,380. This increase is reflected in the combined Statement of Net Position but is not reflected in this table.
Time of Original Issuance
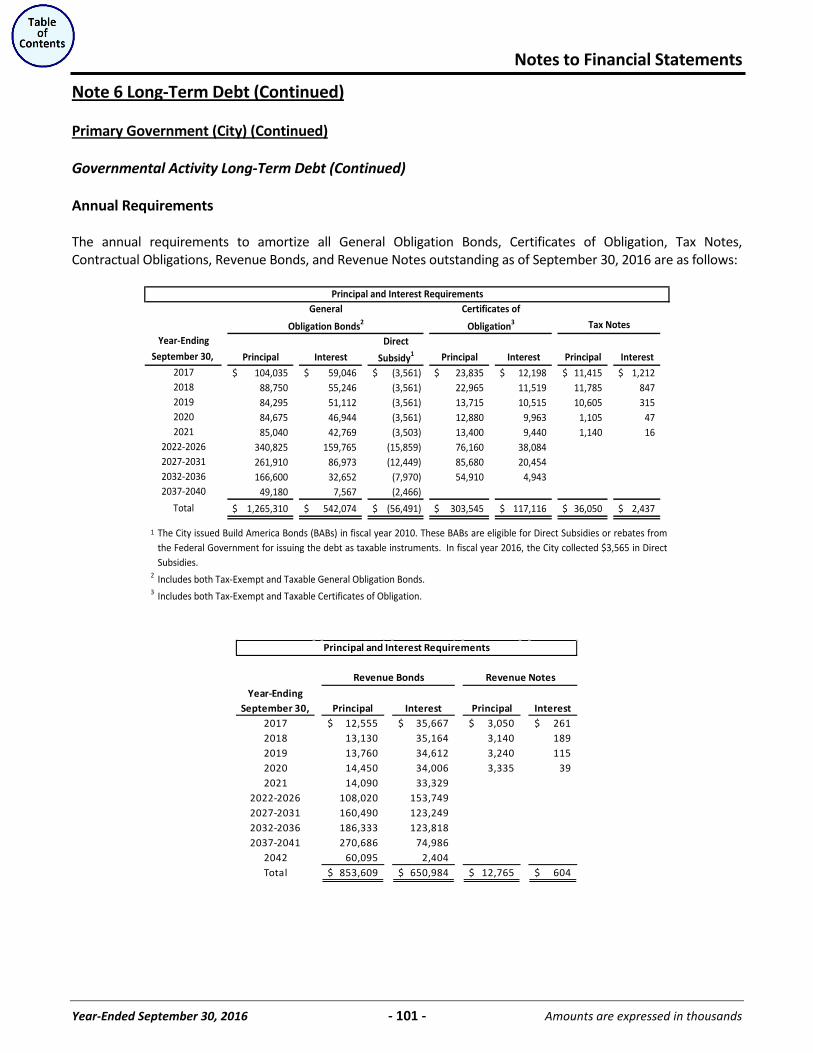
Notes to Financial Statements
Year-Ended September 30, 2016 - 101 - Amounts are expressed in thousands
Note 6 Long-Term Debt (Continued)
Primary Government (City) (Continued)
Governmental Activity Long-Term Debt (Continued) Annual Requirements The annual requirements to amortize all General Obligation Bonds, Certificates of Obligation, Tax Notes, Contractual Obligations, Revenue Bonds, and Revenue Notes outstanding as of September 30, 2016 are as follows:
Direct
Principal Interest Subsidy1 Principal Interest Principal Interest
104,035$ 59,046$ (3,561)$ 23,835$ 12,198$ 11,415$ 1,212$ 88,750 55,246 (3,561) 22,965 11,519 11,785 847 84,295 51,112 (3,561) 13,715 10,515 10,605 315 84,675 46,944 (3,561) 12,880 9,963 1,105 47 85,040 42,769 (3,503) 13,400 9,440 1,140 16
340,825 159,765 (15,859) 76,160 38,084 261,910 86,973 (12,449) 85,680 20,454 166,600 32,652 (7,970) 54,910 4,943
49,180 7,567 (2,466)
1,265,310$ 542,074$ (56,491)$ 303,545$ 117,116$ 36,050$ 2,437$
1
2
3
General
Total
2022-2026
2020
2018
Principal and Interest RequirementsCertificates of
Obligation3Obligation Bonds2
Year-Ending
2027-2031
2019
Tax Notes
September 30,
Includes both Tax-Exempt and Taxable Certificates of Obligation.
Includes both Tax-Exempt and Taxable General Obligation Bonds.
2037-2040
2017
2032-2036
2021
The City issued Build America Bonds (BABs) in fiscal year 2010. These BABs are eligible for Direct Subsidies or rebates fromthe Federal Government for issuing the debt as taxable instruments. In fiscal year 2016, the City collected $3,565 in DirectSubsidies.
Year-EndingSeptember 30, Principal Interest Principal Interest
2017 12,555$ 35,667$ 3,050$ 261$ 2018 13,130 35,164 3,140 189 2019 13,760 34,612 3,240 115 2020 14,450 34,006 3,335 39 2021 14,090 33,329
2022-2026 108,020 153,749 2027-2031 160,490 123,249 2032-2036 186,333 123,818 2037-2041 270,686 74,986
2042 60,095 2,404 Total 853,609$ 650,984$ 12,765$ 604$
Principal and Interest Requirements
Revenue Bonds Revenue Notes
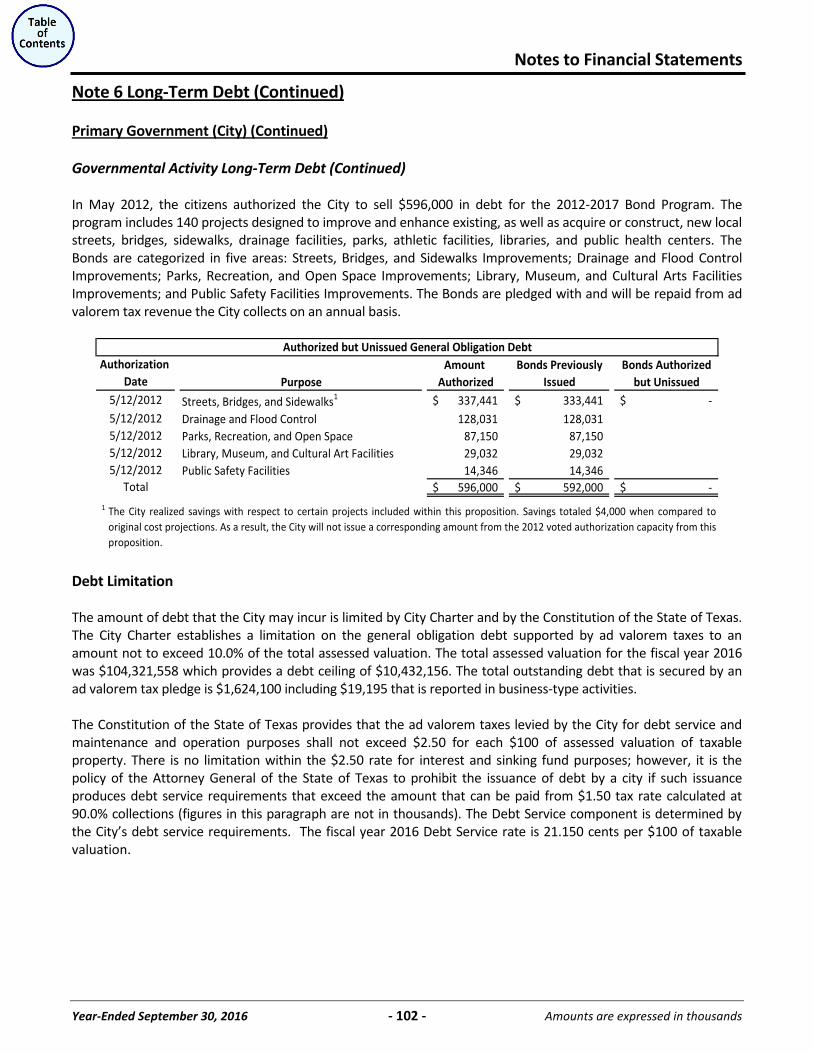
Notes to Financial Statements
Year-Ended September 30, 2016 - 102 - Amounts are expressed in thousands
Note 6 Long-Term Debt (Continued)
Primary Government (City) (Continued)
Governmental Activity Long-Term Debt (Continued) In May 2012, the citizens authorized the City to sell $596,000 in debt for the 2012-2017 Bond Program. The program includes 140 projects designed to improve and enhance existing, as well as acquire or construct, new local streets, bridges, sidewalks, drainage facilities, parks, athletic facilities, libraries, and public health centers. The Bonds are categorized in five areas: Streets, Bridges, and Sidewalks Improvements; Drainage and Flood Control Improvements; Parks, Recreation, and Open Space Improvements; Library, Museum, and Cultural Arts Facilities Improvements; and Public Safety Facilities Improvements. The Bonds are pledged with and will be repaid from ad valorem tax revenue the City collects on an annual basis.
Amount Bonds Previously Bonds AuthorizedPurpose Authorized Issued but Unissued
Streets, Bridges, and Sidewalks1 337,441$ 333,441$ -$ Drainage and Flood Control 128,031 128,031 - Parks, Recreation, and Open Space 87,150 87,150 - Library, Museum, and Cultural Art Facilities 29,032 29,032 - Public Safety Facilities 14,346 14,346 -
596,000$ 592,000$ -$ 1 The City realized savings with respect to certain projects included within this proposition. Savings totaled $4,000 when compared to
original cost projections. As a result, the City will not issue a corresponding amount from the 2012 voted authorization capacity from this proposition.
5/12/2012
5/12/2012
5/12/20125/12/20125/12/2012
Total
Authorized but Unissued General Obligation DebtAuthorization
Date
Debt Limitation The amount of debt that the City may incur is limited by City Charter and by the Constitution of the State of Texas. The City Charter establishes a limitation on the general obligation debt supported by ad valorem taxes to an amount not to exceed 10.0% of the total assessed valuation. The total assessed valuation for the fiscal year 2016 was $104,321,558 which provides a debt ceiling of $10,432,156. The total outstanding debt that is secured by an ad valorem tax pledge is $1,624,100 including $19,195 that is reported in business-type activities. The Constitution of the State of Texas provides that the ad valorem taxes levied by the City for debt service and maintenance and operation purposes shall not exceed $2.50 for each $100 of assessed valuation of taxable property. There is no limitation within the $2.50 rate for interest and sinking fund purposes; however, it is the policy of the Attorney General of the State of Texas to prohibit the issuance of debt by a city if such issuance produces debt service requirements that exceed the amount that can be paid from $1.50 tax rate calculated at 90.0% collections (figures in this paragraph are not in thousands). The Debt Service component is determined by the City’s debt service requirements. The fiscal year 2016 Debt Service rate is 21.150 cents per $100 of taxable valuation.
Notes to Financial Statements
Year-Ended September 30, 2016 - 103 - Amounts are expressed in thousands
Note 6 Long-Term Debt (Continued)
Primary Government (City) (Continued)
Governmental Activity Long-Term Debt (Continued) Notes Payable In September 2004, City Council authorized the submission of a $57,000 HUD 108 loan application to HUD, which was received August 2006. Proceeds of the loan have been utilized to fund various capital improvement projects including streets and drainage projects, and to fund improvements to public health facilities, parks, libraries, and community recreation and cultural facilities. The loan amount outstanding as of September 30, 2016 was $36,190. In June 2015, a three year, 2.1% interest loan was authorized in the amount of $6,100 to finance the costs related to the acquisition of the Frost Tower and Frost Parking Garage that will be used to consolidate City administration into a single facility. Proceeds of the loan have been utilized to fund the acquisition of the acquired property, as well as the payment for professional services related to the acquisition and ultimate utilization by the City. The loan amount outstanding as of September 30, 2016 was $6,100. The notes are secured with a pledge of utility revenue received by the City from CPS Energy. In 2016, Hemisfair Park Area Redevlopment Center, a component unit of the City, entered into two five year, 4.5% interest, loan agreements totaling $511 to finance the construction of two parking lots. The loans allow for accelerated payments which they intend to make from the proceeds of parking lot revenues. As of September 30, 2016 the loan has an outstanding balance of $494. Interfund Borrowings In certain instances, after an evaluation of project/purchase funding requirements, it has been determined that some funds or operations may require temporary financing. As an alternative to the issuance of external debt to finance those projects/purchases, the City has authorized internal temporary financing from available cash balances in the Internal Service Equipment Replacement and Renewal Fund (Other Internal Service Fund) to meet those needs. In June 2009, a loan in the amount of $460 was authorized from the City’s Other Internal Service Fund to the General Fund to finance the City’s participation in an interagency agreement with the San Antonio Water System to implement a water efficiency project at the Hemisfair Fountain. Upon completion of the project, the City received a one-time rebate. The Hemisfair Fountain uses an estimated 36,000 gallons of water each year which equates to an annual estimated cost of $130 to the General Fund. Savings attributed to the implementation of the water efficiency project, along with the one-time rebate and interest earnings, will be transferred to the Other Internal Service Fund for reimbursement of the loan for the capital project. In fiscal year 2016 the Hemisfair Fountain realized no savings from water usage. This lack of savings is attributed to leaking valves, which caused a substantial amount of water consumption. There were no reductions in the loan, and the outstanding balance remains at $20. The following is a summary of changes in the loan for the fiscal year-ended September 30, 2016:
Balance BalanceOctober 1, 2015 Additions Reductions September 30, 2016
20$ -$ -$ 20$
Notes to Financial Statements
Year-Ended September 30, 2016 - 104 - Amounts are expressed in thousands
Note 6 Long-Term Debt (Continued)
Primary Government (City) (Continued)
Governmental Activity Long-Term Debt (Continued) In June 2010, a 15 year, 3.7% interest loan was authorized in the amount of $1,185 from the City to MGA-SA to finance improvements to City owned golf courses. MGA-SA will repay the interfund borrowing with interest from revenues generated by its golf operations. The loan amount outstanding as of September 30, 2016 is $785. During 2015, a ten year, 4.8% interest loan was authorized in the amount of $4,000 from the City to MGA-SA to finance further improvements to City owned golf courses. MGA-SA will repay the interfund borrowing with interest from revenues generated by its golf operations. Upon authorization of the loan $1,803 of proceeds was issued to MGA-SA with further installments planned for upcoming years. As of September 30, 2016 an additional $2,132 of proceeds have been issued to MGA-SA and the loan amount outstanding is $3,580. During 2016, a 15 year, 4.8% interest loan was authorized in the amount of $4,000 from the City to MGA-SA to finance further improvements to City owned golf courses. MGA-SA will repay the interfund borrowing with interest from revenues generated by its golf operations. The loan amount outstanding as of September 30, 2016 is $4,000. The following is a summary of changes in the loans for the fiscal year-ended September 30, 2016:
Balance BalanceOctober 1, 2015 Additions Reductions September 30, 2016
2,663$ 6,132$ 430$ 8,365$
Leases The City leases property and equipment from others. Leased property having elements of ownership is recorded in the government-wide financial statements. The related obligations, in amounts equal to the present value of minimum lease payments payable during the remaining term of the leases, are also recorded in the government-wide financial statements. Other leased property, not having elements of ownership, is classified as operating leases. Both capital and operating lease payments are recorded as expenditures when matured in the governmental fund financial statements. Total expenditures for operating leases for the fiscal year-ended September 30, 2016 were approximately $11,272. The City has entered into various lease purchase agreements for the acquisition of laptops and related components, energy/water saving conservation improvements, thermal-imaging cameras, various emergency services equipment, and a helicopter. These lease agreements qualify as capital leases for accounting purposes and have been recorded at the present value of their future minimum lease payments as of the date of inception. Payments on each of the lease purchases will be made from budgeted annual appropriations to be approved by the City Council. The assets acquired through capital leases for governmental activities are as follows:
Machinery and Equipment 34,694$ Less: Accumulated Depreciation (21,497)
Total 13,197$
Notes to Financial Statements
Year-Ended September 30, 2016 - 105 - Amounts are expressed in thousands
Note 6 Long-Term Debt (Continued)
Primary Government (City) (Continued)
Governmental Activity Long-Term Debt (Continued) As of September 30, 2016, the City had future minimum lease payments under capital and operating leases with a remaining term in excess of one year for governmental activities as follows:
Capital OperatingLeases Leases Total
Fiscal Year-Ending September 30,2017 2,745$ 10,757$ 13,502$ 2018 2,693 9,688 12,381 2019 2,490 8,809 11,299 2020 2,445 7,254 9,699 2021 1,411 6,234 7,645
2022-2026 4,523 6,339 10,862 2027-2031 188 2,181 2,369 2032-2036 2,015 2,015 2037-2041 856 856 2042-After 3,298 3,298
Future Minimum Lease Payments 16,495 57,431$ 73,926$ Less: Interest (1,673)
Present Value of Future Minimum Lease Payments 14,822 Less: Current Portion (2,369)
Capital Lease, Net of Current Portion 12,453$
Business-Type Activity Long-Term Debt Business-Type Activity long-term debt applies to those City operations that relate to business and quasi-business activities where net income and capital maintenance are measured (Enterprise Funds). Long-term debt, which is to be repaid from enterprise fund resources, is reported in the respective proprietary fund. The long-term indebtedness of the City’s Enterprise Funds is presented in the discussion that follows. Issuances On August 31, 2016, $300 of the $194,175 in General Improvement and Refunding Bonds, Series 2016 was allocated to Solid Waste Management. The net proceeds for the allocated portion of the bonds included a premium of $61, which was applied to fund an escrow account for the redemption, discharge, and defeasance of the refunded obligations. As a result of defeasing the debt, the City will realize a total decrease of $40 in debt service payments and total deferred charges of $18. Through this defeasance, the City obtained an economic gain of $37. The Bonds have maturities ranging from 2017 to 2026, with interest rates ranging from 3.0% to 5.0%. On August 31, 2016, $6,585 of the $84,855 in Combination Tax and Revenue Certificates of Obligation, Series 2016 was allocated to Solid Waste Management, which were issued to finance infrastructure improvements. The proceeds from the allocated portion of the Certificates included a premium of $1,020 and have maturities ranging from 2017 to 2036, with interest rates ranging from 2.0% to 5.0%.
Notes to Financial Statements
Year-Ended September 30, 2016 - 106 - Amounts are expressed in thousands
Note 6 Long-Term Debt (Continued)
Primary Government (City) (Continued)
Business-Type Activity Long-Term Debt (Continued) Pledges The Airport System includes the City of San Antonio International Airport, Stinson Municipal Airport, and all land, buildings, structures, equipment, and facilities pertaining thereto. The Airport System’s long-term debt consists of Airport System Revenue Improvement Bonds (GARB), Passenger Facility Charge and Subordinate Lien Bonds (PFC), and Customer Facility Charge Revenue Bonds (CFC). GARBs are payable from and secured solely by an irrevocable first lien on and pledge of the gross revenues of the Airport System. Gross revenues of the Airport System include all revenues of any nature derived from contracts or use agreements with airlines and other users of the Airport System and its facilities. PFCs are payable from and secured by an irrevocable first lien on and pledge of the PFC revenues and a first lien on and pledge of the subordinate net revenues. CFCs are payable from and secured by an irrevocable first lien on and pledge of the CFC revenues. The Parking System operation includes the ownership and operation of parking facilities, parking lots, parking meters, and retail/office space. Long-term debt is allocated to the Parking System on a pro rata basis from proceeds received from the issuance of taxable general obligation debt and is paid from revenues derived from the operation of the Parking System. The allocated debt is secured by an ad valorem tax pledge. Solid Waste Management operation includes the collection and processing of refuse, recycling, and brush. Long-term debt is allocated to Solid Waste Management on a pro rata basis from proceeds received from the issuance of general obligation and certificates of obligation debt for Solid Waste Management related improvements and is paid from revenues derived from the operation of Solid Waste Management. The allocated debt is secured by an ad valorem tax pledge. Capitalized Interest Costs – Interest costs incurred on revenue bonds and other borrowing totaled $26,093 for the Airport System. For fiscal year 2016, the amount of $1,176 was capitalized for the Airport System and included as an addition to construction in progress. Nonmajor enterprise funds did not have any capitalized interest in fiscal year 2016. Prior Years’ Defeased Debt In prior years, the City advance refunded, prior to maturity, certain revenue bonds. The refunding bonds were utilized to purchase securities, which are direct obligations of the United States of America (the Purchased Securities). The Purchased Securities plus cash were deposited into irrevocable escrow accounts in amount scheduled to mature in principal amounts that, when added to interest earned on the Purchased Securities plus remaining balances in the escrow fund, are fully sufficient to make timely payment on the principal, premium if any, and interest scheduled to come due on the refunded obligations. The refunded obligations represent a legal defeasance and are no longer a liability of the City; therefore, they are not included in the City’s financial statements. On September 30, 2016, $1,955 of previously defeased bonds was outstanding.
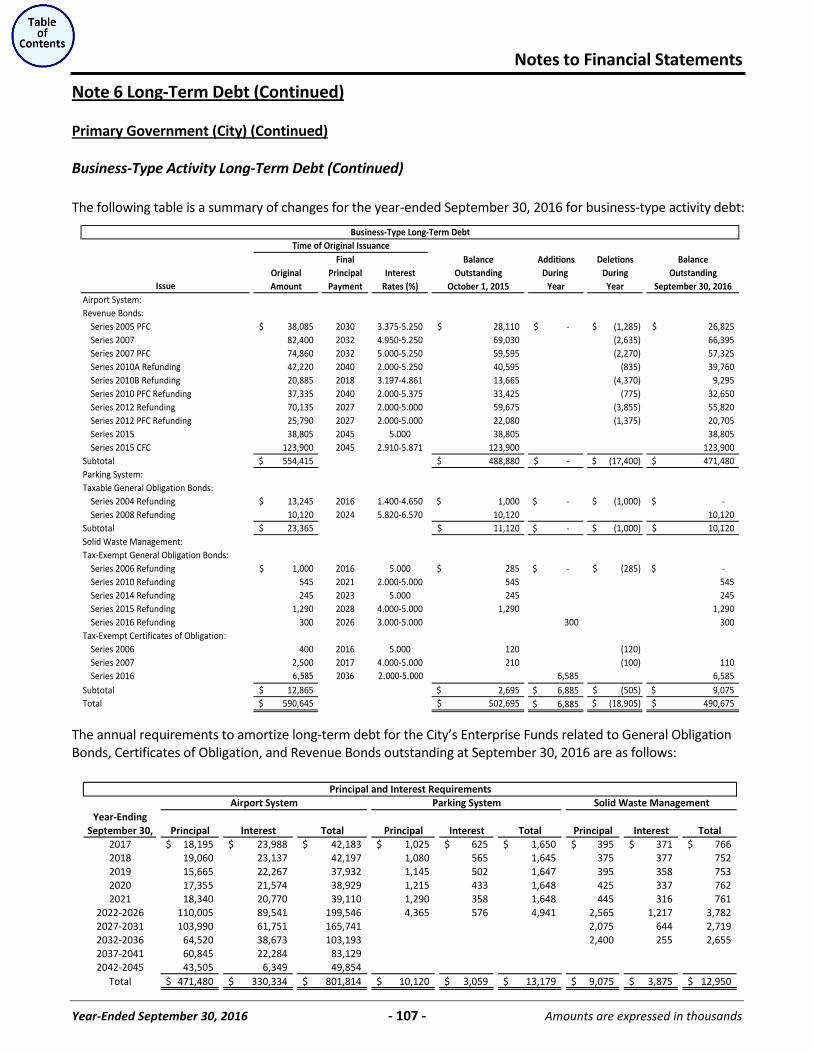
Notes to Financial Statements
Year-Ended September 30, 2016 - 107 - Amounts are expressed in thousands
Note 6 Long-Term Debt (Continued)
Primary Government (City) (Continued)
Business-Type Activity Long-Term Debt (Continued) The following table is a summary of changes for the year-ended September 30, 2016 for business-type activity debt:
Final Balance Additions Deletions BalanceOriginal Principal Interest Outstanding During During OutstandingAmount Payment Rates (%) October 1, 2015 Year Year September 30, 2016
Airport System:Revenue Bonds:
Series 2005 PFC 38,085$ 2030 3.375-5.250 28,110$ -$ (1,285)$ 26,825$ Series 2007 82,400 2032 4.950-5.250 69,030 (2,635) 66,395 Series 2007 PFC 74,860 2032 5.000-5.250 59,595 (2,270) 57,325 Series 2010A Refunding 42,220 2040 2.000-5.250 40,595 (835) 39,760 Series 2010B Refunding 20,885 2018 3.197-4.861 13,665 (4,370) 9,295 Series 2010 PFC Refunding 37,335 2040 2.000-5.375 33,425 (775) 32,650 Series 2012 Refunding 70,135 2027 2.000-5.000 59,675 (3,855) 55,820 Series 2012 PFC Refunding 25,790 2027 2.000-5.000 22,080 (1,375) 20,705 Series 2015 38,805 2045 5.000 38,805 38,805 Series 2015 CFC 123,900 2045 2.910-5.871 123,900 123,900
Subtotal 554,415$ 488,880$ -$ (17,400)$ 471,480$ Parking System:Taxable General Obligation Bonds:
Series 2004 Refunding 13,245$ 2016 1.400-4.650 1,000$ -$ (1,000)$ -$ Series 2008 Refunding 10,120 2024 5.820-6.570 10,120 10,120
Subtotal 23,365$ 11,120$ -$ (1,000)$ 10,120$ Solid Waste Management:Tax-Exempt General Obligation Bonds:
Series 2006 Refunding 1,000$ 2016 5.000 285$ -$ (285)$ -$ Series 2010 Refunding 545 2021 2.000-5.000 545 545 Series 2014 Refunding 245 2023 5.000 245 245 Series 2015 Refunding 1,290 2028 4.000-5.000 1,290 1,290 Series 2016 Refunding 300 2026 3.000-5.000 300 300
Tax-Exempt Certificates of Obligation:Series 2006 400 2016 5.000 120 (120) Series 2007 2,500 2017 4.000-5.000 210 (100) 110 Series 2016 6,585 2036 2.000-5.000 6,585 6,585
Subtotal 12,865$ 2,695$ 6,885$ (505)$ 9,075$ Total 590,645$ 502,695$ 6,885$ (18,905)$ 490,675$
Issue
Business-Type Long-Term DebtTime of Original Issuance
The annual requirements to amortize long-term debt for the City’s Enterprise Funds related to General Obligation Bonds, Certificates of Obligation, and Revenue Bonds outstanding at September 30, 2016 are as follows:
Year-EndingSeptember 30, Principal Interest Total Principal Interest Total Principal Interest Total
2017 18,195$ 23,988$ 42,183$ 1,025$ 625$ 1,650$ 395$ 371$ 766$ 2018 19,060 23,137 42,197 1,080 565 1,645 375 377 752 2019 15,665 22,267 37,932 1,145 502 1,647 395 358 753 2020 17,355 21,574 38,929 1,215 433 1,648 425 337 762 2021 18,340 20,770 39,110 1,290 358 1,648 445 316 761
2022-2026 110,005 89,541 199,546 4,365 576 4,941 2,565 1,217 3,782 2027-2031 103,990 61,751 165,741 2,075 644 2,719 2032-2036 64,520 38,673 103,193 2,400 255 2,655 2037-2041 60,845 22,284 83,129 2042-2045 43,505 6,349 49,854
Total 471,480$ 330,334$ 801,814$ 10,120$ 3,059$ 13,179$ 9,075$ 3,875$ 12,950$
Airport System Parking SystemPrincipal and Interest Requirements
Solid Waste Management
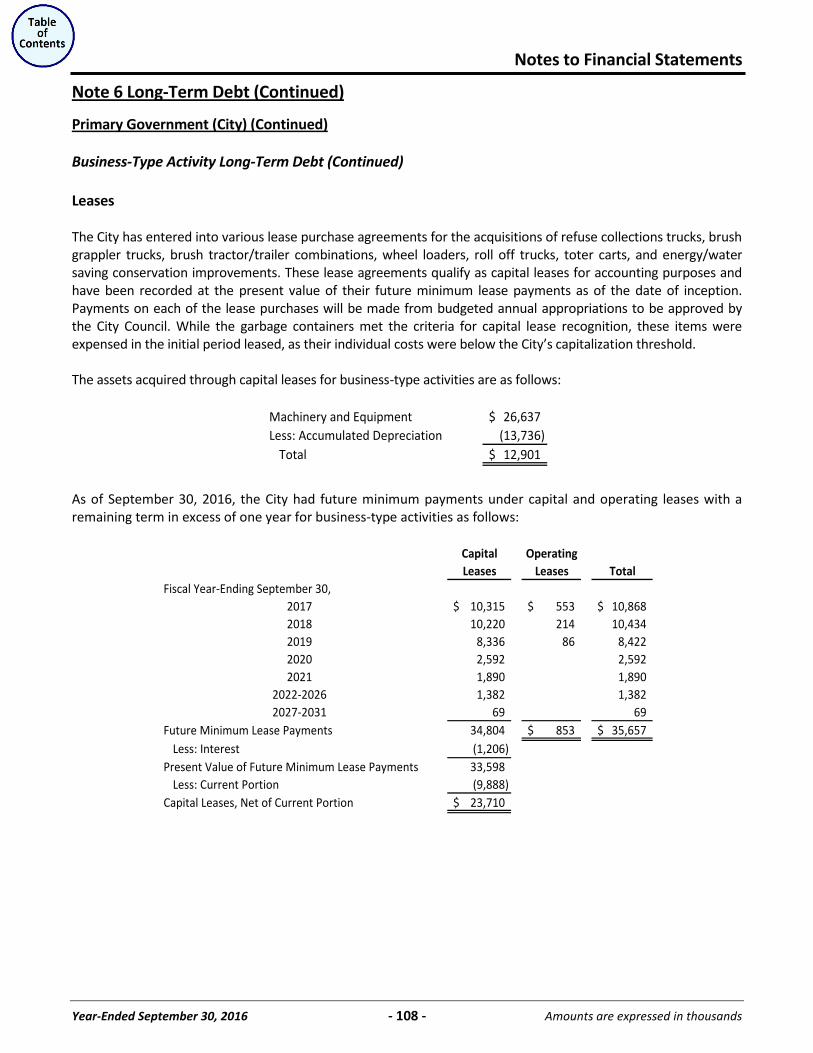
Notes to Financial Statements
Year-Ended September 30, 2016 - 108 - Amounts are expressed in thousands
Note 6 Long-Term Debt (Continued)
Primary Government (City) (Continued)
Business-Type Activity Long-Term Debt (Continued) Leases The City has entered into various lease purchase agreements for the acquisitions of refuse collections trucks, brush grappler trucks, brush tractor/trailer combinations, wheel loaders, roll off trucks, toter carts, and energy/water saving conservation improvements. These lease agreements qualify as capital leases for accounting purposes and have been recorded at the present value of their future minimum lease payments as of the date of inception. Payments on each of the lease purchases will be made from budgeted annual appropriations to be approved by the City Council. While the garbage containers met the criteria for capital lease recognition, these items were expensed in the initial period leased, as their individual costs were below the City’s capitalization threshold. The assets acquired through capital leases for business-type activities are as follows:
Machinery and Equipment 26,637$ Less: Accumulated Depreciation (13,736)
Total 12,901$
As of September 30, 2016, the City had future minimum payments under capital and operating leases with a remaining term in excess of one year for business-type activities as follows:
Capital OperatingLeases Leases Total
Fiscal Year-Ending September 30, 2017 10,315$ 553$ 10,868$ 2018 10,220 214 10,434 2019 8,336 86 8,422 2020 2,592 2,592 2021 1,890 1,890
2022-2026 1,382 1,382 2027-2031 69 69
Future Minimum Lease Payments 34,804 853$ 35,657$ Less: Interest (1,206)
Present Value of Future Minimum Lease Payments 33,598 Less: Current Portion (9,888)
Capital Leases, Net of Current Portion 23,710$
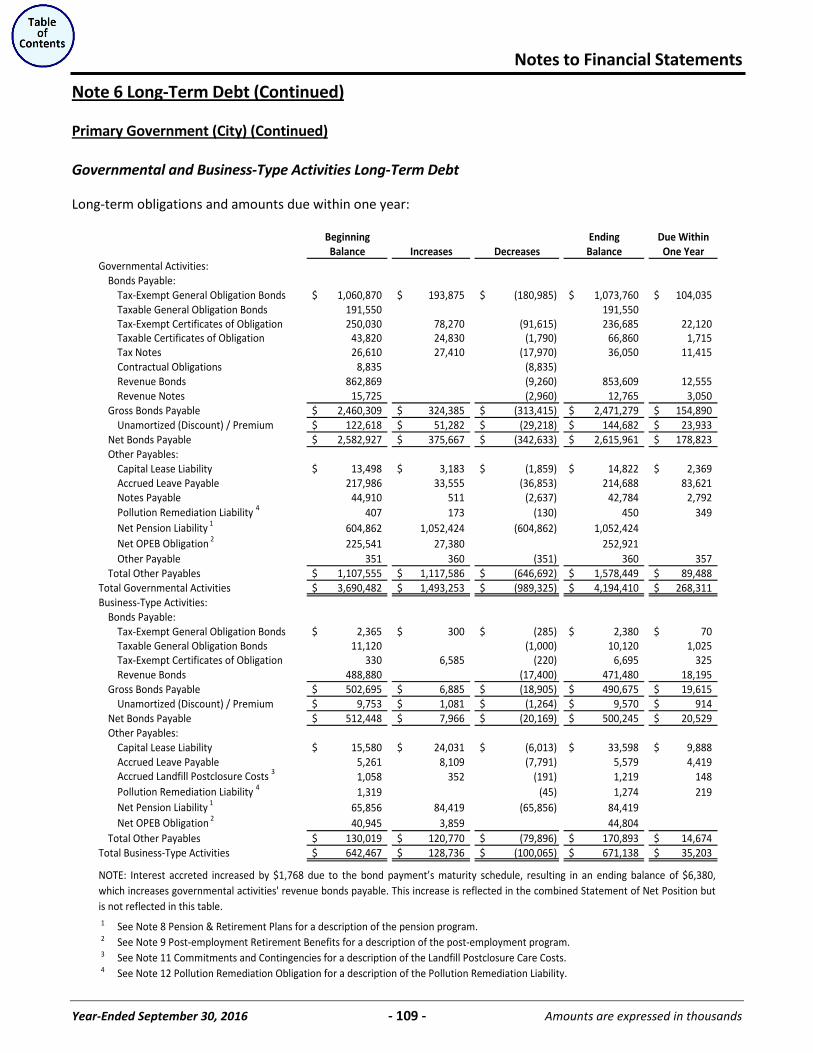
Notes to Financial Statements
Year-Ended September 30, 2016 - 109 - Amounts are expressed in thousands
Note 6 Long-Term Debt (Continued)
Primary Government (City) (Continued)
Governmental and Business-Type Activities Long-Term Debt
Long-term obligations and amounts due within one year:
Beginning Ending Due WithinBalance Increases Decreases Balance One Year
Governmental Activities:Bonds Payable:
Tax-Exempt General Obligation Bonds 1,060,870$ 193,875$ (180,985)$ 1,073,760$ 104,035$ Taxable General Obligation Bonds 191,550 191,550 Tax-Exempt Certificates of Obligation 250,030 78,270 (91,615) 236,685 22,120 Taxable Certificates of Obligation 43,820 24,830 (1,790) 66,860 1,715 Tax Notes 26,610 27,410 (17,970) 36,050 11,415 Contractual Obligations 8,835 (8,835) Revenue Bonds 862,869 (9,260) 853,609 12,555 Revenue Notes 15,725 (2,960) 12,765 3,050
Gross Bonds Payable 2,460,309$ 324,385$ (313,415)$ 2,471,279$ 154,890$ Unamortized (Discount) / Premium 122,618$ 51,282$ (29,218)$ 144,682$ 23,933$
Net Bonds Payable 2,582,927$ 375,667$ (342,633)$ 2,615,961$ 178,823$ Other Payables:
Capital Lease Liability 13,498$ 3,183$ (1,859)$ 14,822$ 2,369$ Accrued Leave Payable 217,986 33,555 (36,853) 214,688 83,621 Notes Payable 44,910 511 (2,637) 42,784 2,792 Pollution Remediation Liability 4 407 173 (130) 450 349 Net Pension Liability 1 604,862 1,052,424 (604,862) 1,052,424 Net OPEB Obligation 2 225,541 27,380 252,921 Other Payable 351 360 (351) 360 357
Total Other Payables 1,107,555$ 1,117,586$ (646,692)$ 1,578,449$ 89,488$ Total Governmental Activities 3,690,482$ 1,493,253$ (989,325)$ 4,194,410$ 268,311$ Business-Type Activities:
Bonds Payable:Tax-Exempt General Obligation Bonds 2,365$ 300$ (285)$ 2,380$ 70$ Taxable General Obligation Bonds 11,120 (1,000) 10,120 1,025 Tax-Exempt Certificates of Obligation 330 6,585 (220) 6,695 325 Revenue Bonds 488,880 (17,400) 471,480 18,195
Gross Bonds Payable 502,695$ 6,885$ (18,905)$ 490,675$ 19,615$ Unamortized (Discount) / Premium 9,753$ 1,081$ (1,264)$ 9,570$ 914$
Net Bonds Payable 512,448$ 7,966$ (20,169)$ 500,245$ 20,529$ Other Payables:
Capital Lease Liability 15,580$ 24,031$ (6,013)$ 33,598$ 9,888$ Accrued Leave Payable 5,261 8,109 (7,791) 5,579 4,419 Accrued Landfill Postclosure Costs 3 1,058 352 (191) 1,219 148 Pollution Remediation Liability 4 1,319 (45) 1,274 219 Net Pension Liability 1 65,856 84,419 (65,856) 84,419 Net OPEB Obligation 2 40,945 3,859 44,804
Total Other Payables 130,019$ 120,770$ (79,896)$ 170,893$ 14,674$ Total Business-Type Activities 642,467$ 128,736$ (100,065)$ 671,138$ 35,203$
1 See Note 8 Pension & Retirement Plans for a description of the pension program.2 See Note 9 Post-employment Retirement Benefits for a description of the post-employment program.3 See Note 11 Commitments and Contingencies for a description of the Landfill Postclosure Care Costs.4 See Note 12 Pollution Remediation Obligation for a description of the Pollution Remediation Liability.
NOTE: Interest accreted increased by $1,768 due to the bond payment’s maturity schedule, resulting in an ending balance of $6,380,which increases governmental activities' revenue bonds payable. This increase is reflected in the combined Statement of Net Position butis not reflected in this table.
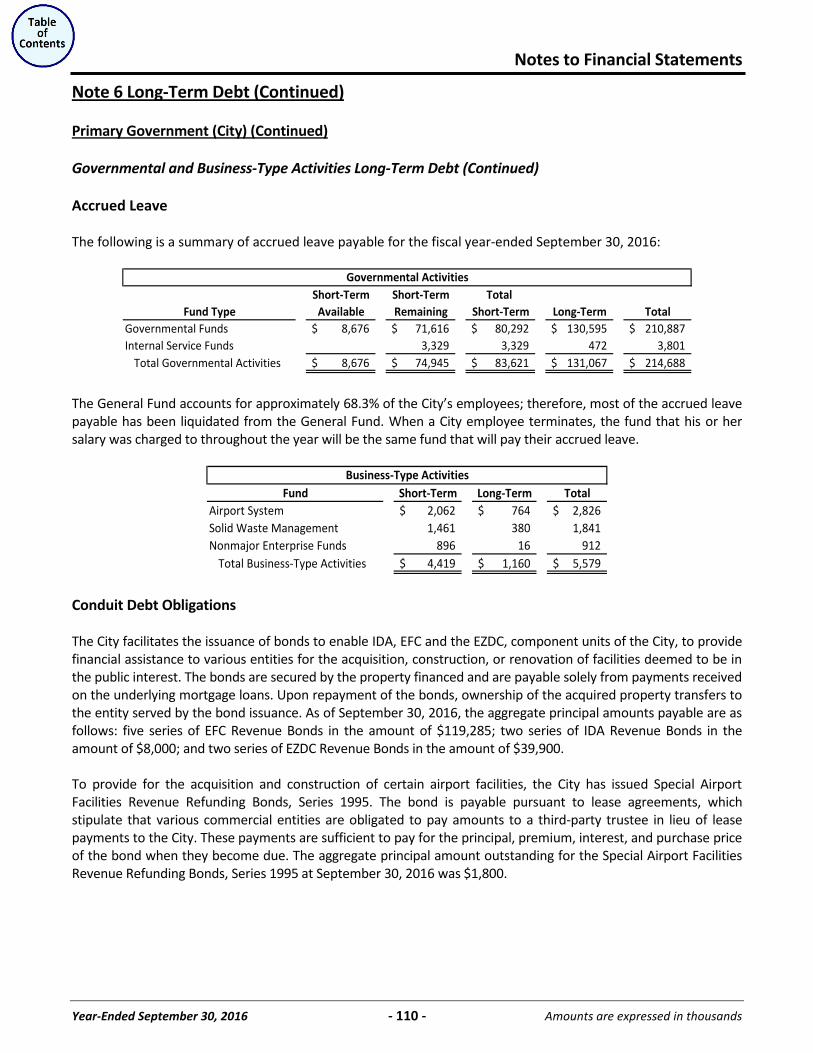
Notes to Financial Statements
Year-Ended September 30, 2016 - 110 - Amounts are expressed in thousands
Note 6 Long-Term Debt (Continued)
Primary Government (City) (Continued)
Governmental and Business-Type Activities Long-Term Debt (Continued) Accrued Leave The following is a summary of accrued leave payable for the fiscal year-ended September 30, 2016:
Short-Term Short-Term Total Fund Type Available Remaining Short-Term Long-Term Total
Governmental Funds 8,676$ 71,616$ 80,292$ 130,595$ 210,887$ Internal Service Funds 3,329 3,329 472 3,801
Total Governmental Activities 8,676$ 74,945$ 83,621$ 131,067$ 214,688$
Governmental Activities
The General Fund accounts for approximately 68.3% of the City’s employees; therefore, most of the accrued leave payable has been liquidated from the General Fund. When a City employee terminates, the fund that his or her salary was charged to throughout the year will be the same fund that will pay their accrued leave.
Fund Short-Term Long-Term TotalAirport System 2,062$ 764$ 2,826$ Solid Waste Management 1,461 380 1,841 Nonmajor Enterprise Funds 896 16 912
Total Business-Type Activities 4,419$ 1,160$ 5,579$
Business-Type Activities
Conduit Debt Obligations The City facilitates the issuance of bonds to enable IDA, EFC and the EZDC, component units of the City, to provide financial assistance to various entities for the acquisition, construction, or renovation of facilities deemed to be in the public interest. The bonds are secured by the property financed and are payable solely from payments received on the underlying mortgage loans. Upon repayment of the bonds, ownership of the acquired property transfers to the entity served by the bond issuance. As of September 30, 2016, the aggregate principal amounts payable are as follows: five series of EFC Revenue Bonds in the amount of $119,285; two series of IDA Revenue Bonds in the amount of $8,000; and two series of EZDC Revenue Bonds in the amount of $39,900. To provide for the acquisition and construction of certain airport facilities, the City has issued Special Airport Facilities Revenue Refunding Bonds, Series 1995. The bond is payable pursuant to lease agreements, which stipulate that various commercial entities are obligated to pay amounts to a third-party trustee in lieu of lease payments to the City. These payments are sufficient to pay for the principal, premium, interest, and purchase price of the bond when they become due. The aggregate principal amount outstanding for the Special Airport Facilities Revenue Refunding Bonds, Series 1995 at September 30, 2016 was $1,800.
Notes to Financial Statements
Year-Ended September 30, 2016 - 111 - Amounts are expressed in thousands
Note 6 Long-Term Debt (Continued)
Primary Government (City) (Continued)
Governmental and Business-Type Activities Long-Term Debt (Continued) The City has authorized the San Antonio Housing Trust Finance Corporation to issue single-family and multi-family mortgage revenue bonds used to provide affordable housing to the citizens of San Antonio. The bonds are payable solely out of the revenues and receipts derived from any residential development or home mortgage financed by the bonds. As of September 30, 2016, the amount of conduit debt was $32,338. The City also facilitates the issuance of tax-exempt revenue bonds for SAEAPFC to enter into long-term prepaid purchases of natural gas. SAEAPFC, in turn, sells contracted volumes of the prepaid gas to CPS Energy on a monthly basis at a discounted rate, which is passed on to CPS Energy’s gas customers through reduced utility costs. The bonds are secured by the gas supplier and are payable primarily from the contracted volume sales and associated gas swap payments. As of September 30, 2016, SAEAPFC has one series of tax-exempt revenue bonds with an aggregate principal amount outstanding of $326,000. Neither the City, the State of Texas, nor any political subdivision of the State of Texas is obligated in any manner for repayment of the aforementioned bonds, loans or leases. Accordingly, the bonds, loans, and leases are not reported as liabilities in the accompanying financial statements.
CPS Energy
To support its long-term capital financing needs, CPS Energy uses several types of debt instruments. As of January 31, 2016 these included fixed-rate and variable-rate bonds, as well as commercial paper. Relative to the bond instruments, provisions may be included that allow for refunding after specified time periods during the bond term. Subject to applicable timing restrictions that may prevent early payoff, CPS Energy also has the option to defease or extinguish debt. A defeasance occurs when funds are placed in an irrevocable trust to be used solely for satisfying scheduled payments of both interest and principal of the defeased debt, which fully discharges the bond issuer’s obligation. At the time of an extinguishment, since the issuer no longer has the legal obligation, the defeased debt is removed from the Statement of Net Position, the related unamortized costs are expensed, and the gain or loss is immediately recognized. Current refundings involve issuing new debt (refunding bonds) to redeem existing debt (refunded bonds) that can be called within 90 days of the call date of the refunding bonds. Advance refunding of bonds involves issuing new debt to redeem existing debt that cannot be called within 90 days of issuing the refunding bonds. In these circumstances, the refunding bond proceeds are irrevocably escrowed with a third party. These proceeds, and income thereon, are used to pay the debt service on the refunded bonds until the refunded bonds can be called. Refunding bonds are generally issued to achieve debt service savings.
Notes to Financial Statements
Year-Ended September 30, 2016 - 112 - Amounts are expressed in thousands
Note 6 Long-Term Debt (Continued)
CPS Energy (Continued)
As of January 31, 2016, the bond ordinances for New Series Bonds contained, among others, the following provisions: Revenue deposited in CPS Energy’s General Account shall be pledged and appropriated to be used in the following priority for:
Maintenance and operating expenses of CPS Energy; Payment of the New Series Bonds; Payment of prior lien bonds, including junior lien obligations; Payment of the notes and the credit agreement (as defined in the ordinance authorizing commercial paper); Payment of any inferior lien obligations issued, which are inferior in lien to the New Series Bonds, the prior lien bonds and the notes and credit agreement; An annual amount equal to 6.0% of the gross revenue of CPS Energy to be deposited in the Repair and Replacement Account; Cash payments and benefits to the General Fund of the City not to exceed 14.0% of the gross revenues of CPS Energy; and Any remaining net revenues of CPS Energy in the General Account to the Repair and Replacement Account, which is used to partially fund construction costs.
The maximum amount in cash to be transferred or credited to the City’s General Fund from the net revenues of CPS Energy during any fiscal year shall not exceed 14.0% of the gross revenues of CPS Energy, less the value of gas and electric services of CPS Energy used by the City for municipal purposes and the amounts expended during the fiscal year for additions to the street lighting system and other authorized exclusions. The percentage of gross revenues of CPS Energy to be paid over, or credited to, the City’s General Fund each fiscal year shall be determined (within the 14.0% limitation) by the governing body of the City. The net revenues of CPS Energy are pledged to the payment of principal of and interest on the New Series Bonds, which are classified as senior lien obligations. All New Series Bonds and the interest thereon shall have a first lien upon the net revenues of CPS Energy. The junior lien obligations are composed of two categories of debt: fixed interest rate and variable interest rate. The junior lien fixed interest rate debt is similar to the senior lien New Series Bonds, as they have fixed and set interest rates for the life of the bonds. The junior lien, Variable-Rate Demand Obligations and Variable-Rate Note bonds are debt instruments of CPS Energy. The junior lien obligations are payable solely from, and equally and ratably secured by, a junior lien on and pledge of the net revenues of CPS Energy, subject and subordinate to liens and pledges securing the outstanding senior lien obligations and any additional senior lien obligations hereafter issued, and superior to the pledge and lien securing the currently outstanding commercial paper obligations, all as fully set forth in the ordinances authorizing the issuance of the junior lien obligations as noted on the next page.
Notes to Financial Statements
Year-Ended September 30, 2016 - 113 - Amounts are expressed in thousands
Note 6 Long-Term Debt (Continued)
CPS Energy (Continued)
The City agrees that it will at all times maintain rates and charges for the sale of electric energy, gas, or other services furnished, provided, and supplied by CPS Energy to the City and all other consumers, which shall be reasonable and nondiscriminatory and which will produce income and revenues sufficient to pay:
All operation and maintenance expenses, depreciation, replacement and betterment expenses, and other costs as may be required by Chapter 1502 of the Texas Government Code, as amended; The interest on, and principal of, all parity bonds, as defined in the New Series Bond ordinances, as and when the same shall become due, and for the establishment and maintenance of the funds and accounts created for the payment and security of the parity bonds; The interest on, and principal of, the prior lien bonds, including the junior lien obligations and any additional junior lien obligations hereafter issued (all as defined in the New Series Bond ordinances), as and when the same shall become due, and for the establishment and maintenance of the funds and accounts created for the payment and security of the junior lien obligations and any additional junior lien obligations; To the extent the same are reasonably anticipated to be paid with available revenues (as defined in the ordinance authorizing the commercial paper), the interest on and principal of all notes (as defined in said ordinance), and the credit agreement (as defined in said ordinance); and Any legal debt or obligation of CPS Energy as and when the same shall become due.
Revenue Bonds On August 13, 2015, CPS Energy issued $320,530 of New Series 2015 Senior Lien Revenue Refunding Bonds. Proceeds, including the $43,345 premium associated with the bonds, were used to refund $339,490 par value of the Series 2007 Revenue Bonds. The refunding transaction resulted in a net present value debt service savings of $36,894, or 10.9% of the par amount of the bonds being refunded. The true interest cost for this issue, which has maturities in 2018 through 2032, is 3.0%. On December 1, 2015, CPS Energy remarketed $47,650 of Series 2012B Variable-Rate Junior Lien Revenue Refunding Bonds. The issuance of a $474 premium in conjunction with the remarketing resulted in a principal paydown for the remarketed bonds of approximately $165. The bonds have maturities in 2024 through 2027. The coupon rate for these bonds is 1.8%, with a current yield of 1.4% and true interest cost of 5.8%, which reflects stepped interest rate provisions applicable to the bonds. On December 3, 2015, CPS Energy issued $235,000 of New Series 2015 Fixed-Rate Revenue Bonds, including a premium of $12,873. The true interest cost for this issue, which has maturities in 2026 through 2039, is 3.5%. The bonds were issued with interest rates varying from 3.0% to 5.0%. Bond proceeds are primarily being used to fund construction projects. Also on December 3, 2015, CPS Energy issued $200,000 of Variable-Rate Junior Lien Revenue Bonds, $100,000 each of Series 2015C and Series 2015D, including a total premium of $12,900. Reflecting stepped interest rate provisions applicable to the bonds, the true interest cost for these bonds, which have maturities in 2038 through 2045, is 6.3% for the Series 2015C bonds and 6.0% for the Series D bonds. Bond proceeds are primarily being used to fund construction projects.
Notes to Financial Statements
Year-Ended September 30, 2016 - 114 - Amounts are expressed in thousands
Note 6 Long-Term Debt (Continued)
CPS Energy (Continued)
Revenue Bonds (Continued)
The Series 2012A and 2012C Junior Lien Bonds were issued as variable-rate bonds that utilize interest rates of 2.0% through their term rate period’s expiration in 2018 and 2016, respectively. A stepped rate of 7.0% is assumed in the table below for each series thereafter through applicable final maturity. The Series 2012B bonds were issued as variable-rate bonds that utilize an interest rate of 1.8% through their term rate period's expiration in 2018. A stepped rate of 8.0% is assumed in the table below for this series thereafter through applicable final maturity. The stepped rate is applicable only if the bonds are not remarketed by their respective expiration date. The Series 2015A and Series 2015B Junior Lien Bonds were issued as multi-modal variable-rate bonds issued initially in a SIFMA Index Mode with an applicable spread of 0.3% and 0.4%, respectively, through their term rate periods of 2017 and 2018 and at a stepped rate of 8.0% for each series thereafter through applicable final maturity. In the table below, interest on these variable-rate bonds is calculated at an assumed rate of 3.0% for the applicable initial interest period and at an assumed stepped rate of 8.0% thereafter through stated maturity. The stepped rate is applicable only if the bonds are not remarketed by their respective expiration date. The Series 2015C and Series 2015D Junior Lien Bonds were issued as multi-modal variable-rate bonds initially issued in a term rate mode as variable-rate bonds that utilize an interest rate of 3.0% through their term rate period's expiration in 2019 and 2020, respectively. A stepped rate of 8.0% is assumed thereafter through applicable final maturity. The stepped rate is applicable only if the bonds are not remarketed by their respective expiration date. Pursuant to guidance provided in GASB Statement No. 65, debt reacquisition costs meet neither the definition of an asset nor a liability and are therefore required to be classified as deferred outflows or inflows of resources on the Statements of Net Position. Debt reacquisition costs reported as deferred outflows of resources totaled $65,612 at January 31, 2016. These amounts are amortized as components of interest expense over the shorter of the remaining life of the refunding or the refunded debt. CPS Energy, as a rate-regulated entity and in accordance with guidance found in GASB Statement No. 62, has establishes regulatory assets for debt issuance costs that would otherwise be required to be expensed in accordance with GASB Statement No. 65. This regulatory accounting treatment results in the amortization of these costs over the life of the related debt. Debt issuance costs, which are reported within other noncurrent assets on the Statements of Net Position, totaled $33,610 at January 31, 2016.
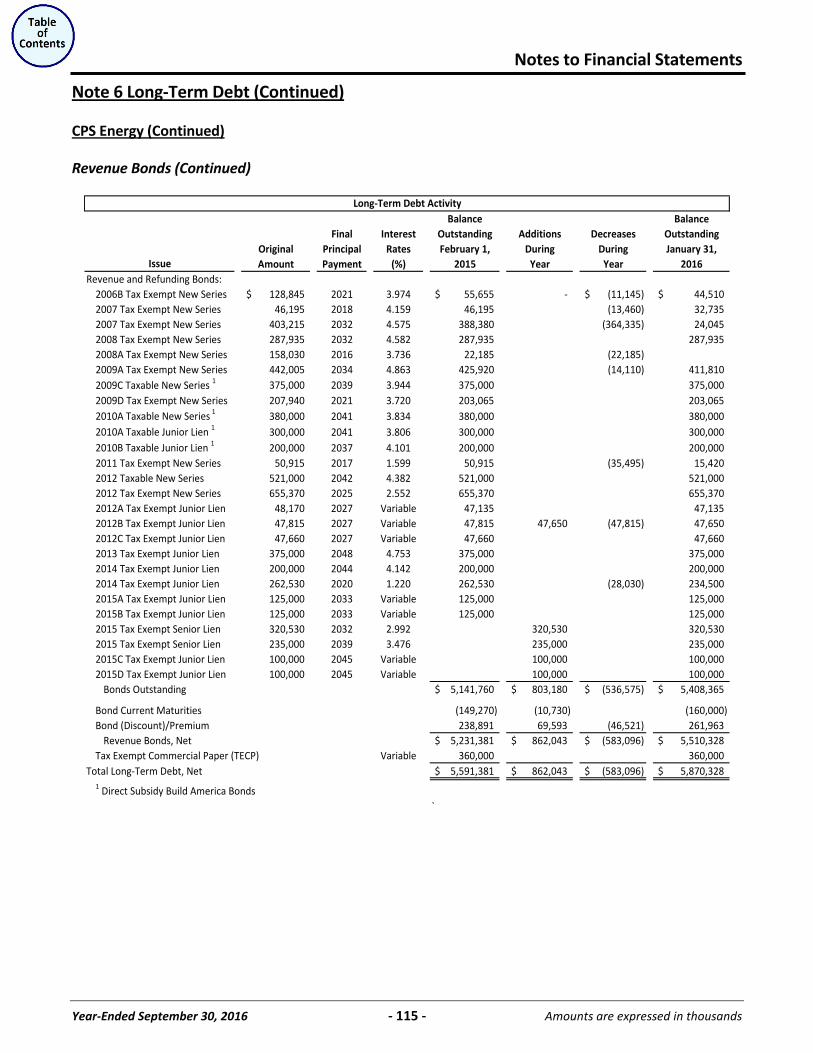
Notes to Financial Statements
Year-Ended September 30, 2016 - 115 - Amounts are expressed in thousands
Note 6 Long-Term Debt (Continued)
CPS Energy (Continued)
Revenue Bonds (Continued)
Balance BalanceFinal Interest Outstanding Additions Decreases Outstanding
Original Principal Rates February 1, During During January 31,Amount Payment (%) 2015 Year Year 2016
Revenue and Refunding Bonds:2006B Tax Exempt New Series 128,845$ 2021 3.974 55,655$ - (11,145)$ 44,510$ 2007 Tax Exempt New Series 46,195 2018 4.159 46,195 (13,460) 32,735 2007 Tax Exempt New Series 403,215 2032 4.575 388,380 (364,335) 24,045 2008 Tax Exempt New Series 287,935 2032 4.582 287,935 287,935 2008A Tax Exempt New Series 158,030 2016 3.736 22,185 (22,185) 2009A Tax Exempt New Series 442,005 2034 4.863 425,920 (14,110) 411,810 2009C Taxable New Series 1 375,000 2039 3.944 375,000 375,000 2009D Tax Exempt New Series 207,940 2021 3.720 203,065 203,065 2010A Taxable New Series 1 380,000 2041 3.834 380,000 380,000 2010A Taxable Junior Lien 1 300,000 2041 3.806 300,000 300,000 2010B Taxable Junior Lien 1 200,000 2037 4.101 200,000 200,000 2011 Tax Exempt New Series 50,915 2017 1.599 50,915 (35,495) 15,420 2012 Taxable New Series 521,000 2042 4.382 521,000 521,000 2012 Tax Exempt New Series 655,370 2025 2.552 655,370 655,370 2012A Tax Exempt Junior Lien 48,170 2027 Variable 47,135 47,135 2012B Tax Exempt Junior Lien 47,815 2027 Variable 47,815 47,650 (47,815) 47,650 2012C Tax Exempt Junior Lien 47,660 2027 Variable 47,660 47,660 2013 Tax Exempt Junior Lien 375,000 2048 4.753 375,000 375,000 2014 Tax Exempt Junior Lien 200,000 2044 4.142 200,000 200,000 2014 Tax Exempt Junior Lien 262,530 2020 1.220 262,530 (28,030) 234,500 2015A Tax Exempt Junior Lien 125,000 2033 Variable 125,000 125,000 2015B Tax Exempt Junior Lien 125,000 2033 Variable 125,000 125,000 2015 Tax Exempt Senior Lien 320,530 2032 2.992 320,530 320,530 2015 Tax Exempt Senior Lien 235,000 2039 3.476 235,000 235,000 2015C Tax Exempt Junior Lien 100,000 2045 Variable 100,000 100,000 2015D Tax Exempt Junior Lien 100,000 2045 Variable 100,000 100,000
Bonds Outstanding 5,141,760$ 803,180$ (536,575)$ 5,408,365$
Bond Current Maturities (149,270) (10,730) (160,000) Bond (Discount)/Premium 238,891 69,593 (46,521) 261,963
Revenue Bonds, Net 5,231,381$ 862,043$ (583,096)$ 5,510,328$ Tax Exempt Commercial Paper (TECP) Variable 360,000 360,000
Total Long-Term Debt, Net 5,591,381$ 862,043$ (583,096)$ 5,870,328$ 1 Direct Subsidy Build America Bonds
`
Long-Term Debt Activity
Issue
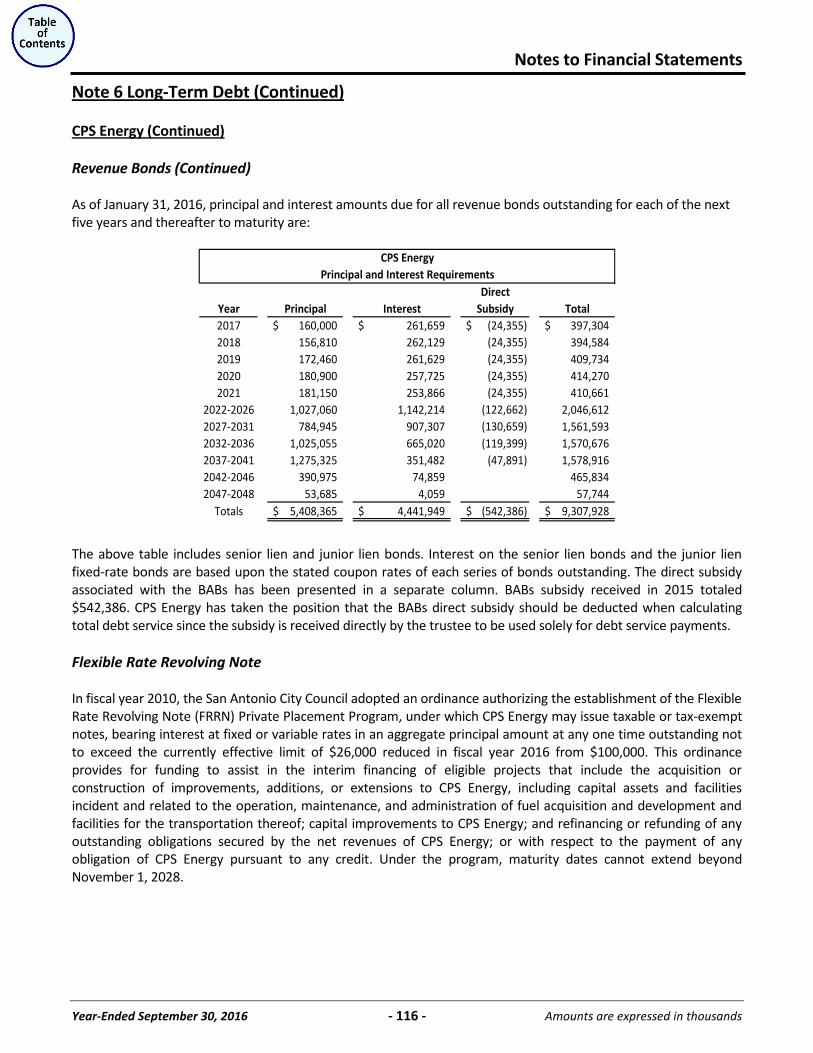
Notes to Financial Statements
Year-Ended September 30, 2016 - 116 - Amounts are expressed in thousands
Note 6 Long-Term Debt (Continued)
CPS Energy (Continued)
Revenue Bonds (Continued) As of January 31, 2016, principal and interest amounts due for all revenue bonds outstanding for each of the next five years and thereafter to maturity are:
DirectYear Principal Interest Subsidy Total2017 160,000$ 261,659$ (24,355)$ 397,304$ 2018 156,810 262,129 (24,355) 394,584 2019 172,460 261,629 (24,355) 409,734 2020 180,900 257,725 (24,355) 414,270 2021 181,150 253,866 (24,355) 410,661
2022-2026 1,027,060 1,142,214 (122,662) 2,046,612 2027-2031 784,945 907,307 (130,659) 1,561,593 2032-2036 1,025,055 665,020 (119,399) 1,570,676 2037-2041 1,275,325 351,482 (47,891) 1,578,916 2042-2046 390,975 74,859 465,834 2047-2048 53,685 4,059 57,744
Totals 5,408,365$ 4,441,949$ (542,386)$ 9,307,928$
CPS EnergyPrincipal and Interest Requirements
The above table includes senior lien and junior lien bonds. Interest on the senior lien bonds and the junior lien fixed-rate bonds are based upon the stated coupon rates of each series of bonds outstanding. The direct subsidy associated with the BABs has been presented in a separate column. BABs subsidy received in 2015 totaled $542,386. CPS Energy has taken the position that the BABs direct subsidy should be deducted when calculating total debt service since the subsidy is received directly by the trustee to be used solely for debt service payments. Flexible Rate Revolving Note In fiscal year 2010, the San Antonio City Council adopted an ordinance authorizing the establishment of the Flexible Rate Revolving Note (FRRN) Private Placement Program, under which CPS Energy may issue taxable or tax-exempt notes, bearing interest at fixed or variable rates in an aggregate principal amount at any one time outstanding not to exceed the currently effective limit of $26,000 reduced in fiscal year 2016 from $100,000. This ordinance provides for funding to assist in the interim financing of eligible projects that include the acquisition or construction of improvements, additions, or extensions to CPS Energy, including capital assets and facilities incident and related to the operation, maintenance, and administration of fuel acquisition and development and facilities for the transportation thereof; capital improvements to CPS Energy; and refinancing or refunding of any outstanding obligations secured by the net revenues of CPS Energy; or with respect to the payment of any obligation of CPS Energy pursuant to any credit. Under the program, maturity dates cannot extend beyond November 1, 2028.
Notes to Financial Statements
Year-Ended September 30, 2016 - 117 - Amounts are expressed in thousands
Note 6 Long-Term Debt (Continued)
CPS Energy (Continued)
Flexible Rate Revolving Note (Continued) On May 10, 2010, CPS Energy issued a $25,200 taxable Flexible Rate Revolving Note, Series A, under its taxable Note Purchase Agreement with JPMorgan Chase Bank, N.A., which currently serves as the note purchaser under the program. On May 11, 2010, the proceeds from the note, along with cash, were used to defease $25,700 in principal amounts of the allocable portion of the debt associated with the common facilities of STP Units 1 and 2 that were assigned to NINA in March 2010 when CPS Energy reduced its ownership share of STP Units 3 and 4 to 7.6%. The outstanding FRRN balance at January 31, 2016 was $25,200. The FRRN has been classified as current in accordance with the financing terms under the taxable Note Purchase Agreement and is reported on the Statements of Net Position under current maturities of debt. At January 31, 2016, only the taxable facility was being utilized through the taxable Note Purchase Agreement. The taxable notes are being secured by a pledge of investment collateral and a limited, subordinate and inferior lien on and pledge of net revenues in the amount of $100. The current taxable Note Purchase Agreement will expire on December 31, 2016, but through an annual renewal process may be extended through November 1, 2028. Accrued Leave Employees earn vacation benefits based upon their employment status and years of service. As of January 31, 2016 the accruals for employee vested benefits were $17,426. These accruals are reported under Accounts Payable and Other Current Liabilities.
San Antonio Water System (SAWS)
City Ordinance No. 75686 requires that gross revenues of SAWS be applied in sequence to (1) payment of current maintenance and operating expenses including a two-month reserve amount based upon the budgeted amount of maintenance and operating expenses for the current fiscal year; (2) Debt Service Fund requirements of Senior Lien Obligations; (3) Reserve Fund requirements of Senior Lien Obligations; (4) Interest and Sinking Fund and Reserve Fund requirements of Junior Lien Obligations; (5) Interest and Sinking Fund and Reserve Fund requirements of Subordinate Lien Obligations; (6) payment of amounts required on Inferior Lien Obligations; and (7) transfers to the City’s General Fund and to SAWS’ Renewal and Replacement Fund. City Ordinance No. 75686 also provides for no free services except for municipal firefighting purposes. SAWS has a contract with CPS Energy, the City-owned electricity and gas utility, for the provision of reuse water. According to City Ordinance No. 75686, the revenues derived from the contract have been restricted in use to only reuse activities and are excluded from gross revenue for purposes of calculating any transfers to the City’s General Fund.
Notes to Financial Statements
Year-Ended September 30, 2016 - 118 - Amounts are expressed in thousands
Note 6 Long-Term Debt (Continued)
San Antonio Water System (SAWS) (Continued)
Revenue Bonds On January 21, 2015 SAWS issued $75,920 City of San Antonio, Texas Water System Junior Lien Revenue Bonds, Series 2015A through the Texas Water Development Board. The bonds were sold under the Drinking Water State Revolving Fund program. The proceeds from the sale of the bonds were used to (i) finance capital improvement projects which qualify under the Texas Water Development Board Program, and (ii) pay the cost of issuance. The bonds are secured together with other currently outstanding Junior Lien Obligations solely by a lien on a pledge of net revenues and are subordinate to outstanding Senior Lien Obligations. On February 18, 2015, SAWS issued $303,235 City of San Antonio, Texas Water System Junior Lien Revenue and Refunding Bonds, Series 2015B (No Reserve Fund). The proceeds from the sale of the bonds were used to (i) refund the City of San Antonio, Texas Water System Junior Lien Revenue and Refunding Bonds, Series 2004; the City of San Antonio, Texas Water System Junior Lien Revenue and Refunding Bonds, Series 2004-A; and the City of San Antonio, Texas Water System Revenue Refunding Bonds, Series 2005 (together the “Refunded Bonds”), (ii) finance capital improvements, and (iii) pay the cost of issuance. The refunding of the Refunded Bonds reduced total future debt service payments by approximately $81,772 and resulted in an economic gain of $46,941. The bonds are secured together with other currently outstanding Junior Lien Obligations solely by a lien on pledge of net revenues and are subordinate to outstanding Senior Lien Obligations. Senior lien water system revenue bonds, comprised of Series 2007, Series 2009, Series 2009B, Series 2010B, Series 2011, Series 2011A, Series 2012, and Series 2012A, outstanding in the amount of $1,157,305 at December 31, 2015, are collateralized by a senior lien and pledge of the gross revenues of SAWS after deducting and paying the current expenses of operation and maintenance of SAWS and maintaining a two-month operating reserve for such expenses. Interest rates range from 2.8% to 6.2%, exclusive of any federal interest subsidy on the Series 2009B and 2010B Build America Bonds. Junior lien water system revenue bonds, comprised of Series 2007, Series 2007A, Series 2008, Series 2008A, Series 2009, Series 2009A, Series 2010, Series 2010A, Series 2011, Series 2011A, Series 2012 (No Reserve Fund), Series 2012, Series 2013A, Series 2013B (No Reserve Fund), Series 2013C, Series 2013D, Series 2013E (No Reserve Fund), Series 2014A (No Reserve Fund), Series 2014C, Series 2014D, Series 2015A, and Series 2015B (No Reserve Fund) is outstanding in the amount of $1,087,430 at December 31, 2015, are collateralized by a junior lien and pledge of the gross revenues of SAWS after deducting the current expenses of operation and maintenance of SAWS, maintaining a two month operating reserve for such expenses, and paying debt service on senior lien debt. Interest rates range from 0.0% to 5.0%. The junior lien variable-interest-rate bonds, comprised of the Series 2013F (No Reserve Fund) and the Series 2014B (No Reserve Fund), are outstanding in the amount of $200,000. The Series 2013F Bonds are tax-exempt variable-interest-rate notes initially issued in a Securities Industry and Financial Markets Association (SIFMA) Index Mode, with the interest rate reset weekly, through the initial interest period expiring October 31, 2016, at a spread of 0.7% over the SIFMA Swap Index. The average and ending interest rate at December 31, 2015 was 0.7%. The Series 2014B Bonds are tax-exempt variable-interest-rate notes initially issued in a SIFMA Index Mode, with the interest rate reset weekly, through the initial interest period expiring October 31, 2017, at a spread of 0.4% over the SIFMA Swap Index. The average and ending interest rate at December 31, 2015 was 0.4%. Upon conclusion of the initial interest period of the Bonds, SAWS is permitted to change the mode for all or any portion of the Bonds to a different mode or to a SIFMA Index Mode of different duration. The Bonds are subject to a mandatory tender without right of retention at the conclusion of the initial interest period. During the initial interest period the Bonds
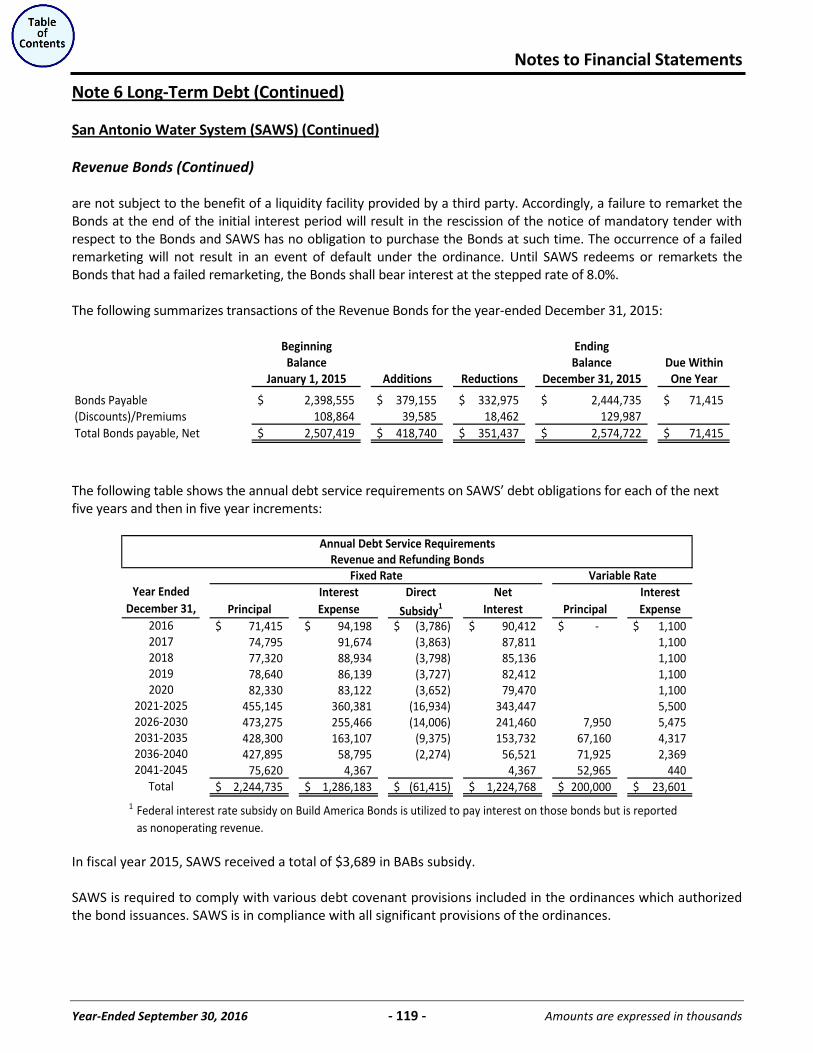
Notes to Financial Statements
Year-Ended September 30, 2016 - 119 - Amounts are expressed in thousands
Note 6 Long-Term Debt (Continued)
San Antonio Water System (SAWS) (Continued)
Revenue Bonds (Continued) are not subject to the benefit of a liquidity facility provided by a third party. Accordingly, a failure to remarket the Bonds at the end of the initial interest period will result in the rescission of the notice of mandatory tender with respect to the Bonds and SAWS has no obligation to purchase the Bonds at such time. The occurrence of a failed remarketing will not result in an event of default under the ordinance. Until SAWS redeems or remarkets the Bonds that had a failed remarketing, the Bonds shall bear interest at the stepped rate of 8.0%. The following summarizes transactions of the Revenue Bonds for the year-ended December 31, 2015:
Beginning EndingBalance Balance Due Within
January 1, 2015 Additions Reductions December 31, 2015 One Year
Bonds Payable 2,398,555$ 379,155$ 332,975$ 2,444,735$ 71,415$ (Discounts)/Premiums 108,864 39,585 18,462 129,987 Total Bonds payable, Net 2,507,419$ 418,740$ 351,437$ 2,574,722$ 71,415$
The following table shows the annual debt service requirements on SAWS’ debt obligations for each of the next five years and then in five year increments:
Interest Direct Net InterestPrincipal Expense Subsidy1 Interest Principal Expense
71,415$ 94,198$ (3,786)$ 90,412$ -$ 1,100$ 74,795 91,674 (3,863) 87,811 1,100 77,320 88,934 (3,798) 85,136 1,100 78,640 86,139 (3,727) 82,412 1,100 82,330 83,122 (3,652) 79,470 1,100
455,145 360,381 (16,934) 343,447 5,500 473,275 255,466 (14,006) 241,460 7,950 5,475 428,300 163,107 (9,375) 153,732 67,160 4,317 427,895 58,795 (2,274) 56,521 71,925 2,369
75,620 4,367 4,367 52,965 440 2,244,735$ 1,286,183$ (61,415)$ 1,224,768$ 200,000$ 23,601$
1 Federal interest rate subsidy on Build America Bonds is utilized to pay interest on those bonds but is reported as nonoperating revenue.
Year EndedDecember 31,
2016
Total
2036-20402041-2045
20172018
2020
Annual Debt Service RequirementsRevenue and Refunding Bonds
2026-20302031-2035
2021-2025
Variable RateFixed Rate
2019
In fiscal year 2015, SAWS received a total of $3,689 in BABs subsidy. SAWS is required to comply with various debt covenant provisions included in the ordinances which authorized the bond issuances. SAWS is in compliance with all significant provisions of the ordinances.
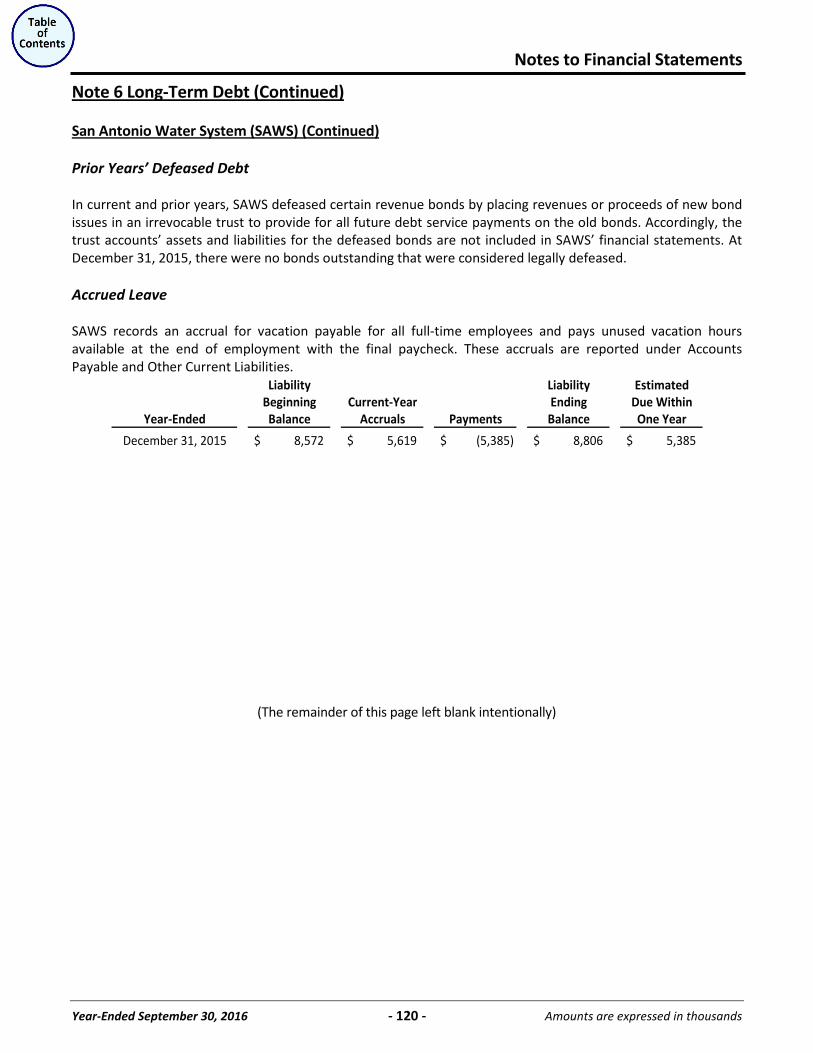
Notes to Financial Statements
Year-Ended September 30, 2016 - 120 - Amounts are expressed in thousands
Note 6 Long-Term Debt (Continued)
San Antonio Water System (SAWS) (Continued)
Prior Years’ Defeased Debt In current and prior years, SAWS defeased certain revenue bonds by placing revenues or proceeds of new bond issues in an irrevocable trust to provide for all future debt service payments on the old bonds. Accordingly, the trust accounts’ assets and liabilities for the defeased bonds are not included in SAWS’ financial statements. At December 31, 2015, there were no bonds outstanding that were considered legally defeased. Accrued Leave SAWS records an accrual for vacation payable for all full-time employees and pays unused vacation hours available at the end of employment with the final paycheck. These accruals are reported under Accounts Payable and Other Current Liabilities.
Liability Liability EstimatedBeginning Current-Year Ending Due Within
Year-Ended Balance Accruals Payments Balance One Year
December 31, 2015 8,572$ 5,619$ (5,385)$ 8,806$ 5,385$
(The remainder of this page left blank intentionally)
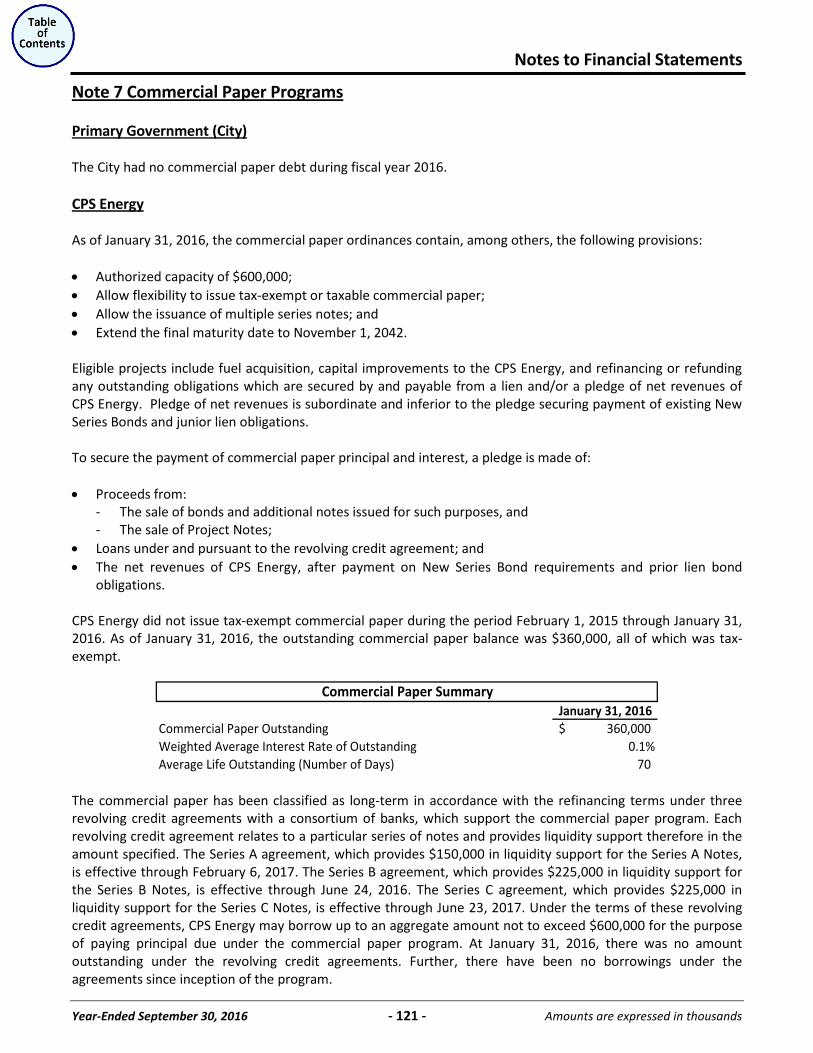
Notes to Financial Statements
Year-Ended September 30, 2016 - 121 - Amounts are expressed in thousands
Note 7 Commercial Paper Programs
Primary Government (City)
The City had no commercial paper debt during fiscal year 2016.
CPS Energy
As of January 31, 2016, the commercial paper ordinances contain, among others, the following provisions:
Authorized capacity of $600,000; Allow flexibility to issue tax-exempt or taxable commercial paper; Allow the issuance of multiple series notes; and Extend the final maturity date to November 1, 2042.
Eligible projects include fuel acquisition, capital improvements to the CPS Energy, and refinancing or refunding any outstanding obligations which are secured by and payable from a lien and/or a pledge of net revenues of CPS Energy. Pledge of net revenues is subordinate and inferior to the pledge securing payment of existing New Series Bonds and junior lien obligations. To secure the payment of commercial paper principal and interest, a pledge is made of:
Proceeds from: - The sale of bonds and additional notes issued for such purposes, and - The sale of Project Notes; Loans under and pursuant to the revolving credit agreement; and The net revenues of CPS Energy, after payment on New Series Bond requirements and prior lien bond obligations.
CPS Energy did not issue tax-exempt commercial paper during the period February 1, 2015 through January 31, 2016. As of January 31, 2016, the outstanding commercial paper balance was $360,000, all of which was tax-exempt.
January 31, 2016Commercial Paper Outstanding 360,000$ Weighted Average Interest Rate of Outstanding 0.1%Average Life Outstanding (Number of Days) 70
Commercial Paper Summary
The commercial paper has been classified as long-term in accordance with the refinancing terms under three revolving credit agreements with a consortium of banks, which support the commercial paper program. Each revolving credit agreement relates to a particular series of notes and provides liquidity support therefore in the amount specified. The Series A agreement, which provides $150,000 in liquidity support for the Series A Notes, is effective through February 6, 2017. The Series B agreement, which provides $225,000 in liquidity support for the Series B Notes, is effective through June 24, 2016. The Series C agreement, which provides $225,000 in liquidity support for the Series C Notes, is effective through June 23, 2017. Under the terms of these revolving credit agreements, CPS Energy may borrow up to an aggregate amount not to exceed $600,000 for the purpose of paying principal due under the commercial paper program. At January 31, 2016, there was no amount outstanding under the revolving credit agreements. Further, there have been no borrowings under the agreements since inception of the program.
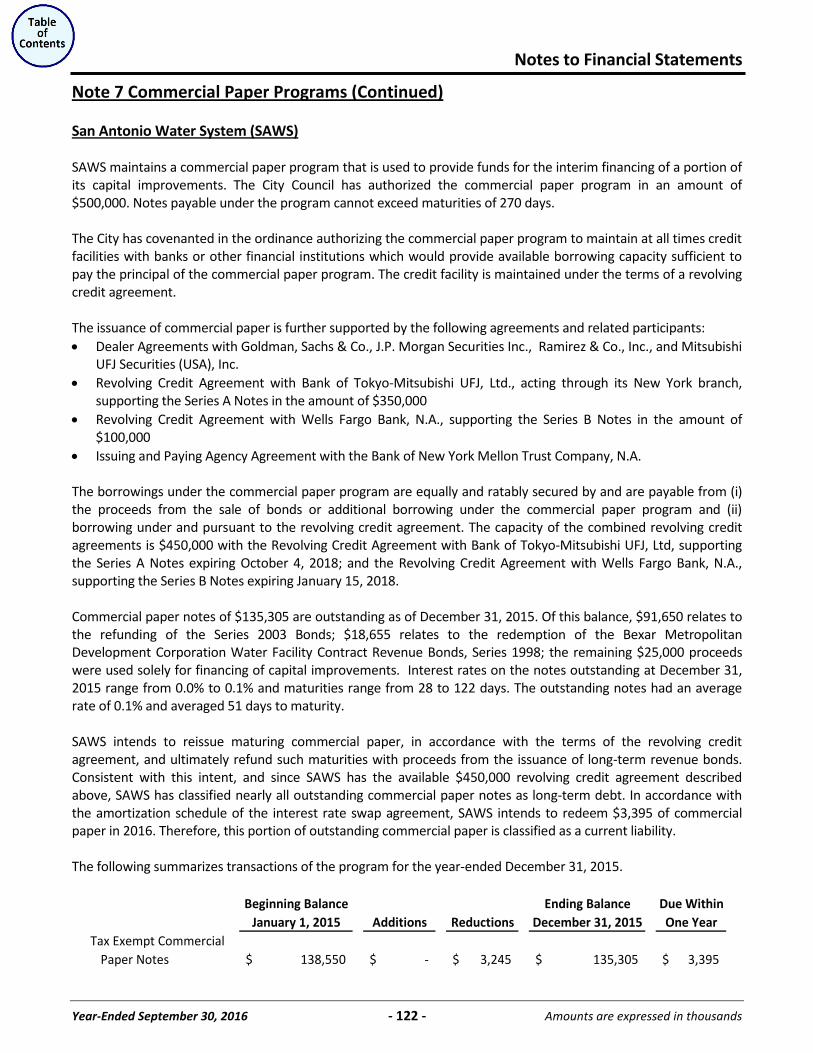
Notes to Financial Statements
Year-Ended September 30, 2016 - 122 - Amounts are expressed in thousands
Note 7 Commercial Paper Programs (Continued)
San Antonio Water System (SAWS)
SAWS maintains a commercial paper program that is used to provide funds for the interim financing of a portion of its capital improvements. The City Council has authorized the commercial paper program in an amount of $500,000. Notes payable under the program cannot exceed maturities of 270 days. The City has covenanted in the ordinance authorizing the commercial paper program to maintain at all times credit facilities with banks or other financial institutions which would provide available borrowing capacity sufficient to pay the principal of the commercial paper program. The credit facility is maintained under the terms of a revolving credit agreement. The issuance of commercial paper is further supported by the following agreements and related participants:
Dealer Agreements with Goldman, Sachs & Co., J.P. Morgan Securities Inc., Ramirez & Co., Inc., and Mitsubishi UFJ Securities (USA), Inc. Revolving Credit Agreement with Bank of Tokyo-Mitsubishi UFJ, Ltd., acting through its New York branch, supporting the Series A Notes in the amount of $350,000 Revolving Credit Agreement with Wells Fargo Bank, N.A., supporting the Series B Notes in the amount of $100,000 Issuing and Paying Agency Agreement with the Bank of New York Mellon Trust Company, N.A.
The borrowings under the commercial paper program are equally and ratably secured by and are payable from (i) the proceeds from the sale of bonds or additional borrowing under the commercial paper program and (ii) borrowing under and pursuant to the revolving credit agreement. The capacity of the combined revolving credit agreements is $450,000 with the Revolving Credit Agreement with Bank of Tokyo-Mitsubishi UFJ, Ltd, supporting the Series A Notes expiring October 4, 2018; and the Revolving Credit Agreement with Wells Fargo Bank, N.A., supporting the Series B Notes expiring January 15, 2018. Commercial paper notes of $135,305 are outstanding as of December 31, 2015. Of this balance, $91,650 relates to the refunding of the Series 2003 Bonds; $18,655 relates to the redemption of the Bexar Metropolitan Development Corporation Water Facility Contract Revenue Bonds, Series 1998; the remaining $25,000 proceeds were used solely for financing of capital improvements. Interest rates on the notes outstanding at December 31, 2015 range from 0.0% to 0.1% and maturities range from 28 to 122 days. The outstanding notes had an average rate of 0.1% and averaged 51 days to maturity. SAWS intends to reissue maturing commercial paper, in accordance with the terms of the revolving credit agreement, and ultimately refund such maturities with proceeds from the issuance of long-term revenue bonds. Consistent with this intent, and since SAWS has the available $450,000 revolving credit agreement described above, SAWS has classified nearly all outstanding commercial paper notes as long-term debt. In accordance with the amortization schedule of the interest rate swap agreement, SAWS intends to redeem $3,395 of commercial paper in 2016. Therefore, this portion of outstanding commercial paper is classified as a current liability. The following summarizes transactions of the program for the year-ended December 31, 2015.
Beginning Balance Ending Balance Due WithinJanuary 1, 2015 Additions Reductions December 31, 2015 One Year
Tax Exempt CommercialPaper Notes 138,550$ -$ 3,245$ 135,305$ 3,395$
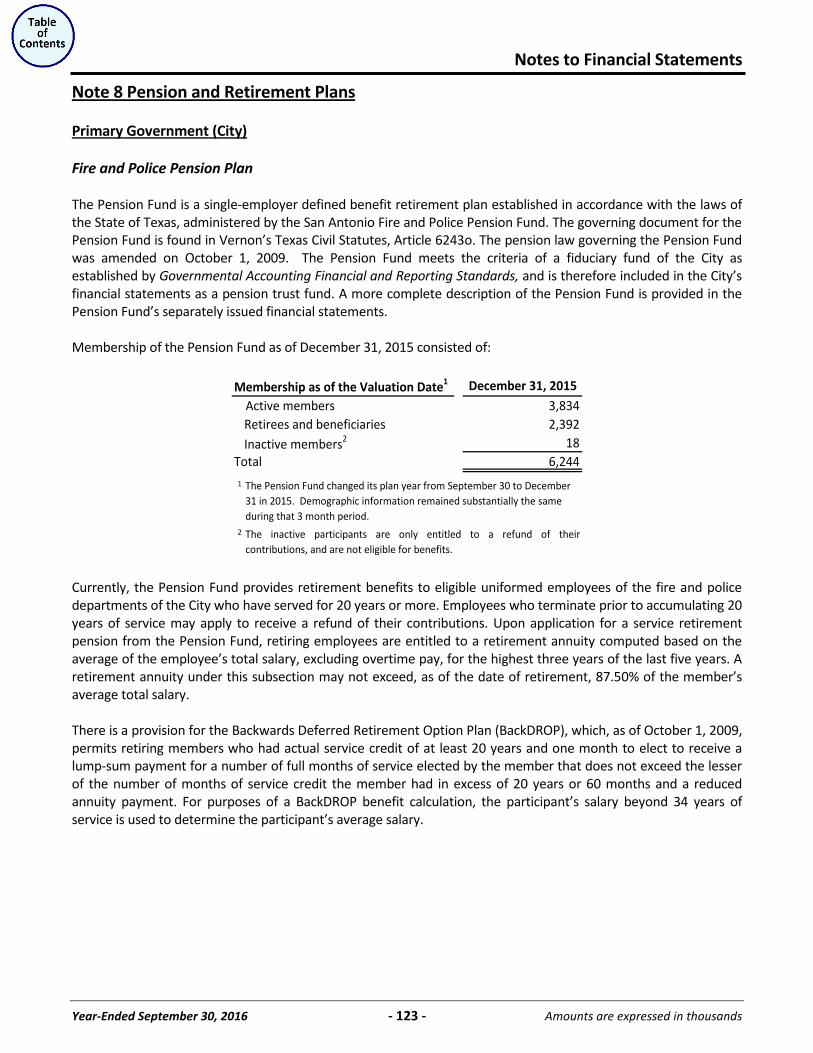
Notes to Financial Statements
Year-Ended September 30, 2016 - 123 - Amounts are expressed in thousands
Note 8 Pension and Retirement Plans
Primary Government (City)
Fire and Police Pension Plan The Pension Fund is a single-employer defined benefit retirement plan established in accordance with the laws of the State of Texas, administered by the San Antonio Fire and Police Pension Fund. The governing document for the Pension Fund is found in Vernon’s Texas Civil Statutes, Article 6243o. The pension law governing the Pension Fund was amended on October 1, 2009. The Pension Fund meets the criteria of a fiduciary fund of the City as established by Governmental Accounting Financial and Reporting Standards, and is therefore included in the City’s financial statements as a pension trust fund. A more complete description of the Pension Fund is provided in the Pension Fund’s separately issued financial statements. Membership of the Pension Fund as of December 31, 2015 consisted of:
Membership as of the Valuation Date1 December 31, 2015Active members 3,834Retirees and beneficiaries 2,392Inactive members2 18
Total 6,244
1
2 The inactive participants are only entitled to a refund of theircontributions, and are not eligible for benefits.
The Pension Fund changed its plan year from September 30 to December 31 in 2015. Demographic information remained substantially the same during that 3 month period.
Currently, the Pension Fund provides retirement benefits to eligible uniformed employees of the fire and police departments of the City who have served for 20 years or more. Employees who terminate prior to accumulating 20 years of service may apply to receive a refund of their contributions. Upon application for a service retirement pension from the Pension Fund, retiring employees are entitled to a retirement annuity computed based on the average of the employee’s total salary, excluding overtime pay, for the highest three years of the last five years. A retirement annuity under this subsection may not exceed, as of the date of retirement, 87.50% of the member’s average total salary. There is a provision for the Backwards Deferred Retirement Option Plan (BackDROP), which, as of October 1, 2009, permits retiring members who had actual service credit of at least 20 years and one month to elect to receive a lump-sum payment for a number of full months of service elected by the member that does not exceed the lesser of the number of months of service credit the member had in excess of 20 years or 60 months and a reduced annuity payment. For purposes of a BackDROP benefit calculation, the participant’s salary beyond 34 years of service is used to determine the participant’s average salary.
Notes to Financial Statements
Year-Ended September 30, 2016 - 124 - Amounts are expressed in thousands
Note 8 Pension and Retirement Plans (Continued)
Primary Government (City) (Continued)
Fire and Police Pension Plan (Continued) There is also a provision for a 13th and 14th pension check. At the end of each fiscal year, the Board may authorize the disbursement of a 13th monthly pension check if the annualized yield on the Pension Fund’s investments exceeds the actuarial projections for the preceding five year fiscal period by at least 100 basis points. In the same way, the Board may authorize a 14th monthly pension check if the annualized yield on the Pension Fund’s investments exceeds the actuarial projections for the preceding five year period by at least 300 basis points. The 13th and 14th pension checks are paid to each retiree and beneficiary receiving a pension at the end of the fiscal year and are in an amount equal to the pension check paid in the last month of the preceding fiscal year of the Pension Fund (retirees/beneficiaries with less than one year of benefits will receive a prorated check, and no check will be paid to members who retired after the end of the fiscal year). Authorization for one year does not obligate the Board to authorize a 13th and 14th check for any other year. The Pension Fund did not meet the criteria for the 13th check since the year ended September 30, 2014 and has not met the criteria for the 14th check since the year ended September 30, 2007. The Pension Fund also provides benefits when service is terminated by reason of death or disability. The employee's beneficiary or the employee shall be entitled to one-half of the average of the employee’s total salary, excluding overtime pay, or vested benefit as is provided in the computation of normal retirement benefits, whichever is higher. If a member dies after retiring, spouses or beneficiaries who were married to or dependents of the member at the time of retirement receive the same annuity paid to the member as of the date of the member’s death up to the maximum benefit. The maximum benefit for surviving spouses and dependent children is equal to a 27 year service pension. As of October 1, 2009, the allocation of death benefits between a surviving spouse and the dependent children of a member is 75.00% to the spouse and 25.00% to the children. The spousal death benefit for a spouse who married a retiree after retirement and at least five years prior to the date of the retiree’s death is the same as a spouse who married a member prior to retirement. At October 1, 2009, amendments establish a 55 year old minimum age for marriage-after-retirement spouses to begin receiving annuity payments for those that qualify for such annuity payments. As of October 1, 2009, the spousal death benefit for a spouse who married a retiree after retirement, and less than five years prior to the date of the retiree’s death, is $15 if there are no other beneficiaries. The Pension Fund provides a disability annuity equal to 87.50% of average total salary, if the member suffers a catastrophic injury. A catastrophic injury is described as an irreparable physical bodily injury suffered during the performance of high-risk line of duty activities, when the injury results in the individual being unable to obtain any sort of employment sufficient to generate income above the poverty level. The surviving spouse of an active member may elect to receive benefits in the form of a lump-sum payment and reduced annuity, similar to a BackDROP election made by a retiring member. The estate of an active member who dies and does not leave a beneficiary will receive either 10 times the amount of an annuity computed according to the Annuity Computation mentioned above, using the deceased member’s service credit and average total salary as of the date of death, or the deceased member’s contributions that were picked up by the City. The estate of a retired member who dies and does not leave a beneficiary will receive a lump-sum benefit equal to 10 times the amount of the annuity awarded by the Board effective on the retiree’s date of retirement, less any retirement or disability annuity and any lump-sum payments paid to the retiree.
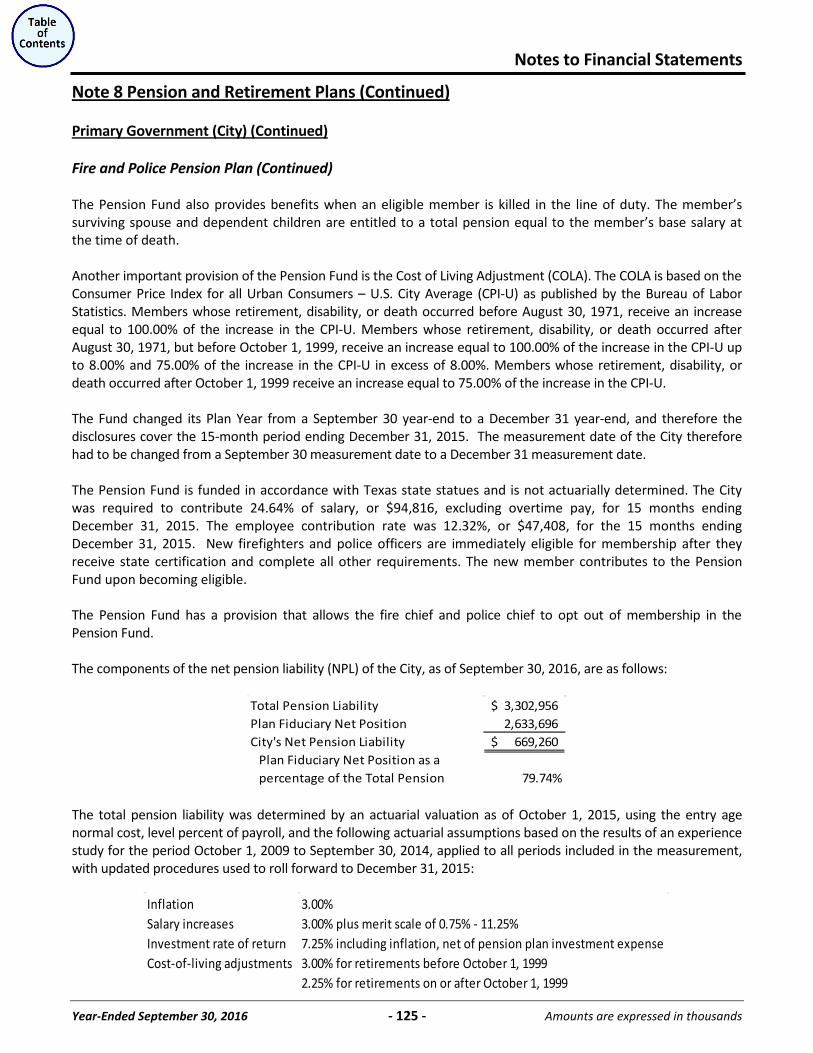
Notes to Financial Statements
Year-Ended September 30, 2016 - 125 - Amounts are expressed in thousands
Note 8 Pension and Retirement Plans (Continued)
Primary Government (City) (Continued)
Fire and Police Pension Plan (Continued) The Pension Fund also provides benefits when an eligible member is killed in the line of duty. The member’s surviving spouse and dependent children are entitled to a total pension equal to the member’s base salary at the time of death. Another important provision of the Pension Fund is the Cost of Living Adjustment (COLA). The COLA is based on the Consumer Price Index for all Urban Consumers – U.S. City Average (CPI-U) as published by the Bureau of Labor Statistics. Members whose retirement, disability, or death occurred before August 30, 1971, receive an increase equal to 100.00% of the increase in the CPI-U. Members whose retirement, disability, or death occurred after August 30, 1971, but before October 1, 1999, receive an increase equal to 100.00% of the increase in the CPI-U up to 8.00% and 75.00% of the increase in the CPI-U in excess of 8.00%. Members whose retirement, disability, or death occurred after October 1, 1999 receive an increase equal to 75.00% of the increase in the CPI-U. The Fund changed its Plan Year from a September 30 year-end to a December 31 year-end, and therefore the disclosures cover the 15-month period ending December 31, 2015. The measurement date of the City therefore had to be changed from a September 30 measurement date to a December 31 measurement date. The Pension Fund is funded in accordance with Texas state statues and is not actuarially determined. The City was required to contribute 24.64% of salary, or $94,816, excluding overtime pay, for 15 months ending December 31, 2015. The employee contribution rate was 12.32%, or $47,408, for the 15 months ending December 31, 2015. New firefighters and police officers are immediately eligible for membership after they receive state certification and complete all other requirements. The new member contributes to the Pension Fund upon becoming eligible. The Pension Fund has a provision that allows the fire chief and police chief to opt out of membership in the Pension Fund. The components of the net pension liability (NPL) of the City, as of September 30, 2016, are as follows:
Total Pension Liability 3,302,956$ Plan Fiduciary Net Position 2,633,696 City's Net Pension Liability 669,260$
Plan Fiduciary Net Position as a percentage of the Total Pension 79.74%
The total pension liability was determined by an actuarial valuation as of October 1, 2015, using the entry age normal cost, level percent of payroll, and the following actuarial assumptions based on the results of an experience study for the period October 1, 2009 to September 30, 2014, applied to all periods included in the measurement, with updated procedures used to roll forward to December 31, 2015:
Inflation 3.00%Salary increases 3.00% plus merit scale of 0.75% - 11.25%Investment rate of return 7.25% including inflation, net of pension plan investment expenseCost-of-living adjustments 3.00% for retirements before October 1, 1999
2.25% for retirements on or after October 1, 1999
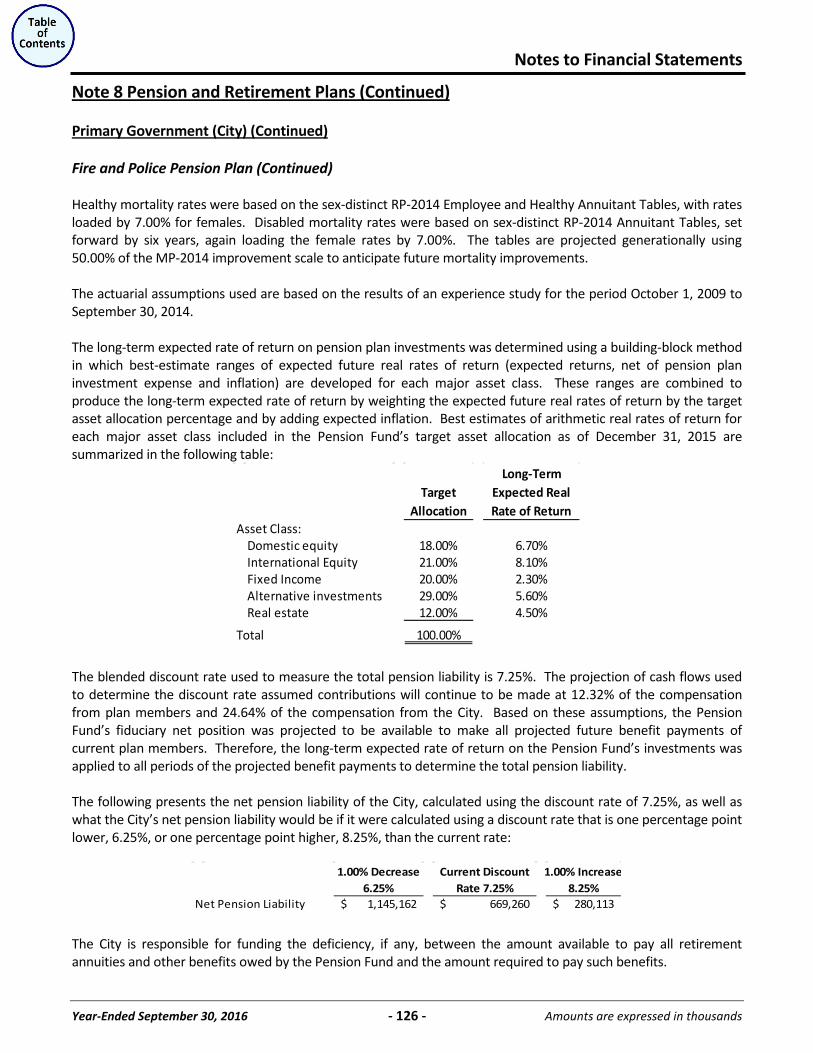
Notes to Financial Statements
Year-Ended September 30, 2016 - 126 - Amounts are expressed in thousands
Note 8 Pension and Retirement Plans (Continued)
Primary Government (City) (Continued)
Fire and Police Pension Plan (Continued) Healthy mortality rates were based on the sex-distinct RP-2014 Employee and Healthy Annuitant Tables, with rates loaded by 7.00% for females. Disabled mortality rates were based on sex-distinct RP-2014 Annuitant Tables, set forward by six years, again loading the female rates by 7.00%. The tables are projected generationally using 50.00% of the MP-2014 improvement scale to anticipate future mortality improvements. The actuarial assumptions used are based on the results of an experience study for the period October 1, 2009 to September 30, 2014. The long-term expected rate of return on pension plan investments was determined using a building-block method in which best-estimate ranges of expected future real rates of return (expected returns, net of pension plan investment expense and inflation) are developed for each major asset class. These ranges are combined to produce the long-term expected rate of return by weighting the expected future real rates of return by the target asset allocation percentage and by adding expected inflation. Best estimates of arithmetic real rates of return for each major asset class included in the Pension Fund’s target asset allocation as of December 31, 2015 are summarized in the following table:
Target Allocation
Long-Term Expected Real Rate of Return
Asset Class:Domestic equity 18.00% 6.70%International Equity 21.00% 8.10%Fixed Income 20.00% 2.30%Alternative investments 29.00% 5.60%Real estate 12.00% 4.50%
Total 100.00%
The blended discount rate used to measure the total pension liability is 7.25%. The projection of cash flows used to determine the discount rate assumed contributions will continue to be made at 12.32% of the compensation from plan members and 24.64% of the compensation from the City. Based on these assumptions, the Pension Fund’s fiduciary net position was projected to be available to make all projected future benefit payments of current plan members. Therefore, the long-term expected rate of return on the Pension Fund’s investments was applied to all periods of the projected benefit payments to determine the total pension liability. The following presents the net pension liability of the City, calculated using the discount rate of 7.25%, as well as what the City’s net pension liability would be if it were calculated using a discount rate that is one percentage point lower, 6.25%, or one percentage point higher, 8.25%, than the current rate:
1.00% Decrease Current Discount 1.00% Increase6.25% Rate 7.25% 8.25%
Net Pension Liability 1,145,162$ 669,260$ 280,113$ The City is responsible for funding the deficiency, if any, between the amount available to pay all retirement annuities and other benefits owed by the Pension Fund and the amount required to pay such benefits.
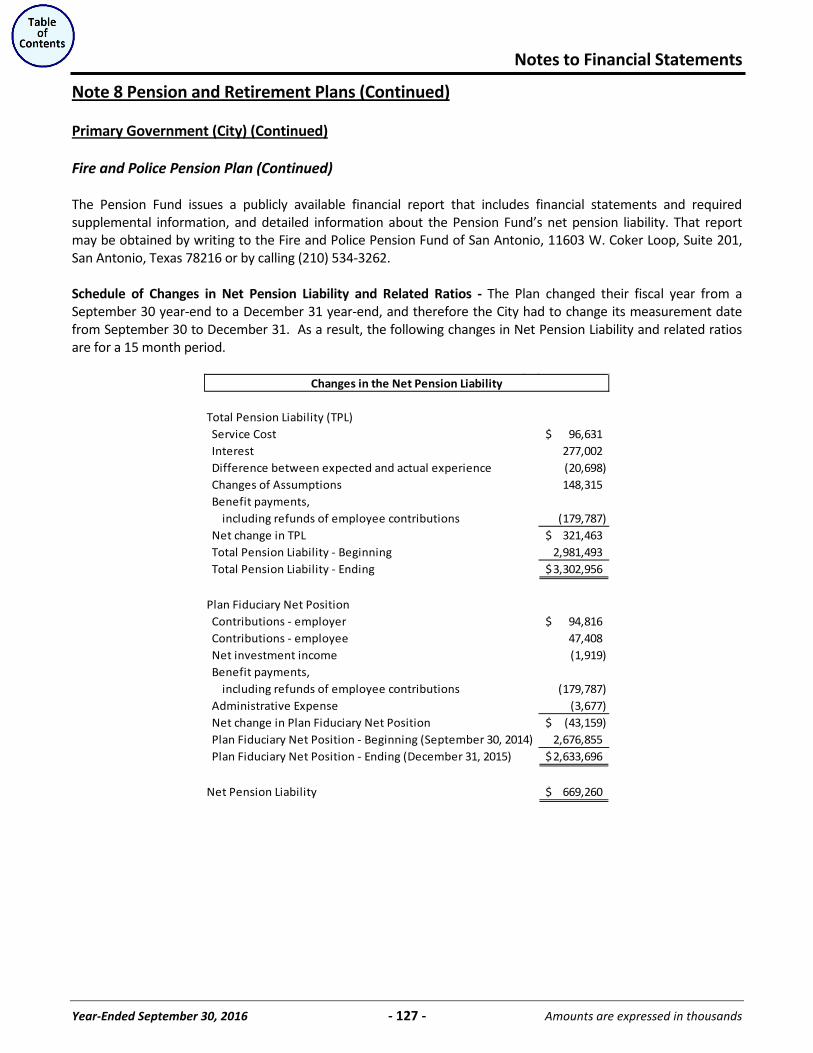
Notes to Financial Statements
Year-Ended September 30, 2016 - 127 - Amounts are expressed in thousands
Note 8 Pension and Retirement Plans (Continued)
Primary Government (City) (Continued)
Fire and Police Pension Plan (Continued) The Pension Fund issues a publicly available financial report that includes financial statements and required supplemental information, and detailed information about the Pension Fund’s net pension liability. That report may be obtained by writing to the Fire and Police Pension Fund of San Antonio, 11603 W. Coker Loop, Suite 201, San Antonio, Texas 78216 or by calling (210) 534-3262. Schedule of Changes in Net Pension Liability and Related Ratios - The Plan changed their fiscal year from a September 30 year-end to a December 31 year-end, and therefore the City had to change its measurement date from September 30 to December 31. As a result, the following changes in Net Pension Liability and related ratios are for a 15 month period.
Changes in the Net Pension Liability
Total Pension Liability (TPL) Service Cost 96,631$ Interest 277,002 Difference between expected and actual experience (20,698) Changes of Assumptions 148,315 Benefit payments, including refunds of employee contributions (179,787) Net change in TPL 321,463$ Total Pension Liability - Beginning 2,981,493 Total Pension Liability - Ending 3,302,956$
Plan Fiduciary Net Position Contributions - employer 94,816$ Contributions - employee 47,408 Net investment income (1,919) Benefit payments, including refunds of employee contributions (179,787) Administrative Expense (3,677) Net change in Plan Fiduciary Net Position (43,159)$ Plan Fiduciary Net Position - Beginning (September 30, 2014) 2,676,855 Plan Fiduciary Net Position - Ending (December 31, 2015) 2,633,696$
Net Pension Liability 669,260$
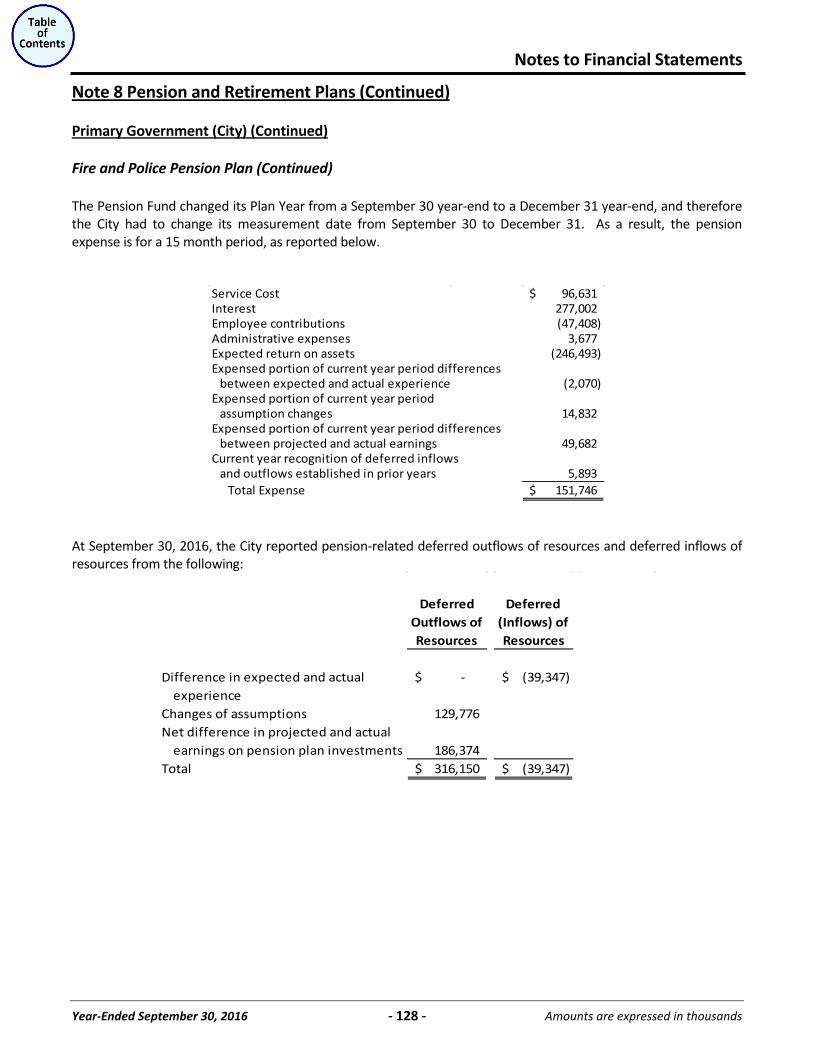
Notes to Financial Statements
Year-Ended September 30, 2016 - 128 - Amounts are expressed in thousands
Note 8 Pension and Retirement Plans (Continued)
Primary Government (City) (Continued)
Fire and Police Pension Plan (Continued) The Pension Fund changed its Plan Year from a September 30 year-end to a December 31 year-end, and therefore the City had to change its measurement date from September 30 to December 31. As a result, the pension expense is for a 15 month period, as reported below.
Service Cost 96,631$ Interest 277,002 Employee contributions (47,408) Administrative expenses 3,677 Expected return on assets (246,493) Expensed portion of current year period differences between expected and actual experience (2,070) Expensed portion of current year period assumption changes 14,832 Expensed portion of current year period differences between projected and actual earnings 49,682 Current year recognition of deferred inflows and outflows established in prior years 5,893 Total Expense 151,746$
At September 30, 2016, the City reported pension-related deferred outflows of resources and deferred inflows of resources from the following:
Deferred Outflows of Resources
Deferred (Inflows) of Resources
Difference in expected and actual -$ (39,347)$ experienceChanges of assumptions 129,776 Net difference in projected and actual earnings on pension plan investments 186,374 Total 316,150$ (39,347)$
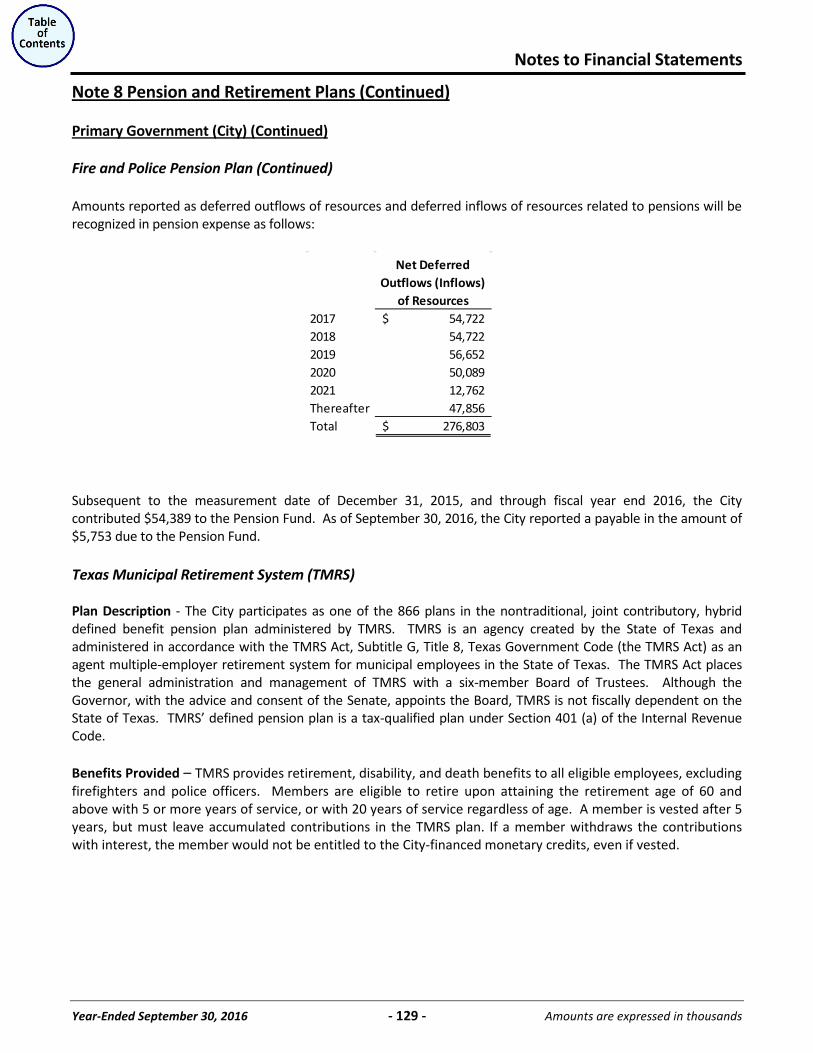
Notes to Financial Statements
Year-Ended September 30, 2016 - 129 - Amounts are expressed in thousands
Note 8 Pension and Retirement Plans (Continued)
Primary Government (City) (Continued)
Fire and Police Pension Plan (Continued) Amounts reported as deferred outflows of resources and deferred inflows of resources related to pensions will be recognized in pension expense as follows:
Net Deferred
Outflows (Inflows) of Resources
2017 54,722$ 2018 54,722 2019 56,652 2020 50,089 2021 12,762 Thereafter 47,856 Total 276,803$
Subsequent to the measurement date of December 31, 2015, and through fiscal year end 2016, the City contributed $54,389 to the Pension Fund. As of September 30, 2016, the City reported a payable in the amount of $5,753 due to the Pension Fund. Texas Municipal Retirement System (TMRS) Plan Description - The City participates as one of the 866 plans in the nontraditional, joint contributory, hybrid defined benefit pension plan administered by TMRS. TMRS is an agency created by the State of Texas and administered in accordance with the TMRS Act, Subtitle G, Title 8, Texas Government Code (the TMRS Act) as an agent multiple-employer retirement system for municipal employees in the State of Texas. The TMRS Act places the general administration and management of TMRS with a six-member Board of Trustees. Although the Governor, with the advice and consent of the Senate, appoints the Board, TMRS is not fiscally dependent on the State of Texas. TMRS’ defined pension plan is a tax-qualified plan under Section 401 (a) of the Internal Revenue Code. Benefits Provided – TMRS provides retirement, disability, and death benefits to all eligible employees, excluding firefighters and police officers. Members are eligible to retire upon attaining the retirement age of 60 and above with 5 or more years of service, or with 20 years of service regardless of age. A member is vested after 5 years, but must leave accumulated contributions in the TMRS plan. If a member withdraws the contributions with interest, the member would not be entitled to the City-financed monetary credits, even if vested.
Notes to Financial Statements
Year-Ended September 30, 2016 - 130 - Amounts are expressed in thousands
Note 8 Pension and Retirement Plans (Continued)
Primary Government (City) (Continued)
Texas Municipal Retirement System (TMRS) (Continued) Benefits depend upon the sum of the employee's contributions to the TMRS plan, with interest, and the City-financed monetary credits with interest. City-financed monetary credits are composed of three sources: prior service credits, current service credits, and updated service credits. Prior service credit, granted by the City, is a monetary credit equal to the accumulated value of the percentage of prior service credit adopted times an employee’s deposits that would have been made, based on the average salary prior to participation, for the number of months the employee has been employed, accruing 3.00% annual interest, and including the matching ratio adopted by the City (2 to 1). Monetary credits for service since the TMRS plan began are a percentage of the employee's accumulated contributions. In addition, the City may grant, as often as annually or annually on a repeating basis, another type of monetary credit referred to as an updated service credit.
This monetary credit is determined by hypothetically re-computing the employee’s account balance by assuming that the current City deposit rate (6.00%) has always been in effect. The computation also assumes that the employee’s salary has always been the employee’s average salary, using a salary calculation based on the 36-month period ending a year before the effective date of calculation. This hypothetical amount is increased by 3.00% each year and increased by the City’s match currently in effect (200.00% match). The resulting sum is then compared to the employee’s actual account balance increased by the actual City match and actual interest credited. If the hypothetical calculation exceeds the actual calculation, the member is granted a monetary credit (or updated service credit) equal to the difference between the hypothetical calculation and the actual calculation times the percentage adopted. At retirement, the benefit is calculated as if the sum of the employee's accumulated contributions with interest and the City-financed monetary credits with interest were used to purchase an annuity. Employees may choose to receive their retirement benefit in one of seven payment options: retiree life only; one of three survivor lifetime options; or one of the three guaranteed term options. Employees may also choose to receive a portion of their benefit as a partial lump sum distribution in an amount equal to 12, 24, or 36 monthly payments under the retiree life only option, which cannot exceed 75.00% of the total employee’s deposits and interest. The City may elect to increase the annuities of its retirees, either annually or on an annually repeating basis, effective January 1 of the calendar year. The City may also adopt annuity increases at a rate equal to 30.00%, 50.00%, or 70.00% of the increase in the Consumer Price Index – all Urban Consumers between the December preceding the employee’s retirement date and the December one year before the effective date of the increase, minus any previously granted increases. The City, based on available financial resources, may approve an annual ad hoc cost of living adjustment for its retirees. City Council approves this recommendation as part of the annual adopted budget. TMRS provisions and contribution requirements are adopted by the City Council within the options available in the state statutes governing TMRS and within the actuarial constraints contained in the statutes. The ad hoc cost of living adjustments were deemed to be substantively automatic in TMRS’ actuarial report. The default method for determining whether ad hoc benefit enhancements are substantively automatic is if the City had granted them in one of the last two years and two of the last five years. The City has met these requirements.
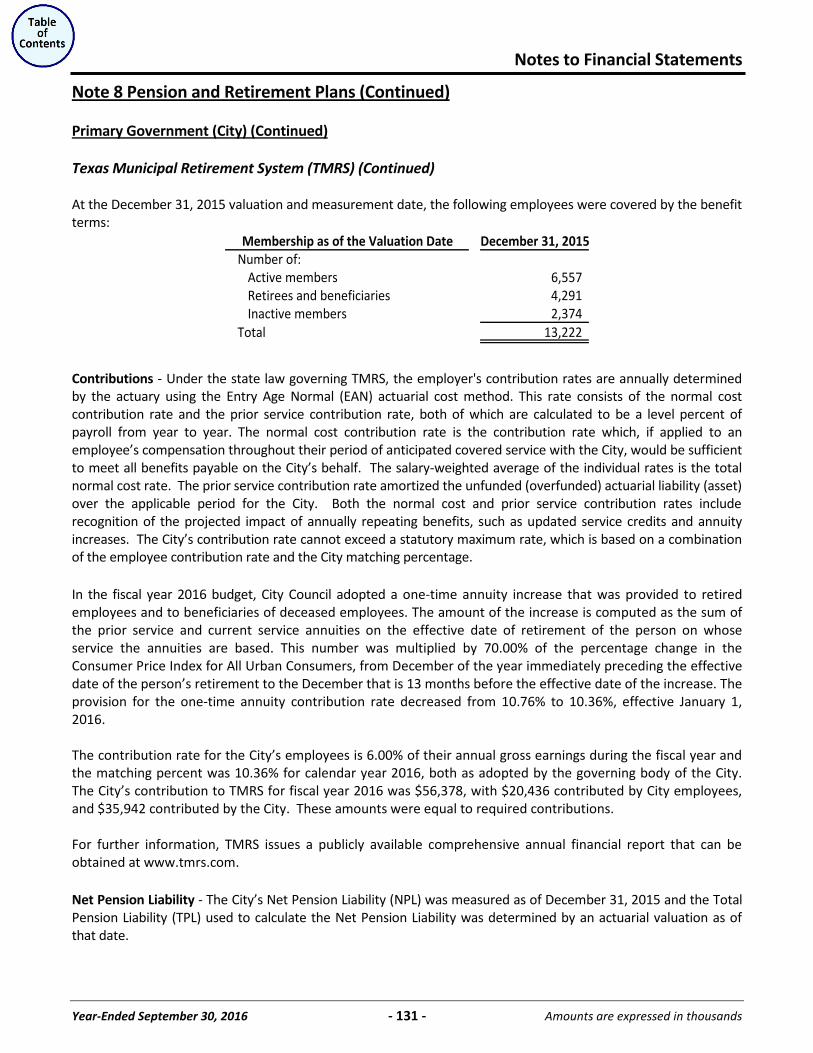
Notes to Financial Statements
Year-Ended September 30, 2016 - 131 - Amounts are expressed in thousands
Note 8 Pension and Retirement Plans (Continued)
Primary Government (City) (Continued)
Texas Municipal Retirement System (TMRS) (Continued) At the December 31, 2015 valuation and measurement date, the following employees were covered by the benefit terms:
Membership as of the Valuation Date December 31, 2015Number of:
Active members 6,557 Retirees and beneficiaries 4,291 Inactive members 2,374
Total 13,222
Contributions - Under the state law governing TMRS, the employer's contribution rates are annually determined by the actuary using the Entry Age Normal (EAN) actuarial cost method. This rate consists of the normal cost contribution rate and the prior service contribution rate, both of which are calculated to be a level percent of payroll from year to year. The normal cost contribution rate is the contribution rate which, if applied to an employee’s compensation throughout their period of anticipated covered service with the City, would be sufficient to meet all benefits payable on the City’s behalf. The salary-weighted average of the individual rates is the total normal cost rate. The prior service contribution rate amortized the unfunded (overfunded) actuarial liability (asset) over the applicable period for the City. Both the normal cost and prior service contribution rates include recognition of the projected impact of annually repeating benefits, such as updated service credits and annuity increases. The City’s contribution rate cannot exceed a statutory maximum rate, which is based on a combination of the employee contribution rate and the City matching percentage. In the fiscal year 2016 budget, City Council adopted a one-time annuity increase that was provided to retired employees and to beneficiaries of deceased employees. The amount of the increase is computed as the sum of the prior service and current service annuities on the effective date of retirement of the person on whose service the annuities are based. This number was multiplied by 70.00% of the percentage change in the Consumer Price Index for All Urban Consumers, from December of the year immediately preceding the effective date of the person’s retirement to the December that is 13 months before the effective date of the increase. The provision for the one-time annuity contribution rate decreased from 10.76% to 10.36%, effective January 1, 2016. The contribution rate for the City’s employees is 6.00% of their annual gross earnings during the fiscal year and the matching percent was 10.36% for calendar year 2016, both as adopted by the governing body of the City. The City’s contribution to TMRS for fiscal year 2016 was $56,378, with $20,436 contributed by City employees, and $35,942 contributed by the City. These amounts were equal to required contributions. For further information, TMRS issues a publicly available comprehensive annual financial report that can be obtained at www.tmrs.com. Net Pension Liability - The City’s Net Pension Liability (NPL) was measured as of December 31, 2015 and the Total Pension Liability (TPL) used to calculate the Net Pension Liability was determined by an actuarial valuation as of that date.
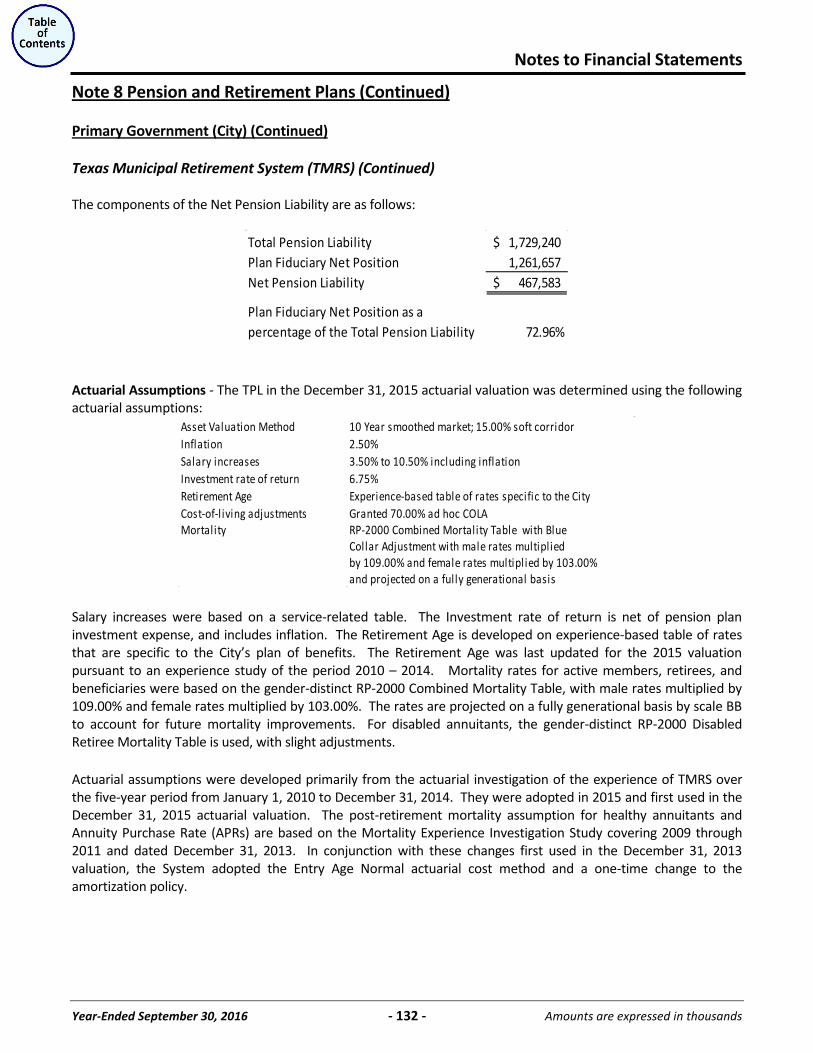
Notes to Financial Statements
Year-Ended September 30, 2016 - 132 - Amounts are expressed in thousands
Note 8 Pension and Retirement Plans (Continued)
Primary Government (City) (Continued)
Texas Municipal Retirement System (TMRS) (Continued) The components of the Net Pension Liability are as follows:
Total Pension Liability 1,729,240$ Plan Fiduciary Net Position 1,261,657 Net Pension Liability 467,583$
Plan Fiduciary Net Position as a percentage of the Total Pension Liability 72.96%
Actuarial Assumptions - The TPL in the December 31, 2015 actuarial valuation was determined using the following actuarial assumptions:
Asset Valuation Method 10 Year smoothed market; 15.00% soft corridorInflation 2.50%Salary increases 3.50% to 10.50% including inflationInvestment rate of return 6.75%Retirement Age Experience-based table of rates specific to the CityCost-of-l iving adjustments Granted 70.00% ad hoc COLAMortality RP-2000 Combined Mortality Table with Blue
Collar Adjustment with male rates multipliedby 109.00% and female rates multiplied by 103.00%and projected on a fully generational basis
Salary increases were based on a service-related table. The Investment rate of return is net of pension plan investment expense, and includes inflation. The Retirement Age is developed on experience-based table of rates that are specific to the City’s plan of benefits. The Retirement Age was last updated for the 2015 valuation pursuant to an experience study of the period 2010 – 2014. Mortality rates for active members, retirees, and beneficiaries were based on the gender-distinct RP-2000 Combined Mortality Table, with male rates multiplied by 109.00% and female rates multiplied by 103.00%. The rates are projected on a fully generational basis by scale BB to account for future mortality improvements. For disabled annuitants, the gender-distinct RP-2000 Disabled Retiree Mortality Table is used, with slight adjustments. Actuarial assumptions were developed primarily from the actuarial investigation of the experience of TMRS over the five-year period from January 1, 2010 to December 31, 2014. They were adopted in 2015 and first used in the December 31, 2015 actuarial valuation. The post-retirement mortality assumption for healthy annuitants and Annuity Purchase Rate (APRs) are based on the Mortality Experience Investigation Study covering 2009 through 2011 and dated December 31, 2013. In conjunction with these changes first used in the December 31, 2013 valuation, the System adopted the Entry Age Normal actuarial cost method and a one-time change to the amortization policy.
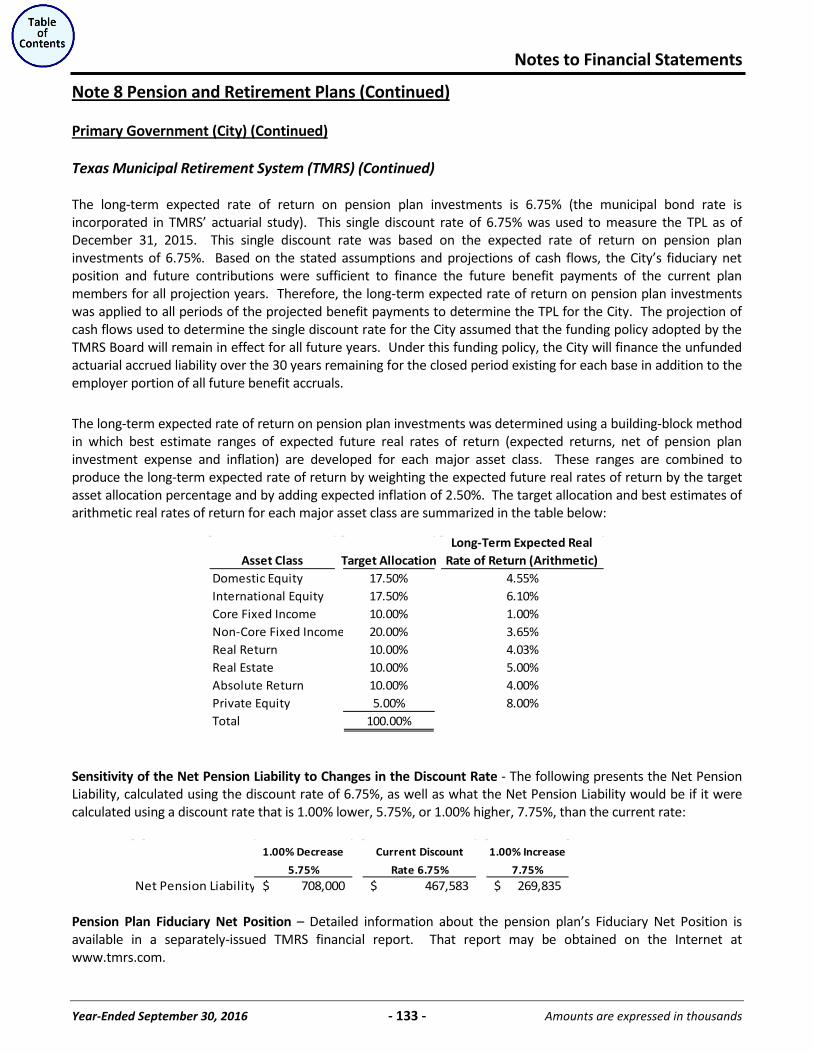
Notes to Financial Statements
Year-Ended September 30, 2016 - 133 - Amounts are expressed in thousands
Note 8 Pension and Retirement Plans (Continued)
Primary Government (City) (Continued)
Texas Municipal Retirement System (TMRS) (Continued) The long-term expected rate of return on pension plan investments is 6.75% (the municipal bond rate is incorporated in TMRS’ actuarial study). This single discount rate of 6.75% was used to measure the TPL as of December 31, 2015. This single discount rate was based on the expected rate of return on pension plan investments of 6.75%. Based on the stated assumptions and projections of cash flows, the City’s fiduciary net position and future contributions were sufficient to finance the future benefit payments of the current plan members for all projection years. Therefore, the long-term expected rate of return on pension plan investments was applied to all periods of the projected benefit payments to determine the TPL for the City. The projection of cash flows used to determine the single discount rate for the City assumed that the funding policy adopted by the TMRS Board will remain in effect for all future years. Under this funding policy, the City will finance the unfunded actuarial accrued liability over the 30 years remaining for the closed period existing for each base in addition to the employer portion of all future benefit accruals.
The long-term expected rate of return on pension plan investments was determined using a building-block method in which best estimate ranges of expected future real rates of return (expected returns, net of pension plan investment expense and inflation) are developed for each major asset class. These ranges are combined to produce the long-term expected rate of return by weighting the expected future real rates of return by the target asset allocation percentage and by adding expected inflation of 2.50%. The target allocation and best estimates of arithmetic real rates of return for each major asset class are summarized in the table below:
Asset Class Target AllocationLong-Term Expected Real
Rate of Return (Arithmetic)Domestic Equity 17.50% 4.55%International Equity 17.50% 6.10%Core Fixed Income 10.00% 1.00%Non-Core Fixed Income 20.00% 3.65%Real Return 10.00% 4.03%Real Estate 10.00% 5.00%Absolute Return 10.00% 4.00%Private Equity 5.00% 8.00%Total 100.00%
Sensitivity of the Net Pension Liability to Changes in the Discount Rate - The following presents the Net Pension Liability, calculated using the discount rate of 6.75%, as well as what the Net Pension Liability would be if it were calculated using a discount rate that is 1.00% lower, 5.75%, or 1.00% higher, 7.75%, than the current rate:
1.00% Decrease Current Discount 1.00% Increase
5.75% Rate 6.75% 7.75%Net Pension Liability 708,000$ 467,583$ 269,835$
Pension Plan Fiduciary Net Position – Detailed information about the pension plan’s Fiduciary Net Position is available in a separately-issued TMRS financial report. That report may be obtained on the Internet at www.tmrs.com.
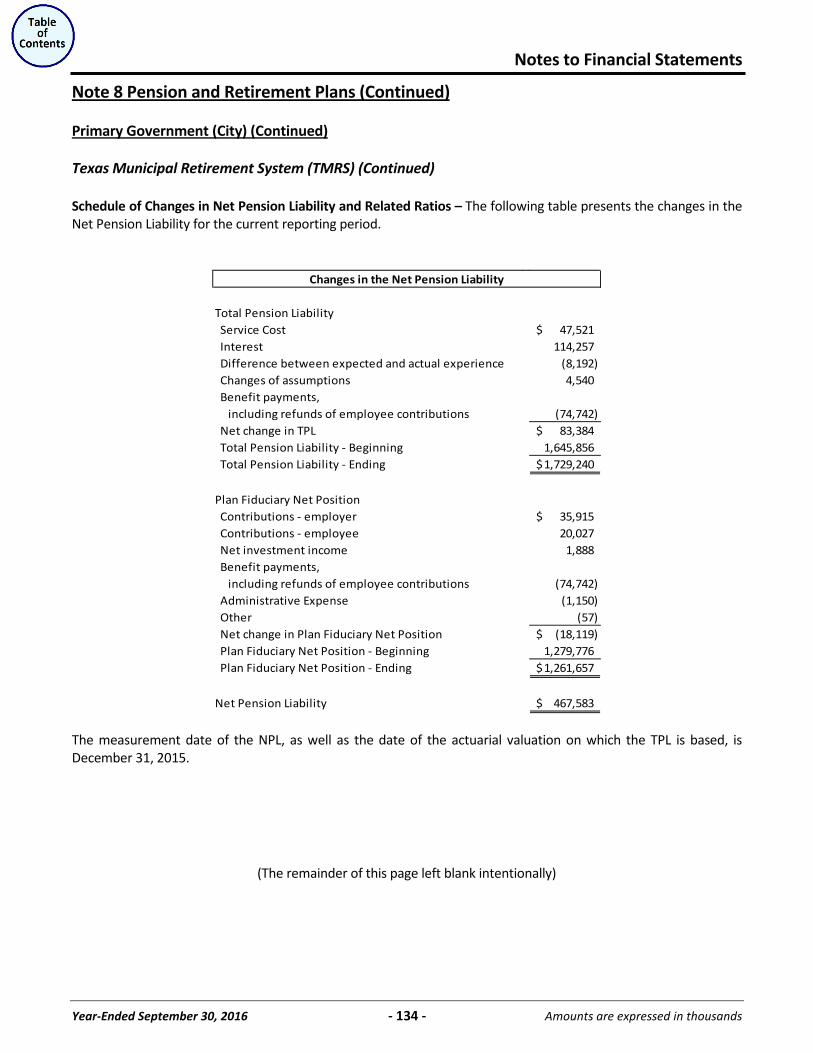
Notes to Financial Statements
Year-Ended September 30, 2016 - 134 - Amounts are expressed in thousands
Note 8 Pension and Retirement Plans (Continued)
Primary Government (City) (Continued)
Texas Municipal Retirement System (TMRS) (Continued) Schedule of Changes in Net Pension Liability and Related Ratios – The following table presents the changes in the Net Pension Liability for the current reporting period.
Changes in the Net Pension Liability
Total Pension Liability Service Cost 47,521$ Interest 114,257 Difference between expected and actual experience (8,192) Changes of assumptions 4,540 Benefit payments, including refunds of employee contributions (74,742) Net change in TPL 83,384$ Total Pension Liability - Beginning 1,645,856 Total Pension Liability - Ending 1,729,240$
Plan Fiduciary Net Position Contributions - employer 35,915$ Contributions - employee 20,027 Net investment income 1,888 Benefit payments, including refunds of employee contributions (74,742) Administrative Expense (1,150) Other (57) Net change in Plan Fiduciary Net Position (18,119)$ Plan Fiduciary Net Position - Beginning 1,279,776 Plan Fiduciary Net Position - Ending 1,261,657$
Net Pension Liability 467,583$
The measurement date of the NPL, as well as the date of the actuarial valuation on which the TPL is based, is December 31, 2015.
(The remainder of this page left blank intentionally)
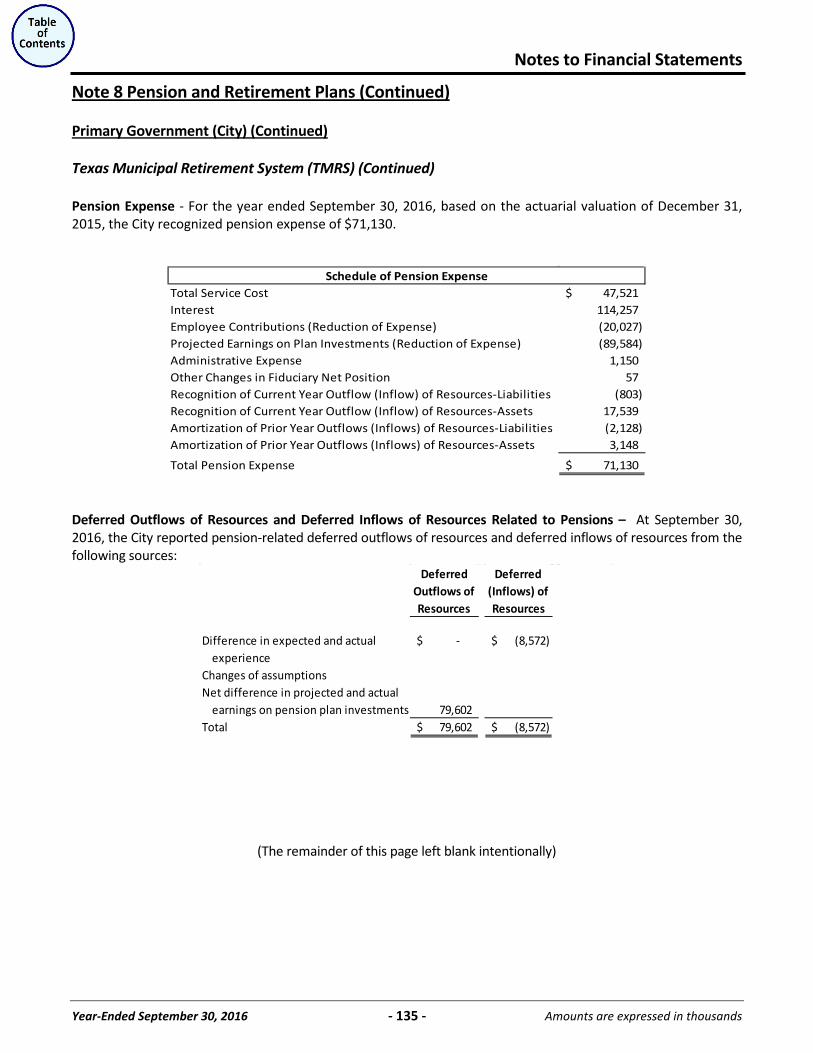
Notes to Financial Statements
Year-Ended September 30, 2016 - 135 - Amounts are expressed in thousands
Note 8 Pension and Retirement Plans (Continued)
Primary Government (City) (Continued)
Texas Municipal Retirement System (TMRS) (Continued) Pension Expense - For the year ended September 30, 2016, based on the actuarial valuation of December 31, 2015, the City recognized pension expense of $71,130.
Schedule of Pension ExpenseTotal Service Cost 47,521$ Interest 114,257 Employee Contributions (Reduction of Expense) (20,027) Projected Earnings on Plan Investments (Reduction of Expense) (89,584) Administrative Expense 1,150 Other Changes in Fiduciary Net Position 57 Recognition of Current Year Outflow (Inflow) of Resources-Liabilities (803) Recognition of Current Year Outflow (Inflow) of Resources-Assets 17,539 Amortization of Prior Year Outflows (Inflows) of Resources-Liabilities (2,128) Amortization of Prior Year Outflows (Inflows) of Resources-Assets 3,148
Total Pension Expense 71,130$
Deferred Outflows of Resources and Deferred Inflows of Resources Related to Pensions – At September 30, 2016, the City reported pension-related deferred outflows of resources and deferred inflows of resources from the following sources:
Deferred Outflows of Resources
Deferred (Inflows) of Resources
Difference in expected and actual -$ (8,572)$ experienceChanges of assumptionsNet difference in projected and actual earnings on pension plan investments 79,602 Total 79,602$ (8,572)$
(The remainder of this page left blank intentionally)
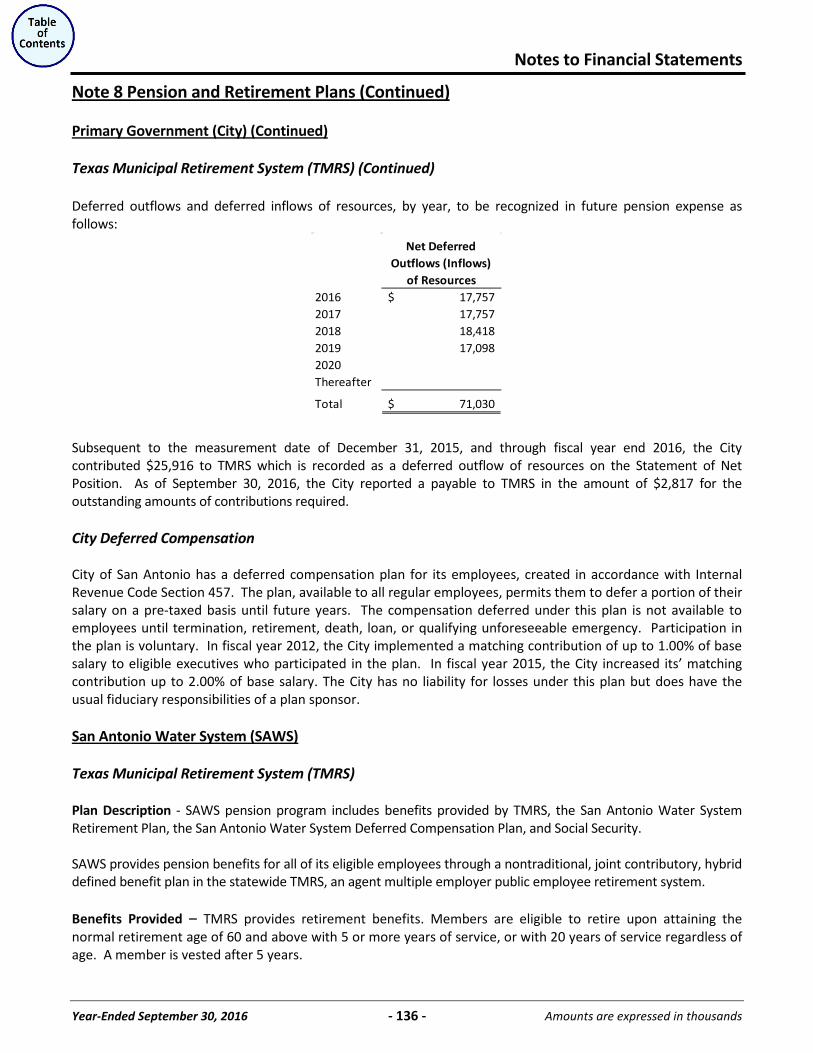
Notes to Financial Statements
Year-Ended September 30, 2016 - 136 - Amounts are expressed in thousands
Note 8 Pension and Retirement Plans (Continued)
Primary Government (City) (Continued)
Texas Municipal Retirement System (TMRS) (Continued) Deferred outflows and deferred inflows of resources, by year, to be recognized in future pension expense as follows:
Net Deferred Outflows (Inflows)
of Resources2016 17,757$ 2017 17,757 2018 18,418 2019 17,098 2020Thereafter
Total 71,030$
Subsequent to the measurement date of December 31, 2015, and through fiscal year end 2016, the City contributed $25,916 to TMRS which is recorded as a deferred outflow of resources on the Statement of Net Position. As of September 30, 2016, the City reported a payable to TMRS in the amount of $2,817 for the outstanding amounts of contributions required. City Deferred Compensation City of San Antonio has a deferred compensation plan for its employees, created in accordance with Internal Revenue Code Section 457. The plan, available to all regular employees, permits them to defer a portion of their salary on a pre-taxed basis until future years. The compensation deferred under this plan is not available to employees until termination, retirement, death, loan, or qualifying unforeseeable emergency. Participation in the plan is voluntary. In fiscal year 2012, the City implemented a matching contribution of up to 1.00% of base salary to eligible executives who participated in the plan. In fiscal year 2015, the City increased its’ matching contribution up to 2.00% of base salary. The City has no liability for losses under this plan but does have the usual fiduciary responsibilities of a plan sponsor.
San Antonio Water System (SAWS)
Texas Municipal Retirement System (TMRS)
Plan Description - SAWS pension program includes benefits provided by TMRS, the San Antonio Water System Retirement Plan, the San Antonio Water System Deferred Compensation Plan, and Social Security. SAWS provides pension benefits for all of its eligible employees through a nontraditional, joint contributory, hybrid defined benefit plan in the statewide TMRS, an agent multiple employer public employee retirement system. Benefits Provided – TMRS provides retirement benefits. Members are eligible to retire upon attaining the normal retirement age of 60 and above with 5 or more years of service, or with 20 years of service regardless of age. A member is vested after 5 years.
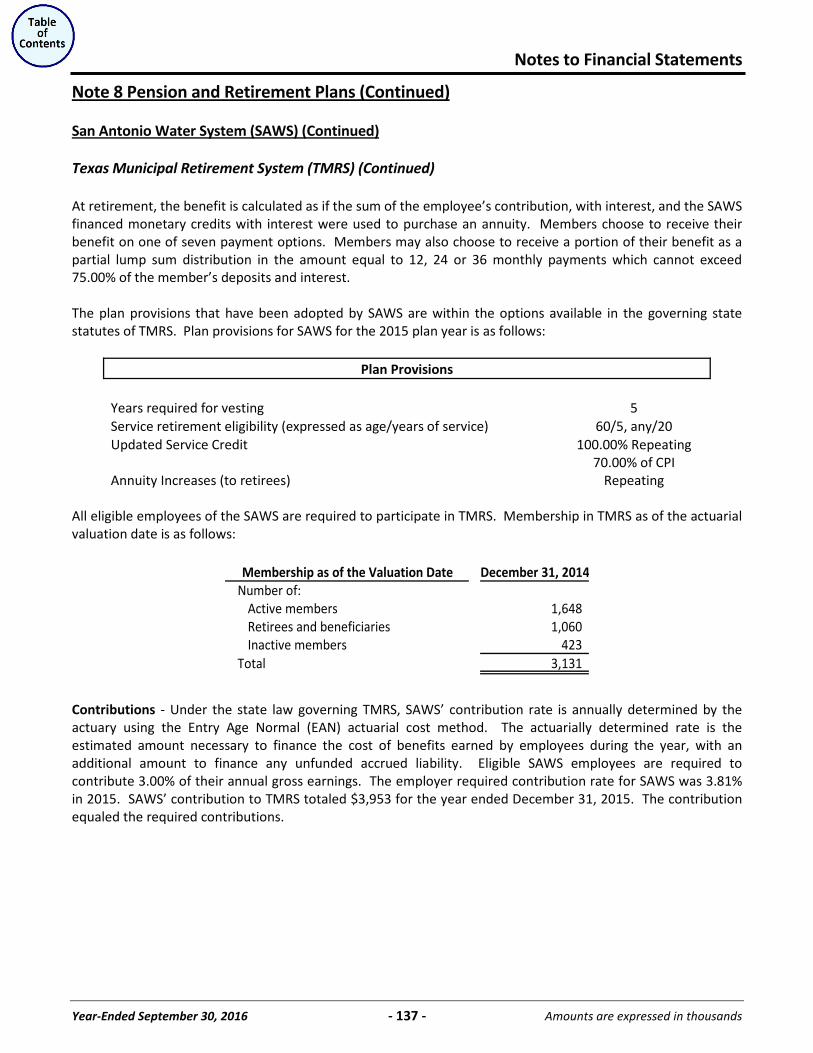
Notes to Financial Statements
Year-Ended September 30, 2016 - 137 - Amounts are expressed in thousands
Note 8 Pension and Retirement Plans (Continued)
San Antonio Water System (SAWS) (Continued)
Texas Municipal Retirement System (TMRS) (Continued) At retirement, the benefit is calculated as if the sum of the employee’s contribution, with interest, and the SAWS financed monetary credits with interest were used to purchase an annuity. Members choose to receive their benefit on one of seven payment options. Members may also choose to receive a portion of their benefit as a partial lump sum distribution in the amount equal to 12, 24 or 36 monthly payments which cannot exceed 75.00% of the member’s deposits and interest. The plan provisions that have been adopted by SAWS are within the options available in the governing state statutes of TMRS. Plan provisions for SAWS for the 2015 plan year is as follows:
Plan Provisions Years required for vesting 5 Service retirement eligibility (expressed as age/years of service) 60/5, any/20 Updated Service Credit 100.00% Repeating
Annuity Increases (to retirees) 70.00% of CPI
Repeating All eligible employees of the SAWS are required to participate in TMRS. Membership in TMRS as of the actuarial valuation date is as follows:
Membership as of the Valuation Date December 31, 2014
Number of:Active members 1,648 Retirees and beneficiaries 1,060 Inactive members 423
Total 3,131
Contributions - Under the state law governing TMRS, SAWS’ contribution rate is annually determined by the actuary using the Entry Age Normal (EAN) actuarial cost method. The actuarially determined rate is the estimated amount necessary to finance the cost of benefits earned by employees during the year, with an additional amount to finance any unfunded accrued liability. Eligible SAWS employees are required to contribute 3.00% of their annual gross earnings. The employer required contribution rate for SAWS was 3.81% in 2015. SAWS’ contribution to TMRS totaled $3,953 for the year ended December 31, 2015. The contribution equaled the required contributions.
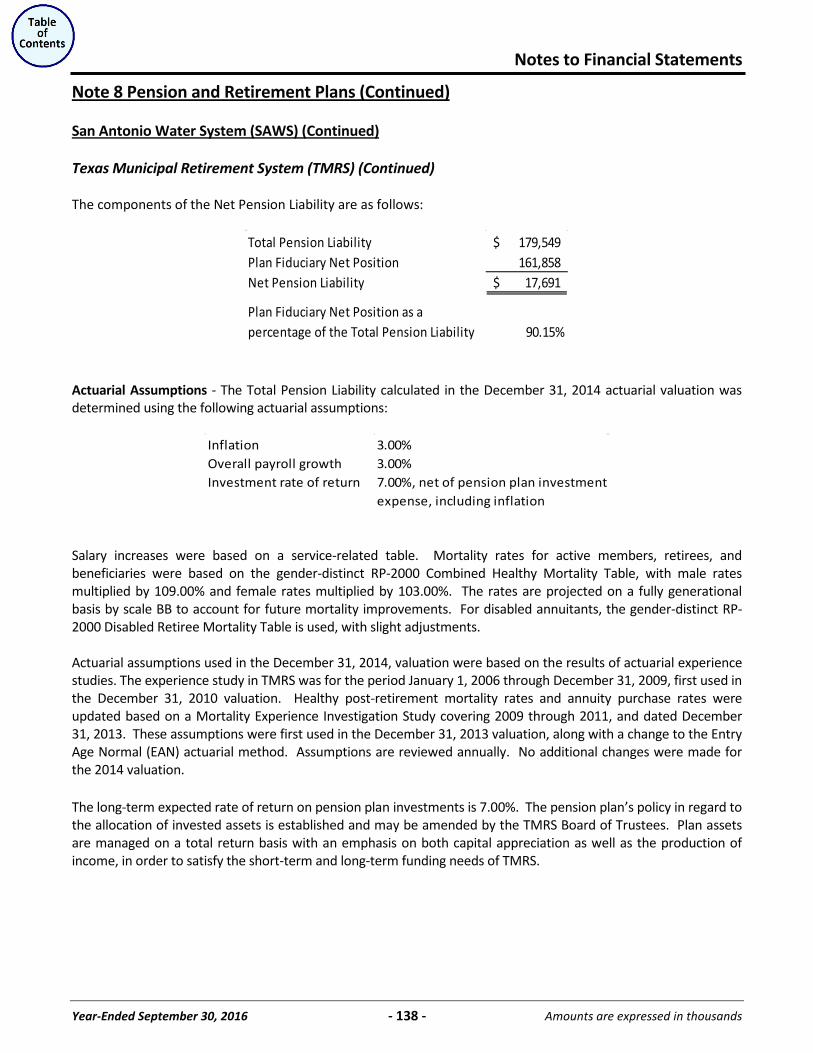
Notes to Financial Statements
Year-Ended September 30, 2016 - 138 - Amounts are expressed in thousands
Note 8 Pension and Retirement Plans (Continued)
San Antonio Water System (SAWS) (Continued)
Texas Municipal Retirement System (TMRS) (Continued) The components of the Net Pension Liability are as follows:
Total Pension Liability 179,549$ Plan Fiduciary Net Position 161,858 Net Pension Liability 17,691$
Plan Fiduciary Net Position as a percentage of the Total Pension Liability 90.15%
Actuarial Assumptions - The Total Pension Liability calculated in the December 31, 2014 actuarial valuation was determined using the following actuarial assumptions:
Inflation 3.00%Overall payroll growth 3.00%Investment rate of return 7.00%, net of pension plan investment
expense, including inflation
Salary increases were based on a service-related table. Mortality rates for active members, retirees, and beneficiaries were based on the gender-distinct RP-2000 Combined Healthy Mortality Table, with male rates multiplied by 109.00% and female rates multiplied by 103.00%. The rates are projected on a fully generational basis by scale BB to account for future mortality improvements. For disabled annuitants, the gender-distinct RP-2000 Disabled Retiree Mortality Table is used, with slight adjustments. Actuarial assumptions used in the December 31, 2014, valuation were based on the results of actuarial experience studies. The experience study in TMRS was for the period January 1, 2006 through December 31, 2009, first used in the December 31, 2010 valuation. Healthy post-retirement mortality rates and annuity purchase rates were updated based on a Mortality Experience Investigation Study covering 2009 through 2011, and dated December 31, 2013. These assumptions were first used in the December 31, 2013 valuation, along with a change to the Entry Age Normal (EAN) actuarial method. Assumptions are reviewed annually. No additional changes were made for the 2014 valuation. The long-term expected rate of return on pension plan investments is 7.00%. The pension plan’s policy in regard to the allocation of invested assets is established and may be amended by the TMRS Board of Trustees. Plan assets are managed on a total return basis with an emphasis on both capital appreciation as well as the production of income, in order to satisfy the short-term and long-term funding needs of TMRS.
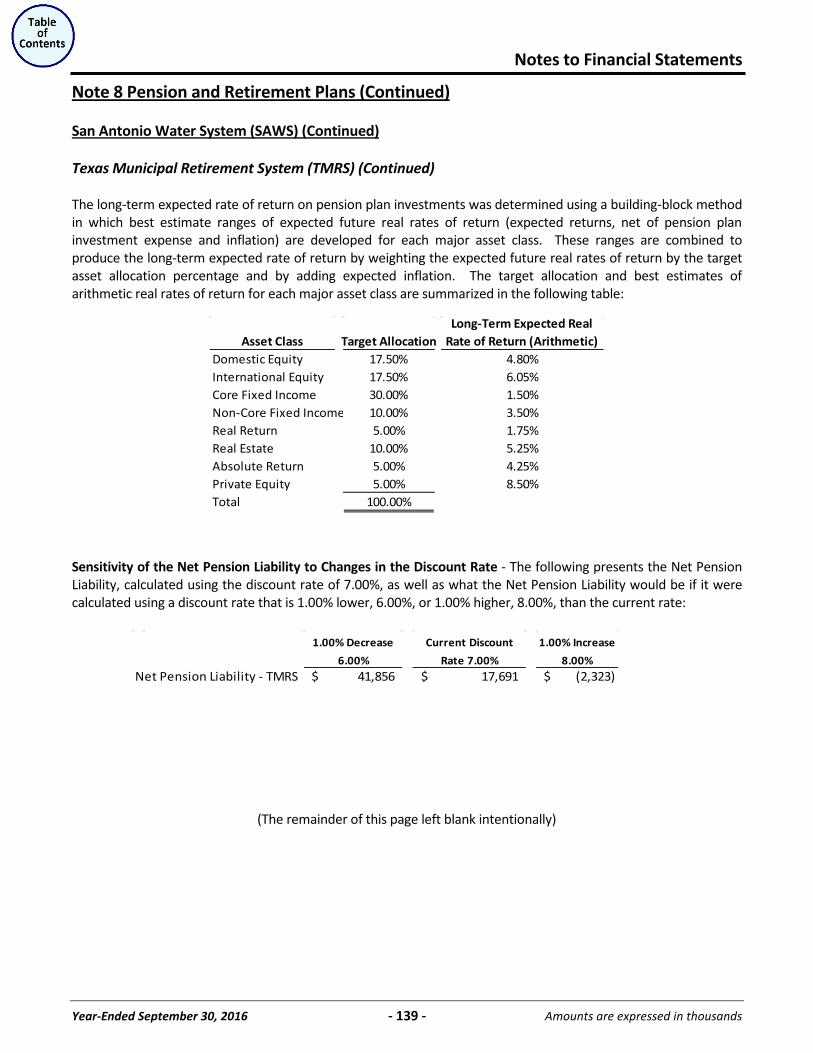
Notes to Financial Statements
Year-Ended September 30, 2016 - 139 - Amounts are expressed in thousands
Note 8 Pension and Retirement Plans (Continued)
San Antonio Water System (SAWS) (Continued)
Texas Municipal Retirement System (TMRS) (Continued) The long-term expected rate of return on pension plan investments was determined using a building-block method in which best estimate ranges of expected future real rates of return (expected returns, net of pension plan investment expense and inflation) are developed for each major asset class. These ranges are combined to produce the long-term expected rate of return by weighting the expected future real rates of return by the target asset allocation percentage and by adding expected inflation. The target allocation and best estimates of arithmetic real rates of return for each major asset class are summarized in the following table:
Asset Class Target AllocationLong-Term Expected Real
Rate of Return (Arithmetic)Domestic Equity 17.50% 4.80%International Equity 17.50% 6.05%Core Fixed Income 30.00% 1.50%Non-Core Fixed Income 10.00% 3.50%Real Return 5.00% 1.75%Real Estate 10.00% 5.25%Absolute Return 5.00% 4.25%Private Equity 5.00% 8.50%Total 100.00%
Sensitivity of the Net Pension Liability to Changes in the Discount Rate - The following presents the Net Pension Liability, calculated using the discount rate of 7.00%, as well as what the Net Pension Liability would be if it were calculated using a discount rate that is 1.00% lower, 6.00%, or 1.00% higher, 8.00%, than the current rate:
1.00% Decrease Current Discount 1.00% Increase
6.00% Rate 7.00% 8.00%Net Pension Liability - TMRS 41,856$ 17,691$ (2,323)$
(The remainder of this page left blank intentionally)
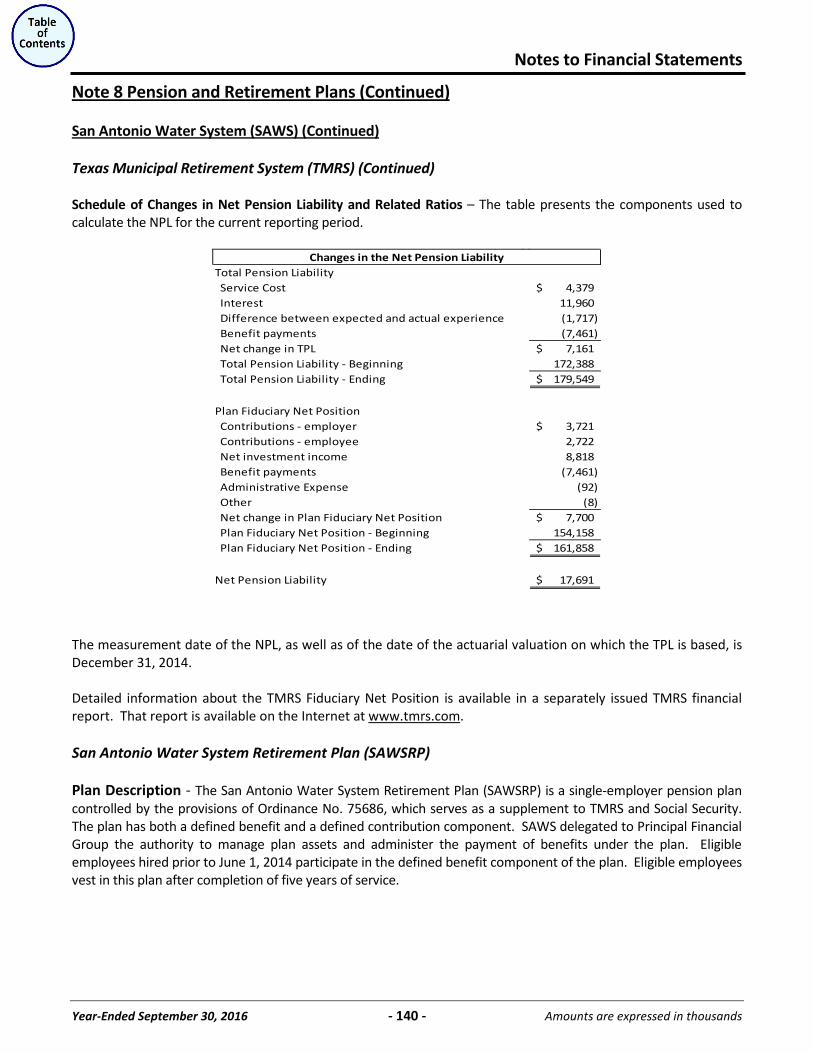
Notes to Financial Statements
Year-Ended September 30, 2016 - 140 - Amounts are expressed in thousands
Note 8 Pension and Retirement Plans (Continued)
San Antonio Water System (SAWS) (Continued)
Texas Municipal Retirement System (TMRS) (Continued) Schedule of Changes in Net Pension Liability and Related Ratios – The table presents the components used to calculate the NPL for the current reporting period.
Changes in the Net Pension LiabilityTotal Pension Liability Service Cost 4,379$ Interest 11,960 Difference between expected and actual experience (1,717) Benefit payments (7,461) Net change in TPL 7,161$ Total Pension Liability - Beginning 172,388 Total Pension Liability - Ending 179,549$
Plan Fiduciary Net Position Contributions - employer 3,721$ Contributions - employee 2,722 Net investment income 8,818 Benefit payments (7,461) Administrative Expense (92) Other (8) Net change in Plan Fiduciary Net Position 7,700$ Plan Fiduciary Net Position - Beginning 154,158 Plan Fiduciary Net Position - Ending 161,858$
Net Pension Liability 17,691$
The measurement date of the NPL, as well as of the date of the actuarial valuation on which the TPL is based, is December 31, 2014. Detailed information about the TMRS Fiduciary Net Position is available in a separately issued TMRS financial report. That report is available on the Internet at www.tmrs.com
.
San Antonio Water System Retirement Plan (SAWSRP) Plan Description - The San Antonio Water System Retirement Plan (SAWSRP) is a single-employer pension plan controlled by the provisions of Ordinance No. 75686, which serves as a supplement to TMRS and Social Security. The plan has both a defined benefit and a defined contribution component. SAWS delegated to Principal Financial Group the authority to manage plan assets and administer the payment of benefits under the plan. Eligible employees hired prior to June 1, 2014 participate in the defined benefit component of the plan. Eligible employees vest in this plan after completion of five years of service.
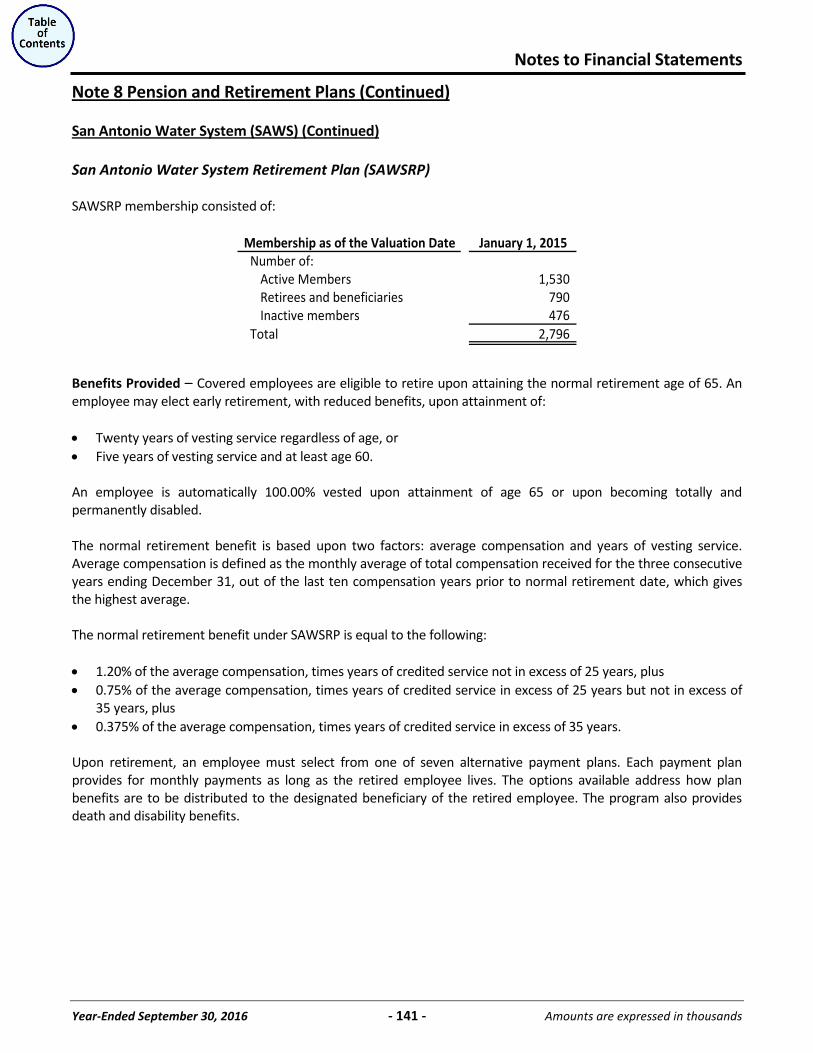
Notes to Financial Statements
Year-Ended September 30, 2016 - 141 - Amounts are expressed in thousands
Note 8 Pension and Retirement Plans (Continued)
San Antonio Water System (SAWS) (Continued)
San Antonio Water System Retirement Plan (SAWSRP) SAWSRP membership consisted of:
Membership as of the Valuation Date January 1, 2015Number of:
Active Members 1,530 Retirees and beneficiaries 790 Inactive members 476
Total 2,796
Benefits Provided – Covered employees are eligible to retire upon attaining the normal retirement age of 65. An employee may elect early retirement, with reduced benefits, upon attainment of:
Twenty years of vesting service regardless of age, or Five years of vesting service and at least age 60.
An employee is automatically 100.00% vested upon attainment of age 65 or upon becoming totally and permanently disabled. The normal retirement benefit is based upon two factors: average compensation and years of vesting service. Average compensation is defined as the monthly average of total compensation received for the three consecutive years ending December 31, out of the last ten compensation years prior to normal retirement date, which gives the highest average. The normal retirement benefit under SAWSRP is equal to the following:
1.20% of the average compensation, times years of credited service not in excess of 25 years, plus 0.75% of the average compensation, times years of credited service in excess of 25 years but not in excess of 35 years, plus 0.375% of the average compensation, times years of credited service in excess of 35 years.
Upon retirement, an employee must select from one of seven alternative payment plans. Each payment plan provides for monthly payments as long as the retired employee lives. The options available address how plan benefits are to be distributed to the designated beneficiary of the retired employee. The program also provides death and disability benefits.
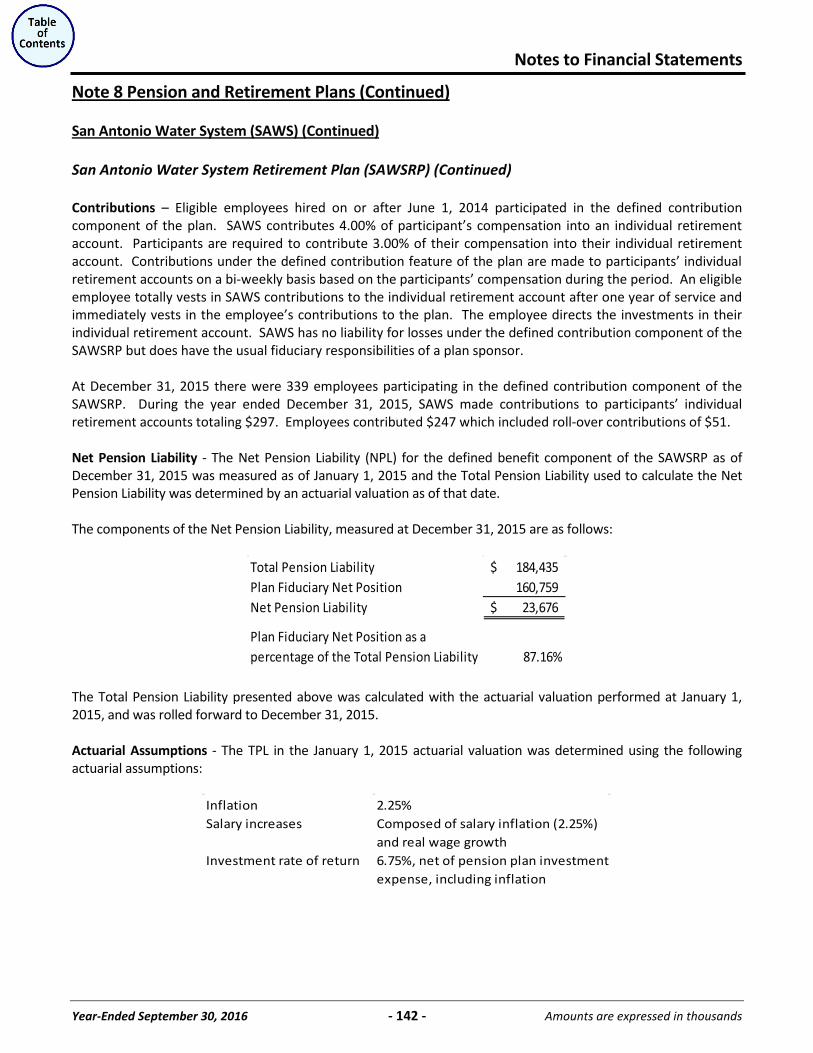
Notes to Financial Statements
Year-Ended September 30, 2016 - 142 - Amounts are expressed in thousands
Note 8 Pension and Retirement Plans (Continued)
San Antonio Water System (SAWS) (Continued)
San Antonio Water System Retirement Plan (SAWSRP) (Continued) Contributions – Eligible employees hired on or after June 1, 2014 participated in the defined contribution component of the plan. SAWS contributes 4.00% of participant’s compensation into an individual retirement account. Participants are required to contribute 3.00% of their compensation into their individual retirement account. Contributions under the defined contribution feature of the plan are made to participants’ individual retirement accounts on a bi-weekly basis based on the participants’ compensation during the period. An eligible employee totally vests in SAWS contributions to the individual retirement account after one year of service and immediately vests in the employee’s contributions to the plan. The employee directs the investments in their individual retirement account. SAWS has no liability for losses under the defined contribution component of the SAWSRP but does have the usual fiduciary responsibilities of a plan sponsor. At December 31, 2015 there were 339 employees participating in the defined contribution component of the SAWSRP. During the year ended December 31, 2015, SAWS made contributions to participants’ individual retirement accounts totaling $297. Employees contributed $247 which included roll-over contributions of $51. Net Pension Liability - The Net Pension Liability (NPL) for the defined benefit component of the SAWSRP as of December 31, 2015 was measured as of January 1, 2015 and the Total Pension Liability used to calculate the Net Pension Liability was determined by an actuarial valuation as of that date. The components of the Net Pension Liability, measured at December 31, 2015 are as follows:
Total Pension Liability 184,435$ Plan Fiduciary Net Position 160,759 Net Pension Liability 23,676$
Plan Fiduciary Net Position as a percentage of the Total Pension Liability 87.16%
The Total Pension Liability presented above was calculated with the actuarial valuation performed at January 1, 2015, and was rolled forward to December 31, 2015. Actuarial Assumptions - The TPL in the January 1, 2015 actuarial valuation was determined using the following actuarial assumptions:
Inflation 2.25%Salary increases Composed of salary inflation (2.25%)
and real wage growthInvestment rate of return 6.75%, net of pension plan investment
expense, including inflation
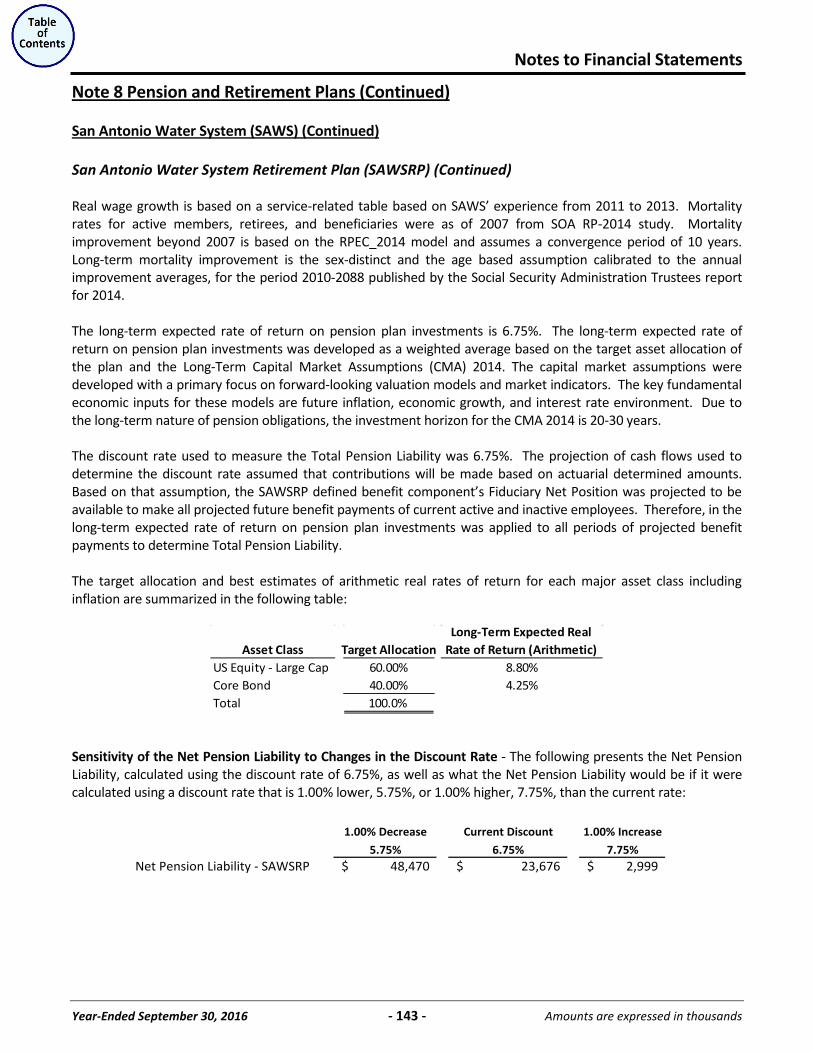
Notes to Financial Statements
Year-Ended September 30, 2016 - 143 - Amounts are expressed in thousands
Note 8 Pension and Retirement Plans (Continued)
San Antonio Water System (SAWS) (Continued)
San Antonio Water System Retirement Plan (SAWSRP) (Continued) Real wage growth is based on a service-related table based on SAWS’ experience from 2011 to 2013. Mortality rates for active members, retirees, and beneficiaries were as of 2007 from SOA RP-2014 study. Mortality improvement beyond 2007 is based on the RPEC_2014 model and assumes a convergence period of 10 years. Long-term mortality improvement is the sex-distinct and the age based assumption calibrated to the annual improvement averages, for the period 2010-2088 published by the Social Security Administration Trustees report for 2014. The long-term expected rate of return on pension plan investments is 6.75%. The long-term expected rate of return on pension plan investments was developed as a weighted average based on the target asset allocation of the plan and the Long-Term Capital Market Assumptions (CMA) 2014. The capital market assumptions were developed with a primary focus on forward-looking valuation models and market indicators. The key fundamental economic inputs for these models are future inflation, economic growth, and interest rate environment. Due to the long-term nature of pension obligations, the investment horizon for the CMA 2014 is 20-30 years. The discount rate used to measure the Total Pension Liability was 6.75%. The projection of cash flows used to determine the discount rate assumed that contributions will be made based on actuarial determined amounts. Based on that assumption, the SAWSRP defined benefit component’s Fiduciary Net Position was projected to be available to make all projected future benefit payments of current active and inactive employees. Therefore, in the long-term expected rate of return on pension plan investments was applied to all periods of projected benefit payments to determine Total Pension Liability. The target allocation and best estimates of arithmetic real rates of return for each major asset class including inflation are summarized in the following table:
Asset Class Target AllocationLong-Term Expected Real
Rate of Return (Arithmetic)US Equity - Large Cap 60.00% 8.80%Core Bond 40.00% 4.25%Total 100.0%
Sensitivity of the Net Pension Liability to Changes in the Discount Rate - The following presents the Net Pension Liability, calculated using the discount rate of 6.75%, as well as what the Net Pension Liability would be if it were calculated using a discount rate that is 1.00% lower, 5.75%, or 1.00% higher, 7.75%, than the current rate:
1.00% Decrease Current Discount 1.00% Increase
5.75% 6.75% 7.75%Net Pension Liability - SAWSRP 48,470$ 23,676$ 2,999$
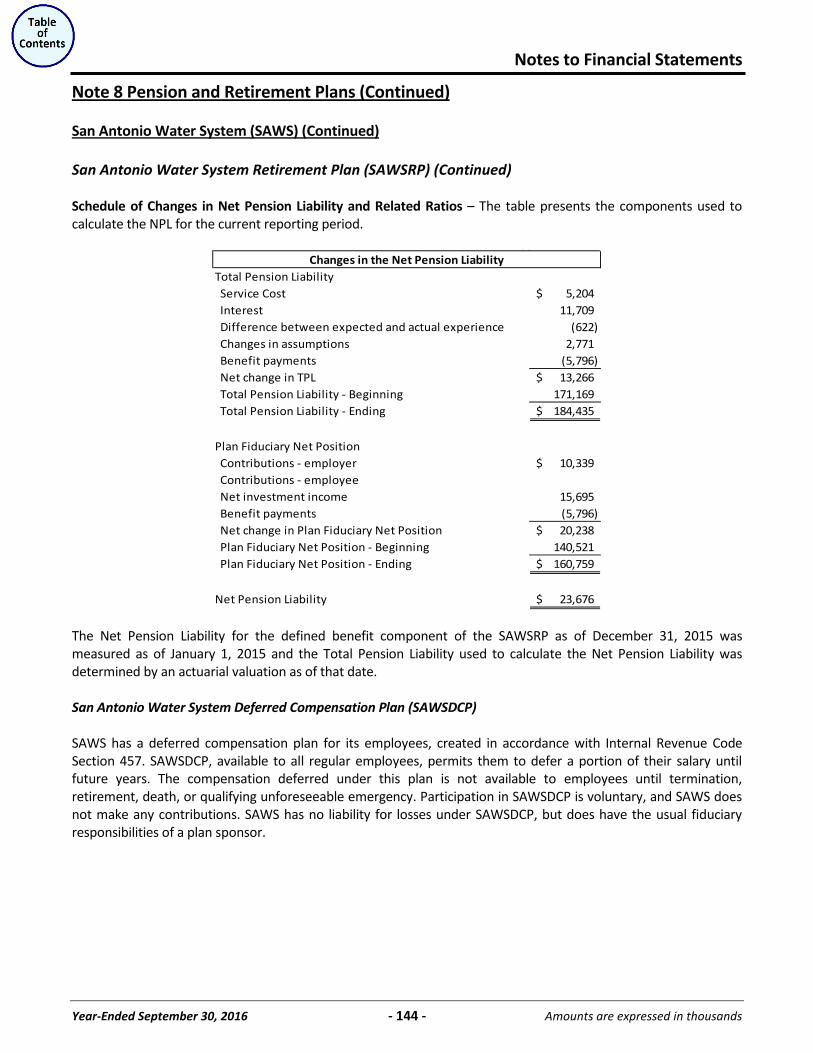
Notes to Financial Statements
Year-Ended September 30, 2016 - 144 - Amounts are expressed in thousands
Note 8 Pension and Retirement Plans (Continued)
San Antonio Water System (SAWS) (Continued)
San Antonio Water System Retirement Plan (SAWSRP) (Continued) Schedule of Changes in Net Pension Liability and Related Ratios – The table presents the components used to calculate the NPL for the current reporting period.
Changes in the Net Pension LiabilityTotal Pension Liability Service Cost 5,204$ Interest 11,709 Difference between expected and actual experience (622) Changes in assumptions 2,771 Benefit payments (5,796) Net change in TPL 13,266$ Total Pension Liability - Beginning 171,169 Total Pension Liability - Ending 184,435$
Plan Fiduciary Net Position Contributions - employer 10,339$ Contributions - employee Net investment income 15,695 Benefit payments (5,796) Net change in Plan Fiduciary Net Position 20,238$ Plan Fiduciary Net Position - Beginning 140,521 Plan Fiduciary Net Position - Ending 160,759$
Net Pension Liability 23,676$
The Net Pension Liability for the defined benefit component of the SAWSRP as of December 31, 2015 was measured as of January 1, 2015 and the Total Pension Liability used to calculate the Net Pension Liability was determined by an actuarial valuation as of that date. San Antonio Water System Deferred Compensation Plan (SAWSDCP) SAWS has a deferred compensation plan for its employees, created in accordance with Internal Revenue Code Section 457. SAWSDCP, available to all regular employees, permits them to defer a portion of their salary until future years. The compensation deferred under this plan is not available to employees until termination, retirement, death, or qualifying unforeseeable emergency. Participation in SAWSDCP is voluntary, and SAWS does not make any contributions. SAWS has no liability for losses under SAWSDCP, but does have the usual fiduciary responsibilities of a plan sponsor.
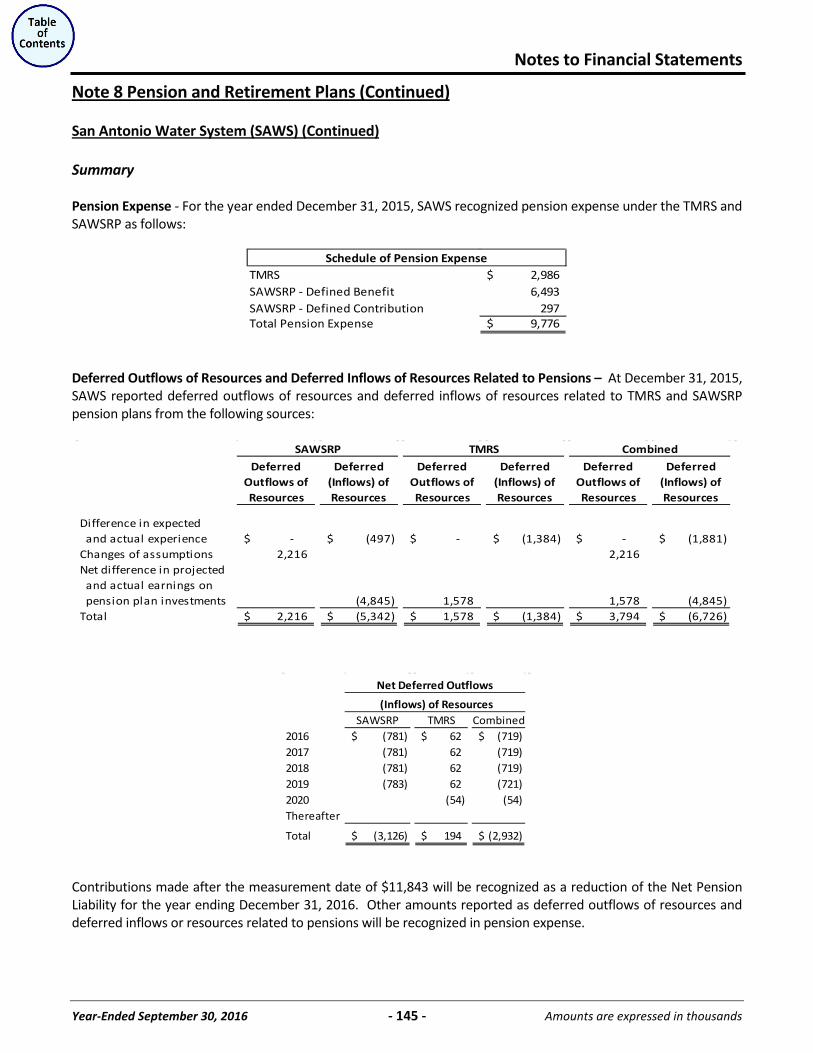
Notes to Financial Statements
Year-Ended September 30, 2016 - 145 - Amounts are expressed in thousands
Note 8 Pension and Retirement Plans (Continued)
San Antonio Water System (SAWS) (Continued)
Summary Pension Expense - For the year ended December 31, 2015, SAWS recognized pension expense under the TMRS and SAWSRP as follows:
Schedule of Pension ExpenseTMRS 2,986$ SAWSRP - Defined Benefit 6,493 SAWSRP - Defined Contribution 297 Total Pension Expense 9,776$
Deferred Outflows of Resources and Deferred Inflows of Resources Related to Pensions – At December 31, 2015, SAWS reported deferred outflows of resources and deferred inflows of resources related to TMRS and SAWSRP pension plans from the following sources:
SAWSRP TMRS Combined
Deferred Outflows of Resources
Deferred (Inflows) of Resources
Deferred Outflows of Resources
Deferred (Inflows) of Resources
Deferred Outflows of Resources
Deferred (Inflows) of Resources
Difference in expected and actual experience -$ (497)$ -$ (1,384)$ -$ (1,881)$ Changes of assumptions 2,216 2,216 Net difference in projected and actual earnings on pension plan investments (4,845) 1,578 1,578 (4,845) Total 2,216$ (5,342)$ 1,578$ (1,384)$ 3,794$ (6,726)$
Net Deferred Outflows
(Inflows) of ResourcesSAWSRP TMRS Combined
2016 (781)$ 62$ (719)$ 2017 (781) 62 (719) 2018 (781) 62 (719) 2019 (783) 62 (721) 2020 (54) (54) Thereafter
Total (3,126)$ 194$ (2,932)$
Contributions made after the measurement date of $11,843 will be recognized as a reduction of the Net Pension Liability for the year ending December 31, 2016. Other amounts reported as deferred outflows of resources and deferred inflows or resources related to pensions will be recognized in pension expense.
Notes to Financial Statements
Year-Ended September 30, 2016 - 146 - Amounts are expressed in thousands
Note 8 Pension and Retirement Plans (Continued)
CPS Energy
All Employee Plan Plan Description - The City Public Service Energy Pension Plan (the Plan) is a self-administered, single-employer, defined-benefit contributory pension plan covering substantially all employees who have attained age 21 and completed one year of service. The Plan is sponsored by and may be amended at any time by CPS Energy, acting by and through an Oversight Committee, which includes the President and CEO, the Chief Financial Officer and the Audit Committee Chair of CPS Energy’s board of trustees. Plan assets are segregated from CPS Energy’s assets and are separately managed by an Administrative Committee, whose members are appointed by the Oversight Committee. The Plan reports results on a calendar-year basis, and the separately audited financial statements, which contain historical trend information, may be obtained at www.cpsenergy.com or by contacting Benefit Trust Administration at CPS Energy. The Plan’s financial statements include certain disclosures related to CPS Energy’s net pension liability. However, because the financial reporting and pension measurement dates for the Plan and CPS Energy are not aligned, the Plan’s disclosures will vary from information provided by CPS Energy in this footnote and in the accompanying RSI. In addition to the defined-benefit pension plan, CPS Energy has two Restoration Plans that were effective as of January 1, 1998, which supplement benefits paid from the Plan due to Internal Revenue Code restrictions on benefit and compensation limits. The benefits due under those Restoration Plans have been paid annually by CPS Energy. Employees who retired prior to 1983 receive annuity payments from an insurance carrier, as well as some benefits directly from CPS Energy. The costs for the benefits directly received from CPS Energy were $20 for fiscal year 2016. These costs were recorded when paid. Benefits Provided – Participants become fully vested in the benefits of the Plan upon attainment of age 40 or after completion of seven years of vesting service before age 40. Normal retirement is age 65; however, early retirement is available with 25 years of benefit service, as well as to those employees who are age 55 or older with at least ten years of benefit service. Retirement benefits are based on length of service and compensation, and benefits are reduced for retirement before age 55 with 25 years or more of benefit service or before age 62 with less than 25 years of service. If early retirement occurs due to disability, the reductions in benefits normally associated with early retirement are modified.
Payments to retirees are adjusted each year by an amount equal to 50.00% of the change in the Consumer Price Index-U, limited to a maximum adjustment of 5.00% each year, with no reduction allowed below the retirees’ initial benefit levels.
(The remainder of this page left blank intentionally)
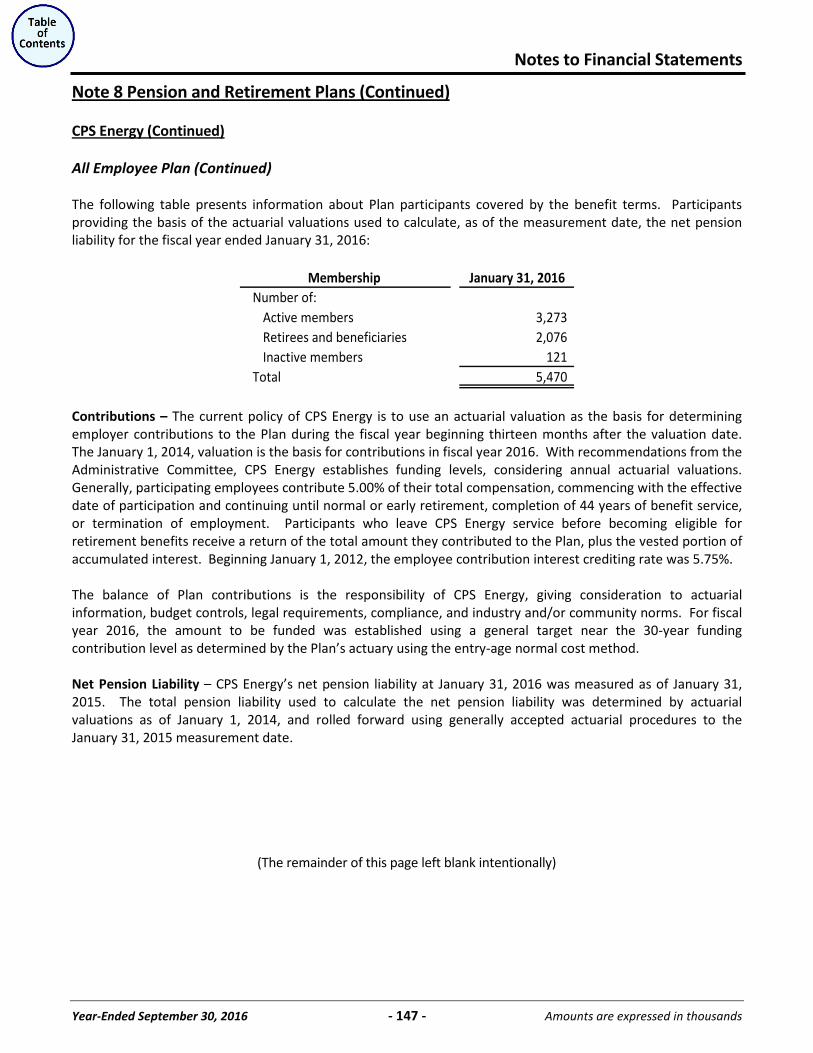
Notes to Financial Statements
Year-Ended September 30, 2016 - 147 - Amounts are expressed in thousands
Note 8 Pension and Retirement Plans (Continued)
CPS Energy (Continued)
All Employee Plan (Continued) The following table presents information about Plan participants covered by the benefit terms. Participants providing the basis of the actuarial valuations used to calculate, as of the measurement date, the net pension liability for the fiscal year ended January 31, 2016:
Membership January 31, 2016Number of:
Active members 3,273 Retirees and beneficiaries 2,076 Inactive members 121
Total 5,470
Contributions – The current policy of CPS Energy is to use an actuarial valuation as the basis for determining employer contributions to the Plan during the fiscal year beginning thirteen months after the valuation date. The January 1, 2014, valuation is the basis for contributions in fiscal year 2016. With recommendations from the Administrative Committee, CPS Energy establishes funding levels, considering annual actuarial valuations. Generally, participating employees contribute 5.00% of their total compensation, commencing with the effective date of participation and continuing until normal or early retirement, completion of 44 years of benefit service, or termination of employment. Participants who leave CPS Energy service before becoming eligible for retirement benefits receive a return of the total amount they contributed to the Plan, plus the vested portion of accumulated interest. Beginning January 1, 2012, the employee contribution interest crediting rate was 5.75%. The balance of Plan contributions is the responsibility of CPS Energy, giving consideration to actuarial information, budget controls, legal requirements, compliance, and industry and/or community norms. For fiscal year 2016, the amount to be funded was established using a general target near the 30-year funding contribution level as determined by the Plan’s actuary using the entry-age normal cost method. Net Pension Liability – CPS Energy’s net pension liability at January 31, 2016 was measured as of January 31, 2015. The total pension liability used to calculate the net pension liability was determined by actuarial valuations as of January 1, 2014, and rolled forward using generally accepted actuarial procedures to the January 31, 2015 measurement date.
(The remainder of this page left blank intentionally)
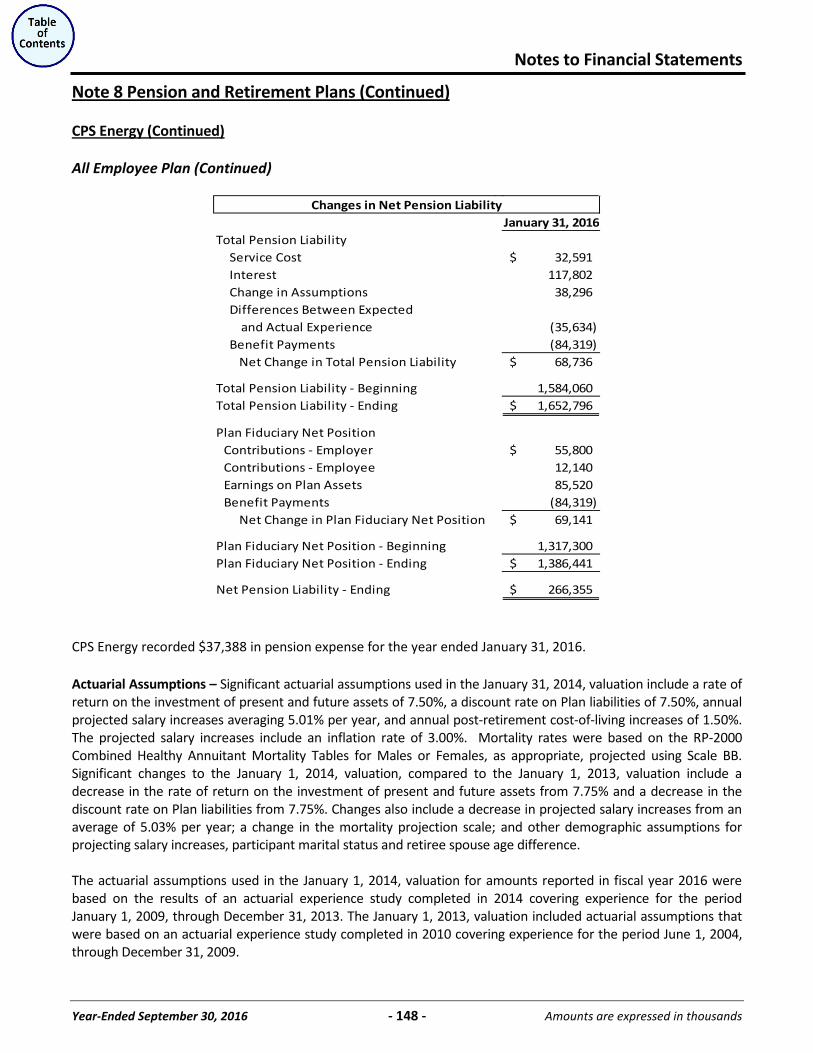
Notes to Financial Statements
Year-Ended September 30, 2016 - 148 - Amounts are expressed in thousands
Note 8 Pension and Retirement Plans (Continued)
CPS Energy (Continued)
All Employee Plan (Continued)
Changes in Net Pension LiabilityJanuary 31, 2016
Total Pension LiabilityService Cost 32,591$ Interest 117,802 Change in Assumptions 38,296 Differences Between Expected and Actual Experience (35,634) Benefit Payments (84,319)
Net Change in Total Pension Liability 68,736$
Total Pension Liability - Beginning 1,584,060 Total Pension Liability - Ending 1,652,796$
Plan Fiduciary Net Position Contributions - Employer 55,800$ Contributions - Employee 12,140 Earnings on Plan Assets 85,520 Benefit Payments (84,319)
Net Change in Plan Fiduciary Net Position 69,141$
Plan Fiduciary Net Position - Beginning 1,317,300 Plan Fiduciary Net Position - Ending 1,386,441$
Net Pension Liability - Ending 266,355$
CPS Energy recorded $37,388 in pension expense for the year ended January 31, 2016. Actuarial Assumptions – Significant actuarial assumptions used in the January 31, 2014, valuation include a rate of return on the investment of present and future assets of 7.50%, a discount rate on Plan liabilities of 7.50%, annual projected salary increases averaging 5.01% per year, and annual post-retirement cost-of-living increases of 1.50%. The projected salary increases include an inflation rate of 3.00%. Mortality rates were based on the RP-2000 Combined Healthy Annuitant Mortality Tables for Males or Females, as appropriate, projected using Scale BB. Significant changes to the January 1, 2014, valuation, compared to the January 1, 2013, valuation include a decrease in the rate of return on the investment of present and future assets from 7.75% and a decrease in the discount rate on Plan liabilities from 7.75%. Changes also include a decrease in projected salary increases from an average of 5.03% per year; a change in the mortality projection scale; and other demographic assumptions for projecting salary increases, participant marital status and retiree spouse age difference. The actuarial assumptions used in the January 1, 2014, valuation for amounts reported in fiscal year 2016 were based on the results of an actuarial experience study completed in 2014 covering experience for the period January 1, 2009, through December 31, 2013. The January 1, 2013, valuation included actuarial assumptions that were based on an actuarial experience study completed in 2010 covering experience for the period June 1, 2004, through December 31, 2009.
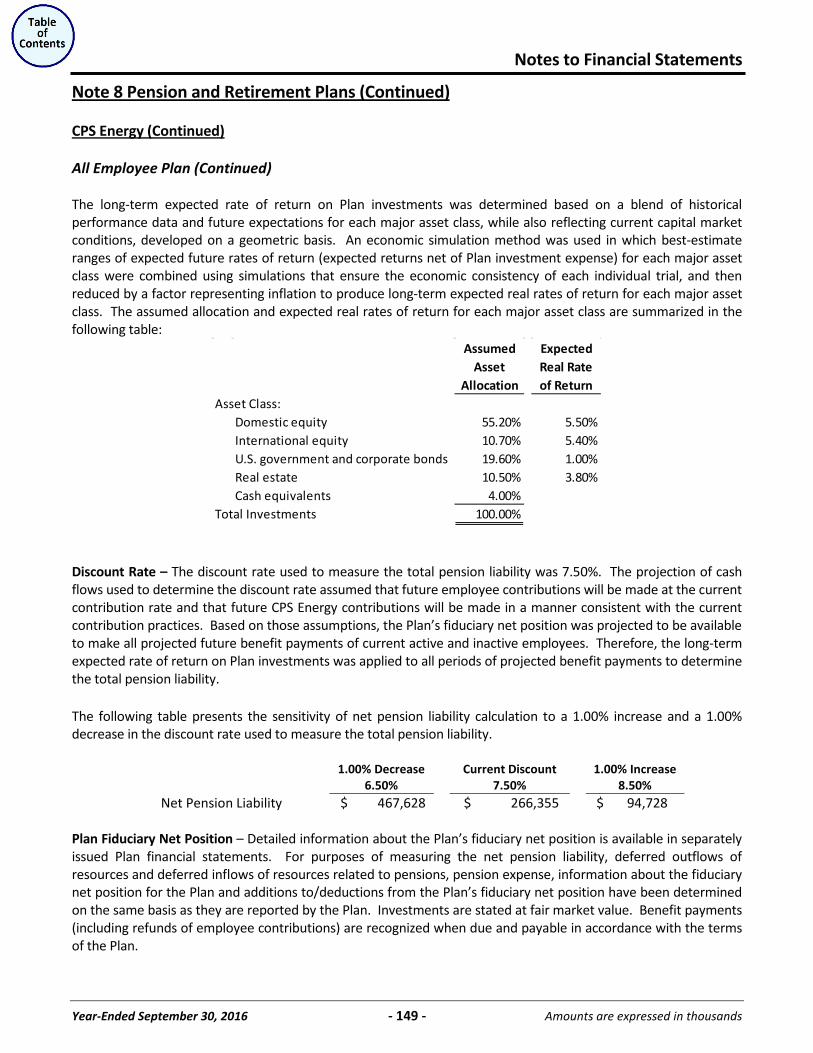
Notes to Financial Statements
Year-Ended September 30, 2016 - 149 - Amounts are expressed in thousands
Note 8 Pension and Retirement Plans (Continued)
CPS Energy (Continued)
All Employee Plan (Continued) The long-term expected rate of return on Plan investments was determined based on a blend of historical performance data and future expectations for each major asset class, while also reflecting current capital market conditions, developed on a geometric basis. An economic simulation method was used in which best-estimate ranges of expected future rates of return (expected returns net of Plan investment expense) for each major asset class were combined using simulations that ensure the economic consistency of each individual trial, and then reduced by a factor representing inflation to produce long-term expected real rates of return for each major asset class. The assumed allocation and expected real rates of return for each major asset class are summarized in the following table:
Assumed ExpectedAsset Real Rate
Allocation of ReturnAsset Class:
Domestic equity 55.20% 5.50%International equity 10.70% 5.40%U.S. government and corporate bonds 19.60% 1.00%Real estate 10.50% 3.80%Cash equivalents 4.00%
Total Investments 100.00%
Discount Rate – The discount rate used to measure the total pension liability was 7.50%. The projection of cash flows used to determine the discount rate assumed that future employee contributions will be made at the current contribution rate and that future CPS Energy contributions will be made in a manner consistent with the current contribution practices. Based on those assumptions, the Plan’s fiduciary net position was projected to be available to make all projected future benefit payments of current active and inactive employees. Therefore, the long-term expected rate of return on Plan investments was applied to all periods of projected benefit payments to determine the total pension liability. The following table presents the sensitivity of net pension liability calculation to a 1.00% increase and a 1.00% decrease in the discount rate used to measure the total pension liability.
1.00% Decrease Current Discount 1.00% Increase 6.50% 7.50% 8.50%
Net Pension Liability $ 467,628 $ 266,355 $ 94,728 Plan Fiduciary Net Position – Detailed information about the Plan’s fiduciary net position is available in separately issued Plan financial statements. For purposes of measuring the net pension liability, deferred outflows of resources and deferred inflows of resources related to pensions, pension expense, information about the fiduciary net position for the Plan and additions to/deductions from the Plan’s fiduciary net position have been determined on the same basis as they are reported by the Plan. Investments are stated at fair market value. Benefit payments (including refunds of employee contributions) are recognized when due and payable in accordance with the terms of the Plan.
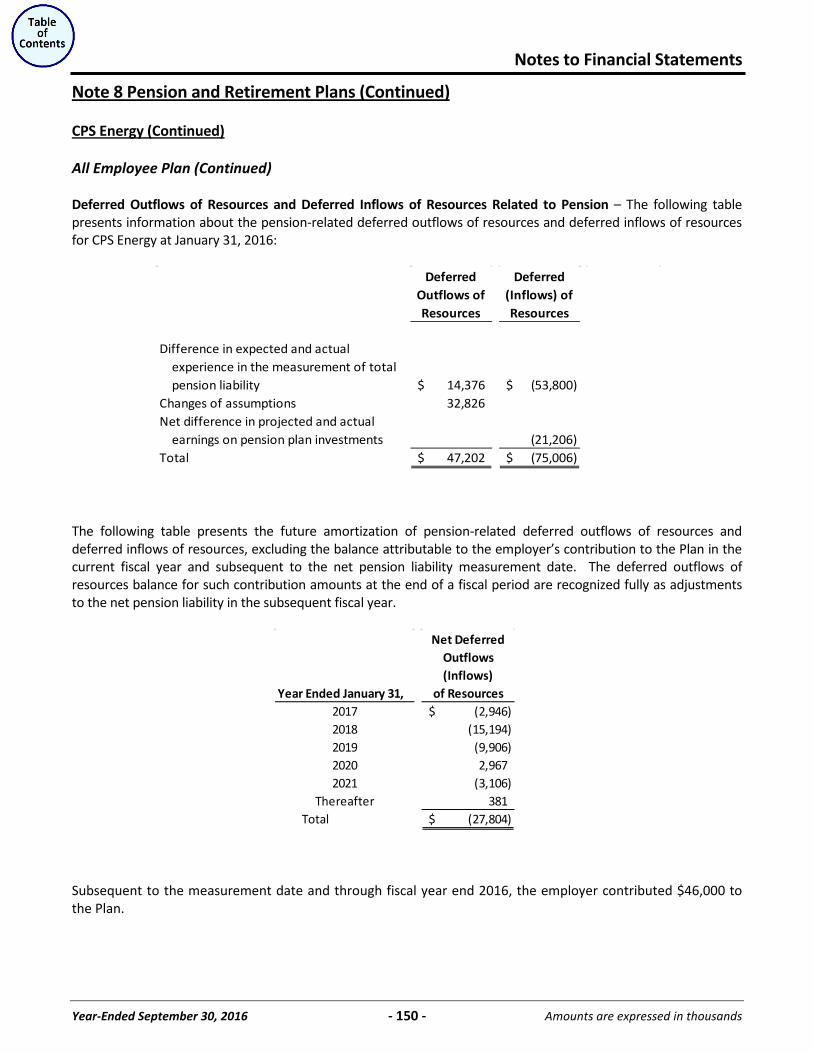
Notes to Financial Statements
Year-Ended September 30, 2016 - 150 - Amounts are expressed in thousands
Note 8 Pension and Retirement Plans (Continued)
CPS Energy (Continued)
All Employee Plan (Continued) Deferred Outflows of Resources and Deferred Inflows of Resources Related to Pension – The following table presents information about the pension-related deferred outflows of resources and deferred inflows of resources for CPS Energy at January 31, 2016:
Deferred Outflows of Resources
Deferred (Inflows) of Resources
Difference in expected and actual experience in the measurement of total pension liability 14,376$ (53,800)$ Changes of assumptions 32,826 Net difference in projected and actual earnings on pension plan investments (21,206) Total 47,202$ (75,006)$
The following table presents the future amortization of pension-related deferred outflows of resources and deferred inflows of resources, excluding the balance attributable to the employer’s contribution to the Plan in the current fiscal year and subsequent to the net pension liability measurement date. The deferred outflows of resources balance for such contribution amounts at the end of a fiscal period are recognized fully as adjustments to the net pension liability in the subsequent fiscal year.
Subsequent to the measurement date and through fiscal year end 2016, the employer contributed $46,000 to the Plan.
Year Ended January 31,
Net Deferred Outflows (Inflows)
of Resources2017 (2,946)$ 2018 (15,194) 2019 (9,906) 2020 2,967 2021 (3,106)
Thereafter 381 Total (27,804)$
Notes to Financial Statements
Year-Ended September 30, 2016 - 151 - Amounts are expressed in thousands
Note 9 Post-employment Retirement Benefits
Primary Government (City)
Plan Description – In addition to the pension benefits discussed in Note 8, Pension and Retirement Plans, the City provides Medicare eligible civilian and uniformed retirees with certain health benefits under two post-employment benefit programs. Pursuant to GASB Statement No. 45, Accounting and Financial Reporting by Employers for Post-employment Benefits Other Than Pensions, the City is required to account for and disclose its other post-employment liability for these programs. The City continues to actively review and have actuarial valuations performed for these programs as required. Civilian and pre-October 1, 1989 uniformed retirees are covered under the City’s post-employment benefit programs, which includes pre-Medicare eligible and post-Medicare eligible options. Retirees not covered by Medicare are covered under a program is comprised of two self-funded PPO health plans currently administered by United Healthcare. These plans may be amended at any time with approval from the City Council. This program is funded on a pay-as-you-go basis with an aggregate sharing of premium costs based on the following targets: 67.00% by the City and 33.00% by the retiree for those retirees hired prior to October 2007. With the adoption of the fiscal year 2008 Budget, additional changes were made to this retirement health plan. For all non-uniformed employees beginning employment on or after October 1, 2007, a revised schedule for sharing of the costs on a pay-as-you-go basis is effective. The revised schedule is as follows: (1) Employees who separate from the City with less than five years of service are not eligible to participate in the program; (2) Employees who separate with at least five years of service but less than 10 years of service are eligible to participate in the program but without City subsidy; and (3) Employees who separate from employment with 10 years of service or more will pay for 50.00% of the pay-as-you-go contributions to the program and the City will contribute the remaining 50.00%. The ability to participate in the program remains based on meeting retirement criteria for the TMRS Pension Plan. Another post-employment retirement benefit program offered to 1,107 participating retirees and surviving spouses is available to eligible retirees who have Medicare coverage. All retirees and dependents are required to apply for and maintain Medicare Parts A & B coverage once they reach age 65 or otherwise become eligible for Medicare, in order to participate in one of two Medicare Advantage PPO Plans or the Medicare Part D Drug Plan. Of the current 1,107 participating Medicare retirees and surviving spouses, 133 participate in a fully insured Medicare Advantage PPO Plus plan, 972 participate in a Medicare Advantage PPO plan, and two participate in the Medicare Part D Drug Plan. As of September 30, 2016, there are 6,242 active civilian employees who may become eligible in the future. Employees may become eligible to participate in this program based on eligibility for a retirement benefit under the rules for TMRS Pension Plan and their number of years of service to the City. Under the TMRS Pension Plan, employees may retire at age 60 and above with five or more years of service or with 20 years of service regardless of age. Retiree medical benefits continue for the life of the retiree and their surviving eligible dependents that were covered at the time of the employee’s severance of service. Non-uniformed City employees who qualify for a disability pension under TMRS rules are also eligible to receive the retiree medical benefit under this plan. As of September 30, 2016, there were 402 retirees and surviving spouses participating in this program. Participant data disclosed above is not expressed in thousands.
Notes to Financial Statements
Year-Ended September 30, 2016 - 152 - Amounts are expressed in thousands
Note 9 Post-employment Retirement Benefits (Continued)
Primary Government (City) (Continued)
Funding Policy – The cost of the program is reviewed annually, and the costs of medical claims are funded jointly by the City and retirees on a pay-as-you-go basis, based on the allocations described above. No contributions were made in fiscal year 2016 to prefund benefits. For the fiscal year-ended September 30, 2016, total contributions were as follows:
City 6,355$ Retiree Premiums 1,605
Total Contributions 7,960$
Total Contributions
The primary source of payment for the City contributions for pay-go contributions is the General Fund. The Self Insurance Fund assesses funds based on active, non-uniformed employees assigned to the various funds. Annual OPEB Cost and Net OPEB Obligation – For the fiscal year-ended September 30, 2016, the City’s annual post-employment benefits other than pension (OPEB) cost was not equal to its annual required contribution (ARC) to the plan. The City’s annual OPEB cost is calculated based on the ARC of the employer, an amount actuarially determined in accordance with GASB Statement No. 45. The ARC represents a level of funding that if paid on an ongoing basis, is projected to cover normal cost each year and amortize any unfunded actuarial balance over thirty years. The City will not be fully funding the ARC at this time. The City will continue to fund OPEB on a pay-as-you-go basis and will continue to monitor and review these programs to manage associated costs and liabilities. Actuarial Methods and Assumptions – Actuarial valuations of an ongoing plan involve estimates of the value of reported amounts and assumptions about the probability of occurrence of events far into the future. Examples include assumptions about future employment, mortality, and the healthcare cost trend. Amounts determined regarding the funded status of the plan and the ARCs of the employer are subject to continual revision as actual results are compared with past expectations and new estimates are made about the future. Projections of benefits for financial reporting purposes are based on the substantive plan (the plan as understood by the employer and the plan members) and include the types of benefits provided at the time of each valuation and the historical pattern of sharing of benefit costs between the City and plan members to that point. The actuarial methods and assumptions used include techniques that are designed to reduce the effects of short-term volatility in actuarial accrued liabilities and the actuarial value of assets, consistent with the long-term perspective of the calculations. The table below details the actuarial methods and assumptions for the City’s OPEB calculation for the fiscal year-ended September 30, 2016:
Actuarial Valuation Date 10/1/2015Actuarial Cost Method Projected Unit CreditAmortization Method Level Dollar, OpenRemaining Amortization Period 30 YearsAsset Valuation Method N/AGeneral Inflation Rate 2.00%Actuarial Assumptions:
Investment Rate of Return 3.00%Projected Salary Increase N/AHealthcare Inflation Rate - Pre-Medicare 8.00% initial (2016)Medical and Prescription 4.50% ultimate (2023)
Assumptions
Notes to Financial Statements
Year-Ended September 30, 2016 - 153 - Amounts are expressed in thousands
Note 9 Post-employment Retirement Benefits (Continued)
Primary Government (City) (Continued)
Below is the health care cost trend assumptions used for the City’s October 1, 2015 actuarial study reviewed and updated for the fiscal year-ended September 30, 2016.
2017 7.50%2018 7.00%2019 6.50%2020 6.00%2021 5.50%2022 5.00%
2023+ 4.50%
City's Health Care Cost Trend Assumptions
YearMedical &
Prescription Drugs
The City’s retiree participation rate is estimated to be at 60.00%. This estimate is based on an evaluation of City retirees enrolled in the City’s retiree plan, versus those enrolled in TMRS. Numerous City retirees are former military, or are able to obtain health insurance through spouses’ insurance, etc. The required schedules of funding progress immediately follows the notes to the financial statements, and they present multi-year trend information regarding the actuarial value of plan assets relative to the actuarial liability for benefits. For additional information, contact City of San Antonio Human Resource Department, Employee Benefit Division, at 111 Soledad, Suite 200, San Antonio, Texas, 78205. Fire and Police Retiree Health Care Fund Plan Description – The second post-employment benefit program of the City, the Fire and Police Retiree Health Care Fund, San Antonio (Health Fund) is a Texas statutory retirement health trust for firefighters and police officers of the City. The trust holds assets and liabilities of the City’s Fire and Police Retiree Health Care Plan (Plan). This Plan is a single-employer defined benefit post-employment health care plan that was created in October 1989 in accordance with provisions established by contract with the local fire and police unions to provide post-employment healthcare benefits to police officers and firefighters of the City retiring after September 30, 1989. Authority to establish and amend the Plan’s post-employment health care benefits is based on regulations enacted by the Texas Legislature that control the operation of the Health Fund. The statutory trust is governed by a Board of Trustees that meets on a monthly basis. The Board consists of nine members: the Mayor or her representative; two members of the City Council; one retired and two active duty police officers; and one retired and two active duty firefighters. The City is the only participating employer in the Plan. WEB-TPA Employer Services, LLC and Envision Pharmaceutical Services serve as the medical and prescription third party administrators for the Health Fund.
Notes to Financial Statements
Year-Ended September 30, 2016 - 154 - Amounts are expressed in thousands
Note 9 Post-employment Retirement Benefits (Continued)
Primary Government (City) (Continued)
Fire and Police Retiree Health Care Fund (Continued) Contributions – Since its inception, the Health Fund has been funded primarily by contributions from the City and active firefighters and police officers, as part of the compensation for services rendered by the union members, and by contributions made by retirees for their dependents. Effective October 1, 2007, the Board implemented state-mandated changes to increase contributions from the Plan’s single employer, the City, and plan members in order to reduce actuarially determined funding deficits and ensure the existence of the Health Fund for future retired firefighters and police officers. The increased contributions were initiated to take effect over a span of years through October 2011 and then stay constant through fiscal year 2016. The state-mandated changes also called for a decrease in the level of benefits. The contribution amounts for each fiscal year, beginning October 1, 2007, are based on a statutory contribution rate that is applied to the average member salary expected for that fiscal year, which is determined by the Health Fund’s actuary. Since fiscal year 2012 the contribution rate has remained at 4.70%, and the related City’s contribution rate has remained constant at 9.40% of the specified wage base. As required by the state-mandated changes effective October 1, 2007, additional changes to the total contribution rate are required beginning October 1, 2017 if the amortization period is above 30 years in the actuarial valuation as of October 1, 2016. Upon determination that the amortization period is in excess of 30 years, both the City and the fire/police contribution rates would be increased by up to 10.00% each year until the Fund has an amortization period of 30 years. At the same time, there would be benefit reductions that would begin January 1, 2018, resulting from imposed increases of up to 10.00% each year in the maximum deductible and in the maximum out-of-pocket payments. To comply with the mandate, the Health Fund’s actuary estimates a contribution rate change for fiscal year 2018, to increase to 5.17% for the participants and to 10.34% for the City, and end with an ultimate contribution rate of 5.53% by the participants and 11.07% by the City for fiscal year 2019 and thereafter. The table below summarizes the actuary’s determinations of the contribution amount for the three months ended December 31, 2015 (not expressed in thousands); based on an actuarial valuation date of October 1, 2015:
Biweekly Contributions: Active Fire and Police Member 131.01$ City for Each Active Fire and Police Member 262.02$
Monthly Contributions: Retirees with less than 30 years of service 283.86$ Dependent Children 430.83$
Total contributions by active firefighters and police officers were $3,511 for the three months ended December 31, 2015. Membership in the Plan consisted of the following at December 31, 2015 (not expressed in thousands):
Retirees and Beneficiaries Receiving Benefits 3,351 Active Plan Members 3,814 Total Membership 7,165
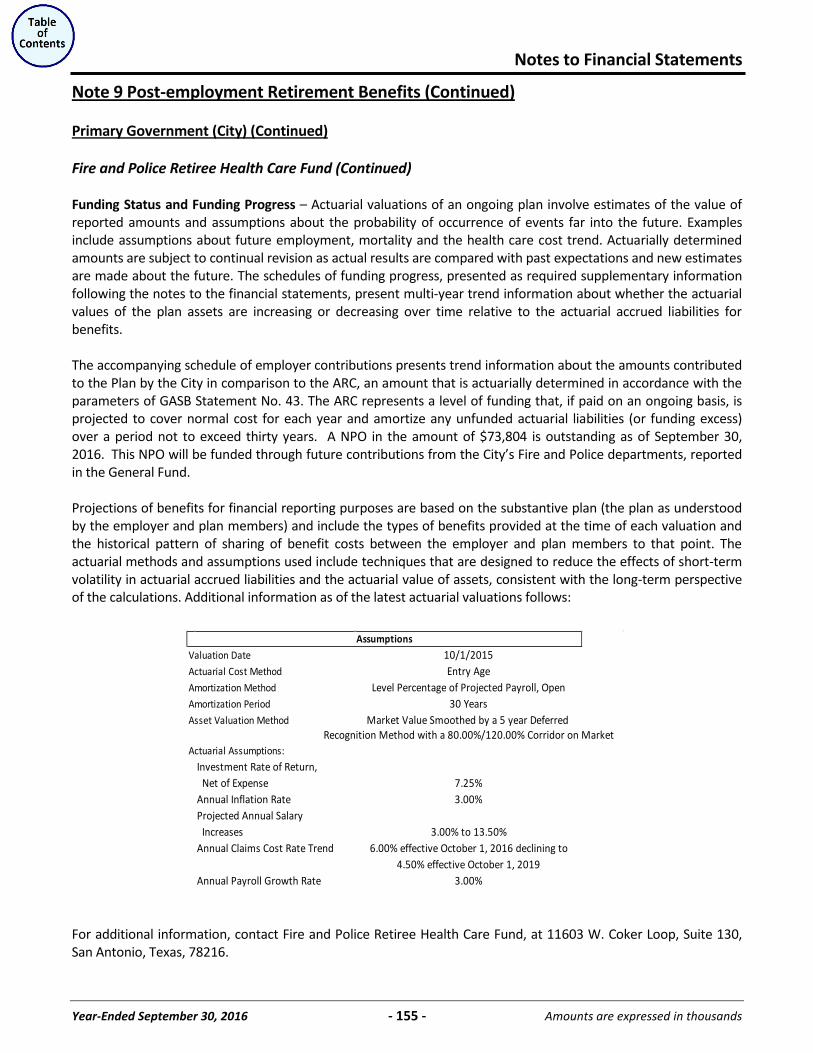
Notes to Financial Statements
Year-Ended September 30, 2016 - 155 - Amounts are expressed in thousands
Note 9 Post-employment Retirement Benefits (Continued)
Primary Government (City) (Continued)
Fire and Police Retiree Health Care Fund (Continued) Funding Status and Funding Progress – Actuarial valuations of an ongoing plan involve estimates of the value of reported amounts and assumptions about the probability of occurrence of events far into the future. Examples include assumptions about future employment, mortality and the health care cost trend. Actuarially determined amounts are subject to continual revision as actual results are compared with past expectations and new estimates are made about the future. The schedules of funding progress, presented as required supplementary information following the notes to the financial statements, present multi-year trend information about whether the actuarial values of the plan assets are increasing or decreasing over time relative to the actuarial accrued liabilities for benefits. The accompanying schedule of employer contributions presents trend information about the amounts contributed to the Plan by the City in comparison to the ARC, an amount that is actuarially determined in accordance with the parameters of GASB Statement No. 43. The ARC represents a level of funding that, if paid on an ongoing basis, is projected to cover normal cost for each year and amortize any unfunded actuarial liabilities (or funding excess) over a period not to exceed thirty years. A NPO in the amount of $73,804 is outstanding as of September 30, 2016. This NPO will be funded through future contributions from the City’s Fire and Police departments, reported in the General Fund. Projections of benefits for financial reporting purposes are based on the substantive plan (the plan as understood by the employer and plan members) and include the types of benefits provided at the time of each valuation and the historical pattern of sharing of benefit costs between the employer and plan members to that point. The actuarial methods and assumptions used include techniques that are designed to reduce the effects of short-term volatility in actuarial accrued liabilities and the actuarial value of assets, consistent with the long-term perspective of the calculations. Additional information as of the latest actuarial valuations follows:
For additional information, contact Fire and Police Retiree Health Care Fund, at 11603 W. Coker Loop, Suite 130, San Antonio, Texas, 78216.
Valuation Date 10/1/2015Actuarial Cost Method Entry AgeAmortization Method Level Percentage of Projected Payroll, OpenAmortization Period 30 YearsAsset Valuation Method Market Value Smoothed by a 5 year Deferred
Recognition Method with a 80.00%/120.00% Corridor on MarketActuarial Assumptions:
Investment Rate of Return, Net of Expense 7.25%Annual Inflation Rate 3.00%Projected Annual Salary Increases 3.00% to 13.50%Annual Claims Cost Rate Trend 6.00% effective October 1, 2016 declining to
4.50% effective October 1, 2019Annual Payroll Growth Rate 3.00%
Assumptions
Notes to Financial Statements
Year-Ended September 30, 2016 - 156 - Amounts are expressed in thousands
Note 9 Post-employment Retirement Benefits (Continued)
CPS Energy
CPS Energy provides certain health, life insurance and disability income benefits for employees. Additionally, most CPS Energy employees continue eligibility upon retirement from CPS Energy. Assets of the plans are held in three separate, single-employer contributory plans:
City Public Service Group Health Plan (Health Plan) – a defined-benefit contributory group health plan that provides health, dental and vision benefits. City Public Service Group Life Insurance Plan (Life Plan) – a defined-benefit contributory plan that provides life insurance benefits. City Public Service Group Disability Plan (Disability Plan) – a defined-benefit employer funded plan that provides disability income benefits.
The Employee Benefit Plans may be amended at any time by CPS Energy, acting by and through the Oversight Committee, which includes the President and CEO, the Chief Financial Officer and the Audit Committee Chair of CPS Energy’s board of trustees. The Employee Benefit Plans’ assets are segregated from CPS Energy’s assets and are separately managed by the Administrative Committee whose members are appointed by the Oversight Committee. The plans report results on a calendar-year basis and issue separately audited financial statements that may be obtained by contacting Benefit Trust Administration at CPS Energy. The Health Plan’s net position was $245,304 at December 31, 2015. The Life Plan’s net position was $47,021 at December 31, 2015. The Disability Plan’s net position was $3,929 at December 31, 2015. Funding Policy – The funding requirements for both the plan participants and the employer are established by and may be amended by CPS Energy. Funding is based on projected pay-as-you-go financing requirements, with an additional amount to prefund benefits as determined annually by CPS Energy. The current policy of CPS Energy is to use each actuarial valuation as the basis for determining monthly employer contributions to the plans during the fiscal year beginning thirteen months after the valuation date. The January 1, 2014 valuation was the basis for contributions in fiscal year 2016. Retired employees contribute to the Health Plan in varying amounts depending upon an equity formula that considers age and years of service. Individuals who retired before February 1, 1993, contribute a base rate plus 2.25% of the difference between that amount and the aggregate rate for each year that the sum of age and service is less than 95. Those who retired on or after February 1, 1993, contribute a base rate plus a percentage of the CPS Energy contribution, based on the number of years of service, if they retired with less than 35 years of service. Retirees and covered dependents contributed $6,804 in fiscal year 2016 for their health insurance benefits. CPS Energy’s contributions in relation to the ARC were 11.50% of covered payroll in fiscal year 2016. The Medicare Prescription Drug Improvement and Modernization Act of 2003, which was effective January 1, 2006, established prescription drug coverage for Medicare beneficiaries known as Medicare Part D. One of the provisions of Medicare Part D entitled the Health Plan to receive retiree drug subsidy payments from the federal government to offset pharmacy claims paid by the Health Plan on behalf of certain plan participants. These payments totaled $927 for fiscal year 2016. In accordance with GASB Technical Bulletin 2006-01, Accounting and Financial Reporting by Employers for Payments from the Federal Government Pursuant to the Retiree Drug Subsidy Provisions of Medicare Part D, future projected payments from the federal government have not been used to lessen total projected obligations under CPS Energy’s Health Plan.
Notes to Financial Statements
Year-Ended September 30, 2016 - 157 - Amounts are expressed in thousands
Note 9 Post-employment Retirement Benefits (Continued)
CPS Energy (Continued)
Employees who retired prior to February 1, 1993, contribute to the Life Plan at a rate of $0.13 per $1 of insurance per month on amounts in excess of $20 plus 2.25% of the difference between that amount and the aggregate rate for retiree coverage for each year the sum of retirement age and service is less than 95. Those who retired on or after February 1, 1993, contribute $0.13 per $1 of insurance per month on amounts in excess of $20 plus a percentage of the CPS Energy contribution, based on number of years of service, if they retired with less than 35 years of service. Retirees and covered dependents contributed $294 in fiscal year 2016 for their life insurance benefits. CPS Energy made no contribution in relation to the ARC in fiscal year 2016. Beginning February 1, 2014, the Disability Plan is funded by a combination of employee and employer contributions. Active employee contribution rates are determined by CPS Energy and may be adjusted on an annual basis. CPS Energy’s contributions are determined on a discretionary basis and are generally based on the actuarial valuation calculations. Retired employees are not eligible to participate and therefore do not contribute to the Disability Plan. Prior to fiscal year 2015, the Disability Plan was funded completely by CPS Energy. CPS Energy’s contributions in relation to the ARC were 0.10% of covered payroll in fiscal year 2016. Annual OPEB Cost and Net OPEB Obligation – CPS Energy’s annual OPEB cost is calculated based on the ARC of the employer, an amount actuarially determined in accordance with the parameters of GASB Statement No. 43. The ARC represents a level of funding that, if paid on an ongoing basis, is projected to cover normal cost each year and amortize any unfunded actuarial liabilities (or funding excess) over a period not to exceed 30 years. The annual OPEB cost consists of the ARC, interest on the net OPEB obligation and adjustments to the ARC for the Health, Life and Disability Plans. The annual OPEB cost was $13,655 for fiscal year 2016. The net OPEB obligation may be either positive, reflecting a liability, or negative, reflecting an asset. The term net OPEB obligation, as used in this Note, refers to either situation. Actuarial Methods and Assumptions – Actuarial valuations of ongoing plans involve estimates of the value of reported amounts and assumptions about the probability of occurrence of events far into the future. Examples include assumptions about future employment, mortality and the healthcare cost trend. Amounts determined regarding the funded status of the plans and the ARCs of the employer are subject to continued revision as actual results are compared with past expectations and new estimates are made about the future. Projections of benefits for financial reporting are based on the substantive plans (the plans as understood by the employer and plan member) and include the types of benefits provided for at the time of each valuation and the historical pattern of sharing of benefit costs between the employer and plan members to that point. The actuarial methods and assumptions used include techniques that are designed to reduce short-term volatility in actuarial accrued liabilities and the actuarial value of assets, consistent with the long-term perspective of the calculations. For the Health Plan, the actuarial cost method used was the projected unit credit actuarial cost method. For the Life and Disability Plans, the aggregate actuarial cost method was used to determine the cost of benefits. Since this method does not identify or separately amortize unfunded actuarial liabilities, information about funded status and funding progress was prepared using the entry age actuarial cost method, which is intended to approximate the funding progress of the plans. The amortization method used for all three Plans was the level-dollar open method, with an amortization period of 20 years. The asset valuation method used for all three plans was the five-year smoothed market valuation method. The January 1 valuation results each year are used to determine the contributions for the fiscal year commencing in the succeeding calendar year.
Notes to Financial Statements
Year-Ended September 30, 2016 - 158 - Amounts are expressed in thousands
Note 9 Post-employment Retirement Benefits (Continued)
CPS Energy (Continued)
Significant actuarial assumptions used in the calculations for the January 1, 2014 actuarial valuation included (a) a rate of return on the investment of present and future assets of 7.50% for the Health, Life and Disability Plans, (b) a Consumer Price Index increase of 3.00% per year for the Life and Disability Plan, (c) projected annual base salary increases for the Health Plan ranging from 4.00% to 9.50% depending on age and projected annual salary increases of 5.01% for the Life and Disability Plans, and (d) overall medical and prescription cost increases projected at 7.50% for 2014, decreasing annually to 5.50% in 2019 and thereafter.
San Antonio Water System (SAWS)
SAWS provides certain healthcare and life insurance benefits for eligible retirees, their spouses, and their dependents through a single-employer defined benefit plan administered by SAWS. The authority to establish and amend the OPEB provisions is vested in the SAWS Board of Trustees. By State law, any employee that retires under either the TMRS or SAWS retirement plans is eligible, at the time of retirement, to obtain health insurance benefits similar to those offered to active SAWS employees. Contributions made by retirees for health insurance benefits vary based on retirement date, years of service and the health care options selected. Retirees may also purchase coverage for their spouse at group rates partially subsidized by SAWS. After age 65, healthcare benefits under the plan are supplemental to Medicare benefits. During 2013 and 2014, the SAWS Board of Trustees approved two changes to the OPEB plan that are expected to significantly reduce the costs of these retiree benefits. Employees hired after December 31, 2013 will not be eligible for any subsidized medical benefits upon retirement from SAWS. They may participate in the plan if they meet other eligibility requirements but will be required to pay the full cost of those benefits. Additionally, beginning in 2015 all Medicare eligible retirees and their dependents will be required to enroll in a fully-insured Medicare Advantage plan sponsored by SAWS. An updated actuarial valuation of the plan was performed as of January 1, 2014 and reflects the impact of these changes to the plan. The following is the participant summary as of January 1, 2014 (the most recent actuarial valuation date, not expressed in thousands):
Active employees 1,502 Retired employees 774
Total 2,276
Funding Policy – The contribution requirements of plan members and SAWS are established and may be amended by the SAWS Board of Trustees. Prior to 2012, SAWS funded all obligations arising under these plans on a pay-as-you-go basis. In March 2012, SAWS established an OPEB Trust for the exclusive purpose of providing benefits to eligible retirees and their dependents. SAWS intends to make annual contributions to the OPEB Trust in accordance with a plan that results in fully funding the actuarially determined annual required contributions for these benefits over a period of time. For the year-ended December 31, 2015, plan members receiving benefits contributed $672. In addition to the $7,500 contributed to the OPEB Trust in 2015, SAWS contributed the remainder of the pay-as-you-go cost of $6,261 for a total OPEB contribution of $14,433.
Notes to Financial Statements
Year-Ended September 30, 2016 - 159 - Amounts are expressed in thousands
Note 9 Post-employment Retirement Benefits (Continued)
San Antonio Water System (SAWS) (Continued)
Annual OPEB Cost and Net OPEB Obligation – For the year ended December 31, 2015, SAWS’ annual OPEB cost is calculated based on the ARC. Actuarial Methods and Assumptions – Actuarial valuations of an ongoing plan involve estimates of the value of reported amounts and assumptions about the probability of occurrence of events far into the future. SAWS does not issue a separate financial report for its OPEB plan. In the January 1, 2014 actuarial valuation, the projected unit credit funding method was used. The investment return assumption used in the calculation of the Actuarial Accrued Liability (AAL) was 4.75%, which is a blended rate of the estimated long-term investment return on the investments that are expected to be used to finance the payment of benefits. The investment return assumes SAWS will phase-in fully funding the Annual Required Contribution (ARC) over the years. There is not an inflation rate projected for this actuarial valuation. As of December 31, 2015, the Unfunded Actuarial Accrued Liability (UAAL) is being amortized as a level dollar amount over a 20 year closed period. Health care cost trend rates are used to anticipate increases in medical benefit costs expected to be experienced by the retiree health plan in each future year. The trend rates used are as follows:
Annual Rate of IncreaseYear Beginning Medical
January 1 Trend2014 7.50%2015 7.25%2016 7.00%2017 6.75%2018 6.50%2019 6.25%2020 6.17%2025 5.84%2030 5.97%2035 5.86%2040 5.33%2050 5.03%2060 4.87%2070 4.75%
Ultimate - 2084 4.24%
Notes to Financial Statements
Year-Ended September 30, 2016 - 160 - Amounts are expressed in thousands
Note 9 Post-employment Retirement Benefits (Continued)
Funded Status and Funding Progress
Three-Year Trend Information
The City’s, CPS Energy’s and SAWS’s annual OPEB cost, employer contributions, percentage cost contributed to the plan, and net OPEB obligation for the three most recent fiscal years were as follows:
Annual Net OPEB Net OPEB PercentageRequired Interest on Adjustment Annual Contributions Increase Obligation (Asset) Obligation (Asset) of
Fiscal Contribution Net OPEB To OPEB In Relation to (Decrease) at Beginning at End OPEB CostYear (ARC) Obligation ARC Cost ARC in Net OPEB of Year of Year Contributed
City of San Antonio 2014 34,217$ 4,634$ (7,880)$ 30,971$ (5,797)$ 25,174$ 154,455$ 179,629$ 18.72%2015 36,215 5,389 (9,165) 32,439 (7,190) 25,249 179,629 204,878 22.16%2016 29,400 6,146 (10,148) 25,398 (6,355) 19,043 204,878 223,921 25.02%
Fire and Police Retiree 2014 31,325$ 3,723$ (2,543)$ 32,505$ (26,343)$ 6,162$ 46,538$ 52,700$ 81.04%
Health Care Fund2, 3 2015 34,024 3,953 (2,886) 35,091 (26,183) 8,908 52,700 61,608 74.61%2016 36,867 4,621 (3,374) 38,114 (25,918) 12,196 61,608 73,804 68.00%
CPS - Health Plan1 2014 6,382$ (1,233)$ 1,476$ 6,625$ (1,106)$ 5,519$ (15,906)$ (10,387)$ 16.69%2015 8,216 (805) 963 8,374 (3,200) 5,174 (10,387) (5,213) 38.21%2016 12,816 (391) 476 12,901 (27,800) (14,899) (5,213) (20,112) 215.49%
-CPS - Life Plan1 2014 99$ (70)$ 86$ 115$ (99)$ 16$ (927)$ (911)$ 86.09%
2015 227 (71) 85 241 - 241 (911) (670) 0.00%2016 561 (50) 61 572 - 572 (670) (98) 0.00%
CPS - Disability Plan1 2014 205$ (79)$ 95$ 221$ (257)$ (36)$ (1,026)$ (1,062)$ 116.29%2015 176 (82) 99 193 (175) 18 (1,062) (1,044) 90.67%2016 164 (78) 96 182 (175) 7 (1,044) (1,037) 96.15%
SAWS - OPEB2 2013 21,869$ 3,776$ (5,025)$ 20,620$ (12,465)$ 8,155 79,493$ 87,648$ 60.45%2014 12,978 4,163 (6,885) 10,256 (14,170) (3,914) 87,648 83,734 138.16%2015 12,978 3,977 (6,578) 10,377 (13,761) (3,384) 83,734 80,350 132.61%
1 Fiscal year-ended January 31, 20162 Fiscal year-ended December 31, 20153 Actuarial reports have not been completed by City's release date of the audit. The balance of the net OPEB from fiscal year 2015 and 2016 is based on the 2015 actuarial report.
Three-Year Trend Information
OPEB Plan
The City’s Health Fund, SAWS’ and CPS Energy’s funded status for the most recent year are as follows:
Fire and PoliceCity of Health Care CPS Energy CPS Energy CPS Energy
San Antonio Fund SAWS Health Plan Life Plan Disability Plan
Actuarial value of plan assets (a) -$ 337,191$ 19,259$ 242,994$ 45,928$ 4,516$ Actuarial accrued liability (b) 270,465 799,275 139,574 280,655 43,544 4,960 Unfunded actuarial accrued liability
(funding excess) (b) - (a) 270,465$ 462,084$ 120,315$ 37,661$ (2,384)$ 444$ Funded ratio (a) / (b) 0.00% 42.19% 13.80% 86.58% 105.47% 91.15%Covered payroll (c) 334,689$ 285,773$ 88,895$ 242,652$ 218,939$ 218,939$ Unfunded actuarial accrued liability
(funding excess) as a percentageof covered payroll ([(b) - (a)] / (c)) 80.81% 161.70% 135.35% 15.52% (1.09%) 0.20%
Funded Status and Funding Progress
OPEB Plan
Notes to Financial Statements
Year-Ended September 30, 2016 - 161 - Amounts are expressed in thousands
Note 10 CPS Energy South Texas Project (STP)
Joint Operations
Units 1 and 2 – CPS Energy is one of three participants in STP, currently a two-unit nuclear power plant with each unit having a nominal output of approximately 1,350 MW. The other participants in STP Units 1 and 2 are NRG South Texas LLP, a wholly owned subsidiary of NRG Energy, Inc. (NRG) and the City of Austin. The units, along with their support facilities and administrative offices, are located on a 12,220-acre site in Matagorda County, Texas. In-service dates for STP were August 1988 for Unit 1 and June 1989 for Unit 2. CPS Energy’s 40.0% ownership in STP Units 1 and 2 represents approximately 1,080 MW of total plant capacity. Effective November 17, 1997, the Participation Agreement among the owners of STP was amended and restated. At that time, the South Texas Project Nuclear Operating Company (STPNOC), a Texas nonprofit, nonmember corporation created by the participants, assumed responsibility as the licensed operator of STP. The participants share costs in proportion to ownership interests, including all liabilities and expenses of STPNOC. STPNOC is financed and controlled by the owners pursuant to an operating agreement among the owners and STPNOC. Currently, a four-member board of directors governs STPNOC, with each owner appointing one member to serve with STPNOC’s chief executive officer. On October 28, 2010, STP submitted license renewal applications to the NRC to extend the operating licenses of STP Units 1 and 2 to 2047 and 2048, respectively. The NRC issued a revision to STPNOC’s license renewal application schedule due to a scheduling request from the Advisory Committee on Reactor Safeguards and due to continued work on one of the open items. This schedule change lists milestones associated with issuance of the Safety Evaluation Report as “to be determined.” In a separate action, on June 8, 2012, the U.S. Court of Appeals for the District of Columbia Circuit (Court) found that some aspects of the Waste Confidence Decision and Rule did not satisfy the NRC’s National Environmental Protection Act obligations and vacated the Decision and Rule. The Waste Confidence Decision and Rule represent the determination by the NRC that spent nuclear fuel can be stored safely and without significant environmental impact for a period of time after the end of the licensed life of a nuclear power plant. In response to the Court’s decision, in August 2012 the NRC suspended all licensing activities that rely on the Waste Confidence Decision and Rule and created a Waste Confidence Directorate within the Office of Nuclear Material Safety and Safeguards to oversee the drafting of a new Waste Confidence Rule and a supporting Generic Environmental Impact Statement (GEIS) within 24 months. On August 26, 2014, the NRC approved the GEIS and final rule (renamed the Continued Storage rule). In a separate order, the NRC approved lifting the licensing suspension once the Continued Storage rule became effective, which was effective on October 20, 2014. On September 29, 2014, interveners filed a petition to suspend the new rule with the Atomic Safety and Licensing Board (ASLB) and a proposed contention opposing the NRC's action. This petition, proposed contention, and motion to reopen were rejected by the NRC on February 26, 2015. The interveners subsequently submitted two more petitions concerning environmental issues and the Continued Storage Rule. In April 2015 and May 2015, respectively, the NRC denied and deemed inadmissible the petitions filed by the interveners. In late October 2014, the states of New York, Vermont and Connecticut filed a timely petition for review of the Continued Storage rule by the U.S. Court of Appeals for the District of Columbia Circuit. These petitions were subsequently consolidated into a single proceeding for the court to consider. The NRC issued further guidance in February 2015 determining the Atomic Energy Act does not require a waste confidence safety filing and declined to suspend final licensing decisions. Barring further action by the Court, CPS Energy expects that STPNOC's license renewal applications for STP Units 1 and 2 will be approved in the latter part of 2016 or early 2017. Upon approval of these applications, it is expected that STP Units 1 and 2 will each be licensed for a total of 60 years of operation.
Notes to Financial Statements
Year-Ended September 30, 2016 - 162 - Amounts are expressed in thousands
Note 10 CPS Energy South Texas Project (STP) (Continued)
Joint Operations (Continued)
Under the Nuclear Waste Policy Act (NWPA), the DOE (Department of Energy) has an obligation to provide for the permanent disposal of high-level radioactive waste, which includes used nuclear fuel at U.S. commercial nuclear power plants such as STP. To fund that obligation, all owners or operators of commercial nuclear power plants entered into a standard contract under which the owners paid a fee to the DOE based on the amount of electricity generated and sold from the power plant, along with additional assessments. In exchange for collecting this fee and the assessments, the DOE undertook the obligation to develop a high-level waste repository for safe, long-term storage of the fuel and, no later than January 31, 1998, to transport and dispose of the used fuel. To date, no high-level waste repository has been licensed to accept used fuel. NARUC challenged further collection of this fee; and on November 19, 2013, the Court ruled in favor of NARUC and ordered the DOE to submit to the U.S. Congress a proposal to reduce the fee to zero until certain conditions are met. While the reporting to the DOE of used nuclear fuel volumes will continue, effective May 16, 2014, the rate was reduced to zero. Multiple cases have been filed in the U.S. Court of Federal Claims by the existing owners or operators of nuclear facilities against the DOE related to its failure to meet its obligations under the NWPA. The owners/operators were seeking damages related to ongoing used nuclear fuel storage costs incurred because the DOE did not meet its obligation. On August 31, 2000, in Maine Yankee Atomic Power Company, et. al. v. United States, the United States Court of Appeals for the Federal Circuit affirmed that the DOE had breached its obligations to commercial nuclear power plant owners for failing to live up to its obligations to dispose of used nuclear fuel. Subsequent to that decision, the DOE has settled with certain commercial nuclear power plant owners and agreed to provide funds to pay for storage costs while the DOE continues to develop a permanent high-level waste repository. In early February 2013, STPNOC, on behalf of the owners of STP, entered into a similar settlement with the DOE. Under the terms of the settlement, the DOE will reimburse STP for certain costs that will be incurred in continuing onsite storage of all of its used nuclear fuel. As with similar settlements throughout the nuclear industry, the terms of the agreement called for the DOE to reimburse for certain costs incurred through December 2013. In November 2013, STPNOC and its outside counsel received notice from the Department of Justice that the DOE was offering to extend the terms of the settlement through December 2016. The settlement extension was executed on January 24, 2014, and extends the term of the Spent Fuel Settlement Agreement with the DOE through December 31, 2016. Until the DOE is able to fulfill its responsibilities under the NWPA, the NWPA has provisions directing the NRC to create procedures to provide for interim storage of used nuclear fuel at the site of a commercial nuclear reactor. Pursuant to STPNOC’s analysis of NRC guidance, STPNOC has started the process of planning, licensing, and building an on-site independent spent fuel storage installation ("ISFSI"; also known as "Dry Cask Storage") with an expectation that the ISFSI will be operational in 2017. Ongoing costs for the spent fuel management project are being funded by the STP owners as expenditures are incurred. CPS Energy requests reimbursement periodically from its Decommissioning Trusts for CPS Energy’s portion of allowable costs. Annually, STPNOC submits claims to the DOE for the reimbursement of allowable costs for spent fuel management. Allowable costs are returned by STP to the owners upon receipt of funds from the DOE. Upon receipt, CPS Energy reimburses the Trusts for the settlement amount received from the DOE. Qualifying spent fuel management costs not reimbursable by the DOE are funded by the Trusts. Any costs not reimbursable by the DOE or the Trusts are recorded as an STP O&M expense or capital costs.
Notes to Financial Statements
Year-Ended September 30, 2016 - 163 - Amounts are expressed in thousands
Note 10 CPS Energy South Texas Project (STP) (Continued)
Joint Operations (Continued)
Beginning in January 2014, the electric output of STP Units 1 and 2 has been reduced by 22 MW and 18 MW, respectively, from their nominal output of 1,350 MW for each unit. STPNOC has identified an issue with the ultrasonic feed water flow (“UTF”) as the reason for the reduction. This issue does not represent a safety or other long-term operational concern for STP. During the spring 2015 Unit 2 refueling and maintenance outage, a new feedwater flow measurement system and venturi system were installed. Following the outage, Unit 2’s electrical generation remained at a reduced level. STPNOC worked with an independent consultant and the vendor to analyze the generation issue in Unit 2. The UTF system and venturi flow system were replaced in Unit 1 as part of the fall 2015 refueling and maintenance outage. Like Unit 2, the electric output in Unit 1 remained at a reduced level following the outage. While STP continues to make minor adjustments, these changes have not completely restored the reduced generation. Unit 1 Project – On November 18, 2015, STP Unit 1 Shutdown Bank Control Rod D6 was determined to be inoperable following a scheduled refueling and maintenance outage. Following extensive analyses to ensure safe operation of the unit, on December 3, 2015, STPNOC submitted an Emergency License Amendment Request to the NRC seeking authorization to operate STP Unit 1 during the next 18-month operating cycle with 56 full-length control rods instead of 57. The NRC approved the license amendment on December 11, 2015. The approved license amendment supports the safe operation of STP Unit 1 with Control Rod D6 and the associated control rod drive shaft removed. On April 7, 2016, STPNOC submitted to the NRC a license amendment request to allow for the continued operation of STP Unit 1 in this configuration. Units 3 and 4 Project – In September 2007, NRG and CPS Energy signed the South Texas Project Supplemental Agreement (“Supplemental Agreement”) under which CPS Energy elected to participate in the development of two new nuclear units at the STP site, STP Units 3 and 4, pursuant to the terms of the participation agreement among the STP owners and agreed to potentially own up to 50.0% of STP Units 3 and 4. Also in September 2007, STPNOC, on behalf of CPS Energy and NRG, filed with the NRC a combined construction and operating license application (“COLA”) to build and operate STP Units 3 and 4. This COLA was the first complete application for new commercial nuclear units to be filed with the NRC in nearly 30 years. On November 29, 2007, the NRC announced it had accepted the COLA for review. On March 26, 2008, NRG announced the formation of NINA. Upon the formation of NINA, NRG had an 88.0% ownership interest in NINA, while Toshiba America Nuclear Energy Corporation (“TANE”) owned the remaining 12.0%. NRG contributed its 50.0% ownership of, and its development rights to, STP Units 3 and 4 to NINA. As a result, NINA became CPS Energy’s partner for the co-development of STP Units 3 and 4. On September 24, 2008, STPNOC, on behalf of CPS Energy and NINA, filed with the NRC an updated COLA naming TANE as the provider of STP Units 3 and 4. Receipt of the NRC-approved combined operating license is a condition precedent to starting significant project construction. On December 6, 2009, CPS Energy filed a petition in Bexar County district court to clarify the roles and obligations of CPS Energy and NINA and to define the rights of both parties should either decide to withdraw from the project. NRG escalated the litigation when it sued CPS Energy and claimed CPS Energy should forfeit all investment to date and lose all value in the project’s land and water rights. CPS Energy amended its petition on December 23, 2009, and raised significant issues concerning misconduct by NRG and NINA. CPS Energy specified actual and exemplary damages of $32,000,000.
Notes to Financial Statements
Year-Ended September 30, 2016 - 164 - Amounts are expressed in thousands
Note 10 CPS Energy South Texas Project (STP) (Continued)
Joint Operations (Continued)
On February 17, 2010, CPS Energy and NINA announced that a proposed settlement had been reached that ended the parties’ legal disagreement and allowed the proposed expansion of STP Units 3 and 4 to proceed. As a result of the settlement, CPS Energy’s ownership stake in STP Units 3 and 4 was reduced from 50.0% to 7.6%, while NINA retained 92.4% ownership. CPS Energy is not liable for any project development costs incurred after January 31, 2010. However, once the new units reach commercial operation, CPS Energy will be responsible for its 7.6% share of ongoing costs to operate and maintain the units. Also as a result of the settlement, NINA agreed to pay CPS Energy $80,000, in two $40,000 payments, upon DOE issuance of a conditional loan guarantee. NINA also agreed to make a contribution of $10,000 over a four-year period to the Residential Energy Assistance Partnership (“REAP”), which provides emergency bill payment assistance to low-income customers in San Antonio and Bexar County. The settlement agreement was finalized on March 1, 2010. CPS Energy has received the entire $10,000 from NINA for REAP. On March 21, 2011, NINA announced that it was reducing the scope of development in STP Units 3 and 4 to allow time for the NRC to assess the lessons learned from the Fukushima Daiichi nuclear units damaged in the March 11, 2011 earthquake and resulting tsunami. They further stated that current ongoing work would be limited to activities associated with NRC licensing and with securing a DOE loan guarantee. On April 19, 2011, NRG announced that it would continue to support its current partners but that it would not invest additional capital in the STP Units 3 and 4 development effort. NRG wrote off the entire value of its investment in the project while continuing to own a legal interest. Since then, TANE has funded ongoing costs to move the application process forward for the combined operating and construction license. On June 6, 2013, the NRC issued a letter to NINA providing an updated review schedule for the STP Units 3 and 4 COLA. Citing budget constraints, the NRC informed NINA that the review schedule for the STP Units 3 and 4 COLA would be delayed by five months, resulting in a revised target date of September 30, 2015, for the release of the final Safety Evaluation Report. In May 2014, Toshiba Corporation (Toshiba) announced that it had taken a partial write down of the value of its ownership in NINA of about $300,000 for its fiscal year ended March 31, 2014. TANE continued to provide funding to NINA for licensing efforts for STP Units 3 and 4. On September 29, 2015, the NRC issued its Final Safety Evaluation Report for the Combined Licenses for the proposed STP Units 3 and 4. The report concludes there are no safety aspects that would preclude issuing licenses for construction and operation of the proposed reactors at the site. The Mandatory Hearings took place on November 19, 2015, when the NRC staff provided the Final Safety Evaluation Report and Final Environmental Impact Statement on the application to the Commission. On February 9, 2016, the NRC commissioners authorized issuance of the combined licenses (COL) for STP Units 3 and 4.
(The remainder of this page left blank intentionally)
Notes to Financial Statements
Year-Ended September 30, 2016 - 165 - Amounts are expressed in thousands
Note 10 CPS Energy South Texas Project (STP) (Continued)
Joint Operations (Continued)
Annually, CPS Energy performs a thorough re-evaluation of its investment in the STP Units 3 and 4 project to reassess the ongoing viability of the project and the appropriateness of continuing to report the cost of the project on its Statements of Net Position. Despite the project having secured the NRC’s authorization for the issuance of the COL, in January 2016 CPS Energy reached the conclusion that as a result of sustained changes in a number of environmental and economic factors directly affecting the projected economic feasibility of completing construction of STP Units 3 and 4, the project had experienced a permanent impairment. CPS Energy determined it was appropriate to write off the entire $391,417 investment in STP Units 3 and 4. The impairment loss was recorded as an extraordinary item on CPS Energy’s Statements of Revenues, Expenses, and Changes in Net Position for the period ended January 31, 2016. This noncash transaction did not impact CPS Energy’s debt service coverage ratio; however, there was a resulting increase from 61.1% to 63.7% in the debt to debt and net position ratio at January 31, 2016. Going forward, CPS Energy continues to retain a legal interest in the project. See Note 4 – Capital Assets for more information about CPS Energy’s capital investment in STP.
Nuclear Insurance
The Price-Anderson Act is a comprehensive statutory arrangement for providing limitations on liability and governmental indemnities with respect to nuclear accidents or events. The maximum amount that each licensee may be assessed following a nuclear incident at any insured facility is $121,255, subject to adjustment for inflation, for the number of operating nuclear units and for each licensed reactor, payable at $18,963 per year per reactor for each nuclear incident. CPS Energy and each of the other participants of STP are subject to such assessments, which will be borne on the basis of their respective ownership interests. For purposes of these assessments, STP has two licensed reactors. The participants have purchased the maximum limits of nuclear liability insurance, as required by law, and have executed indemnification agreements with the NRC in accordance with the financial protection requirements of the Price-Anderson Act. A nuclear liability policy, with a maximum limit of $375,000 for the nuclear industry as a whole, provides protection from nuclear-related claims. A Master Worker Nuclear Liability policy, also with a maximum limit of $375,000 for the nuclear industry as a whole, provides protection from radiation tort claims of workers at nuclear facilities. NRC regulations require licensees of nuclear power plants to obtain on-site property damage insurance in a minimum amount of approximately $1,100,000. NRC regulations also require that the proceeds from this insurance be used first to ensure that the licensed reactor is in a safe and stable condition so as to prevent any significant risk to the public health or safety, and then to complete any decontamination operations that may be ordered by the NRC. Any funds remaining would then be available for covering direct losses to property. The owners of STP Units 1 and 2 currently maintain approximately $2,800,000 of nuclear property insurance, which is above the legally required amount of $1,100,000. The $2,800,000 of nuclear property insurance consists of $500,000 in primary property damage insurance and $2,300,000 of excess property damage insurance, both subject to a retrospective assessment being paid by all members of Nuclear Electric Insurance Limited (NEIL). A retrospective assessment could occur if property losses, as a result of an accident at any nuclear plant insured by NEIL, exceed the accumulated funds available to NEIL. CPS Energy also maintains accidental outage insurance through STP’s NEIL membership, with a policy structure consisting of an eight-week deductible period, with a $4,500 weekly indemnity option and $490,000 policy limit.
Notes to Financial Statements
Year-Ended September 30, 2016 - 166 - Amounts are expressed in thousands
Note 10 CPS Energy South Texas Project (STP) (Continued)
Nuclear Decommissioning
In 1991, CPS Energy started accumulating funds for the decommissioning of its 28% ownership in STP Units 1 and 2 in an external trust in accordance with the NRC regulations. The 28% Decommissioning Trust’s assets and related liabilities are included in CPS Energy’s financial statements as a component unit. Excess or deficient funds related to the 28% Trust will be distributed to or received from CPS Energy’s ratepayers after decommissioning is complete. In conjunction with the acquisition of the additional 12% interest in STP Units 1 and 2 in May 2005, CPS Energy also assumed control of a relative portion of the Decommissioning Trust previously established by the prior owner, American Electric Power (AEP). The 12% Decommissioning Trust’s assets and related liabilities are also included in CPS Energy’s financial statements as a component unit. Subject to PUCT approval as requested in the future, excess or deficient funds related to the 12% Trust will be distributed to or received from AEP customers after decommissioning is complete. CPS Energy, together with the other owners of STP Units 1 and 2, files a certificate of financial assurance with the NRC for the decommissioning of the nuclear power plant every two years or upon transfer of ownership. The certificate assures that CPS Energy and the other owners meet the minimum decommissioning funding requirements mandated by the NRC. The owners agreed in the financial assurance plan that their estimate of decommissioning costs would be reviewed and updated periodically. The most recent cost study, which was finalized in May 2013, estimated decommissioning costs for the 28% ownership in STP Units 1 and 2 at $627,495 in 2012 dollars. Included in the cost study was a 10.0% contingency component as required to comply with the PUCT. Based on the level of funds accumulated in the 28% Trust and an analysis of this cost study, CPS Energy determined that no further decommissioning contributions will be required to be deposited into the Trust. In fiscal year 2009, CPS Energy determined that some preshutdown decommissioning and spent fuel management activities would be required prior to shutdown of STP Units 1 and 2. As a result, separate trust accounts were created to pay for preshutdown decommissioning activities. Additionally, funds in the Trusts applicable to spent fuel management were transferred to separate spent fuel management accounts so that they were not commingled with funds allocable to preshutdown or postshutdown decommissioning costs. Based on projected costs, the spent fuel management accounts are currently fully funded; therefore, no contributions were made to these accounts in fiscal year 2016. CPS Energy made contributions of $1,800 in fiscal year 2016 to fund preshutdown decommissioning costs for its 28% ownership in STP. For the 12% Trust, preshutdown costs were funded by AEP’s ratepayers. The 12% Trust incurred no preshutdown decommissioning expenses in the twelve months ended December 31, 2015. As of December 31, 2015, CPS Energy had accumulated approximately $389,414 in the 28% Trust. Total funds are allocated to decommissioning costs, preshutdown decommissioning costs, spent fuel management and site restoration. Based on the most recent annual calculation of financial assurance required by the NRC as of December 31, 2014, the 28% Trust funds allocated to decommissioning costs totaled $241,640, which exceeded the calculated financial assurance amount of $185,288.
Notes to Financial Statements
Year-Ended September 30, 2016 - 167 - Amounts are expressed in thousands
Note 10 CPS Energy South Texas Project (STP) (Continued)
Nuclear Decommissioning (Continued)
The May 2013 cost study estimated decommissioning costs for the 12% ownership in STP Units 1 and 2 at $268,927 in 2012 dollars. As of December 31, 2015, approximately $142,056 had been accumulated in the 12% Trust. Total funds are allocated to decommissioning costs, spent fuel management and site restoration. Based on the most recent annual calculation of financial assurance required by the NRC as of December 31, 2014, the 12% Trust funds allocated to decommissioning costs totaled $93,335, which exceeded the calculated financial assurance amount of $79,409. CPS Energy accounts for decommissioning by recognizing a liability and expense for a pro rata share of projected decommissioning costs as determined by the most recent cost study. A new cost study is performed every five years, and in years subsequent to the latest study, estimated annual decommissioning expense and an increase in the liability is calculated by applying the effects of inflation and the ratio of years of plant usage to total plant life. Additionally, a zero net position approach is applied for the Decommissioning Trusts. Both Decommissioning Trusts also have separate calendar-year financial statements, which are separately audited and can be obtained by contacting the Controller at CPS Energy. STP Pension Plan and Other Postretirement Benefits
STPNOC maintains several pension and other postretirement benefit plans covering most employees, including a noncontributory defined-benefit pension plan, defined-benefit postretirement plan, supplementary nonqualified unfunded pension plan, supplemental retirement plan, deferred compensation program, and a contributory savings plan. The owners of STPNOC, including CPS Energy, share in all plan costs in the same proportion as their respective ownership percentages. The noncontributory defined-benefit pension plan covers certain employees. Retirement benefits are based on length of service and compensation. Plan assets are invested in various equity and fixed-income securities. Pension contributions totaling $19,800 were made in STP’s fiscal year 2015 of which $4,700 related to the 2015 plan year, while $15,100 related to the 2014 plan year. No other contributions are required for plan years 2014 and 2015. STPNOC also maintains a defined-benefit postretirement plan that provides medical, dental and life insurance benefits for substantially all non-bargaining retirees and eligible dependents. The cost of these benefits is recognized in the project statements during an employee’s active working career. STPNOC has a trust to partially meet the obligations of the plan. As of May 1, 2014, STPNOC members of the International Brotherhood of Electrical Workers (“IBEW”) Local 66 voted to transition from STPNOC’s medical plan to the National Electrical Contractors Association (“NECA”) Family Medical Care Plan, a Taft-Hartley multi-employer health and welfare plan. STPNOC pays monthly premiums for the benefits, to be partially funded by IBEW employees.
Notes to Financial Statements
Year-Ended September 30, 2016 - 168 - Amounts are expressed in thousands
Note 10 CPS Energy South Texas Project (STP) (Continued)
STP Pension Plan and Other Postretirement Benefits (Continued)
Employees whose eligible compensation exceeds the limitations established under the 1974 Employee Retirement Income Security Act, $265 for 2015, are covered by a supplementary nonqualified, unfunded pension plan, which is provided for by charges to operations sufficient to meet the projected benefit obligation. The accruals for the cost of that plan are based on substantially the same actuarial methods and economics as the noncontributory defined-benefit pension plan. An unfunded supplemental retirement plan and other unfunded deferred compensation programs are maintained by STPNOC for certain key individuals. STPNOC approved a change to the pension plan, effective January 1, 2007, to preclude the eligibility of employees hired after December 31, 2006, in the plan. Employees hired after this date receive enhanced matching contributions under the STP Nuclear Operating Company Savings Plan. Pursuant to Subtopic 958-715 of the FASB Accounting Standards Codification, the Compensation – Retirement Benefits Subtopic of the Not-for-Profit Entities Topic, STP is required to recognize additional liabilities and eliminate the intangible asset related to certain of its qualified and nonqualified plans. The effect to CPS Energy of funding obligations related to the defined-benefit plans sponsored by STPNOC was $2,267 for CPS Energy’s fiscal year 2016 and is reflected as an increase on the Statement of Activities.
(The remainder of this page left blank intentionally)
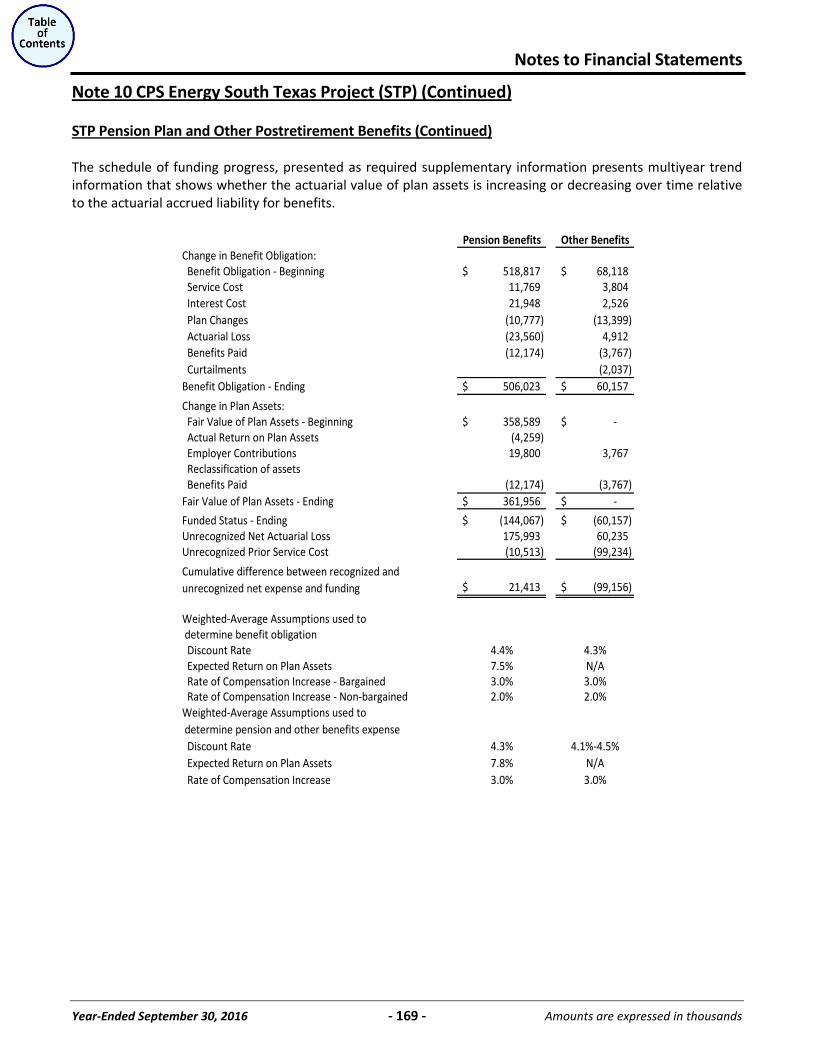
Notes to Financial Statements
Year-Ended September 30, 2016 - 169 - Amounts are expressed in thousands
Note 10 CPS Energy South Texas Project (STP) (Continued)
STP Pension Plan and Other Postretirement Benefits (Continued)
The schedule of funding progress, presented as required supplementary information presents multiyear trend information that shows whether the actuarial value of plan assets is increasing or decreasing over time relative to the actuarial accrued liability for benefits.
Pension Benefits Other BenefitsChange in Benefit Obligation: Benefit Obligation - Beginning 518,817$ 68,118$ Service Cost 11,769 3,804 Interest Cost 21,948 2,526 Plan Changes (10,777) (13,399) Actuarial Loss (23,560) 4,912 Benefits Paid (12,174) (3,767) Curtailments (2,037) Benefit Obligation - Ending 506,023$ 60,157$
Change in Plan Assets: Fair Value of Plan Assets - Beginning 358,589$ -$ Actual Return on Plan Assets (4,259) Employer Contributions 19,800 3,767 Reclassification of assets Benefits Paid (12,174) (3,767) Fair Value of Plan Assets - Ending 361,956$ -$
Funded Status - Ending (144,067)$ (60,157)$ Unrecognized Net Actuarial Loss 175,993 60,235 Unrecognized Prior Service Cost (10,513) (99,234)
Cumulative difference between recognized and unrecognized net expense and funding 21,413$ (99,156)$
Weighted-Average Assumptions used to determine benefit obligation Discount Rate 4.4% 4.3% Expected Return on Plan Assets 7.5% N/A Rate of Compensation Increase - Bargained 3.0% 3.0% Rate of Compensation Increase - Non-bargained 2.0% 2.0%Weighted-Average Assumptions used to determine pension and other benefits expense Discount Rate 4.3% 4.1%-4.5% Expected Return on Plan Assets 7.8% N/A Rate of Compensation Increase 3.0% 3.0%
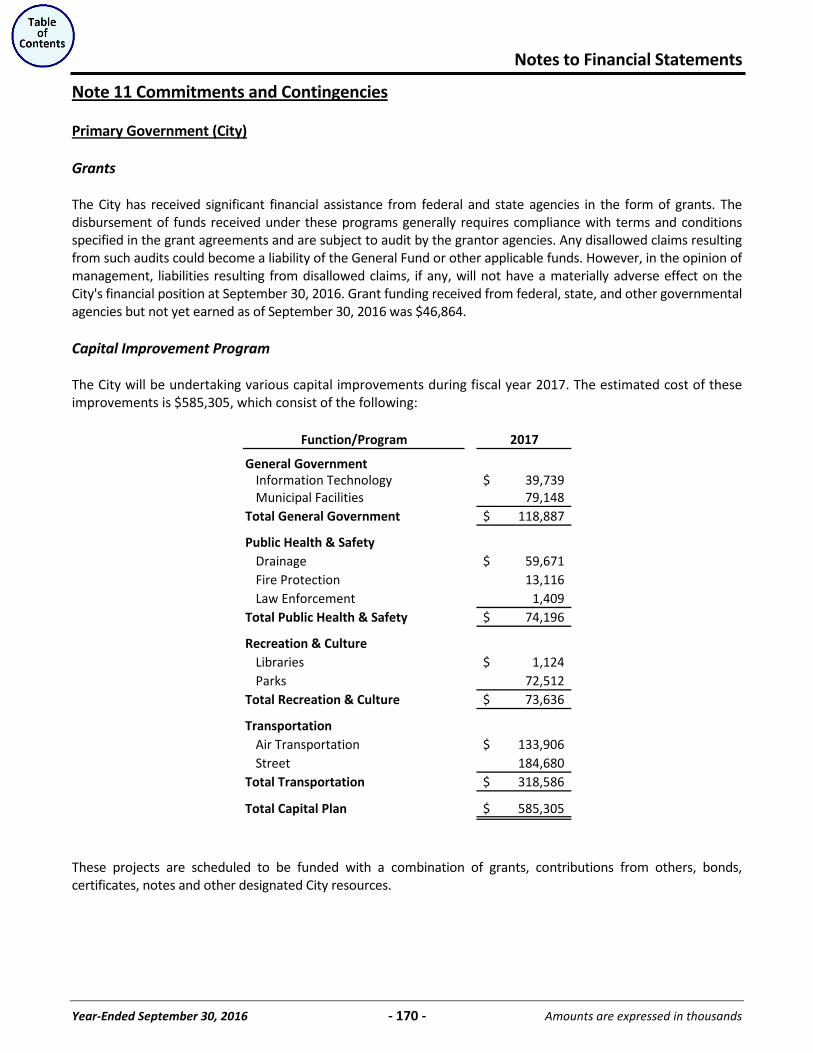
Notes to Financial Statements
Year-Ended September 30, 2016 - 170 - Amounts are expressed in thousands
Note 11 Commitments and Contingencies
Primary Government (City)
Grants The City has received significant financial assistance from federal and state agencies in the form of grants. The disbursement of funds received under these programs generally requires compliance with terms and conditions specified in the grant agreements and are subject to audit by the grantor agencies. Any disallowed claims resulting from such audits could become a liability of the General Fund or other applicable funds. However, in the opinion of management, liabilities resulting from disallowed claims, if any, will not have a materially adverse effect on the City's financial position at September 30, 2016. Grant funding received from federal, state, and other governmental agencies but not yet earned as of September 30, 2016 was $46,864. Capital Improvement Program The City will be undertaking various capital improvements during fiscal year 2017. The estimated cost of these improvements is $585,305, which consist of the following:
Function/Program 2017
General GovernmentInformation Technology 39,739$ Municipal Facilities 79,148
Total General Government 118,887$
Public Health & SafetyDrainage 59,671$ Fire Protection 13,116 Law Enforcement 1,409
Total Public Health & Safety 74,196$
Recreation & CultureLibraries 1,124$ Parks 72,512
Total Recreation & Culture 73,636$
TransportationAir Transportation 133,906$ Street 184,680
Total Transportation 318,586$
Total Capital Plan 585,305$
These projects are scheduled to be funded with a combination of grants, contributions from others, bonds, certificates, notes and other designated City resources.
Notes to Financial Statements
Year-Ended September 30, 2016 - 171 - Amounts are expressed in thousands
Note 11 Commitments and Contingencies (Continued)
Primary Government (City) (Continued)
Litigation The City is a party to various claims and lawsuits alleging personal and property damages, wrongful death, breach of contract, environmental matters, civil rights violations, and employment matters. The estimated liability, including an estimate of incurred but not reported claims, is recorded in the Insurance Reserve Fund in the amount $18,556. The City estimates the amounts of unsettled claims under its self-insurance program and believes that the self-insurance reserves recorded as appropriations in the Insurance Reserve Fund are adequate to cover losses for which the City may be liable. Whether additional claims or revisions to estimates required for settlement on existing claims could have a material effect on the basic financial statements cannot be determined. Shavonda Bailey, et al v. City of San Antonio, et al
Plaintiffs allege that San Antonio Police Department (SAPD) officers used excessive force when they arrested Pierre Abernathy after a low speed vehicle pursuit. Plaintiffs sued the City and seven police officers under 42 USC §1983, alleging excessive use of force. They seek damages for Mr. Abernathy’s pain and suffering as well as damages for his death. Plaintiffs seek damages of at least $1,000. The City was dismissed from this case on May 5, 2015; the case is proceeding with respect to Defendant Officers.
Cheryl Jones, et al v. City of San Antonio, et al
On February 28, 2014 Marquise Jones was shot by a SAPD police officer at Chacho’s Restaurant. Plaintiffs are asserting claims under 42 USC §1983 against the City and the officer for excessive force, racial profiling, and failure to train under the Texas Survivor Statute and Texas Wrongful Death Statute. Plaintiffs seek damages of at least $5,000 for loss of affection, consortium, financial assistance, pain and suffering of decedent prior to death, mental anguish, emotional distress, quality of life, exemplary and punitive damages, attorney fees, and costs of court. This case has not been set for trial.
Jimmy Maspero and Regina Maspero, et al v. City of San Antonio, et al
Plaintiffs allege that on September 19, 2012 Plaintiffs’ vehicle was involved in a collision with a vehicle being pursued by a SAPD patrol car causing the death of two of Plaintiffs’ children and severe permanent injuries to the remaining Plaintiffs (two children, two adults). The Plaintiffs have asserted a “state-created danger” theory under 42 USC §1983 alleging a violation of Plaintiffs’ 14th Amendment substantive due process. Plaintiffs are also asserting state law theories of negligence. Plaintiffs seek to recover damages for mental anguish, physical pain, impairment, medical expenses, and the wrongful death of two of their children. Plaintiffs are seeking monetary damages of at least $3,000. This case has not been set for trial.
Scott Mathews v. City of San Antonio, et al
Plaintiff claims that on April 14, 2013 SAPD police officers were called to his house as a result of a domestic dispute between him and his wife. Plaintiff filed suit under 42 USC §1983 for violation of his civil rights and excessive force and also alleges assault and battery pursuant to Texas state law. Plaintiff seeks damages for his medical expenses, disability as well as for pain and suffering, emotional and mental distress, and loss of wage earning capacity. Plaintiff is seeking damages in an amount of at least $1,000. The City has been dismissed from this lawsuit; the case is proceeding against the Defendant Officers. The case has not been set for trial.
Notes to Financial Statements
Year-Ended September 30, 2016 - 172 - Amounts are expressed in thousands
Note 11 Commitments and Contingencies (Continued)
Primary Government (City) (Continued)
Litigation (Continued) Roxana Tenorio, Individually and on behalf of Pedro Tenorio, Deceased v. Benito Garza and City of San Antonio
Plaintiff claims that a SAPD high speed pursuit of Defendant Benito Garza was the cause of a vehicle accident on September 21, 2012 in which Pedro Tenorio was killed. Plaintiff sued Benito Garza and the City under the Texas Tort Claims Act (TTCA) for Negligence. Plaintiff is seeking monetary relief in excess of $1,000 for past and future mental anguish, loss of consortium, loss of inheritance, loss of companionship and pecuniary damages under the Texas Wrongful Death Act and Texas Survival Act. The City’s Plea to Jurisdiction was denied. The City has filed an interlocutory appeal to the fourth Court of Appeals.
Estate of Jesse Aguirre, Deceased, et al v. City of San Antonio, et al
Plaintiffs filed suit alleging that after handcuffing Plaintiffs’ decedent, SAPD officers flipped him over a barricade, knocking him unconscious. Attempts to revive decedent were unsuccessful, resulting in his death while in custody. Plaintiffs filed suit alleging violations of the TTCA and 42 USC §1983. This case was recently filed and has not been set for trial. Damages could be in excess of $250.
David Brian Ricks v. City of San Antonio, et al
Plaintiff was arrested for public intoxication. He alleges that SAPD Officers used excessive force during his arrest, causing severe bodily injuries. Plaintiff sued pursuant to 42 USC §1983. This case was recently filed and discovery is ongoing. Damages could be in excess of $250.
Estate of Norman Cooper, et al v. City of San Antonio, et al
SAPD officers were called to a residence on a report of domestic violence. At the scene, decedent was tased on two separate occasions. Decedent later collapsed and died. Decedent’s estate and family members have filed suit against the City and named officers alleging use of excessive force in violation of 42 USC §1983. Plaintiffs seek damages in excess of $250. This case has recently been filed and no trial date has been set.
Estate of Hector Alfredo Aragon, et al v. City of San Antonio et al
Aragon’s ex-girlfriend requested and was driven home by an undercover police officer. On arrival, Aragon was seen waiting in the parking lot and opened fire on the police officer and his ex-girlfriend, striking her. The SAPD officer left the scene with the girlfriend, with Aragon in pursuit. The ex-girlfriend, concerned that her child with Aragon was at his house, asked the SAPD officer to continue to that location to assure the child’s safety. On arrival at his residence, Aragon moved aggressively towards the officer, who shot and killed him. Plaintiffs initially sued both the City and the SAPD officer, but only served the City. The City has been dismissed from the suit. The Plaintiffs have now obtained service on the SAPD officer. Plaintiffs seek damages in excess of $250. This case is not currently set for trial.
Diane Jackson v. City of San Antonio
Plaintiff alleges that she was rear-ended by an SAPD patrol vehicle. She claims personal injuries to her neck, mid-back and lower back, as well as property damage. While Plaintiff’s past medical expenses are low, she now claims future medical damages approaching $200. This case is set for trial April 3, 2017.
Notes to Financial Statements
Year-Ended September 30, 2016 - 173 - Amounts are expressed in thousands
Note 11 Commitments and Contingencies (Continued)
Primary Government (City) (Continued)
Litigation (Continued) Elena Scott, Individually and as Representative of the Estate of Antronie Scott v City of San Antonio, et al
An SAPD officer was attempting to execute an arrest warrant when Plaintiff's decedent exited his vehicle with an object the officer believed was a weapon. The office discharged his service weapon, fatally wounding decedent. Plaintiff has filed suit under 42 USC § 1983 alleging use of excessive force. These two matters have been consolidated. Discovery is on-going and the matter has not been set for trial.
Rogelio Carlos lll, et. al. v Carlos Chavez, et. al
SWAT officers were assisting High Intensity Drug Trafficking Area (HIDTA) in searching for a fleeing suspect. Plaintiff was misidentified by the HIDTA officer as being the suspect. HIDTA officer engaged and attempted to physically apprehend Plaintiff and was assisted by SAPD SWAT officers. Plaintiff suffered minor injuries as a result of the arrest, although he later complained of neck and shoulder/arm pain. Several months after the incident, Plaintiff underwent surgery, during which procedure, Plaintiff was paralyzed. Plaintiff has filed suit against the City and various officers under 42 USC §1983. Discovery is on-going. This case has not been set for trial.
Neka Scarborough Jenkins v. City of San Antonio.
Plaintiff's decedent was driving northbound on Blanco Road and attempted to turn left onto Lockhill Selma at a controlled traffic signal. Plaintiff contends that the traffic signal for her lane of traffic was facing the wrong direction. While making the turn, decedent was struck by an oncoming vehicle and was killed. Plaintiff claims the City of San Antonio had prior notice but failed to correct the issue within a reasonable period of time. Plaintiff also claims the investigation revealed the light was placed too low and was not at the correct height for a traffic signal. This is fairly new litigation and is brought under the Texas Tort Claims Act. Facts and damage have not been vetted through the discovery process at the time of the Audit Letter. Under Texas Tort Claims Act, damages are capped at $250.
(The remainder of this page left blank intentionally)
Notes to Financial Statements
Year-Ended September 30, 2016 - 174 - Amounts are expressed in thousands
Note 11 Commitments and Contingencies (Continued)
Primary Government (City) (Continued)
Leases The City leases City-owned property to others consisting of buildings, real property, and parking spaces. Costs of specific leased components are not readily determinable. The Airport System's revenue is net of Ground Abatement Credits and Building Improvement Credits allowed to lessees per signed contracts. Total rental revenue from operating leases received for the fiscal year-ended September 30, 2016 was $11,343 for Governmental Activities and $47,962 for Business-Type Activities, which consisted of $40,188 for the Airport System, $111 for Solid Waste Management and $7,663 for Nonmajor Enterprise. As of September 30, 2016, the leases provide for the following future minimum rentals:
Governmental Airport Solid Waste NonmajorActivities System Management Enterprise Total
2017 13,056$ 40,363$ 100$ 7,298$ 60,817$ 2018 13,556 16,060 100 3,709 33,425 2019 12,978 14,734 100 3,201 31,013 2020 11,846 12,634 100 2,913 27,493 2021 12,131 11,202 100 2,073 25,506
2022-2026 55,776 54,009 500 4,477 114,762 2027-2031 23,103 18,217 400 1,592 43,312 2032-2036 3,364 4,733 232 8,329 2037-2041 1,908 1,233 179 3,320 2042-After 22,053 117 22,170
169,771$ 173,185$ 1,400$ 25,791$ 370,147$ Future Minimum Lease Rental
Leases Revenues
Fiscal year-ending September 30
Landfill Postclosure Care Costs In October 1993, the City Council approved closure of the Nelson Gardens Landfill, which immediately stopped accepting solid waste. Subsequent to landfill closure, federal and state laws required the City to incur certain postclosure care costs over a period of 30 years. As of September 30, 1994, the City estimated these costs for postclosure of the Nelson Gardens Landfill at $3,825. The estimate was based on projected costs for installation of a leachate and groundwater collection system, installation of a methane recovery system, geotechnical and environmental engineering services, and monitoring and maintaining the facility for a 30-year period. In accordance with GASB Statement No. 18, Accounting for Municipal Solid Waste Landfill Closure and Postclosure Care Cost, the estimated postclosure cost for the Nelson Gardens Landfill is recorded as a liability and expensed in the Solid Waste Management Fund. This cost is an estimate and is subject to changes resulting from inflation/deflation, advances in technology, or changes in applicable laws or regulations. Each fiscal year, the City performs an annual re-evaluation of the postclosure care costs associated with the Nelson Gardens Landfill. The annual re-evaluation conducted for the fiscal year-ended September 30, 2016 resulted in an estimated postclosure care liability for the Nelson Gardens Landfill of $1,219. This represents an increase of $161 from the prior fiscal year as a result of the City contracting with a third party to capture and sell methane gas in exchange for a percentage of the revenue earned and postclosure maintenance costs assumed by the third party.
Notes to Financial Statements
Year-Ended September 30, 2016 - 175 - Amounts are expressed in thousands
Note 11 Commitments and Contingencies (Continued)
Primary Government (City) (Continued)
Texas Commission on Environmental Quality (TCEQ) Financial Assurance The City is required under the provision of the Texas Administrative Code to provide financial assurance to the Texas Commission on Environmental Quality (TCEQ) related to the closure of municipal solid waste operations including, but not limited to, storage, collection, handling, transportation, processing, and disposal of municipal solid waste. In relation to new and modification permits for closed landfills from TCEQ, the City has an obligation to provide financial assurance of the postclosure cost estimates for landfills. Additionally, financial assurance is required to demonstrate financial responsibility for underground storage petroleum facilities. Based on the number of underground petroleum storage tanks, the City is required to provide $1,000 of financial assurance related to the underground storage facilities. The City completes and submits its financial assurance to TCEQ annually. Arbitrage The City has issued certain tax-exempt obligations that are subject to IRS arbitrage regulations. Noncompliance with these regulations, which pertain to the utilization and investment of proceeds, can result in penalties, including the loss of the tax-exempt status of the applicable obligations retroactive to the date of original issuance. In addition, the IRS requires that interest income earned on proceeds in excess of the arbitrage rate on applicable obligations be rebated to the federal government. The City monitors its bond proceeds in relation to arbitrage regulations, and “arbitrage rebate” is estimated and recorded in the government-wide and proprietary financial statements when susceptible to accrual, and in the governmental fund type when matured. As of September 30, 2016, the City has no arbitrage liability for its governmental or proprietary funds. Collective Bargaining Agreements
On September 1, 2016 the City Council adopted a new collective bargaining agreement with the San Antonio Police Officers’ Association (SAPOA) that provided all officers pay increases while having officers contribute to the cost of providing healthcare for their families. All officers would receive a 17.0% wage increase over five years, including a 3.0% lump sum in year one, 3.0% increases in years two through four and a 5.0% increase in year five. There would be no retroactive pay for the two years officers have gone without a wage increase since the original contract term expired in 2014. Additionally the Evergreen Clause of the contract was reduced from 10 years to eight, with a condition that employee monthly contributions to healthcare premiums will continue to increase 10.0% over the prior year’s contribution for every year during the life of the agreement, including during the evergreen period. The parties also have agreed to eliminate the City’s $1,500 annual contribution to a legal fund, but only if a similar agreement is reached between the City and the Fire Local 624 (IAFF).
CPS Energy
Litigation In the normal course of business, CPS Energy is involved in legal proceedings related to alleged personal and property damages, breach of contract, condemnation appeals, and discrimination cases. In addition, CPS Energy’s power generation activities and other utility operations are subject to extensive state and federal environmental regulation. In the opinion of CPS Energy’s management, the outcome of such proceedings will not have a material adverse effect on the financial position or results of operations of CPS Energy.
Notes to Financial Statements
Year-Ended September 30, 2016 - 176 - Amounts are expressed in thousands
Note 11 Commitments and Contingencies (Continued)
CPS Energy (Continued)
Leases Capital Leases – CPS Energy was not a contracted party to any capital leases for fiscal year 2016. Operating Leases – In fiscal year 2014, CPS Energy entered into an agreement to sell 69 of its communication towers to an independent third party. Title to 62 of the towers was conveyed to the purchaser in January 2014. (Towers count is not expressed in thousands). Resolution of easement issues related to the remaining sites was concluded in February 2016, resulting in the transfer of title to the purchaser for five additional towers. Additionally, new licensing agreements were entered into between CPS Energy and the purchaser for CPS Energy’s ongoing use of the towers and the purchaser’s use of CPS Energy’s communication buildings for a period of 40 years, with three five-year options by the purchaser to extend the agreement. In accordance with lease guidance provided in GASB Statement No. 62, leases related to the communication towers sale, both with CPS Energy as lessor and as lessee, have been classified as operating leases. Future minimum lease payment information provided on the following page includes lease revenue and lease expense to be recognized as a result of the following lease components of the communication towers sale.
• Lease of Tower Space for CPS Energy Communication Equipment – The parties to the sale transaction agreed that no cash would be paid by CPS Energy for the space it leased on the communication towers for the 40-year term of the lease agreement. As a result, the total sale transaction proceeds received from the purchaser were reduced by an amount representing an advance payment to the purchaser of the net present value of the estimated total lease obligation. This value represents a prepaid lease expense to CPS Energy benefitting a period of time equal to the 40-year term of the leases. In accordance with GASB Statement No. 62, the value of this prepaid lease obligation for space on the 62 towers (not in thousands) was recorded at fair value and totaled $18,705, which will be amortized to lease expense over a 40-year term. The prepaid lease obligation related to each of the remaining seven towers will be recorded at closing and title conveyance for each respective tower sale.
• Lease of Communication Building Space –The parties agreed that no cash would be paid by the
purchaser for the space it leased in CPS Energy’s communication buildings for the term of the lease agreement. As a result, the total sale transaction proceeds received from the purchaser included an additional amount representing an advance payment by the purchaser of the net present value of the estimated total lease obligation. This value represents unearned lease revenue to CPS Energy generated over a period of time equal to the 40-year term of the leases. In accordance with GASB Statement No. 62, the value of this unearned lease revenue for space in the 62 communication buildings (not in thousands) was recorded at fair value and totaled $6,336, which will be amortized to nonoperating income over the 40-year term. The unearned lease revenue related to each of the remaining seven communication buildings will be recorded at closing and title conveyance for each respective tower sale.
Notes to Financial Statements
Year-Ended September 30, 2016 - 177 - Amounts are expressed in thousands
Note 11 Commitments and Contingencies (Continued)
CPS Energy (Continued)
Leases (Continued) Additionally, the communication towers sale transaction included an assignment of existing operating lease agreements with tenants who had equipment located on the towers. At the time of sale, there were approximately 127 lease agreements outstanding (not in thousands), with CPS Energy as lessor for space on the towers and in CPS Energy’s communication buildings, having remaining terms varying from fewer than two years to ten years. With the sale of the towers, these leases were assigned to the purchaser, and the right to collect future cash flows from the leases was conveyed. The estimated net present value of these cash flows, including annual escalations based on estimate future Consumer Price Indices, total approximately $6,500 for the 62 towers conveyed in the initial closing plus an additional $463 for the seven towers to be subsequently conveyed. Proceeds to CPS Energy from the tower sale transaction included a purchase price for these leases, which was recorded as a deferred inflow of resources totaling $6,500 in accordance with guidance provided in GASB Statement 65. As of January 31, 2016, the balance of unearned revenue reported as deferred inflow of resources was $4,507. Revenue from the sale of future revenues related to these leases will be recognized over the term of the original leases in accordance with guidance provided in GASB Statement No. 48, Sales and Pledges of Receivable and Future Revenues and Intra-Equity Transfers of Assets and Future Revenues. Additional deferred inflows of resources for the assignment to the purchaser of any leases related to each of the remaining seven towers will be recorded at closing and title conveyance for each respective tower sale.
CPS Energy has entered into operating lease agreements to secure the usage of communication towers space, railroad cars, natural gas storage facilities, land, office space, parking lot space and engineering equipment. The lease for the parking lot space and several of the leases for office space, as well as the communication towers space, include an escalation in the monthly payment amount after the first year of each lease. The future minimum lease payments to be made by CPS Energy for noncancelable operating leases with terms in excess of one year are as follows:
Operating LeaseYear Ended January 31, Payments
2017 9,918$ 2018 7,219 2019 3,222 2020 1,421 2021 1,430
Later years 75,798 Total future minimum lease payments 99,008$
CPS Energy’s minimum lease payments for all operating leases for which CPS Energy was the lessee amounted to $10,342 in fiscal year 2016. There was $132 in contingent lease payments in fiscal year 2016.
Notes to Financial Statements
Year-Ended September 30, 2016 - 178 - Amounts are expressed in thousands
Note 11 Commitments and Contingencies (Continued)
CPS Energy (Continued)
Leases (Continued) CPS Energy has entered into operating lease agreements allowing cable and telecommunication companies to attach telephone, cable and fiber-optic lines to CPS Energy’s electric poles. Operating leases also exist between CPS Energy and telecommunication companies allowing the companies to attach communication equipment to CPS Energy’s communication and transmission towers. Projected future minimum lease receipts pertaining to the use of CPS Energy’s communication towers and buildings reflect a 4.0% annual escalation in receipts after the first year of each lease. Additionally, CPS Energy has three operating leases for the use of land that CPS Energy owns, and it has entered into multiple agricultural leases allowing the lessees to use CPS Energy’s land for sheep and cattle grazing. The majority of the operating leases pertaining to the use of CPS Energy’s transmission towers contain provisions for contingent lease receipts that will equal the lesser of a 15.0% increase in the prior five-year lease payment or the percentage increase in the Consumer Price Index over the same five-year period. Furthermore, the three land leases also contain provisions for contingent lease receipts based on the Consumer Price Index. The future minimum lease receipts to CPS Energy for noncancelable operating leases with terms in excess of one year are as follows:
Operating LeaseYear Ended January 31, Receipts
2017 1,067$ 2018 888 2019 673 2020 556 2021 545
Later years 25,995 Total future minimum lease receipts 29,724$
CPS Energy’s minimum lease receipts for all operating leases for which CPS Energy was the lessor amounted to $7,278 in fiscal year 2016. Contingent lease receipts amounted to $33 for fiscal year 2016. There were no sublease receipts in fiscal year 2016. Other Purchase and construction commitments approximated $7,261,956 at January 31, 2016. This amount includes construction commitments, provisions for coal purchases through December 2021, coal transportation through December 2018 and natural gas purchases through June 2027; the actual amount to be paid will depend on CPS Energy’s actual requirements during the contract period and the price of gas. Also included are provisions for wind power through 2038, solar power through 2042, landfill power through 2029, and raw uranium associated with STP fabrication and conversion services needed for refueling through May 2026.
Notes to Financial Statements
Year-Ended September 30, 2016 - 179 - Amounts are expressed in thousands
Note 11 Commitments and Contingencies (Continued)
CPS Energy (Continued)
Other (Continued) On January 20, 2009, the Board approved a policy statement on sustainability. The basis of the policy is to affirm that CPS Energy’s strategic direction centers on transforming from a company focused on providing low-cost power from traditional generation sources to a company providing competitively priced power from a variety of sources, including low and non-carbon emitting sources. To be sustainable, CPS Energy has to balance its financial viability, environmental commitments and social responsibility as a community-owned provider. In fiscal year 2008, CPS Energy entered into a Natural Gas Supply Agreement with SAEAPFC to purchase, to the extent of its gas utility requirements, all natural gas to be delivered under a Prepaid Natural Gas Sales Agreement. Under the Prepaid Natural Gas Sales Agreement between SAEAPFC and a third-party gas supplier, SAEAPFC has prepaid the cost of a specified supply of natural gas to be delivered over 20 years. On February 25, 2013, SAEAPFC executed certain amendments to the Prepaid Natural Gas Sales Agreement entered into with J. Aron in 2007 and other related documents with respect to the 2007 prepayment transaction with J. Aron. Under the resolution and the amendments, Goldman, Sachs & Co. surrendered for cancellation $111,060 of the SA Energy Acquisition Public Facility Corporation Gas Supply Revenue Bonds, Series 2007 owned by J. Aron; Goldman, Sachs & Co.; or affiliates. In exchange, SAEAPFC agreed to reduce future required natural gas delivery volumes from 104.6 MMBtu to 81.3 MMBtu and to adjust the notional amount of its commodities price hedge so that hedged revenue from gas sales will bear at least the same proportion to annual debt service requirements as before the transaction. In conjunction with the transaction, a portion of the savings related to the purchase of natural gas from SAEAPFC that would have been passed on to CPS Energy’s distribution gas customers over the 20-year life of the original agreement is being accelerated. Distribution gas customers benefitted from the accelerated savings beginning March 1, 2013 through June 30, 2015. Although this accelerated savings period has ended, the remainder of the transaction remains intact through 2027. CPS Energy’s 20-year commitment under the Natural Gas Supply Agreement is included in the aforementioned purchase and construction commitments amount. In fiscal year 2003, CPS Energy entered into a 20-year agreement with BDA to upgrade the electric and gas utility systems located within the Brooks City-Base. CPS Energy and BDA have each committed to invest $6,323 ($4,284 in year 2002 dollars, which accumulates interest at the rate of 3.7% compounded annually) to upgrade the infrastructure at that location. Annual reductions to BDA’s obligation were made from incremental revenues to the City for electric and gas sales to customers that reside on the BDA-developed property. Annual reductions to BDA’s obligation were also made in accordance with contract terms for economic development at Brooks City-Base that benefits CPS Energy’s systems. To the extent that the capital renewals and upgrades do not total $12,646 by September 2022, BDA’s and CPS Energy’s committed investments each will be reduced equally. To date, $11,164 has been invested in capital renewals and upgrades and BDA has met its $4,284 obligation, net of annual interest. In September 2010, CPS Energy committed to partner in the Texas Sustainable Energy Research Institute at the University of Texas at San Antonio for sustainable energy research. The agreement calls for CPS Energy to invest up to $50,000 over 10 years in the institute. The investment made through January 31, 2016 was $6,500 from funds currently allocated to research and development. Future funding will be developed by the scope of the projects defined by the partnership and subject to annual approval by the Board. Projects will be designed to produce clear value to CPS Energy and its customers.
Notes to Financial Statements
Year-Ended September 30, 2016 - 180 - Amounts are expressed in thousands
Note 11 Commitments and Contingencies (Continued)
CPS Energy (Continued)
Other (Continued) CPS Energy sells its excess power into the wholesale market. While the majority of these transactions are conducted in the short-term market, from time to time, CPS Energy enters into long-term wholesale power supply agreements with other public power entities. In addition to long-standing wholesale power relationships with the cities of Castroville, Floresville and Hondo, CPS Energy currently has agreements to provide either full or partial requirements to seven additional public power entities. These agreements have varying terms expiring between 2016 and 2023. The volumes committed under these agreements represent approximately 5.0% to 7.0% of current capacity. CPS Energy regularly monitors the market values of these transactions to manage contract provisions with the counterparties. On June 20, 2011, CPS Energy announced its New Energy Economy initiative. The program is designed to focus on more clean energy sources rather than traditional energy sources and includes several major initiatives to which CPS Energy has committed (current commitments are included in the aforementioned $7,261,956):
CPS Energy’s customers will have the opportunity to manage their home energy use through a Home Area Network system referred to as Home Manager. A program was launched in fiscal year 2012 with plans to enroll up to 140,000 homes and businesses (not reported in thousands) by 2019. Home area networks work with smart meters to provide up-to-the-minute energy use information and allow demand-side management to reduce energy consumption on the customer premises. The deployment may be partially funded through the Save for Tomorrow Energy Program (STEP) and has the potential to reduce electrical demand by 205 megawatts. Through January 31, 2016, approximately 22,000 Home Manager systems (not reported in thousands) were actively installed.
CPS Energy is in the process of replacing 25 San Antonio street lights with light-emitting diode (LED) street lights. The lights were purchased from GreenStar, a worldwide supplier of LED lighting. The street lights use 60.0% less energy than standard sodium lights and are designed to last 12 to 15 years, thereby reducing maintenance costs. Approximately $2,200 of the deployment costs will be funded through STEP, with the remainder funded by the City. Through January 31, 2016, approximately 24,000 LED streetlights (not reported in thousands) have been installed. On June 2, 2016, City Council approved an ordinance authorizing retrofit of approximately 30,000 LED residential streetlights (not reported in thousands). The remaining lights required for replacement within the downtown area are expected to be replaced throughout fiscal year 2017.
In November 2011, CPS Energy entered into a $77,025 prepaid agreement with SunEdison for purchased power equal to approximately 60.0% of the anticipated output from 30 MW of solar energy facilities in the San Antonio area. Subsequent to the execution of this agreement, SunEdison transferred 100.0% of its interests in these facilities to San Antonio Solar Holdings LLC. The unamortized balance of the prepayment was $66,056 at January 31, 2016. The agreement expires in 2037, and the purchase of the balance of the output is on a pay-as-you-go basis. As part of the agreement, CPS Energy has the right to purchase the facilities six years after commencement of commercial operations, which occurred in May 2012.
Notes to Financial Statements
Year-Ended September 30, 2016 - 181 - Amounts are expressed in thousands
Note 11 Commitments and Contingencies (Continued)
CPS Energy (Continued)
Other (Continued)
In January 2014, CPS Energy announced a renewal of an earlier agreement with Summit Power Group to purchase power from its Texas Clean Energy Project integrated combined-cycle coal gasification plant, which will incorporate carbon capture, utilization and storage technology in a first-of-its-kind commercial clean-coal power plant. The plant will provide 200 megawatts of clean-coal electricity to CPS Energy; 90.0% of the carbon will be captured and used for enhanced oil recovery in the West Texas Permian Basin. The plant, to be built approximately 15 miles west of Odessa, Texas, is expected to be online in 2019. The contract is for all expected net generation electrical output from the facility, with payments beginning once the project has commenced electrical production. Although this project will continue to be evaluated, CPS Energy has no further legal or financial obligations associated with the project.
In July 2012, CPS Energy and OCI Solar Power (OCI) entered into an agreement for CPS Energy to purchase solar power produced by OCI. OCI created a consortium of partners to deliver 400 megawatt of solar energy, produced at solar farms primarily in and around San Antonio, to CPS Energy throughout the life of the 25-year power purchase agreement. Also as part of the agreement, Mission Solar Energy, LLC, the anchor manufacturer in the consortium, has built a high-tech manufacturing facility to produce components for solar power generation and has relocated its headquarters to San Antonio, creating over 400 jobs (jobs not expressed in thousands).
In October 2015, CPS Energy and OCI entered into an agreement for CPS Energy to purchase an additional 50 MW of solar power produced by OCI. The solar energy will be delivered to CPS Energy by the same consortium of partners throughout the life of the 25-year power purchase agreement. In December 2013, CPS Energy, along with partners Silver Spring Networks and Landis+Gyr, began CPS Energy’s Grid Optimization project, or more commonly known as Smart Grid. The project will provide a standards-based networking platform, advanced metering infrastructure and distribution automation solutions across CPS Energy’s service territory. The completed system will also facilitate wireless two-way communication between CPS Energy and its customers and allow for increased energy efficiency and offer greater customer control and savings. The estimated cost of this project is approximately $290,000 and is expected to bring a minimum of 50 jobs (not expressed in thousands) to San Antonio. Simply Solar is the trademarked name for CPS Energy’s new solar initiatives – Roofless Solar and SolarHostSA. Roofless Solar is being offered by CPS Energy in partnership with Clean Energy Collective (CEC). CEC will build and maintain a 1 MW community solar farm in the CPS Energy service territory and sell 100-watt panels in the array to customers who want to enjoy the benefits of solar power without having to install their own system. On June 18, 2015, CPS Energy entered into an agreement to purchase the output from the solar farm for 25 years. For the SolarHostSA program, CPS Energy partnered with PowerFin Partners to install up to 10 MW of rooftop systems on customer homes and businesses. The program will provide participating customers a monthly credit for hosting the systems on their rooftops. The program is intended to make solar accessible to more customers by doing away with the significant upfront cost of traditional rooftop systems. On August 12, 2015, CPS Energy entered into an agreement to purchase the output from the rooftop systems for an initial term of 20 years.
Notes to Financial Statements
Year-Ended September 30, 2016 - 182 - Amounts are expressed in thousands
Note 11 Commitments and Contingencies (Continued)
CPS Energy (Continued)
Save for Tomorrow Energy Program (STEP) CPS Energy has projected to spend approximately $849,000 over a 12-year period on energy efficiency and conservation through STEP. Contributing towards its goal to save 771 MW by 2020, CPS Energy’s programs include home weatherization, higher efficiency light bulbs, solar rebates, peak saver thermostats, home area networks, demand response, rooftop and community solar programs, and other such initiatives. Annually, approximately $9,000 of the STEP expenses are funded through the electric base rate and reported as CPS Energy operation and maintenance expenses. STEP expenses over this initial amount per year are recovered through the fuel adjustment factor over a 12-month period beginning in the subsequent fiscal year after they are incurred and have been independently validated. These STEP recoveries are accrued as a regulatory asset referred to as STEP net costs recoverable.
San Antonio Water System (SAWS)
Litigation SAWS is the subject of various claims and potential litigation, which arise in the ordinary course of its operations. Management, in consultation with legal counsel, makes an estimate of potential costs that are expected to be paid in the future as a result of known claims and potential litigation and records this estimate as a contingent liability. Postclosure Care Costs In connection with a desalination injection well permits obtained by SAWS from the Texas Commission on Environmental Quality (TCEQ), SAWS has an obligation to plug the injection wells once the wells are no longer in service. At December 31, 2015, SAWS has recorded a liability of $457 related to this post-closure obligation. Other In March 2007, SAWS was notified by Region 6 of the United States Environmental Protection Agency (EPA) of alleged failures to comply with the Clean Water Act due to the occurrence of sanitary sewer overflows (SSO). The EPA subsequently referred the matter to the United States Department of Justice (DOJ) for an enforcement action. On June 4, 2013, the Board approved a Consent Decree between SAWS, the United States of America, and the State of Texas. On September 13, 2013, after consideration of the comments received, the United States of America filed its Motion for entry of the Consent Decree, requesting the Court to approve the Consent Decree by signing and entering it. The Consent Decree was signed and entered by the Court on October 15, 2013. During the 10 to 12 year term of the Consent Decree, SAWS estimates the cost to perform the operating and maintenance requirements of the Consent Decree will be approximately $250,000. Additionally, SAWS estimates that capital investments of approximately $850,000 will be required over the Consent Decree term. As with any estimate, the actual amounts incurred could differ materially. Since entry into the Consent Decree, SAWS has performed its obligations under terms of the Consent Decree and is in material compliance with such terms, conditions, and requirements. Since 2010, SAWS has seen a significant reduction in SSOs, from 538 in 2010 to 262 in 2015 (figures in this sentence are not in thousands).
Notes to Financial Statements
Year-Ended September 30, 2016 - 183 - Amounts are expressed in thousands
Note 11 Commitments and Contingencies (Continued)
San Antonio Water System (SAWS) (Continued)
Other (Continued) In an effort to achieve significant diversification of the City’s water supply, in 2011 the Board solicited requests for competitive sealed proposals for the provision and delivery of alternative water supplies for the purpose of meeting SAWS’ water supply needs. In response to the solicitation, the Board received nine responses, from which three finalists were selected and reviewed prior to determining that the proposal of the Abengoa Vista Ridge, LLC (AVR) presented the most advantageous possibility for the City obtaining an alternative water source.
On October 30, 2014 the City Council adopted an ordinance, approving the execution of a Water Transmission and Purchase Agreement (the Agreement) between the City, acting by and through SAWS and AVR, pursuant to which AVR has committed to make available to SAWS, and SAWS has agreed to pay for, up to 50 acre-feet of potable water (Project Water) per year for an initial period of 30 years plus a limited 10 year extension period under certain circumstances, hereinafter referred to as the operational phase. To produce and deliver the Project Water, AVR will develop well fields to withdraw water from the Carrizo and Simsboro Aquifers in Burleson County, Texas pursuant to currently-held long-term leases with landowners and construct (or cause to be constructed) a 142-mile pipeline from this well field to northern Bexar County (the well fields and the pipeline, together, the Project). The pipeline will be connected to the SAWS distribution system at this delivery point in northern Bexar County. The Agreement is separated into three distinct phases. The development phase commenced on November 4, 2014, which was the date of complete execution and delivery of the Agreement, and is scheduled to last between 18 and 30 months. The development phase concludes upon satisfaction of certain contractual requirements, the most significant of which is when AVR obtains permanent construction financing for the Project. These events are referred to as financial closure and its occurrence results in the conclusion of the development phase and commencement of the construction phase by AVR. During the construction phase of the Project, SAWS will also begin construction of improvements necessary to accept and integrate the Project Water, at an anticipated capital cost to SAWS of approximately $145,000. This construction phase is scheduled to last 42 months and its conclusion will result in the commencement of the aforementioned 30 year operational phase, during which period SAWS is obligated to pay for water (up to 50 acre-feet annually) made available to it by AVR at the connection point. During the development phase, SAWS has retained the right to terminate the Agreement for its convenience, subject to its payment of a termination fee to AVR (determined based on the costs incurred by AVR pursuant to the Agreement from commencement of the development phase to the date of termination, such termination fee being capped at $40,100). After financial closure, SAWS has also retained the right to terminate the Agreement by purchasing the Project for the aggregate amount of the outstanding AVR debt, contract breakage costs and return of and on equity contributions by AVR’s principals (no cap is imposed upon such amount as exists if the Agreement is terminated during the development phase). At the end of the operational phase, ownership of the Project will be transferred to SAWS at no cost. SAWS has also entered into a separate agreement with Blue Water Vista Ridge, LLC, the lessee of the Project Water, to continue to acquire the 50 acre-feet of untreated groundwater upon the termination of the agreement and transfer of the Project to SAWS, and the cost of such water at the end of the Agreement will be tied to prevailing Edwards Aquifer leases.
Notes to Financial Statements
Year-Ended September 30, 2016 - 184 - Amounts are expressed in thousands
Note 11 Commitments and Contingencies (Continued)
San Antonio Water System (SAWS) (Continued)
Other (Continued) Pursuant to the terms of the Agreement, SAWS will pay costs arising under the Agreement, as maintenance and operating expense of SAWS for rate setting purposes, only for Project Water made available at the connection point (which payment will include the costs of operating and maintaining the Project). SAWS will have no obligation to pay for any debt issued by AVR, and any such debt will be non-recourse to SAWS. SAWS anticipates that Project Water (the cost of which is paid directly to AVR), together with Vista Ridge Project operations and maintenance (as a direct pass through under the Agreement) and electricity (paid directly by SAWS to the utility providers), will initially cost approximately $2 per acre-foot, resulting in an annual charge to SAWS of approximately $110,000 (which amount does not take into account potential revenue increases resultant from Project Water being available to SAWS for sale). On November 19, 2015, the City Council approved a series of increases to the water supply fee to support the acquisition of new water supplies, including the Project. SAWS currently projects that, absent any increase in SAWS system revenues attributable to the availability of Project Water for sale, its payment obligation under the Agreement will result in a rate increase of approximately 14.0% to the average monthly SAWS residential bill by 2020 (which increase does not include other projected rate increases anticipated to occur by such time). Any such fee will only be imposed by SAWS so that revenues are not generated and received until needed. Accordingly, SAWS will not impose this approved fee to pay costs of the Project until payment for Project Water is imminent.
The execution of the Agreement represents a significant diversification of the City’s water source, as SAWS projects that Project Water, if delivered at the maximum amount (which is the expectation of both SAWS and AVR), will account for approximately 20.0% of SAWS’ current annual usage. On November 25, 2015, national and international media reported Abengoa Parent’s commencement of pre-insolvency proceedings in Spain, indicating the beginning of an approximately four-month period during which Abengoa Parent negotiated with its creditors in an effort to reach an accord to guarantee Abengoa Parent’s continued financial viability. On February 3, 2016, Abengoa Parent presented its viability plan to its main creditors, who were to agree to a restructuring plan prior to March 28, 2016 for Abengoa Parent to avoid filing for insolvency. See Note 19 Subsequent Events for additional discussion regarding Abengoa’s Bankruptcy.
On December 18, 2015, Metropolitan Water Company, L.P. (Met Water) filed a lawsuit in Travis County District Court, 201st Judicial District, styled Metropolitan Water Company, L.P. v. Blue Water Systems, LP; Blue Water Regional Supply Project, LP; Blue Water Vista Ridge LLC; Abengoa Vista Ridge LLC; and Wilmington Trust National Association. In this lawsuit, Met Water alleged various Blue Water entities breached certain agreements with Met Water and failed to pay Met Water money owed under said agreements. Met Water also alleges that an assignment of leases to Blue Water Vista Ridge, LLC was entered into based upon a fraudulent inducement. Met Water sought rescission of the agreements with the Blue Water Vista Ridge, LLC-affiliated entities, including the assignment of leases, and/or money damages. The leases that are the subject of the assignment in dispute give Abengoa VR the right to produce the Project Water to be sold to SAWS under the Agreement. On May 11, 2016, the litigating parties filed a Notice of Non-Suit with Prejudice, effectively dismissing all claims that could adversely affect performance of the Agreement. On November 1, 2016, the Board of Trustees approved a second amendment to the Agreement to accommodate the declaration of financial closure under the Agreement. Please see Note 19 Subsequent Events for further information.
Notes to Financial Statements
Year-Ended September 30, 2016 - 185 - Amounts are expressed in thousands
Note 11 Commitments and Contingencies (Continued)
San Antonio Water System (SAWS) (Continued)
Other (Continued) As of December 31, 2015, SAWS has entered into various water leases to obtain rights to pump water from the Edwards Aquifer. The term of these agreements vary, with some expiring as early as 2016 and others continuing until 2023. Some of the leases include price escalations and the annual cost per acre-foot ranges from $115 to $140. (Figures in this paragraph are not in thousands.) The future commitments under these leases are as follows:
2016 2017 2018 2019 2020 ThereafterLease obligations 3,430$ 3,509$ 3,764$ 2,920$ 2,793$ 5,267$ Lease obligations (acre feet) 28,029 27,904 27,673 20,858 19,948 37,620
SAWS has various commitments relating to water purchases. A summary of these commitments is provided in the following table. As with any estimates, the actual amounts paid could differ materially.
2016 2017 2018 2019 2020 ThereafterPurchased water payments - fixed 15,930$ 16,367$ 16,447$ 16,532$ 16,626$ 397,347$ Acre feet purchased - fixed 22,570 22,472 22,295 22,122 21,953 452,187 Purchased water payments - variable 9,438$ 14,734$ 15,055$ 15,381$ 15,490$ 227,474$ Acre feet purchased - variable 10,562 14,849 14,849 14,849 14,621 157,050
Under a contract with Guadalupe Blanco River Authority (GBRA), SAWS will receive 6 acre-feet of water annually through the end of the contract in 2037. Additionally, SAWS must purchase water not sold by GBRA to other third parties. The additional amount of water available in 2016 is estimated to be 3 acre-feet and will decline over the remaining term of the contract as the demand of GBRA’s other customer’s increases. The cost of the water escalates over time with projected prices ranging from $952 per acre-foot in 2016 to approximately $1,538 per acre-foot by 2037. SAWS has an option to extend this contract until 2077 under new payment terms. (Dollars referenced in this paragraph are not stated in thousands.) Under a contract with the Massah Development Corporation, SAWS has a minimum take or pay commitment to purchase .1 acre-feet per month or 1 acre-feet per year of raw water from the Lower Glen Rose/Cow Creek formations of the Trinity Aquifer in northern Bexar County at projected prices ranging from $624 to $815 per acre- foot. This agreement expires in 2025 and SAWS has an option to extend the contract for 10 years. Dollars referenced in this paragraph are not stated in thousands.) Under a contract with Sneckner Partners, Ltd., SAWS has a take or pay commitment to purchase 1,500 acre-feet of water annually from the Trinity Aquifer at a minimum annual cost of $225 per acre-foot through 2020. (Figures in this sentence are not in thousands.) SAWS has an option to extend the contract through 2026. As part of this contract, SAWS agreed to make quarterly defined payments for any residential customers that are connected to the system within a defined geographical area that begin taking water service from SAWS. SAWS began making these payments during 2012 as the area has begun to experience some development. SAWS has made payments totaling $270 for new customer connections under the terms of this contract. While it is impossible to estimate the exact amount of any potential future payments associated with this provision of the agreement, management’s estimate of this potential contingent liability is less than $5,000.
Notes to Financial Statements
Year-Ended September 30, 2016 - 186 - Amounts are expressed in thousands
Note 11 Commitments and Contingencies (Continued)
San Antonio Water System (SAWS) (Continued)
Other (Continued) In 2012, SAWS entered into an agreement with Water Exploration Company, Ltd. (WECO) to purchase groundwater produced by WECO from the Trinity Aquifer. In connection with this agreement, two prior water purchase agreements between SAWS DSP and WECO were terminated. The new agreement has a term of 15 years, with two optional five-year extensions. SAWS is obligated to purchase up to 17 acre-feet per year in monthly increments not to exceed 1 acre-feet if water is available to be produced. SAWS only pays for delivered water meeting all state and federal drinking water standards. Pumping by WECO may not reduce the Trinity Aquifer below .6 feet Mean Sea Level at test wells on the tracts. The projected price to be paid per acre-foot of raw water ranges from $916 in 2016 to $1,138 by 2027. (Dollars referenced in this paragraph are not stated in thousands.) In 2010, SAWS was granted a permit by the Gonzales County Underground Water Conservation District to produce 11,688 acre-feet of water from the Carrizo Aquifer in Gonzales County. SAWS has entered into 23 separate agreements with land owners to produce water under that permit. (Agreement count and acreage not in thousands.) These agreements remain in force indefinitely as long as SAWS continues to make payments in accordance with the terms of the agreements. SAWS makes payments to the landowners based on actual water produced. SAWS expects to produce the maximum water available under its permit in 2016 and projects payments to landowners will be $1,101. These payments escalate annually based on the average of the increase in the Consumer Price Index and Producers Price Index. In 2011, SAWS entered into an agreement with the Schertz Seguin Local Government Corporation (SSLGC) to treat the water produced by SAWS under its permit with the District at its treatment plant in Guadalupe County and transport that water through SSLGC’s existing transportation pipeline to a SAWS facility in Schertz, Texas, and to purchase up to 5,000 acre-feet of wholesale water annually from SSLGC. As part of that agreement, SSLGC agreed to expand its treatment facilities to handle the volume of water supplied by SAWS. SSLGC issued contract revenue bonds in 2012 to finance the expansion. SAWS is unconditionally obligated to make monthly payment to SSLGC beginning in December 2014 equal to 1/12th the annual debt service payment owed by SSLGC on the contract revenue bonds regardless of the amount of water actually provided by SAWS to SSLGC for treatment and transportation. In addition to the payment made to SSLGC for the expansion of the treatment plant, SAWS makes payments to SSLGC for treating and transporting the SAWS produced water. (Figures in this paragraph are not in thousands.) The initial term of the agreement with SSLGC expires in 2050 and can be renewed for successive terms of 5 years. The projected price paid to SSLGC for water treated and transported by SAWS is projected to be $476 per acre- foot in 2016 and includes the debt service associated with the expansion of SSLGC’s treatment plan. Payments for any wholesale water purchased from SSLGC is based on SSLGC’s wholesale water rates. (Figures in this paragraph are not in thousands.) SAWS is also committed under various contracts for completion of construction or acquisition of utility plant totaling approximately $384,366 as of December 31, 2015. Funding of this amount will come from excess revenues, contributions from developers, restricted assets and available commercial paper capacity.
Notes to Financial Statements
Year-Ended September 30, 2016 - 187 - Amounts are expressed in thousands
Note 11 Commitments and Contingencies (Continued)
San Antonio Water System (SAWS) (Continued)
Arbitrage The Federal Tax Reform Act of 1986 requires issuers of tax-exempt debt to make payments to the United States Treasury for investment income received at yields that exceed the issuer’s tax exempt borrowing rates. The Treasury requires payment for each issue every five years. The estimated liability is updated annually for all tax-exempt issuances or changes in yields until such time payment of the calculated liability is due. A liability is recorded once payment appears to be probable. As of December 31, 2015, SAWS has no arbitrage rebate liability associated with any outstanding bonds.
(The remainder of this page left blank intentionally)
Notes to Financial Statements
Year-Ended September 30, 2016 - 188 - Amounts are expressed in thousands
Note 12 Pollution Remediation Obligation
Primary Government (City)
The City follows the provisions of GASB Statement No. 49, Accounting and Financial Reporting for Pollution Remediation Obligations. The general nature of existing pollution that has been identified on City property is consistent with City operations of acquiring properties for infrastructure and improvement development. Under most circumstances, the triggering event relevant to the City is the voluntary commencement of activities to clean up the pollution. Costs were estimated using the expected cash flow technique prescribed under GASB Statement No. 49 utilizing information provided by the City’s respective departments which included previous knowledge of clean-up costs, existing contracts, etc. Depending on the length of time it takes the City to remediate the pollution, costs may be different from that estimated below as a result of market rate changes, price increases or reductions, improvements to technology, or changes in applicable laws or regulations.
Beginning EndingBalance Additions Deletions Balance
Governmental Activities:Liabilities 407$ 173$ (130)$ 450$ Construction in Progress 264 133 (28) 369
Business-Type Activities:Liabilities 1,319$ (45)$ 1,274$
The Governmental Activities’ liabilities were a result of cost estimates to clean existing pollution found on land acquired by the City’s Transportation and Capital Improvements Department for the construction of streets and drainage and parks, respectively. Any net changes in the Governmental Activities pollution liability that was not capitalized under Construction in Progress was expensed under the City’s public works activities. The City foresees receiving $154 in recoveries from third parties for the costs associated with cleaning up these pollution obligations. The Business-Type Activities’ liability was a result of cost estimates to clean existing pollution found on land acquired by the Airport System for the construction of airport structures. As the City acquired this property in the early 1940s, the liability did not meet the criteria to be capitalized, and as such was expensed in fiscal year 2009. The City had no additional pollution remediation costs in Business-Type Activities in fiscal year 2016.
CPS Energy
GASB Statement No. 49 requires that a liability be recognized for expected outlays for remediating existing pollution when certain triggering events occur. The general nature of existing pollution that has been identified at CPS Energy sites is consistent with that experienced within the electric and gas utilities industry. Under most circumstances, the triggering event most relevant to CPS Energy is the voluntary commencement of activities to clean up pollution. Under the FERC guidance, reserves have been established for dismantling and closure costs. In fiscal year 2008, in preparation for implementation of GASB Statement No. 49, a portion of those reserves were reclassified to remediation and dismantling reserve accounts reported on the Statement of Net Position within other liabilities. When a triggering event occurs, those reserves will be reclassified as a pollution remediation liability also reported within other liabilities.
Notes to Financial Statements
Year-Ended September 30, 2016 - 189 - Amounts are expressed in thousands
Note 12 Pollution Remediation Obligation (Continued)
CPS Energy (Continued)
The pollution remediation liability was $1,462 as of January 31, 2016. Costs were estimated using the expected cash flow technique prescribed under GASB Statement No. 49 utilizing information provided by CPS Energy’s environmental staff and consultants.
San Antonio Water System (SAWS)
SAWS had no material pollution remediation liabilities at December 31, 2015.
(The remainder of this page left blank intentionally)
Notes to Financial Statements
Year-Ended September 30, 2016 - 190 - Amounts are expressed in thousands
Note 13 Risk Financing
Primary Government (City)
Property and Casualty Liability Factory Mutual Insurance Company provides coverage for the City’s real property and contents. The City’s deductible for property damage is $100 and the insurance will reimburse up to $2,000,000. As of October 1, 2013, the City is completely self-insured for liability claims. Effective January 1, 2015, all auto and general liability claims were brought in-house to be administered internally. Obligations for claims under these programs are accrued in the City’s Self-Insurance Program’s Insurance Reserve Fund based on the City’s estimates of the aggregate liability for claims made and claims incurred but not reported. The departments are assessed contributions to cover expenditures. Workers’ Compensation As of May 1, 2013, the City is completely self-insured for workers’ compensation claims. The City utilizes a third-party administrator to adjust its claims. Obligations for claims under these programs are accrued in the City’s Self-Insurance Program’s Workers’ Compensation Fund based on the City’s estimates of the aggregate liability for claims made and claims incurred but not reported. The departments are assessed contributions to cover expenditures.
Employee Health Benefits The City offers employees and their eligible dependents a comprehensive employee benefits program including medical, dental, vision and basic and supplemental life insurance. Employees may also participate in healthcare or dependent care spending accounts. The City’s health program is self-insured and the City’s vision plan is fully-insured. The City offers two dental plans: one is self-insured and one is fully-insured. Obligations for benefits are accrued in the Employee Health Benefits Fund based upon the City's estimates of the aggregate liability for unpaid benefits. Retiree Health Benefits The City offers medical coverage for its retirees and their dependents. The City offers both self-insured and fully- insured plans to participating employees who are eligible to retire from the TMRS Pension Plan immediately following severance from the City. Self-Funded obligations for benefits are accrued in the City’s Retiree Health Benefits Insurance Fund (a subfund of the Employee Health Benefits Fund) based upon the City’s estimates of the aggregate liability for unpaid benefits. The City additionally determined and accrued OPEB liabilities based on an actuarial assessment of historical self-funded claims data performed bi-annually and reviewed annually. Current year unpaid benefit liabilities for retirees are netted against the OPEB liability as additional contributions.
Notes to Financial Statements
Year-Ended September 30, 2016 - 191 - Amounts are expressed in thousands
Note 13 Risk Financing (Continued)
Primary Government (City) (Continued)
Unemployment Compensation Program The Unemployment Compensation Program provides a central account for payment of unemployment compensation claims. As of the fiscal year-end, claims were being administered externally and are paid to the Texas Workforce Commission on a reimbursement basis. All costs incurred are recorded on a claim paid basis in the Employee Health Benefits Fund. Extended Sick Leave Program The Extended Sick Leave Program is used to pay benefits associated with short term disability, long-term disability and continued long-term disability. Benefits are administered by the City. Actual costs are incurred when extended leave is taken. Short term and long-term disability is funded by the employee’s department. Continued long-term disability is funded out of the Employee Health Benefits Fund. Employee Wellness Program The Employee Wellness Program supports a culture of wellness and provides employees and their family members with the necessary tools to achieve and maintain a healthy lifestyle, while positively impacting medical claim trends. The City offers a variety of programs including personalized onsite and telephonic health coaching, smoking cessation, health education sessions, and an activity-based program that outfits employees with a free pedometer. Through this activity-based program, employees are able to track their activity over the course of 12 months, during which they can earn up to $500 in financial contributions (not expressed in thousands). In fiscal year 2016 the City contributed $655 towards employee’s Flexible Spending or Health Savings account. The Employee Wellness Program is managed out of the Employee Health Benefits Fund. Claims Liability The liability for the Employee Health Benefits Program is based on the estimated aggregate amount outstanding at the Statement of Net Position date for unpaid benefits. Liabilities for the Insurance Reserve and Workers’ Compensation Programs are reported when it is probable that a loss has occurred as of the Statement of Net Position date, and the amount of the loss can be reasonably estimated. These liabilities include allocable loss adjustment expenses, specific incremental claim adjustment expenses such as the cost of outside legal counsel, and a provision for claims that have been incurred but not reported (IBNR). Unallocated claim adjustment expenses have not been included in the calculation of the outstanding claims liability, as management of the City feels it would not be practical or cost beneficial. In addition, based on the difficulty in determining a basis for estimating potential recoveries and the immateriality of prior amounts, no provision for subrogation or salvage has been included in the calculation of the claims liability. The claims liability reported in the accompanying financial statements for both the Insurance Reserve and Workers’ Compensation Programs is based on a 2.0% discount rate due to the multi-year life cycle to close out these claims and the average historical as well as forecasted yield on the City’s investments.
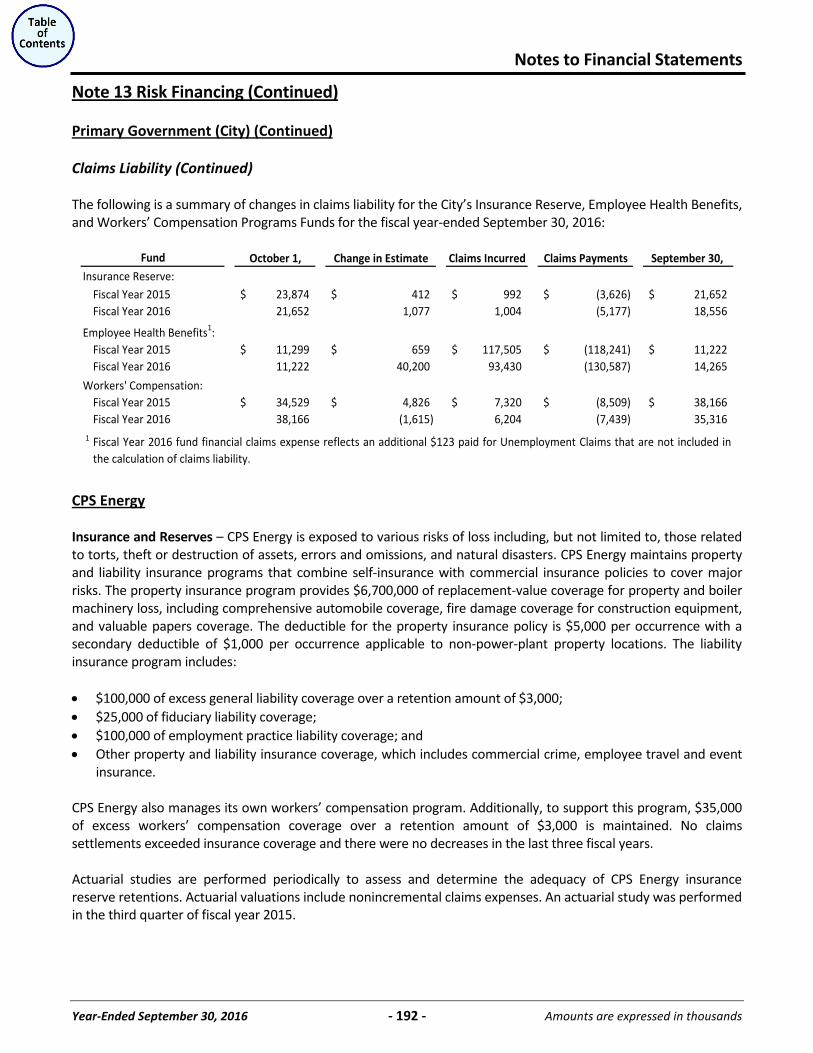
Notes to Financial Statements
Year-Ended September 30, 2016 - 192 - Amounts are expressed in thousands
Note 13 Risk Financing (Continued)
Primary Government (City) (Continued)
Claims Liability (Continued) The following is a summary of changes in claims liability for the City’s Insurance Reserve, Employee Health Benefits, and Workers’ Compensation Programs Funds for the fiscal year-ended September 30, 2016:
October 1, Change in Estimate Claims Incurred Claims Payments September 30, Insurance Reserve:
Fiscal Year 2015 23,874$ 412$ 992$ (3,626)$ 21,652$ Fiscal Year 2016 21,652 1,077 1,004 (5,177) 18,556
Employee Health Benefits1: Fiscal Year 2015 11,299$ 659$ 117,505$ (118,241)$ 11,222$ Fiscal Year 2016 11,222 40,200 93,430 (130,587) 14,265
Workers' Compensation: Fiscal Year 2015 34,529$ 4,826$ 7,320$ (8,509)$ 38,166$ Fiscal Year 2016 38,166 (1,615) 6,204 (7,439) 35,316
1
Fund
Fiscal Year 2016 fund financial claims expense reflects an additional $123 paid for Unemployment Claims that are not included inthe calculation of claims liability.
CPS Energy
Insurance and Reserves – CPS Energy is exposed to various risks of loss including, but not limited to, those related to torts, theft or destruction of assets, errors and omissions, and natural disasters. CPS Energy maintains property and liability insurance programs that combine self-insurance with commercial insurance policies to cover major risks. The property insurance program provides $6,700,000 of replacement-value coverage for property and boiler machinery loss, including comprehensive automobile coverage, fire damage coverage for construction equipment, and valuable papers coverage. The deductible for the property insurance policy is $5,000 per occurrence with a secondary deductible of $1,000 per occurrence applicable to non-power-plant property locations. The liability insurance program includes:
$100,000 of excess general liability coverage over a retention amount of $3,000; $25,000 of fiduciary liability coverage; $100,000 of employment practice liability coverage; and Other property and liability insurance coverage, which includes commercial crime, employee travel and event insurance.
CPS Energy also manages its own workers’ compensation program. Additionally, to support this program, $35,000 of excess workers’ compensation coverage over a retention amount of $3,000 is maintained. No claims settlements exceeded insurance coverage and there were no decreases in the last three fiscal years. Actuarial studies are performed periodically to assess and determine the adequacy of CPS Energy insurance reserve retentions. Actuarial valuations include nonincremental claims expenses. An actuarial study was performed in the third quarter of fiscal year 2015.
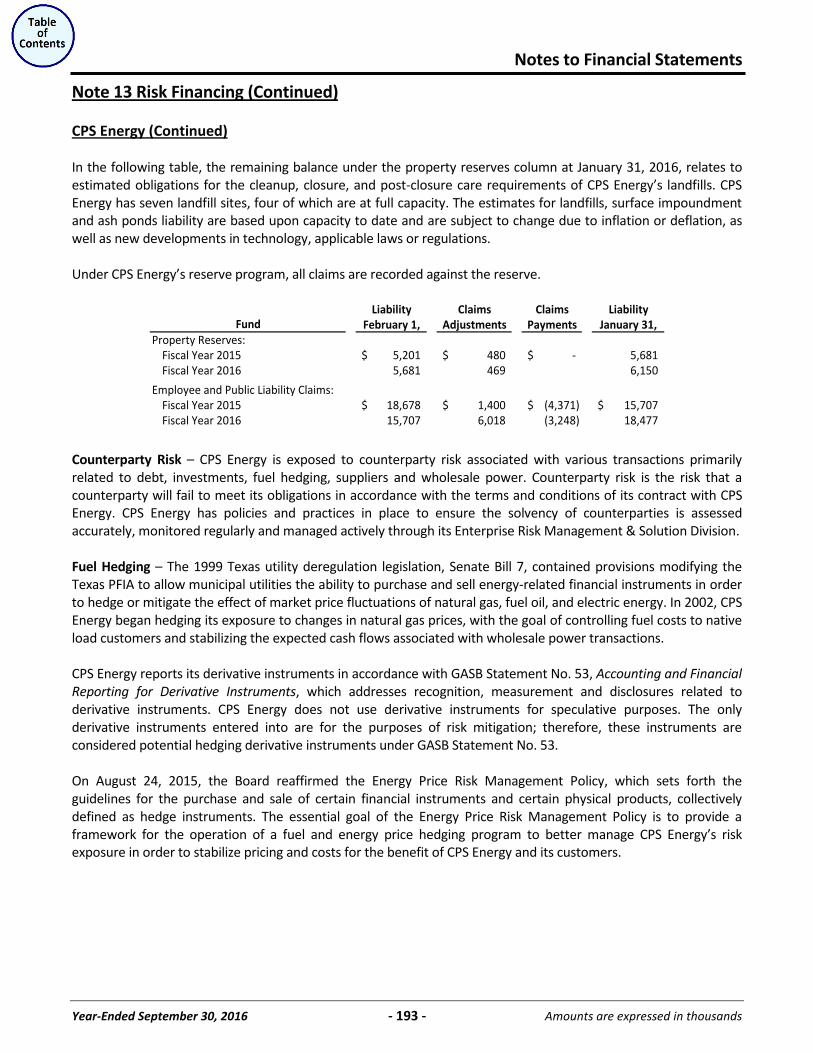
Notes to Financial Statements
Year-Ended September 30, 2016 - 193 - Amounts are expressed in thousands
Note 13 Risk Financing (Continued)
CPS Energy (Continued)
In the following table, the remaining balance under the property reserves column at January 31, 2016, relates to estimated obligations for the cleanup, closure, and post-closure care requirements of CPS Energy’s landfills. CPS Energy has seven landfill sites, four of which are at full capacity. The estimates for landfills, surface impoundment and ash ponds liability are based upon capacity to date and are subject to change due to inflation or deflation, as well as new developments in technology, applicable laws or regulations. Under CPS Energy’s reserve program, all claims are recorded against the reserve.
Liability Claims Claims LiabilityFebruary 1, Adjustments Payments January 31,
Property Reserves:Fiscal Year 2015 5,201$ 480$ -$ 5,681 Fiscal Year 2016 5,681 469 6,150
Employee and Public Liability Claims:Fiscal Year 2015 18,678$ 1,400$ (4,371)$ 15,707$ Fiscal Year 2016 15,707 6,018 (3,248) 18,477
Fund
Counterparty Risk – CPS Energy is exposed to counterparty risk associated with various transactions primarily related to debt, investments, fuel hedging, suppliers and wholesale power. Counterparty risk is the risk that a counterparty will fail to meet its obligations in accordance with the terms and conditions of its contract with CPS Energy. CPS Energy has policies and practices in place to ensure the solvency of counterparties is assessed accurately, monitored regularly and managed actively through its Enterprise Risk Management & Solution Division. Fuel Hedging – The 1999 Texas utility deregulation legislation, Senate Bill 7, contained provisions modifying the Texas PFIA to allow municipal utilities the ability to purchase and sell energy-related financial instruments in order to hedge or mitigate the effect of market price fluctuations of natural gas, fuel oil, and electric energy. In 2002, CPS Energy began hedging its exposure to changes in natural gas prices, with the goal of controlling fuel costs to native load customers and stabilizing the expected cash flows associated with wholesale power transactions. CPS Energy reports its derivative instruments in accordance with GASB Statement No. 53, Accounting and Financial Reporting for Derivative Instruments, which addresses recognition, measurement and disclosures related to derivative instruments. CPS Energy does not use derivative instruments for speculative purposes. The only derivative instruments entered into are for the purposes of risk mitigation; therefore, these instruments are considered potential hedging derivative instruments under GASB Statement No. 53. On August 24, 2015, the Board reaffirmed the Energy Price Risk Management Policy, which sets forth the guidelines for the purchase and sale of certain financial instruments and certain physical products, collectively defined as hedge instruments. The essential goal of the Energy Price Risk Management Policy is to provide a framework for the operation of a fuel and energy price hedging program to better manage CPS Energy’s risk exposure in order to stabilize pricing and costs for the benefit of CPS Energy and its customers.
Notes to Financial Statements
Year-Ended September 30, 2016 - 194 - Amounts are expressed in thousands
Note 13 Risk Financing (Continued)
CPS Energy (Continued)
In accordance with the requirements of GASB Statement No. 53, all fuel hedges are reported on the Statements of Net Position at fair value. The fair value of option contracts is determined using New York Mercantile Exchange (NYMEX) closing settlement prices as of the last day of the reporting period. For fixed-price contracts, the fair value is calculated by deriving the difference between the closing futures prices on the last day of the reporting period and the futures or basis swap purchase prices at the time the positions were established. All potential hedging derivative instruments were evaluated for effectiveness at January 31, 2016, and were determined to be effective in substantially offsetting the changes in cash flows of the hedgeable items. The instruments were categorized into two broad groups for the purposes of this testing. In one category, hedges utilize natural gas forwards and options that are priced based on the underlying Henry Hub natural gas price, while the physical gas is typically purchased at prices based on either the Western Area Hub Association (WAHA) or the Houston Ship Channel (HSC). Therefore, effectiveness testing was based on the extent of correlation between the first of the month index prices of natural gas at each of these locations and the settlement price at Henry Hub. The correlation coefficient was established by GASB Statement No. 53 as the critical term to be evaluated, with 0.89 established as the minimum standard tolerated. The testing, based on two different location hubs (WAHA and HSC), demonstrated a substantial offset in the fair values, as evidenced by their calculated R values, 0.98 and 0.99, respectively, indicating that the changes in cash flows of the derivative instruments substantially offset the changes in cash flows of the hedgeable item. Additionally, the substantive characteristics of the hedge have been considered, and the evaluation of this effectiveness measure has been sufficiently completed and documented such that a different evaluator, using the same method and assumptions, would reach substantially similar results. In the second category, hedges utilize both Henry Hub based natural gas forwards and locational basis swaps to the appropriate natural gas hub (WAHA or HSC) with volumes matching the underlying expected physical transaction. Considering the substantive characteristics of these hedge transactions, these instruments were determined to be effective utilizing the consistent critical terms method prescribed under GASB Statement No. 53. In fiscal year 2016, as a result of revisions to the expected volumes of some underlying wholesale physical transactions, it was determined that a group of existing financial hedge positions in this category were no longer effective. Offsetting financial positions were executed and the fair value of the ineffective hedges resulted in a loss totaling $851, which was recognized as a reduction in investment income. All other hedging derivative instruments in both effectiveness testing categories were determined to be effective in substantially offsetting the changes in cash flows of the hedgeable items at January 31, 2016. As of January 31, 2016, the total fair value of outstanding hedge instruments was a net liability of ($36,292). Fuel hedging instruments with a fair value of ($20,461) are classified on the Statements of Net Position as a component of current accounts payable and accrued liabilities. Long-term fuel hedges with a fair value of ($15,831) are classified as a component of other noncurrent liabilities. Consistent with hedge accounting treatment required for derivative instruments that are determined to be effective in offsetting changes in the cash flows of the hedged item, changes in fair value are reported as deferred (inflows) outflows of resources on the Statements of Net Position until the contract expiration that occurs in conjunction with the hedged expected fuel purchase transaction. When fuel hedging contracts expire, at the time the purchase transactions occur, the deferred balance is recorded as an adjustment to fuel expense. The deferred outflows of resources related to fuel hedges totaled $37,920 at January 31, 2016.
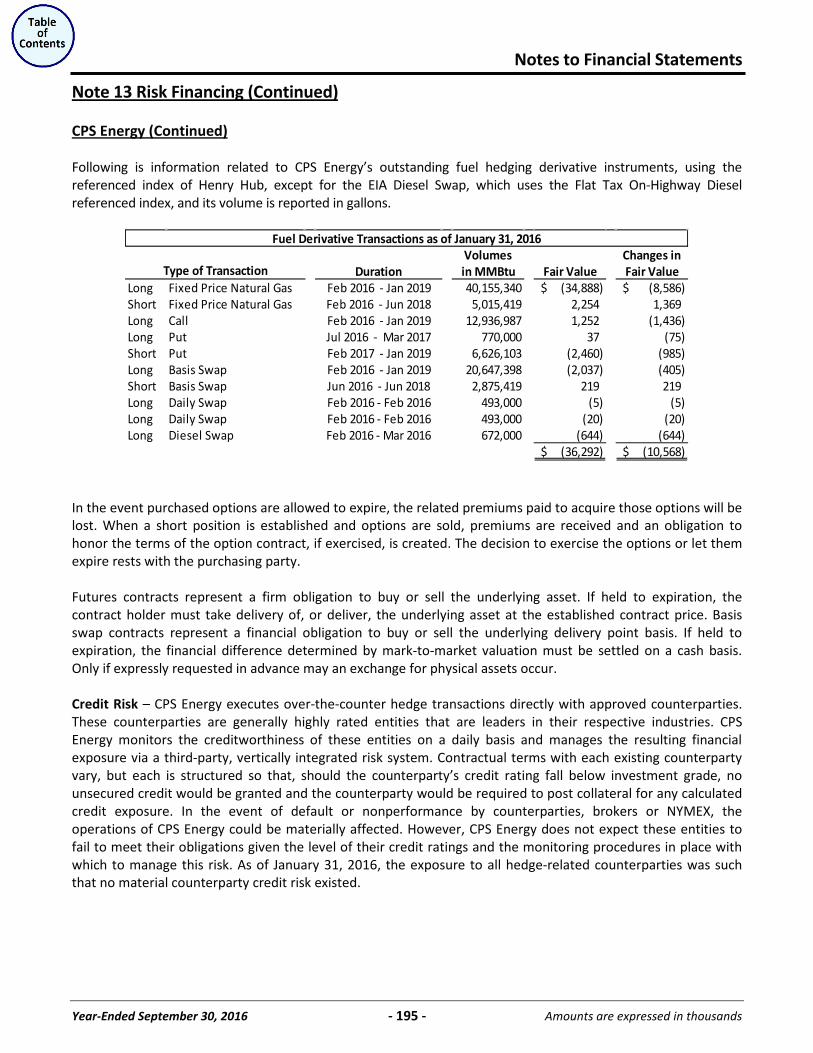
Notes to Financial Statements
Year-Ended September 30, 2016 - 195 - Amounts are expressed in thousands
Note 13 Risk Financing (Continued)
CPS Energy (Continued)
Following is information related to CPS Energy’s outstanding fuel hedging derivative instruments, using the referenced index of Henry Hub, except for the EIA Diesel Swap, which uses the Flat Tax On-Highway Diesel referenced index, and its volume is reported in gallons.
Volumes Changes inDuration in MMBtu Fair Value Fair Value
Long Fixed Price Natural Gas Feb 2016 - Jan 2019 40,155,340 (34,888)$ (8,586)$ Short Fixed Price Natural Gas Feb 2016 - Jun 2018 5,015,419 2,254 1,369 Long Call Feb 2016 - Jan 2019 12,936,987 1,252 (1,436) Long Put Jul 2016 - Mar 2017 770,000 37 (75) Short Put Feb 2017 - Jan 2019 6,626,103 (2,460) (985) Long Basis Swap Feb 2016 - Jan 2019 20,647,398 (2,037) (405) Short Basis Swap Jun 2016 - Jun 2018 2,875,419 219 219 Long Daily Swap Feb 2016 - Feb 2016 493,000 (5) (5) Long Daily Swap Feb 2016 - Feb 2016 493,000 (20) (20) Long Diesel Swap Feb 2016 - Mar 2016 672,000 (644) (644)
(36,292)$ (10,568)$
Type of Transaction
Fuel Derivative Transactions as of January 31, 2016
In the event purchased options are allowed to expire, the related premiums paid to acquire those options will be lost. When a short position is established and options are sold, premiums are received and an obligation to honor the terms of the option contract, if exercised, is created. The decision to exercise the options or let them expire rests with the purchasing party. Futures contracts represent a firm obligation to buy or sell the underlying asset. If held to expiration, the contract holder must take delivery of, or deliver, the underlying asset at the established contract price. Basis swap contracts represent a financial obligation to buy or sell the underlying delivery point basis. If held to expiration, the financial difference determined by mark-to-market valuation must be settled on a cash basis. Only if expressly requested in advance may an exchange for physical assets occur. Credit Risk – CPS Energy executes over-the-counter hedge transactions directly with approved counterparties. These counterparties are generally highly rated entities that are leaders in their respective industries. CPS Energy monitors the creditworthiness of these entities on a daily basis and manages the resulting financial exposure via a third-party, vertically integrated risk system. Contractual terms with each existing counterparty vary, but each is structured so that, should the counterparty’s credit rating fall below investment grade, no unsecured credit would be granted and the counterparty would be required to post collateral for any calculated credit exposure. In the event of default or nonperformance by counterparties, brokers or NYMEX, the operations of CPS Energy could be materially affected. However, CPS Energy does not expect these entities to fail to meet their obligations given the level of their credit ratings and the monitoring procedures in place with which to manage this risk. As of January 31, 2016, the exposure to all hedge-related counterparties was such that no material counterparty credit risk existed.
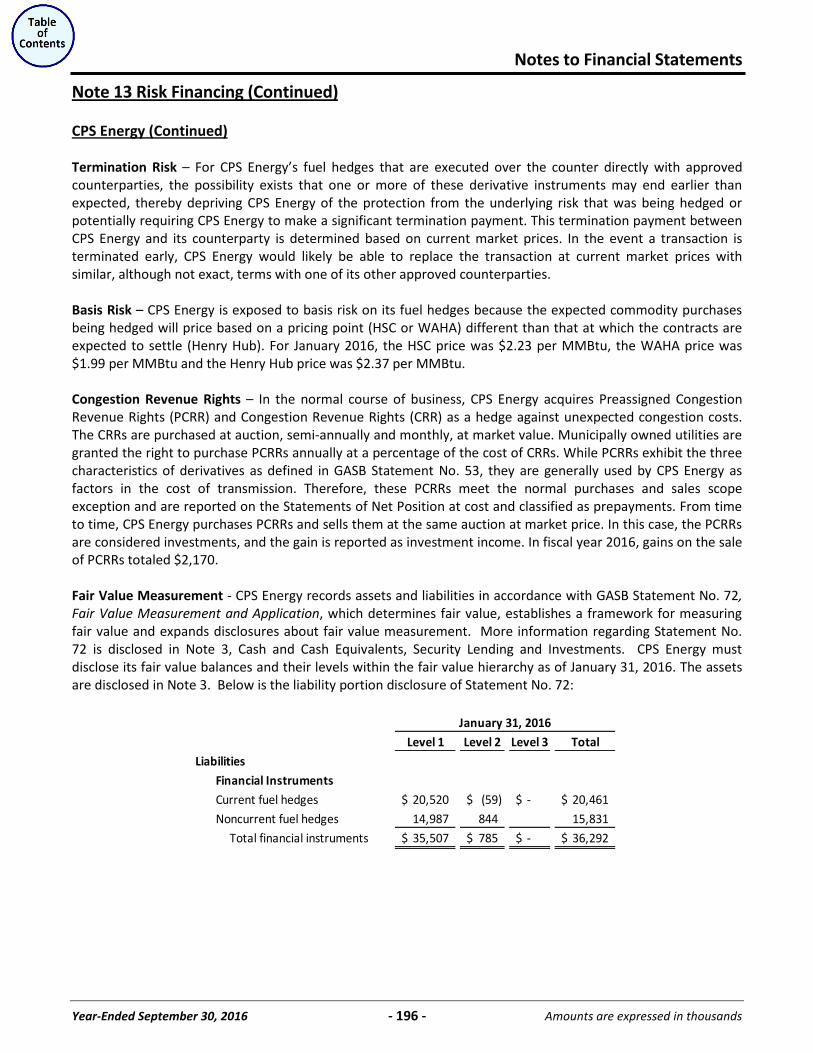
Notes to Financial Statements
Year-Ended September 30, 2016 - 196 - Amounts are expressed in thousands
Note 13 Risk Financing (Continued)
CPS Energy (Continued)
Termination Risk – For CPS Energy’s fuel hedges that are executed over the counter directly with approved counterparties, the possibility exists that one or more of these derivative instruments may end earlier than expected, thereby depriving CPS Energy of the protection from the underlying risk that was being hedged or potentially requiring CPS Energy to make a significant termination payment. This termination payment between CPS Energy and its counterparty is determined based on current market prices. In the event a transaction is terminated early, CPS Energy would likely be able to replace the transaction at current market prices with similar, although not exact, terms with one of its other approved counterparties. Basis Risk – CPS Energy is exposed to basis risk on its fuel hedges because the expected commodity purchases being hedged will price based on a pricing point (HSC or WAHA) different than that at which the contracts are expected to settle (Henry Hub). For January 2016, the HSC price was $2.23 per MMBtu, the WAHA price was $1.99 per MMBtu and the Henry Hub price was $2.37 per MMBtu. Congestion Revenue Rights – In the normal course of business, CPS Energy acquires Preassigned Congestion Revenue Rights (PCRR) and Congestion Revenue Rights (CRR) as a hedge against unexpected congestion costs. The CRRs are purchased at auction, semi-annually and monthly, at market value. Municipally owned utilities are granted the right to purchase PCRRs annually at a percentage of the cost of CRRs. While PCRRs exhibit the three characteristics of derivatives as defined in GASB Statement No. 53, they are generally used by CPS Energy as factors in the cost of transmission. Therefore, these PCRRs meet the normal purchases and sales scope exception and are reported on the Statements of Net Position at cost and classified as prepayments. From time to time, CPS Energy purchases PCRRs and sells them at the same auction at market price. In this case, the PCRRs are considered investments, and the gain is reported as investment income. In fiscal year 2016, gains on the sale of PCRRs totaled $2,170. Fair Value Measurement - CPS Energy records assets and liabilities in accordance with GASB Statement No. 72, Fair Value Measurement and Application, which determines fair value, establishes a framework for measuring fair value and expands disclosures about fair value measurement. More information regarding Statement No. 72 is disclosed in Note 3, Cash and Cash Equivalents, Security Lending and Investments. CPS Energy must disclose its fair value balances and their levels within the fair value hierarchy as of January 31, 2016. The assets are disclosed in Note 3. Below is the liability portion disclosure of Statement No. 72:
Level 1 Level 2 Level 3 TotalLiabilities
Financial InstrumentsCurrent fuel hedges 20,520$ (59)$ -$ 20,461$ Noncurrent fuel hedges 14,987 844 15,831 Total financial instruments 35,507$ 785$ -$ 36,292$
January 31, 2016
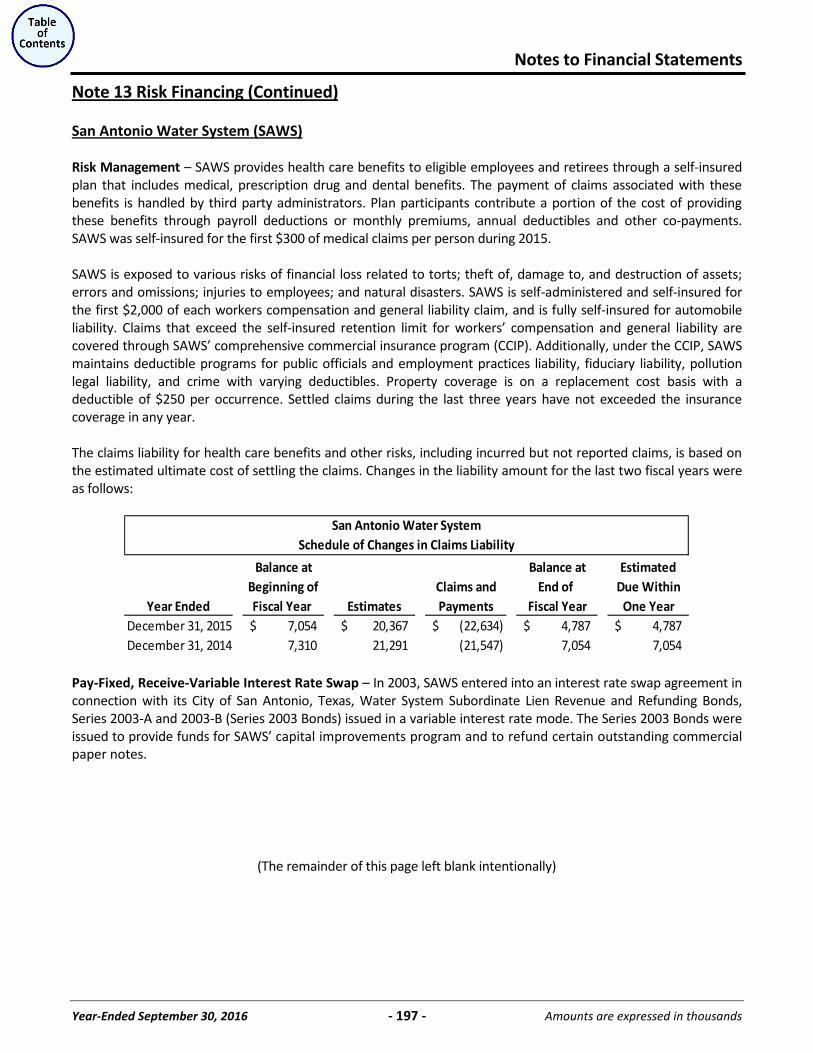
Notes to Financial Statements
Year-Ended September 30, 2016 - 197 - Amounts are expressed in thousands
Note 13 Risk Financing (Continued)
San Antonio Water System (SAWS)
Risk Management – SAWS provides health care benefits to eligible employees and retirees through a self-insured plan that includes medical, prescription drug and dental benefits. The payment of claims associated with these benefits is handled by third party administrators. Plan participants contribute a portion of the cost of providing these benefits through payroll deductions or monthly premiums, annual deductibles and other co-payments. SAWS was self-insured for the first $300 of medical claims per person during 2015. SAWS is exposed to various risks of financial loss related to torts; theft of, damage to, and destruction of assets; errors and omissions; injuries to employees; and natural disasters. SAWS is self-administered and self-insured for the first $2,000 of each workers compensation and general liability claim, and is fully self-insured for automobile liability. Claims that exceed the self-insured retention limit for workers’ compensation and general liability are covered through SAWS’ comprehensive commercial insurance program (CCIP). Additionally, under the CCIP, SAWS maintains deductible programs for public officials and employment practices liability, fiduciary liability, pollution legal liability, and crime with varying deductibles. Property coverage is on a replacement cost basis with a deductible of $250 per occurrence. Settled claims during the last three years have not exceeded the insurance coverage in any year. The claims liability for health care benefits and other risks, including incurred but not reported claims, is based on the estimated ultimate cost of settling the claims. Changes in the liability amount for the last two fiscal years were as follows:
Balance at Balance at EstimatedBeginning of Claims and End of Due Within
Year Ended Fiscal Year Estimates Payments Fiscal Year One YearDecember 31, 2015 7,054$ 20,367$ (22,634)$ 4,787$ 4,787$ December 31, 2014 7,310 21,291 (21,547) 7,054 7,054
San Antonio Water SystemSchedule of Changes in Claims Liability
Pay-Fixed, Receive-Variable Interest Rate Swap – In 2003, SAWS entered into an interest rate swap agreement in connection with its City of San Antonio, Texas, Water System Subordinate Lien Revenue and Refunding Bonds, Series 2003-A and 2003-B (Series 2003 Bonds) issued in a variable interest rate mode. The Series 2003 Bonds were issued to provide funds for SAWS’ capital improvements program and to refund certain outstanding commercial paper notes.
(The remainder of this page left blank intentionally)
Notes to Financial Statements
Year-Ended September 30, 2016 - 198 - Amounts are expressed in thousands
Note 13 Risk Financing (Continued)
San Antonio Water System (SAWS) (Continued)
The swap was used to hedge interest rates on the Series 2003 Bonds to a synthetic fixed rate that produced a lower interest rate cost than a traditional long-term fixed rate bond issued at that time. In August 2008, SAWS used commercial paper notes to redeem $110,615 of the $111,615 outstanding principal of the Series 2003 Bonds due to unfavorable market conditions relating to the ratings downgrade of the 2003 Bond insurer, MBIA Insurance Corporation. In 2009, SAWS redeemed the remaining $1,000 of the Series 2003 Bonds through the issuance of additional commercial paper. The interest rate swap agreement was not terminated upon the redemption of the 2003 Bonds and instead serves as an off-market hedge for that portion of the commercial paper notes outstanding which pertain to the redemption of the 2003 Bonds. SAWS currently intends to maintain a portion of its outstanding commercial paper in amounts matching the notional amounts of the swap. SAWS did not recognize any economic gain or loss as a result of this refunding since the debt service requirements of the commercial paper notes are expected to closely match the debt service requirements of the refunded debt. At December 31, 2015 $91,650 of commercial paper notes are hedged by the interest rate swap agreement. Terms – The swap agreement contains scheduled reductions to the outstanding notional amounts that are expected to follow the original scheduled reductions in the Series 2003 Bonds. The Series 2003 Bonds were issued on March 27, 2003, with a principal amount of $122,500. The swap agreement matures on May 1, 2033. At the time the swap was entered into, the counterparty was Bear Stearns Financial Products, Inc. (Bear Stearns FPI), with the index for the variable rate leg of the swap being the Securities Industry and Financial Markets Association Municipal Swap Index. In 2008, JPMorgan Chase & Co. announced its acquisition of The Bear Stearns Companies, Inc., the parent of Bear Stearns FPI. JPMorgan Chase & Co. has guaranteed the trading obligations of Bear Stearns and its subsidiaries. Effective June 16, 2009, the swap agreement was amended between SAWS, JPMorgan Chase & Co., and MBIA to provide for JPMorgan Chase Bank N.A. to become the swap counterparty and allow for the remainder of outstanding Series 2003 Bonds to be redeemed, while maintaining the swap agreement as an obligation to all parties. The amendment provides for the conditional release of MBIA’s swap insurance policy upon the occurrence of certain future events. The combination of commercial paper notes and a floating-to-fixed swap creates a synthetic fixed-rate of 4.2%. The synthetic fixed-rate protects against the potential of rising interest rates. Fair Value – The swap had a negative fair value of approximately $20,700 at December 31, 2015. This value was calculated using the zero-coupon method. This method calculates the future net settlement payments required by the swap, assuming that the current forward rates implied by the yield curve correctly anticipate future spot interest rates. These net payments are then discounted using the spot rates implied by the current yield curve for hypothetical zero-coupon bonds due on the date of each future net settlement on the swap. The swap agreement meets the criteria of an effective hedge under GASB Statement 53 and therefore qualifies for hedge accounting treatment. Since the fair value is negative, the fair value is recorded as a non-current liability. Changes in the swap’s fair value are recorded as a deferred outflow of resources and included on the Statement of Net Position. At the time the 2003 Bonds were redeemed in 2008, the fair value of the swap was negative $6,200. The deferred outflow at the time of redemption was included in the carrying value of the 2003 Bonds and resulted in a loss on redemption of $6,200. This loss is amortized over the remaining life of the 2003 Bonds. The unamortized deferred charge on bond refunding related to the swap was $4,266 at December 31, 2015.
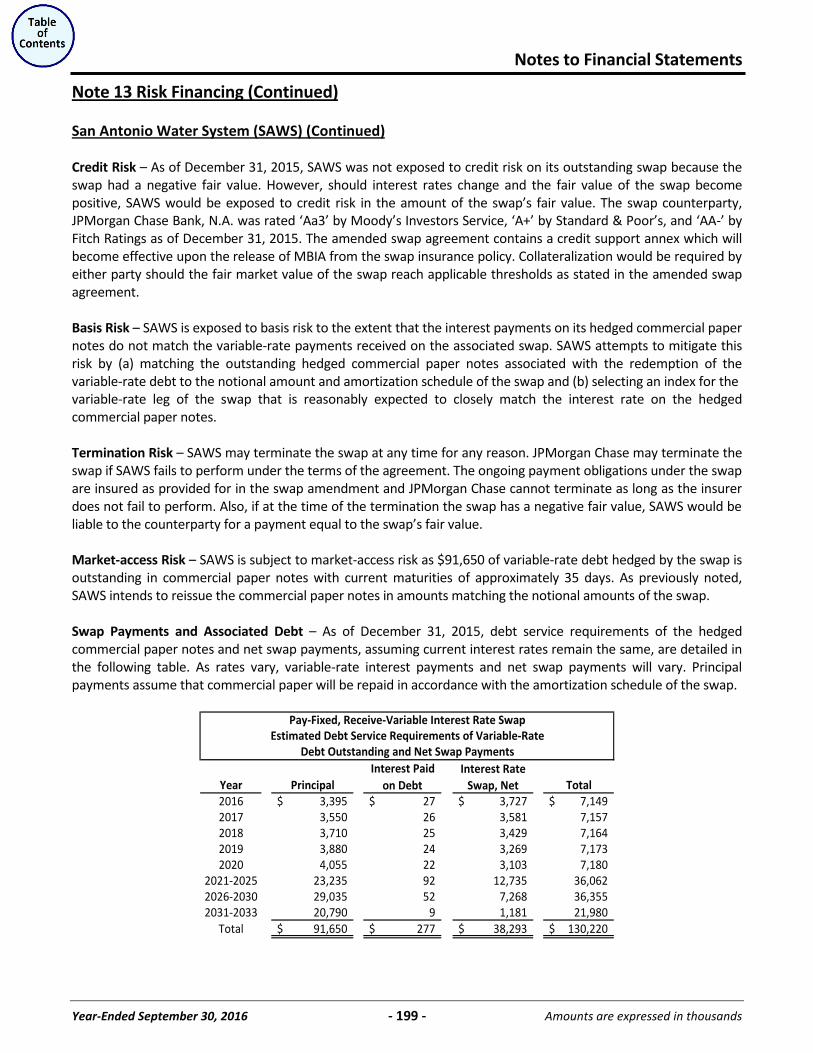
Notes to Financial Statements
Year-Ended September 30, 2016 - 199 - Amounts are expressed in thousands
Note 13 Risk Financing (Continued)
San Antonio Water System (SAWS) (Continued)
Credit Risk – As of December 31, 2015, SAWS was not exposed to credit risk on its outstanding swap because the swap had a negative fair value. However, should interest rates change and the fair value of the swap become positive, SAWS would be exposed to credit risk in the amount of the swap’s fair value. The swap counterparty, JPMorgan Chase Bank, N.A. was rated ‘Aa3’ by Moody’s Investors Service, ‘A+’ by Standard & Poor’s, and ‘AA-’ by Fitch Ratings as of December 31, 2015. The amended swap agreement contains a credit support annex which will become effective upon the release of MBIA from the swap insurance policy. Collateralization would be required by either party should the fair market value of the swap reach applicable thresholds as stated in the amended swap agreement. Basis Risk – SAWS is exposed to basis risk to the extent that the interest payments on its hedged commercial paper notes do not match the variable-rate payments received on the associated swap. SAWS attempts to mitigate this risk by (a) matching the outstanding hedged commercial paper notes associated with the redemption of the variable-rate debt to the notional amount and amortization schedule of the swap and (b) selecting an index for the variable-rate leg of the swap that is reasonably expected to closely match the interest rate on the hedged commercial paper notes. Termination Risk – SAWS may terminate the swap at any time for any reason. JPMorgan Chase may terminate the swap if SAWS fails to perform under the terms of the agreement. The ongoing payment obligations under the swap are insured as provided for in the swap amendment and JPMorgan Chase cannot terminate as long as the insurer does not fail to perform. Also, if at the time of the termination the swap has a negative fair value, SAWS would be liable to the counterparty for a payment equal to the swap’s fair value. Market-access Risk – SAWS is subject to market-access risk as $91,650 of variable-rate debt hedged by the swap is outstanding in commercial paper notes with current maturities of approximately 35 days. As previously noted, SAWS intends to reissue the commercial paper notes in amounts matching the notional amounts of the swap. Swap Payments and Associated Debt – As of December 31, 2015, debt service requirements of the hedged commercial paper notes and net swap payments, assuming current interest rates remain the same, are detailed in the following table. As rates vary, variable-rate interest payments and net swap payments will vary. Principal payments assume that commercial paper will be repaid in accordance with the amortization schedule of the swap.
Interest Paid Interest RateYear Principal on Debt Swap, Net Total2016 3,395$ 27$ 3,727$ 7,149$ 2017 3,550 26 3,581 7,157 2018 3,710 25 3,429 7,164 2019 3,880 24 3,269 7,173 2020 4,055 22 3,103 7,180
2021-2025 23,235 92 12,735 36,062 2026-2030 29,035 52 7,268 36,355 2031-2033 20,790 9 1,181 21,980
Total 91,650$ 277$ 38,293$ 130,220$
Pay-Fixed, Receive-Variable Interest Rate SwapEstimated Debt Service Requirements of Variable-Rate
Debt Outstanding and Net Swap Payments
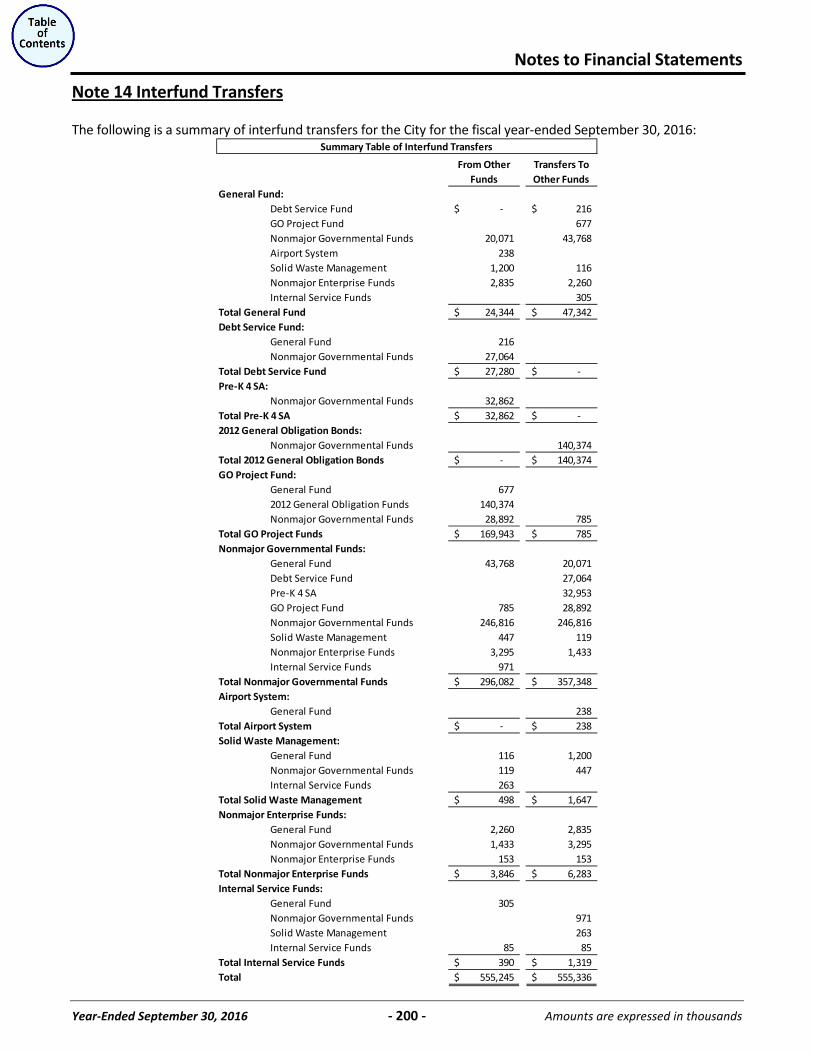
Notes to Financial Statements
Year-Ended September 30, 2016 - 200 - Amounts are expressed in thousands
Note 14 Interfund Transfers
The following is a summary of interfund transfers for the City for the fiscal year-ended September 30, 2016:
From Other Funds
Transfers To Other Funds
General Fund:Debt Service Fund -$ 216$ GO Project Fund 677 Nonmajor Governmental Funds 20,071 43,768 Airport System 238 Solid Waste Management 1,200 116 Nonmajor Enterprise Funds 2,835 2,260 Internal Service Funds 305
Total General Fund 24,344$ 47,342$ Debt Service Fund:
General Fund 216 Nonmajor Governmental Funds 27,064
Total Debt Service Fund 27,280$ -$ Pre-K 4 SA:
Nonmajor Governmental Funds 32,862 Total Pre-K 4 SA 32,862$ -$ 2012 General Obligation Bonds:
Nonmajor Governmental Funds 140,374 Total 2012 General Obligation Bonds -$ 140,374$ GO Project Fund:
General Fund 677 2012 General Obligation Funds 140,374 Nonmajor Governmental Funds 28,892 785
Total GO Project Funds 169,943$ 785$ Nonmajor Governmental Funds:
General Fund 43,768 20,071 Debt Service Fund 27,064 Pre-K 4 SA 32,953 GO Project Fund 785 28,892 Nonmajor Governmental Funds 246,816 246,816 Solid Waste Management 447 119 Nonmajor Enterprise Funds 3,295 1,433 Internal Service Funds 971
Total Nonmajor Governmental Funds 296,082$ 357,348$ Airport System:
General Fund 238 Total Airport System -$ 238$ Solid Waste Management:
General Fund 116 1,200 Nonmajor Governmental Funds 119 447 Internal Service Funds 263
Total Solid Waste Management 498$ 1,647$ Nonmajor Enterprise Funds:
General Fund 2,260 2,835 Nonmajor Governmental Funds 1,433 3,295 Nonmajor Enterprise Funds 153 153
Total Nonmajor Enterprise Funds 3,846$ 6,283$ Internal Service Funds:
General Fund 305 Nonmajor Governmental Funds 971 Solid Waste Management 263 Internal Service Funds 85 85
Total Internal Service Funds 390$ 1,319$ Total 555,245$ 555,336$
Summary Table of Interfund Transfers
Notes to Financial Statements
Year-Ended September 30, 2016 - 201 - Amounts are expressed in thousands
Note 14 Interfund Transfers (Continued)
Transfers are made to use unrestricted revenues collected in the General Fund to finance various programs accounted for in other funds. These transfers are in the form of operating subsidies, grant matches, and funding for capital projects. In addition, transfers are routinely made from other funds to fund debt service payments and for other restricted purposes. Some examples include the 1/8 cent sales and use tax are collected by the City and provided to Pre-K 4 SA for operations, 15% Hotel Occupancy Tax (HOT) collections are used to fund Historic Preservation which operates in the General Fund, and Bond proceeds are used to fund capital projects. All transfers are in accordance with budgetary authorizations. Different fiscal year-ends exist between the City and Pre-K 4 SA (September 30th and June 30th, respectively) therefore, interfund transfers do not eliminate by $91. In accordance with GASB Statement No. 33, Accounting and Financial Reporting for Nonexchange Transactions, the City’s transfer to Pre-K 4 SA represents its obligation to provide the 1/8 cents sales tax collected 60 days after September 30, 2016; however, Pre-K 4 SA’s due from other funds illustrates the City’s 1/8 cents sales tax collected 60 days after June 30, 2016. These transfers are in accordance with legislative and contractual requirements.
(The remainder of this page left blank intentionally)
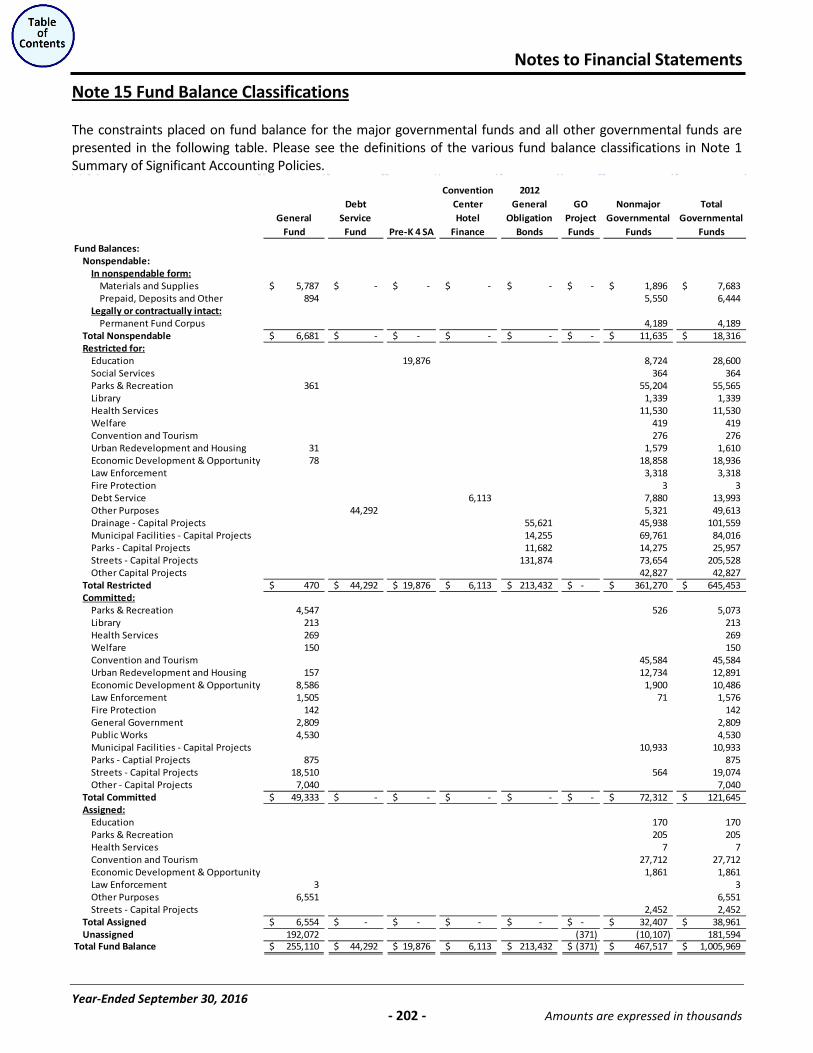
Notes to Financial Statements
Year-Ended September 30, 2016 - 202 - Amounts are expressed in thousands
Note 15 Fund Balance Classifications
The constraints placed on fund balance for the major governmental funds and all other governmental funds are presented in the following table. Please see the definitions of the various fund balance classifications in Note 1 Summary of Significant Accounting Policies.
General Fund
Debt Service
Fund Pre-K 4 SA
Convention Center Hotel
Finance
2012 General
Obligation Bonds
GO Project Funds
Nonmajor Governmental
Funds
Total Governmental
Funds
Fund Balances:Nonspendable:
In nonspendable form:Materials and Supplies 5,787$ -$ -$ -$ -$ -$ 1,896$ 7,683$ Prepaid, Deposits and Other 894 5,550 6,444
Legally or contractually intact:Permanent Fund Corpus 4,189 4,189
Total Nonspendable 6,681$ -$ -$ -$ -$ -$ 11,635$ 18,316$ Restricted for:
Education 19,876 8,724 28,600 Social Services 364 364 Parks & Recreation 361 55,204 55,565 Library 1,339 1,339 Health Services 11,530 11,530 Welfare 419 419 Convention and Tourism 276 276 Urban Redevelopment and Housing 31 1,579 1,610 Economic Development & Opportunity 78 18,858 18,936 Law Enforcement 3,318 3,318 Fire Protection 3 3 Debt Service 6,113 7,880 13,993 Other Purposes 44,292 5,321 49,613 Drainage - Capital Projects 55,621 45,938 101,559 Municipal Facilities - Capital Projects 14,255 69,761 84,016 Parks - Capital Projects 11,682 14,275 25,957 Streets - Capital Projects 131,874 73,654 205,528 Other Capital Projects 42,827 42,827
Total Restricted 470$ 44,292$ 19,876$ 6,113$ 213,432$ -$ 361,270$ 645,453$ Committed:
Parks & Recreation 4,547 526 5,073 Library 213 213 Health Services 269 269 Welfare 150 150 Convention and Tourism 45,584 45,584 Urban Redevelopment and Housing 157 12,734 12,891 Economic Development & Opportunity 8,586 1,900 10,486 Law Enforcement 1,505 71 1,576 Fire Protection 142 142 General Government 2,809 2,809 Public Works 4,530 4,530 Municipal Facilities - Capital Projects 10,933 10,933 Parks - Captial Projects 875 875 Streets - Capital Projects 18,510 564 19,074 Other - Capital Projects 7,040 7,040
Total Committed 49,333$ -$ -$ -$ -$ -$ 72,312$ 121,645$ Assigned:
Education 170 170 Parks & Recreation 205 205 Health Services 7 7 Convention and Tourism 27,712 27,712 Economic Development & Opportunity 1,861 1,861 Law Enforcement 3 3 Other Purposes 6,551 6,551 Streets - Capital Projects 2,452 2,452
Total Assigned 6,554$ -$ -$ -$ -$ -$ 32,407$ 38,961$ Unassigned 192,072 (371) (10,107) 181,594
Total Fund Balance 255,110$ 44,292$ 19,876$ 6,113$ 213,432$ (371)$ 467,517$ 1,005,969$
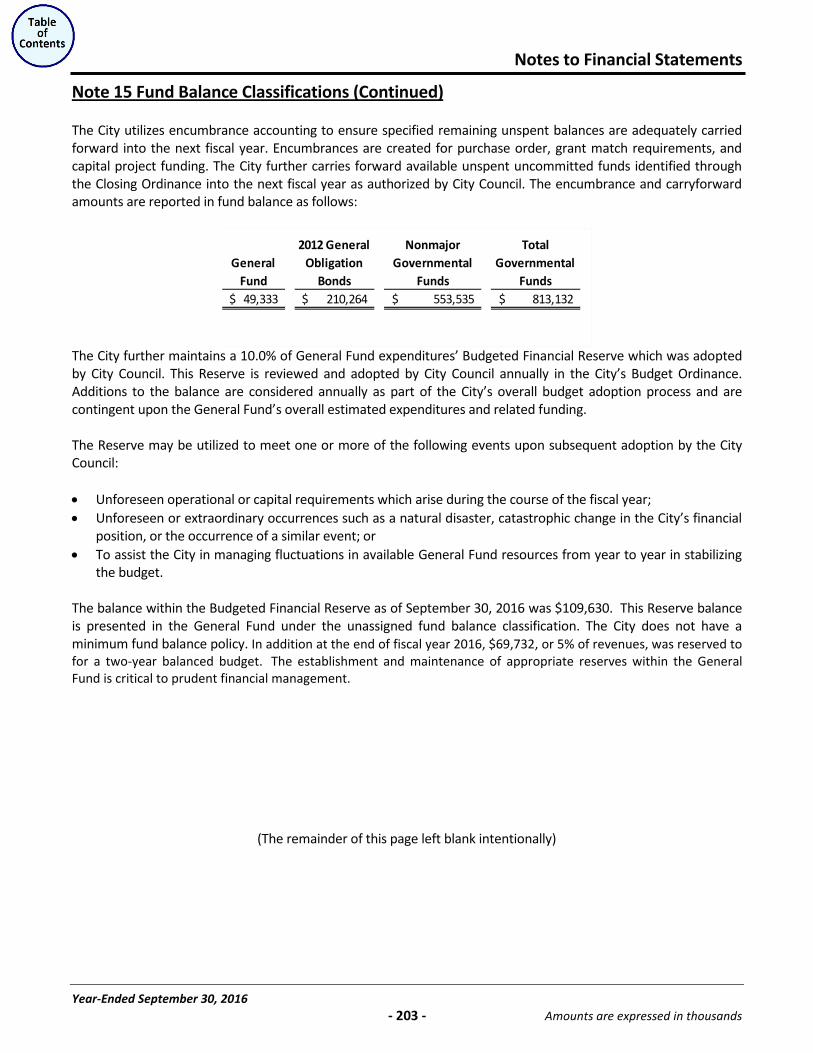
Notes to Financial Statements
Year-Ended September 30, 2016 - 203 - Amounts are expressed in thousands
Note 15 Fund Balance Classifications (Continued)
The City utilizes encumbrance accounting to ensure specified remaining unspent balances are adequately carried forward into the next fiscal year. Encumbrances are created for purchase order, grant match requirements, and capital project funding. The City further carries forward available unspent uncommitted funds identified through the Closing Ordinance into the next fiscal year as authorized by City Council. The encumbrance and carryforward amounts are reported in fund balance as follows:
General Fund
2012 General Obligation
Bonds
Nonmajor Governmental
Funds
Total Governmental
Funds49,333$ 210,264$ 553,535$ 813,132$
The City further maintains a 10.0% of General Fund expenditures’ Budgeted Financial Reserve which was adopted by City Council. This Reserve is reviewed and adopted by City Council annually in the City’s Budget Ordinance. Additions to the balance are considered annually as part of the City’s overall budget adoption process and are contingent upon the General Fund’s overall estimated expenditures and related funding. The Reserve may be utilized to meet one or more of the following events upon subsequent adoption by the City Council:
Unforeseen operational or capital requirements which arise during the course of the fiscal year; Unforeseen or extraordinary occurrences such as a natural disaster, catastrophic change in the City’s financial position, or the occurrence of a similar event; or To assist the City in managing fluctuations in available General Fund resources from year to year in stabilizing the budget.
The balance within the Budgeted Financial Reserve as of September 30, 2016 was $109,630. This Reserve balance is presented in the General Fund under the unassigned fund balance classification. The City does not have a minimum fund balance policy. In addition at the end of fiscal year 2016, $69,732, or 5% of revenues, was reserved to for a two-year balanced budget. The establishment and maintenance of appropriate reserves within the General Fund is critical to prudent financial management.
(The remainder of this page left blank intentionally)
Notes to Financial Statements
Year-Ended September 30, 2016 - 204 - Amounts are expressed in thousands
Note 16 Deficits in Fund Balances / Net Position
Grants
As of September 30, 2016, deficit fund balances are reported in the American Recovery and Reinvestment Act, Community Development Program, HOME Program, and HUD 108 Loan Program in the amounts of $125, $4,078, $15, and $506 respectively. These deficits are due to disallowed costs in various projects within each respective fund. The City through future budget adoptions will determine how to fund these deficits.
Capital Projects Funds
As of September 30, 2016, deficit fund balances are reported in the General Obligation Projects Fund, Certificates of Obligation Projects Fund, and Convention Center Expansion in the amounts of $371, $3,283, and $658 respectively. The major contribution of the projects deficits are the timing of invoices billed to third party contributors and sale of debt issuances to fund projects. The deficits will be addressed by transferring funds from future debt issuances with reimbursement resolutions, operating funds, grants, and/or by billing and collecting contributions from third party contributors. As of September 30, 2016, a deficit fund balance is reported in the Equipment Acquisition Fund in the amount of $84 this is attributed to a lease purchase of non-capitalized assets, this funding will be recouped in future years with operating dollars.
Enterprise Funds
As of September 30, 2016, deficit net positions are reported in Solid Waste Management and Development Services in the amounts of $19,380 and $9,136 respectively. The City does not currently prefund OPEB obligations nor the pension liability; as a result these funds will continue to exhibit an increasing deficit net position. The City will analyze the growing deficits and its funding policy at a future period. The Solid Waste deficit is also attributed to a lease purchase of non-capitalized assets, this funding will be recouped in future years with operating dollars.
Internal Service Funds
As of September 30, 2016, a deficit net position is reported in the Employee Health Benefits Fund in the amount of $22,944. The City plans to reduce the deficit over five years through a one time infusion of funding, changes to benefit options, sharing of premiums and additional plan design changes to avoid unsustainable increases in health costs. Since the City does not prefund OPEB obligations or the net pension liability, this fund will continue to exhibit an increasing deficit net position even with the plan modifications and funding noted above which will be analyzed at a future period. The City considers the Self-Insurance Program to include Employee Health Benefits Fund, Liability Insurance Reserve Fund, and Worker’s Compensation Fund. The Self-Insurance Program reports a positive $7,447 combined net position. As of September 30, 2016, a deficit net position is reported for Information Services in the amount of $31,692. The deficit is due to the fund not including long-term liabilities in its rate assessments. The City does not prefund OPEB obligations or the GASB Statement No. 68 pension liability; as a result this fund will continue to exhibit an increasing deficit net position which will be analyzed at a future period.
Notes to Financial Statements
Year-Ended September 30, 2016 - 205 - Amounts are expressed in thousands
Note 16 Deficits in Fund Balances / Net Position (Continued)
Internal Service Funds (Continued)
As of September 30, 2016, a deficit net position is reported in CIMS in the amount of $17,804. The deficit in CIMS is due to the fund not including long-term liabilities (OPEB, net pension liability, and Accrued Leave) in its rate assessments. Due to the fund’s GASB Statement No. 54 reclassification, accrued leave not previously recorded in the fund will now be incorporated in future assessments and fees. However, since the City does not prefund OPEB obligations or the GASB Statement No. 68 pension liability, this fund will continue to exhibit an increasing deficit net position which will be analyzed at a future period.
(The remainder of this page is left blank intentionally)
Notes to Financial Statements
Year-Ended September 30, 2016 - 206 - Amounts are expressed in thousands
Note 17 Other Disclosures
Primary Government (City)
Donor Restricted Endowment The City has four Permanent Funds: Carver Cultural Center Endowment, City Cemeteries, William C. Morris Endowment, and Boza Becica Endowment. The City is only allowed to spend interest proceeds generated from the principal amount for each of these funds. The City’s endowments’ spending policy for authorizing and spending investment income is a total return policy. Income will include not only interest and dividends, but also include increase and/or decreases in the market value of the endowed assets, if applicable. Market value fluctuations are included as an integral part of investment returns. The net assets from these endowment funds are reported in the government-wide financial statements. The Carver Cultural Center Endowment Fund generated $1 in investment earnings. These earnings can be used for the Carver Community Cultural Center’s operating program, or reinvestment expenses (as detailed in the grant agreement). This fund is managed in accordance with the Uniform Prudent Management of Institutional Funds Act, which is codified as Section 163.001 in the Texas Property Code. The principal portion of the fund came from a one-time grant from the National Endowment for the Arts. The City Cemeteries Fund generated $13 in investment earnings to be expended for specified purposes. Chapter 713 of the Texas Health and Safety Code governs what expenditures the City may incur when spending the interest income. Per Chapter 713, the revenue can be spent for the maintenance and care of the graves, lots, and burial places, and to beautify the entire cemetery. The principal amount of this fund is increased each year by sales of lots from the San Jose Cemetery. The principal is required to be retained in perpetuity. The William C. Morris Endowment Fund generated $1 in investment earnings. These earnings are used on an annual basis to enhance educational programming and services for children provided at the City libraries. The earnings of the funds will be expended in accordance with the spending policy of the Library’s Board of Directors or Trustees. The Boza Becica Endowment Fund generated $2 in investment earnings. These earnings will be used for the acquisition of books and materials for the San Antonio Public Library in accordance with the terms and conditions of the Last Will and Testament of Boza Becica. The principal is required to be retained in perpetuity. Service Concession Agreements
The City has a fixed term agreement with Mission Park in which Mission Park pays the City 40.0% of burial plot sales and 10.0% of revenue from services, merchandise and products for the life of the contract (December 2035 with option to renew). All capital improvements become property of the City and the City retains ownership of the property after the contract expires. All permanent improvements of material nature have to be approved by the City. The City approves the rates and services Mission Park will provide. Mission Park collects all fees and pays the City its portion. The assets include 84 acres acquired at a value of $1,820. The City received an upfront payment of $130 in fiscal year 2011. In fiscal year 2016, the City received $270 in revenue from Mission Park. The City has a Management Agreement with MGA-SA. In the agreement, MGA-SA manages the City’s golf courses and in return, the City received $150 in profit-sharing in fiscal year 2016. All permanent structures existing on the golf courses and those added during the term of the agreement are property of the City. The City determines and/or approves of the services provided to the public. The assets include eight golf courses valued at $35,791.
Notes to Financial Statements
Year-Ended September 30, 2016 - 207 - Amounts are expressed in thousands
Note 18 Prior Period Restatement
Primary Government (City)
Airport System In fiscal year 2015 the City issued $123,900 in revenue bonds for the construction of a consolidated airport rental car facility (CONRAC). The bond proceeds are held in the City’s name with a trustee who approves reimbursements for project costs related to the CONRAC facility. In fiscal year 2015 the City accrued $12,594 in revenue for outstanding trustee reimbursements at fiscal year-end. Since the City also reported these assets under restricted cash and cash equivalents in the Airport System’s fund financials, these revenues were overstated. The net position at the beginning of the year for both the Airport System and Business – Type Activities was restated by $12,594. San Antonio Economic Development Corporation Net position at the beginning of the year was adjusted due to the impact of GASB Statement No. 72, Fair Value Measurements and Applications. The restated net position of $706 includes the prior year adjustment of $150. Urban Renewal Agency (OUR SA) Net position at the beginning of the year was restated by $1,768 to account for assets held by the trustee. The restatement primarily includes changes to cash and inventory improvements.
Discretely Presented Component Units
San Antonio Water System (SAWS)
Effective January 1, 2015, SAWS adopted GASB Statement No. 68, Accounting and Financial Reporting for Pensions – An Amendment of GASB Statement No. 27 and GASB Statement No. 71, Pension Transition for Contributions Made Subsequent to the Measurement Date – An Amendment to GASB Statement No. 68. In accordance with these pronouncements, SAWS recorded a charge to unrestricted net position as of January 1, 2015 of $31,373 to reflect the Net Pension Liability for SAWS defined benefit plans. Sufficient data was not available for the pension plans to restate the financial statements for the year ended December 31, 2014, therefore, as permitted by GASB Statement No. 68, only the financial statement information for the year ended December 31, 2015 reflects the requirements of these new accounting rules for pensions. SAWS DSP In accordance with pronouncements of GASB Statement No. 68, Accounting and Financial Reporting for Pensions, SAWS DSP recorded a charge to unrestricted net position as of January 1, 2015 of $775 to reflect the Net Pension Liability for the SAWS DSP defined benefit plan. San Antonio Housing Trust Foundation Inc (SAHTF) A prior period adjustment was made in the amount of $7 to adjust for an assets not owned by SAHFT. The adjustment resulted in the decrease of $7 to net assets.

Notes to Financial Statements
Year-Ended September 30, 2016 - 208 - Amounts are expressed in thousands
Note 19 Subsequent Events
Long-Term Debt
Primary Government (City)
On December 19, 2016, the City issued $47,000 in Combination Tax and Revenue Certificates of Obligation, Taxable Series 2016 with an expected maturity date of February 1, 2046. The Certificates were issued to finance the costs related to the acquisition of the Frost Tower and Frost Parking Garage. The City purchased the Frost Bank Tower and the Frost Parking Garage to serve as a consolidated office tower and garage for City operations for a total purchase price of $51,020. The difference between the amount issued and the purchase price was funded with a prepaid purchase portion held in escrow. The City has assumed the leases at Frost Tower with the current tenants. The Frost Tower will consolidate over 1,300 (not in thousands) City employees into the upgraded facility by 2020.
BABs Subsidy Sequestration
Pursuant to the requirements of the Balanced Budget and Emergency Deficit Control Act of 1985, as amended, the federal government will reduce the BABs subsidy by 6.9% for payments to be made during the period beginning October 1, 2016, through the end of their fiscal year (September 30, 2017). There is still uncertainty regarding whether or not the reduction will continue after that date. The subsidy reduction for fiscal year 2017 will result in an approximate $264 increase in the City’s debt-related interest expense.
2017 Bond Program
In May 2017, San Antonio residents will consider an $850,000 municipal bond program. Prior to the approval, City Council appointed committee members to each of the five citizen bond committees that met from October through December 2016, and reviewed potential projects and made recommendations to the Mayor and City Council. Categories include streets bridges and sidewalks, drainage and flood control, parks and recreation, facilities, and neighborhood improvements. The Mayor and City Council were presented and approved the final list of recommended projects in January 2017. The proposed program will be considered by San Antonio voters on May 6, 2017.
Annexation
As part of the of a growing residential area along Interstate 10 West (I-10 West), the City will develop a service plan in fiscal year 2017 for the provision of City services to the I-10 West area. This includes approximately 15 square miles of the I-10 West area (both commercial and residential) with the annexation anticipated to be effective by October 2019. City Council will vote to add the I-10 West area to the City during this time. Until then, residents in these areas will not pay city taxes.
On December 1, 2016, City Council approved the annexation of the U.S. 281 Commercial Corridor consisting of approximately 1.9 square miles. The annexation area’s primary existing land use is commercial and agricultural. The City will provide full municipal services including, but not limited to, police, fire, and emergency medical services. The annexation was effective December 31, 2016.
Visit San Antonio
On October 1, 2016, City Council legally adopted to spin off Convention and Visitors Bureau (CVB) into Visit San Antonio (VSA) (a component unit). VSA personnel began transitioning into the new organization in January 2017, and the process will be completed by October 2017. The restructuring allows VSA to supplement the City’s Hotel Occupancy Tax funds with funds from the private sector. The funds could include corporate sponsors, memberships, partnerships, and advertising dollars to increase the marketing activity in San Antonio.
Notes to Financial Statements
Year-Ended September 30, 2016 - 209 - Amounts are expressed in thousands
Note 19 Subsequent Events (Continued)
Collective Bargaining Agreements
Primary Government (City) (Continued)
The collective bargaining agreement between the City and the International Association of Fire Local 624 (IAFF) expired September 30, 2014, with refusal for negotiations by the IAFF pursuant to the bargaining process. The parties continue to operate under the terms of agreement with a challenge by the City to the evergreen clause which purports to extend the agreement through September 30, 2024. The City filed a lawsuit questioning the constitutionality of the evergreen clause and on October 13, 2016, the Fourth Court of Appeals ordered the IAFF and the City to mediate. The parties continue to mediate as a result of the Court's order.
Long-Term Debt
CPS Energy
On July 28, 2016, CPS Energy issued $544,260 of New Series 2016 Senior Lien Revenue Refunding Bonds. Proceeds were used to refund $243,485 and $365,550 par value of the New Series 2008 Revenue Bonds with New Series 2009A Revenue Refunding Bonds, respectively. The true interest cost for this issue, which has maturities in 2020 through 2034, is 2.1%.
On December 1, 2016, CPS Energy remarketed $47,500 of Series 2012C Variable-Rate Junior Lien Revenue Refunding Bonds. The issuance of a $466 premium in conjunction with the remarketing resulted in principle paydown for the remarketed bonds of approximately $160. The bonds have maturities in 2024 through 2027. The true interest cost for the remarketed bonds is 6.4%.
On December 14, 2016, CPS Energy remarketed $124,555 of Series 2015A Variable-Rate Junior Lien Revenue Refunding Bonds. The issuance of a $1,070 premium in conjunction with the remarketing resulted in principle paydown for the remarketed bonds of approximately $367. The true interest cost for the remarketed bonds, which has maturities in 2029 through 2033, is 6.29%.
Flexible Rate Revolving Note
On December 26, 2016, the $25,200 taxable Flexible Rate Revolving Note was renewed through December 26, 2017, but through an annual renewal process may be extended through November 1, 2028, the final maturity date of the Program.
Commercial Paper and Related Revolving Credit Agreements
Effective June 15, 2016, CPS Energy executed the First Amendment to the City’s Electric and Gas Systems Commercial Paper Notes, Series B and the Second Amendment to the Commercial Paper Notes, Series C agreements extending $225,000 and $225,000, respectively, in liquidity support for the Series B and Series C Notes to June, 21, 2019.
Effective January 25, 2017, CPS Energy executed the Second Amendment to the City’s Electric and Gas Systems Commercial Paper Notes, Series A agreement extending $150,000 in liquidity support for the Series A Notes to February 6, 2019.
Notes to Financial Statements
Year-Ended September 30, 2016 - 210 - Amounts are expressed in thousands
Note 19 Subsequent Events (Continued)
SunEdison Inc. Bankruptcy
CPS Energy (Continued)
On April 21, 2016, SunEdison Inc. (SunEdison) filed for Chapter 11 bankruptcy protection. SunEdison served until 2012 as CPS Energy’s counterparty in a prepaid renewable purchased power transaction from 30 MW of solar power generation facilities constructed by SunEdison. This power is supplied by three separate 10 MW facilities, each built on different sites. In 2012, the facilities were sold by SunEdison to San Antonio Solar Holdings LLC. SunEdison, however, retained ownership of the land for one of these sites and has continued as operator of each of the facilities under an agreement with San Antonio Solar Holdings LLC. CPS Energy does not have any remaining agreements directly with SunEdison and has determined that this event is not expected to have a material impact on its prepaid transaction. Please refer to Note 11 Commitments and Contingencies, for additional discussion of CPS Energy’s prepaid renewable power transaction.
SAWS DSP
San Antonio Water System (SAWS)
On January 14, 2016, City Council approved the dissolution of SAWS DSP upon the refunding of all SAWS DSP outstanding debt with SAWS debt. With the two debt transactions described below, all SAWS DSP debt was effectively retired and SAWS DSP was dissolved. In accordance with GASB Statement No. 69, Government Combinations and Disposals of Government Operations, the dissolution of SAWS DSP and transfer of SAWS DSP assets and liabilities to SAWS will be accounted for as a government merger. Accordingly, SAWS recorded the transferred assets and liabilities at the DSP’s carrying value as of January 1, 2016.
Long-Term Debt
On February 25, 2016, SAWS issued $173,565 City of San Antonio, Texas Water System Junior Lien Revenue Refunding Bonds, Series 2016A and $42,775 City of San Antonio, Texas Water System Junior Lien Revenue Refunding Bonds, Taxable Series 2016B. The proceeds from the sale of bonds were used to refund the outstanding SAWS DSP bonds as a necessary step toward final and complete integration of the former BexarMet into SAWS, which also resulted in debt service savings, advance refund a portion of the City of San Antonio, Texas Water System Revenue Refunding Bonds, Series 2007 for debt service savings, and pay the cost of issuance.
At the same time, SAWS issued $88,700 under its Tax-Exempt Commercial Paper Program to retire the SAWS DSP Flexible Rate Revolving Note Program. There was no economic gain or loss on this transaction.
On November 1, 2016, SAWS issued $305,065 City of San Antonio, Texas Water System Revenue and Refunding Bonds, Series 2016C (No Reserve Fund). The proceeds from the sale of the bonds were used to (i) advance refund a portion of the City of San Antonio, Texas Water System Revenue Refunding Bonds, Series 2007 (Series 2007), (ii) advance refund a portion of the City of San Antonio, Texas Water System Revenue and Refunding Bonds, Series 2009 (Series 2009), (iii) finance capital improvements and (iv) pay the cost of issuance. The refunding of the Series 2007 and Series 2009 bonds reduced total future debt service payments by approximately $45,300 and resulted in an economic gain of $33,200. The bonds are secured together with other outstanding Junior Lien Obligations solely by a lien on a pledge of net revenues and are subordinate to outstanding Senior Lien Obligations.
Notes to Financial Statements
Year-Ended September 30, 2016 - 211 - Amounts are expressed in thousands
Note 19 Subsequent Events (Continued)
Long Term Debt (Continued)
San Antonio Water System (SAWS) (Continued)
On November 1, 2016, SAWS remarketed $98,795 City of San Antonio, Texas Water System Variable Rate Junior Lien Revenue and Refunding Bonds, Series 2013F Bonds (No Reserve Fund) into a Fixed Rate Mode for a period of five years, ending October 31, 2021. The proceeds from the sale of the bonds were used to (i) pay the principal of the maturity bonds, and (ii) pay the cost of issuance. The bonds are secured together with other outstanding Junior Lien Obligations solely by a lien on a pledge of net revenues and are subordinate to outstanding Senior Lien Obligations. There was no economic gain or loss on this transaction.
On December 15, 2016, SAWS issued $12,500 City of San Antonio, Texas Water System Junior Lien Revenue Bonds, Series 2016D through the Texas Water Development Board. The bonds were sold under the Drinking Water State Revolving Fund Program. The proceeds from the sale of the bonds were used to (i) finance capital improvement projects which qualify under the Texas Water Development Board Program, and (ii) pay the cost of issuance. The bonds are secured together with other outstanding Junior Lien Obligations solely by a lien on a pledge of net revenues and are subordinate to outstanding Senior Lien Obligations.
On December 15, 2016, SAWS issued $14,360 City of San Antonio, Texas Water System Junior Lien Revenue Bonds, Series 2016E through the Texas Water Development Board. The bonds were sold under the Clean Water State Revolving Fund Program. The proceeds from the sale of the bonds were used to (i) finance capital improvement projects which qualify under the Texas Water Development Board Program, and (ii) pay the cost of issuance. The bonds are secured together with other outstanding Junior Lien Obligations solely by a lien on a pledge of net revenues and are subordinate to outstanding Senior Lien Obligations.
On February 28, 2017, SAWS issued $90,915 City of San Antonio, Texas Water System Revenue Refunding Bonds, Series 2017A (No Reserve Fund). The proceeds from the sale of the bonds were used to (i) refund the remaining City of San Antonio, Texas Water System Revenue Refunding Bonds, Series 2007 (Series 2007), (ii) refund a portion of the City of San Antonio, Texas Water System Junior Lien Revenue and Refunding Bonds, Series 2007A (Series 2007A), and (iii) pay the cost of issuance. The refunding of the Series 2007 and Series 2007A bonds reduced total future debt service payments by approximately $9,900 and resulted in an economic gain of $7,500. The bonds are secured together with other outstanding Junior Lien Obligations solely by a lien on a pledge of net revenues and are subordinate to outstanding Senior Lien Obligations.
Rate Increase
On November 19, 2015, the City Council approved a maximum increase in SAWS water and sewer rates of 7.9% for 2017. On December 14, 2017, SAWS Board approved water and sewer rate adjustments averaging 6.8% beginning January 1, 2017. Because the adjustments were below the maximum adjustments approved by City Council in November 2015, no further City Council action was required.
Vista Ridge Bankruptcy
On March 28, 2016, Abengoa reported that it had obtained backing from 75.0% of its creditors for a seven-month standstill agreement, which it filed with the court in Seville, Spain as it seeks more time to restructure its debt, and avoiding filing for insolvency. In addition, it was reported on March 29th, that Abengoa filed for Chapter 15 bankruptcy protection in the United States Bankruptcy Court in Wilmington, Delaware while it continues discussions with banks and bondholders on its restructuring plan. The Chapter 15 filing is a natural extension of the existing pre-insolvency proceeding in Spain. If approved, it is recognition of the Spanish proceeding by the United States Bankruptcy Court, and will afford certain protections to Abengoa under United States Bankruptcy laws. The Chapter 15 filing has no direct impact on SAWS’ rights and obligations.
Notes to Financial Statements
Year-Ended September 30, 2016 - 212 - Amounts are expressed in thousands
Note 19 Subsequent Events (Continued)
Vista Ridge Bankruptcy (Continued)
San Antonio Water System (SAWS) (Continued)
On May 17, 2016, SAWS exercised its contractual right to fix the Capital and Raw Groundwater Unit Price under the Agreement based on the methodology provided for therein. This action reduced the price of the Project Water component of SAWS annual payment requirement from the possible maximum amount of $1,959 per acre foot to $1,606 per acre foot, which will remain fixed for the entire 30 year term (and any extension of that term) of the Agreement. This action results in savings to SAWS of more than $17,000 per year and more than $529,000 over the maximum that could have been charged under the 30 year term of the Agreement.
On May 18, 2016, the Board approved a 2016 Amendment to the Agreement which includes approval of the transfer to Garney of the Transferred Project Company Interest and other miscellaneous and conforming amendments to the Agreement, approved other related agreements, including a Project Real Property Conveyance Agreement between SAWS and the Central Texas Regional Water Supply Corporation, and authorized the President and Chief Executive Officer, upon determining that all necessary prerequisites have occurred, to undertake all necessary actions and execute the 2016 Amendment (which occurred contemporaneously with the closing under the Equity Purchase Agreement). Nothing in the 2016 Amendment changes the Agreement structure described above.
On November 1, 2016, the SAWS Board of Trustees approved a second amendment to the Agreement (the “Second 2016 Amendment”) to accommodate the declaration of financial closure under the Agreement. Once again, the SAWS Board of Trustees authorized the SAWS President and Chief Executive Officer to approve the effectiveness of the Second 2016 Amendment upon prior confirmation of satisfaction of necessary prerequisites. The Second 2016 Amendment was made effective on November 2, 2016, concurrent with a declaration of financial closure under the Agreement, as amended by the First 2016 Amendment and the Second 2016 Amendment. The Second 2016 Amendment also contemplated finalization of infrastructure related to the Connection Point and selection of an operating service provider to operate the Project during the “operational phase” of the Project. Neither the First 2016 Amendment nor the Second 2016 Amendment altered the Agreement’s structure or provisions in a manner that differs from its description provided above.
Accordingly, Garney now owns an 80.0% equity stake in and all control rights of Abengoa VR. Abengoa Parent affiliate, Abengoa Water retains its silent 20.0% equity interest in Abengoa VR. Garney has indicated an interest in finding a long term operating service provider, potentially in conjunction with a future equity sale. SAWS will continue to have approval rights of any equity sale that results in Garney not controlling a majority interest in the Abengoa VR, and selection of any operating service provider under the Agreement.
Mitchell Lake
SAWS operates the Mitchell Lake Site Wastewater Treatment Facility pursuant to a Texas Pollutant Discharge Elimination Permit issued by the TCEQ under a delegation of authority from the EPA (the Permit). In October 2015, during the presentation of SAWS’ annual report, the EPA orally notified SAWS that SAWS violated the effluent discharge limitations of that Permit as a result of discharges occurring during significant rainfall events. The EPA stated that it would likely issue a Notice of Violation to SAWS for these alleged violations. On August 18, 2016, SAWS received an Administrative Order from EPA that alleges that SAWS violated the Permit by failing to meet effluent limits as required by the Permit. SAWS responded to the Administrative Order within the time required by the Order on September 15, 2016. SAWS does not know what actions may ultimately be required or the costs associated with those actions.

REQUIRED SUPPLEMENTARY INFORMATION
REQUIREDSUPPLEMENTARYINFORMATION
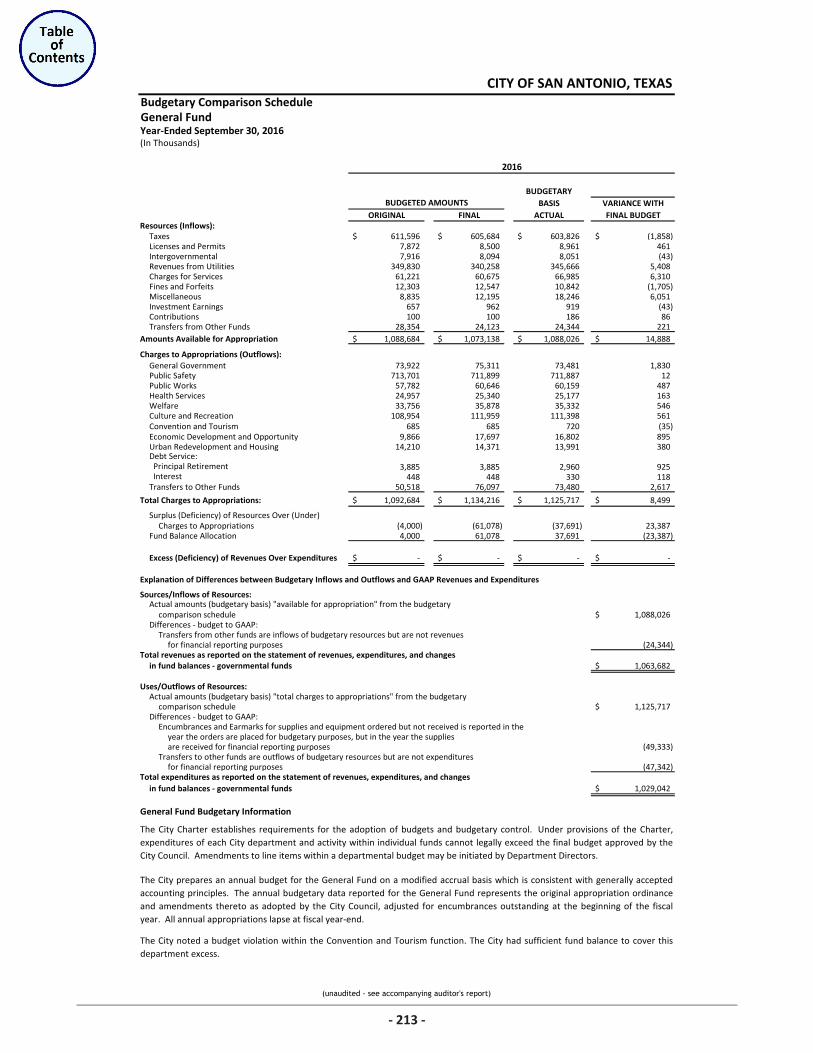
(unaudited - see accompanying auditor's report)
Budgetary Comparison ScheduleGeneral Fund
BUDGETARYBASIS VARIANCE WITH
ORIGINAL FINAL ACTUAL FINAL BUDGET
Taxes 611,596$ 605,684$ 603,826$ (1,858)$ Licenses and Permits 7,872 8,500 8,961 461 Intergovernmental 7,916 8,094 8,051 (43) Revenues from Utilities 349,830 340,258 345,666 5,408 Charges for Services 61,221 60,675 66,985 6,310 Fines and Forfeits 12,303 12,547 10,842 (1,705) Miscellaneous 8,835 12,195 18,246 6,051 Investment Earnings 657 962 919 (43) Contributions 100 100 186 86 Transfers from Other Funds 28,354 24,123 24,344 221
Amounts Available for Appropriation 1,088,684$ 1,073,138$ 1,088,026$ 14,888$
Charges to Appropriations (Outflows):General Government 73,922 75,311 73,481 1,830 Public Safety 713,701 711,899 711,887 12 Public Works 57,782 60,646 60,159 487 Health Services 24,957 25,340 25,177 163 Welfare 33,756 35,878 35,332 546 Culture and Recreation 108,954 111,959 111,398 561 Convention and Tourism 685 685 720 (35) Economic Development and Opportunity 9,866 17,697 16,802 895 Urban Redevelopment and Housing 14,210 14,371 13,991 380 Debt Service: Principal Retirement 3,885 3,885 2,960 925 Interest 448 448 330 118 Transfers to Other Funds 50,518 76,097 73,480 2,617
Total Charges to Appropriations: 1,092,684$ 1,134,216$ 1,125,717$ 8,499$
Charges to Appropriations (4,000) (61,078) (37,691) 23,387
Fund Balance Allocation 4,000 61,078 37,691 (23,387)
Excess (Deficiency) of Revenues Over Expenditures -$ -$ -$ -$
Explanation of Differences between Budgetary Inflows and Outflows and GAAP Revenues and Expenditures
Sources/Inflows of Resources:
comparison schedule 1,088,026$ Differences - budget to GAAP:
Transfers from other funds are inflows of budgetary resources but are not revenuesfor financial reporting purposes (24,344)
Total revenues as reported on the statement of revenues, expenditures, and changesin fund balances - governmental funds 1,063,682$
Uses/Outflows of Resources:Actual amounts (budgetary basis) "total charges to appropriations" from the budgetary
comparison schedule 1,125,717$ Differences - budget to GAAP:
Encumbrances and Earmarks for supplies and equipment ordered but not received is reported in the year the orders are placed for budgetary purposes, but in the year the supplies are received for financial reporting purposes (49,333)
Transfers to other funds are outflows of budgetary resources but are not expendituresfor financial reporting purposes (47,342)
Total expenditures as reported on the statement of revenues, expenditures, and changesin fund balances - governmental funds 1,029,042$
General Fund Budgetary Information
Surplus (Deficiency) of Resources Over (Under)
Actual amounts (budgetary basis) "available for appropriation" from the budgetary
The City Charter establishes requirements for the adoption of budgets and budgetary control. Under provisions of the Charter,expenditures of each City department and activity within individual funds cannot legally exceed the final budget approved by theCity Council. Amendments to line items within a departmental budget may be initiated by Department Directors.
The City prepares an annual budget for the General Fund on a modified accrual basis which is consistent with generally acceptedaccounting principles. The annual budgetary data reported for the General Fund represents the original appropriation ordinanceand amendments thereto as adopted by the City Council, adjusted for encumbrances outstanding at the beginning of the fiscalyear. All annual appropriations lapse at fiscal year-end.
The City noted a budget violation within the Convention and Tourism function. The City had sufficient fund balance to cover thisdepartment excess.
Resources (Inflows):
CITY OF SAN ANTONIO, TEXAS
Year-Ended September 30, 2016(In Thousands)
2016
BUDGETED AMOUNTS
213
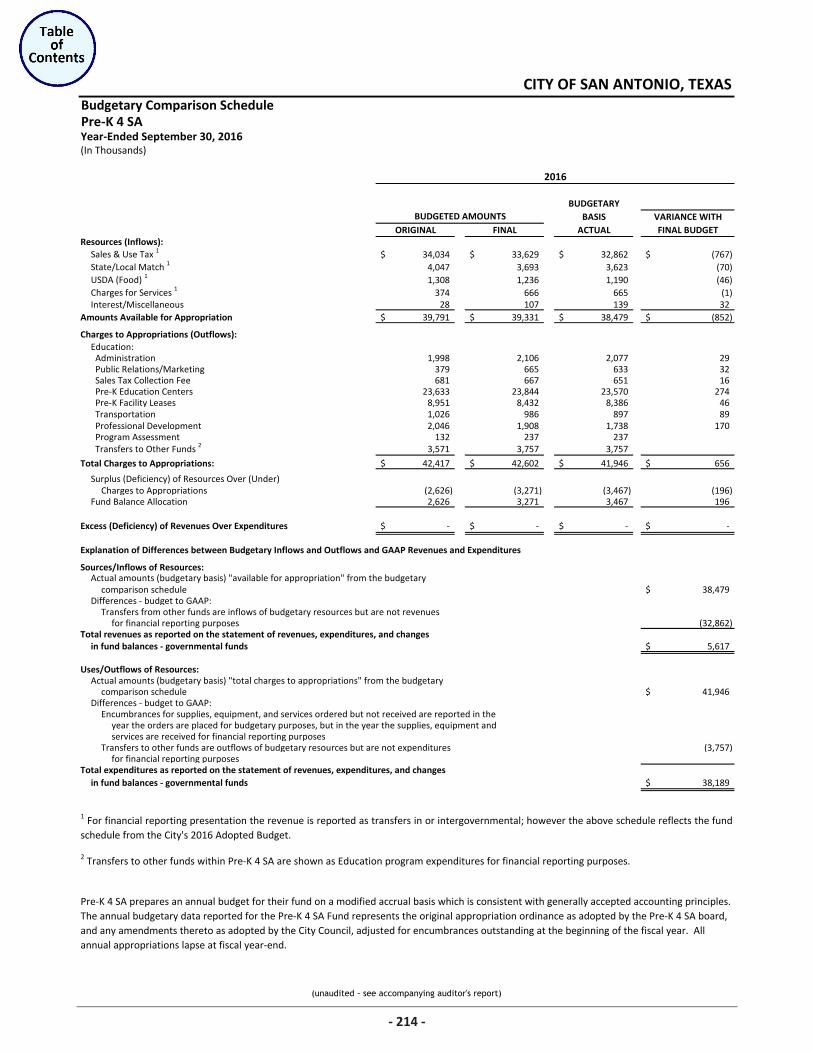
(unaudited - see accompanying auditor's report)
Budgetary Comparison SchedulePre-K 4 SA
BUDGETARYBASIS VARIANCE WITH
ORIGINAL FINAL ACTUAL FINAL BUDGET
Sales & Use Tax 1 34,034$ 33,629$ 32,862$ (767)$ State/Local Match 1 4,047 3,693 3,623 (70) USDA (Food) 1 1,308 1,236 1,190 (46) Charges for Services 1 374 666 665 (1) Interest/Miscellaneous 28 107 139 32
Amounts Available for Appropriation 39,791$ 39,331$ 38,479$ (852)$
Charges to Appropriations (Outflows):Education: Administration 1,998 2,106 2,077 29 Public Relations/Marketing 379 665 633 32 Sales Tax Collection Fee 681 667 651 16 Pre-K Education Centers 23,633 23,844 23,570 274 Pre-K Facility Leases 8,951 8,432 8,386 46 Transportation 1,026 986 897 89 Professional Development 2,046 1,908 1,738 170 Program Assessment 132 237 237 Transfers to Other Funds 2 3,571 3,757 3,757
Total Charges to Appropriations: 42,417$ 42,602$ 41,946$ 656$
Charges to Appropriations (2,626) (3,271) (3,467) (196)
Fund Balance Allocation 2,626 3,271 3,467 196
Excess (Deficiency) of Revenues Over Expenditures -$ -$ -$ -$
Explanation of Differences between Budgetary Inflows and Outflows and GAAP Revenues and Expenditures
Sources/Inflows of Resources:
comparison schedule 38,479$ Differences - budget to GAAP:
Transfers from other funds are inflows of budgetary resources but are not revenuesfor financial reporting purposes (32,862)
Total revenues as reported on the statement of revenues, expenditures, and changesin fund balances - governmental funds 5,617$
Uses/Outflows of Resources:Actual amounts (budgetary basis) "total charges to appropriations" from the budgetary
comparison schedule 41,946$ Differences - budget to GAAP:
Encumbrances for supplies, equipment, and services ordered but not received are reported in the year the orders are placed for budgetary purposes, but in the year the supplies, equipment andservices are received for financial reporting purposes
Transfers to other funds are outflows of budgetary resources but are not expenditures (3,757) for financial reporting purposes
Total expenditures as reported on the statement of revenues, expenditures, and changesin fund balances - governmental funds 38,189$
Pre-K 4 SA prepares an annual budget for their fund on a modified accrual basis which is consistent with generally accepted accounting principles. The annual budgetary data reported for the Pre-K 4 SA Fund represents the original appropriation ordinance as adopted by the Pre-K 4 SA board, and any amendments thereto as adopted by the City Council, adjusted for encumbrances outstanding at the beginning of the fiscal year. All annual appropriations lapse at fiscal year-end.
2 Transfers to other funds within Pre-K 4 SA are shown as Education program expenditures for financial reporting purposes.
CITY OF SAN ANTONIO, TEXAS
Year-Ended September 30, 2016(In Thousands)
2016
BUDGETED AMOUNTS
Surplus (Deficiency) of Resources Over (Under)
Actual amounts (budgetary basis) "available for appropriation" from the budgetary
1 For financial reporting presentation the revenue is reported as transfers in or intergovernmental; however the above schedule reflects the fundschedule from the City's 2016 Adopted Budget.
Resources (Inflows):
214

Pension andPost-employment
Schedules
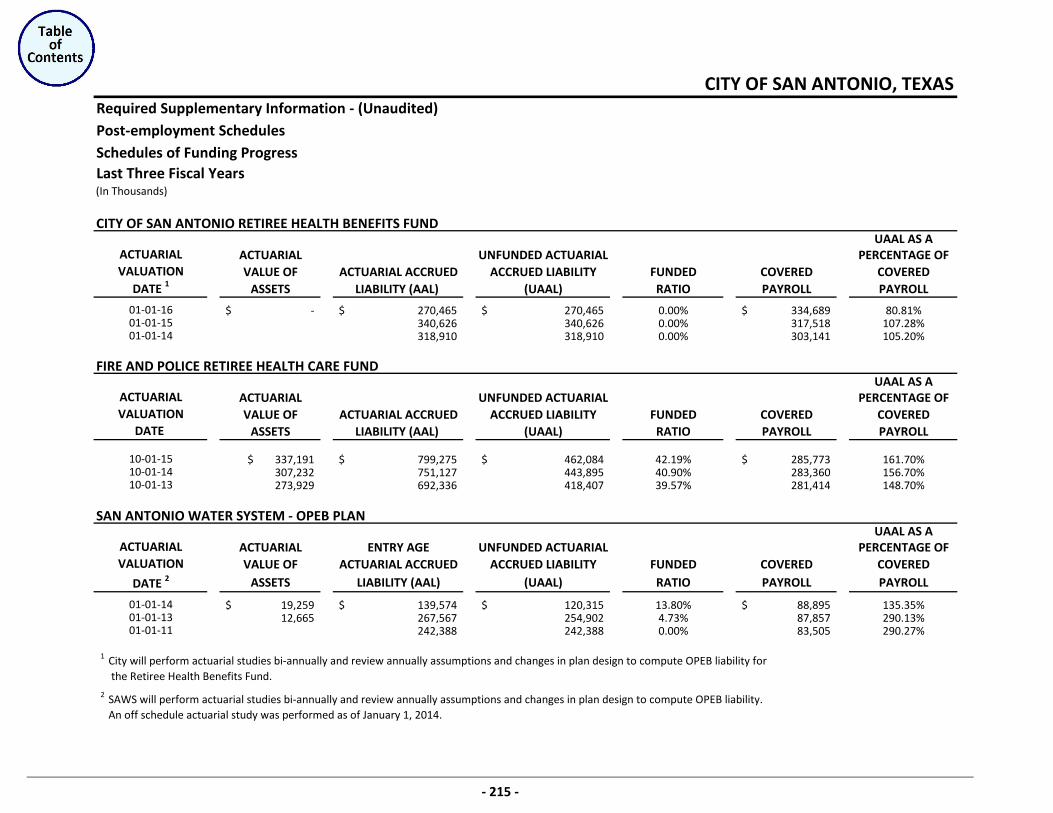
Required Supplementary Information - (Unaudited)Post-employment SchedulesSchedules of Funding Progress
CITY OF SAN ANTONIO RETIREE HEALTH BENEFITS FUNDUAAL AS A
ACTUARIAL UNFUNDED ACTUARIAL PERCENTAGE OFVALUE OF ACTUARIAL ACCRUED ACCRUED LIABILITY FUNDED COVERED COVERED
ASSETS LIABILITY (AAL) (UAAL) RATIO PAYROLL PAYROLL
-$ 270,465$ 270,465$ 0.00% 334,689$ 80.81%340,626 340,626 0.00% 317,518 107.28%318,910 318,910 0.00% 303,141 105.20%
FIRE AND POLICE RETIREE HEALTH CARE FUND UAAL AS A
ACTUARIAL UNFUNDED ACTUARIAL PERCENTAGE OFVALUE OF ACTUARIAL ACCRUED ACCRUED LIABILITY FUNDED COVERED COVERED
ASSETS LIABILITY (AAL) (UAAL) RATIO PAYROLL PAYROLL
337,191$ 799,275$ 462,084$ 42.19% 285,773$ 161.70%307,232 751,127 443,895 40.90% 283,360 156.70%273,929 692,336 418,407 39.57% 281,414 148.70%
SAN ANTONIO WATER SYSTEM - OPEB PLANUAAL AS A
ACTUARIAL ENTRY AGE UNFUNDED ACTUARIAL PERCENTAGE OFVALUE OF ACTUARIAL ACCRUED ACCRUED LIABILITY FUNDED COVERED COVERED
ASSETS LIABILITY (AAL) (UAAL) RATIO PAYROLL PAYROLL
19,259$ 139,574$ 120,315$ 13.80% 88,895$ 135.35%12,665 267,567 254,902 4.73% 87,857 290.13%
242,388 242,388 0.00% 83,505 290.27%
1 City will perform actuarial studies bi-annually and review annually assumptions and changes in plan design to compute OPEB liability for the Retiree Health Benefits Fund.
2 SAWS will perform actuarial studies bi-annually and review annually assumptions and changes in plan design to compute OPEB liability.An off schedule actuarial study was performed as of January 1, 2014.
VALUATION
10-01-13
DATE
VALUATION
DATE 2
10-01-1510-01-14
CITY OF SAN ANTONIO, TEXAS
Last Three Fiscal Years(In Thousands)
ACTUARIAL
ACTUARIAL
01-01-1401-01-15
VALUATION
01-01-16
DATE 1
01-01-1101-01-13
ACTUARIAL
01-01-14
- 215 -
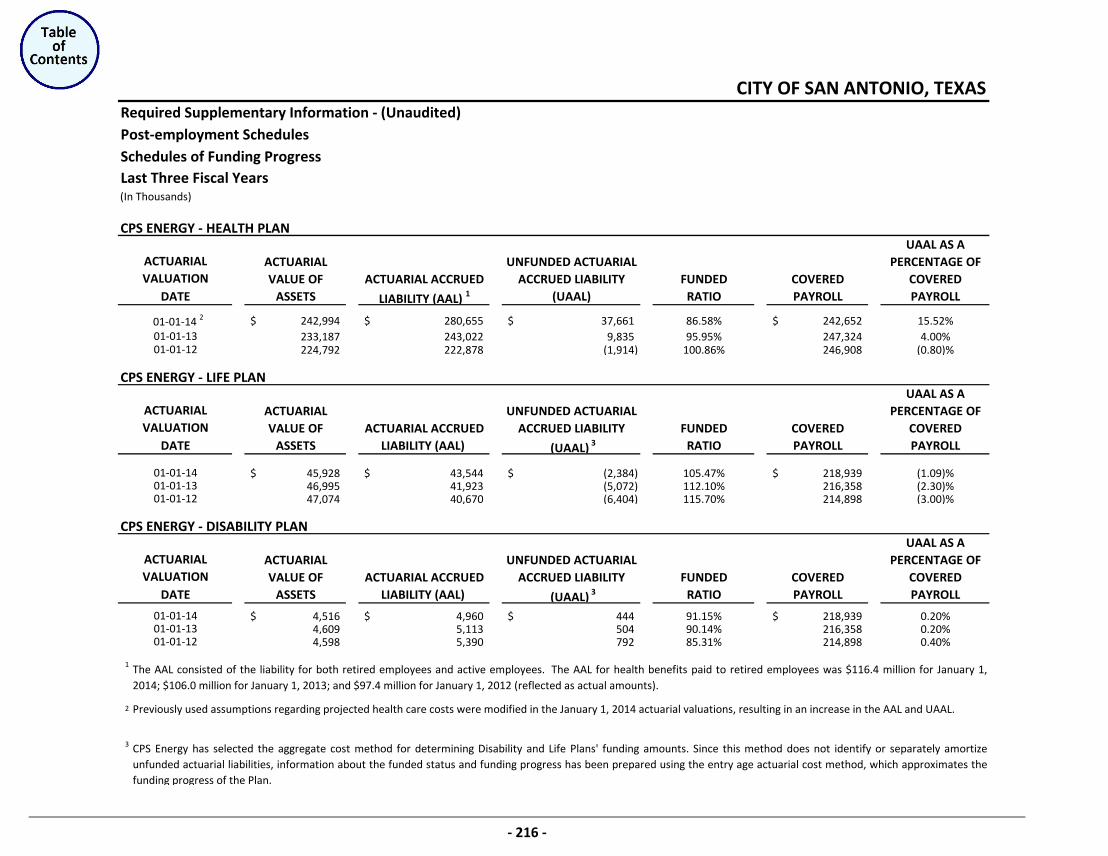
Required Supplementary Information - (Unaudited)Post-employment SchedulesSchedules of Funding Progress
CPS ENERGY - HEALTH PLANUAAL AS A
ACTUARIAL UNFUNDED ACTUARIAL PERCENTAGE OFVALUE OF ACTUARIAL ACCRUED ACCRUED LIABILITY FUNDED COVERED COVERED
ASSETS LIABILITY (AAL) 1 (UAAL) RATIO PAYROLL PAYROLL
242,994$ 280,655$ 37,661$ 86.58% 242,652$ 15.52%233,187 243,022 9,835 95.95% 247,324 4.00%224,792 222,878 (1,914) 100.86% 246,908 (0.80)%
CPS ENERGY - LIFE PLANUAAL AS A
ACTUARIAL UNFUNDED ACTUARIAL PERCENTAGE OFVALUE OF ACTUARIAL ACCRUED ACCRUED LIABILITY FUNDED COVERED COVERED
ASSETS LIABILITY (AAL) (UAAL) 3 RATIO PAYROLL PAYROLL
45,928$ 43,544$ (2,384)$ 105.47% 218,939$ (1.09)%46,995 41,923 (5,072) 112.10% 216,358 (2.30)%47,074 40,670 (6,404) 115.70% 214,898 (3.00)%
CPS ENERGY - DISABILITY PLANUAAL AS A
ACTUARIAL UNFUNDED ACTUARIAL PERCENTAGE OFVALUE OF ACTUARIAL ACCRUED ACCRUED LIABILITY FUNDED COVERED COVERED
ASSETS LIABILITY (AAL) (UAAL) 3 RATIO PAYROLL PAYROLL
4,516$ 4,960$ 444$ 91.15% 218,939$ 0.20%4,609 5,113 504 90.14% 216,358 0.20%4,598 5,390 792 85.31% 214,898 0.40%
1
2
3
01-01-1201-01-13
DATE
01-01-12
CPS Energy has selected the aggregate cost method for determining Disability and Life Plans' funding amounts. Since this method does not identify or separately amortizeunfunded actuarial liabilities, information about the funded status and funding progress has been prepared using the entry age actuarial cost method, which approximates thefunding progress of the Plan.
01-01-1301-01-14
The AAL consisted of the liability for both retired employees and active employees. The AAL for health benefits paid to retired employees was $116.4 million for January 1,2014; $106.0 million for January 1, 2013; and $97.4 million for January 1, 2012 (reflected as actual amounts).
Previously used assumptions regarding projected health care costs were modified in the January 1, 2014 actuarial valuations, resulting in an increase in the AAL and UAAL.
ACTUARIALVALUATION
01-01-14
CITY OF SAN ANTONIO, TEXAS
Last Three Fiscal Years(In Thousands)
DATE
01-01-1301-01-12
01-01-14 2
ACTUARIAL
DATE VALUATION
VALUATIONACTUARIAL
- 216 -
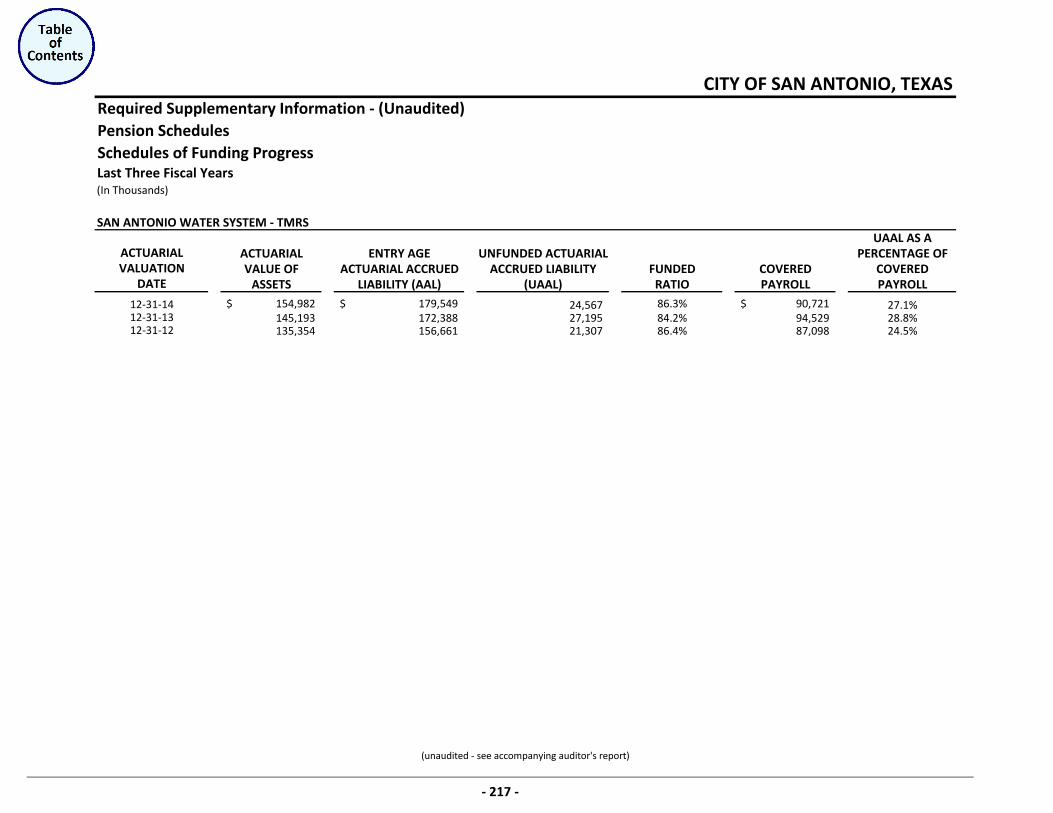
(unaudited - see accompanying auditor's report)
Required Supplementary Information - (Unaudited)Pension SchedulesSchedules of Funding Progress
SAN ANTONIO WATER SYSTEM - TMRSUAAL AS A
ACTUARIAL ENTRY AGE UNFUNDED ACTUARIAL PERCENTAGE OFVALUE OF ACTUARIAL ACCRUED ACCRUED LIABILITY FUNDED COVERED COVERED
ASSETS LIABILITY (AAL) (UAAL) RATIO PAYROLL PAYROLL154,982$ 179,549$ 24,567 86.3% 90,721$ 27.1%145,193 172,388 27,195 84.2% 94,529 28.8%135,354 156,661 21,307 86.4% 87,098 24.5%
CITY OF SAN ANTONIO, TEXAS
Last Three Fiscal Years(In Thousands)
ACTUARIAL
12-31-1312-31-12
12-31-14
VALUATIONDATE
- 217 -
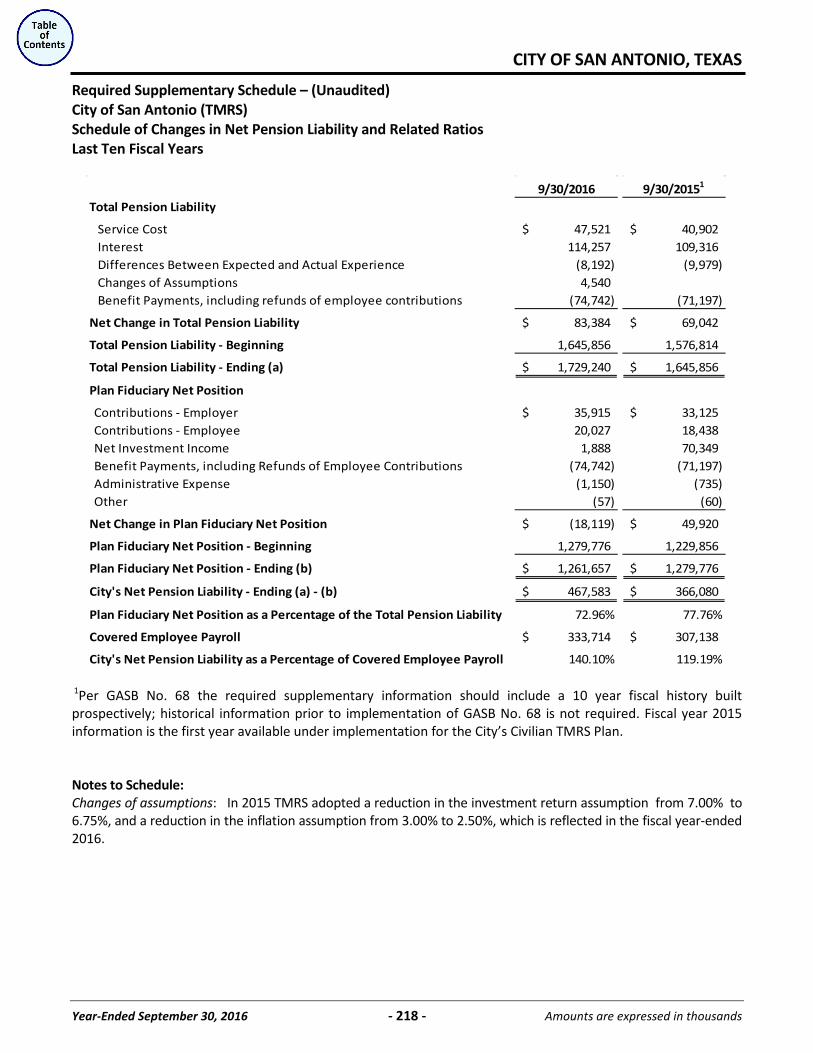
CITY OF SAN ANTONIO, TEXAS
Year-Ended September 30, 2016 - 218 - Amounts are expressed in thousands
Required Supplementary Schedule – (Unaudited) City of San Antonio (TMRS) Schedule of Changes in Net Pension Liability and Related Ratios Last Ten Fiscal Years
9/30/2016 9/30/20151
Total Pension Liability
Service Cost 47,521$ 40,902$ Interest 114,257 109,316 Differences Between Expected and Actual Experience (8,192) (9,979) Changes of Assumptions 4,540 Benefit Payments, including refunds of employee contributions (74,742) (71,197)
Net Change in Total Pension Liability 83,384$ 69,042$
Total Pension Liability - Beginning 1,645,856 1,576,814
Total Pension Liability - Ending (a) 1,729,240$ 1,645,856$
Plan Fiduciary Net Position
Contributions - Employer 35,915$ 33,125$ Contributions - Employee 20,027 18,438 Net Investment Income 1,888 70,349 Benefit Payments, including Refunds of Employee Contributions (74,742) (71,197) Administrative Expense (1,150) (735) Other (57) (60)
Net Change in Plan Fiduciary Net Position (18,119)$ 49,920$
Plan Fiduciary Net Position - Beginning 1,279,776 1,229,856
Plan Fiduciary Net Position - Ending (b) 1,261,657$ 1,279,776$
City's Net Pension Liability - Ending (a) - (b) 467,583$ 366,080$
Plan Fiduciary Net Position as a Percentage of the Total Pension Liability 72.96% 77.76%
Covered Employee Payroll 333,714$ 307,138$
City's Net Pension Liability as a Percentage of Covered Employee Payroll 140.10% 119.19%
1Per GASB No. 68 the required supplementary information should include a 10 year fiscal history built prospectively; historical information prior to implementation of GASB No. 68 is not required. Fiscal year 2015 information is the first year available under implementation for the City’s Civilian TMRS Plan. Notes to Schedule: Changes of assumptions: In 2015 TMRS adopted a reduction in the investment return assumption from 7.00% to 6.75%, and a reduction in the inflation assumption from 3.00% to 2.50%, which is reflected in the fiscal year-ended 2016.
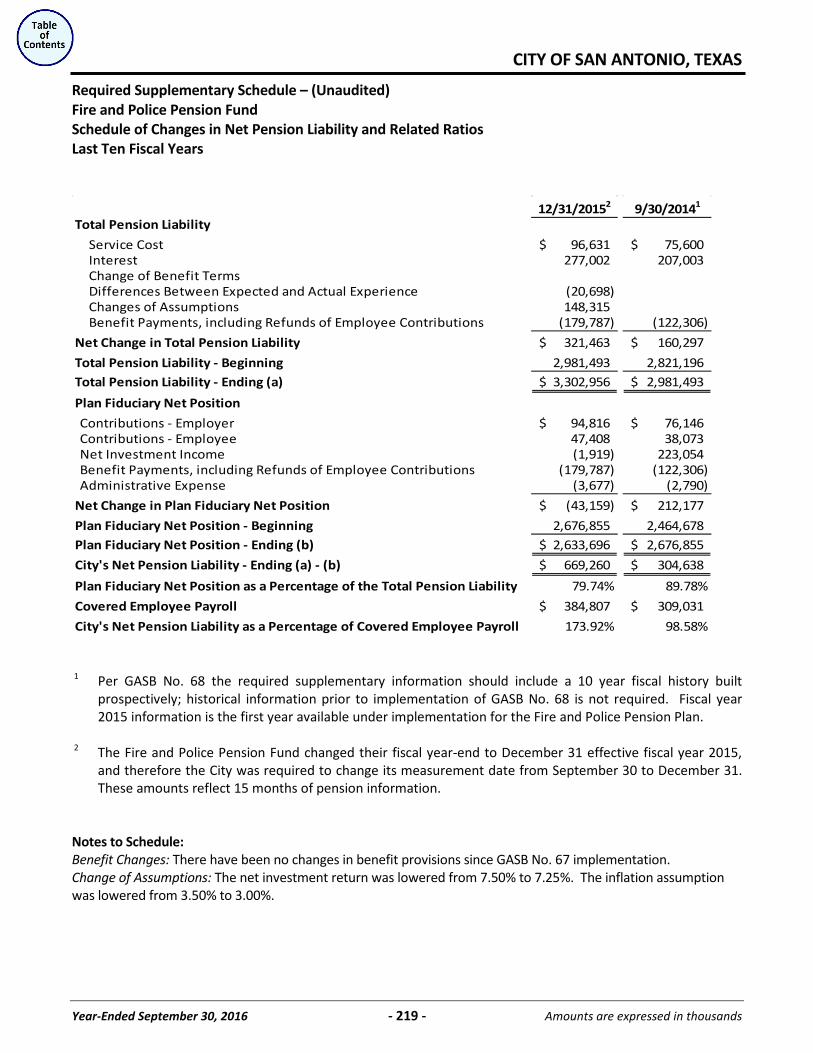
CITY OF SAN ANTONIO, TEXAS
Year-Ended September 30, 2016 - 219 - Amounts are expressed in thousands
Required Supplementary Schedule – (Unaudited) Fire and Police Pension Fund Schedule of Changes in Net Pension Liability and Related Ratios Last Ten Fiscal Years
12/31/20152 9/30/20141
Total Pension Liability
Service Cost 96,631$ 75,600$ Interest 277,002 207,003 Change of Benefit TermsDifferences Between Expected and Actual Experience (20,698) Changes of Assumptions 148,315 Benefit Payments, including Refunds of Employee Contributions (179,787) (122,306)
Net Change in Total Pension Liability 321,463$ 160,297$
Total Pension Liability - Beginning 2,981,493 2,821,196 Total Pension Liability - Ending (a) 3,302,956$ 2,981,493$
Plan Fiduciary Net Position
Contributions - Employer 94,816$ 76,146$ Contributions - Employee 47,408 38,073 Net Investment Income (1,919) 223,054 Benefit Payments, including Refunds of Employee Contributions (179,787) (122,306) Administrative Expense (3,677) (2,790)
Net Change in Plan Fiduciary Net Position (43,159)$ 212,177$
Plan Fiduciary Net Position - Beginning 2,676,855 2,464,678 Plan Fiduciary Net Position - Ending (b) 2,633,696$ 2,676,855$
City's Net Pension Liability - Ending (a) - (b) 669,260$ 304,638$
Plan Fiduciary Net Position as a Percentage of the Total Pension Liability 79.74% 89.78%
Covered Employee Payroll 384,807$ 309,031$
City's Net Pension Liability as a Percentage of Covered Employee Payroll 173.92% 98.58%
1 Per GASB No. 68 the required supplementary information should include a 10 year fiscal history built prospectively; historical information prior to implementation of GASB No. 68 is not required. Fiscal year 2015 information is the first year available under implementation for the Fire and Police Pension Plan.
2 The Fire and Police Pension Fund changed their fiscal year-end to December 31 effective fiscal year 2015,
and therefore the City was required to change its measurement date from September 30 to December 31. These amounts reflect 15 months of pension information.
Notes to Schedule: Benefit Changes: There have been no changes in benefit provisions since GASB No. 67 implementation. Change of Assumptions: The net investment return was lowered from 7.50% to 7.25%. The inflation assumption was lowered from 3.50% to 3.00%.
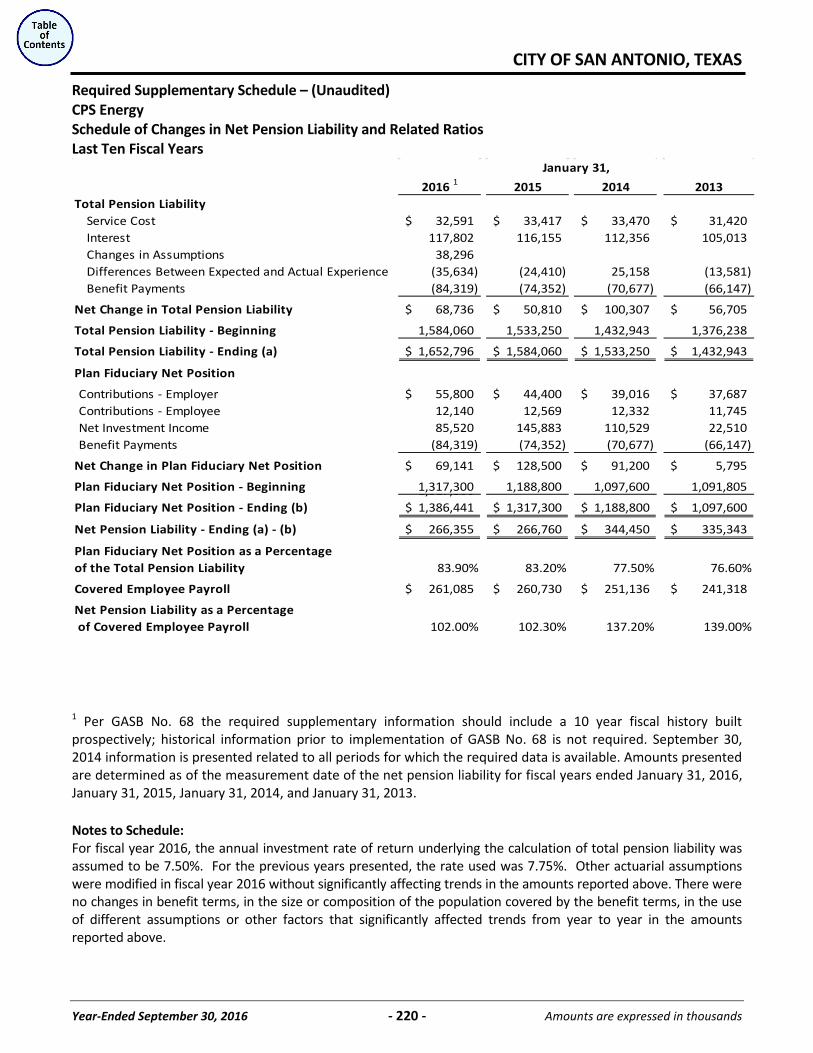
CITY OF SAN ANTONIO, TEXAS
Year-Ended September 30, 2016 - 220 - Amounts are expressed in thousands
Required Supplementary Schedule – (Unaudited) CPS Energy Schedule of Changes in Net Pension Liability and Related Ratios Last Ten Fiscal Years
January 31,
2016 1 2015 2014 2013Total Pension Liability
Service Cost 32,591$ 33,417$ 33,470$ 31,420$ Interest 117,802 116,155 112,356 105,013 Changes in Assumptions 38,296 Differences Between Expected and Actual Experience (35,634) (24,410) 25,158 (13,581) Benefit Payments (84,319) (74,352) (70,677) (66,147)
Net Change in Total Pension Liability 68,736$ 50,810$ 100,307$ 56,705$
Total Pension Liability - Beginning 1,584,060 1,533,250 1,432,943 1,376,238
Total Pension Liability - Ending (a) 1,652,796$ 1,584,060$ 1,533,250$ 1,432,943$
Plan Fiduciary Net Position
Contributions - Employer 55,800$ 44,400$ 39,016$ 37,687$ Contributions - Employee 12,140 12,569 12,332 11,745 Net Investment Income 85,520 145,883 110,529 22,510 Benefit Payments (84,319) (74,352) (70,677) (66,147)
Net Change in Plan Fiduciary Net Position 69,141$ 128,500$ 91,200$ 5,795$
Plan Fiduciary Net Position - Beginning 1,317,300 1,188,800 1,097,600 1,091,805 1,317,300 Plan Fiduciary Net Position - Ending (b) 1,386,441$ 1,317,300$ 1,188,800$ 1,097,600$
Net Pension Liability - Ending (a) - (b) 266,355$ 266,760$ 344,450$ 335,343$
Plan Fiduciary Net Position as a Percentageof the Total Pension Liability 83.90% 83.20% 77.50% 76.60%
Covered Employee Payroll 261,085$ 260,730$ 251,136$ 241,318$
Net Pension Liability as a Percentage of Covered Employee Payroll 102.00% 102.30% 137.20% 139.00%
1 Per GASB No. 68 the required supplementary information should include a 10 year fiscal history built prospectively; historical information prior to implementation of GASB No. 68 is not required. September 30, 2014 information is presented related to all periods for which the required data is available. Amounts presented are determined as of the measurement date of the net pension liability for fiscal years ended January 31, 2016, January 31, 2015, January 31, 2014, and January 31, 2013. Notes to Schedule: For fiscal year 2016, the annual investment rate of return underlying the calculation of total pension liability was assumed to be 7.50%. For the previous years presented, the rate used was 7.75%. Other actuarial assumptions were modified in fiscal year 2016 without significantly affecting trends in the amounts reported above. There were no changes in benefit terms, in the size or composition of the population covered by the benefit terms, in the use of different assumptions or other factors that significantly affected trends from year to year in the amounts reported above.
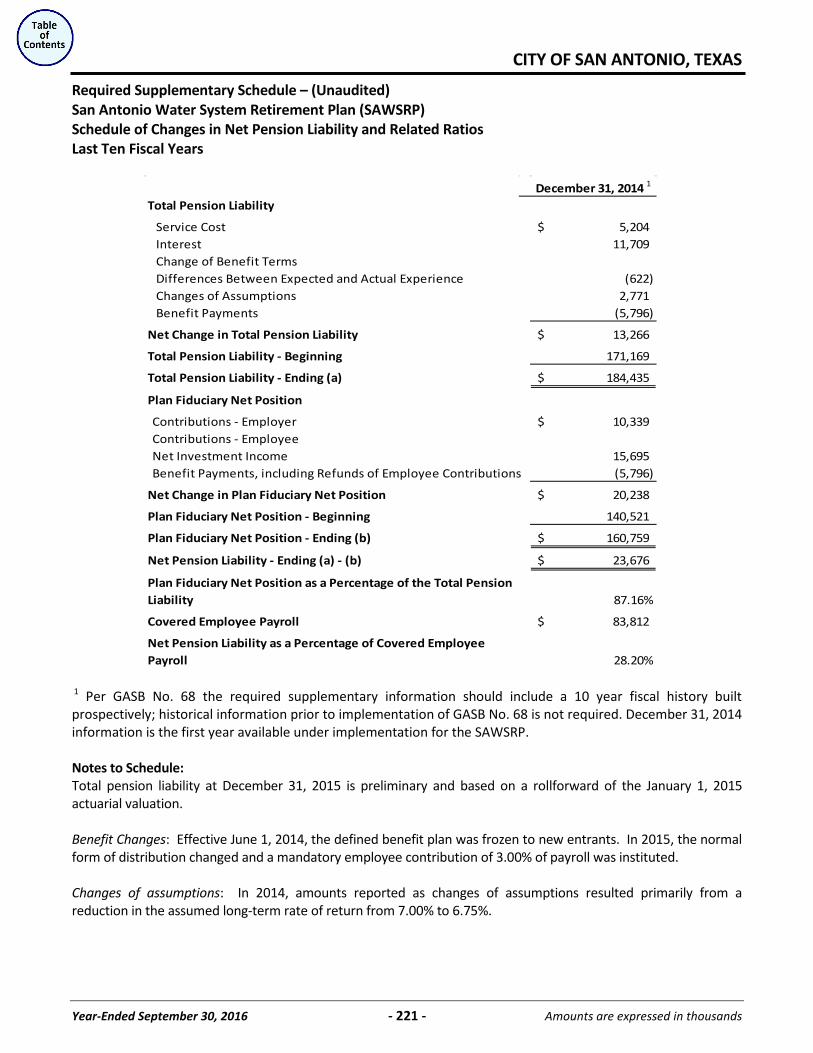
CITY OF SAN ANTONIO, TEXAS
Year-Ended September 30, 2016 - 221 - Amounts are expressed in thousands
Required Supplementary Schedule – (Unaudited) San Antonio Water System Retirement Plan (SAWSRP) Schedule of Changes in Net Pension Liability and Related Ratios Last Ten Fiscal Years
December 31, 2014 1
Total Pension Liability
Service Cost 5,204$ Interest 11,709 Change of Benefit TermsDifferences Between Expected and Actual Experience (622) Changes of Assumptions 2,771 Benefit Payments (5,796)
Net Change in Total Pension Liability 13,266$
Total Pension Liability - Beginning 171,169
Total Pension Liability - Ending (a) 184,435$
Plan Fiduciary Net Position
Contributions - Employer 10,339$ Contributions - EmployeeNet Investment Income 15,695 Benefit Payments, including Refunds of Employee Contributions (5,796)
Net Change in Plan Fiduciary Net Position 20,238$
Plan Fiduciary Net Position - Beginning 140,521
Plan Fiduciary Net Position - Ending (b) 160,759$
Net Pension Liability - Ending (a) - (b) 23,676$
Plan Fiduciary Net Position as a Percentage of the Total Pension Liability 87.16%
Covered Employee Payroll 83,812$
Net Pension Liability as a Percentage of Covered Employee Payroll 28.20%
1 Per GASB No. 68 the required supplementary information should include a 10 year fiscal history built prospectively; historical information prior to implementation of GASB No. 68 is not required. December 31, 2014 information is the first year available under implementation for the SAWSRP. Notes to Schedule: Total pension liability at December 31, 2015 is preliminary and based on a rollforward of the January 1, 2015 actuarial valuation. Benefit Changes: Effective June 1, 2014, the defined benefit plan was frozen to new entrants. In 2015, the normal form of distribution changed and a mandatory employee contribution of 3.00% of payroll was instituted. Changes of assumptions: In 2014, amounts reported as changes of assumptions resulted primarily from a reduction in the assumed long-term rate of return from 7.00% to 6.75%.
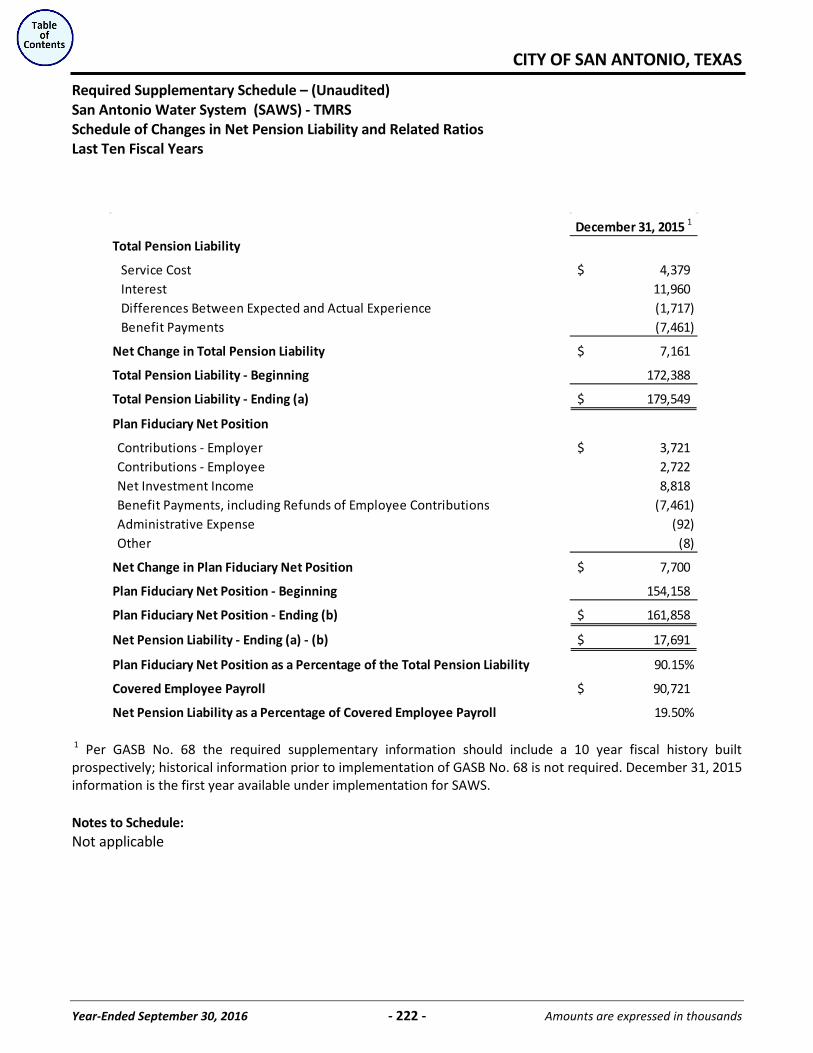
CITY OF SAN ANTONIO, TEXAS
Year-Ended September 30, 2016 - 222 - Amounts are expressed in thousands
Required Supplementary Schedule – (Unaudited) San Antonio Water System (SAWS) - TMRS Schedule of Changes in Net Pension Liability and Related Ratios Last Ten Fiscal Years
December 31, 2015 1
Total Pension Liability
Service Cost 4,379$ Interest 11,960 Differences Between Expected and Actual Experience (1,717) Benefit Payments (7,461)
Net Change in Total Pension Liability 7,161$
Total Pension Liability - Beginning 172,388
Total Pension Liability - Ending (a) 179,549$
Plan Fiduciary Net Position
Contributions - Employer 3,721$ Contributions - Employee 2,722 Net Investment Income 8,818 Benefit Payments, including Refunds of Employee Contributions (7,461) Administrative Expense (92) Other (8)
Net Change in Plan Fiduciary Net Position 7,700$
Plan Fiduciary Net Position - Beginning 154,158
Plan Fiduciary Net Position - Ending (b) 161,858$
Net Pension Liability - Ending (a) - (b) 17,691$
Plan Fiduciary Net Position as a Percentage of the Total Pension Liability 90.15%
Covered Employee Payroll 90,721$
Net Pension Liability as a Percentage of Covered Employee Payroll 19.50% 1 Per GASB No. 68 the required supplementary information should include a 10 year fiscal history built prospectively; historical information prior to implementation of GASB No. 68 is not required. December 31, 2015 information is the first year available under implementation for SAWS. Notes to Schedule: Not applicable
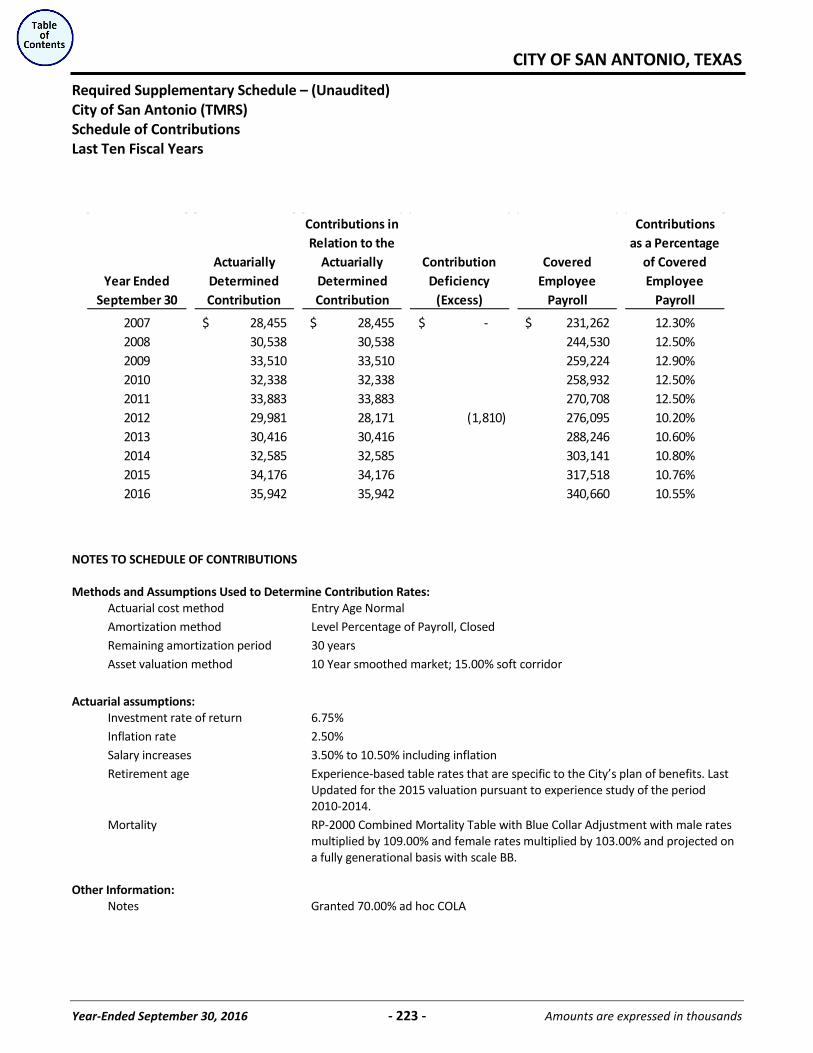
CITY OF SAN ANTONIO, TEXAS
Year-Ended September 30, 2016 - 223 - Amounts are expressed in thousands
Required Supplementary Schedule – (Unaudited) City of San Antonio (TMRS) Schedule of Contributions Last Ten Fiscal Years
Year Ended September 30
Actuarially Determined Contribution
Contributions in Relation to the
Actuarially Determined Contribution
Contribution Deficiency
(Excess)
Covered Employee
Payroll
Contributions as a Percentage
of Covered Employee
Payroll
2007 28,455$ 28,455$ -$ 231,262$ 12.30%2008 30,538 30,538 244,530 12.50%2009 33,510 33,510 259,224 12.90%2010 32,338 32,338 258,932 12.50%2011 33,883 33,883 270,708 12.50%2012 29,981 28,171 (1,810) 276,095 10.20%2013 30,416 30,416 288,246 10.60%2014 32,585 32,585 303,141 10.80%2015 34,176 34,176 317,518 10.76%2016 35,942 35,942 340,660 10.55%
NOTES TO SCHEDULE OF CONTRIBUTIONS Methods and Assumptions Used to Determine Contribution Rates: Actuarial cost method Entry Age Normal Amortization method Level Percentage of Payroll, Closed Remaining amortization period 30 years Asset valuation method 10 Year smoothed market; 15.00% soft corridor Actuarial assumptions: Investment rate of return 6.75% Inflation rate 2.50% Salary increases 3.50% to 10.50% including inflation Retirement age Experience-based table rates that are specific to the City’s plan of benefits. Last Updated for the 2015 valuation pursuant to experience study of the period 2010-2014. Mortality RP-2000 Combined Mortality Table with Blue Collar Adjustment with male rates multiplied by 109.00% and female rates multiplied by 103.00% and projected on a fully generational basis with scale BB. Other Information: Notes Granted 70.00% ad hoc COLA
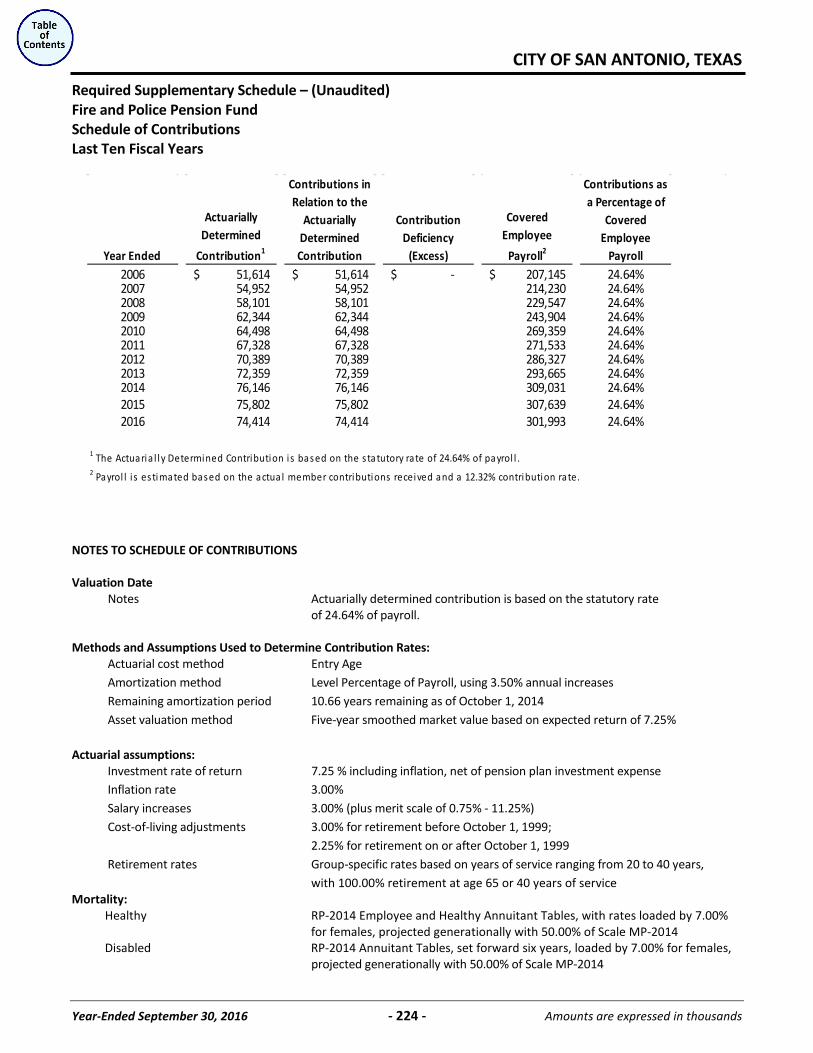
CITY OF SAN ANTONIO, TEXAS
Year-Ended September 30, 2016 - 224 - Amounts are expressed in thousands
Required Supplementary Schedule – (Unaudited) Fire and Police Pension Fund Schedule of Contributions Last Ten Fiscal Years
Year Ended
Actuarially Determined
Contribution1
Contributions in Relation to the
Actuarially Determined Contribution
Contribution Deficiency
(Excess)
Covered Employee
Payroll2
Contributions as a Percentage of
Covered Employee
Payroll2006 51,614$ 51,614$ -$ 207,145$ 24.64%2007 54,952 54,952 214,230 24.64%2008 58,101 58,101 229,547 24.64%2009 62,344 62,344 243,904 24.64%2010 64,498 64,498 269,359 24.64%2011 67,328 67,328 271,533 24.64%2012 70,389 70,389 286,327 24.64%2013 72,359 72,359 293,665 24.64%2014 76,146 76,146 309,031 24.64%2015 75,802 75,802 307,639 24.64%2016 74,414 74,414 301,993 24.64%
1 The Actuaria l ly Determined Contribution i s based on the s tatutory rate of 24.64% of payrol l .2 Payrol l i s es timated based on the actual member contributions received and a 12.32% contribution rate.
NOTES TO SCHEDULE OF CONTRIBUTIONS Valuation Date Notes Actuarially determined contribution is based on the statutory rate of 24.64% of payroll. Methods and Assumptions Used to Determine Contribution Rates: Actuarial cost method Entry Age Amortization method Level Percentage of Payroll, using 3.50% annual increases Remaining amortization period 10.66 years remaining as of October 1, 2014 Asset valuation method Five-year smoothed market value based on expected return of 7.25% Actuarial assumptions: Investment rate of return 7.25 % including inflation, net of pension plan investment expense Inflation rate 3.00% Salary increases 3.00% (plus merit scale of 0.75% - 11.25%) Cost-of-living adjustments 3.00% for retirement before October 1, 1999; 2.25% for retirement on or after October 1, 1999 Retirement rates Group-specific rates based on years of service ranging from 20 to 40 years, with 100.00% retirement at age 65 or 40 years of service Mortality: Healthy RP-2014 Employee and Healthy Annuitant Tables, with rates loaded by 7.00% for females, projected generationally with 50.00% of Scale MP-2014 Disabled RP-2014 Annuitant Tables, set forward six years, loaded by 7.00% for females, projected generationally with 50.00% of Scale MP-2014
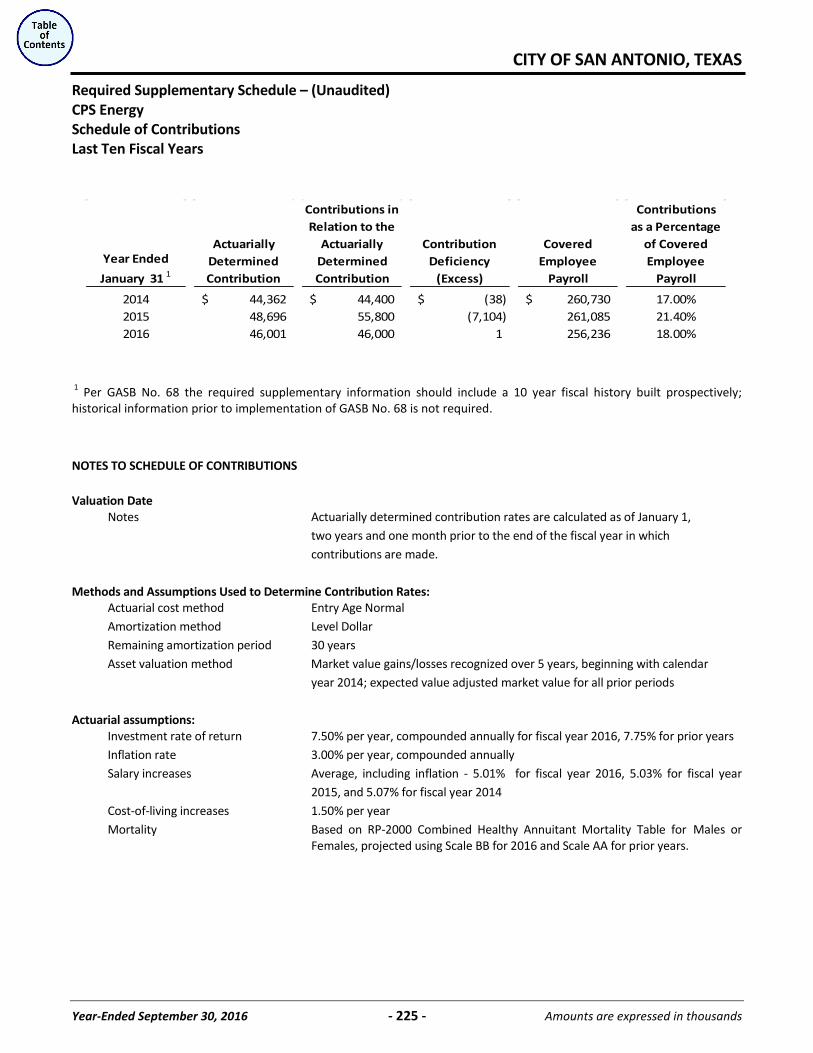
CITY OF SAN ANTONIO, TEXAS
Year-Ended September 30, 2016 - 225 - Amounts are expressed in thousands
Required Supplementary Schedule – (Unaudited) CPS Energy Schedule of Contributions Last Ten Fiscal Years
Year Ended
January 31 1
Actuarially Determined Contribution
Contributions in Relation to the
Actuarially Determined Contribution
Contribution Deficiency
(Excess)
Covered Employee
Payroll
Contributions as a Percentage
of Covered Employee
Payroll
2014 44,362$ 44,400$ (38)$ 260,730$ 17.00%2015 48,696 55,800 (7,104) 261,085 21.40%2016 46,001 46,000 1 256,236 18.00%
1 Per GASB No. 68 the required supplementary information should include a 10 year fiscal history built prospectively; historical information prior to implementation of GASB No. 68 is not required. NOTES TO SCHEDULE OF CONTRIBUTIONS Valuation Date Notes Actuarially determined contribution rates are calculated as of January 1, two years and one month prior to the end of the fiscal year in which contributions are made. Methods and Assumptions Used to Determine Contribution Rates: Actuarial cost method Entry Age Normal Amortization method Level Dollar Remaining amortization period 30 years Asset valuation method Market value gains/losses recognized over 5 years, beginning with calendar year 2014; expected value adjusted market value for all prior periods Actuarial assumptions: Investment rate of return 7.50% per year, compounded annually for fiscal year 2016, 7.75% for prior years Inflation rate 3.00% per year, compounded annually Salary increases Average, including inflation - 5.01% for fiscal year 2016, 5.03% for fiscal year
2015, and 5.07% for fiscal year 2014 Cost-of-living increases 1.50% per year Mortality Based on RP-2000 Combined Healthy Annuitant Mortality Table for Males or
Females, projected using Scale BB for 2016 and Scale AA for prior years.
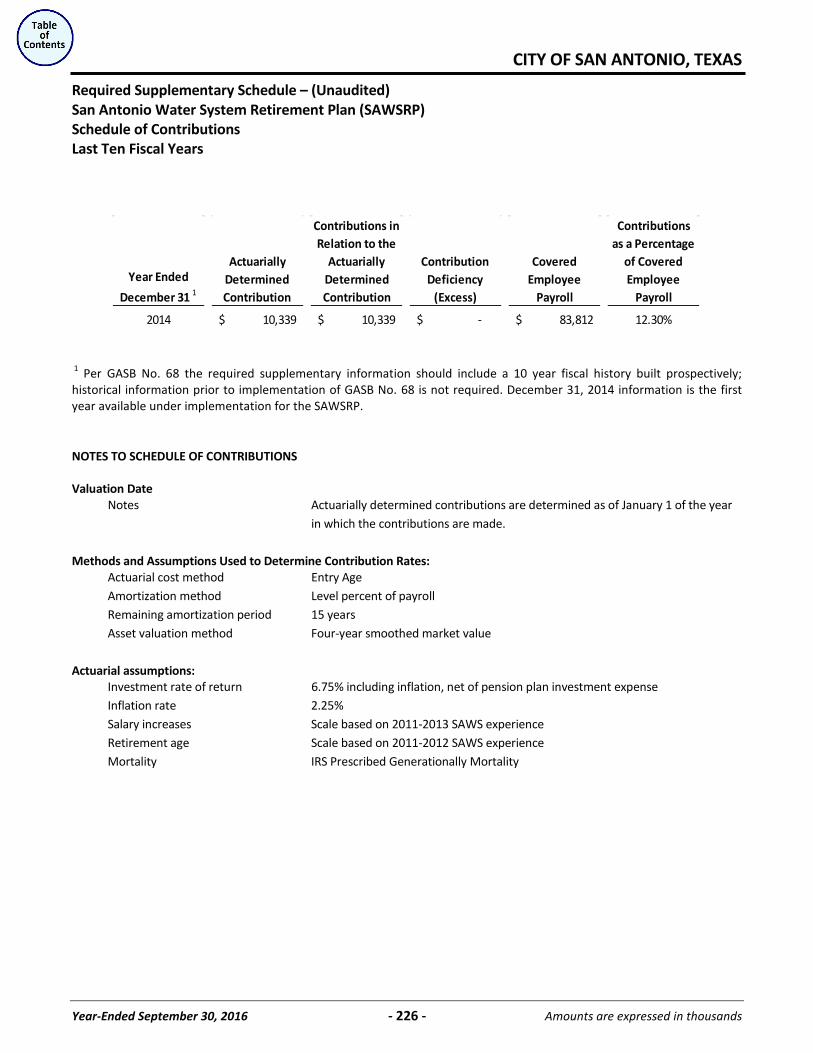
CITY OF SAN ANTONIO, TEXAS
Year-Ended September 30, 2016 - 226 - Amounts are expressed in thousands
Required Supplementary Schedule – (Unaudited) San Antonio Water System Retirement Plan (SAWSRP) Schedule of Contributions Last Ten Fiscal Years
Year Ended
December 31 1
Actuarially Determined Contribution
Contributions in Relation to the
Actuarially Determined Contribution
Contribution Deficiency
(Excess)
Covered Employee
Payroll
Contributions as a Percentage
of Covered Employee
Payroll
2014 10,339$ 10,339$ -$ 83,812$ 12.30%
1 Per GASB No. 68 the required supplementary information should include a 10 year fiscal history built prospectively; historical information prior to implementation of GASB No. 68 is not required. December 31, 2014 information is the first year available under implementation for the SAWSRP. NOTES TO SCHEDULE OF CONTRIBUTIONS Valuation Date Notes Actuarially determined contributions are determined as of January 1 of the year in which the contributions are made. Methods and Assumptions Used to Determine Contribution Rates: Actuarial cost method Entry Age Amortization method Level percent of payroll Remaining amortization period 15 years Asset valuation method Four-year smoothed market value Actuarial assumptions: Investment rate of return 6.75% including inflation, net of pension plan investment expense Inflation rate 2.25% Salary increases Scale based on 2011-2013 SAWS experience Retirement age Scale based on 2011-2012 SAWS experience Mortality IRS Prescribed Generationally Mortality
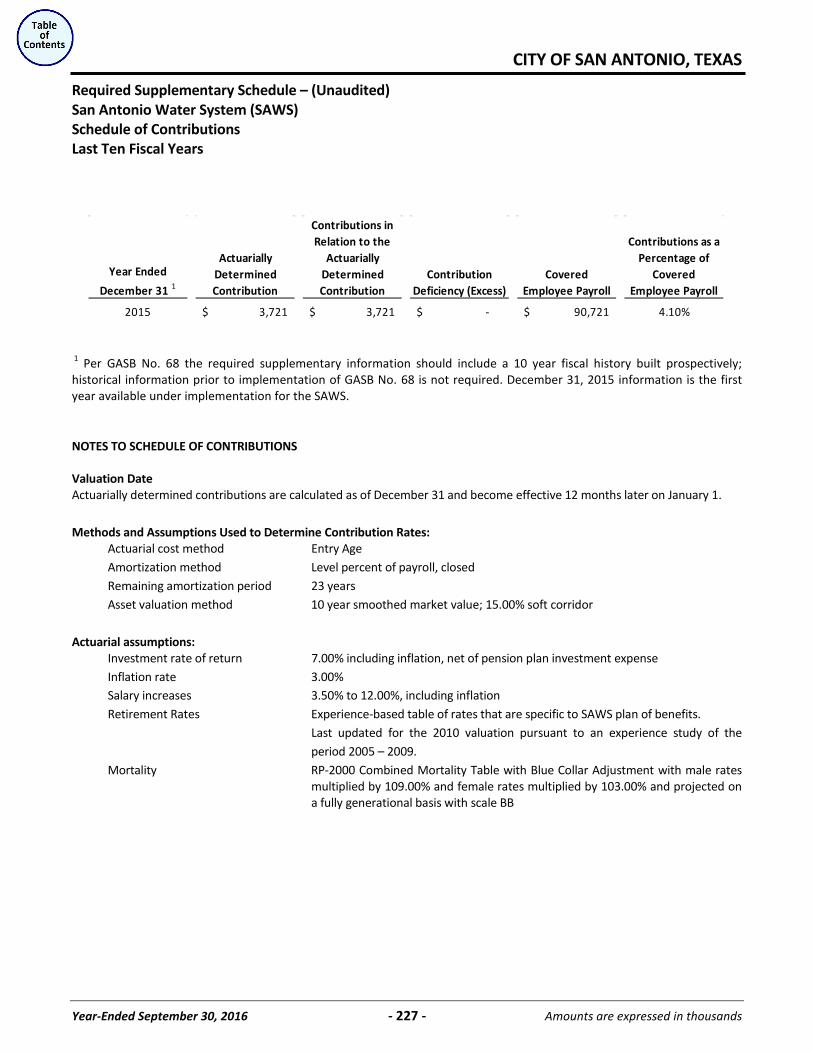
CITY OF SAN ANTONIO, TEXAS
Year-Ended September 30, 2016 - 227 - Amounts are expressed in thousands
Required Supplementary Schedule – (Unaudited) San Antonio Water System (SAWS) Schedule of Contributions Last Ten Fiscal Years
Year Ended
December 31 1
Actuarially Determined Contribution
Contributions in Relation to the
Actuarially Determined Contribution
Contribution Deficiency (Excess)
Covered Employee Payroll
Contributions as a Percentage of
Covered Employee Payroll
2015 3,721$ 3,721$ -$ 90,721$ 4.10%
1 Per GASB No. 68 the required supplementary information should include a 10 year fiscal history built prospectively; historical information prior to implementation of GASB No. 68 is not required. December 31, 2015 information is the first year available under implementation for the SAWS. NOTES TO SCHEDULE OF CONTRIBUTIONS Valuation Date Actuarially determined contributions are calculated as of December 31 and become effective 12 months later on January 1. Methods and Assumptions Used to Determine Contribution Rates: Actuarial cost method Entry Age Amortization method Level percent of payroll, closed Remaining amortization period 23 years Asset valuation method 10 year smoothed market value; 15.00% soft corridor Actuarial assumptions: Investment rate of return 7.00% including inflation, net of pension plan investment expense Inflation rate 3.00% Salary increases 3.50% to 12.00%, including inflation Retirement Rates Experience-based table of rates that are specific to SAWS plan of benefits.
Last updated for the 2010 valuation pursuant to an experience study of the period 2005 – 2009.
Mortality RP-2000 Combined Mortality Table with Blue Collar Adjustment with male rates multiplied by 109.00% and female rates multiplied by 103.00% and projected on a fully generational basis with scale BB

COMBINING FINANCIAL STATEMENTS
COMBININGFINANCIALSTATEMENTS
Nonmajor Governmental FundsSpecial Revenue Funds
GRANTS
AMERICAN RECOVERY AND REINVESTMENT ACT – to accept, receipt, and disburse federal fundsdesignated as part of the American Recovery and Reinvestment Act.CATEGORICAL GRANT IN AID – accounts for the receipt and disbursement of all federal and stategrants (with non cash in kind contributions from external agencies for federal grants), except forCommunity Development Block Grants, HUD 108 loans, HOME Investment Partnership Grants,Confiscated Property, and the American Recovery and Reinvestment Act Grants.COMMUNITY DEVELOPMENT PROGRAM – to accept, receipt, and disburse federal fundsdesignated for Community Development Block Grants’ Programs.CONFISCATED PROPERTY – to account for receipts and disbursement of funds confiscated by lawenforcement officers within the City of San Antonio, Texas.HOME PROGRAM – to accept, receipt, and disburse federal funds designated for HOMEInvestment Partnership Programs.HUD 108 LOAN PROGRAM – to accept, receipt, and disburse federal funds designed to financevarious HUD eligible capital improvements within the City.
OTHER SPECIAL REVENUES
ADVANCED TRANSPORTATION DISTRICT – to account for a cent sales tax that funds theadministration and project delivery of the Advanced Transportation District Program (ATD).COMMUNITY AND VISITOR FACILITIES – to account for revenues and expenditures generatedfrom Convention and Tourism activities relating to the promotion of City of San Antonio ownedfacilities to be used for conventions, community, and entertainment venues.COMMUNITY SERVICES – to account for funds that provide various services to the community,such as health, housing, education, safety, employment, golfing, and economic development.HOTEL/MOTEL 2% REVENUE – to account for funds derived from and capital improvementactivity relating to the additional 2.0% Municipal Hotel/Motel Occupancy Tax.PARKS DEVELOPMENT AND EXPANSION – to account for a cent sales tax that funds thepurchase and maintenance of new parkland in the Edwards Aquifer Recharge Zones, as well aslinear parks along Leon Creek and Salado Creek.EARLY EDUCATION DEVELOPMENT – to account for revenues and expenditures relating to acent sales tax to fund the Pre K 4 SA education initiative created to provide high quality pre k forfour year olds throughout the City.RIGHT OF WAYS – to account for funds used in the maintenance and improvement of right ofways. Financing is provided by street resurfacing charges.SAN ANTONIO HOUSING TRUST – to account for funds utilized in programs administered by theSan Antonio Housing Trust Foundation. Financing is provided from investment earnings thatwere designated from the sale of Roger’s Cable System.STORMWATER OPERATIONS – to account for the administrative and operational activities of theStormwater Program. Financing is provided by a storm water fee.
Nonmajor Governmental FundsSpecial Revenue Funds (continued)
OTHER SPECIAL REVENUES (continued)
TAX INCREMENT REINVESTMENT ZONE – to account for all revenues and expendituresassociated with the operations of Tax Increment Reinvestment Zones (TIRZ) and the TaxIncrement Financing Fund (TIF). Financing is provided by property taxes contributed from theCity and other participating jurisdictions.PARKS ENVIRONMENTAL & SANITATION – to account for the administrative and operationalactivities of the Parks Environmental Program. Financing is provided by a parks environmentalfee.
BLENDED COMPONENT UNITS
SAN ANTONIO EDUCATION FACILITIES CORPORATION (EFC) – was established in accordancewith state laws for the purpose of aiding nonprofit institutions of higher education in providingeducational, housing, and other related facilities.SAN ANTONIO HEALTH FACILITIES DEVELOPMENT CORPORATION (HFDC) – was established inaccordance with state laws for the purpose of acquiring, constructing, improving, providing,financing, and refinancing for any real, personal, or mixed property for health care, research, andeducation, and to assist in the maintenance of the public health.SAN ANTONIO INDUSTRIAL DEVELOPMENT AUTHORITY (IDA) – was established in accordancewith state laws for the purpose of furthering the promotion and development of commercial,industrial, and manufacturing enterprises to promote and encourage employment and the publicwelfare.MUNICIPAL GOLF ASSOCIATION – SAN ANTONIO (MGA SA) – was established for the purposeof, and to act on behalf of the City in, operating and promoting the City of San Antonio municipalgolf facilities.SAN ANTONIO TEXAS MUNICIPAL FACILITIES CORPORATION (TMFC) – to account for thefinancing for the acquisition and construction of a One Stop Development Services Center and aFire and Police Emergency Dispatch Center, also known as the Public Safety Answering Point(PSAP) facility, for the City of San Antonio, Texas. Financing was derived from the sale of City ofSan Antonio, Texas Municipal Facilities Corporation Lease Revenue Bonds.STARBRIGHT INDUSTRIAL DEVELOPMENT CORPORATION (SIDC) – to account for the purchaseof the project site for the Toyota plant and finance other costs of the project site including sitepreparation and a training facility as provided in the Project Starbright Agreement. Financing wasderived from the prior sale of City of San Antonio, Texas Starbright Industrial DevelopmentCorporation Contract Revenue Bonds.SAN ANTONIO ECONOMIC DEVELOPMENT CORPORATION (EDC) – was established to promote,assist, and enhance economic development activities for the City.TEXAS PUBLIC FACILITIES CORPORATION (TPFC) – was established in accordance with state lawsfor the purpose of, and to act on the behalf of the City, to effectuate the buyout of the City’sexisting Hotel Revenue Bonds and funding for the expansion of the City’s Convention Centerthrough issuance of 2012 Lease Revenue Bonds.HEMISFAIR PARK AREA REDEVELOPMENT CORPORATION (HPARC) – was established by the Cityin August 2009 for the purpose of aiding and acting on behalf of the City to assist with acquiringproperty, planning, developing, constructing, managing, maintaining, and financing projectswithin Hemisfair and adjacent to or near Hemisfair.
Nonmajor Governmental FundsSpecial Revenue Funds (continued)
BLENDED COMPONENT UNITS (continued)
URBAN RENEWAL AGENCY (OUR SA) – OUR SA is responsible for implementing the City’s UrbanRenewal Program. Financing is provided from the City of San Antonio, and the sale ofredeveloped real estate.WESTSIDE DEVELOPMENT CORPORATION (WDC) – was established to promote economicdevelopment and redevelopment opportunities in the west side of San Antonio. WDC seeks togenerate new capital investment, create higher paying jobs, and reduce the poverty level in thearea. In addition, WDC functions as a land development corporation that has the power to buy,sell, and accept land as a nonprofit without the restrictions placed upon a municipality.
Capital Projects Funds
GENERAL OBLIGATION BONDS
GENERAL OBLIGATION BONDS – to account for financial resources to be used for the acquisition orconstruction of major capital facilities, such as drainage and library improvements, excluding thosefinanced by proprietary type funds and trust funds. Financing is derived by the sale of GeneralObligation Bonds.
PRE 1999 GENERAL OBLIGATION BONDS – consist of six bond elections from 1980 to 1994 heldon January 26, 1980, April 2, 1983, April 6, 1985, November 3, 1987, May 6, 1989, and May 7,1994, respectively, for development and improvement projects. These six bond elections coveredprojects within seven areas: libraries, fire protection, crime prevention, parks, San Antonio Riverflood control, drainage and flood control, and street, bridge, and related improvements.1999 GENERAL OBLIGATION BONDS – a bond election held on May 1, 1999 approved $140.2million in physical infrastructure development and improvement projects. These projects werewithin six areas: streets and pedestrian, drainage improvements, flood control with parkimprovements, parks and recreation, library system, and public safety.2003 GENERAL OBLIGATION BONDS – a bond election held on November 4, 2003 approved$115.0 million in physical infrastructure development and improvement projects. These projectswere within five areas: streets and pedestrian, drainage improvements, library improvements,parks and recreation, and public safety.2007 GENERAL OBLIGATION BONDS – a bond election held on May 12, 2007 approved $550.0million in physical infrastructure development and improvement projects. These projects werewithin five areas: streets and pedestrian, drainage improvements, library improvements, parksand recreation, and public safety.GENERAL OBLIGATION PROJECTS FUND – to account for the acquisition or construction of majorcapital facilities such as streets, drainage, library, and park improvements, where funding isprimarily derived from the sale of General Obligation Bonds.
Nonmajor Governmental FundsCapital Projects Funds (continued)
CERTIFICATES OF OBLIGATION
CERTIFICATES OF OBLIGATION – to account for permanent public improvements and/or constructionof municipal facilities, streets, drainage, and emergency fire protection projects. Financing is derivedfrom the sale of Certificates of Obligation.
PRE 2006 CERTIFICATES OF OBLIGATION – consists of Certificates of Obligation sold between theyears of 1986 to 2005 for construction of municipal facilities, library, streets, drainage, parks,police, and emergency fire protection projects.2006 CERTIFICATES OF OBLIGATION – consists of Certificates of Obligation sold in 2006 forconstruction of municipal facilities, library, streets, drainage, parks, police, and emergency fireprotection projects.2007 CERTIFICATES OF OBLIGATION – consists of Certificates of Obligation sold in 2007 forconstruction of municipal facilities, library, streets, drainage, parks, police, and emergency fireprotection projects.2008 CERTIFICATES OF OBLIGATION – consists of Certificates of Obligation sold in 2008 forconstruction of municipal facilities, library, streets, drainage, parks, police, and emergency fireprotection projects.2010 CERTIFICATES OF OBLIGATION – consists of Certificates of Obligation sold in 2010 forconstruction of municipal facilities, library, streets, drainage, parks, police, and emergency fireprotection projects.2011 CERTIFICATES OF OBLIGATION – consists of Certificates of Obligation sold in 2011 forconstruction of municipal facilities, library, streets, drainage, parks, police, and emergency fireprotection projects.2012 CERTIFICATES OF OBLIGATION – consists of Certificates of Obligation sold in 2012 forconstruction of municipal facilities, library, streets, drainage, parks, police, and emergency fireprotection projects.2013 CERTIFICATES OF OBLIGATION – consists of Certificates of Obligation sold in 2013 forconstruction of a new fire station facility, various street lighting improvements, and theequipment and management related to these projects.2015 CERTIFICATES OF OBLIGATION – consists of Certificates of Obligation sold in 2015 forconstruction of municipal facilities, library, streets, drainage, parks, police, and emergency fireprotection projects.CERTIFICATES OF OBLIGATION PROJECTS FUND – to account for the acquisition or constructionof major capital facilities such as streets, drainage, library, and park improvements, wherefunding is primarily derived from the sale of Certificates of Obligation.
OTHER CAPITAL PROJECTS
CONVENTION CENTER EXPANSION – to account for financial resources to be used in theConvention Center Expansion Project. Financing is primarily derived by contributions from theTexas Public Facility Corporation, a City blended component unit.EDWARDS AQUIFER PROTECTION VENUE – to account for the acquisition and development ofland in the Edwards Aquifer Recharge Zones. Financing is derived from a cent sales taxapproved by voters on May 7, 2007 and a portion from the sale of sales tax revenue commercialpaper notes.
Nonmajor Governmental FundsCapital Projects Funds (continued)
OTHER CAPITAL PROJECTS (continued)
EQUIPMENT ACQUISITION – to account for the lease financing of large or bulk capital assets forthe City to include a mainframe computer, fire trucks, police video equipment, various medicalemergency services equipment, etc.IMPROVEMENT PROJECTS – to account for special capital improvements designated by CityCouncil. Financing is derived from contributions from other funds and notes payables issued.MUNICIPAL DRAINAGE UTILITY SYSTEM – to account for financial resources to be used tofinance the costs of drainage improvements, including the acquisition, construction, and repair ofstructures, equipment and facilities for the City’s Municipal Drainage Utility System. Financing isderived from the prior sale of City of San Antonio, Texas Municipal Drainage Utility SystemRevenue Bonds.PARKS DEVELOPMENT AND EXPANSION – to account for the acquisition and development ofnew parkland in the Edwards Aquifer Recharge Zones, as well as linear parks along Leon Creekand Salado Creek. Financing is derived from a cent sales tax approved by voters on May 6,2000, extended by voters on May 7, 2005 and again on November 2, 2010. Balance also includesa portion from the prior sale of sales tax revenue commercial paper notes.RESIDUAL CAPITAL PROJECTS – to account for residual investment earnings generated fromGeneral Obligation Bonds (Pre 1999, 1999, 2003, and 2007) and Certificates of Obligation (Pre2006, 2006, 2007, 2008, 2010, and 2011) project fundings. These residual earnings wereprimarily used to fund specific municipal facilities and street projects.TAX & REVENUE NOTES – to account for capital projects where funding is derived from the saleof short term tax and revenue notes.
Permanent Funds
CARVER CULTURAL CENTER ENDOWMENT – to account for matching funds held by the City ofSan Antonio and grant funds previously awarded by the National Endowment for the Arts.CITY CEMETERIES – to account for operation of the City of San Antonio’s burial park. Financingfor operations is provided by user fees and investment earnings. The principal portion is requiredto be retained in the Fund’s Corpus.WILLIAM C. MORRIS ENDOWMENT – to account for funds donated to the City of San Antonio bythe estate of William C. Morris for the purpose of developing and sustaining the San AntonioPublic Library’s programs for children.BOZA BECICA ENDOWMENT – to account for funds donated to the City of San Antonio by theestate of Boza Becica for the purpose of developing and sustaining the San Antonio PublicLibrary’s material purchases. The principal portion is required to be retained in the Fund’sCorpus.
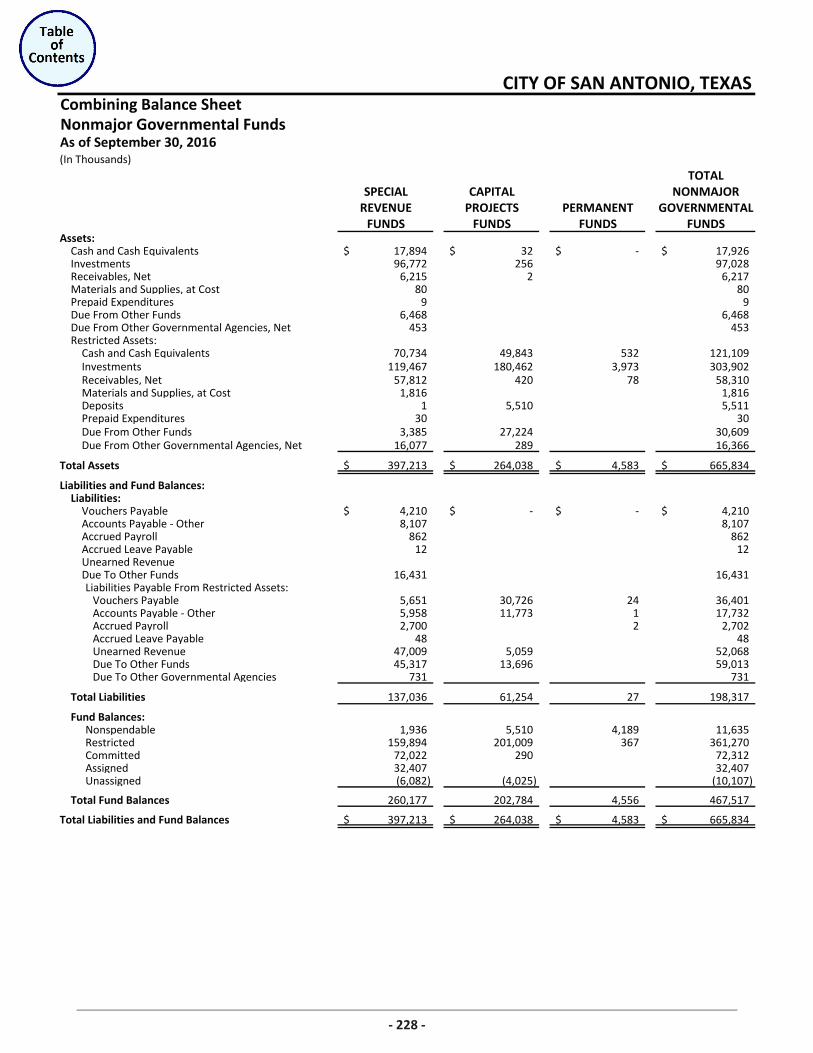
Combining Balance SheetNonmajor Governmental Funds
(In Thousands)TOTAL
SPECIAL CAPITAL NONMAJORREVENUE PROJECTS PERMANENT GOVERNMENTAL
FUNDS FUNDS FUNDS FUNDSAssets:
Cash and Cash Equivalents 17,894$ 32$ -$ 17,926$ Investments 96,772 256 97,028 Receivables, Net 6,215 2 6,217 Materials and Supplies, at Cost 80 80 Prepaid Expenditures 9 9 Due From Other Funds 6,468 6,468 Due From Other Governmental Agencies, Net 453 453 Restricted Assets:
Cash and Cash Equivalents 70,734 49,843 532 121,109 Investments 119,467 180,462 3,973 303,902 Receivables, Net 57,812 420 78 58,310 Materials and Supplies, at Cost 1,816 1,816 Deposits 1 5,510 5,511 Prepaid Expenditures 30 30 Due From Other Funds 3,385 27,224 30,609 Due From Other Governmental Agencies, Net 16,077 289 16,366
Total Assets 397,213$ 264,038$ 4,583$ 665,834$
Liabilities and Fund Balances:Liabilities:
Vouchers Payable 4,210$ -$ -$ 4,210$ Accounts Payable - Other 8,107 8,107 Accrued Payroll 862 862 Accrued Leave Payable 12 12 Unearned Revenue Due To Other Funds 16,431 16,431 Liabilities Payable From Restricted Assets:
Vouchers Payable 5,651 30,726 24 36,401 Accounts Payable - Other 5,958 11,773 1 17,732 Accrued Payroll 2,700 2 2,702 Accrued Leave Payable 48 48 Unearned Revenue 47,009 5,059 52,068 Due To Other Funds 45,317 13,696 59,013 Due To Other Governmental Agencies 731 731
Total Liabilities 137,036 61,254 27 198,317
Fund Balances:Nonspendable 1,936 5,510 4,189 11,635 Restricted 159,894 201,009 367 361,270 Committed 72,022 290 72,312 Assigned 32,407 32,407 Unassigned (6,082) (4,025) (10,107)
Total Fund Balances 260,177 202,784 4,556 467,517
Total Liabilities and Fund Balances 397,213$ 264,038$ 4,583$ 665,834$
CITY OF SAN ANTONIO, TEXAS
As of September 30, 2016
228
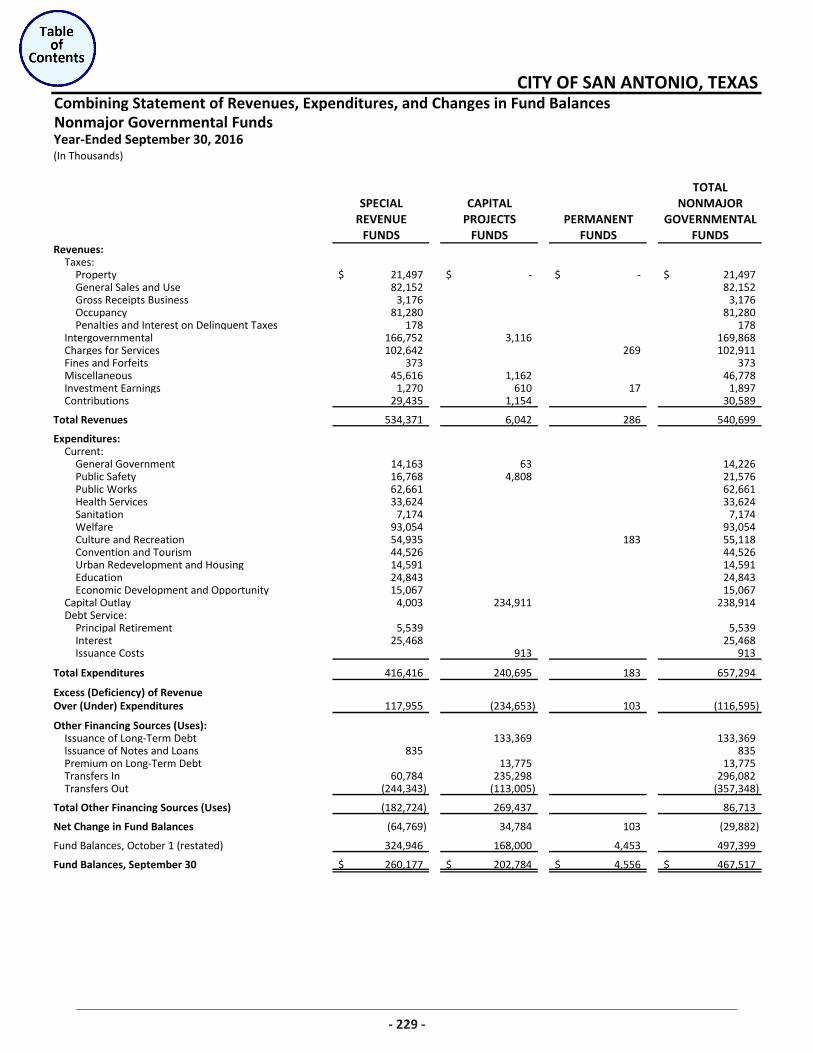
Combining Statement of Revenues, Expenditures, and Changes in Fund BalancesNonmajor Governmental Funds
(In Thousands)
TOTALSPECIAL CAPITAL NONMAJOR
REVENUE PROJECTS PERMANENT GOVERNMENTALFUNDS FUNDS FUNDS FUNDS
Revenues:Taxes:
Property 21,497$ -$ -$ 21,497$ General Sales and Use 82,152 82,152 Gross Receipts Business 3,176 3,176 Occupancy 81,280 81,280 Penalties and Interest on Delinquent Taxes 178 178
Intergovernmental 166,752 3,116 169,868 Charges for Services 102,642 269 102,911 Fines and Forfeits 373 373 Miscellaneous 45,616 1,162 46,778 Investment Earnings 1,270 610 17 1,897 Contributions 29,435 1,154 30,589
Total Revenues 534,371 6,042 286 540,699
Expenditures: Current:
General Government 14,163 63 14,226 Public Safety 16,768 4,808 21,576 Public Works 62,661 62,661 Health Services 33,624 33,624 Sanitation 7,174 7,174 Welfare 93,054 93,054 Culture and Recreation 54,935 183 55,118 Convention and Tourism 44,526 44,526 Urban Redevelopment and Housing 14,591 14,591 Education 24,843 24,843 Economic Development and Opportunity 15,067 15,067
Capital Outlay 4,003 234,911 238,914 Debt Service:
Principal Retirement 5,539 5,539 Interest 25,468 25,468 Issuance Costs 913 913
Total Expenditures 416,416 240,695 183 657,294
Excess (Deficiency) of RevenueOver (Under) Expenditures 117,955 (234,653) 103 (116,595)
Other Financing Sources (Uses):Issuance of Long-Term Debt 133,369 133,369 Issuance of Notes and Loans 835 835 Premium on Long-Term Debt 13,775 13,775 Transfers In 60,784 235,298 296,082 Transfers Out (244,343) (113,005) (357,348)
Total Other Financing Sources (Uses) (182,724) 269,437 86,713
Net Change in Fund Balances (64,769) 34,784 103 (29,882)
Fund Balances, October 1 (restated) 324,946 168,000 4,453 497,399
Fund Balances, September 30 260,177$ 202,784$ 4,556$ 467,517$
CITY OF SAN ANTONIO, TEXAS
Year-Ended September 30, 2016
229
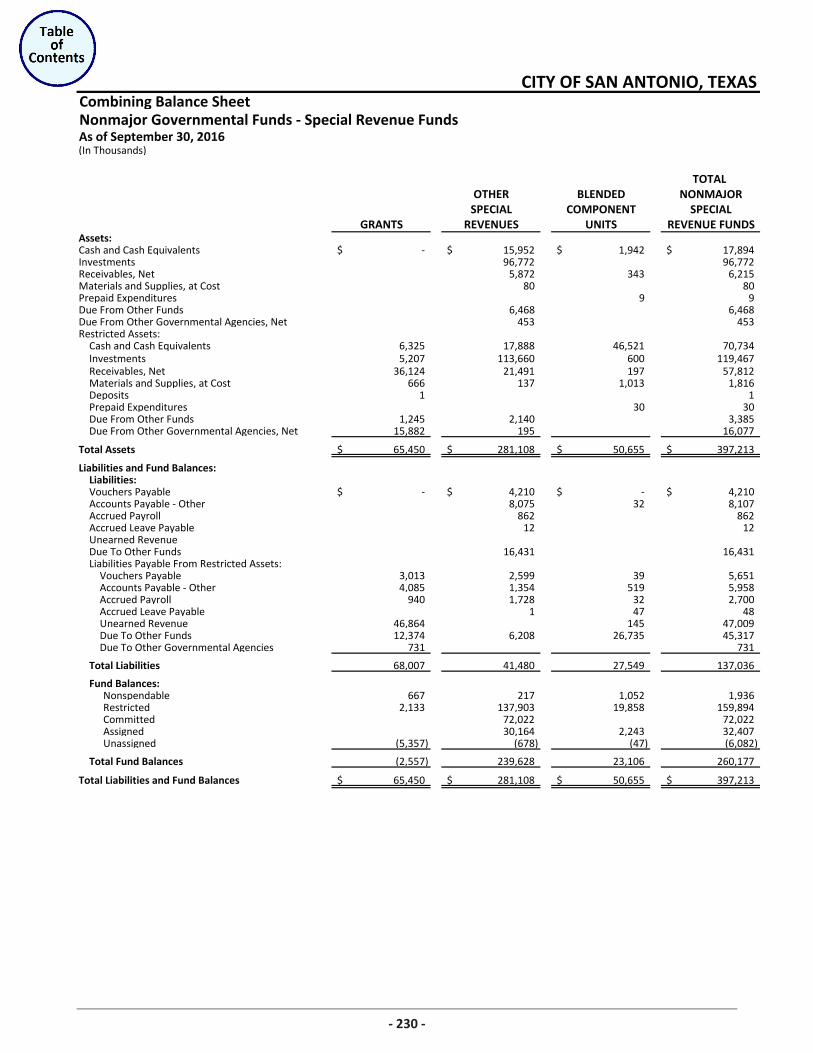
Combining Balance SheetNonmajor Governmental Funds - Special Revenue FundsAs of September 30, 2016(In Thousands)
TOTAL OTHER BLENDED NONMAJOR
SPECIAL COMPONENT SPECIALGRANTS REVENUES UNITS REVENUE FUNDS
Assets:Cash and Cash Equivalents -$ 15,952$ 1,942$ 17,894$ Investments 96,772 96,772 Receivables, Net 5,872 343 6,215 Materials and Supplies, at Cost 80 80 Prepaid Expenditures 9 9 Due From Other Funds 6,468 6,468 Due From Other Governmental Agencies, Net 453 453 Restricted Assets:
Cash and Cash Equivalents 6,325 17,888 46,521 70,734 Investments 5,207 113,660 600 119,467 Receivables, Net 36,124 21,491 197 57,812 Materials and Supplies, at Cost 666 137 1,013 1,816 Deposits 1 1 Prepaid Expenditures 30 30 Due From Other Funds 1,245 2,140 3,385 Due From Other Governmental Agencies, Net 15,882 195 16,077
Total Assets 65,450$ 281,108$ 50,655$ 397,213$
Liabilities and Fund Balances:Liabilities:Vouchers Payable -$ 4,210$ -$ 4,210$ Accounts Payable - Other 8,075 32 8,107 Accrued Payroll 862 862 Accrued Leave Payable 12 12 Unearned Revenue Due To Other Funds 16,431 16,431 Liabilities Payable From Restricted Assets:
Vouchers Payable 3,013 2,599 39 5,651 Accounts Payable - Other 4,085 1,354 519 5,958 Accrued Payroll 940 1,728 32 2,700 Accrued Leave Payable 1 47 48 Unearned Revenue 46,864 145 47,009 Due To Other Funds 12,374 6,208 26,735 45,317 Due To Other Governmental Agencies 731 731
Total Liabilities 68,007 41,480 27,549 137,036
Fund Balances:Nonspendable 667 217 1,052 1,936 Restricted 2,133 137,903 19,858 159,894 Committed 72,022 72,022 Assigned 30,164 2,243 32,407 Unassigned (5,357) (678) (47) (6,082)
Total Fund Balances (2,557) 239,628 23,106 260,177
Total Liabilities and Fund Balances 65,450$ 281,108$ 50,655$ 397,213$
CITY OF SAN ANTONIO, TEXAS
230
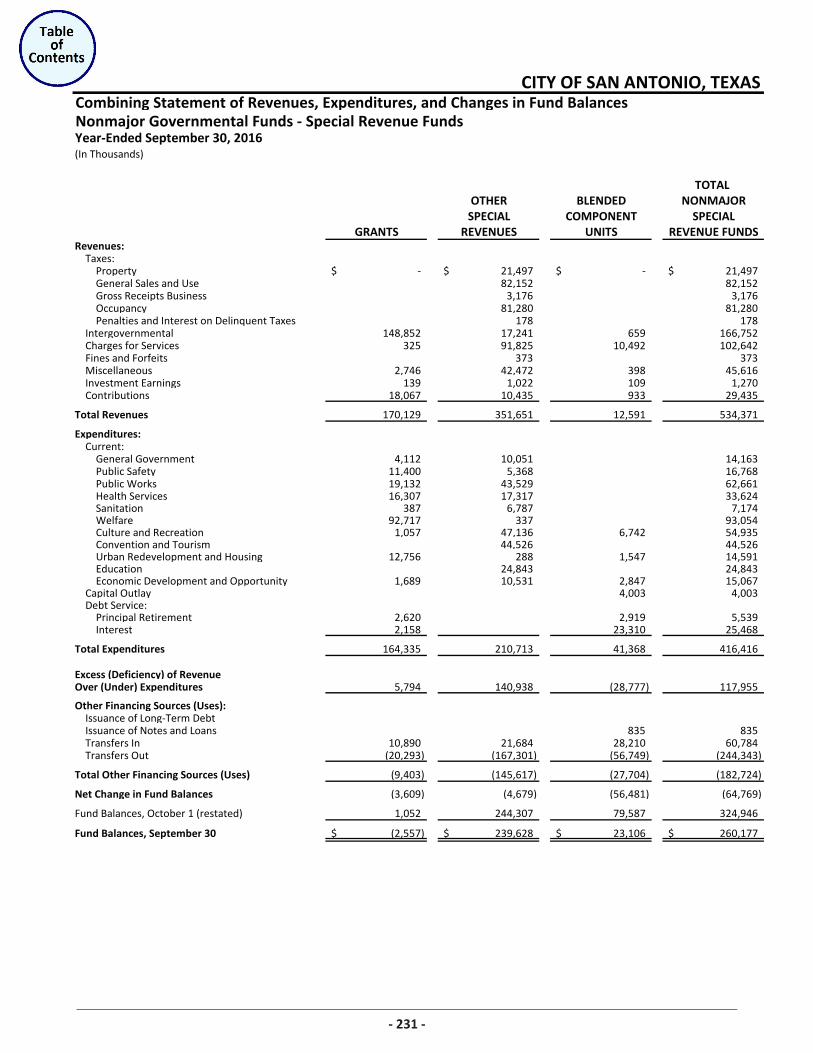
Combining Statement of Revenues, Expenditures, and Changes in Fund BalancesNonmajor Governmental Funds - Special Revenue Funds
(In Thousands)
TOTAL OTHER BLENDED NONMAJORSPECIAL COMPONENT SPECIAL
GRANTS REVENUES UNITS REVENUE FUNDSRevenues:
Taxes:Property -$ 21,497$ -$ 21,497$ General Sales and Use 82,152 82,152 Gross Receipts Business 3,176 3,176 Occupancy 81,280 81,280 Penalties and Interest on Delinquent Taxes 178 178
Intergovernmental 148,852 17,241 659 166,752 Charges for Services 325 91,825 10,492 102,642 Fines and Forfeits 373 373 Miscellaneous 2,746 42,472 398 45,616 Investment Earnings 139 1,022 109 1,270 Contributions 18,067 10,435 933 29,435
Total Revenues 170,129 351,651 12,591 534,371
Expenditures:Current:
General Government 4,112 10,051 14,163 Public Safety 11,400 5,368 16,768 Public Works 19,132 43,529 62,661 Health Services 16,307 17,317 33,624 Sanitation 387 6,787 7,174 Welfare 92,717 337 93,054 Culture and Recreation 1,057 47,136 6,742 54,935 Convention and Tourism 44,526 44,526 Urban Redevelopment and Housing 12,756 288 1,547 14,591 Education 24,843 24,843 Economic Development and Opportunity 1,689 10,531 2,847 15,067
Capital Outlay 4,003 4,003 Debt Service:
Principal Retirement 2,620 2,919 5,539 Interest 2,158 23,310 25,468
Total Expenditures 164,335 210,713 41,368 416,416
Excess (Deficiency) of RevenueOver (Under) Expenditures 5,794 140,938 (28,777) 117,955
Other Financing Sources (Uses):Issuance of Long-Term Debt Issuance of Notes and Loans 835 835 Transfers In 10,890 21,684 28,210 60,784 Transfers Out (20,293) (167,301) (56,749) (244,343)
Total Other Financing Sources (Uses) (9,403) (145,617) (27,704) (182,724)
Net Change in Fund Balances (3,609) (4,679) (56,481) (64,769)
Fund Balances, October 1 (restated) 1,052 244,307 79,587 324,946
Fund Balances, September 30 (2,557)$ 239,628$ 23,106$ 260,177$
CITY OF SAN ANTONIO, TEXAS
Year-Ended September 30, 2016
231
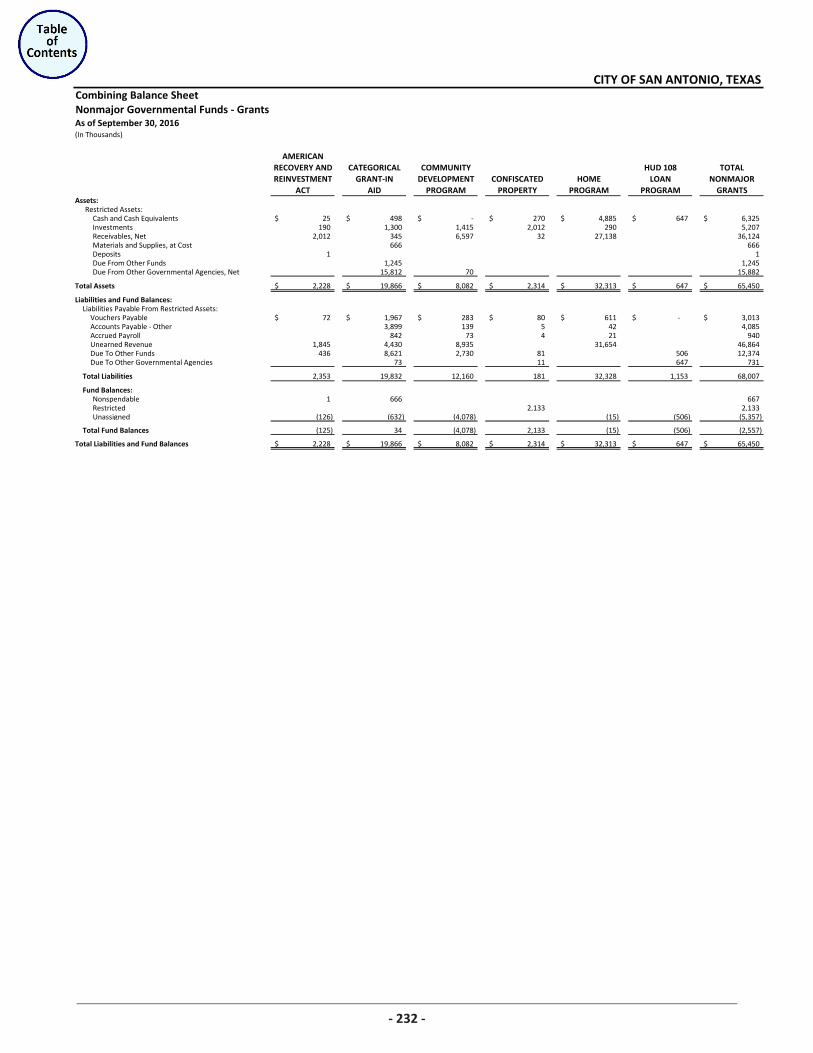
Combining Balance SheetNonmajor Governmental Funds - GrantsAs of September 30, 2016(In Thousands)
AMERICANRECOVERY AND CATEGORICAL COMMUNITY HUD 108 TOTALREINVESTMENT GRANT-IN DEVELOPMENT CONFISCATED HOME LOAN NONMAJOR
ACT AID PROGRAM PROPERTY PROGRAM PROGRAM GRANTSAssets:
Restricted Assets: Cash and Cash Equivalents 25$ 498$ -$ 270$ 4,885$ 647$ 6,325$ Investments 190 1,300 1,415 2,012 290 5,207 Receivables, Net 2,012 345 6,597 32 27,138 36,124 Materials and Supplies, at Cost 666 666 Deposits 1 1 Due From Other Funds 1,245 1,245 Due From Other Governmental Agencies, Net 15,812 70 15,882
Total Assets 2,228$ 19,866$ 8,082$ 2,314$ 32,313$ 647$ 65,450$
Liabilities and Fund Balances:Liabilities Payable From Restricted Assets:
Vouchers Payable 72$ 1,967$ 283$ 80$ 611$ -$ 3,013$ Accounts Payable - Other 3,899 139 5 42 4,085 Accrued Payroll 842 73 4 21 940 Unearned Revenue 1,845 4,430 8,935 31,654 46,864 Due To Other Funds 436 8,621 2,730 81 506 12,374 Due To Other Governmental Agencies 73 11 647 731
Total Liabilities 2,353 19,832 12,160 181 32,328 1,153 68,007
Fund Balances:Nonspendable 1 666 667 Restricted 2,133 2,133 Unassigned (126) (632) (4,078) (15) (506) (5,357)
Total Fund Balances (125) 34 (4,078) 2,133 (15) (506) (2,557)
Total Liabilities and Fund Balances 2,228$ 19,866$ 8,082$ 2,314$ 32,313$ 647$ 65,450$
CITY OF SAN ANTONIO, TEXAS
232
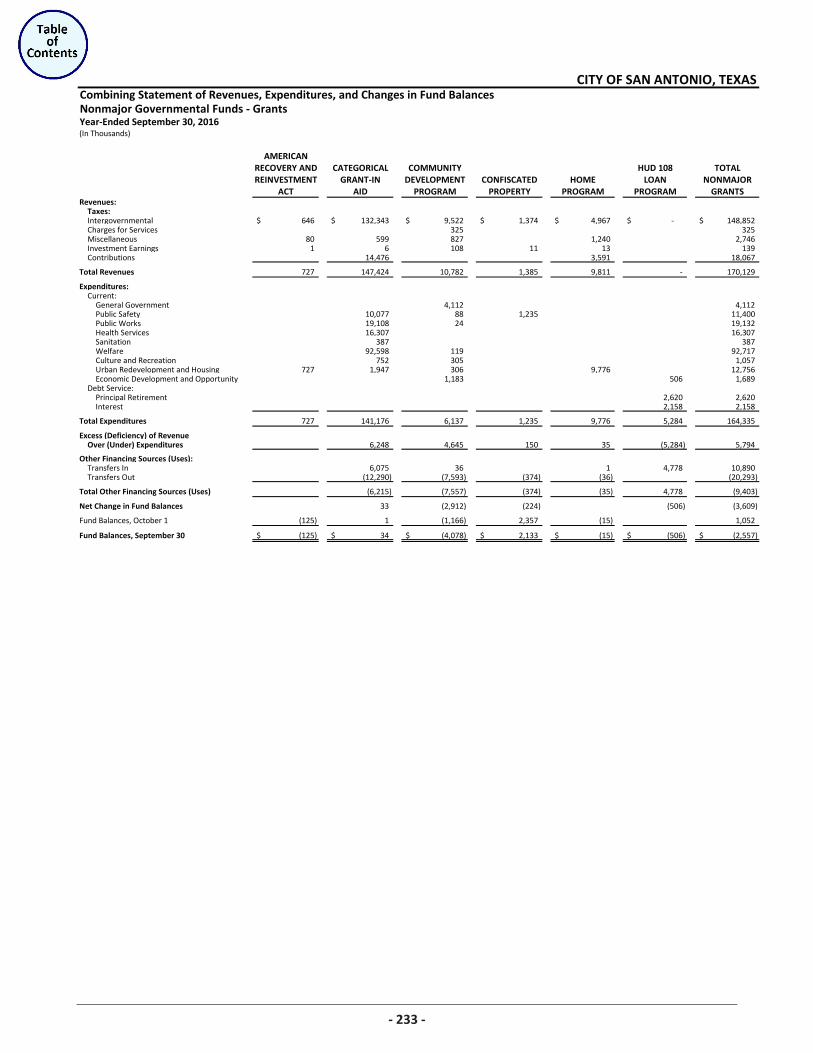
Combining Statement of Revenues, Expenditures, and Changes in Fund BalancesNonmajor Governmental Funds - GrantsYear-Ended September 30, 2016(In Thousands)
AMERICANRECOVERY AND CATEGORICAL COMMUNITY HUD 108 TOTALREINVESTMENT GRANT-IN DEVELOPMENT CONFISCATED HOME LOAN NONMAJOR
ACT AID PROGRAM PROPERTY PROGRAM PROGRAM GRANTSRevenues:
Taxes:Intergovernmental 646$ 132,343$ 9,522$ 1,374$ 4,967$ -$ 148,852$ Charges for Services 325 325 Miscellaneous 80 599 827 1,240 2,746 Investment Earnings 1 6 108 11 13 139 Contributions 14,476 3,591 18,067
Total Revenues 727 147,424 10,782 1,385 9,811 - 170,129
Expenditures:Current:
General Government 4,112 4,112 Public Safety 10,077 88 1,235 11,400 Public Works 19,108 24 19,132 Health Services 16,307 16,307 Sanitation 387 387 Welfare 92,598 119 92,717 Culture and Recreation 752 305 1,057 Urban Redevelopment and Housing 727 1,947 306 9,776 12,756 Economic Development and Opportunity 1,183 506 1,689
Debt Service: Principal Retirement 2,620 2,620 Interest 2,158 2,158
Total Expenditures 727 141,176 6,137 1,235 9,776 5,284 164,335
Excess (Deficiency) of RevenueOver (Under) Expenditures 6,248 4,645 150 35 (5,284) 5,794
Other Financing Sources (Uses):Transfers In 6,075 36 1 4,778 10,890 Transfers Out (12,290) (7,593) (374) (36) (20,293)
Total Other Financing Sources (Uses) (6,215) (7,557) (374) (35) 4,778 (9,403)
Net Change in Fund Balances 33 (2,912) (224) (506) (3,609)
Fund Balances, October 1 (125) 1 (1,166) 2,357 (15) 1,052
Fund Balances, September 30 (125)$ 34$ (4,078)$ 2,133$ (15)$ (506)$ (2,557)$
CITY OF SAN ANTONIO, TEXAS
233
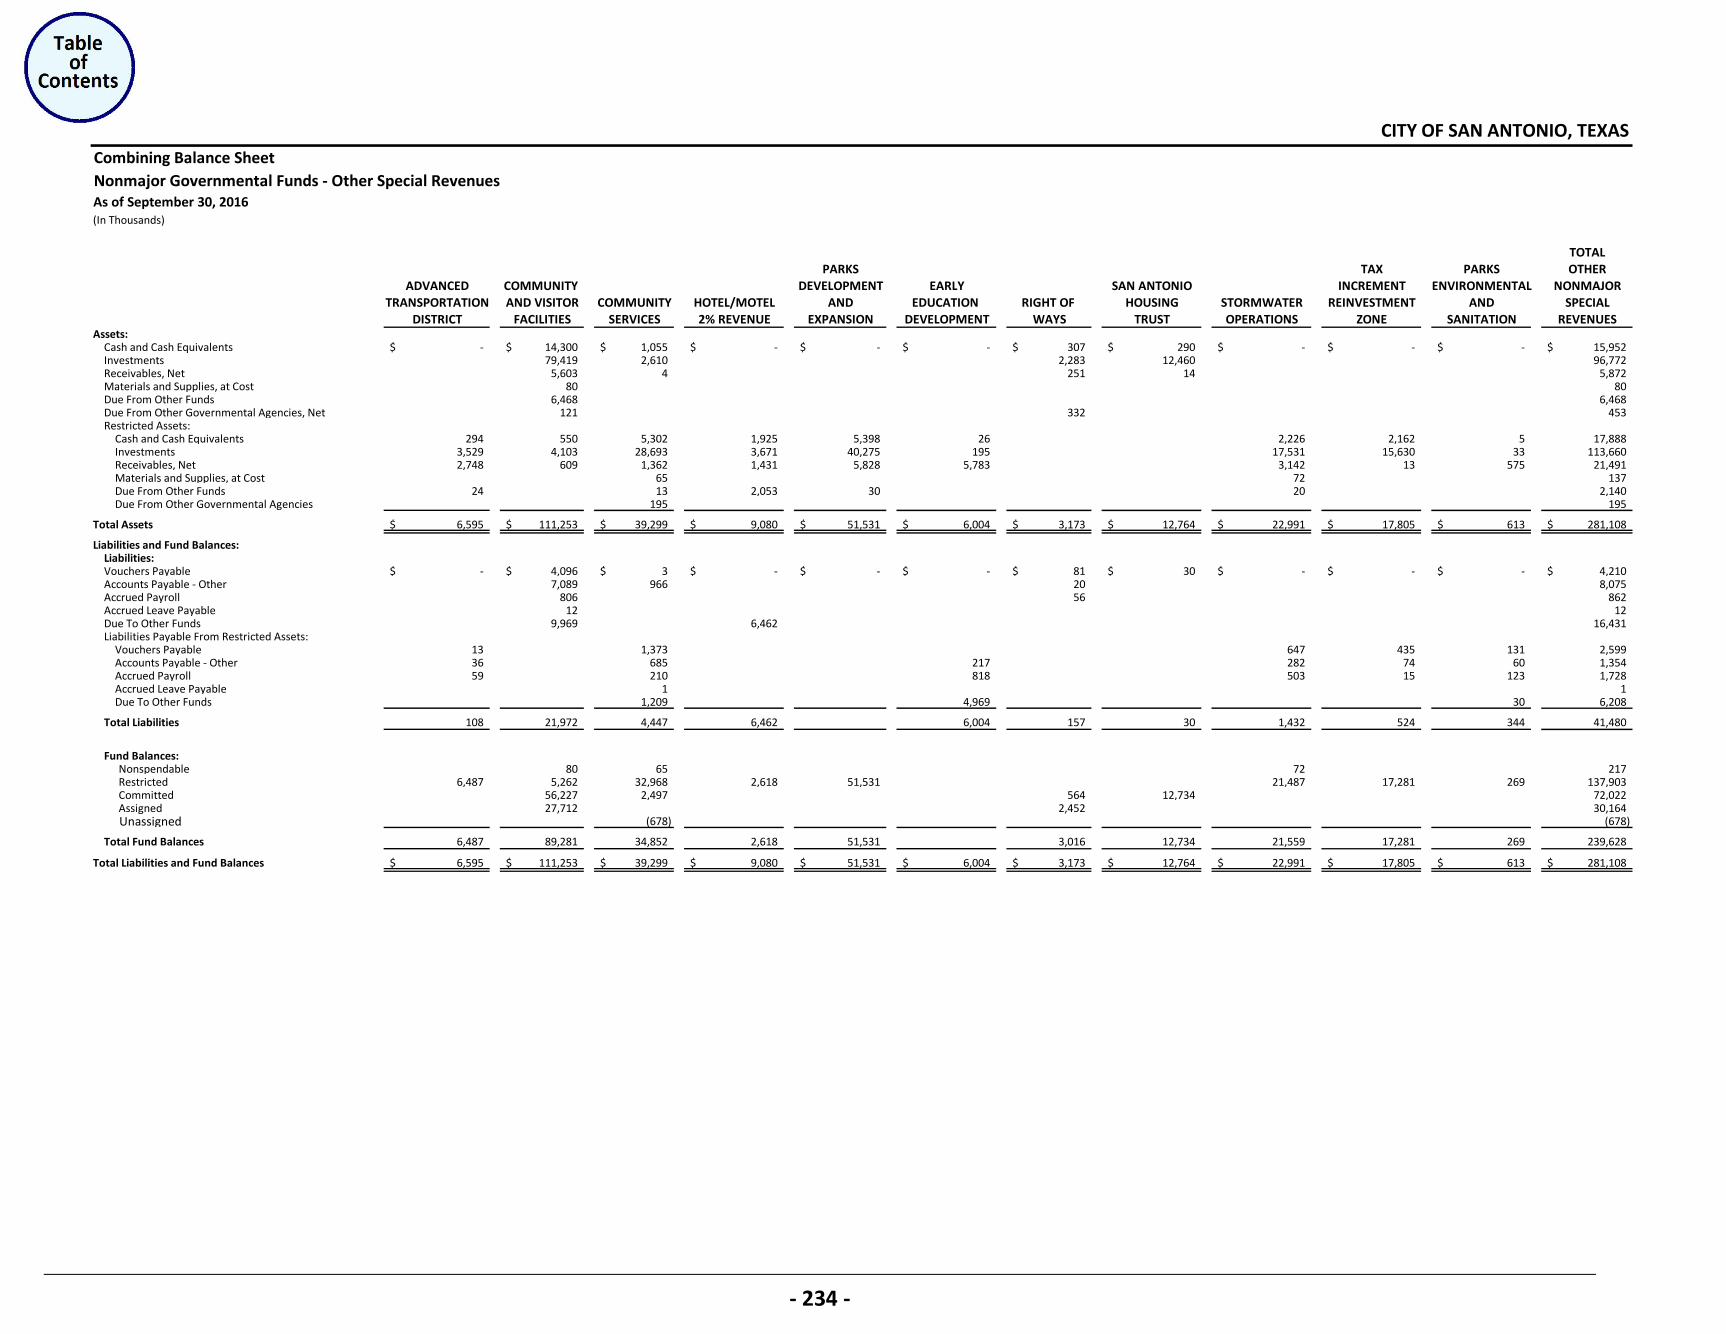
Combining Balance SheetNonmajor Governmental Funds - Other Special RevenuesAs of September 30, 2016(In Thousands)
TOTALPARKS TAX PARKS OTHER
ADVANCED COMMUNITY DEVELOPMENT EARLY SAN ANTONIO INCREMENT ENVIRONMENTAL NONMAJORTRANSPORTATION AND VISITOR COMMUNITY HOTEL/MOTEL AND EDUCATION RIGHT OF HOUSING STORMWATER REINVESTMENT AND SPECIAL
DISTRICT FACILITIES SERVICES 2% REVENUE EXPANSION DEVELOPMENT WAYS TRUST OPERATIONS ZONE SANITATION REVENUESAssets:
Cash and Cash Equivalents -$ 14,300$ 1,055$ -$ -$ -$ 307$ 290$ -$ -$ -$ 15,952$ Investments 79,419 2,610 2,283 12,460 96,772 Receivables, Net 5,603 4 251 14 5,872 Materials and Supplies, at Cost 80 80 Due From Other Funds 6,468 6,468 Due From Other Governmental Agencies, Net 121 332 453 Restricted Assets:
Cash and Cash Equivalents 294 550 5,302 1,925 5,398 26 2,226 2,162 5 17,888 Investments 3,529 4,103 28,693 3,671 40,275 195 17,531 15,630 33 113,660 Receivables, Net 2,748 609 1,362 1,431 5,828 5,783 3,142 13 575 21,491 Materials and Supplies, at Cost 65 72 137 Due From Other Funds 24 13 2,053 30 20 2,140 Due From Other Governmental Agencies 195 195
Total Assets 6,595$ 111,253$ 39,299$ 9,080$ 51,531$ 6,004$ 3,173$ 12,764$ 22,991$ 17,805$ 613$ 281,108$
Liabilities and Fund Balances:Liabilities:Vouchers Payable -$ 4,096$ 3$ -$ -$ -$ 81$ 30$ -$ -$ -$ 4,210$ Accounts Payable - Other 7,089 966 20 8,075 Accrued Payroll 806 56 862 Accrued Leave Payable 12 12 Due To Other Funds 9,969 6,462 16,431 Liabilities Payable From Restricted Assets:
Vouchers Payable 13 1,373 647 435 131 2,599 Accounts Payable - Other 36 685 217 282 74 60 1,354 Accrued Payroll 59 210 818 503 15 123 1,728 Accrued Leave Payable 1 1 Due To Other Funds 1,209 4,969 30 6,208
Total Liabilities 108 21,972 4,447 6,462 6,004 157 30 1,432 524 344 41,480
Fund Balances:Nonspendable 80 65 72 217 Restricted 6,487 5,262 32,968 2,618 51,531 21,487 17,281 269 137,903 Committed 56,227 2,497 564 12,734 72,022 Assigned 27,712 2,452 30,164 Unassigned (678) (678)
Total Fund Balances 6,487 89,281 34,852 2,618 51,531 3,016 12,734 21,559 17,281 269 239,628
Total Liabilities and Fund Balances 6,595$ 111,253$ 39,299$ 9,080$ 51,531$ 6,004$ 3,173$ 12,764$ 22,991$ 17,805$ 613$ 281,108$
CITY OF SAN ANTONIO, TEXAS
- 234 -
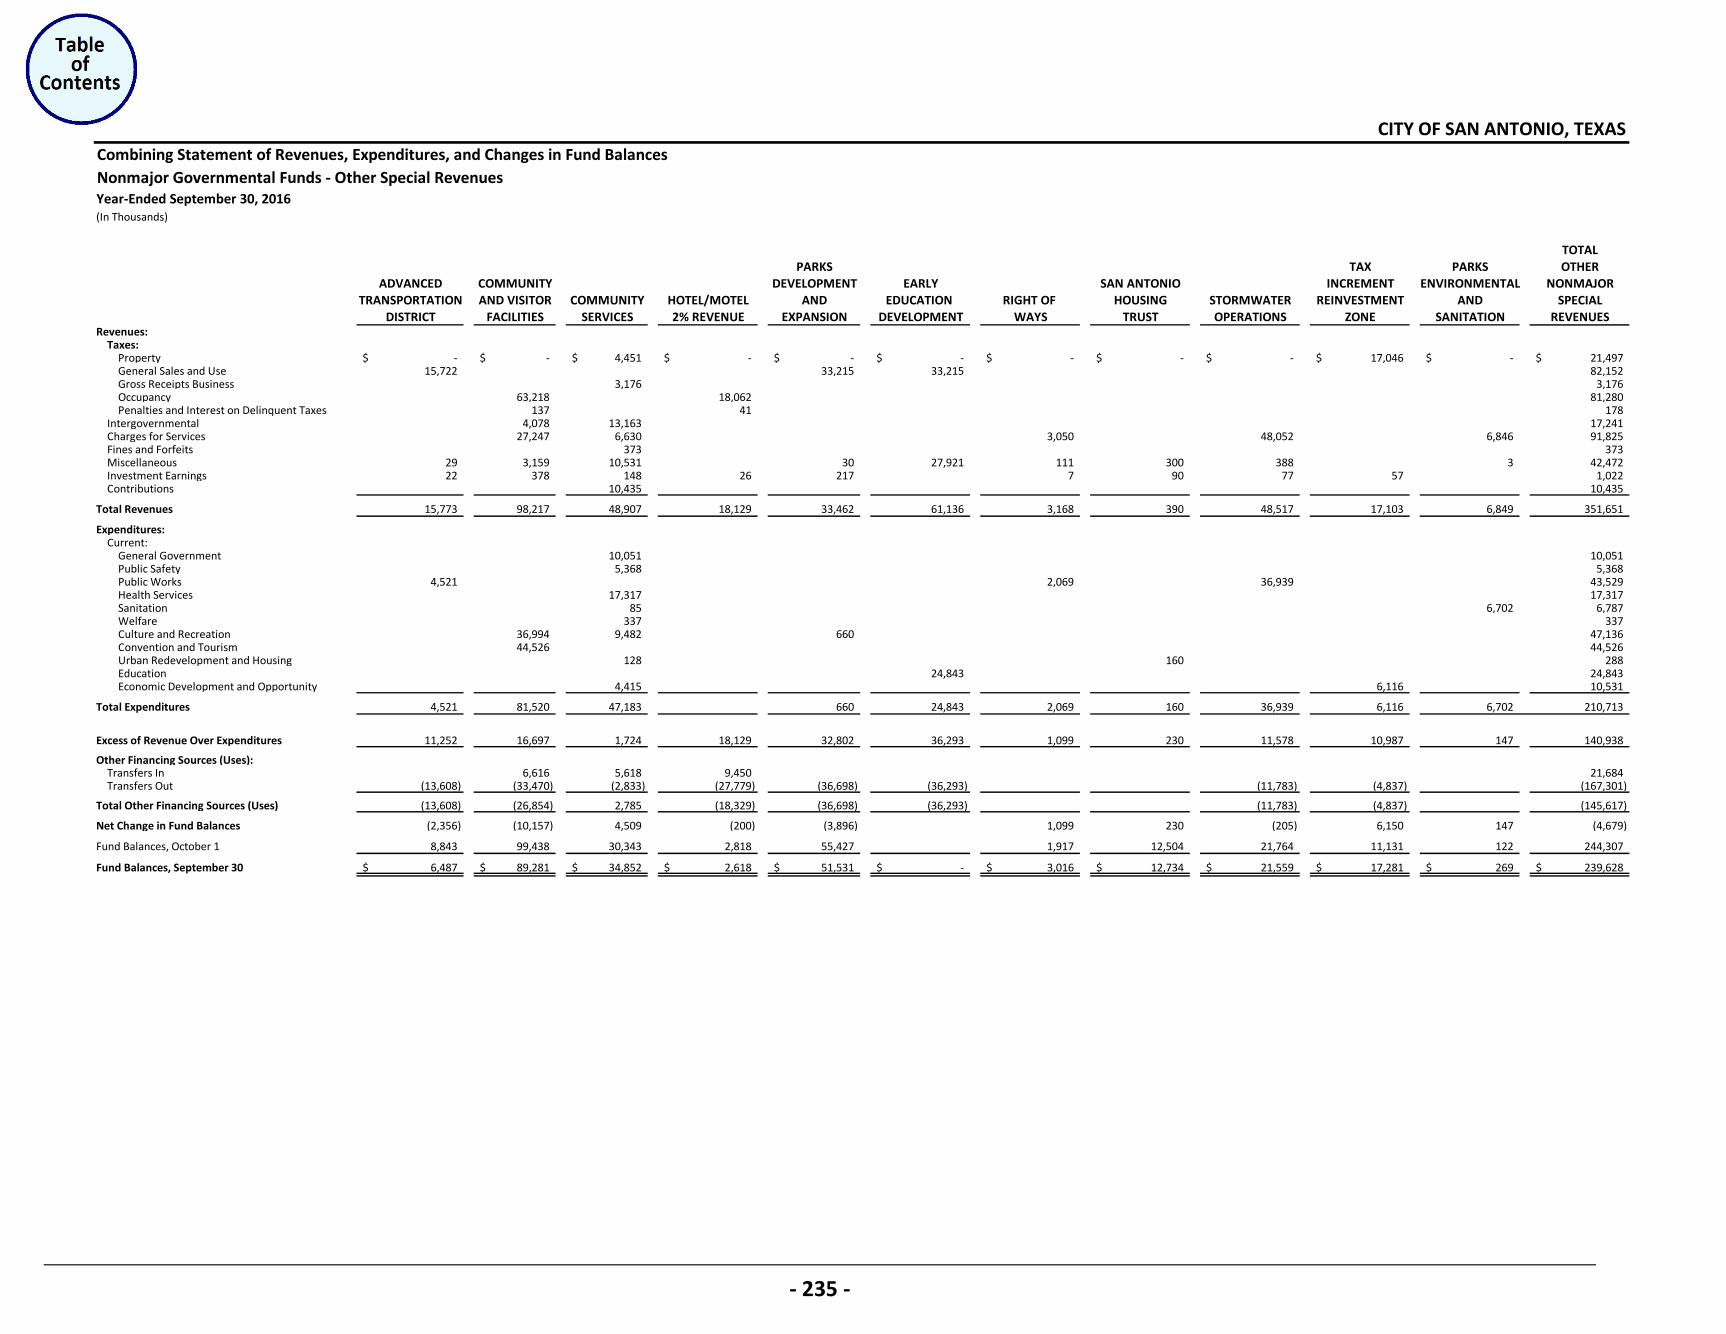
Combining Statement of Revenues, Expenditures, and Changes in Fund BalancesNonmajor Governmental Funds - Other Special RevenuesYear-Ended September 30, 2016(In Thousands)
TOTALPARKS TAX PARKS OTHER
ADVANCED COMMUNITY DEVELOPMENT EARLY SAN ANTONIO INCREMENT ENVIRONMENTAL NONMAJORTRANSPORTATION AND VISITOR COMMUNITY HOTEL/MOTEL AND EDUCATION RIGHT OF HOUSING STORMWATER REINVESTMENT AND SPECIAL
DISTRICT FACILITIES SERVICES 2% REVENUE EXPANSION DEVELOPMENT WAYS TRUST OPERATIONS ZONE SANITATION REVENUESRevenues:
Taxes:Property -$ -$ 4,451$ -$ -$ -$ -$ -$ -$ 17,046$ -$ 21,497$ General Sales and Use 15,722 33,215 33,215 82,152 Gross Receipts Business 3,176 3,176 Occupancy 63,218 18,062 81,280 Penalties and Interest on Delinquent Taxes 137 41 178
Intergovernmental 4,078 13,163 17,241 Charges for Services 27,247 6,630 3,050 48,052 6,846 91,825 Fines and Forfeits 373 373 Miscellaneous 29 3,159 10,531 30 27,921 111 300 388 3 42,472 Investment Earnings 22 378 148 26 217 7 90 77 57 1,022 Contributions 10,435 10,435
Total Revenues 15,773 98,217 48,907 18,129 33,462 61,136 3,168 390 48,517 17,103 6,849 351,651
Expenditures:Current:
General Government 10,051 10,051 Public Safety 5,368 5,368 Public Works 4,521 2,069 36,939 43,529 Health Services 17,317 17,317 Sanitation 85 6,702 6,787 Welfare 337 337 Culture and Recreation 36,994 9,482 660 47,136 Convention and Tourism 44,526 44,526 Urban Redevelopment and Housing 128 160 288 Education 24,843 24,843 Economic Development and Opportunity 4,415 6,116 10,531
Total Expenditures 4,521 81,520 47,183 660 24,843 2,069 160 36,939 6,116 6,702 210,713
Excess of Revenue Over Expenditures 11,252 16,697 1,724 18,129 32,802 36,293 1,099 230 11,578 10,987 147 140,938
Other Financing Sources (Uses):Transfers In 6,616 5,618 9,450 21,684 Transfers Out (13,608) (33,470) (2,833) (27,779) (36,698) (36,293) (11,783) (4,837) (167,301)
Total Other Financing Sources (Uses) (13,608) (26,854) 2,785 (18,329) (36,698) (36,293) (11,783) (4,837) (145,617)
Net Change in Fund Balances (2,356) (10,157) 4,509 (200) (3,896) 1,099 230 (205) 6,150 147 (4,679)
Fund Balances, October 1 8,843 99,438 30,343 2,818 55,427 1,917 12,504 21,764 11,131 122 244,307
Fund Balances, September 30 6,487$ 89,281$ 34,852$ 2,618$ 51,531$ -$ 3,016$ 12,734$ 21,559$ 17,281$ 269$ 239,628$
CITY OF SAN ANTONIO, TEXAS
- 235 -
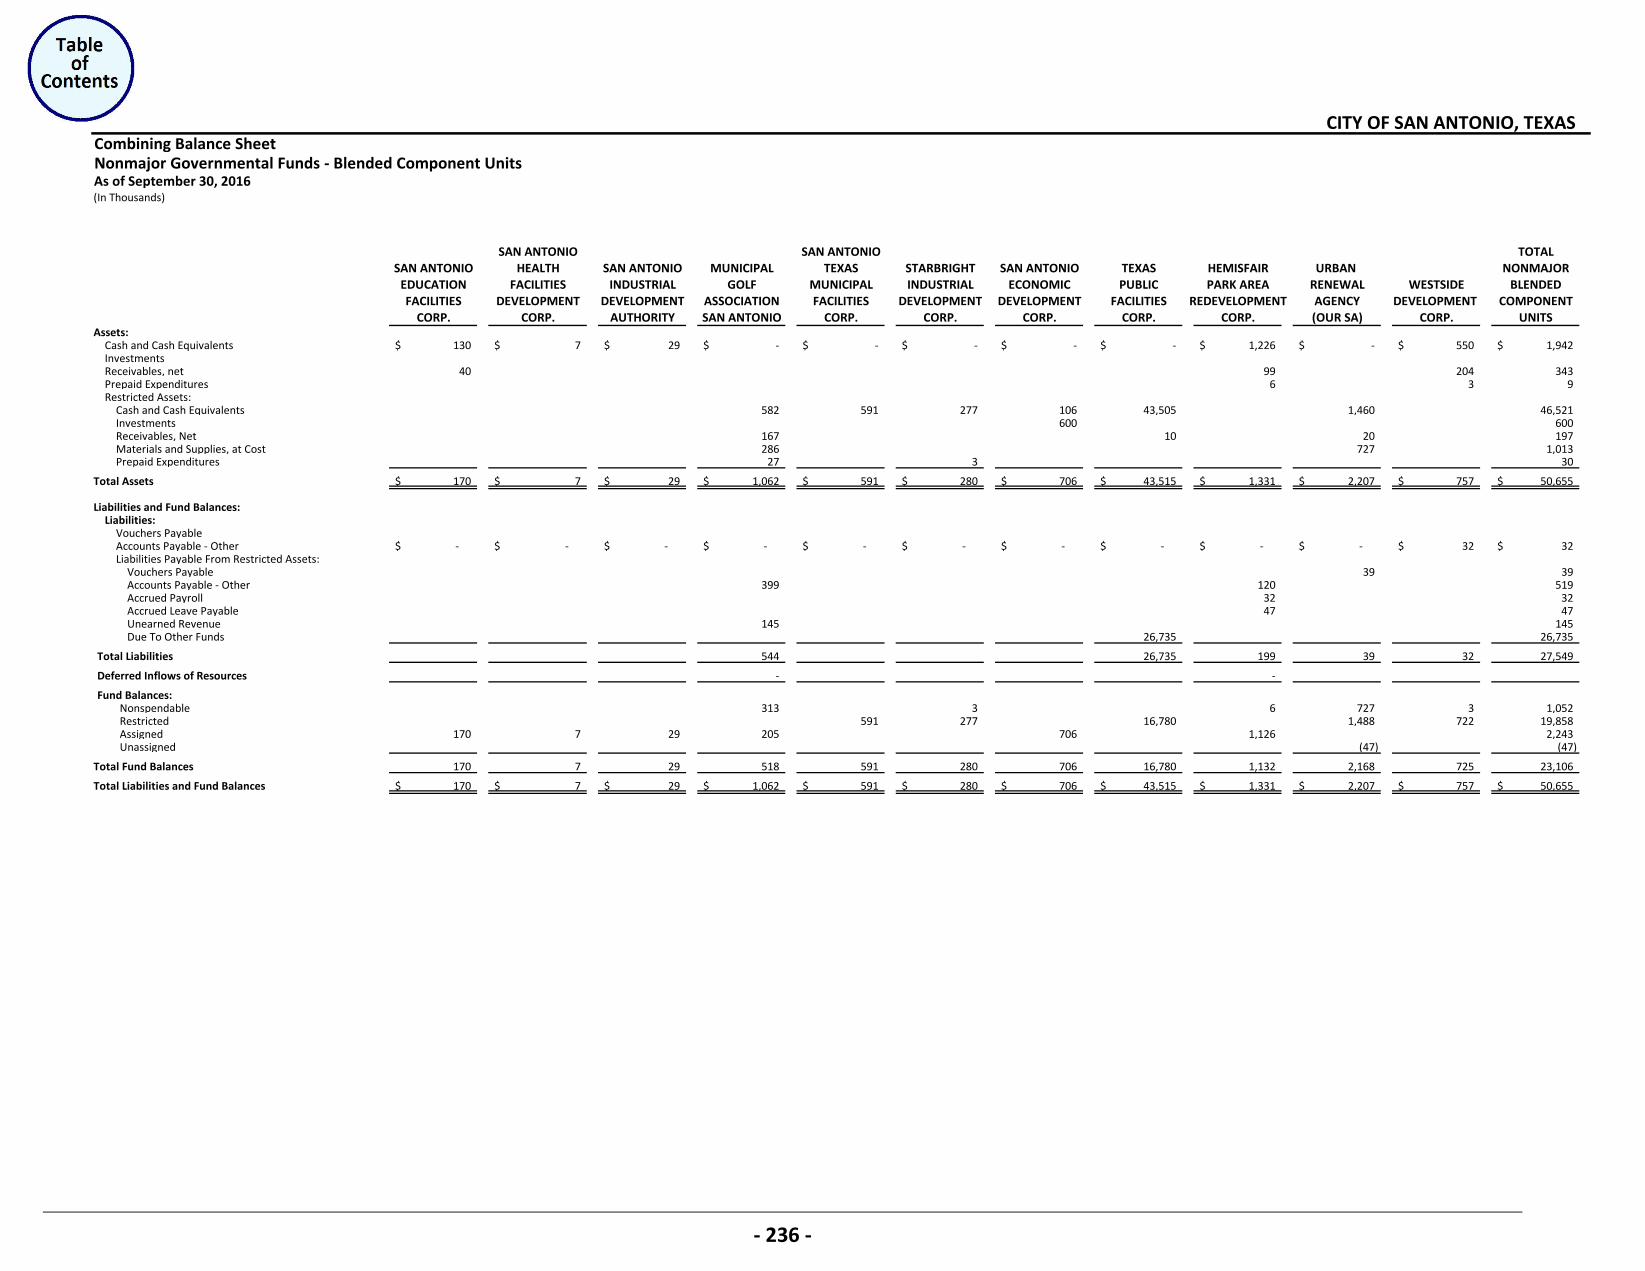
Combining Balance SheetNonmajor Governmental Funds - Blended Component UnitsAs of September 30, 2016(In Thousands)
SAN ANTONIO SAN ANTONIO TOTALSAN ANTONIO HEALTH SAN ANTONIO MUNICIPAL TEXAS STARBRIGHT SAN ANTONIO TEXAS HEMISFAIR URBAN NONMAJOR
EDUCATION FACILITIES INDUSTRIAL GOLF MUNICIPAL INDUSTRIAL ECONOMIC PUBLIC PARK AREA RENEWAL WESTSIDE BLENDEDFACILITIES DEVELOPMENT DEVELOPMENT ASSOCIATION FACILITIES DEVELOPMENT DEVELOPMENT FACILITIES REDEVELOPMENT AGENCY DEVELOPMENT COMPONENT
CORP. CORP. AUTHORITY SAN ANTONIO CORP. CORP. CORP. CORP. CORP. (OUR SA) CORP. UNITSAssets:
Cash and Cash Equivalents 130$ 7$ 29$ -$ -$ -$ -$ -$ 1,226$ -$ 550$ 1,942$ Investments Receivables, net 40 99 204 343 Prepaid Expenditures 6 3 9 Restricted Assets:
Cash and Cash Equivalents 582 591 277 106 43,505 1,460 46,521 Investments 600 600 Receivables, Net 167 10 20 197 Materials and Supplies, at Cost 286 727 1,013 Prepaid Expenditures 27 3 30
Total Assets 170$ 7$ 29$ 1,062$ 591$ 280$ 706$ 43,515$ 1,331$ 2,207$ 757$ 50,655$
Liabilities and Fund Balances:Liabilities:
Vouchers Payable Accounts Payable - Other -$ -$ -$ -$ -$ -$ -$ -$ -$ -$ 32$ 32$ Liabilities Payable From Restricted Assets:
Vouchers Payable 39 39 Accounts Payable - Other 399 120 519 Accrued Payroll 32 32 Accrued Leave Payable 47 47 Unearned Revenue 145 145 Due To Other Funds 26,735 26,735
Total Liabilities 544 26,735 199 39 32 27,549
Deferred Inflows of Resources - -
Fund Balances:Nonspendable 313 3 6 727 3 1,052 Restricted 591 277 16,780 1,488 722 19,858 Assigned 170 7 29 205 706 1,126 2,243 Unassigned (47) (47)
Total Fund Balances 170 7 29 518 591 280 706 16,780 1,132 2,168 725 23,106
Total Liabilities and Fund Balances 170$ 7$ 29$ 1,062$ 591$ 280$ 706$ 43,515$ 1,331$ 2,207$ 757$ 50,655$
CITY OF SAN ANTONIO, TEXAS
- 236 -
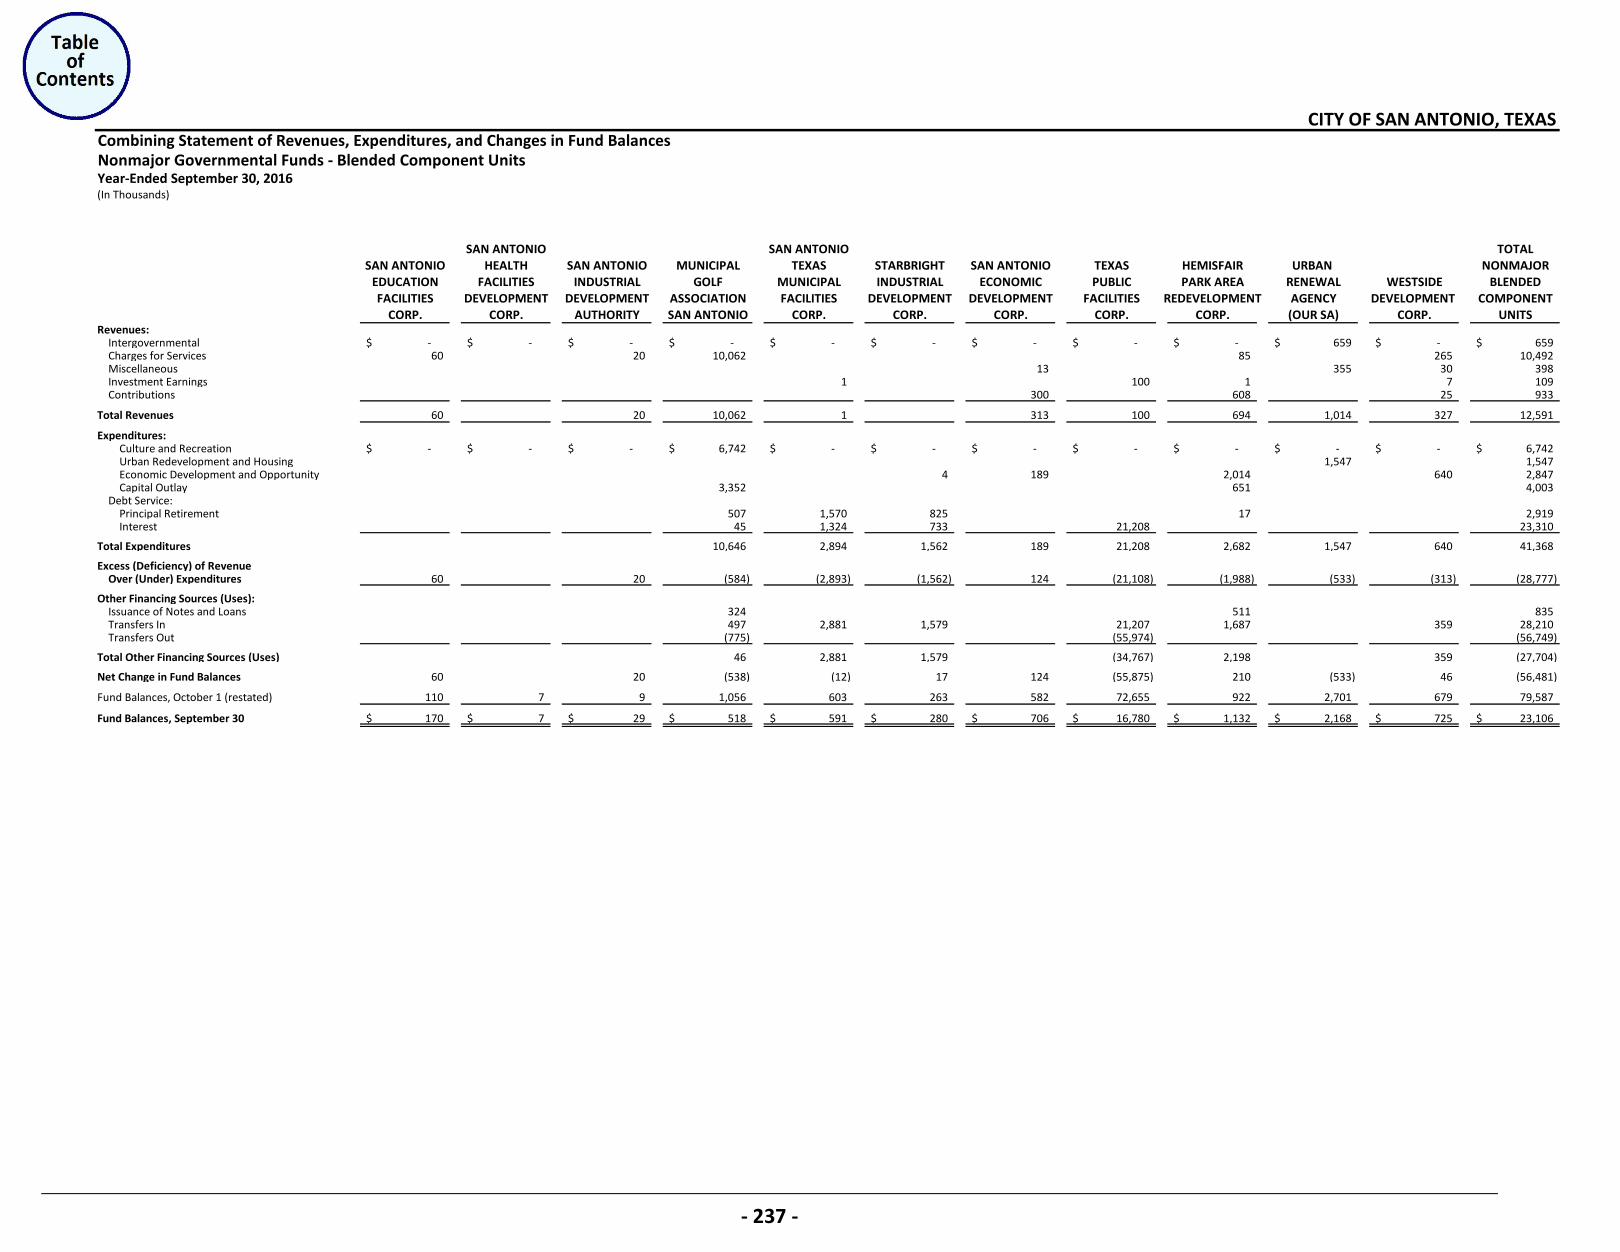
Combining Statement of Revenues, Expenditures, and Changes in Fund BalancesNonmajor Governmental Funds - Blended Component UnitsYear-Ended September 30, 2016(In Thousands)
SAN ANTONIO SAN ANTONIO TOTALSAN ANTONIO HEALTH SAN ANTONIO MUNICIPAL TEXAS STARBRIGHT SAN ANTONIO TEXAS HEMISFAIR URBAN NONMAJOR
EDUCATION FACILITIES INDUSTRIAL GOLF MUNICIPAL INDUSTRIAL ECONOMIC PUBLIC PARK AREA RENEWAL WESTSIDE BLENDEDFACILITIES DEVELOPMENT DEVELOPMENT ASSOCIATION FACILITIES DEVELOPMENT DEVELOPMENT FACILITIES REDEVELOPMENT AGENCY DEVELOPMENT COMPONENT
CORP. CORP. AUTHORITY SAN ANTONIO CORP. CORP. CORP. CORP. CORP. (OUR SA) CORP. UNITSRevenues:
Intergovernmental -$ -$ -$ -$ -$ -$ -$ -$ -$ 659$ -$ 659$ Charges for Services 60 20 10,062 85 265 10,492 Miscellaneous 13 355 30 398 Investment Earnings 1 100 1 7 109 Contributions 300 608 25 933
Total Revenues 60 20 10,062 1 313 100 694 1,014 327 12,591
Expenditures:Culture and Recreation -$ -$ -$ 6,742$ -$ -$ -$ -$ -$ -$ -$ 6,742$ Urban Redevelopment and Housing 1,547 1,547 Economic Development and Opportunity 4 189 2,014 640 2,847 Capital Outlay 3,352 651 4,003
Debt Service: Principal Retirement 507 1,570 825 17 2,919 Interest 45 1,324 733 21,208 23,310
Total Expenditures 10,646 2,894 1,562 189 21,208 2,682 1,547 640 41,368
Excess (Deficiency) of RevenueOver (Under) Expenditures 60 20 (584) (2,893) (1,562) 124 (21,108) (1,988) (533) (313) (28,777)
Other Financing Sources (Uses):Issuance of Notes and Loans 324 511 835 Transfers In 497 2,881 1,579 21,207 1,687 359 28,210 Transfers Out (775) (55,974) (56,749)
Total Other Financing Sources (Uses) 46 2,881 1,579 (34,767) 2,198 359 (27,704)
Net Change in Fund Balances 60 20 (538) (12) 17 124 (55,875) 210 (533) 46 (56,481)
Fund Balances, October 1 (restated) 110 7 9 1,056 603 263 582 72,655 922 2,701 679 79,587
Fund Balances, September 30 170$ 7$ 29$ 518$ 591$ 280$ 706$ 16,780$ 1,132$ 2,168$ 725$ 23,106$
CITY OF SAN ANTONIO, TEXAS
- 237 -
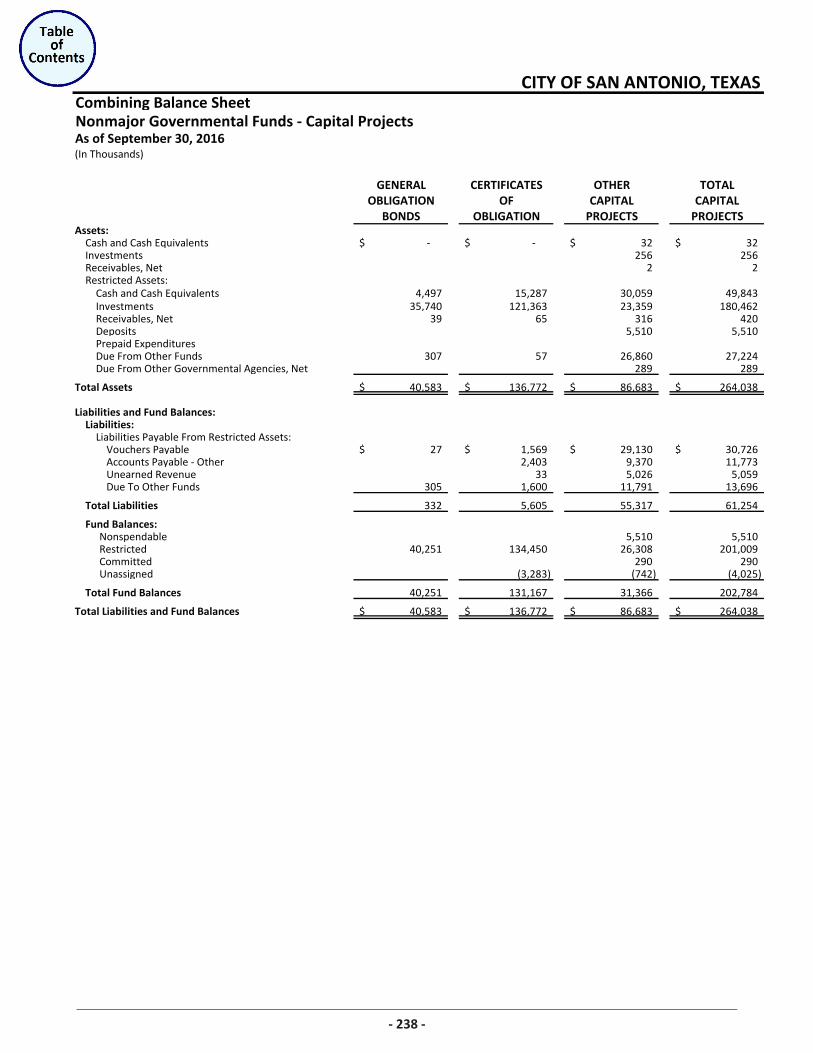
Combining Balance SheetNonmajor Governmental Funds - Capital ProjectsAs of September 30, 2016(In Thousands)
GENERAL CERTIFICATES OTHER TOTALOBLIGATION OF CAPITAL CAPITAL
BONDS OBLIGATION PROJECTS PROJECTSAssets:
Cash and Cash Equivalents -$ -$ 32$ 32$ Investments 256 256 Receivables, Net 2 2 Restricted Assets:
Cash and Cash Equivalents 4,497 15,287 30,059 49,843 Investments 35,740 121,363 23,359 180,462 Receivables, Net 39 65 316 420 Deposits 5,510 5,510 Prepaid Expenditures Due From Other Funds 307 57 26,860 27,224 Due From Other Governmental Agencies, Net 289 289
Total Assets 40,583$ 136,772$ 86,683$ 264,038$
Liabilities and Fund Balances:Liabilities:
Liabilities Payable From Restricted Assets: Vouchers Payable 27$ 1,569$ 29,130$ 30,726$ Accounts Payable - Other 2,403 9,370 11,773 Unearned Revenue 33 5,026 5,059 Due To Other Funds 305 1,600 11,791 13,696
Total Liabilities 332 5,605 55,317 61,254
Fund Balances:Nonspendable 5,510 5,510 Restricted 40,251 134,450 26,308 201,009 Committed 290 290 Unassigned (3,283) (742) (4,025)
Total Fund Balances 40,251 131,167 31,366 202,784
Total Liabilities and Fund Balances 40,583$ 136,772$ 86,683$ 264,038$
CITY OF SAN ANTONIO, TEXAS
238
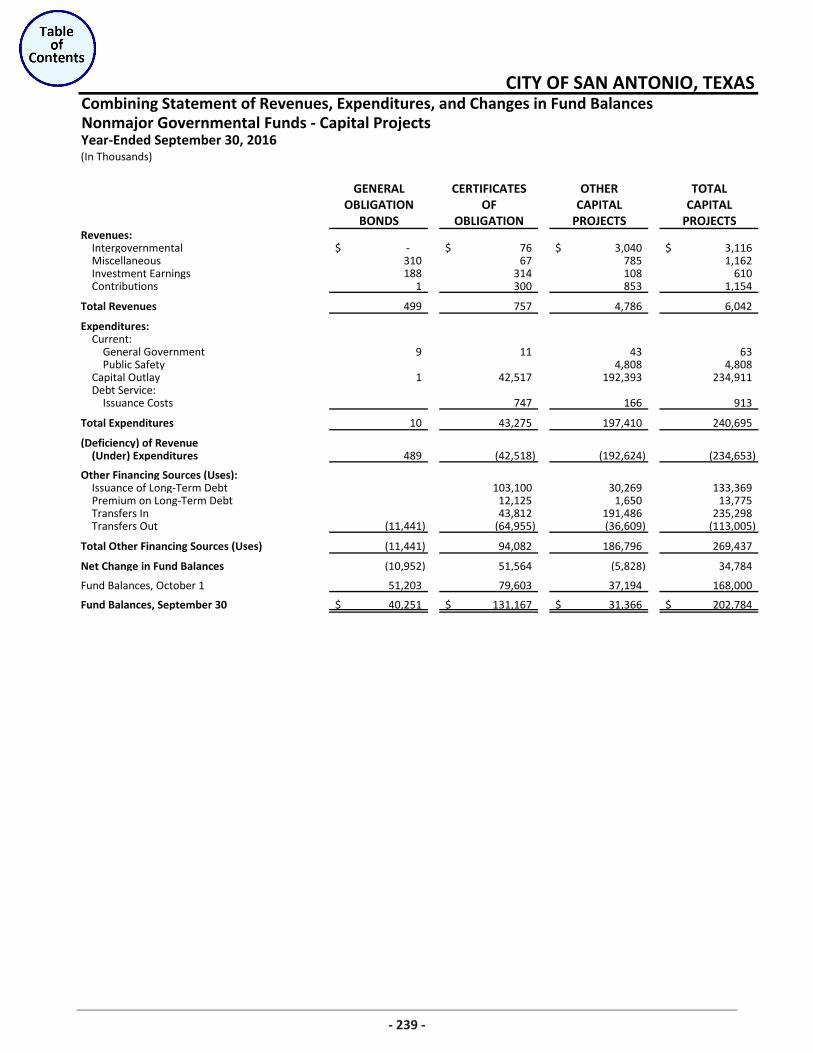
Combining Statement of Revenues, Expenditures, and Changes in Fund BalancesNonmajor Governmental Funds - Capital Projects
(In Thousands)
GENERAL CERTIFICATES OTHER TOTALOBLIGATION OF CAPITAL CAPITAL
BONDS OBLIGATION PROJECTS PROJECTSRevenues:
Intergovernmental -$ 76$ 3,040$ 3,116$ Miscellaneous 310 67 785 1,162 Investment Earnings 188 314 108 610 Contributions 1 300 853 1,154
Total Revenues 499 757 4,786 6,042
Expenditures:Current:
General Government 9 11 43 63 Public Safety 4,808 4,808
Capital Outlay 1 42,517 192,393 234,911 Debt Service:
Issuance Costs 747 166 913
Total Expenditures 10 43,275 197,410 240,695
(Deficiency) of Revenue(Under) Expenditures 489 (42,518) (192,624) (234,653)
Other Financing Sources (Uses):Issuance of Long-Term Debt 103,100 30,269 133,369 Premium on Long-Term Debt 12,125 1,650 13,775 Transfers In 43,812 191,486 235,298 Transfers Out (11,441) (64,955) (36,609) (113,005)
Total Other Financing Sources (Uses) (11,441) 94,082 186,796 269,437
Net Change in Fund Balances (10,952) 51,564 (5,828) 34,784
Fund Balances, October 1 51,203 79,603 37,194 168,000
Fund Balances, September 30 40,251$ 131,167$ 31,366$ 202,784$
CITY OF SAN ANTONIO, TEXAS
Year-Ended September 30, 2016
239
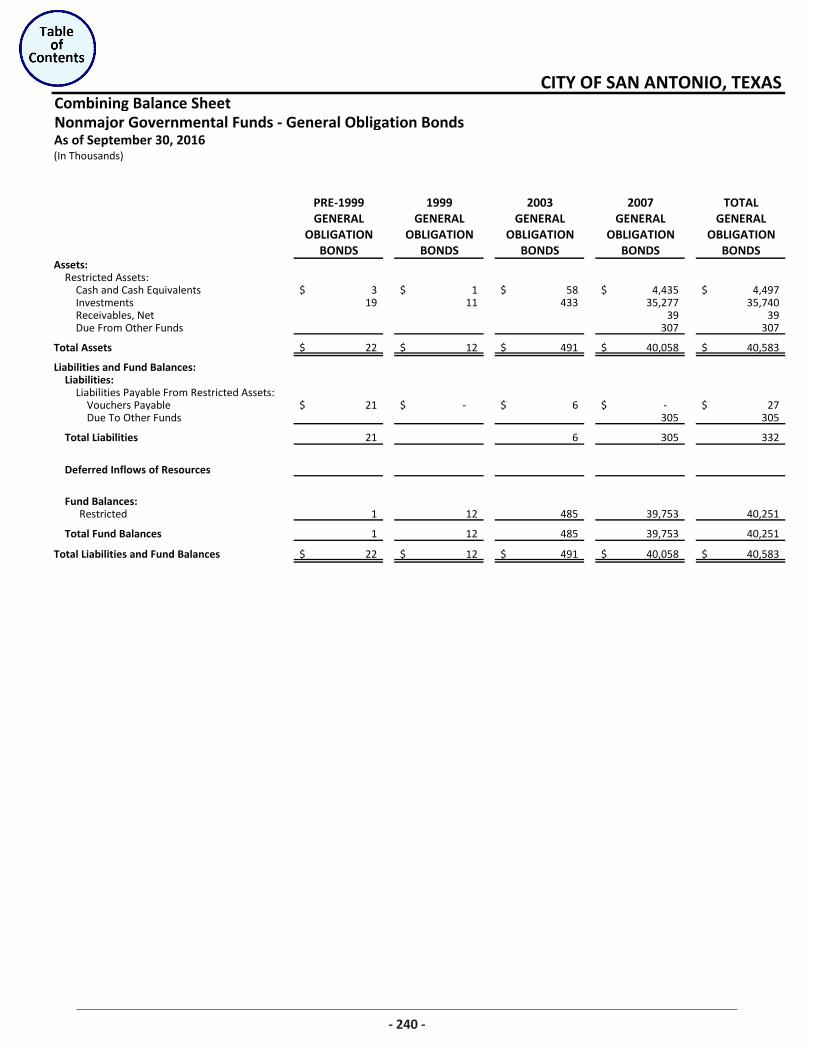
Combining Balance SheetNonmajor Governmental Funds - General Obligation BondsAs of September 30, 2016(In Thousands)
PRE-1999 1999 2003 2007 TOTALGENERAL GENERAL GENERAL GENERAL GENERAL
OBLIGATION OBLIGATION OBLIGATION OBLIGATION OBLIGATIONBONDS BONDS BONDS BONDS BONDS
Assets:Restricted Assets:
Cash and Cash Equivalents 3$ 1$ 58$ 4,435$ 4,497$ Investments 19 11 433 35,277 35,740 Receivables, Net 39 39 Due From Other Funds 307 307
Total Assets 22$ 12$ 491$ 40,058$ 40,583$
Liabilities and Fund Balances:Liabilities:
Liabilities Payable From Restricted Assets: Vouchers Payable 21$ -$ 6$ -$ 27$ Due To Other Funds 305 305
Total Liabilities 21 6 305 332
Deferred Inflows of Resources
Fund Balances:Restricted 1 12 485 39,753 40,251
Total Fund Balances 1 12 485 39,753 40,251
Total Liabilities and Fund Balances 22$ 12$ 491$ 40,058$ 40,583$
CITY OF SAN ANTONIO, TEXAS
240
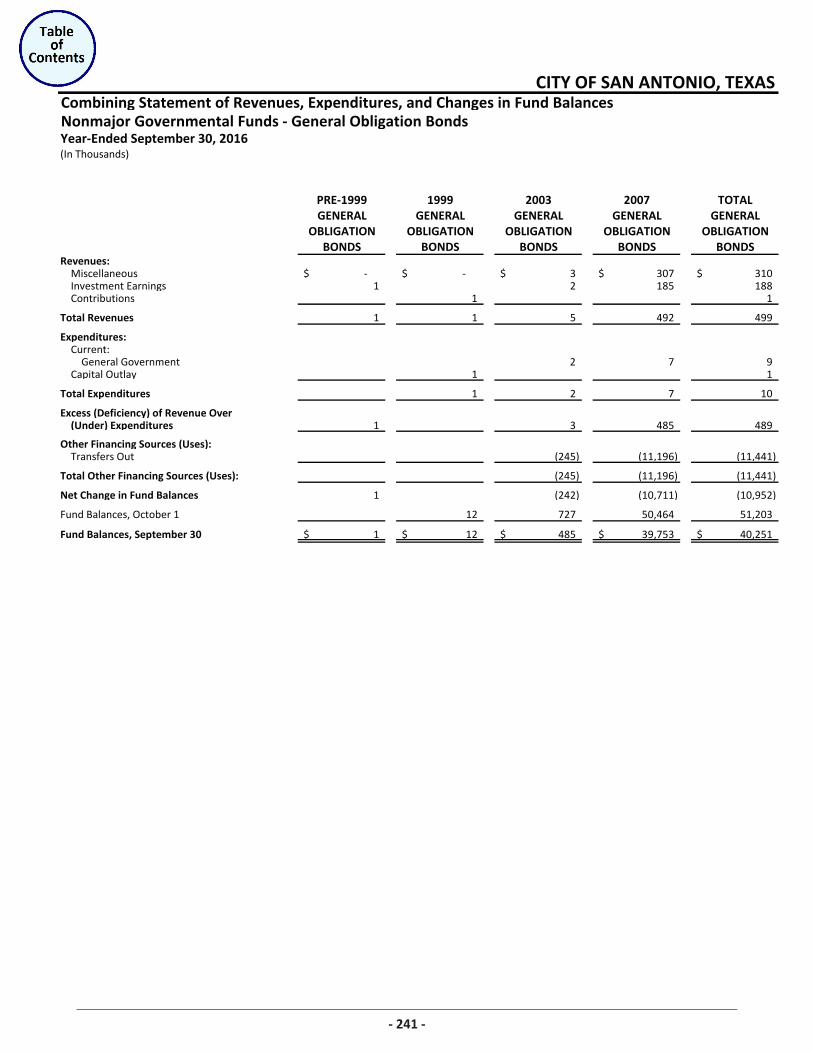
Combining Statement of Revenues, Expenditures, and Changes in Fund BalancesNonmajor Governmental Funds - General Obligation BondsYear-Ended September 30, 2016(In Thousands)
PRE-1999 1999 2003 2007 TOTALGENERAL GENERAL GENERAL GENERAL GENERAL
OBLIGATION OBLIGATION OBLIGATION OBLIGATION OBLIGATIONBONDS BONDS BONDS BONDS BONDS
Revenues:Miscellaneous -$ -$ 3$ 307$ 310$ Investment Earnings 1 2 185 188 Contributions 1 1
Total Revenues 1 1 5 492 499
Expenditures:Current:
General Government 2 7 9 Capital Outlay 1 1
Total Expenditures 1 2 7 10
Excess (Deficiency) of Revenue Over(Under) Expenditures 1 3 485 489
Other Financing Sources (Uses):Transfers Out (245) (11,196) (11,441)
Total Other Financing Sources (Uses): (245) (11,196) (11,441)
Net Change in Fund Balances 1 (242) (10,711) (10,952)
Fund Balances, October 1 12 727 50,464 51,203
Fund Balances, September 30 1$ 12$ 485$ 39,753$ 40,251$
CITY OF SAN ANTONIO, TEXAS
241
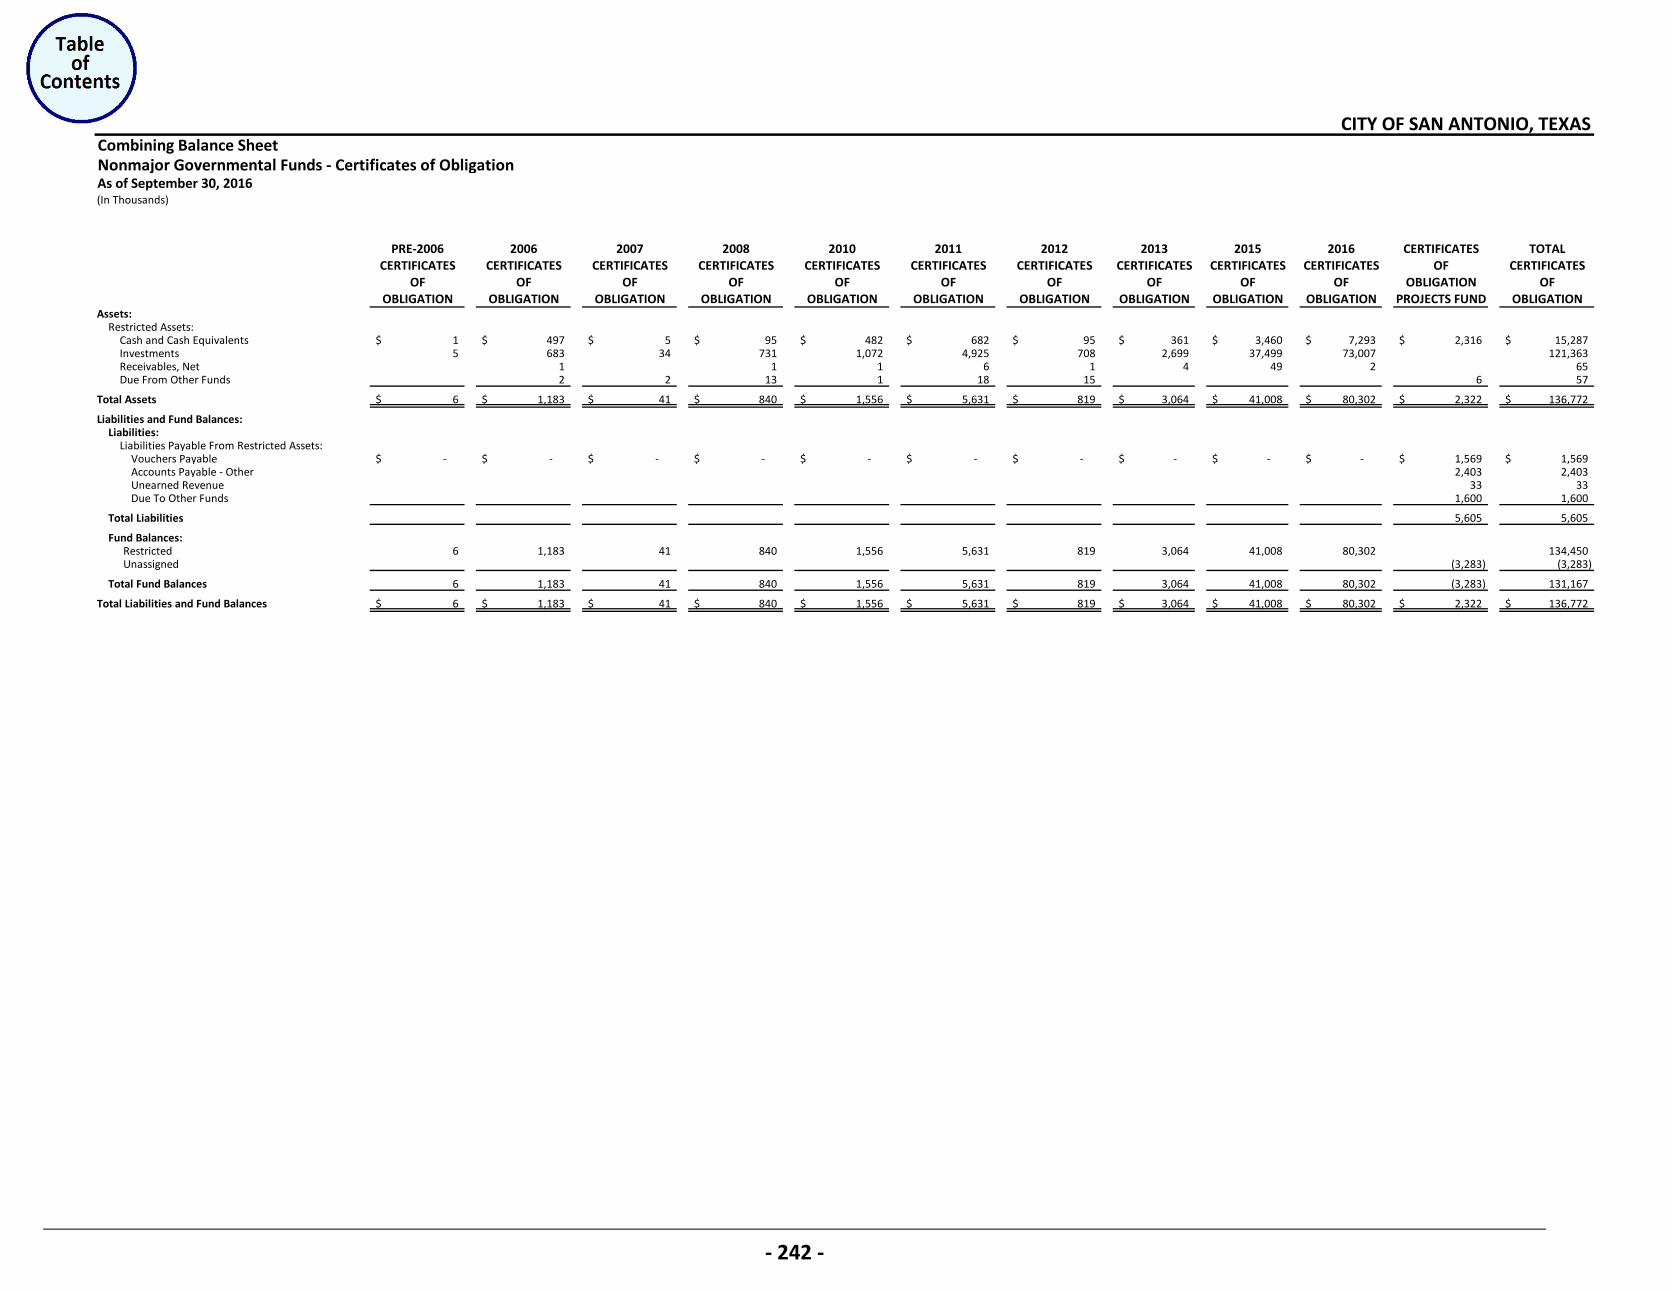
Combining Balance SheetNonmajor Governmental Funds - Certificates of ObligationAs of September 30, 2016(In Thousands)
PRE-2006 2006 2007 2008 2010 2011 2012 2013 2015 2016 CERTIFICATES TOTALCERTIFICATES CERTIFICATES CERTIFICATES CERTIFICATES CERTIFICATES CERTIFICATES CERTIFICATES CERTIFICATES CERTIFICATES CERTIFICATES OF CERTIFICATES
OF OF OF OF OF OF OF OF OF OF OBLIGATION OFOBLIGATION OBLIGATION OBLIGATION OBLIGATION OBLIGATION OBLIGATION OBLIGATION OBLIGATION OBLIGATION OBLIGATION PROJECTS FUND OBLIGATION
Assets:Restricted Assets:
Cash and Cash Equivalents 1$ 497$ 5$ 95$ 482$ 682$ 95$ 361$ 3,460$ 7,293$ 2,316$ 15,287$ Investments 5 683 34 731 1,072 4,925 708 2,699 37,499 73,007 121,363 Receivables, Net 1 1 1 6 1 4 49 2 65 Due From Other Funds 2 2 13 1 18 15 6 57
Total Assets 6$ 1,183$ 41$ 840$ 1,556$ 5,631$ 819$ 3,064$ 41,008$ 80,302$ 2,322$ 136,772$
Liabilities and Fund Balances:Liabilities:
Liabilities Payable From Restricted Assets: Vouchers Payable -$ -$ -$ -$ -$ -$ -$ -$ -$ -$ 1,569$ 1,569$ Accounts Payable - Other 2,403 2,403 Unearned Revenue 33 33 Due To Other Funds 1,600 1,600
Total Liabilities 5,605 5,605
Fund Balances:Restricted 6 1,183 41 840 1,556 5,631 819 3,064 41,008 80,302 134,450 Unassigned (3,283) (3,283)
Total Fund Balances 6 1,183 41 840 1,556 5,631 819 3,064 41,008 80,302 (3,283) 131,167
Total Liabilities and Fund Balances 6$ 1,183$ 41$ 840$ 1,556$ 5,631$ 819$ 3,064$ 41,008$ 80,302$ 2,322$ 136,772$
CITY OF SAN ANTONIO, TEXAS
- 242 -
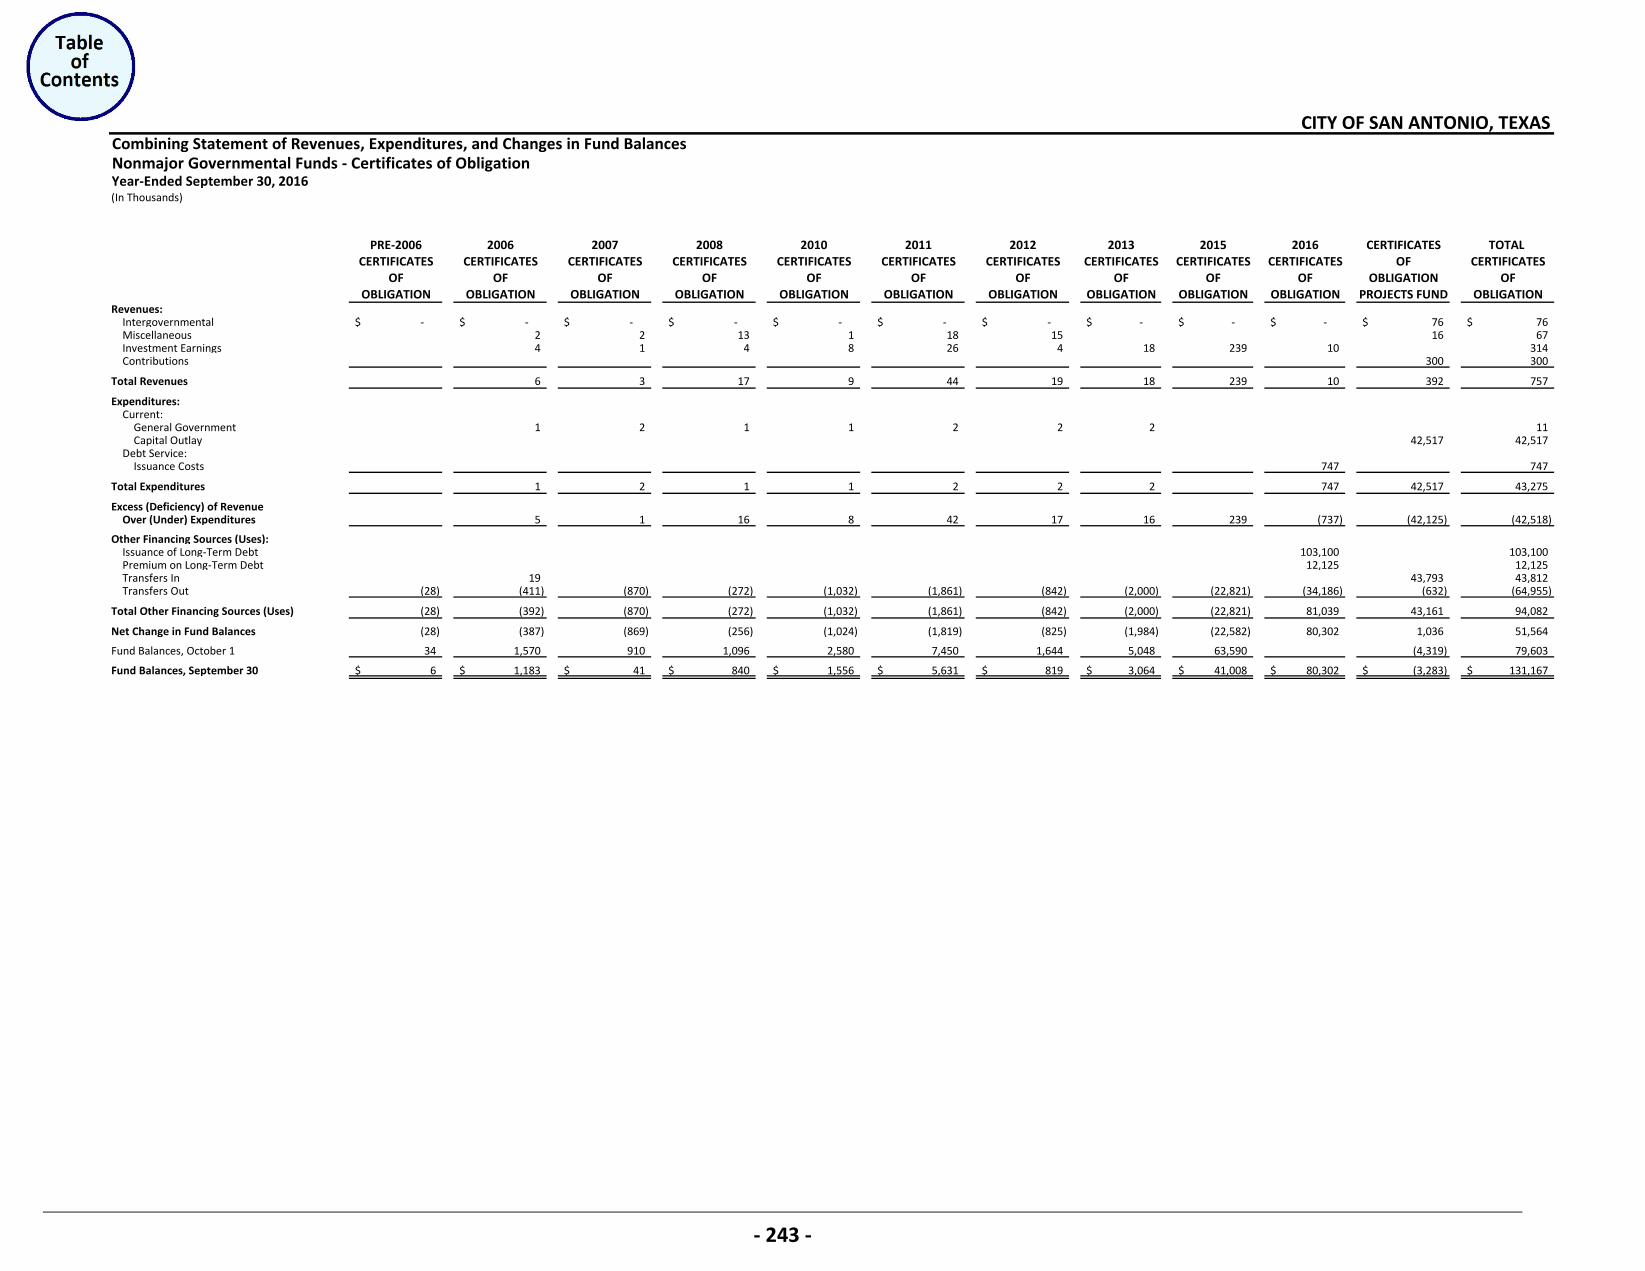
Combining Statement of Revenues, Expenditures, and Changes in Fund BalancesNonmajor Governmental Funds - Certificates of ObligationYear-Ended September 30, 2016(In Thousands)
PRE-2006 2006 2007 2008 2010 2011 2012 2013 2015 2016 CERTIFICATES TOTAL CERTIFICATES CERTIFICATES CERTIFICATES CERTIFICATES CERTIFICATES CERTIFICATES CERTIFICATES CERTIFICATES CERTIFICATES CERTIFICATES OF CERTIFICATES
OF OF OF OF OF OF OF OF OF OF OBLIGATION OFOBLIGATION OBLIGATION OBLIGATION OBLIGATION OBLIGATION OBLIGATION OBLIGATION OBLIGATION OBLIGATION OBLIGATION PROJECTS FUND OBLIGATION
Revenues:Intergovernmental -$ -$ -$ -$ -$ -$ -$ -$ -$ -$ 76$ 76$ Miscellaneous 2 2 13 1 18 15 16 67 Investment Earnings 4 1 4 8 26 4 18 239 10 314 Contributions 300 300
Total Revenues 6 3 17 9 44 19 18 239 10 392 757
Expenditures:Current:
General Government 1 2 1 1 2 2 2 11 Capital Outlay 42,517 42,517
Debt Service: Issuance Costs 747 747
Total Expenditures 1 2 1 1 2 2 2 747 42,517 43,275
Excess (Deficiency) of RevenueOver (Under) Expenditures 5 1 16 8 42 17 16 239 (737) (42,125) (42,518)
Other Financing Sources (Uses):Issuance of Long-Term Debt 103,100 103,100 Premium on Long-Term Debt 12,125 12,125 Transfers In 19 43,793 43,812 Transfers Out (28) (411) (870) (272) (1,032) (1,861) (842) (2,000) (22,821) (34,186) (632) (64,955)
Total Other Financing Sources (Uses) (28) (392) (870) (272) (1,032) (1,861) (842) (2,000) (22,821) 81,039 43,161 94,082
Net Change in Fund Balances (28) (387) (869) (256) (1,024) (1,819) (825) (1,984) (22,582) 80,302 1,036 51,564
Fund Balances, October 1 34 1,570 910 1,096 2,580 7,450 1,644 5,048 63,590 (4,319) 79,603
Fund Balances, September 30 6$ 1,183$ 41$ 840$ 1,556$ 5,631$ 819$ 3,064$ 41,008$ 80,302$ (3,283)$ 131,167$
CITY OF SAN ANTONIO, TEXAS
- 243 -
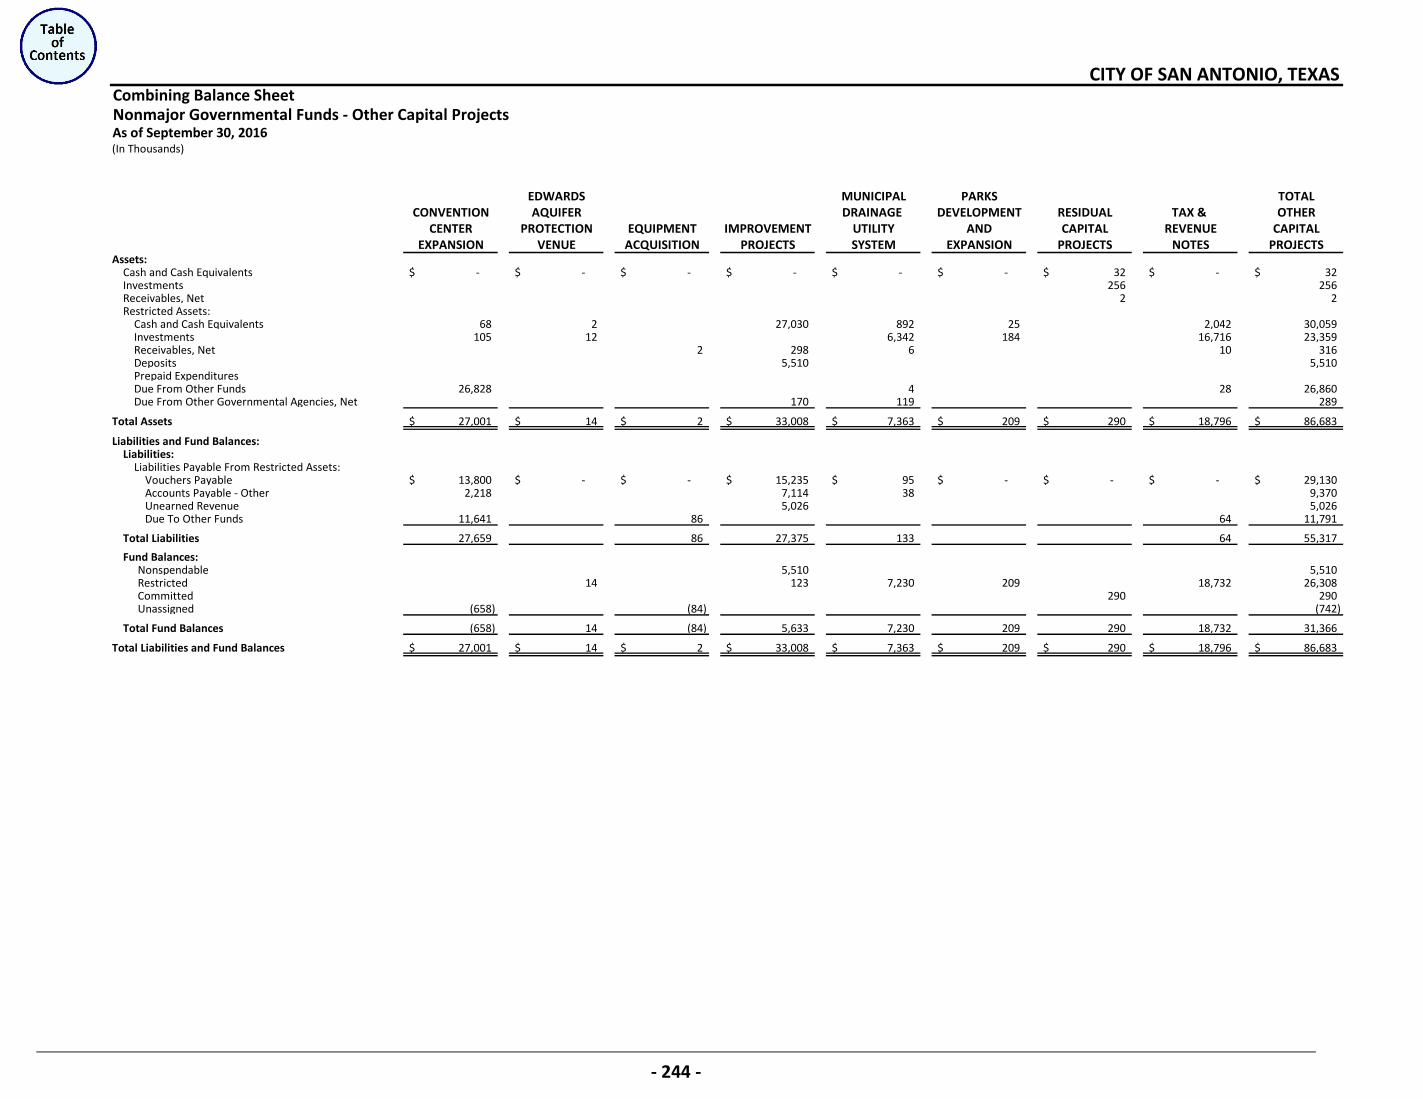
Combining Balance SheetNonmajor Governmental Funds - Other Capital ProjectsAs of September 30, 2016(In Thousands)
EDWARDS MUNICIPAL PARKS TOTALCONVENTION AQUIFER DRAINAGE DEVELOPMENT RESIDUAL TAX & OTHER
CENTER PROTECTION EQUIPMENT IMPROVEMENT UTILITY AND CAPITAL REVENUE CAPITALEXPANSION VENUE ACQUISITION PROJECTS SYSTEM EXPANSION PROJECTS NOTES PROJECTS
Assets:Cash and Cash Equivalents -$ -$ -$ -$ -$ -$ 32$ -$ 32$ Investments 256 256 Receivables, Net 2 2 Restricted Assets:
Cash and Cash Equivalents 68 2 27,030 892 25 2,042 30,059 Investments 105 12 6,342 184 16,716 23,359 Receivables, Net 2 298 6 10 316 Deposits 5,510 5,510 Prepaid Expenditures Due From Other Funds 26,828 4 28 26,860 Due From Other Governmental Agencies, Net 170 119 289
Total Assets 27,001$ 14$ 2$ 33,008$ 7,363$ 209$ 290$ 18,796$ 86,683$
Liabilities and Fund Balances:Liabilities:
Liabilities Payable From Restricted Assets: Vouchers Payable 13,800$ -$ -$ 15,235$ 95$ -$ -$ -$ 29,130$ Accounts Payable - Other 2,218 7,114 38 9,370 Unearned Revenue 5,026 5,026 Due To Other Funds 11,641 86 64 11,791
Total Liabilities 27,659 86 27,375 133 64 55,317
Fund Balances:Nonspendable 5,510 5,510 Restricted 14 123 7,230 209 18,732 26,308 Committed 290 290 Unassigned (658) (84) (742)
Total Fund Balances (658) 14 (84) 5,633 7,230 209 290 18,732 31,366
Total Liabilities and Fund Balances 27,001$ 14$ 2$ 33,008$ 7,363$ 209$ 290$ 18,796$ 86,683$
CITY OF SAN ANTONIO, TEXAS
- 244 -
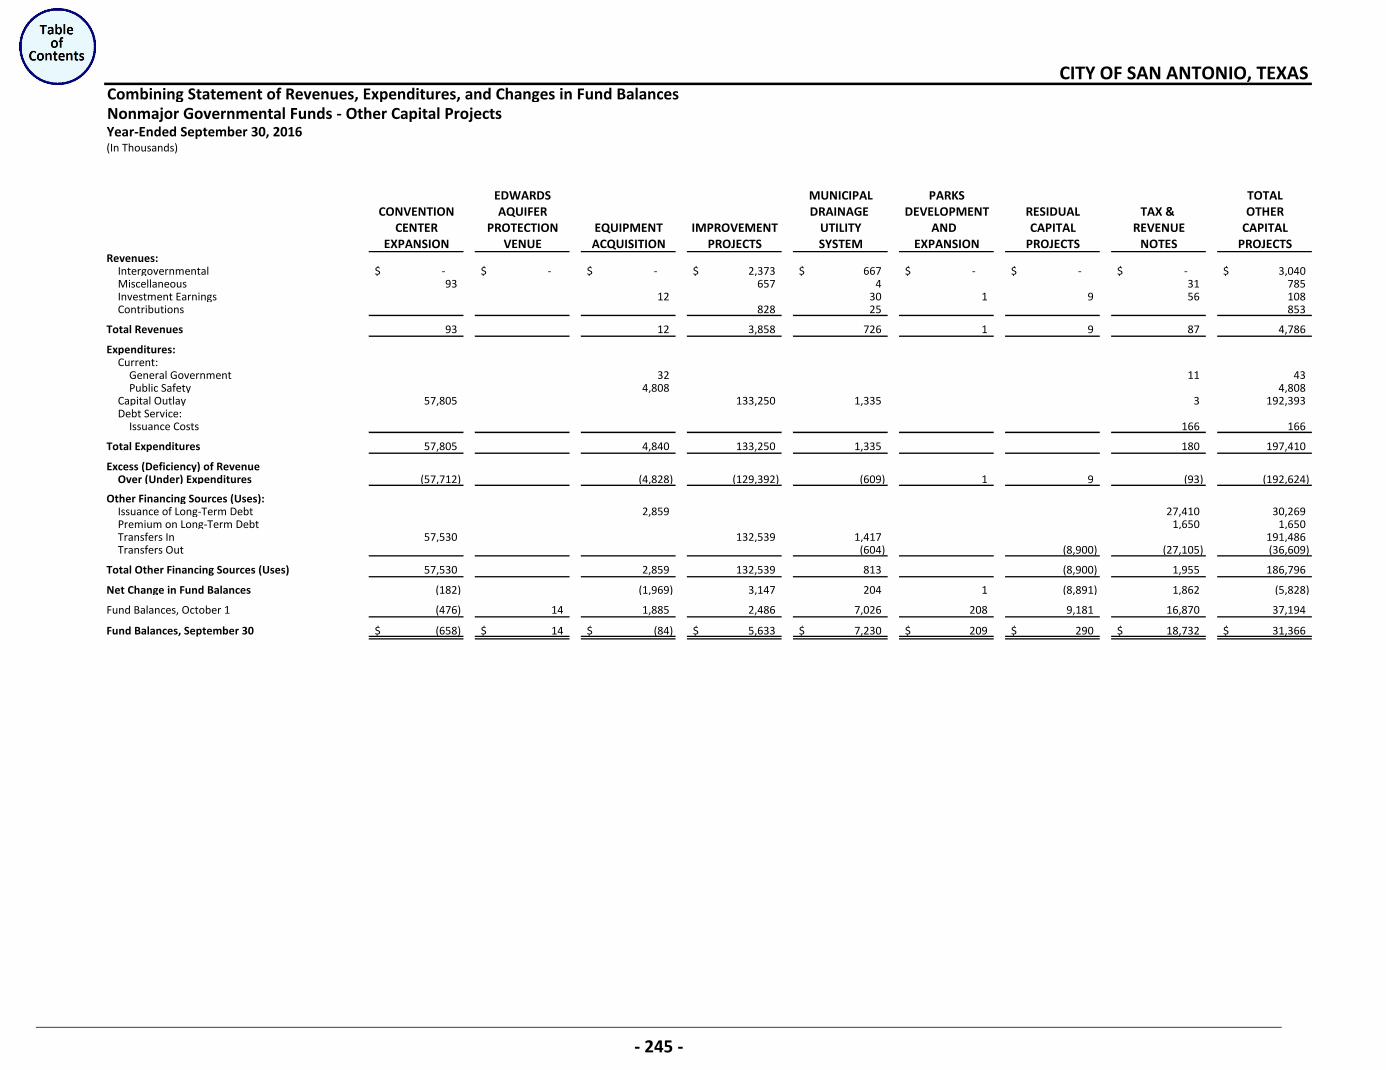
Combining Statement of Revenues, Expenditures, and Changes in Fund BalancesNonmajor Governmental Funds - Other Capital ProjectsYear-Ended September 30, 2016(In Thousands)
EDWARDS MUNICIPAL PARKS TOTALCONVENTION AQUIFER DRAINAGE DEVELOPMENT RESIDUAL TAX & OTHER
CENTER PROTECTION EQUIPMENT IMPROVEMENT UTILITY AND CAPITAL REVENUE CAPITALEXPANSION VENUE ACQUISITION PROJECTS SYSTEM EXPANSION PROJECTS NOTES PROJECTS
Revenues:Intergovernmental -$ -$ -$ 2,373$ 667$ -$ -$ -$ 3,040$ Miscellaneous 93 657 4 31 785 Investment Earnings 12 30 1 9 56 108 Contributions 828 25 853
Total Revenues 93 12 3,858 726 1 9 87 4,786
Expenditures:Current:
General Government 32 11 43 Public Safety 4,808 4,808
Capital Outlay 57,805 133,250 1,335 3 192,393 Debt Service:
Issuance Costs 166 166
Total Expenditures 57,805 4,840 133,250 1,335 180 197,410
Excess (Deficiency) of RevenueOver (Under) Expenditures (57,712) (4,828) (129,392) (609) 1 9 (93) (192,624)
Other Financing Sources (Uses):Issuance of Long-Term Debt 2,859 27,410 30,269 Premium on Long-Term Debt 1,650 1,650 Transfers In 57,530 132,539 1,417 191,486 Transfers Out (604) (8,900) (27,105) (36,609)
Total Other Financing Sources (Uses) 57,530 2,859 132,539 813 (8,900) 1,955 186,796
Net Change in Fund Balances (182) (1,969) 3,147 204 1 (8,891) 1,862 (5,828)
Fund Balances, October 1 (476) 14 1,885 2,486 7,026 208 9,181 16,870 37,194
Fund Balances, September 30 (658)$ 14$ (84)$ 5,633$ 7,230$ 209$ 290$ 18,732$ 31,366$
CITY OF SAN ANTONIO, TEXAS
- 245 -
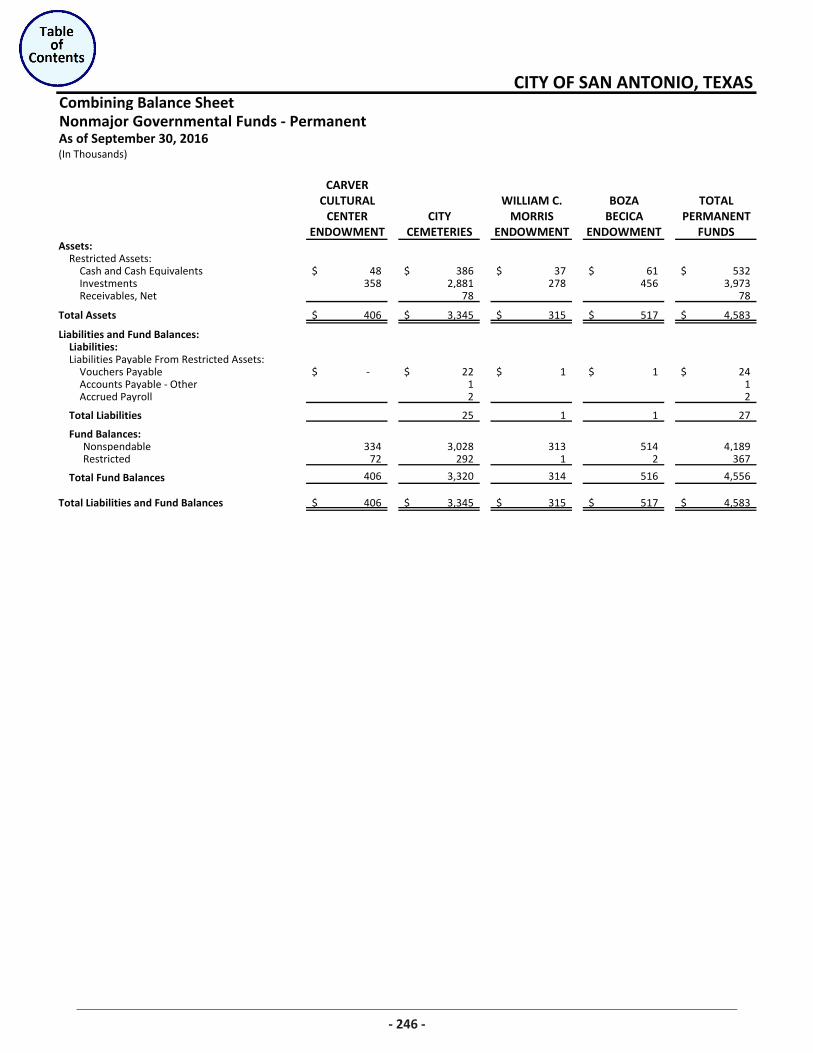
Combining Balance SheetNonmajor Governmental Funds - PermanentAs of September 30, 2016(In Thousands)
CARVERCULTURAL WILLIAM C. BOZA TOTAL
CENTER CITY MORRIS BECICA PERMANENTENDOWMENT CEMETERIES ENDOWMENT ENDOWMENT FUNDS
Assets:Restricted Assets:
Cash and Cash Equivalents 48$ 386$ 37$ 61$ 532$ Investments 358 2,881 278 456 3,973 Receivables, Net 78 78
Total Assets 406$ 3,345$ 315$ 517$ 4,583$
Liabilities and Fund Balances:Liabilities:Liabilities Payable From Restricted Assets:
Vouchers Payable -$ 22$ 1$ 1$ 24$ Accounts Payable - Other 1 1 Accrued Payroll 2 2
Total Liabilities 25 1 1 27
Fund Balances:Nonspendable 334 3,028 313 514 4,189 Restricted 72 292 1 2 367
Total Fund Balances 406 3,320 314 516 4,556
Total Liabilities and Fund Balances 406$ 3,345$ 315$ 517$ 4,583$
CITY OF SAN ANTONIO, TEXAS
246
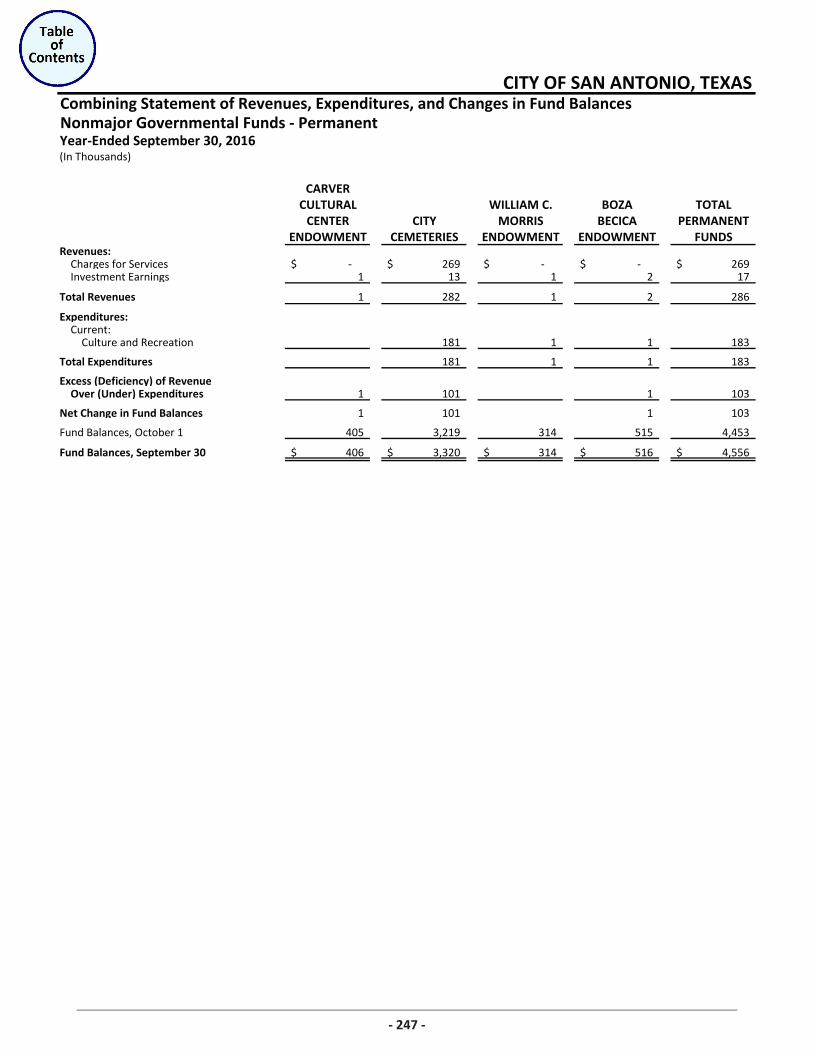
Combining Statement of Revenues, Expenditures, and Changes in Fund BalancesNonmajor Governmental Funds - PermanentYear-Ended September 30, 2016(In Thousands)
CARVERCULTURAL WILLIAM C. BOZA TOTAL
CENTER CITY MORRIS BECICA PERMANENTENDOWMENT CEMETERIES ENDOWMENT ENDOWMENT FUNDS
Revenues:Charges for Services -$ 269$ -$ -$ 269$ Investment Earnings 1 13 1 2 17
Total Revenues 1 282 1 2 286
Expenditures:Current:
Culture and Recreation 181 1 1 183
Total Expenditures 181 1 1 183
Excess (Deficiency) of RevenueOver (Under) Expenditures 1 101 1 103
Net Change in Fund Balances 1 101 1 103
Fund Balances, October 1 405 3,219 314 515 4,453
Fund Balances, September 30 406$ 3,320$ 314$ 516$ 4,556$
CITY OF SAN ANTONIO, TEXAS
247

SupplementaryBudget and Actual
Schedules for Legally Adopted
Funds
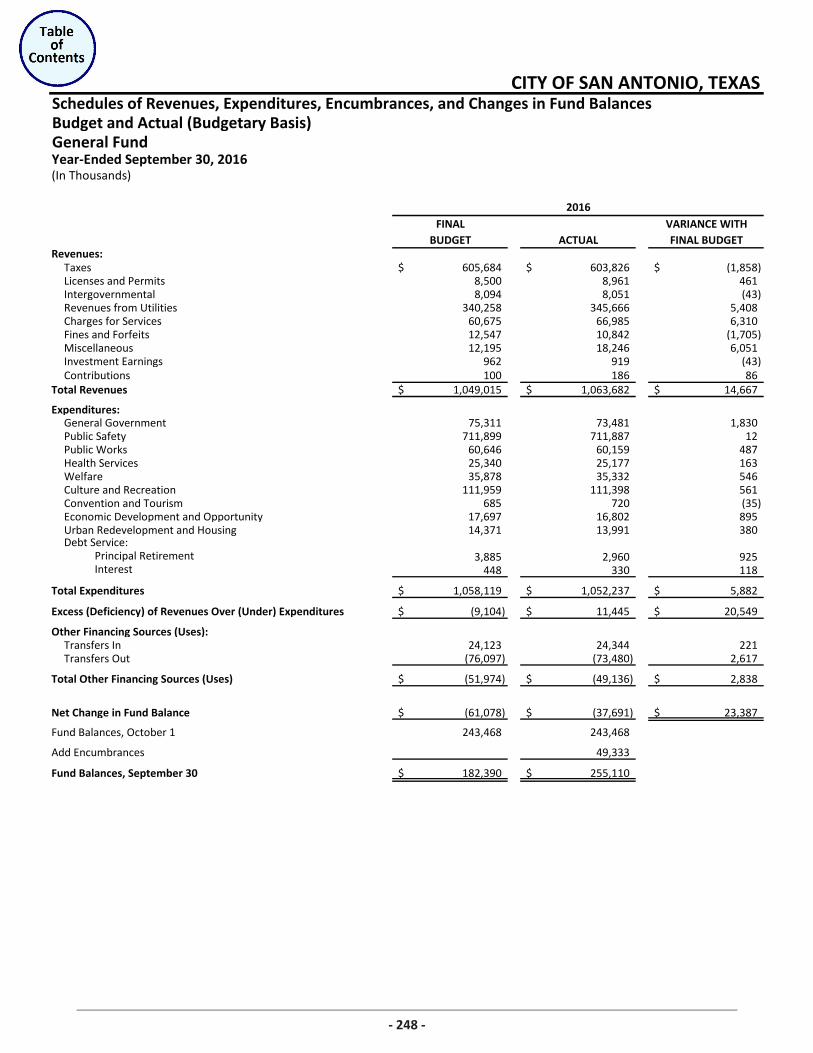
Schedules of Revenues, Expenditures, Encumbrances, and Changes in Fund BalancesBudget and Actual (Budgetary Basis)General Fund
FINAL VARIANCE WITHBUDGET ACTUAL FINAL BUDGET
Taxes 605,684$ 603,826$ (1,858)$ Licenses and Permits 8,500 8,961 461 Intergovernmental 8,094 8,051 (43) Revenues from Utilities 340,258 345,666 5,408 Charges for Services 60,675 66,985 6,310 Fines and Forfeits 12,547 10,842 (1,705) Miscellaneous 12,195 18,246 6,051 Investment Earnings 962 919 (43) Contributions 100 186 86
Total Revenues 1,049,015$ 1,063,682$ 14,667$
Expenditures:General Government 75,311 73,481 1,830 Public Safety 711,899 711,887 12 Public Works 60,646 60,159 487 Health Services 25,340 25,177 163 Welfare 35,878 35,332 546 Culture and Recreation 111,959 111,398 561 Convention and Tourism 685 720 (35) Economic Development and Opportunity 17,697 16,802 895 Urban Redevelopment and Housing 14,371 13,991 380 Debt Service:
Principal Retirement 3,885 2,960 925 Interest 448 330 118
Total Expenditures 1,058,119$ 1,052,237$ 5,882$
Excess (Deficiency) of Revenues Over (Under) Expenditures (9,104)$ 11,445$ 20,549$
Other Financing Sources (Uses):Transfers In 24,123 24,344 221 Transfers Out (76,097) (73,480) 2,617
Total Other Financing Sources (Uses) (51,974)$ (49,136)$ 2,838$
Net Change in Fund Balance (61,078)$ (37,691)$ 23,387$
Fund Balances, October 1 243,468 243,468
Add Encumbrances 49,333
Fund Balances, September 30 182,390$ 255,110$
CITY OF SAN ANTONIO, TEXAS
Year-Ended September 30, 2016(In Thousands)
2016
Revenues:
248
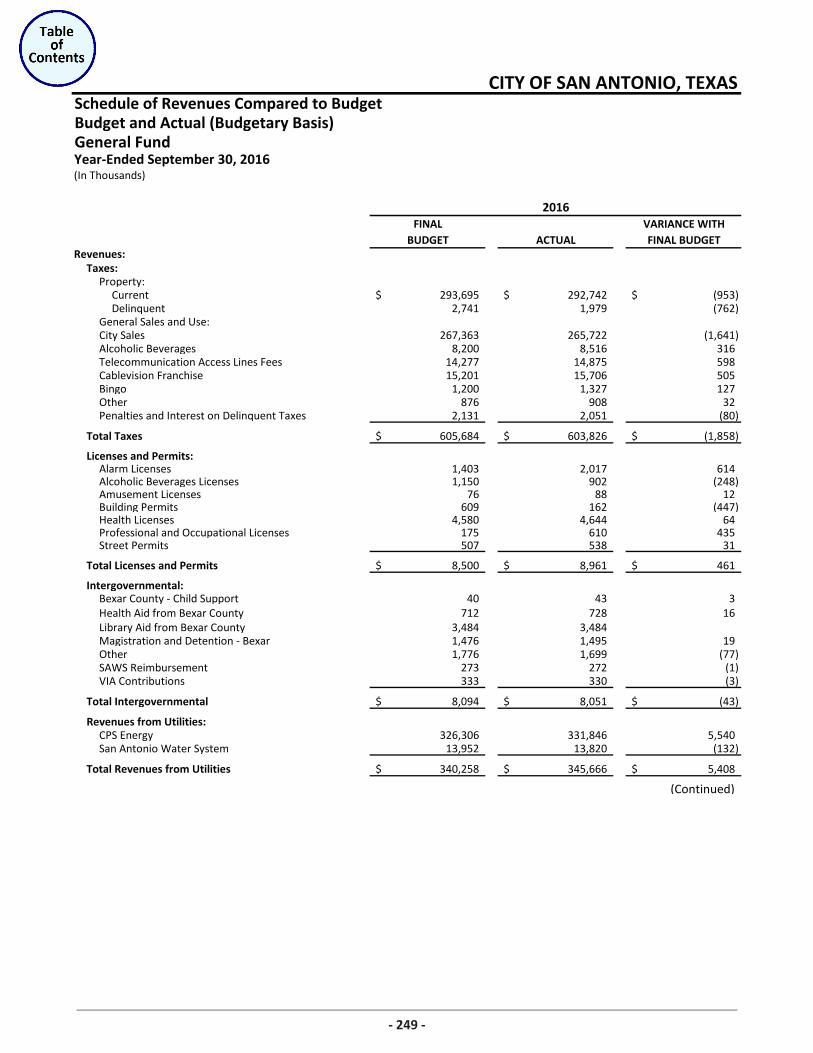
Schedule of Revenues Compared to BudgetBudget and Actual (Budgetary Basis)General Fund
FINAL VARIANCE WITHBUDGET ACTUAL FINAL BUDGET
Taxes:Property:
Current 293,695$ 292,742$ (953)$ Delinquent 2,741 1,979 (762)
General Sales and Use: City Sales 267,363 265,722 (1,641) Alcoholic Beverages 8,200 8,516 316 Telecommunication Access Lines Fees 14,277 14,875 598 Cablevision Franchise 15,201 15,706 505 Bingo 1,200 1,327 127 Other 876 908 32 Penalties and Interest on Delinquent Taxes 2,131 2,051 (80)
Total Taxes 605,684$ 603,826$ (1,858)$
Licenses and Permits:Alarm Licenses 1,403 2,017 614 Alcoholic Beverages Licenses 1,150 902 (248) Amusement Licenses 76 88 12 Building Permits 609 162 (447) Health Licenses 4,580 4,644 64 Professional and Occupational Licenses 175 610 435 Street Permits 507 538 31
Total Licenses and Permits 8,500$ 8,961$ 461$
Intergovernmental:Bexar County - Child Support 40 43 3 Health Aid from Bexar County 712 728 16 Library Aid from Bexar County 3,484 3,484 Magistration and Detention - Bexar 1,476 1,495 19 Other 1,776 1,699 (77) SAWS Reimbursement 273 272 (1) VIA Contributions 333 330 (3)
Total Intergovernmental 8,094$ 8,051$ (43)$
Revenues from Utilities:CPS Energy 326,306 331,846 5,540 San Antonio Water System 13,952 13,820 (132)
Total Revenues from Utilities 340,258$ 345,666$ 5,408$
(Continued)
CITY OF SAN ANTONIO, TEXAS
Year-Ended September 30, 2016(In Thousands)
2016
Revenues:
249
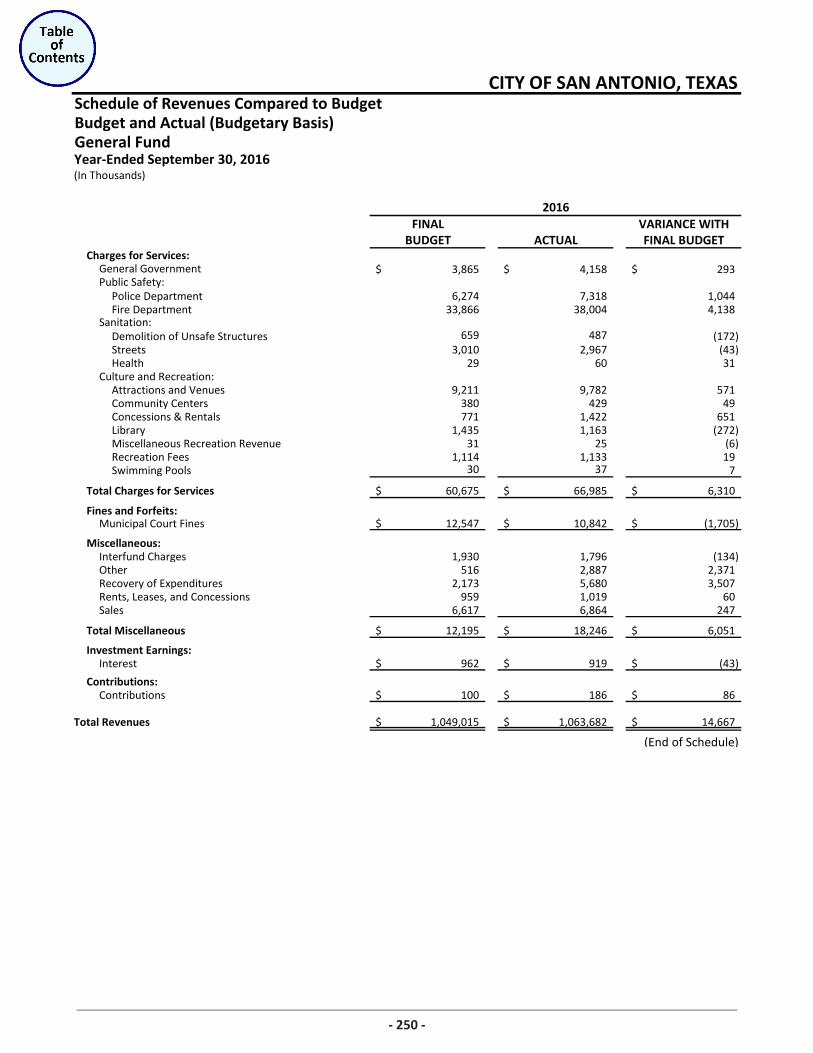
Schedule of Revenues Compared to BudgetBudget and Actual (Budgetary Basis)General Fund
FINAL VARIANCE WITHBUDGET ACTUAL FINAL BUDGET
Charges for Services:3,865$ 4,158$ 293$
Police Department 6,274 7,318 1,044 Fire Department 33,866 38,004 4,138
Demolition of Unsafe Structures 659 487 (172)
Streets 3,010 2,967 (43) Health 29 60 31
Culture and Recreation: Attractions and Venues 9,211 9,782 571 Community Centers 380 429 49 Concessions & Rentals 771 1,422 651 Library 1,435 1,163 (272) Miscellaneous Recreation Revenue 31 25 (6) Recreation Fees 1,114 1,133 19 Swimming Pools 30 37 7
Total Charges for Services 60,675$ 66,985$ 6,310$
Fines and Forfeits:Municipal Court Fines 12,547$ 10,842$ (1,705)$
Miscellaneous:Interfund Charges 1,930 1,796 (134) Other 516 2,887 2,371 Recovery of Expenditures 2,173 5,680 3,507 Rents, Leases, and Concessions 959 1,019 60 Sales 6,617 6,864 247
Total Miscellaneous 12,195$ 18,246$ 6,051$
Investment Earnings: Interest 962$ 919$ (43)$
Contributions:Contributions 100$ 186$ 86$
Total Revenues 1,049,015$ 1,063,682$ 14,667$
(End of Schedule)
CITY OF SAN ANTONIO, TEXAS
Sanitation:
Year-Ended September 30, 2016(In Thousands)
2016
General GovernmentPublic Safety:
250
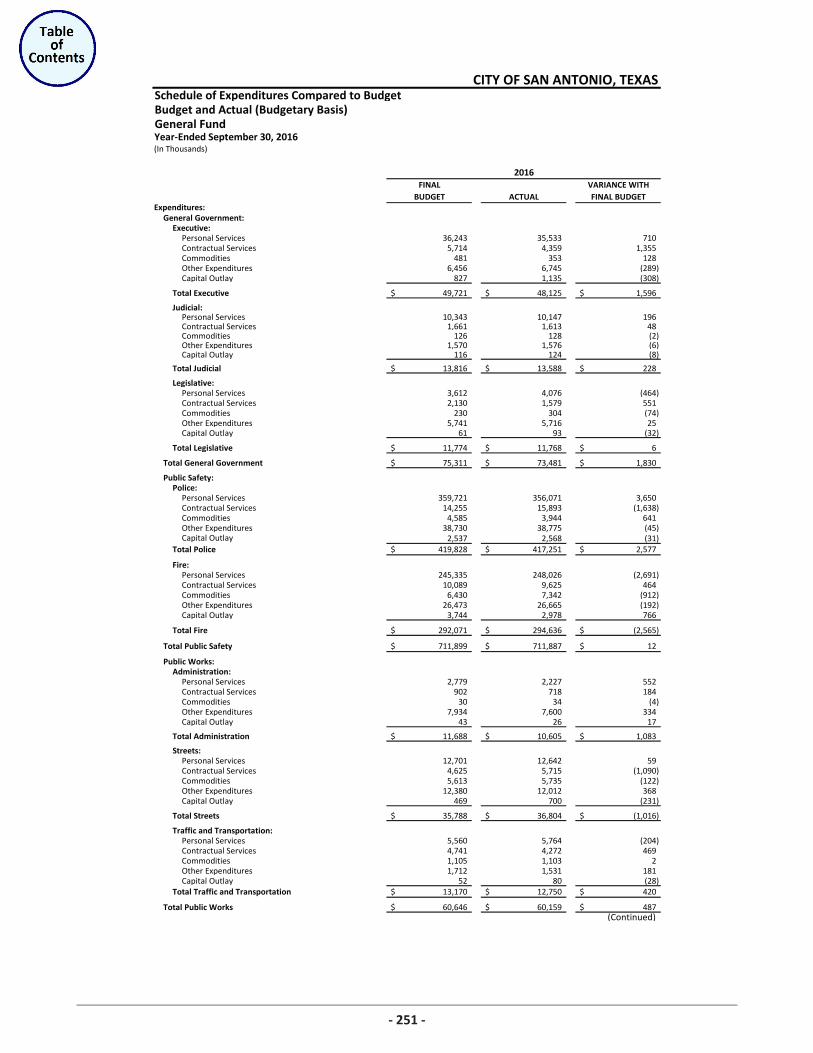
Schedule of Expenditures Compared to Budget Budget and Actual (Budgetary Basis)General Fund
FINAL VARIANCE WITHBUDGET ACTUAL FINAL BUDGET
General Government:Executive:
Personal Services 36,243 35,533 710 Contractual Services 5,714 4,359 1,355 Commodities 481 353 128 Other Expenditures 6,456 6,745 (289) Capital Outlay 827 1,135 (308)
Total Executive 49,721$ 48,125$ 1,596$
Judicial: Personal Services 10,343 10,147 196 Contractual Services 1,661 1,613 48 Commodities 126 128 (2) Other Expenditures 1,570 1,576 (6) Capital Outlay 116 124 (8)
Total Judicial 13,816$ 13,588$ 228$
Legislative:Personal Services 3,612 4,076 (464) Contractual Services 2,130 1,579 551 Commodities 230 304 (74) Other Expenditures 5,741 5,716 25 Capital Outlay 61 93 (32)
Total Legislative 11,774$ 11,768$ 6$
Total General Government 75,311$ 73,481$ 1,830$
Public Safety:Police:
Personal Services 359,721 356,071 3,650 Contractual Services 14,255 15,893 (1,638) Commodities 4,585 3,944 641 Other Expenditures 38,730 38,775 (45) Capital Outlay 2,537 2,568 (31)
Total Police 419,828$ 417,251$ 2,577$
Fire:Personal Services 245,335 248,026 (2,691) Contractual Services 10,089 9,625 464 Commodities 6,430 7,342 (912) Other Expenditures 26,473 26,665 (192) Capital Outlay 3,744 2,978 766
Total Fire 292,071$ 294,636$ (2,565)$
Total Public Safety 711,899$ 711,887$ 12$
Public Works:Administration:
Personal Services 2,779 2,227 552 Contractual Services 902 718 184 Commodities 30 34 (4) Other Expenditures 7,934 7,600 334 Capital Outlay 43 26 17
Total Administration 11,688$ 10,605$ 1,083$
Streets: Personal Services 12,701 12,642 59 Contractual Services 4,625 5,715 (1,090) Commodities 5,613 5,735 (122) Other Expenditures 12,380 12,012 368 Capital Outlay 469 700 (231)
Total Streets 35,788$ 36,804$ (1,016)$
Traffic and Transportation:Personal Services 5,560 5,764 (204) Contractual Services 4,741 4,272 469 Commodities 1,105 1,103 2 Other Expenditures 1,712 1,531 181 Capital Outlay 52 80 (28)
Total Traffic and Transportation 13,170$ 12,750$ 420$
Total Public Works 60,646$ 60,159$ 487$ (Continued)
CITY OF SAN ANTONIO, TEXAS
Year-Ended September 30, 2016(In Thousands)
2016
Expenditures:
251
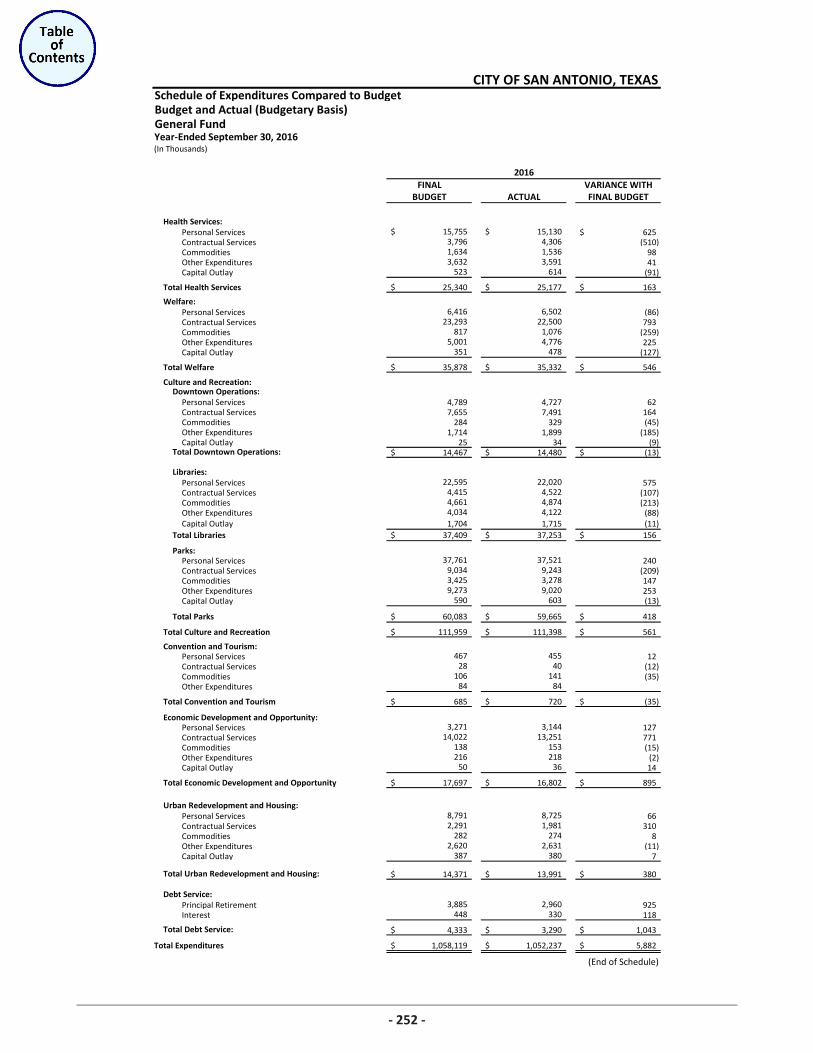
Schedule of Expenditures Compared to Budget Budget and Actual (Budgetary Basis)General Fund
FINAL VARIANCE WITHBUDGET ACTUAL FINAL BUDGET
Health Services:Personal Services 15,755$ 15,130$ 625$ Contractual Services 3,796 4,306 (510) Commodities 1,634 1,536 98 Other Expenditures 3,632 3,591 41 Capital Outlay 523 614 (91)
Total Health Services 25,340$ 25,177$ 163$
Welfare: Personal Services 6,416 6,502 (86) Contractual Services 23,293 22,500 793 Commodities 817 1,076 (259) Other Expenditures 5,001 4,776 225 Capital Outlay 351 478 (127)
Total Welfare 35,878$ 35,332$ 546$
Culture and Recreation: Downtown Operations:
Personal Services 4,789 4,727 62 Contractual Services 7,655 7,491 164 Commodities 284 329 (45) Other Expenditures 1,714 1,899 (185) Capital Outlay 25 34 (9)
Total Downtown Operations: 14,467$ 14,480$ (13)$
Libraries:Personal Services 22,595 22,020 575 Contractual Services 4,415 4,522 (107) Commodities 4,661 4,874 (213) Other Expenditures 4,034 4,122 (88) Capital Outlay 1,704 1,715 (11)
Total Libraries 37,409$ 37,253$ 156$
Parks: Personal Services 37,761 37,521 240 Contractual Services 9,034 9,243 (209) Commodities 3,425 3,278 147 Other Expenditures 9,273 9,020 253 Capital Outlay 590 603 (13)
Total Parks 60,083$ 59,665$ 418$
Total Culture and Recreation 111,959$ 111,398$ 561$
Convention and Tourism:Personal Services 467 455 12 Contractual Services 28 40 (12) Commodities 106 141 (35) Other Expenditures 84 84
Total Convention and Tourism 685$ 720$ (35)$
Economic Development and Opportunity:Personal Services 3,271 3,144 127 Contractual Services 14,022 13,251 771 Commodities 138 153 (15) Other Expenditures 216 218 (2) Capital Outlay 50 36 14
Total Economic Development and Opportunity 17,697$ 16,802$ 895$
Urban Redevelopment and Housing:Personal Services 8,791 8,725 66 Contractual Services 2,291 1,981 310 Commodities 282 274 8 Other Expenditures 2,620 2,631 (11) Capital Outlay 387 380 7
Total Urban Redevelopment and Housing: 14,371$ 13,991$ 380$
Debt Service:Principal Retirement 3,885 2,960 925 Interest 448 330 118
Total Debt Service: 4,333$ 3,290$ 1,043$
Total Expenditures 1,058,119$ 1,052,237$ 5,882$
(End of Schedule)
2016
CITY OF SAN ANTONIO, TEXAS
Year-Ended September 30, 2016(In Thousands)
252
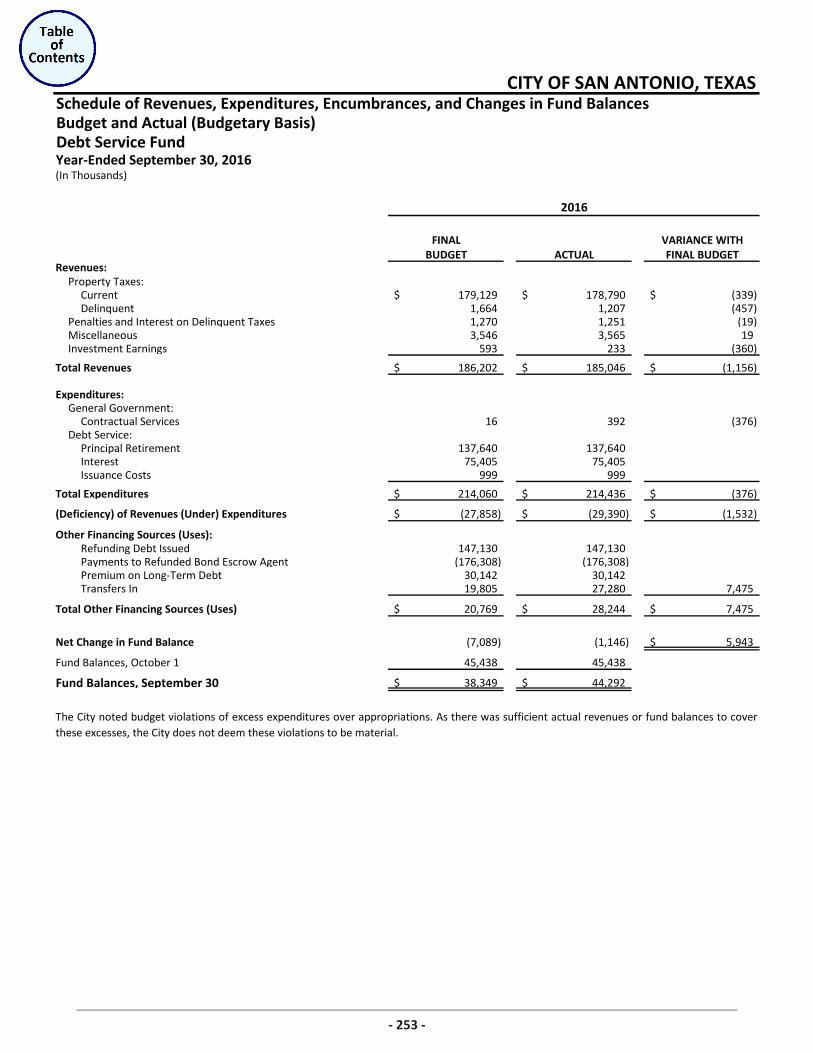
Schedule of Revenues, Expenditures, Encumbrances, and Changes in Fund BalancesBudget and Actual (Budgetary Basis)Debt Service FundYear-Ended September 30, 2016
FINAL VARIANCE WITHBUDGET ACTUAL FINAL BUDGET
Property Taxes:Current 179,129$ 178,790$ (339)$ Delinquent 1,664 1,207 (457)
Penalties and Interest on Delinquent Taxes 1,270 1,251 (19) Miscellaneous 3,546 3,565 19 Investment Earnings 593 233 (360)
Total Revenues 186,202$ 185,046$ (1,156)$
Expenditures: General Government:
Contractual Services 16 392 (376) Debt Service:
Principal Retirement 137,640 137,640 Interest 75,405 75,405 Issuance Costs 999 999
Total Expenditures 214,060$ 214,436$ (376)$
(Deficiency) of Revenues (Under) Expenditures (27,858)$ (29,390)$ (1,532)$
Other Financing Sources (Uses): Refunding Debt Issued 147,130 147,130 Payments to Refunded Bond Escrow Agent (176,308) (176,308) Premium on Long-Term Debt 30,142 30,142 Transfers In 19,805 27,280 7,475
Total Other Financing Sources (Uses) 20,769$ 28,244$ 7,475$
Net Change in Fund Balance (7,089) (1,146) 5,943$
Fund Balances, October 1 45,438 45,438
Fund Balances, September 30 38,349$ 44,292$
The City noted budget violations of excess expenditures over appropriations. As there was sufficient actual revenues or fund balances to coverthese excesses, the City does not deem these violations to be material.
2016
CITY OF SAN ANTONIO, TEXAS
(In Thousands)
Revenues:
253
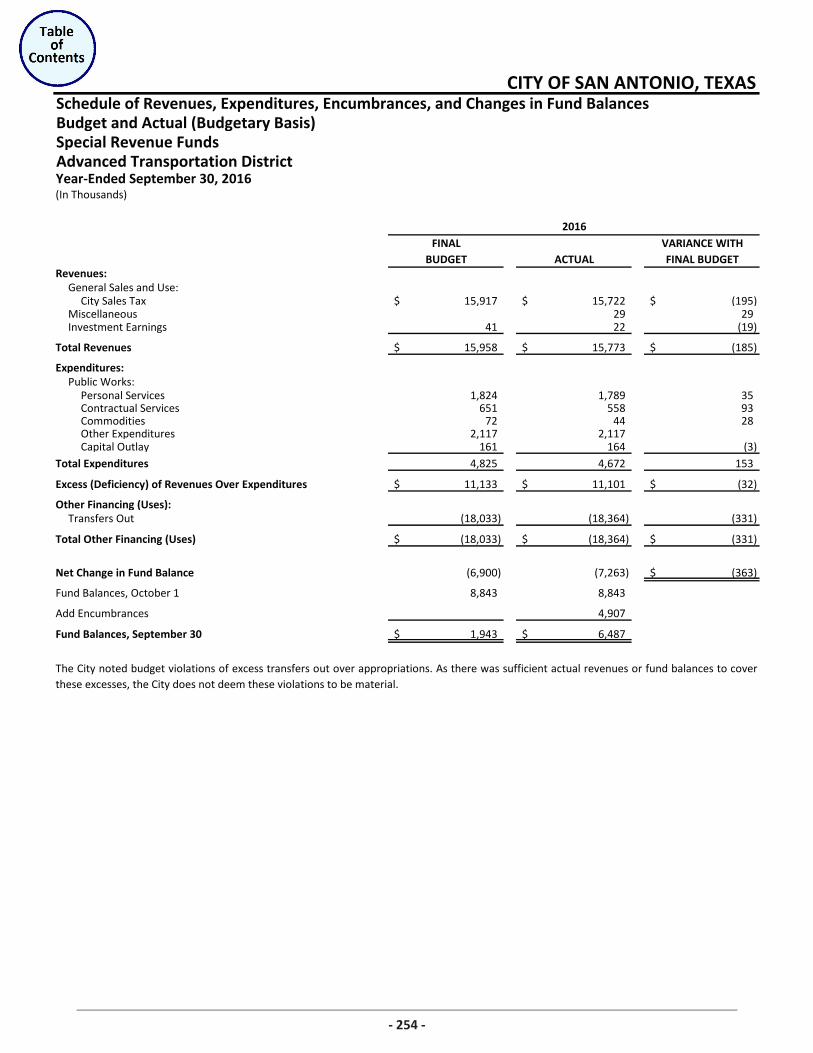
Schedule of Revenues, Expenditures, Encumbrances, and Changes in Fund BalancesBudget and Actual (Budgetary Basis)Special Revenue FundsAdvanced Transportation District
FINAL VARIANCE WITHBUDGET ACTUAL FINAL BUDGET
General Sales and Use:City Sales Tax 15,917$ 15,722$ (195)$
Miscellaneous 29 29 Investment Earnings 41 22 (19)
Total Revenues 15,958$ 15,773$ (185)$
Expenditures: Public Works:
Personal Services 1,824 1,789 35 Contractual Services 651 558 93 Commodities 72 44 28 Other Expenditures 2,117 2,117 Capital Outlay 161 164 (3)
Total Expenditures 4,825 4,672 153
Excess (Deficiency) of Revenues Over Expenditures 11,133$ 11,101$ (32)$
Other Financing (Uses):Transfers Out (18,033) (18,364) (331)
Total Other Financing (Uses) (18,033)$ (18,364)$ (331)$
Net Change in Fund Balance (6,900) (7,263) (363)$
Fund Balances, October 1 8,843 8,843
Add Encumbrances 4,907
Fund Balances, September 30 1,943$ 6,487$
The City noted budget violations of excess transfers out over appropriations. As there was sufficient actual revenues or fund balances to coverthese excesses, the City does not deem these violations to be material.
2016
Revenues:
CITY OF SAN ANTONIO, TEXAS
(In Thousands)Year-Ended September 30, 2016
254
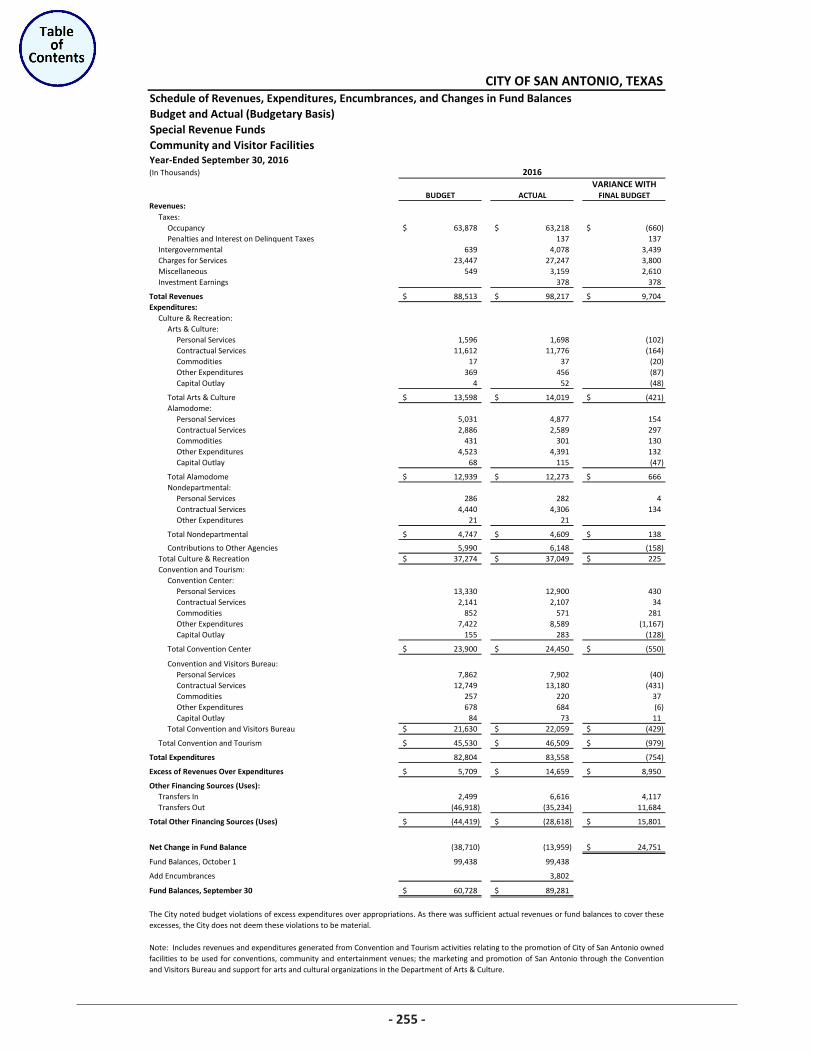
Schedule of Revenues, Expenditures, Encumbrances, and Changes in Fund BalancesBudget and Actual (Budgetary Basis)Special Revenue FundsCommunity and Visitor FacilitiesYear-Ended September 30, 2016(In Thousands)
VARIANCE WITHBUDGET ACTUAL FINAL BUDGET
Taxes:Occupancy 63,878$ 63,218$ (660)$ Penalties and Interest on Delinquent Taxes 137 137
Intergovernmental 639 4,078 3,439 Charges for Services 23,447 27,247 3,800 Miscellaneous 549 3,159 2,610 Investment Earnings 378 378
Total Revenues 88,513$ 98,217$ 9,704$ Expenditures:
Culture & Recreation: Arts & Culture:
Personal Services 1,596 1,698 (102) Contractual Services 11,612 11,776 (164) Commodities 17 37 (20) Other Expenditures 369 456 (87) Capital Outlay 4 52 (48)
Total Arts & Culture 13,598$ 14,019$ (421)$ Alamodome:
Personal Services 5,031 4,877 154 Contractual Services 2,886 2,589 297 Commodities 431 301 130 Other Expenditures 4,523 4,391 132 Capital Outlay 68 115 (47)
Total Alamodome 12,939$ 12,273$ 666$ Nondepartmental:
Personal Services 286 282 4 Contractual Services 4,440 4,306 134 Other Expenditures 21 21
Total Nondepartmental 4,747$ 4,609$ 138$
Contributions to Other Agencies 5,990 6,148 (158) Total Culture & Recreation 37,274$ 37,049$ 225$ Convention and Tourism:
Convention Center:Personal Services 13,330 12,900 430 Contractual Services 2,141 2,107 34 Commodities 852 571 281 Other Expenditures 7,422 8,589 (1,167) Capital Outlay 155 283 (128)
Total Convention Center 23,900$ 24,450$ (550)$
Convention and Visitors Bureau:Personal Services 7,862 7,902 (40) Contractual Services 12,749 13,180 (431) Commodities 257 220 37 Other Expenditures 678 684 (6) Capital Outlay 84 73 11
Total Convention and Visitors Bureau 21,630$ 22,059$ (429)$
Total Convention and Tourism 45,530$ 46,509$ (979)$
Total Expenditures 82,804 83,558 (754)
Excess of Revenues Over Expenditures 5,709$ 14,659$ 8,950$
Other Financing Sources (Uses):Transfers In 2,499 6,616 4,117 Transfers Out (46,918) (35,234) 11,684
Total Other Financing Sources (Uses) (44,419)$ (28,618)$ 15,801$
Net Change in Fund Balance (38,710) (13,959) 24,751$
Fund Balances, October 1 99,438 99,438
Add Encumbrances 3,802
Fund Balances, September 30 60,728$ 89,281$
CITY OF SAN ANTONIO, TEXAS
2016
Revenues:
The City noted budget violations of excess expenditures over appropriations. As there was sufficient actual revenues or fund balances to cover theseexcesses, the City does not deem these violations to be material.
Note: Includes revenues and expenditures generated from Convention and Tourism activities relating to the promotion of City of San Antonio ownedfacilities to be used for conventions, community and entertainment venues; the marketing and promotion of San Antonio through the Conventionand Visitors Bureau and support for arts and cultural organizations in the Department of Arts & Culture.
255
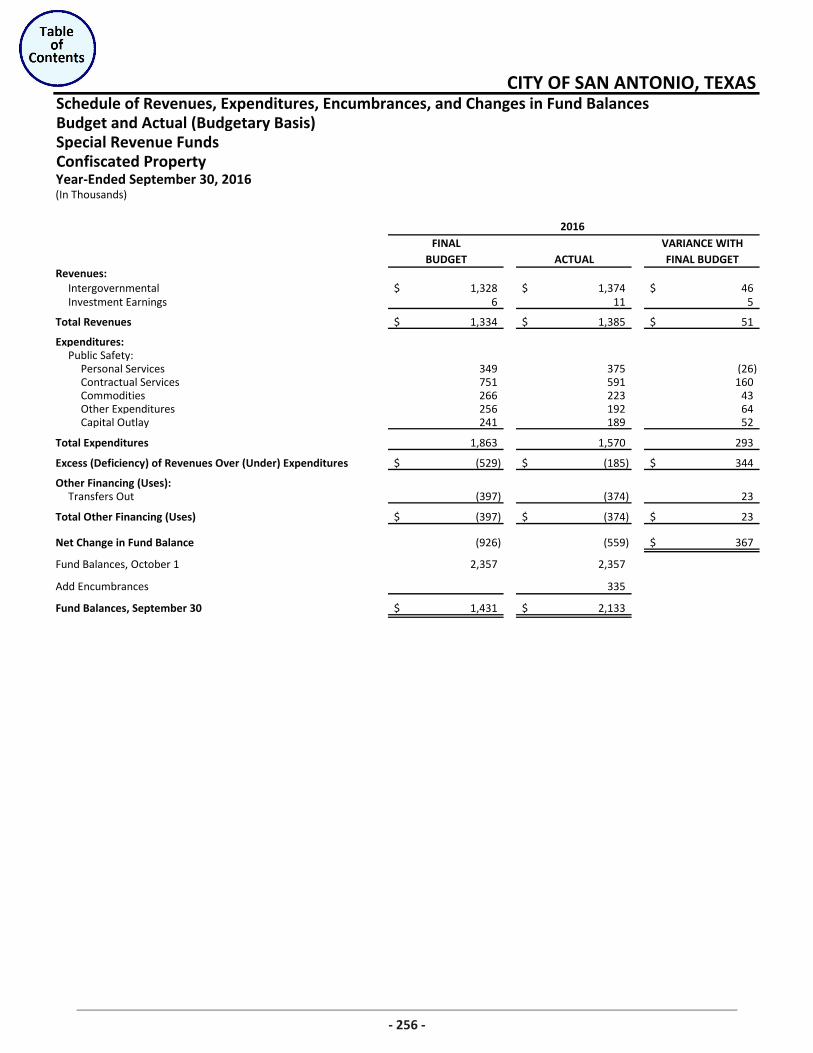
Schedule of Revenues, Expenditures, Encumbrances, and Changes in Fund BalancesBudget and Actual (Budgetary Basis)Special Revenue FundsConfiscated PropertyYear-Ended September 30, 2016
FINAL VARIANCE WITHBUDGET ACTUAL FINAL BUDGET
Intergovernmental 1,328$ 1,374$ 46$ Investment Earnings 6 11 5
Total Revenues 1,334$ 1,385$ 51$
Expenditures:Public Safety:
Personal Services 349 375 (26) Contractual Services 751 591 160 Commodities 266 223 43 Other Expenditures 256 192 64 Capital Outlay 241 189 52
Total Expenditures 1,863 1,570 293
Excess (Deficiency) of Revenues Over (Under) Expenditures (529)$ (185)$ 344$
Other Financing (Uses):Transfers Out (397) (374) 23
Total Other Financing (Uses) (397)$ (374)$ 23$
Net Change in Fund Balance (926) (559) 367$
Fund Balances, October 1 2,357 2,357
Add Encumbrances 335
Fund Balances, September 30 1,431$ 2,133$
2016
Revenues:
CITY OF SAN ANTONIO, TEXAS
(In Thousands)
256
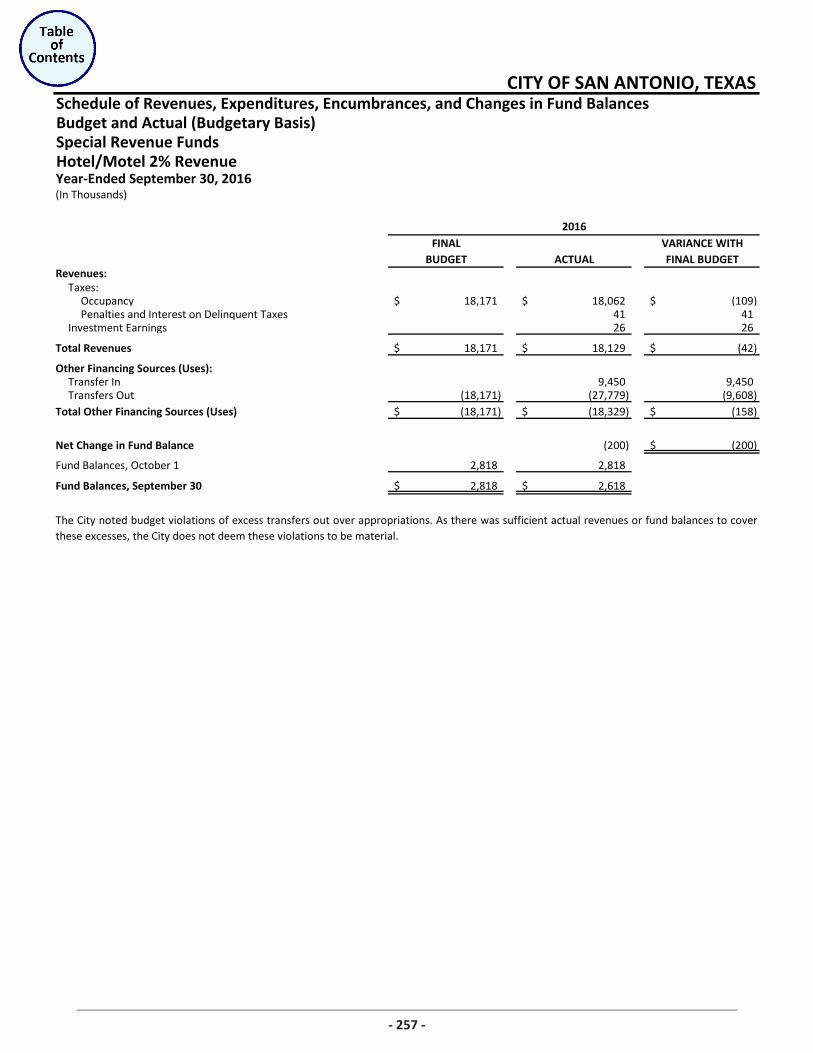
Schedule of Revenues, Expenditures, Encumbrances, and Changes in Fund BalancesBudget and Actual (Budgetary Basis)Special Revenue FundsHotel/Motel 2% Revenue
FINAL VARIANCE WITHBUDGET ACTUAL FINAL BUDGET
Taxes: Occupancy 18,171$ 18,062$ (109)$ Penalties and Interest on Delinquent Taxes 41 41
Investment Earnings 26 26
Total Revenues 18,171$ 18,129$ (42)$
Other Financing Sources (Uses):Transfer In 9,450 9,450 Transfers Out (18,171) (27,779) (9,608)
Total Other Financing Sources (Uses) (18,171)$ (18,329)$ (158)$
Net Change in Fund Balance (200) (200)$
Fund Balances, October 1 2,818 2,818
Fund Balances, September 30 2,818$ 2,618$
The City noted budget violations of excess transfers out over appropriations. As there was sufficient actual revenues or fund balances to coverthese excesses, the City does not deem these violations to be material.
CITY OF SAN ANTONIO, TEXAS
Year-Ended September 30, 2016(In Thousands)
2016
Revenues:
257
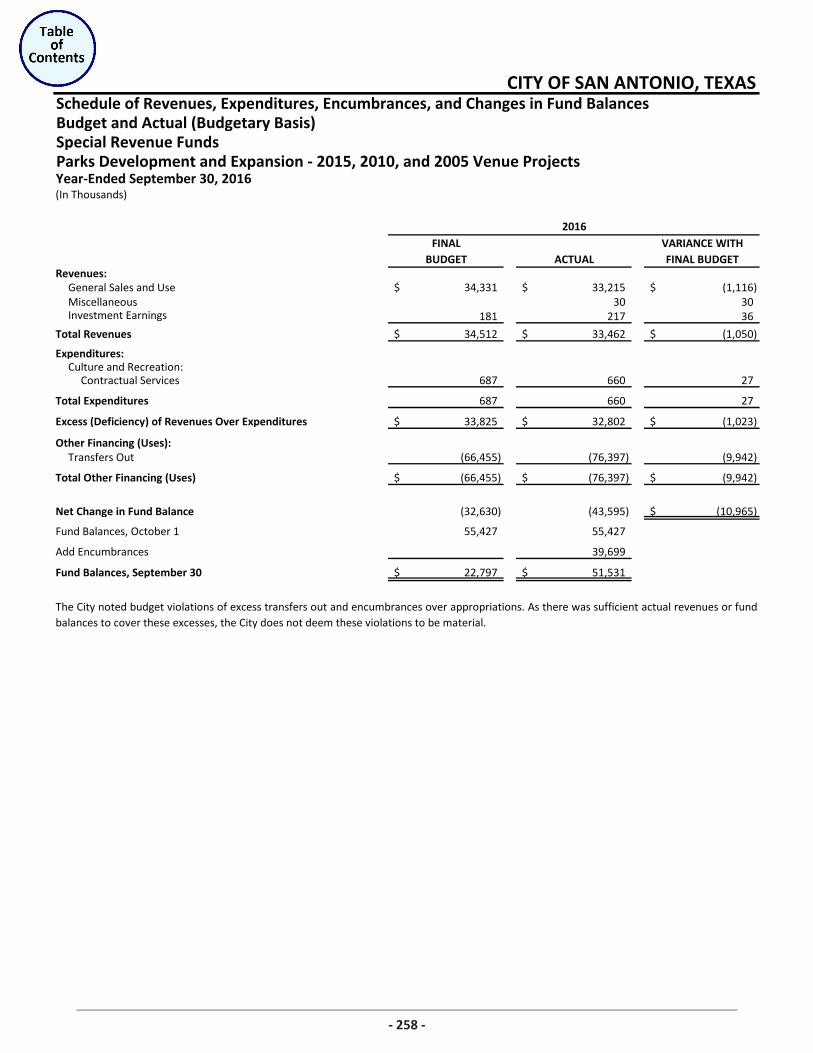
Schedule of Revenues, Expenditures, Encumbrances, and Changes in Fund BalancesBudget and Actual (Budgetary Basis)Special Revenue FundsParks Development and Expansion - 2015, 2010, and 2005 Venue Projects
FINAL VARIANCE WITHBUDGET ACTUAL FINAL BUDGET
General Sales and Use 34,331$ 33,215$ (1,116)$ Miscellaneous 30 30 Investment Earnings 181 217 36
Total Revenues 34,512$ 33,462$ (1,050)$
Expenditures: Culture and Recreation:
Contractual Services 687 660 27
Total Expenditures 687 660 27
Excess (Deficiency) of Revenues Over Expenditures 33,825$ 32,802$ (1,023)$
Other Financing (Uses):Transfers Out (66,455) (76,397) (9,942)
Total Other Financing (Uses) (66,455)$ (76,397)$ (9,942)$
Net Change in Fund Balance (32,630) (43,595) (10,965)$
Fund Balances, October 1 55,427 55,427
Add Encumbrances 39,699
Fund Balances, September 30 22,797$ 51,531$
The City noted budget violations of excess transfers out and encumbrances over appropriations. As there was sufficient actual revenues or fundbalances to cover these excesses, the City does not deem these violations to be material.
CITY OF SAN ANTONIO, TEXAS
Year-Ended September 30, 2016(In Thousands)
2016
Revenues:
258
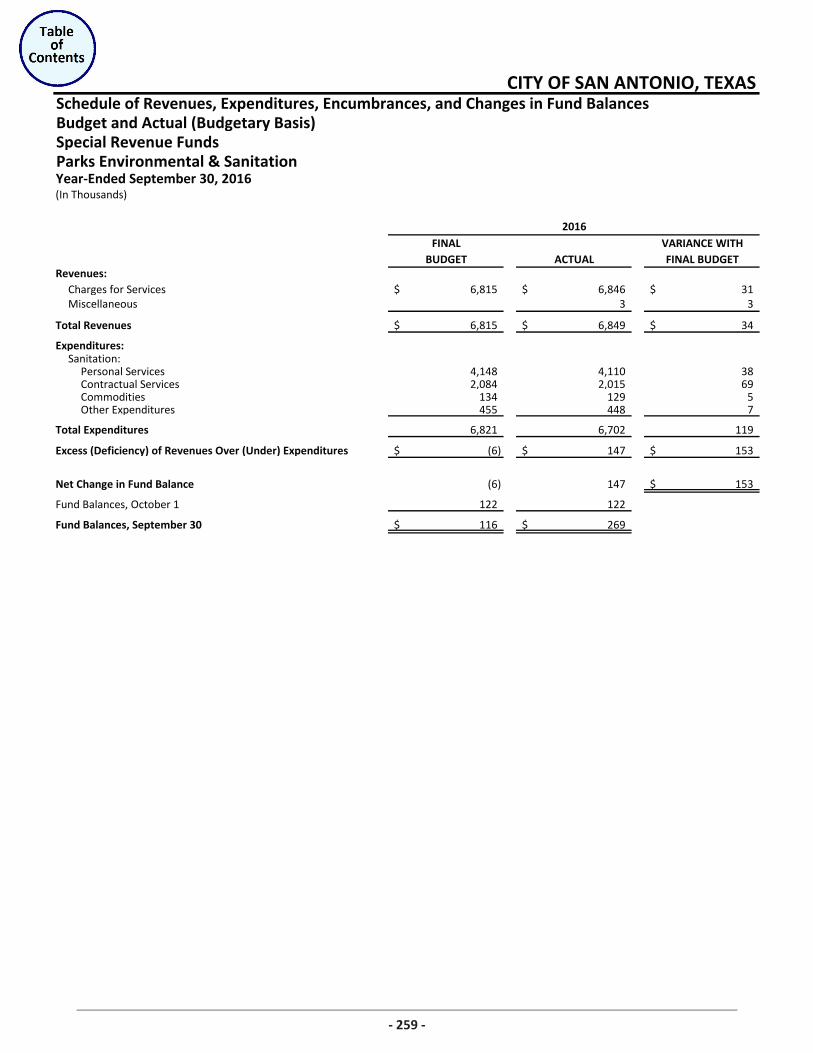
Schedule of Revenues, Expenditures, Encumbrances, and Changes in Fund BalancesBudget and Actual (Budgetary Basis)Special Revenue FundsParks Environmental & Sanitation
FINAL VARIANCE WITHBUDGET ACTUAL FINAL BUDGET
Charges for Services 6,815$ 6,846$ 31$ Miscellaneous 3 3
Total Revenues 6,815$ 6,849$ 34$
Expenditures: Sanitation:
Personal Services 4,148 4,110 38 Contractual Services 2,084 2,015 69 Commodities 134 129 5 Other Expenditures 455 448 7
Total Expenditures 6,821 6,702 119
Excess (Deficiency) of Revenues Over (Under) Expenditures (6)$ 147$ 153$
Net Change in Fund Balance (6) 147 153$
Fund Balances, October 1 122 122
Fund Balances, September 30 116$ 269$
CITY OF SAN ANTONIO, TEXAS
Year-Ended September 30, 2016(In Thousands)
2016
Revenues:
259
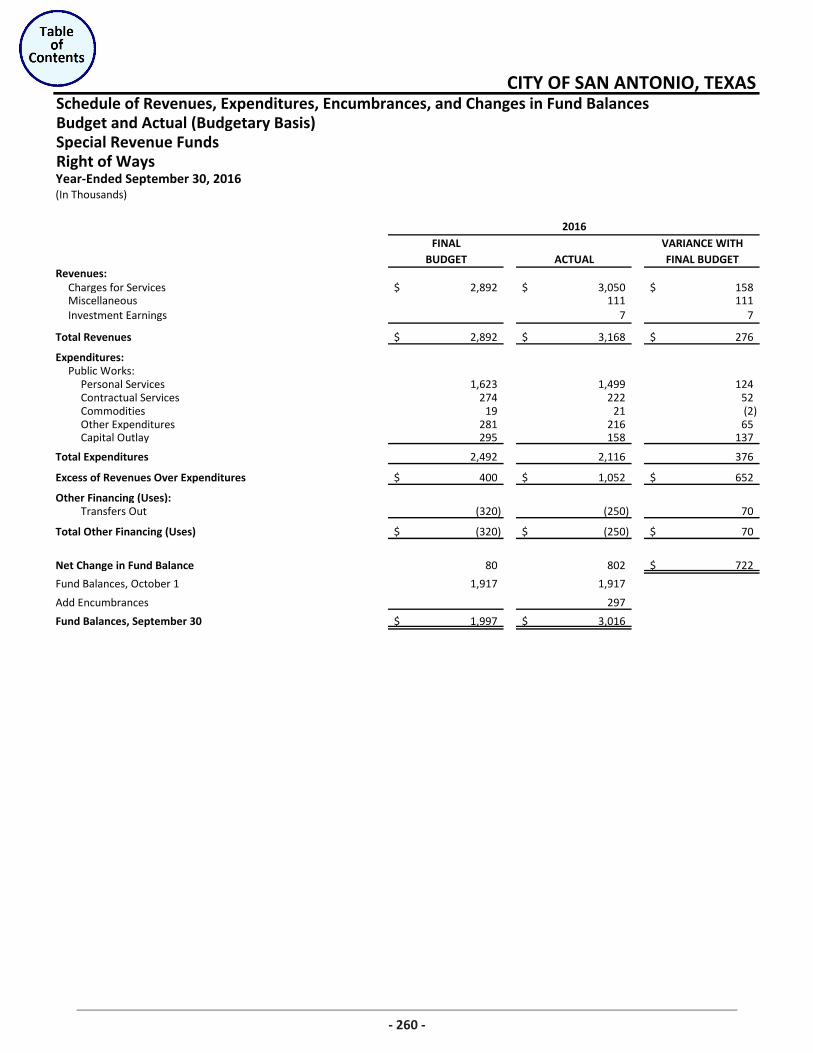
Schedule of Revenues, Expenditures, Encumbrances, and Changes in Fund BalancesBudget and Actual (Budgetary Basis)Special Revenue FundsRight of Ways
FINAL VARIANCE WITHBUDGET ACTUAL FINAL BUDGET
Charges for Services 2,892$ 3,050$ 158$ Miscellaneous 111 111 Investment Earnings 7 7
Total Revenues 2,892$ 3,168$ 276$
Expenditures: Public Works:
Personal Services 1,623 1,499 124 Contractual Services 274 222 52 Commodities 19 21 (2) Other Expenditures 281 216 65 Capital Outlay 295 158 137
Total Expenditures 2,492 2,116 376
Excess of Revenues Over Expenditures 400$ 1,052$ 652$
Other Financing (Uses):Transfers Out (320) (250) 70
Total Other Financing (Uses) (320)$ (250)$ 70$
Net Change in Fund Balance 80 802 722$
Fund Balances, October 1 1,917 1,917
Add Encumbrances 297
Fund Balances, September 30 1,997$ 3,016$
CITY OF SAN ANTONIO, TEXAS
Year-Ended September 30, 2016(In Thousands)
2016
Revenues:
260
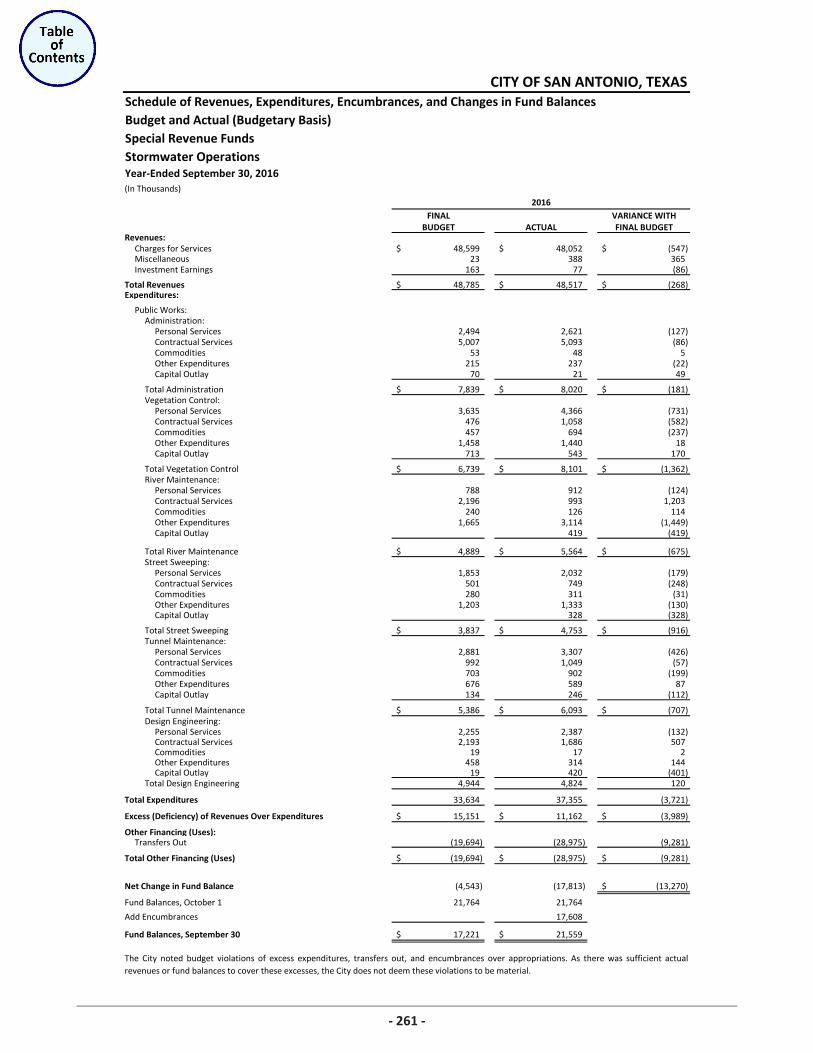
Schedule of Revenues, Expenditures, Encumbrances, and Changes in Fund BalancesBudget and Actual (Budgetary Basis)Special Revenue FundsStormwater Operations
FINAL VARIANCE WITHBUDGET ACTUAL FINAL BUDGET
Charges for Services 48,599$ 48,052$ (547)$ Miscellaneous 23 388 365 Investment Earnings 163 77 (86)
Total Revenues 48,785$ 48,517$ (268)$ Expenditures:
Public Works:Administration:
Personal Services 2,494 2,621 (127) Contractual Services 5,007 5,093 (86) Commodities 53 48 5 Other Expenditures 215 237 (22) Capital Outlay 70 21 49
Total Administration 7,839$ 8,020$ (181)$ Vegetation Control:
Personal Services 3,635 4,366 (731) Contractual Services 476 1,058 (582) Commodities 457 694 (237) Other Expenditures 1,458 1,440 18 Capital Outlay 713 543 170
Total Vegetation Control 6,739$ 8,101$ (1,362)$ River Maintenance:
Personal Services 788 912 (124) Contractual Services 2,196 993 1,203 Commodities 240 126 114 Other Expenditures 1,665 3,114 (1,449) Capital Outlay 419 (419)
Total River Maintenance 4,889$ 5,564$ (675)$ Street Sweeping:
Personal Services 1,853 2,032 (179) Contractual Services 501 749 (248) Commodities 280 311 (31) Other Expenditures 1,203 1,333 (130) Capital Outlay 328 (328)
Total Street Sweeping 3,837$ 4,753$ (916)$ Tunnel Maintenance:
Personal Services 2,881 3,307 (426) Contractual Services 992 1,049 (57) Commodities 703 902 (199) Other Expenditures 676 589 87 Capital Outlay 134 246 (112)
Total Tunnel Maintenance 5,386$ 6,093$ (707)$ Design Engineering:
Personal Services 2,255 2,387 (132) Contractual Services 2,193 1,686 507 Commodities 19 17 2 Other Expenditures 458 314 144 Capital Outlay 19 420 (401)
Total Design Engineering 4,944 4,824 120
Total Expenditures 33,634 37,355 (3,721)
Excess (Deficiency) of Revenues Over Expenditures 15,151$ 11,162$ (3,989)$
Other Financing (Uses): Transfers Out (19,694) (28,975) (9,281)
Total Other Financing (Uses) (19,694)$ (28,975)$ (9,281)$
Net Change in Fund Balance (4,543) (17,813) (13,270)$
Fund Balances, October 1 21,764 21,764
Add Encumbrances 17,608
Fund Balances, September 30 17,221$ 21,559$
The City noted budget violations of excess expenditures, transfers out, and encumbrances over appropriations. As there was sufficient actualrevenues or fund balances to cover these excesses, the City does not deem these violations to be material.
2016
CITY OF SAN ANTONIO, TEXAS
(In Thousands)
Year-Ended September 30, 2016
Revenues:
261
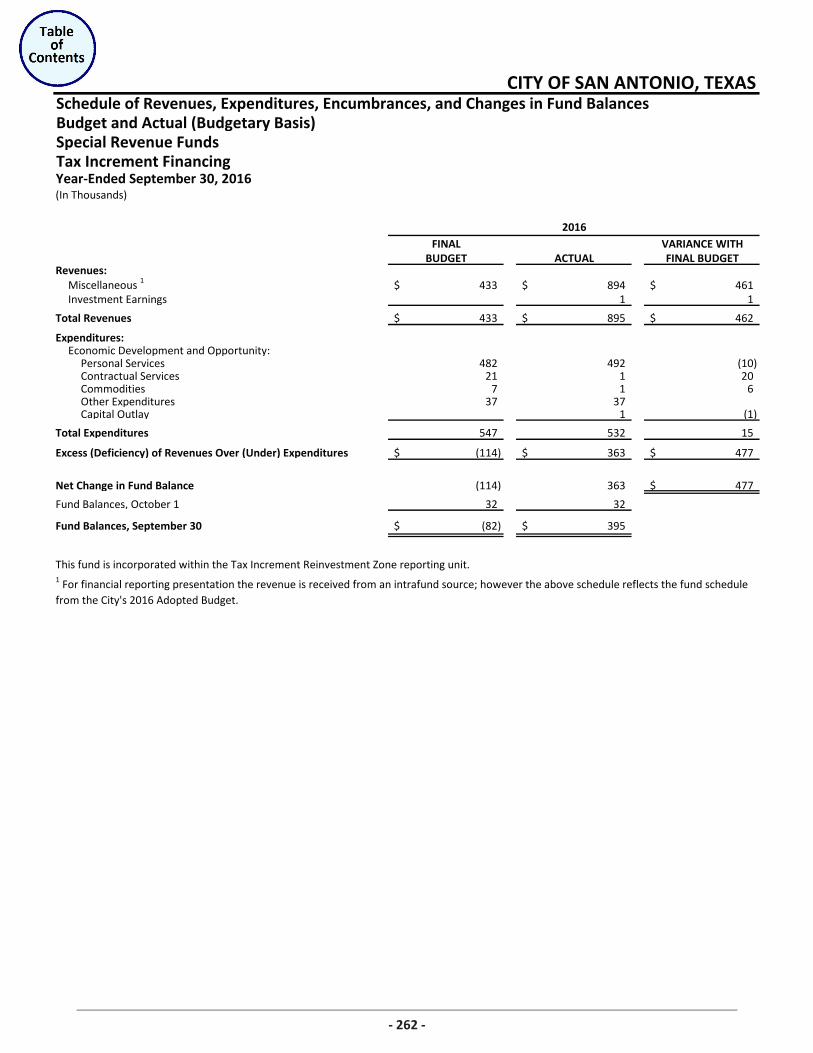
Schedule of Revenues, Expenditures, Encumbrances, and Changes in Fund BalancesBudget and Actual (Budgetary Basis)Special Revenue FundsTax Increment Financing
FINAL VARIANCE WITHBUDGET ACTUAL FINAL BUDGET
Miscellaneous 1 433$ 894$ 461$ Investment Earnings 1 1
Total Revenues 433$ 895$ 462$
Expenditures: Economic Development and Opportunity:
Personal Services 482 492 (10) Contractual Services 21 1 20 Commodities 7 1 6 Other Expenditures 37 37 Capital Outlay 1 (1)
Total Expenditures 547 532 15
Excess (Deficiency) of Revenues Over (Under) Expenditures (114)$ 363$ 477$
Net Change in Fund Balance (114) 363 477$
Fund Balances, October 1 32 32
Fund Balances, September 30 (82)$ 395$
This fund is incorporated within the Tax Increment Reinvestment Zone reporting unit.
2016
CITY OF SAN ANTONIO, TEXAS
(In Thousands)Year-Ended September 30, 2016
Revenues:
1 For financial reporting presentation the revenue is received from an intrafund source; however the above schedule reflects the fund schedule from the City's 2016 Adopted Budget.
262
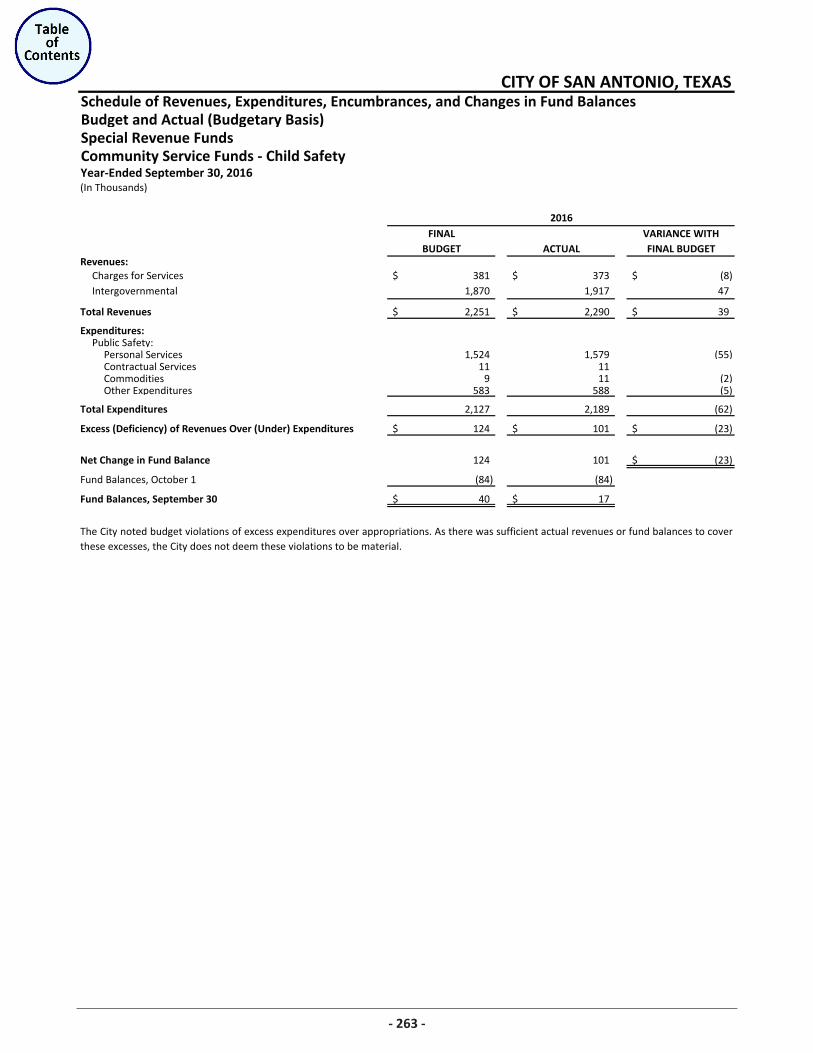
Schedule of Revenues, Expenditures, Encumbrances, and Changes in Fund BalancesBudget and Actual (Budgetary Basis)Special Revenue FundsCommunity Service Funds - Child SafetyYear-Ended September 30, 2016
FINAL VARIANCE WITHBUDGET ACTUAL FINAL BUDGET
Charges for Services 381$ 373$ (8)$ Intergovernmental 1,870 1,917 47
Total Revenues 2,251$ 2,290$ 39$
Expenditures: Public Safety:
Personal Services 1,524 1,579 (55) Contractual Services 11 11 Commodities 9 11 (2) Other Expenditures 583 588 (5)
Total Expenditures 2,127 2,189 (62)
Excess (Deficiency) of Revenues Over (Under) Expenditures 124$ 101$ (23)$
Net Change in Fund Balance 124 101 (23)$
Fund Balances, October 1 (84) (84)
Fund Balances, September 30 40$ 17$
The City noted budget violations of excess expenditures over appropriations. As there was sufficient actual revenues or fund balances to coverthese excesses, the City does not deem these violations to be material.
2016
Revenues:
CITY OF SAN ANTONIO, TEXAS
(In Thousands)
263
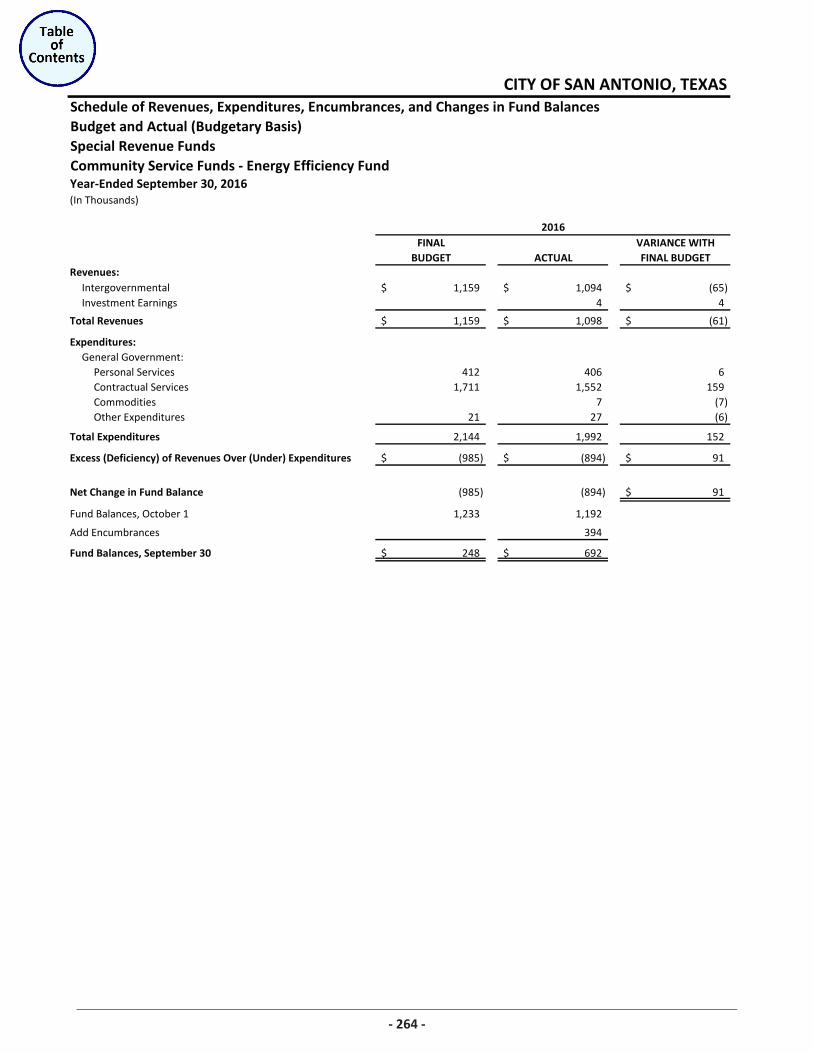
Schedule of Revenues, Expenditures, Encumbrances, and Changes in Fund BalancesBudget and Actual (Budgetary Basis)Special Revenue FundsCommunity Service Funds - Energy Efficiency Fund
FINAL VARIANCE WITHBUDGET ACTUAL FINAL BUDGET
Intergovernmental 1,159$ 1,094$ (65)$ Investment Earnings 4 4
Total Revenues 1,159$ 1,098$ (61)$
Expenditures: General Government:
Personal Services 412 406 6 Contractual Services 1,711 1,552 159 Commodities 7 (7) Other Expenditures 21 27 (6)
Total Expenditures 2,144 1,992 152
Excess (Deficiency) of Revenues Over (Under) Expenditures (985)$ (894)$ 91$
Net Change in Fund Balance (985) (894) 91$
Fund Balances, October 1 1,233 1,192
Add Encumbrances 394
Fund Balances, September 30 248$ 692$
CITY OF SAN ANTONIO, TEXAS
(In Thousands)
2016
Revenues:
Year-Ended September 30, 2016
264
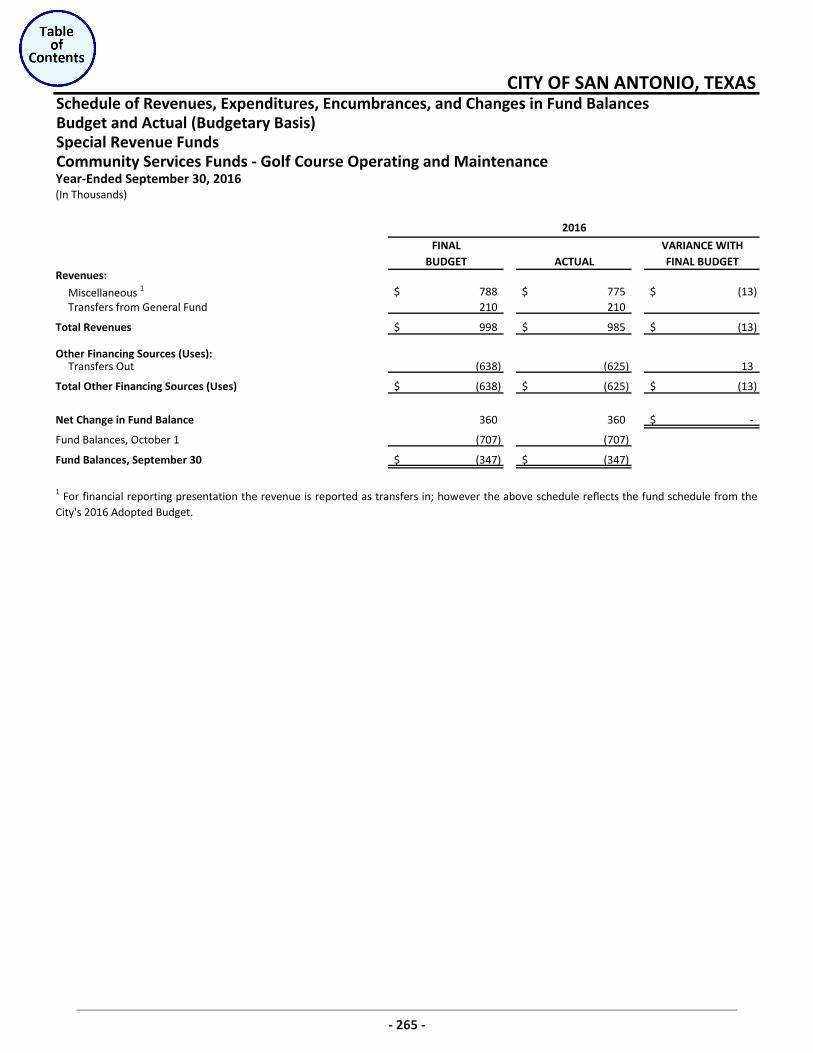
Schedule of Revenues, Expenditures, Encumbrances, and Changes in Fund BalancesBudget and Actual (Budgetary Basis)Special Revenue FundsCommunity Services Funds - Golf Course Operating and Maintenance
FINAL VARIANCE WITHBUDGET ACTUAL FINAL BUDGET
Miscellaneous 1 788$ 775$ (13)$ Transfers from General Fund 210 210
Total Revenues 998$ 985$ (13)$
Other Financing Sources (Uses):Transfers Out (638) (625) 13
Total Other Financing Sources (Uses) (638)$ (625)$ (13)$
Net Change in Fund Balance 360 360 -$
Fund Balances, October 1 (707) (707)
Fund Balances, September 30 (347)$ (347)$
1 For financial reporting presentation the revenue is reported as transfers in; however the above schedule reflects the fund schedule from theCity's 2016 Adopted Budget.
2016
Revenues:
CITY OF SAN ANTONIO, TEXAS
(In Thousands)Year-Ended September 30, 2016
265
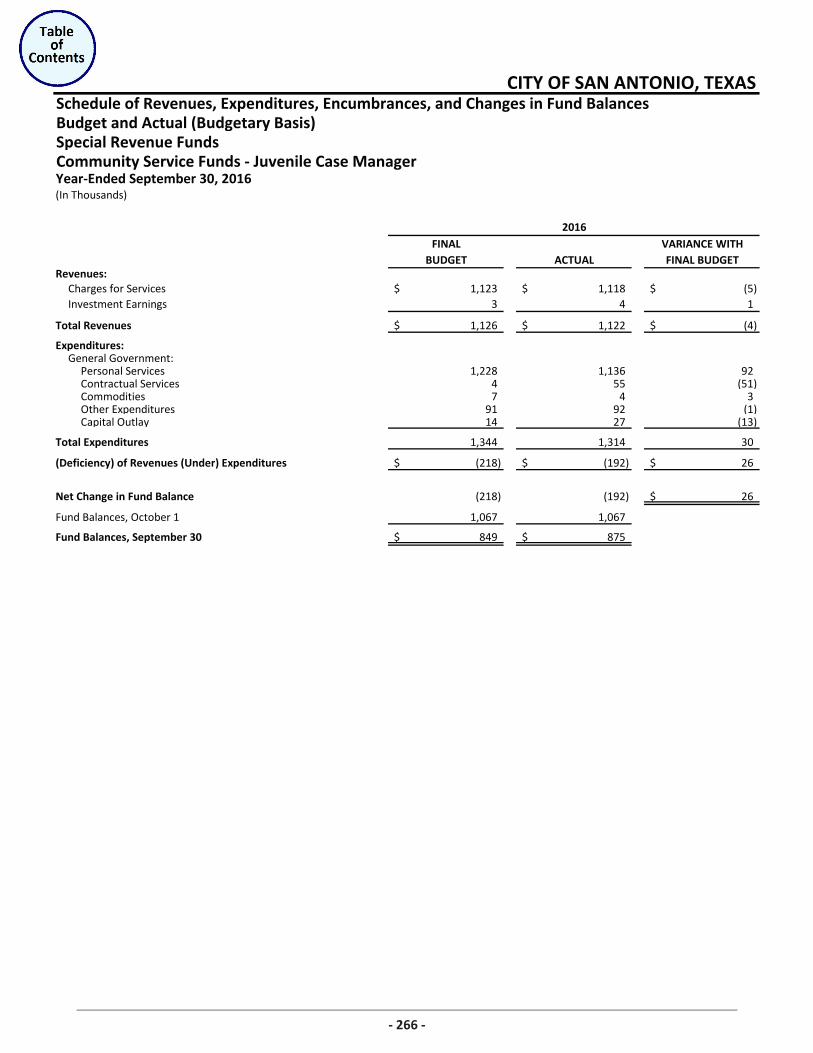
Schedule of Revenues, Expenditures, Encumbrances, and Changes in Fund BalancesBudget and Actual (Budgetary Basis)Special Revenue FundsCommunity Service Funds - Juvenile Case Manager
FINAL VARIANCE WITHBUDGET ACTUAL FINAL BUDGET
Charges for Services 1,123$ 1,118$ (5)$ Investment Earnings 3 4 1
Total Revenues 1,126$ 1,122$ (4)$
Expenditures: General Government:
Personal Services 1,228 1,136 92 Contractual Services 4 55 (51) Commodities 7 4 3 Other Expenditures 91 92 (1) Capital Outlay 14 27 (13)
Total Expenditures 1,344 1,314 30
(Deficiency) of Revenues (Under) Expenditures (218)$ (192)$ 26$
Net Change in Fund Balance (218) (192) 26$
Fund Balances, October 1 1,067 1,067
Fund Balances, September 30 849$ 875$
Revenues:
CITY OF SAN ANTONIO, TEXAS
(In Thousands)
2016
Year-Ended September 30, 2016
266
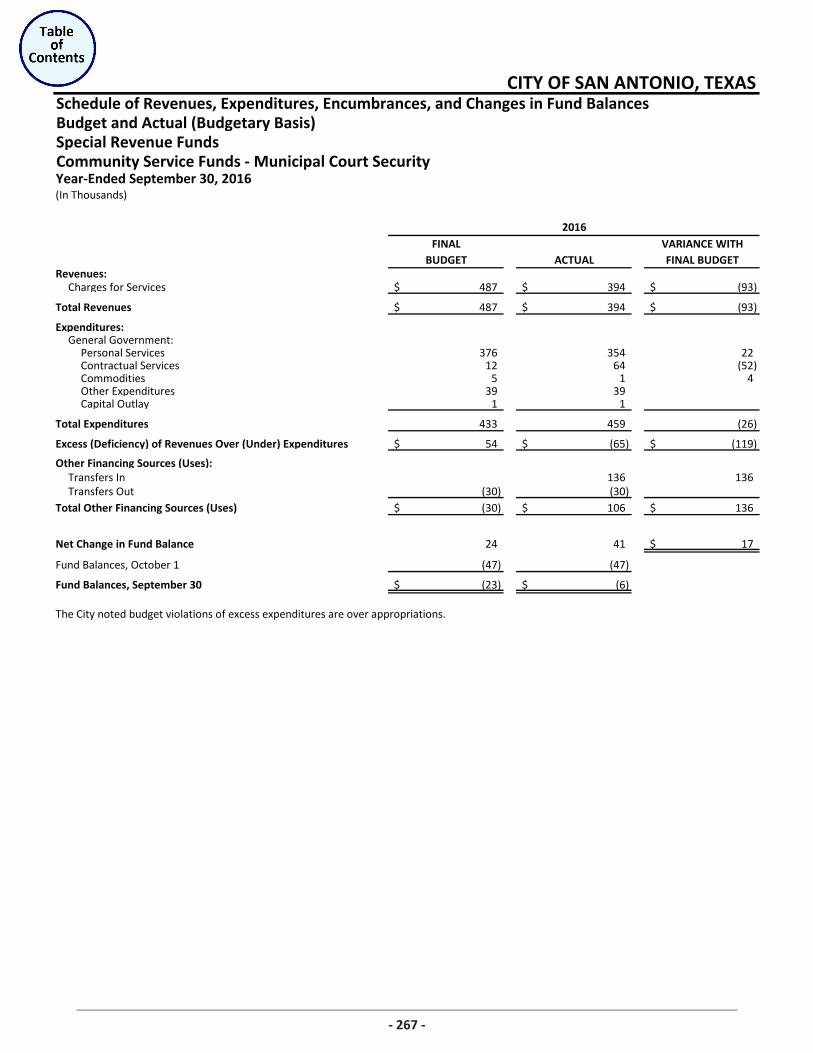
Schedule of Revenues, Expenditures, Encumbrances, and Changes in Fund BalancesBudget and Actual (Budgetary Basis)Special Revenue FundsCommunity Service Funds - Municipal Court Security
FINAL VARIANCE WITHBUDGET ACTUAL FINAL BUDGET
Charges for Services 487$ 394$ (93)$
Total Revenues 487$ 394$ (93)$
Expenditures: General Government:
Personal Services 376 354 22 Contractual Services 12 64 (52) Commodities 5 1 4 Other Expenditures 39 39 Capital Outlay 1 1
Total Expenditures 433 459 (26)
Excess (Deficiency) of Revenues Over (Under) Expenditures 54$ (65)$ (119)$
Other Financing Sources (Uses):Transfers In 136 136 Transfers Out (30) (30)
Total Other Financing Sources (Uses) (30)$ 106$ 136$
Net Change in Fund Balance 24 41 17$
Fund Balances, October 1 (47) (47)
Fund Balances, September 30 (23)$ (6)$
The City noted budget violations of excess expenditures are over appropriations.
CITY OF SAN ANTONIO, TEXAS
(In Thousands)
2016
Revenues:
Year-Ended September 30, 2016
267
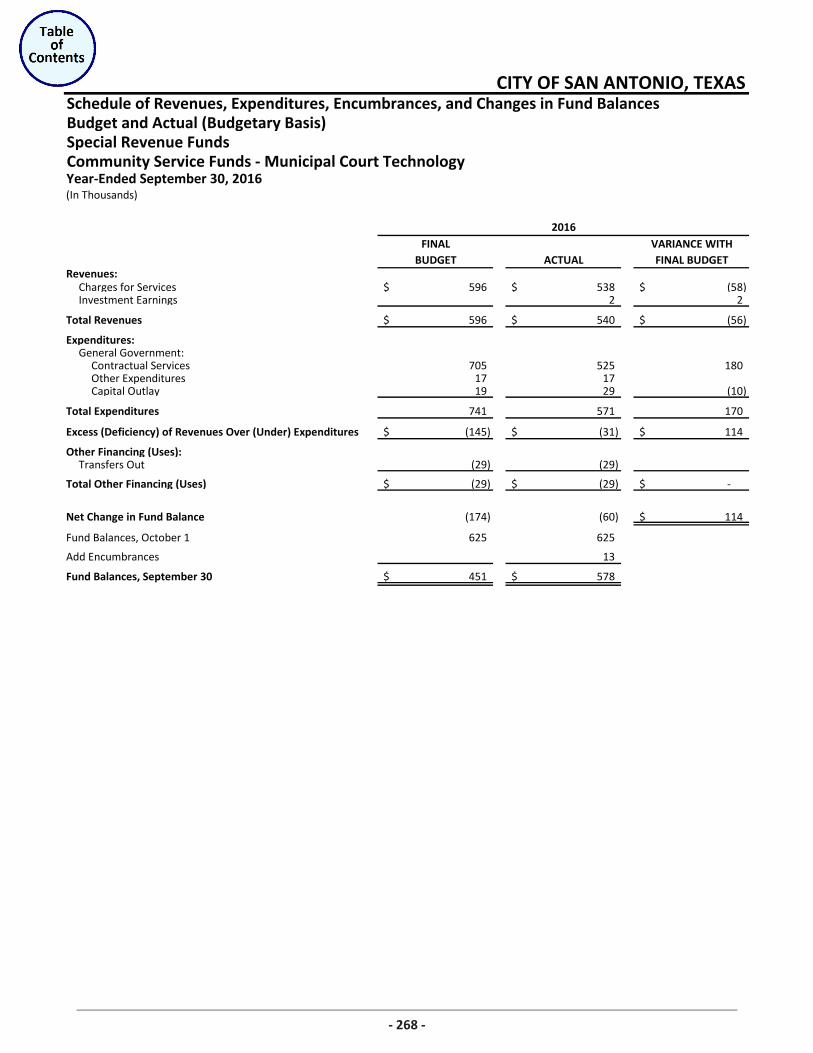
Schedule of Revenues, Expenditures, Encumbrances, and Changes in Fund BalancesBudget and Actual (Budgetary Basis)Special Revenue FundsCommunity Service Funds - Municipal Court Technology
FINAL VARIANCE WITHBUDGET ACTUAL FINAL BUDGET
Charges for Services 596$ 538$ (58)$ Investment Earnings 2 2
Total Revenues 596$ 540$ (56)$
Expenditures: General Government:
Contractual Services 705 525 180 Other Expenditures 17 17 Capital Outlay 19 29 (10)
Total Expenditures 741 571 170
Excess (Deficiency) of Revenues Over (Under) Expenditures (145)$ (31)$ 114$
Other Financing (Uses):Transfers Out (29) (29)
Total Other Financing (Uses) (29)$ (29)$ -$
Net Change in Fund Balance (174) (60) 114$
Fund Balances, October 1 625 625
Add Encumbrances 13
Fund Balances, September 30 451$ 578$
CITY OF SAN ANTONIO, TEXAS
Year-Ended September 30, 2016(In Thousands)
2016
Revenues:
268
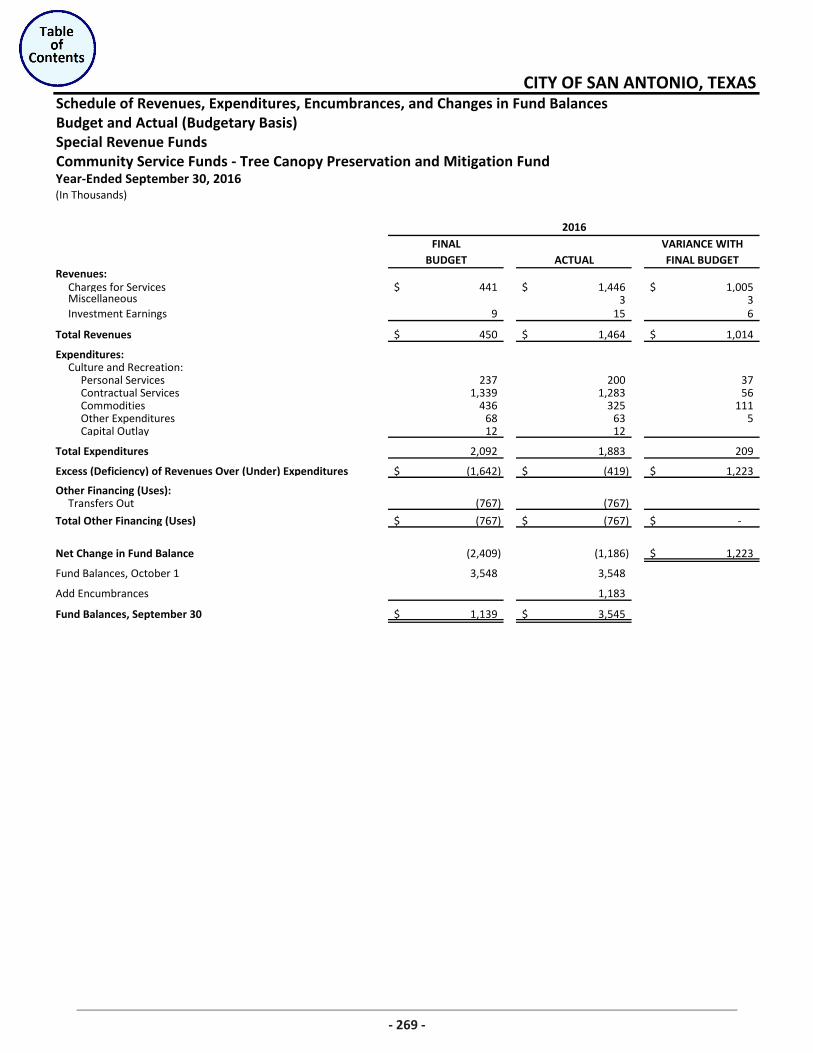
Schedule of Revenues, Expenditures, Encumbrances, and Changes in Fund BalancesBudget and Actual (Budgetary Basis)Special Revenue FundsCommunity Service Funds - Tree Canopy Preservation and Mitigation Fund
FINAL VARIANCE WITHBUDGET ACTUAL FINAL BUDGET
Charges for Services 441$ 1,446$ 1,005$ Miscellaneous 3 3 Investment Earnings 9 15 6
Total Revenues 450$ 1,464$ 1,014$
Expenditures: Culture and Recreation:
Personal Services 237 200 37 Contractual Services 1,339 1,283 56 Commodities 436 325 111 Other Expenditures 68 63 5 Capital Outlay 12 12
Total Expenditures 2,092 1,883 209
Excess (Deficiency) of Revenues Over (Under) Expenditures (1,642)$ (419)$ 1,223$
Other Financing (Uses):Transfers Out (767) (767)
Total Other Financing (Uses) (767)$ (767)$ -$
Net Change in Fund Balance (2,409) (1,186) 1,223$
Fund Balances, October 1 3,548 3,548
Add Encumbrances 1,183
Fund Balances, September 30 1,139$ 3,545$
2016
Revenues:
CITY OF SAN ANTONIO, TEXAS
(In Thousands)Year-Ended September 30, 2016
269
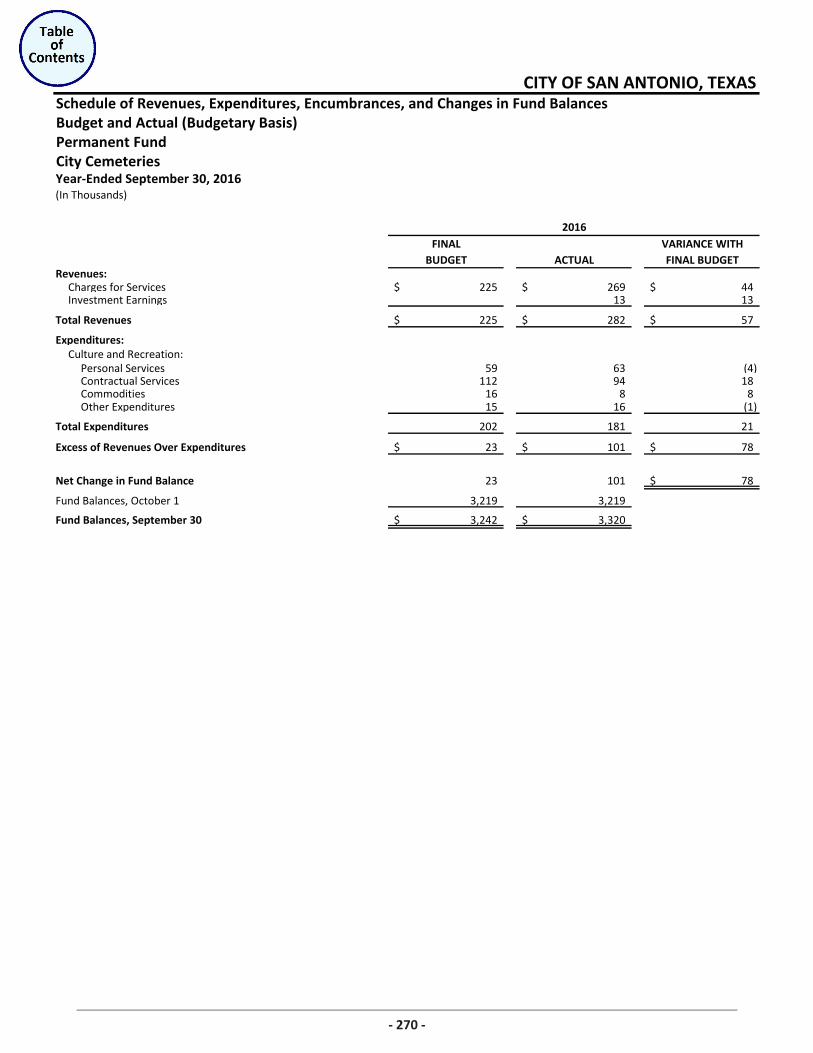
Schedule of Revenues, Expenditures, Encumbrances, and Changes in Fund BalancesBudget and Actual (Budgetary Basis)Permanent FundCity Cemeteries
FINAL VARIANCE WITHBUDGET ACTUAL FINAL BUDGET
Charges for Services 225$ 269$ 44$ Investment Earnings 13 13
Total Revenues 225$ 282$ 57$
Expenditures: Culture and Recreation:
Personal Services 59 63 (4) Contractual Services 112 94 18 Commodities 16 8 8 Other Expenditures 15 16 (1)
Total Expenditures 202 181 21
Excess of Revenues Over Expenditures 23$ 101$ 78$
Net Change in Fund Balance 23 101 78$
Fund Balances, October 1 3,219 3,219
Fund Balances, September 30 3,242$ 3,320$
2016
Revenues:
CITY OF SAN ANTONIO, TEXAS
(In Thousands)Year-Ended September 30, 2016
270
Nonmajor Enterprise FundsDEVELOPMENT SERVICES – accounts for all revenues and expenses associated with theoperation and maintenance of the City’s development and service activities.
MARKET SQUARE – accounts for all revenues and expenses associated with themanagement and operation of the Farmer’s Market, El Mercado, the Market Square ParkingLot, and Alameda.
PARKING SYSTEM – accounts for all revenues and expenses associated with the operationand maintenance of the City’s structures and parking lots, required debt service foroutstanding bonds, and construction and management of the Parking System’s assets.
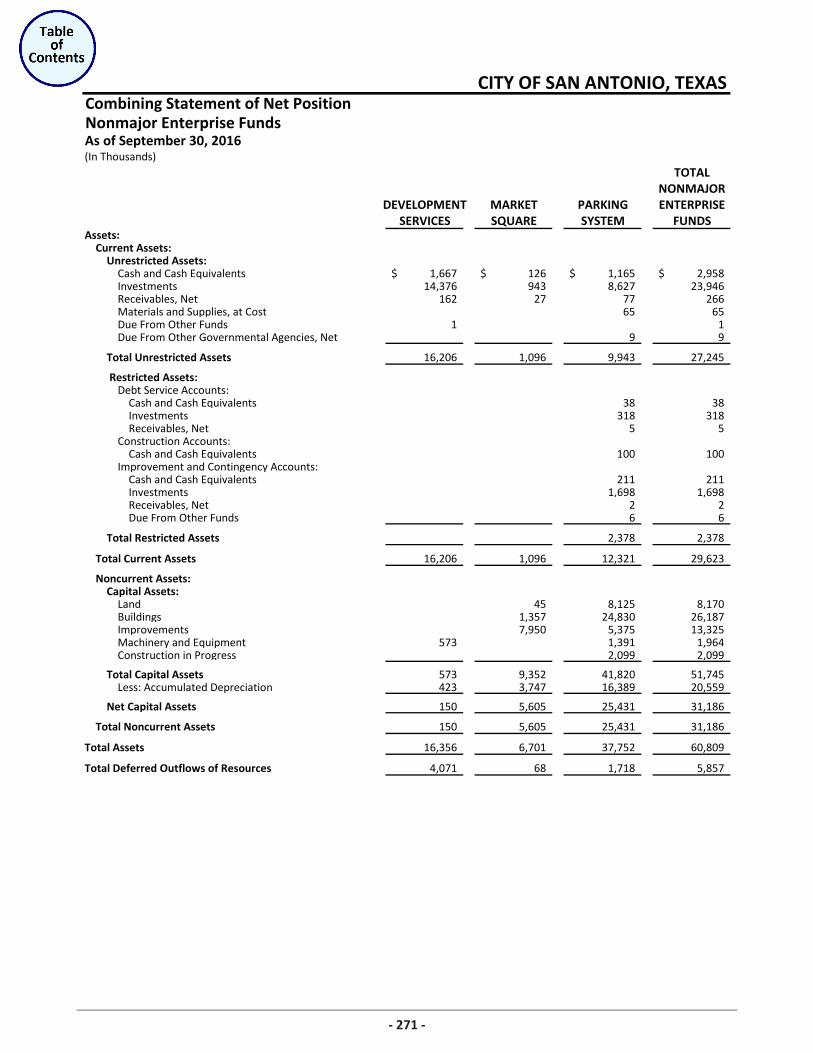
Combining Statement of Net PositionNonmajor Enterprise FundsAs of September 30, 2016(In Thousands)
TOTALNONMAJOR
DEVELOPMENT MARKET PARKING ENTERPRISESERVICES SQUARE SYSTEM FUNDS
Assets:Current Assets:
Unrestricted Assets:Cash and Cash Equivalents 1,667$ 126$ 1,165$ 2,958$ Investments 14,376 943 8,627 23,946 Receivables, Net 162 27 77 266 Materials and Supplies, at Cost 65 65 Due From Other Funds 1 1 Due From Other Governmental Agencies, Net 9 9
Total Unrestricted Assets 16,206 1,096 9,943 27,245
Restricted Assets:Debt Service Accounts:
Cash and Cash Equivalents 38 38 Investments 318 318 Receivables, Net 5 5
Construction Accounts: Cash and Cash Equivalents 100 100
Improvement and Contingency Accounts: Cash and Cash Equivalents 211 211 Investments 1,698 1,698 Receivables, Net 2 2 Due From Other Funds 6 6
Total Restricted Assets 2,378 2,378
Total Current Assets 16,206 1,096 12,321 29,623
Noncurrent Assets:Capital Assets:
Land 45 8,125 8,170 Buildings 1,357 24,830 26,187 Improvements 7,950 5,375 13,325 Machinery and Equipment 573 1,391 1,964 Construction in Progress 2,099 2,099
Total Capital Assets 573 9,352 41,820 51,745 Less: Accumulated Depreciation 423 3,747 16,389 20,559
Net Capital Assets 150 5,605 25,431 31,186
Total Noncurrent Assets 150 5,605 25,431 31,186
Total Assets 16,356 6,701 37,752 60,809
Total Deferred Outflows of Resources 4,071 68 1,718 5,857
CITY OF SAN ANTONIO, TEXAS
271
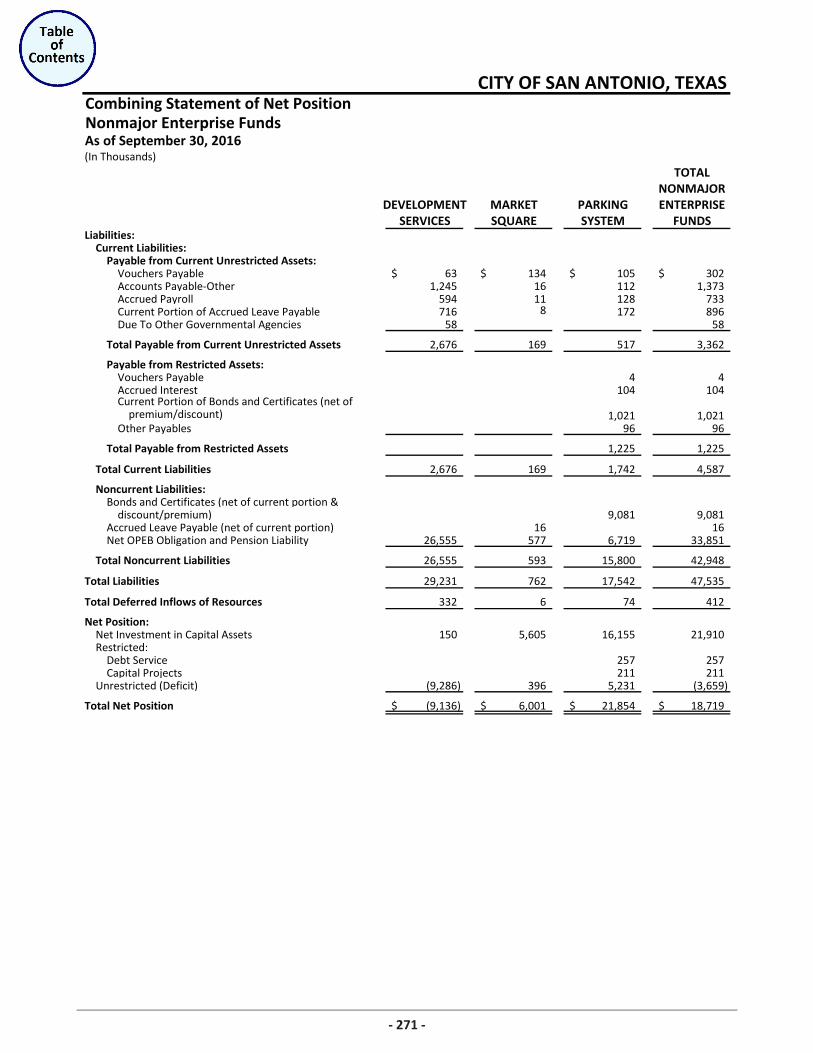
Combining Statement of Net PositionNonmajor Enterprise FundsAs of September 30, 2016(In Thousands)
TOTALNONMAJOR
DEVELOPMENT MARKET PARKING ENTERPRISESERVICES SQUARE SYSTEM FUNDS
Liabilities:Current Liabilities:
Payable from Current Unrestricted Assets:Vouchers Payable 63$ 134$ 105$ 302$ Accounts Payable-Other 1,245 16 112 1,373 Accrued Payroll 594 11 128 733 Current Portion of Accrued Leave Payable 716 8 172 896 Due To Other Governmental Agencies 58 58
Total Payable from Current Unrestricted Assets 2,676 169 517 3,362
Payable from Restricted Assets:Vouchers Payable 4 4 Accrued Interest 104 104 Current Portion of Bonds and Certificates (net of
premium/discount) 1,021 1,021 Other Payables 96 96
Total Payable from Restricted Assets 1,225 1,225
Total Current Liabilities 2,676 169 1,742 4,587
Noncurrent Liabilities:Bonds and Certificates (net of current portion &
discount/premium) 9,081 9,081 Accrued Leave Payable (net of current portion) 16 16 Net OPEB Obligation and Pension Liability 26,555 577 6,719 33,851
Total Noncurrent Liabilities 26,555 593 15,800 42,948
Total Liabilities 29,231 762 17,542 47,535
Total Deferred Inflows of Resources 332 6 74 412
Net Position:Net Investment in Capital Assets 150 5,605 16,155 21,910 Restricted:
Debt Service 257 257 Capital Projects 211 211
Unrestricted (Deficit) (9,286) 396 5,231 (3,659)
Total Net Position (9,136)$ 6,001$ 21,854$ 18,719$
CITY OF SAN ANTONIO, TEXAS
271
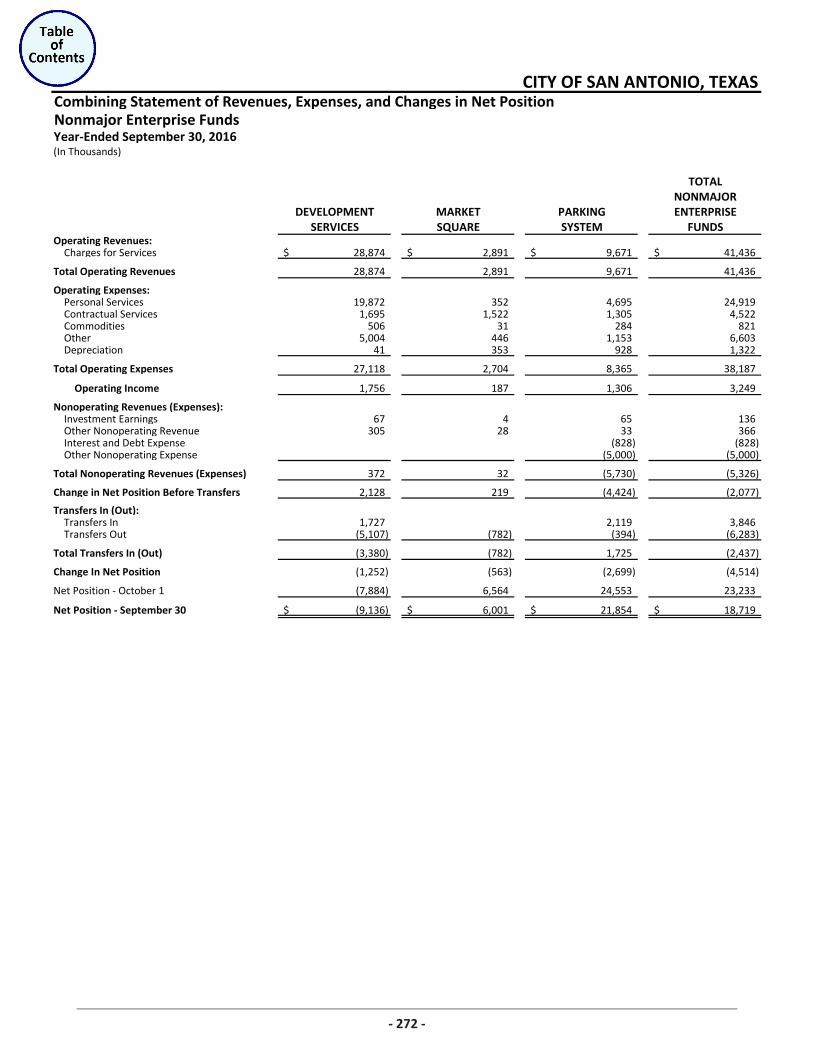
Combining Statement of Revenues, Expenses, and Changes in Net PositionNonmajor Enterprise FundsYear-Ended September 30, 2016(In Thousands)
TOTALNONMAJOR
DEVELOPMENT MARKET PARKING ENTERPRISESERVICES SQUARE SYSTEM FUNDS
Operating Revenues:Charges for Services 28,874$ 2,891$ 9,671$ 41,436$
Total Operating Revenues 28,874 2,891 9,671 41,436
Operating Expenses:Personal Services 19,872 352 4,695 24,919 Contractual Services 1,695 1,522 1,305 4,522 Commodities 506 31 284 821 Other 5,004 446 1,153 6,603 Depreciation 41 353 928 1,322
Total Operating Expenses 27,118 2,704 8,365 38,187
Operating Income 1,756 187 1,306 3,249
Nonoperating Revenues (Expenses):Investment Earnings 67 4 65 136 Other Nonoperating Revenue 305 28 33 366 Interest and Debt Expense (828) (828) Other Nonoperating Expense (5,000) (5,000)
Total Nonoperating Revenues (Expenses) 372 32 (5,730) (5,326)
Change in Net Position Before Transfers 2,128 219 (4,424) (2,077)
Transfers In (Out):Transfers In 1,727 2,119 3,846 Transfers Out (5,107) (782) (394) (6,283)
Total Transfers In (Out) (3,380) (782) 1,725 (2,437)
Change In Net Position (1,252) (563) (2,699) (4,514)
Net Position - October 1 (7,884) 6,564 24,553 23,233
Net Position - September 30 (9,136)$ 6,001$ 21,854$ 18,719$
CITY OF SAN ANTONIO, TEXAS
272
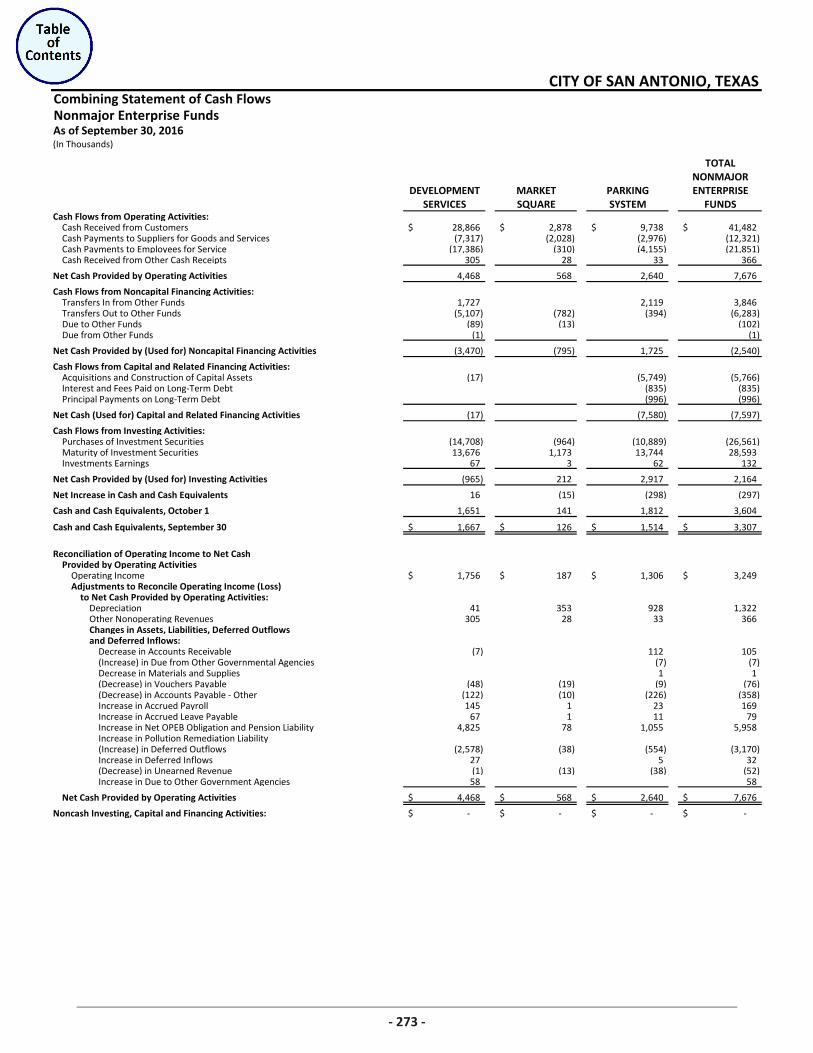
Combining Statement of Cash FlowsNonmajor Enterprise FundsAs of September 30, 2016(In Thousands)
TOTALNONMAJOR
DEVELOPMENT MARKET PARKING ENTERPRISESERVICES SQUARE SYSTEM FUNDS
Cash Flows from Operating Activities:Cash Received from Customers 28,866$ 2,878$ 9,738$ 41,482$ Cash Payments to Suppliers for Goods and Services (7,317) (2,028) (2,976) (12,321) Cash Payments to Employees for Service (17,386) (310) (4,155) (21,851) Cash Received from Other Cash Receipts 305 28 33 366
Net Cash Provided by Operating Activities 4,468 568 2,640 7,676
Cash Flows from Noncapital Financing Activities:Transfers In from Other Funds 1,727 2,119 3,846 Transfers Out to Other Funds (5,107) (782) (394) (6,283) Due to Other Funds (89) (13) (102) Due from Other Funds (1) (1)
Net Cash Provided by (Used for) Noncapital Financing Activities (3,470) (795) 1,725 (2,540)
Cash Flows from Capital and Related Financing Activities:Acquisitions and Construction of Capital Assets (17) (5,749) (5,766) Interest and Fees Paid on Long-Term Debt (835) (835) Principal Payments on Long-Term Debt (996) (996)
Net Cash (Used for) Capital and Related Financing Activities (17) (7,580) (7,597)
Cash Flows from Investing Activities: Purchases of Investment Securities (14,708) (964) (10,889) (26,561) Maturity of Investment Securities 13,676 1,173 13,744 28,593 Investments Earnings 67 3 62 132
Net Cash Provided by (Used for) Investing Activities (965) 212 2,917 2,164
Net Increase in Cash and Cash Equivalents 16 (15) (298) (297)
Cash and Cash Equivalents, October 1 1,651 141 1,812 3,604
Cash and Cash Equivalents, September 30 1,667$ 126$ 1,514$ 3,307$
Reconciliation of Operating Income to Net CashProvided by Operating Activities
Operating Income 1,756$ 187$ 1,306$ 3,249$ Adjustments to Reconcile Operating Income (Loss)
to Net Cash Provided by Operating Activities: Depreciation 41 353 928 1,322 Other Nonoperating Revenues 305 28 33 366 Changes in Assets, Liabilities, Deferred Outflows and Deferred Inflows:
Decrease in Accounts Receivable (7) 112 105 (Increase) in Due from Other Governmental Agencies (7) (7) Decrease in Materials and Supplies 1 1 (Decrease) in Vouchers Payable (48) (19) (9) (76) (Decrease) in Accounts Payable - Other (122) (10) (226) (358) Increase in Accrued Payroll 145 1 23 169 Increase in Accrued Leave Payable 67 1 11 79 Increase in Net OPEB Obligation and Pension Liability 4,825 78 1,055 5,958 Increase in Pollution Remediation Liability (Increase) in Deferred Outflows (2,578) (38) (554) (3,170) Increase in Deferred Inflows 27 5 32 (Decrease) in Unearned Revenue (1) (13) (38) (52) Increase in Due to Other Government Agencies 58 58
Net Cash Provided by Operating Activities 4,468$ 568$ 2,640$ 7,676$
Noncash Investing, Capital and Financing Activities: -$ -$ -$ -$
CITY OF SAN ANTONIO, TEXAS
273
Internal Service FundsSELF INSURANCE PROGRAMS – to account for Self Insurance Programs including funds forthe administration of all tort claims against the City and for the operation of the City’semployee benefit programs. Included in the Self Insurance Programs are the EmployeeHealth Benefits Program, Insurance Reserve Program, and Workers’ Compensation Program.
INFORMATION SERVICES – to account for financing of goods or services provided to otherdepartments or agencies in the field of data processing, programming, and communicationservices.
OTHER INTERNAL SERVICES – to account for financing of goods or services (other than dataprocessing and programming) provided to other departments or agencies. This fund has thefollowing divisions: Purchasing, Central Stores, Automotive Repair, Temporary Services andBuilding Maintenance and Repairs. Reserves for Equipment Renewal and Replacement arerecorded by charges to the user departments.
CAPITAL IMPROVEMENTS MANAGEMENT SERVICES (CIMS) – to account for revenues andexpenses associated with the administration and delivery of the City’s capital improvementprojects.
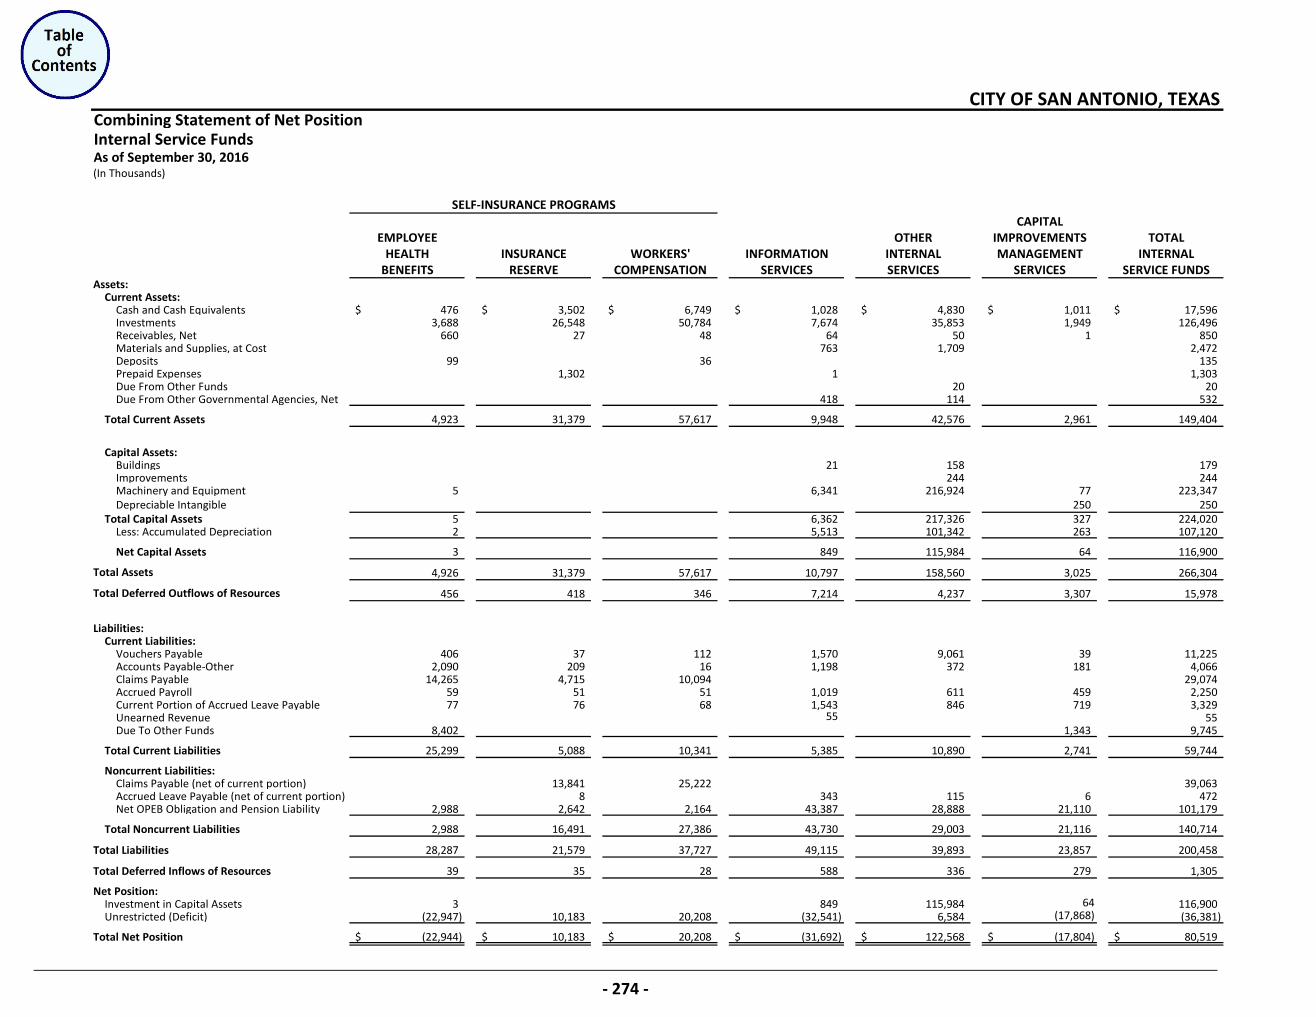
Combining Statement of Net PositionInternal Service FundsAs of September 30, 2016(In Thousands)
CAPITALEMPLOYEE OTHER IMPROVEMENTS TOTAL
HEALTH INSURANCE WORKERS' INFORMATION INTERNAL MANAGEMENT INTERNALBENEFITS RESERVE COMPENSATION SERVICES SERVICES SERVICES SERVICE FUNDS
Assets:Current Assets:
Cash and Cash Equivalents 476$ 3,502$ 6,749$ 1,028$ 4,830$ 1,011$ 17,596$ Investments 3,688 26,548 50,784 7,674 35,853 1,949 126,496 Receivables, Net 660 27 48 64 50 1 850 Materials and Supplies, at Cost 763 1,709 2,472 Deposits 99 36 135 Prepaid Expenses 1,302 1 1,303 Due From Other Funds 20 20 Due From Other Governmental Agencies, Net 418 114 532
Total Current Assets 4,923 31,379 57,617 9,948 42,576 2,961 149,404
Capital Assets: Buildings 21 158 179 Improvements 244 244 Machinery and Equipment 5 6,341 216,924 77 223,347 Depreciable Intangible 250 250
Total Capital Assets 5 6,362 217,326 327 224,020 Less: Accumulated Depreciation 2 5,513 101,342 263 107,120
Net Capital Assets 3 849 115,984 64 116,900
Total Assets 4,926 31,379 57,617 10,797 158,560 3,025 266,304
Total Deferred Outflows of Resources 456 418 346 7,214 4,237 3,307 15,978
Liabilities:Current Liabilities:
Vouchers Payable 406 37 112 1,570 9,061 39 11,225 Accounts Payable-Other 2,090 209 16 1,198 372 181 4,066 Claims Payable 14,265 4,715 10,094 29,074 Accrued Payroll 59 51 51 1,019 611 459 2,250 Current Portion of Accrued Leave Payable 77 76 68 1,543 846 719 3,329 Unearned Revenue 55 55 Due To Other Funds 8,402 1,343 9,745
Total Current Liabilities 25,299 5,088 10,341 5,385 10,890 2,741 59,744
Noncurrent Liabilities:Claims Payable (net of current portion) 13,841 25,222 39,063 Accrued Leave Payable (net of current portion) 8 343 115 6 472 Net OPEB Obligation and Pension Liability 2,988 2,642 2,164 43,387 28,888 21,110 101,179
Total Noncurrent Liabilities 2,988 16,491 27,386 43,730 29,003 21,116 140,714
Total Liabilities 28,287 21,579 37,727 49,115 39,893 23,857 200,458
Total Deferred Inflows of Resources 39 35 28 588 336 279 1,305
Net Position:Investment in Capital Assets 3 849 115,984 64 116,900 Unrestricted (Deficit) (22,947) 10,183 20,208 (32,541) 6,584 (17,868) (36,381)
Total Net Position (22,944)$ 10,183$ 20,208$ (31,692)$ 122,568$ (17,804)$ 80,519$
SELF-INSURANCE PROGRAMS
CITY OF SAN ANTONIO, TEXAS
‐ 274 ‐
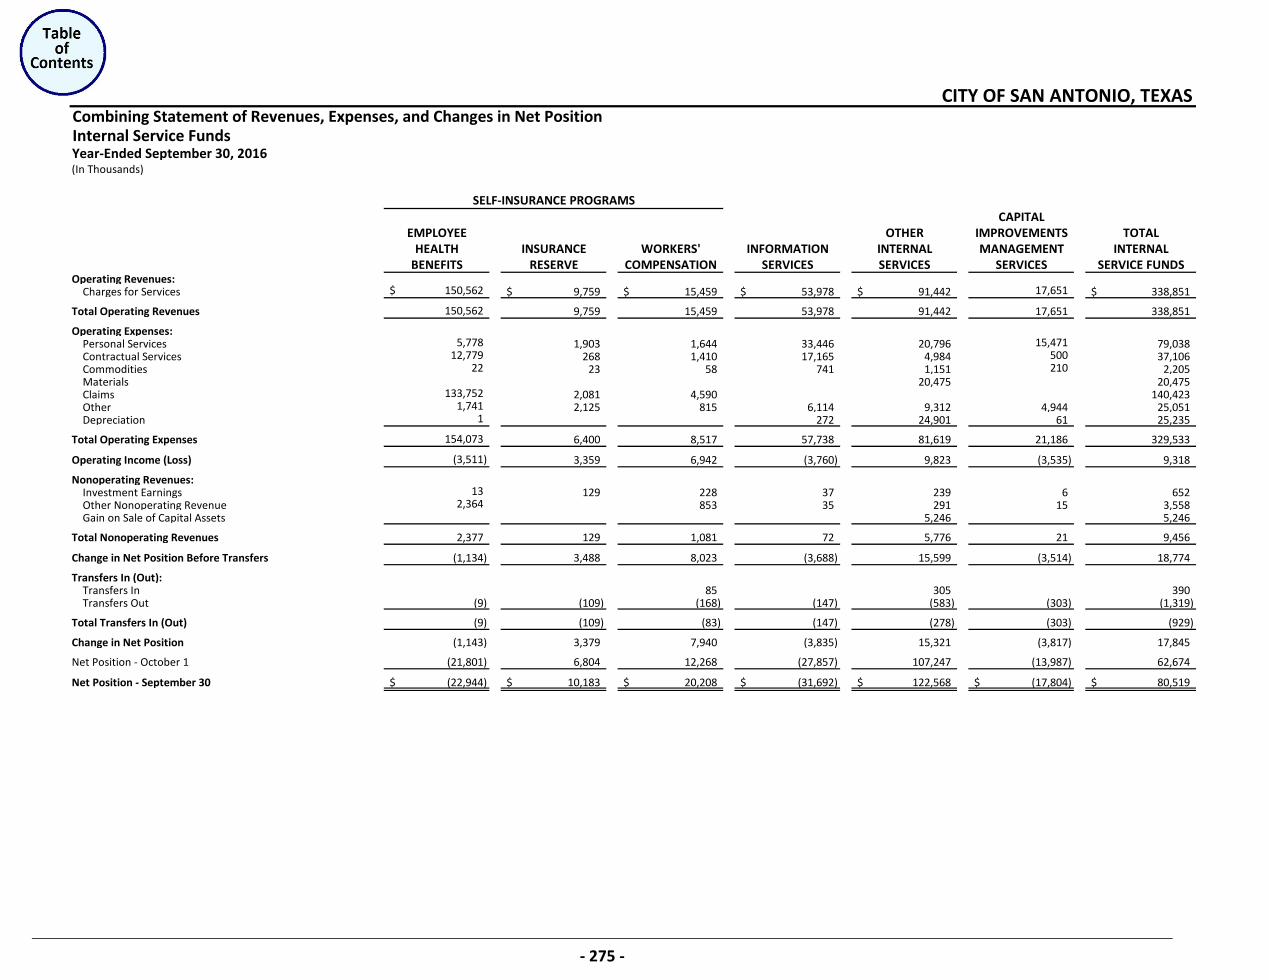
Combining Statement of Revenues, Expenses, and Changes in Net PositionInternal Service FundsYear-Ended September 30, 2016(In Thousands)
CAPITALEMPLOYEE OTHER IMPROVEMENTS TOTAL
HEALTH INSURANCE WORKERS' INFORMATION INTERNAL MANAGEMENT INTERNALBENEFITS RESERVE COMPENSATION SERVICES SERVICES SERVICES SERVICE FUNDS
Operating Revenues:Charges for Services 150,562$ 9,759$ 15,459$ 53,978$ 91,442$ 17,651 338,851$
Total Operating Revenues 150,562 9,759 15,459 53,978 91,442 17,651 338,851
Operating Expenses:Personal Services 5,778 1,903 1,644 33,446 20,796 15,471 79,038 Contractual Services 12,779 268 1,410 17,165 4,984 500 37,106 Commodities 22 23 58 741 1,151 210 2,205 Materials 20,475 20,475 Claims 133,752 2,081 4,590 140,423 Other 1,741 2,125 815 6,114 9,312 4,944 25,051 Depreciation 1 272 24,901 61 25,235
Total Operating Expenses 154,073 6,400 8,517 57,738 81,619 21,186 329,533
Operating Income (Loss) (3,511) 3,359 6,942 (3,760) 9,823 (3,535) 9,318
Nonoperating Revenues:Investment Earnings 13 129 228 37 239 6 652 Other Nonoperating Revenue 2,364 853 35 291 15 3,558 Gain on Sale of Capital Assets 5,246 5,246
Total Nonoperating Revenues 2,377 129 1,081 72 5,776 21 9,456
Change in Net Position Before Transfers (1,134) 3,488 8,023 (3,688) 15,599 (3,514) 18,774
Transfers In (Out):Transfers In 85 305 390 Transfers Out (9) (109) (168) (147) (583) (303) (1,319)
Total Transfers In (Out) (9) (109) (83) (147) (278) (303) (929)
Change in Net Position (1,143) 3,379 7,940 (3,835) 15,321 (3,817) 17,845
Net Position - October 1 (21,801) 6,804 12,268 (27,857) 107,247 (13,987) 62,674
Net Position - September 30 (22,944)$ 10,183$ 20,208$ (31,692)$ 122,568$ (17,804)$ 80,519$
SELF-INSURANCE PROGRAMS
CITY OF SAN ANTONIO, TEXAS
- 275 -
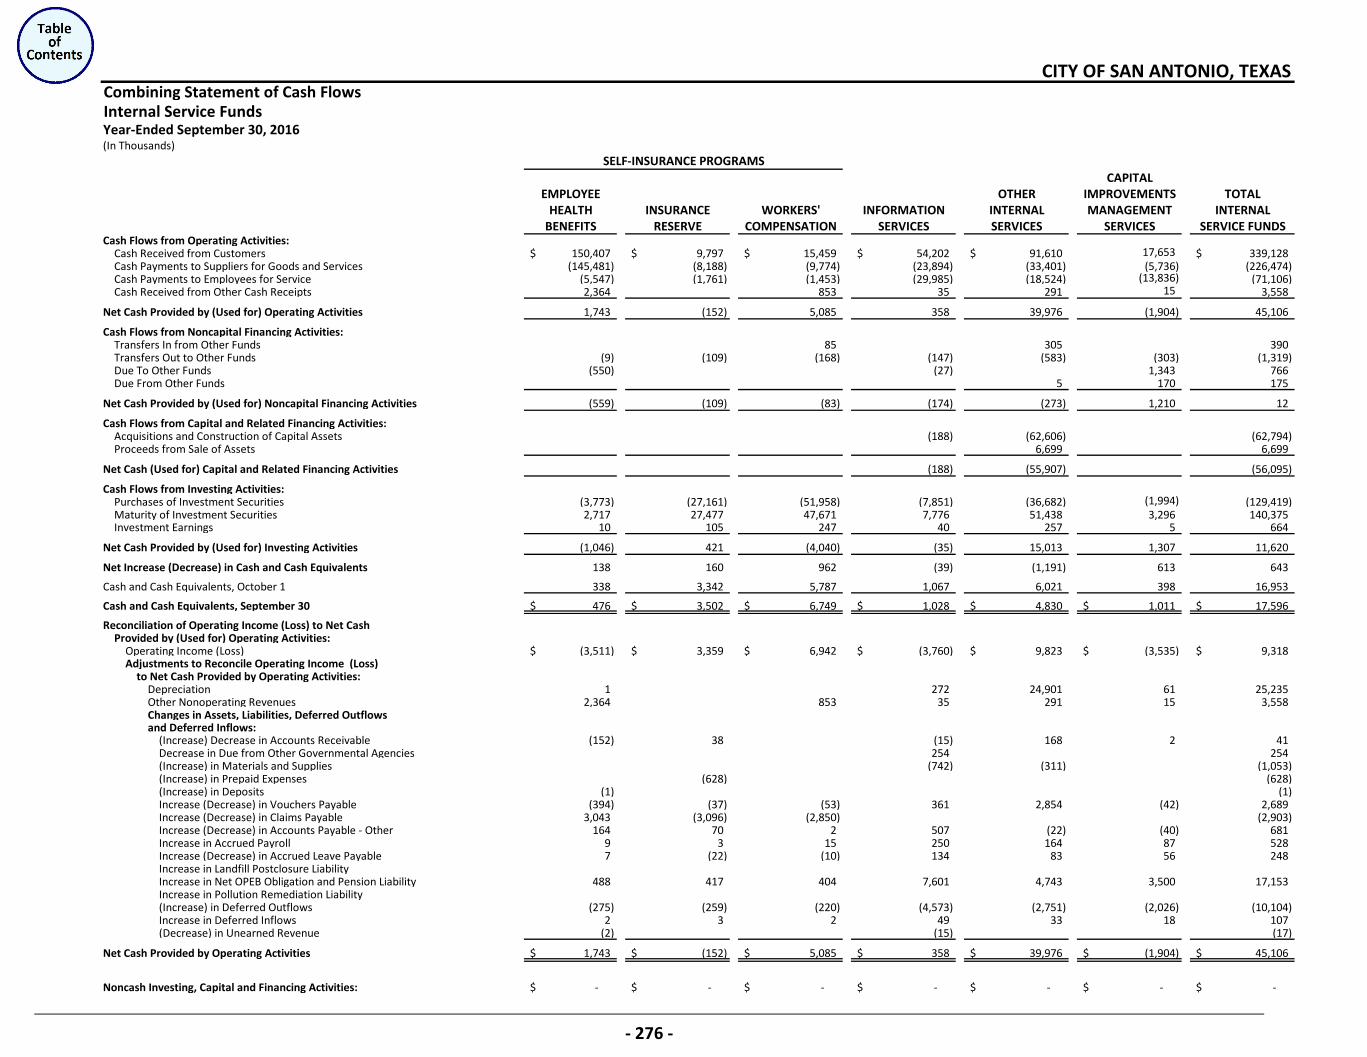
Combining Statement of Cash FlowsInternal Service FundsYear-Ended September 30, 2016(In Thousands)
CAPITALEMPLOYEE OTHER IMPROVEMENTS TOTAL
HEALTH INSURANCE WORKERS' INFORMATION INTERNAL MANAGEMENT INTERNALBENEFITS RESERVE COMPENSATION SERVICES SERVICES SERVICES SERVICE FUNDS
Cash Flows from Operating Activities:Cash Received from Customers 150,407$ 9,797$ 15,459$ 54,202$ 91,610$ 17,653 339,128$ Cash Payments to Suppliers for Goods and Services (145,481) (8,188) (9,774) (23,894) (33,401) (5,736) (226,474) Cash Payments to Employees for Service (5,547) (1,761) (1,453) (29,985) (18,524) (13,836) (71,106) Cash Received from Other Cash Receipts 2,364 853 35 291 15 3,558
Net Cash Provided by (Used for) Operating Activities 1,743 (152) 5,085 358 39,976 (1,904) 45,106
Cash Flows from Noncapital Financing Activities:Transfers In from Other Funds 85 305 390 Transfers Out to Other Funds (9) (109) (168) (147) (583) (303) (1,319) Due To Other Funds (550) (27) 1,343 766 Due From Other Funds 5 170 175
Net Cash Provided by (Used for) Noncapital Financing Activities (559) (109) (83) (174) (273) 1,210 12
Cash Flows from Capital and Related Financing Activities:Acquisitions and Construction of Capital Assets (188) (62,606) (62,794) Proceeds from Sale of Assets 6,699 6,699
Net Cash (Used for) Capital and Related Financing Activities (188) (55,907) (56,095)
Cash Flows from Investing Activities:Purchases of Investment Securities (3,773) (27,161) (51,958) (7,851) (36,682) (1,994) (129,419) Maturity of Investment Securities 2,717 27,477 47,671 7,776 51,438 3,296 140,375 Investment Earnings 10 105 247 40 257 5 664
Net Cash Provided by (Used for) Investing Activities (1,046) 421 (4,040) (35) 15,013 1,307 11,620
Net Increase (Decrease) in Cash and Cash Equivalents 138 160 962 (39) (1,191) 613 643
Cash and Cash Equivalents, October 1 338 3,342 5,787 1,067 6,021 398 16,953
Cash and Cash Equivalents, September 30 476$ 3,502$ 6,749$ 1,028$ 4,830$ 1,011$ 17,596$
Reconciliation of Operating Income (Loss) to Net CashProvided by (Used for) Operating Activities:
Operating Income (Loss) (3,511)$ 3,359$ 6,942$ (3,760)$ 9,823$ (3,535)$ 9,318$ Adjustments to Reconcile Operating Income (Loss)
to Net Cash Provided by Operating Activities: Depreciation 1 272 24,901 61 25,235 Other Nonoperating Revenues 2,364 853 35 291 15 3,558 Changes in Assets, Liabilities, Deferred Outflows and Deferred Inflows:
(Increase) Decrease in Accounts Receivable (152) 38 (15) 168 2 41 Decrease in Due from Other Governmental Agencies 254 254 (Increase) in Materials and Supplies (742) (311) (1,053) (Increase) in Prepaid Expenses (628) (628) (Increase) in Deposits (1) (1) Increase (Decrease) in Vouchers Payable (394) (37) (53) 361 2,854 (42) 2,689 Increase (Decrease) in Claims Payable 3,043 (3,096) (2,850) (2,903) Increase (Decrease) in Accounts Payable - Other 164 70 2 507 (22) (40) 681 Increase in Accrued Payroll 9 3 15 250 164 87 528 Increase (Decrease) in Accrued Leave Payable 7 (22) (10) 134 83 56 248 Increase in Landfill Postclosure Liability Increase in Net OPEB Obligation and Pension Liability 488 417 404 7,601 4,743 3,500 17,153 Increase in Pollution Remediation Liability (Increase) in Deferred Outflows (275) (259) (220) (4,573) (2,751) (2,026) (10,104) Increase in Deferred Inflows 2 3 2 49 33 18 107 (Decrease) in Unearned Revenue (2) (15) (17)
Net Cash Provided by Operating Activities 1,743$ (152)$ 5,085$ 358$ 39,976$ (1,904)$ 45,106$
Noncash Investing, Capital and Financing Activities: -$ -$ -$ -$ -$ -$ -$
SELF-INSURANCE PROGRAMS
CITY OF SAN ANTONIO, TEXAS
‐ 276 ‐
Fiduciary FundsFIRE AND POLICE PENSION AND HEALTH CARE FUNDS – to account for resources of the pension andhealth care funds established for the City’s firefighters and police officers, as provided for under statelaw and the respective collective bargaining agreements:
SAN ANTONIO FIRE AND POLICE PENSION FUND – to account for collection and payment offunds for the pension fund established for the City’s firefighters and police officers, as providedfor under state law.
SAN ANTONIO FIRE AND POLICE RETIREE HEALTH CARE FUND – to account for the collection andpayment of funds for health care benefits of the City’s firefighters and police officers who retiredafter October 1, 1989, as provided for under state law and the respective collective bargainingagreements.
AGENCY FUNDS – to account for funds which are custodial in nature and for which the City is acting as anagent. The City has established the following agency funds based upon the above definition:
BEXAR COUNTY HOTEL/MOTEL TAX COLLECTIONS FUND – to account for the collection andpayment to Bexar County for certain hotel occupancy taxes.
CRIMINAL JUSTICE PLANNING FUND – to account for the collection and payment to the State ofTexas for Law Enforcement Fees collected.
CVB HOUSING BUREAU FUND – to account for individual hotel reservation deposits maintainedby Convention & Visitors Bureau staff for confirmed City wide conventions.
DEPOSIT FUND – to account for the collection and payment of cash deposits held by the Citypending the outcome of bids on contracts.
EVIDENTIARY CASH FUND – to account for cash impounded by the San Antonio PoliceDepartment pending the outcome of legal proceedings.
LESSEES’ SPECIAL EVENTS LIABILITY INSURANCE FUND – to account for funds utilized for thepurchase of insurance coverage on special events. Financing is provided by contributions fromlessees.
MUNICIPAL COURT CASH BOND FUND – to account for the collection and payment of Court CashBonds held by the City pending the outcome of court cases.
MAYOR’S LUNCH – to account for collection and payment to caterers for lunch events with theMayor organized and for the benefit of third parties.
STATE SALES TAX FUND – to account for the collection and payment to the State of Texas forsales tax collected.
UNCLAIMED PROPERTY FUND – to account for the collection and administration of unclaimedproperty in accordance with the Texas Property Code Title 6.
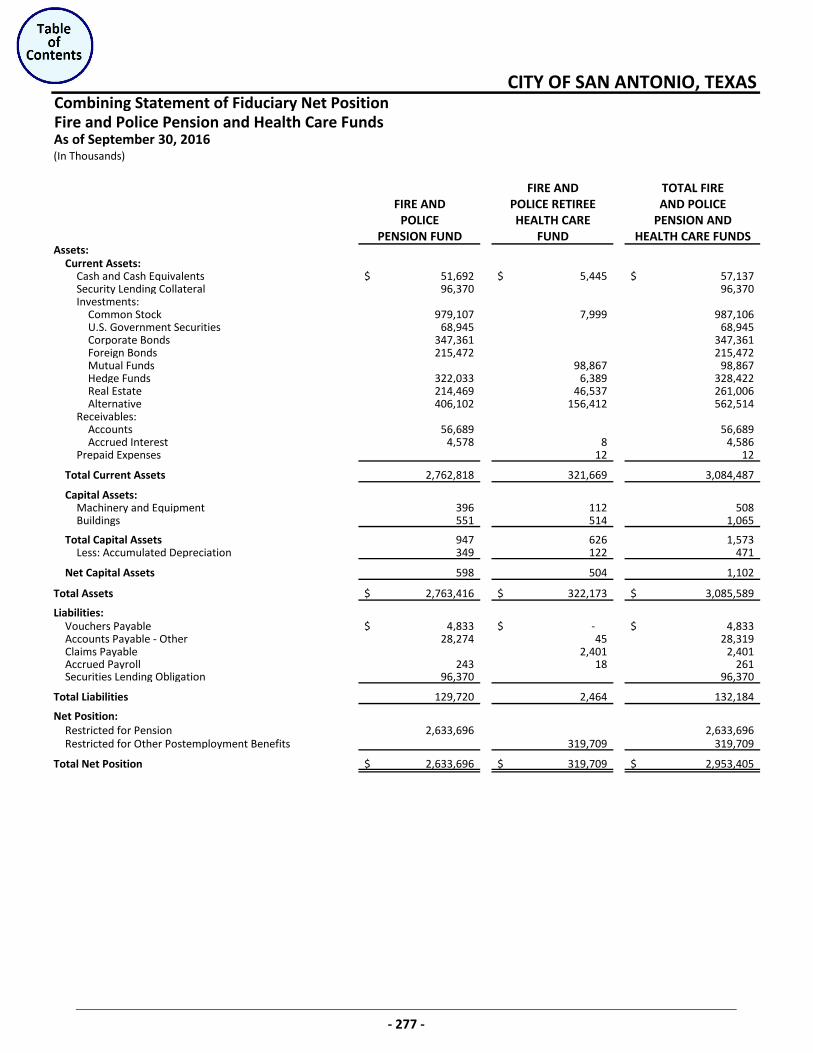
Combining Statement of Fiduciary Net PositionFire and Police Pension and Health Care Funds
(In Thousands)
FIRE AND TOTAL FIREFIRE AND POLICE RETIREE AND POLICE
POLICE HEALTH CARE PENSION ANDPENSION FUND FUND HEALTH CARE FUNDS
Current Assets:Cash and Cash Equivalents 51,692$ 5,445$ 57,137$ Security Lending Collateral 96,370 96,370 Investments:
Common Stock 979,107 7,999 987,106 U.S. Government Securities 68,945 68,945 Corporate Bonds 347,361 347,361 Foreign Bonds 215,472 215,472 Mutual Funds 98,867 98,867 Hedge Funds 322,033 6,389 328,422 Real Estate 214,469 46,537 261,006 Alternative 406,102 156,412 562,514
Receivables: Accounts 56,689 56,689 Accrued Interest 4,578 8 4,586
Prepaid Expenses 12 12
Total Current Assets 2,762,818 321,669 3,084,487
Capital Assets:Machinery and Equipment 396 112 508 Buildings 551 514 1,065
Total Capital Assets 947 626 1,573 Less: Accumulated Depreciation 349 122 471
Net Capital Assets 598 504 1,102
Total Assets 2,763,416$ 322,173$ 3,085,589$
Vouchers Payable 4,833$ -$ 4,833$ Accounts Payable - Other 28,274 45 28,319 Claims Payable 2,401 2,401 Accrued Payroll 243 18 261 Securities Lending Obligation 96,370 96,370
Total Liabilities 129,720 2,464 132,184
Restricted for Pension 2,633,696 2,633,696 Restricted for Other Postemployment Benefits 319,709 319,709
Total Net Position 2,633,696$ 319,709$ 2,953,405$
Net Position:
CITY OF SAN ANTONIO, TEXAS
As of September 30, 2016
Assets:
Liabilities:
‐ 277 ‐
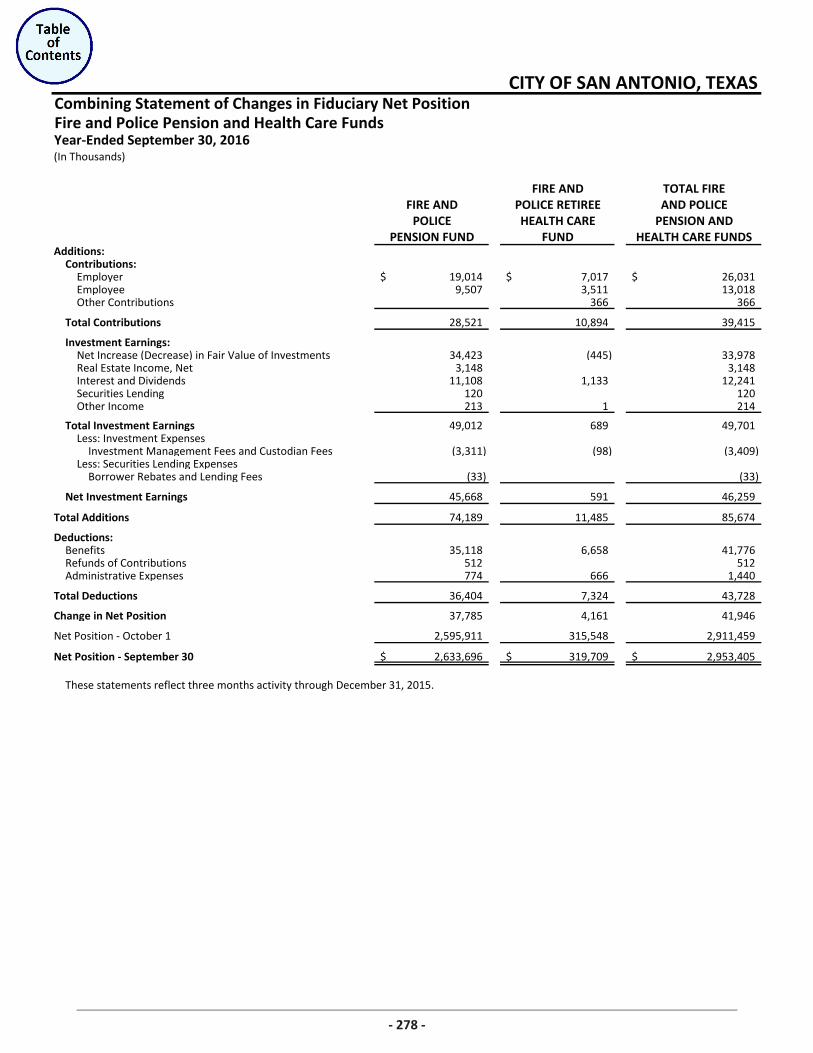
Combining Statement of Changes in Fiduciary Net PositionFire and Police Pension and Health Care Funds
(In Thousands)
FIRE AND TOTAL FIREFIRE AND POLICE RETIREE AND POLICE
POLICE HEALTH CARE PENSION ANDPENSION FUND FUND HEALTH CARE FUNDS
Additions:Contributions:
Employer 19,014$ 7,017$ 26,031$ Employee 9,507 3,511 13,018 Other Contributions 366 366
Total Contributions 28,521 10,894 39,415
Investment Earnings:Net Increase (Decrease) in Fair Value of Investments 34,423 (445) 33,978 Real Estate Income, Net 3,148 3,148 Interest and Dividends 11,108 1,133 12,241 Securities Lending 120 120 Other Income 213 1 214
Total Investment Earnings 49,012 689 49,701 Less: Investment Expenses
Investment Management Fees and Custodian Fees (3,311) (98) (3,409) Less: Securities Lending Expenses
Borrower Rebates and Lending Fees (33) (33)
Net Investment Earnings 45,668 591 46,259
Total Additions 74,189 11,485 85,674
Deductions:Benefits 35,118 6,658 41,776 Refunds of Contributions 512 512 Administrative Expenses 774 666 1,440
Total Deductions 36,404 7,324 43,728
Change in Net Position 37,785 4,161 41,946
Net Position - October 1 2,595,911 315,548 2,911,459
Net Position - September 30 2,633,696$ 319,709$ 2,953,405$
These statements reflect three months activity through December 31, 2015.
CITY OF SAN ANTONIO, TEXAS
Year-Ended September 30, 2016
278
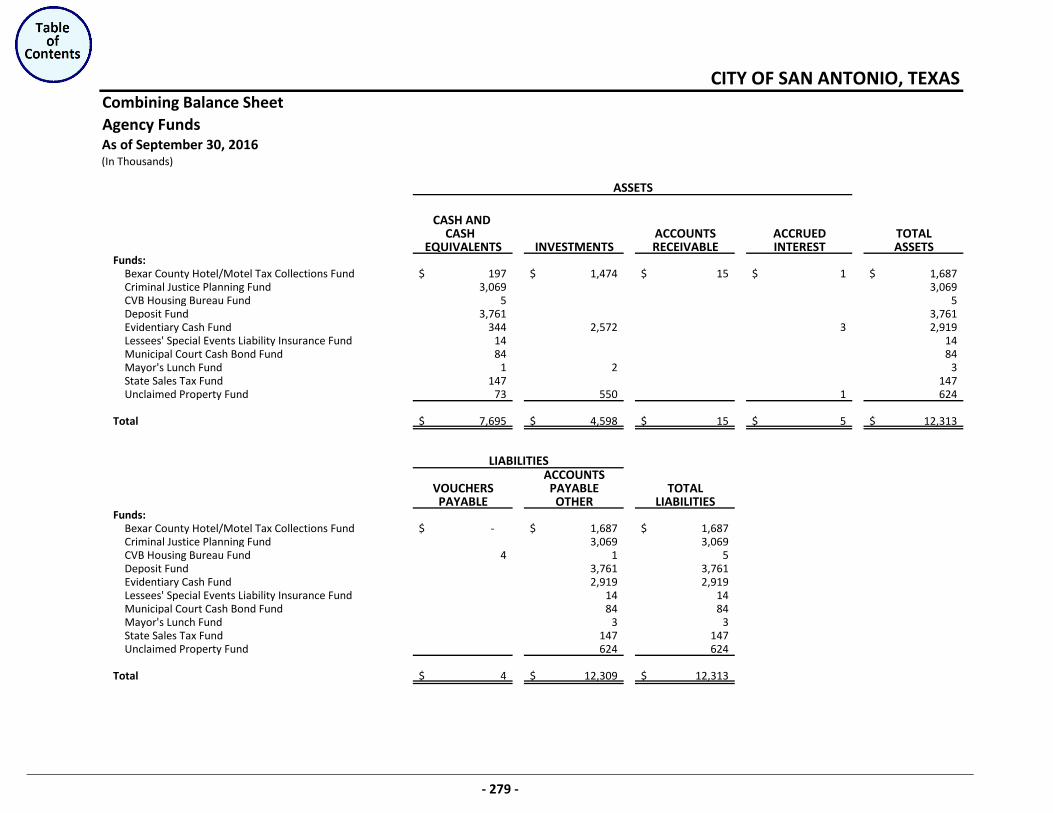
Combining Balance SheetAgency Funds
(In Thousands)
CASH AND CASH ACCOUNTS ACCRUED TOTAL
EQUIVALENTS INVESTMENTS RECEIVABLE INTEREST ASSETSFunds:
Bexar County Hotel/Motel Tax Collections Fund 197$ 1,474$ 15$ 1$ 1,687$ Criminal Justice Planning Fund 3,069 3,069 CVB Housing Bureau Fund 5 5 Deposit Fund 3,761 3,761 Evidentiary Cash Fund 344 2,572 3 2,919 Lessees' Special Events Liability Insurance Fund 14 14 Municipal Court Cash Bond Fund 84 84 Mayor's Lunch Fund 1 2 3 State Sales Tax Fund 147 147 Unclaimed Property Fund 73 550 1 624
Total 7,695$ 4,598$ 15$ 5$ 12,313$
ACCOUNTSVOUCHERS PAYABLE TOTALPAYABLE OTHER LIABILITIES
Funds:Bexar County Hotel/Motel Tax Collections Fund -$ 1,687$ 1,687$ Criminal Justice Planning Fund 3,069 3,069 CVB Housing Bureau Fund 4 1 5 Deposit Fund 3,761 3,761 Evidentiary Cash Fund 2,919 2,919 Lessees' Special Events Liability Insurance Fund 14 14 Municipal Court Cash Bond Fund 84 84 Mayor's Lunch Fund 3 3 State Sales Tax Fund 147 147 Unclaimed Property Fund 624 624
Total 4$ 12,309$ 12,313$
LIABILITIES
ASSETS
CITY OF SAN ANTONIO, TEXAS
As of September 30, 2016
‐ 279 ‐
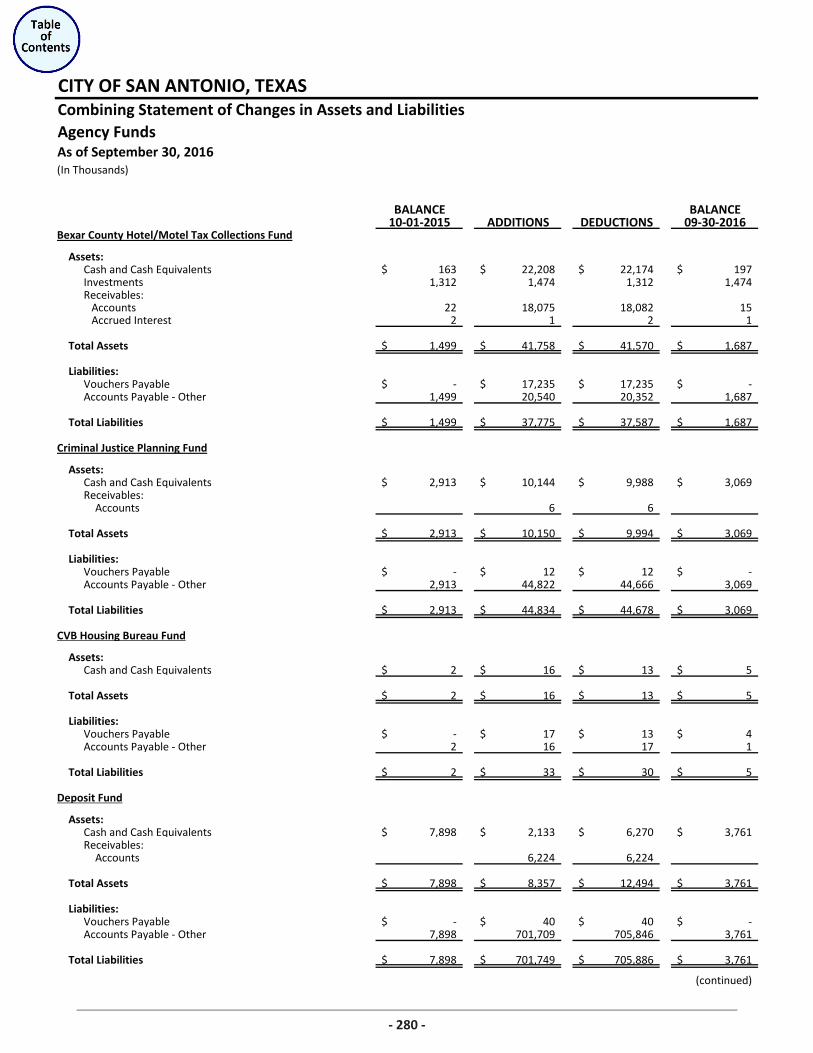
CITY OF SAN ANTONIO, TEXASCombining Statement of Changes in Assets and LiabilitiesAgency Funds
(In Thousands)
BALANCE BALANCE10-01-2015 ADDITIONS DEDUCTIONS 09-30-2016
Bexar County Hotel/Motel Tax Collections Fund
Assets:Cash and Cash Equivalents 163$ 22,208$ 22,174$ 197$ Investments 1,312 1,474 1,312 1,474 Receivables:
Accounts 22 18,075 18,082 15 Accrued Interest 2 1 2 1
Total Assets 1,499$ 41,758$ 41,570$ 1,687$
Liabilities:Vouchers Payable -$ 17,235$ 17,235$ -$ Accounts Payable - Other 1,499 20,540 20,352 1,687
Total Liabilities 1,499$ 37,775$ 37,587$ 1,687$
Criminal Justice Planning Fund
Assets:Cash and Cash Equivalents 2,913$ 10,144$ 9,988$ 3,069$ Receivables:
Accounts 6 6
Total Assets 2,913$ 10,150$ 9,994$ 3,069$
Liabilities:Vouchers Payable -$ 12$ 12$ -$ Accounts Payable - Other 2,913 44,822 44,666 3,069
Total Liabilities 2,913$ 44,834$ 44,678$ 3,069$
CVB Housing Bureau Fund
Assets:Cash and Cash Equivalents 2$ 16$ 13$ 5$
Total Assets 2$ 16$ 13$ 5$
Liabilities:Vouchers Payable -$ 17$ 13$ 4$ Accounts Payable - Other 2 16 17 1
Total Liabilities 2$ 33$ 30$ 5$
Deposit Fund
Assets:Cash and Cash Equivalents 7,898$ 2,133$ 6,270$ 3,761$ Receivables:
Accounts 6,224 6,224
Total Assets 7,898$ 8,357$ 12,494$ 3,761$
Liabilities:Vouchers Payable -$ 40$ 40$ -$ Accounts Payable - Other 7,898 701,709 705,846 3,761
Total Liabilities 7,898$ 701,749$ 705,886$ 3,761$
(continued)
As of September 30, 2016
280
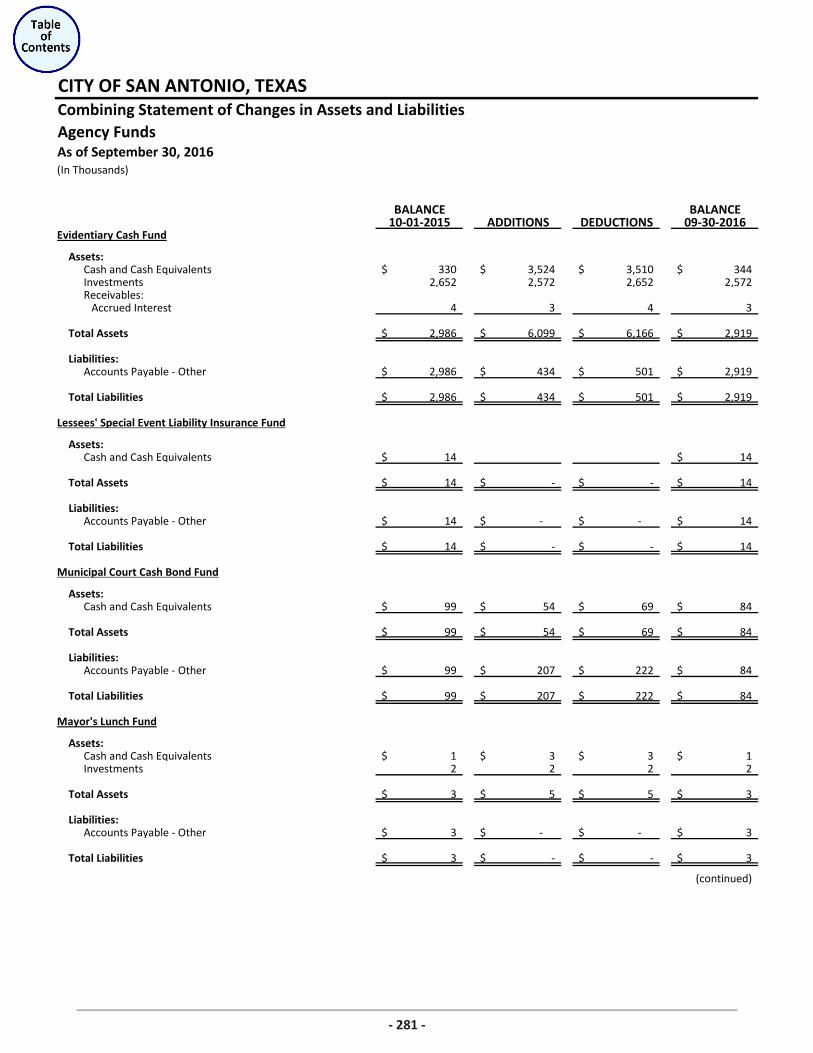
CITY OF SAN ANTONIO, TEXASCombining Statement of Changes in Assets and LiabilitiesAgency Funds
(In Thousands)
BALANCE BALANCE10-01-2015 ADDITIONS DEDUCTIONS 09-30-2016
As of September 30, 2016
Evidentiary Cash Fund
Assets:Cash and Cash Equivalents 330$ 3,524$ 3,510$ 344$ Investments 2,652 2,572 2,652 2,572 Receivables:
Accrued Interest 4 3 4 3
Total Assets 2,986$ 6,099$ 6,166$ 2,919$
Liabilities:Accounts Payable - Other 2,986$ 434$ 501$ 2,919$
Total Liabilities 2,986$ 434$ 501$ 2,919$
Lessees' Special Event Liability Insurance Fund
Assets:Cash and Cash Equivalents 14$ 14$
Total Assets 14$ -$ -$ 14$
Liabilities:Accounts Payable - Other 14$ -$ -$ 14$
Total Liabilities 14$ -$ -$ 14$
Municipal Court Cash Bond Fund
Assets:Cash and Cash Equivalents 99$ 54$ 69$ 84$
Total Assets 99$ 54$ 69$ 84$
Liabilities:Accounts Payable - Other 99$ 207$ 222$ 84$
Total Liabilities 99$ 207$ 222$ 84$
Mayor's Lunch Fund
Assets:Cash and Cash Equivalents 1$ 3$ 3$ 1$ Investments 2 2 2 2
Total Assets 3$ 5$ 5$ 3$
Liabilities:Accounts Payable - Other 3$ -$ -$ 3$
Total Liabilities 3$ -$ -$ 3$
(continued)
281
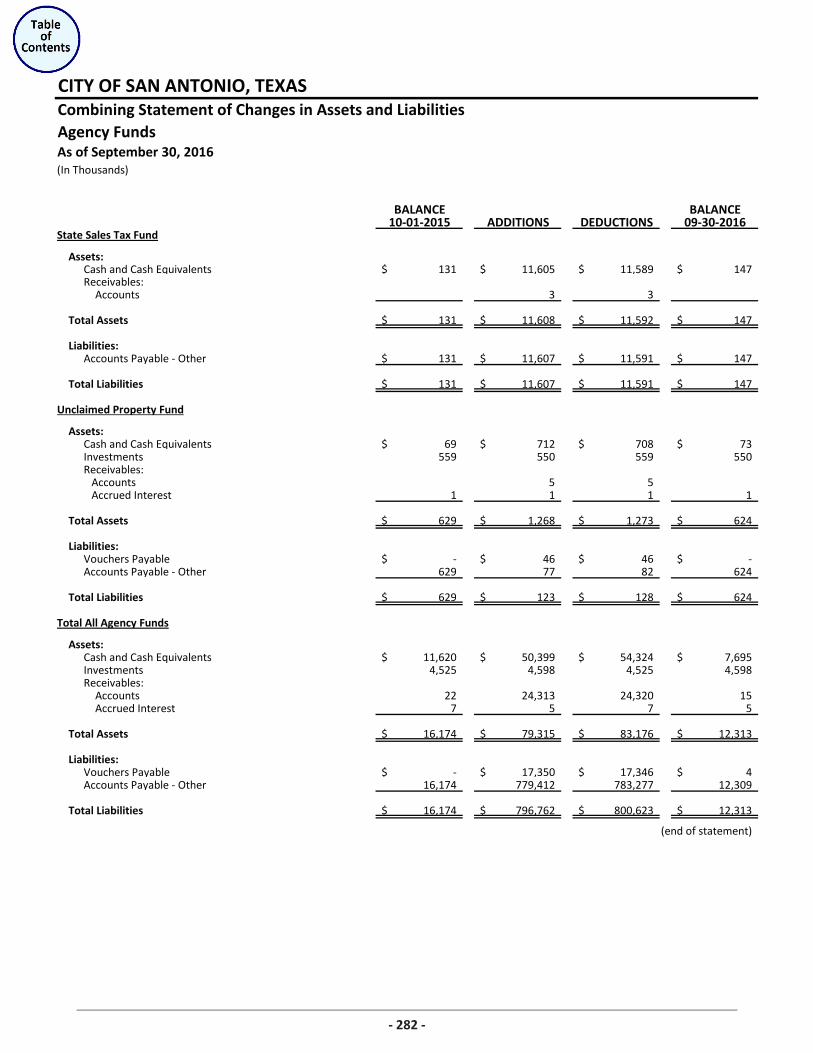
CITY OF SAN ANTONIO, TEXASCombining Statement of Changes in Assets and LiabilitiesAgency Funds
(In Thousands)
BALANCE BALANCE10-01-2015 ADDITIONS DEDUCTIONS 09-30-2016
As of September 30, 2016
State Sales Tax Fund
Assets:Cash and Cash Equivalents 131$ 11,605$ 11,589$ 147$ Receivables:
Accounts 3 3
Total Assets 131$ 11,608$ 11,592$ 147$
Liabilities:Accounts Payable - Other 131$ 11,607$ 11,591$ 147$
Total Liabilities 131$ 11,607$ 11,591$ 147$
Unclaimed Property Fund
Assets:Cash and Cash Equivalents 69$ 712$ 708$ 73$ Investments 559 550 559 550 Receivables:
Accounts 5 5 Accrued Interest 1 1 1 1
Total Assets 629$ 1,268$ 1,273$ 624$
Liabilities:Vouchers Payable -$ 46$ 46$ -$ Accounts Payable - Other 629 77 82 624
Total Liabilities 629$ 123$ 128$ 624$
Total All Agency Funds
Assets:Cash and Cash Equivalents 11,620$ 50,399$ 54,324$ 7,695$ Investments 4,525 4,598 4,525 4,598 Receivables:
Accounts 22 24,313 24,320 15 Accrued Interest 7 5 7 5
Total Assets 16,174$ 79,315$ 83,176$ 12,313$
Liabilities:Vouchers Payable -$ 17,350$ 17,346$ 4$ Accounts Payable - Other 16,174 779,412 783,277 12,309
Total Liabilities 16,174$ 796,762$ 800,623$ 12,313$
(end of statement)
282
Nonmajor Discretely PresentedComponent Units
BROOKS DEVELOPMENT AUTHORITY (BDA) – was designated to improve mission effectiveness,reduce the cost of providing quality installation support, and promote economic development onBrooks Air Force Base and in the surrounding community. Dedicated funds will provide basicmunicipal services at the base while continuing to develop it as a technology and business park.
PORT AUTHORITY OF SAN ANTONIO (THE PORT) – was established for the purpose of monitoringthe closing of Kelly Air Force Base (Kelly) and formulating and adopting a comprehensive plan for theconversion and redevelopment of Kelly. The Port is authorized to issue bonds to finance relatedprojects. These bonds are not obligations of the City.
SA ENERGY ACQUISITION PUBLIC FACILITY CORPORATION (SAEAPFC) – was established for thepurpose of, and to act on behalf of the City in, the financing and acquisition of electric energy andpower, oil, gas, coal and other liquid, gaseous or solid hydrocarbon fuels for the electric and gassystems of the City of San Antonio.
SAWS DISTRICT SPECIAL PROJECT (DSP) – was established as a component unit of the City during thetransition of BexarMet’s operations into SAWS.
SAN ANTONIO HOUSING TRUST FINANCE CORPORATION (HTFC) – was established in accordancewith state laws for the purpose of acting on behalf of the City, to carry out the purposes of the TexasHousing Finance Corporations Act.
SAN ANTONIO HOUSING TRUST FOUNDATION, INC. (HTF) – is a nonprofit corporation established in1990 for the purpose of supporting charitable, educational, and scientific undertakings, specificallyfor providing housing for low to middle income families. In addition, SAHTF provides administrativeand other support for the operations of the San Antonio Housing Trust Fund, a Special Revenue Fundof the City.
SAN ANTONIO HOUSING TRUST PUBLIC FACILITY CORPORATION (HTPFC) – was established to assistthe City in financing, refinancing, or providing public facilities. The Corporation was to provide a toolto develop affordable housing.
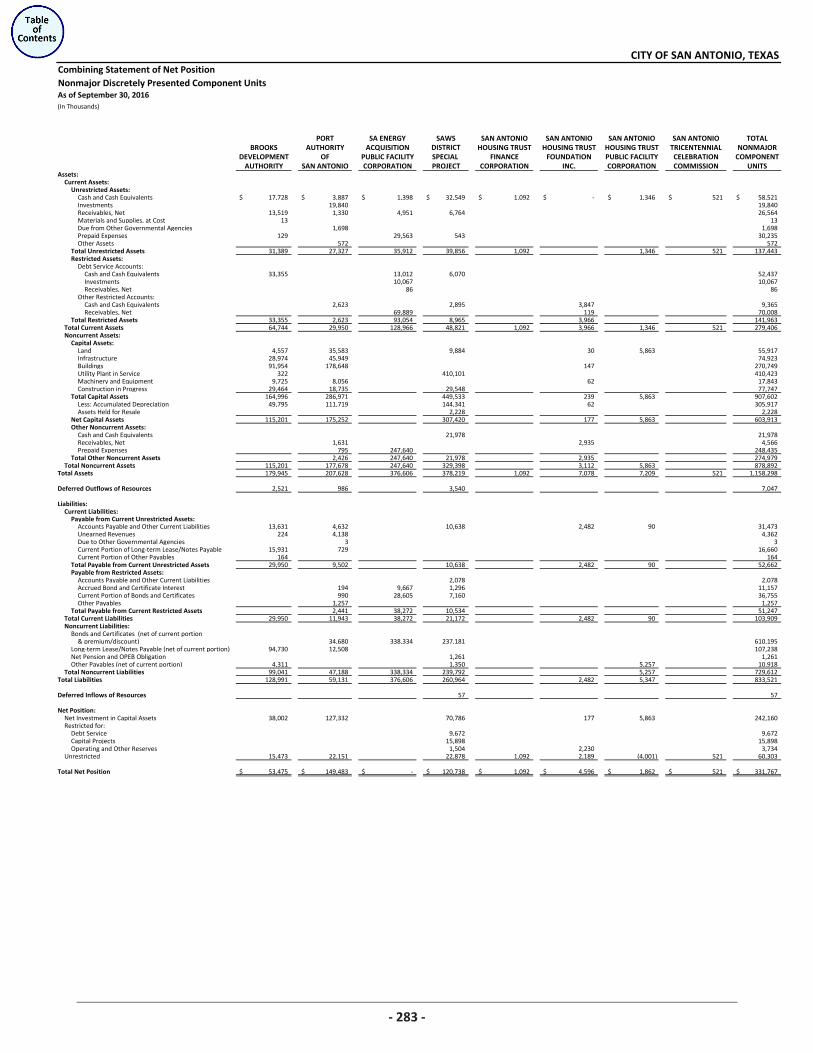
Combining Statement of Net PositionNonmajor Discretely Presented Component Units
(In Thousands)
PORT SA ENERGY SAWS SAN ANTONIO SAN ANTONIO SAN ANTONIO SAN ANTONIO TOTALBROOKS AUTHORITY ACQUISITION DISTRICT HOUSING TRUST HOUSING TRUST HOUSING TRUST TRICENTENNIAL NONMAJOR
DEVELOPMENT OF PUBLIC FACILITY SPECIAL FINANCE FOUNDATION PUBLIC FACILITY CELEBRATION COMPONENTAUTHORITY SAN ANTONIO CORPORATION PROJECT CORPORATION INC. CORPORATION COMMISSION UNITS
Assets:Current Assets:
Unrestricted Assets:Cash and Cash Equivalents 17,728$ 3,887$ 1,398$ 32,549$ 1,092$ -$ 1,346$ 521$ 58,521$ Investments 19,840 19,840 Receivables, Net 13,519 1,330 4,951 6,764 26,564 Materials and Supplies, at Cost 13 13 Due from Other Governmental Agencies 1,698 1,698 Prepaid Expenses 129 29,563 543 30,235 Other Assets 572 572
Total Unrestricted Assets 31,389 27,327 35,912 39,856 1,092 1,346 521 137,443 Restricted Assets:
Debt Service Accounts: Cash and Cash Equivalents 33,355 13,012 6,070 52,437 Investments 10,067 10,067 Receivables, Net 86 86
Other Restricted Accounts: Cash and Cash Equivalents 2,623 2,895 3,847 9,365 Receivables, Net 69,889 119 70,008
Total Restricted Assets 33,355 2,623 93,054 8,965 3,966 141,963 Total Current Assets 64,744 29,950 128,966 48,821 1,092 3,966 1,346 521 279,406 Noncurrent Assets:
Capital Assets:Land 4,557 35,583 9,884 30 5,863 55,917 Infrastructure 28,974 45,949 74,923 Buildings 91,954 178,648 147 270,749 Utility Plant in Service 322 410,101 410,423 Machinery and Equipment 9,725 8,056 62 17,843 Construction in Progress 29,464 18,735 29,548 77,747
Total Capital Assets 164,996 286,971 449,533 239 5,863 907,602 Less: Accumulated Depreciation 49,795 111,719 144,341 62 305,917 Assets Held for Resale 2,228 2,228
Net Capital Assets 115,201 175,252 307,420 177 5,863 603,913 Other Noncurrent Assets:
Cash and Cash Equivalents 21,978 21,978 Receivables, Net 1,631 2,935 4,566 Prepaid Expenses 795 247,640 248,435
Total Other Noncurrent Assets 2,426 247,640 21,978 2,935 274,979 Total Noncurrent Assets 115,201 177,678 247,640 329,398 3,112 5,863 878,892
Total Assets 179,945 207,628 376,606 378,219 1,092 7,078 7,209 521 1,158,298
Deferred Outflows of Resources 2,521 986 3,540 7,047
Liabilities:Current Liabilities:
Payable from Current Unrestricted Assets:Accounts Payable and Other Current Liabilities 13,631 4,632 10,638 2,482 90 31,473 Unearned Revenues 224 4,138 4,362 Due to Other Governmental Agencies 3 3 Current Portion of Long-term Lease/Notes Payable 15,931 729 16,660 Current Portion of Other Payables 164 164
Total Payable from Current Unrestricted Assets 29,950 9,502 10,638 2,482 90 52,662 Payable from Restricted Assets:
Accounts Payable and Other Current Liabilities 2,078 2,078 Accrued Bond and Certificate Interest 194 9,667 1,296 11,157 Current Portion of Bonds and Certificates 990 28,605 7,160 36,755 Other Payables 1,257 1,257
Total Payable from Current Restricted Assets 2,441 38,272 10,534 51,247 Total Current Liabilities 29,950 11,943 38,272 21,172 2,482 90 103,909 Noncurrent Liabilities:
Bonds and Certificates (net of current portion & premium/discount) 34,680 338,334 237,181 610,195
Long-term Lease/Notes Payable (net of current portion) 94,730 12,508 107,238 Net Pension and OPEB Obligation 1,261 1,261 Other Payables (net of current portion) 4,311 1,350 5,257 10,918
Total Noncurrent Liabilities 99,041 47,188 338,334 239,792 5,257 729,612 Total Liabilities 128,991 59,131 376,606 260,964 2,482 5,347 833,521
Deferred Inflows of Resources 57 57
Net Position:Net Investment in Capital Assets 38,002 127,332 70,786 177 5,863 242,160 Restricted for:
Debt Service 9,672 9,672 Capital Projects 15,898 15,898 Operating and Other Reserves 1,504 2,230 3,734
Unrestricted 15,473 22,151 22,878 1,092 2,189 (4,001) 521 60,303
Total Net Position 53,475$ 149,483$ -$ 120,738$ 1,092$ 4,596$ 1,862$ 521$ 331,767$
As of September 30, 2016
CITY OF SAN ANTONIO, TEXAS
283
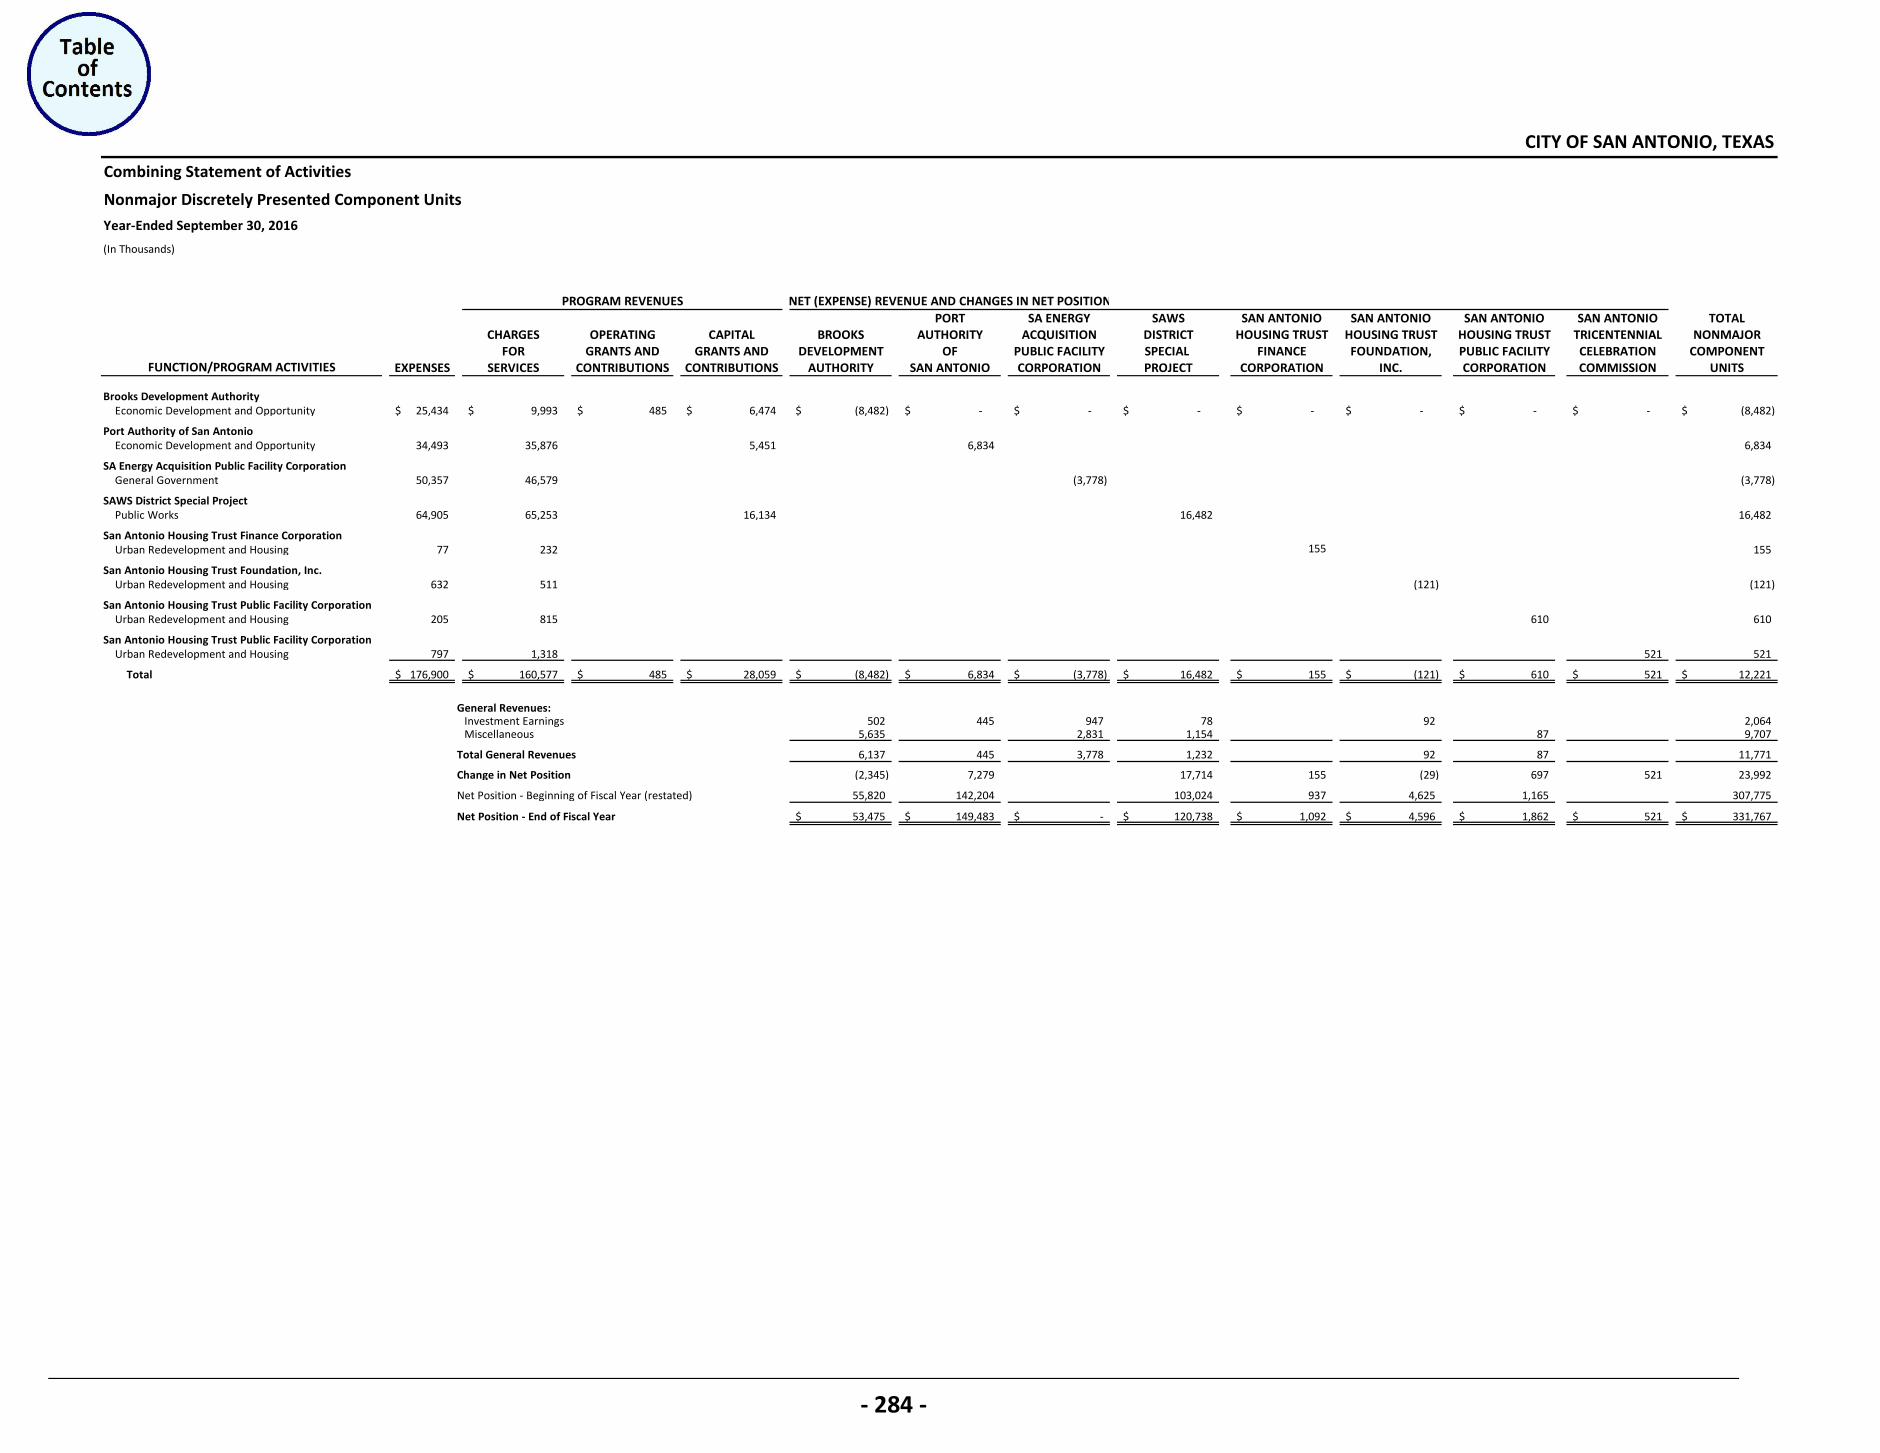
Combining Statement of Activities
Nonmajor Discretely Presented Component Units
Year-Ended September 30, 2016
(In Thousands)
PORT SA ENERGY SAWS SAN ANTONIO SAN ANTONIO SAN ANTONIO SAN ANTONIO TOTALCHARGES OPERATING CAPITAL BROOKS AUTHORITY ACQUISITION DISTRICT HOUSING TRUST HOUSING TRUST HOUSING TRUST TRICENTENNIAL NONMAJOR
FOR GRANTS AND GRANTS AND DEVELOPMENT OF PUBLIC FACILITY SPECIAL FINANCE FOUNDATION, PUBLIC FACILITY CELEBRATION COMPONENTEXPENSES SERVICES CONTRIBUTIONS CONTRIBUTIONS AUTHORITY SAN ANTONIO CORPORATION PROJECT CORPORATION INC. CORPORATION COMMISSION UNITS
Brooks Development Authority Economic Development and Opportunity 25,434$ 9,993$ 485$ 6,474$ (8,482)$ -$ -$ -$ -$ -$ -$ -$ (8,482)$
Port Authority of San AntonioEconomic Development and Opportunity 34,493 35,876 5,451 6,834 6,834
SA Energy Acquisition Public Facility CorporationGeneral Government 50,357 46,579 (3,778) (3,778)
SAWS District Special ProjectPublic Works 64,905 65,253 16,134 16,482 16,482
San Antonio Housing Trust Finance CorporationUrban Redevelopment and Housing 77 232 155 155
San Antonio Housing Trust Foundation, Inc.Urban Redevelopment and Housing 632 511 (121) (121)
San Antonio Housing Trust Public Facility CorporationUrban Redevelopment and Housing 205 815 610 610
San Antonio Housing Trust Public Facility CorporationUrban Redevelopment and Housing 797 1,318 521 521
Total 176,900$ 160,577$ 485$ 28,059$ (8,482)$ 6,834$ (3,778)$ 16,482$ 155$ (121)$ 610$ 521$ 12,221$
General Revenues:Investment Earnings 502 445 947 78 92 2,064 Miscellaneous 5,635 2,831 1,154 87 9,707
Total General Revenues 6,137 445 3,778 1,232 92 87 11,771
Change in Net Position (2,345) 7,279 17,714 155 (29) 697 521 23,992
Net Position - Beginning of Fiscal Year (restated) 55,820 142,204 103,024 937 4,625 1,165 307,775
Net Position - End of Fiscal Year 53,475$ 149,483$ -$ 120,738$ 1,092$ 4,596$ 1,862$ 521$ 331,767$
CITY OF SAN ANTONIO, TEXAS
FUNCTION/PROGRAM ACTIVITIES
PROGRAM REVENUES NET (EXPENSE) REVENUE AND CHANGES IN NET POSITION
- 284 -

Capital Assets Used in the Operation of
Governmental Funds
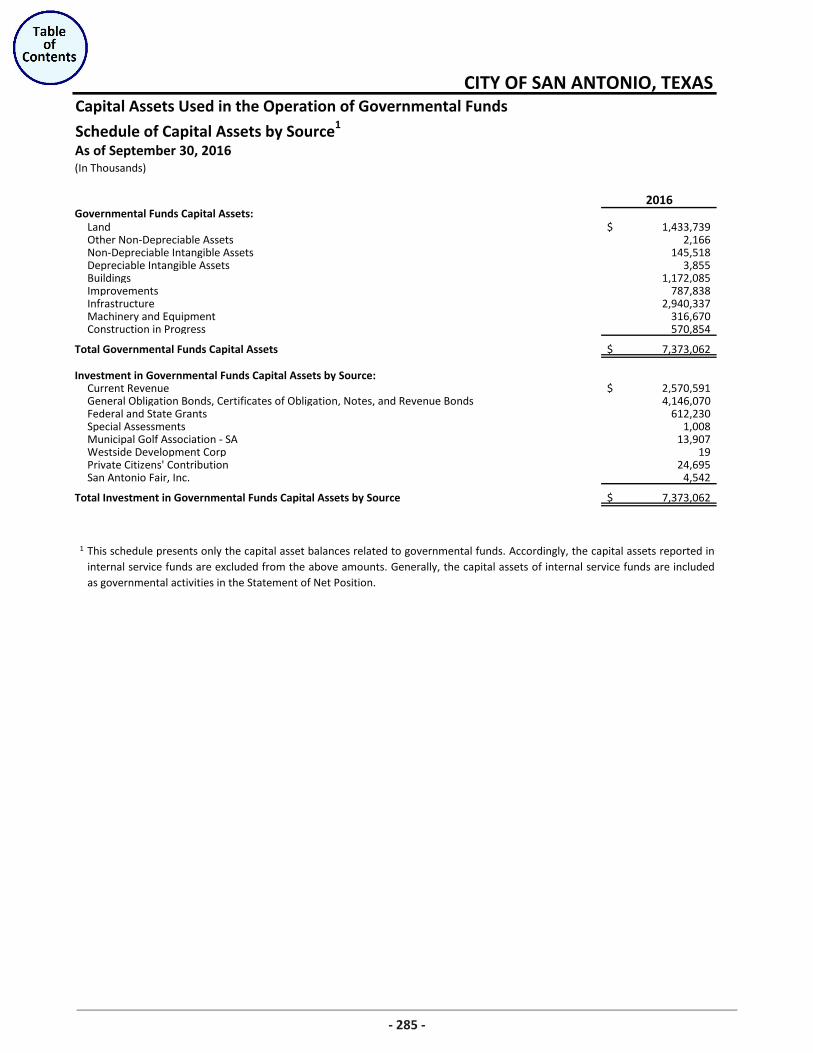
Capital Assets Used in the Operation of Governmental Funds
Schedule of Capital Assets by Source1
(In Thousands)
2016
Land 1,433,739$ Other Non-Depreciable Assets 2,166 Non-Depreciable Intangible Assets 145,518 Depreciable Intangible Assets 3,855 Buildings 1,172,085 Improvements 787,838 Infrastructure 2,940,337 Machinery and Equipment 316,670 Construction in Progress 570,854
Total Governmental Funds Capital Assets 7,373,062$
Investment in Governmental Funds Capital Assets by Source:Current Revenue 2,570,591$ General Obligation Bonds, Certificates of Obligation, Notes, and Revenue Bonds 4,146,070 Federal and State Grants 612,230 Special Assessments 1,008 Municipal Golf Association - SA 13,907 Westside Development Corp 19 Private Citizens' Contribution 24,695 San Antonio Fair, Inc. 4,542
Total Investment in Governmental Funds Capital Assets by Source 7,373,062$
1
CITY OF SAN ANTONIO, TEXAS
As of September 30, 2016
Governmental Funds Capital Assets:
This schedule presents only the capital asset balances related to governmental funds. Accordingly, the capital assets reported ininternal service funds are excluded from the above amounts. Generally, the capital assets of internal service funds are includedas governmental activities in the Statement of Net Position.
285
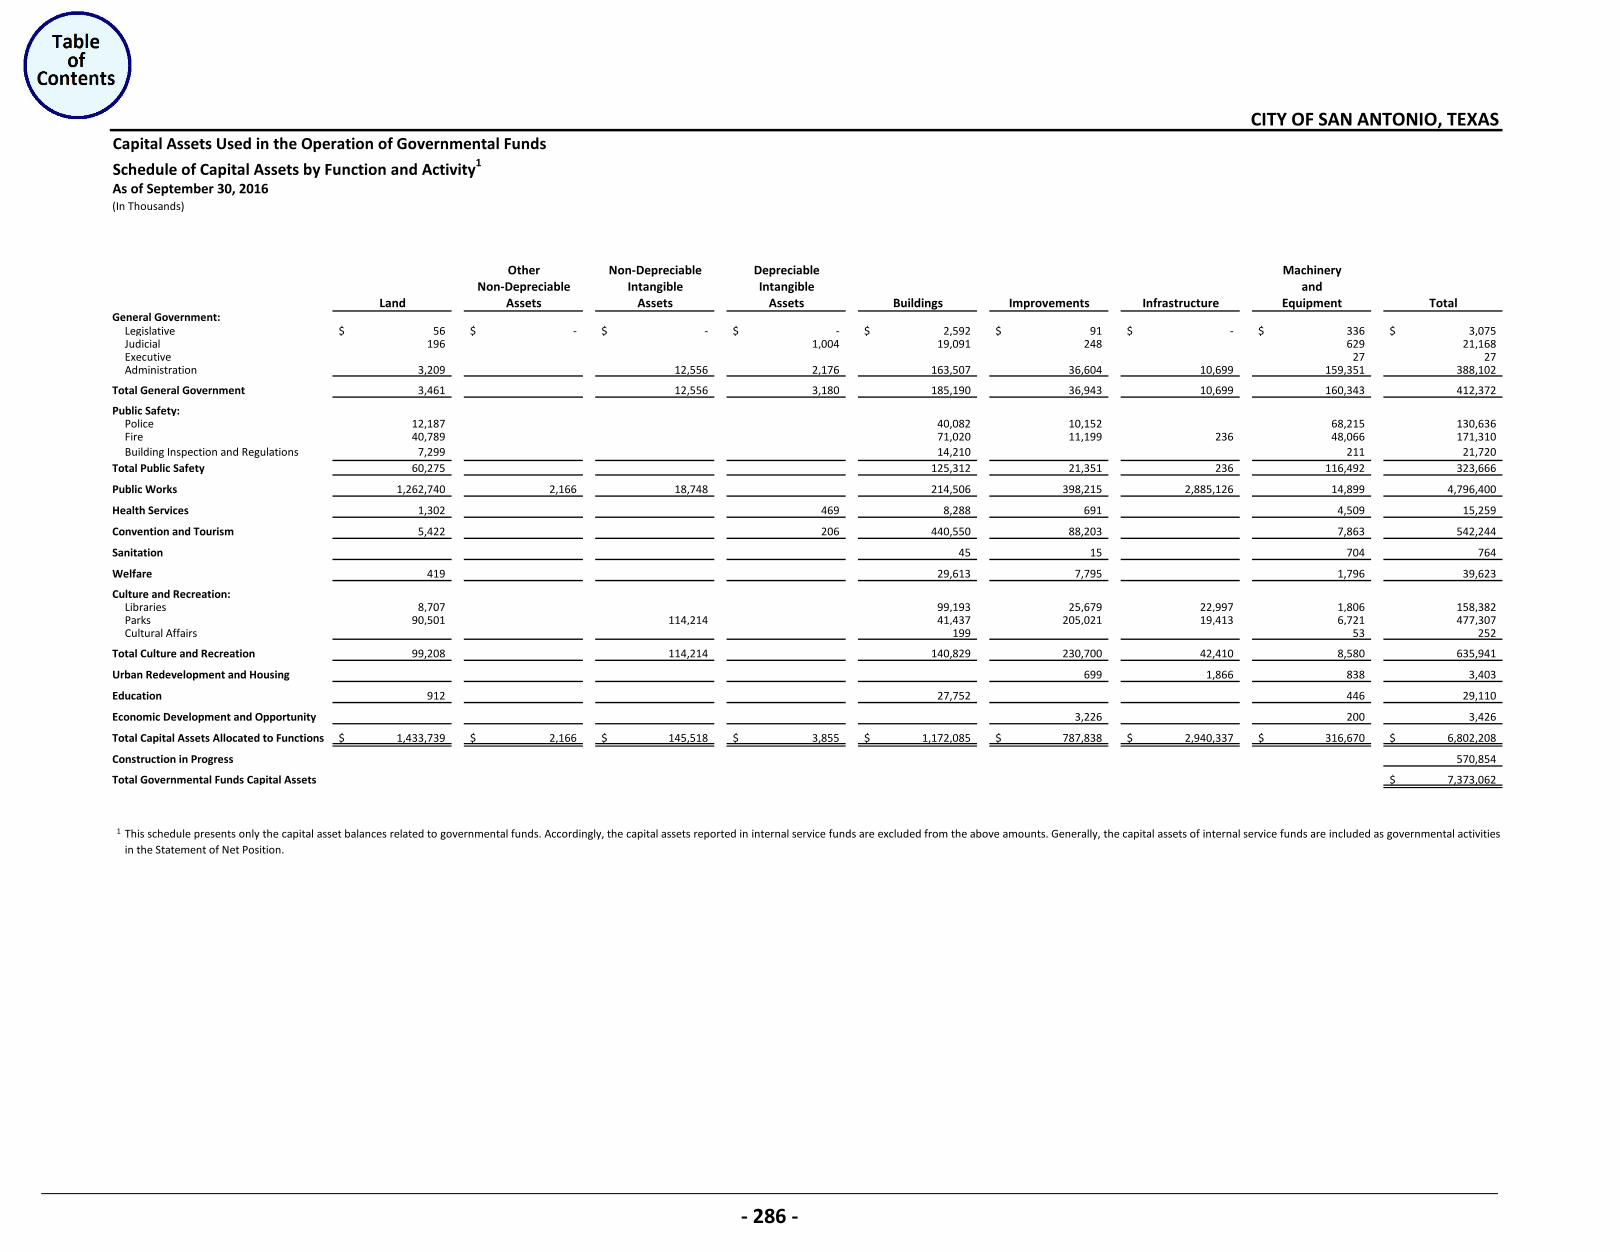
Capital Assets Used in the Operation of Governmental Funds
Schedule of Capital Assets by Function and Activity1
(In Thousands)
Other Non-Depreciable Depreciable MachineryNon-Depreciable Intangible Intangible and
Land Assets Assets Assets Buildings Improvements Infrastructure Equipment Total
Legislative 56$ -$ -$ -$ 2,592$ 91$ -$ 336$ 3,075$ Judicial 196 1,004 19,091 248 629 21,168Executive 27 27Administration 3,209 12,556 2,176 163,507 36,604 10,699 159,351 388,102
Total General Government 3,461 12,556 3,180 185,190 36,943 10,699 160,343 412,372
Public Safety:Police 12,187 40,082 10,152 68,215 130,636Fire 40,789 71,020 11,199 236 48,066 171,310Building Inspection and Regulations 7,299 14,210 211 21,720
Total Public Safety 60,275 125,312 21,351 236 116,492 323,666
Public Works 1,262,740 2,166 18,748 214,506 398,215 2,885,126 14,899 4,796,400
Health Services 1,302 469 8,288 691 4,509 15,259
Convention and Tourism 5,422 206 440,550 88,203 7,863 542,244
Sanitation 45 15 704 764
Welfare 419 29,613 7,795 1,796 39,623
Culture and Recreation:Libraries 8,707 99,193 25,679 22,997 1,806 158,382Parks 90,501 114,214 41,437 205,021 19,413 6,721 477,307Cultural Affairs 199 53 252
Total Culture and Recreation 99,208 114,214 140,829 230,700 42,410 8,580 635,941
Urban Redevelopment and Housing 699 1,866 838 3,403
Education 912 27,752 446 29,110
Economic Development and Opportunity 3,226 200 3,426
Total Capital Assets Allocated to Functions 1,433,739$ 2,166$ 145,518$ 3,855$ 1,172,085$ 787,838$ 2,940,337$ 316,670$ 6,802,208$
Construction in Progress 570,854
Total Governmental Funds Capital Assets 7,373,062$
1
CITY OF SAN ANTONIO, TEXAS
As of September 30, 2016
General Government:
This schedule presents only the capital asset balances related to governmental funds. Accordingly, the capital assets reported in internal service funds are excluded from the above amounts. Generally, the capital assets of internal service funds are included as governmental activitiesin the Statement of Net Position.
- 286 -
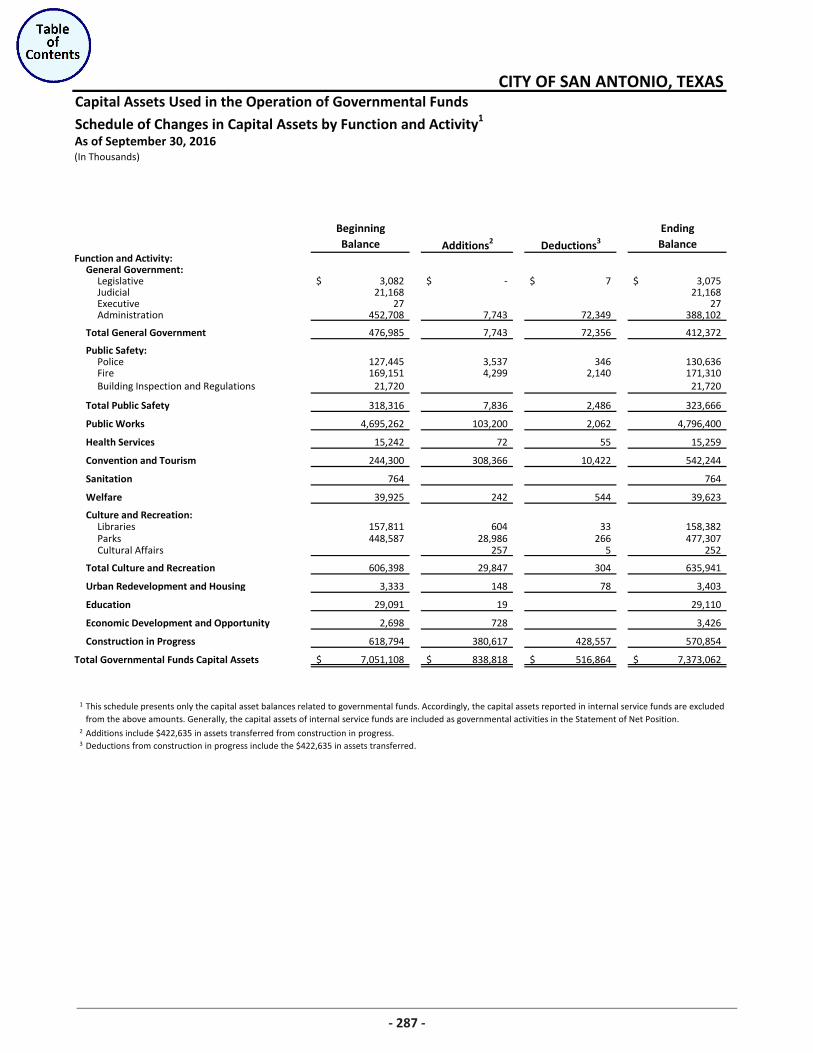
Capital Assets Used in the Operation of Governmental Funds
Schedule of Changes in Capital Assets by Function and Activity1
(In Thousands)
Beginning EndingBalance Additions2 Deductions3 Balance
Function and Activity:General Government:
Legislative 3,082$ -$ 7$ 3,075$ Judicial 21,168 21,168Executive 27 27Administration 452,708 7,743 72,349 388,102
Total General Government 476,985 7,743 72,356 412,372
Public Safety:Police 127,445 3,537 346 130,636Fire 169,151 4,299 2,140 171,310Building Inspection and Regulations 21,720 21,720
Total Public Safety 318,316 7,836 2,486 323,666
Public Works 4,695,262 103,200 2,062 4,796,400
Health Services 15,242 72 55 15,259
Convention and Tourism 244,300 308,366 10,422 542,244
Sanitation 764 764
Welfare 39,925 242 544 39,623
Culture and Recreation:Libraries 157,811 604 33 158,382Parks 448,587 28,986 266 477,307Cultural Affairs 257 5 252
Total Culture and Recreation 606,398 29,847 304 635,941
Urban Redevelopment and Housing 3,333 148 78 3,403
Education 29,091 19 29,110
Economic Development and Opportunity 2,698 728 3,426
Construction in Progress 618,794 380,617 428,557 570,854
Total Governmental Funds Capital Assets 7,051,108$ 838,818$ 516,864$ 7,373,062$
1
2
3
CITY OF SAN ANTONIO, TEXAS
As of September 30, 2016
This schedule presents only the capital asset balances related to governmental funds. Accordingly, the capital assets reported in internal service funds are excluded from the above amounts. Generally, the capital assets of internal service funds are included as governmental activities in the Statement of Net Position.
Additions include $422,635 in assets transferred from construction in progress. Deductions from construction in progress include the $422,635 in assets transferred.
287

STATISTICAL SECTION
STATISTICALSECTION
Statistical Section (Unaudited)Sources: Unless otherwise noted, the information in these schedules is derived from the comprehensiveannual financial reports for the relevant year. The City implemented GASB Statement No. 54 in fiscal year2011; schedules presenting fund balance information as required by GASB Statement No. 54 began in thatyear.
FINANCIAL TRENDS – These schedules contain trend information to help the reader understand how theCity’s financial performance and well being have changed over time.
REVENUE CAPACITY – These schedules contain information to help the reader assess the factorsaffecting the City’s ability to generate its property and sales and use taxes.
DEBT CAPACITY – These schedules present information to help the reader assess the affordability of theCity’s current levels of outstanding debt and the City’s ability to issue additional debt in the future.
DEMOGRAPHIC AND ECONOMIC INFORMATION – These schedules offer demographic and economicindicators to help the reader understand the environment within which the City’s financial activities takeplace and to help make comparisons over time and with other governments.
OPERATING INFORMATION – These schedules contain information about the City’s operations andresources to help the reader understand how the City’s financial information relates to the services theCity provides and the activities it performs.
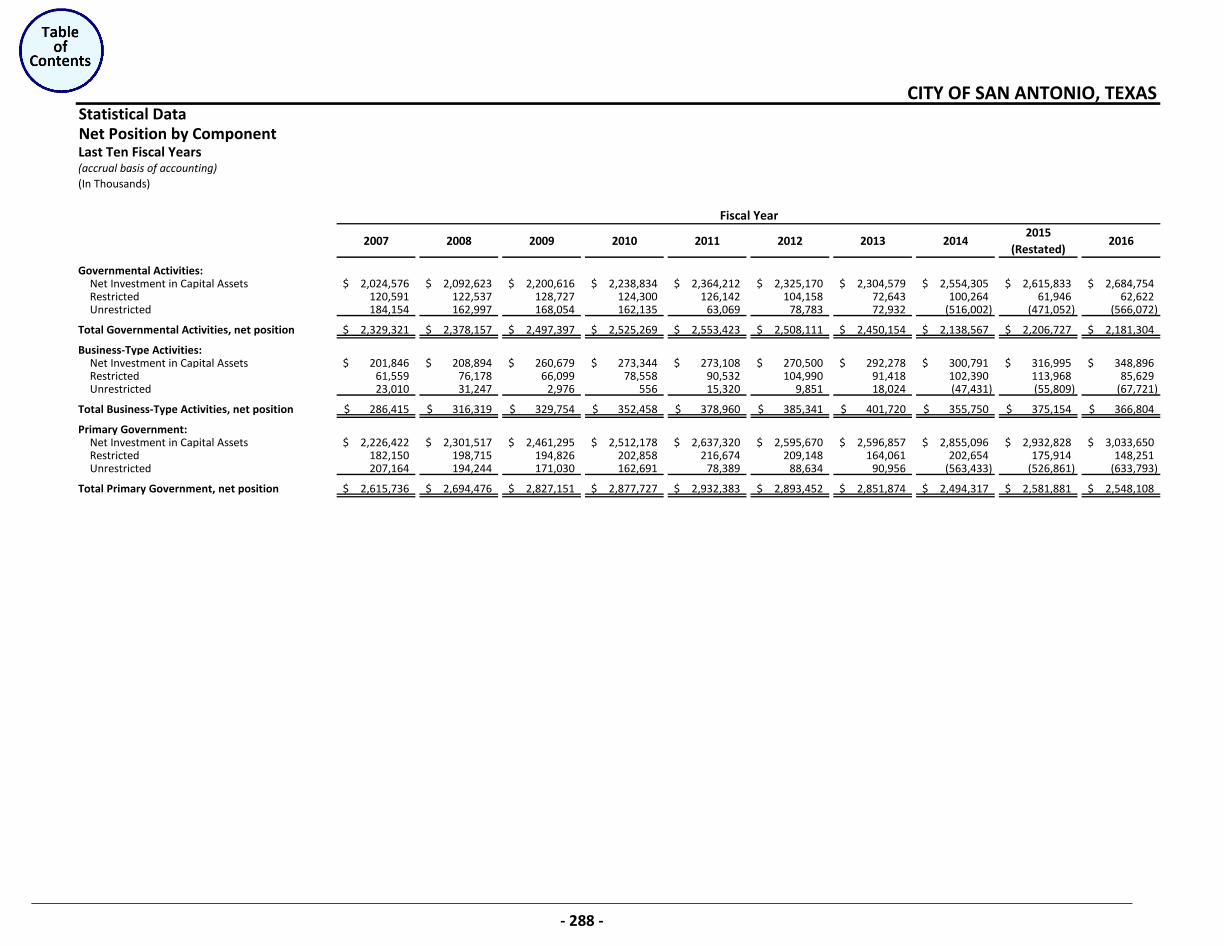
Statistical DataNet Position by ComponentLast Ten Fiscal Years(accrual basis of accounting)(In Thousands)
2007 2008 2009 2010 2011 2012 2013 20142015
(Restated)2016
Governmental Activities:Net Investment in Capital Assets 2,024,576$ 2,092,623$ 2,200,616$ 2,238,834$ 2,364,212$ 2,325,170$ 2,304,579$ 2,554,305$ 2,615,833$ 2,684,754$ Restricted 120,591 122,537 128,727 124,300 126,142 104,158 72,643 100,264 61,946 62,622 Unrestricted 184,154 162,997 168,054 162,135 63,069 78,783 72,932 (516,002) (471,052) (566,072)
Total Governmental Activities, net position 2,329,321$ 2,378,157$ 2,497,397$ 2,525,269$ 2,553,423$ 2,508,111$ 2,450,154$ 2,138,567$ 2,206,727$ 2,181,304$
Business-Type Activities:Net Investment in Capital Assets 201,846$ 208,894$ 260,679$ 273,344$ 273,108$ 270,500$ 292,278$ 300,791$ 316,995$ 348,896$ Restricted 61,559 76,178 66,099 78,558 90,532 104,990 91,418 102,390 113,968 85,629 Unrestricted 23,010 31,247 2,976 556 15,320 9,851 18,024 (47,431) (55,809) (67,721)
Total Business-Type Activities, net position 286,415$ 316,319$ 329,754$ 352,458$ 378,960$ 385,341$ 401,720$ 355,750$ 375,154$ 366,804$
Primary Government:Net Investment in Capital Assets 2,226,422$ 2,301,517$ 2,461,295$ 2,512,178$ 2,637,320$ 2,595,670$ 2,596,857$ 2,855,096$ 2,932,828$ 3,033,650$ Restricted 182,150 198,715 194,826 202,858 216,674 209,148 164,061 202,654 175,914 148,251 Unrestricted 207,164 194,244 171,030 162,691 78,389 88,634 90,956 (563,433) (526,861) (633,793)
Total Primary Government, net position 2,615,736$ 2,694,476$ 2,827,151$ 2,877,727$ 2,932,383$ 2,893,452$ 2,851,874$ 2,494,317$ 2,581,881$ 2,548,108$
Fiscal Year
CITY OF SAN ANTONIO, TEXAS
- 288 -
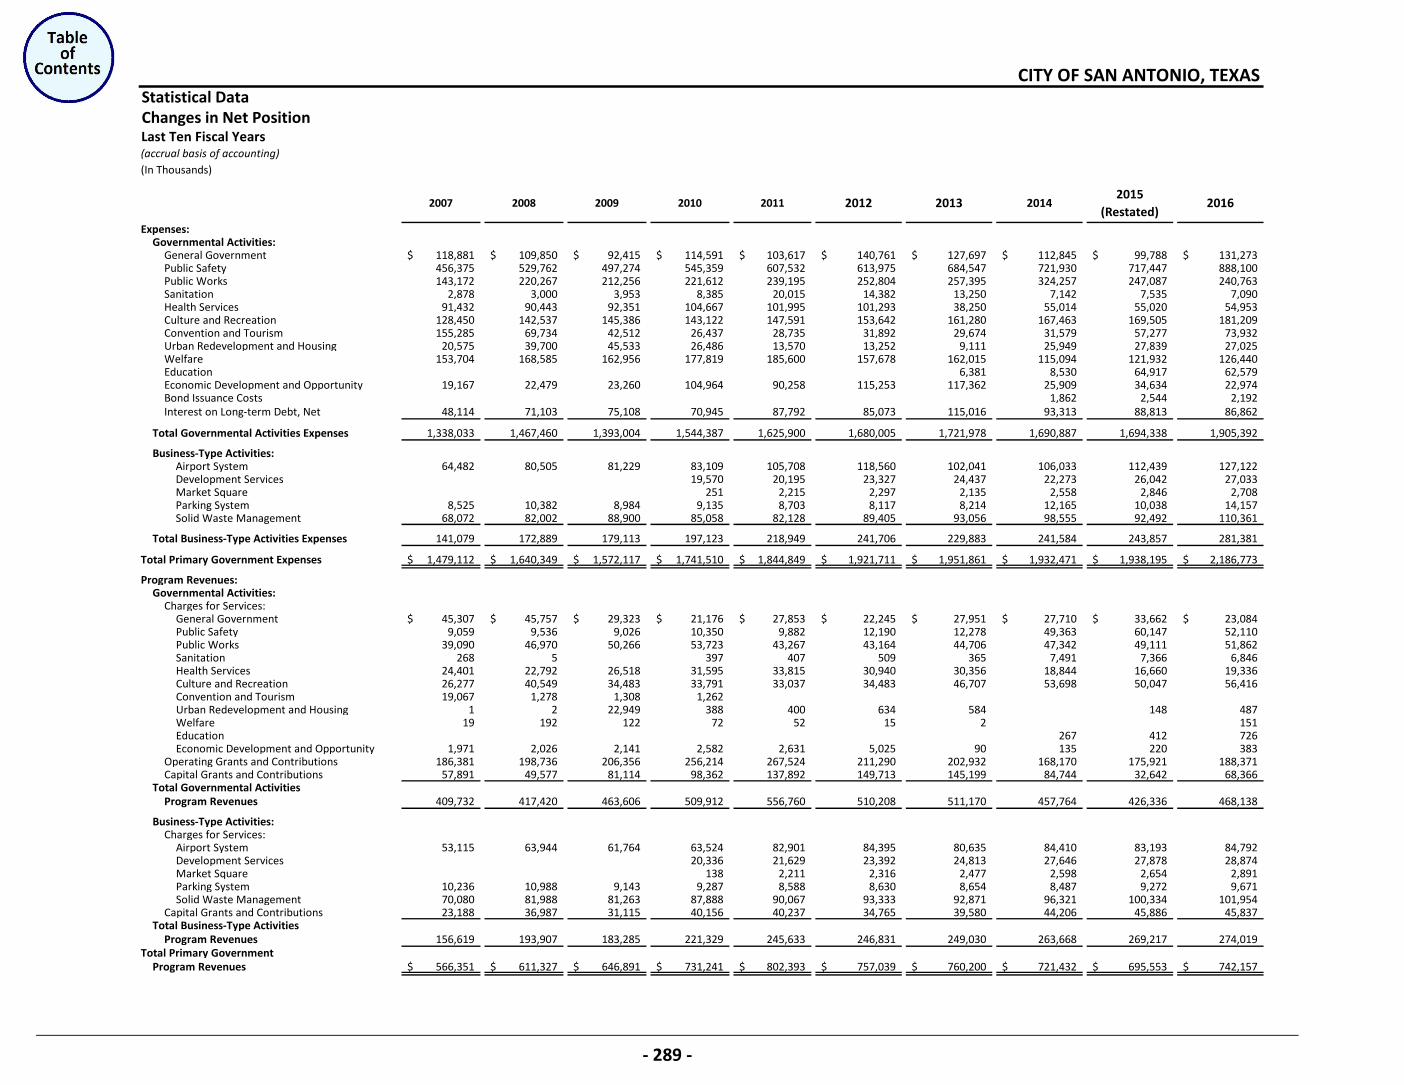
Statistical DataChanges in Net PositionLast Ten Fiscal Years(accrual basis of accounting)(In Thousands)
2007 2008 2009 2010 2011 2012 2013 20142015
(Restated)2016
Expenses:Governmental Activities:
General Government 118,881$ 109,850$ 92,415$ 114,591$ 103,617$ 140,761$ 127,697$ 112,845$ 99,788$ 131,273$ Public Safety 456,375 529,762 497,274 545,359 607,532 613,975 684,547 721,930 717,447 888,100 Public Works 143,172 220,267 212,256 221,612 239,195 252,804 257,395 324,257 247,087 240,763 Sanitation 2,878 3,000 3,953 8,385 20,015 14,382 13,250 7,142 7,535 7,090 Health Services 91,432 90,443 92,351 104,667 101,995 101,293 38,250 55,014 55,020 54,953 Culture and Recreation 128,450 142,537 145,386 143,122 147,591 153,642 161,280 167,463 169,505 181,209 Convention and Tourism 155,285 69,734 42,512 26,437 28,735 31,892 29,674 31,579 57,277 73,932 Urban Redevelopment and Housing 20,575 39,700 45,533 26,486 13,570 13,252 9,111 25,949 27,839 27,025 Welfare 153,704 168,585 162,956 177,819 185,600 157,678 162,015 115,094 121,932 126,440 Education 6,381 8,530 64,917 62,579 Economic Development and Opportunity 19,167 22,479 23,260 104,964 90,258 115,253 117,362 25,909 34,634 22,974 Bond Issuance Costs 1,862 2,544 2,192 Interest on Long-term Debt, Net 48,114 71,103 75,108 70,945 87,792 85,073 115,016 93,313 88,813 86,862
Total Governmental Activities Expenses 1,338,033 1,467,460 1,393,004 1,544,387 1,625,900 1,680,005 1,721,978 1,690,887 1,694,338 1,905,392
Business-Type Activities:Airport System 64,482 80,505 81,229 83,109 105,708 118,560 102,041 106,033 112,439 127,122 Development Services 19,570 20,195 23,327 24,437 22,273 26,042 27,033 Market Square 251 2,215 2,297 2,135 2,558 2,846 2,708 Parking System 8,525 10,382 8,984 9,135 8,703 8,117 8,214 12,165 10,038 14,157 Solid Waste Management 68,072 82,002 88,900 85,058 82,128 89,405 93,056 98,555 92,492 110,361
Total Business-Type Activities Expenses 141,079 172,889 179,113 197,123 218,949 241,706 229,883 241,584 243,857 281,381
Total Primary Government Expenses 1,479,112$ 1,640,349$ 1,572,117$ 1,741,510$ 1,844,849$ 1,921,711$ 1,951,861$ 1,932,471$ 1,938,195$ 2,186,773$
Program Revenues:Governmental Activities:
Charges for Services:General Government 45,307$ 45,757$ 29,323$ 21,176$ 27,853$ 22,245$ 27,951$ 27,710$ 33,662$ 23,084$ Public Safety 9,059 9,536 9,026 10,350 9,882 12,190 12,278 49,363 60,147 52,110 Public Works 39,090 46,970 50,266 53,723 43,267 43,164 44,706 47,342 49,111 51,862 Sanitation 268 5 397 407 509 365 7,491 7,366 6,846 Health Services 24,401 22,792 26,518 31,595 33,815 30,940 30,356 18,844 16,660 19,336 Culture and Recreation 26,277 40,549 34,483 33,791 33,037 34,483 46,707 53,698 50,047 56,416 Convention and Tourism 19,067 1,278 1,308 1,262 Urban Redevelopment and Housing 1 2 22,949 388 400 634 584 148 487 Welfare 19 192 122 72 52 15 2 151 Education 267 412 726 Economic Development and Opportunity 1,971 2,026 2,141 2,582 2,631 5,025 90 135 220 383
Operating Grants and Contributions 186,381 198,736 206,356 256,214 267,524 211,290 202,932 168,170 175,921 188,371 Capital Grants and Contributions 57,891 49,577 81,114 98,362 137,892 149,713 145,199 84,744 32,642 68,366
Total Governmental Activities Program Revenues 409,732 417,420 463,606 509,912 556,760 510,208 511,170 457,764 426,336 468,138
Business-Type Activities:Charges for Services:
Airport System 53,115 63,944 61,764 63,524 82,901 84,395 80,635 84,410 83,193 84,792 Development Services 20,336 21,629 23,392 24,813 27,646 27,878 28,874 Market Square 138 2,211 2,316 2,477 2,598 2,654 2,891 Parking System 10,236 10,988 9,143 9,287 8,588 8,630 8,654 8,487 9,272 9,671 Solid Waste Management 70,080 81,988 81,263 87,888 90,067 93,333 92,871 96,321 100,334 101,954
Capital Grants and Contributions 23,188 36,987 31,115 40,156 40,237 34,765 39,580 44,206 45,886 45,837 Total Business-Type Activities
Program Revenues 156,619 193,907 183,285 221,329 245,633 246,831 249,030 263,668 269,217 274,019 Total Primary Government
Program Revenues 566,351$ 611,327$ 646,891$ 731,241$ 802,393$ 757,039$ 760,200$ 721,432$ 695,553$ 742,157$
CITY OF SAN ANTONIO, TEXAS
- 289 -
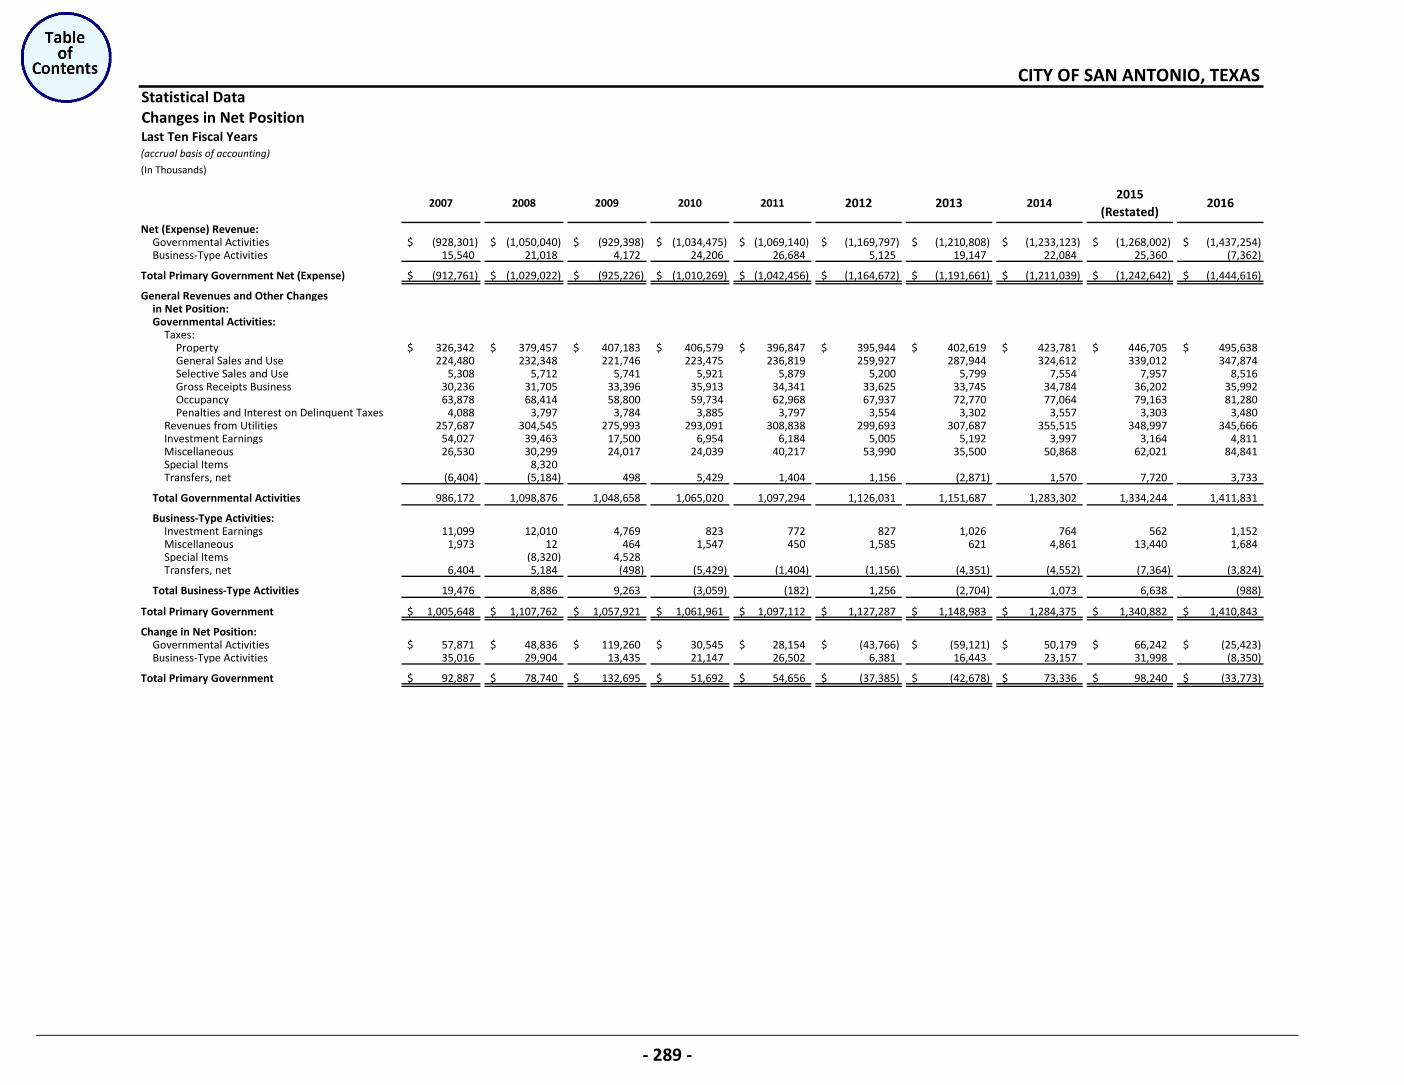
Statistical DataChanges in Net PositionLast Ten Fiscal Years(accrual basis of accounting)
(In Thousands)
2007 2008 2009 2010 2011 2012 2013 20142015
(Restated)2016
Net (Expense) Revenue:Governmental Activities (928,301)$ (1,050,040)$ (929,398)$ (1,034,475)$ (1,069,140)$ (1,169,797)$ (1,210,808)$ (1,233,123)$ (1,268,002)$ (1,437,254)$ Business-Type Activities 15,540 21,018 4,172 24,206 26,684 5,125 19,147 22,084 25,360 (7,362)
Total Primary Government Net (Expense) (912,761)$ (1,029,022)$ (925,226)$ (1,010,269)$ (1,042,456)$ (1,164,672)$ (1,191,661)$ (1,211,039)$ (1,242,642)$ (1,444,616)$
General Revenues and Other Changes in Net Position:Governmental Activities:
Taxes:Property 326,342$ 379,457$ 407,183$ 406,579$ 396,847$ 395,944$ 402,619$ 423,781$ 446,705$ 495,638$ General Sales and Use 224,480 232,348 221,746 223,475 236,819 259,927 287,944 324,612 339,012 347,874 Selective Sales and Use 5,308 5,712 5,741 5,921 5,879 5,200 5,799 7,554 7,957 8,516 Gross Receipts Business 30,236 31,705 33,396 35,913 34,341 33,625 33,745 34,784 36,202 35,992 Occupancy 63,878 68,414 58,800 59,734 62,968 67,937 72,770 77,064 79,163 81,280 Penalties and Interest on Delinquent Taxes 4,088 3,797 3,784 3,885 3,797 3,554 3,302 3,557 3,303 3,480
Revenues from Utilities 257,687 304,545 275,993 293,091 308,838 299,693 307,687 355,515 348,997 345,666 Investment Earnings 54,027 39,463 17,500 6,954 6,184 5,005 5,192 3,997 3,164 4,811 Miscellaneous 26,530 30,299 24,017 24,039 40,217 53,990 35,500 50,868 62,021 84,841 Special Items 8,320 Transfers, net (6,404) (5,184) 498 5,429 1,404 1,156 (2,871) 1,570 7,720 3,733
Total Governmental Activities 986,172 1,098,876 1,048,658 1,065,020 1,097,294 1,126,031 1,151,687 1,283,302 1,334,244 1,411,831
Business-Type Activities:Investment Earnings 11,099 12,010 4,769 823 772 827 1,026 764 562 1,152 Miscellaneous 1,973 12 464 1,547 450 1,585 621 4,861 13,440 1,684 Special Items (8,320) 4,528 Transfers, net 6,404 5,184 (498) (5,429) (1,404) (1,156) (4,351) (4,552) (7,364) (3,824)
Total Business-Type Activities 19,476 8,886 9,263 (3,059) (182) 1,256 (2,704) 1,073 6,638 (988)
Total Primary Government 1,005,648$ 1,107,762$ 1,057,921$ 1,061,961$ 1,097,112$ 1,127,287$ 1,148,983$ 1,284,375$ 1,340,882$ 1,410,843$
Change in Net Position:Governmental Activities 57,871$ 48,836$ 119,260$ 30,545$ 28,154$ (43,766)$ (59,121)$ 50,179$ 66,242$ (25,423)$ Business-Type Activities 35,016 29,904 13,435 21,147 26,502 6,381 16,443 23,157 31,998 (8,350)
Total Primary Government 92,887$ 78,740$ 132,695$ 51,692$ 54,656$ (37,385)$ (42,678)$ 73,336$ 98,240$ (33,773)$
CITY OF SAN ANTONIO, TEXAS
- 289 -
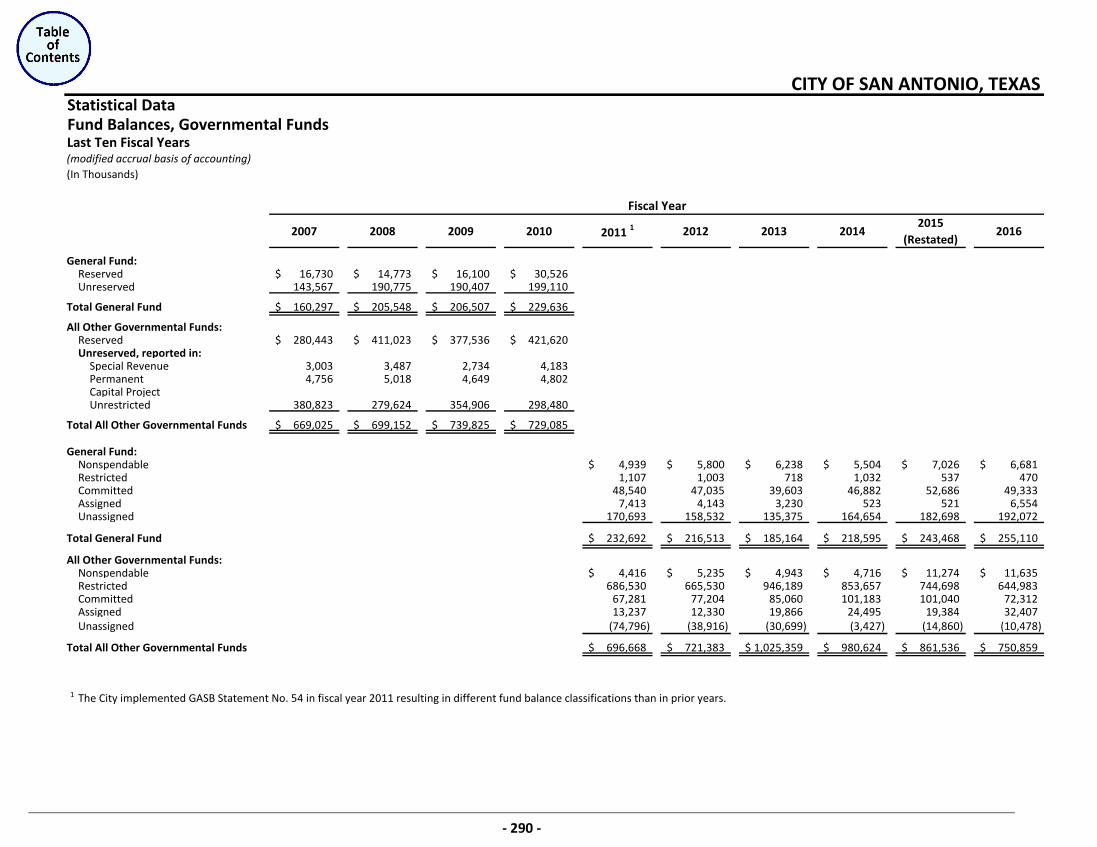
Statistical DataFund Balances, Governmental FundsLast Ten Fiscal Years(modified accrual basis of accounting)(In Thousands)
2007 2008 2009 2010 2011 1 2012 2013 20142015
(Restated)2016
General Fund:Reserved 16,730$ 14,773$ 16,100$ 30,526$ Unreserved 143,567 190,775 190,407 199,110
Total General Fund 160,297$ 205,548$ 206,507$ 229,636$
All Other Governmental Funds:Reserved 280,443$ 411,023$ 377,536$ 421,620$ Unreserved, reported in:
Special Revenue 3,003 3,487 2,734 4,183 Permanent 4,756 5,018 4,649 4,802 Capital Project Unrestricted 380,823 279,624 354,906 298,480
Total All Other Governmental Funds 669,025$ 699,152$ 739,825$ 729,085$
General Fund:Nonspendable 4,939$ 5,800$ 6,238$ 5,504$ 7,026$ 6,681$ Restricted 1,107 1,003 718 1,032 537 470 Committed 48,540 47,035 39,603 46,882 52,686 49,333 Assigned 7,413 4,143 3,230 523 521 6,554 Unassigned 170,693 158,532 135,375 164,654 182,698 192,072
Total General Fund 232,692$ 216,513$ 185,164$ 218,595$ 243,468$ 255,110$
All Other Governmental Funds:Nonspendable 4,416$ 5,235$ 4,943$ 4,716$ 11,274$ 11,635$ Restricted 686,530 665,530 946,189 853,657 744,698 644,983 Committed 67,281 77,204 85,060 101,183 101,040 72,312 Assigned 13,237 12,330 19,866 24,495 19,384 32,407 Unassigned (74,796) (38,916) (30,699) (3,427) (14,860) (10,478)
Total All Other Governmental Funds 696,668$ 721,383$ 1,025,359$ 980,624$ 861,536$ 750,859$
1 The City implemented GASB Statement No. 54 in fiscal year 2011 resulting in different fund balance classifications than in prior years.
Fiscal Year
CITY OF SAN ANTONIO, TEXAS
- 290 -
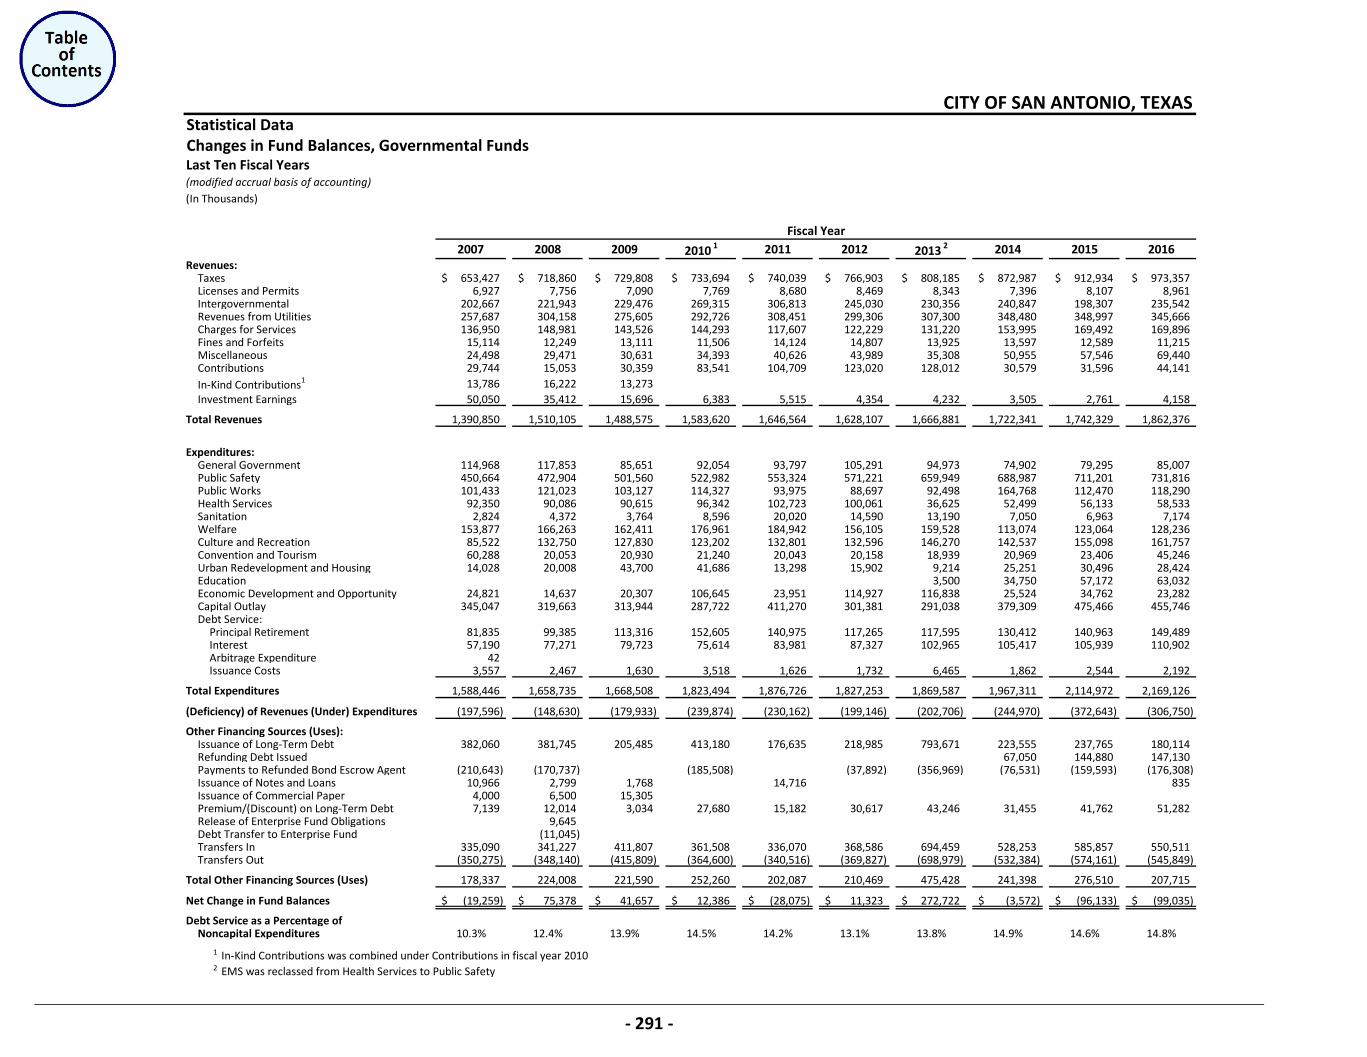
Statistical DataChanges in Fund Balances, Governmental FundsLast Ten Fiscal Years(modified accrual basis of accounting)(In Thousands)
2007 2008 2009 2010 1 2011 2012 2013 2 2014 2015 2016Revenues:
Taxes 653,427$ 718,860$ 729,808$ 733,694$ 740,039$ 766,903$ 808,185$ 872,987$ 912,934$ 973,357$ Licenses and Permits 6,927 7,756 7,090 7,769 8,680 8,469 8,343 7,396 8,107 8,961 Intergovernmental 202,667 221,943 229,476 269,315 306,813 245,030 230,356 240,847 198,307 235,542 Revenues from Utilities 257,687 304,158 275,605 292,726 308,451 299,306 307,300 348,480 348,997 345,666 Charges for Services 136,950 148,981 143,526 144,293 117,607 122,229 131,220 153,995 169,492 169,896 Fines and Forfeits 15,114 12,249 13,111 11,506 14,124 14,807 13,925 13,597 12,589 11,215 Miscellaneous 24,498 29,471 30,631 34,393 40,626 43,989 35,308 50,955 57,546 69,440 Contributions 29,744 15,053 30,359 83,541 104,709 123,020 128,012 30,579 31,596 44,141 In-Kind Contributions1 13,786 16,222 13,273 Investment Earnings 50,050 35,412 15,696 6,383 5,515 4,354 4,232 3,505 2,761 4,158
Total Revenues 1,390,850 1,510,105 1,488,575 1,583,620 1,646,564 1,628,107 1,666,881 1,722,341 1,742,329 1,862,376
Expenditures:General Government 114,968 117,853 85,651 92,054 93,797 105,291 94,973 74,902 79,295 85,007 Public Safety 450,664 472,904 501,560 522,982 553,324 571,221 659,949 688,987 711,201 731,816 Public Works 101,433 121,023 103,127 114,327 93,975 88,697 92,498 164,768 112,470 118,290 Health Services 92,350 90,086 90,615 96,342 102,723 100,061 36,625 52,499 56,133 58,533 Sanitation 2,824 4,372 3,764 8,596 20,020 14,590 13,190 7,050 6,963 7,174 Welfare 153,877 166,263 162,411 176,961 184,942 156,105 159,528 113,074 123,064 128,236 Culture and Recreation 85,522 132,750 127,830 123,202 132,801 132,596 146,270 142,537 155,098 161,757 Convention and Tourism 60,288 20,053 20,930 21,240 20,043 20,158 18,939 20,969 23,406 45,246 Urban Redevelopment and Housing 14,028 20,008 43,700 41,686 13,298 15,902 9,214 25,251 30,496 28,424 Education 3,500 34,750 57,172 63,032 Economic Development and Opportunity 24,821 14,637 20,307 106,645 23,951 114,927 116,838 25,524 34,762 23,282 Capital Outlay 345,047 319,663 313,944 287,722 411,270 301,381 291,038 379,309 475,466 455,746 Debt Service:
Principal Retirement 81,835 99,385 113,316 152,605 140,975 117,265 117,595 130,412 140,963 149,489 Interest 57,190 77,271 79,723 75,614 83,981 87,327 102,965 105,417 105,939 110,902 Arbitrage Expenditure 42 Issuance Costs 3,557 2,467 1,630 3,518 1,626 1,732 6,465 1,862 2,544 2,192
Total Expenditures 1,588,446 1,658,735 1,668,508 1,823,494 1,876,726 1,827,253 1,869,587 1,967,311 2,114,972 2,169,126
(Deficiency) of Revenues (Under) Expenditures (197,596) (148,630) (179,933) (239,874) (230,162) (199,146) (202,706) (244,970) (372,643) (306,750)
Other Financing Sources (Uses):Issuance of Long-Term Debt 382,060 381,745 205,485 413,180 176,635 218,985 793,671 223,555 237,765 180,114 Refunding Debt Issued 67,050 144,880 147,130 Payments to Refunded Bond Escrow Agent (210,643) (170,737) (185,508) (37,892) (356,969) (76,531) (159,593) (176,308) Issuance of Notes and Loans 10,966 2,799 1,768 14,716 835 Issuance of Commercial Paper 4,000 6,500 15,305 Premium/(Discount) on Long-Term Debt 7,139 12,014 3,034 27,680 15,182 30,617 43,246 31,455 41,762 51,282 Release of Enterprise Fund Obligations 9,645 Debt Transfer to Enterprise Fund (11,045) Transfers In 335,090 341,227 411,807 361,508 336,070 368,586 694,459 528,253 585,857 550,511 Transfers Out (350,275) (348,140) (415,809) (364,600) (340,516) (369,827) (698,979) (532,384) (574,161) (545,849)
Total Other Financing Sources (Uses) 178,337 224,008 221,590 252,260 202,087 210,469 475,428 241,398 276,510 207,715
Net Change in Fund Balances (19,259)$ 75,378$ 41,657$ 12,386$ (28,075)$ 11,323$ 272,722$ (3,572)$ (96,133)$ (99,035)$
Debt Service as a Percentage of Noncapital Expenditures 10.3% 12.4% 13.9% 14.5% 14.2% 13.1% 13.8% 14.9% 14.6% 14.8%
1 In-Kind Contributions was combined under Contributions in fiscal year 20102 EMS was reclassed from Health Services to Public Safety
CITY OF SAN ANTONIO, TEXAS
Fiscal Year
- 291 -
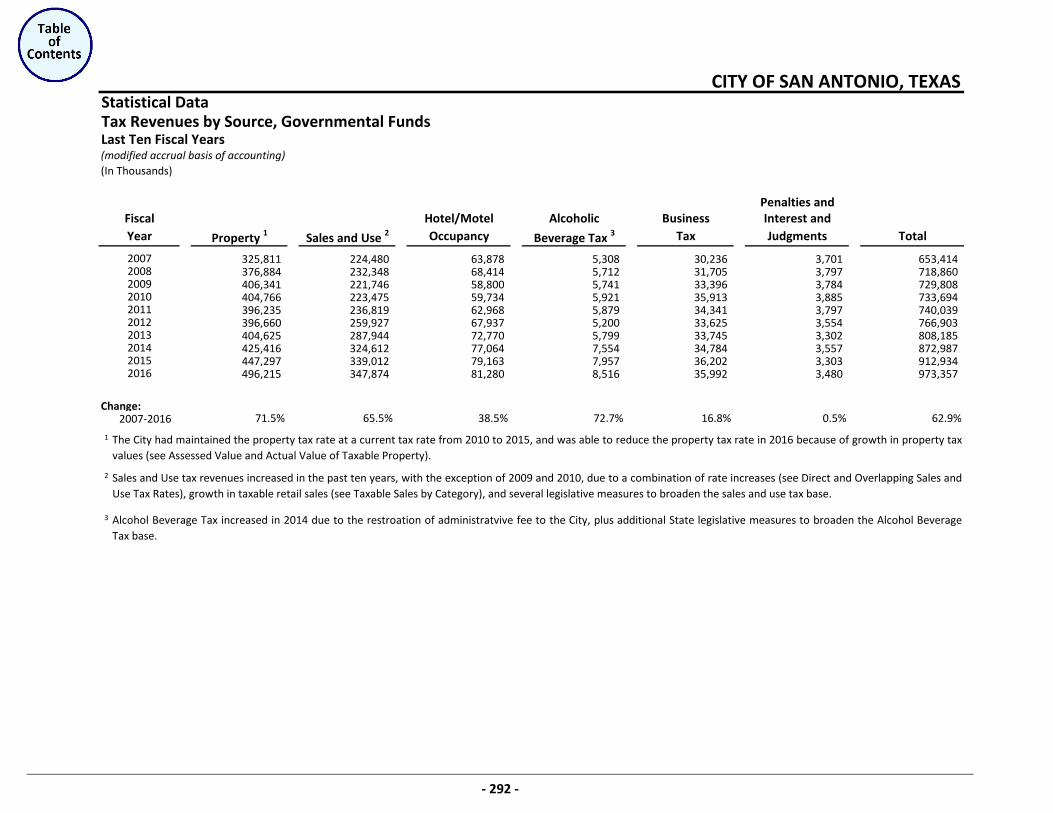
Statistical DataTax Revenues by Source, Governmental FundsLast Ten Fiscal Years(modified accrual basis of accounting)(In Thousands)
325,811 224,480 63,878 5,308 30,236 3,701 653,414 376,884 232,348 68,414 5,712 31,705 3,797 718,860 406,341 221,746 58,800 5,741 33,396 3,784 729,808 404,766 223,475 59,734 5,921 35,913 3,885 733,694 396,235 236,819 62,968 5,879 34,341 3,797 740,039 396,660 259,927 67,937 5,200 33,625 3,554 766,903 404,625 287,944 72,770 5,799 33,745 3,302 808,185 425,416 324,612 77,064 7,554 34,784 3,557 872,987 447,297 339,012 79,163 7,957 36,202 3,303 912,934 496,215 347,874 81,280 8,516 35,992 3,480 973,357
Change:2007-2016
1
2
3 Alcohol Beverage Tax increased in 2014 due to the restroation of administratvive fee to the City, plus additional State legislative measures to broaden the Alcohol BeverageTax base.
0.5% 62.9%
The City had maintained the property tax rate at a current tax rate from 2010 to 2015, and was able to reduce the property tax rate in 2016 because of growth in property taxvalues (see Assessed Value and Actual Value of Taxable Property).
Sales and Use tax revenues increased in the past ten years, with the exception of 2009 and 2010, due to a combination of rate increases (see Direct and Overlapping Sales andUse Tax Rates), growth in taxable retail sales (see Taxable Sales by Category), and several legislative measures to broaden the sales and use tax base.
65.5% 38.5% 72.7% 16.8%71.5%
Tax JudgmentsYear Property 1 Sales and Use 2 Occupancy Beverage Tax 3
2016
200920102011
20072008
2012201320142015
Total
CITY OF SAN ANTONIO, TEXAS
Penalties andFiscal Hotel/Motel Alcoholic Business Interest and
- 292 -
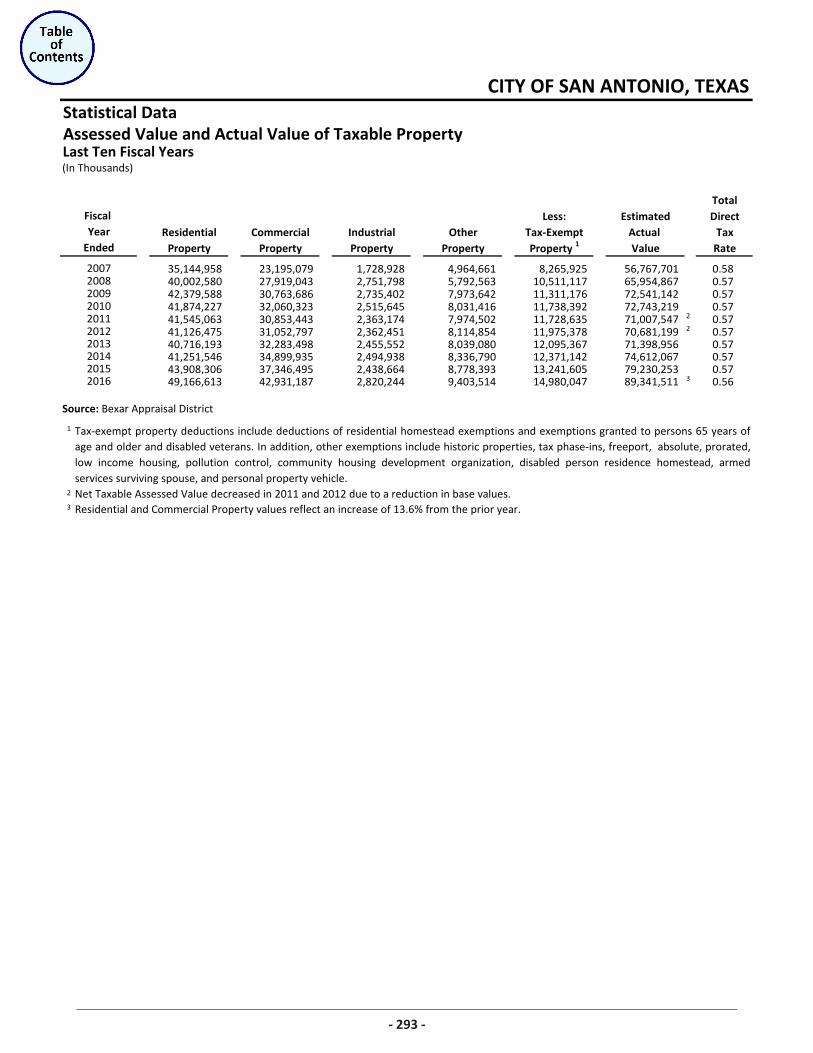
Statistical DataAssessed Value and Actual Value of Taxable PropertyLast Ten Fiscal Years(In Thousands)
TotalLess: Estimated Direct
Residential Commercial Industrial Other Tax-Exempt Actual TaxProperty Property Property Property Property 1 Value Rate
35,144,958 23,195,079 1,728,928 4,964,661 8,265,925 56,767,701 0.5840,002,580 27,919,043 2,751,798 5,792,563 10,511,117 65,954,867 0.5742,379,588 30,763,686 2,735,402 7,973,642 11,311,176 72,541,142 0.5741,874,227 32,060,323 2,515,645 8,031,416 11,738,392 72,743,219 0.5741,545,063 30,853,443 2,363,174 7,974,502 11,728,635 71,007,547 2 0.5741,126,475 31,052,797 2,362,451 8,114,854 11,975,378 70,681,199 2 0.5740,716,193 32,283,498 2,455,552 8,039,080 12,095,367 71,398,956 0.5741,251,546 34,899,935 2,494,938 8,336,790 12,371,142 74,612,067 0.5743,908,306 37,346,495 2,438,664 8,778,393 13,241,605 79,230,253 0.5749,166,613 42,931,187 2,820,244 9,403,514 14,980,047 89,341,511 3 0.56
Source: Bexar Appraisal District
1
2 Net Taxable Assessed Value decreased in 2011 and 2012 due to a reduction in base values. 3
20102011
201420152016
Residential and Commercial Property values reflect an increase of 13.6% from the prior year.
CITY OF SAN ANTONIO, TEXAS
2007
2013
Tax-exempt property deductions include deductions of residential homestead exemptions and exemptions granted to persons 65 years ofage and older and disabled veterans. In addition, other exemptions include historic properties, tax phase-ins, freeport, absolute, prorated,low income housing, pollution control, community housing development organization, disabled person residence homestead, armedservices surviving spouse, and personal property vehicle.
2012
Fiscal
EndedYear
20082009
293
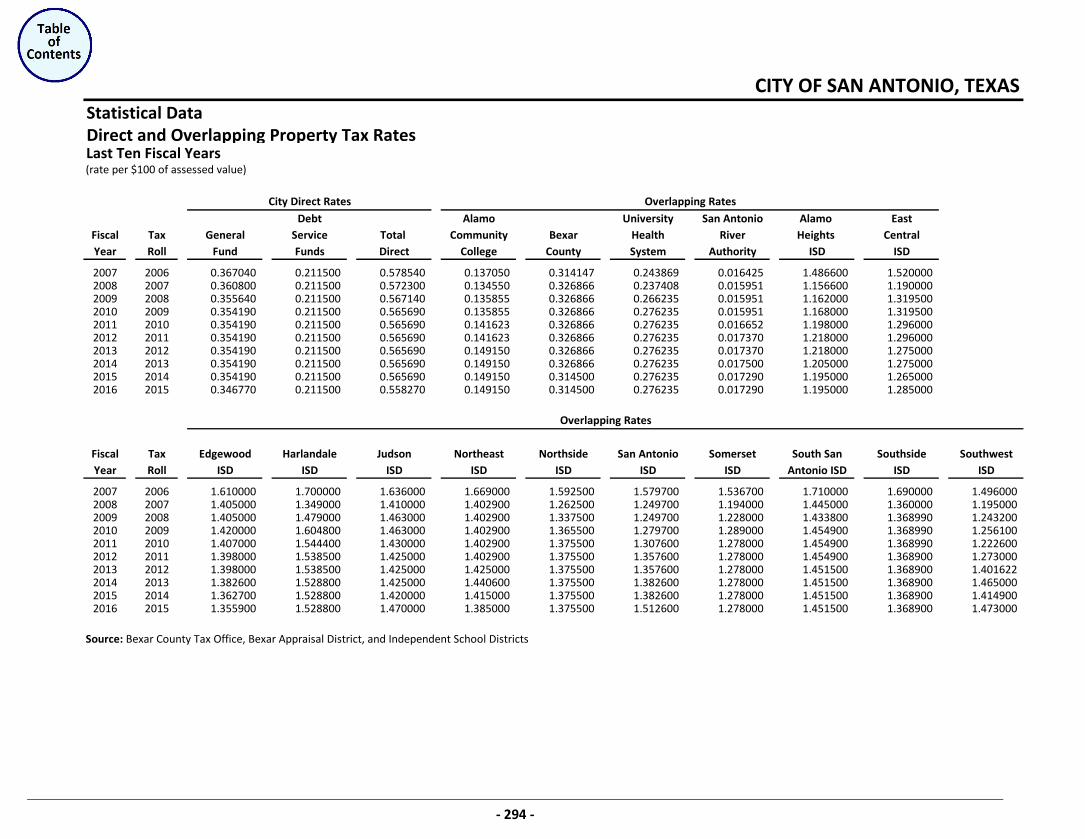
Statistical DataDirect and Overlapping Property Tax RatesLast Ten Fiscal Years(rate per $100 of assessed value)
Debt Alamo University San Antonio Alamo EastFiscal Tax General Service Total Community Bexar Health River Heights CentralYear Roll Fund Funds Direct College County System Authority ISD ISD
2007 2006 0.367040 0.211500 0.578540 0.137050 0.314147 0.243869 0.016425 1.486600 1.520000 2008 2007 0.360800 0.211500 0.572300 0.134550 0.326866 0.237408 0.015951 1.156600 1.190000 2009 2008 0.355640 0.211500 0.567140 0.135855 0.326866 0.266235 0.015951 1.162000 1.319500 2010 2009 0.354190 0.211500 0.565690 0.135855 0.326866 0.276235 0.015951 1.168000 1.319500 2011 2010 0.354190 0.211500 0.565690 0.141623 0.326866 0.276235 0.016652 1.198000 1.296000 2012 2011 0.354190 0.211500 0.565690 0.141623 0.326866 0.276235 0.017370 1.218000 1.296000 2013 2012 0.354190 0.211500 0.565690 0.149150 0.326866 0.276235 0.017370 1.218000 1.275000 2014 2013 0.354190 0.211500 0.565690 0.149150 0.326866 0.276235 0.017500 1.205000 1.275000 2015 2014 0.354190 0.211500 0.565690 0.149150 0.314500 0.276235 0.017290 1.195000 1.265000 2016 2015 0.346770 0.211500 0.558270 0.149150 0.314500 0.276235 0.017290 1.195000 1.285000
Fiscal Tax Edgewood Harlandale Judson Northeast Northside San Antonio Somerset South San Southside SouthwestYear Roll ISD ISD ISD ISD ISD ISD ISD Antonio ISD ISD ISD
2007 2006 1.610000 1.700000 1.636000 1.669000 1.592500 1.579700 1.536700 1.710000 1.690000 1.496000 2008 2007 1.405000 1.349000 1.410000 1.402900 1.262500 1.249700 1.194000 1.445000 1.360000 1.195000 2009 2008 1.405000 1.479000 1.463000 1.402900 1.337500 1.249700 1.228000 1.433800 1.368990 1.243200 2010 2009 1.420000 1.604800 1.463000 1.402900 1.365500 1.279700 1.289000 1.454900 1.368990 1.256100 2011 2010 1.407000 1.544400 1.430000 1.402900 1.375500 1.307600 1.278000 1.454900 1.368990 1.222600 2012 2011 1.398000 1.538500 1.425000 1.402900 1.375500 1.357600 1.278000 1.454900 1.368900 1.273000 2013 2012 1.398000 1.538500 1.425000 1.425000 1.375500 1.357600 1.278000 1.451500 1.368900 1.401622 2014 2013 1.382600 1.528800 1.425000 1.440600 1.375500 1.382600 1.278000 1.451500 1.368900 1.465000 2015 2014 1.362700 1.528800 1.420000 1.415000 1.375500 1.382600 1.278000 1.451500 1.368900 1.414900 2016 2015 1.355900 1.528800 1.470000 1.385000 1.375500 1.512600 1.278000 1.451500 1.368900 1.473000
Source: Bexar County Tax Office, Bexar Appraisal District, and Independent School Districts
CITY OF SAN ANTONIO, TEXAS
City Direct Rates Overlapping Rates
Overlapping Rates
- 294 -
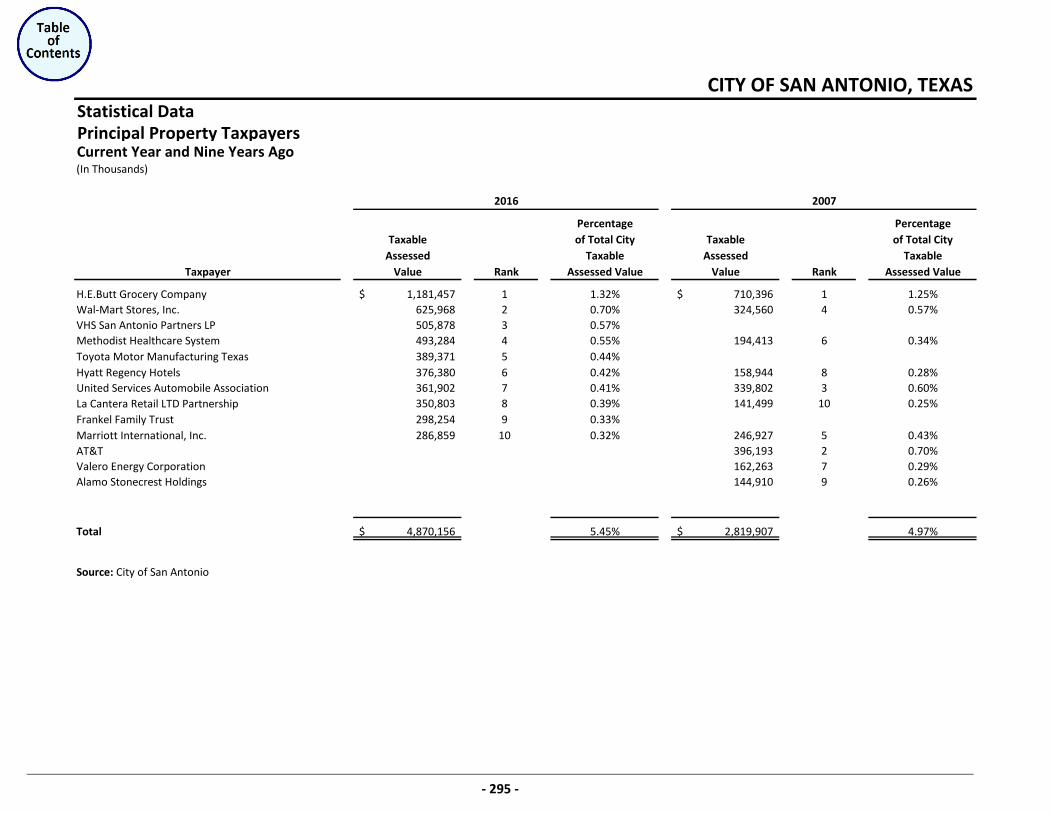
Statistical DataPrincipal Property TaxpayersCurrent Year and Nine Years Ago(In Thousands)
Percentage PercentageTaxable of Total City Taxable of Total City
Assessed Taxable Assessed TaxableTaxpayer Value Rank Assessed Value Value Rank Assessed Value
H.E.Butt Grocery Company 1,181,457$ 1 1.32% 710,396$ 1 1.25%Wal-Mart Stores, Inc. 625,968 2 0.70% 324,560 4 0.57%VHS San Antonio Partners LP 505,878 3 0.57%Methodist Healthcare System 493,284 4 0.55% 194,413 6 0.34%Toyota Motor Manufacturing Texas 389,371 5 0.44%Hyatt Regency Hotels 376,380 6 0.42% 158,944 8 0.28%United Services Automobile Association 361,902 7 0.41% 339,802 3 0.60%La Cantera Retail LTD Partnership 350,803 8 0.39% 141,499 10 0.25%Frankel Family Trust 298,254 9 0.33%Marriott International, Inc. 286,859 10 0.32% 246,927 5 0.43%AT&T 396,193 2 0.70%Valero Energy Corporation 162,263 7 0.29%Alamo Stonecrest Holdings 144,910 9 0.26%
Total 4,870,156$ 5.45% 2,819,907$ 4.97%
Source: City of San Antonio
CITY OF SAN ANTONIO, TEXAS
2016 2007
- 295 -
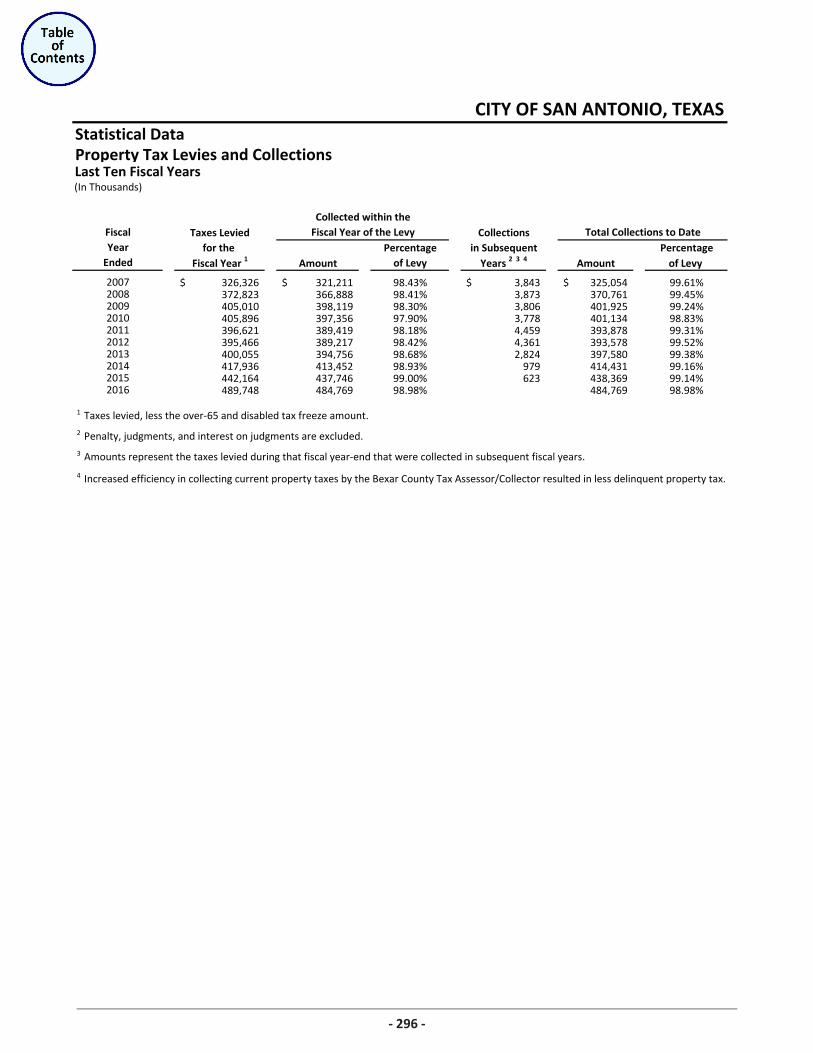
Statistical DataProperty Tax Levies and CollectionsLast Ten Fiscal Years(In Thousands)
Taxes Levied Collectionsfor the Percentage in Subsequent Percentage
Fiscal Year 1 Amount of Levy Years 2 3 4 Amount of Levy
326,326$ 321,211$ 98.43% 3,843$ 325,054$ 99.61%372,823 366,888 98.41% 3,873 370,761 99.45%405,010 398,119 98.30% 3,806 401,925 99.24%405,896 397,356 97.90% 3,778 401,134 98.83%396,621 389,419 98.18% 4,459 393,878 99.31%395,466 389,217 98.42% 4,361 393,578 99.52%400,055 394,756 98.68% 2,824 397,580 99.38%417,936 413,452 98.93% 979 414,431 99.16%442,164 437,746 99.00% 623 438,369 99.14%489,748 484,769 98.98% 484,769 98.98%
1 Taxes levied, less the over-65 and disabled tax freeze amount.2 Penalty, judgments, and interest on judgments are excluded.3 Amounts represent the taxes levied during that fiscal year-end that were collected in subsequent fiscal years.
4 Increased efficiency in collecting current property taxes by the Bexar County Tax Assessor/Collector resulted in less delinquent property tax.
20162015
20092008
2014
CITY OF SAN ANTONIO, TEXAS
FiscalYear
Ended
Collected within theTotal Collections to Date
20132012
Fiscal Year of the Levy
2007
20112010
296
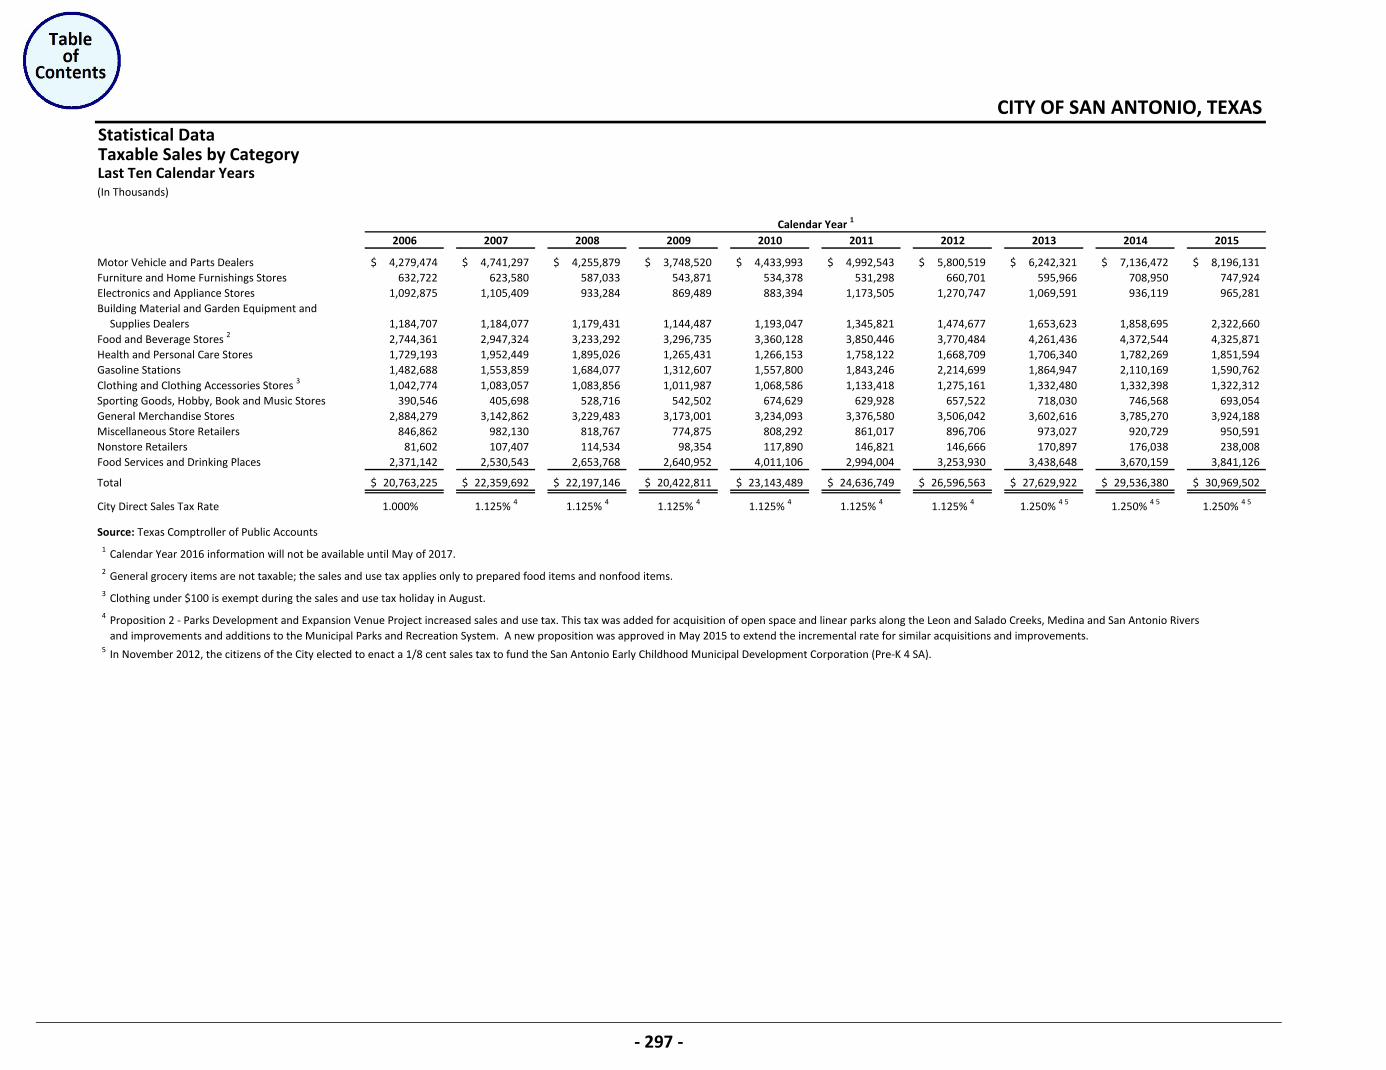
Statistical DataTaxable Sales by CategoryLast Ten Calendar Years(In Thousands)
2006 2007 2008 2009 2010 2011 2012 2013 2014 2015
Motor Vehicle and Parts Dealers 4,279,474$ 4,741,297$ 4,255,879$ 3,748,520$ 4,433,993$ 4,992,543$ 5,800,519$ 6,242,321$ 7,136,472$ 8,196,131$ Furniture and Home Furnishings Stores 632,722 623,580 587,033 543,871 534,378 531,298 660,701 595,966 708,950 747,924 Electronics and Appliance Stores 1,092,875 1,105,409 933,284 869,489 883,394 1,173,505 1,270,747 1,069,591 936,119 965,281 Building Material and Garden Equipment and
Supplies Dealers 1,184,707 1,184,077 1,179,431 1,144,487 1,193,047 1,345,821 1,474,677 1,653,623 1,858,695 2,322,660 Food and Beverage Stores 2 2,744,361 2,947,324 3,233,292 3,296,735 3,360,128 3,850,446 3,770,484 4,261,436 4,372,544 4,325,871 Health and Personal Care Stores 1,729,193 1,952,449 1,895,026 1,265,431 1,266,153 1,758,122 1,668,709 1,706,340 1,782,269 1,851,594 Gasoline Stations 1,482,688 1,553,859 1,684,077 1,312,607 1,557,800 1,843,246 2,214,699 1,864,947 2,110,169 1,590,762 Clothing and Clothing Accessories Stores 3 1,042,774 1,083,057 1,083,856 1,011,987 1,068,586 1,133,418 1,275,161 1,332,480 1,332,398 1,322,312 Sporting Goods, Hobby, Book and Music Stores 390,546 405,698 528,716 542,502 674,629 629,928 657,522 718,030 746,568 693,054 General Merchandise Stores 2,884,279 3,142,862 3,229,483 3,173,001 3,234,093 3,376,580 3,506,042 3,602,616 3,785,270 3,924,188 Miscellaneous Store Retailers 846,862 982,130 818,767 774,875 808,292 861,017 896,706 973,027 920,729 950,591 Nonstore Retailers 81,602 107,407 114,534 98,354 117,890 146,821 146,666 170,897 176,038 238,008 Food Services and Drinking Places 2,371,142 2,530,543 2,653,768 2,640,952 4,011,106 2,994,004 3,253,930 3,438,648 3,670,159 3,841,126
Total 20,763,225$ 22,359,692$ 22,197,146$ 20,422,811$ 23,143,489$ 24,636,749$ 26,596,563$ 27,629,922$ 29,536,380$ 30,969,502$
City Direct Sales Tax Rate 1.000% 4 1.125% 4 1.125% 4 1.125% 4 1.125% 4 1.125% 4 1.125% 4 1.250% 4 5 1.250% 4 5 1.250% 4 5
Source: Texas Comptroller of Public Accounts1 Calendar Year 2016 information will not be available until May of 2017.2 General grocery items are not taxable; the sales and use tax applies only to prepared food items and nonfood items.3 Clothing under $100 is exempt during the sales and use tax holiday in August.4 Proposition 2 - Parks Development and Expansion Venue Project increased sales and use tax. This tax was added for acquisition of open space and linear parks along the Leon and Salado Creeks, Medina and San Antonio Rivers
and improvements and additions to the Municipal Parks and Recreation System. A new proposition was approved in May 2015 to extend the incremental rate for similar acquisitions and improvements.5 In November 2012, the citizens of the City elected to enact a 1/8 cent sales tax to fund the San Antonio Early Childhood Municipal Development Corporation (Pre-K 4 SA).
CITY OF SAN ANTONIO, TEXAS
Calendar Year 1
- 297 -
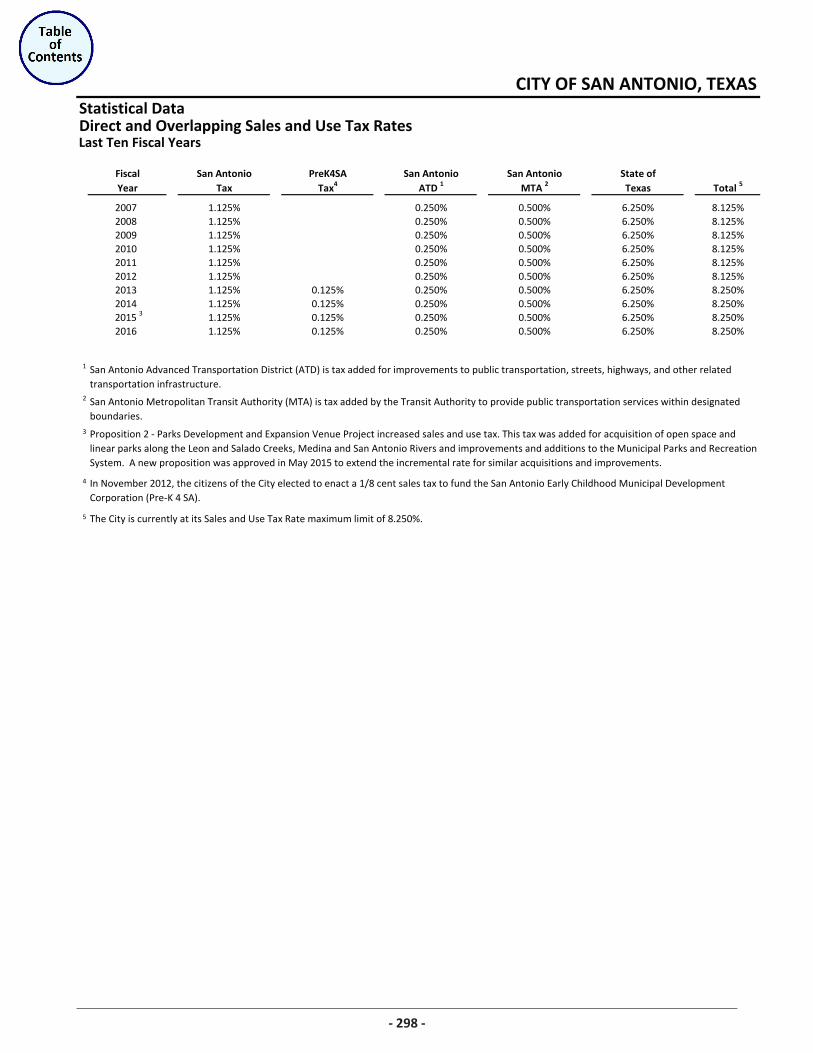
Statistical DataDirect and Overlapping Sales and Use Tax RatesLast Ten Fiscal Years
Fiscal San Antonio PreK4SA San Antonio San Antonio State ofYear Tax Tax4 ATD 1 MTA 2 Texas Total 5
2007 1.125% 0.250% 0.500% 6.250% 8.125%2008 1.125% 0.250% 0.500% 6.250% 8.125%2009 1.125% 0.250% 0.500% 6.250% 8.125%2010 1.125% 0.250% 0.500% 6.250% 8.125%2011 1.125% 0.250% 0.500% 6.250% 8.125%2012 1.125% 0.250% 0.500% 6.250% 8.125%2013 1.125% 0.125% 0.250% 0.500% 6.250% 8.250%2014 1.125% 0.125% 0.250% 0.500% 6.250% 8.250%
2015 3 1.125% 0.125% 0.250% 0.500% 6.250% 8.250%2016 1.125% 0.125% 0.250% 0.500% 6.250% 8.250%
1
2
3
4
5 The City is currently at its Sales and Use Tax Rate maximum limit of 8.250%.
CITY OF SAN ANTONIO, TEXAS
San Antonio Advanced Transportation District (ATD) is tax added for improvements to public transportation, streets, highways, and other related transportation infrastructure.
San Antonio Metropolitan Transit Authority (MTA) is tax added by the Transit Authority to provide public transportation services within designated boundaries.
Proposition 2 - Parks Development and Expansion Venue Project increased sales and use tax. This tax was added for acquisition of open space and linear parks along the Leon and Salado Creeks, Medina and San Antonio Rivers and improvements and additions to the Municipal Parks and Recreation System. A new proposition was approved in May 2015 to extend the incremental rate for similar acquisitions and improvements.
In November 2012, the citizens of the City elected to enact a 1/8 cent sales tax to fund the San Antonio Early Childhood Municipal Development Corporation (Pre-K 4 SA).
298
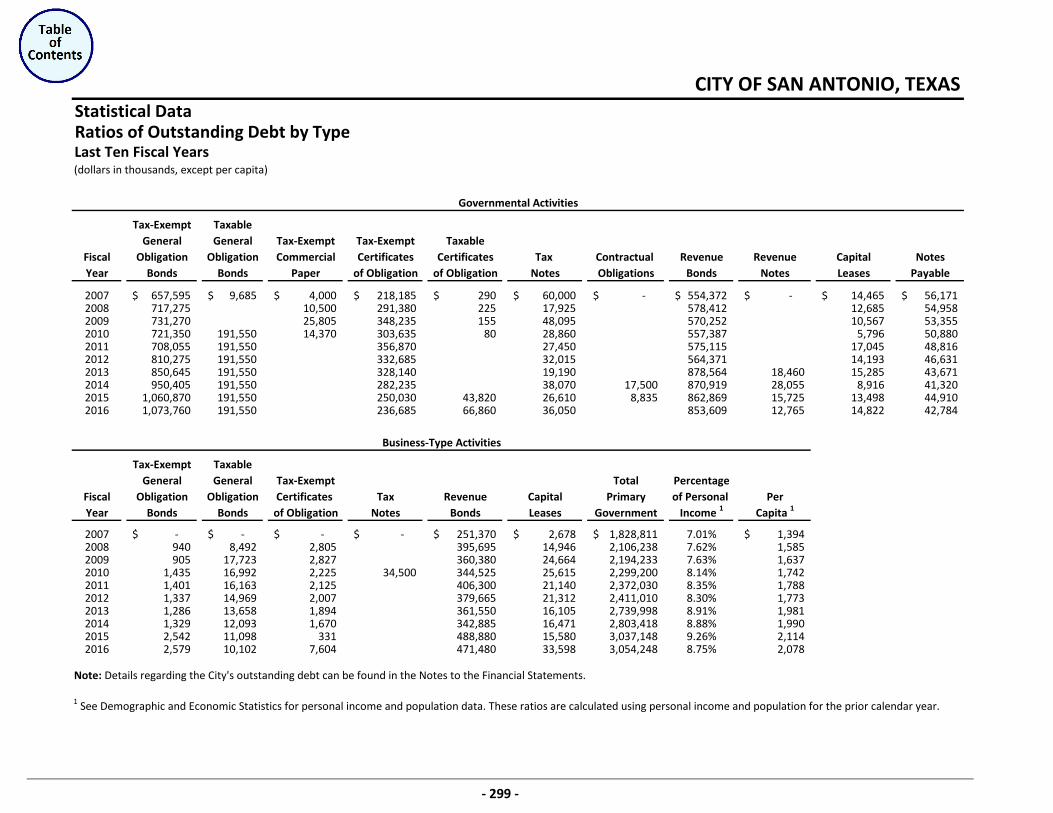
Statistical DataRatios of Outstanding Debt by TypeLast Ten Fiscal Years(dollars in thousands, except per capita)
Tax-Exempt TaxableGeneral General Tax-Exempt Tax-Exempt Taxable
Fiscal Obligation Obligation Commercial Certificates Certificates Tax Contractual Revenue Revenue Capital NotesYear Bonds Bonds Paper of Obligation of Obligation Notes Obligations Bonds Notes Leases Payable
2007 657,595$ 9,685$ 4,000$ 218,185$ 290$ 60,000$ -$ 554,372$ -$ 14,465$ 56,171$ 2008 717,275 10,500 291,380 225 17,925 578,412 12,685 54,958 2009 731,270 25,805 348,235 155 48,095 570,252 10,567 53,355 2010 721,350 191,550 14,370 303,635 80 28,860 557,387 5,796 50,880 2011 708,055 191,550 356,870 27,450 575,115 17,045 48,816 2012 810,275 191,550 332,685 32,015 564,371 14,193 46,631 2013 850,645 191,550 328,140 19,190 878,564 18,460 15,285 43,671 2014 950,405 191,550 282,235 38,070 17,500 870,919 28,055 8,916 41,320 2015 1,060,870 191,550 250,030 43,820 26,610 8,835 862,869 15,725 13,498 44,910 2016 1,073,760 191,550 236,685 66,860 36,050 853,609 12,765 14,822 42,784
Tax-Exempt TaxableGeneral General Tax-Exempt Total Percentage
Fiscal Obligation Obligation Certificates Tax Revenue Capital Primary of Personal PerYear Bonds Bonds of Obligation Notes Bonds Leases Government Income 1 Capita 1
2007 -$ -$ -$ -$ 251,370$ 2,678$ 1,828,811$ 7.01% 1,394$ 2008 940 8,492 2,805 395,695 14,946 2,106,238 7.62% 1,585 2009 905 17,723 2,827 360,380 24,664 2,194,233 7.63% 1,637 2010 1,435 16,992 2,225 34,500 344,525 25,615 2,299,200 8.14% 1,742 2011 1,401 16,163 2,125 406,300 21,140 2,372,030 8.35% 1,788 2012 1,337 14,969 2,007 379,665 21,312 2,411,010 8.30% 1,773 2013 1,286 13,658 1,894 361,550 16,105 2,739,998 8.91% 1,981 2014 1,329 12,093 1,670 342,885 16,471 2,803,418 8.88% 1,990 2015 2,542 11,098 331 488,880 15,580 3,037,148 9.26% 2,114 2016 2,579 10,102 7,604 471,480 33,598 3,054,248 8.75% 2,078
CITY OF SAN ANTONIO, TEXAS
Governmental Activities
Business-Type Activities
Note: Details regarding the City's outstanding debt can be found in the Notes to the Financial Statements.
1 See Demographic and Economic Statistics for personal income and population data. These ratios are calculated using personal income and population for the prior calendar year.
- 299 -
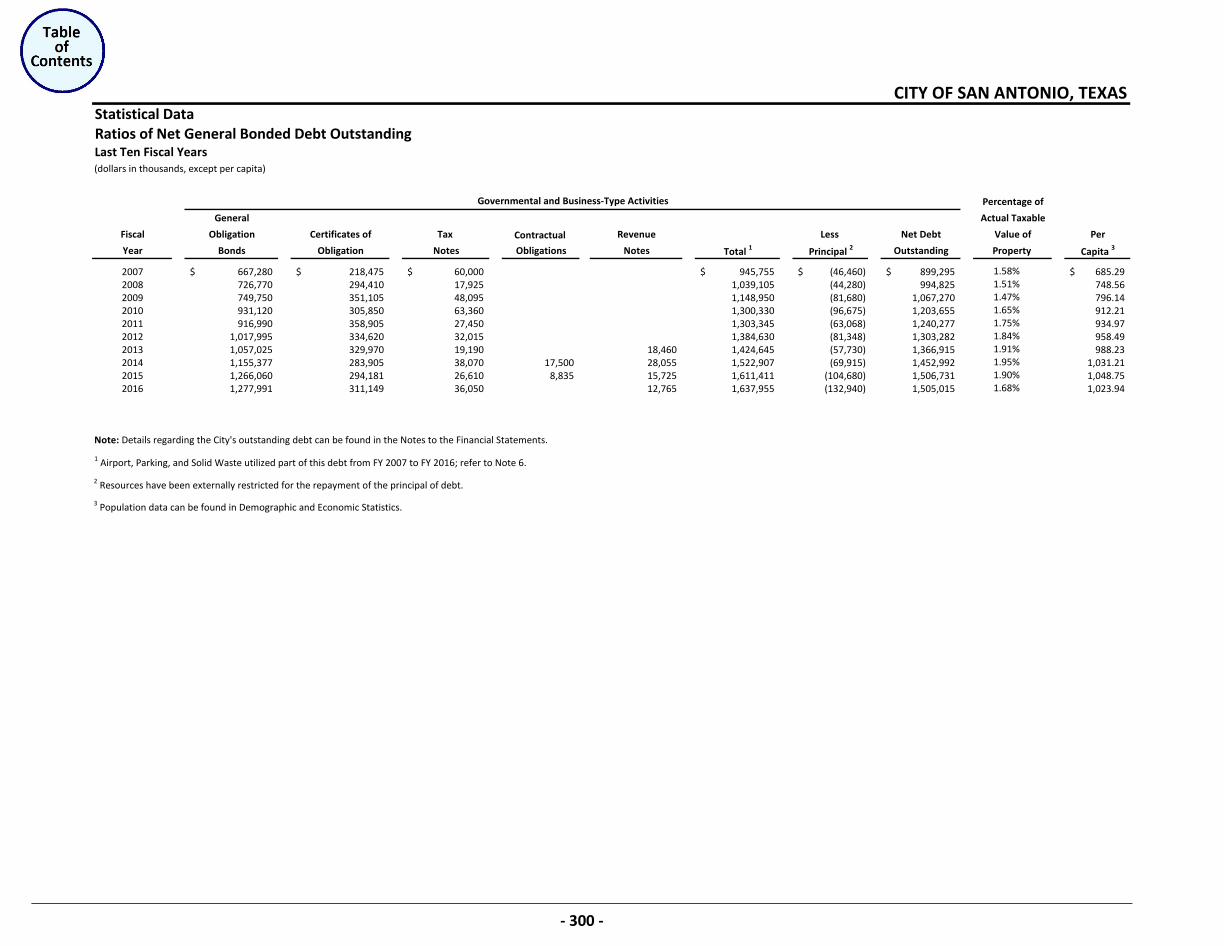
Statistical DataRatios of Net General Bonded Debt OutstandingLast Ten Fiscal Years(dollars in thousands, except per capita)
Percentage of
General Actual Taxable
Fiscal Obligation Certificates of Tax Contractual Revenue Less Net Debt Value of Per
Year Bonds Obligation Notes Obligations Notes Total 1 Principal 2 Outstanding Property Capita 3
2007 667,280$ 218,475$ 60,000$ 945,755$ (46,460)$ 899,295$ 685.29$ 2008 726,770 294,410 17,925 1,039,105 (44,280) 994,825 748.562009 749,750 351,105 48,095 1,148,950 (81,680) 1,067,270 796.142010 931,120 305,850 63,360 1,300,330 (96,675) 1,203,655 912.212011 916,990 358,905 27,450 1,303,345 (63,068) 1,240,277 934.972012 1,017,995 334,620 32,015 1,384,630 (81,348) 1,303,282 958.492013 1,057,025 329,970 19,190 18,460 1,424,645 (57,730) 1,366,915 988.232014 1,155,377 283,905 38,070 17,500 28,055 1,522,907 (69,915) 1,452,992 1,031.212015 1,266,060 294,181 26,610 8,835 15,725 1,611,411 (104,680) 1,506,731 1,048.752016 1,277,991 311,149 36,050 12,765 1,637,955 (132,940) 1,505,015 1,023.94
1 Airport, Parking, and Solid Waste utilized part of this debt from FY 2007 to FY 2016; refer to Note 6.
2 Resources have been externally restricted for the repayment of the principal of debt.
3 Population data can be found in Demographic and Economic Statistics.
Note: Details regarding the City's outstanding debt can be found in the Notes to the Financial Statements.
1.95%
CITY OF SAN ANTONIO, TEXAS
Governmental and Business-Type Activities
1.47%1.65%1.75%1.84%1.91%
1.58%1.51%
1.90%1.68%
- 300 -
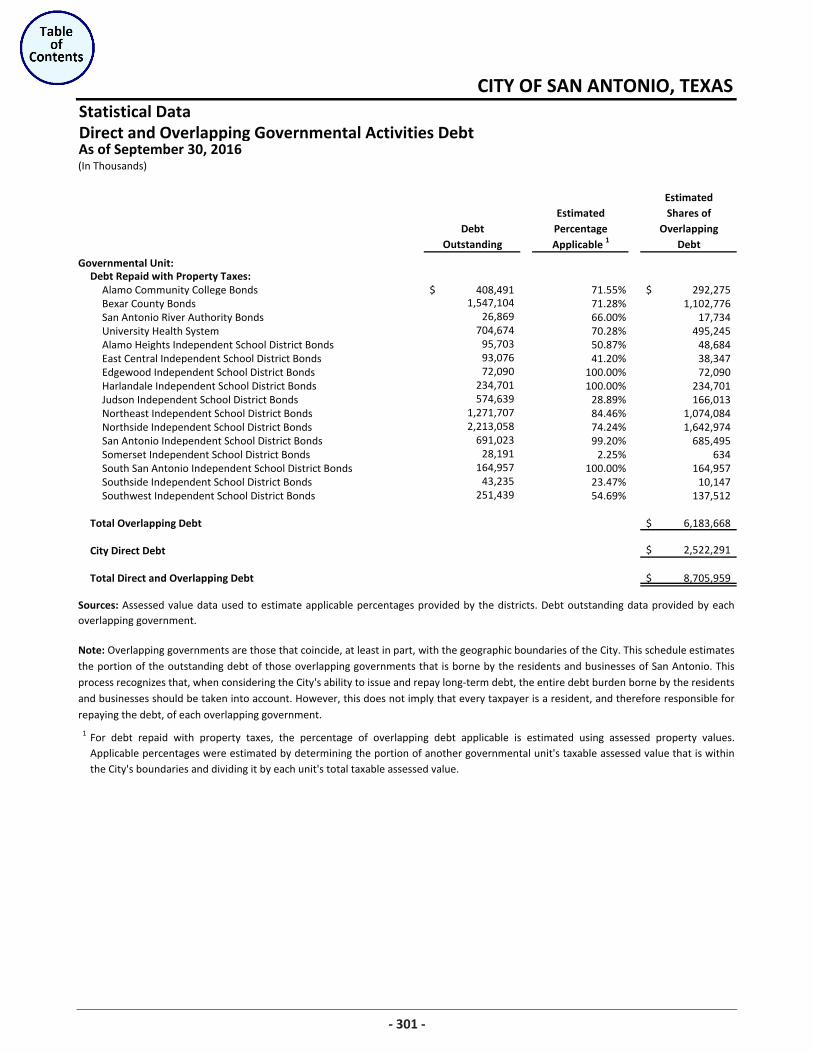
Statistical DataDirect and Overlapping Governmental Activities Debt
(In Thousands)
EstimatedEstimated Shares of
Debt Percentage OverlappingOutstanding Applicable 1 Debt
Governmental Unit:Debt Repaid with Property Taxes:
Alamo Community College Bonds 408,491$ 71.55% 292,275$ Bexar County Bonds 1,547,104 71.28% 1,102,776 San Antonio River Authority Bonds 26,869 66.00% 17,734 University Health System 704,674 70.28% 495,245 Alamo Heights Independent School District Bonds 95,703 50.87% 48,684 East Central Independent School District Bonds 93,076 41.20% 38,347 Edgewood Independent School District Bonds 72,090 100.00% 72,090 Harlandale Independent School District Bonds 234,701 100.00% 234,701 Judson Independent School District Bonds 574,639 28.89% 166,013 Northeast Independent School District Bonds 1,271,707 84.46% 1,074,084 Northside Independent School District Bonds 2,213,058 74.24% 1,642,974 San Antonio Independent School District Bonds 691,023 99.20% 685,495 Somerset Independent School District Bonds 28,191 2.25% 634 South San Antonio Independent School District Bonds 164,957 100.00% 164,957 Southside Independent School District Bonds 43,235 23.47% 10,147 Southwest Independent School District Bonds 251,439 54.69% 137,512
Total Overlapping Debt 6,183,668$
City Direct Debt 2,522,291$
Total Direct and Overlapping Debt 8,705,959$
1
Note: Overlapping governments are those that coincide, at least in part, with the geographic boundaries of the City. This schedule estimatesthe portion of the outstanding debt of those overlapping governments that is borne by the residents and businesses of San Antonio. Thisprocess recognizes that, when considering the City's ability to issue and repay long-term debt, the entire debt burden borne by the residentsand businesses should be taken into account. However, this does not imply that every taxpayer is a resident, and therefore responsible forrepaying the debt, of each overlapping government.
For debt repaid with property taxes, the percentage of overlapping debt applicable is estimated using assessed property values.Applicable percentages were estimated by determining the portion of another governmental unit's taxable assessed value that is withinthe City's boundaries and dividing it by each unit's total taxable assessed value.
CITY OF SAN ANTONIO, TEXAS
As of September 30, 2016
Sources: Assessed value data used to estimate applicable percentages provided by the districts. Debt outstanding data provided by eachoverlapping government.
301
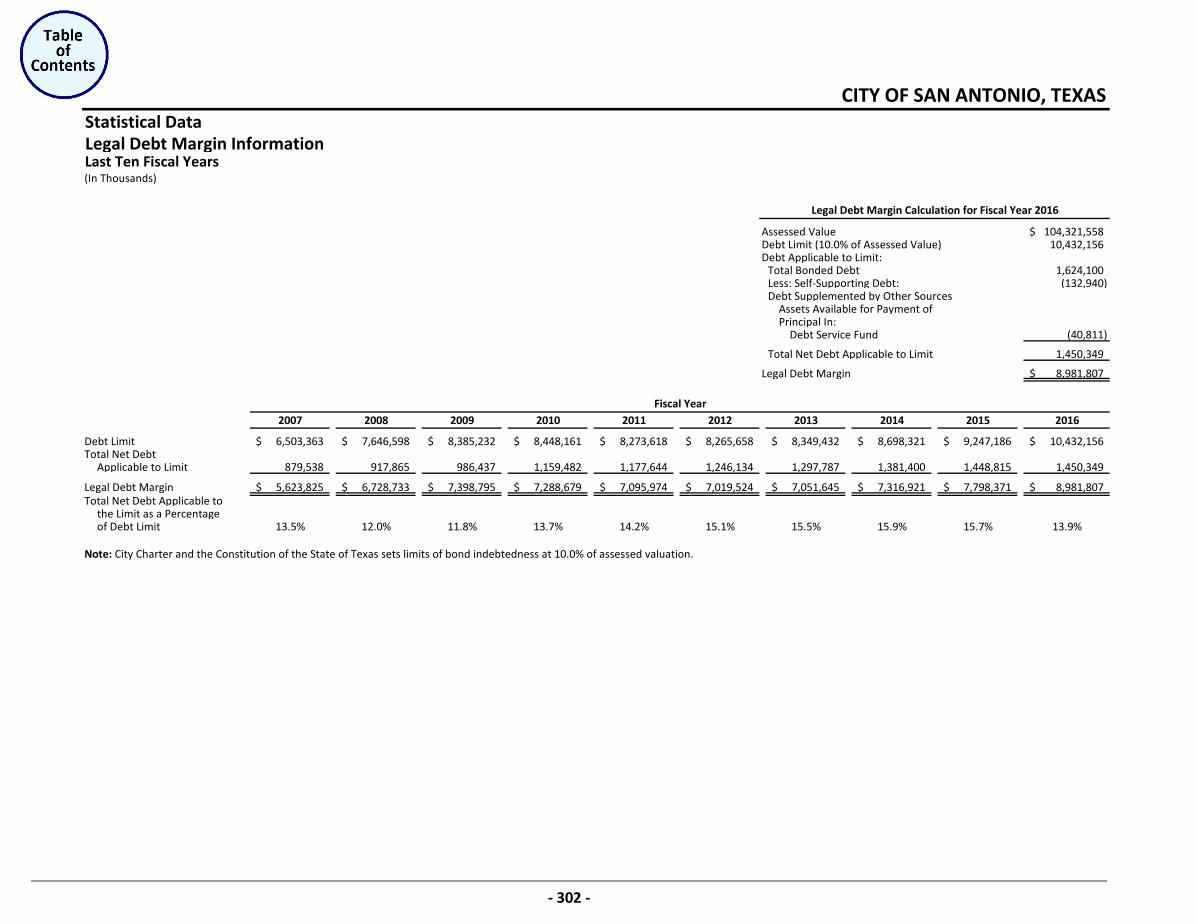
Statistical DataLegal Debt Margin InformationLast Ten Fiscal Years(In Thousands)
Assessed Value 104,321,558$ Debt Limit (10.0% of Assessed Value) 10,432,156 Debt Applicable to Limit:
Total Bonded Debt 1,624,100 Less: Self-Supporting Debt: (132,940) Debt Supplemented by Other Sources
Assets Available for Payment of Principal In:
Debt Service Fund (40,811)
Total Net Debt Applicable to Limit 1,450,349
Legal Debt Margin 8,981,807$
2007 2008 2009 2010 2011 2012 2013 2014 2015 2016
Debt Limit 6,503,363$ 7,646,598$ 8,385,232$ 8,448,161$ 8,273,618$ 8,265,658$ 8,349,432$ 8,698,321$ 9,247,186$ 10,432,156$ Total Net Debt
Applicable to Limit 879,538 917,865 986,437 1,159,482 1,177,644 1,246,134 1,297,787 1,381,400 1,448,815 1,450,349
Legal Debt Margin 5,623,825$ 6,728,733$ 7,398,795$ 7,288,679$ 7,095,974$ 7,019,524$ 7,051,645$ 7,316,921$ 7,798,371$ 8,981,807$ Total Net Debt Applicable to
the Limit as a Percentageof Debt Limit 13.5% 12.0% 11.8% 13.7% 14.2% 15.1% 15.5% 15.9% 15.7% 13.9%
CITY OF SAN ANTONIO, TEXAS
Legal Debt Margin Calculation for Fiscal Year 2016
Fiscal Year
Note: City Charter and the Constitution of the State of Texas sets limits of bond indebtedness at 10.0% of assessed valuation.
- 302 -
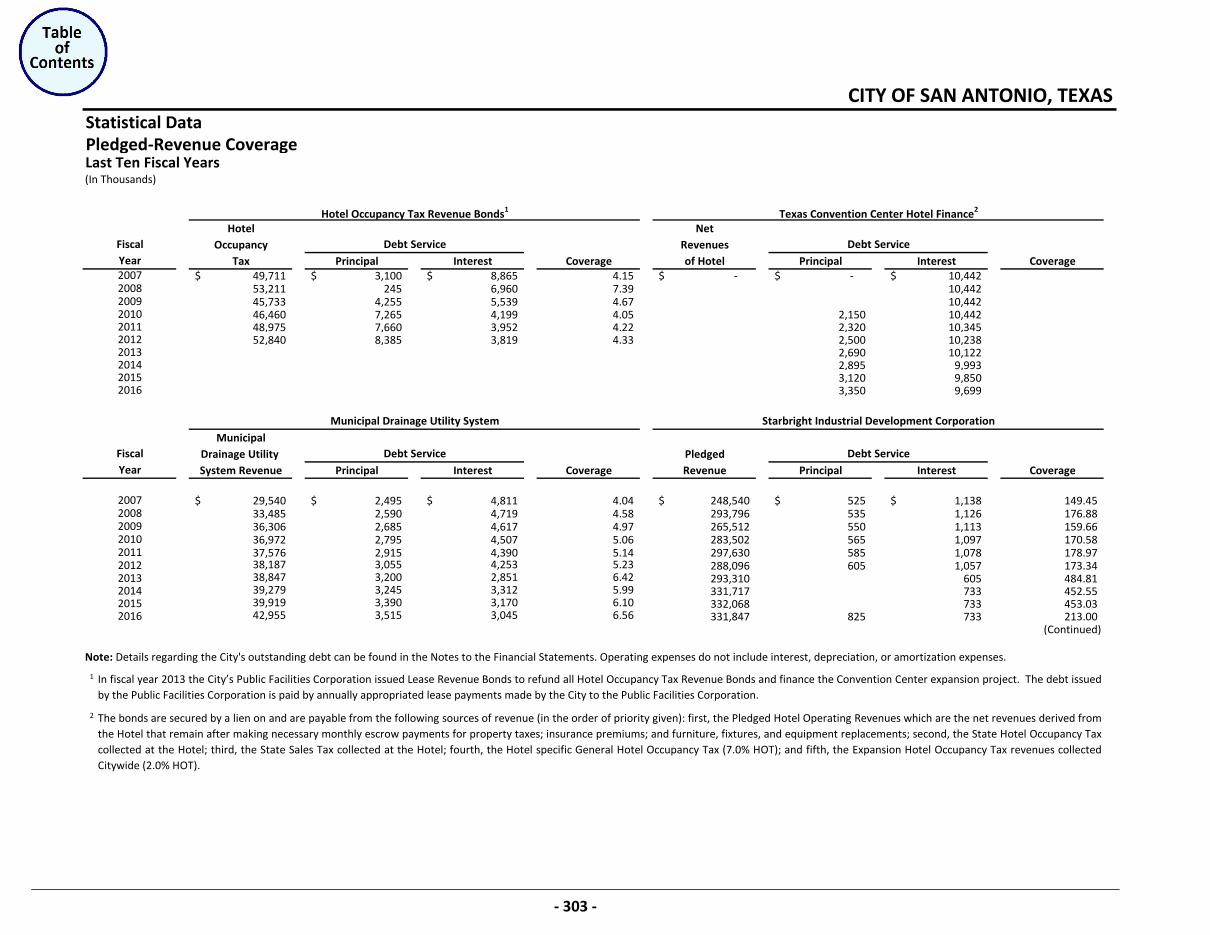
Statistical DataPledged-Revenue CoverageLast Ten Fiscal Years(In Thousands)
Hotel NetOccupancy Revenues
Tax Principal Interest Coverage of Hotel Principal Interest Coverage49,711$ 3,100$ 8,865$ 4.15 -$ -$ 10,442$ 53,211 245 6,960 7.39 10,442 45,733 4,255 5,539 4.67 10,442 46,460 7,265 4,199 4.05 2,150 10,442 48,975 7,660 3,952 4.22 2,320 10,345 52,840 8,385 3,819 4.33 2,500 10,238
2,690 10,122 2,895 9,993 3,120 9,850 3,350 9,699
MunicipalDrainage Utility PledgedSystem Revenue Principal Interest Coverage Revenue Principal Interest Coverage
29,540$ 2,495$ 4,811$ 4.04 248,540$ 525$ 1,138$ 149.45 33,485 2,590 4,719 4.58 293,796 535 1,126 176.88 36,306 2,685 4,617 4.97 265,512 550 1,113 159.66 36,972 2,795 4,507 5.06 283,502 565 1,097 170.58 37,576 2,915 4,390 5.14 297,630 585 1,078 178.97 38,187 3,055 4,253 5.23 288,096 605 1,057 173.34 38,847 3,200 2,851 6.42 293,310 605 484.81 39,279 3,245 3,312 5.99 331,717 733 452.55 39,919 3,390 3,170 6.10 332,068 733 453.03 42,955 3,515 3,045 6.56 331,847 825 733 213.00
(Continued)
1
2
2015
2015
2008
The bonds are secured by a lien on and are payable from the following sources of revenue (in the order of priority given): first, the Pledged Hotel Operating Revenues which are the net revenues derived fromthe Hotel that remain after making necessary monthly escrow payments for property taxes; insurance premiums; and furniture, fixtures, and equipment replacements; second, the State Hotel Occupancy Taxcollected at the Hotel; third, the State Sales Tax collected at the Hotel; fourth, the Hotel specific General Hotel Occupancy Tax (7.0% HOT); and fifth, the Expansion Hotel Occupancy Tax revenues collectedCitywide (2.0% HOT).
20072008200920102011201220132014
CITY OF SAN ANTONIO, TEXAS
Hotel Occupancy Tax Revenue Bonds1 Texas Convention Center Hotel Finance2
Fiscal Debt Service Debt ServiceYear2007
Year
200920102011201220132014
2016
Municipal Drainage Utility System Starbright Industrial Development Corporation
Fiscal Debt Service Debt Service
Note: Details regarding the City's outstanding debt can be found in the Notes to the Financial Statements. Operating expenses do not include interest, depreciation, or amortization expenses.
In fiscal year 2013 the City’s Public Facilities Corporation issued Lease Revenue Bonds to refund all Hotel Occupancy Tax Revenue Bonds and finance the Convention Center expansion project. The debt issuedby the Public Facilities Corporation is paid by annually appropriated lease payments made by the City to the Public Facilities Corporation.
2016
- 303 -
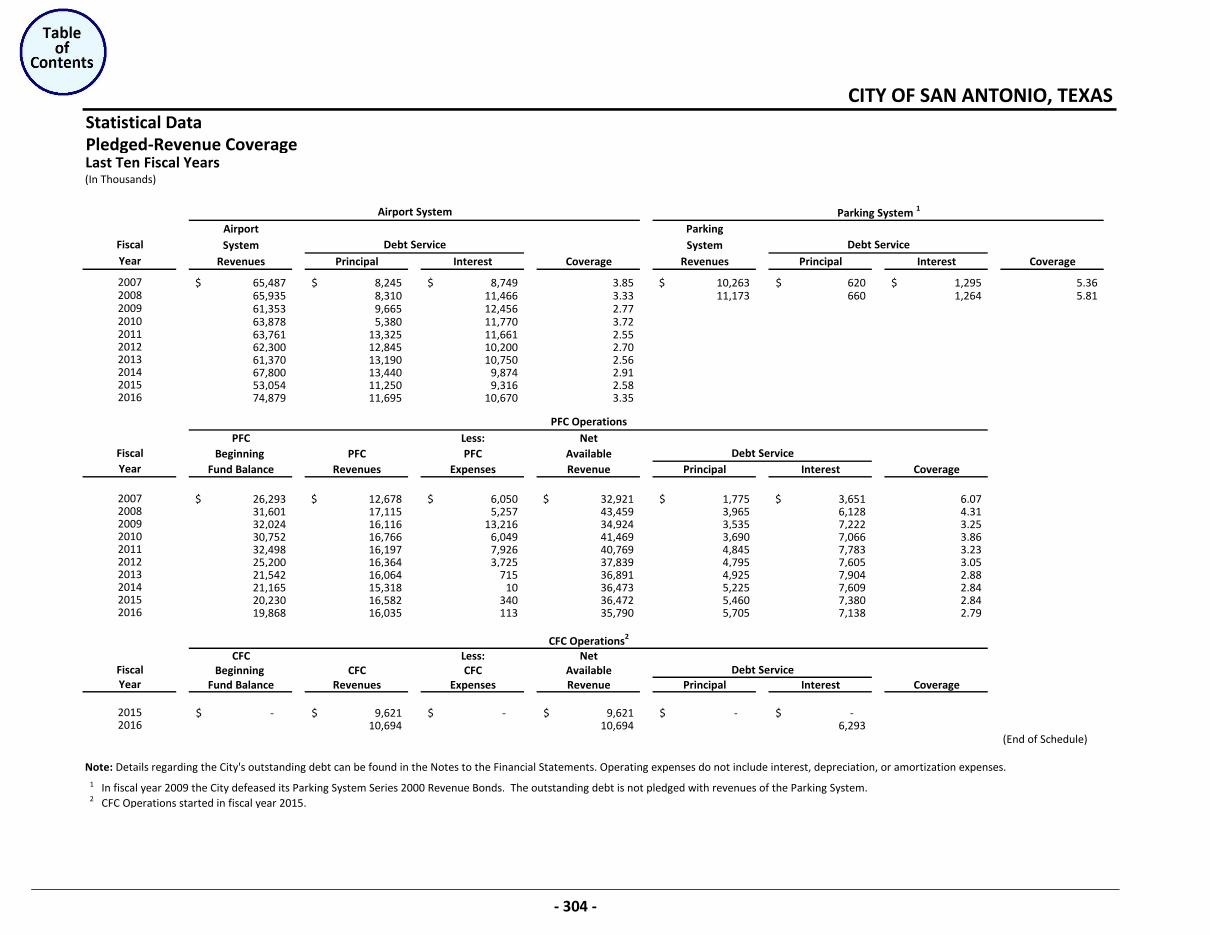
Statistical DataPledged-Revenue CoverageLast Ten Fiscal Years(In Thousands)
Airport ParkingSystem System
Revenues Principal Interest Coverage Revenues Principal Interest Coverage
65,487$ 8,245$ 8,749$ 3.85 10,263$ 620$ 1,295$ 5.36 65,935 8,310 11,466 3.33 11,173 660 1,264 5.81 61,353 9,665 12,456 2.77 63,878 5,380 11,770 3.72 63,761 13,325 11,661 2.55 62,300 12,845 10,200 2.70 61,370 13,190 10,750 2.56 67,800 13,440 9,874 2.91 53,054 11,250 9,316 2.58 74,879 11,695 10,670 3.35
PFC Less: NetBeginning PFC PFC Available
Fund Balance Revenues Expenses Revenue Principal Interest Coverage
26,293$ 12,678$ 6,050$ 32,921$ 1,775$ 3,651$ 6.0731,601 17,115 5,257 43,459 3,965 6,128 4.3132,024 16,116 13,216 34,924 3,535 7,222 3.2530,752 16,766 6,049 41,469 3,690 7,066 3.8632,498 16,197 7,926 40,769 4,845 7,783 3.2325,200 16,364 3,725 37,839 4,795 7,605 3.0521,542 16,064 715 36,891 4,925 7,904 2.8821,165 15,318 10 36,473 5,225 7,609 2.8420,230 16,582 340 36,472 5,460 7,380 2.8419,868 16,035 113 35,790 5,705 7,138 2.79
CFC Less: NetBeginning CFC CFC Available
Fund Balance Revenues Expenses Revenue Principal Interest Coverage
-$ 9,621$ -$ 9,621$ -$ -$ 10,694 10,694 6,293
(End of Schedule)
1 In fiscal year 2009 the City defeased its Parking System Series 2000 Revenue Bonds. The outstanding debt is not pledged with revenues of the Parking System.2 CFC Operations started in fiscal year 2015.
2015
2015
CITY OF SAN ANTONIO, TEXAS
Airport System Parking System 1
Fiscal Debt Service Debt Service
2014
Year
2007200820092010201120122013
2010
PFC Operations
Fiscal Debt ServiceYear
200720082009
2016
2016
2016
2011201220132014
Note: Details regarding the City's outstanding debt can be found in the Notes to the Financial Statements. Operating expenses do not include interest, depreciation, or amortization expenses.
CFC Operations2
Fiscal Debt ServiceYear
2015
- 304 -
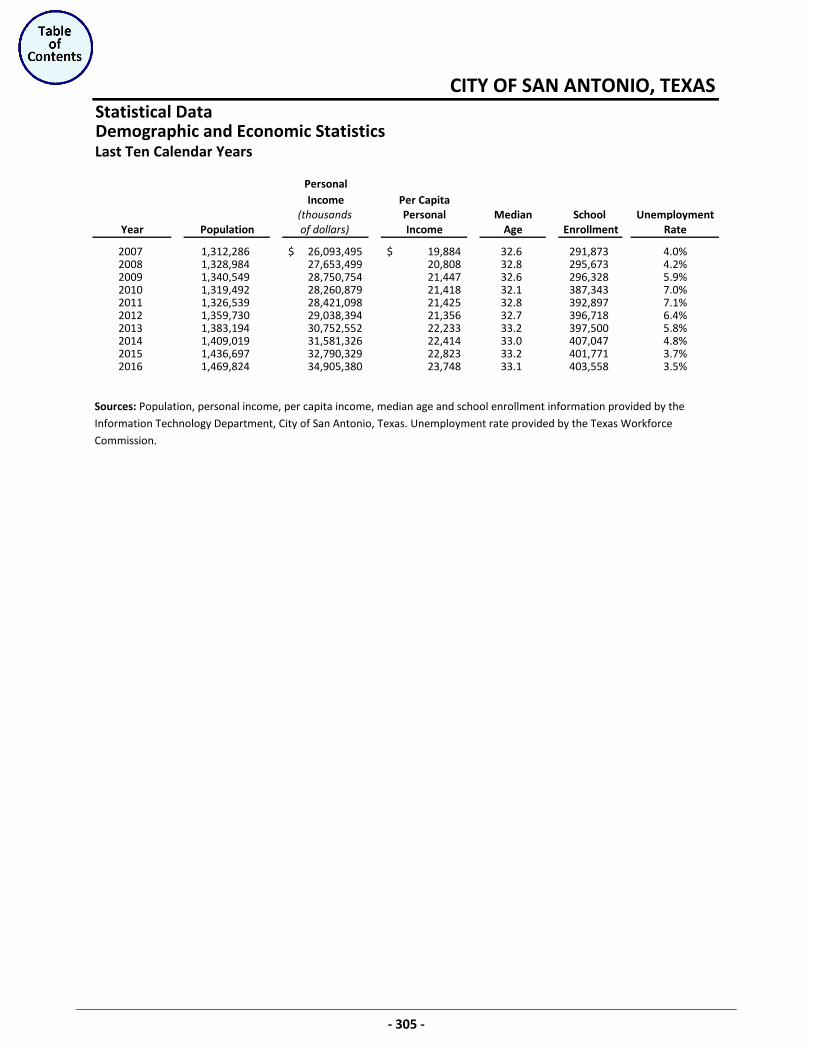
Statistical DataDemographic and Economic StatisticsLast Ten Calendar Years
PersonalIncome Per Capita
(thousands Personal Median School UnemploymentYear Population of dollars) Income Age Enrollment Rate
2007 1,312,286 26,093,495$ 19,884$ 32.6 291,873 4.0%2008 1,328,984 27,653,499 20,808 32.8 295,673 4.2%2009 1,340,549 28,750,754 21,447 32.6 296,328 5.9%2010 1,319,492 28,260,879 21,418 32.1 387,343 7.0%2011 1,326,539 28,421,098 21,425 32.8 392,897 7.1%2012 1,359,730 29,038,394 21,356 32.7 396,718 6.4%2013 1,383,194 30,752,552 22,233 33.2 397,500 5.8%2014 1,409,019 31,581,326 22,414 33.0 407,047 4.8%2015 1,436,697 32,790,329 22,823 33.2 401,771 3.7%2016 1,469,824 34,905,380 23,748 33.1 403,558 3.5%
CITY OF SAN ANTONIO, TEXAS
Sources: Population, personal income, per capita income, median age and school enrollment information provided by the Information Technology Department, City of San Antonio, Texas. Unemployment rate provided by the Texas Workforce Commission.
‐ 305 ‐
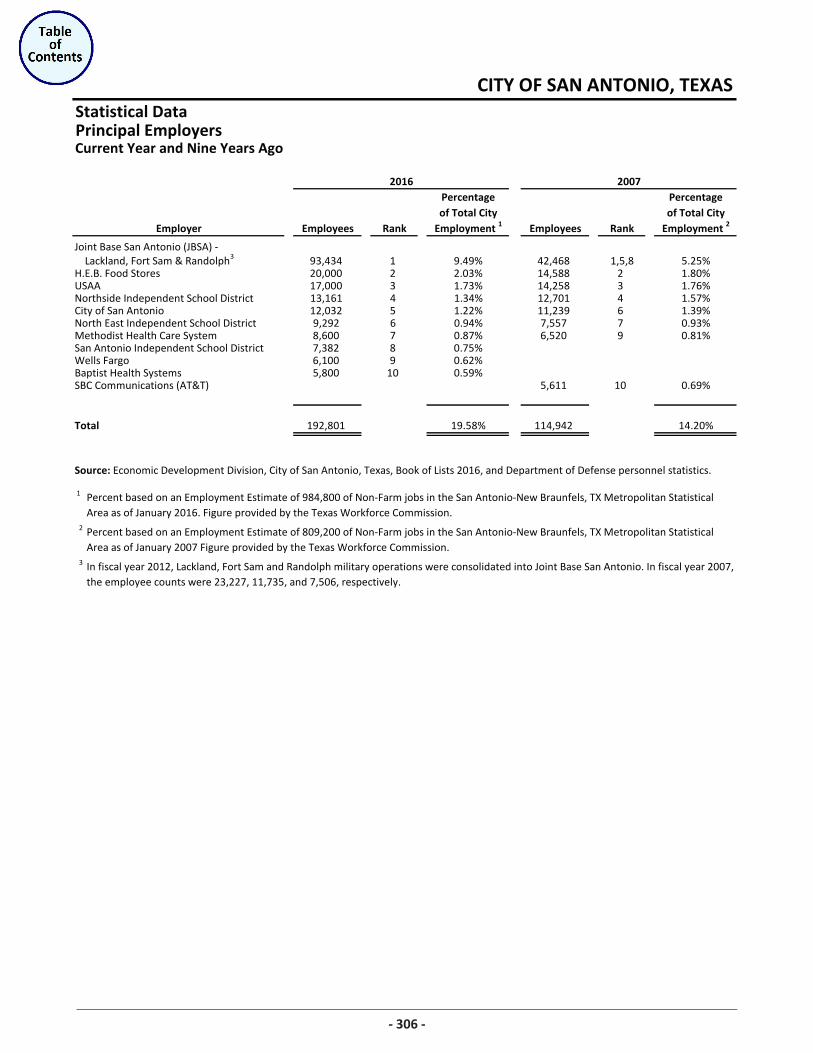
Statistical DataPrincipal EmployersCurrent Year and Nine Years Ago
Percentage Percentageof Total City of Total City
Employees Rank Employment 1 Employees Rank Employment 2
93,434 1 9.49% 42,468 1,5,8 5.25%H.E.B. Food Stores 20,000 2 2.03% 14,588 2 1.80%USAA 17,000 3 1.73% 14,258 3 1.76%Northside Independent School District 13,161 4 1.34% 12,701 4 1.57%City of San Antonio 12,032 5 1.22% 11,239 6 1.39%North East Independent School District 9,292 6 0.94% 7,557 7 0.93%Methodist Health Care System 8,600 7 0.87% 6,520 9 0.81%San Antonio Independent School District 7,382 8 0.75%Wells Fargo 6,100 9 0.62%Baptist Health Systems 5,800 10 0.59%SBC Communications (AT&T) 5,611 10 0.69%
Total 192,801 19.58% 114,942 14.20%
1
2
3 In fiscal year 2012, Lackland, Fort Sam and Randolph military operations were consolidated into Joint Base San Antonio. In fiscal year 2007, the employee counts were 23,227, 11,735, and 7,506, respectively.
CITY OF SAN ANTONIO, TEXAS
Source: Economic Development Division, City of San Antonio, Texas, Book of Lists 2016, and Department of Defense personnel statistics.
Percent based on an Employment Estimate of 984,800 of Non-Farm jobs in the San Antonio-New Braunfels, TX Metropolitan Statistical Area as of January 2016. Figure provided by the Texas Workforce Commission.
Percent based on an Employment Estimate of 809,200 of Non-Farm jobs in the San Antonio-New Braunfels, TX Metropolitan Statistical Area as of January 2007 Figure provided by the Texas Workforce Commission.
2016 2007
Employer
Joint Base San Antonio (JBSA) - Lackland, Fort Sam & Randolph3
306
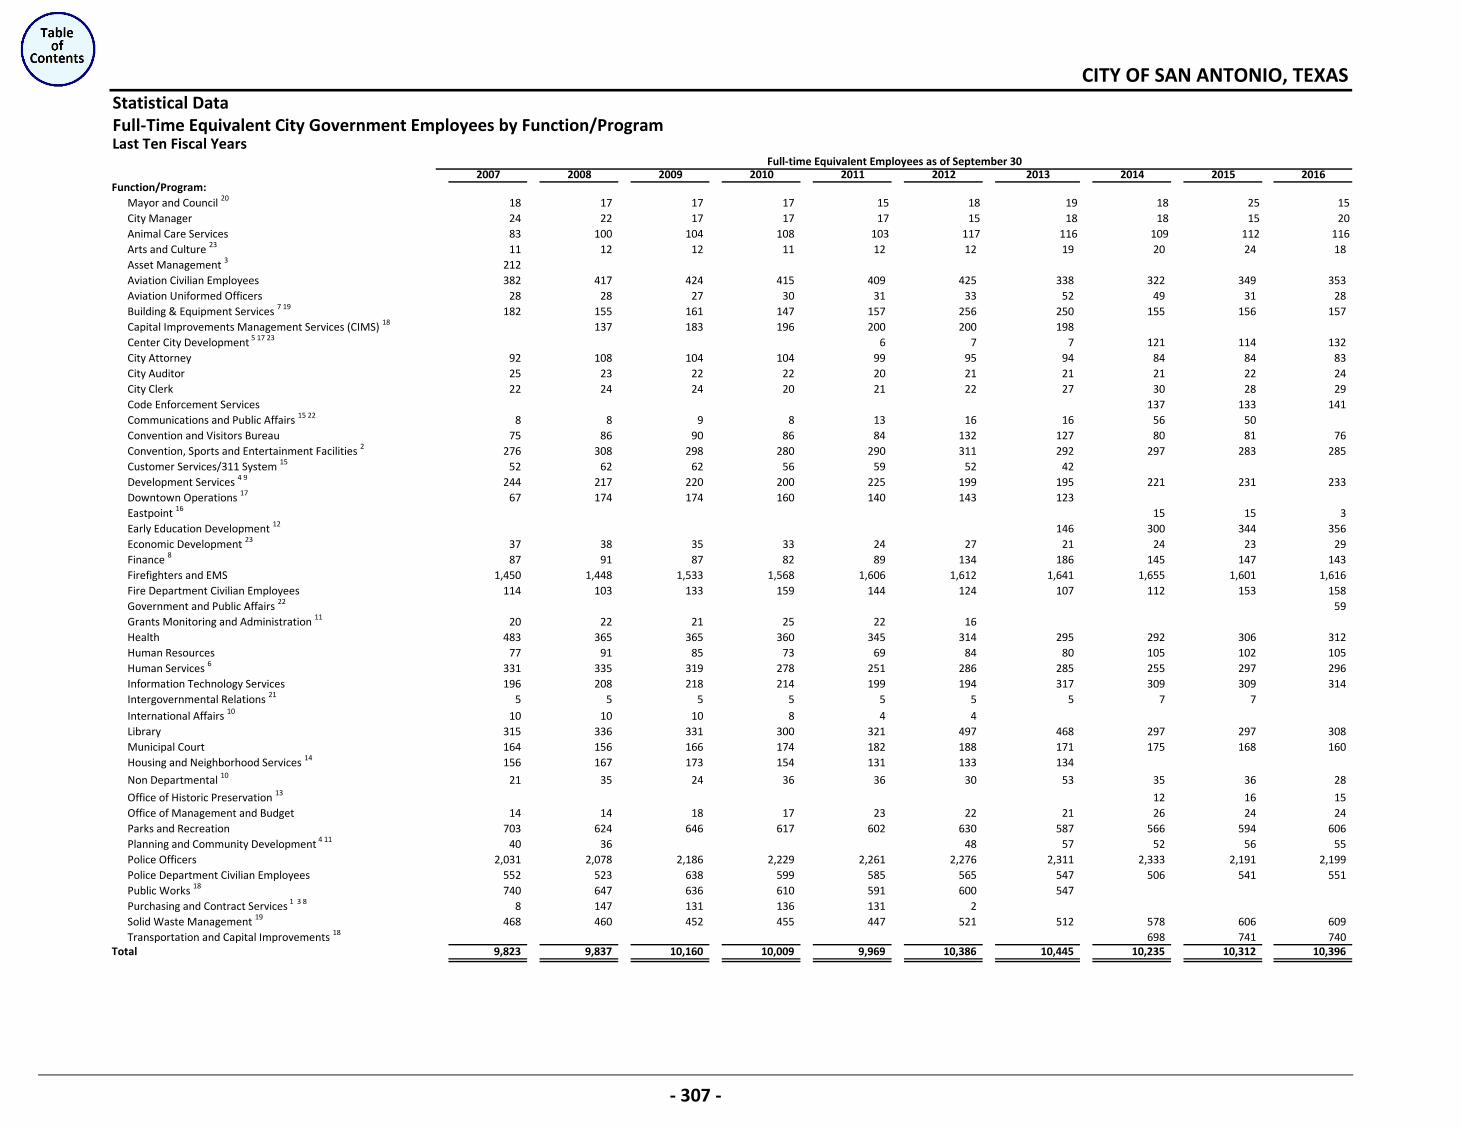
Statistical DataFull-Time Equivalent City Government Employees by Function/Program
2007 2008 2009 2010 2011 2012 2013 2014 2015 2016Function/Program:
Mayor and Council 20 18 17 17 17 15 18 19 18 25 15City Manager 24 22 17 17 17 15 18 18 15 20Animal Care Services 83 100 104 108 103 117 116 109 112 116Arts and Culture 23 11 12 12 11 12 12 19 20 24 18 Asset Management 3 212Aviation Civilian Employees 382 417 424 415 409 425 338 322 349 353 Aviation Uniformed Officers 28 28 27 30 31 33 52 49 31 28 Building & Equipment Services 7 19 182 155 161 147 157 256 250 155 156 157 Capital Improvements Management Services (CIMS) 18 137 183 196 200 200 198 Center City Development 5 17 23 6 7 7 121 114 132 City Attorney 92 108 104 104 99 95 94 84 84 83 City Auditor 25 23 22 22 20 21 21 21 22 24 City Clerk 22 24 24 20 21 22 27 30 28 29 Code Enforcement Services 137 133 141 Communications and Public Affairs 15 22 8 8 9 8 13 16 16 56 50 Convention and Visitors Bureau 75 86 90 86 84 132 127 80 81 76 Convention, Sports and Entertainment Facilities 2 276 308 298 280 290 311 292 297 283 285 Customer Services/311 System 15 52 62 62 56 59 52 42 Development Services 4 9 244 217 220 200 225 199 195 221 231 233 Downtown Operations 17 67 174 174 160 140 143 123 Eastpoint 16 15 15 3 Early Education Development 12 146 300 344 356 Economic Development 23 37 38 35 33 24 27 21 24 23 29 Finance 8 87 91 87 82 89 134 186 145 147 143 Firefighters and EMS 1,450 1,448 1,533 1,568 1,606 1,612 1,641 1,655 1,601 1,616 Fire Department Civilian Employees 114 103 133 159 144 124 107 112 153 158 Government and Public Affairs 22 59 Grants Monitoring and Administration 11 20 22 21 25 22 16 Health 483 365 365 360 345 314 295 292 306 312 Human Resources 77 91 85 73 69 84 80 105 102 105 Human Services 6 331 335 319 278 251 286 285 255 297 296 Information Technology Services 196 208 218 214 199 194 317 309 309 314 Intergovernmental Relations 21 5 5 5 5 5 5 5 7 7 International Affairs 10 10 10 10 8 4 4 Library 315 336 331 300 321 497 468 297 297 308 Municipal Court 164 156 166 174 182 188 171 175 168 160 Housing and Neighborhood Services 14 156 167 173 154 131 133 134
Non Departmental 10 21 35 24 36 36 30 53 35 36 28
Office of Historic Preservation 13 12 16 15 Office of Management and Budget 14 14 18 17 23 22 21 26 24 24 Parks and Recreation 703 624 646 617 602 630 587 566 594 606 Planning and Community Development 4 11 40 36 48 57 52 56 55 Police Officers 2,031 2,078 2,186 2,229 2,261 2,276 2,311 2,333 2,191 2,199 Police Department Civilian Employees 552 523 638 599 585 565 547 506 541 551 Public Works 18 740 647 636 610 591 600 547 Purchasing and Contract Services 1 3 8 8 147 131 136 131 2 Solid Waste Management 19 468 460 452 455 447 521 512 578 606 609 Transportation and Capital Improvements 18 698 741 740
Total 9,823 9,837 10,160 10,009 9,969 10,386 10,445 10,235 10,312 10,396
Last Ten Fiscal YearsFull-time Equivalent Employees as of September 30
CITY OF SAN ANTONIO, TEXAS
- 307 -
Statistical DataFull-Time Equivalent City Government Employees by Function/Program
Source: City of San Antonio, Texas. Figures account for actual employment positions filled.1 In fiscal year 2007, Administrative Services was divided into two new departments, forming the Fleet Maintenance and Operations and Purchasing and Contract Services Departments. 2 In fiscal year 2007, Alamodome and Convention Facilities were combined to form the Convention, Sports and Entertainment Facilities Department. 3 In fiscal year 2008, the Asset Management Department was moved into Purchasing and Contract Services. 4 In fiscal year 2009, Planning and Community Development was combined with Development Services and then split back up in fiscal year 2012. 5 In fiscal year 2011, Center City Development was separated from Economic and Employment Development. 6 In fiscal year 2011, Community Initiatives was renamed Human Services. 7 In fiscal year 2012, Fleet Maintenance Operations was renamed Building & Equipment Services. 8 In fiscal year 2012, Purchasing and Contract Services was combined with Finance. 9 In fiscal year 2012, Code Compliance was combined with Development Services.
10 In fiscal year 2013, International Affairs was combined with Non Departmental. 11 In fiscal year 2013, Grants Monitoring and Administration was combined with Planning and Community Development. 12 In fiscal year 2013, Early Education Development department was established. 13 In fiscal year 2014, Office of Historic Preservation split from Development Services. 14 In fiscal year 2014, Housing and Neighborhood services combined with Planning and Community Development. 15 In fiscal year 2014, Customer Services/311 Systems combined with Communications and Public Affairs. 16 In fiscal year 2014, Eastpoint department was established. 17 In fiscal year 2014, Downtown Operations was combined with Center City Development. 18 In fiscal year 2014, Public Works and CIMS combined to form Transportation and Capital Improvements. 19 In fiscal year 2015, some Fleet employees were reclassed from Building Equipment Services into Solid Waste Management. 20 In fiscal year 2015, the Mayor and members of the City Council are considered City employees. 21 In fiscal year 2016, the International Relations Office was combined with the Economic Development Department. 22 In fiscal year 2016, the Communications and Public Affairs Department was combined into the Government and Public Affairs Department. 23 In fiscal year 2016, some employees were reclassed from Creative and Cultural Development into Center City Development.
CITY OF SAN ANTONIO, TEXAS
Last Ten Fiscal Years
- 307 -
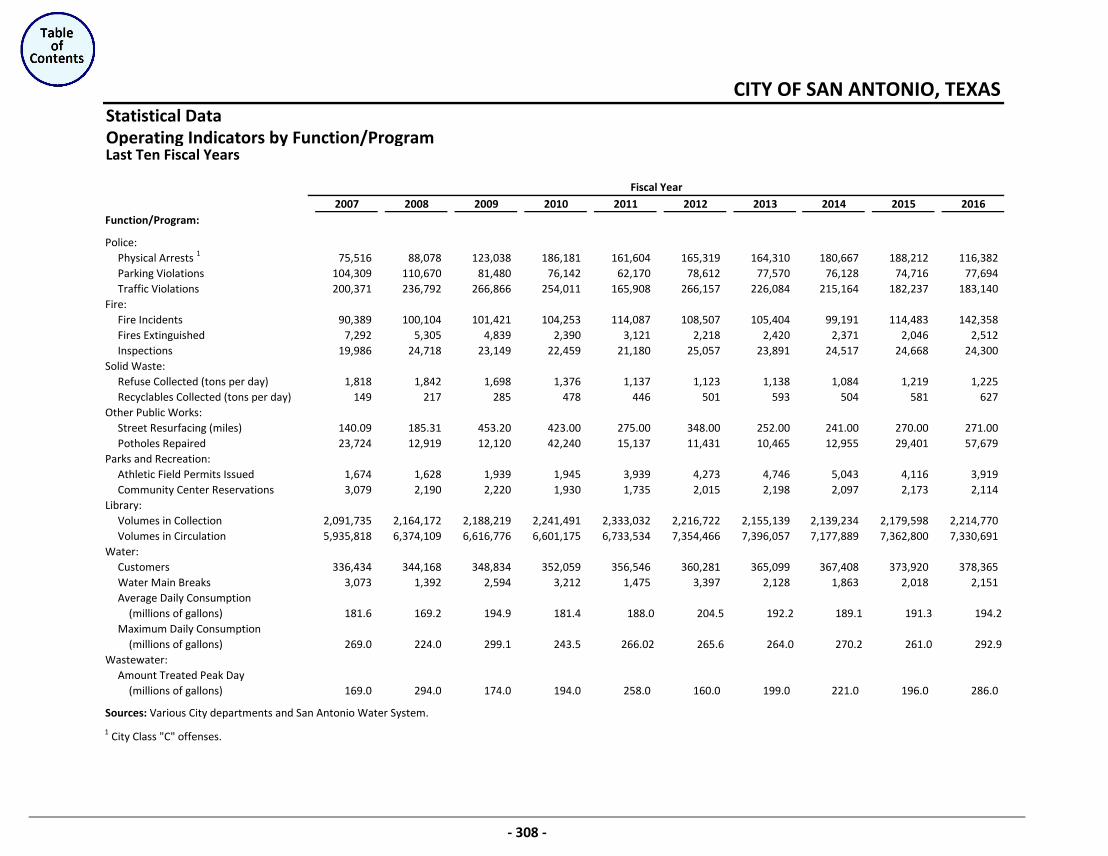
Statistical DataOperating Indicators by Function/Program
2007 2008 2009 2010 2011 2012 2013 2014 2015 2016Function/Program:
Police:Physical Arrests 1 75,516 88,078 123,038 186,181 161,604 165,319 164,310 180,667 188,212 116,382Parking Violations 104,309 110,670 81,480 76,142 62,170 78,612 77,570 76,128 74,716 77,694Traffic Violations 200,371 236,792 266,866 254,011 165,908 266,157 226,084 215,164 182,237 183,140
Fire:Fire Incidents 90,389 100,104 101,421 104,253 114,087 108,507 105,404 99,191 114,483 142,358Fires Extinguished 7,292 5,305 4,839 2,390 3,121 2,218 2,420 2,371 2,046 2,512Inspections 19,986 24,718 23,149 22,459 21,180 25,057 23,891 24,517 24,668 24,300
Solid Waste:Refuse Collected (tons per day) 1,818 1,842 1,698 1,376 1,137 1,123 1,138 1,084 1,219 1,225Recyclables Collected (tons per day) 149 217 285 478 446 501 593 504 581 627
Other Public Works:Street Resurfacing (miles) 140.09 185.31 453.20 423.00 275.00 348.00 252.00 241.00 270.00 271.00Potholes Repaired 23,724 12,919 12,120 42,240 15,137 11,431 10,465 12,955 29,401 57,679
Parks and Recreation:Athletic Field Permits Issued 1,674 1,628 1,939 1,945 3,939 4,273 4,746 5,043 4,116 3,919Community Center Reservations 3,079 2,190 2,220 1,930 1,735 2,015 2,198 2,097 2,173 2,114
Library:Volumes in Collection 2,091,735 2,164,172 2,188,219 2,241,491 2,333,032 2,216,722 2,155,139 2,139,234 2,179,598 2,214,770Volumes in Circulation 5,935,818 6,374,109 6,616,776 6,601,175 6,733,534 7,354,466 7,396,057 7,177,889 7,362,800 7,330,691
Water: Customers 336,434 344,168 348,834 352,059 356,546 360,281 365,099 367,408 373,920 378,365Water Main Breaks 3,073 1,392 2,594 3,212 1,475 3,397 2,128 1,863 2,018 2,151Average Daily Consumption
(millions of gallons) 181.6 169.2 194.9 181.4 188.0 204.5 192.2 189.1 191.3 194.2Maximum Daily Consumption
(millions of gallons) 269.0 224.0 299.1 243.5 266.02 265.6 264.0 270.2 261.0 292.9Wastewater:
Amount Treated Peak Day(millions of gallons) 169.0 294.0 174.0 194.0 258.0 160.0 199.0 221.0 196.0 286.0
Sources: Various City departments and San Antonio Water System.
1 City Class "C" offenses.
Last Ten Fiscal Years
Fiscal Year
CITY OF SAN ANTONIO, TEXAS
- 308 -
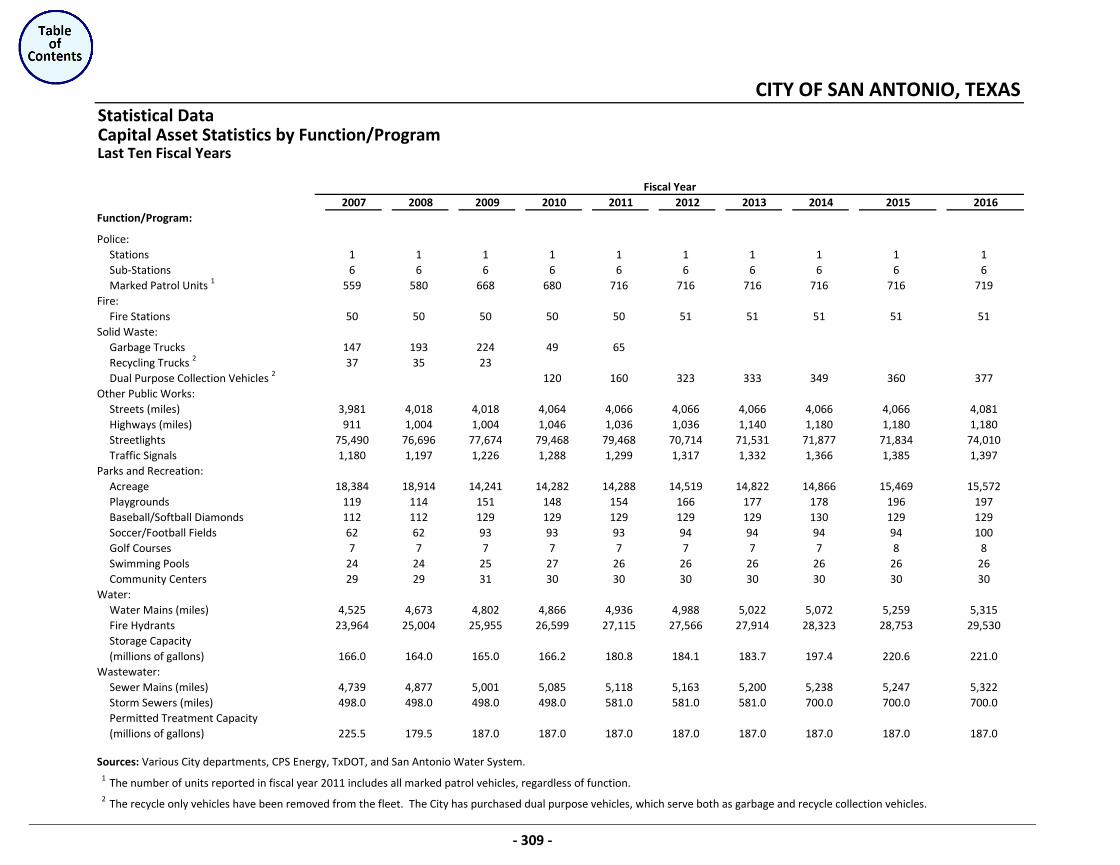
Statistical DataCapital Asset Statistics by Function/Program
2007 2008 2009 2010 2011 2012 2013 2014 2015 2016Function/Program:
Police:Stations 1 1 1 1 1 1 1 1 1 1Sub-Stations 6 6 6 6 6 6 6 6 6 6Marked Patrol Units 1 559 580 668 680 716 716 716 716 716 719
Fire:Fire Stations 50 50 50 50 50 51 51 51 51 51
Solid Waste:Garbage Trucks 147 193 224 49 65Recycling Trucks 2 37 35 23Dual Purpose Collection Vehicles 2 120 160 323 333 349 360 377
Other Public Works:Streets (miles) 3,981 4,018 4,018 4,064 4,066 4,066 4,066 4,066 4,066 4,081Highways (miles) 911 1,004 1,004 1,046 1,036 1,036 1,140 1,180 1,180 1,180Streetlights 75,490 76,696 77,674 79,468 79,468 70,714 71,531 71,877 71,834 74,010Traffic Signals 1,180 1,197 1,226 1,288 1,299 1,317 1,332 1,366 1,385 1,397
Parks and Recreation:Acreage 18,384 18,914 14,241 14,282 14,288 14,519 14,822 14,866 15,469 15,572Playgrounds 119 114 151 148 154 166 177 178 196 197Baseball/Softball Diamonds 112 112 129 129 129 129 129 130 129 129Soccer/Football Fields 62 62 93 93 93 94 94 94 94 100Golf Courses 7 7 7 7 7 7 7 7 8 8Swimming Pools 24 24 25 27 26 26 26 26 26 26Community Centers 29 29 31 30 30 30 30 30 30 30
Water: Water Mains (miles) 4,525 4,673 4,802 4,866 4,936 4,988 5,022 5,072 5,259 5,315Fire Hydrants 23,964 25,004 25,955 26,599 27,115 27,566 27,914 28,323 28,753 29,530Storage Capacity(millions of gallons) 166.0 164.0 165.0 166.2 180.8 184.1 183.7 197.4 220.6 221.0
Wastewater:Sewer Mains (miles) 4,739 4,877 5,001 5,085 5,118 5,163 5,200 5,238 5,247 5,322Storm Sewers (miles) 498.0 498.0 498.0 498.0 581.0 581.0 581.0 700.0 700.0 700.0Permitted Treatment Capacity(millions of gallons) 225.5 179.5 187.0 187.0 187.0 187.0 187.0 187.0 187.0 187.0
Sources: Various City departments, CPS Energy, TxDOT, and San Antonio Water System.1
2
CITY OF SAN ANTONIO, TEXAS
Fiscal Year
The recycle only vehicles have been removed from the fleet. The City has purchased dual purpose vehicles, which serve both as garbage and recycle collection vehicles.
The number of units reported in fiscal year 2011 includes all marked patrol vehicles, regardless of function.
Last Ten Fiscal Years
- 309 -

FEDERAL SECTION
FEDERALSECTION
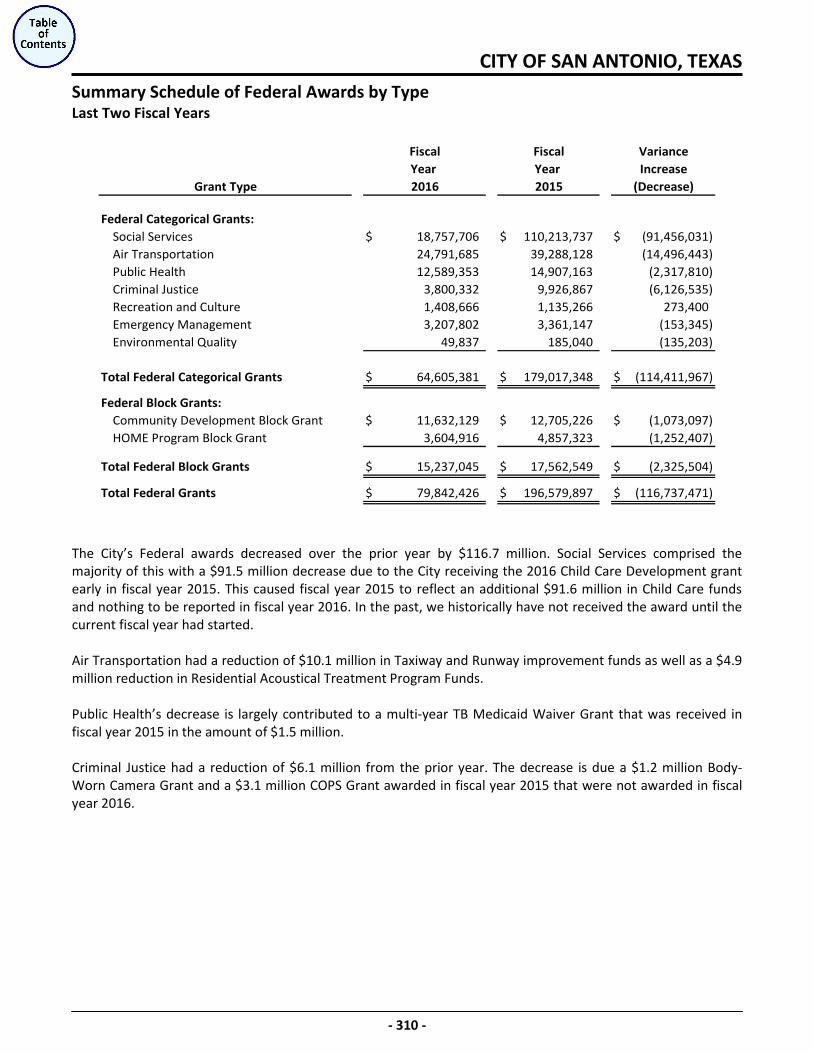
CITY OF SAN ANTONIO, TEXAS
- 310 -
Summary Schedule of Federal Awards by Type Last Two Fiscal Years
Federal Categorical Grants:Social Services $ 18,757,706 $ 110,213,737 $ (91,456,031)Air Transportation 24,791,685 39,288,128 (14,496,443)Public Health 12,589,353 14,907,163 (2,317,810)Criminal Justice 3,800,332 9,926,867 (6,126,535)Recreation and Culture 1,408,666 1,135,266 273,400Emergency Management 3,207,802 3,361,147 (153,345)Environmental Quality 49,837 185,040 (135,203)
Total Federal Categorical Grants $ 64,605,381 $ 179,017,348 $ (114,411,967)
Federal Block Grants:Community Development Block Grant $ 11,632,129 $ 12,705,226 $ (1,073,097)HOME Program Block Grant 3,604,916 4,857,323 (1,252,407)
Total Federal Block Grants $ 15,237,045 $ 17,562,549 $ (2,325,504)
Total Federal Grants $ 79,842,426 $ 196,579,897 $ (116,737,471)
Year 2015
VarianceIncrease
(Decrease)Grant Type
FiscalYear 2016
Fiscal
The City’s Federal awards decreased over the prior year by $116.7 million. Social Services comprised the majority of this with a $91.5 million decrease due to the City receiving the 2016 Child Care Development grant early in fiscal year 2015. This caused fiscal year 2015 to reflect an additional $91.6 million in Child Care funds and nothing to be reported in fiscal year 2016. In the past, we historically have not received the award until the current fiscal year had started. Air Transportation had a reduction of $10.1 million in Taxiway and Runway improvement funds as well as a $4.9 million reduction in Residential Acoustical Treatment Program Funds. Public Health’s decrease is largely contributed to a multi-year TB Medicaid Waiver Grant that was received in fiscal year 2015 in the amount of $1.5 million. Criminal Justice had a reduction of $6.1 million from the prior year. The decrease is due a $1.2 million Body-Worn Camera Grant and a $3.1 million COPS Grant awarded in fiscal year 2015 that were not awarded in fiscal year 2016.

Schedule of Expenditures of
Federal Awards by Grantor, Federal
Program and Grant Number
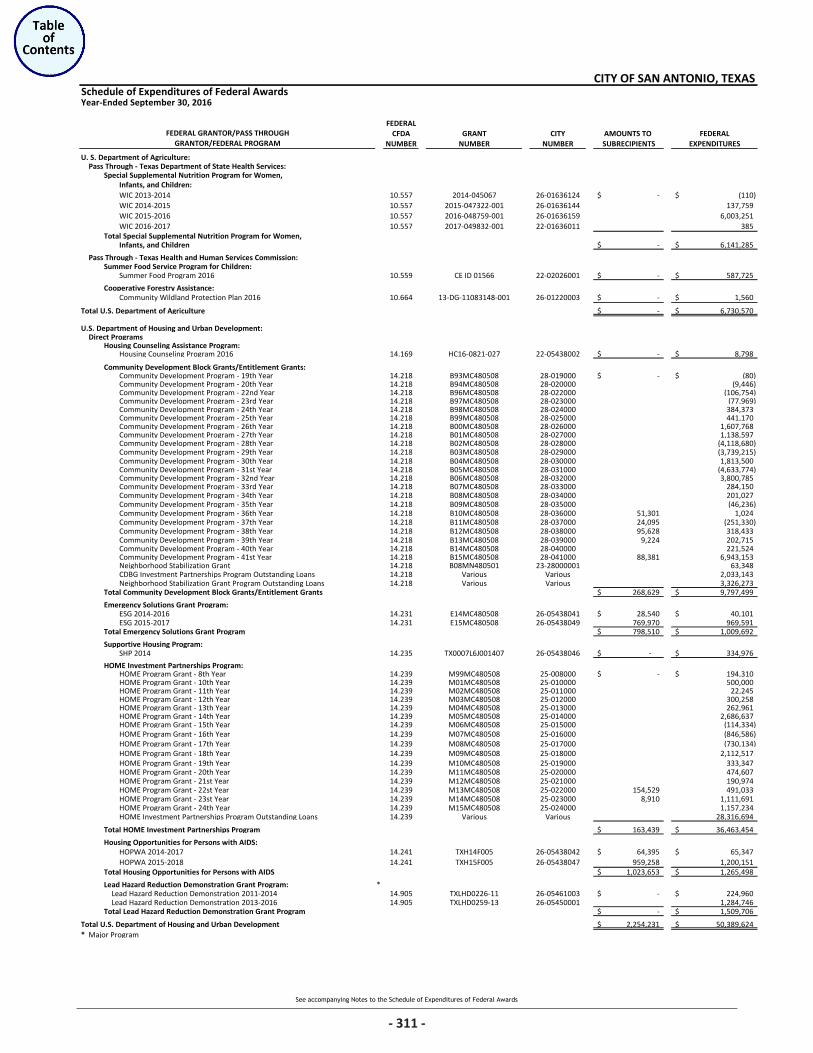
See accompanying Notes to the Schedule of Expenditures of Federal Awards
Schedule of Expenditures of Federal Awards
FEDERALCFDA GRANT CITY AMOUNTS TO FEDERAL
NUMBER NUMBER NUMBER SUBRECIPIENTS EXPENDITURES
U. S. Department of Agriculture:Pass Through - Texas Department of State Health Services:
Special Supplemental Nutrition Program for Women, Infants, and Children:WIC 2013-2014 10.557 2014-045067 26-01636124 -$ (110)$ WIC 2014-2015 10.557 2015-047322-001 26-01636144 137,759 WIC 2015-2016 10.557 2016-048759-001 26-01636159 6,003,251 WIC 2016-2017 10.557 2017-049832-001 22-01636011 385
Total Special Supplemental Nutrition Program for Women, Infants, and Children -$ 6,141,285$
Pass Through - Texas Health and Human Services Commission:Summer Food Service Program for Children:
Summer Food Program 2016 10.559 CE ID 01566 22-02026001 -$ 587,725$
Cooperative Forestry Assistance:Community Wildland Protection Plan 2016 10.664 13-DG-11083148-001 26-01220003 -$ 1,560$
Total U.S. Department of Agriculture -$ 6,730,570$
U.S. Department of Housing and Urban Development:Direct Programs
Housing Counseling Assistance Program:Housing Counseling Program 2016 14.169 HC16-0821-027 22-05438002 -$ 8,798$
Community Development Block Grants/Entitlement Grants:Community Development Program - 19th Year 14.218 B93MC480508 28-019000 -$ (80)$ Community Development Program - 20th Year 14.218 B94MC480508 28-020000 (9,446) Community Development Program - 22nd Year 14.218 B96MC480508 28-022000 (106,754) Community Development Program - 23rd Year 14.218 B97MC480508 28-023000 (77,969) Community Development Program - 24th Year 14.218 B98MC480508 28-024000 384,373 Community Development Program - 25th Year 14.218 B99MC480508 28-025000 441,170 Community Development Program - 26th Year 14.218 B00MC480508 28-026000 1,607,768 Community Development Program - 27th Year 14.218 B01MC480508 28-027000 1,138,597 Community Development Program - 28th Year 14.218 B02MC480508 28-028000 (4,118,680) Community Development Program - 29th Year 14.218 B03MC480508 28-029000 (3,739,215) Community Development Program - 30th Year 14.218 B04MC480508 28-030000 1,813,500 Community Development Program - 31st Year 14.218 B05MC480508 28-031000 (4,633,774) Community Development Program - 32nd Year 14.218 B06MC480508 28-032000 3,800,785 Community Development Program - 33rd Year 14.218 B07MC480508 28-033000 284,150 Community Development Program - 34th Year 14.218 B08MC480508 28-034000 201,027 Community Development Program - 35th Year 14.218 B09MC480508 28-035000 (46,236) Community Development Program - 36th Year 14.218 B10MC480508 28-036000 51,301 1,024 Community Development Program - 37th Year 14.218 B11MC480508 28-037000 24,095 (251,330) Community Development Program - 38th Year 14.218 B12MC480508 28-038000 95,628 318,433 Community Development Program - 39th Year 14.218 B13MC480508 28-039000 9,224 202,715 Community Development Program - 40th Year 14.218 B14MC480508 28-040000 221,524 Community Development Program - 41st Year 14.218 B15MC480508 28-041000 88,381 6,943,153 Neighborhood Stabilization Grant 14.218 B08MN480501 23-28000001 63,348 CDBG Investment Partnerships Program Outstanding Loans 14.218 Various Various 2,033,143 Neighborhood Stabilization Grant Program Outstanding Loans 14.218 Various Various 3,326,273
Total Community Development Block Grants/Entitlement Grants 268,629$ 9,797,499$
Emergency Solutions Grant Program:ESG 2014-2016 14.231 E14MC480508 26-05438041 28,540$ 40,101$ ESG 2015-2017 14.231 E15MC480508 26-05438049 769,970 969,591
Total Emergency Solutions Grant Program 798,510$ 1,009,692$
Supportive Housing Program:SHP 2014 14.235 TX0007L6J001407 26-05438046 -$ 334,976$
HOME Investment Partnerships Program:HOME Program Grant - 8th Year 14.239 M99MC480508 25-008000 -$ 194,310$ HOME Program Grant - 10th Year 14.239 M01MC480508 25-010000 500,000 HOME Program Grant - 11th Year 14.239 M02MC480508 25-011000 22,245 HOME Program Grant - 12th Year 14.239 M03MC480508 25-012000 300,258 HOME Program Grant - 13th Year 14.239 M04MC480508 25-013000 262,961 HOME Program Grant - 14th Year 14.239 M05MC480508 25-014000 2,686,637 HOME Program Grant - 15th Year 14.239 M06MC480508 25-015000 (114,334) HOME Program Grant - 16th Year 14.239 M07MC480508 25-016000 (846,586) HOME Program Grant - 17th Year 14.239 M08MC480508 25-017000 (730,134) HOME Program Grant - 18th Year 14.239 M09MC480508 25-018000 2,112,517 HOME Program Grant - 19th Year 14.239 M10MC480508 25-019000 333,347 HOME Program Grant - 20th Year 14.239 M11MC480508 25-020000 474,607 HOME Program Grant - 21st Year 14.239 M12MC480508 25-021000 190,974 HOME Program Grant - 22st Year 14.239 M13MC480508 25-022000 154,529 491,033 HOME Program Grant - 23st Year 14.239 M14MC480508 25-023000 8,910 1,111,691 HOME Program Grant - 24th Year 14.239 M15MC480508 25-024000 1,157,234 HOME Investment Partnerships Program Outstanding Loans 14.239 Various Various 28,316,694
Total HOME Investment Partnerships Program 163,439$ 36,463,454$
Housing Opportunities for Persons with AIDS:HOPWA 2014-2017 14.241 TXH14F005 26-05438042 64,395$ 65,347$ HOPWA 2015-2018 14.241 TXH15F005 26-05438047 959,258 1,200,151
Total Housing Opportunities for Persons with AIDS 1,023,653$ 1,265,498$
Lead Hazard Reduction Demonstration Grant Program: *Lead Hazard Reduction Demonstration 2011-2014 14.905 TXLHD0226-11 26-05461003 -$ 224,960$ Lead Hazard Reduction Demonstration 2013-2016 14.905 TXLHD0259-13 26-05450001 1,284,746
Total Lead Hazard Reduction Demonstration Grant Program -$ 1,509,706$
Total U.S. Department of Housing and Urban Development 2,254,231$ 50,389,624$ * Major Program
CITY OF SAN ANTONIO, TEXAS
Year-Ended September 30, 2016
FEDERAL GRANTOR/PASS THROUGHGRANTOR/FEDERAL PROGRAM
311
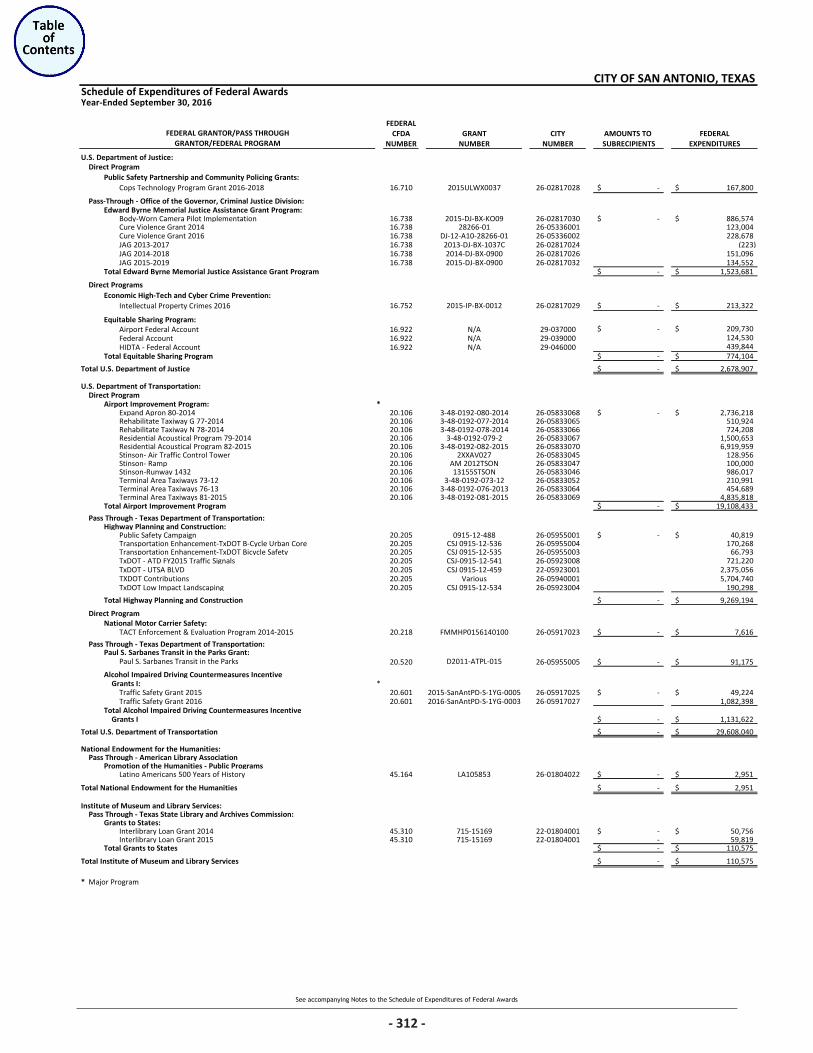
See accompanying Notes to the Schedule of Expenditures of Federal Awards
Schedule of Expenditures of Federal Awards
FEDERALCFDA GRANT CITY AMOUNTS TO FEDERAL
NUMBER NUMBER NUMBER SUBRECIPIENTS EXPENDITURES
CITY OF SAN ANTONIO, TEXAS
Year-Ended September 30, 2016
FEDERAL GRANTOR/PASS THROUGHGRANTOR/FEDERAL PROGRAM
U.S. Department of Justice:Direct Program Public Safety Partnership and Community Policing Grants:
Cops Technology Program Grant 2016-2018 16.710 2015ULWX0037 26-02817028 -$ 167,800$
Pass-Through - Office of the Governor, Criminal Justice Division:Edward Byrne Memorial Justice Assistance Grant Program:
Body-Worn Camera Pilot Implementation 16.738 2015-DJ-BX-KO09 26-02817030 -$ 886,574$ Cure Violence Grant 2014 16.738 28266-01 26-05336001 123,004 Cure Violence Grant 2016 16.738 DJ-12-A10-28266-01 26-05336002 228,678 JAG 2013-2017 16.738 2013-DJ-BX-1037C 26-02817024 (223) JAG 2014-2018 16.738 2014-DJ-BX-0900 26-02817026 151,096 JAG 2015-2019 16.738 2015-DJ-BX-0900 26-02817032 134,552
Total Edward Byrne Memorial Justice Assistance Grant Program -$ 1,523,681$
Direct ProgramsEconomic High-Tech and Cyber Crime Prevention:
Intellectual Property Crimes 2016 16.752 2015-IP-BX-0012 26-02817029 -$ 213,322$
Equitable Sharing Program:Airport Federal Account 16.922 N/A 29-037000 -$ 209,730$ Federal Account 16.922 N/A 29-039000 124,530 HIDTA - Federal Account 16.922 N/A 29-046000 439,844
Total Equitable Sharing Program -$ 774,104$
Total U.S. Department of Justice -$ 2,678,907$
U.S. Department of Transportation:Direct Program
Airport Improvement Program: *Expand Apron 80-2014 20.106 3-48-0192-080-2014 26-05833068 -$ 2,736,218$ Rehabilitate Taxiway G 77-2014 20.106 3-48-0192-077-2014 26-05833065 510,924 Rehabilitate Taxiway N 78-2014 20.106 3-48-0192-078-2014 26-05833066 724,208 Residential Acoustical Program 79-2014 20.106 3-48-0192-079-2 26-05833067 1,500,653 Residential Acoustical Program 82-2015 20.106 3-48-0192-082-2015 26-05833070 6,919,959 Stinson- Air Traffic Control Tower 20.106 2XXAV027 26-05833045 128,956 Stinson- Ramp 20.106 AM 2012TSON 26-05833047 100,000 Stinson-Runway 1432 20.106 13155STSON 26-05833046 986,017 Terminal Area Taxiways 73-12 20.106 3-48-0192-073-12 26-05833052 210,991 Terminal Area Taxiways 76-13 20.106 3-48-0192-076-2013 26-05833064 454,689 Terminal Area Taxiways 81-2015 20.106 3-48-0192-081-2015 26-05833069 4,835,818
Total Airport Improvement Program -$ 19,108,433$
Pass Through - Texas Department of Transportation:Highway Planning and Construction:
Public Safety Campaign 20.205 0915-12-488 26-05955001 -$ 40,819$ Transportation Enhancement-TxDOT B-Cycle Urban Core 20.205 CSJ 0915-12-536 26-05955004 170,268 Transportation Enhancement-TxDOT Bicycle Safety 20.205 CSJ 0915-12-535 26-05955003 66,793 TxDOT - ATD FY2015 Traffic Signals 20.205 CSJ-0915-12-541 26-05923008 721,220 TxDOT - UTSA BLVD 20.205 CSJ 0915-12-459 22-05923001 2,375,056 TXDOT Contributions 20.205 Various 26-05940001 5,704,740 TxDOT Low Impact Landscaping 20.205 CSJ 0915-12-534 26-05923004 190,298
Total Highway Planning and Construction -$ 9,269,194$
Direct Program National Motor Carrier Safety:
TACT Enforcement & Evaluation Program 2014-2015 20.218 FMMHP0156140100 26-05917023 -$ 7,616$
Pass Through - Texas Department of Transportation:Paul S. Sarbanes Transit in the Parks Grant:
Paul S. Sarbanes Transit in the Parks 20.520 D2011-ATPL-015 26-05955005 -$ 91,175$
Alcohol Impaired Driving Countermeasures Incentive Grants I: *
Traffic Safety Grant 2015 20.601 2015-SanAntPD-S-1YG-0005 26-05917025 -$ 49,224$ Traffic Safety Grant 2016 20.601 2016-SanAntPD-S-1YG-0003 26-05917027 1,082,398
Total Alcohol Impaired Driving Countermeasures Incentive Grants I -$ 1,131,622$
Total U.S. Department of Transportation -$ 29,608,040$
National Endowment for the Humanities:Pass Through - American Library Association
Promotion of the Humanities - Public ProgramsLatino Americans 500 Years of History 45.164 LA105853 26-01804022 -$ 2,951$
Total National Endowment for the Humanities -$ 2,951$
Institute of Museum and Library Services:Pass Through - Texas State Library and Archives Commission:
Grants to States:Interlibrary Loan Grant 2014 45.310 715-15169 22-01804001 -$ 50,756$ Interlibrary Loan Grant 2015 45.310 715-15169 22-01804001 - 59,819
Total Grants to States -$ 110,575$
Total Institute of Museum and Library Services -$ 110,575$
* Major Program
312
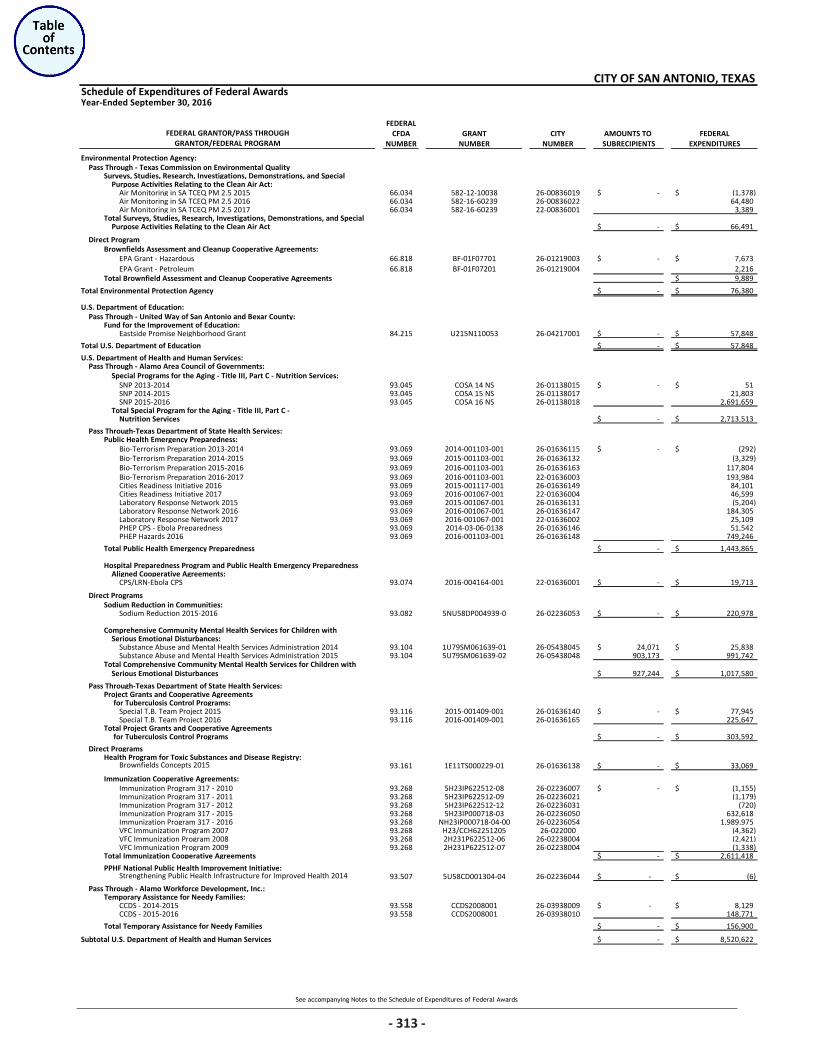
See accompanying Notes to the Schedule of Expenditures of Federal Awards
Schedule of Expenditures of Federal Awards
FEDERALCFDA GRANT CITY AMOUNTS TO FEDERAL
NUMBER NUMBER NUMBER SUBRECIPIENTS EXPENDITURES
CITY OF SAN ANTONIO, TEXAS
Year-Ended September 30, 2016
FEDERAL GRANTOR/PASS THROUGHGRANTOR/FEDERAL PROGRAM
Environmental Protection Agency:Pass Through - Texas Commission on Environmental Quality
Surveys, Studies, Research, Investigations, Demonstrations, and SpecialPurpose Activities Relating to the Clean Air Act:
Air Monitoring in SA TCEQ PM 2.5 2015 66.034 582-12-10038 26-00836019 -$ (1,378)$ Air Monitoring in SA TCEQ PM 2.5 2016 66.034 582-16-60239 26-00836022 64,480 Air Monitoring in SA TCEQ PM 2.5 2017 66.034 582-16-60239 22-00836001 3,389
Total Surveys, Studies, Research, Investigations, Demonstrations, and SpecialPurpose Activities Relating to the Clean Air Act -$ 66,491$
Direct ProgramBrownfields Assessment and Cleanup Cooperative Agreements:
EPA Grant - Hazardous 66.818 BF-01F07701 26-01219003 -$ 7,673$ EPA Grant - Petroleum 66.818 BF-01F07201 26-01219004 2,216
Total Brownfield Assessment and Cleanup Cooperative Agreements 9,889$
Total Environmental Protection Agency -$ 76,380$
U.S. Department of Education:Pass Through - United Way of San Antonio and Bexar County:
Fund for the Improvement of Education:Eastside Promise Neighborhood Grant 84.215 U215N110053 26-04217001 -$ 57,848$
Total U.S. Department of Education -$ 57,848$
U.S. Department of Health and Human Services:Pass Through - Alamo Area Council of Governments:
Special Programs for the Aging - Title III, Part C - Nutrition Services:SNP 2013-2014 93.045 COSA 14 NS 26-01138015 -$ 51$ SNP 2014-2015 93.045 COSA 15 NS 26-01138017 21,803SNP 2015-2016 93.045 COSA 16 NS 26-01138018 2,691,659
Total Special Program for the Aging - Title III, Part C -Nutrition Services -$ 2,713,513$
Pass Through-Texas Department of State Health Services:Public Health Emergency Preparedness:
Bio-Terrorism Preparation 2013-2014 93.069 2014-001103-001 26-01636115 -$ (292)$ Bio-Terrorism Preparation 2014-2015 93.069 2015-001103-001 26-01636132 (3,329) Bio-Terrorism Preparation 2015-2016 93.069 2016-001103-001 26-01636163 117,804 Bio-Terrorism Preparation 2016-2017 93.069 2016-001103-001 22-01636003 193,984 Cities Readiness Initiative 2016 93.069 2015-001117-001 26-01636149 84,101 Cities Readiness Initiative 2017 93.069 2016-001067-001 22-01636004 46,599 Laboratory Response Network 2015 93.069 2015-001067-001 26-01636131 (5,204) Laboratory Response Network 2016 93.069 2016-001067-001 26-01636147 184,305 Laboratory Response Network 2017 93.069 2016-001067-001 22-01636002 25,109 PHEP CPS - Ebola Preparedness 93.069 2014-03-06-0138 26-01636146 51,542 PHEP Hazards 2016 93.069 2016-001103-001 26-01636148 749,246
Total Public Health Emergency Preparedness -$ 1,443,865$
Hospital Preparedness Program and Public Health Emergency PreparednessAligned Cooperative Agreements:
CPS/LRN-Ebola CPS 93.074 2016-004164-001 22-01636001 -$ 19,713$
Direct ProgramsSodium Reduction in Communities:
Sodium Reduction 2015-2016 93.082 5NU58DP004939-0 26-02236053 -$ 220,978$
Comprehensive Community Mental Health Services for Children withSerious Emotional Disturbances:
Substance Abuse and Mental Health Services Administration 2014 93.104 1U79SM061639-01 26-05438045 24,071$ 25,838$ Substance Abuse and Mental Health Services Administration 2015 93.104 5U79SM061639-02 26-05438048 903,173 991,742
Total Comprehensive Community Mental Health Services for Children withSerious Emotional Disturbances 927,244$ 1,017,580$
Pass Through-Texas Department of State Health Services:Project Grants and Cooperative Agreements
for Tuberculosis Control Programs:Special T.B. Team Project 2015 93.116 2015-001409-001 26-01636140 -$ 77,945$ Special T.B. Team Project 2016 93.116 2016-001409-001 26-01636165 225,647
Total Project Grants and Cooperative Agreements for Tuberculosis Control Programs -$ 303,592$
Direct ProgramsHealth Program for Toxic Substances and Disease Registry:
Brownfields Concepts 2015 93.161 1E11TS000229-01 26-01636138 -$ 33,069$
Immunization Cooperative Agreements:Immunization Program 317 - 2010 93.268 5H23IP622512-08 26-02236007 -$ (1,155)$ Immunization Program 317 - 2011 93.268 5H23IP622512-09 26-02236021 (1,179)Immunization Program 317 - 2012 93.268 5H23IP622512-12 26-02236031 (720)Immunization Program 317 - 2015 93.268 5H23IP000718-03 26-02236050 632,618Immunization Program 317 - 2016 93.268 NH23IP000718-04-00 26-02236054 1,989,975 VFC Immunization Program 2007 93.268 H23/CCH62251205 26-022000 (4,362)VFC Immunization Program 2008 93.268 2H231P622512-06 26-02238004 (2,421)VFC Immunization Program 2009 93.268 2H231P622512-07 26-02238004 (1,338)
Total Immunization Cooperative Agreements -$ 2,611,418$
PPHF National Public Health Improvement Initiative:Strengthening Public Health Infrastructure for Improved Health 2014 93.507 5U58CD001304-04 26-02236044 -$ (6)$
Pass Through - Alamo Workforce Development, Inc.:Temporary Assistance for Needy Families:
CCDS - 2014-2015 93.558 CCDS2008001 26-03938009 -$ 8,129$ CCDS - 2015-2016 93.558 CCDS2008001 26-03938010 148,771
Total Temporary Assistance for Needy Families -$ 156,900$
Subtotal U.S. Department of Health and Human Services -$ 8,520,622$
313
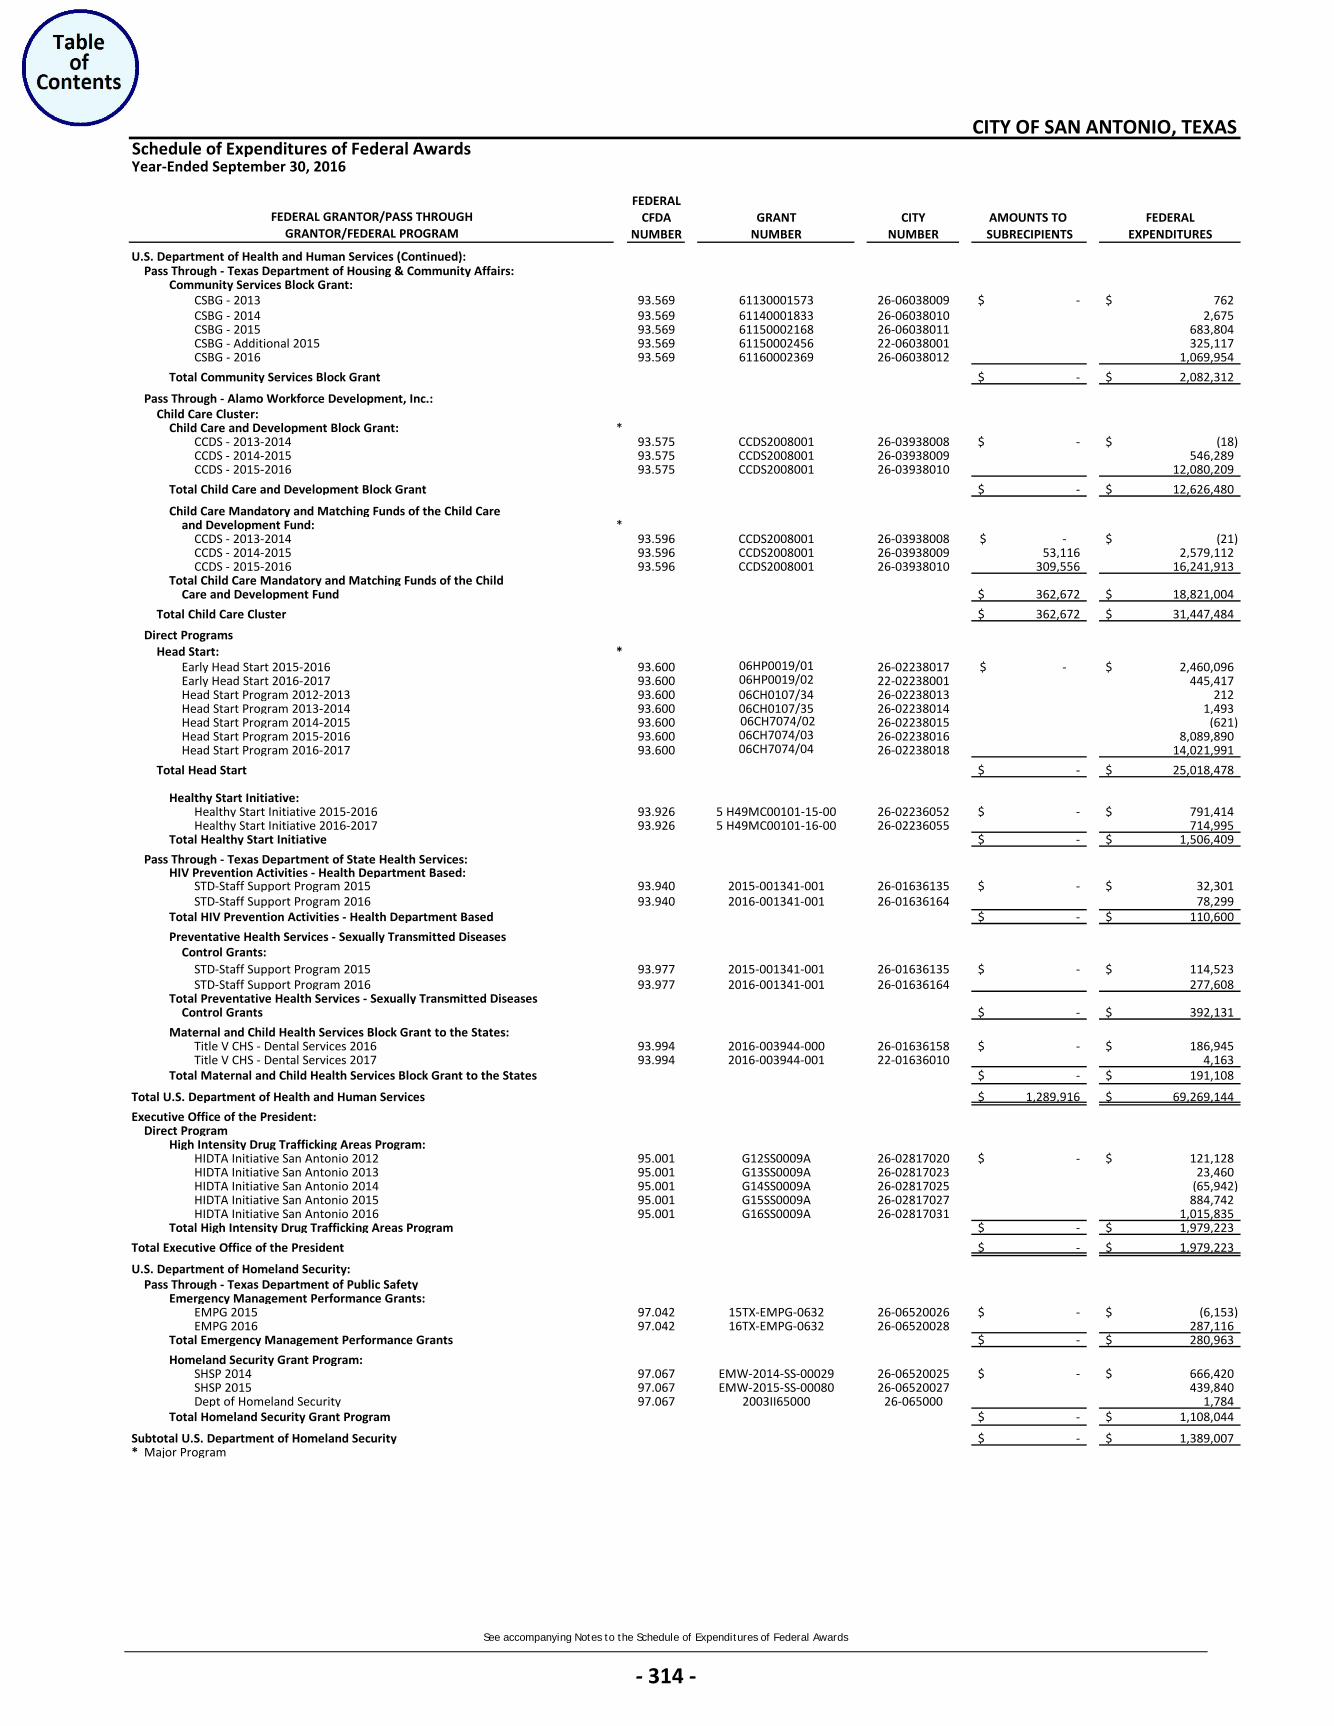
See accompanying Notes to the Schedule of Expenditures of Federal Awards
Schedule of Expenditures of Federal Awards
FEDERALCFDA GRANT CITY AMOUNTS TO FEDERAL
NUMBER NUMBER NUMBER SUBRECIPIENTS EXPENDITURES
CITY OF SAN ANTONIO, TEXAS
Year-Ended September 30, 2016
FEDERAL GRANTOR/PASS THROUGHGRANTOR/FEDERAL PROGRAM
U.S. Department of Health and Human Services (Continued):Pass Through - Texas Department of Housing & Community Affairs:
Community Services Block Grant:CSBG - 2013 93.569 61130001573 26-06038009 -$ 762$ CSBG - 2014 93.569 61140001833 26-06038010 2,675CSBG - 2015 93.569 61150002168 26-06038011 683,804CSBG - Additional 2015 93.569 61150002456 22-06038001 325,117CSBG - 2016 93.569 61160002369 26-06038012 1,069,954
Total Community Services Block Grant -$ 2,082,312$
Pass Through - Alamo Workforce Development, Inc.:Child Care Cluster:
Child Care and Development Block Grant: *CCDS - 2013-2014 93.575 CCDS2008001 26-03938008 -$ (18)$ CCDS - 2014-2015 93.575 CCDS2008001 26-03938009 546,289CCDS - 2015-2016 93.575 CCDS2008001 26-03938010 12,080,209
Total Child Care and Development Block Grant -$ 12,626,480$
Child Care Mandatory and Matching Funds of the Child Careand Development Fund: *
CCDS - 2013-2014 93.596 CCDS2008001 26-03938008 -$ (21)$ CCDS - 2014-2015 93.596 CCDS2008001 26-03938009 53,116 2,579,112CCDS - 2015-2016 93.596 CCDS2008001 26-03938010 309,556 16,241,913
Total Child Care Mandatory and Matching Funds of the ChildCare and Development Fund 362,672$ 18,821,004$
Total Child Care Cluster 362,672$ 31,447,484$
Direct ProgramsHead Start: *
Early Head Start 2015-2016 93.600 06HP0019/01 26-02238017 -$ 2,460,096$ Early Head Start 2016-2017 93.600 06HP0019/02 22-02238001 445,417Head Start Program 2012-2013 93.600 06CH0107/34 26-02238013 212Head Start Program 2013-2014 93.600 06CH0107/35 26-02238014 1,493Head Start Program 2014-2015 93.600 06CH7074/02 26-02238015 (621)Head Start Program 2015-2016 93.600 06CH7074/03 26-02238016 8,089,890Head Start Program 2016-2017 93.600 06CH7074/04 26-02238018 14,021,991
Total Head Start -$ 25,018,478$
Healthy Start Initiative: Healthy Start Initiative 2015-2016 93.926 5 H49MC00101-15-00 26-02236052 -$ 791,414$ Healthy Start Initiative 2016-2017 93.926 5 H49MC00101-16-00 26-02236055 714,995
Total Healthy Start Initiative -$ 1,506,409$
Pass Through - Texas Department of State Health Services:HIV Prevention Activities - Health Department Based:
STD-Staff Support Program 2015 93.940 2015-001341-001 26-01636135 -$ 32,301$ STD-Staff Support Program 2016 93.940 2016-001341-001 26-01636164 78,299
Total HIV Prevention Activities - Health Department Based -$ 110,600$
Preventative Health Services - Sexually Transmitted DiseasesControl Grants:
STD-Staff Support Program 2015 93.977 2015-001341-001 26-01636135 -$ 114,523$ STD-Staff Support Program 2016 93.977 2016-001341-001 26-01636164 277,608
Total Preventative Health Services - Sexually Transmitted DiseasesControl Grants -$ 392,131$
Maternal and Child Health Services Block Grant to the States:Title V CHS - Dental Services 2016 93.994 2016-003944-000 26-01636158 -$ 186,945$ Title V CHS - Dental Services 2017 93.994 2016-003944-001 22-01636010 4,163
Total Maternal and Child Health Services Block Grant to the States -$ 191,108$
Total U.S. Department of Health and Human Services 1,289,916$ 69,269,144$
Executive Office of the President:Direct Program
High Intensity Drug Trafficking Areas Program:HIDTA Initiative San Antonio 2012 95.001 G12SS0009A 26-02817020 -$ 121,128$ HIDTA Initiative San Antonio 2013 95.001 G13SS0009A 26-02817023 23,460 HIDTA Initiative San Antonio 2014 95.001 G14SS0009A 26-02817025 (65,942) HIDTA Initiative San Antonio 2015 95.001 G15SS0009A 26-02817027 884,742 HIDTA Initiative San Antonio 2016 95.001 G16SS0009A 26-02817031 1,015,835
Total High Intensity Drug Trafficking Areas Program -$ 1,979,223$
Total Executive Office of the President -$ 1,979,223$
U.S. Department of Homeland Security:Pass Through - Texas Department of Public Safety
Emergency Management Performance Grants:EMPG 2015 97.042 15TX-EMPG-0632 26-06520026 -$ (6,153)$ EMPG 2016 97.042 16TX-EMPG-0632 26-06520028 287,116
Total Emergency Management Performance Grants -$ 280,963$
Homeland Security Grant Program:SHSP 2014 97.067 EMW-2014-SS-00029 26-06520025 -$ 666,420$ SHSP 2015 97.067 EMW-2015-SS-00080 26-06520027 439,840 Dept of Homeland Security 97.067 2003II65000 26-065000 1,784
Total Homeland Security Grant Program -$ 1,108,044$
Subtotal U.S. Department of Homeland Security -$ 1,389,007$ * Major Program
‐ 314 ‐
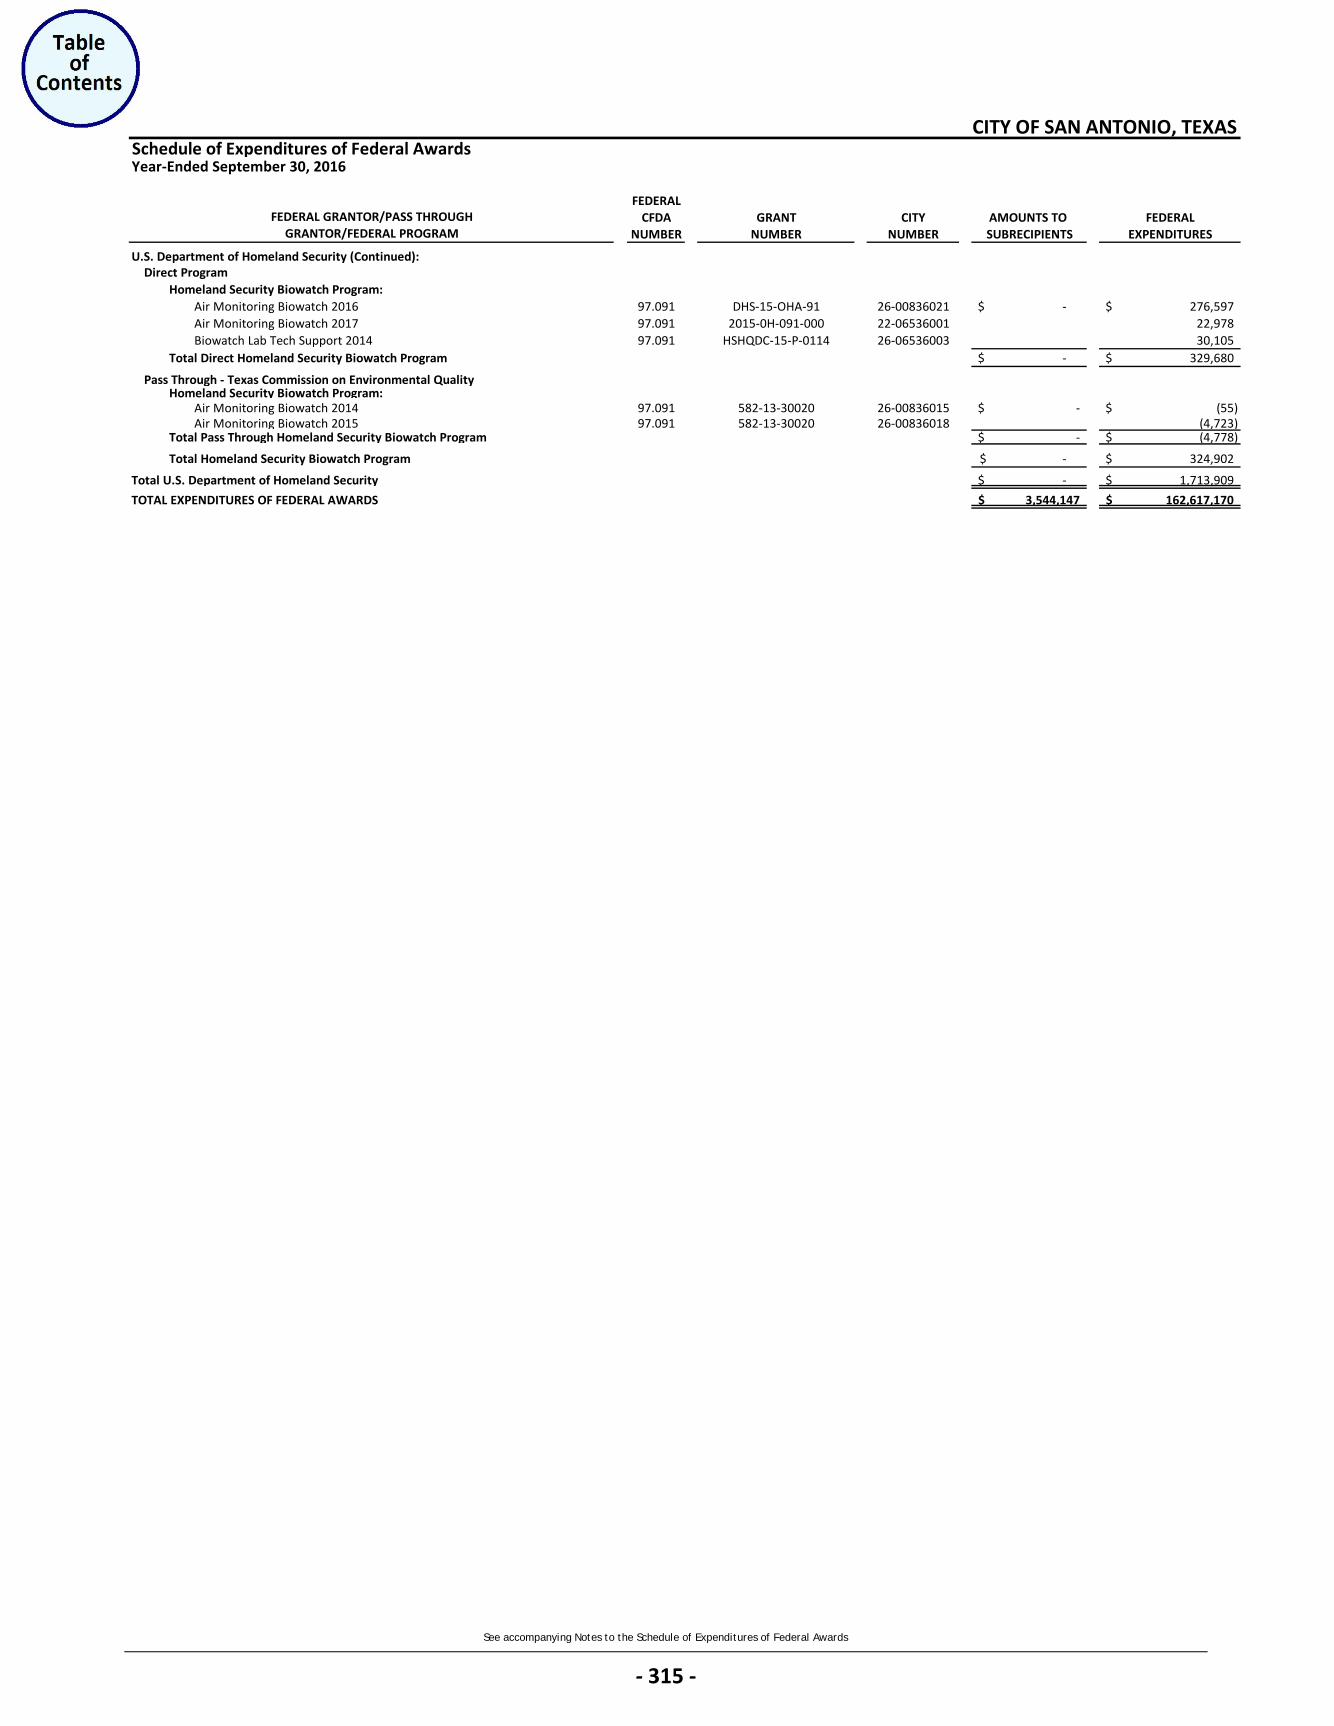
See accompanying Notes to the Schedule of Expenditures of Federal Awards
Schedule of Expenditures of Federal Awards
FEDERALCFDA GRANT CITY AMOUNTS TO FEDERAL
NUMBER NUMBER NUMBER SUBRECIPIENTS EXPENDITURES
CITY OF SAN ANTONIO, TEXAS
Year-Ended September 30, 2016
FEDERAL GRANTOR/PASS THROUGHGRANTOR/FEDERAL PROGRAM
U.S. Department of Homeland Security (Continued):Direct Program
Homeland Security Biowatch Program:Air Monitoring Biowatch 2016 97.091 DHS-15-OHA-91 26-00836021 -$ 276,597$ Air Monitoring Biowatch 2017 97.091 2015-0H-091-000 22-06536001 22,978 Biowatch Lab Tech Support 2014 97.091 HSHQDC-15-P-0114 26-06536003 30,105
Total Direct Homeland Security Biowatch Program -$ 329,680$
Pass Through - Texas Commission on Environmental QualityHomeland Security Biowatch Program:
Air Monitoring Biowatch 2014 97.091 582-13-30020 26-00836015 -$ (55)$ Air Monitoring Biowatch 2015 97.091 582-13-30020 26-00836018 (4,723)
Total Pass Through Homeland Security Biowatch Program -$ (4,778)$
Total Homeland Security Biowatch Program -$ 324,902$
Total U.S. Department of Homeland Security -$ 1,713,909$
TOTAL EXPENDITURES OF FEDERAL AWARDS 3,544,147$ 162,617,170$
‐ 315 ‐
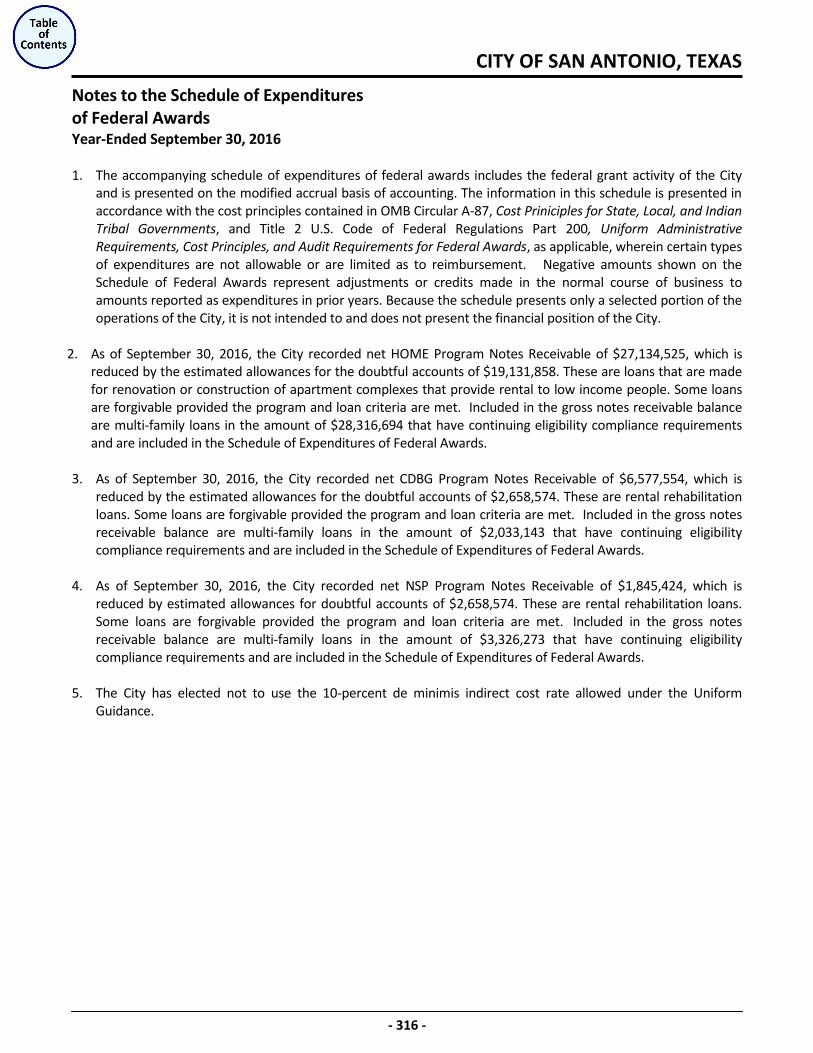
CITY OF SAN ANTONIO, TEXAS
- 316 -
Notes to the Schedule of Expenditures of Federal Awards Year-Ended September 30, 2016 1. The accompanying schedule of expenditures of federal awards includes the federal grant activity of the City
and is presented on the modified accrual basis of accounting. The information in this schedule is presented in accordance with the cost principles contained in OMB Circular A-87, Cost Priniciples for State, Local, and Indian Tribal Governments, and Title 2 U.S. Code of Federal Regulations Part 200, Uniform Administrative Requirements, Cost Principles, and Audit Requirements for Federal Awards, as applicable, wherein certain types of expenditures are not allowable or are limited as to reimbursement. Negative amounts shown on the Schedule of Federal Awards represent adjustments or credits made in the normal course of business to amounts reported as expenditures in prior years. Because the schedule presents only a selected portion of the operations of the City, it is not intended to and does not present the financial position of the City.
2. As of September 30, 2016, the City recorded net HOME Program Notes Receivable of $27,134,525, which is
reduced by the estimated allowances for the doubtful accounts of $19,131,858. These are loans that are made for renovation or construction of apartment complexes that provide rental to low income people. Some loans are forgivable provided the program and loan criteria are met. Included in the gross notes receivable balance are multi-family loans in the amount of $28,316,694 that have continuing eligibility compliance requirements and are included in the Schedule of Expenditures of Federal Awards.
3. As of September 30, 2016, the City recorded net CDBG Program Notes Receivable of $6,577,554, which is
reduced by the estimated allowances for the doubtful accounts of $2,658,574. These are rental rehabilitation loans. Some loans are forgivable provided the program and loan criteria are met. Included in the gross notes receivable balance are multi-family loans in the amount of $2,033,143 that have continuing eligibility compliance requirements and are included in the Schedule of Expenditures of Federal Awards.
4. As of September 30, 2016, the City recorded net NSP Program Notes Receivable of $1,845,424, which is
reduced by estimated allowances for doubtful accounts of $2,658,574. These are rental rehabilitation loans. Some loans are forgivable provided the program and loan criteria are met. Included in the gross notes receivable balance are multi-family loans in the amount of $3,326,273 that have continuing eligibility compliance requirements and are included in the Schedule of Expenditures of Federal Awards.
5. The City has elected not to use the 10-percent de minimis indirect cost rate allowed under the Uniform
Guidance.
Independent Auditor’s Report on Internal Control over Financial Reporting and on Compliance and Other Matters Based on an Audit of Financial Statements
Performed in Accordance with Government Auditing Standards
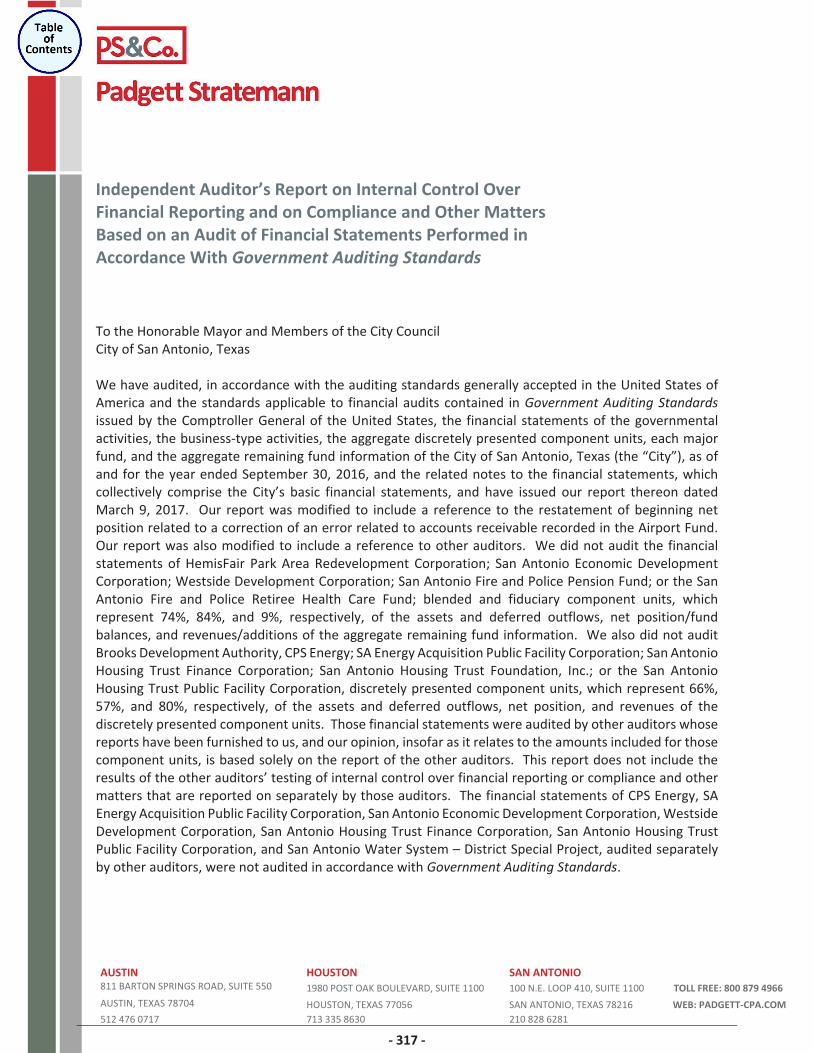
AUSTIN HOUSTON SAN ANTONIO811 BARTON SPRINGS ROAD, SUITE 550 1980 POST OAK BOULEVARD, SUITE 1100 100 N.E. LOOP 410, SUITE 1100 TOLL FREE: 800 879 4966AUSTIN, TEXAS 78704 HOUSTON, TEXAS 77056 SAN ANTONIO, TEXAS 78216 WEB: PADGETT CPA.COM512 476 0717 713 335 8630 210 828 6281
Independent Auditor’s Report on Internal Control OverFinancial Reporting and on Compliance and Other MattersBased on an Audit of Financial Statements Performed inAccordance With Government Auditing Standards
To the Honorable Mayor and Members of the City CouncilCity of San Antonio, Texas
We have audited, in accordance with the auditing standards generally accepted in the United States ofAmerica and the standards applicable to financial audits contained in Government Auditing Standardsissued by the Comptroller General of the United States, the financial statements of the governmentalactivities, the business type activities, the aggregate discretely presented component units, each majorfund, and the aggregate remaining fund information of the City of San Antonio, Texas (the “City”), as ofand for the year ended September 30, 2016, and the related notes to the financial statements, whichcollectively comprise the City’s basic financial statements, and have issued our report thereon datedMarch 9, 2017. Our report was modified to include a reference to the restatement of beginning netposition related to a correction of an error related to accounts receivable recorded in the Airport Fund.Our report was also modified to include a reference to other auditors. We did not audit the financialstatements of HemisFair Park Area Redevelopment Corporation; San Antonio Economic DevelopmentCorporation; Westside Development Corporation; San Antonio Fire and Police Pension Fund; or the SanAntonio Fire and Police Retiree Health Care Fund; blended and fiduciary component units, whichrepresent 74%, 84%, and 9%, respectively, of the assets and deferred outflows, net position/fundbalances, and revenues/additions of the aggregate remaining fund information. We also did not auditBrooks Development Authority, CPS Energy; SA Energy Acquisition Public Facility Corporation; San AntonioHousing Trust Finance Corporation; San Antonio Housing Trust Foundation, Inc.; or the San AntonioHousing Trust Public Facility Corporation, discretely presented component units, which represent 66%,57%, and 80%, respectively, of the assets and deferred outflows, net position, and revenues of thediscretely presented component units. Those financial statements were audited by other auditors whosereports have been furnished to us, and our opinion, insofar as it relates to the amounts included for thosecomponent units, is based solely on the report of the other auditors. This report does not include theresults of the other auditors’ testing of internal control over financial reporting or compliance and othermatters that are reported on separately by those auditors. The financial statements of CPS Energy, SAEnergy Acquisition Public Facility Corporation, San Antonio Economic Development Corporation,WestsideDevelopment Corporation, San Antonio Housing Trust Finance Corporation, San Antonio Housing TrustPublic Facility Corporation, and San Antonio Water System – District Special Project, audited separatelyby other auditors, were not audited in accordance with Government Auditing Standards.
317
Internal Control Over Financial Reporting
In planning and performing our audit of the financial statements, we considered the City’s internal controlover financial reporting (internal control) to determine the audit procedures that are appropriate in thecircumstances for the purpose of expressing our opinions on the financial statements, but not for thepurpose of expressing an opinion on the effectiveness of the City’s internal control. Accordingly, we donot express an opinion on the effectiveness of City’s internal control.
A deficiency in internal control exists when the design or operation of a control does not allowmanagement or employees, in the normal course of performing their assigned functions, to prevent ordetect and correct misstatements on a timely basis. A material weakness is a deficiency, or combinationof deficiencies, in internal control, such that there is a reasonable possibility that a material misstatementof the City’s financial statements will not be prevented or detected and corrected on a timely basis. Asignificant deficiency is a deficiency, or a combination of deficiencies, in internal control that is less severethan a material weakness, yet important enough to merit attention by those charged with governance.
Our consideration of internal control was for the limited purpose described in the first paragraph of thissection and was not designed to identify all deficiencies in internal control that might be materialweaknesses or significant deficiencies and therefore, material weakness or significant deficiencies mayexist that were not identified. Given these limitations, during our audit we did not identify any deficienciesin internal control that we consider to be material weaknesses. We did identify a deficiency in internalcontrol identified in the accompanying schedule of findings and questioned costs that we consider to bea significant deficiency as item 2016 001.
Compliance and Other Matters
As part of obtaining reasonable assurance about whether the City’s financial statements are free frommaterial misstatement, we performed tests of its compliance with certain provisions of laws, regulations,contracts, and grant agreements, noncompliance with which could have a direct and material effect onthe determination of financial statement amounts. However, providing an opinion on compliance withthose provisions was not an objective of our audit and, accordingly, we do not express such an opinion.The results of our tests disclosed no instances of noncompliance or other matters that are required to bereported under Government Auditing Standards.
City’s Response to Finding
The City’s response to the finding identified in our audit is described in the accompanying Schedule ofFindings and Questioned Costs. The City’s response was not subjected to the auditing procedures appliedto the audit of the financial statements and, accordingly, we express no opinion on it.
318
Purpose of This Report
The purpose of this report is solely to describe the scope of our testing of internal control and complianceand the results of that testing, and not to provide an opinion on the effectiveness of the City’s internalcontrol or on compliance. This report is an integral part of an audit performed in accordance withGovernment Auditing Standards in considering the City’s internal control and compliance. Accordingly,this communication is not suitable for any other purpose.
San Antonio, TexasMarch 9, 2017
319
Independent Auditor’s Report on Compliance For Each Major
Federal Program and Report on Internal Control Over
Compliance as Required by the Uniform Guidance
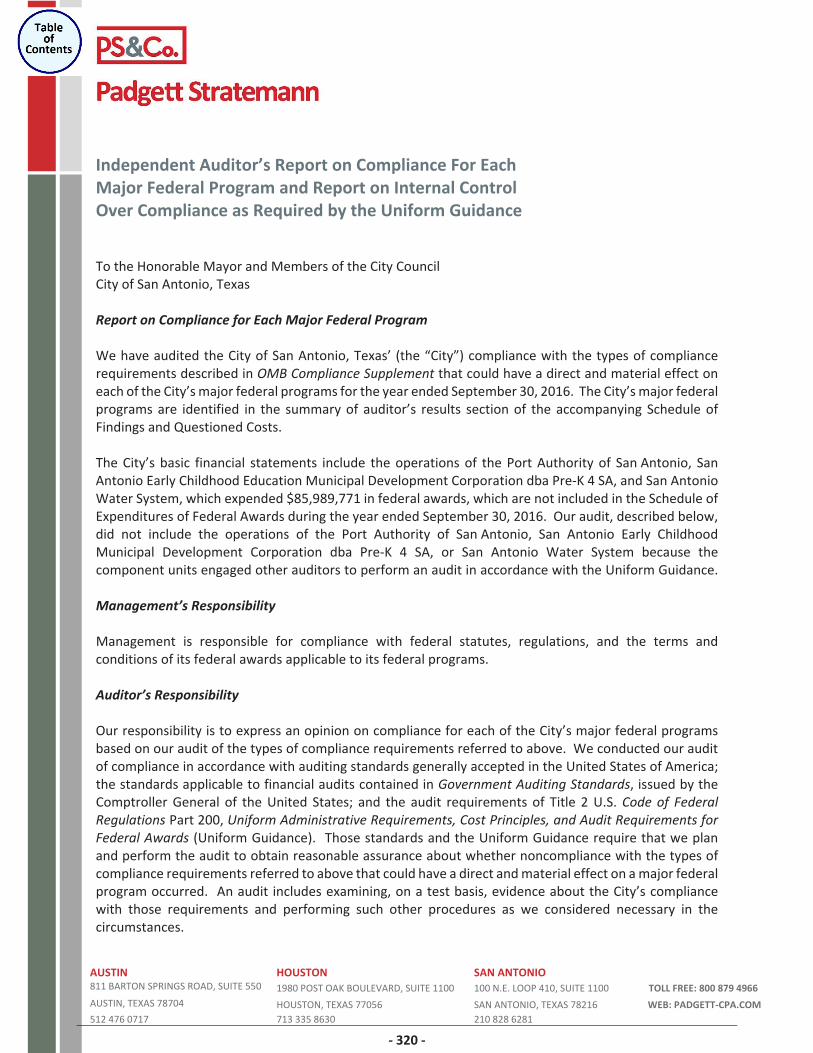
AUSTIN HOUSTON SAN ANTONIO811 BARTON SPRINGS ROAD, SUITE 550 1980 POST OAK BOULEVARD, SUITE 1100 100 N.E. LOOP 410, SUITE 1100 TOLL FREE: 800 879 4966AUSTIN, TEXAS 78704 HOUSTON, TEXAS 77056 SAN ANTONIO, TEXAS 78216 WEB: PADGETT CPA.COM512 476 0717 713 335 8630 210 828 6281
Independent Auditor’s Report on Compliance For EachMajor Federal Program and Report on Internal ControlOver Compliance as Required by the Uniform Guidance
To the Honorable Mayor and Members of the City CouncilCity of San Antonio, Texas
Report on Compliance for Each Major Federal Program
We have audited the City of San Antonio, Texas’ (the “City”) compliance with the types of compliancerequirements described in OMB Compliance Supplement that could have a direct and material effect oneach of the City’s major federal programs for the year ended September 30, 2016. The City’s major federalprograms are identified in the summary of auditor’s results section of the accompanying Schedule ofFindings and Questioned Costs.
The City’s basic financial statements include the operations of the Port Authority of San Antonio, SanAntonio Early Childhood Education Municipal Development Corporation dba Pre K 4 SA, and San AntonioWater System, which expended $85,989,771 in federal awards, which are not included in the Schedule ofExpenditures of Federal Awards during the year ended September 30, 2016. Our audit, described below,did not include the operations of the Port Authority of San Antonio, San Antonio Early ChildhoodMunicipal Development Corporation dba Pre K 4 SA, or San Antonio Water System because thecomponent units engaged other auditors to perform an audit in accordance with the Uniform Guidance.
Management’s Responsibility
Management is responsible for compliance with federal statutes, regulations, and the terms andconditions of its federal awards applicable to its federal programs.
Auditor’s Responsibility
Our responsibility is to express an opinion on compliance for each of the City’s major federal programsbased on our audit of the types of compliance requirements referred to above. We conducted our auditof compliance in accordance with auditing standards generally accepted in the United States of America;the standards applicable to financial audits contained in Government Auditing Standards, issued by theComptroller General of the United States; and the audit requirements of Title 2 U.S. Code of FederalRegulations Part 200, Uniform Administrative Requirements, Cost Principles, and Audit Requirements forFederal Awards (Uniform Guidance). Those standards and the Uniform Guidance require that we planand perform the audit to obtain reasonable assurance about whether noncompliance with the types ofcompliance requirements referred to above that could have a direct andmaterial effect on amajor federalprogram occurred. An audit includes examining, on a test basis, evidence about the City’s compliancewith those requirements and performing such other procedures as we considered necessary in thecircumstances.
320
We believe that our audit provides a reasonable basis for our opinion on compliance for each major federal program. However, our audit does not provide a legal determination of the City’s compliance. Opinion on Each Major Federal Program In our opinion, the City complied, in all material respects, with the types of compliance requirements referred to above that could have a direct and material effect on each of its major federal programs for the year ended September 30, 2016. Report on Internal Control Over Compliance Management of the City is responsible for establishing and maintaining effective internal control over compliance with the types of compliance requirements referred to above. In planning and performing our audit of compliance, we considered the City’s internal control over compliance with the types of requirements that could have a direct and material effect on each major federal program to determine the auditing procedures that are appropriate in the circumstances for the purpose of expressing an opinion on compliance for each major federal program and to test and report on internal control over compliance in accordance with the Uniform Guidance, but not for the purpose of expressing an opinion on the effectiveness of internal control over compliance. Accordingly, we do not express an opinion on the effectiveness of the City’s internal control over compliance. A deficiency in internal control over compliance exists when the design or operation of a control over compliance does not allow management or employees, in the normal course of performing their assigned functions, to prevent or detect and correct noncompliance with a type of compliance requirement of a federal program on a timely basis. A material weakness in internal control over compliance is a deficiency, or combination of deficiencies, in internal control over compliance, such that there is a reasonable possibility that material noncompliance with a type of compliance requirement of a federal program will not be prevented or detected and corrected on a timely basis. A significant deficiency in internal control over compliance is a deficiency, or a combination of deficiencies, in internal control over compliance with a type of compliance requirement of a federal program that is less severe than a material weakness in internal control over compliance, yet important enough to merit attention by those charged with governance. Our consideration of internal control over compliance was for the limited purpose described in the first paragraph of this section and was not designed to identify all deficiencies in internal control over compliance that might be material weaknesses or significant deficiencies. We did not identify any deficiencies in internal control over compliance that we consider to be material weaknesses. However, material weaknesses may exist that have not been identified. The purpose of this report on internal control over compliance is solely to describe the scope of our testing of internal control over compliance and the results of that testing based on the requirements of the Uniform Guidance. Accordingly, this report is not suitable for any other purpose.
San Antonio, Texas March 9, 2017
‐ 321 ‐
Schedule of Findings and Questioned Costs
Federal
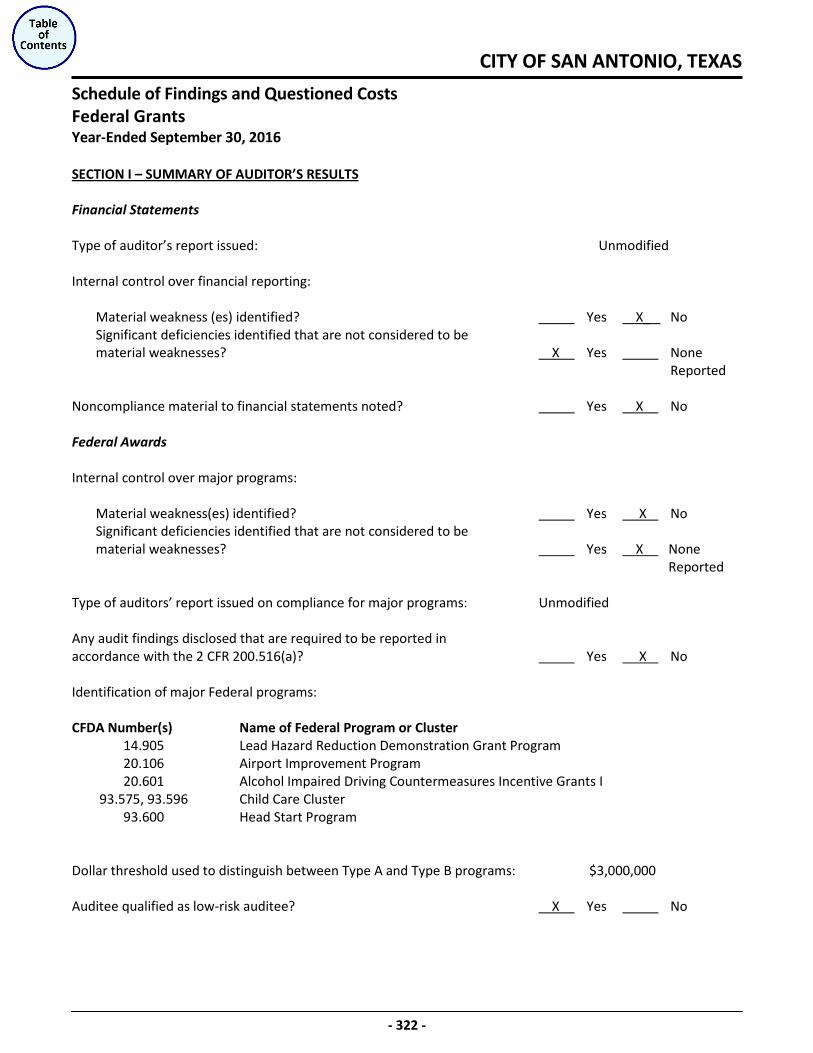
CITY OF SAN ANTONIO, TEXAS
Schedule of Findings and Questioned Costs Federal Grants Year-Ended September 30, 2016
- 322 -
SECTION I – SUMMARY OF AUDITOR’S RESULTS
Financial Statements Type of auditor’s report issued: Unmodified Internal control over financial reporting: Material weakness (es) identified? Yes X_ Significant deficiencies identified that are not considered to be
No
material weaknesses? X
Yes None Reported
Noncompliance material to financial statements noted? Yes X
No
Federal Awards Internal control over major programs: Material weakness(es) identified? Yes X Significant deficiencies identified that are not considered to be
No
material weaknesses? Yes X Reported
None
Type of auditors’ report issued on compliance for major programs: Unmodified Any audit findings disclosed that are required to be reported in accordance with the 2 CFR 200.516(a)? Yes X
No
Identification of major Federal programs: CFDA Number(s) Name of Federal Program or Cluster 14.905 Lead Hazard Reduction Demonstration Grant Program 20.106 Airport Improvement Program 20.601 Alcohol Impaired Driving Countermeasures Incentive Grants I 93.575, 93.596 Child Care Cluster 93.600 Head Start Program Dollar threshold used to distinguish between Type A and Type B programs: $3,000,000 Auditee qualified as low-risk auditee? X
Yes No
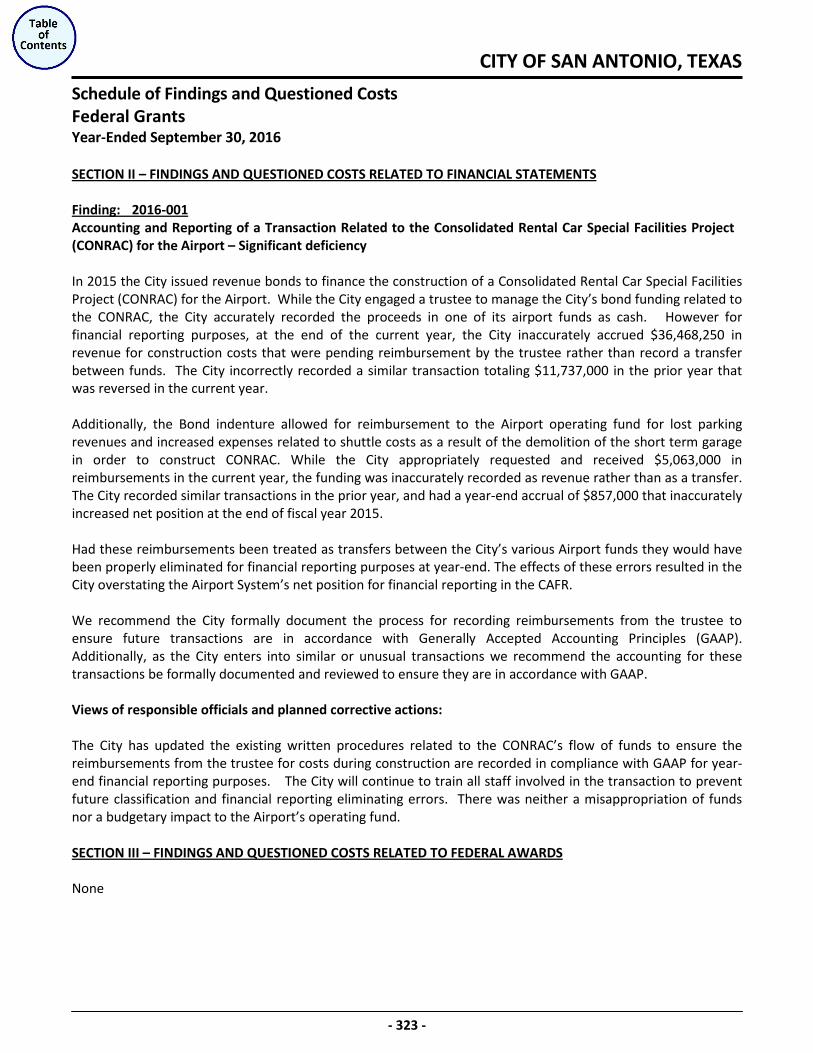
CITY OF SAN ANTONIO, TEXAS
Schedule of Findings and Questioned Costs Federal Grants Year-Ended September 30, 2016
- 323 -
SECTION II – FINDINGS AND QUESTIONED COSTS RELATED TO FINANCIAL STATEMENTS
Accounting and Reporting of a Transaction Related to the Consolidated Rental Car Special Facilities Project (CONRAC) for the Airport – Significant deficiency
Finding: 2016-001
In 2015 the City issued revenue bonds to finance the construction of a Consolidated Rental Car Special Facilities Project (CONRAC) for the Airport. While the City engaged a trustee to manage the City’s bond funding related to the CONRAC, the City accurately recorded the proceeds in one of its airport funds as cash. However for financial reporting purposes, at the end of the current year, the City inaccurately accrued $36,468,250 in revenue for construction costs that were pending reimbursement by the trustee rather than record a transfer between funds. The City incorrectly recorded a similar transaction totaling $11,737,000 in the prior year that was reversed in the current year. Additionally, the Bond indenture allowed for reimbursement to the Airport operating fund for lost parking revenues and increased expenses related to shuttle costs as a result of the demolition of the short term garage in order to construct CONRAC. While the City appropriately requested and received $5,063,000 in reimbursements in the current year, the funding was inaccurately recorded as revenue rather than as a transfer. The City recorded similar transactions in the prior year, and had a year-end accrual of $857,000 that inaccurately increased net position at the end of fiscal year 2015. Had these reimbursements been treated as transfers between the City’s various Airport funds they would have been properly eliminated for financial reporting purposes at year-end. The effects of these errors resulted in the City overstating the Airport System’s net position for financial reporting in the CAFR. We recommend the City formally document the process for recording reimbursements from the trustee to ensure future transactions are in accordance with Generally Accepted Accounting Principles (GAAP). Additionally, as the City enters into similar or unusual transactions we recommend the accounting for these transactions be formally documented and reviewed to ensure they are in accordance with GAAP. Views of responsible officials and planned corrective actions: The City has updated the existing written procedures related to the CONRAC’s flow of funds to ensure the reimbursements from the trustee for costs during construction are recorded in compliance with GAAP for year-end financial reporting purposes. The City will continue to train all staff involved in the transaction to prevent future classification and financial reporting eliminating errors. There was neither a misappropriation of funds nor a budgetary impact to the Airport’s operating fund.
SECTION III – FINDINGS AND QUESTIONED COSTS RELATED TO FEDERAL AWARDS
None

Corrective Action Plan
Federal
CITY OF SAN ANTONIO, TEXAS
Corrective Action Plan Federal Grants Year-Ended September 30, 2016
-324-
Finding 2016-001 Accounting and Reporting of a Transaction Related to the Consolidated Rental Car Special Facilities Project (CONRAC) for the Airport
Troy Elliott, CPA, Deputy Chief Financial Officer Responsible Person
Finance Department
March 9, 2017 Implementation Dates
Views of responsible officials and planned corrective actions
The City has updated the existing written procedures related to the CONRAC’s flow of funds to ensure the reimbursements from the trustee for costs during construction are recorded in compliance with GAAP for year-end financial reporting purposes. The City will continue to train all staff involved in the transaction to prevent future classification and financial reporting eliminating errors. There was neither a misappropriation of funds nor a budgetary impact to the Airport’s operating fund.
Summary Status of Prior Year Findings
Federal
CITY OF SAN ANTONIO, TEXAS
Summary Status of Prior Year Findings Federal Grants Year-Ended September 30, 2016
- 325 -
Procurement and Suspension and Debarment Finding: 2014-004
CFDA #95.001 – High Intensity Drug Trafficking Area Award Number – G14SS0009A Award Year – 2014 Federal Agency – Executive Office of the President Type of Finding – Non-compliance and Control deficiency Questioned Costs - $0
We recommend the City amend its Procurement Policy and Procedures to include controls and procedures over federally funded leases and lease renewals greater than $25,000 in order to ensure such expenditures are adequately documented and in compliance with procurement and suspension and debarment requirements.
Recommendation:
In Progress Status:
The Finance Department will coordinate with Center City Development Office (CCDO) to draft, release, and train on a Lease Administrative Directive. The Administrative Directive (AD) and training will include checklists created by CCDO to ensure that adherence with all federal procurement regulations are followed, and that proper documentation is retained (to include documentation of sole source cases and searches for suspension and debarment). Specific identification of funding sources of the leases, whether grant or debt, will be required in order to ensure specific adherence to governing regulations. A new GASB statement on leases is forthcoming (final draft for approval is scheduled in mid-2017). Once changes are communicated via the GASB statement, the City will incorporate the new requirements in the AD and in the training.
December 2017 Implementation Date
Chief William McManus Responsible Persons:
San Antonio Police Department
Troy Elliott, CPA, Deputy Chief Financial Officer Finance Department
CITY OF SAN ANTONIO, TEXAS
Summary Status of Prior Year Findings Federal Grants Year-Ended September 30, 2016
- 326 -
Program Income Finding: 2014-006
CFDA #14.218 – Community Development Block Grants/Entitlement Grants Award Numbers – B05MC480508, B06MC480508, B08MC480508, B09MC480508, B10MC480508, B11MC480508, B12MC480508, B13MC480508 Award Years – 2005, 2006, 2008, 2009, 2010, 2011, 2012, and 2013 Federal Agency – U.S. Department of Housing and Urban Development Type of Finding –Significant deficiency Questioned Costs - $0
We recommend the City update controls and procedures to ensure all program income funds have been expended prior to approving the request for additional funds.
Recommendation:
We also recommend the City complete a reconciliation of the CDBG program income receipts and the CDBG program income activities between IDIS and the City’s accounting system as requested by HUD, and apply future expenditures against program income funds before any additional drawdowns.
In addition, we recommend the City implement monthly reconciliation controls and procedures between CDBG program income receipts and vouchers reported in the City’s accounting system with drawdowns in IDIS to ensure the accuracy of the amounts being requested from HUD.
In Progress Status:
The City and HUD have been working diligently to reconcile the City’s CDBG Program Income recorded in SAP to that reported in IDIS. Remaining reconciliation items are anticipated to be resolved by June 2017. IDIS Expenditures and Draw Down procedures were submitted and approved by HUD in April 2014. Procedures include a monthly reconciliation of program income. Draw down procedures are currently in effect. Once the reconciliation has been completed and approved by HUD, the current process will remain in effect to ensure program income is reported in IDIS monthly and used before new funding is drawn upon.
June 2017 Implementation Date
Bridgett White, Director Responsible Person:
Department of Planning and Community Development

STATE SECTION
STATESECTION
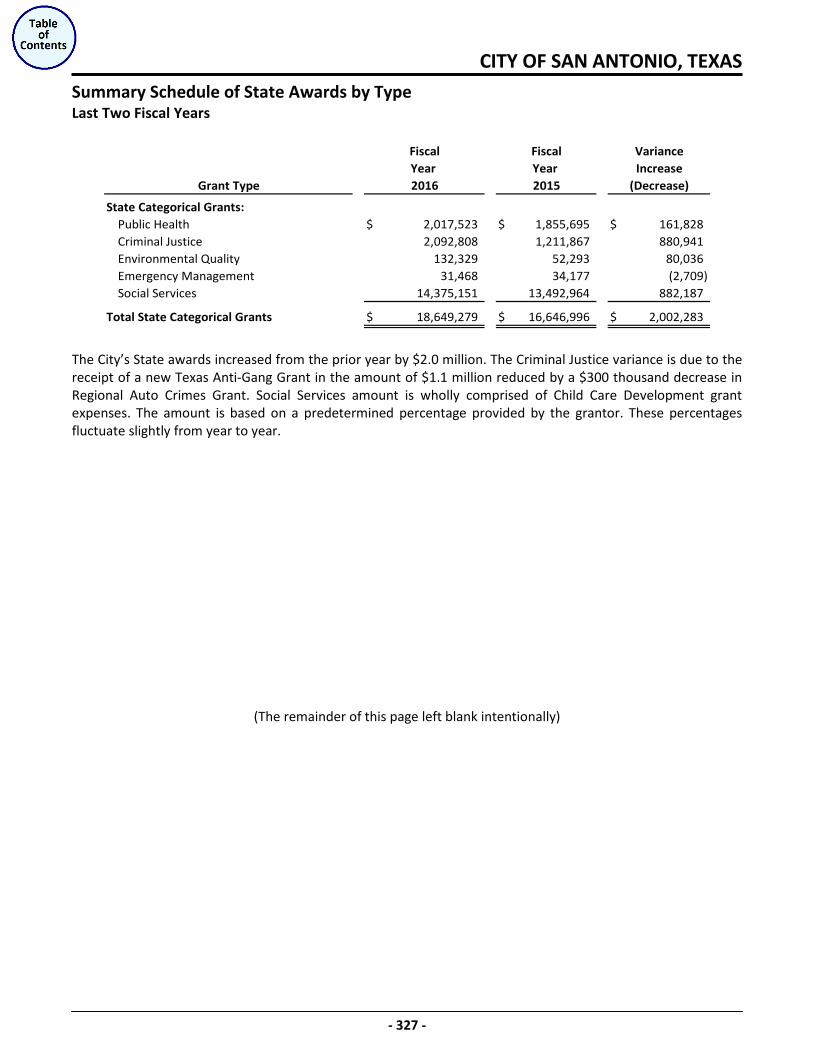
CITY OF SAN ANTONIO, TEXAS
- 327 -
Summary Schedule of State Awards by Type Last Two Fiscal Years
State Categorical Grants:Public Health $ 2,017,523 $ 1,855,695 $ 161,828Criminal Justice 2,092,808 1,211,867 880,941Environmental Quality 132,329 52,293 80,036Emergency Management 31,468 34,177 (2,709)Social Services 14,375,151 13,492,964 882,187
Total State Categorical Grants $ 18,649,279 $ 16,646,996 $ 2,002,283
Year 2015
VarianceIncrease
(Decrease)Grant Type
FiscalYear 2016
Fiscal
The City’s State awards increased from the prior year by $2.0 million. The Criminal Justice variance is due to the receipt of a new Texas Anti-Gang Grant in the amount of $1.1 million reduced by a $300 thousand decrease in Regional Auto Crimes Grant. Social Services amount is wholly comprised of Child Care Development grant expenses. The amount is based on a predetermined percentage provided by the grantor. These percentages fluctuate slightly from year to year.
(The remainder of this page left blank intentionally)

Schedule of Expenditures of State Awards by Grantor, State Program and
Grant Number
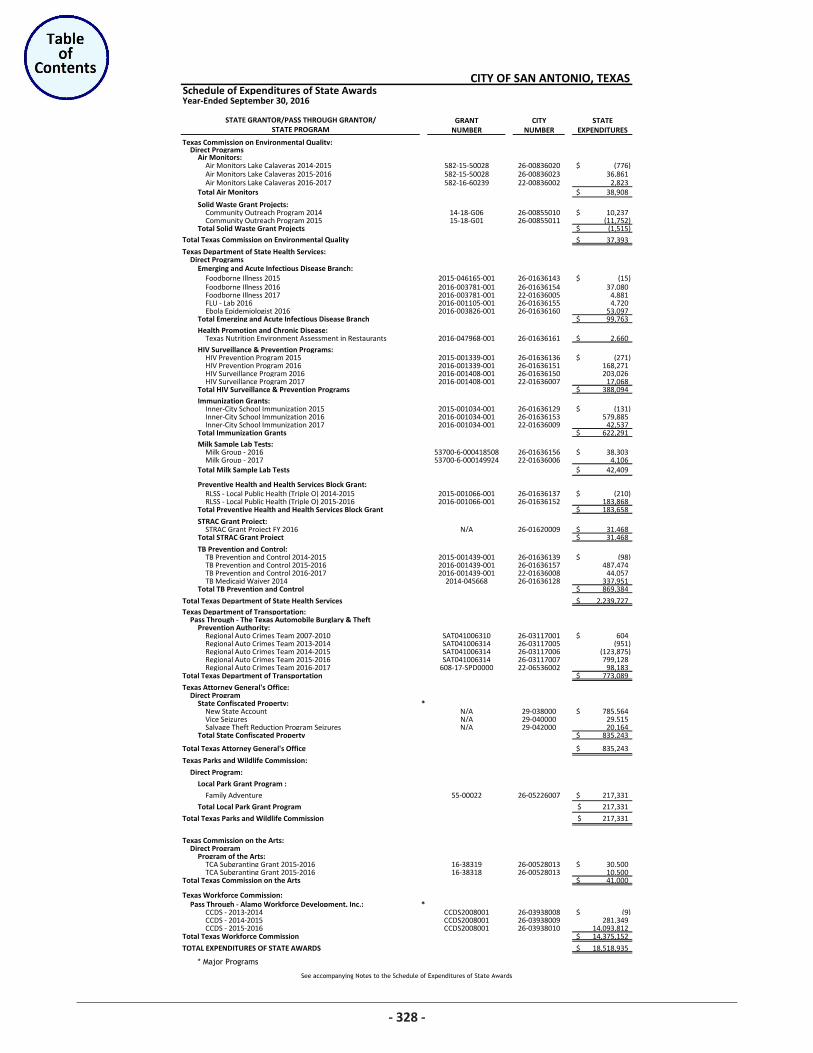
See accompanying Notes to the Schedule of Expenditures of State Awards
Schedule of Expenditures of State Awards
GRANT CITY STATENUMBER NUMBER EXPENDITURES
Texas Commission on Environmental Quality:Direct Programs
Air Monitors:Air Monitors Lake Calaveras 2014-2015 582-15-50028 26-00836020 (776)$ Air Monitors Lake Calaveras 2015-2016 582-15-50028 26-00836023 36,861 Air Monitors Lake Calaveras 2016-2017 582-16-60239 22-00836002 2,823
Total Air Monitors 38,908$
Solid Waste Grant Projects:Community Outreach Program 2014 14-18-G06 26-00855010 10,237$ Community Outreach Program 2015 15-18-G01 26-00855011 (11,752)
Total Solid Waste Grant Projects (1,515)$
37,393$
Texas Department of State Health Services:Direct Programs
Emerging and Acute Infectious Disease Branch:Foodborne Illness 2015 2015-046165-001 26-01636143 (15)$ Foodborne Illness 2016 2016-003781-001 26-01636154 37,080 Foodborne Illness 2017 2016-003781-001 22-01636005 4,881 FLU - Lab 2016 2016-001105-001 26-01636155 4,720 Ebola Epidemiologist 2016 2016-003826-001 26-01636160 53,097
Total Emerging and Acute Infectious Disease Branch 99,763$ Health Promotion and Chronic Disease:
Texas Nutrition Environment Assessment in Restaurants 2016-047968-001 26-01636161 2,660$ HIV Surveillance & Prevention Programs:
HIV Prevention Program 2015 2015-001339-001 26-01636136 (271)$ HIV Prevention Program 2016 2016-001339-001 26-01636151 168,271 HIV Surveillance Program 2016 2016-001408-001 26-01636150 203,026 HIV Surveillance Program 2017 2016-001408-001 22-01636007 17,068
Total HIV Surveillance & Prevention Programs 388,094$ Immunization Grants:
Inner-City School Immunization 2015 2015-001034-001 26-01636129 (131)$ Inner-City School Immunization 2016 2016-001034-001 26-01636153 579,885 Inner-City School Immunization 2017 2016-001034-001 22-01636009 42,537
Total Immunization Grants 622,291$ Milk Sample Lab Tests:
Milk Group - 2016 53700-6-000418508 26-01636156 38,303$ Milk Group - 2017 53700-6-000149924 22-01636006 4,106
Total Milk Sample Lab Tests 42,409$
Preventive Health and Health Services Block Grant:RLSS - Local Public Health (Triple O) 2014-2015 2015-001066-001 26-01636137 (210)$ RLSS - Local Public Health (Triple O) 2015-2016 2016-001066-001 26-01636152 183,868
Total Preventive Health and Health Services Block Grant 183,658$
STRAC Grant Project:STRAC Grant Project FY 2016 N/A 26-01620009 31,468$
Total STRAC Grant Project 31,468$
TB Prevention and Control:TB Prevention and Control 2014-2015 2015-001439-001 26-01636139 (98)$ TB Prevention and Control 2015-2016 2016-001439-001 26-01636157 487,474 TB Prevention and Control 2016-2017 2016-001439-001 22-01636008 44,057 TB Medicaid Waiver 2014 2014-045668 26-01636128 337,951
Total TB Prevention and Control 869,384$
Total Texas Department of State Health Services 2,239,727$ Texas Department of Transportation:
Pass Through - The Texas Automobile Burglary & TheftPrevention Authority:
Regional Auto Crimes Team 2007-2010 SAT041006310 26-03117001 604$ Regional Auto Crimes Team 2013-2014 SAT041006314 26-03117005 (951) Regional Auto Crimes Team 2014-2015 SAT041006314 26-03117006 (123,875) Regional Auto Crimes Team 2015-2016 SAT041006314 26-03117007 799,128 Regional Auto Crimes Team 2016-2017 608-17-SPD0000 22-06536002 98,183
Total Texas Department of Transportation 773,089$
Texas Attorney General's Office:Direct Program
State Confiscated Property: *New State Account N/A 29-038000 785,564$ Vice Seizures N/A 29-040000 29,515 Salvage Theft Reduction Program Seizures N/A 29-042000 20,164
Total State Confiscated Property 835,243$
Total Texas Attorney General's Office 835,243$
Texas Parks and Wildlife Commission:
Direct Program:
Local Park Grant Program :
Family Adventure 55-00022 26-05226007 217,331$
Total Local Park Grant Program 217,331$
Total Texas Parks and Wildlife Commission 217,331$
Texas Commission on the Arts:Direct Program
Program of the Arts:TCA Subgranting Grant 2015-2016 16-38319 26-00528013 30,500$ TCA Subgranting Grant 2015-2016 16-38318 26-00528013 10,500
Total Texas Commission on the Arts 41,000$
Texas Workforce Commission:Pass Through - Alamo Workforce Development, Inc.: *
CCDS - 2013-2014 CCDS2008001 26-03938008 (9)$ CCDS - 2014-2015 CCDS2008001 26-03938009 281,349 CCDS - 2015-2016 CCDS2008001 26-03938010 14,093,812
Total Texas Workforce Commission 14,375,152$
TOTAL EXPENDITURES OF STATE AWARDS 18,518,935$
* Major Programs
CITY OF SAN ANTONIO, TEXAS
Year-Ended September 30, 2016
STATE GRANTOR/PASS THROUGH GRANTOR/STATE PROGRAM
Total Texas Commission on Environmental Quality
328
CITY OF SAN ANTONIO, TEXAS
- 329 - Amounts are expressed in thousands
Notes to the Schedule of Expenditures of State Awards Year-Ended September 30, 2016 1. The accompanying schedule of expenditures of state awards includes the state grant activity of the City and is
presented on the modified accrual basis of accounting. The information in this schedule is presented in accordance with the requirements of the State of Texas Single Audit Circular (“Audit Circular”). The Audit Circular was issued under the authority of the Texas Government Code, Chapter 783, entitled Uniform Grant and Contract Management. This circular sets standards for obtaining consistency and uniformity among state agencies for the coordinated audit of local governments expending any state awards. Because the schedule presents only a selected portion of the operations of the City, it is not intended to and does not present the financial position of the City.
2. Through September 30, 2016, the City did not provide state awards to any subrecipients.
(The remainder of this page left blank intentionally)
Independent Auditor’s Report on Internal Control over Financial Reporting and on Compliance and Other Matters Based on an Audit of Financial Statements
Performed in Accordance with Government Auditing Standards

AUSTIN HOUSTON SAN ANTONIO 811 BARTON SPRINGS ROAD, SUITE 550 1980 POST OAK BOULEVARD, SUITE 1100 100 N.E. LOOP 410, SUITE 1100 TOLL FREE: 800 879 4966 AUSTIN, TEXAS 78704 HOUSTON, TEXAS 77056 SAN ANTONIO, TEXAS 78216 WEB: PADGETT‐CPA.COM 512 476 0717 713 335 8630 210 828 6281
Independent Auditor’s Report on Internal Control Over Financial Reporting and on Compliance and Other Matters Based on an Audit of Financial Statements Performed in Accordance With Government Auditing Standards To the Honorable Mayor and Members of the City Council City of San Antonio, Texas We have audited, in accordance with the auditing standards generally accepted in the United States of America and the standards applicable to financial audits contained in Government Auditing Standards issued by the Comptroller General of the United States, the financial statements of the governmental activities, the business‐type activities, the aggregate discretely presented component units, each major fund, and the aggregate remaining fund information of the City of San Antonio, Texas (the “City”), as of and for the year ended September 30, 2016, and the related notes to the financial statements, which collectively comprise the City’s basic financial statements, and have issued our report thereon dated March 9, 2017. Our report was modified to include a reference to the restatement of beginning net position related to a correction of an error related to accounts receivable recorded in the Airport fund. Our report was also modified to include a reference to other auditors. We did not audit the financial statements of HemisFair Park Area Redevelopment Corporation; San Antonio Economic Development Corporation; Westside Development Corporation; San Antonio Fire and Police Pension Fund; or the San Antonio Fire and Police Retiree Health Care Fund; blended and fiduciary component units, which represent 74%, 84%, and 9%, respectively, of the assets and deferred outflows, net position/fund balances, and revenues/additions of the aggregate remaining fund information. We also did not audit Brooks Development Authority, CPS Energy; SA Energy Acquisition Public Facility Corporation; San Antonio Housing Trust Finance Corporation; San Antonio Housing Trust Foundation, Inc.; or the San Antonio Housing Trust Public Facility Corporation, discretely presented component units, which represent 66%, 57%, and 80%, respectively, of the assets and deferred outflows, net position, and revenues of the discretely presented component units. Those financial statements were audited by other auditors whose reports have been furnished to us, and our opinion, insofar as it relates to the amounts included for those component units, is based solely on the report of the other auditors. This report does not include the results of the other auditors’ testing of internal control over financial reporting or compliance and other matters that are reported on separately by those auditors. The financial statements of CPS Energy, SA Energy Acquisition Public Facility Corporation, San Antonio Economic Development Corporation, Westside Development Corporation, San Antonio Housing Trust Finance Corporation, San Antonio Housing Trust Public Facility Corporation, and San Antonio Water System – District Special Project, audited separately by other auditors, were not audited in accordance with Government Auditing Standards.
‐ 330 ‐

Internal Control Over Financial Reporting In planning and performing our audit of the financial statements, we considered the City’s internal control over financial reporting (internal control) to determine the audit procedures that are appropriate in the circumstances for the purpose of expressing our opinions on the financial statements, but not for the purpose of expressing an opinion on the effectiveness of the City’s internal control. Accordingly, we do not express an opinion on the effectiveness of City’s internal control. A deficiency in internal control exists when the design or operation of a control does not allow management or employees, in the normal course of performing their assigned functions, to prevent or detect and correct misstatements on a timely basis. A material weakness is a deficiency, or combination of deficiencies, in internal control, such that there is a reasonable possibility that a material misstatement of the City’s financial statements will not be prevented or detected and corrected on a timely basis. A significant deficiency is a deficiency, or a combination of deficiencies, in internal control that is less severe than a material weakness, yet important enough to merit attention by those charged with governance. Our consideration of internal control was for the limited purpose described in the first paragraph of this section and was not designed to identify all deficiencies in internal control that might be material weaknesses or significant deficiencies and therefore, material weakness or significant deficiencies may exist that were not identified. Given these limitations, during our audit we did not identify any deficiencies in internal control that we consider to be material weaknesses. We did identify a deficiency in internal control identified in the accompanying schedule of findings and questioned costs that we consider to be a significant deficiency as item 2016‐001. Compliance and Other Matters As part of obtaining reasonable assurance about whether the City’s financial statements are free from material misstatement, we performed tests of its compliance with certain provisions of laws, regulations, contracts, and grant agreements, noncompliance with which could have a direct and material effect on the determination of financial statement amounts. However, providing an opinion on compliance with those provisions was not an objective of our audit and, accordingly, we do not express such an opinion. The results of our tests disclosed no instances of noncompliance or other matters that are required to be reported under Government Auditing Standards. City’s Response to Finding The City’s response to the finding identified in our audit is described in the accompanying Schedule of Findings and Questioned Costs. The City’s response was not subjected to the auditing procedures applied to the audit of the financial statements and, accordingly, we express no opinion on it.
‐ 331 ‐
Purpose of This Report The purpose of this report is solely to describe the scope of our testing of internal control and compliance and the results of that testing, and not to provide an opinion on the effectiveness of the City’s internal control or on compliance. This report is an integral part of an audit performed in accordance with Government Auditing Standards in considering the City’s internal control and compliance. Accordingly, this communication is not suitable for any other purpose.
San Antonio, Texas March 9, 2017
‐ 332 ‐
Independent Auditor’s Report on Compliance For Each Major
State Program and on Internal Control over Compliance as
Required by the State of Texas Single Audit Circular
AUSTIN HOUSTON SAN ANTONIO 811 BARTON SPRINGS ROAD, SUITE 550 1980 POST OAK BOULEVARD, SUITE 1100 100 N.E. LOOP 410, SUITE 1100 TOLL FREE: 800 879 4966 AUSTIN, TEXAS 78704 HOUSTON, TEXAS 77056 SAN ANTONIO, TEXAS 78216 WEB: PADGETT‐CPA.COM 512 476 0717 713 335 8630 210 828 6281
Independent Auditor’s Report on Compliance For Each Major State Program and Report on Internal Control Over Compliance as Required by the State of Texas Single Audit Circular To the Honorable Mayor and Members of the City Council City of San Antonio, Texas Report on Compliance for Each Major State Program We have audited the City of San Antonio, Texas’ (the “City”) compliance with the types of compliance requirements described in the State of Texas Single Audit Circular that could have a direct and material effect on each of the City’s major state programs for the year ended September 30, 2016. The City’s major state programs are identified in the summary of auditor’s results section of the accompanying Schedule of Findings and Questioned Costs. The City’s basic financial statements include the operations of the Port Authority of San Antonio, San Antonio Early Childhood Education Municipal Development Corporation dba Pre‐K 4 SA, and San Antonio Water System. Our audit, described below, did not include the operations of the Port Authority of San Antonio, San Antonio Early Childhood Municipal Development Corporation dba Pre‐K 4 SA, or San Antonio Water System because the component units engaged other auditors to perform an audit in accordance with Government Auditing Standards, Uniform Guidance, and the State of Texas Single Audit Circular, as applicable. Management’s Responsibility Management is responsible for compliance with the requirements of laws, regulations, contracts, and grants applicable to its state programs. Auditor’s Responsibility Our responsibility is to express an opinion on compliance for the City’s major state programs based on our audit of the types of compliance requirements referred to above. We conducted our audit of compliance in accordance with auditing standards generally accepted in the United States of America; the standards applicable to financial audits contained in Government Auditing Standards, issued by the Comptroller General of the United States; and the State of Texas Single Audit Circular. Those standards and the State of Texas Single Audit Circular require that we plan and perform the audit to obtain reasonable assurance about whether noncompliance with the types of compliance requirements referred to above that could have a direct and material effect on a major state program occurred. An audit includes examining, on a test basis, evidence about the City’s compliance with those requirements and performing such other procedures as we considered necessary in the circumstances.
‐ 333 ‐
We believe that our audit provides a reasonable basis for our opinion on compliance for each major state program. However, our audit does not provide a legal determination of the City’s compliance.
Opinion on Major State Programs In our opinion, the City complied, in all material respects, with the types of compliance requirements referred to above that could have a direct and material effect on each of its major state programs for the year ended September 30, 2016. Report on Internal Control Over Compliance Management of the City is responsible for establishing and maintaining effective internal control over compliance with the types of compliance requirements referred to above. In planning and performing our audit of compliance, we considered the City’s internal control over compliance with the types of requirements that could have a direct and material effect on each of its major state programs to determine the auditing procedures that are appropriate in the circumstances for the purpose of expressing an opinion on compliance for each of its major state programs and to test and report on internal control over compliance in accordance with the State of Texas Single Audit Circular, but not for the purpose of expressing an opinion on the effectiveness of internal control over compliance. Accordingly, we do not express an opinion on the effectiveness of the City’s internal control over compliance. A deficiency in internal control over compliance exists when the design or operation of a control over compliance does not allow management or employees, in the normal course of performing their assigned functions, to prevent or detect and correct noncompliance with a type of compliance requirement of a state program on a timely basis. A material weakness in internal control over compliance is a deficiency, or combination of deficiencies, in internal control over compliance, such that there is a reasonable possibility that material noncompliance with a type of compliance requirement of a state program will not be prevented or detected and corrected on a timely basis. A significant deficiency in internal control over compliance is a deficiency, or a combination of deficiencies, in internal control over compliance with a type of compliance requirement of a state program that is less severe than a material weakness in internal control over compliance, yet important enough to merit attention by those charged with governance. Our consideration of internal control over compliance was for the limited purpose described in the first paragraph of this section and was not designed to identify all deficiencies in internal control over compliance that might be material weaknesses or significant deficiencies. We did not identify any deficiencies in internal control over compliance that we consider to be material weaknesses. However, material weaknesses may exist that have not been identified. The purpose of this report on internal control over compliance is solely to describe the scope of our testing of internal control over compliance and the results of that testing based on the requirements of the State of Texas Single Audit Circular. Accordingly, this report is not suitable for any other purpose.
San Antonio, Texas March 9, 2017
‐ 334 ‐

Schedule of Findings and Questioned Costs
State
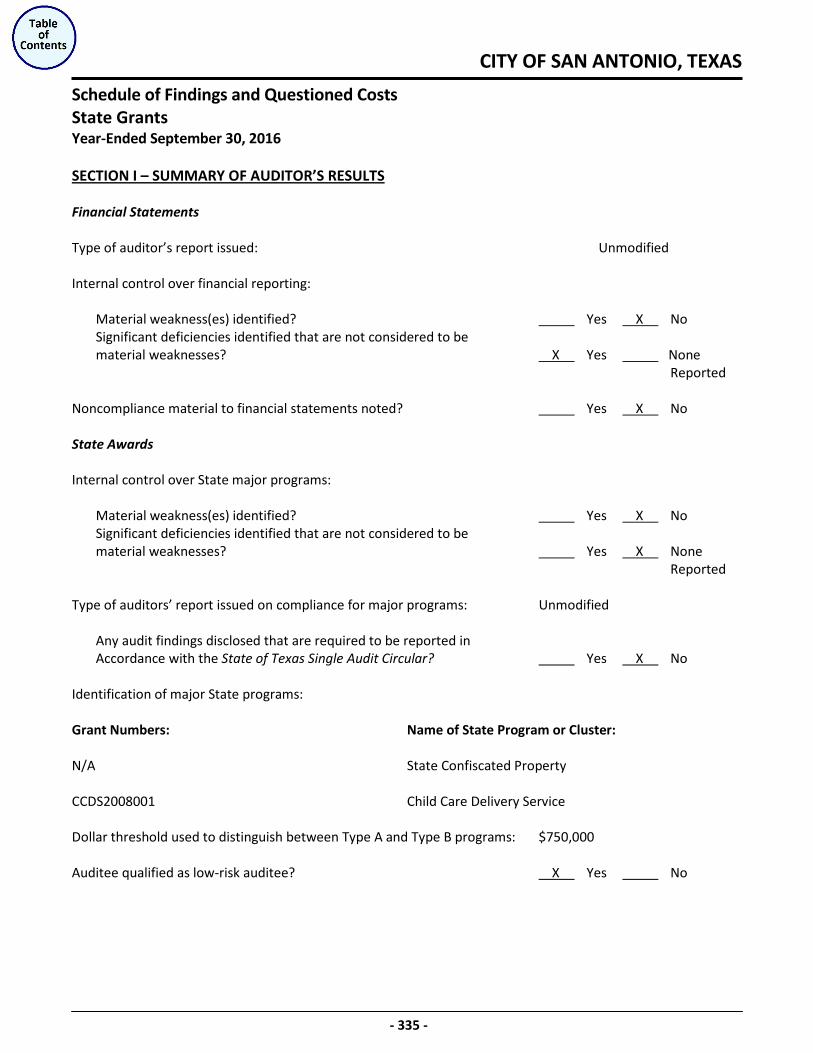
CITY OF SAN ANTONIO, TEXAS
Schedule of Findings and Questioned Costs State Grants Year-Ended September 30, 2016
- 335 -
SECTION I – SUMMARY OF AUDITOR’S RESULTS
Financial Statements Type of auditor’s report issued: Unmodified Internal control over financial reporting: Material weakness(es) identified? Yes X Significant deficiencies identified that are not considered to be
No
material weaknesses? X
Yes None Reported
Noncompliance material to financial statements noted? Yes X
No
State Awards Internal control over State major programs: Material weakness(es) identified? Yes X Significant deficiencies identified that are not considered to be
No
material weaknesses? Yes X
None Reported
Type of auditors’ report issued on compliance for major programs: Unmodified Any audit findings disclosed that are required to be reported in Accordance with the State of Texas Single Audit Circular? Yes X
No
Identification of major State programs: Grant Numbers: Name of State Program or Cluster: N/A State Confiscated Property CCDS2008001 Child Care Delivery Service Dollar threshold used to distinguish between Type A and Type B programs: $750,000 Auditee qualified as low-risk auditee? X
Yes No
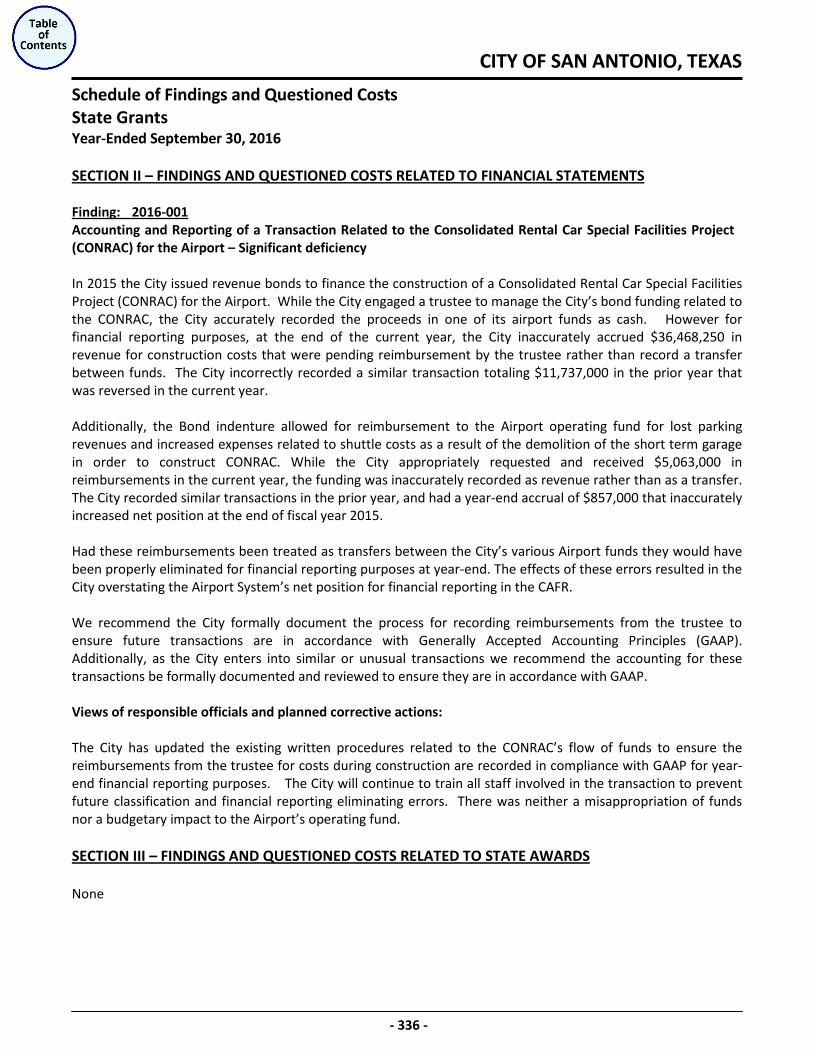
CITY OF SAN ANTONIO, TEXAS
Schedule of Findings and Questioned Costs State Grants Year-Ended September 30, 2016
- 336 -
SECTION II – FINDINGS AND QUESTIONED COSTS RELATED TO FINANCIAL STATEMENTS
Accounting and Reporting of a Transaction Related to the Consolidated Rental Car Special Facilities Project (CONRAC) for the Airport – Significant deficiency
Finding: 2016-001
In 2015 the City issued revenue bonds to finance the construction of a Consolidated Rental Car Special Facilities Project (CONRAC) for the Airport. While the City engaged a trustee to manage the City’s bond funding related to the CONRAC, the City accurately recorded the proceeds in one of its airport funds as cash. However for financial reporting purposes, at the end of the current year, the City inaccurately accrued $36,468,250 in revenue for construction costs that were pending reimbursement by the trustee rather than record a transfer between funds. The City incorrectly recorded a similar transaction totaling $11,737,000 in the prior year that was reversed in the current year. Additionally, the Bond indenture allowed for reimbursement to the Airport operating fund for lost parking revenues and increased expenses related to shuttle costs as a result of the demolition of the short term garage in order to construct CONRAC. While the City appropriately requested and received $5,063,000 in reimbursements in the current year, the funding was inaccurately recorded as revenue rather than as a transfer. The City recorded similar transactions in the prior year, and had a year-end accrual of $857,000 that inaccurately increased net position at the end of fiscal year 2015. Had these reimbursements been treated as transfers between the City’s various Airport funds they would have been properly eliminated for financial reporting purposes at year-end. The effects of these errors resulted in the City overstating the Airport System’s net position for financial reporting in the CAFR. We recommend the City formally document the process for recording reimbursements from the trustee to ensure future transactions are in accordance with Generally Accepted Accounting Principles (GAAP). Additionally, as the City enters into similar or unusual transactions we recommend the accounting for these transactions be formally documented and reviewed to ensure they are in accordance with GAAP. Views of responsible officials and planned corrective actions: The City has updated the existing written procedures related to the CONRAC’s flow of funds to ensure the reimbursements from the trustee for costs during construction are recorded in compliance with GAAP for year-end financial reporting purposes. The City will continue to train all staff involved in the transaction to prevent future classification and financial reporting eliminating errors. There was neither a misappropriation of funds nor a budgetary impact to the Airport’s operating fund.
SECTION III – FINDINGS AND QUESTIONED COSTS RELATED TO STATE AWARDS
None

Corrective Action PlanState

CITY OF SAN ANTONIO, TEXAS
Corrective Action Plan State Grants Year-Ended September 30, 2016
-337-
Finding 2016-001 Accounting and Reporting of a Transaction Related to the Consolidated Rental Car Special Facilities Project (CONRAC) for the Airport
Troy Elliott, CPA, Deputy Chief Financial Officer Responsible Person
Finance Department
March 9, 2017 Implementation Dates
Views of responsible officials and planned corrective actions
The City has updated the existing written procedures related to the CONRAC’s flow of funds to ensure the reimbursements from the trustee for costs during construction are recorded in compliance with GAAP for year-end financial reporting purposes. The City will continue to train all staff involved in the transaction to prevent future classification and financial reporting eliminating errors. There was neither a misappropriation of funds nor a budgetary impact to the Airport’s operating fund.
Summary Status of Prior Year Findings
State
CITY OF SAN ANTONIO, TEXAS
Summary Status of Prior Year Findings State Grants Year-Ended September 30, 2016
- 338 -
None

CITY OF SAN ANTONIO, TEXAS