disaster response preparedness coordination through social networks
TRANSCRIPT

Disaster response preparedness coordination through social networks
Liaquat Hossain Director, and Matthew Kuti Advisory Board member, Project Management Graduate Programme, University of Sydney, Australia
Studies of coordination in human networks have typically presented models that require stable working relationships. These models cannot be applied to emergency response management, which demands distributed coordination in volatile situations. This paper argues that changes to interconnectedness of nodes in a network may have implications for the potential to coordinate. A social network-based coordination model is proposed to explore an organizational actor’s state of readiness in extreme conditions. To test this hypothesis, the study investigates survey data from state law enforcement, state emergency services and local law enforcement, presenting agency-based (macro) and cross-agency (micro) analysis on 224 completed questionnaires. The main findings are: (i) there is a positive correlation between network connectedness and the potential to coordinate; (ii) the concept of tiers within an emergency response network may exist and be characterized by the sub-network with which an organization associates; (iii) a range or threshold characterizes how interconnected an organization at a given tier should be.
Keywords: centrality, coordination, disaster, emergency response, organizational cliques, preparedness, social networks
IntroductionThis paper introduces the concept of coordination and investigates its components, general application and interdisciplinary uses. The focus then turns to a specific form of coordination pertinent to distributed networks and how the complexity of the dispersed network structure affects the capacity to coordinate. Preexisting models of coordination are examined to overcome the challenges of a distributed structure—without success. The pervasive threat of natural and manmade disasters has led to a societal shift of time and resources towards being equipped to handle crisis situations. Based on the literature of Waugh (2003) and Kapucu (2005), this paper defines a disaster as a destructive event creating negative social and economic conditions that interrupt the daytoday activities of a society. Comfort and Kapucu (2003) note that in response to a manmade disaster such as a terrorist attack, a twophased operation is launched simultaneously. The first response is identified as crisis management, which incorporates seeking the perpetrators of the disaster and bringing them to justice. The second phase, which is the focus of this study and is also launched in a naturally occurring disaster, is known as consequence management and involves launching an interorganizational multisector (emergency response network) response to assist and rescue victims of a crisis event.
doi:10.1111/j.03613666.2010.01168.x
Disasters, 2010, 34(3): 755−786. © 2010 The Author(s). Journal compilation © Overseas Development Institute, 2010 Published by Blackwell Publishing, 9600 Garsington Road, Oxford, OX4 2DQ, UK and 350 Main Street, Malden, MA 02148, USA

Liaquat Hossain and Matthew Kuti756
Arguably, the motivation for a society to fund and develop consequence management initiatives stems from the need to create a society resilient to disaster incidents. Within a crisis setting, the term resilience as applied to a society may be aptly described as the ability to recover and return to a precrisis state (Kapucu, 2005). Current literature regarding the lessons learned from recent disaster response efforts have presented several key areas preventing an emergency response network (ERN) from reaching the target level of resilience. Typical measures of resilience can be identified as the number of lives lost in an event, the elapsed time until recovery and the general economic and social impact. Documentation by Borkulo et al. (2005) highlights many of the underlying problems for an emergency response as a result of poor coordination, which causes a lack of good communication between organizations, a lack of uptodate and relevant information circulating through the ERN and insufficient access to data and action plans. Yuan and Detlor (2005) support Borkulo et al. (2005) in regards to their perspective on the current state of emergency response efforts; they emphasize the necessity of emergency response teams—including medical, fire and police—to be able to coordinate their actions and resources in hazardous, uncertain and timecritical disaster environments. This study recommends a possible solution for distributed network challenges by investigating coordination from a social networking perspective. Measures of social networks theory are introduced as a means of exploring the group structure and assessing the current state of actor involvement. It is suggested that by increasing the efficiency of the actor’s connectedness within the network, an increase in the potential for the network to coordinate effectively may be found. The US emergency response network is investigated as a case study that demonstrates the symptoms of poor coordination efficiency, which is assumed to be generated by the distributed and interorganizational network structure. The theoretical contributions from this study are designed to produce a new perspective for overcoming coordination problems in ERNs and generating discussion for increasing network performance. Based on the research findings, a model is introduced for assessing the current state of coordination as a reflection of the distributed network. The model hypothesizes a correlated relationship between the network and the level of coordination; by increasing network connectedness, coordination challenges and communication gaps may thus be reduced.
The relationship between social networks and coordinationTo investigate the qualities and attributes of network relationships within a distributed structure, this paper applies a social networks approach. Developed by sociologists at the turn of the 20th century, social networks theory is based on the study of relationships between people with a focus on measuring the structural patterns of exchanges to determine behavioural outcomes (Marsden, 2002; Chung, Hossain and Davis, 2005; Breiger, 2004). The basic framework of a social network can be viewed as a set of actors and a set of links between those actors. The social network analysis

Disaster response preparedness coordination through social networks 757
(SNA) definition of an actor may describe an individual or a collection of people sharing something in common, such as an organization. The formation of a social network is typically associated with the need for an actor to receive some sort of information or resource; the network allows for an exchange whereby actors invest in relationships determined by their level of need. Traditional SNA looked at this framework on a smallscale network of friends or the like, whereby a small number of links exist and the network itself is stable. A limited number of studies have considered SNA on largescale networks, such as interorganizational relationships; however, these types of studies are uncommon (Carley, 2003). The study of SNA plays a vital role in identifying and quantifying the patterns of network behaviour based on the shadow or informal network, which functions at a level beyond the formal and traditional organizational structure of relationships. Investigation of the informal network is useful to detect network properties, such as which actors have the most influence, who is more involved in the network, and whose contributions are inhibiting network efficiency (Chung, Hossain and Davis, 2005). The informal network can present what would otherwise be unnoticed communication links within the network that allows for a particular actor to be better positioned and more influential within the network structure (Mullen, Johnson and Salas, 1991). Approaches to studying a social network are determined by the type of network under investigation and its associated level of data collection. Researchers agree that network analysis may be assessed by one of two methods: egocentric and sociocentric (Carrasco et al., 2006; Marsden, 2002; Chung, Hossain and Davis, 2005; Borgatti and Foster, 2003). The usefulness of applying SNA to a network may be appreciated across many disciplines for different reasons. By examining a network in terms of actors and relationships, predictions may be made, which allows forecasting of developments such as the spread of infection or the dissemination of innovation (Borgatti, 2005). Beyond the ability for prediction, SNA also allows disciplines to investigate a network to discover insight into how and why information within a network travels, such as who receives organizational gossip in a workplace, which may in turn have consequences for organizational performance (Borgatti, 2005). The ability to make this sort of inference can be especially useful for studying coordination in a distributed setting, as understanding the inner workings of a network may help to identify problems that are inhibiting coordination and areas that can be improved. Many studies have shown the vast applicability of SNA to different domains and just how useful such studies are in measuring the structural qualities and behaviours of the network against specific outcomes (Brandes and Fleischer, 2005). By assessing a distributed network based on attributes of SNA, it may be possible to provide insight into the current state of coordination and reasons for a particular outcome. In an organization, the multifaceted nature of coordination can be seen by the need for employees to share information, delegate tasks or cooperate to solve problems. In each instance, according to Malone and Crowston (1990), the aspect that constitutes coordination is the management of the relationship interdependencies

Liaquat Hossain and Matthew Kuti758
required to achieve a particular task. SNA allows for the investigation and visualization of a network in order to understand the relationships and network properties that are associated with a particular outcome of coordination (Chung, Hossain and Davis, 2005). This approach to studying coordination helps provide insight into network conditions, such as how involved certain actors are, whether any structural holes exist and any other enabling or inhibiting factors that may produce a particular coordination outcome. In order to assess coordination from social networks theory, it is important to select the most appropriate measures for correct assessment of the possible cause of an outcome. Marsden’s (2002) research into egocentric measures looks at the key differences between egocentric and sociocentric assessment techniques and identifies measures for investigating a distributed network, which is examined in the methodology chapter. In order to develop the contextbased component of a coordination model, it is important to understand the attributes of the context itself. An emergency response network is a very dynamic and ad hoc network that is formed for the sole purpose of responding to a crisis (Perdu and Levis, 1998). Once a disaster has been brought under control and overcome, the networked organizations return to being inwardly focused as the network is disassembled just as quickly as it materialized. As there is no central point of control, it is the responsibility of each agency to collaborate with agencies across horizontal and vertical business sector boundaries in order to work together in highly stressful and timecritical conditions. The US National Response Plan (NRP) describes the varied roles and responsibilities of each organizational sector in an emergency and a basic design for how an ERN should function in a crisis (DHS, 2006). The plan implies a loose leadership structure led by the federal government and then state and local levels to guide the emergency network and all other sectors involved in the response. This paper argues that an ERN can be segmented into a threetiered structure of network leadership that guides the level of interconnectedness and network involvement displayed by a particular organization. It describes the network structure as taking a bottomup approach to its formation, as organizations may simply volunteer to participate, creating a limitless number of possible actors involved in the disaster recovery effort. It is likely that a cause of communication problems within the network may be a result of this structure, which has the potential to increase the cost of coordination due to the greater number of information paths. Borkulo et al. (2005) describe these network qualities and disaster attributes as likely causes for an inhibited interorganizational response effort.
Development of a research model for emergency coordinationCoordination theorists attempt to analyse and assess interdependencies and levels of coordination by using conceptual modelling in specific domains and contexts

Disaster response preparedness coordination through social networks 759
(Malone, 1987). Although the models may not produce a consensus of the characteristics of coordination, nor their meaning, each interpretation is able to identify specific challenges of coordination, which may help to establish a reference model of coordination that may be applied through interdisciplinary contexts. Mintzberg’s (1979) study of coordination in organizations finds that the mechanisms of coordination are dependent on organizational structure. These mechanisms can be identified as:
1. Mutual adjustment—decisions are reached internally through informal peertopeer communication, with the guidance of a manager.
2. Direct supervision—a supervisor is responsible for the coordination of actors and tasks by giving directions.
3. Standardization of work—the work to be done is explicit, which removes the need for any decisions to be made.
4. Standardization of outputs—the deliverables are made explicit, which removes the need for decisions and issues relating to the use of the deliverables.
5. Standardization of skills—defines the training required for work to be done.
Standardization of workStandardization of outputsStandardization of skills
Operator Operator
Analyst
Manager
O O
A
M
O O
A
M
O O
A
M
Input skills Work process
Ouputs
Mutual adjustment:Informal communication
Direct supervision:One is responsible for others
Figure 1 Mintzberg’s model, 1979
Source: Tolksdorf (2000).
Liaquat Hossain and Matthew Kuti760
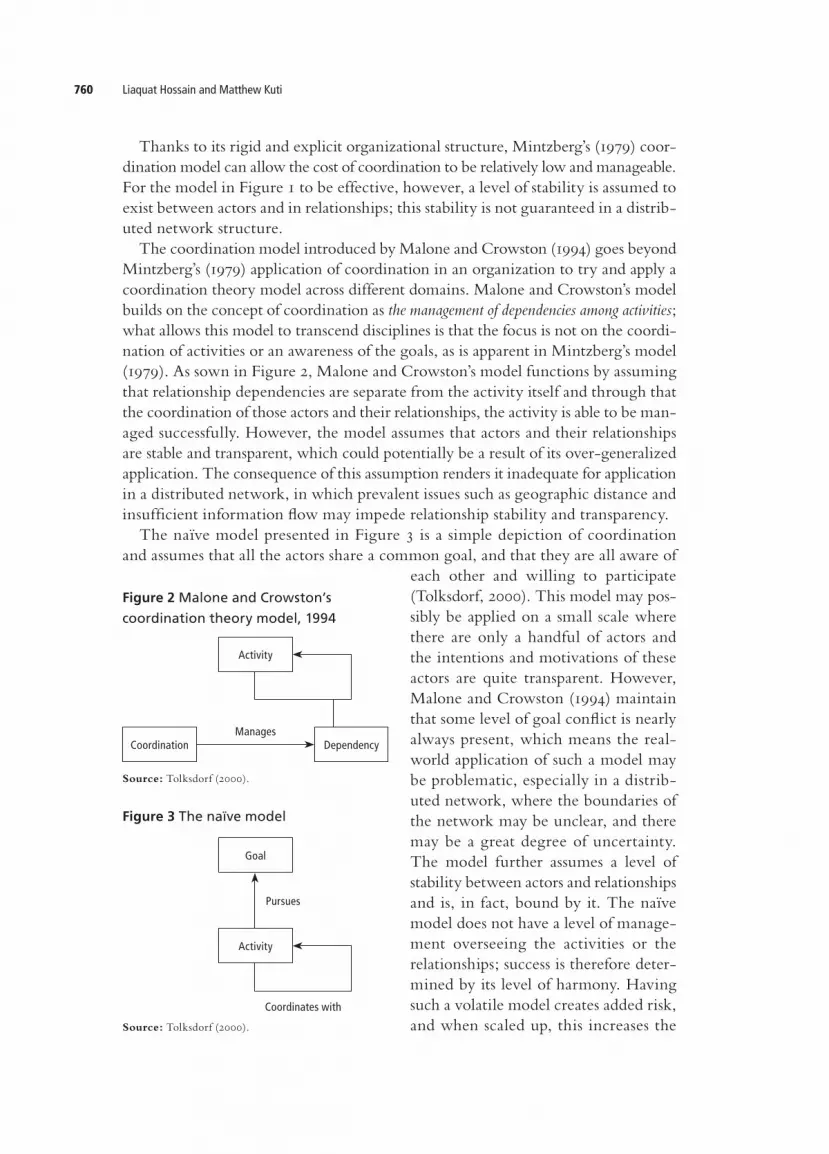
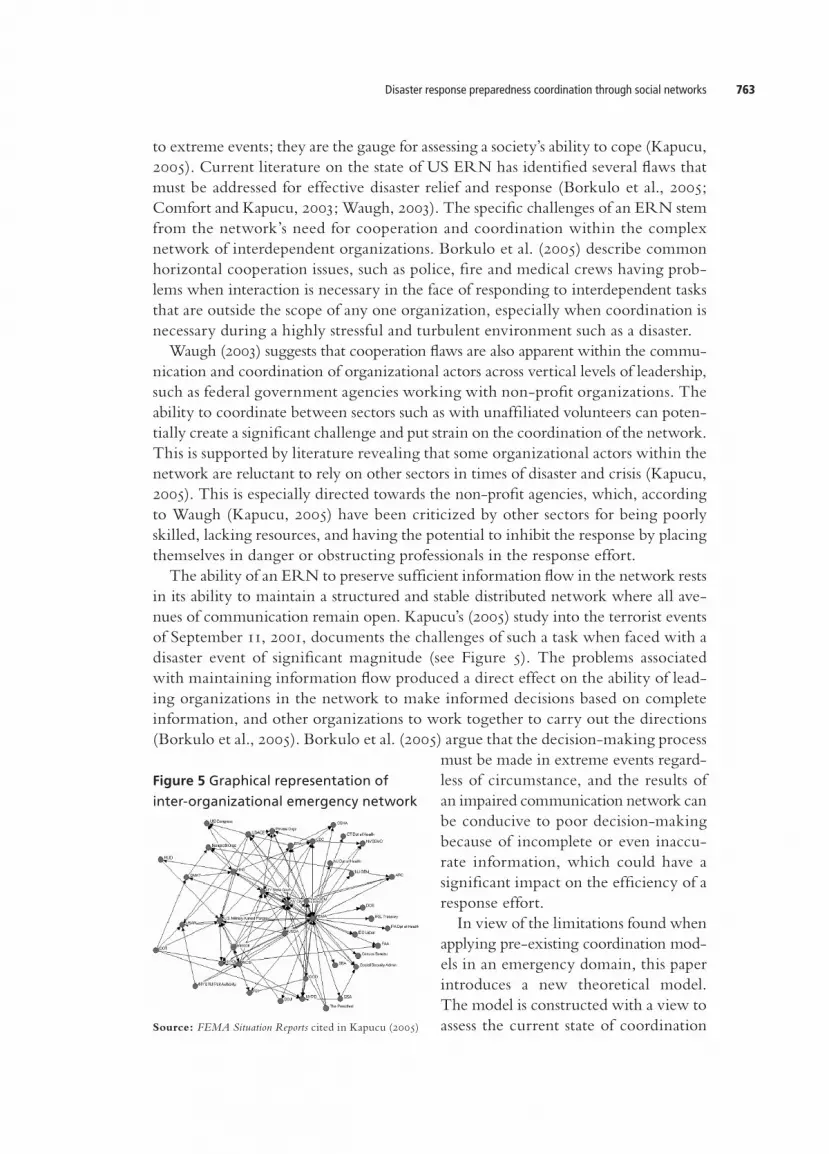
Thanks to its rigid and explicit organizational structure, Mintzberg’s (1979) coordination model can allow the cost of coordination to be relatively low and manageable. For the model in Figure 1 to be effective, however, a level of stability is assumed to exist between actors and in relationships; this stability is not guaranteed in a distributed network structure. The coordination model introduced by Malone and Crowston (1994) goes beyond Mintzberg’s (1979) application of coordination in an organization to try and apply a coordination theory model across different domains. Malone and Crowston’s model builds on the concept of coordination as the management of dependencies among activities; what allows this model to transcend disciplines is that the focus is not on the coordination of activities or an awareness of the goals, as is apparent in Mintzberg’s model (1979). As sown in Figure 2, Malone and Crowston’s model functions by assuming that relationship dependencies are separate from the activity itself and through that the coordination of those actors and their relationships, the activity is able to be managed successfully. However, the model assumes that actors and their relationships are stable and transparent, which could potentially be a result of its overgeneralized application. The consequence of this assumption renders it inadequate for application in a distributed network, in which prevalent issues such as geographic distance and insufficient information flow may impede relationship stability and transparency. The naïve model presented in Figure 3 is a simple depiction of coordination and assumes that all the actors share a common goal, and that they are all aware of
each other and willing to participate (Tolksdorf, 2000). This model may possibly be applied on a small scale where there are only a handful of actors and the intentions and motivations of these actors are quite transparent. However, Malone and Crowston (1994) maintain that some level of goal conflict is nearly always present, which means the realworld application of such a model may be problematic, especially in a distributed network, where the boundaries of the network may be unclear, and there may be a great degree of uncertainty. The model further assumes a level of stability between actors and relationships and is, in fact, bound by it. The naïve model does not have a level of management overseeing the activities or the relationships; success is therefore determined by its level of harmony. Having such a volatile model creates added risk, and when scaled up, this increases the
Coordination Dependency
Activity
Manages
Activity
Goal
Coordinates with
Pursues
Figure 2 Malone and Crowston’s
coordination theory model, 1994
Source: Tolksdorf (2000).
Source: Tolksdorf (2000).
Figure 3 The naïve model

Disaster response preparedness coordination through social networks 761
chances of miscommunication, differing agendas and relationship strain, all potentially causing the model to fail. It has been mentioned that with every additional node entering a distributed network, the chance of network failure increases due to unmanageable complexity and information redundancy. In mathematical terms, this risk or probability of network failure can be expressed as Pf=f (Pa, Pd, Pi), where Pa, Pd and Pi represent the probability of failure because of distributed analysis, design and implementation, respectively (Berenbach, 2006). Hinds and McGrath (2006) support Berenbach’s statement by suggesting that in distributed teams, the cost of communication is magnified because of the inherent nodetonode structure. Another source of potential problems apparent in distributed networks is based on the human element. Hinds and McGrath find that rapport and trust may be particularly hard to monitor in a distributed environment, which could also affect the network’s ability to collaborate and reach any consensus for decisionmaking. Such problems may lead to reduced information flow through the network and may inhibit the network’s ability to function effectively (Carley, Lee and Krackhardt, 2001). It has also been noted that within a distributed network, the reliance on information being passed through the network to attain a complete picture may be a source of problems. The agenda from actor to actor within a distributed network may differ, which could influence how willingly an person may pass on information instead of treating it as leverage to gain status, or seeking individual goals (Ahuja, Carley and Galletta, 1997). As evident with the problems of coordination in a distributed network, it seems that the concept of a universally applied coordination model cannot be utilized in this framework. Based on the models examined, no one preexisting method can be applied in a distributed setting (see Table 1). The challenge for the study of coordination in a distributed environment is to create a model that is contextdriven and developed based on the problems of a disperse network. A dominant characteristic of coordination in this type of context is the network structure itself. By developing a model that focuses on the relationship between the network and its correlation with coordination, an assessment of the current workings of a distributed network can be analysed and assessed against its effect on coordination. Although each of the preexisting models brings useful perspectives to enhance coordination
Table 1 Coordination assessment models
Coordination assessment model
Effective in distributed networks
Does not rely on stable actors and relationships
Scalable Low coordination cost
Effective in complex networks
Mintzberg’s model
Coordination theory model
Naïve model

Liaquat Hossain and Matthew Kuti762
in specific domains, no one model looks at the network itself to draw conclusions about coordination; instead, they focus on achieving coordination by managing either the task, as is the case with the Mintzberg model, or the relationship dependencies, as shown in Malone and Crowston’s coordination theory model. These types of structures seem very inwardly focused and impractical where interdependent tasks suffer from conflicting motivations, and relationships are volatile and unpredictable. For applicability in complex distributed networks, research into the network itself seems necessary to enhance understanding of communication structures and properties of interconnectedness. The effect of a disaster, regardless of whether it is natural or manmade, brings about a disrupted state of negative social and economic conditions (Kapucu, 2005). The aim of an emergency response network is to respond to extreme events as quickly and efficiently as possible in order to return the society to a ‘businessasusual’ state, thus restoring social confidence and economic stability (Waugh, 2003). Extreme events trigger the launch of what is known as consequence management, which is the motivation for establishing an ERN with the goal of saving victims’ lives (see Figure 4) (FEMA, 1999; Comfort and Kapucu, 2003). Consequence management requires the mobilization of a complex network of organizations designed to form rapidly to coordinate a multifaceted disaster response and then quickly dissolve once the incident has been controlled (Kapucu, 2003; 2005). The effectiveness of consequence management may be defined through quantifiable measures such as the number of lives lost, property damage or overall time until recovery. These quantifiable measures are what define a society’s ‘resilience’
Figure 4 High-level crisis and consequence management deployment plan
Source: FEMA (1999).
LAW ENFORCEMENT
THREAT ASSESSMENT AND CONSULTATION
WMDTECHNICAL SUPPORT
FOLLOW-ON ASSETS TO SUPPORT THE RESPONSE TO CONSEQUENCES ON LIVES AND PROPERTY
CRIS
IS M
ANAGEM
ENT
CONSEQUENCE MANAGEM
ENT
Disaster response preparedness coordination through social networks 763
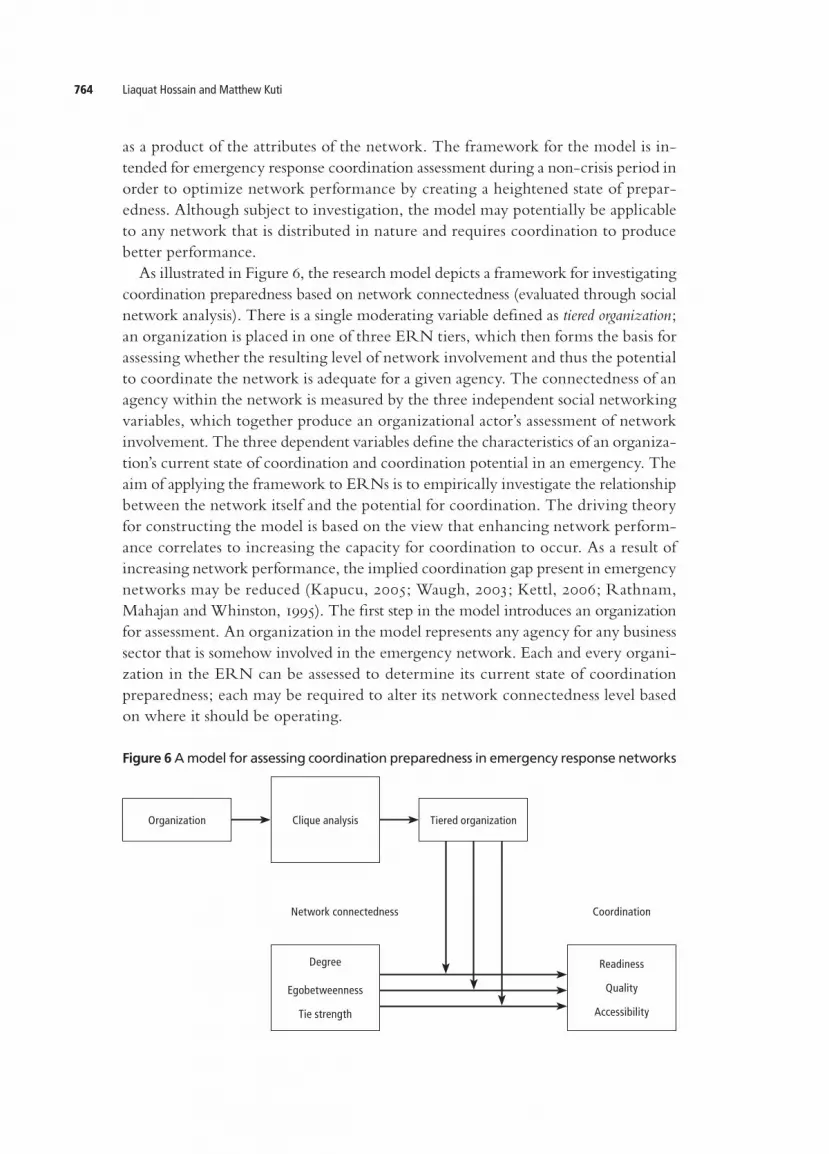
to extreme events; they are the gauge for assessing a society’s ability to cope (Kapucu, 2005). Current literature on the state of US ERN has identified several flaws that must be addressed for effective disaster relief and response (Borkulo et al., 2005; Comfort and Kapucu, 2003; Waugh, 2003). The specific challenges of an ERN stem from the network’s need for cooperation and coordination within the complex network of interdependent organizations. Borkulo et al. (2005) describe common horizontal cooperation issues, such as police, fire and medical crews having problems when interaction is necessary in the face of responding to interdependent tasks that are outside the scope of any one organization, especially when coordination is necessary during a highly stressful and turbulent environment such as a disaster. Waugh (2003) suggests that cooperation flaws are also apparent within the communication and coordination of organizational actors across vertical levels of leadership, such as federal government agencies working with nonprofit organizations. The ability to coordinate between sectors such as with unaffiliated volunteers can potentially create a significant challenge and put strain on the coordination of the network. This is supported by literature revealing that some organizational actors within the network are reluctant to rely on other sectors in times of disaster and crisis (Kapucu, 2005). This is especially directed towards the nonprofit agencies, which, according to Waugh (Kapucu, 2005) have been criticized by other sectors for being poorly skilled, lacking resources, and having the potential to inhibit the response by placing themselves in danger or obstructing professionals in the response effort. The ability of an ERN to preserve sufficient information flow in the network rests in its ability to maintain a structured and stable distributed network where all avenues of communication remain open. Kapucu’s (2005) study into the terrorist events of September 11, 2001, documents the challenges of such a task when faced with a disaster event of significant magnitude (see Figure 5). The problems associated with maintaining information flow produced a direct effect on the ability of leading organizations in the network to make informed decisions based on complete information, and other organizations to work together to carry out the directions (Borkulo et al., 2005). Borkulo et al. (2005) argue that the decisionmaking process
must be made in extreme events regardless of circumstance, and the results of an impaired communication network can be conducive to poor decisionmaking because of incomplete or even inaccurate information, which could have a significant impact on the efficiency of a response effort. In view of the limitations found when applying preexisting coordination models in an emergency domain, this paper introduces a new theoretical model. The model is constructed with a view to assess the current state of coordination
Figure 5 Graphical representation of
inter-organizational emergency network
Source: FEMA Situation Reports cited in Kapucu (2005)
Liaquat Hossain and Matthew Kuti764
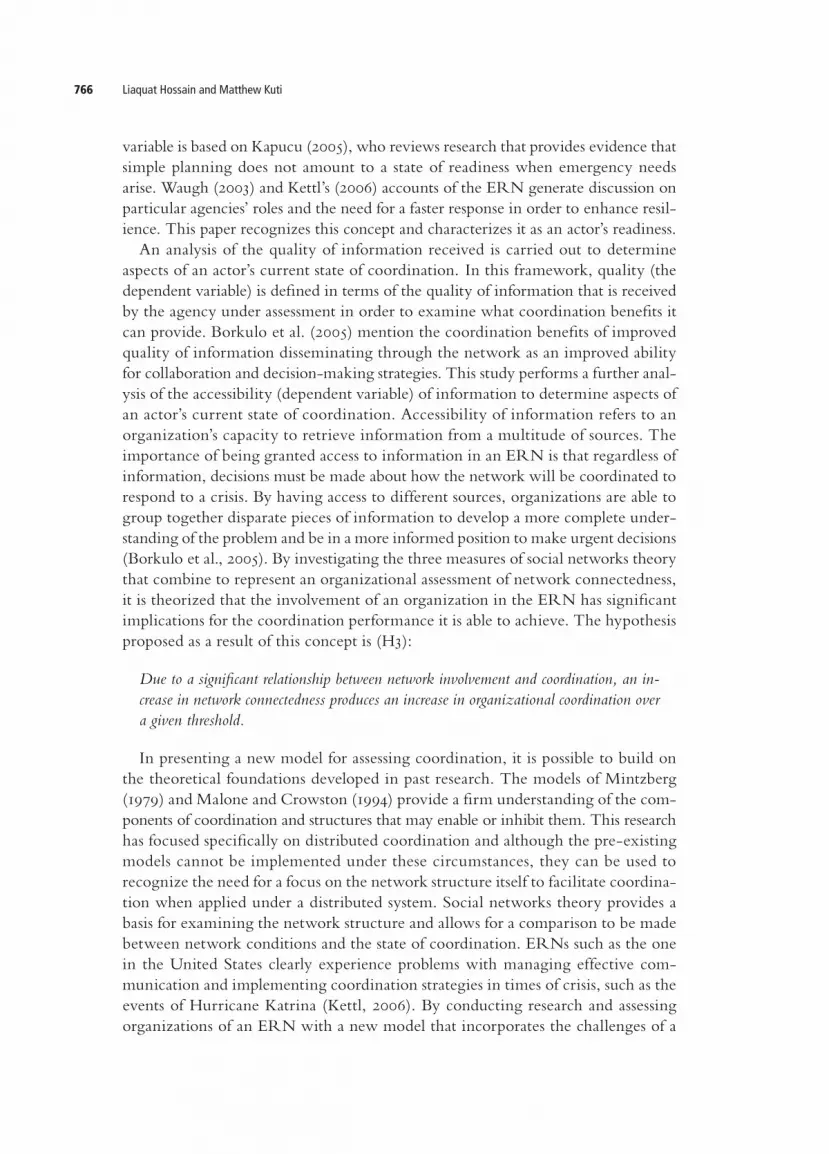
as a product of the attributes of the network. The framework for the model is intended for emergency response coordination assessment during a noncrisis period in order to optimize network performance by creating a heightened state of preparedness. Although subject to investigation, the model may potentially be applicable to any network that is distributed in nature and requires coordination to produce better performance. As illustrated in Figure 6, the research model depicts a framework for investigating coordination preparedness based on network connectedness (evaluated through social network analysis). There is a single moderating variable defined as tiered organization; an organization is placed in one of three ERN tiers, which then forms the basis for assessing whether the resulting level of network involvement and thus the potential to coordinate the network is adequate for a given agency. The connectedness of an agency within the network is measured by the three independent social networking variables, which together produce an organizational actor’s assessment of network involvement. The three dependent variables define the characteristics of an organization’s current state of coordination and coordination potential in an emergency. The aim of applying the framework to ERNs is to empirically investigate the relationship between the network itself and the potential for coordination. The driving theory for constructing the model is based on the view that enhancing network performance correlates to increasing the capacity for coordination to occur. As a result of increasing network performance, the implied coordination gap present in emergency networks may be reduced (Kapucu, 2005; Waugh, 2003; Kettl, 2006; Rathnam, Mahajan and Whinston, 1995). The first step in the model introduces an organization for assessment. An organization in the model represents any agency for any business sector that is somehow involved in the emergency network. Each and every organization in the ERN can be assessed to determine its current state of coordination preparedness; each may be required to alter its network connectedness level based on where it should be operating.
Figure 6 A model for assessing coordination preparedness in emergency response networks
Organization Tiered organizationClique analysis
Degree
Egobetweenness
Tie strength
Readiness
Quality
Accessibility
Network connectedness
Coordination

Disaster response preparedness coordination through social networks 765
A clique analysis is then carried out to assign tier allocation. According to Hanneman and Riddle (2005), a clique can be defined as a subset of actors within a network that are so closely tied that they inevitably create a subgroup. The analysis technique is used in the framework to assess to which cluster an organization belongs. According to the NRP (DHS, 2006), each agency involved in consequence management is responsible for taking on certain leadership roles within the ERN. The NRP implies a loosely based leadership structure that is assumed to represent three tiers of responsibility; federal organizations represent the first tier, followed by state and local agencies, and then all other sectors and organizations. The clique analysis of an organization is hypothesized to provide evidence of tier placement based on an actor’s subgroup association. The reasoning behind this theory is that, for example, if an organization communicates with significantly more state and local authorities, it is likely that the agency being assessed also belongs to that particular tier. This leads to the first hypothesis that (H1):
An organization’s tier placement can be predicted based on its group association.
A tier level determines an organization’s expected level of network connectedness. This study uses tiered organization as a moderating variable. A tiered organization represents an agency that has been placed in a particular tier group that determines its expected level of network involvement. Based on NRP literature (DHS, 2006), an association with a particular tier retains expectations of network leadership and coordination facilitation. By this reasoning, an assessment of coordination preparedness is imbalanced across all organizations as performance expectations are not equal and therefore a weighted score based on tier positioning is required. This leads to the second hypothesis (H2):
The level of network involvement expected from an organization is mediated by associations in its tier.
Next, this study then uses network connectedness as an independent measure in the model. A degree centrality analysis is carried out to determine aspects of the network of a particular actor, or ego. Degree as an independent variable is used to measure connectedness, which defines the number of relationships (also known as arcs or ties) to which a particular node (actor) is connected. Marsden (2002) mentions that the identical degree centrality measure may be used for an egocentric analysis as the principal for defining relationships remains the same. Egobetweenness analysis is then carried out to determine aspects of an ego’s network, in which the measure of betweenness characterizes the extent to which a node lies in between other nodes in the network (Chung, Hossain and Davis, 2005; Freeman, 1977). Lastly, a tie strength analysis is carried out to determine aspects of an ego’s network. An analysis of readiness is carried out to determine aspects of an actor’s current state of coordination. Readiness is used as a dependent variable to define an organization’s perceived ability to react to a crisis event should the need arise at any given moment. The
Liaquat Hossain and Matthew Kuti766
variable is based on Kapucu (2005), who reviews research that provides evidence that simple planning does not amount to a state of readiness when emergency needs arise. Waugh (2003) and Kettl’s (2006) accounts of the ERN generate discussion on particular agencies’ roles and the need for a faster response in order to enhance resilience. This paper recognizes this concept and characterizes it as an actor’s readiness. An analysis of the quality of information received is carried out to determine aspects of an actor’s current state of coordination. In this framework, quality (the dependent variable) is defined in terms of the quality of information that is received by the agency under assessment in order to examine what coordination benefits it can provide. Borkulo et al. (2005) mention the coordination benefits of improved quality of information disseminating through the network as an improved ability for collaboration and decisionmaking strategies. This study performs a further analysis of the accessibility (dependent variable) of information to determine aspects of an actor’s current state of coordination. Accessibility of information refers to an organization’s capacity to retrieve information from a multitude of sources. The importance of being granted access to information in an ERN is that regardless of information, decisions must be made about how the network will be coordinated to respond to a crisis. By having access to different sources, organizations are able to group together disparate pieces of information to develop a more complete understanding of the problem and be in a more informed position to make urgent decisions (Borkulo et al., 2005). By investigating the three measures of social networks theory that combine to represent an organizational assessment of network connectedness, it is theorized that the involvement of an organization in the ERN has significant implications for the coordination performance it is able to achieve. The hypothesis proposed as a result of this concept is (H3):
Due to a significant relationship between network involvement and coordination, an in-crease in network connectedness produces an increase in organizational coordination over a given threshold.
In presenting a new model for assessing coordination, it is possible to build on the theoretical foundations developed in past research. The models of Mintzberg (1979) and Malone and Crowston (1994) provide a firm understanding of the components of coordination and structures that may enable or inhibit them. This research has focused specifically on distributed coordination and although the preexisting models cannot be implemented under these circumstances, they can be used to recognize the need for a focus on the network structure itself to facilitate coordination when applied under a distributed system. Social networks theory provides a basis for examining the network structure and allows for a comparison to be made between network conditions and the state of coordination. ERNs such as the one in the United States clearly experience problems with managing effective communication and implementing coordination strategies in times of crisis, such as the events of Hurricane Katrina (Kettl, 2006). By conducting research and assessing organizations of an ERN with a new model that incorporates the challenges of a
Disaster response preparedness coordination through social networks 767
distributed network, it may be possible to identify current network shortfalls that may impact the network’s ability to coordinate in a crisis situation. In optimizing the interconnectedness of the network prior to a disaster, it should be possible to raise the level of preparedness exhibited by the network so that the actions of the network in a crisis can replicate that of a planned response.
Social network analysis: data collection, analysis and interpretationSince the inception of social networks theory in the 1930s, several different measures have been created to assess structural conditions of a network. Current literature defines one of the main methods of measuring SNA through centrality, a method developed by Bavelas in 1948 (Freeman, 1977; Chung, Hossain and Davis, 2005). The method of centrality focuses on the relative position of actors within a network, and their connectivity within the network structure. These measures each address different attributes associated with particular actors to assess their level of centralization within the network. Other measures of SNA include density and tie strength, which assess element of an ego’s network. These measures are useful when studying a network in which the boundaries are unclear and studying a complete network is not viable. When studying a social network, approaches to its investigation are determined by the type of network and its associated level of data collection. As noted above, researchers agree that network analysis may be assessed by either the egocentric or the sociocentric method. A closed population such as a group of friends may be studied using a ‘whole’ or sociocentric methodology in order to assess structural patterns of relationships with a view to explaining how those patterns correlate to an outcome, such as which actors in the network are privy to gossip (Marsden, 2002; Chung, Hossain and Davis, 2005). The sociocentric approach is derived from work in sociology and involves the quantification of relationships between people and a defined group. However, Marsden (2002) comments that when the sociocentric approach is applied to large or interorganizational networks, access to complete network data on all social links may be unattainable and may therefore skew any analysis based on measures of the network structure. An egocentric approach to network analysis focuses on an ego and that ego’s surrounding contacts, known as alters. Called a ‘network of me’ by by Carrasco et al., this type of investigation focuses on the social environments surrounding an individual (Carrasco et al., 2006; Chung, Hossain and Davis, 2005; Borgatti and Foster, 2003). A study based on an egocentric approach creates a localized network assessment and can provide generalized information about specific aspects of a network, such as subnetwork groupings or cliques. Its use is derived from circumstances in which network data is incomplete or network boundaries are difficult to define, such as in the case of investigating largescale interorganizational networks (Carrasco et al., 2006). Data collection for an egocentric assessment may be acquired through
Liaquat Hossain and Matthew Kuti768
survey means to represent a perceived network as it is understood by the respondent; data may be collected for several unrelated respondents or egos in order to form a crosssection of the network (Borgatti and Foster, 2003).
Measures of social network analysis for coordination
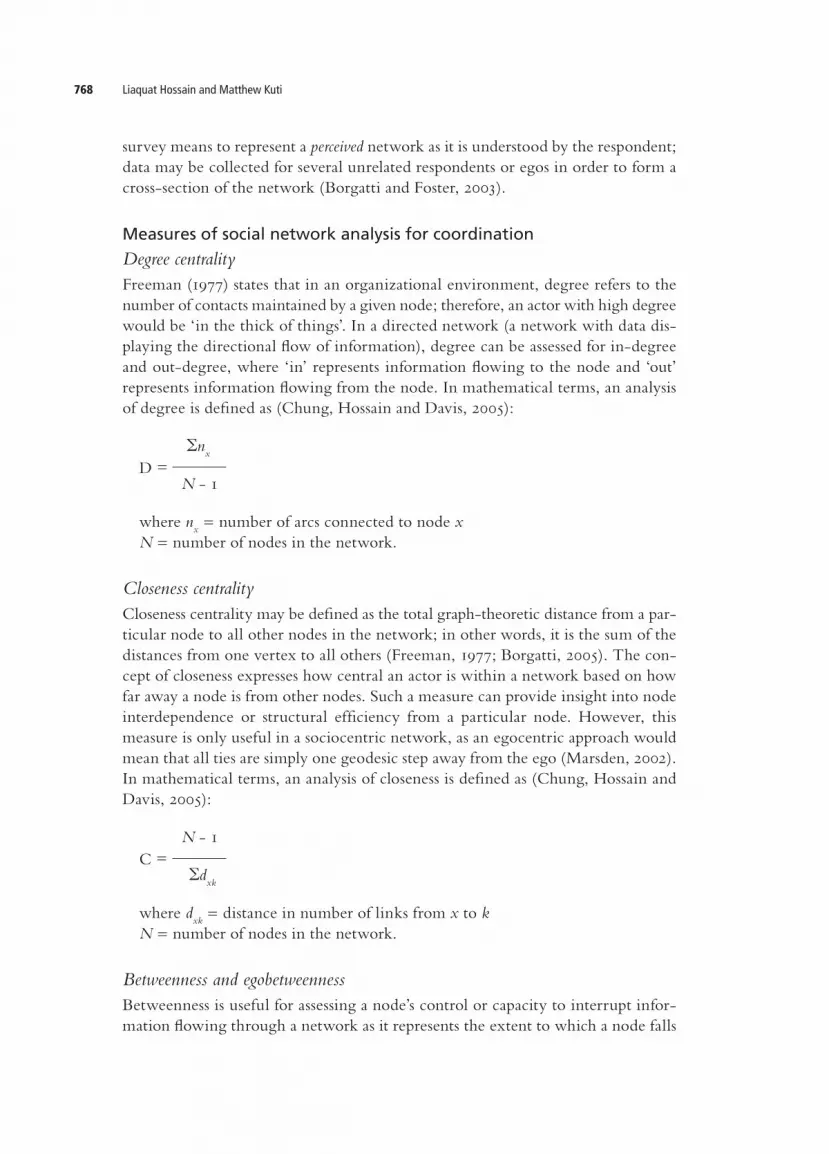
Degree centralityFreeman (1977) states that in an organizational environment, degree refers to the number of contacts maintained by a given node; therefore, an actor with high degree would be ‘in the thick of things’. In a directed network (a network with data displaying the directional flow of information), degree can be assessed for indegree and outdegree, where ‘in’ represents information flowing to the node and ‘out’ represents information flowing from the node. In mathematical terms, an analysis of degree is defined as (Chung, Hossain and Davis, 2005):
D =
nx
N 1
where nx = number of arcs connected to node x
N = number of nodes in the network.
Closeness centralityCloseness centrality may be defined as the total graphtheoretic distance from a particular node to all other nodes in the network; in other words, it is the sum of the distances from one vertex to all others (Freeman, 1977; Borgatti, 2005). The concept of closeness expresses how central an actor is within a network based on how far away a node is from other nodes. Such a measure can provide insight into node interdependence or structural efficiency from a particular node. However, this measure is only useful in a sociocentric network, as an egocentric approach would mean that all ties are simply one geodesic step away from the ego (Marsden, 2002). In mathematical terms, an analysis of closeness is defined as (Chung, Hossain and Davis, 2005):
C = N 1
dxk
where dxk
= distance in number of links from x to k N = number of nodes in the network.
Betweenness and egobetweennessBetweenness is useful for assessing a node’s control or capacity to interrupt information flowing through a network as it represents the extent to which a node falls

Disaster response preparedness coordination through social networks 769
on the shortest path between pairs of other nodes (Chung, Hossain and Davis, 2005). A betweenness assessment can reveal bottlenecks in communication and structural weak points to information flow. A hierarchical network system would reveal high levels of betweenness for actors in executive positions in an organizational chart, whereas in a distributed network, a betweenness assessment would typically reveal lower levels of betweenness and a lower capacity to break down a network. Marsden (2002) comments that although the betweenness measure can be used for both a sociocentric and egocentric network, the application of a single formula may provide misleading results. This is because in an egocentric network, all alters are within one step of the ego and are connected either directly or indirectly; therefore, a single formula would not reflect a true position between indirect ties three or more geodesic distances away (Marsden, 2002). This gives rise to two mathematical measures of betweenness:
1) a sociocentric measure (Chung, Hossain and Davis, 2005):
B = 2 ( p
jk(x) )
N2 3N + 2
where pjk(x)
= probability that communication between j and k must pass through x N = number of nodes in the network;
2) an egobetweenness measure, cited in Marsden (2002):
C(pi) = [1 a (p
j, p
k)
where Ai = an ego network
and pj and p
k = geodesic points.
DensityThe density measure in SNA represents the number of connections in an ego network over the total number of connections possible. A network that is completely dense has a value of 1, which means all nodes in the network are connected, and the closer a network density value is to 0, the less connected it is (Chung, Hossain and Davis, 2005). The density measure establishes how well connected a network is, which, in turn, may have an affect on the rate of flow through the network, such as infection or information. In mathematical terms, an analysis of density is defined as (Chung, Hossain and Davis, 2005):
D = 2N
i
N(N 1)
Ni
jAi,ji kAi,ki
j-1
Liaquat Hossain and Matthew Kuti770
where N t = number of connections
N = number of nodes in the network
Tie strengthWithin SNA, the concept of tie strength defines the quality of a relationship between two nodes. Several studies have focused on the strength of network ties as a source of different kinds of information exchange. Granovetter’s (1973) research paper on the strength of weak ties demonstrates the usefulness of weak ties for attaining new information that otherwise would not be introduced within a network of strong ties. The paper finds that weak ties represent relationships that may be less efficient and not as well maintained, whereas strong ties depict frequent and stable relationships. Ties may or may not store information based on direction. Directed ties infer if a node is sending or receiving information, whereas undirected ties simply illustrate that a connection is present (Friedkin, 1982; Chung, Hossain and Davis, 2005).
Clique analysisA clique analysis improves understanding of how individuals group together out of a larger social network structure, providing possible insight into how the network as a whole is likely to behave. This is especially useful for social networks that take bottomup development approaches, are distributed and lack centralized control, such as an emergency response network in which each organizational actor forms subgroups based on organizational sector and disaster responsibilities (Kapucu, 2005). This sort of focus illustrates how network behaviour and macro responses and efficiency may be derived from the subgroupings or microlevel interactions. Reichardt and Bornholdt (2006) look at cliques as a development of community whereby common traits are shared to create group identity that encourages closer interaction between members of a subgroup. Of the seven types of SNA measures examined above, five are applicable to studying coordination in distributed networks from an egocentric approach. As the density measure and degree centrality measure are quite similar in their usefulness for analysing network involvement, the degree measure is used in this study. Since the level of network control and types of relationships held by an actor can enable or inhibit a network’s efficiency and thus the potential for coordination, the measures of egobetweenness and tie strength are also used in this study. In addition, this study addresses the importance of how actors, especially in a distributed network, group together based on responsibilities. The subgroup structure, analysed by means of a clique analysis, is able to provide insight on the network’s behaviour as a whole, which can be a cause of a particular level of coordination within the network.
Coordination dataset for emergency response
The dataset entitled ‘Domestic Terrorism: Assessment of State and Local Preparedness in the United States, 1992’ was accessed on the InterUniversity Consortium for

Disaster response preparedness coordination through social networks 771
Political and Social Research (ICPSR) website (ICPSR, 1992). The study was developed to ‘analyse states’ and municipalities’ terrorism preparedness as a means of providing law enforcement with information about the prevention and control of terrorist activities in the United States’ (Riley and Hoffman, 1995). The study was funded by the US Department of Justice and the National Institute of Justice. Research investigation was carried out by Kevin Jack Riley and Bruce Hoffman of the RAND Corporation. The research agenda was to conduct an assessment of how state and local law enforcement perceived the threat of terrorism under the federal level of government. The framework for data collection involved sending each selected agency a package that included the survey instrument, a request letter of participation, a confidentiality agreement and a brief overview of the RAND Corporation (Riley and Hoffman, 1995). The procedure after the initial invitation was to follow up with a second letter after a tenday period as a reminder notice. If the study was not filled out within three weeks, all documents found in the original invitation were resent in a second package; two weeks later, that second package was followed by a phone call to the agencies that had not yet responded. If the survey still was not filled out and returned 20 days after the final telephone call, another jurisdiction was to be contacted to replace the agency that was not responding. The sampling technique used to invite participants involved a twopart methodology for local law enforcement agencies. The first stage of sampling required the selection of 12 counties in each census district using a populationbased method. Three counties were selected based on the 1990 US Census estimates that they were the largest counties in different states. The remainder were chosen by random sample from each region pool that qualified in the categories of population exceeding 500,000; between 100,000 and 500,000; and less than 100,000. An additional 139 locations were also included in the second stage to supplement the sample; these were selected based on targeted sampling in districts that had experienced or retained targets likely to provoke terrorist activity. No sampling methodology was
Table 2 Social network measures for coordination
Measures Egocentric measure? Usefulness for assessing coordination in a distributed network in terms of defining:
Degree centrality Yes Network involvement
Closeness No Network centralization
Betweenness No Network control
Egobetweenness Yes Network control
Density Yes Network involvement
Tie strength Yes Network relationships
Clique analysis Yes Subgroup

Liaquat Hossain and Matthew Kuti772
used in selecting state law enforcement and emergency agencies (Riley and Hoffman, 1995). The response rate for the study includes 39 state law enforcement agencies, 37 state emergency agencies and 148 local law enforcement agencies (see Table 3). The study was begun in 1992 and completed in January 1993, one month before the World Trade Center bombing, meaning that respondents could not have referred to any events related to the terrorist event. Indeed, respondents were surveyed in a noncrisis state and survey findings are thus relevant to preparedness perceptions rather than lessons learned in hindsight. As noted on the ICPSR site, access to the research is provided by means of SPSS data files, supplementary machinereadable documentation and data collection instruments for each of the three specific agency groups. Specifics of the included material detail the following:
• DS1: State law enforcement agency data• DS2: State emergency management organization data• DS3: Local and municipal law enforcement agency data• DS4: SAS data definition statements for state law enforcement agency data• DS5: SAS data definition statements for state emergency management organiza
tion data• DS6: SAS data definition statements for local and municipal law enforcement
agency data• DS7: User guide
A fourphase method for data preparation and analysis was utilized to assess the coordination networks (CordNet) model against the survey data of Riley and Hoffman (1992). The method is carried out in five cycles for different network configurations, including:
• Organizationalnetworkofallagencies(macrolevel)• Statelawenforcementnetwork• Stateemergencyservicesnetwork
Table 3 Response rate of research sample
Agency group
No. invited agencies No. participating agencies
Response rate %
State law enforcement 52 39 73%
State emergency 52 37 71%
Local law enforcement 299 148 49%
Local law enforcement (population-based)
160 84 53%
Local law enforcement (targeted sample)
139 64 46%
Disaster response preparedness coordination through social networks 773
• Locallawenforcementnetwork• Actornetworkofallagencies(microlevel)
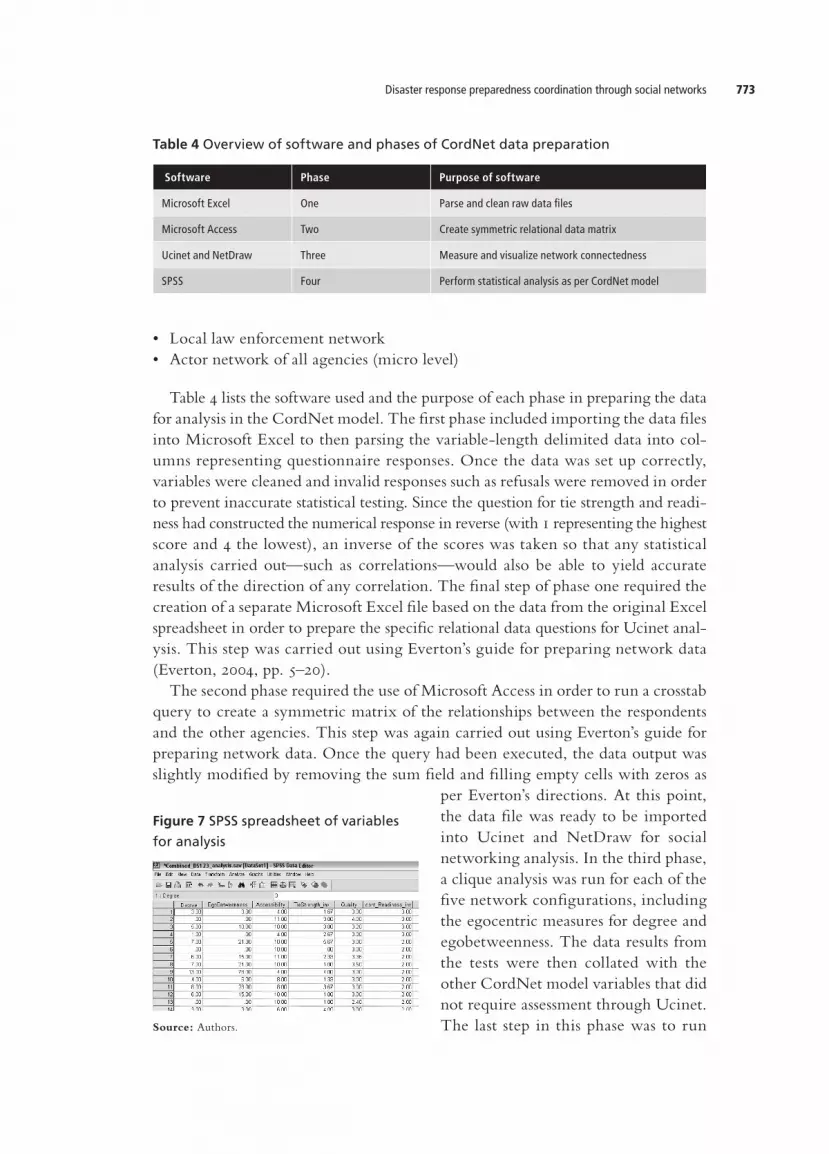
Table 4 lists the software used and the purpose of each phase in preparing the data for analysis in the CordNet model. The first phase included importing the data files into Microsoft Excel to then parsing the variablelength delimited data into columns representing questionnaire responses. Once the data was set up correctly, variables were cleaned and invalid responses such as refusals were removed in order to prevent inaccurate statistical testing. Since the question for tie strength and readiness had constructed the numerical response in reverse (with 1 representing the highest score and 4 the lowest), an inverse of the scores was taken so that any statistical analysis carried out—such as correlations—would also be able to yield accurate results of the direction of any correlation. The final step of phase one required the creation of a separate Microsoft Excel file based on the data from the original Excel spreadsheet in order to prepare the specific relational data questions for Ucinet analysis. This step was carried out using Everton’s guide for preparing network data (Everton, 2004, pp. 5–20). The second phase required the use of Microsoft Access in order to run a crosstab query to create a symmetric matrix of the relationships between the respondents and the other agencies. This step was again carried out using Everton’s guide for preparing network data. Once the query had been executed, the data output was slightly modified by removing the sum field and filling empty cells with zeros as
per Everton’s directions. At this point, the data file was ready to be imported into Ucinet and NetDraw for social networking analysis. In the third phase, a clique analysis was run for each of the five network configurations, including the egocentric measures for degree and egobetweenness. The data results from the tests were then collated with the other CordNet model variables that did not require assessment through Ucinet. The last step in this phase was to run
Table 4 Overview of software and phases of CordNet data preparation
Software Phase Purpose of software
Microsoft Excel One Parse and clean raw data files
Microsoft Access Two Create symmetric relational data matrix
Ucinet and NetDraw Three Measure and visualize network connectedness
SPSS Four Perform statistical analysis as per CordNet model
Figure 7 SPSS spreadsheet of variables
for analysis
Source: Authors.

Liaquat Hossain and Matthew Kuti774
Table 5 SPSS test matrix defining tests to be carried out and variables to be used
Degree Egobetweenness Tie strength Quality Accessibility Readiness
Degree Kruskal–Wallis comparison
x x x x x
Egobetweenness x Kruskal–Wallis comparison
x x x x
Tie strength x x Kruskal–Wallis comparison
x x x
Quality Spearman correlation
Spearman correlation
Spearman correlation
x x x
Accessibility Spearman correlation
Spearman correlation
Spearman correlation
x x x
Readiness Spearman correlation
Spearman correlation
Spearman correlation
x x x
Note: x denotes unnecessary or outofscope testing.
graphical representations of the network configurations through NetDraw in order to visualize the interconnectedness structure. All variables were then imported into SPSS for the fourth and final phase of the preparation method (see Figure 7). Once the variables were in SPSS, statistical analyses could be performed to test hypotheses, as defined in the research model (see Table 5).
Results and discussionsBased on the NRP literature (DHS, 2006), it may be firmly established that organizations involved in a disaster response effort do not all share equal responsibilities. The NRP further elaborates on the roles of specific government levels and industry sectors as loosely retaining different levels of leadership and control over how the emergency network operates in a crisis. This paper proposes a threetiered framework that mandates how involved any particular organization should be in a crisis. To support the threetiered theory and to justify placement of an agency within one of the tiers, it recognizes the research by Borkulo et al. (2005), which states that organizations in an emergency naturally form subgroups with other agencies with which they most regularly collaborate. To test the theory, this study performed a clique analysis on each of the specified agency groups. Extending this concept, this research suggests that local and state government agencies share the second tier of network control and presents the following hypothesis (H1):
An organization’s tier placement can be predicted based on its group association.
Emergency response literature elaborates on this point, noting that organizations of a specific sector and even specialized trade have reservations about working with
Disaster response preparedness coordination through social networks 775
agencies from other areas, and typically do not associate with them (Borkulo et al., 2005). Based on this information, this study assumes that sametiered organizations—that is, organizations that are used to working together and frequently exchange information—would naturally form subgroups. Therefore, to support the model that tier placement can be seen as a mediating factor on the network, which must first be established that the system involves three tiers made up of (1) the federal government, (2) state and local government and (3) all other sectors. A clique analysis is conducted to see if these organizations do in fact form clusters within the greater network, which would prove that this is how the network’s loosely structured leadership system is established. The same test is then performed at the micro level on clusters to see if they contain actors from each of the three government agencies and therefore operate within the one tier. Once this has been validated through a clique analysis for hypothesis testing, the study can focus on H1, that tier placement mediates network connectedness.
Test 1a: organizational clique analysis (macro level)
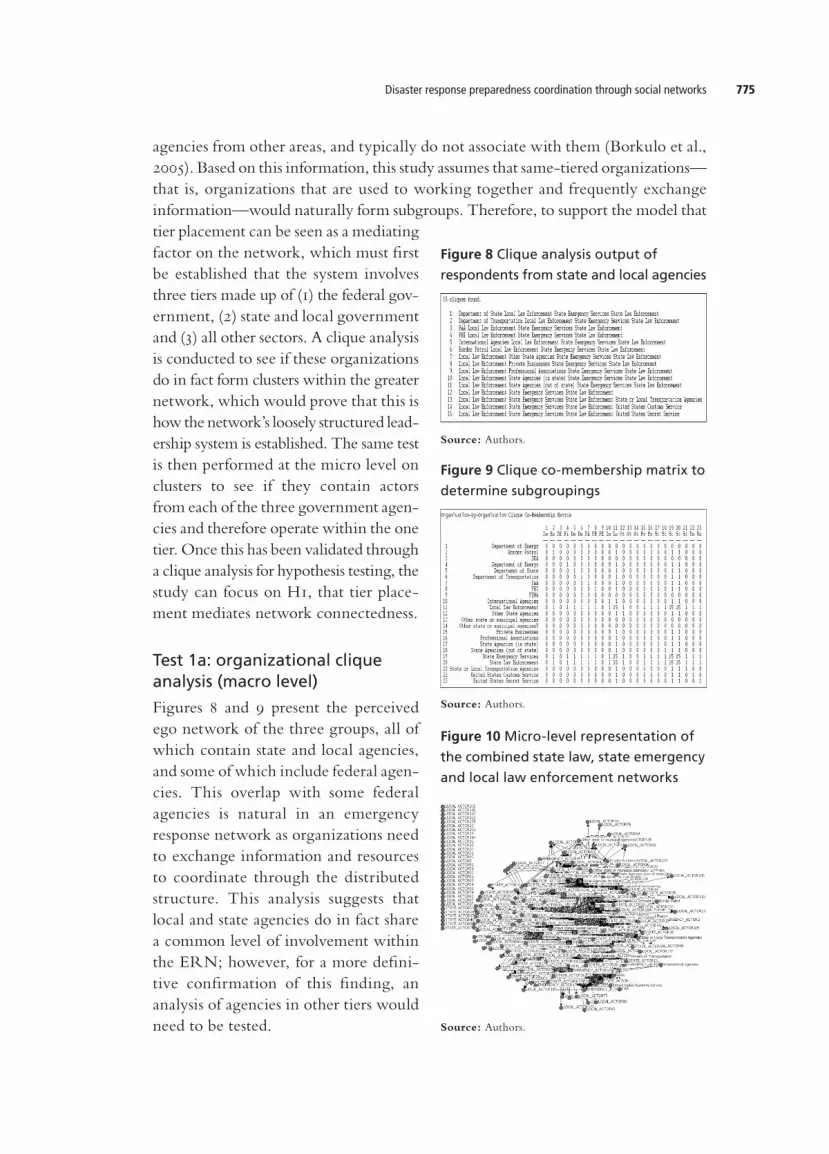
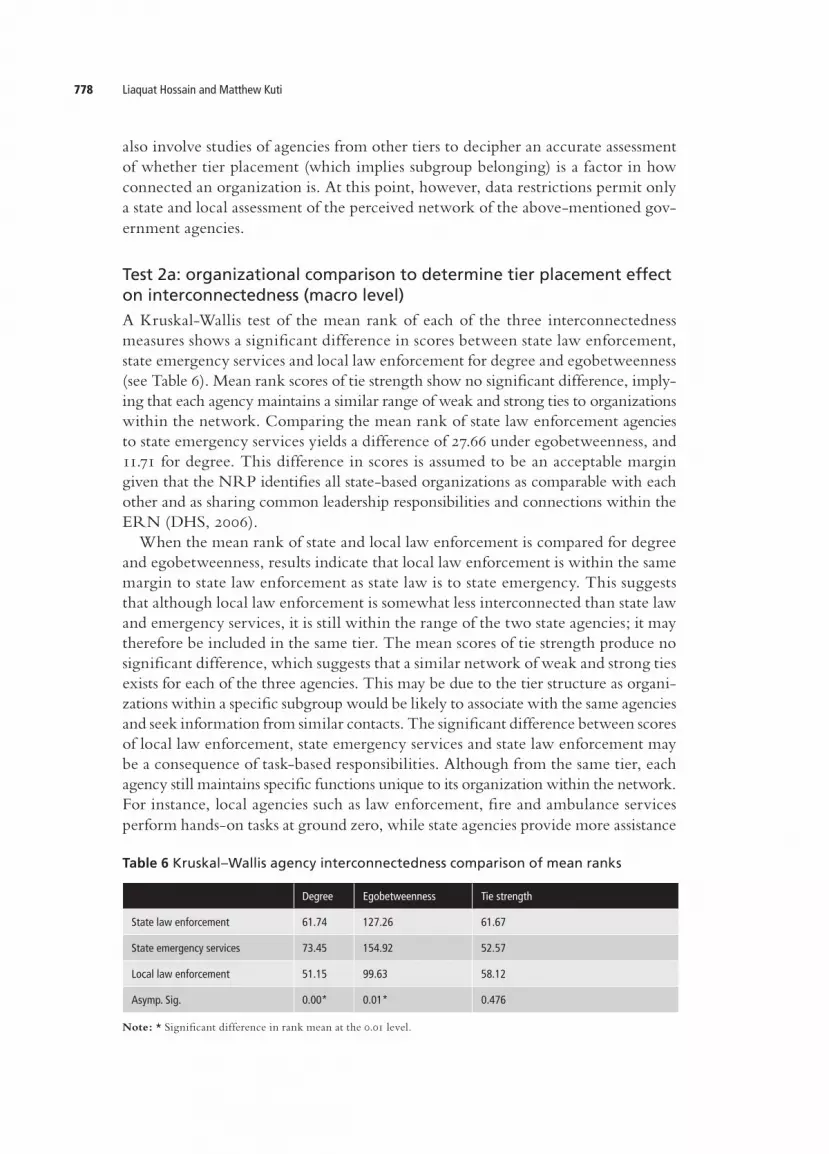
Figures 8 and 9 present the perceived ego network of the three groups, all of which contain state and local agencies, and some of which include federal agencies. This overlap with some federal agencies is natural in an emergency response network as organizations need to exchange information and resources to coordinate through the distributed structure. This analysis suggests that local and state agencies do in fact share a common level of involvement within the ERN; however, for a more definitive confirmation of this finding, an analysis of agencies in other tiers would need to be tested.
Figure 8 Clique analysis output of
respondents from state and local agencies
Source: Authors.
Figure 9 Clique co-membership matrix to
determine subgroupings
Source: Authors.
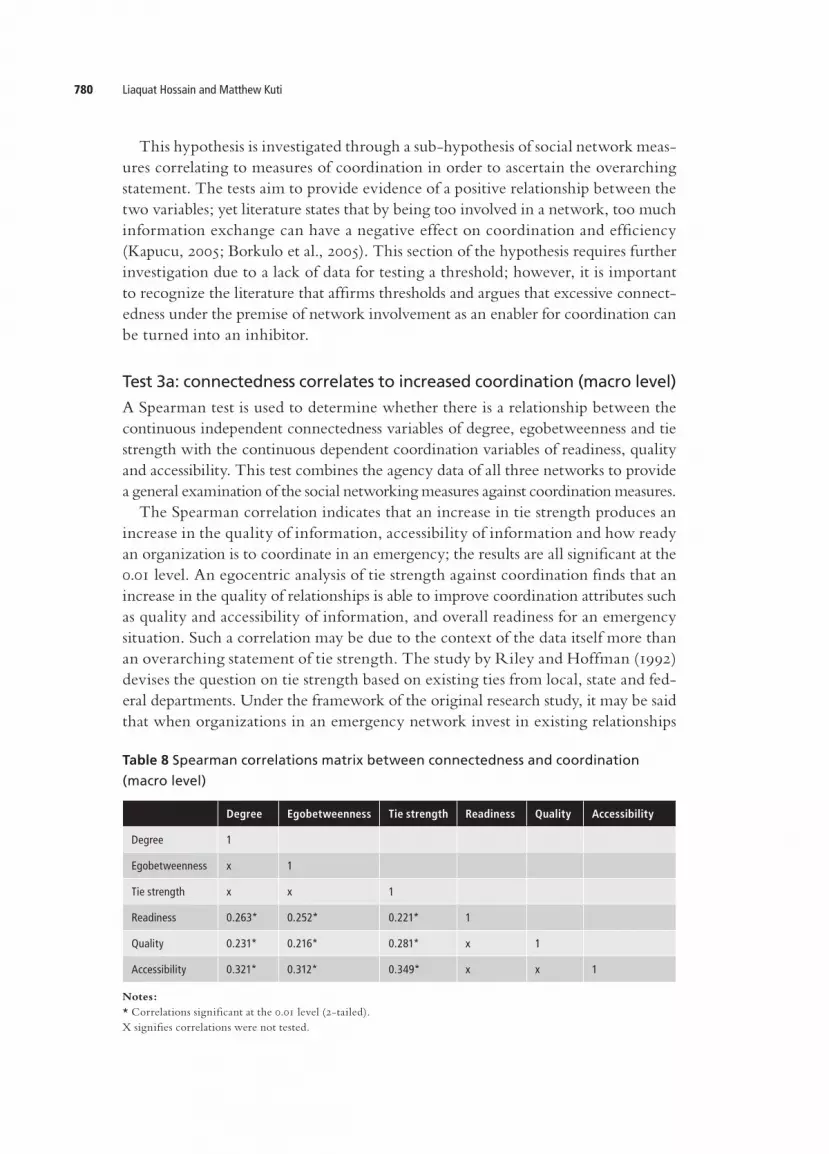
Figure 10 Micro-level representation of
the combined state law, state emergency
and local law enforcement networks
Source: Authors.

Liaquat Hossain and Matthew Kuti776
By examining the combined state law, state emergency and local law enforcement networks at a micro level, the clustering of individual actors can be explored to provide further evidence to support the first hypothesis that actors from within the three agency groups are interconnected and share responsibilities for driving the ERN. The lowlevel illustration of the organizational network demonstrates the relationship complexity once it is broken down (see Figure 10).
Test 1b: individual n-clique analysis (micro level)
By performing an nclique analysis on the lowlevel network, this investigation can dissect the network and investigate network behaviour at a microlevel (see Figure 11). This discrete perspective uncovers 249 clusters or subgrouping within the greater network; closer inspection of the subgroups reveals actors from each of the three agencies within a distance of length 2 from each other. There is an overlap with agencies between clusters; however, for the purpose of this investigation, identification of clusters containing actors from both state and local Figure 14 The third randomly selected
cluster from the n-clique analysis
Source: Authors.Source: Authors.
Source: Authors.
Figure 11 An n-clique analysis of the
low-level combined state and local
agency networks
Figure 12 The first randomly selected
cluster from the n-clique analysis
Figure 13 The second randomly selected
cluster from the n-clique analysis
Source: Authors.

Disaster response preparedness coordination through social networks 777
agencies is sufficient evidence to support the hypothesis. Based on an assessment of three clusters selected at random from the nclique analysis, the research model may be investigated further and the behaviour of crosssections of the ERN may be examined to support the stated hypotheses. The three diagrams of each of the clusters (see Figures 12–14) provide a visual representation of the subgroups under investigation. Within the subgroups, only organizations from state law, state emergency and local law enforcement agencies are investigated. The agencies that appear white in the graphs are within the clusters; only the circled nodes would be assessed in the CordNet model and compared. At face value, it is evident that organizations from each of the three agencies work closely within the model, as depicted in Figures 12–14. If the test results above are accepted and it is assumed that a clique analysis of an organization allows for tier definition, it is possible to test the second hypothesis (H2):
The level of network involvement expect-ed from an organization is mediated by associations in its tier.
Based on the clique results that state and local agencies share a common tier, it is possible to perform a simple comparison to assess whether each secondtier organization shares similar network connectedness as defined by an analysis of degree, egobetweenness and tie strength. Figures 15–17 illustrate the egocentric network of each of the three organizational actors and how individual respondents in that organization perceive their own network. Ultimately, testing this hypothesis needs to be carried out with actual rather than perceived network data; it should
Figure 16 State emergency services network
Figure 17 Local law enforcement network
Figure 15 State law enforcement network
Source: Authors.
Source: Authors.
Source: Authors.
Liaquat Hossain and Matthew Kuti778
also involve studies of agencies from other tiers to decipher an accurate assessment of whether tier placement (which implies subgroup belonging) is a factor in how connected an organization is. At this point, however, data restrictions permit only a state and local assessment of the perceived network of the abovementioned government agencies.
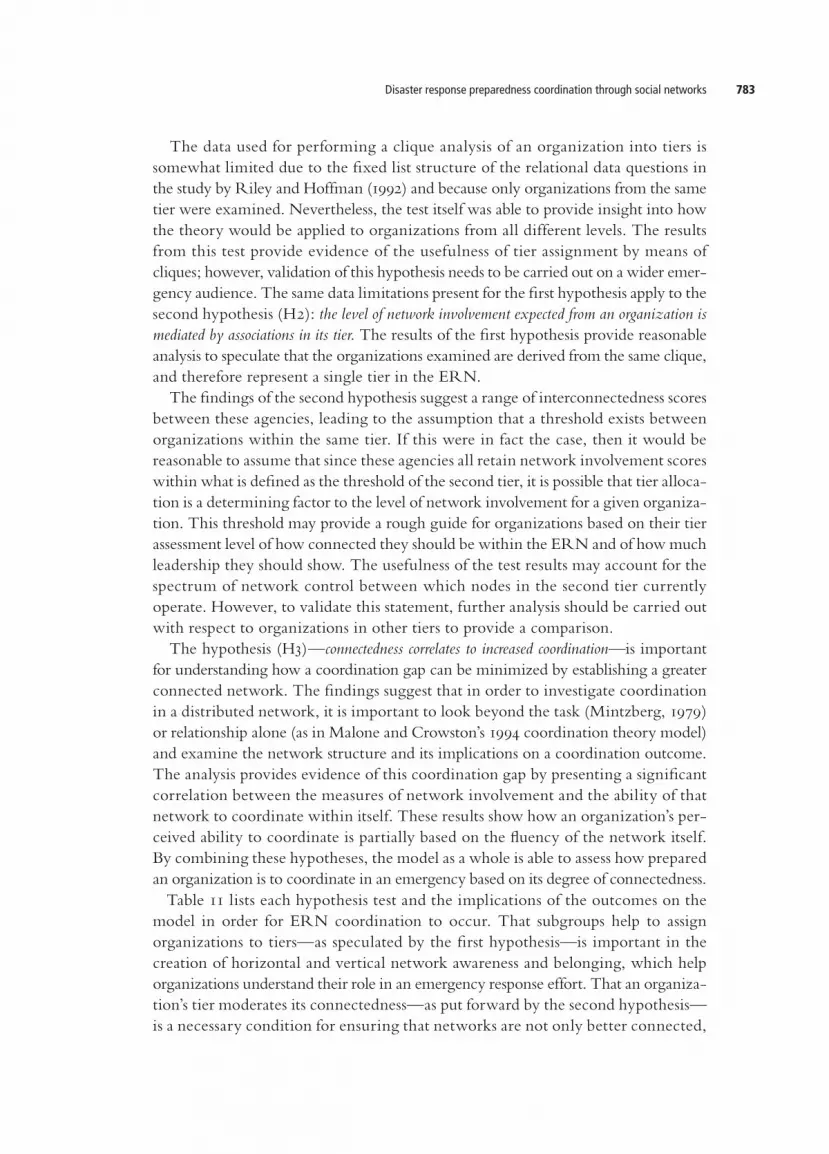
Test 2a: organizational comparison to determine tier placement effect on interconnectedness (macro level)A KruskalWallis test of the mean rank of each of the three interconnectedness measures shows a significant difference in scores between state law enforcement, state emergency services and local law enforcement for degree and egobetweenness (see Table 6). Mean rank scores of tie strength show no significant difference, implying that each agency maintains a similar range of weak and strong ties to organizations within the network. Comparing the mean rank of state law enforcement agencies to state emergency services yields a difference of 27.66 under egobetweenness, and 11.71 for degree. This difference in scores is assumed to be an acceptable margin given that the NRP identifies all statebased organizations as comparable with each other and as sharing common leadership responsibilities and connections within the ERN (DHS, 2006). When the mean rank of state and local law enforcement is compared for degree and egobetweenness, results indicate that local law enforcement is within the same margin to state law enforcement as state law is to state emergency. This suggests that although local law enforcement is somewhat less interconnected than state law and emergency services, it is still within the range of the two state agencies; it may therefore be included in the same tier. The mean scores of tie strength produce no significant difference, which suggests that a similar network of weak and strong ties exists for each of the three agencies. This may be due to the tier structure as organizations within a specific subgroup would be likely to associate with the same agencies and seek information from similar contacts. The significant difference between scores of local law enforcement, state emergency services and state law enforcement may be a consequence of taskbased responsibilities. Although from the same tier, each agency still maintains specific functions unique to its organization within the network. For instance, local agencies such as law enforcement, fire and ambulance services perform handson tasks at ground zero, while state agencies provide more assistance
Table 6 Kruskal–Wallis agency interconnectedness comparison of mean ranks
Degree Egobetweenness Tie strength
State law enforcement 61.74 127.26 61.67
State emergency services 73.45 154.92 52.57
Local law enforcement 51.15 99.63 58.12
Asymp. Sig. 0.00* 0.01* 0.476
Note: * Significant difference in rank mean at the 0.01 level.

Disaster response preparedness coordination through social networks 779
and resource coordination. This requires an interdependency of government agencies at the state and local level to provide leadership under the federal government for the ERN as a whole.
Test 2b: cluster comparison to determine tier placement effect on interconnectedness (micro level)A Kruskal–Wallis test on each of the three clusters against the interconnectedness measures of degree, egobetweenness and tie strength reveals no significant difference in scores (see Table 7). The three clusters of state and local government agencies taken from the ERN indicate that the level of connectedness between all three groups is comparable. The marginal differences in scores may suggest further evidence of the idea that although they are not significantly different, there is a difference that may account for a threshold of network involvement that allows for an amount of variance between agencies or in this case clusters taken from the same tier. The fact that all three clusters, selected from what is believed to be the second tier, retain similar scores in the Kruskal–Wallis comparison is evidence to suggest that tier placement is a primary candidate for determining the level of network involvement. Although neither of these tests is definitive proof that an organization’s interconnectedness is mediated by its tier level, it does in fact provide a step in the right direction by beginning to explore the possible thresholds within a given tier of what constitutes adequate network involvement and interconnectedness. It is only through an understanding of this threshold for each of the three tiers that an analysis can be carried out to clearly define whether interconnectedness is in fact mediated by the tier structure. Further analysis of clusters in different tier allocations would also be beneficial to support this hypothesis. Once an organizational analysis has been made to determine tier placement, it is proposed that a significant proportion of the effectiveness of coordination in an ERN is the result of how involved an organization is within a network. This level of coordination based on network interconnection is arguably a determining factor in what distinguishes an organization’s state of preparedness. By using social networks theory to assess network involvement, hypothesis (H3) posits:
Due to a significant relationship between network involvement and coordination, an in-crease in network connectedness produces an increase in organizational coordination over a given threshold.
Table 7 Kruskal–Wallis cluster interconnectedness comparison of mean ranks
Degree Egobetweenness Tie strength
Cluster 1 99.50 99.29 87.78
Cluster 2 106.00 108.54 94.21
Cluster 3 88.52 87.10 100.65
Asymp. Sig. 0.152 0.064 0.435
Liaquat Hossain and Matthew Kuti780
This hypothesis is investigated through a subhypothesis of social network measures correlating to measures of coordination in order to ascertain the overarching statement. The tests aim to provide evidence of a positive relationship between the two variables; yet literature states that by being too involved in a network, too much information exchange can have a negative effect on coordination and efficiency (Kapucu, 2005; Borkulo et al., 2005). This section of the hypothesis requires further investigation due to a lack of data for testing a threshold; however, it is important to recognize the literature that affirms thresholds and argues that excessive connectedness under the premise of network involvement as an enabler for coordination can be turned into an inhibitor.
Test 3a: connectedness correlates to increased coordination (macro level)
A Spearman test is used to determine whether there is a relationship between the continuous independent connectedness variables of degree, egobetweenness and tie strength with the continuous dependent coordination variables of readiness, quality and accessibility. This test combines the agency data of all three networks to provide a general examination of the social networking measures against coordination measures. The Spearman correlation indicates that an increase in tie strength produces an increase in the quality of information, accessibility of information and how ready an organization is to coordinate in an emergency; the results are all significant at the 0.01 level. An egocentric analysis of tie strength against coordination finds that an increase in the quality of relationships is able to improve coordination attributes such as quality and accessibility of information, and overall readiness for an emergency situation. Such a correlation may be due to the context of the data itself more than an overarching statement of tie strength. The study by Riley and Hoffman (1992) devises the question on tie strength based on existing ties from local, state and federal departments. Under the framework of the original research study, it may be said that when organizations in an emergency network invest in existing relationships
Table 8 Spearman correlations matrix between connectedness and coordination
(macro level)
Degree Egobetweenness Tie strength Readiness Quality Accessibility
Degree 1
Egobetweenness x 1
Tie strength x x 1
Readiness 0.263* 0.252* 0.221* 1
Quality 0.231* 0.216* 0.281* x 1
Accessibility 0.321* 0.312* 0.349* x x 1
Notes: * Correlations significant at the 0.01 level (2tailed). X signifies correlations were not tested.

Disaster response preparedness coordination through social networks 781
to strengthen the bond, interorganizational dependency becomes more efficient as trust is developed and collective sensemaking can be enhanced. In turn, this may mean that after establishing better network relationships, an organization is more likely to have access to information that is of better quality because other organizations are more forthcoming. This improved working relationship may then have a positive affect on sharing, which may facilitate coordination and the perceived state of readiness to interact with other organizational nodes in an emergency.
Test 3b: connectedness correlates to increased coordination (micro level)A subsequent examination for correlation was carried out to provide supporting evidence of the relationship between network connectedness and the potential for coordination. The three randomly selected clusters were merged to provide enough cases to perform a Spearman correlation and determine whether the correlation that has been identified at the macro level of the ERN holds at the micro level. As discovered in the previous section, the cluster examination reveals a positive correlation between the coordination measures of quality and accessibility against the network interconnectedness measures of degree, egobetweenness and tie strength. Table 9 shows the relationship between accessibility and tie strength as having a positive correlation score of 0.385, which is significant at the 0.01 level. The results for coordination readiness investigated at the microlevel reveal a difference in findings from the macrolevel test. The data suggests a positive correlation between each of the three network connectedness measures to coordination readiness; however, none of these was particularly significant (see tie strength scores in Table 9). This may be a result of the clusters selected for analysis. Since there is evidence to suggest the interconnectedness scores of each cluster are not significantly different from each other—as discovered while testing the second hypothesis (see Test 2b)—it is plausible that because of the macrolevel correlation between interconnectedness and coordination readiness, the three clusters each provided similar subjective
Table 9 Spearman correlations matrix between connectedness and coordination
(micro level)
Degree Egobetweenness Tie Strength Readiness Quality Accessibility
Degree 1
Egobetweenness X 1
Tie strength X x 1
Readiness 0.112 0.100 0.220 1
Quality 0.292** 0.264** 0.219** x 1
Accessibility 0.226** 0.172* 0.385** x x 1
Notes: ** Correlations significant at the 0.01 level (2tailed). * Correlations significant at the 0.05 level (2tailed).X signifies correlations were not tested.

Liaquat Hossain and Matthew Kuti782
scores of readiness; as a result, these may have provided an insufficient range of readiness scores to calculate a correlation. To test this theory, a Kruskal–Wallis test was performed to determine whether there was a significant difference between clusters. The results indicate that the three clusters are in very close proximity to each other; they support the finding that no correlation exists between coordination readiness and interconnectedness at the micro level (see Table 10).
ConclusionThis research suggests that there is indeed a positive correlation between interconnectedness and coordination, such if the involvement of actors within the network is improved, their ability to coordinate will also increase. The results from investigation at both the macro and micro level complement each other and provide greater support for the three abovementioned hypotheses. By presenting a model of coordination assessment based on network connectedness, an organization can be reviewed in order to identify its current state of connectedness and can therefore be judged for its potential to coordinate in an emergency. The findings from the hypothesis (H1) that an organization’s tier placement can be predicted based on observing its group association suggests that within an ERN, organizations that share common traits form subgroups. These groupings then form the basis for an assumption that collective involvement from organizations that interact and share a common purpose within the ERN can be categorized into tiers that retain certain levels of authority and control over the network and the potential to coordinate in an emergency. The importance of this step in the CordNet model is in making sure network connectedness acts as an enabler of coordination efficiency rather than an inhibitor by limiting network involvement to the needs of a given tier, thus preventing the circulation of redundant or unnecessary information through the network as a product of excessive ties. The influence for using a clique analysis for categorizing organizations according to tiers comes from Falzon (2000):
in any human organization in which individuals interact [. . .] groups emerge quite naturally and often deliberately [. . .] it helps us understand how information spreads throughout the organization.
Table 10 Kruskal–Wallis comparison of readiness between clusters
Readiness
Cluster 1 99.52
Cluster 2 95.70
Cluster 3 94.64
Asymp. Sig. 0.868
Notes: ** Significant difference in rank mean at the 0.01 level.* Significant difference in rank mean at the 0.05 level.
Disaster response preparedness coordination through social networks 783
The data used for performing a clique analysis of an organization into tiers is somewhat limited due to the fixed list structure of the relational data questions in the study by Riley and Hoffman (1992) and because only organizations from the same tier were examined. Nevertheless, the test itself was able to provide insight into how the theory would be applied to organizations from all different levels. The results from this test provide evidence of the usefulness of tier assignment by means of cliques; however, validation of this hypothesis needs to be carried out on a wider emergency audience. The same data limitations present for the first hypothesis apply to the second hypothesis (H2): the level of network involvement expected from an organization is mediated by associations in its tier. The results of the first hypothesis provide reasonable analysis to speculate that the organizations examined are derived from the same clique, and therefore represent a single tier in the ERN. The findings of the second hypothesis suggest a range of interconnectedness scores between these agencies, leading to the assumption that a threshold exists between organizations within the same tier. If this were in fact the case, then it would be reasonable to assume that since these agencies all retain network involvement scores within what is defined as the threshold of the second tier, it is possible that tier allocation is a determining factor to the level of network involvement for a given organization. This threshold may provide a rough guide for organizations based on their tier assessment level of how connected they should be within the ERN and of how much leadership they should show. The usefulness of the test results may account for the spectrum of network control between which nodes in the second tier currently operate. However, to validate this statement, further analysis should be carried out with respect to organizations in other tiers to provide a comparison. The hypothesis (H3)—connectedness correlates to increased coordination—is important for understanding how a coordination gap can be minimized by establishing a greater connected network. The findings suggest that in order to investigate coordination in a distributed network, it is important to look beyond the task (Mintzberg, 1979) or relationship alone (as in Malone and Crowston’s 1994 coordination theory model) and examine the network structure and its implications on a coordination outcome. The analysis provides evidence of this coordination gap by presenting a significant correlation between the measures of network involvement and the ability of that network to coordinate within itself. These results show how an organization’s perceived ability to coordinate is partially based on the fluency of the network itself. By combining these hypotheses, the model as a whole is able to assess how prepared an organization is to coordinate in an emergency based on its degree of connectedness. Table 11 lists each hypothesis test and the implications of the outcomes on the model in order for ERN coordination to occur. That subgroups help to assign organizations to tiers—as speculated by the first hypothesis—is important in the creation of horizontal and vertical network awareness and belonging, which help organizations understand their role in an emergency response effort. That an organization’s tier moderates its connectedness—as put forward by the second hypothesis—is a necessary condition for ensuring that networks are not only better connected,
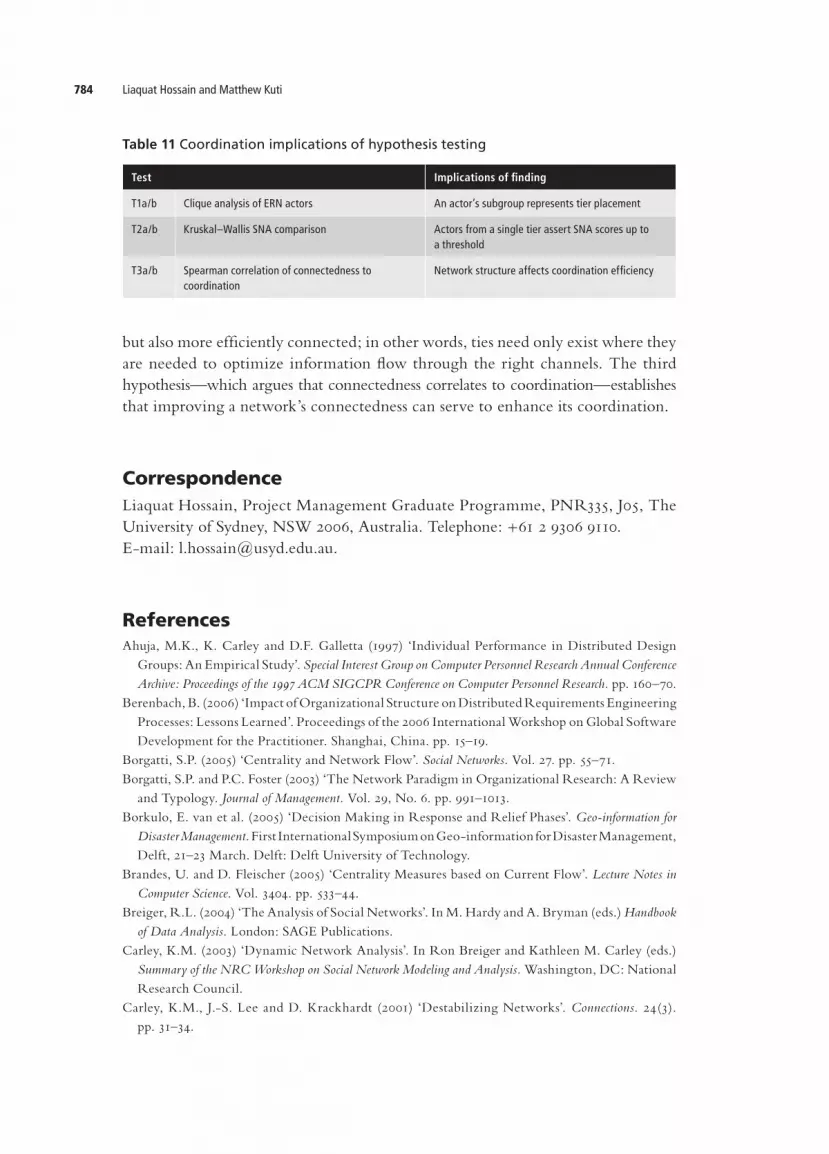
Liaquat Hossain and Matthew Kuti784
but also more efficiently connected; in other words, ties need only exist where they are needed to optimize information flow through the right channels. The third hypothesis—which argues that connectedness correlates to coordination—establishes that improving a network’s connectedness can serve to enhance its coordination.
CorrespondenceLiaquat Hossain, Project Management Graduate Programme, PNR335, J05, The University of Sydney, NSW 2006, Australia. Telephone: +61 2 9306 9110.Email: [email protected].
ReferencesAhuja, M.K., K. Carley and D.F. Galletta (1997) ‘Individual Performance in Distributed Design
Groups: An Empirical Study’. Special Interest Group on Computer Personnel Research Annual Conference Archive: Proceedings of the 1997 ACM SIGCPR Conference on Computer Personnel Research. pp. 160–70.
Berenbach, B. (2006) ‘Impact of Organizational Structure on Distributed Requirements Engineering Processes: Lessons Learned’. Proceedings of the 2006 International Workshop on Global Software Development for the Practitioner. Shanghai, China. pp. 15–19.
Borgatti, S.P. (2005) ‘Centrality and Network Flow’. Social Networks. Vol. 27. pp. 55–71.Borgatti, S.P. and P.C. Foster (2003) ‘The Network Paradigm in Organizational Research: A Review
and Typology. Journal of Management. Vol. 29, No. 6. pp. 991–1013.Borkulo, E. van et al. (2005) ‘Decision Making in Response and Relief Phases’. Geo-information for
Disaster Management. First International Symposium on Geoinformation for Disaster Management, Delft, 21–23 March. Delft: Delft University of Technology.
Brandes, U. and D. Fleischer (2005) ‘Centrality Measures based on Current Flow’. Lecture Notes in Computer Science. Vol. 3404. pp. 533–44.
Breiger, R.L. (2004) ‘The Analysis of Social Networks’. In M. Hardy and A. Bryman (eds.) Handbook of Data Analysis. London: SAGE Publications.
Carley, K.M. (2003) ‘Dynamic Network Analysis’. In Ron Breiger and Kathleen M. Carley (eds.) Summary of the NRC Workshop on Social Network Modeling and Analysis. Washington, DC: National Research Council.
Carley, K.M., J.S. Lee and D. Krackhardt (2001) ‘Destabilizing Networks’. Connections. 24(3). pp. 31–34.
Table 11 Coordination implications of hypothesis testing
Test Implications of finding
T1a/b Clique analysis of ERN actors An actor’s subgroup represents tier placement
T2a/b Kruskal–Wallis SNA comparison Actors from a single tier assert SNA scores up to a threshold
T3a/b Spearman correlation of connectedness to coordination
Network structure affects coordination efficiency

Disaster response preparedness coordination through social networks 785
Carrasco, J.A. et al. (2006) Collecting Social Network Data to Study Social Activity–Travel Behaviour: An Egocentric Approach. Presented at the 85th Transportation Research Board Meeting. Washington, DC. January 22–26.
Chung, K.K.S., L. Hossain and J. Davis (2005) Exploring Sociocentric and Egocentric Approaches for Social Network Analysis. International Conference on Knowledge Management, Asia Pacific, November 27–29. Victoria University Wellington, New Zealand.
Comfort, L. and N. Kapucu (2003) ‘Interorganizational Coordination in Extreme Events: The World Trade Center attacks, September 11, 2001’. Natural Hazards. pp. 309–27.
DHS (Department of Homeland Security) (2006) National Response Plan (NRP). Formerly the Federal Response Plan (FRP). http://www.dhs.gov/xprepresp/commitees/editorial_0566.shtml.
Everton, S.F. (2004) A Guide for the Visually Perplexed: Visually Representing Social Networks. Stanford: Stanford University Press.
Falzon, L. (2000) ‘Determining Groups from the Clique Structure in Large Social Networks’. Social Networks. Vol. 22, No. 2. pp. 159–72.
FEMA (Federal Emergency Management Agency) (1999) Federal Response Plan (FRP). http://www.fema.gov/rnr/frp/frpfull.pdf.
Freeman, L.C. (1977) ‘A Set of Measures of Centrality Based on Betweenness’. Sociometry. Vol. 40. pp. 35–41.
Friedkin, N.E. (1982) ‘Information Flow through Strong and Weak Ties in Intraorganizational Social Networks’. Social Networks. Vol. 3. pp. 273–85.
Granovetter, M.S. (1973) ‘The Strength of Weak Ties’. The American Journal of Sociology. 78(6). pp. 1360–80.
Hanneman, R.A. and M. Riddle (2005) Introduction to Social Network Method. Riverside, CA: University of California, Riverside.
Hinds, P. and C. McGrath (2006) ‘Structures that Work: Social Structure, Work Structure and Coordination Ease in Geographically Distributed Teams’. Proceedings of the 2006 20th Anniversary Conference on Computersupported Cooperative Work. Banff, Alberta, Canada. pp. 343–52.
ICPSR (InterUniversity Consortium for Political and Social Research) (1992) ‘Domestic Terrorism: Assessment of State and Local Preparedness in the United States, 1992’. http://www.icpsr.umich.edu/cocoon/ICPSR/STUDY/06566.xml.
Kapucu, N. (2003) Coordinating without Hierarchy: Public–Non-profit Partnerships. Paper presented at the National Association of Schools and Institutes of Administration (IASIA) Annual Conference. Miami, Florida.
Kapucu, N. (2005) ‘Interorganizational Coordination in Dynamic Context: Networks in Emergency Response Management’. Connections. 26a(2). pp. 33–48.
Kettl, D.F. (2006) ‘Fixing FEMA’. Statement for the Record of Donald F. Kettl for the Committee on Homeland Security, United States Senate. 8 March.
Malone, T.W. (1987) ‘Modeling Coordination in Organizations and Markets’. Management Science. Vol. 33. pp. 1317–32.
Malone, T.W. and K. Crowston (1990) ‘What Is Coordination Theory and How Can It Help Design Cooperative Work Systems?’ Proceedings of the 1990 ACM Conference on Computer-supported Cooperative Work. Los Angeles: Computersupported Cooperative Work. pp. 357–70.
Malone, T.W. and K. Crowston (1994) ‘The Interdisciplinary Study of Coordination’. ACM Computing Surveys. Vol. 26. pp. 87–119.
Marsden, P.V. (2002) ‘Egocentric and Sociocentric Measures of Network Centrality’. Social Networks. Vol. 24. pp. 407–22.
Mintzberg, H. (1979) The Structuring of Organizations: A Synthesis of the Research. Englewood Cliffs, NJ: Prentice Hall.
Liaquat Hossain and Matthew Kuti786
Mullen, B., C. Johnson and E. Salas (1991) ‘Effects of Communication Network Structure: Components of Positional Centrality’. Social Networks. Vol. 13. pp. 169–86.
Perdu, D.M. and A.H. Levis (1998) ‘Adaptation as a Morphing Process: A Methodology for the Design and Evaluation of Adaptive Organizational Structures’. Computational & Mathematical Organization Theory. Vol. 4. pp. 5–41.
Rathnam, S., V. Mahajan, A.B. Whinston (1995) ‘Facilitating Coordination in Customer Support Teams: A Framework and Its Implications for the Design of Information Technology’. Management Science. Vol. 41. pp. 1900–21.
Reichardt, J. and S. Bornholdt (2006) ‘When Are Networks Truly Modular?’ Physica D: Nonlinear Phenomena. Vol. 224. pp. 20–26.
Riley, K.J. and B. Hoffman (1992) Domestic Terrorism: Assessment of State and Local Preparedness in the United States, 1992. Computer file. Santa Monica, CA: RAND Corporation. Distributed by Interuniversity Consortium for Political and Social Research, 1996.
Riley, K.J. and B. Hoffman (1995) Domestic Terrorism: A National Assessment of State and Local Preparedness. Santa Monica: RAND Corporation.
Tolksdorf, R. (2000) ‘Models of Coordination’. Lecture Notes In Computer Science. Vol. 1972. pp. 78–92.Waugh, W.L. (2003) ‘Terrorism, Homeland Security and the National Emergency Management
Network’. Public Organizational Review. pp. 373–85.Yuan, Y. and B. Detlor (2005) ‘Intelligent Mobile Crisis Response Systems’. Communications of the ACM.
Vol. 48. pp. 95–98.