development of key performance measures for the automobile green supply chain
TRANSCRIPT
Ds
ED
a
ARRA
KGPRP
1
duaptssatatitiM
(
0d
Resources, Conservation and Recycling 55 (2011) 567–579
Contents lists available at ScienceDirect
Resources, Conservation and Recycling
journa l homepage: www.e lsev ier .com/ locate / resconrec
evelopment of key performance measures for the automobile greenupply chain
zutah Udoncy Olugu, Kuan Yew Wong ∗, Awaludin Mohamed Shaharounepartment of Manufacturing and Industrial Engineering, Faculty of Mechanical Engineering, Universiti Teknologi Malaysia, 81310 UTM Skudai, Malaysia
r t i c l e i n f o
rticle history:eceived 30 October 2009eceived in revised form 12 April 2010ccepted 4 June 2010
eywords:reen supply chainerformance measurementeverse logisticserformance measures
a b s t r a c t
The main purpose of this study was to develop a set of measures for evaluating the performance of theautomobile green supply chain. This study reviewed various literatures on green supply chain perfor-mance measurement, environmental management, traditional supply chain performance measurement,and automobile supply chain management. In order to comprehensively and effectively establish therelevant measures, a suitable framework which considered the automobile green supply chain as atwo-in-one chain was adopted. This two-in-one chain comprised a forward and backward chain for theautomobile industry. Consequently, 10 measures with 49 metrics and 6 measures with 23 metrics wereidentified and developed for the forward and backward chains, respectively. Sequel to the development ofthese measures, a survey was conducted using a four-page questionnaire distributed to experts (includ-ing academics and practitioners) to establish their importance and applicability. The findings of this studysuggested that the importance and applicability of all the developed measures have been substantiated.
For the forward chain, the most crucial measure was customer perspective while the most applicableone was traditional supply chain cost. The reverse chain measures were topped by management com-mitment in terms of both importance and applicability. This study contributed to the advancement ofknowledge by pioneering the development of a set of holistic measures for evaluating the performanceof the automobile green supply chain. The study was wrapped up with the proposition of directions forfurther studies.. Introduction
Within today’s manufacturing circle, there is a rapid revolutionue to so many reasons, ranging from customer oriented prod-cts, shortening product life cycles, stakeholder requirements, localnd international regulatory compliances, to competitions amongstlayers within the industry. For any manufacturing organizationo survive these challenges there is a need to devise innovativetrategies which can generate a sustainable competitive edge whileatisfying all the requirements from stakeholders and regulatorygencies. It is an established observation, that the global ecosys-em is witnessing a rigorous challenge in its economic sub-systems energy capacity and waste disposal capability are approachingheir limits (Solvang et al., 2006). The major source of this imbalancen the ecosystem has been attributed to manufacturing operations,
hus numerous laws and regulations have been put in place to mon-tor these manufacturing operations and their ensuing products.anufacturing operations have a major contribution to environ-
∗ Corresponding author. Tel.: +60 7 5534691; fax: +60 7 5566159.E-mail addresses: [email protected], [email protected]
K.Y. Wong).
921-3449/$ – see front matter © 2010 Elsevier B.V. All rights reserved.oi:10.1016/j.resconrec.2010.06.003
© 2010 Elsevier B.V. All rights reserved.
mental degradation at various stages in the product life cycle, fromresource extraction to manufacturing, use, reuse, recycling anddisposal. It is therefore eminent for manufacturers to imbibe thephilosophy of environmental responsible manufacturing. This canbe adopted as a strategy to achieve competitive edge and increasemarket share through the process of improving the overall environ-mental impacts of products (van Hoek, 1999; Zhu and Sarkis, 2006).Recently, the focus on environmental management has shifted fromoperations internal to the manufacturing companies or facilities tothe entire supply chain. Extending this practice along the entireechelons within the supply chain involved in the production of aproduct, will unarguably yield the greatest value in terms of effi-ciency and effectiveness. Chung and Wee (2008) supported thisby stating that product design and manufacture significantly influ-ences the cost of disassembly, inspection, repair, remanufacturingand recycling. Handfield and Nichols (1999) have made a similarobservation regarding the cost associated with the supply chain.They believed that optimization involving all parties within thechain can yield the lowest cost minimization.
With the advent of environmental concerns, supply chain man-agement has been redefined making it more complicated. Differentlegislations and regulations in most developed countries such asthe European community (EC, 2000; US-AEP, 1999) have made
5 vation and Recycling 55 (2011) 567–579
teotifmeamwwfiimeBwmsfiTgi
mapseqcs
2
pufif
mlIh(mc(ZstsdafiZbcrssa
68 E.U. Olugu et al. / Resources, Conser
he manufacturers accountable for their products, throughout theirntire useful life and beyond. This has resulted in the extensionf the traditional supply chain to include the after-use phase ofhe products. This after-use phase cannot achieve its objectives insolation, thus there is a need to develop an integrated approachor planning and controlling the features and manners in which
aterials flow within the supply chain. This integrated approach ismbedded into green supply chain management. Beamon (1999b)nd Linton et al. (2007) craved for a redefinition in supply chainanagement to incorporate the new environmental challengeshich are faced in manufacturing and production operations. Itas further pointed out that a major stride towards achieving thist would be to define a new structure for the entire supply chain by
ncorporating environmental concerns. Supply chain performanceeasurement has been identified as a major stride towards an
ffective and efficient supply chain management (Liang et al., 2006).ond (1999) stated that performance measurement will indicatehether a company should continue with its current strategy orake adjustments. Many automobile organizations have failed in
upply chain management due to their inability to develop the per-ormance measures and metrics required for complete supply chainntegration and performance measurement (Mentzer et al., 2007).hus, there is a need to establish suitable measures for effectivereen supply chain performance measurement in the automotivendustry.
This paper begins with a description on green supply chainanagement and its performance measurement in general. It goes
head to describe a suitable framework to measure the green sup-ly chain performance in the automotive industry. On that note, aet of measures for performance measurement in this industry isstablished. These measures are justified through a survey usinguestionnaires and the results are discussed. The paper ends withonclusions and recommendations on the directions for furthertudies.
. Conceptual background
In this section, previous literature upon which the concept oferformance measurement for a green supply chain is anchoredpon is reviewed. This involves the use of existing literature in theeld of supply chain performance measurement to justify the need
or green supply chain performance measurement.Many researchers have defined a green supply chain in various
anners using different terms. Some studies defined it as a closedoop supply chain (van Hoek, 1999; Beamon, 1999b; Steven, 2004;nderfurth, 2004; Spengler et al., 2004; Zhu and Sarkis, 2006). Itas been described as a sustainable supply chain by Linton et al.2007) and Beamon (2005). Some have called it as an environ-
ental supply chain (Hall, 2000; Beamon, 2005), ethical supplyhain (Roberts, 2003; Beamon, 2005), and integrated supply chainPreuss, 2001; Mezher and Ajam, 2006; Vachon and Klassen, 2006;hu and Sarkis, 2006). It was also termed as a socially responsibleupply chain (Salam, 2009) and the list can continue. Irrespec-ive of the nomenclature adopted, the bottom line remains theame, i.e. “environment”. Green supply chain management is thusefined as the totality of green purchasing, green manufacturingnd material management, green distribution and marketing, andnally reverse logistics (Hervani et al., 2005; Linton et al., 2007;hu and Sarkis, 2006). This is in line with the explanation giveny Vachon and Klassen (2008) that suppliers, manufacturers andustomers should work together towards the reduction of envi-
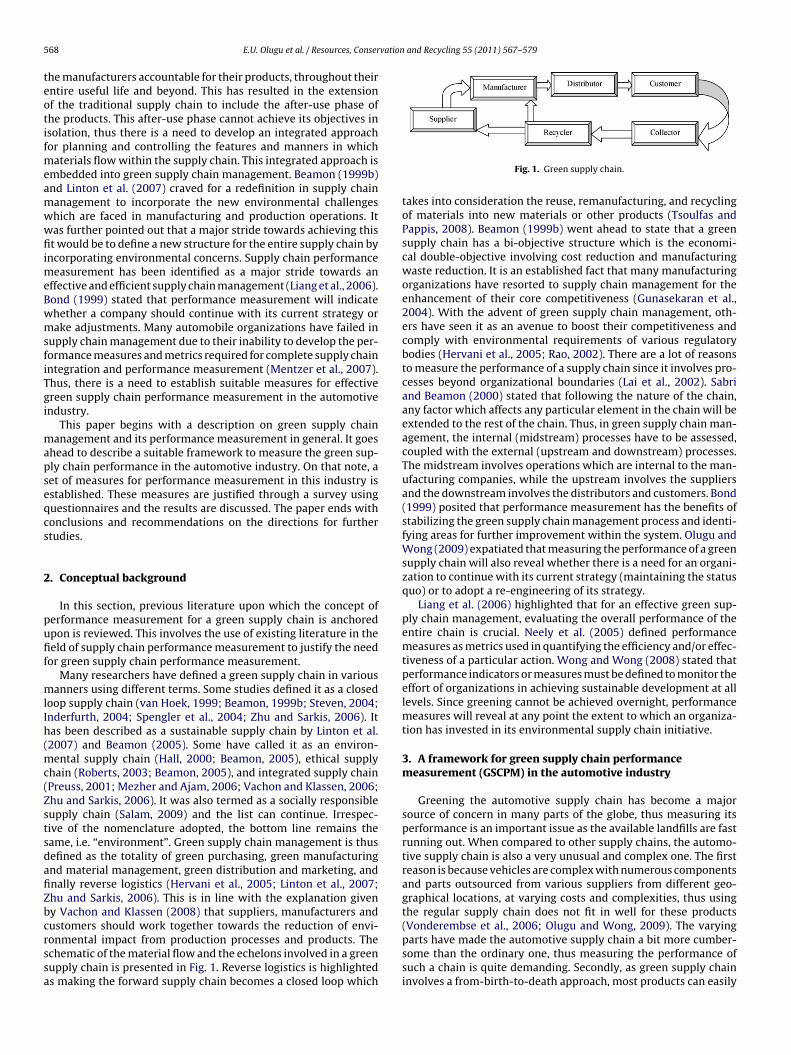
onmental impact from production processes and products. Thechematic of the material flow and the echelons involved in a greenupply chain is presented in Fig. 1. Reverse logistics is highlighteds making the forward supply chain becomes a closed loop whichFig. 1. Green supply chain.
takes into consideration the reuse, remanufacturing, and recyclingof materials into new materials or other products (Tsoulfas andPappis, 2008). Beamon (1999b) went ahead to state that a greensupply chain has a bi-objective structure which is the economi-cal double-objective involving cost reduction and manufacturingwaste reduction. It is an established fact that many manufacturingorganizations have resorted to supply chain management for theenhancement of their core competitiveness (Gunasekaran et al.,2004). With the advent of green supply chain management, oth-ers have seen it as an avenue to boost their competitiveness andcomply with environmental requirements of various regulatorybodies (Hervani et al., 2005; Rao, 2002). There are a lot of reasonsto measure the performance of a supply chain since it involves pro-cesses beyond organizational boundaries (Lai et al., 2002). Sabriand Beamon (2000) stated that following the nature of the chain,any factor which affects any particular element in the chain will beextended to the rest of the chain. Thus, in green supply chain man-agement, the internal (midstream) processes have to be assessed,coupled with the external (upstream and downstream) processes.The midstream involves operations which are internal to the man-ufacturing companies, while the upstream involves the suppliersand the downstream involves the distributors and customers. Bond(1999) posited that performance measurement has the benefits ofstabilizing the green supply chain management process and identi-fying areas for further improvement within the system. Olugu andWong (2009) expatiated that measuring the performance of a greensupply chain will also reveal whether there is a need for an organi-zation to continue with its current strategy (maintaining the statusquo) or to adopt a re-engineering of its strategy.
Liang et al. (2006) highlighted that for an effective green sup-ply chain management, evaluating the overall performance of theentire chain is crucial. Neely et al. (2005) defined performancemeasures as metrics used in quantifying the efficiency and/or effec-tiveness of a particular action. Wong and Wong (2008) stated thatperformance indicators or measures must be defined to monitor theeffort of organizations in achieving sustainable development at alllevels. Since greening cannot be achieved overnight, performancemeasures will reveal at any point the extent to which an organiza-tion has invested in its environmental supply chain initiative.
3. A framework for green supply chain performancemeasurement (GSCPM) in the automotive industry
Greening the automotive supply chain has become a majorsource of concern in many parts of the globe, thus measuring itsperformance is an important issue as the available landfills are fastrunning out. When compared to other supply chains, the automo-tive supply chain is also a very unusual and complex one. The firstreason is because vehicles are complex with numerous componentsand parts outsourced from various suppliers from different geo-graphical locations, at varying costs and complexities, thus usingthe regular supply chain does not fit in well for these products(Vonderembse et al., 2006; Olugu and Wong, 2009). The varying
parts have made the automotive supply chain a bit more cumber-some than the ordinary one, thus measuring the performance ofsuch a chain is quite demanding. Secondly, as green supply chaininvolves a from-birth-to-death approach, most products can easily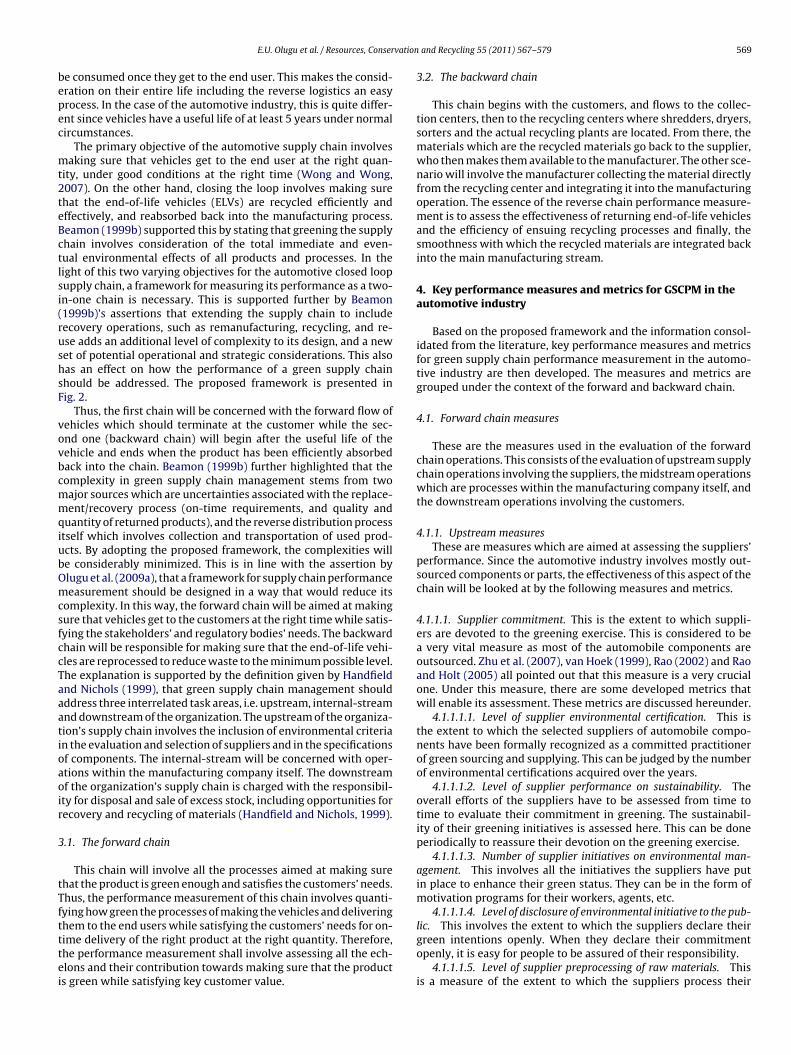
vation
bepec
mt2teBctlsi(rushsF
vovbcmmqiubOmcsfccTaaatioaoir
3
tTftttei
E.U. Olugu et al. / Resources, Conser
e consumed once they get to the end user. This makes the consid-ration on their entire life including the reverse logistics an easyrocess. In the case of the automotive industry, this is quite differ-nt since vehicles have a useful life of at least 5 years under normalircumstances.
The primary objective of the automotive supply chain involvesaking sure that vehicles get to the end user at the right quan-
ity, under good conditions at the right time (Wong and Wong,007). On the other hand, closing the loop involves making surehat the end-of-life vehicles (ELVs) are recycled efficiently andffectively, and reabsorbed back into the manufacturing process.eamon (1999b) supported this by stating that greening the supplyhain involves consideration of the total immediate and even-ual environmental effects of all products and processes. In theight of this two varying objectives for the automotive closed loopupply chain, a framework for measuring its performance as a two-n-one chain is necessary. This is supported further by Beamon1999b)’s assertions that extending the supply chain to includeecovery operations, such as remanufacturing, recycling, and re-se adds an additional level of complexity to its design, and a newet of potential operational and strategic considerations. This alsoas an effect on how the performance of a green supply chainhould be addressed. The proposed framework is presented inig. 2.
Thus, the first chain will be concerned with the forward flow ofehicles which should terminate at the customer while the sec-nd one (backward chain) will begin after the useful life of theehicle and ends when the product has been efficiently absorbedack into the chain. Beamon (1999b) further highlighted that theomplexity in green supply chain management stems from twoajor sources which are uncertainties associated with the replace-ent/recovery process (on-time requirements, and quality and
uantity of returned products), and the reverse distribution processtself which involves collection and transportation of used prod-cts. By adopting the proposed framework, the complexities wille considerably minimized. This is in line with the assertion bylugu et al. (2009a), that a framework for supply chain performanceeasurement should be designed in a way that would reduce its
omplexity. In this way, the forward chain will be aimed at makingure that vehicles get to the customers at the right time while satis-ying the stakeholders’ and regulatory bodies’ needs. The backwardhain will be responsible for making sure that the end-of-life vehi-les are reprocessed to reduce waste to the minimum possible level.he explanation is supported by the definition given by Handfieldnd Nichols (1999), that green supply chain management shouldddress three interrelated task areas, i.e. upstream, internal-streamnd downstream of the organization. The upstream of the organiza-ion’s supply chain involves the inclusion of environmental criterian the evaluation and selection of suppliers and in the specificationsf components. The internal-stream will be concerned with oper-tions within the manufacturing company itself. The downstreamf the organization’s supply chain is charged with the responsibil-ty for disposal and sale of excess stock, including opportunities forecovery and recycling of materials (Handfield and Nichols, 1999).
.1. The forward chain
This chain will involve all the processes aimed at making surehat the product is green enough and satisfies the customers’ needs.hus, the performance measurement of this chain involves quanti-ying how green the processes of making the vehicles and deliveringhem to the end users while satisfying the customers’ needs for on-
ime delivery of the right product at the right quantity. Therefore,he performance measurement shall involve assessing all the ech-lons and their contribution towards making sure that the products green while satisfying key customer value.and Recycling 55 (2011) 567–579 569
3.2. The backward chain
This chain begins with the customers, and flows to the collec-tion centers, then to the recycling centers where shredders, dryers,sorters and the actual recycling plants are located. From there, thematerials which are the recycled materials go back to the supplier,who then makes them available to the manufacturer. The other sce-nario will involve the manufacturer collecting the material directlyfrom the recycling center and integrating it into the manufacturingoperation. The essence of the reverse chain performance measure-ment is to assess the effectiveness of returning end-of-life vehiclesand the efficiency of ensuing recycling processes and finally, thesmoothness with which the recycled materials are integrated backinto the main manufacturing stream.
4. Key performance measures and metrics for GSCPM in theautomotive industry
Based on the proposed framework and the information consol-idated from the literature, key performance measures and metricsfor green supply chain performance measurement in the automo-tive industry are then developed. The measures and metrics aregrouped under the context of the forward and backward chain.
4.1. Forward chain measures
These are the measures used in the evaluation of the forwardchain operations. This consists of the evaluation of upstream supplychain operations involving the suppliers, the midstream operationswhich are processes within the manufacturing company itself, andthe downstream operations involving the customers.
4.1.1. Upstream measuresThese are measures which are aimed at assessing the suppliers’
performance. Since the automotive industry involves mostly out-sourced components or parts, the effectiveness of this aspect of thechain will be looked at by the following measures and metrics.
4.1.1.1. Supplier commitment. This is the extent to which suppli-ers are devoted to the greening exercise. This is considered to bea very vital measure as most of the automobile components areoutsourced. Zhu et al. (2007), van Hoek (1999), Rao (2002) and Raoand Holt (2005) all pointed out that this measure is a very crucialone. Under this measure, there are some developed metrics thatwill enable its assessment. These metrics are discussed hereunder.
4.1.1.1.1. Level of supplier environmental certification. This isthe extent to which the selected suppliers of automobile compo-nents have been formally recognized as a committed practitionerof green sourcing and supplying. This can be judged by the numberof environmental certifications acquired over the years.
4.1.1.1.2. Level of supplier performance on sustainability. Theoverall efforts of the suppliers have to be assessed from time totime to evaluate their commitment in greening. The sustainabil-ity of their greening initiatives is assessed here. This can be doneperiodically to reassure their devotion on the greening exercise.
4.1.1.1.3. Number of supplier initiatives on environmental man-agement. This involves all the initiatives the suppliers have putin place to enhance their green status. They can be in the form ofmotivation programs for their workers, agents, etc.
4.1.1.1.4. Level of disclosure of environmental initiative to the pub-lic. This involves the extent to which the suppliers declare their
green intentions openly. When they declare their commitmentopenly, it is easy for people to be assured of their responsibility.4.1.1.1.5. Level of supplier preprocessing of raw materials. Thisis a measure of the extent to which the suppliers process their
570 E.U. Olugu et al. / Resources, Conservation and Recycling 55 (2011) 567–579
e com
se
4
oattr
4ct(eteaat
iimiie
Fig. 2. A two-in-on
upplied components in order to minimize or eliminate anti-nvironmental components.
.1.2. Midstream measuresThese are measures which are used in assessing the internal
perations of the company towards achieving and maintainingn environmentally sound supply chain. Under this category arehe greening cost, level of process management, product charac-eristics, management commitment, traditional supply chain cost,esponsiveness, quality, and flexibility.
.1.2.1. Greening cost. This is the overall cost incurred by theompany in making sure that its operations are environmen-ally sustainable. It has been considered as important by Beamon1999b), Hervani et al. (2005), Tsoulfas and Pappis (2008) and Zhut al. (2007). Klassen and Whybark (1999) have demonstrated thathe investment pattern of an organization has a huge impact onnvironmental performance. Based on its level of considerationnd significance, greening cost is one of the major measures forn efficient green supply chain management. The metrics underhis measure are as discussed in the ensuing paragraphs.
4.1.2.1.1. Cost associated with environmental compliance. Thiss very vital in assessing the greening cost. This involves all capitalnvested by a company in trying to meet up with all the environ-
ental requirements. It is believed that environmental compliancenvolves a series of expenditures. Thus, the more a company spendsn trying to achieve compliance, the more likely it will yield anffective green supply chain.
bined framework.
4.1.2.1.2. Cost associated with energy consumption. Under thiscost, the energy which the company consumes in its manufactur-ing operation is considered. Specifically, it includes the energy costof the plant and machineries, and that spent on other functionalaspects of the organization. For a green company, the level of con-sumption should be comparatively low.
4.1.2.1.3. Cost associated with environmentally friendly materi-als. This involves the totality of capital invested by an organizationtowards the acquisition of environmentally compliant raw mate-rials. It is a known fact that in order to acquire environmentallyfriendly raw materials, a company will have to spend additionalcapital on the suppliers. Higher capital invested in this regard willyield greater motivation to the suppliers and thus will boost thegreening effort.
4.1.2.1.4. Green cost per revenue. This item means the capitalwhich the organization sets apart from all its revenue solely for theimplementation of green supply chain management.
4.1.2.2. Level of process management. This means the extent anorganization has gone in optimizing and modifying its processes toenhance the reduction of environmental impact. This is very impor-tant as it reduces significantly the immediate and eventual effectsof the products. To buttress the importance of this measure, manyresearchers have recognized its essentiality, thus its consideration(Mclntyre et al., 1998; Beamon, 1999b; van Hoek, 1999; Rao, 2002;
Rao and Holt, 2005; Hervani et al., 2005; Tsoulfas and Pappis, 2008).The metrics under this measure are as follows.4.1.2.2.1. Availability of process optimization for waste reduction.This item considers whether the company has any structure in place
vation
tT
ettc
qwem
qpi
TstSe
4aMieOaac
tieo
Ttltb5
sdap
sbbrdmd
DmImtd
T
E.U. Olugu et al. / Resources, Conser
o enhance the reduction of waste generated during manufacturing.he definition of waste here involves both solid and liquid waste.
4.1.2.2.2. Level of spillage, leakage and pollution control. When-ver environmental effects associated with manufacturing arealked about, the first thing that comes to mind is emission. Underhis metric, the level of emission, spillage and leakage control isonsidered.
4.1.2.2.3. Level of waste generated during production. This is theuantity of waste generated through manufacturing operationsithin an organization. It is believed that if the process is green
nough, the level of waste generated should be considerably mini-al.4.1.2.2.4. Quantity of utility used. This takes into account the
uantity of water, electricity, and gas that is employed in the com-any over a given period of time. This is a very important metric as
t shows that the ecosystem should be tapped with caution.4.1.2.2.5. Number of violations of environmental regulations.
his is the bottom line of the metrics for process management. Itimply shows whether an organization is really living up to expec-ation in its bid to maintaining an environmentally sound process.ince many regulatory bodies are in place to monitor this, it is veryasy to notice when an organization violates any given area.
.1.2.3. Product characteristics. This is the most glaring measures it involves the features and components of the automobile.any studies have acknowledged its importance by relating to it
n one form or another. This is evident in studies done by Mclntyret al. (1998), Beamon (1999b), van Hoek (1999) and Rao (2002).ther researchers that took product features into considerationre Hervani et al. (2005), Rao and Holt (2005), Zhu et al. (2007),nd Tsoulfas and Pappis (2008). Under this measure, the metricsonsidered are as follows.
4.1.2.3.1. Level of recycled material in products. This measureshe extent to which the company integrates recycled materials backnto its main stream manufacturing process. This is a major step inncouraging reverse logistics by becoming a major customer of itswn recycled materials.
4.1.2.3.2. Level of product to be disposed to landfill or incinerated.his looks at the percentage of the vehicle that is not recyclable,hus destined to the landfills or incinerators. If a company is fol-owing the standard practice enshrined by the European Union forhe automotive industry (EC, 2000), the expected quantity shoulde less than 15% of the entire car and it is expected to be less than% by 2015 (Cruz-Rivera and Ertel, 2009).
4.1.2.3.3. Availability of eco-labelling. Eco-label is a labellingystem for consumer products that are made in a fashion that avoidsetrimental effects on the environment. This has been identifieds a way of showcasing the environmental compliance of a givenroduct, making it an obvious sight for a green conscious customer.
4.1.2.3.4. Level of biodegradable content in products. This mea-ures the quantity of materials in the vehicle which is capable ofeing decomposed by biological agents such as bacteria and otheriodegradable detergents. Biodegradable materials will eventuallyeturn to the mother earth after they have been disposed. Theyo not pose much threat to the environment. Inclusion of suchaterials in the vehicle components contributes to the greening
rive.4.1.2.3.5. Level of usage of design-for-assembly in products.
esign-for-assembly involves designing with ease of assembly inind. This has been expanded to include design-for-disassembly.
f products contain fewer parts or are provided with features whichake it easier to grasp, move, orient and insert them, it will take less
ime to assemble and disassemble, thereby reducing assembly orisassembly costs. These will in-turn enhance recycling processes.
4.1.2.3.6. Level of market share controlled by green products.his is a measure of the proportion of industry sales of a green
and Recycling 55 (2011) 567–579 571
vehicle. It is believed that this will have a great impact on assessingthe success of a green product.
4.1.2.4. Management commitment. This measures the overall effortand initiatives employed by the management of an organization incombating anti-environmental practices within its supply chain.This is considered to be the most important, because unless the topmanagement has decided to implement green supply chain man-agement as a strategy, it cannot succeed. Managers are the onesresponsible for making decisions related to supplier selection andmanufacturing operations (Rao and Holt, 2005; Zhu et al., 2007).To establish the level of importance of management commitment,almost all the reviewed studies in the area of green supply chainperformance measurement have emphasized it (Beamon, 1999b;Hervani et al., 2005; Tsoulfas and Pappis, 2008; Rao, 2002; vanHoek, 1999). Under this measure are the following metrics.
4.1.2.4.1. Level of management effort to motivate employees. Itis a popular adage that ‘charity begins at home’. So this metricmeasures the top management’s effort in motivating its employ-ees towards green supply chain management. Since the employeesare directly in-charge of implementing the strategy, it is necessaryto motivate them towards its success.
4.1.2.4.2. Availability of environmental evaluation schemes. If anorganization is to succeed in greening its internal operation, there isa need to put an appraisal system in place that will be charged withthe responsibility of measuring how well the different departmentswithin the organization are implementing the practice.
4.1.2.4.3. Availability of environmental auditing systems. Thismetric evaluates the availability of such internal environmentalregulating systems. This ensures that the right attitudes and actionsare being implemented towards greening the internal processeswithin the organization.
4.1.2.4.4. Availability of mission statement on sustainability. Amission statement is a document which is intended to serve as asummary of the business goals and values of an organization. Ifcompanies include greening in their mission statement, it impliesthey are really serious about it. Availability of such a document is ameasure of greening commitment.
4.1.2.4.5. Number of environmental management initiatives.This is a measure of the level to which the companies have devisedseveral programs aimed at encouraging green supply chain man-agement within and outside their immediate organization.
4.1.2.4.6. Level of management effort to enlighten consumers onsustainability. This metric measures the level to which the man-agement is enlightening the customer with information aboutgreening effect. Since information is power, its dissemination by themanagement will result in more confidence and conviction gainedby the customer.
4.1.2.4.7. Availability of environmental reward systems. Thismeasures the availability of an incentive package or any form ofcompensation created to encourage individuals, departments orsuppliers to practice green supply chain management.
4.1.2.4.8. Level of management effort to motivate suppliers.Under this metric, the level of encouragement given to the sup-pliers by the management of an organization aimed at boostingtheir greening strives is assessed. It can be in the form of training,financial assistance, etc.
4.1.2.5. Traditional supply chain cost. This is the regular costincurred by the supply chain as a result of the normal opera-tions in the chain. This cost has been identified as an importantmeasure of the supply chain performance for a long time
(Gunasekaran et al., 2001; Beamon, 1999a; Schonsleben, 2004;Stephens, 2001; Morgan, 2004; Bhagwat and Sharma, 2007). Itis believed that by greening the supply chain, the traditionalsupply chain cost will be influenced in one way or another.
5 vation
Tg
btaG(ctsca
tpiit
apSwbtccr
micraitt
aaplbbc
4tltribtt
easeot
Tp
72 E.U. Olugu et al. / Resources, Conser
he aspects of cost identified are listed in the ensuing para-raphs.
4.1.2.5.1. Percentage decrease in total supply chain cost (tangi-le and intangible cost). This is the total cost incurred in runninghe entire supply chain by an organization. It takes into accountll costs accruable in making sure that goods get to the end users.unasekaran et al. (2001) included cost of operation per hour. Chan
2003) included total overhead cost, tangible cost and incentiveost. Beamon (1999a) included total cost of resources and manufac-uring. It was described to cover returns processing cost and totalupply chain cost (Stephens, 2001). Bhagwat and Sharma (2007)alled it supply chain finance, logistic cost and cost associated withssets.
4.1.2.5.2. Percentage decrease in delivery cost. It is believed thathe cost of delivery will be reduced under a sound green sup-ly chain management. Chan (2003) highlighted this to be a very
mportant metric. Schonsleben (2004) expressed it as cost of fin-shed goods in transit. The change in delivery cost should be a metrico assess the overall traditional supply chain cost.
4.1.2.5.3. Percentage decrease in inventory cost. This is the costssociated with inventory storage within the company over aeriod of time. Morgan (2004) called it inventory carrying cost.tephens (2001) expressed this as cost of inventory for supplies,hile it was called inventory utilization and warehousing cost
y Chan and Qi (2003). Beamon (1999a) considered it as inven-ory obsolesce and inventory investment cost. Schonsleben (2004)alled it inventory turnover cost and Bhagwat and Sharma (2007)alled it total inventory cost. It is believed that inventory cost willeduce as a result of green supply chain management.
4.1.2.5.4. Percentage decrease in information sharing cost. Infor-ation sharing cost includes all the costs associated with
nformation processing for a smooth operation of the supplyhain. Gunasekaran et al. (2001) and Bhagwat and Sharma (2007)eferred to it as information carrying cost, while Stewart (1995)nd Gunasekaran et al. (2004) expressed it as information process-ng cost. A decrease in information sharing cost is expected withinhe supply chain as a result of the greening initiatives. This is dueo the fact that all parties share common goals.
4.1.2.5.5. Percentage decrease in ordering cost. This is the costssociated with orders placed on raw materials. Gunasekaran etl. (2001) included economic order quantity and effectiveness ofroduction schedule as elements in ordering cost. Beamon (1999a)
ooked at it as the number of back orders and stock out proba-ilities. Morgan (2004) looked at it as order processing cost. It iselieved that a good supply chain practice such as green supplyhain management should reduce the ordering cost.
.1.2.6. Responsiveness. This is a measure of the rate at whichhe supply chain responds to certain elements such as orderead time, product development cycle time, manufacturing leadime, total supply chain cycle time and on-time delivery. Someesearchers who recognized this as a key performance measurenclude Gunasekaran et al. (2001) and Beamon (1999a). It iselieved that responsiveness will be affected by the greening ini-iative and thus, a measure of the effect is necessary. The metricso be considered are as follows.
4.1.2.6.1. Percentage decrease in order lead time. This is the timelapsed between the ordering of raw materials and components,nd when they are received. Gunasekaran et al. (2001) includedupplier lead time and purchase order cycle time. Beamon (1999a)xpressed this as the average lateness and average earliness ofrders. Stephens (2001) discussed this as order fulfillment lead
ime. Another researcher who considered this is Chan (2003).4.1.2.6.2. Percentage decrease in product development cycle time.his is the time taken from the conception of ideas till the com-letion of the design. Researchers such as Chan (2003) considered
and Recycling 55 (2011) 567–579
it as the duration to produce a new product mix and the percent-age decrease in the time to produce a new product. Gunasekaranet al. (2001), and Bhagwat and Sharma (2007) considered it underproduct development cycle time.
4.1.2.6.3. Percentage decrease in manufacturing lead time. Thismeasures the delay from the moment the order is ready for man-ufacturing until its completion. Some studies have identified itas very crucial as is evident in Beamon (1999a) and Stephens(2001).
4.1.2.6.4. Percentage decrease in total supply chain cycle time.This is the total time elapsed between the ordering of raw materialsand components from the suppliers until when the finished prod-ucts reach the end users. Researchers such as Schonsleben (2004),Gunasekaran et al. (2001) and Beamon (1999a) identified it as avery crucial metric. Schonsleben (2004) and Morgan (2004) dis-cussed this as total supply chain response time. These show thelevel of importance attached to this metric.
4.1.2.6.5. Percentage increase in on-time delivery. This mea-sures the tardiness in the delivery of finished products. Tra-ditionally, some researchers looked at it as delivery lead time(Gunasekaran et al., 2001; Chan, 2003; Beamon, 1999a; Stephens,2001). The emphasis on this has been established based on the levelof attention it has received.
4.1.2.7. Quality. This is a distinguishing attribute as it measuresthe standard of the product. It has been considered by so manyresearchers as having a very big impact on supply chain perfor-mance. The majority of researchers have included it in their studiessuch as Artz (1999), Gunasekaran et al. (2001), Beamon (1999a),Stephens (2001), Hieber (2002), Chan and Qi (2003), Chan (2003),Graham et al. (1994), Bhagwat and Sharma (2007), Morgan (2004),and Windischer and Grote (2003). Metrics under this measure arediscussed here under.
4.1.2.7.1. Percentage decrease in customer dissatisfaction. Thisinvolves dissatisfaction of the customer from product use, etc.Beamon (1999a) and Morgan (2004) identified this as customercomplaint level, while Gunasekaran et al. (2001) and Chan (2003)considered it as customer satisfaction. It was also discussed as ser-vice level against competitors’ and customer perception of service(Bhagwat and Sharma, 2007). This is considered as a very vitalmetric since customer satisfaction is the most valuable asset anorganization can have.
4.1.2.7.2. Percentage decrease in delivery unreliability. Thisrefers to the level of dissatisfaction arising from unsatisfactorydelivery of products. It is believed that a high quality should bereflected in the reduced number of complaints with regard to unre-liable delivery.
4.1.2.7.3. Percentage decrease in scrap and rework. This is thenumber of products that is reworked due to certain reasons as wellas those which cannot be reworked which are classified as scraps.Chan (2003) termed this as the proportion of wrong products man-ufactured. Morgan (2004) called it damaged product. It is believedthat a reduced level of scrap and rework depicts a high level ofquality in manufacturing processes.
4.1.2.7.4. Availability of green product warranty. This is the levelto which green products are guaranteed against any form of fail-ure. Morgan (2004) called this damage claim level. A warranty willinstill confidence in the customers on the purchase and use of greenproducts.
4.1.2.8. Flexibility. This implies that the chain has the ability foradjustment to suit the various scenarios that might arise due
to changes in the normal supply chain processes. The impor-tance of flexibility is evident in the studies which considered itas a measure, such as Chan (2003), Beamon (1999a), Gunasekaranet al. (2004), Gunasekaran et al. (2001), Stephens (2001) and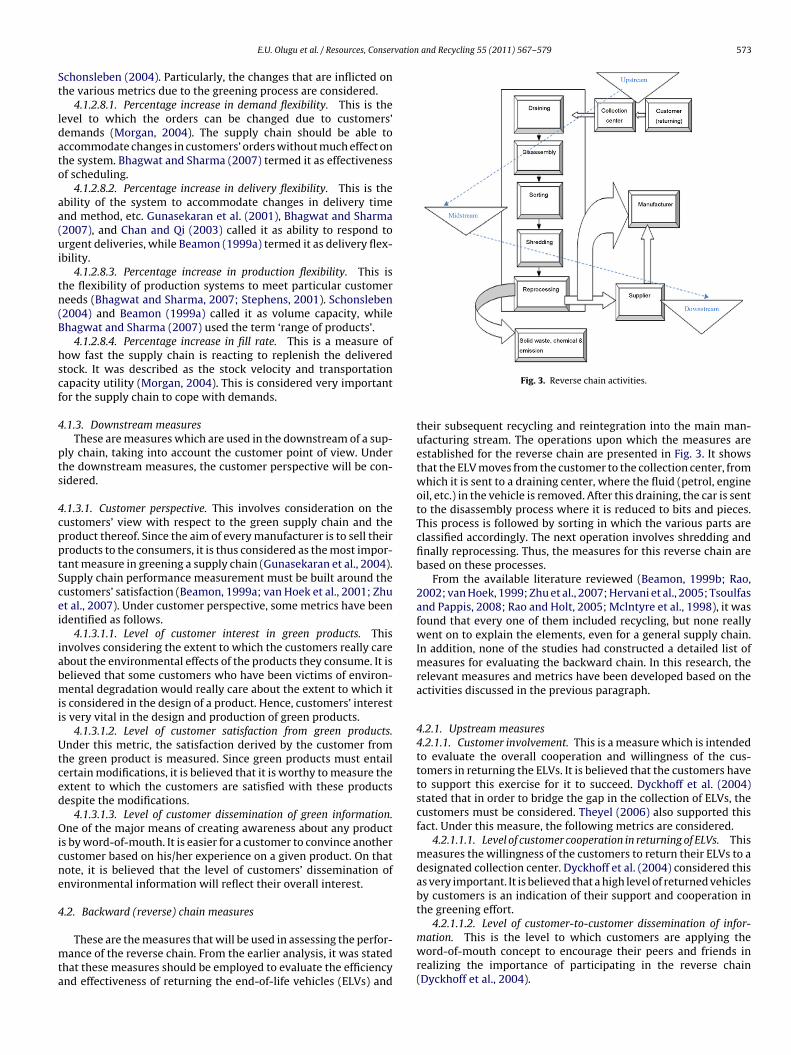
vation and Recycling 55 (2011) 567–579 573
St
ldato
aa(ui
tn(B
hscf
4
pts
4cpptScei
iabmii
Utced
Oicne
4
mta
E.U. Olugu et al. / Resources, Conser
chonsleben (2004). Particularly, the changes that are inflicted onhe various metrics due to the greening process are considered.
4.1.2.8.1. Percentage increase in demand flexibility. This is theevel to which the orders can be changed due to customers’emands (Morgan, 2004). The supply chain should be able toccommodate changes in customers’ orders without much effect onhe system. Bhagwat and Sharma (2007) termed it as effectivenessf scheduling.
4.1.2.8.2. Percentage increase in delivery flexibility. This is thebility of the system to accommodate changes in delivery timend method, etc. Gunasekaran et al. (2001), Bhagwat and Sharma2007), and Chan and Qi (2003) called it as ability to respond torgent deliveries, while Beamon (1999a) termed it as delivery flex-
bility.4.1.2.8.3. Percentage increase in production flexibility. This is
he flexibility of production systems to meet particular customereeds (Bhagwat and Sharma, 2007; Stephens, 2001). Schonsleben2004) and Beamon (1999a) called it as volume capacity, whilehagwat and Sharma (2007) used the term ‘range of products’.
4.1.2.8.4. Percentage increase in fill rate. This is a measure ofow fast the supply chain is reacting to replenish the deliveredtock. It was described as the stock velocity and transportationapacity utility (Morgan, 2004). This is considered very importantor the supply chain to cope with demands.
.1.3. Downstream measuresThese are measures which are used in the downstream of a sup-
ly chain, taking into account the customer point of view. Underhe downstream measures, the customer perspective will be con-idered.
.1.3.1. Customer perspective. This involves consideration on theustomers’ view with respect to the green supply chain and theroduct thereof. Since the aim of every manufacturer is to sell theirroducts to the consumers, it is thus considered as the most impor-ant measure in greening a supply chain (Gunasekaran et al., 2004).upply chain performance measurement must be built around theustomers’ satisfaction (Beamon, 1999a; van Hoek et al., 2001; Zhut al., 2007). Under customer perspective, some metrics have beendentified as follows.
4.1.3.1.1. Level of customer interest in green products. Thisnvolves considering the extent to which the customers really carebout the environmental effects of the products they consume. It iselieved that some customers who have been victims of environ-ental degradation would really care about the extent to which it
s considered in the design of a product. Hence, customers’ interests very vital in the design and production of green products.
4.1.3.1.2. Level of customer satisfaction from green products.nder this metric, the satisfaction derived by the customer from
he green product is measured. Since green products must entailertain modifications, it is believed that it is worthy to measure thextent to which the customers are satisfied with these productsespite the modifications.
4.1.3.1.3. Level of customer dissemination of green information.ne of the major means of creating awareness about any product
s by word-of-mouth. It is easier for a customer to convince anotherustomer based on his/her experience on a given product. On thatote, it is believed that the level of customers’ dissemination ofnvironmental information will reflect their overall interest.
.2. Backward (reverse) chain measures
These are the measures that will be used in assessing the perfor-ance of the reverse chain. From the earlier analysis, it was stated
hat these measures should be employed to evaluate the efficiencynd effectiveness of returning the end-of-life vehicles (ELVs) and
Fig. 3. Reverse chain activities.
their subsequent recycling and reintegration into the main man-ufacturing stream. The operations upon which the measures areestablished for the reverse chain are presented in Fig. 3. It showsthat the ELV moves from the customer to the collection center, fromwhich it is sent to a draining center, where the fluid (petrol, engineoil, etc.) in the vehicle is removed. After this draining, the car is sentto the disassembly process where it is reduced to bits and pieces.This process is followed by sorting in which the various parts areclassified accordingly. The next operation involves shredding andfinally reprocessing. Thus, the measures for this reverse chain arebased on these processes.
From the available literature reviewed (Beamon, 1999b; Rao,2002; van Hoek, 1999; Zhu et al., 2007; Hervani et al., 2005; Tsoulfasand Pappis, 2008; Rao and Holt, 2005; Mclntyre et al., 1998), it wasfound that every one of them included recycling, but none reallywent on to explain the elements, even for a general supply chain.In addition, none of the studies had constructed a detailed list ofmeasures for evaluating the backward chain. In this research, therelevant measures and metrics have been developed based on theactivities discussed in the previous paragraph.
4.2.1. Upstream measures4.2.1.1. Customer involvement. This is a measure which is intendedto evaluate the overall cooperation and willingness of the cus-tomers in returning the ELVs. It is believed that the customers haveto support this exercise for it to succeed. Dyckhoff et al. (2004)stated that in order to bridge the gap in the collection of ELVs, thecustomers must be considered. Theyel (2006) also supported thisfact. Under this measure, the following metrics are considered.
4.2.1.1.1. Level of customer cooperation in returning of ELVs. Thismeasures the willingness of the customers to return their ELVs to adesignated collection center. Dyckhoff et al. (2004) considered thisas very important. It is believed that a high level of returned vehiclesby customers is an indication of their support and cooperation inthe greening effort.
4.2.1.1.2. Level of customer-to-customer dissemination of infor-mation. This is the level to which customers are applying the
word-of-mouth concept to encourage their peers and friends inrealizing the importance of participating in the reverse chain(Dyckhoff et al., 2004).
5 vation
Tpsit
44crcSpcc
tliDei
iroae
tisec
AA(ewt
4eDacmm
(cretnq
iravt
s
74 E.U. Olugu et al. / Resources, Conser
4.2.1.1.3. Level of understanding of green process by customers.his measures the understanding of customers in the greeningrocess. Dyckhoff et al. (2004) believed that without this under-tanding the customers will not participate fully in the process. Its only when they understand the rationale behind a process thathey can really support it whole heartedly.
.2.2. Midstream measures
.2.2.1. Recycling cost. This is the cost associated with all the pro-esses involved in recycling the ELVs, ranging from the cost ofeturning, draining, disassembling, sorting, shredding, to repro-essing. Inderfurth (2004) considered it as remanufacturing cost.ince cost has already been identified as very vital to supply chainerformance measurement, the cost associated with the reversehain will no doubt be a very important measure. Under recyclingost, the following metrics are discussed.
4.2.2.1.1. Cost associated with returning of ELVs. This is theotality of money spent in making sure that the ELVs get to the col-ection centers and eventually to the final reprocessing plant. Thiss believed to be very vital to the efficient collection of the vehicles.yckhoff et al. (2004) pointed out that returning of ELVs is vital forffective recycling. Thus, the cost incurred is a good metric to assessts success.
4.2.2.1.2. Cost associated with processing of recyclables. Thisncludes the cost of draining, disassembling, shredding and finaleprocessing of the ELVs. Schultmann et al. (2004) called this as costf treatment of ELVs, while Schultmann et al. (2001) considered its cost of reprocessing activities. All these costs are necessary forffective reprocessing of the vehicles.
4.2.2.1.3. Cost of sorting and segregation of recyclables. Underhis metric, the capital invested for separating different recyclablesnto different categories is considered. Spengler et al. (2004) con-idered this as recovery cost. It is believed that effective andfficient sorting will enhance the effectiveness of the recycling pro-ess.
4.2.2.1.4. Cost of disposal for hazardous and unprocessed waste.t the end of the recycling process, there is always a residue.ccording to Dyckhoff et al. (2004) and Cruz-Rivera and Ertel
2009), this waste should constitute about 15% of the ELV and it isxpected to be less than 5% by 2015. Thus, this and other hazardousaste generated should be properly disposed. The cost involved in
his disposal (Dyckhoff et al., 2004) is considered here.
.2.2.2. Material features. This measures the composition andffect of the materials in the ELVs on the reverse supply chain.ifferent automobiles have different compositions and thus willffect the entire reverse logistics process. Hesselbach et al. (2007)onsidered this as the recyclability of the materials. This is a majoreasure of the effectiveness of the reverse chain and the followingetrics are developed.4.2.2.2.1. Level of waste generated. This is the quantity of waste
solid and liquid) that is generated per ELV at the end of the recy-ling process. It is expected that this waste should have a directelationship with the material composition of the ELV. Dyckhofft al. (2004) and Cruz-Rivera and Ertel (2009) highlighted thathis waste is a very important metric. Therefore, the higher theon-recyclable portion of the automobile, the higher the expecteduantity of waste to be generated.
4.2.2.2.2. Ratio of materials recycled to recyclable materials. Thiss the proportion of the actual recycled materials to the supposedecyclable materials in the ELV. In other words, this is the ratio of thectual volume achieved in the recycling process to the theoretical
olume of recyclables. Hesselbach et al. (2007) considered this ashe recycling potential of the product.4.2.2.2.3. Material recovery time. This metric is the total timepent on a given ELV from draining, disassembling, shredding, to
and Recycling 55 (2011) 567–579
reprocessing. The lower the time, the more efficient and effectivethe recycling processes. Fleischer et al. (2007) and Hesselbach et al.(2007) supported this fact. A good material composition of an ELVshould enhance the recovery time positively.
4.2.2.3. Management commitment. This is a measure of the totalityof the top management’s initiatives aimed at making sure that therecycling is efficiently and effectively carried out. Under this mea-sure, there are several metrics which could be employed. Mezherand Ajam (2006) and Olugu et al. (2009b) considered this as a keysuccess factor for environmental stewardship of a product.
4.2.2.3.1. Level of motivation to customers on ELVs. In most casesthe management has introduced a lot of initiatives aimed at moti-vating the customers to return their ELVs. Some of these includea trade-in of the ELV for a new car, while some give a certainlevel of rebate. Dyckhoff et al. (2004) considered these efforts ascustomer incentives and they are geared towards motivating thecustomers.
4.2.2.3.2. Availability of standard operating procedure for the col-lection of ELVs. This is aimed at assessing the management effort inhaving a defined procedure in place for returning the ELVs and theirsubsequent reprocessing. Schultmann et al. (2004) and Dyckhoff etal. (2004) described this to be very important. If a structure is inplace, obviously it will boost the effectiveness of the entire process.
4.2.2.3.3. Availability of collection centers. It is expected that themanagement will be responsible for providing a collection center.Dyckhoff et al. (2004) and Helms and Hervani (2006) believed thatthis will be very necessary for an effective returning of ELVs. Theavailability and ease of accessibility of collection centers for ELVswill boost the returning process.
4.2.2.3.4. Availability of waste management schemes. This isaimed at evaluating the availability and effectiveness of the wastemanagement scheme for waste generated at the end of the recy-cling process. Since there is always a certain level of wastegenerated at the end of the recycling process, there should be aproper management and disposal program in place. Dyckhoff etal. (2004), Schultmann et al. (2004) and Hesselbach et al. (2007)supported this as an important metric.
4.2.2.4. Recycling efficiency. This is a measure of the overall effec-tiveness of the recycling processes. A higher recycling efficiencysignifies that the processes are supporting green supply chain man-agement. Below are some metrics used in the measurement of therecycling efficiency.
4.2.2.4.1. Percentage decrease in the recycling time. This is theoverall reduction in the time taken to completely recycle ELVs (fromthe time they arrive at collection centers until they have been finallyreprocessed). Fleischer et al. (2007) considered it as recycling rateand Schultmann et al. (2004) supported this as an important metric.It is believed that when the workers become more familiar withthe system, the process will become faster. This reduction in timeshows that there is an improvement in the process.
4.2.2.4.2. Availability of recycling standards. This is aimed atmeasuring the existence of a standard established for all the recy-cling processes. Without a standard, it will be difficult to knowwhether the recycling is effective or not. Thus, this is a vital metric.Hesselbach et al. (2007) and Spengler et al. (2004) identified this asvery important in assessing the recyclability of any product.
4.2.2.4.3. Availability of standard operating procedures. Thismetric measures whether there is any standard procedure ormethodology to guide the recycling process. Spengler et al. (2004)called this procedure as the product recycling passport or recycling
database. This will save cost arising from waste due to errors oromissions in the recycling processes.4.2.2.4.4. Percentage decrease in utility usage during recycling.This is a measure of the amount of power consumed, water used,
vation and Recycling 55 (2011) 567–579 575
gile
a(cI
EcwSe
44pcv
UtubftSal
TsaHm
TpTtS
5
refpanwdctamoms2ci
E.U. Olugu et al. / Resources, Conser
as used, etc., during the recycling of a given quantity of ELVs. Its believed that a higher efficiency of the process will lead to aower usage of utilities. Tsoulfas and Pappis (2008) and Hervanit al. (2005) considered this metric as important.
4.2.2.4.5. Efficiency of shredders and dismantlers. The shreddersnd dismantlers are two vital players within the recycling processSchultmann et al., 2004). If they do not carry out their job very effi-iently, the overall time for the recycling process will be increased.n addition, there will be more waste generated during the process.
4.2.2.4.6. Percentage reduction in emission and waste generated.lmer (2007) considered this metric as the amount of pollutant perommodity. Basically, it looks at the level to which the emission andaste generated has been reduced during each recycling operation.
ince recycling is aimed at waste reduction, the lower the waste andmission generated, the more efficient the recycling process.
.2.3. Downstream measures
.2.3.1. Supplier commitment. This is to assess the initiatives put inlace by the suppliers in making sure that the entire reverse supplyhain process is successful. Hamner (2006) supported this to be aery crucial measure. The metrics employed here are as follows.
4.2.3.1.1. Extent of delivery from suppliers back to manufacturers.nder this metric, the effectiveness of inclusion and integration of
he recycled materials into the main manufacturing stream is eval-ated. If suppliers give their full support to this integration, it willoost the entire process. It is believed that without a commitmentrom the suppliers to smoothly integrate the recycled materials intoheir supplies, the relevance of the backward chain will be defeated.roufe (2006) and Baumgarten et al. (2007) considered this metrics a key success factor for the selection of suppliers and reverseogistics.
4.2.3.1.2. Certification system for suppliers in the recycling process.he availability of a system that will certify the effectiveness of theuppliers in reverse logistics is assessed here. It can serve as anudit system to know whether the integration is really taking place.amner (2006) and Sroufe (2006) believed this to be a very crucialetric.4.2.3.1.3. Number of supplier initiatives in the recycling process.
his is a measure of the number of initiatives put in place by the sup-liers to encourage and promote the effective recycling of the ELVs.his should be evaluated based on the key programs employed byhe raw material suppliers aimed at boosting the recycling process.roufe (2006) highlighted this to be an important metric.
. Research methodology
In order to validate the proposed measures, a survey was car-ied out. It should be noted that this was an expert evaluationxercise rather than a full-fledged industrial survey. Based on theramework which has been discussed earlier in Section 3, a four-age questionnaire was developed for assessing the importancend applicability level of the measures and metrics. The question-aire comprised three sections. The first part of the questionnaireas aimed to obtain background information about the respon-ents. The second section comprised the measures for the forwardhain and their corresponding metrics. The respondents were askedo assign a score to each of the metrics to evaluate their importancend applicability level in measuring the performance of an auto-otive green supply chain. Importance level implies the degree
f perceived importance placed on the metrics, while applicabilityeans the extent to which they can be applied or used in practice. A
coring scale from 0 to 5 was applied where 0 = no idea, 1 = very low,= low, 3 = moderate, 4 = high, and 5 = very high. The third sectionomprised the measures and metrics for the reverse chain. Sim-larly, the respondents were asked to rate each of the metrics to
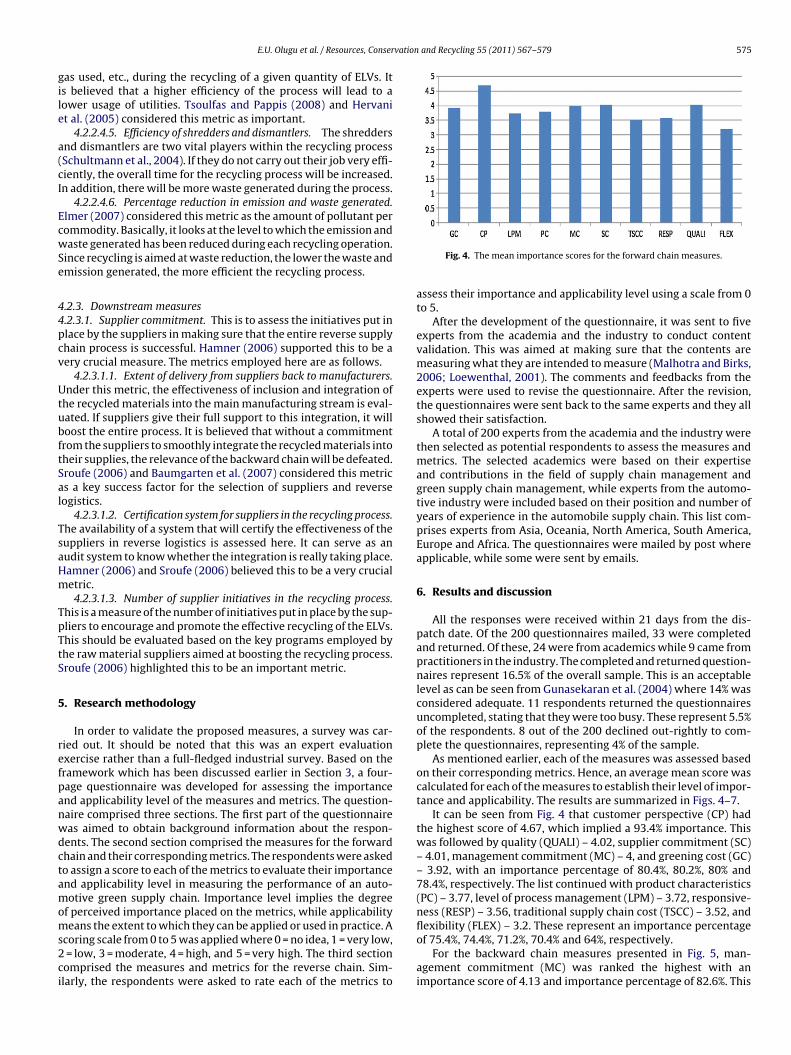
Fig. 4. The mean importance scores for the forward chain measures.
assess their importance and applicability level using a scale from 0to 5.
After the development of the questionnaire, it was sent to fiveexperts from the academia and the industry to conduct contentvalidation. This was aimed at making sure that the contents aremeasuring what they are intended to measure (Malhotra and Birks,2006; Loewenthal, 2001). The comments and feedbacks from theexperts were used to revise the questionnaire. After the revision,the questionnaires were sent back to the same experts and they allshowed their satisfaction.
A total of 200 experts from the academia and the industry werethen selected as potential respondents to assess the measures andmetrics. The selected academics were based on their expertiseand contributions in the field of supply chain management andgreen supply chain management, while experts from the automo-tive industry were included based on their position and number ofyears of experience in the automobile supply chain. This list com-prises experts from Asia, Oceania, North America, South America,Europe and Africa. The questionnaires were mailed by post whereapplicable, while some were sent by emails.
6. Results and discussion
All the responses were received within 21 days from the dis-patch date. Of the 200 questionnaires mailed, 33 were completedand returned. Of these, 24 were from academics while 9 came frompractitioners in the industry. The completed and returned question-naires represent 16.5% of the overall sample. This is an acceptablelevel as can be seen from Gunasekaran et al. (2004) where 14% wasconsidered adequate. 11 respondents returned the questionnairesuncompleted, stating that they were too busy. These represent 5.5%of the respondents. 8 out of the 200 declined out-rightly to com-plete the questionnaires, representing 4% of the sample.
As mentioned earlier, each of the measures was assessed basedon their corresponding metrics. Hence, an average mean score wascalculated for each of the measures to establish their level of impor-tance and applicability. The results are summarized in Figs. 4–7.
It can be seen from Fig. 4 that customer perspective (CP) hadthe highest score of 4.67, which implied a 93.4% importance. Thiswas followed by quality (QUALI) – 4.02, supplier commitment (SC)– 4.01, management commitment (MC) – 4, and greening cost (GC)– 3.92, with an importance percentage of 80.4%, 80.2%, 80% and78.4%, respectively. The list continued with product characteristics(PC) – 3.77, level of process management (LPM) – 3.72, responsive-ness (RESP) – 3.56, traditional supply chain cost (TSCC) – 3.52, andflexibility (FLEX) – 3.2. These represent an importance percentage
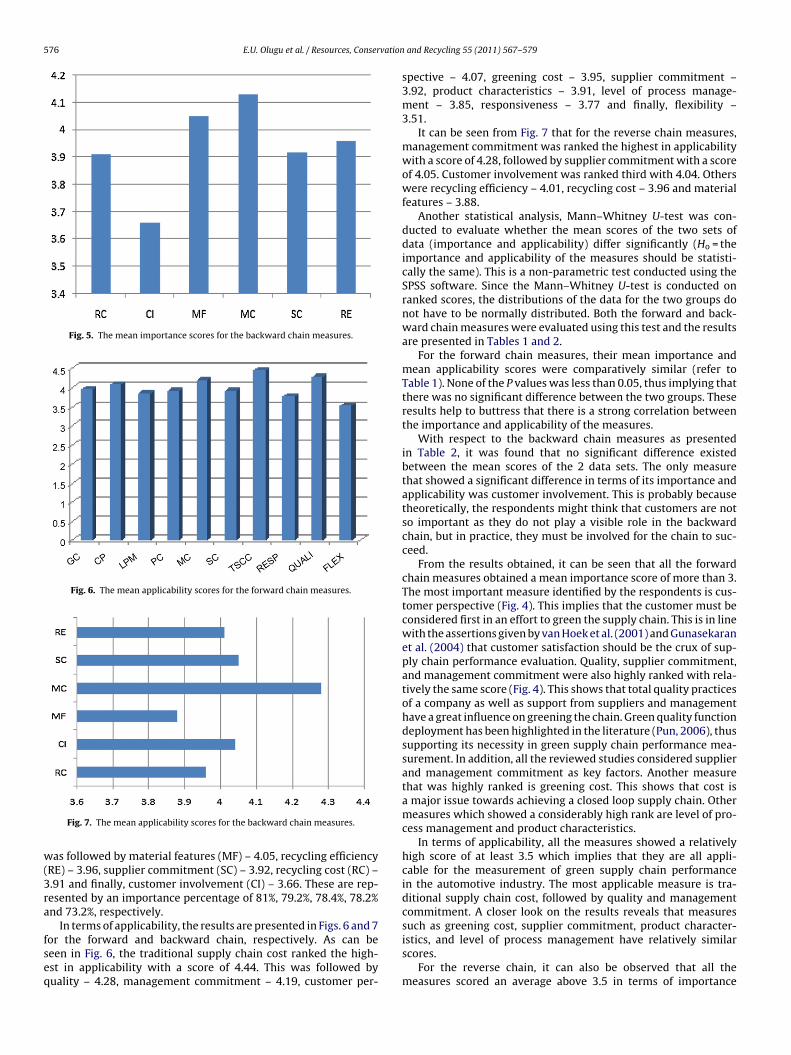
of 75.4%, 74.4%, 71.2%, 70.4% and 64%, respectively.For the backward chain measures presented in Fig. 5, man-agement commitment (MC) was ranked the highest with animportance score of 4.13 and importance percentage of 82.6%. This
576 E.U. Olugu et al. / Resources, Conservation
Fig. 5. The mean importance scores for the backward chain measures.
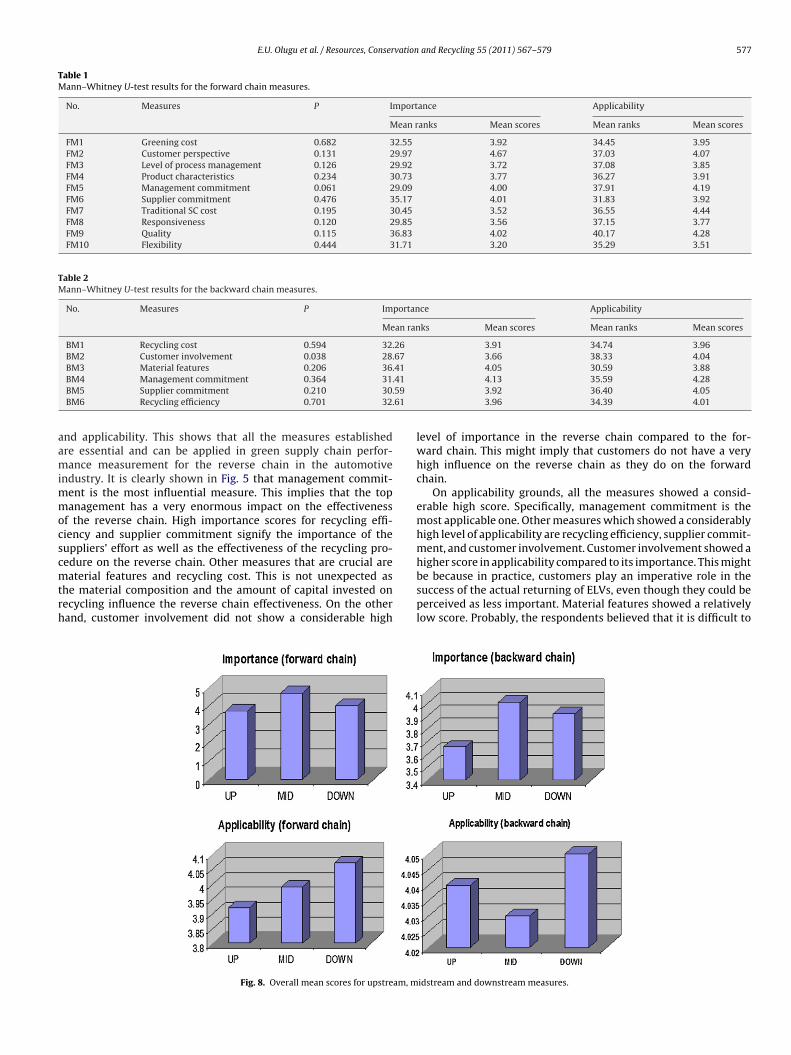
Fig. 6. The mean applicability scores for the forward chain measures.
w(3ra
fseq
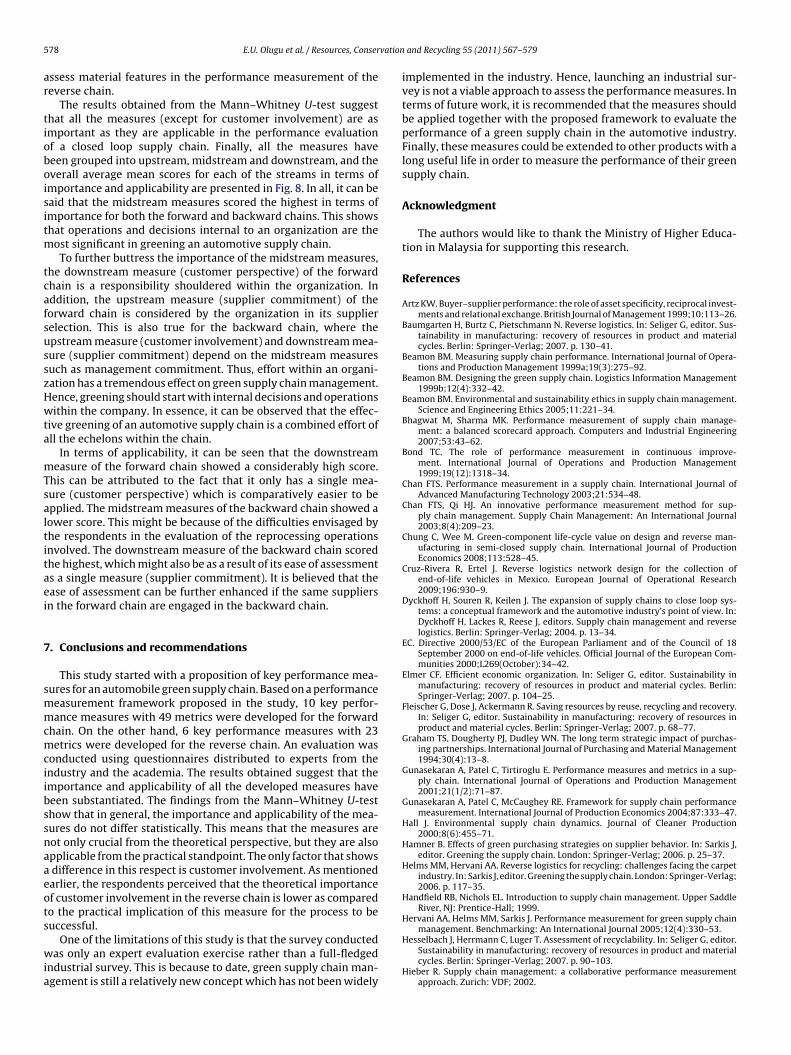
Fig. 7. The mean applicability scores for the backward chain measures.
as followed by material features (MF) – 4.05, recycling efficiencyRE) – 3.96, supplier commitment (SC) – 3.92, recycling cost (RC) –.91 and finally, customer involvement (CI) – 3.66. These are rep-esented by an importance percentage of 81%, 79.2%, 78.4%, 78.2%nd 73.2%, respectively.
In terms of applicability, the results are presented in Figs. 6 and 7
or the forward and backward chain, respectively. As can beeen in Fig. 6, the traditional supply chain cost ranked the high-st in applicability with a score of 4.44. This was followed byuality – 4.28, management commitment – 4.19, customer per-and Recycling 55 (2011) 567–579
spective – 4.07, greening cost – 3.95, supplier commitment –3.92, product characteristics – 3.91, level of process manage-ment – 3.85, responsiveness – 3.77 and finally, flexibility –3.51.
It can be seen from Fig. 7 that for the reverse chain measures,management commitment was ranked the highest in applicabilitywith a score of 4.28, followed by supplier commitment with a scoreof 4.05. Customer involvement was ranked third with 4.04. Otherswere recycling efficiency – 4.01, recycling cost – 3.96 and materialfeatures – 3.88.
Another statistical analysis, Mann–Whitney U-test was con-ducted to evaluate whether the mean scores of the two sets ofdata (importance and applicability) differ significantly (Ho = theimportance and applicability of the measures should be statisti-cally the same). This is a non-parametric test conducted using theSPSS software. Since the Mann–Whitney U-test is conducted onranked scores, the distributions of the data for the two groups donot have to be normally distributed. Both the forward and back-ward chain measures were evaluated using this test and the resultsare presented in Tables 1 and 2.
For the forward chain measures, their mean importance andmean applicability scores were comparatively similar (refer toTable 1). None of the P values was less than 0.05, thus implying thatthere was no significant difference between the two groups. Theseresults help to buttress that there is a strong correlation betweenthe importance and applicability of the measures.
With respect to the backward chain measures as presentedin Table 2, it was found that no significant difference existedbetween the mean scores of the 2 data sets. The only measurethat showed a significant difference in terms of its importance andapplicability was customer involvement. This is probably becausetheoretically, the respondents might think that customers are notso important as they do not play a visible role in the backwardchain, but in practice, they must be involved for the chain to suc-ceed.
From the results obtained, it can be seen that all the forwardchain measures obtained a mean importance score of more than 3.The most important measure identified by the respondents is cus-tomer perspective (Fig. 4). This implies that the customer must beconsidered first in an effort to green the supply chain. This is in linewith the assertions given by van Hoek et al. (2001) and Gunasekaranet al. (2004) that customer satisfaction should be the crux of sup-ply chain performance evaluation. Quality, supplier commitment,and management commitment were also highly ranked with rela-tively the same score (Fig. 4). This shows that total quality practicesof a company as well as support from suppliers and managementhave a great influence on greening the chain. Green quality functiondeployment has been highlighted in the literature (Pun, 2006), thussupporting its necessity in green supply chain performance mea-surement. In addition, all the reviewed studies considered supplierand management commitment as key factors. Another measurethat was highly ranked is greening cost. This shows that cost isa major issue towards achieving a closed loop supply chain. Othermeasures which showed a considerably high rank are level of pro-cess management and product characteristics.
In terms of applicability, all the measures showed a relativelyhigh score of at least 3.5 which implies that they are all appli-cable for the measurement of green supply chain performancein the automotive industry. The most applicable measure is tra-ditional supply chain cost, followed by quality and managementcommitment. A closer look on the results reveals that measuressuch as greening cost, supplier commitment, product character-
istics, and level of process management have relatively similarscores.For the reverse chain, it can also be observed that all themeasures scored an average above 3.5 in terms of importance
E.U. Olugu et al. / Resources, Conservation and Recycling 55 (2011) 567–579 577
Table 1Mann–Whitney U-test results for the forward chain measures.
No. Measures P Importance Applicability
Mean ranks Mean scores Mean ranks Mean scores
FM1 Greening cost 0.682 32.55 3.92 34.45 3.95FM2 Customer perspective 0.131 29.97 4.67 37.03 4.07FM3 Level of process management 0.126 29.92 3.72 37.08 3.85FM4 Product characteristics 0.234 30.73 3.77 36.27 3.91FM5 Management commitment 0.061 29.09 4.00 37.91 4.19FM6 Supplier commitment 0.476 35.17 4.01 31.83 3.92FM7 Traditional SC cost 0.195 30.45 3.52 36.55 4.44FM8 Responsiveness 0.120 29.85 3.56 37.15 3.77FM9 Quality 0.115 36.83 4.02 40.17 4.28FM10 Flexibility 0.444 31.71 3.20 35.29 3.51
Table 2Mann–Whitney U-test results for the backward chain measures.
No. Measures P Importance Applicability
Mean ranks Mean scores Mean ranks Mean scores
BM1 Recycling cost 0.594 32.26 3.91 34.74 3.96BM2 Customer involvement 0.038 28.67 3.66 38.33 4.04BM3 Material features 0.206 36.41 4.05 30.59 3.88
.41
.59
.61
aamimmocscmtrh
BM4 Management commitment 0.364 31BM5 Supplier commitment 0.210 30BM6 Recycling efficiency 0.701 32
nd applicability. This shows that all the measures establishedre essential and can be applied in green supply chain perfor-ance measurement for the reverse chain in the automotive
ndustry. It is clearly shown in Fig. 5 that management commit-ent is the most influential measure. This implies that the topanagement has a very enormous impact on the effectiveness
f the reverse chain. High importance scores for recycling effi-iency and supplier commitment signify the importance of theuppliers’ effort as well as the effectiveness of the recycling pro-edure on the reverse chain. Other measures that are crucial are
aterial features and recycling cost. This is not unexpected ashe material composition and the amount of capital invested onecycling influence the reverse chain effectiveness. On the otherand, customer involvement did not show a considerable high
Fig. 8. Overall mean scores for upstream, m
4.13 35.59 4.283.92 36.40 4.053.96 34.39 4.01
level of importance in the reverse chain compared to the for-ward chain. This might imply that customers do not have a veryhigh influence on the reverse chain as they do on the forwardchain.
On applicability grounds, all the measures showed a consid-erable high score. Specifically, management commitment is themost applicable one. Other measures which showed a considerablyhigh level of applicability are recycling efficiency, supplier commit-ment, and customer involvement. Customer involvement showed ahigher score in applicability compared to its importance. This might
be because in practice, customers play an imperative role in thesuccess of the actual returning of ELVs, even though they could beperceived as less important. Material features showed a relativelylow score. Probably, the respondents believed that it is difficult toidstream and downstream measures.
5 vation
ar
tioboisitm
tcafsusszHwta
mTsaltitaei
7
smmcmciibssnaaeots
wia
78 E.U. Olugu et al. / Resources, Conser
ssess material features in the performance measurement of theeverse chain.
The results obtained from the Mann–Whitney U-test suggesthat all the measures (except for customer involvement) are asmportant as they are applicable in the performance evaluationf a closed loop supply chain. Finally, all the measures haveeen grouped into upstream, midstream and downstream, and theverall average mean scores for each of the streams in terms ofmportance and applicability are presented in Fig. 8. In all, it can beaid that the midstream measures scored the highest in terms ofmportance for both the forward and backward chains. This showshat operations and decisions internal to an organization are the
ost significant in greening an automotive supply chain.To further buttress the importance of the midstream measures,
he downstream measure (customer perspective) of the forwardhain is a responsibility shouldered within the organization. Inddition, the upstream measure (supplier commitment) of theorward chain is considered by the organization in its supplierelection. This is also true for the backward chain, where thepstream measure (customer involvement) and downstream mea-ure (supplier commitment) depend on the midstream measuresuch as management commitment. Thus, effort within an organi-ation has a tremendous effect on green supply chain management.ence, greening should start with internal decisions and operationsithin the company. In essence, it can be observed that the effec-
ive greening of an automotive supply chain is a combined effort ofll the echelons within the chain.
In terms of applicability, it can be seen that the downstreameasure of the forward chain showed a considerably high score.
his can be attributed to the fact that it only has a single mea-ure (customer perspective) which is comparatively easier to bepplied. The midstream measures of the backward chain showed aower score. This might be because of the difficulties envisaged byhe respondents in the evaluation of the reprocessing operationsnvolved. The downstream measure of the backward chain scoredhe highest, which might also be as a result of its ease of assessments a single measure (supplier commitment). It is believed that thease of assessment can be further enhanced if the same suppliersn the forward chain are engaged in the backward chain.
. Conclusions and recommendations
This study started with a proposition of key performance mea-ures for an automobile green supply chain. Based on a performanceeasurement framework proposed in the study, 10 key perfor-ance measures with 49 metrics were developed for the forward
hain. On the other hand, 6 key performance measures with 23etrics were developed for the reverse chain. An evaluation was
onducted using questionnaires distributed to experts from thendustry and the academia. The results obtained suggest that themportance and applicability of all the developed measures haveeen substantiated. The findings from the Mann–Whitney U-testhow that in general, the importance and applicability of the mea-ures do not differ statistically. This means that the measures areot only crucial from the theoretical perspective, but they are alsopplicable from the practical standpoint. The only factor that showsdifference in this respect is customer involvement. As mentionedarlier, the respondents perceived that the theoretical importancef customer involvement in the reverse chain is lower as comparedo the practical implication of this measure for the process to beuccessful.
One of the limitations of this study is that the survey conductedas only an expert evaluation exercise rather than a full-fledged
ndustrial survey. This is because to date, green supply chain man-gement is still a relatively new concept which has not been widely
and Recycling 55 (2011) 567–579
implemented in the industry. Hence, launching an industrial sur-vey is not a viable approach to assess the performance measures. Interms of future work, it is recommended that the measures shouldbe applied together with the proposed framework to evaluate theperformance of a green supply chain in the automotive industry.Finally, these measures could be extended to other products with along useful life in order to measure the performance of their greensupply chain.
Acknowledgment
The authors would like to thank the Ministry of Higher Educa-tion in Malaysia for supporting this research.
References
Artz KW. Buyer–supplier performance: the role of asset specificity, reciprocal invest-ments and relational exchange. British Journal of Management 1999;10:113–26.
Baumgarten H, Burtz C, Pietschmann N. Reverse logistics. In: Seliger G, editor. Sus-tainability in manufacturing: recovery of resources in product and materialcycles. Berlin: Springer-Verlag; 2007. p. 130–41.
Beamon BM. Measuring supply chain performance. International Journal of Opera-tions and Production Management 1999a;19(3):275–92.
Beamon BM. Designing the green supply chain. Logistics Information Management1999b;12(4):332–42.
Beamon BM. Environmental and sustainability ethics in supply chain management.Science and Engineering Ethics 2005;11:221–34.
Bhagwat M, Sharma MK. Performance measurement of supply chain manage-ment: a balanced scorecard approach. Computers and Industrial Engineering2007;53:43–62.
Bond TC. The role of performance measurement in continuous improve-ment. International Journal of Operations and Production Management1999;19(12):1318–34.
Chan FTS. Performance measurement in a supply chain. International Journal ofAdvanced Manufacturing Technology 2003;21:534–48.
Chan FTS, Qi HJ. An innovative performance measurement method for sup-ply chain management. Supply Chain Management: An International Journal2003;8(4):209–23.
Chung C, Wee M. Green-component life-cycle value on design and reverse man-ufacturing in semi-closed supply chain. International Journal of ProductionEconomics 2008;113:528–45.
Cruz-Rivera R, Ertel J. Reverse logistics network design for the collection ofend-of-life vehicles in Mexico. European Journal of Operational Research2009;196:930–9.
Dyckhoff H, Souren R, Keilen J. The expansion of supply chains to close loop sys-tems: a conceptual framework and the automotive industry’s point of view. In:Dyckhoff H, Lackes R, Reese J, editors. Supply chain management and reverselogistics. Berlin: Springer-Verlag; 2004. p. 13–34.
EC. Directive 2000/53/EC of the European Parliament and of the Council of 18September 2000 on end-of-life vehicles. Official Journal of the European Com-munities 2000;L269(October):34–42.
Elmer CF. Efficient economic organization. In: Seliger G, editor. Sustainability inmanufacturing: recovery of resources in product and material cycles. Berlin:Springer-Verlag; 2007. p. 104–25.
Fleischer G, Dose J, Ackermann R. Saving resources by reuse, recycling and recovery.In: Seliger G, editor. Sustainability in manufacturing: recovery of resources inproduct and material cycles. Berlin: Springer-Verlag; 2007. p. 68–77.
Graham TS, Dougherty PJ, Dudley WN. The long term strategic impact of purchas-ing partnerships. International Journal of Purchasing and Material Management1994;30(4):13–8.
Gunasekaran A, Patel C, Tirtiroglu E. Performance measures and metrics in a sup-ply chain. International Journal of Operations and Production Management2001;21(1/2):71–87.
Gunasekaran A, Patel C, McCaughey RE. Framework for supply chain performancemeasurement. International Journal of Production Economics 2004;87:333–47.
Hall J. Environmental supply chain dynamics. Journal of Cleaner Production2000;8(6):455–71.
Hamner B. Effects of green purchasing strategies on supplier behavior. In: Sarkis J,editor. Greening the supply chain. London: Springer-Verlag; 2006. p. 25–37.
Helms MM, Hervani AA. Reverse logistics for recycling: challenges facing the carpetindustry. In: Sarkis J, editor. Greening the supply chain. London: Springer-Verlag;2006. p. 117–35.
Handfield RB, Nichols EL. Introduction to supply chain management. Upper SaddleRiver, NJ: Prentice-Hall; 1999.
Hervani AA, Helms MM, Sarkis J. Performance measurement for green supply chainmanagement. Benchmarking: An International Journal 2005;12(4):330–53.
Hesselbach J, Herrmann C, Luger T. Assessment of recyclability. In: Seliger G, editor.Sustainability in manufacturing: recovery of resources in product and materialcycles. Berlin: Springer-Verlag; 2007. p. 90–103.
Hieber R. Supply chain management: a collaborative performance measurementapproach. Zurich: VDF; 2002.
vation
I
K
L
L
L
L
M
M
M
M
M
N
O
O
O
P
P
R
R
R
S
S
S
S
implementation by Chinese manufacturers. Journal of Environmental Manage-
E.U. Olugu et al. / Resources, Conser
nderfurth K. Product recovery behavior in a closed loop supply chain. In: DyckhoffH, Lackes R, Reese J, editors. Supply chain management and reverse logistics.Berlin: Springer-Verlag; 2004.
lassen R, Whybark DC. The impact of environmental technologies on manufactur-ing performance. Academy of Management Journal 1999;42(6):599–615.
ai K, Ngai EWT, Cheng TCE. Measures for evaluating supply chain performance intransport logistics. Transportation Research Part E 2002;38:439–56.
iang L, Feng F, Cook WD, Zhu J. DEA models for supply chain efficiency evaluation.Annals of Operations Research 2006;145:35–49.
inton JD, Klassen R, Jayaraman V. Sustainable supply chains: an introduction. Jour-nal of Operations Management 2007;25(1):1075–82.
oewenthal KM. An introduction to psychological tests and scales. East Sussex:Psychology Press; 2001.
alhotra NK, Birks DF. Marketing research: an applied approach. Harlow, England:Prentice-Hall; 2006.
clntyre K, Smith HA, Henham A, Pretlove J. Environmental performance indicatorsfor integrated supply chains: the case of Xerox Ltd. Supply Chain Management:An International Journal 1998;3(3):149–56.
entzer JT, Myers MB, Stank TP. Handbook of global supply chain management.California: Sage Publications; 2007.
ezher T, Ajam M. Integrating quality, environmental and supply chain manage-ment systems into the learning organization. In: Sarkis J, editor. Greening thesupply chain. London: Springer-Verlag; 2006.
organ C. Structure, speed and salience: performance measurement in the supplychain. Business Process Management Journal 2004;10(5):522–36.
eely A, Gregory M, Platts K. Performance measurement system design: a literaturereview and research agenda. International Journal of Operations and ProductionManagement 2005;25(12):1228–63.
lugu EU, Wong KY. Supply chain performance evaluation: trends and challenges.American Journal of Engineering and Applied Sciences 2009;2(1):202–11.
lugu EU, Wong KY, Shaharoun AM. A conceptual framework for green supplychain performance measurement in the automotive industry. In: Proceedingsof the 13th IBIMA Conference on Knowledge Management and Innovation inAdvancing Economies; 2009a. p. 40–50.
lugu EU, Wong KY, Shaharoun AM. Proposed performance measurement areas foran automobile green supply chain. In: Proceedings of the 13th IBIMA Conferenceon Knowledge Management and Innovation in Advancing Economies; 2009b. p.130–8.
reuss L. In dirty chains: purchasing and greener manufacturing. Journal of BusinessEthics 2001;34:345–59.
un KF. Determinants of environmentally responsible operations: a review. Inter-national Journal of Quality and Reliability Management 2006;23(3):279–97.
ao P. Greening the supply chain: a new initiative in South East Asia. InternationalJournal of Operations and Production Management 2002;22(6):632–55.
ao P, Holt D. Do green supply chains lead to competitiveness and economic per-formance? International Journal of Operations and Production Management2005;25(9):898–916.
oberts S. Supply chain specific? Understanding the patchy success of ethical sourc-ing initiatives. Journal of Business Ethics 2003;44:159–70.
abri EH, Beamon M. A multi-objective approach to simultaneous strategic and oper-ational planning in supply chain design. Omega: An International Journal ofManagement Science 2000;28:581–98.
alam MA. Corporate social responsibility in purchasing and supply chain. Journalof Business Ethics 2009;85(2):355–70.
chonsleben P. Integral logistics management: planning and control of comprehen-sive supply chains. Boca Raton, FL: St Lucie Press; 2004.
chultmann F, Jochum R, Rentz O. A methodological approach for the economicassessment of best available techniques: case study for the steel industry. Inter-national Journal of Life Cycle Assessment 2001;6:19–27.
and Recycling 55 (2011) 567–579 579
Schultmann F, Zumkeller M, Rentz O. Integrating spent products material into sup-ply chains: the recycling of end-of-life vehicles as an example. In: Dyckhoff H,Lackes R, Reese J, editors. Supply chain management and reverse logistics. Berlin:Springer-Verlag; 2004.
Solvang WD, Roman E, Deng Z, Solvang B. A framework for holistic greening of valuechains. Knowledge enterprise: intelligent strategies in product design, manufac-turing, and management. International Federation for Information Processing(IFIP) 2006;207:350–5.
Spengler T, Stolting W, Ploog M. Recovery planning in closed loop supply chain:an activity analysis based approach. In: Dyckhoff H, Lackes R, Reese J, edi-tors. Supply chain management and reverse logistics. Berlin: Springer-Verlag;2004.
Sroufe RP. A framework for strategic environmental sourcing. In: SarkisJ, editor. Greening the supply chain. London: Springer-Verlag; 2006.p. 3–23.
Stephens S. Supply chain operations reference model version 5.0: a new tool toimprove supply chain efficiency and achieve best practice. Information SystemsFrontiers 2001;3(4):471–6.
Steven M. Network in reversed logistics. In: Dyckhoff H, Lackes R, Reese J, editors.Supply chain management and reverse logistics. Berlin: Springer-Verlag; 2004.
Stewart G. Supply chain performance benchmarking study reveals keys tosupply chain excellence. Logistics Information Management 1995;8(2):38–44.
Theyel G. Customer and supplier relations for environmental performance. In: SarkisJ, editor. Greening the supply chain. London: Springer-Verlag; 2006. p. 139–49.
Tsoulfas GT, Pappis CP. A model for supply chains environmental performanceanalysis and decision making. Journal of Cleaner Production 2008;16(15):1647–57.
US-AEP. Sector based public policy in the Asia-Pacific Region. US-AEP; 1999.Vachon S, Klassen RD. Extending green practices across the supply chain: the impact
of upstream and downstream integration. International Journal of Operationsand Production Management 2006;26(7):795–821.
Vachon S, Klassen RD. Environmental management and manufacturing perfor-mance: the role of collaboration in the supply chain. International Journal ofProduction Economics 2008;111:299–315.
van Hoek RI. From reversed logistics to green supply chains. Supply Chain Manage-ment: An International Journal 1999;4(3):129–34.
van Hoek RI, Harrison A, Christopher M. Measuring the agile capabilities in thesupply chain. International Journal of Operations and Production Management2001;21(1/2):126–47.
Vonderembse MA, Uppal M, Huang SH, Dismukes. Designing supply chains:towards theory development. International Journal of Production Economics2006;100:223–38.
Windischer A, Grote G. Success factors for collaborative planning. In: Seuring S,Muller M, Goldbach M, editors. Strategy and organization in supply chain. NewYork: Physica-Verlag; 2003. p. 131–46.
Wong WP, Wong KY. Supply chain performance measurement system usingDEA modeling. Industrial Management and Data Systems 2007;107(3):361–81.
Wong WP, Wong KY. A review on benchmarking of supply chain performance mea-sures. Benchmarking: An International Journal 2008;15(1):25–51.
Zhu Q, Sarkis J, Lai K. Initiatives and outcomes of green supply chain management
ment 2007;85:179–89.Zhu Q, Sarkis J. An inter-sectoral comparison of green supply chain manage-
ment in China: drivers and practices. Journal of Cleaner Production 2006;14:472–86.