development of classical force field for the chemical bonding between benzenedithiolate and gold
TRANSCRIPT
Interaction between benzenedithiolate and gold: Classical force field forchemical bonding
Yongsheng Lenga�
Department of Chemical Engineering, Vanderbilt University, Nashville, Tennessee 37235
Predrag S. KrstićPhysics Division, Oak Ridge National Laboratory, Oak Ridge, Tennessee 37831
Jack C. WellsComputer Science and Mathematics Division, Oak Ridge National Laboratory, Oak Ridge, Tennessee 37831
Peter T. CummingsDepartment of Chemical Engineering, Vanderbilt University, Nashville, Tennessee 37235 and ChemicalSciences Division and Center for Nanophase Materials Sciences, Oak Ridge National Laboratory, Oak Ridge,Tennessee 37831
David J. DeanPhysics Division, Oak Ridge National Laboratory, Oak Ridge, Tennessee 37831
�Received 4 April 2005; accepted 4 May 2005; published online 6 July 2005�
We have constructed a group of classical potentials based on ab initio density-functional theory�DFT� calculations to describe the chemical bonding between benzenedithiolate �BDT� moleculeand gold atoms, including bond stretching, bond angle bending, and dihedral angle torsion involvedat the interface between the molecule and gold clusters. Three DFT functionals, local-densityapproximation �LDA�, PBE0, and X3LYP, have been implemented to calculate single point energies�SPE� for a large number of molecular configurations of BDT–1, 2 Au complexes. The three DFTmethods yield similar bonding curves. The variations of atomic charges from Mulliken populationanalysis within the molecule/metal complex versus different molecular configurations have beeninvestigated in detail. We found that, except for bonded atoms in BDT–1, 2 Au complexes, theMulliken partial charges of other atoms in BDT are quite stable, which significantly reduces theuncertainty in partial charge selections in classical molecular simulations. Molecular-dynamics�MD� simulations are performed to investigate the structure of BDT self-assembled monolayer�SAM� and the adsorption geometry of S adatoms on Au �111� surface. We found that thebond-stretching potential is the most dominant part in chemical bonding. Whereas the local bondinggeometry of BDT molecular configuration may depend on the DFT functional used, the globalpacking structure of BDT SAM is quite independent of DFT functional, even though the uncertaintyof some force-field parameters for chemical bonding can be as large as �100%. This indicates thatthe intermolecular interactions play a dominant role in determining the BDT SAMs global packingstructure. © 2005 American Institute of Physics. �DOI: 10.1063/1.1942468�
I. INTRODUCTION
The geometry of molecular bonding and packing of self-assembled monolayers �SAMs� at an organometallic inter-face is a fundamental issue in the development of molecularelectronic devices.1 While extensive experimental effortshave been invested in calibrating the transport properties of asingle-molecule bridge between metal leads,2,3 theoreticaland experimental investigations also indicate that the con-ductance of metal-molecule-metal junctions depends on themolecular conformations,4,5 the temperature,5,6 the packingdensity,7 and the contact nature between organic moleculesand electrodes.8 Understanding the equilibrium structure of
SAMs under zero bias should be a starting point to the sub-sequent transport calculations, though an actual electric cur-rent may affect the SAMs structure.1,9
Recent ab initio density-functional theory �DFT� calcu-lations of thiolate molecules on the Au �111� surface, eitherat full or low coverage,10–14 show that S head groups preferto bond at bridge or bridgelike binding sites with a strongchemical bonding, instead of the fcc hollow sites.15 The DFTcalculations for the binding between thiolate molecules andgold clusters also find that sulphur forms strong chemicalbonds with only one or two gold atoms,9,16–18 correspondingto the “on-top” or “on-bridge” �or “on-bridgelike”� bondingon an extended gold surface. Indeed, the strong Au–S cova-lent bonding is indicated by the larger concentration of elec-tron density between S and bonded Au atoms11,12,18 and bythe distinctly directional Au–S–C bond whose bond angle isclose to 103°–109°.16 Given the evidence of the very local
a�Author to whom correspondence should be addressed. Electronic mail:[email protected]
THE JOURNAL OF CHEMICAL PHYSICS 122, 244721 �2005�
0021-9606/2005/122�24�/244721/12/$22.50 © 2005 American Institute of Physics122, 244721-1
Downloaded 21 Jul 2005 to 129.59.75.207. Redistribution subject to AIP license or copyright, see http://jcp.aip.org/jcp/copyright.jsp

chemical bonding between S and Au atoms, we can safelyassume that the interactions between thiolate molecules andgold clusters or bulk surfaces can be separated into two parts:the bonded interaction involving S and one or two Au atomsand the nonbonded interaction between thiolate molecule andother gold atoms. Whereas the far-field van der Waals inter-actions can be approximately described by a general univer-sal force field �UFF�,19 characterization of the locally bondedinteractions by classical potentials is a real challenge. This isbecause the electronic structure and energetics of individualgold clusters may differ from those of the same clusters em-bedded in the bulk metal surfaces.16,17 These differences maylead to different bonding geometries �particularly the bondlengths�. However, there is at least a quantitative way tocalibrate this difference by increasing the cluster sizes, and inthe present study we first focus on individual small clusters.In fact, mechanically pulling a thiolate molecule from astepped gold surface already suggested that the final ruptureis governed by the interaction between the molecule and 1–3Au atoms.20
We develop a set of classical potentials representing thelocal bonding behaviors of benzenedithiolate �BDT� mol-ecule �a prototypical molecular bridge well investigated inexperimental measurements2 and theoretical work7,21� withonly one or two Au atom clusters. These potentials can beused in large-scale molecular-dynamics �MD� simulations ofmolecular electronic devices. We note that a more completetreatment14 of thiolate molecules on Au �111� surface em-ploys the hybrid quantum mechanical with molecular me-chanics �QM/MM� approach,22 in which the QM subsysteminvolves the metal surface and thiol head groups and theremaining chain subsystem is dealt with the MM empiricalpotentials. However, the computational time is still quite de-manding. In general, hybrid QM/MM methods can give bet-ter descriptions of vibrational spectra of molecules comparedwith crude MM force field. But in view of statistical struc-ture properties, which are the main concerns in large-scalemolecular simulations, the MM method �particularly theclassical force field derived from ab initio quantum-mechanical calculations for chemical bonding� implementedin MD simulations is much more valuable.22
In our early work23 of the MD simulations of BDTmonolayers on Au �111� surfaces, a primary force field forAu–BDT chemical bonding was developed. However, thefunctional forms of bond stretching and angle bending wereharmonic. We feel that these potentials cannot correctly de-scribe the dynamics of BDT molecules, particularly at largedeformations, and higher-order anharmonic terms should beincluded. Moreover, only the local-density approximation�LDA� in DFT was used to calibrate BDT–Au bonded inter-actions. The present study explores other DFT methods �seebelow� to gain insight into the uncertainty of parameters inclassical potentials and molecular packing structure to thechoice of the DFT exchange-correlation �XC� functionals.We will also investigate the effect of molecular conformationon the Mulliken charge distributions in BDT–1, 2 Au com-plexes, one of the key components in determining the pack-ing structure of SAMs.24 Using the newly developed classi-cal potentials for BDT/Au chemical bonding, we perform
MD simulations to investigate the BDT SAM structure onAu �111� surfaces. Our main findings show that whereas thelocal bonding geometry at BDT/Au interface is directly re-lated to the chemical bonding potentials �particularly thebond-stretching terms derived from different DFT XC func-tionals�, the global packing structure of BDT SAM is largelydetermined by the nonbonded intermolecular interactions,thus quite independent of XC functional used.
The paper is constructed as follows: Sec. II briefly de-scribes the molecular models for BDT/gold complexes andcomputational method. In Sec. III, we present in detail thederivations of the chemical bonding potentials for the inter-action between BDT molecules and gold atoms based on theDFT energy calculations, followed by the investigations ofthe atomic charge variations with the changes of BDT–1, 2Au molecular geometries. Section IV gives detailed MDsimulations for the adsorption structure of BDT monolayeron Au �111� surface based on the developed force field forthe BDT–1, 2 Au chemical bonding. Our conclusions areshown in Sec. V.
II. MODELS AND METHOD
A. BDT–1, 2 Au cluster models
Based on recent DFT calculations for the binding be-tween thiolate molecules and gold clusters, which showedthat sulphur forms strong chemical bonds with only one ortwo gold atoms,9,16–18 we construct two BDT/gold molecularmodels: BDT–1 Au and BDT–2 Au complexes, as shown inFigs. 1�a� and 1�b�. The geometry of the BDT molecule wasobtained through the optimization of the molecular geometryby the UFF.25 The top S–H bond is perpendicular to thebenzene ring. A recent, rather accurate MP2 calculation fa-vored this perpendicular structure over the planar one by2.1 kJ/mol, which is comparable to kT at T=298 K.26 InFig. 1�a�, the bond stretching, bond angle bending, and bondtorsion correspond to Au14–S8, Au14–S8–C4, and Au14–S8–C4–C3 �torsion Au14–S8–C4–C5 is also considered by
FIG. 1. Molecular models for BDT–1, 2 Au complexes.
244721-2 Leng et al. J. Chem. Phys. 122, 244721 �2005�
Downloaded 21 Jul 2005 to 129.59.75.207. Redistribution subject to AIP license or copyright, see http://jcp.aip.org/jcp/copyright.jsp
dividing the force constant by a factor of 2�. For the BDT–2Au complex �Fig. 1�b��, we introduce a geometric point asthe starting bonded “atom” �marked by a dot X� that repre-sents the midpoint of 2-Au cluster. The bond stretching, bondangle bending, and bond torsion correspond to X–S8,X–S8–C4, and X–S8–C4–C3. We notice that there shouldbe a constraint barrier for the BDT molecule to move alongthe Au–Au direction �see Sec. III B�. This barrier is thecomplement to the bonded interaction between the BDT and2-Au clusters. We assume that the Au–Au distance inFig. 1�b� is fixed and takes the bulk value of 2.88 Å, andomit the relaxation of Au–Au distance induced by the chemi-cal bonding with S.9
B. Computational method
All the calculations were performed within the frame-work of the DFT using the NWCHEM package.27 The Gauss-ian valence triple zeta basis set 6-311G �Ref. 28� is used forS, C, and H in BDT molecule and the effective core potential�CRENBL-ECP� and associated basis set29 is used for the Auatoms. �The 60 core electrons of Au are represented by ECPand the 19 remaining active electrons are represented by 44basis functions.30� For the open shell systems �BDT–2 Aucomplex�, we use spin-polarized wave functions. Since theoptimal form of the DFT functional for such organometallicclusters is not known, three separate calculations of the forceparameters were done, employing various DFT functionals:�1� standard local-density approximation �LDA� with Slaterexchange and Vosko–Wilk–Nusair �VWN-V� correlation,31
�2� the PBE0,32 often used for transition metals, a hybrid,parameter-free approximation for exchange-correlation com-bining a generalized gradient functional �LDA-GGA� �25%Hartree–Fock �exact� exchange, 75% PBE exchange func-tional, Perdew91 LDA local correlation functional, and PBEnonlocal correlation functional�, and �3� the X3LYP,33 oftenused for hydrocarbons �improvement of the conventionalB3LYP�, an extended hybrid, generalized gradient functionalcombined with Lee–Yang–Parr correlation functional �21.8%Hartree–Fock �exact� exchange, 78.2% local Slater exchangefunctional, 54.2% nonlocal Becke 1988 exchange functional,87.1% Lee–Yang–Parr correlation functional, 16.7% Per-dew91 nonlocal correlation functional, and 12.9% VWN-IRPA local correlation functional�. We investigate the sensi-tivity of the force-field parameters to the DFT functionalsfrom these three calculations, which enables us to set therelevant uncertainty for each parameter.
Since we are not interested in the global energy mini-mum for BDT–1, 2 Au complexes but rather in local energychanges due to the geometry variation of BDT and gold, allthe energy curves are obtained from the total DFT energywhile keeping the BDT molecule rigid. Moreover, we do notconsider the cross or coupling between different bondingterms. Thus, when dealing with the higher-order bonded in-teractions �e.g., Au14–S8–C4–C3 torsion term�, the lower-order bond geometry parameters �e.g., Au14–S8 bond lengthand Au14–S8–C4 bond angle� are fixed to the local-
optimized �equilibrium� values. The partial charge distribu-tions within the molecule are obtained simultaneously fromMulliken population analysis.34
We note that the continuous and lowest-energy curvewhile varying stretching distance is obtained by the totalsinglet spin state in the case of BDT–1 Au complex, and bythe total quartet spin pairing for the BDT–2 Au complex.This is an artifact of the simplified model of the gold surface,containing only one and two Au atoms. It is expected that thespin dependence is suppressed with an increase of the num-ber of Au atoms in the model, and eventually disappears forthe bulk of Au substrate. Our test comparison of the BDT–1Au singlet and triplet stretching curves with the ones usingBDT–10 Au complex �not shown in this paper� support thisconclusion.
III. RESULTS AND DISCUSSION
For the chemical bonding between the S atom in BDTand 1, 2 Au atoms, the total force-field energy is written as asum of several individual bonding terms
Etot = Estr + Ebend + Etors + �Econstr� , �1�
where Estr, Ebend, and Etors are the bond-stretching, angle-bending, and bond-torsion energies, and Econstr is the con-straint potential for BDT molecule sliding along the Au–Audirection in the case of BDT–2 Au complex. Below we de-scribe the development of these individual terms from theDFT energy calculations.
A. BDT–1 Au complex
1. Bond stretching
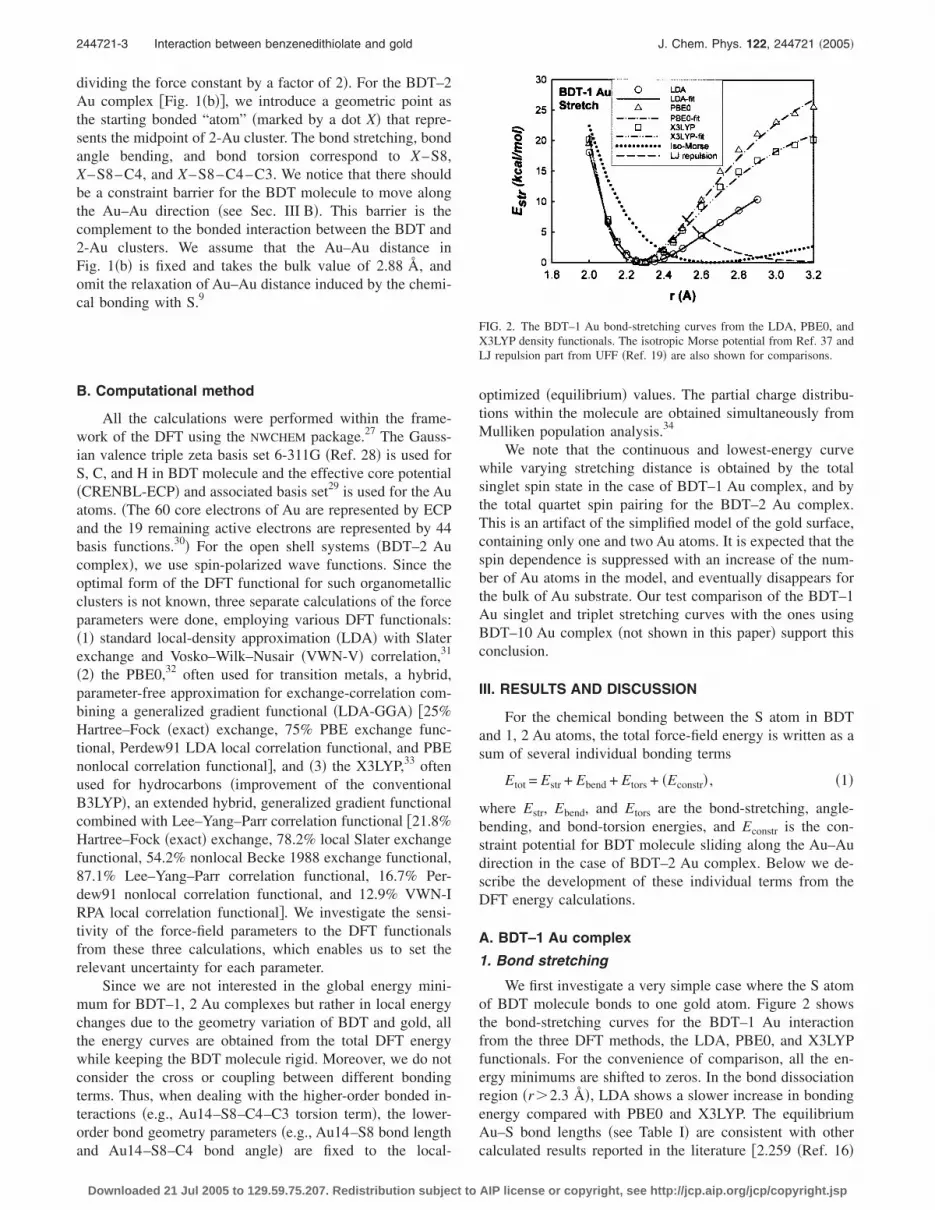
We first investigate a very simple case where the S atomof BDT molecule bonds to one gold atom. Figure 2 showsthe bond-stretching curves for the BDT–1 Au interactionfrom the three DFT methods, the LDA, PBE0, and X3LYPfunctionals. For the convenience of comparison, all the en-ergy minimums are shifted to zeros. In the bond dissociationregion �r�2.3 Å�, LDA shows a slower increase in bondingenergy compared with PBE0 and X3LYP. The equilibriumAu–S bond lengths �see Table I� are consistent with othercalculated results reported in the literature �2.259 �Ref. 16�
FIG. 2. The BDT–1 Au bond-stretching curves from the LDA, PBE0, andX3LYP density functionals. The isotropic Morse potential from Ref. 37 andLJ repulsion part from UFF �Ref. 19� are also shown for comparisons.
244721-3 Interaction between benzenedithiolate and gold J. Chem. Phys. 122, 244721 �2005�
Downloaded 21 Jul 2005 to 129.59.75.207. Redistribution subject to AIP license or copyright, see http://jcp.aip.org/jcp/copyright.jsp

and 2.234 Å,17 both using the CPMD package with plane-wave basis sets and BP86 or PBE functional, see the relatedreferences� for thiol molecule bonded to single gold atoms,but are less than recent experimental values of methylthiolateat atop site on bulk Au �111� surface �2.42 �Ref. 35� and2.5 Å �Ref. 36��. The bond-stretching curves can be wellfitted by a shifted Morse potential
Estr = E0e−��r−r0��e−��r−r0� − 2� + E0, �2�
where r is the distance between the S atom and Au atom, andE0 �the well-depth�, � and r0 �the equilibrium bond length�are the parameters to be fitted, which are listed in Table I. Itis interesting to note that previously the isotropic Morse �Iso-Morse� potential between Au and S has been developedbased on temperature-programmed desorption �TPD� valueof a methylthiolate on gold surface.37 Parameters of this Iso-Morse potential are also listed in Table I for comparison. Theforce constants at equilibrium ��d2E /dr2��r=r0�=2�2E0�,which are listed at the bottom row of Table I, show thatvalues from the DFT are approximately five to ten times ofthat of Iso-Morse, suggesting that single BDT–Au chemicalbond is much stronger than the Iso-Morse bond. We believethat this is probably because in the development of the Iso-Morse potential,37 the treatment of nondistinction betweenthe bonded and nonbonded Au–S interactions may smear outthe very strong chemical bonding. Specifically, the data inthe last two rows in Table I show that PBE0 and X3LYPfunctionals give mutually consistent Au–S bond lengths andforce constants compared with LDA results. These bondlengths are smaller than that given by the Iso-Morse poten-tial. The average values and total variations �defined as thedifference between the largest and the smallest values di-vided by the average value� of the fitted force-field param-eters from the three DFT functionals are also show inTable I. Obviously, the larger uncertainties come from thebond-stretching parameters E0 and �.
In the UFF,19 the nonbonded van der Waals interactionsare represented by the 12-6 Lennard-Jones potentials, wherethe repulsive interaction is proportional to the overlap be-tween the squared wave functions of two species. For the S
and Au nonbonded atomic pairs, this weak repulsion is usedfor the distances much larger than the Au–S bond lengths. InFig. 2, only the shifted LJ repulsion part beyond 2.5 Å isshown. It goes to zero at rLJ=3.65 Å �not shown in thefigure�.
2. Bond angle bending
From geometric consideration, the angle-bending Au14–S8–C4 should be out of the plane of benzene ring. The threeDFT functionals, LDA, PBE0, and X3LYP, give very similarbending energy curves �shown in the supplementalFig. S1�.38 Similar to the UFF,19 these bending curves can beapproximately fitted by a harmonic cosine functional in alarger range of bending angle from 90° to 180°:
Ebend =k�
2 sin2 �0�cos � − cos �0�2, �3�
where k� is the force constant k�= ��2Ebend/��2��0, and �0 is
the bending angle at equilibrium. Values of the fitted forceconstants and equilibrium angles from the LDA, PBE0, andX3LYP functionals are listed in Table II. Equation �3� isequivalent to the following three-term Fourier expansion:
Ebend = k��C0 + C1 cos � + C2 cos 2��
with the three expansion coefficients defined as
C2 = 1/�4 sin2 �0�, C1 = − 4C2 cos �0,
C0 = C2�2 cos2 �0 + 1� .
3. Bond torsion
Keeping Au–S bond length and Au–S–C bond angle atequilibrium values and rotating the benzene ring along theS–S axis, we obtain the variation of torsional energies versusthe rotational angle � �see supplementary Fig. S2�.38 Follow-ing the general rules in UFF �Ref. 19� and keeping in mindthat the rotation of benzene ring has two-fold symmetry, wecan write the torsional potential as
TABLE I. BDT–1 Au bond-stretching potentials. The units of parameters are kcal/mol, Å−1, Å, andkcal/mol Å2, respectively.
Parameter LDA PBE0 X3LYP Average Variation �%� Iso-Morse
E0 20.11 34.54 25.58 26.74 54.0 8.763� 2.157 2.242 2.505 2.301 15.1 1.47r0
a 2.309 2.253 2.257 2.273 2.47 2.652�2E0 187.1 347.2 321.0 37.87
aThe fitted values are slightly different from the DFT results.
TABLE II. BDT–1 Au bond angle-bending and torsion potential parameters.
Parameter Units LDA PBE0 X3LYP Average Variation �%�
k� kcal/ �mol rad2� 145.5 142.9 148.0 145.5 3.50�0 degree 105.1 105.3 105.9 105.4 0.38E� kcal/mol 2.09 3.28 3.38 2.92 44.2�0 degree 90 90 90 90 0.0
244721-4 Leng et al. J. Chem. Phys. 122, 244721 �2005�
Downloaded 21 Jul 2005 to 129.59.75.207. Redistribution subject to AIP license or copyright, see http://jcp.aip.org/jcp/copyright.jsp

Etors = 1/2E��1 − cos 2�0 cos 2�� , �4�
where E� is the rotational barrier and �0 the equilibriumrotation angle �see Table II�. Specifically, the preference ofout-of-plane bending of benzene ring leads to �0=90°. ThePBE0 and X3LYP give mutually consistent rotational barri-ers compared with the LDA result. However, these barriersare much less than the bond-stretching and bond angle-bending energies. In Table II, the uncertainties of parametersfrom the three functionals are quite small, except for therotational barrier. But we anticipate that the large uncertaintyof this rotational barrier to the SAMs structure is small sincethe torsion potential is not the dominant part in chemicalbonding.
4. Partial charges
The distribution of atomic partial charges within theBDT–Au complex has a profound effect on molecular con-formation and packing structure through the long-range Cou-lombic interactions. A detailed analysis of the variation ofthis charge distribution with the BDT–Au bonding geometryis therefore necessary. Along with the calculations of singlepoint DFT energies for each of BDT–Au bonding geom-etries, we also computed atomic charges from Mullikenpopulation analysis.34 Our emphasis is on the charge varia-tion when varying the BDT–Au bonding geometry, thoughwe know that the absolute value of an atomic charge in amolecule is not uniquely defined physically.9,39
Since the X3LYP functional yields quite similar chargedistributions as those given by PBE0 functional, either forBDT–1 Au or BDT–2 Au complexes, hereafter, we will con-centrate on the results given by LDA and PBE0. Further, allthe figures related to the discussion of atomic charge varia-tions are put into a supplemental document38 to avoid toomany illustrations in this paper.
Figure S3 �Ref. 38� shows the variations of atomic par-tial charges versus the Au–S bond lengths from the LDA andPBE0 functionals. These charges are for the atoms involvedin chemical bonding between the BDT molecule and the Auatom. We found that the Mulliken charges on other atoms inBDT molecule remain almost constant, and only those atomsinvolved in chemical bonding, in particular, atoms Au14, S8,and C4, experience substantial charge transfer. Table III pre-sents all other charges that remain constant. This phenom-enon suggests that the electronic structure change due tometal/molecule chemical bonding is very localized, leavingthe structure of the BDT molecule largely unchanged. InFig. S3, atomic charges from PBE0 and LDA show some-what different charge variations, but the same amount ofcharge transfer �0.3e� from S8 to Au14 during the dissocia-
tion process from rAu–S=2 Å to rAu–S�3.2 Å. Moreover,atom C4 has obtained more negative charge ��0.2e� trend-ing toward the C1 partial charge due to molecular symmetry.In contrast, the partial charges on C3 �C5� which are onlyinvolved in bond torsion have changed slightly ��0.04e�.
Keeping the Au–S bond length at equilibrium value �r0�and changing the bond angle �Au14–S8–C4 from 180° to90°, we also found significant charge transfers between at-oms involved in BDT–Au chemical bonding, as shown inFig. S4.38 The Mulliken charges on bonded atoms changedramatically in the range of 150°–180°. The LDA functionalpredicts that some 0.14e is transferred from the molecule tothe gold atom, while the PBE0 shows that more charges aretransferred �0.32e�. The Mulliken charge on C4 atom, on theother hand, becomes more negative, and C3 �C5� charge onlychanges slightly.
The variations of Mulliken charges with the Au–S–C–Cdihedral angle are comparably small. All the three function-als predict very similar result �Fig. S5�.38 This is consistentwith the notion that the rotation of benzene ring does notchange dramatically the electronic structure of the metal/molecule complex.
In molecular-dynamics �MD� simulations, fixed atomiccharges should be assigned to particles a priori before thelong-range Coulombic interactions can be calculated. Ourdetailed MD simulations �see below� show that for BDTmolecules adsorbed on Au �111� surfaces at room tempera-ture, the molecules only explore very limited regions of con-formation space. These regions are marked in shaded areas inFigs. S3 and S4. This limited sampling of configurationspace significantly reduces the uncertainty in the atomic par-tial charge determinations.
B. BDT–2 Au complex
For the chemical bonding between the S atom in BDTand the two Au atoms, in addition to bond-stretching, angle-bending, and bond-torsion terms, the total force-field energyneeds to add one more component, the constraint barrier forBDT molecule sliding along the Au–Au direction, Econstr, asdescribed in Eq. �1�. Below we describe these individualterms from the DFT energy calculations.
1. Bond stretching
Similar to the BDT–1 Au complex, the shifted bond�X–S bond, see Fig. 1� stretching curve for BDT–2 Au in-teraction from the three DFT functionals can be well fitted bythe Morse potential given by Eq. �2�. All the parameters inthe fitted Morse potentials are listed in Table IV. The forceconstants of the fitted Morse potentials are four to five times
TABLE III. The constant Mulliken charges in BDT molecule �unit=e�. The partial charges on the symmetricatoms in BDT are omitted.
DFT functional C1 C2 S7 H9 H10 H13
LDA −0.51 −0.07 0.08 0.21 0.22 0.16PBE0 −0.48 −0.06 0.06 0.19 0.19 0.15
X3LYP −0.47 −0.06 0.07 0.19 0.18 0.14
244721-5 Interaction between benzenedithiolate and gold J. Chem. Phys. 122, 244721 �2005�
Downloaded 21 Jul 2005 to 129.59.75.207. Redistribution subject to AIP license or copyright, see http://jcp.aip.org/jcp/copyright.jsp

of that of the Iso-Morse potential. Since there are two Au–Sbonds involved in chemical bonding, the Au–S bond lengths�shown in parentheses in Table IV� are already close to dAu–S
of thiolate bonded to bridge or bridgelike sites on bulk goldsurfaces �2.55,10 2.49–2.52 �depending on the coverage�,11,13
and 2.5 Å �Refs. 14 and 40��. These numbers are also con-sistent with other results for small thiolate–gold clusters�2.42–2.58 Å�.9 Assuming that the bonding energy of indi-vidual BDT–Au bond is equal to the half of the total DFTenergy and refitting the bonding curves, we still get a verystrong Morse potential �the corresponding parameters areshown in parentheses in Table IV�. Interestingly, the welldepths of the newly fitted individual BDT–Au Morse poten-tial decrease drastically, but are still larger than that of theIso-Morse. The force constants decrease slightly due to theincrease of parameter �. As for the BDT–1 Au complex, wealso calculate the average values and total variations of thefitted force-field parameters, as shown in Table IV. Obvi-ously, the larger uncertainties come from the bond-stretchingparameters E0 and �.
2. Bond angle bending and torsion
As in the BDT–1 Au case, the bond angle-bending andtorsional potentials can be well fitted by Eqs. �3� and �4�,which have sound mathematical forms due to the Fouriercosine expansion in � or �. However, the magnitudes ofbending force constants and rotational barriers decrease sub-stantially due to the two Au–S bonds involved in chemicalbonding. These numbers are listed in Table V. Specifically,the rotational barriers from the three DFT functionals arecomparable to kT ��0.6 kcal/mol�. This suggests that tor-sional constraint forces are less dominant than the bond-stretching and angle-bending forces, as observed by otherDFT research on thiolate–Au �111� systems.41
3. Constraint potential along Au–Au direction
Keeping the distance between the S atom in BDT andthe line Au–Au at the equilibrium bond length r0, thereshould be a constraint barrier to centralize BDT over themidpoint X between the two Au atoms. This potential can bedescribed by a small cosine Fourier expansion in the distanceR away from one Au atom
Econstr = 0.5EC�1 + cos�R/R0��� , �5�
where EC is the constraint barrier and R0 the half distancebetween the two Au atoms, i.e., R0=1.44 Å.
All the three DFT methods predict almost the same con-straint barriers �EC�, which are significantly larger than therotational barriers �see supplementary Fig. S6�.38 Values ofthese barriers from the LDA, PBE0, and X3LYP functionalsare also included in Table V.
Table V also shows that the uncertainties of parametersin bond angle-bending, torsion, and constraint potentialsfrom the three functionals are quite small for BDT–2 Aucomplex.
4. Partial charges
Following the same procedure as in the BDT–1 Au case,we investigate the atomic charge variations in BDT–2 Aucomplex. Similar to the case in BDT–1 Au complex, theMulliken charges of nonbonded atoms in BDT molecule re-main almost constant and take the values of those in BDT–1Au complex �see Table III�. In particular, the LDA predictsthat about 0.14e has been transferred from the molecule tothe gold atoms, and S8 becomes more positive charged dur-ing dissociation. The PBE0 predicts that about 0.1e has beentransferred from each of the Au atoms to the molecule, re-sulting in S8 and C4 having more negative charges �seesupplemental Fig. S7�. However, as we mentioned beforeand will see later, X–S bond length only explores very lim-
TABLE IV. BDT–2 Au bond-stretching potentials. The units of parameters are kcal/mol, Å−1, Å, kcal/mol Å2.The parameters in parentheses are for the single bond Au–S Morse potentials.
Parameter LDA PBE0 X3LYP Average Variation �%� Iso-Morse
E0 20.99�9.298�
74.18�29.35�
75.25�27.44�
56.8 95.5 8.763
� 1.949�2.664�
1.136�1.611�
1.105�1.626�
1.397 60.4 1.47
r0a 1.905
�2.387�1.982
�2.449�2.000
�2.462�1.962 4.84 2.65
2�2E0 159.5�132.0�
191.5�152.3�
183.8�145.1�
37.87
aThe fitted values are slightly different from the DFT results.
TABLE V. BDT–2 Au bond angle-bending, torsion, and constraint potential parameters.
Parameters units LDA PBE0 X3LYP Average Variation �%�
k� kcal/ �mol rad2� 70.23 70.58 73.74 71.52 4.9�0 degree 109.3 111.3 111.8 110.8 2.26E� kcal/mol 1.20 1.271 1.215 1.229 5.78�0 degree 90 90 90 90 0.0EC kcal/mol 30.8 31.0 31.6 31.1 2.57
244721-6 Leng et al. J. Chem. Phys. 122, 244721 �2005�
Downloaded 21 Jul 2005 to 129.59.75.207. Redistribution subject to AIP license or copyright, see http://jcp.aip.org/jcp/copyright.jsp

ited region where variations of Mulliken charges are quitesmall. In fact, for BDT–2 Au complex, the magnitudes ofpartial charges on bonded atoms, S8 and Au14 �Au15�, arecomparably small compared with those in the BDT–1 Aucomplex. This is probably due to the weaker chemical bond-ing in the BDT–2 Au complex.
Bending the BDT molecule relative to the Au atomsfrom the “straight-up” configuration also yields charge trans-fers from the BDT molecule to the gold atoms. All the threeDFT functionals predict the same phenomenon: when thebending angle changes from 180° to 150° �30° tilt�, about0.1e charge has been transferred locally from the sulphuratom to the two-gold cluster. This can be seen from the LDAand PBE0 results shown in Fig. S8,38 which are consistentwith other investigations for benzenethiolate bonded on thebridge sites of small gold clusters.39
Our results show that the variations of Mulliken chargesdue to the rotation of benzene ring are quite small, as theyare in the BDT–1 Au case. All the three DFT functionals givevery similar charge variations �see the LDA result inFig. S9�.38 The partial charges on gold atoms �Au14 andAu15� switch back and forth symmetrically around a verylow mean value of −0.04e in the range of �=0–180°, and nosignificant charge variations are observed for C4, C3 �C5�,and S8 in this range. We note that these Mulliken charges arecalculated based on the molecular configuration where theX–S bond length and X–S–C bond angle take the equilib-rium values. We believe that adding all the components ofmolecular interactions does not change dramatically the mo-lecular configurations, as we have previously observed.23
Variation of the Mulliken charge within the BDT–2 Aucomplex is also a concern when the BDT molecule shiftsaway from the center X of Au–Au cluster due to the thermalmotion along the Au–Au direction. We demonstrate inFig. S10 �Ref. 38� that the BDT molecular shift does notchange significantly the charge distribution within the mol-ecule, except for a very small dipole induced between thetwo gold atoms. Since this induced dipole is parallel to theAu–Au direction and the thermal shifts of the BDT moleculeare symmetric about the midpoint X on average, the effect ofthe induced dipole on the molecular conformation should besmall.
IV. MOLECULAR-DYNAMICS SIMULATIONS
We consider the BDT monolayer adsorbed on Au �111�surface. Molecular system is the same as that in the previous
work.23 The simulation box is rhombic in two-dimension�2D� whereas the unit cell takes the ��13� �13� R13.9°structure with one BDT molecule on the top site and theother three BDT molecules on the bridge sites. This full-coverage adsorption structure had been observed in earlyscanning tunneling microscope �STM� experiment for ben-zenethiolate �BT� monolayer on Au �111� surface.42 Theintra- and intermolecular interactions within and betweenBDT molecules and between BDT molecules and nonbondedgold atoms are described by UFF,19 and these force-field pa-rameters are given in Tables I and II in Ref. 23. For thebonded interactions between the BDT and Au atoms, theforce-field parameters, together with constant atomic chargesdirectly come from Tables I–V. Atomic charges for thebonded atoms are determined based on the most possibleBDT–1, 2 Au configurations. Initially, we assume that thesepartial charges correspond to “equilibrium” configuration�r0 ,�0 ,�0� and perform MD runs at 298 K. We find thatBDT molecules in SAMs actually explore a limited configu-ration space as shown in the shaded areas in Figs. S3, S4, S7,S8, and S10 �Ref. 38�. We then reselect these atomic chargesas the averages in these shaded areas and conduct MD runsagain to obtain the final SAMs packing structure �this isequivalent to an iteration procedure�. Table VI lists all thebonded atomic charges from the LDA, PBE0, and X3LYPfunctionals.
The double RESPA algorithm23 based on the originalwork of Tuckerman et al.43 is employed in MD simulations.To correctly calculate the long-range electrostatic interac-tions, we use the three-dimensional �3D� Ewald summationwith a correction term44 �EW3DC� for the 2D rhombic slabgeometry. The initial molecular configuration of BDT mono-layer was assumed to be normal to the Au �111� surface. Thisconfiguration corresponds to �=180° of Au–S–C bond angle�large molecular deformation�, and the bending force canonly be calculated correctly through Eq. �3�, rather than the
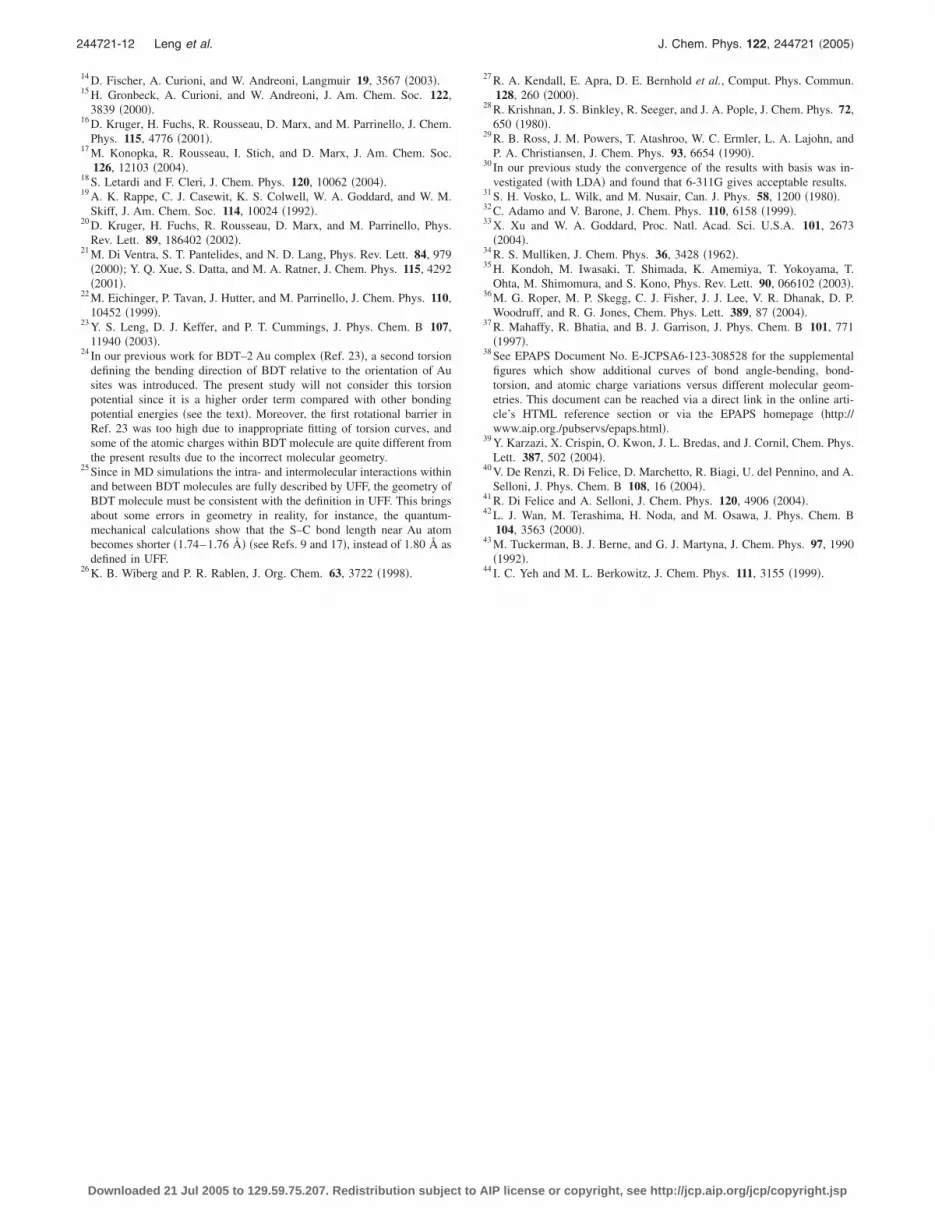
FIG. 3. Normalized probability distri-butions of Au–S bond stretching for�a� BDT–1 Au and �b� BDT–2 Aucomplexes from MD simulations andfrom the Boltzmann results obtainedfrom individual bond-stretchingpotentials.
TABLE VI. Mulliken partial charges for bonded atoms. BDT–1 Au/BDT–2Au, unit=electron.
Atoms LDA PBE0 X3LYP
C3 �C5� −0.08/−0.11 −0.08/−0.10 −0.08/−0.10C4 −0.43/−0.35 −0.40/−0.32 −0.39/−0.32S8 0.10/0.20 0.04/0.10 0.05/0.11Au 0.04/ �−0.04��2 0.15/0.02�2 0.12/0.01�2
244721-7 Interaction between benzenedithiolate and gold J. Chem. Phys. 122, 244721 �2005�
Downloaded 21 Jul 2005 to 129.59.75.207. Redistribution subject to AIP license or copyright, see http://jcp.aip.org/jcp/copyright.jsp

harmonic � potential used in our previous work.23 To avoidany metastable states, we first increase the temperature to800–1200 K and run MD for a substantially long time �usu-ally a few hundreds of picoseconds�, then gradually decreasethe temperature to 298 K. At high temperatures, to avoiddesorption of BDT molecules from Au �111� surface, we in-crease the well depth of Morse potential by 50%–100%. Thisdoes not influence the packing structure of BDT SAM at298 K. The time step in MD runs is 2 fs, and the three-layergold substrate is kept rigid, though we realize that significantrelaxation of Au substrate may be possible.12
A. BDT–1, 2 Au local bonding geometry
In order to understand how the BDT–1, 2 Au bondedinteraction potentials dominate the local bonding geometryin SAMs, we plot the probability distributions for all of thebonding geometric parameters from MD simulations, and thecorresponding normalized Boltzmann factor distributionswhich are solely determined by the specific potentials.
Figures 3 and 4 show the BDT–1, 2 Au bond-stretchingand angle-bending distributions from the LDA, PBE0, andX3LYP functionals. We see that at 298 K BDT molecules inSAM structure only explore very limited molecular configu-ration space. The possible regions of bond stretching andangle bending are also marked by the shaded areas in supple-mental Figs. S3, S4, S7, and S8 �Ref. 38� for atomic chargevariations. Obviously, there are somewhat shifts of the MDcurves relative to the Boltzmann distributions due to the ef-fect of intermolecular interactions. These shifts are more evi-dent for the angle-bending curves compared with the bond-stretching curves, implying that bond-stretching potential is
the most dominant part in chemical bonding. This conclusionwas also obtained in the previous studies23 concentrating ondifferent DFT basis sets. At the highest end, Fig. 5 showsthat the bond-torsion distributions from MD simulations aredramatically different from the Boltzmann distributions, sug-gesting that torsional forces are not the main constraintforces in determining the SAMs structure. The universal twopeaks around 50° and 150°, instead of a single peak around90°, are directly related to the global packing structure ofBDT monolayer on Au �111� surface �see below�. In the pre-vious work,23 the torsional barrier at bridge site was incor-rectly too high, resulting in a single peak around 90°.
In Fig. 5�b�, the bond-torsion distributions for BDT–2Au show more divergence compared with those for BDT–1Au in Fig. 5�a�. This is due to the very small rotational bar-rier in BDT–2 Au complex which has two Au–S bonds in-volved in chemical bonding. Likewise, in comparison withBDT–1 Au in Fig. 4�a�, the angle-bending distributions fromMD simulations for BDT–2 Au �Fig. 4�b�� also show moredivergence and more shifts relative to the Boltzmann distri-butions. As we have seen in Tables I, II, and IV, larger un-certainties of the force-field parameters for different DFTfunctionals come from E0, �, and E�. These uncertainties arereflected in Figs. 3 and 5�a� that present fairly different dis-tribution curves.
Figure 6 shows the PBE0 results of probability distribu-tions of BDT molecular shift along the Au–Au direction inBDT–2 Au complex. The LDA and X3LYP functionals givethe quite similar results and are not shown in the figure. Thecentral point r=0 corresponds to 1.44 Å distance away fromone Au atom. We see that MD curve is a little wider than the
FIG. 4. Normalized probability distri-butions of Au–S–C bond angle bend-ing for �a� BDT–1 Au and �b� BDT–2Au complexes from MD simulationsand from the Boltzmann results ob-tained from individual bond angle-bending potentials.
FIG. 5. Normalized probability distri-butions of Au–S–C–C bond torsion for�a� BDT–1 Au and �b� BDT–2 Aucomplexes from MD simulations andfrom the Boltzmann results obtainedfrom individual bond-torsionpotentials.
244721-8 Leng et al. J. Chem. Phys. 122, 244721 �2005�
Downloaded 21 Jul 2005 to 129.59.75.207. Redistribution subject to AIP license or copyright, see http://jcp.aip.org/jcp/copyright.jsp

Boltzmann distribution but with no relative deviation. Thisindicates that intermolecular interactions do not bias thebridge S atom away from the bridge or bridgelike bondingsite. The region explored by BDT molecules in Fig. 6 is alsomarked by a shaded area in Fig. S10 �Ref. 38�.
B. Global packing structure and S adsorption site
The above results and discussions on the BDT–1, 2 Aulocal bonding geometry show that the intermolecular inter-action also plays an important role in determining the BDTSAM structure. This is particularly true when looking at theprobability distributions in Figs. 4 and 5. Following the samedefinitions as in the previous work,23 we consider threeangles describing the global packing structure of BDT mono-layer on Au �111� surface: the tilt angle �, the azimuthalangle �, and twist angle � �see Fig. 7�.
Figures 8–10 show the probability distributions of thethree angles. The distributions of tilt angle �Fig. 8� from thethree DFT functionals have the same peak at �=32°. Thisglobal tilt angle is a little larger than the previous result�26°�.23 The twist angle distributions shown in Fig. 10 havetwo peaks around �=40° –50° and �=135° –140°, depend-ing on the DFT functional used. Very interestingly, Fig. 9
shows that the three DFT functionals yield very similar azi-muthal angle distributions but with a relative shift of 60° inturn. These distributions have two distinct peaks separatedby �40°. Evidently, Figs. 9 and 10 indicate that the globalpacking structure of BDT SAM adopts a herringbone struc-ture, as shown in Fig. 11. These three herringbone structuresare actually the same structure, but being viewed along dif-ferent directions: 120°, 60°, and 0° for the LDA, PBE0, andX3LYP, respectively.
To give a clear picture of the adsorption sites of S atomson Au �111� surface, Fig. 12 shows the PBE0 result of theadsorbed S adatoms and the first two gold layers. The ad-sorption structures predicted by the LDA and X3LYP func-tionals are quite similar and will not be shown here. In gen-eral, about one half of the bridge S atoms �B� are located atthe bridge sites slightly shifted to the fcc-hollow sites �fccbridge�, and another half of the bridge S atoms are located atthe bridge sites slightly shifted to the hcp-hollow sites �hcpbridge�. This equal partition between the fcc-bridge and hcp-bridge adsorption sites seems reasonable since the differenceof adsorption energies between the two is comparable tokT.12 The atop S atoms �T� are not right above the top sites,instead, there is always a slight shift due to the Au–S–Cangle bending. Figure 13 shows the Au–S distance distribu-tions between the S adatoms and the first-layer gold atoms.The results from the PBE0 and X3LYP functionals show thefirst small peak at 2.28 Å and the second larger peak at
FIG. 6. The PBE0 results of normalized probability distributions of BDTmolecule shift along Au–Au direction in BDT–2 Au complex. The solid linecorresponds to the MD simulation result. The dashed line is for the Boltz-mann distribution obtained from individual constraint potential alongAu–Au direction.
FIG. 7. Global orientation of BDT molecule described by three geometricangles.
FIG. 8. The normalized probability distributions of global tilt angle � fromthe LDA, PBE0, and X3LYP functionals.
FIG. 9. The normalized probability distributions of global azimuthal angle �from the LDA, PBE0, and X3LYP functionals.
244721-9 Interaction between benzenedithiolate and gold J. Chem. Phys. 122, 244721 �2005�
Downloaded 21 Jul 2005 to 129.59.75.207. Redistribution subject to AIP license or copyright, see http://jcp.aip.org/jcp/copyright.jsp

2.5 Å, which correspond to the atop Au–S and bridge Au–Sbond lengths, separately. The third peak at 2.78 Å corre-sponds to the nonbonded Au–S distance between the bridgeS atom and the third-nearest Au atom around the hollow site.Compared with the PBE0 and X3LYP results, the LDA doesnot show the first small peak. This may be because the bond-stretching force constant from LDA is too low comparedwith those of PBE0 and X3LYP �see Table I�. The secondand third peaks correspond to the Au–S distances of 2.42 and2.76 Å, respectively, which are slightly shorter than thePBE0 and X3LYP results. Looking back at the data in TableIV, we see that when two Au–S bonds are involved in chemi-cal bonding, the Au–S bond length is already increased sub-stantially. When all the components of intermolecular inter-actions are considered, the Au–S bond length on the bridgeor bridgelike site approaches the universal value of 2.5 Å�but this seems unfortunate for the atop case, which needsfurther investigation�. We believe that this is largely due tothe LJ repulsions from the nonbonded Au atoms nearby. Theclear cut at �2.7 Å to distinguish between the bonded andnonbonded Au–S distances seems reasonable since mechani-cally pulling a thiolate molecule away from a stepped goldsurface20 found that the bond rupture usually happened atthis distance.
V. SUMMARY AND CONCLUSIONS
The present study develops a classical force field for thechemical bonding between gold atoms and BDT moleculesthat can be used for large-scale molecular simulations for theself-assembly on either extended gold surfaces or gold clus-ters. The bond-stretching and angle-bending potentials arerepresented by the Morse potential and harmonic cosineterms, respectively, allowing the BDT molecule to explorelarger range of deformations. In the current study, the effectof the functional forms of bond stretching �Morse or har-monic� on SAM structure �both interfacial and global pack-ing� should be small since the BDT molecules are alreadyassumed to be anchored on the top or bridge sites based onexperimental observations. However, we anticipate that inself-assembly simulations the Morse potential is more suit-able to search for chemical bonds than harmonic potential.Moreover, the Morse potential for bond stretching is suitableto describe the bond dissociation process. The harmonic co-
sine term for the bond angle-bending potential can yield cor-rectly the bending forces even at �=180°, which is crucial indetermining correct packing structures in MD runs.
We employ DFT as an efficient, practical approach to thequantum many-body problem, but its main drawback issomewhat ad hoc choice of exchange-correlation functionalswhen used to describe new systems, especially organometal-lic complexes. To quantitatively describe and stress the im-portance of this issue we utilize three well-known approxi-mations to the XC functional, LDA, PBE0, and X3LYP, toinvestigate the sensitivity of the force-field parameters to thechoice of the XC approximation. In general, they yield simi-lar bonding curves, whereas PBE0 and X3LYP give moremutually consistent results compared with LDA. The largestvariations in the derived force-field parameters come fromthe well depth of Morse potential for bond stretching, E0, forwhich LDA has predicted a significantly different �as large as95.5% for BDT–2 Au� result for the bond dissociation curve.
FIG. 10. The normalized probability distributions of global twist angle �from the LDA, PBE0, and X3LYP functionals.
FIG. 11. BDT SAM herringbone packing structures from the three DFTfunctionals: �a� LDA �120° view�, �b� PBE0 �60° view�, and �c� X3LYP �0°view�.
244721-10 Leng et al. J. Chem. Phys. 122, 244721 �2005�
Downloaded 21 Jul 2005 to 129.59.75.207. Redistribution subject to AIP license or copyright, see http://jcp.aip.org/jcp/copyright.jsp

The main contributions to the force field for chemical bond-ing are the bond-stretching and angle-bending terms. How-ever, for the BDT–2 Au complex, the constraint barrier alongthe Au–Au direction is also significant.
A complete investigation of the atomic charge distribu-tion, a key component in determining SAMs structure, ver-sus the molecular geometry is given. The Mulliken partialcharge distribution within the molecule/metal complex isfound to be quite stable for the molecular conformationspace that BDT molecule samples in SAMs structure. Thepartial charge variation due to the change of molecular ge-ometry is consistent with other investigations.39 For the cur-rent study, we do not consider the polarization effects due tointermolecular charge interactions, which is an interestingissue in the future work.
Our MD simulations on the adsorption of BDT SAM onAu �111� surface using the developed force field for BDT/Auchemical bonding, combined with the UFF19 for nonbondedintermolecular interactions, show that the local bonding ge-ometry at BDT/Au interface does depend to some extent onthe DFT XC functional used, and the bond-stretching poten-
tial is the most dominant part in chemical bonding, whereasthe torsional potential is the weakest part. The global packingstructures of BDT SAMs from the three XC functionals arebasically the same herringbone structures. In other words,the SAM packing structure largely depends on the intermo-lecular interactions, instead of the XC functional. However,as we mentioned before, XC functional does influence theinterfacial bonding properties, which plays equally an impor-tant role in determining the organometallic structure.
As shown in the bond-stretching curves in Fig. 2 andMorse parameters in Tables I and IV, the bonded interactionbetween S and Au is much stronger than the isotropic Morsepotential. The convergence of the DFT energy usually be-comes more difficult at larger bond lengths around �3 Å,where we keep in mind that the BDT-Au interaction in thiscase should be switched to nonbonded interaction, and ourchoice of localized Gaussian basis set becomes inadequatefor the disassociation process. Moreover, the current studydoes not consider the relaxation of gold substrate upon theadsorption of BDT molecules. Some DFT investigationsshow that this relaxation is significant even at groundstate.12,15 This fundamental issue is very interesting and willbe investigated in our future work. The methodology offorce-field development in the present study is general andapplicable to other organometallic complexes, which is ben-eficial to the large-scale molecular simulations for a varietyof organometallic nanostructures and molecular electronicdevices.
ACKNOWLEDGMENTS
Our research was sponsored by the Office of Science ofthe US Department of Energy Computational NanoscienceProject �YSL, PTC�, the Office of Fusion Energy Sciences�PK�, Division of Materials Sciences and Engineering�JCW�, and used resources of the Center for ComputationalSciences at Oak Ridge National Laboratory, all under Con-tract No. DE-AC05-00OR22725 with UT-Battelle, LLC.
1 A. Nitzan and M. A. Ratner, Science 300, 1384 �2003�.2 M. A. Reed, C. Zhou, C. J. Muller, T. P. Burgin, and J. M. Tour, Science
278, 252 �1997�; X. Y. Xiao, B. Q. Xu, and N. J. Tao, Nano Lett. 4, 267�2004�.
3 X. D. Cui, A. Primak, X. Zarate et al., Science 294, 571 �2001�; B. Q.Xu and N. J. J. Tao, ibid. 301, 1221 �2003�.
4 C. Joachim, J. K. Gimzewski, and A. Aviram, Nature �London� 408, 541�2000�; J. Chen, M. A. Reed, A. M. Rawlett, and J. M. Tour, Science286, 1550 �1999�; P. E. Kornilovitch and A. M. Bratkovsky, Phys. Rev.B 64, 195413 �2001�; E. G. Emberly and G. Kirczenow, Phys. Rev. Lett.87, 269701 �2001�.
5 E. G. Emberly and G. Kirczenow, Phys. Rev. Lett. 91, 188301 �2003�.6 M. Di Ventra, S. G. Kim, S. T. Pantelides, and N. D. Lang, Phys. Rev.Lett. 86, 288 �2001�.
7 J. Tomfohr and O. F. Sankey, J. Chem. Phys. 120, 1542 �2004�.8 S. N. Yaliraki, M. Kemp, and M. A. Ratner, J. Am. Chem. Soc. 121,3428 �1999�; K. W. Hipps, Science 294, 536 �2001�; J. Nara, W. T. Geng,H. Kino, N. Kobayashi, and T. Ohno, J. Chem. Phys. 121, 6485 �2004�.
9 H. Basch and M. A. Ratner, J. Chem. Phys. 119, 11926 �2003�.10 J. Gottschalck and B. Hammer, J. Chem. Phys. 116, 784 �2002�.11 Y. Yourdshahyan and A. M. Rappe, J. Chem. Phys. 117, 825 �2002�.12 J. Nara, S. Higai, Y. Morikawa, and T. Ohno, J. Chem. Phys. 120, 6705
�2004�.13 M. C. Vargas, P. Giannozzi, A. Selloni, and G. Scoles, J. Phys. Chem. B
105, 9509 �2001�.
FIG. 12. The PBE0 result of the adsorption structure of S adatoms on Au�111� surface. The black dots are S adatoms, the large and small emptycircles represent the first and second gold layers.
FIG. 13. The normalized probability distributions of the Au–S distance be-tween the S adatoms and the first-layer gold atoms from the LDA, PBE0,and X3LYP functionals.
244721-11 Interaction between benzenedithiolate and gold J. Chem. Phys. 122, 244721 �2005�
Downloaded 21 Jul 2005 to 129.59.75.207. Redistribution subject to AIP license or copyright, see http://jcp.aip.org/jcp/copyright.jsp
14 D. Fischer, A. Curioni, and W. Andreoni, Langmuir 19, 3567 �2003�.15 H. Gronbeck, A. Curioni, and W. Andreoni, J. Am. Chem. Soc. 122,
3839 �2000�.16 D. Kruger, H. Fuchs, R. Rousseau, D. Marx, and M. Parrinello, J. Chem.
Phys. 115, 4776 �2001�.17 M. Konopka, R. Rousseau, I. Stich, and D. Marx, J. Am. Chem. Soc.
126, 12103 �2004�.18 S. Letardi and F. Cleri, J. Chem. Phys. 120, 10062 �2004�.19 A. K. Rappe, C. J. Casewit, K. S. Colwell, W. A. Goddard, and W. M.
Skiff, J. Am. Chem. Soc. 114, 10024 �1992�.20 D. Kruger, H. Fuchs, R. Rousseau, D. Marx, and M. Parrinello, Phys.
Rev. Lett. 89, 186402 �2002�.21 M. Di Ventra, S. T. Pantelides, and N. D. Lang, Phys. Rev. Lett. 84, 979
�2000�; Y. Q. Xue, S. Datta, and M. A. Ratner, J. Chem. Phys. 115, 4292�2001�.
22 M. Eichinger, P. Tavan, J. Hutter, and M. Parrinello, J. Chem. Phys. 110,10452 �1999�.
23 Y. S. Leng, D. J. Keffer, and P. T. Cummings, J. Phys. Chem. B 107,11940 �2003�.
24 In our previous work for BDT–2 Au complex �Ref. 23�, a second torsiondefining the bending direction of BDT relative to the orientation of Ausites was introduced. The present study will not consider this torsionpotential since it is a higher order term compared with other bondingpotential energies �see the text�. Moreover, the first rotational barrier inRef. 23 was too high due to inappropriate fitting of torsion curves, andsome of the atomic charges within BDT molecule are quite different fromthe present results due to the incorrect molecular geometry.
25 Since in MD simulations the intra- and intermolecular interactions withinand between BDT molecules are fully described by UFF, the geometry ofBDT molecule must be consistent with the definition in UFF. This bringsabout some errors in geometry in reality, for instance, the quantum-mechanical calculations show that the S–C bond length near Au atombecomes shorter �1.74–1.76 Å� �see Refs. 9 and 17�, instead of 1.80 Å asdefined in UFF.
26 K. B. Wiberg and P. R. Rablen, J. Org. Chem. 63, 3722 �1998�.
27 R. A. Kendall, E. Apra, D. E. Bernhold et al., Comput. Phys. Commun.128, 260 �2000�.
28 R. Krishnan, J. S. Binkley, R. Seeger, and J. A. Pople, J. Chem. Phys. 72,650 �1980�.
29 R. B. Ross, J. M. Powers, T. Atashroo, W. C. Ermler, L. A. Lajohn, andP. A. Christiansen, J. Chem. Phys. 93, 6654 �1990�.
30 In our previous study the convergence of the results with basis was in-vestigated �with LDA� and found that 6-311G gives acceptable results.
31 S. H. Vosko, L. Wilk, and M. Nusair, Can. J. Phys. 58, 1200 �1980�.32 C. Adamo and V. Barone, J. Chem. Phys. 110, 6158 �1999�.33 X. Xu and W. A. Goddard, Proc. Natl. Acad. Sci. U.S.A. 101, 2673
�2004�.34 R. S. Mulliken, J. Chem. Phys. 36, 3428 �1962�.35 H. Kondoh, M. Iwasaki, T. Shimada, K. Amemiya, T. Yokoyama, T.
Ohta, M. Shimomura, and S. Kono, Phys. Rev. Lett. 90, 066102 �2003�.36 M. G. Roper, M. P. Skegg, C. J. Fisher, J. J. Lee, V. R. Dhanak, D. P.
Woodruff, and R. G. Jones, Chem. Phys. Lett. 389, 87 �2004�.37 R. Mahaffy, R. Bhatia, and B. J. Garrison, J. Phys. Chem. B 101, 771
�1997�.38 See EPAPS Document No. E-JCPSA6-123-308528 for the supplemental
figures which show additional curves of bond angle-bending, bond-torsion, and atomic charge variations versus different molecular geom-etries. This document can be reached via a direct link in the online arti-cle’s HTML reference section or via the EPAPS homepage �http://www.aip.org./pubservs/epaps.html�.
39 Y. Karzazi, X. Crispin, O. Kwon, J. L. Bredas, and J. Cornil, Chem. Phys.Lett. 387, 502 �2004�.
40 V. De Renzi, R. Di Felice, D. Marchetto, R. Biagi, U. del Pennino, and A.Selloni, J. Phys. Chem. B 108, 16 �2004�.
41 R. Di Felice and A. Selloni, J. Chem. Phys. 120, 4906 �2004�.42 L. J. Wan, M. Terashima, H. Noda, and M. Osawa, J. Phys. Chem. B
104, 3563 �2000�.43 M. Tuckerman, B. J. Berne, and G. J. Martyna, J. Chem. Phys. 97, 1990
�1992�.44 I. C. Yeh and M. L. Berkowitz, J. Chem. Phys. 111, 3155 �1999�.
244721-12 Leng et al. J. Chem. Phys. 122, 244721 �2005�
Downloaded 21 Jul 2005 to 129.59.75.207. Redistribution subject to AIP license or copyright, see http://jcp.aip.org/jcp/copyright.jsp