micro feature enhanced sinter bonding of
TRANSCRIPT
Clemson UniversityTigerPrints
All Dissertations Dissertations
5-2011
MICRO FEATURE ENHANCED SINTERBONDING OF METAL INJECTIONMOLDED (MIM) PARTS TO A SOLIDSUBSTRATEThomas MartensClemson University, [email protected]
Follow this and additional works at: https://tigerprints.clemson.edu/all_dissertations
Part of the Operations Research, Systems Engineering and Industrial Engineering Commons
This Dissertation is brought to you for free and open access by the Dissertations at TigerPrints. It has been accepted for inclusion in All Dissertations byan authorized administrator of TigerPrints. For more information, please contact [email protected].
Recommended CitationMartens, Thomas, "MICRO FEATURE ENHANCED SINTER BONDING OF METAL INJECTION MOLDED (MIM) PARTSTO A SOLID SUBSTRATE" (2011). All Dissertations. 710.https://tigerprints.clemson.edu/all_dissertations/710
MICRO FEATURE ENHANCED SINTER BONDING OF METAL INJECTION MOLDED (MIM) PARTS TO A SOLID SUBSTRATE
A Dissertation Presented to
the Graduate School of Clemson University
In Partial Fulfillment of the Requirements for the Degree
Doctor of Philosophy Automotive Engineering
by Thomas Martens
May 2011
Accepted by: Dr. L. Mears, Committee Chair
Dr. M. Grujicic Dr. M. Omar Dr. R. Prucka
ii
ABSTRACT
In metal injection molding (MIM), fine metal powders are mixed with a binder and
injected into molds, similar to plastic injection molding. After molding, the binder is
removed from the part, and the compact is sintered to almost full density.
The obstacle to sinter bonding a MIM part to a conventional (solid) substrate lies in
the sinter shrinkage of the MIM part, which can be up to 20%, meaning that the MIM
part shrinks during sintering, while the conventional substrate maintains its dimensions.
This behavior would typically inhibit bonding and/or cause cracking and deformation of
the MIM part. It is also the reason, why sinter bonding MIM to solid substrates is not an
industrially applied process and little to no prior research exists.
By applying a structure of micro features to the surface of the MIM part, this allows
for shrinkage while bonding to the substrate. The micro features tolerate certain plastic
deformation to permit the shrinkage and thermal expansion/contraction without causing
cracks after the initial bonds are established. The bonding and deformation behavior of
the powder compacts is analyzed and modeled. A new approach to simulate the
deformation is developed. Finally, the samples are evaluated and compared with other
joining processes.

iii
DEDICATION
For my family, who offered me unconditional support throughout the course of
this dissertation.

iv
ACKNOWLEDGMENTS
It is a pleasure to thank the many people who made this thesis possible. I am
heartily thankful to my advisor, Dr. Mears, whose encouragement, supervision and
support from the preliminary to the concluding level enabled me to develop a deep
understanding of the subject.
I would also like to thank the following companies for their support:
• BASF for providing the feedstock
• DSH Technologies, LLC for sintering my samples
• Hoowaki, LLC for providing the mold inserts and compression molded
samples
• Ionic Technologies for the heat treatment of my shear test fixture
• Ceramic Technologies for providing alumina sintering supports
I owe my thanks to my wife Carolina and my sons Georg and Nicolas. Without
their encouragement and understanding it would have been impossible for me to finish
this work. My special gratitude is due to my parents, Georg and Anne Martens and
parents in law, Julio and Magally Villasmil for their support.

v
TABLE OF CONTENTS
Page
TITLE PAGE ................................................................................................................... i
ABSTRACT ....................................................................................................................ii
DEDICATION .............................................................................................................. iii
ACKNOWLEDGMENTS .............................................................................................. iv
LIST OF TABLES ......................................................................................................... ix
LIST OF FIGURES ......................................................................................................... x
1. INTRODUCTION .................................................................................................... 1
1.1. Metal Injection Molding ...................................................................... 1
1.2. Limitations .......................................................................................... 6
1.3. Motivation .......................................................................................... 9
1.4. Dissertation outline and organization................................................. 12
2. BACKGROUND .................................................................................................... 14
2.1. Literature Review .............................................................................. 14
2.1.1. Sintering ........................................................................................ 14
2.1.2. Sinter bonding in traditional powder metallurgy ............................. 20
2.1.3. Sinter bonding in metal injection molding ...................................... 24
2.1.4. Sintering models and simulations ................................................... 30
vi
2.1.5. The MSC model ............................................................................. 36
2.2. Previous work ................................................................................... 42
2.3. Problem statement ............................................................................. 53
2.4. Proposed solution .............................................................................. 54
3. RESEARCH METHODOLOGY ............................................................................ 57
3.1. Outline .............................................................................................. 57
3.1.1. Objective 1: Sinter bonding ............................................................ 57
3.1.2. Objective 2: Deformation ............................................................... 58
3.1.3. Objective 3: Model and evaluation ................................................. 58
3.2. Tasks ................................................................................................ 59
4. RESEARCH RESULTS ......................................................................................... 75
4.1. Introduction ...................................................................................... 75
4.2. Sinter bonding ................................................................................... 75
4.2.1. Initial contact ................................................................................. 81
4.2.2. Bond strength ................................................................................. 90
4.2.3. Sub-conclusion .............................................................................. 95
4.3. Post bond and deformation ................................................................ 97
4.4. Post bonding deformation and simulation ........................................ 102
4.4.1. Calculating sintering shrinkage .................................................... 102
vii
4.4.2. Model development ..................................................................... 103
4.4.3. Simulation ................................................................................... 108
4.4.4. Limitations................................................................................... 115
4.4.5. Sub-conclusion ............................................................................ 116
4.5. Model and evaluation ...................................................................... 118
4.5.1. Evaluation of bond strength ......................................................... 125
4.5.2. Maximum deformation................................................................. 131
4.5.3. Sub-conclusion ............................................................................ 142
5. DISCUSSION AND CONCLUSION ................................................................... 143
5.1. Introduction .................................................................................... 143
5.2. Research questions .......................................................................... 143
5.3. Research objectives ......................................................................... 149
5.4. Research goal .................................................................................. 150
5.5. Broader impacts .............................................................................. 152
5.6. Outlook and further directions ......................................................... 152
APPENDICES ............................................................................................................ 154
MATLAB program to calculate van der Waals forces (vanderWaals.m).... 155
MATLAB program to calculate the neck size between two spheres during
sintering (necksizecalculation_einfach.m) ............................................................ 156

viii
MATLAB program to determine the coefficients to fit the MSC curve to the
BASF shrinkage data (Determ_BASF_curve_coeff_1.m) ..................................... 158
MATLAB program to apply the MSC data
(MSC_application_onephase_1.m) ....................................................................... 159
MATLAB program to calculate sintering stress (sintstress_1.m) ............... 160
MATLAB program to calculate neck size between two spheres
(necksizecalculation_radius.m) ............................................................................. 162
MATLAB program to calculate neck size between two spheres
(test_sphere_flat_neu.m) ...................................................................................... 164
REFERENCES............................................................................................................ 166
ix
LIST OF TABLES
Table Page
Table 1: Comparison of small particle production techniques [1] ......................... 1
Table 2: Selected machanical properties of MIM metals and alloys (HT=heat
treated) [2]....................................................................................................................... 2
Table 3: Mass transport mechanisms .................................................................. 16
Table 4: Material transport mechanisms during sintering [26] ............................ 17
Table 5: First series of samples .......................................................................... 50
Table 6: Micro feature characteristics................................................................. 67
Table 7: Typical composition of BSAF Catamold 17-4PH A after sintering ....... 68
Table 8: Characteristic properties of BSAF Catamold 17-4PH A ....................... 68
Table 9: Flatness measurements ......................................................................... 71
Table 10: MIM features dimensions ................................................................... 78
Table 11: Measurements and results to determine the point of bonding ............ 101
Table 12: Result of measurements, 100µm features .......................................... 114
Table 13: Result of measurements, 200µm features .......................................... 115
Table 14: Shear strength results ....................................................................... 121
Table 15: Feature to area ratio 50µm and 100µm features ................................ 127
Table 16: Shear strength .................................................................................. 127
x
LIST OF FIGURES
Figure Page
Figure 1: The MIM process [5] ............................................................................ 3
Figure 2: Economy of the MIM process (after [6]). .............................................. 4
Figure 3: Typical MIM applications [8]. .............................................................. 5
Figure 4: Schematic of some limitations in MIM.................................................. 7
Figure 5: Effect of gravity during sintering. ......................................................... 8
Figure 6: Comparison of manufacturing processes. .............................................. 9
Figure 7: Frenkel's model [21]. .......................................................................... 15
Figure 8: Sintering stages [25]. .......................................................................... 17
Figure 9: Material transport paths during sintering [26]. ..................................... 18
Figure 10: Densification curve of a powder compact over four stages [26]. ........ 19
Figure 11: Tabata's set-up for two types of composites [17]. .............................. 21
Figure 12: Relation between bond strength t and relative density ρ [17]. ............ 22
Figure 13: Dilatometric curves of three types of Fe-1C components and Fe green
compacts during sintering in N2 [35]. ............................................................................ 23
Figure 14: Schematic illustration of the sample set-up [37]. ............................... 25
Figure 15: The tensile strength of MIM compacts and various couples sintered at
1573K in H2 (after [38]). ............................................................................................... 25
Figure 16: Bi-metal part made by welding [39] .................................................. 26
Figure 17: Bi-metal part produced by MIM [39] ................................................ 26
xi
List of Figures (continued)
Figure Page
Figure 18: Two different part designs: two cavities (a) and three cavities (b) [42].
...................................................................................................................................... 27
Figure 19: Micro tensile test specimens after molding, sintering and testing [45].
The tested sample (below) shows that the failure was not where the two different
materials were joined, but rather in the bulk of one of them (on the left). ....................... 28
Figure 20: Illustration of (a) successive molding and (b) simultaneous molding
[45]. The different shapes of the interface between two materials are clearly visible. For
successive molding, a part of the mold cavity needs to be shut off during injection of the
first material, thus making the mold more complicated. ................................................. 29
Figure 21: Ruh's composite part configuration [46]. ........................................... 30
Figure 22:KMC simulation results showing microstuctural (grain) evolution
during sintering of three particles [52]. .......................................................................... 34
Figure 23: MSC of 17-4PH [62]. ........................................................................ 38
Figure 24: Piecewise approximation for a MSC [63]. ......................................... 39
Figure 25: Two-phase MSC showing crossover from low temperature region to
high temperature region [67]. ........................................................................................ 41
Figure 26: Multi cavity mold.............................................................................. 42
Figure 27: Green MIM-solid composite part ...................................................... 43
Figure 28: Sintered MIM-solid composite part ................................................... 43
Figure 29: Flat MIM-solid composite part. ......................................................... 44
Figure 30: CTE as a function of density. ............................................................ 45
xii
List of Figures (continued)
Figure Page
Figure 31: geometry of deformed flat sample. .................................................... 46
Figure 32: Bonding area on flat MIM-solid composite part. ............................... 48
Figure 33: V-slot in solid part ............................................................................ 50
Figure 34: Grain structure continues over gap .................................................... 50
Figure 35: Point contact on V-slot composite part .............................................. 51
Figure 36: Point contact on V-slot composite part .............................................. 51
Figure 37: Composite part with rough surface structure on substrate .................. 52
Figure 38: Cross section of part with rough surface ............................................ 52
Figure 39: Sintering on a substrate with friction. ................................................ 52
Figure 40: Ideal sintering shrinkage [76]. ........................................................... 53
Figure 41: Proposed solution, powder compact with microstructure. .................. 55
Figure 42: Structure of this research ................................................................... 66
Figure 43: Injection molding machine in CGEC manufacturing lab. ................... 67
Figure 44: Two cavity mold. .............................................................................. 68
Figure 45: RTV rubber insert for 100µm features ............................................... 69
Figure 46: RTV rubber insert for 50µm features ................................................. 69
Figure 47: MIM part injected onto RTV insert. .................................................. 70
Figure 48: Layout of measurement points. ......................................................... 71
Figure 49: Surface structure. .............................................................................. 72
Figure 50: DSH sintering cycle. ......................................................................... 73
Figure 51: Basic MIM compact-substrate geometry. .......................................... 76
xiii
List of Figures (continued)
Figure Page
Figure 52: Zygo image of micro features. ........................................................... 77
Figure 53: Sphere distribution in pillar. .............................................................. 79
Figure 54: Graphical representation of particle size distribution (after [97]) ....... 81
Figure 55: Van der Waals forces sphere-sphere and sphere-plate........................ 82
Figure 56: Relative van der Waals forces. .......................................................... 83
Figure 57: Zones on bonded samples. ................................................................ 84
Figure 58: Ideal sintering model for infinite time [3]. ......................................... 86
Figure 59: Sintering of two spheres to 20% shrinkage. ....................................... 87
Figure 60: Sphere diameter vs. center distance. .................................................. 88
Figure 61: Deformed surface feature .................................................................. 89
Figure 62: Deformed surface feature .................................................................. 89
Figure 63: Pillar tips in rolling motion over substrate. ........................................ 89
Figure 64: Schematic of solid state material transport [101]. .............................. 90
Figure 65: Material transport in sintering a sphere to a plate............................... 91
Figure 66: Neck size sphere-flat at cycle start. ................................................... 92
Figure 67: Neck size sphere-flat at cycle end...................................................... 93
Figure 68: Neck size sphere-sphere at cycle start................................................ 94
Figure 69: Neck size sphere-sphere at cycle end. ................................................ 95
Figure 70: MIM part with 10µm dia. surface features (top) bonded to a solid
substrate (below). .......................................................................................................... 97
Figure 71: Micro features bonded to substrate. ................................................... 98
xiv
List of Figures (continued)
Figure Page
Figure 72: Part of the evaluated area of sinter bonded part. ................................ 99
Figure 73: Determining the point of bonding. ................................................... 100
Figure 74: BASF sintering cycle and dilatometer curve. ................................... 103
Figure 75: Dilatometer curve from BASF data. ................................................ 104
Figure 76: Sintering curve with MSC fit. ......................................................... 105
Figure 77: Calculated densification through known sintering cycle modeled with
MSC. ........................................................................................................................... 106
Figure 78: Sintering stress over sintering cycle. ............................................... 108
Figure 79: Pressure profile in ANSYS.............................................................. 109
Figure 80: Simulation of sintering shrinkage. ................................................... 110
Figure 81: Undeformed pillar model. ............................................................... 111
Figure 82: Deformed pillar model. ................................................................... 111
Figure 83: SEM image of a MIM compact (top) sinter bonded to a solid substrate
(below). ....................................................................................................................... 112
Figure 84: Comparison between samples and simulation, 100µm features. ....... 114
Figure 85: Comparison between samples and simulation, 200µm features. ....... 115
Figure 86: Shear test fixture. ............................................................................ 118
Figure 87: Shear test fixture placed in INSTRON. ........................................... 119
Figure 88: Shear test failure area. ..................................................................... 122
Figure 89: Shear test failure pattern. ................................................................. 123
Figure 90: Detail of shear failure. ..................................................................... 124
xv
List of Figures (continued)
Figure Page
Figure 91: Shear test results. ............................................................................ 125
Figure 92: Area/feature ratio 50µm feature. ...................................................... 126
Figure 93: Area/feature ratio 100µm feature. .................................................... 126
Figure 94: Bonded areas on 10µm sample. ....................................................... 128
Figure 95: Bonded area on 50µm sample. ........................................................ 129
Figure 96: Bonded area on 100µm sample........................................................ 129
Figure 97: bonding area per feature. ................................................................. 130
Figure 98: Figurative representation of feature deformation ............................. 131
Figure 99: Free body diagram .......................................................................... 131
Figure 100: Shape of deformed feature ............................................................ 132
Figure 101: Shear failure of micro feature. ....................................................... 133
Figure 102: The schematic diagram showing the geometric profile of the neck,
which is approximated as two circularly cylinders, and in the lower drawing this
approximation is overlaid on the two particle sintering geometry [113]. ...................... 134
Figure 103: Stress concentration factor. ........................................................... 135
Figure 104: Thermal softening of 17-4PH [72]. ................................................ 136
Figure 105: Testing the applicability of the Arrhenius equation ........................ 137
Figure 106: Extrapolation of tensile strength over temperature. ........................ 138
Figure 107: Elongation of features. .................................................................. 139
Figure 108: Elongation as a function of temperature of stainless steel 17-4PH
[72]. ............................................................................................................................ 140

xvi
List of Figures (continued)
Figure Page
Figure 109: Elongation of features as a function of distance ............................. 141
Figure 110: Compression molded MIM part (top) sinter bonded to solid substrate
.................................................................................................................................... 146
1. INTRODUCTION
1.1. Metal Inject ion Molding
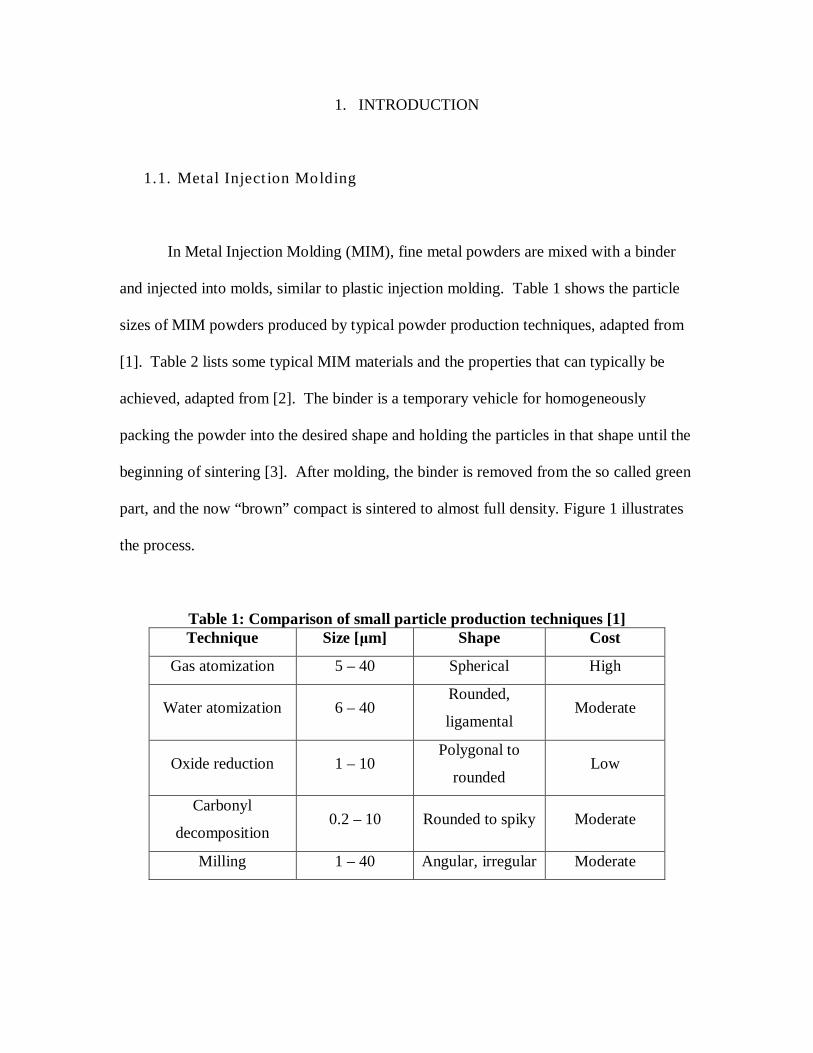
In Metal Injection Molding (MIM), fine metal powders are mixed with a binder
and injected into molds, similar to plastic injection molding. Table 1 shows the particle
sizes of MIM powders produced by typical powder production techniques, adapted from
[1]. Table 2 lists some typical MIM materials and the properties that can typically be
achieved, adapted from [2]. The binder is a temporary vehicle for homogeneously
packing the powder into the desired shape and holding the particles in that shape until the
beginning of sintering [3]. After molding, the binder is removed from the so called green
part, and the now “brown” compact is sintered to almost full density. Figure 1 illustrates
the process.
Table 1: Comparison of small particle production techniques [1] Technique Size [µm] Shape Cost
Gas atomization 5 – 40 Spherical High
Water atomization 6 – 40 Rounded,
ligamental Moderate
Oxide reduction 1 – 10 Polygonal to
rounded Low
Carbonyl
decomposition 0.2 – 10 Rounded to spiky Moderate
Milling 1 – 40 Angular, irregular Moderate
2
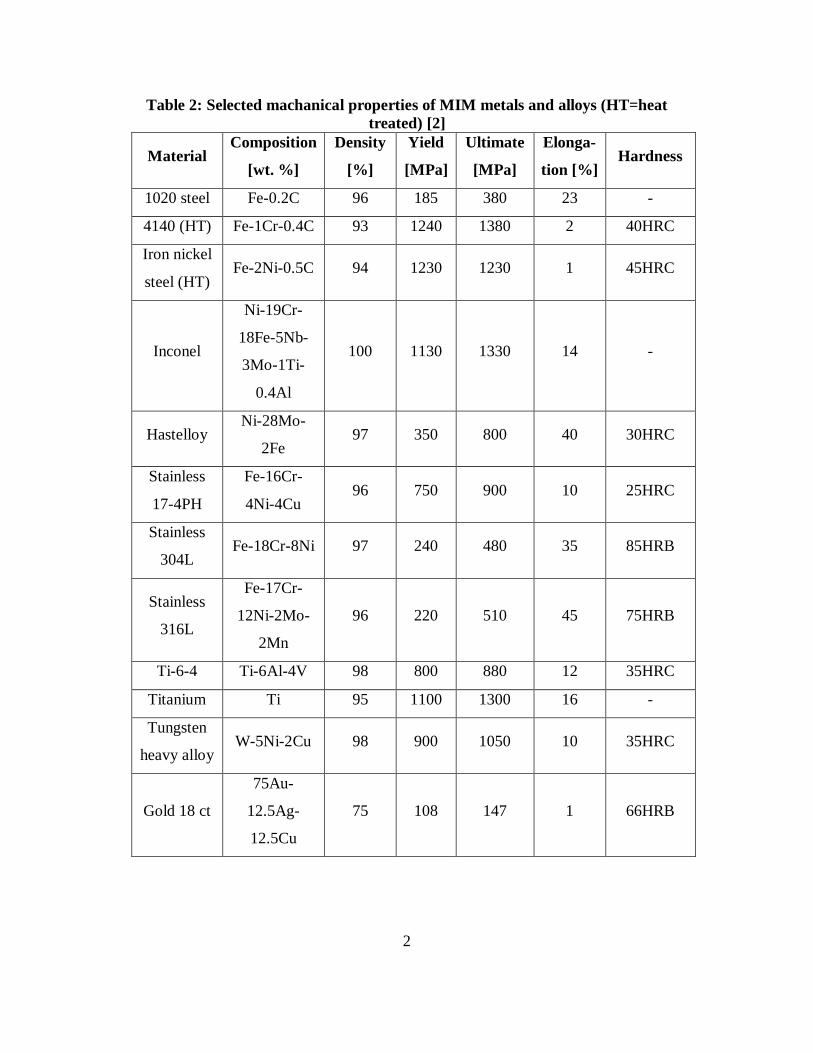
Table 2: Selected machanical properties of MIM metals and alloys (HT=heat treated) [2]
Material Composition
[wt. %]
Density
[%]
Yield
[MPa]
Ultimate
[MPa]
Elonga-
tion [%] Hardness
1020 steel Fe-0.2C 96 185 380 23 -
4140 (HT) Fe-1Cr-0.4C 93 1240 1380 2 40HRC
Iron nickel
steel (HT) Fe-2Ni-0.5C 94 1230 1230 1 45HRC
Inconel
Ni-19Cr-
18Fe-5Nb-
3Mo-1Ti-
0.4Al
100 1130 1330 14 -
Hastelloy Ni-28Mo-
2Fe 97 350 800 40 30HRC
Stainless
17-4PH
Fe-16Cr-
4Ni-4Cu 96 750 900 10 25HRC
Stainless
304L Fe-18Cr-8Ni 97 240 480 35 85HRB
Stainless
316L
Fe-17Cr-
12Ni-2Mo-
2Mn
96 220 510 45 75HRB
Ti-6-4 Ti-6Al-4V 98 800 880 12 35HRC
Titanium Ti 95 1100 1300 16 -
Tungsten
heavy alloy W-5Ni-2Cu 98 900 1050 10 35HRC
Gold 18 ct
75Au-
12.5Ag-
12.5Cu
75 108 147 1 66HRB
3
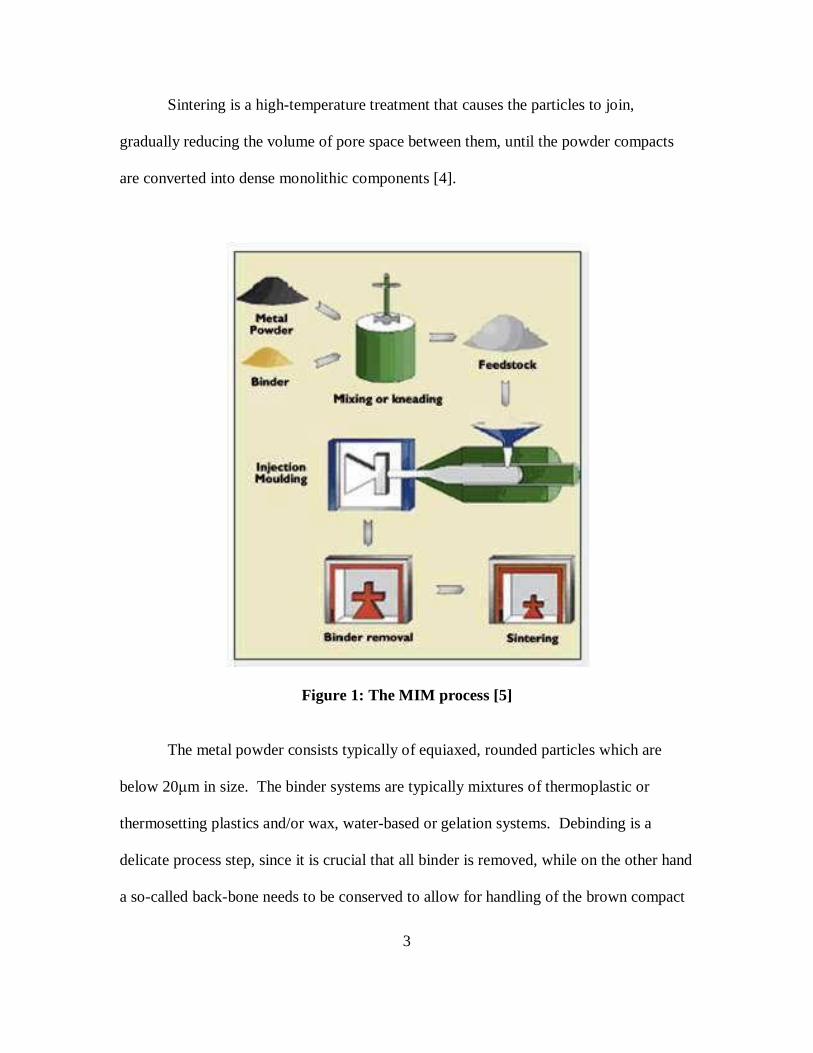
Sintering is a high-temperature treatment that causes the particles to join,
gradually reducing the volume of pore space between them, until the powder compacts
are converted into dense monolithic components [4].
Figure 1: The MIM process [5]
The metal powder consists typically of equiaxed, rounded particles which are
below 20µm in size. The binder systems are typically mixtures of thermoplastic or
thermosetting plastics and/or wax, water-based or gelation systems. Debinding is a
delicate process step, since it is crucial that all binder is removed, while on the other hand
a so-called back-bone needs to be conserved to allow for handling of the brown compact
4
rom the debinding furnace to the sintering furnace and support the part between
debinding and sintering. Depending on the binder system, there are different debinding
processes: solvent-, thermal-, or catalytic-debinding or drying of the compact. Once the
compacts are debound, they are sintered at a temperature which is typically above 0.5 of
its absolute melting temperature. Depending on the material, there will be a vacuum, an
oxidizing, a reducing or an inert atmosphere in the sintering furnace.
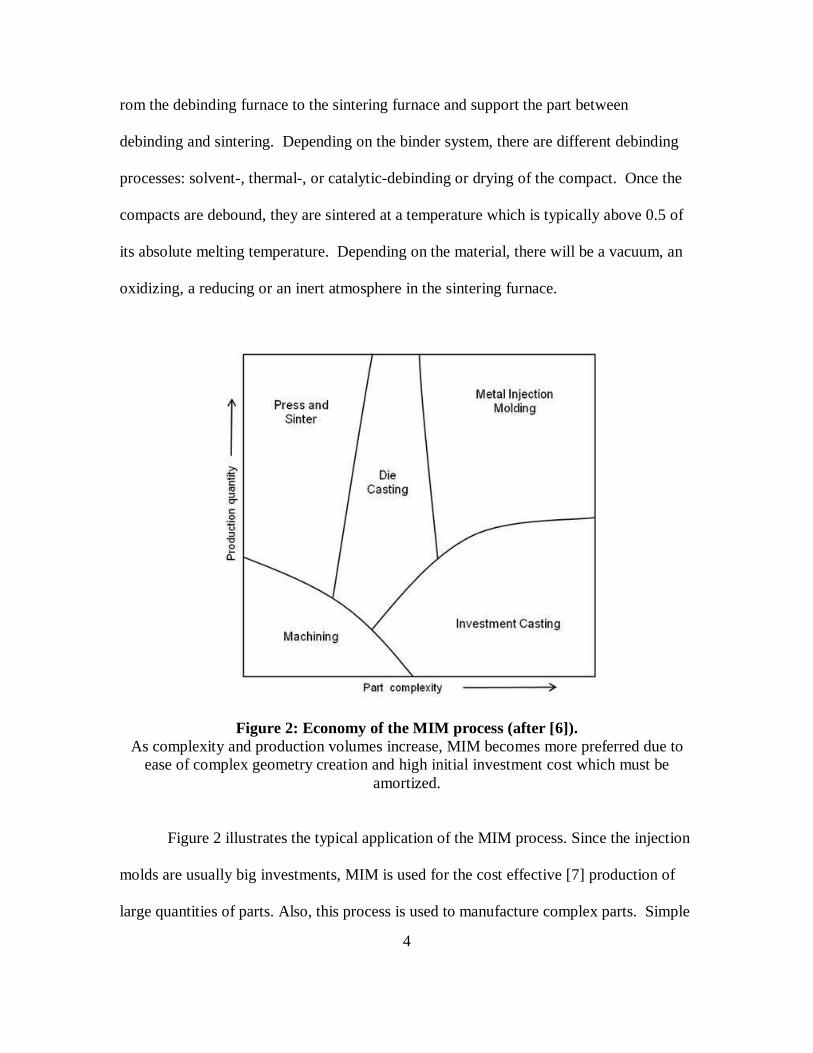
Figure 2: Economy of the MIM process (after [6]). As complexity and production volumes increase, MIM becomes more preferred due to
ease of complex geometry creation and high initial investment cost which must be amortized.
Figure 2 illustrates the typical application of the MIM process. Since the injection
molds are usually big investments, MIM is used for the cost effective [7] production of
large quantities of parts. Also, this process is used to manufacture complex parts. Simple
5
parts can be manufactured more economically by press and sinter powder metallurgy, die
casting or machining.
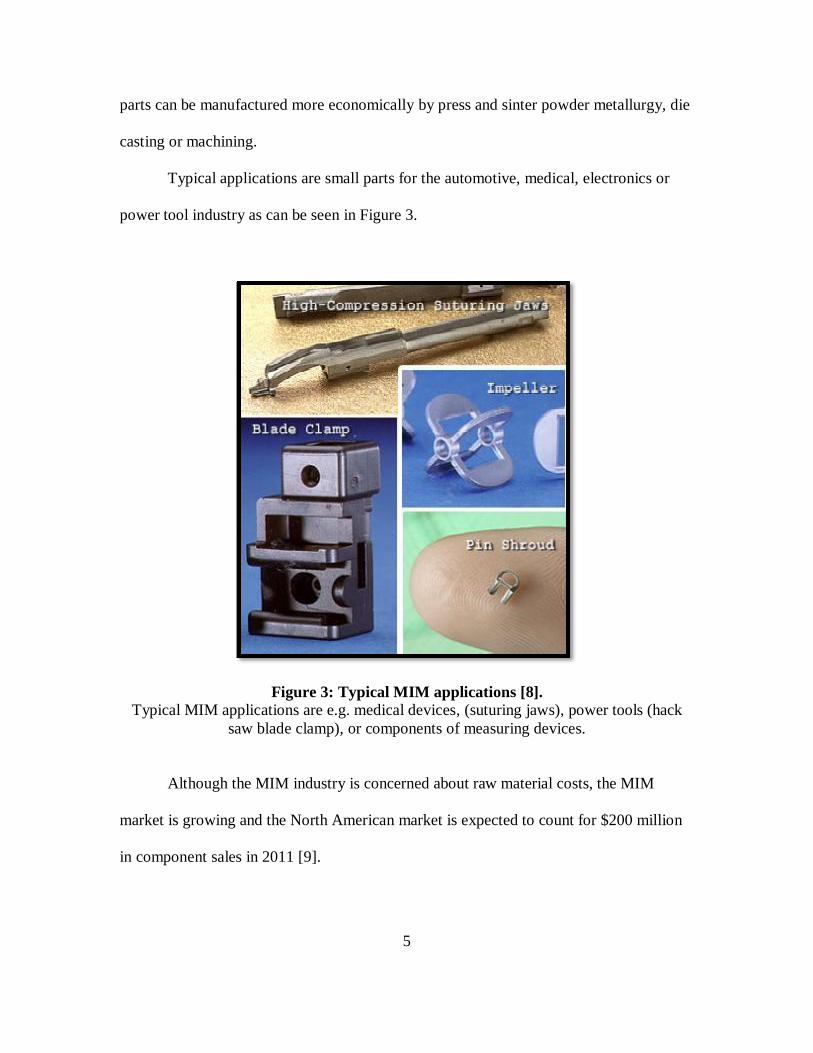
Typical applications are small parts for the automotive, medical, electronics or
power tool industry as can be seen in Figure 3.
Figure 3: Typical MIM applications [8]. Typical MIM applications are e.g. medical devices, (suturing jaws), power tools (hack
saw blade clamp), or components of measuring devices.
Although the MIM industry is concerned about raw material costs, the MIM
market is growing and the North American market is expected to count for $200 million
in component sales in 2011 [9].
6
While in North America only about 7% of the MIM market is dedicated to the
automotive industry, medical applications and firearm components take the biggest share.
In Europe the automotive industry is responsible for 50% of the total MIM market. Raw
material fluctuations continue to impact metalworking processes, favoring MIM’s
netshape appeal [10].
1.2. Limitat ions
However, there are still size and shape limitations in the MIM process. Besides
the cost of the feedstock these limitations are mainly imposed by the debinding and
sintering operations. The general rule is that parts with a weight over 200g are usually
more economically manufactured through other processes.
The feedstock cost exceeds the advantages of the MIM process at this weight. As
stated by EPMA (European Powder Metallurgy Association) [11]: there is, theoretically,
no limit to the maximum size of part that could be produced, but economic considerations
restrict the sizes that are currently viable. The larger the part the greater is the proportion
of the overall cost that is attributable to the raw material which is costly. The total cost of
the powder is a linear function of the weight of the part, but in the case of parts produced
by machining from solid bar stock, for example, the machining costs increase with
increasing part size at a much lower rate. Also, tooling costs per part can be reduced by
increasing the number of cavities per mold. But as the part size increases, the number of
cavities for a given mold or machine size is limited.
7
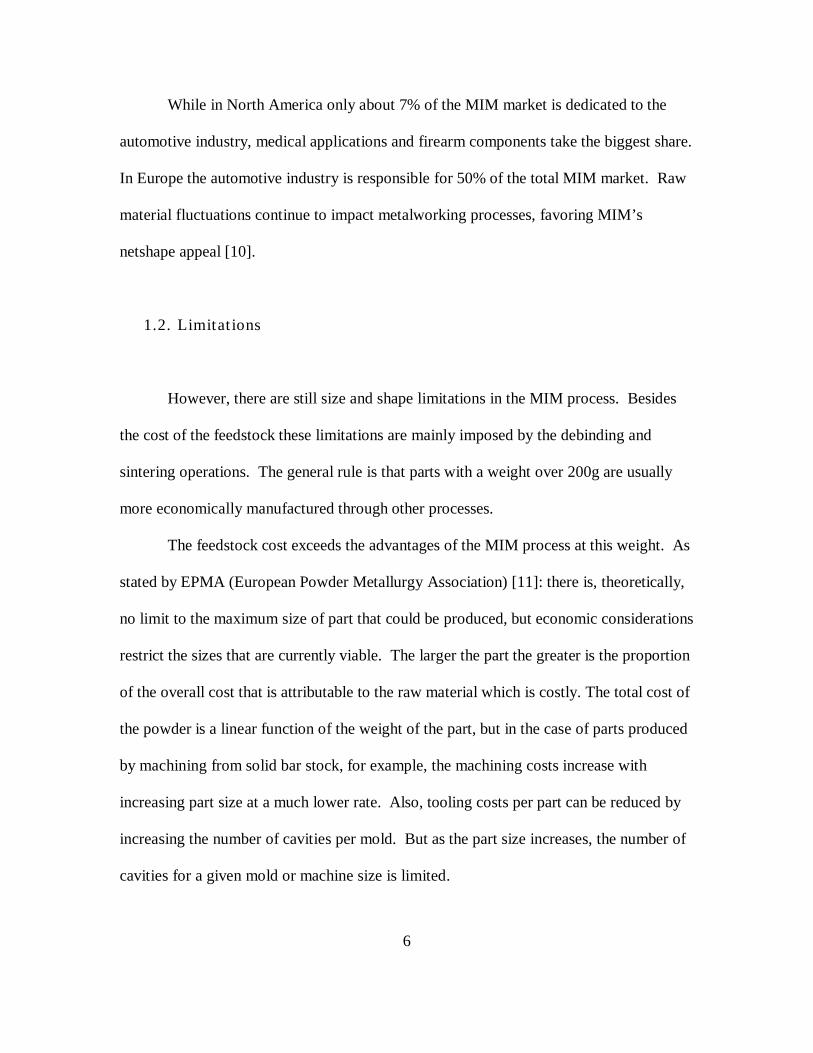
Figure 4: Schematic of some limitations in MIM. The binder needs to be safely extracted from the center of the component; unsupported
areas may sag due to gravity.
Thick cross sections are difficult to debind (see Figure 4) or would take too much
time to debind and make this process step too cost intensive. An upper limit for a wall
thickness of 6mm is suggested from the binder removal operation [12]. Depending on
the binder system, thicker cross sections can be achieved. Besides the cost of debinding
time there is also the risk of binder not being removed at all. Excess residue binder will
lead to cracks, pores and deformation during sintering. Also, uniform wall thickness is
critical because non-uniform walls may cause distortion, internal stresses, voids, cracking
and sink marks. Variations in wall thickness also cause variations in shrinkage during
sintering, making dimensional control difficult [13].
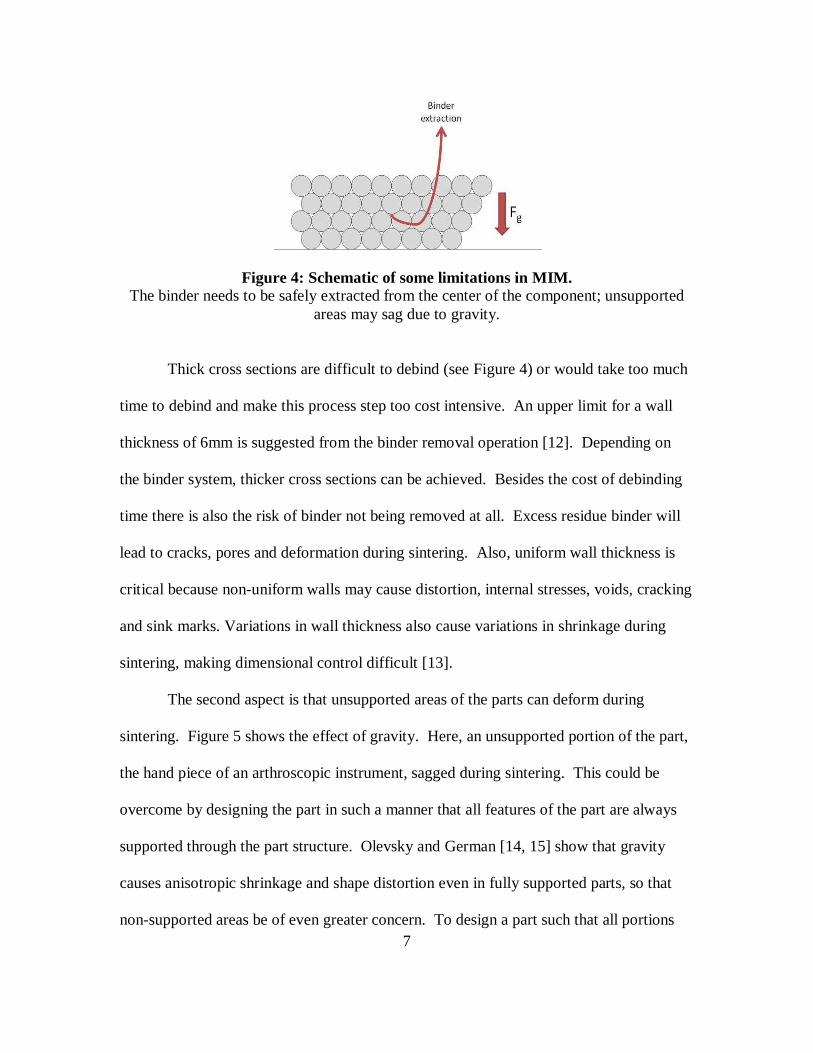
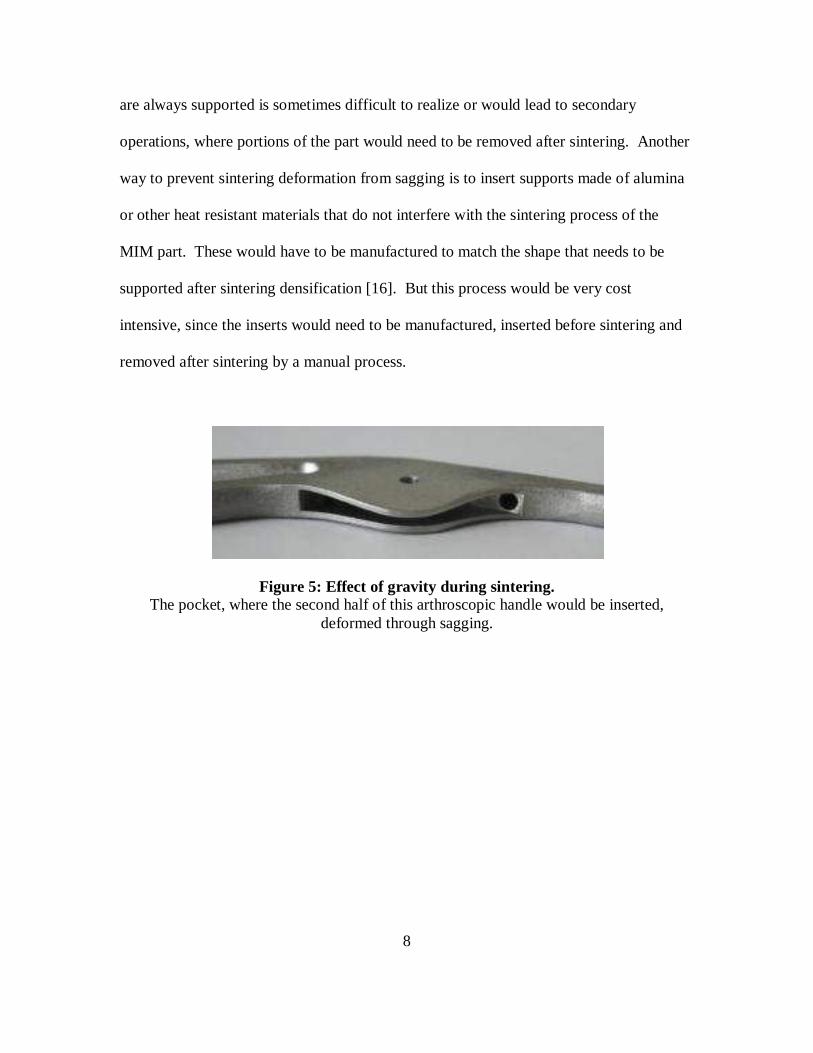
The second aspect is that unsupported areas of the parts can deform during
sintering. Figure 5 shows the effect of gravity. Here, an unsupported portion of the part,
the hand piece of an arthroscopic instrument, sagged during sintering. This could be
overcome by designing the part in such a manner that all features of the part are always
supported through the part structure. Olevsky and German [14, 15] show that gravity
causes anisotropic shrinkage and shape distortion even in fully supported parts, so that
non-supported areas be of even greater concern. To design a part such that all portions
8
are always supported is sometimes difficult to realize or would lead to secondary
operations, where portions of the part would need to be removed after sintering. Another
way to prevent sintering deformation from sagging is to insert supports made of alumina
or other heat resistant materials that do not interfere with the sintering process of the
MIM part. These would have to be manufactured to match the shape that needs to be
supported after sintering densification [16]. But this process would be very cost
intensive, since the inserts would need to be manufactured, inserted before sintering and
removed after sintering by a manual process.
Figure 5: Effect of gravity during sintering. The pocket, where the second half of this arthroscopic handle would be inserted,
deformed through sagging.
9
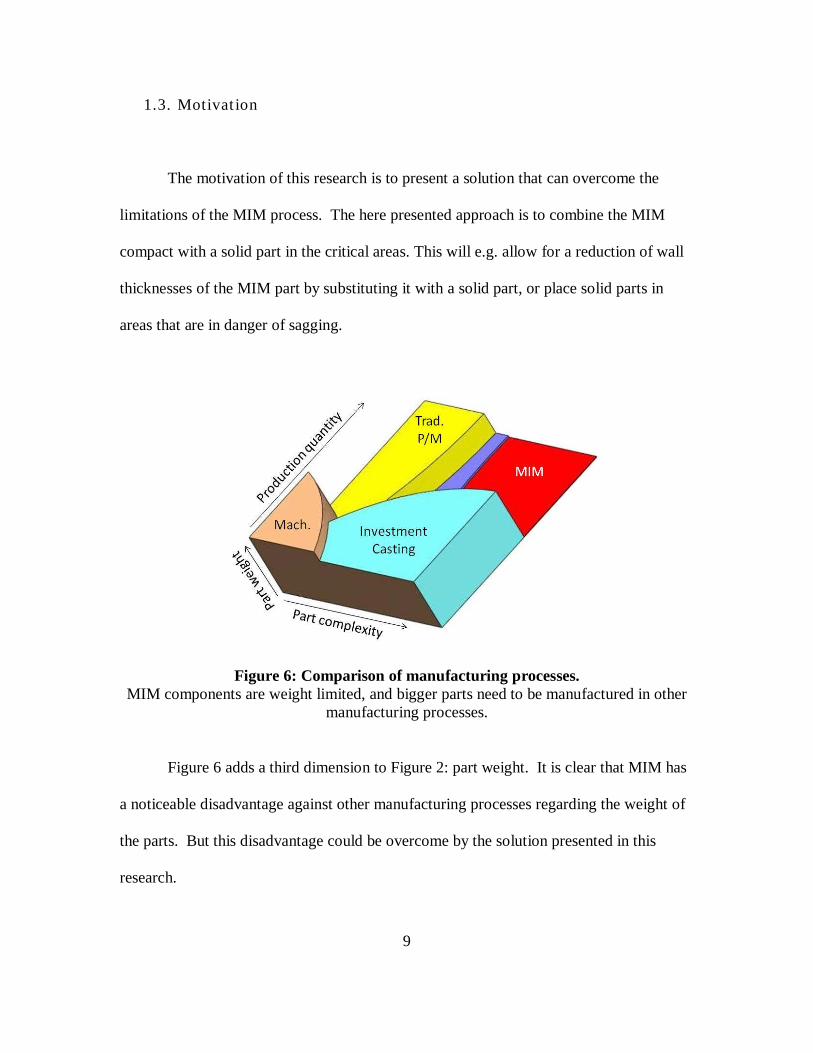
1.3. Motivat ion
The motivation of this research is to present a solution that can overcome the
limitations of the MIM process. The here presented approach is to combine the MIM
compact with a solid part in the critical areas. This will e.g. allow for a reduction of wall
thicknesses of the MIM part by substituting it with a solid part, or place solid parts in
areas that are in danger of sagging.
Figure 6: Comparison of manufacturing processes. MIM components are weight limited, and bigger parts need to be manufactured in other
manufacturing processes.
Figure 6 adds a third dimension to Figure 2: part weight. It is clear that MIM has
a noticeable disadvantage against other manufacturing processes regarding the weight of
the parts. But this disadvantage could be overcome by the solution presented in this
research.
10
According to experts in the field of metal injection molding and powder
metallurgy that have been contacted regarding sinter bonding a MIM compact to a solid
substrate, this is very difficult to achieve, if not impossible, due to the shrinkage of the
compact. Since the substrate would maintain its shape and dimensions, the powder
compact is expected to crack and/or undergo distortion during sintering. This seems to
be the reason, that there are no publications in relation to this topic available at this point.
This work could be the foundation to achieving sinter bonding powder compacts
to solid substrates. Beginning with identical materials, as shown here, this can be
extended to other material combinations metal-metal, or even metal-ceramics.
Sinter bonding powder compacts with solid substrates has several advantages over
parts that are only made by powder injection molding or e.g. by machining only.
Adapted from Tabata [17], who was working in the area of traditional powder
metallurgy, that is press and sinter, the advantages of composite parts are:
1. Amount of powder used can be reduced with maintaining a merit of the MIM process,
that is, parts of complex shape can be made easily.
2. Parts that are only difficult to make by MIM (for example limited by mold design,
cost or size) can be fabricated, for example, by combining a MIM part with a long,
thick or thin solid metal.

11
3. High mechanical strength or other properties can be acquired only at a necessary
portion by using different materials, for example, an alloy steel feedstock and
comparatively cheap steel. Achieve other properties like magnetic-non magnetic in
one part.
4. Other joining processes like welding or brazing can be replaced. In this context, a
study has been done by Parmigiani and Kosco [18], investigating several joining
methods to join PM components. They investigated friction welding, high speed
pulse welding, tungsten inert gas welding, brazing and fusion welding. The results
show that there is room for improvements. Especially brazing and fusion welding
showed to be problematic processes in joining PM components.
5. The above mentioned advantages (1), (2), (3) and (4) may lead to cost reduction.
12
1.4. Dissertation outline and organizat ion
After having given an introduction to the metal injection molding process and its
limitation, the motivation for this research was laid out in this chapter.
The structure of the remainder of this dissertation will be as follows:
Chapter Two is an in depth discussion on the background. First there is the
literature review, which is divided into three blocks, a review on sintering in general
along the historic timeline, followed by reviews of available literature on sinter bonding
in traditional powder metallurgy, and sinter bonding in metal injection molding. The last
block is a detailed review on sintering models and simulations with an emphasis on the
Master sintering curve approach, as this is the model that will be used later in this
research. The next section covers the previous work. These are some test and samples
that were produced to get a better understanding of sinter bonding a MIM powder
compact to a solid substrate. These samples led to the formulation of the here presented
proposed solution to overcome the limitations of the MIM process.
Chapter Three presents the research methodology. The research goal, objectives,
questions and tasks will be defined and explained. The basis for this research is a series
of reference samples that have been produced at the CGEC’s manufacturing lab as
described in this chapter.
The research results will be presented in Chapter Four. Again, the chapter will be
divided into sub sections: the first one on sinter bonding, the second on post bond and
deformation, and the last one on the model and bonding and model evaluation. The
13
section on sinter bonding is an examination of the actual bonding process and its
development through the sintering cycle. In the post bond and deformation section, the
actual deformation of the micro features will be modeled and simulated with ANSYS.
Finally, in the last section, the bonds will be evaluated for shear strength and the results
will be compared with theoretical values and the limits will be explored.
In Chapter Five, a summary will be presented in the form of answering the
previously stated research questions individually and thus fulfilling the research
objectives and goal. The last section in this chapter will be an outlook on future work.
This will be followed by the appendices, in this case printouts of MATLAB code,
and finally the references used throughout this dissertation.
14
2. BACKGROUND
2.1. Literature Review
The literature on sinter bonding refers primarily to traditional powder metallurgy.
The first part of this literature review is on sintering basics, developing the theory of
sintering along the historic timeline. This first part is followed by a review on sinter
bonding in traditional powder metallurgy and a review of literature on sinter bonding in
metal injection molding. The final part is a literature review on sintering models and
simulations.
2.1.1. Sintering
“Sintering is a thermal treatment of particulate material or a porous body which
remains predominantly solid and, with the formation and growth of particle contacts,
becomes a more coherent mass of lower free enthalpy.” [19]
According to Ristic, “the first theory of sintering was established by Y. I. Frenkel
in the paper “Viscous flow of crystalline bodies under action of surface tension” [20], in
which the cause of sintering and its transferring force were defined as sufficient of Gibb’s
surface energy” [21].
15
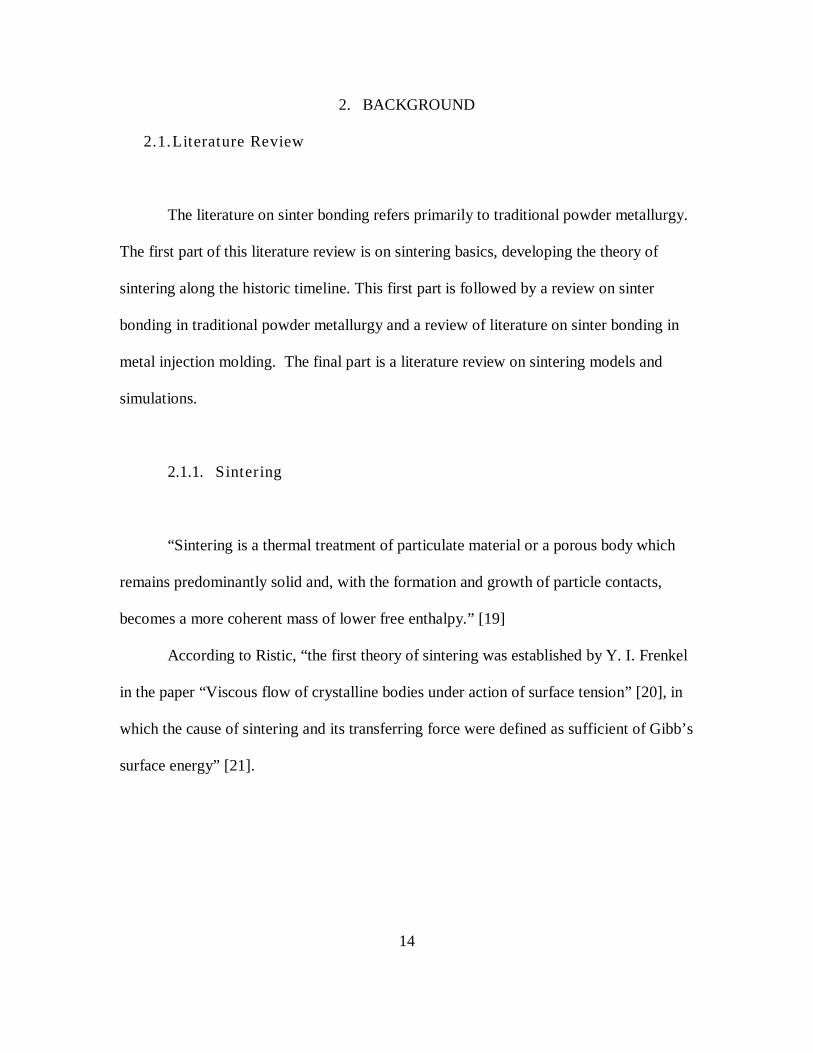
Figure 7: Frenkel's model [21]. Two particles join during sintering in the shape of two drops touching each other.
Frenkel stated that the first stage of sintering could be represented as the joining
of two liquid drops touching each other in one point at the beginning. After some time t,
the drops would touch each other along a circle with a radius of Y(t). He assumed that
remaining parts of both drops retained their shape, Figure 7. The following publications
still stated that density increase could not be explained by volume diffusion of vacant
lattice sites or surface migration of atoms, but must involve macroscopic flow, with the
driving force for this flow being surface tension [22]. Kuczynski [23], however,
improved Frenkel’s basic postulate. He discussed diffusion along grain boundaries and
volume diffusion as possible densification mechanisms and concluded that volume
diffusion was the mechanism that was more probable to cause shrinkage.
Ashby [24] defined four stages in the sintering process, during which six transport
paths appear, all leading to neck growth, but only three leading to densification. The
stages are (0), the instantaneous neck formation which interatomic forces cause when
powder particles are placed in contact. Stage (0) is followed by stage (1), the early stage
of neck growth. Next is the intermediate stage (2): the necks are quite large, and the
yΘa
16
pores are roughly cylindrical. In the final stage, stage (3), the pores are isolated and
spherical.
Table 3: Mass transport mechanisms [24] Transport path Source of matter Sink of matter
Surface diffusion Surface Neck Lattice diffusion Surface Neck Vapor transport Surface Neck
Boundary diffusion Grain boundary Neck Lattice diffusion Grain boundary Neck Lattice diffusion Dislocations Neck
Table 3 lists the mass transport mechanisms defined by Ashby. Only the last
three lead to densification. The rate at which the particle centers approach each other is
non-zero only when matter is removed from the grain boundary which separates two
particles or from dislocations within the neck region. Figure 8 from German [25]
illustrates the sintering stages.
17
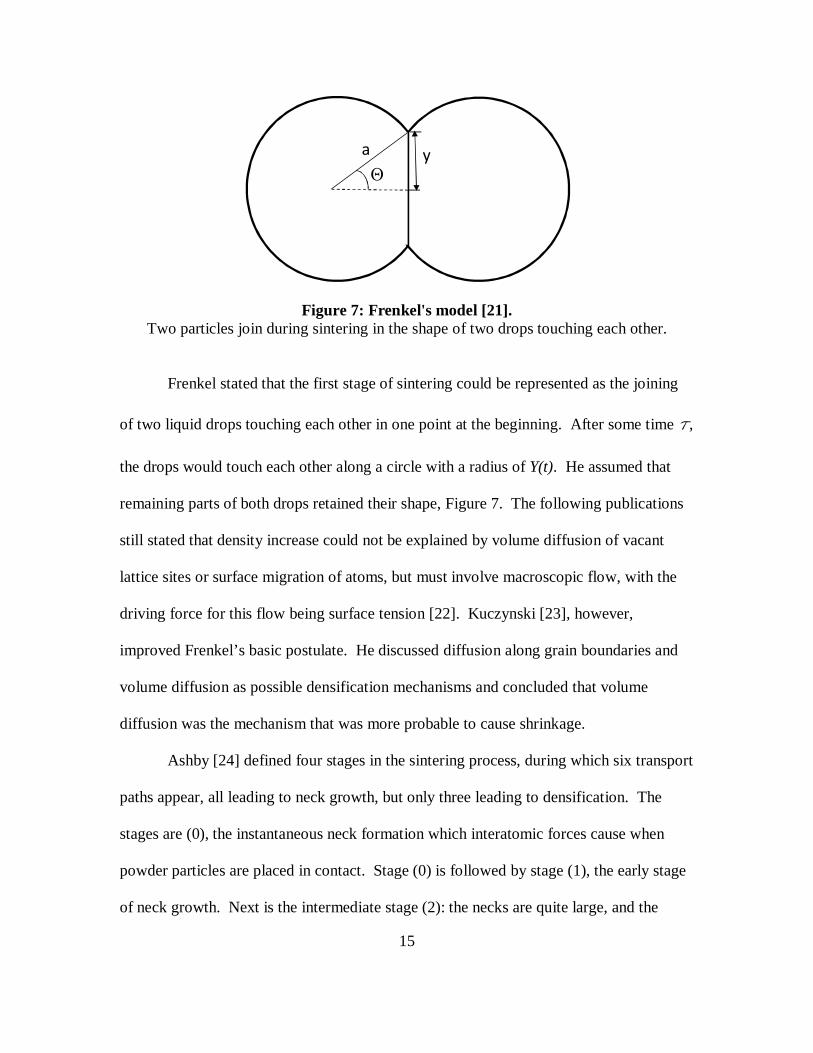
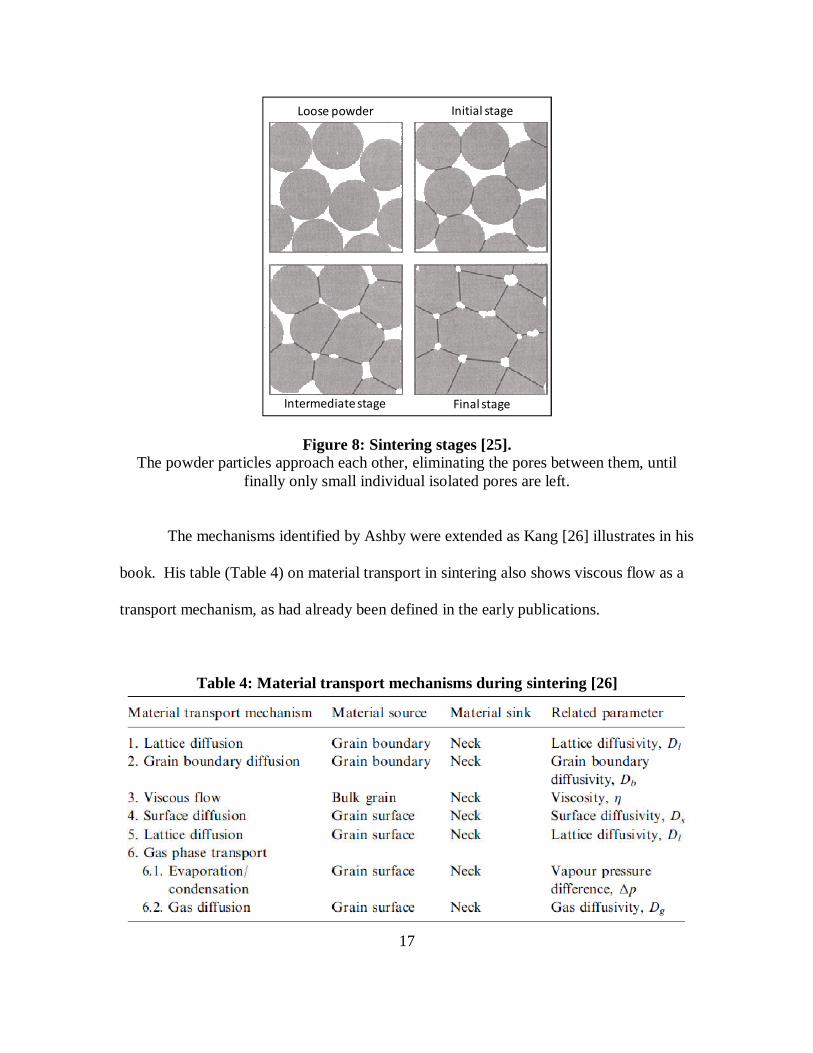
Figure 8: Sintering stages [25]. The powder particles approach each other, eliminating the pores between them, until
finally only small individual isolated pores are left.
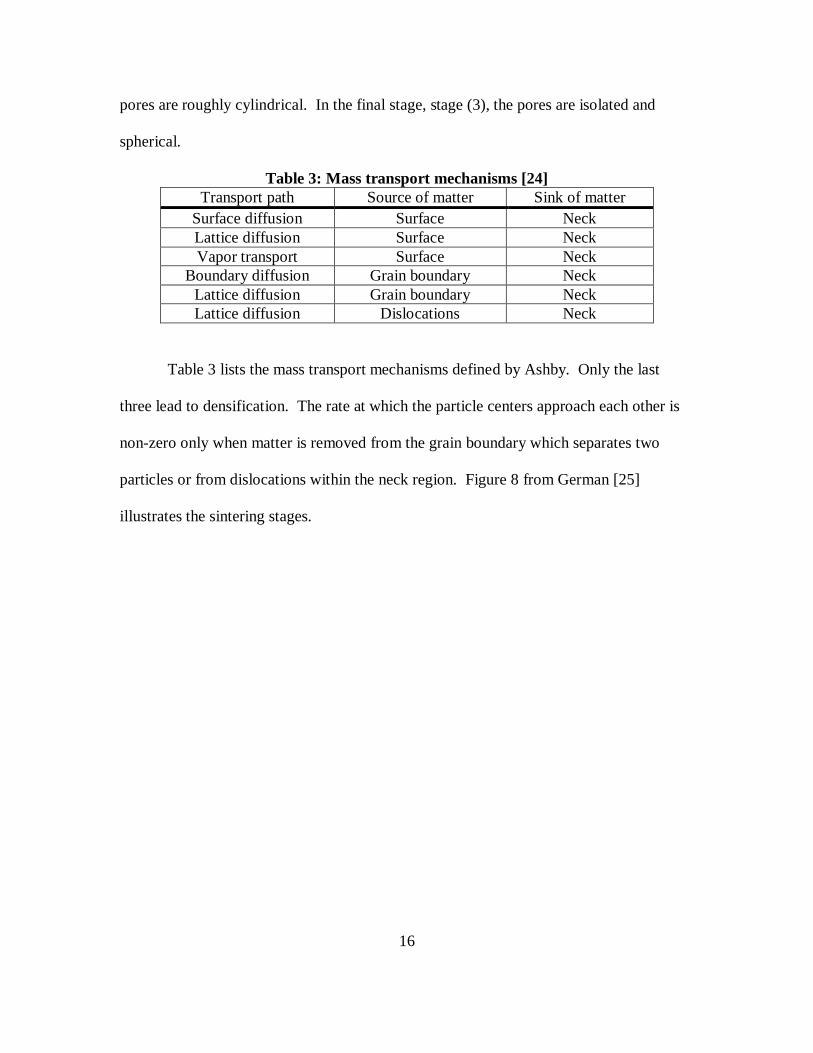
The mechanisms identified by Ashby were extended as Kang [26] illustrates in his
book. His table (Table 4) on material transport in sintering also shows viscous flow as a
transport mechanism, as had already been defined in the early publications.
Table 4: Material transport mechanisms during sintering [26]
Loose powder Initial stage
Final stageIntermediate stage
18
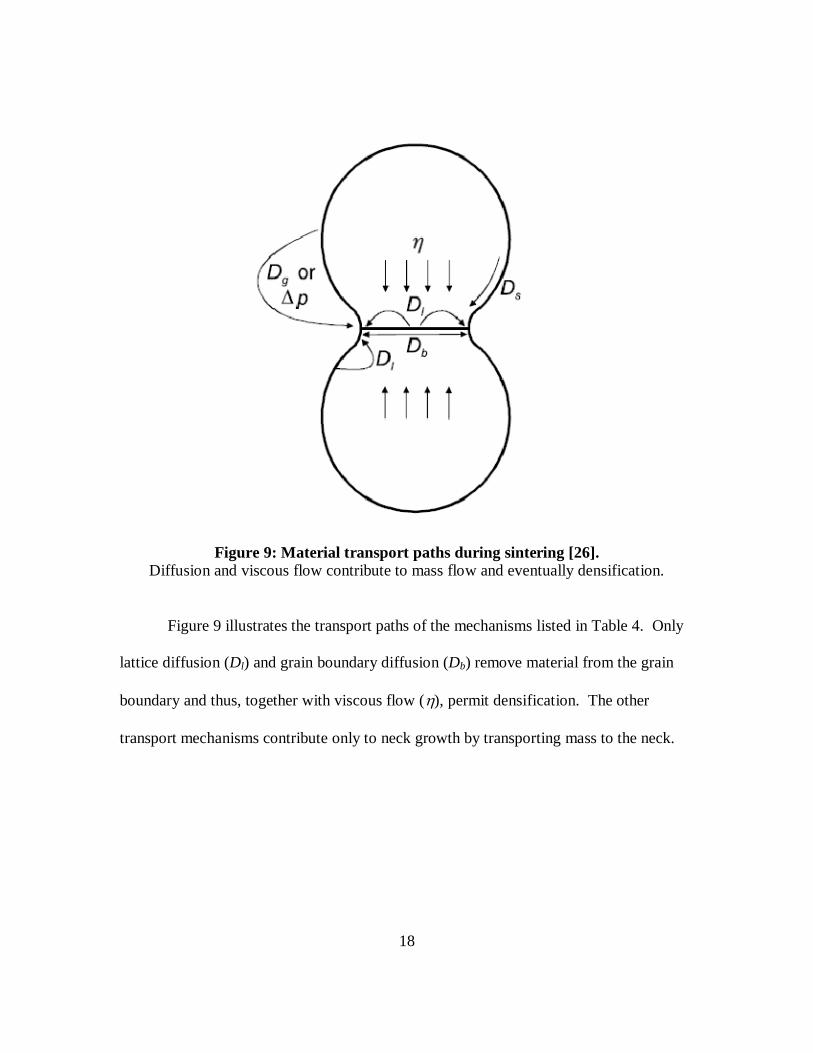
Figure 9: Material transport paths during sintering [26]. Diffusion and viscous flow contribute to mass flow and eventually densification.
Figure 9 illustrates the transport paths of the mechanisms listed in Table 4. Only
lattice diffusion (Dl) and grain boundary diffusion (Db) remove material from the grain
boundary and thus, together with viscous flow (η), permit densification. The other
transport mechanisms contribute only to neck growth by transporting mass to the neck.
19
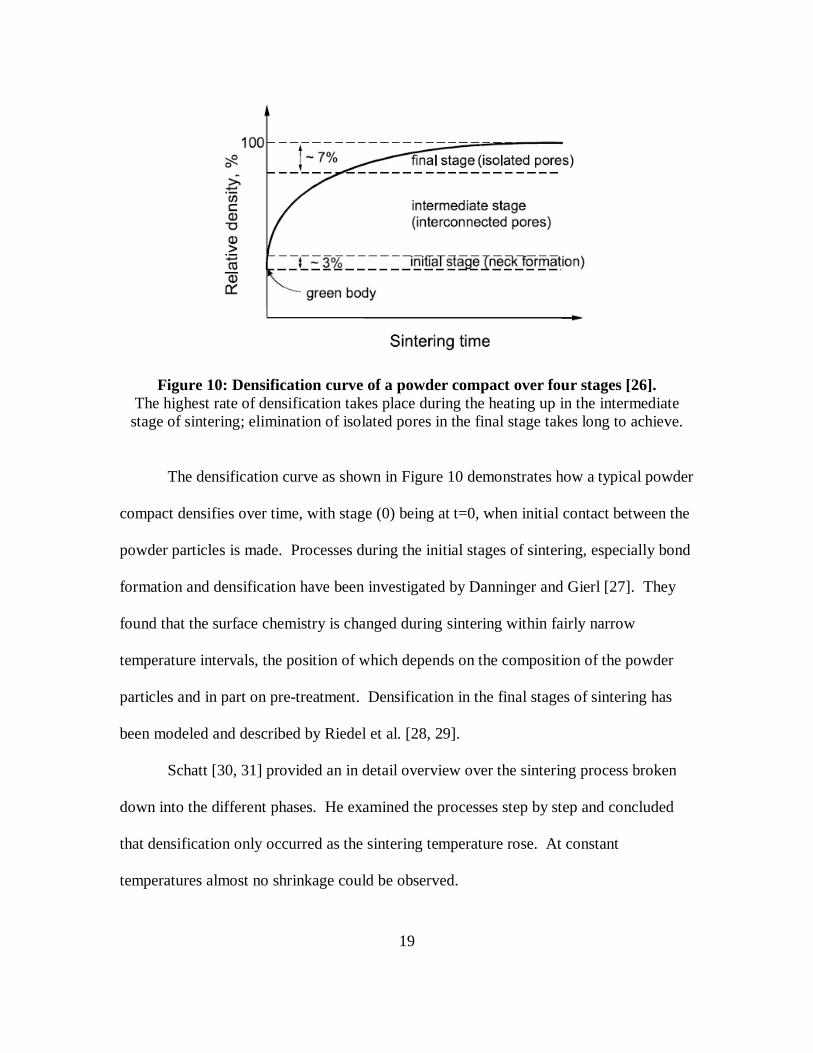
Figure 10: Densification curve of a powder compact over four stages [26]. The highest rate of densification takes place during the heating up in the intermediate stage of sintering; elimination of isolated pores in the final stage takes long to achieve.
The densification curve as shown in Figure 10 demonstrates how a typical powder
compact densifies over time, with stage (0) being at t=0, when initial contact between the
powder particles is made. Processes during the initial stages of sintering, especially bond
formation and densification have been investigated by Danninger and Gierl [27]. They
found that the surface chemistry is changed during sintering within fairly narrow
temperature intervals, the position of which depends on the composition of the powder
particles and in part on pre-treatment. Densification in the final stages of sintering has
been modeled and described by Riedel et al. [28, 29].
Schatt [30, 31] provided an in detail overview over the sintering process broken
down into the different phases. He examined the processes step by step and concluded
that densification only occurred as the sintering temperature rose. At constant
temperatures almost no shrinkage could be observed.
20
The latest developments in sintering theory have been made with the use of
continuum mechanics, which has been successfully applied to the analysis of compaction
of porous bodies. The sintering kinetics of real porous bodies is determined not only by
the properties of the powder particles and the nature of their interaction, but also by
macroscopic factors. Among them are kinematic constraints (for example, adhesion of
porous sample’s end face and furnace surface), externally applied forces and, also,
inhomogeneity of properties in volume under investigation [32].
2.1.2. Sinter bonding in tradit ional powder metallurgy
Bonding a metal powder compact to a solid substrate during sintering is well
known in traditional powder metallurgy. Tabata [17, 33] did several experiments, where
the powder and the substrates were brought into close contact by pressing the powder
around a solid cylinder, pressing it inside a solid tube, or rolling it onto a flat strip.
21
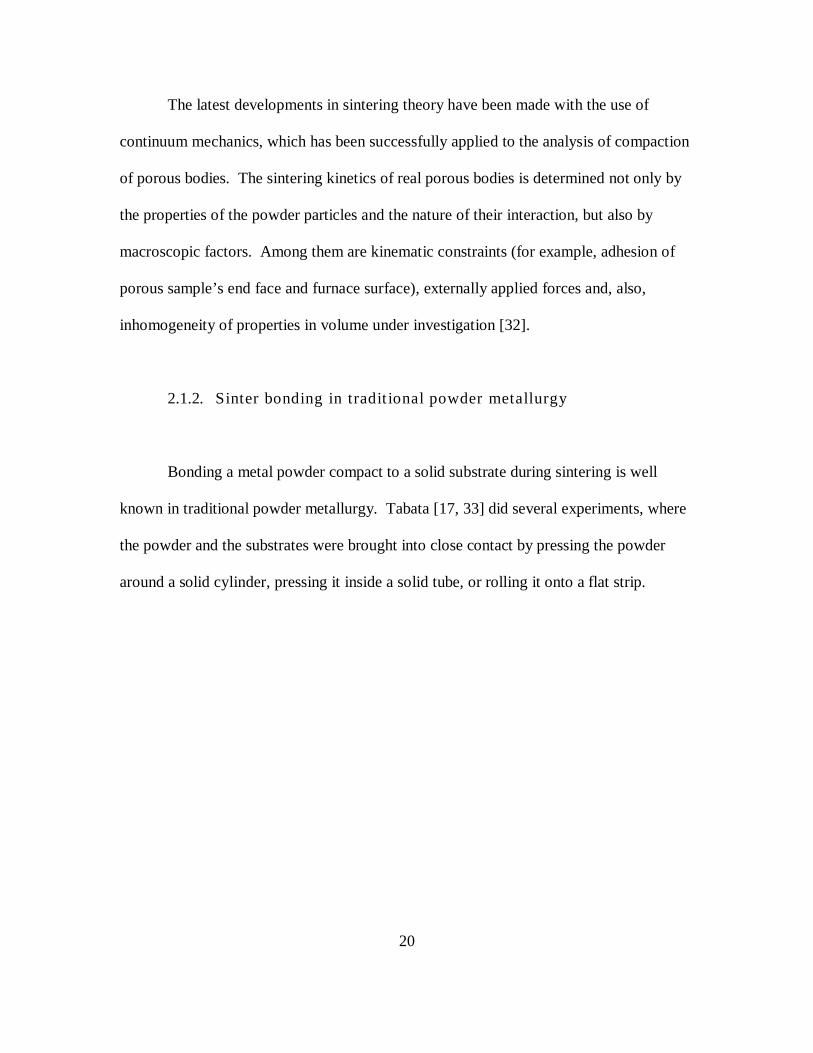
Figure 11: Tabata's set-up for two types of composites [17]. The metal powder is pressed around a massive cylinder (a), or inside a tube (b) to
evaluate bonding.
Figure 11 illustrates Tabata’s set-up. This configuration brings the metal powder
and solid metal into very close contact that enhances the bond strengths. He achieved
good bond strengths between the powder and the substrate, which could even be
improved by repressing and resintering.
22
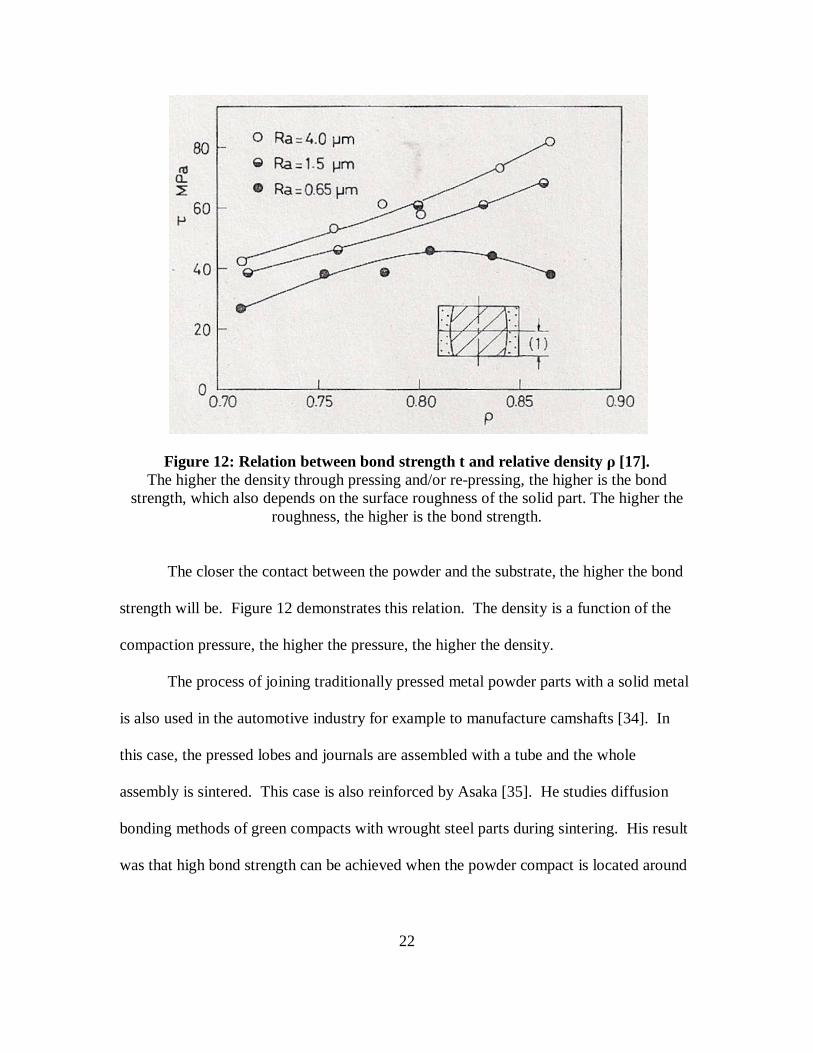
Figure 12: Relation between bond strength t and relative density ρ [17]. The higher the density through pressing and/or re-pressing, the higher is the bond
strength, which also depends on the surface roughness of the solid part. The higher the roughness, the higher is the bond strength.
The closer the contact between the powder and the substrate, the higher the bond
strength will be. Figure 12 demonstrates this relation. The density is a function of the
compaction pressure, the higher the pressure, the higher the density.
The process of joining traditionally pressed metal powder parts with a solid metal
is also used in the automotive industry for example to manufacture camshafts [34]. In
this case, the pressed lobes and journals are assembled with a tube and the whole
assembly is sintered. This case is also reinforced by Asaka [35]. He studies diffusion
bonding methods of green compacts with wrought steel parts during sintering. His result
was that high bond strength can be achieved when the powder compact is located around
23
the wrought part, e.g. a tube or shaft. He concluded that this is because the wrought part
expands more than the powder compact.
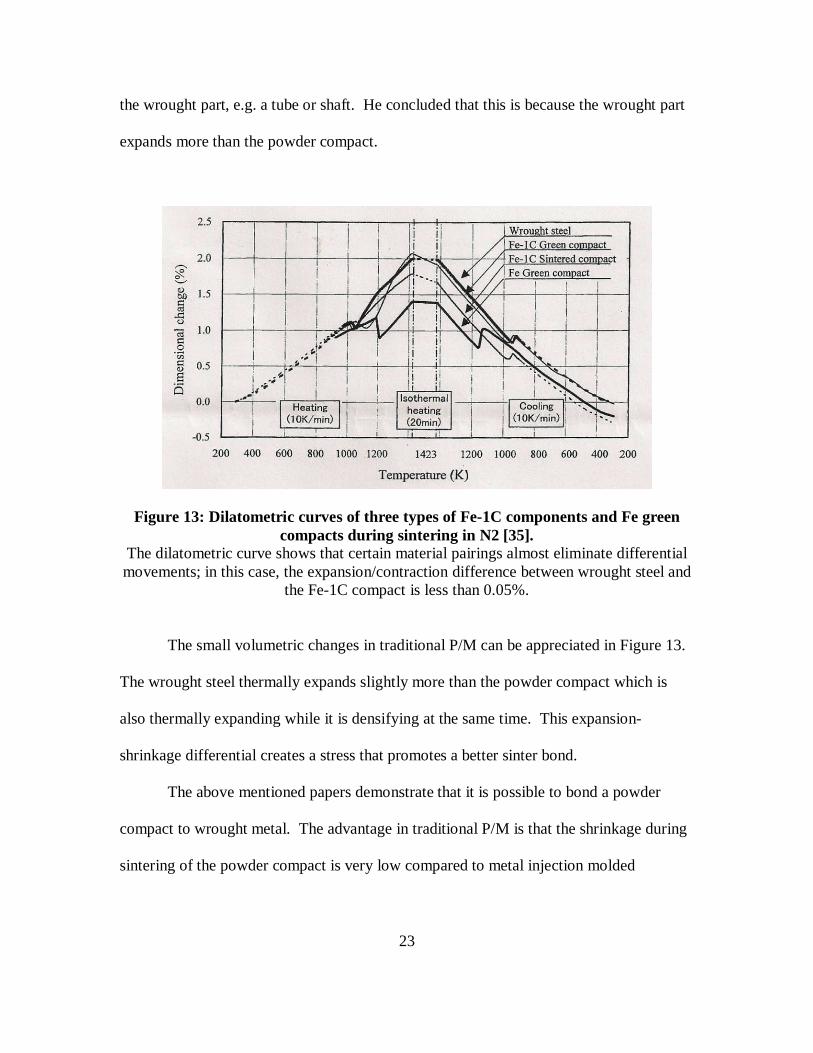
Figure 13: Dilatometric curves of three types of Fe-1C components and Fe green compacts during sintering in N2 [35].
The dilatometric curve shows that certain material pairings almost eliminate differential movements; in this case, the expansion/contraction difference between wrought steel and
the Fe-1C compact is less than 0.05%.
The small volumetric changes in traditional P/M can be appreciated in Figure 13.
The wrought steel thermally expands slightly more than the powder compact which is
also thermally expanding while it is densifying at the same time. This expansion-
shrinkage differential creates a stress that promotes a better sinter bond.
The above mentioned papers demonstrate that it is possible to bond a powder
compact to wrought metal. The advantage in traditional P/M is that the shrinkage during
sintering of the powder compact is very low compared to metal injection molded
24
compacts. For die-compacted ferrous alloys, a common net change may be less than 0.1%
[36].
2.1.3. Sinter bonding in metal inject ion molding
In the field of metal injection molding, so far there has only been work published
regarding bonding of green components, either by assembling previously injected
compacts or by injecting the components simultaneously or successively directly onto
each other. A first paper was published by Miura [37], where he evaluated the influence
of the debinding methods. He assembled previously injected compacts, and debound and
sintered the assemblies. This work was the foundation to more research in the area of
sinter joining MIM parts. In a later paper [38] he also evaluated the tensile strength of
the bond.
25
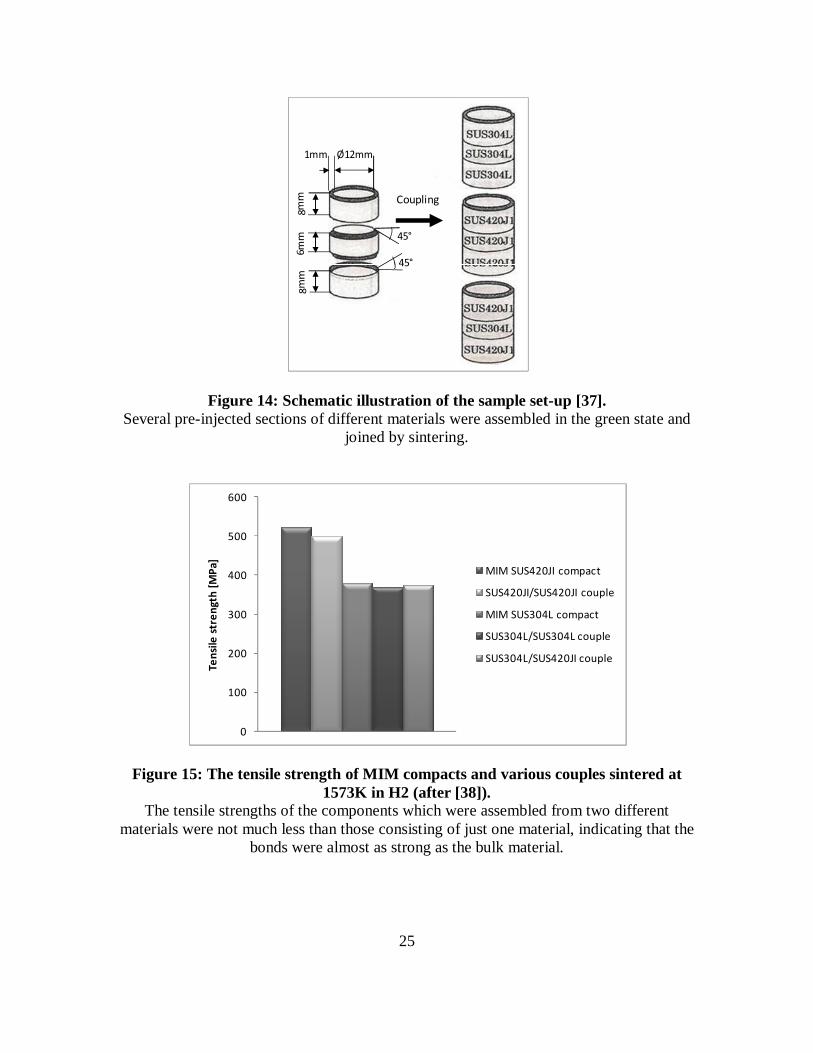
Figure 14: Schematic illustration of the sample set-up [37]. Several pre-injected sections of different materials were assembled in the green state and
joined by sintering.
Figure 15: The tensile strength of MIM compacts and various couples sintered at 1573K in H2 (after [38]).
The tensile strengths of the components which were assembled from two different materials were not much less than those consisting of just one material, indicating that the
bonds were almost as strong as the bulk material.
8mm
8mm
6mm
Ø12mm1mm
45°
45°
Coupling
0
100
200
300
400
500
600
Tens
ile st
reng
th [M
Pa]
MIM SUS420JI compactSUS420JI/SUS420JI coupleMIM SUS304L compactSUS304L/SUS304L coupleSUS304L/SUS420JI couple
26
Miura compared the strength of tube shaped injection molded compacts with
those that were assembled from tube shaped injection molded compacts. These were
either made of one type of steel (SUS420J/SUS420J) or two different steels
(SUS304L/SUS420J), see the set-up in Figure 14. Miura showed that the bond strength
of the compact assemblies was the almost the same as that of the parts that were injected
as one, as can be seen in Figure 15.
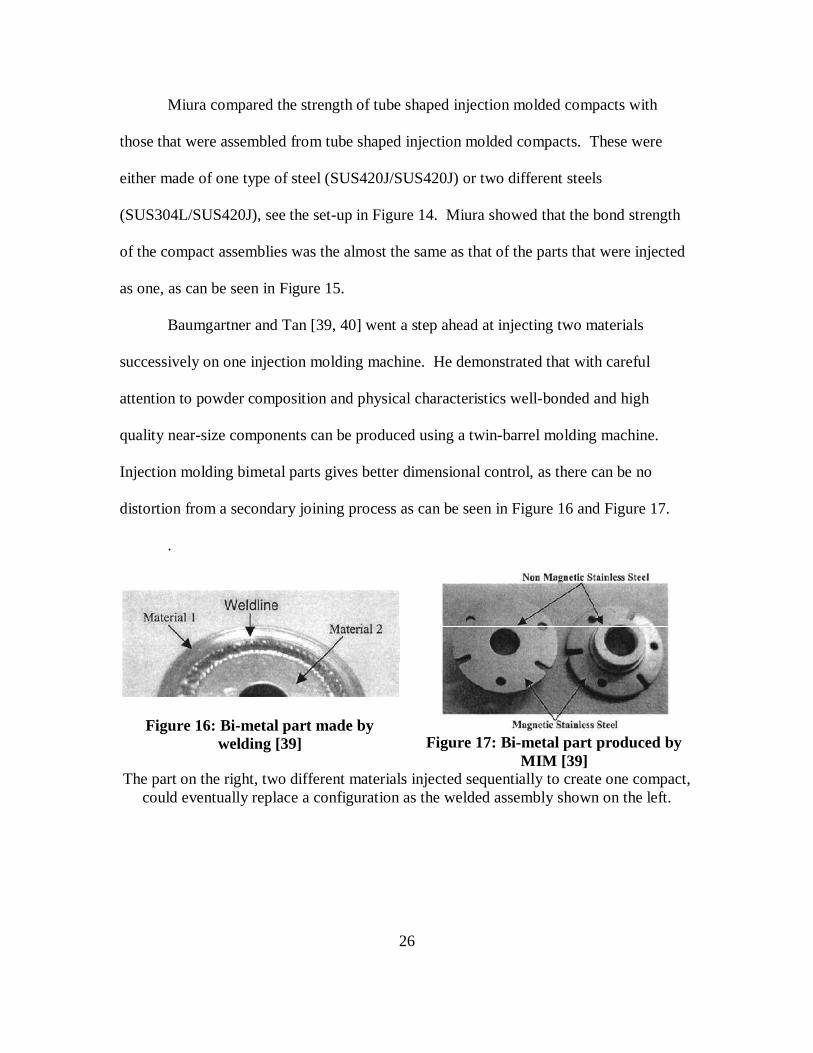
Baumgartner and Tan [39, 40] went a step ahead at injecting two materials
successively on one injection molding machine. He demonstrated that with careful
attention to powder composition and physical characteristics well-bonded and high
quality near-size components can be produced using a twin-barrel molding machine.
Injection molding bimetal parts gives better dimensional control, as there can be no
distortion from a secondary joining process as can be seen in Figure 16 and Figure 17.
.
Figure 16: Bi-metal part made by welding [39]
Figure 17: Bi-metal part produced by
MIM [39] The part on the right, two different materials injected sequentially to create one compact,
could eventually replace a configuration as the welded assembly shown on the left.
27
Insert injection molding of a hard material (SUS420J) onto a stainless steel
(SUS316L) was evaluated by Harikou [41]. This process would be especially helpful to
manufacture machine tools. Harikou achieved high bond strength and hardness, which he
improved though heat treatment.
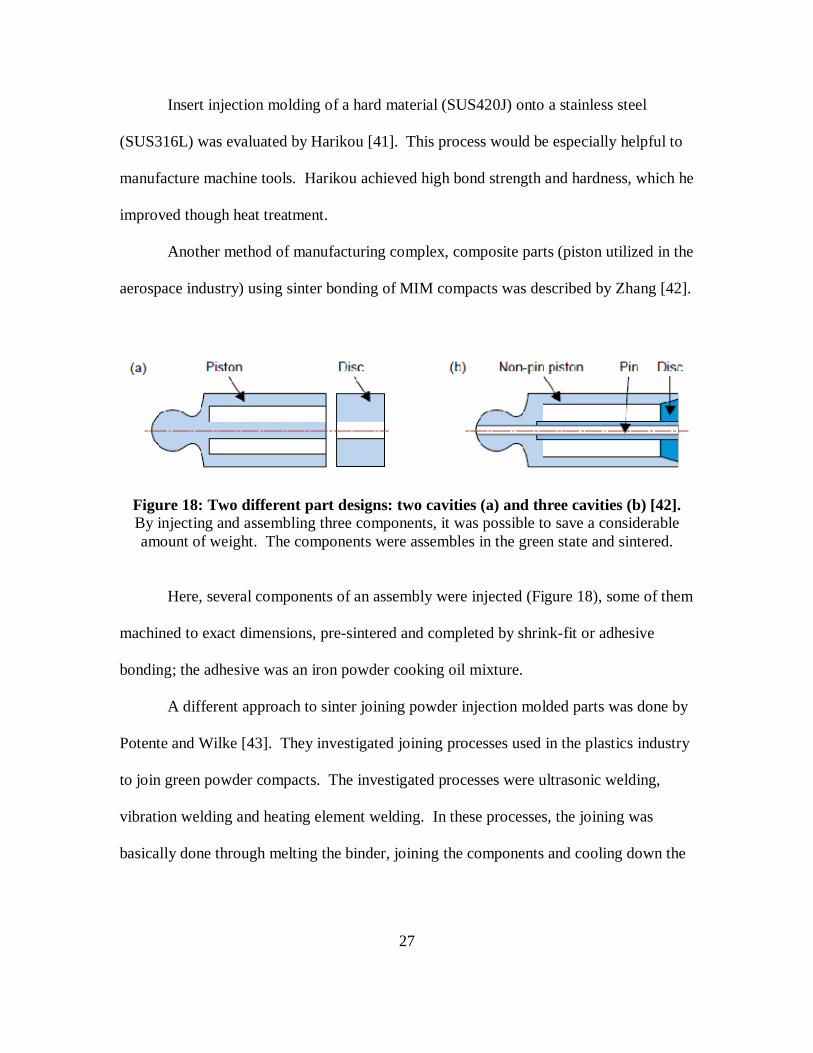
Another method of manufacturing complex, composite parts (piston utilized in the
aerospace industry) using sinter bonding of MIM compacts was described by Zhang [42].
Figure 18: Two different part designs: two cavities (a) and three cavities (b) [42]. By injecting and assembling three components, it was possible to save a considerable amount of weight. The components were assembles in the green state and sintered.
Here, several components of an assembly were injected (Figure 18), some of them
machined to exact dimensions, pre-sintered and completed by shrink-fit or adhesive
bonding; the adhesive was an iron powder cooking oil mixture.
A different approach to sinter joining powder injection molded parts was done by
Potente and Wilke [43]. They investigated joining processes used in the plastics industry
to join green powder compacts. The investigated processes were ultrasonic welding,
vibration welding and heating element welding. In these processes, the joining was
basically done through melting the binder, joining the components and cooling down the
28
part. They obtained good results, being able to create complex assemblies of green parts
which were subsequently co-sintered.
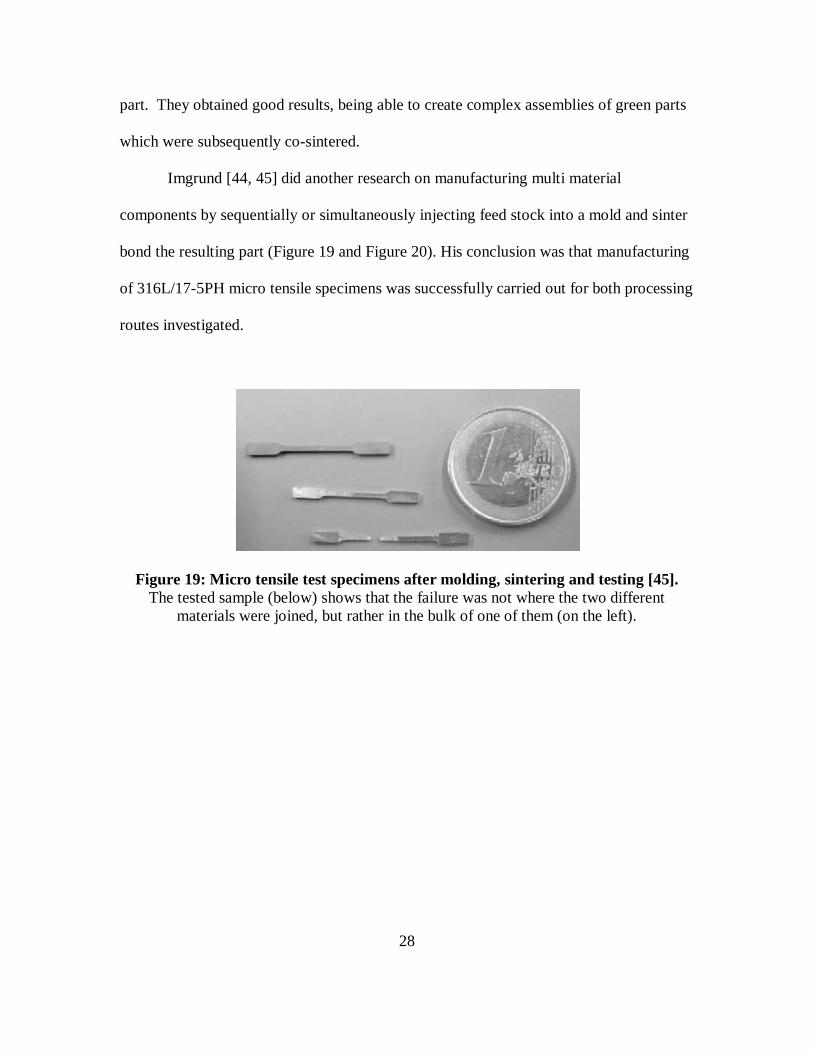
Imgrund [44, 45] did another research on manufacturing multi material
components by sequentially or simultaneously injecting feed stock into a mold and sinter
bond the resulting part (Figure 19 and Figure 20). His conclusion was that manufacturing
of 316L/17-5PH micro tensile specimens was successfully carried out for both processing
routes investigated.
Figure 19: Micro tensile test specimens after molding, sintering and testing [45]. The tested sample (below) shows that the failure was not where the two different
materials were joined, but rather in the bulk of one of them (on the left).
29
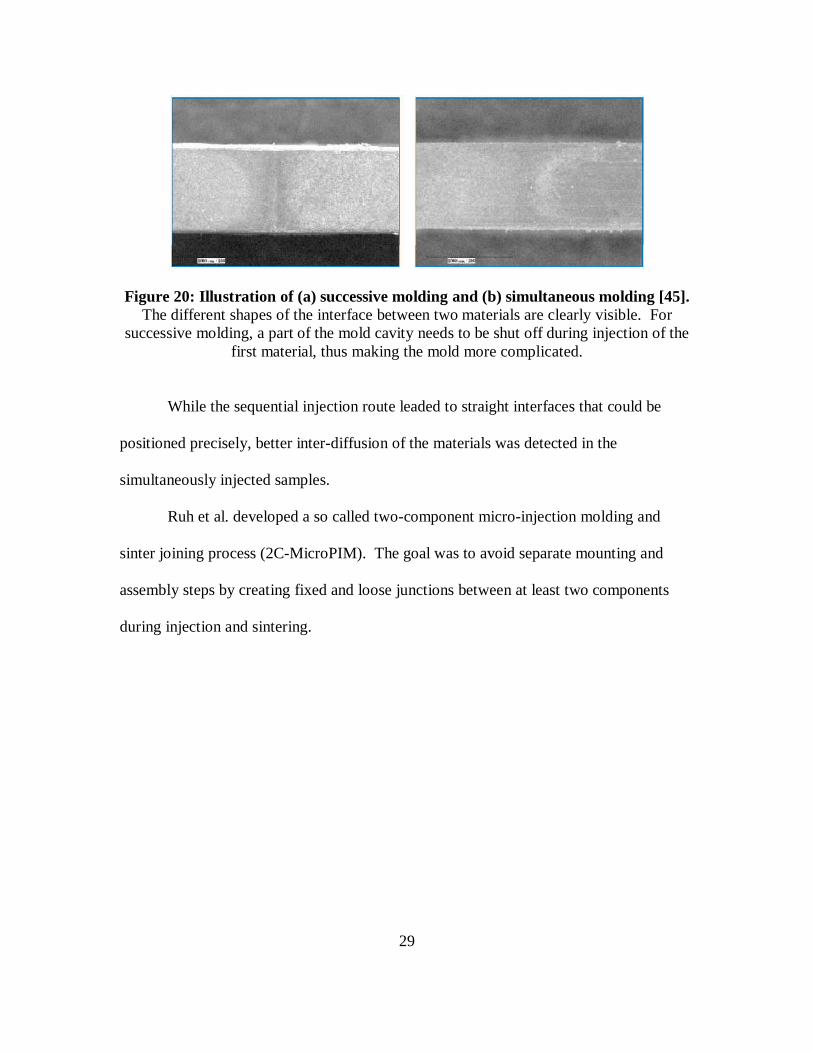
Figure 20: Illustration of (a) successive molding and (b) simultaneous molding [45]. The different shapes of the interface between two materials are clearly visible. For
successive molding, a part of the mold cavity needs to be shut off during injection of the first material, thus making the mold more complicated.
While the sequential injection route leaded to straight interfaces that could be
positioned precisely, better inter-diffusion of the materials was detected in the
simultaneously injected samples.
Ruh et al. developed a so called two-component micro-injection molding and
sinter joining process (2C-MicroPIM). The goal was to avoid separate mounting and
assembly steps by creating fixed and loose junctions between at least two components
during injection and sintering.
30
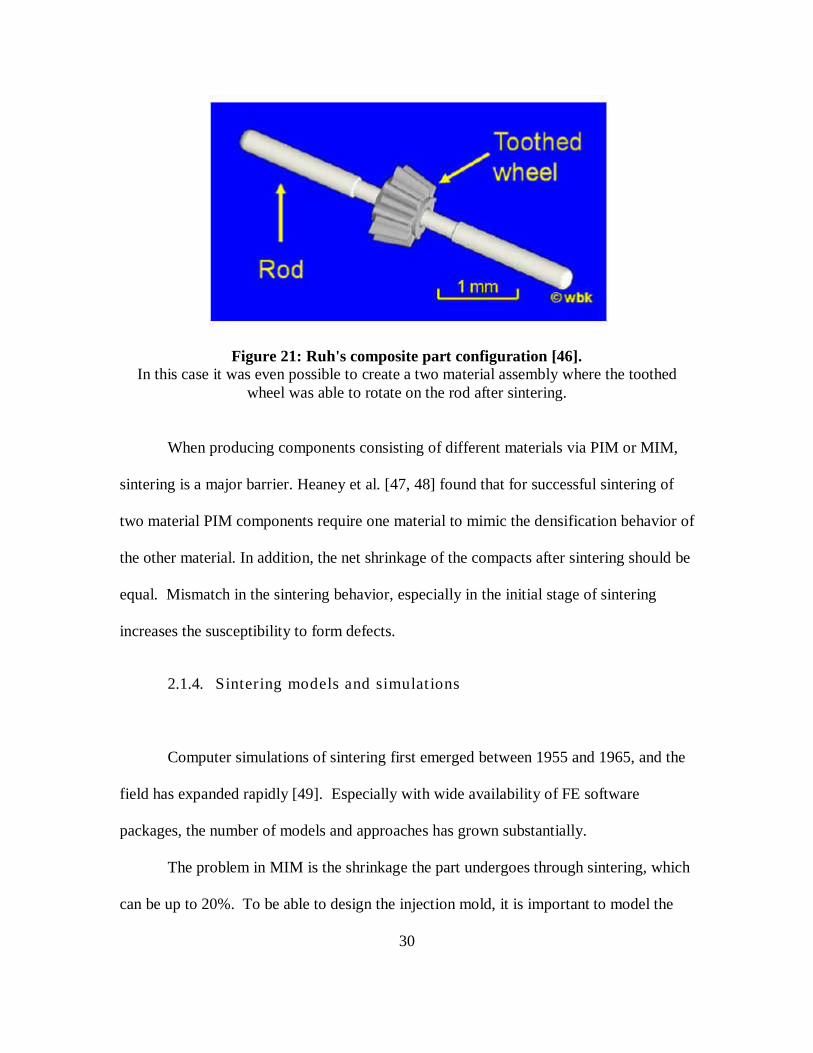
Figure 21: Ruh's composite part configuration [46]. In this case it was even possible to create a two material assembly where the toothed
wheel was able to rotate on the rod after sintering.
When producing components consisting of different materials via PIM or MIM,
sintering is a major barrier. Heaney et al. [47, 48] found that for successful sintering of
two material PIM components require one material to mimic the densification behavior of
the other material. In addition, the net shrinkage of the compacts after sintering should be
equal. Mismatch in the sintering behavior, especially in the initial stage of sintering
increases the susceptibility to form defects.
2.1.4. Sintering models and simulat ions
Computer simulations of sintering first emerged between 1955 and 1965, and the
field has expanded rapidly [49]. Especially with wide availability of FE software
packages, the number of models and approaches has grown substantially.
The problem in MIM is the shrinkage the part undergoes through sintering, which
can be up to 20%. To be able to design the injection mold, it is important to model the
31
final shape of the part. Part and material properties are generally assumed to be
isotropically [50]. This is in reality not the case [51] and gravity, friction or other
constraints can introduce shape distortions during the sintering process.
Reiterer and Ewsuk [52] compare four different sintering models. The models
compared by Reiterer and Ewsuk are:
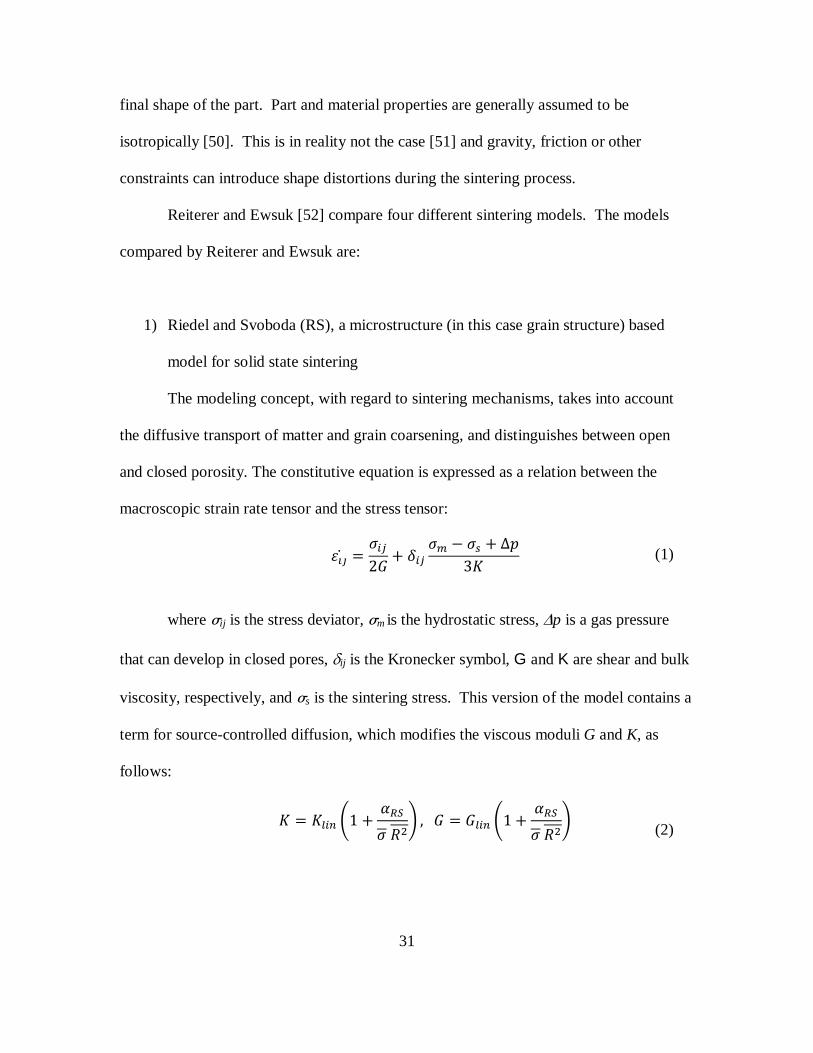
1) Riedel and Svoboda (RS), a microstructure (in this case grain structure) based
model for solid state sintering
The modeling concept, with regard to sintering mechanisms, takes into account
the diffusive transport of matter and grain coarsening, and distinguishes between open
and closed porosity. The constitutive equation is expressed as a relation between the
macroscopic strain rate tensor and the stress tensor:
���� � ���2� � ��� �� �� � ∆�3 (1)
where σij is the stress deviator, σm is the hydrostatic stress, ∆p is a gas pressure
that can develop in closed pores, δij is the Kronecker symbol, G and K are shear and bulk
viscosity, respectively, and σs is the sintering stress. This version of the model contains a
term for source-controlled diffusion, which modifies the viscous moduli G and K, as
follows:
� ��� �1 � �� ��� , � � ���� �1 � �� ���
(2)
32
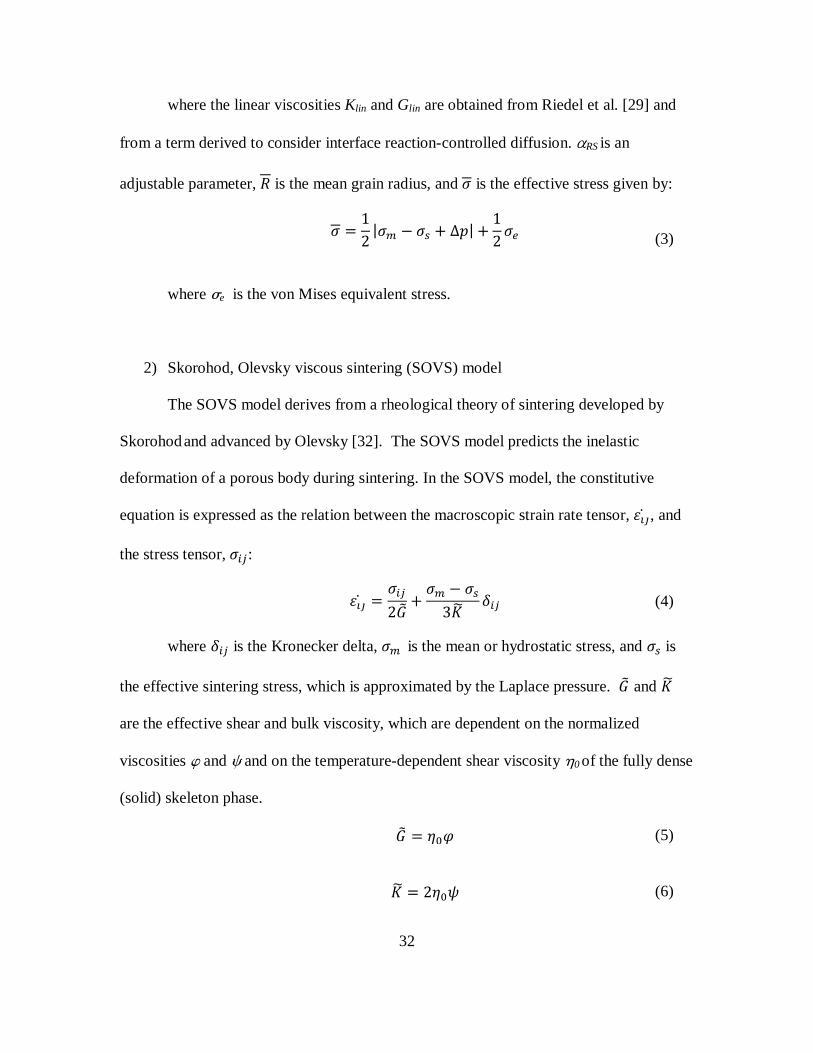
where the linear viscosities Klin and Glin are obtained from Riedel et al. [29] and
from a term derived to consider interface reaction-controlled diffusion. αRS is an
adjustable parameter, � is the mean grain radius, and � is the effective stress given by:
� � 12 |�� �� � ∆�| � 12�� (3)
where σe is the von Mises equivalent stress.
2) Skorohod, Olevsky viscous sintering (SOVS) model
The SOVS model derives from a rheological theory of sintering developed by
Skorohod and advanced by Olevsky [32]. The SOVS model predicts the inelastic
deformation of a porous body during sintering. In the SOVS model, the constitutive
equation is expressed as the relation between the macroscopic strain rate tensor, ���� , and
the stress tensor, ���: ���� � ���2�� � �� ��3 � ��� (4)
where ��� is the Kronecker delta, �� is the mean or hydrostatic stress, and �� is
the effective sintering stress, which is approximated by the Laplace pressure. �� and �
are the effective shear and bulk viscosity, which are dependent on the normalized
viscosities ϕ and ψ and on the temperature-dependent shear viscosity η0 of the fully dense
(solid) skeleton phase.
�� � � � (5)
� � 2� � (6)
33
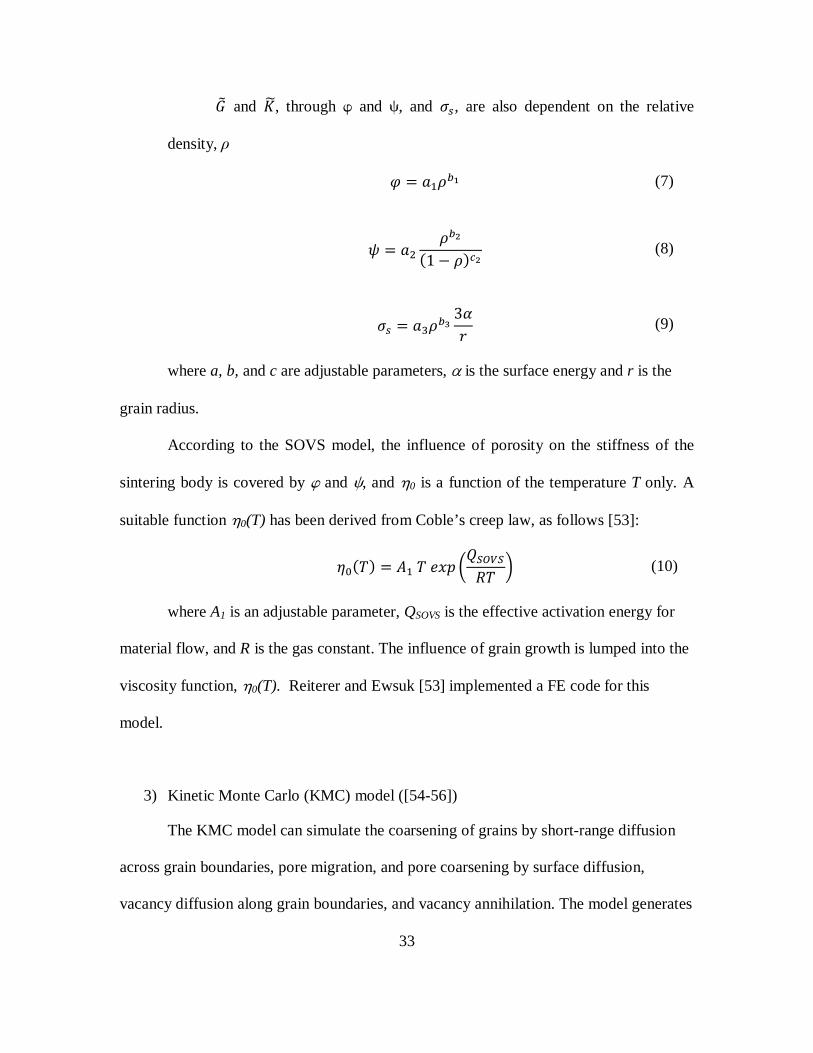
�� and �, through ϕ and ψ, and ��, are also dependent on the relative
density, ρ
� � ����� (7)
� � �� ����1 ���� (8)
�� � ����� 3�� (9)
where a, b, and c are adjustable parameters, α is the surface energy and r is the
grain radius.
According to the SOVS model, the influence of porosity on the stiffness of the
sintering body is covered by ϕ and ψ, and η0 is a function of the temperature T only. A
suitable function η0(T) has been derived from Coble’s creep law, as follows [53]:
� � � � !� "#� $%��� & (10)
where A1 is an adjustable parameter, QSOVS is the effective activation energy for
material flow, and R is the gas constant. The influence of grain growth is lumped into the
viscosity function, η0(T). Reiterer and Ewsuk [53] implemented a FE code for this
model.
3) Kinetic Monte Carlo (KMC) model ([54-56])
The KMC model can simulate the coarsening of grains by short-range diffusion
across grain boundaries, pore migration, and pore coarsening by surface diffusion,
vacancy diffusion along grain boundaries, and vacancy annihilation. The model generates
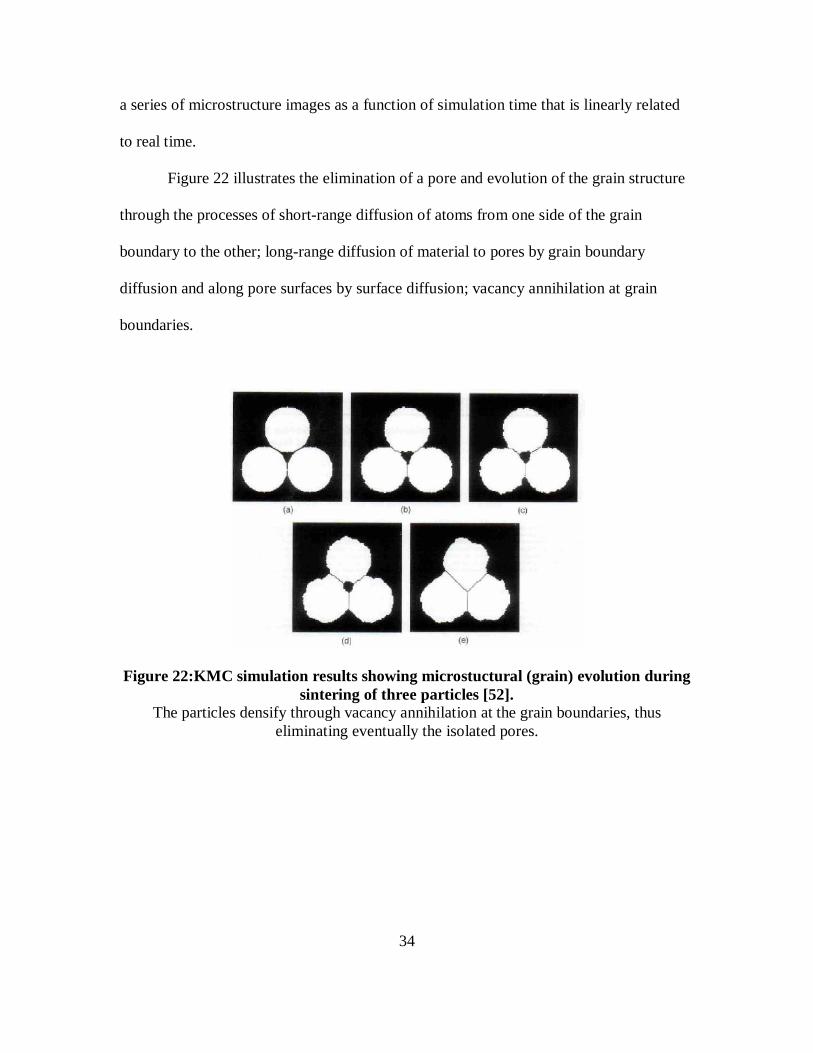
34
a series of microstructure images as a function of simulation time that is linearly related
to real time.
Figure 22 illustrates the elimination of a pore and evolution of the grain structure
through the processes of short-range diffusion of atoms from one side of the grain
boundary to the other; long-range diffusion of material to pores by grain boundary
diffusion and along pore surfaces by surface diffusion; vacancy annihilation at grain
boundaries.
Figure 22:KMC simulation results showing microstuctural (grain) evolution during sintering of three particles [52].
The particles densify through vacancy annihilation at the grain boundaries, thus eliminating eventually the isolated pores.
35
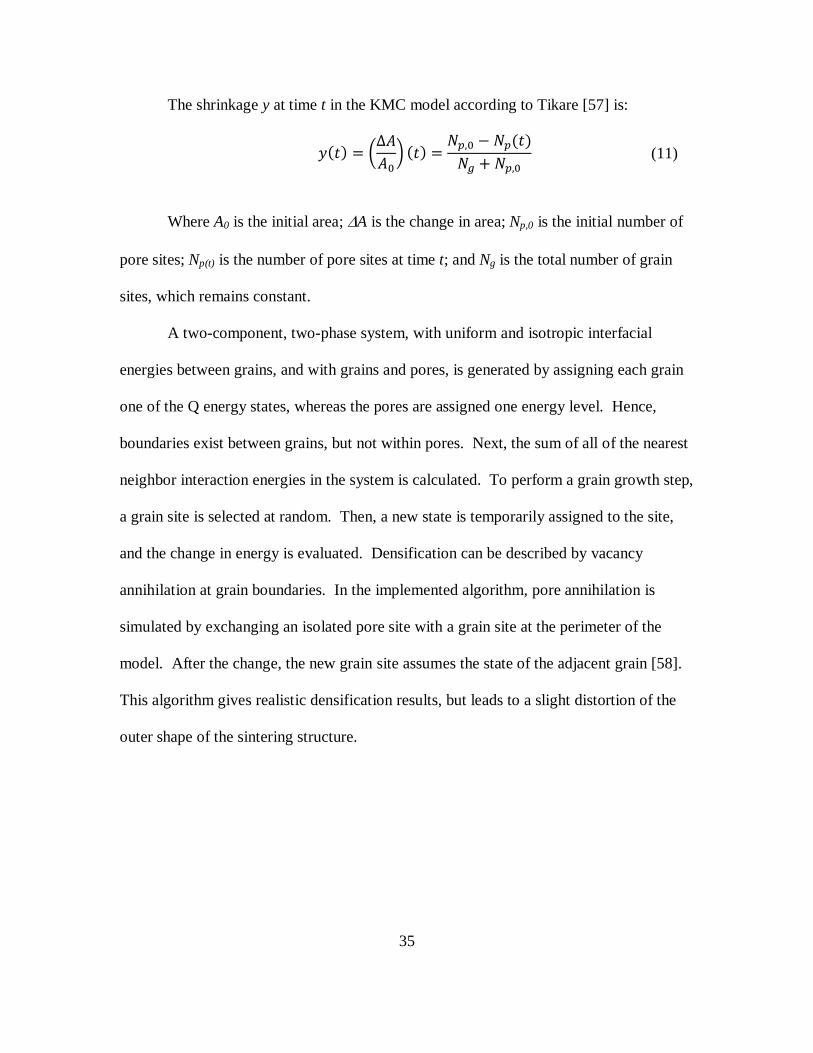
The shrinkage y at time t in the KMC model according to Tikare [57] is:
'�(� � $Δ!! & �(� � *�, *��(�*� � *�,
(11)
Where A0 is the initial area; ∆A is the change in area; Np,0 is the initial number of
pore sites; Np(t) is the number of pore sites at time t; and Ng is the total number of grain
sites, which remains constant.
A two-component, two-phase system, with uniform and isotropic interfacial
energies between grains, and with grains and pores, is generated by assigning each grain
one of the Q energy states, whereas the pores are assigned one energy level. Hence,
boundaries exist between grains, but not within pores. Next, the sum of all of the nearest
neighbor interaction energies in the system is calculated. To perform a grain growth step,
a grain site is selected at random. Then, a new state is temporarily assigned to the site,
and the change in energy is evaluated. Densification can be described by vacancy
annihilation at grain boundaries. In the implemented algorithm, pore annihilation is
simulated by exchanging an isolated pore site with a grain site at the perimeter of the
model. After the change, the new grain site assumes the state of the adjacent grain [58].
This algorithm gives realistic densification results, but leads to a slight distortion of the
outer shape of the sintering structure.
36
4) Master sintering curve (MSC) model,
The basis of the MSC approach is that it is supposed that identical samples
sintered to the same density, even with different time–temperature sintering profiles, will
have the same microstructure, including the same average grain size. Since this approach
will be used in this research, it will be reviewed in more depth below.
Reiterer and Ewsuk conclude that based on the extensive published literature on
Monte Carlo simulations, the KMC seems to have the greatest potential for providing
improved understanding and control of micro[grain]structure evolution as it relates to
mesostructure. The RS and the MSC have the greatest potential to allow the user to
quickly understand and control the effects of processing conditions with minimal testing.
The SOVS and RS models, which are implemented as subroutines in finite element
codes, can readily be used to predict final dimensions and density distributions, including
those induced by green density variations or gravity, and in complex shape components.
2.1.5. The MSC model
With the Master-Sintering-Curve (MSC),originally defined by Su and Johnson
[59], approach, the densification behavior of a powder compact can be predicted under
arbitrary temperature-time excursions following a minimal set of preliminary
experiments. Once obtained, the MSC can be used to predict sintering results. The
advantage of the MSC approach is that it delivers results fast. Of course, the MSC can be
applied only to powder compacts made from the same powder and by the same green-
37
body processing. Different powders and green-body processes result in differences in
particle size, particle-size distribution, initial pore-size distribution, packing properties,
and green density. These quantities affect densification behavior [60, 61].
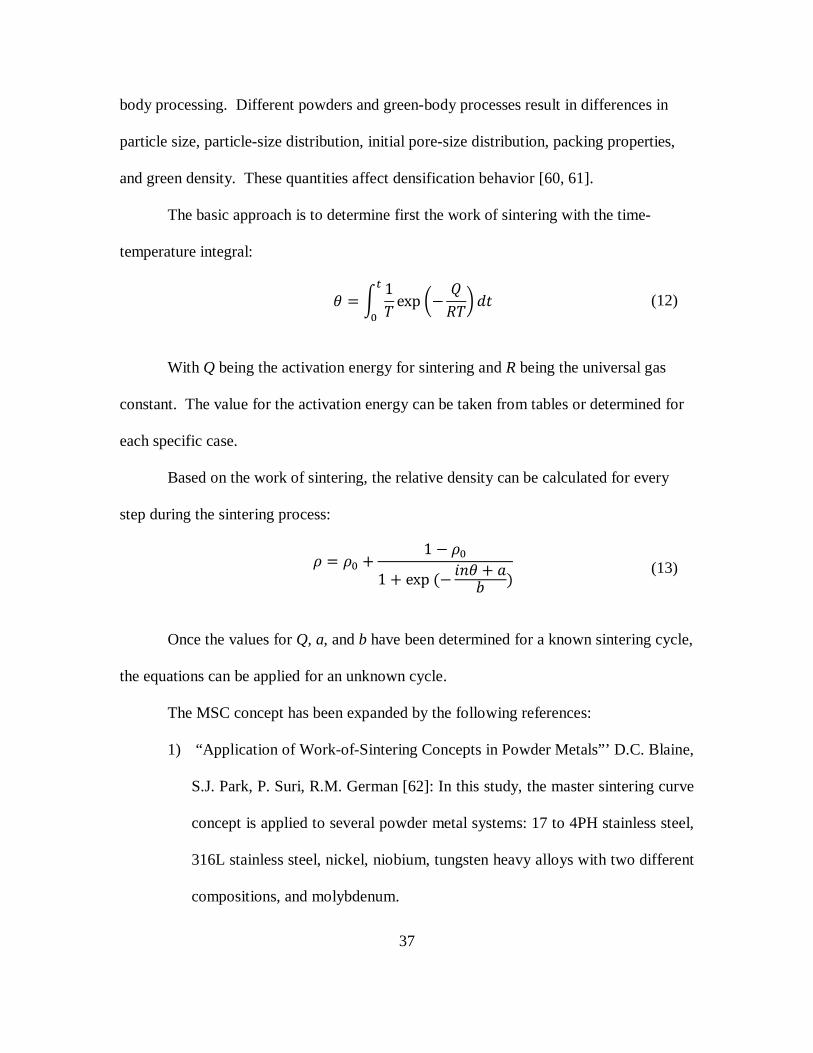
The basic approach is to determine first the work of sintering with the time-
temperature integral:
+ � , 1 exp $ %� &0(�
(12)
With Q being the activation energy for sintering and R being the universal gas
constant. The value for the activation energy can be taken from tables or determined for
each specific case.
Based on the work of sintering, the relative density can be calculated for every
step during the sintering process:
� � � � 1 � 1 � exp � 12+ � �3 � (13)
Once the values for Q, a, and b have been determined for a known sintering cycle,
the equations can be applied for an unknown cycle.
The MSC concept has been expanded by the following references:
1) “Application of Work-of-Sintering Concepts in Powder Metals”’ D.C. Blaine,
S.J. Park, P. Suri, R.M. German [62]: In this study, the master sintering curve
concept is applied to several powder metal systems: 17 to 4PH stainless steel,
316L stainless steel, nickel, niobium, tungsten heavy alloys with two different
compositions, and molybdenum.
38
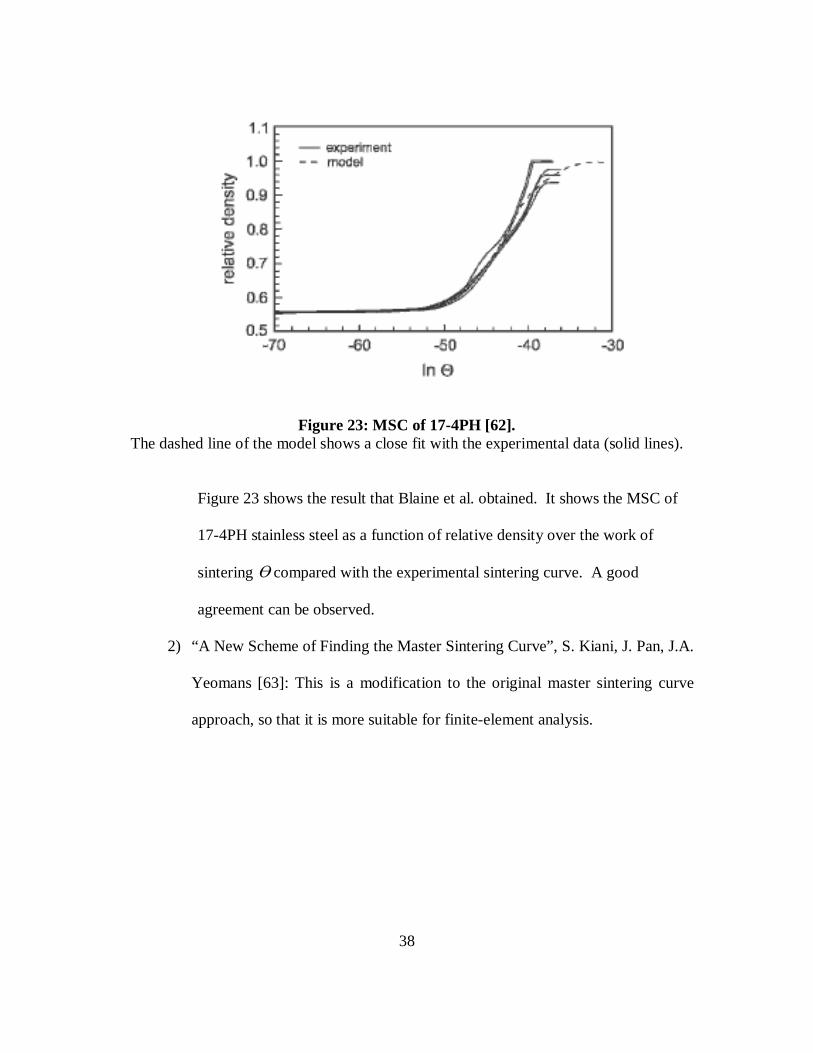
Figure 23: MSC of 17-4PH [62]. The dashed line of the model shows a close fit with the experimental data (solid lines).
Figure 23 shows the result that Blaine et al. obtained. It shows the MSC of
17-4PH stainless steel as a function of relative density over the work of
sintering � compared with the experimental sintering curve. A good
agreement can be observed.
2) “A New Scheme of Finding the Master Sintering Curve”, S. Kiani, J. Pan, J.A.
Yeomans [63]: This is a modification to the original master sintering curve
approach, so that it is more suitable for finite-element analysis.
39
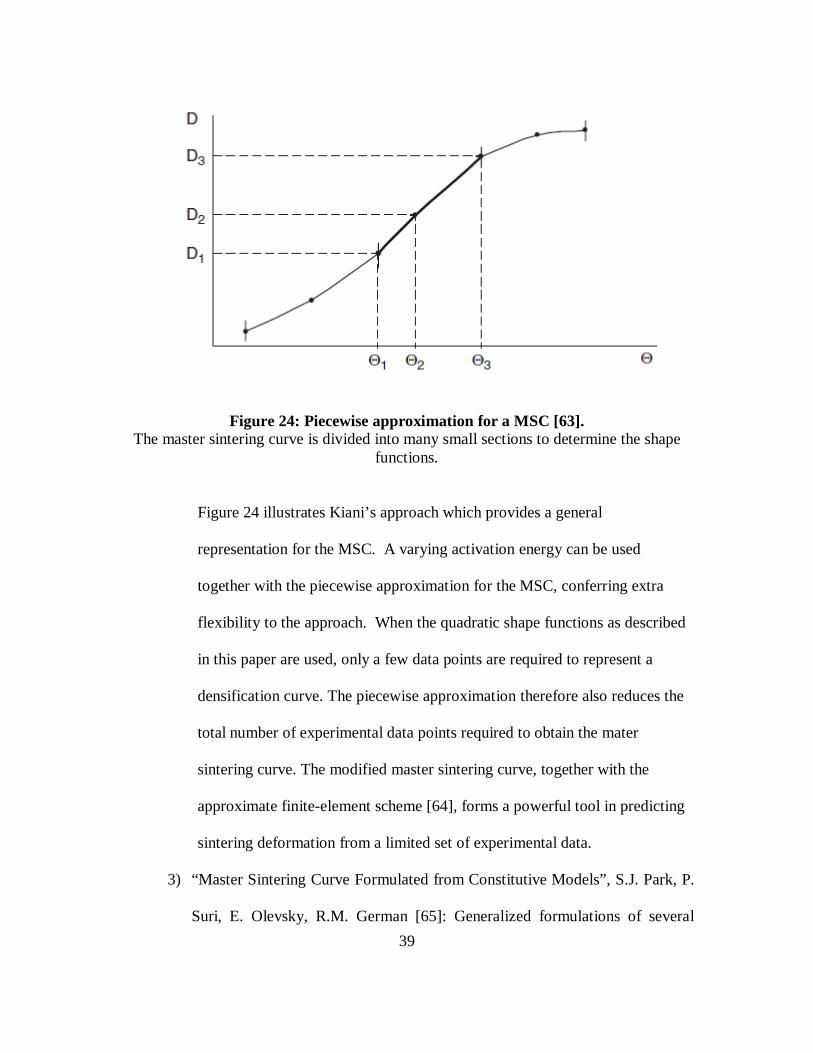
Figure 24: Piecewise approximation for a MSC [63]. The master sintering curve is divided into many small sections to determine the shape
functions.
Figure 24 illustrates Kiani’s approach which provides a general
representation for the MSC. A varying activation energy can be used
together with the piecewise approximation for the MSC, conferring extra
flexibility to the approach. When the quadratic shape functions as described
in this paper are used, only a few data points are required to represent a
densification curve. The piecewise approximation therefore also reduces the
total number of experimental data points required to obtain the mater
sintering curve. The modified master sintering curve, together with the
approximate finite-element scheme [64], forms a powerful tool in predicting
sintering deformation from a limited set of experimental data.
3) “Master Sintering Curve Formulated from Constitutive Models”, S.J. Park, P.
Suri, E. Olevsky, R.M. German [65]: Generalized formulations of several
40
constitutive equations including both grain growth and densification are
developed using the concepts of MSC. The developed MSC models can be
applied to obtain material properties for the finite-element method simulation
and evaluate the effect of compaction pressure, phase change, grain growth,
and composition on densification, to classify regions having different sintering
mechanism, and to help engineer design, optimize, and monitor sintering
cycles.
4) “Linearization of Master Sintering Curve”, D.C. Blaine, S.J. Park, R.M.
German [66]: In this work, the sigmoid form of the MSC is linearized by
relating the natural logarithm of the work of sintering to the densification
parameter. Linearization of the MSC simplifies the characterization of the
model parameters.
5) “Master Sintering Curve for a Two-Phase Material”’ D.C. Blaine, R.M.
German [67]: A new two-phase master sintering curve model for sintering
densification of gas-atomized 17-4PH stainless steel, with consideration of δ-
ferrite content, is developed. A phase transition from α-austenite to δ-ferrite
starts at 1200°C in 17-4PH stainless steel, changing the rate of densification
during sintering from this point on.
41
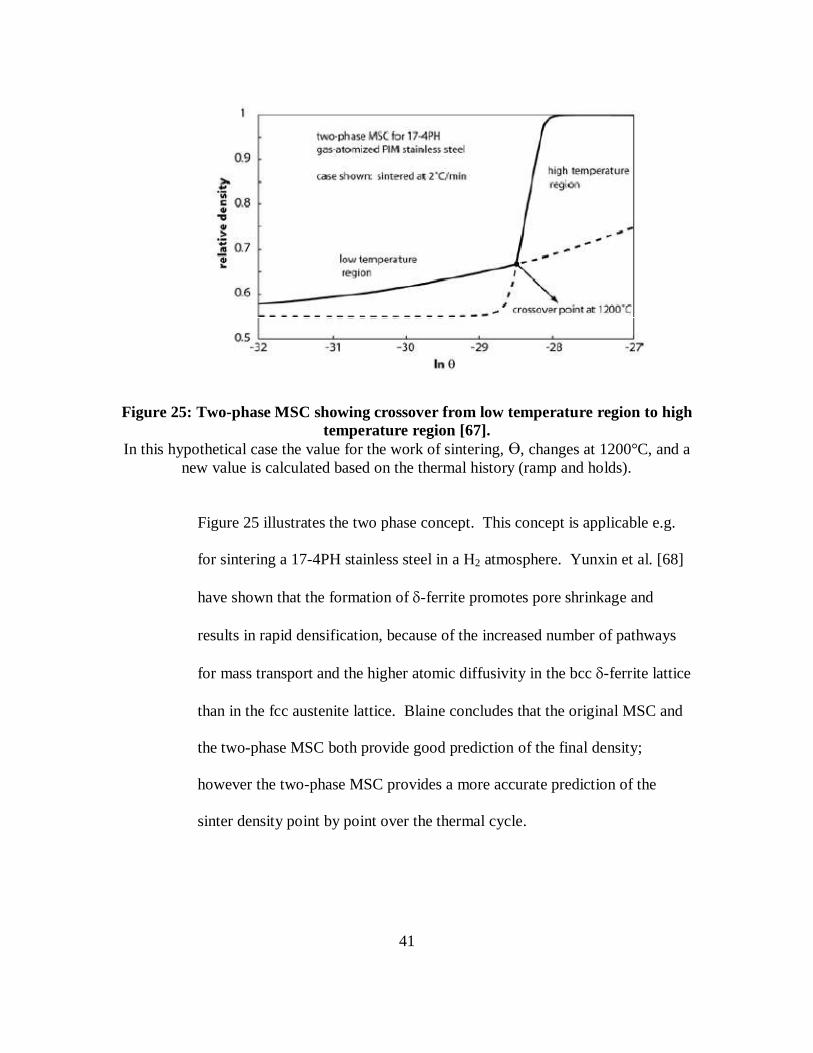
Figure 25: Two-phase MSC showing crossover from low temperature region to high temperature region [67].
In this hypothetical case the value for the work of sintering, �, changes at 1200°C, and a new value is calculated based on the thermal history (ramp and holds).
Figure 25 illustrates the two phase concept. This concept is applicable e.g.
for sintering a 17-4PH stainless steel in a H2 atmosphere. Yunxin et al. [68]
have shown that the formation of δ-ferrite promotes pore shrinkage and
results in rapid densification, because of the increased number of pathways
for mass transport and the higher atomic diffusivity in the bcc δ-ferrite lattice
than in the fcc austenite lattice. Blaine concludes that the original MSC and
the two-phase MSC both provide good prediction of the final density;
however the two-phase MSC provides a more accurate prediction of the
sinter density point by point over the thermal cycle.
42
2.2. Previous work
Based on the experiences in traditional P/M, as well as in metal injection molding,
it seemed reasonable to conduct trials on the possibilities of sinter bonding MIM
components to solid metal.
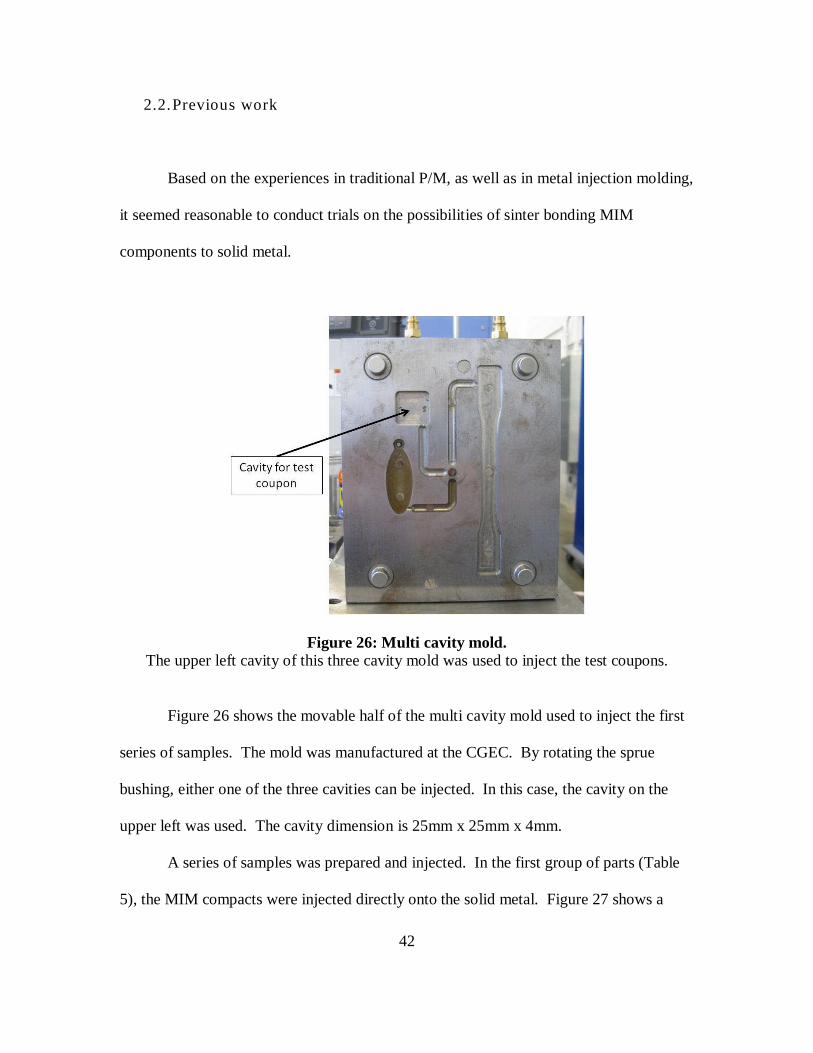
Figure 26: Multi cavity mold. The upper left cavity of this three cavity mold was used to inject the test coupons.
Figure 26 shows the movable half of the multi cavity mold used to inject the first
series of samples. The mold was manufactured at the CGEC. By rotating the sprue
bushing, either one of the three cavities can be injected. In this case, the cavity on the
upper left was used. The cavity dimension is 25mm x 25mm x 4mm.
A series of samples was prepared and injected. In the first group of parts (Table
5), the MIM compacts were injected directly onto the solid metal. Figure 27 shows a
43
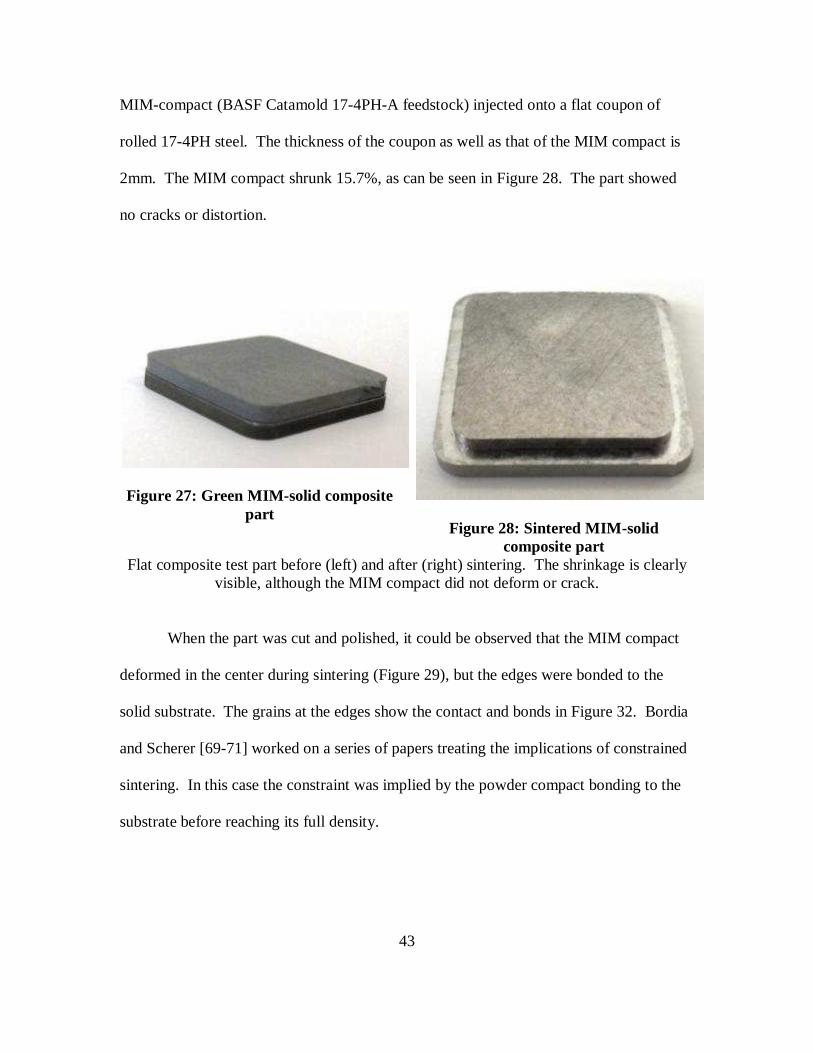
MIM-compact (BASF Catamold 17-4PH-A feedstock) injected onto a flat coupon of
rolled 17-4PH steel. The thickness of the coupon as well as that of the MIM compact is
2mm. The MIM compact shrunk 15.7%, as can be seen in Figure 28. The part showed
no cracks or distortion.
Figure 27: Green MIM-solid composite part
Figure 28: Sintered MIM-solid composite part
Flat composite test part before (left) and after (right) sintering. The shrinkage is clearly visible, although the MIM compact did not deform or crack.
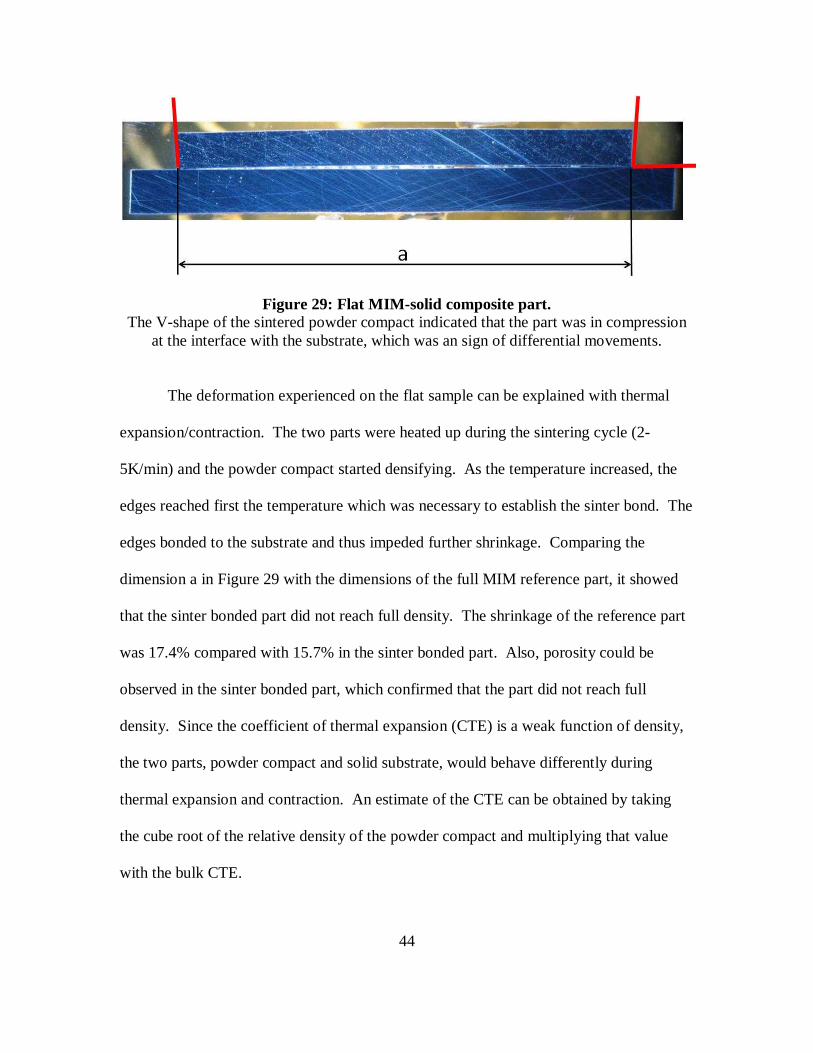
When the part was cut and polished, it could be observed that the MIM compact
deformed in the center during sintering (Figure 29), but the edges were bonded to the
solid substrate. The grains at the edges show the contact and bonds in Figure 32. Bordia
and Scherer [69-71] worked on a series of papers treating the implications of constrained
sintering. In this case the constraint was implied by the powder compact bonding to the
substrate before reaching its full density.
44
Figure 29: Flat MIM-solid composite part. The V-shape of the sintered powder compact indicated that the part was in compression
at the interface with the substrate, which was an sign of differential movements.
The deformation experienced on the flat sample can be explained with thermal
expansion/contraction. The two parts were heated up during the sintering cycle (2-
5K/min) and the powder compact started densifying. As the temperature increased, the
edges reached first the temperature which was necessary to establish the sinter bond. The
edges bonded to the substrate and thus impeded further shrinkage. Comparing the
dimension a in Figure 29 with the dimensions of the full MIM reference part, it showed
that the sinter bonded part did not reach full density. The shrinkage of the reference part
was 17.4% compared with 15.7% in the sinter bonded part. Also, porosity could be
observed in the sinter bonded part, which confirmed that the part did not reach full
density. Since the coefficient of thermal expansion (CTE) is a weak function of density,
the two parts, powder compact and solid substrate, would behave differently during
thermal expansion and contraction. An estimate of the CTE can be obtained by taking
the cube root of the relative density of the powder compact and multiplying that value
with the bulk CTE.
45
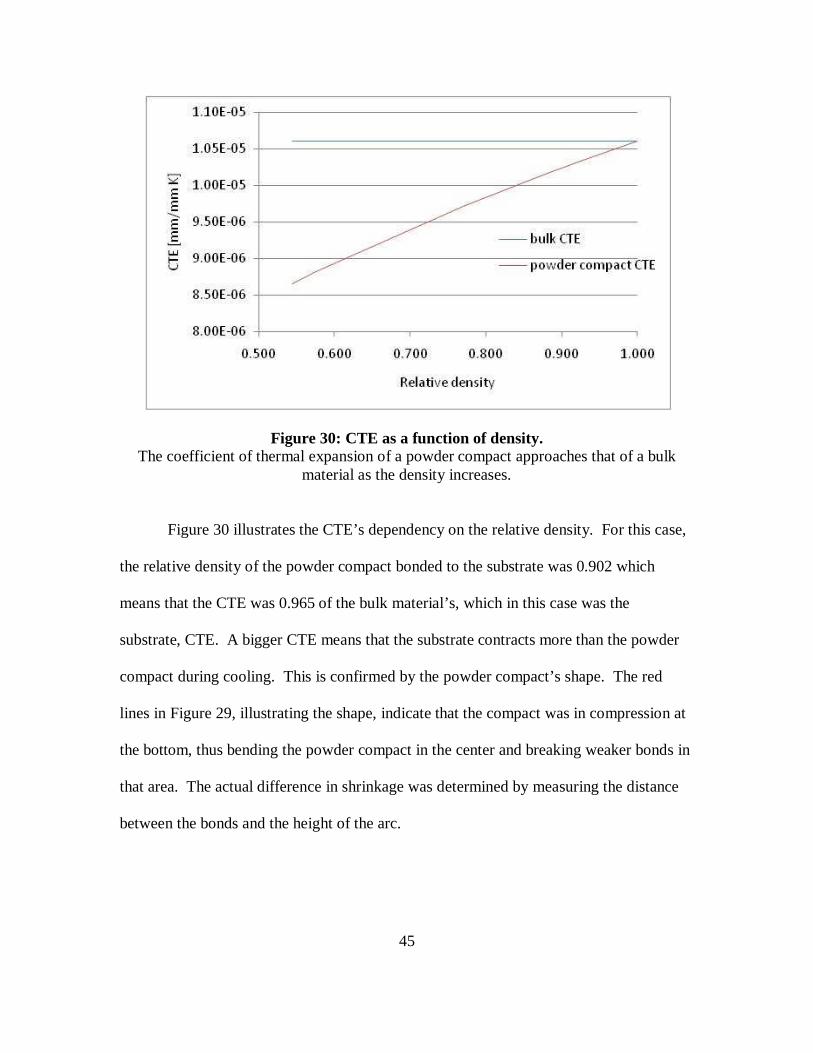
Figure 30: CTE as a function of density. The coefficient of thermal expansion of a powder compact approaches that of a bulk
material as the density increases.
Figure 30 illustrates the CTE’s dependency on the relative density. For this case,
the relative density of the powder compact bonded to the substrate was 0.902 which
means that the CTE was 0.965 of the bulk material’s, which in this case was the
substrate, CTE. A bigger CTE means that the substrate contracts more than the powder
compact during cooling. This is confirmed by the powder compact’s shape. The red
lines in Figure 29, illustrating the shape, indicate that the compact was in compression at
the bottom, thus bending the powder compact in the center and breaking weaker bonds in
that area. The actual difference in shrinkage was determined by measuring the distance
between the bonds and the height of the arc.
46
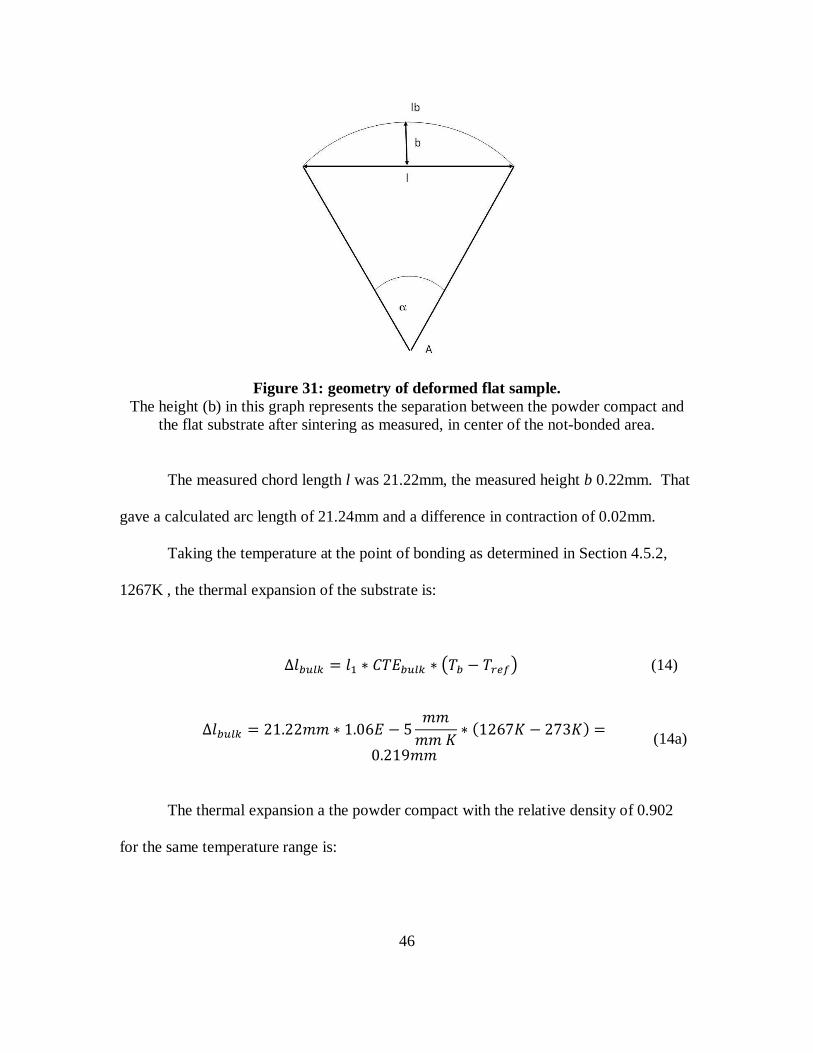
Figure 31: geometry of deformed flat sample. The height (b) in this graph represents the separation between the powder compact and
the flat substrate after sintering as measured, in center of the not-bonded area.
The measured chord length l was 21.22mm, the measured height b 0.22mm. That
gave a calculated arc length of 21.24mm and a difference in contraction of 0.02mm.
Taking the temperature at the point of bonding as determined in Section 4.5.2,
1267K , the thermal expansion of the substrate is:
Δ4���� � 4� 5 6 7���� 5 8 � ���9 (14)
Δ4���� � 21.22;; 5 1.067 5 ;;;; 5 �1267 273 � � 0.219;; (14a)
The thermal expansion a the powder compact with the relative density of 0.902
for the same temperature range is:
47
Δ4������� � 4� 5 6 7������� 5 8 � ���9 (15)
Δ4������� � 21.22;; 5 9.977 6 ���� � 5 �1267 273 �=
0.198mm (15a)
This calculation confirms the geometrical calculation of the difference in thermal
contraction of 0.02mm.
This small difference could imply sufficient stress as to cause buckling of the
powder compact and break any bonds in the center. Also, the Young’s modulus
decreases significantly with temperature. According to the software MPDB, just between
290K and 590K it decreases by approximately 20% [72].
The stresses, so called self-stresses, appearing in this configuration can be of
considerable magnitude. As Green et al. state, “It is also important to understand that
self-stresses arise in multi-component bodies during the cooling stage of the sintering
process, usually in the form of residual stresses. These stresses usually result from
mismatches in the thermal expansion behavior of the various components or from other
types of strain mismatch and can be orders of magnitude greater than the stresses that
occur during densification” [73].
48
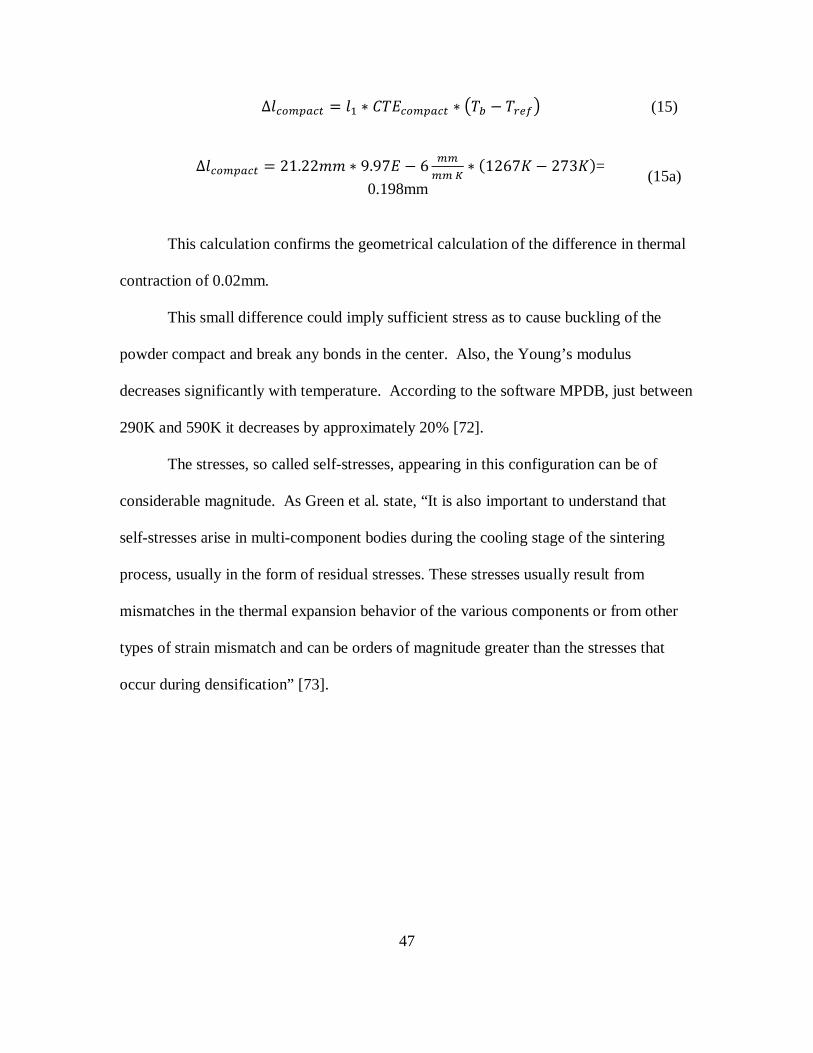
Figure 32: Bonding area on flat MIM-solid composite part. The MIM part (top) is bonded to the substrate (below), with grains connecting both
components.
The problem with injecting onto a flat surface was that the green MIM compact
did not adhere to the substrate. The two components came apart right after ejection from
the injection molding machine. Additionally, different surface finishes were evaluated,
from polished to EDM cut, open 0.3mm grooves. When the surface was rough enough to
provide adhesion to the MIM compact, this would crack during sintering. On the parts
with a sufficiently smooth surface, it was found that during sintering, the shrinkage could
actually move the compact into any direction. This shift in location is dependent on
friction, the surface condition of the substrate, or where the first bond was formed.
To avoid the problems encountered with the flat samples, some solid parts had
features like slots or high surface roughness to allow for mechanical interlock between
the MIM compact and the solid metal. Figure 33 shows a section of a composite part,
where a V-slot had been cut into the substrate to allow for a mechanical interlock
between powder compact and substrate. Again, contact and bonding was achieved at the
49
edges and, in this case, in the center, where the V-slot was. Figure 36 also shows how the
V-slot was originally filled with feedstock, which then shrunk and left a gap. The filled
V-slot avoided the larger deformation in the center as observed in the flat part. But there
were still areas where no bonding took place or where the bonds had been broken apart
(Figure 35 and Figure 36).
Figure 34 shows an interesting effect. Here the grain structure seems to continue
between the substrate and the powder compact. Although there is a gap between both
components, the grain structure seems to be aligned. This is a consequence of the
sintering of the powder compact. Sintering of the powder compact begins at relatively
low temperatures around 600°C when necks begin to form. When a neck is formed, the
grain extends from one particle to the other or from one particle to the solid plate. At this
stage there is no densification that has taken place. With increase in temperature, initially
there is only neck growth and densification takes place at higher temperatures. As the
powder mass densifies, it shrinks and creates stresses at the solid metal powder mass
interface. Some of the vacancies, pores can be considered to be a mass of vacancies,
migrate to heavily stressed areas to relieve stress. Also, while all this is happening in the
powder portion of the structure, the only thing happening inside the solid substrate is
grain growth [74].
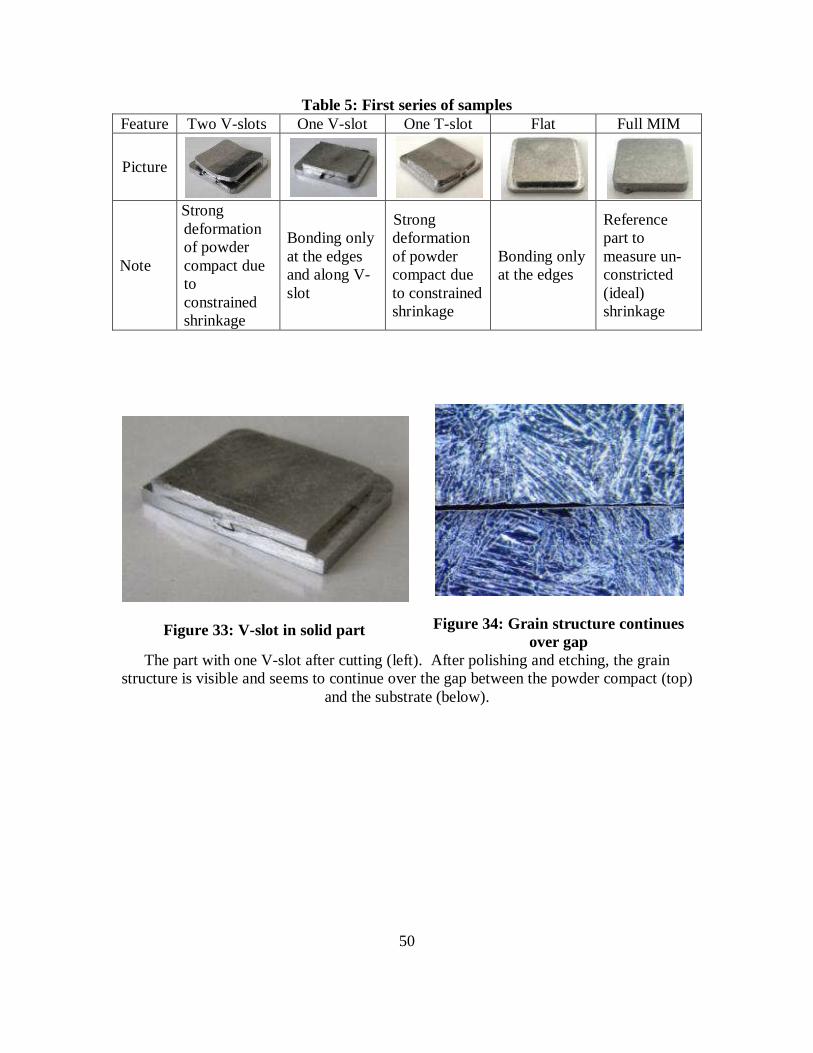
50
Table 5: First series of samples Feature Two V-slots One V-slot One T-slot Flat Full MIM
Picture
Note
Strong deformation of powder compact due to constrained shrinkage
Bonding only at the edges and along V-slot
Strong deformation of powder compact due to constrained shrinkage
Bonding only at the edges
Reference part to measure un-constricted (ideal) shrinkage
Figure 33: V-slot in solid part
Figure 34: Grain structure continues over gap
The part with one V-slot after cutting (left). After polishing and etching, the grain structure is visible and seems to continue over the gap between the powder compact (top)
and the substrate (below).
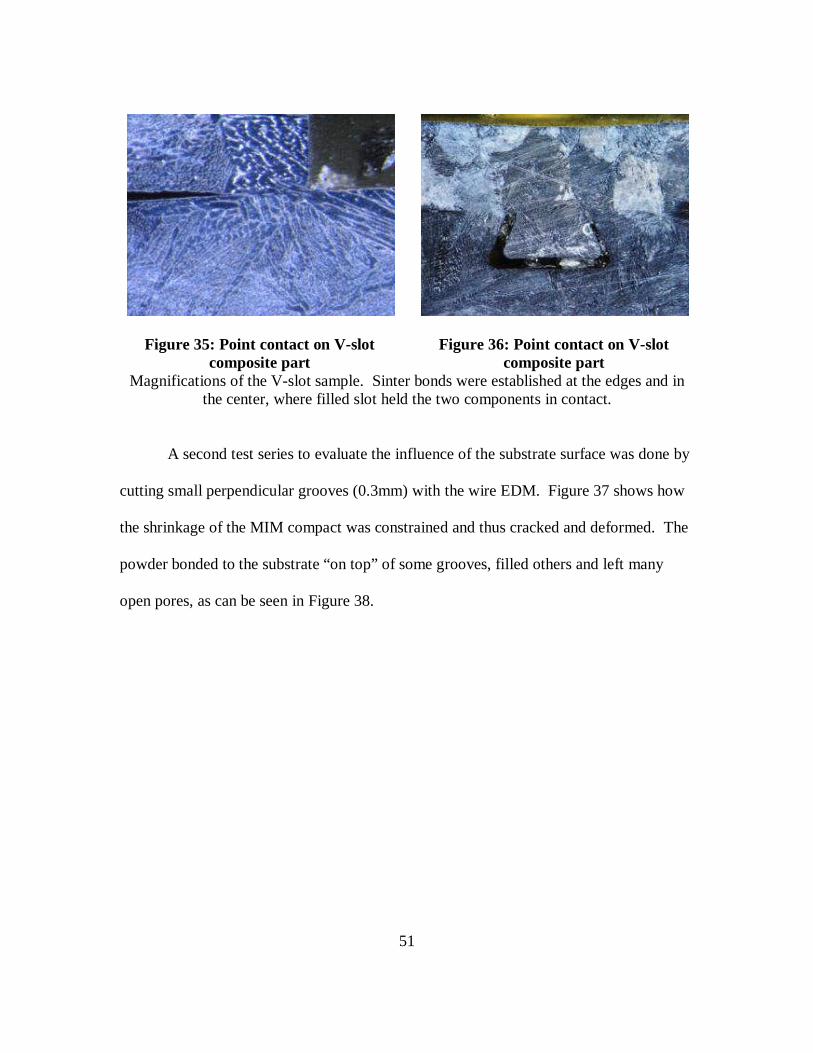
51
Figure 35: Point contact on V-slot composite part
Figure 36: Point contact on V-slot composite part
Magnifications of the V-slot sample. Sinter bonds were established at the edges and in the center, where filled slot held the two components in contact.
A second test series to evaluate the influence of the substrate surface was done by
cutting small perpendicular grooves (0.3mm) with the wire EDM. Figure 37 shows how
the shrinkage of the MIM compact was constrained and thus cracked and deformed. The
powder bonded to the substrate “on top” of some grooves, filled others and left many
open pores, as can be seen in Figure 38.
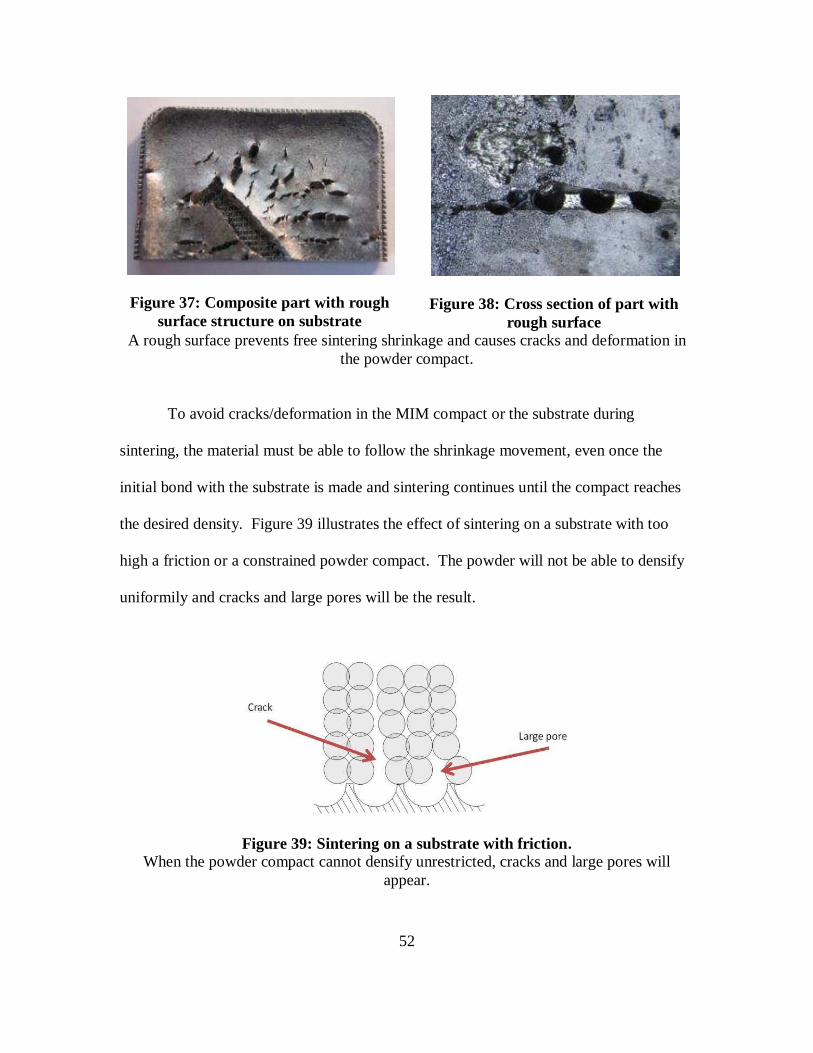
52
Figure 37: Composite part with rough surface structure on substrate
Figure 38: Cross section of part with rough surface
A rough surface prevents free sintering shrinkage and causes cracks and deformation in the powder compact.
To avoid cracks/deformation in the MIM compact or the substrate during
sintering, the material must be able to follow the shrinkage movement, even once the
initial bond with the substrate is made and sintering continues until the compact reaches
the desired density. Figure 39 illustrates the effect of sintering on a substrate with too
high a friction or a constrained powder compact. The powder will not be able to densify
uniformily and cracks and large pores will be the result.
Figure 39: Sintering on a substrate with friction. When the powder compact cannot densify unrestricted, cracks and large pores will
appear.
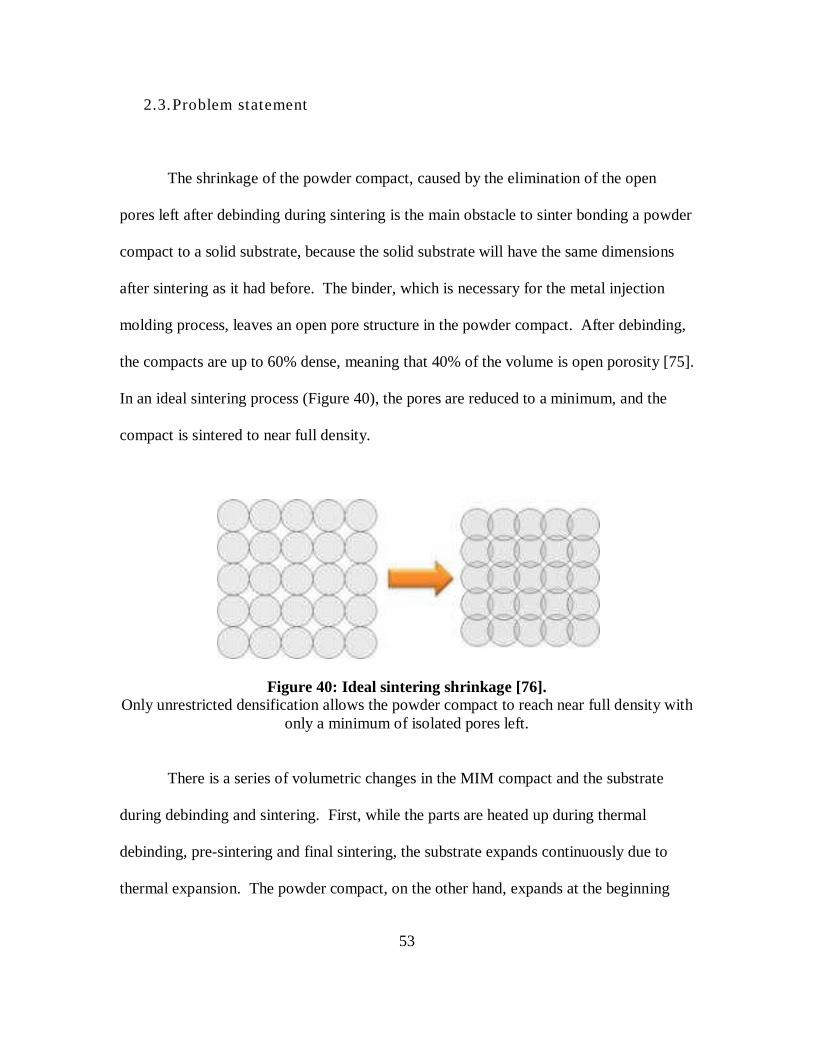
53
2.3. Problem statement
The shrinkage of the powder compact, caused by the elimination of the open
pores left after debinding during sintering is the main obstacle to sinter bonding a powder
compact to a solid substrate, because the solid substrate will have the same dimensions
after sintering as it had before. The binder, which is necessary for the metal injection
molding process, leaves an open pore structure in the powder compact. After debinding,
the compacts are up to 60% dense, meaning that 40% of the volume is open porosity [75].
In an ideal sintering process (Figure 40), the pores are reduced to a minimum, and the
compact is sintered to near full density.
Figure 40: Ideal sintering shrinkage [76]. Only unrestricted densification allows the powder compact to reach near full density with
only a minimum of isolated pores left.
There is a series of volumetric changes in the MIM compact and the substrate
during debinding and sintering. First, while the parts are heated up during thermal
debinding, pre-sintering and final sintering, the substrate expands continuously due to
thermal expansion. The powder compact, on the other hand, expands at the beginning
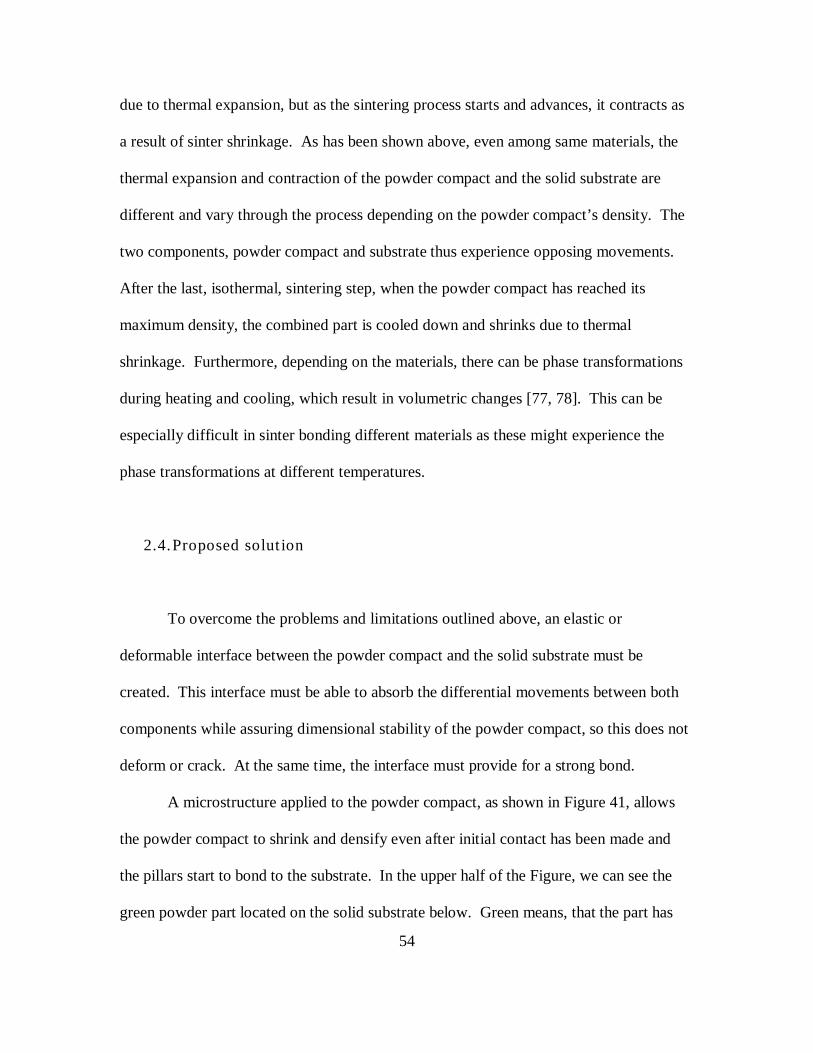
54
due to thermal expansion, but as the sintering process starts and advances, it contracts as
a result of sinter shrinkage. As has been shown above, even among same materials, the
thermal expansion and contraction of the powder compact and the solid substrate are
different and vary through the process depending on the powder compact’s density. The
two components, powder compact and substrate thus experience opposing movements.
After the last, isothermal, sintering step, when the powder compact has reached its
maximum density, the combined part is cooled down and shrinks due to thermal
shrinkage. Furthermore, depending on the materials, there can be phase transformations
during heating and cooling, which result in volumetric changes [77, 78]. This can be
especially difficult in sinter bonding different materials as these might experience the
phase transformations at different temperatures.
2.4. Proposed solut ion
To overcome the problems and limitations outlined above, an elastic or
deformable interface between the powder compact and the solid substrate must be
created. This interface must be able to absorb the differential movements between both
components while assuring dimensional stability of the powder compact, so this does not
deform or crack. At the same time, the interface must provide for a strong bond.
A microstructure applied to the powder compact, as shown in Figure 41, allows
the powder compact to shrink and densify even after initial contact has been made and
the pillars start to bond to the substrate. In the upper half of the Figure, we can see the
green powder part located on the solid substrate below. Green means, that the part has
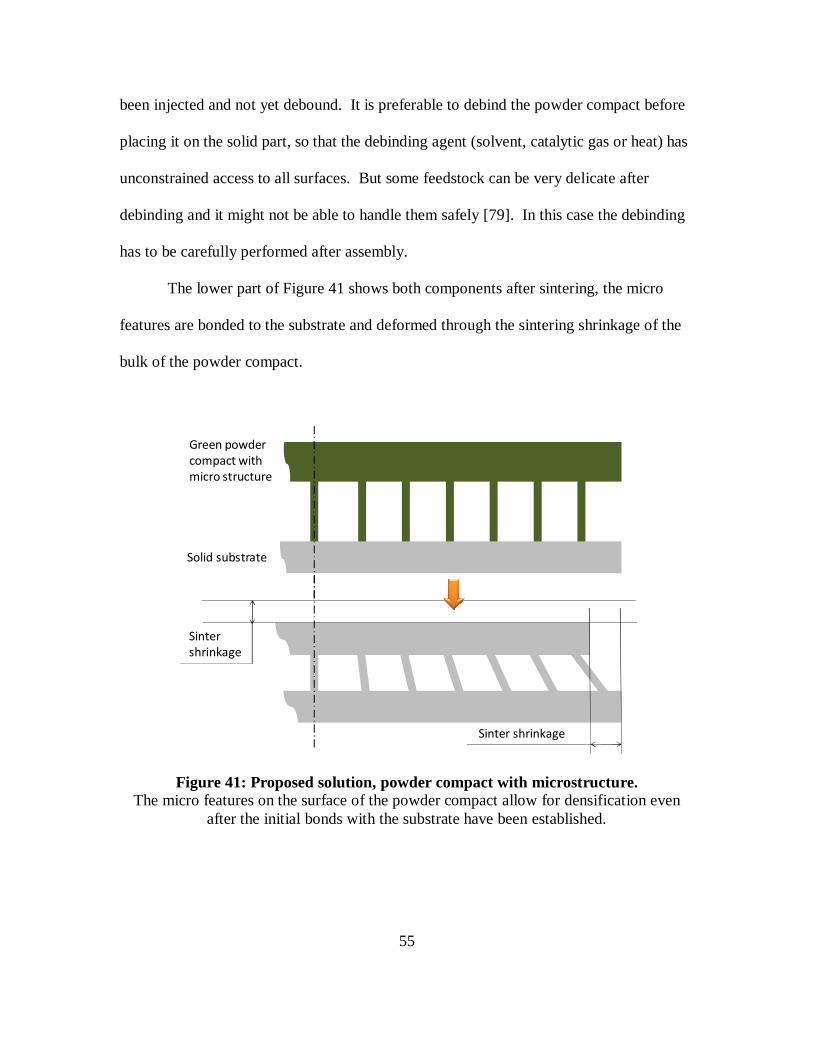
55
been injected and not yet debound. It is preferable to debind the powder compact before
placing it on the solid part, so that the debinding agent (solvent, catalytic gas or heat) has
unconstrained access to all surfaces. But some feedstock can be very delicate after
debinding and it might not be able to handle them safely [79]. In this case the debinding
has to be carefully performed after assembly.
The lower part of Figure 41 shows both components after sintering, the micro
features are bonded to the substrate and deformed through the sintering shrinkage of the
bulk of the powder compact.
Figure 41: Proposed solution, powder compact with microstructure. The micro features on the surface of the powder compact allow for densification even
after the initial bonds with the substrate have been established.
Sinter shrinkage
Sinter shrinkage
Green powdercompact with micro structure
Solid substrate
56
This set-up was expected to impart certain elasticity and permits differential
movements between the powder compact and the solid substrate. Especially during the
initial sintering stages, while the part is being heated up, the powder compact shows a
high shrinkage rate. At the same time, the substrate expands due to thermal expansion.
This elasticity was estimated to prevent the part from cracking and deforming. At
the same time the pillars would have to be able to deform sufficiently without reaching
their deformation limits which would break the bonds.
Also, the structure provides a “gap” between both components which allows for a
more uniform temperature distribution on the bonding surface, so that all pillars start
bonding at the same time, thus theoretically preventing the deformation experienced in
the initial, flat samples.
An understanding and a model of this configuration needed to be developed to be
able to design a structure that could be optimized for bonding strength and to benefit
from the possibilities that this new design offers.
57
3. RESEARCH METHODOLOGY
3.1. Outline
The overall goal of this research was to investigate, understand and model the
proposed process of micro feature enhanced sinter bonding a MIM powder compact to a
solid substrate. This comprised three objectives: model the time temperature dependent
process of bonding a powder to a solid substrate, model the deformation of the micro
features once the bond between powder compact and substrate has been established and
finally model and evaluate the overall sinter bonding process.
Six research questions have been established to reach the objectives.
Furthermore, to answer the six questions, eight tasks have been defined. The outcomes
of the earlier tasks are the inputs for the later ones.
3.1.1. Object ive 1: Sinter bonding
The first objective of this research was to develop a fundamental understanding of
the process of sinter bonding a powder compact to a solid substrate and model this
process and its time-temperature dependant development. It was fundamental to
understand the difference between the bonding among the powder spheres and the
bonding of powder spheres to the solid substrate. From the reference samples it was
observed that the particles first bonded among themselves and then to the substrate. The
research questions for this objective were:
58
1. How does the classical two-sphere sinter model apply to sinter bonding powder to
a solid substrate?
2. How and when during the sinter cycle is the bond between the powder compact
and the substrate established?
3. How can the process of sinter bonding a powder compact to a solid substrate be
modeled?
3.1.2. Object ive 2: Deformat ion
The second objective of this research was to model the “post-bonding”
deformation and densification of the microstructure and bulk of the powder component.
The research questions for this objective were:
1. How will the structure deform and what are the deformation limits?
2. How does the microstructure behave after the initial bond is established?
3.1.3. Object ive 3: Model and evaluat ion
The third objective of this research was to combine the results from objectives
one and two into one model, evaluate the structure design for bond strength and prove the
concept. To evaluate the strength of the sinter bonds, a shear test fixture was designed
and built and the different samples were tested and compared with samples of traditional
joining methods. The research question for this objective was:
59
1. How can the pre-bonding and post-bonding phases be combined, modeled and
simulated?
3.2. Tasks
The seven tasks defined to answer the research questions, and thus the objectives
and finally the research goal, were as follows:
Task 1: Produce samples for fundamental measurements and characterizations
As a foundation, it was necessary to produce a number of samples to gather data
for the research objective 1.
Method: Three series of samples were injected and evaluated:
Evaluation:
• Measure bulk before and after sintering (characterize shrinkage and density)
• Shear test • Cut
• Polish
• Etch
• Measure microstructure, optical or SEM (characterize microstructure shape and behavior)
Expected outcome and contingency plan:
The goal of this task is to obtain a set of fundamental data on the
behavior of the powder compacts as to shrinkage, deformation,
strength. If there would be problems with the parts (e.g. due to
sintering problems), a second series could be injected and sintered
60
at a different toll sintering company. Also, there are still the
samples from the preliminary tests which could be evaluated
further.
Task 2: Literature research
Extensive literature regarding the basics of sintering was available. Most
publications describe the bonding process between two or more sphere shaped
particles.
Method: In this task it needed to be evaluated how far these models could
be applied to bonding a particle to a solid (flat) substrate. The
second part of this literature research was to obtain information on
the conditions for the creation of sinter bonds in general.
Expected outcome and contingency plan:
The purpose of this task was to identify a model that applied to
sinter bonding a sphere to a solid substrate and gather information
on the requirements and conditions for establishing sinter bonds.
If no directly applicable models could be identified, a model must
be created.
61
Task 3: Evaluate samples; compare samples that were bonded to substrate with
“MIM only” samples
This task was a continuation of Task 1. Comparing the samples that were bonded
to a substrate with those that are not, it was possible to isolate the influence of the
constraints during sintering. The evaluation was based on the same procedure as
in Task 1:
Method:
• Measure bulk before and after sintering (characterize shrinkage and density)
• Shear test • Cut
• Polish
• Etch
• Measure microstructure, optical or SEM (characterize microstructure shape and behavior)
Expected outcome and contingency plan:
This task was expected to provide data on the deformation and
densification of the powder compacts, especially the difference
between those that were bonded to the substrate, and thus
constrained, and those that were not. If there would have been
problems with the parts (e.g. due to sintering problems), a second
series could be injected and sintered at a different toll sintering
company. Also, there were still the samples from the preliminary
tests which could be evaluated further.
62
Task 4: Identify the elements of the model, e.g. surface properties, powder size,
material, sintering cycle, etc.
This was a fundamental task for the modeling of sinter bonding a powder compact
to a solid substrate.
Method: Based on the literature research (Task 2) and sample evaluations
(Task 3), the elements of such a model were identified.
Expected outcome and contingency plan:
This task should deliver a series of elements that would be joined
to one model. The influence of each element would be weighted.
Additionally, and also as contingency, the models in later tasks
would be created on the bases of existing models with their
elements.
Evaluation: The applicability of the identified elements was evaluated by
testing their influence in the models, varying the identified
elements. This could be done by comparing the results
(dimensions and shape) of the models with the original samples.
63
Task 5: Create a model that describes the process of bonding between the powder
compact and the substrate.
Method: With the input from Tasks 2-4, a model would be created
Expected outcome and contingency plan:
The model to be designed would describe the process of
establishing the bond between the powder compact and the
substrate. It should be able to predict when the bond is established,
the mechanisms for creating the bond and its strength. There
would be two approaches, a theoretical and an empirical which
ideally complement each other. In case of problems with one of
the approaches, the weight can be shifted towards the other.
Evaluation: The model and simulation were evaluated by comparing its results
with SEM images and dimensions taken from samples.
Task 6: Model the microstructure deformation
Tasks 3 and 4 lead to model the deformation of the microstructure
Method: Based on Tasks 3 and 4, a model would be created that
demonstrated and predicted the deformation of the microstructure
during sintering.
Expected outcome and contingency plan:
Based on the deformation model, the “overall” model would be
created. The deformation model would deliver data on the
constraints acting on the bulk of the powder compact during
64
sintering. It was also important for geometric control of the
compact. As in task 5, there would be two approaches, a
theoretical and an empirical which ideally complement each other.
In case of problems with one of the approaches, the weight could
be shifted towards the other.
Evaluation: The model and simulation were to be evaluated by comparing its
results with SEM images and dimensions taken from samples. The
agreement between the physical samples and the simulation would
be a measurement for the precision of the model.
Task 7: Integrate the results of above tasks into one model for sinter bonding a
powder compact to a solid substrate.
The “final” model would represent the complete process, from the start of the
sintering process, creation of the first sinter bonds, to the final sintering stage,
where the compact reached nearly full density.
Method: Based on the results of Tasks 1 – 6, a model would be designed.
This model would consider boundary conditions such as material,
surface properties, sintering cycle, etc.
Expected outcome and contingency plan
The anticipated outcome of Task 7 was a model that allowed
developing a microstructure to sinter bond a powder compact to a
solid substrate and predict the properties of the part as to strength
and final dimensions. If the model could not describe the complete
65
process, a divided model would be considered. This model would
divide the process in stages and describe each one successively
from start to finish.
Evaluation: The model and simulation were to be evaluated by comparing its
results with SEM images and dimensions taken from samples. The
agreement between the physical samples and the simulation would
be a measurement for the precision of the model.
Error! Reference source not found.Error! Reference source not found. shows
the structure of this research and how the goal, objectives, research questions and tasks
are connected feed into one another.
The basis of this research was a series of reference samples which were evaluated
and measured under the optical microscope and the SEM as described in task 1.
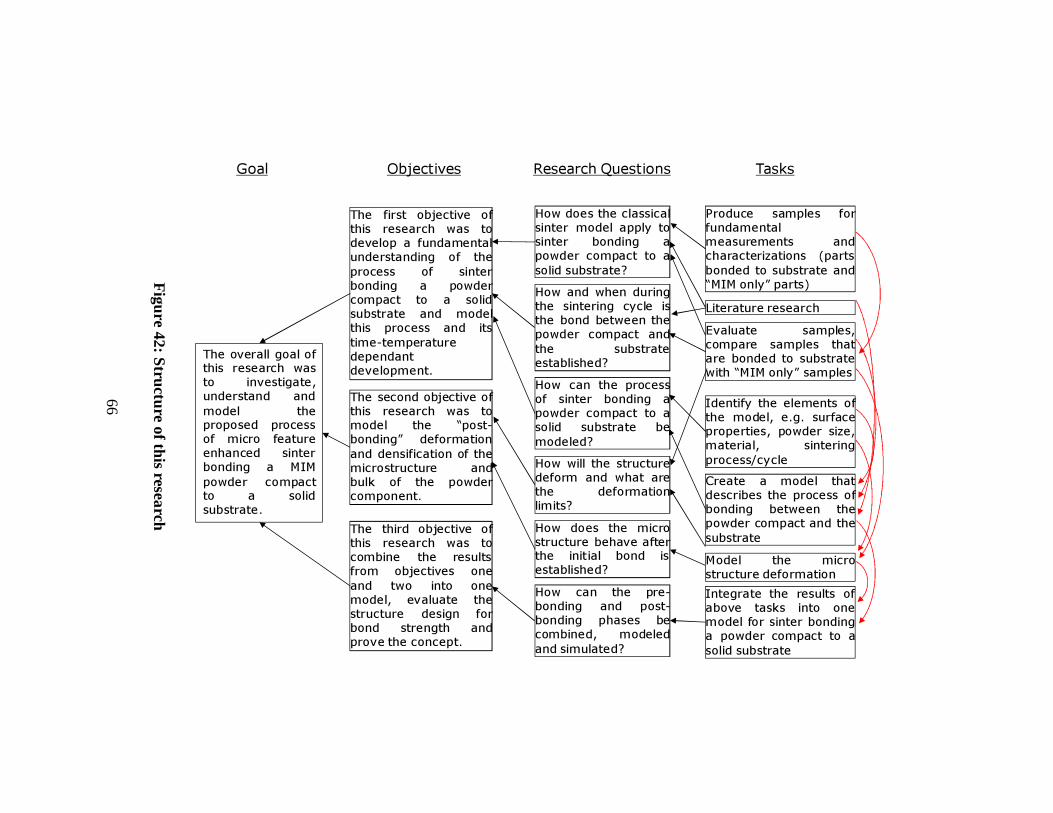
66
The second objective ofthis research was tomodel the “post-bonding” deformationand densification of themicrostructure andbulk of the powdercomponent.
The first objective ofthis research was todevelop a fundamentalunderstanding of theprocess of sinterbonding a powdercompact to a solidsubstrate and modelthis process and itstime-temperaturedependantdevelopment.
The third objective ofthis research was tocombine the resultsfrom objectives oneand two into onemodel, evaluate thestructure design forbond strength andprove the concept.
How does the classicalsinter model apply tosinter bonding apowder compact to asolid substrate?How and when duringthe sintering cycle isthe bond between thepowder compact andthe substrateestablished?How can the processof sinter bonding apowder compact to asolid substrate bemodeled?How will the structuredeform and what arethe deformationlimits?How does the microstructure behave afterthe initial bond isestablished?How can the pre-bonding and post-bonding phases becombined, modeledand simulated?
Evaluate samples,compare samples thatare bonded to substratewith “MIM only” samples
Identify the elements ofthe model, e.g. surfaceproperties, powder size,material, sinteringprocess/cycleCreate a model thatdescribes the process ofbonding between thepowder compact and thesubstrateModel the microstructure deformationIntegrate the results ofabove tasks into onemodel for sinter bondinga powder compact to asolid substrate
Goal Objectives Research Questions Tasks
Literature research
The overall goal ofthis research wasto investigate,understand andmodel theproposed processof micro featureenhanced sinterbonding a MIMpowder compactto a solidsubstrate.
Produce samples forfundamentalmeasurements andcharacterizations (partsbonded to substrate and“MIM only” parts)F
igure 42: Structure of this research
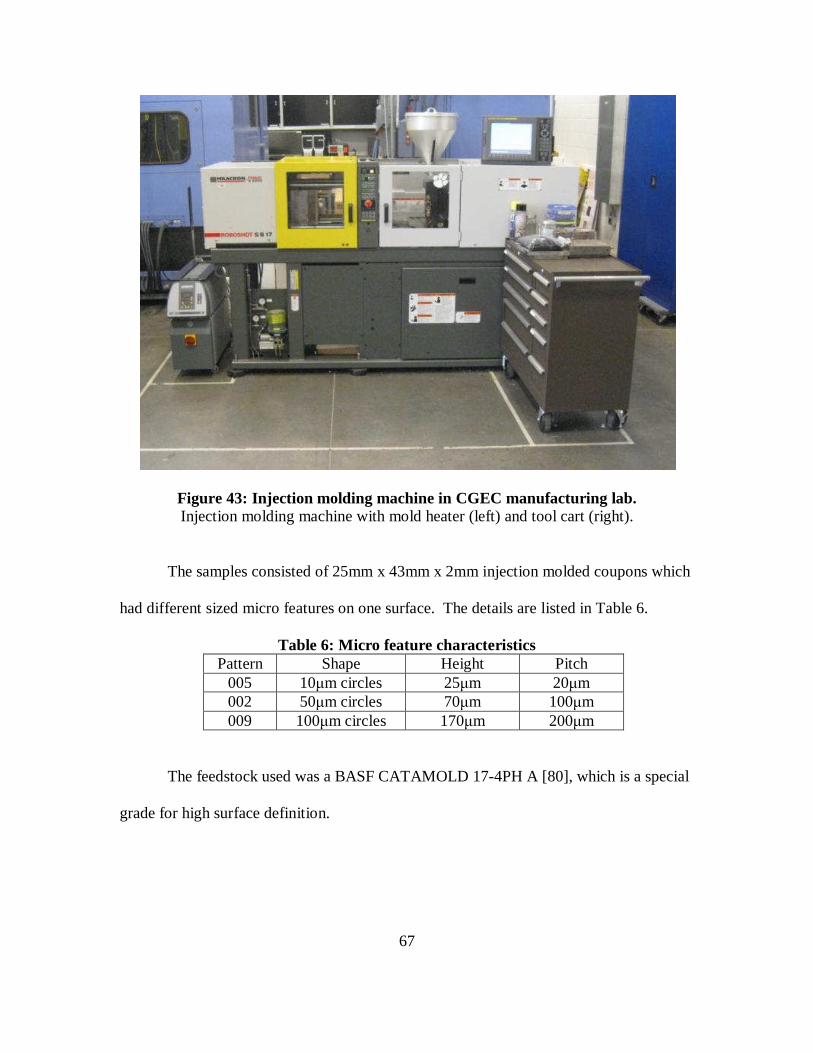
67
Figure 43: Injection molding machine in CGEC manufacturing lab. Injection molding machine with mold heater (left) and tool cart (right).
The samples consisted of 25mm x 43mm x 2mm injection molded coupons which
had different sized micro features on one surface. The details are listed in Table 6.
Table 6: Micro feature characteristics Pattern Shape Height Pitch
005 10µm circles 25µm 20µm 002 50µm circles 70µm 100µm 009 100µm circles 170µm 200µm
The feedstock used was a BASF CATAMOLD 17-4PH A [80], which is a special
grade for high surface definition.
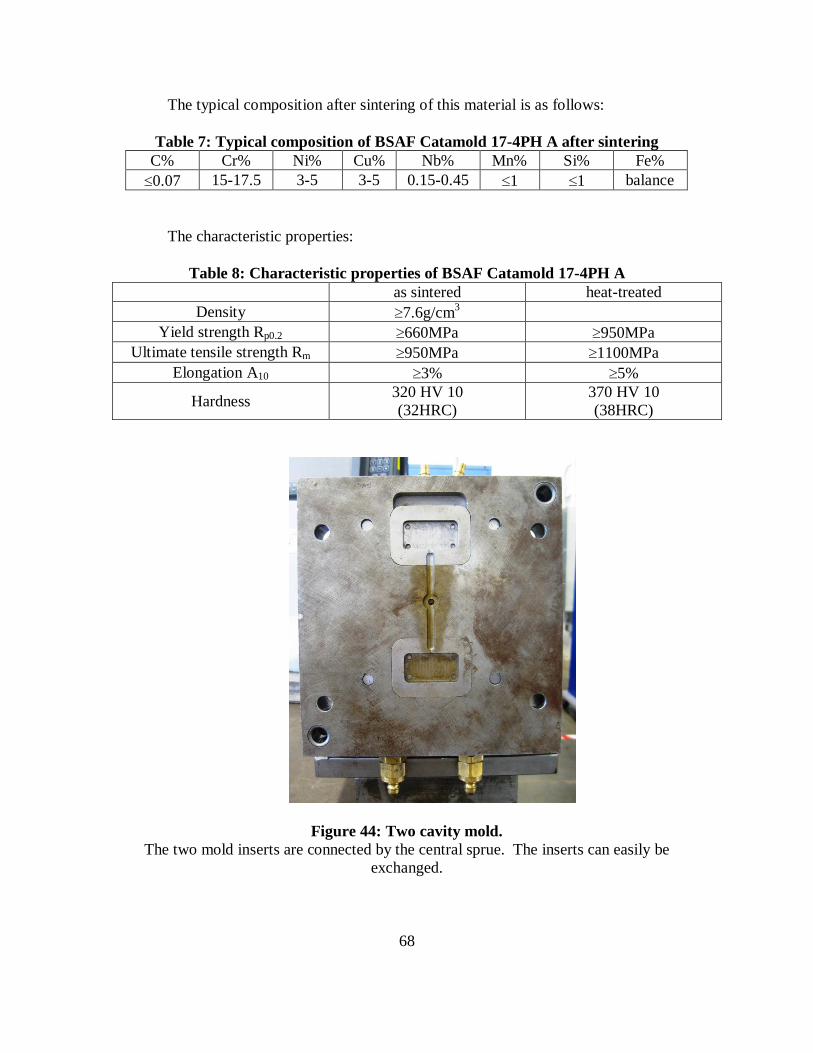
68
The typical composition after sintering of this material is as follows:
Table 7: Typical composition of BSAF Catamold 17-4PH A after sintering C% Cr% Ni% Cu% Nb% Mn% Si% Fe% ≤0.07 15-17.5 3-5 3-5 0.15-0.45 ≤1 ≤1 balance
The characteristic properties:
Table 8: Characteristic properties of BSAF Catamold 17-4PH A as sintered heat-treated
Density ≥7.6g/cm3 Yield strength Rp0.2 ≥660MPa ≥950MPa
Ultimate tensile strength Rm ≥950MPa ≥1100MPa Elongation A10 ≥3% ≥5%
Hardness 320 HV 10 (32HRC)
370 HV 10 (38HRC)
Figure 44: Two cavity mold. The two mold inserts are connected by the central sprue. The inserts can easily be
exchanged.
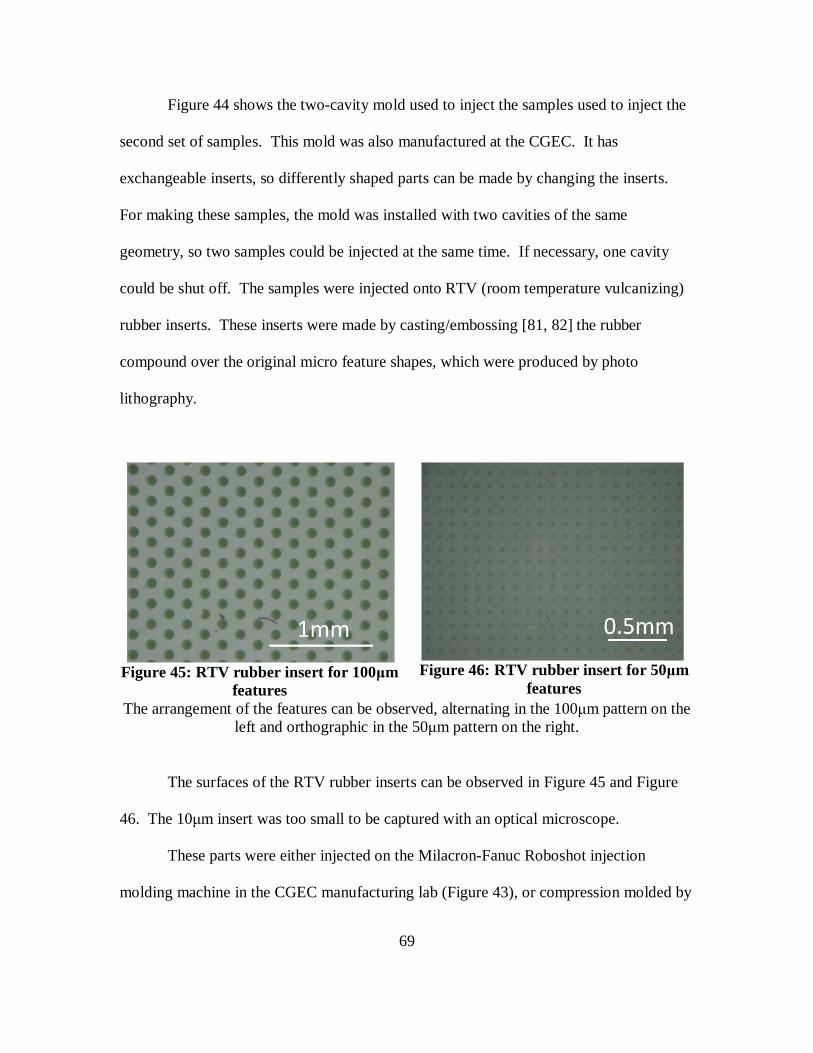
69
Figure 44 shows the two-cavity mold used to inject the samples used to inject the
second set of samples. This mold was also manufactured at the CGEC. It has
exchangeable inserts, so differently shaped parts can be made by changing the inserts.
For making these samples, the mold was installed with two cavities of the same
geometry, so two samples could be injected at the same time. If necessary, one cavity
could be shut off. The samples were injected onto RTV (room temperature vulcanizing)
rubber inserts. These inserts were made by casting/embossing [81, 82] the rubber
compound over the original micro feature shapes, which were produced by photo
lithography.
Figure 45: RTV rubber insert for 100µm
features
Figure 46: RTV rubber insert for 50µm
features The arrangement of the features can be observed, alternating in the 100µm pattern on the
left and orthographic in the 50µm pattern on the right.
The surfaces of the RTV rubber inserts can be observed in Figure 45 and Figure
46. The 10µm insert was too small to be captured with an optical microscope.
These parts were either injected on the Milacron-Fanuc Roboshot injection
molding machine in the CGEC manufacturing lab (Figure 43), or compression molded by
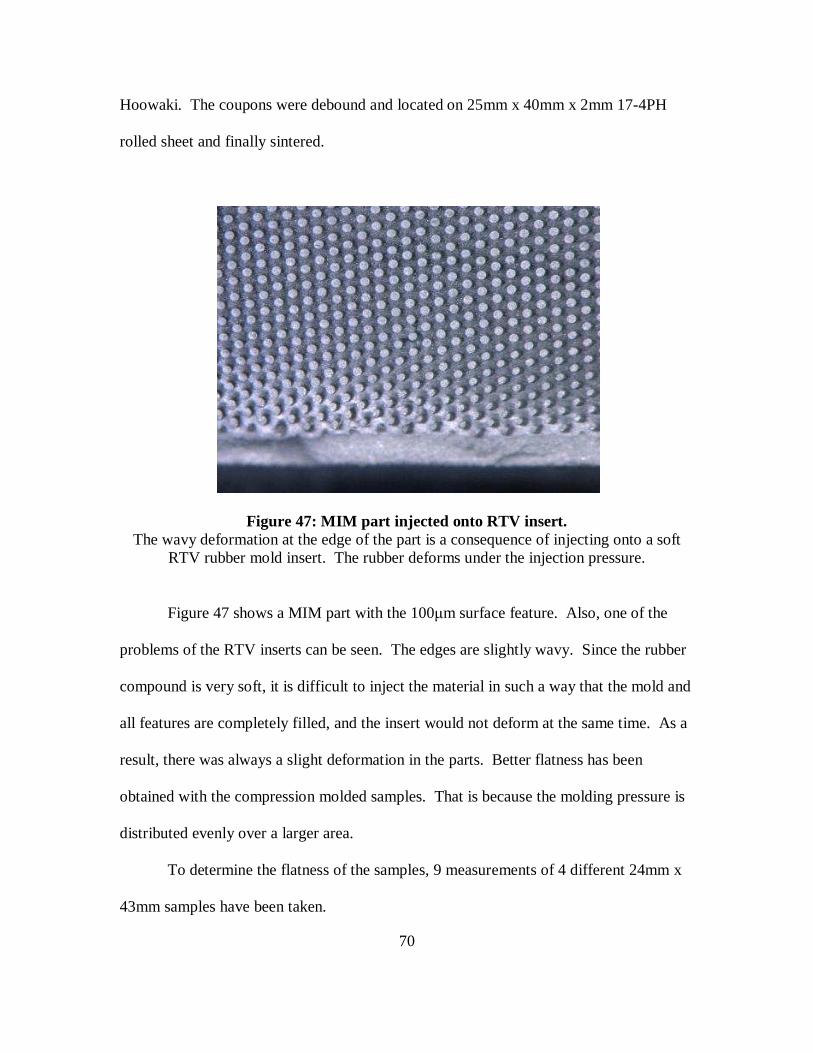
70
Hoowaki. The coupons were debound and located on 25mm x 40mm x 2mm 17-4PH
rolled sheet and finally sintered.
Figure 47: MIM part injected onto RTV insert. The wavy deformation at the edge of the part is a consequence of injecting onto a soft
RTV rubber mold insert. The rubber deforms under the injection pressure.
Figure 47 shows a MIM part with the 100µm surface feature. Also, one of the
problems of the RTV inserts can be seen. The edges are slightly wavy. Since the rubber
compound is very soft, it is difficult to inject the material in such a way that the mold and
all features are completely filled, and the insert would not deform at the same time. As a
result, there was always a slight deformation in the parts. Better flatness has been
obtained with the compression molded samples. That is because the molding pressure is
distributed evenly over a larger area.
To determine the flatness of the samples, 9 measurements of 4 different 24mm x
43mm samples have been taken.
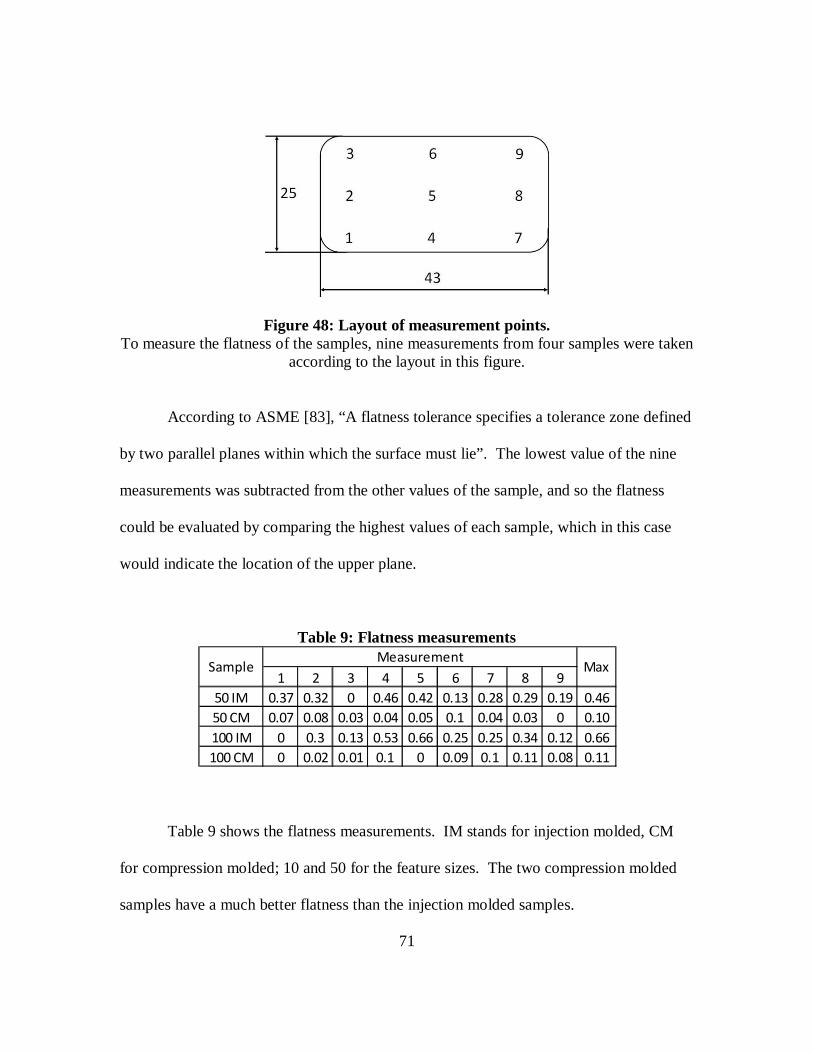
71
Figure 48: Layout of measurement points. To measure the flatness of the samples, nine measurements from four samples were taken
according to the layout in this figure.
According to ASME [83], “A flatness tolerance specifies a tolerance zone defined
by two parallel planes within which the surface must lie”. The lowest value of the nine
measurements was subtracted from the other values of the sample, and so the flatness
could be evaluated by comparing the highest values of each sample, which in this case
would indicate the location of the upper plane.
Table 9: Flatness measurements
Table 9 shows the flatness measurements. IM stands for injection molded, CM
for compression molded; 10 and 50 for the feature sizes. The two compression molded
samples have a much better flatness than the injection molded samples.
1 2 3 4 5 6 7 8 950 IM 0.37 0.32 0 0.46 0.42 0.13 0.28 0.29 0.19 0.4650 CM 0.07 0.08 0.03 0.04 0.05 0.1 0.04 0.03 0 0.10100 IM 0 0.3 0.13 0.53 0.66 0.25 0.25 0.34 0.12 0.66100 CM 0 0.02 0.01 0.1 0 0.09 0.1 0.11 0.08 0.11
MeasurementSample Max

72
Also, compression molding, or hot embossing, is capable to achieve very low
surface roughness with RTV rubber mold inserts [84]. Injection molding of polymers
and metal or ceramic powders into micro features has gained a lot of attention during the
last years and is in steady development [85-88].
The problem here is to fill the finer features (10µm) with the rather coarse powder
(average particle size 4µm). Also, the smaller the features, the more difficult it gets to get
any trapped air out.
Figure 49: Surface structure. The 2:1 aspect ratio of the 100µm features is clearly visible
The side view in Figure 49 illustrates the surface features and their height to
diameter ratio.
The feedstock used was BASF Catamold 17-4PHA. The solid substrate sheet was
also 17-4PH. The BASF samples were processed by DSH Technologies, LLC.
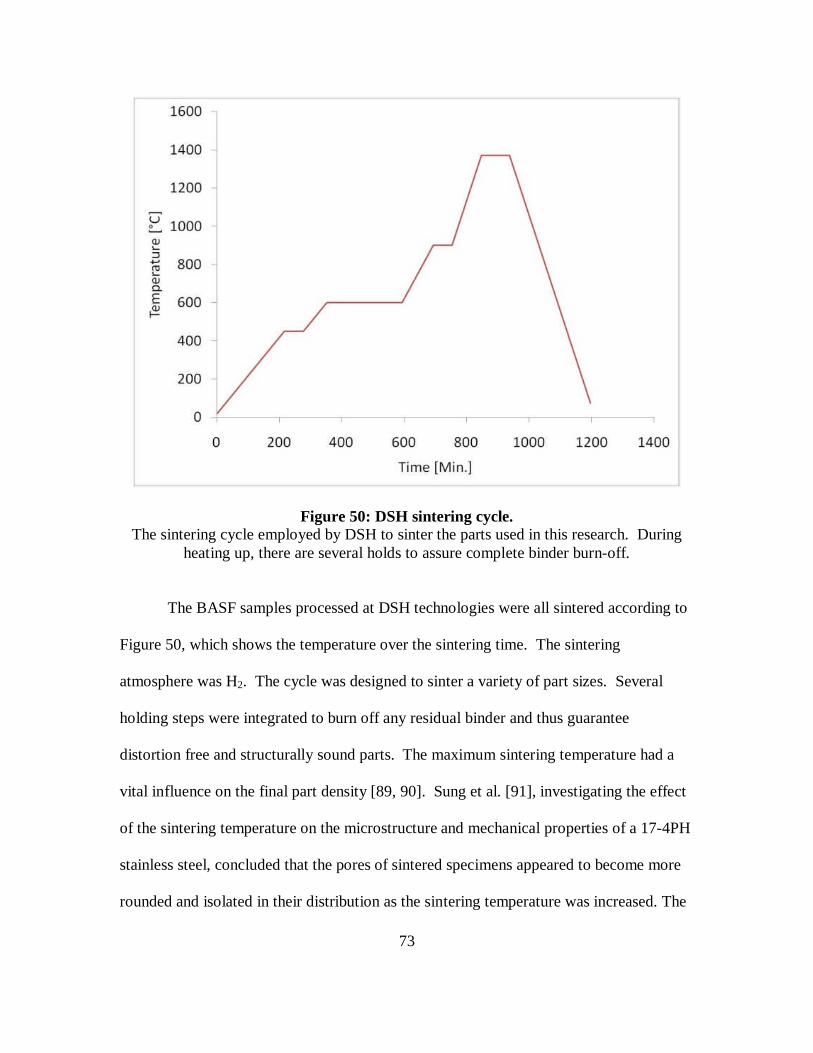
73
Figure 50: DSH sintering cycle. The sintering cycle employed by DSH to sinter the parts used in this research. During
heating up, there are several holds to assure complete binder burn-off.
The BASF samples processed at DSH technologies were all sintered according to
Figure 50, which shows the temperature over the sintering time. The sintering
atmosphere was H2. The cycle was designed to sinter a variety of part sizes. Several
holding steps were integrated to burn off any residual binder and thus guarantee
distortion free and structurally sound parts. The maximum sintering temperature had a
vital influence on the final part density [89, 90]. Sung et al. [91], investigating the effect
of the sintering temperature on the microstructure and mechanical properties of a 17-4PH
stainless steel, concluded that the pores of sintered specimens appeared to become more
rounded and isolated in their distribution as the sintering temperature was increased. The

74
closure of pores enhanced elongation and strength of sintered specimen. The tensile
strength of sintered specimens was found to increase almost linearly with the sintering
temperature.
As explored by Yunxin et al. [68], using pure H2 as the sintering atmosphere as
opposed to a mix of H2 and N2 has the advantage, that this produces a higher shrinkage
rate. The H2 + N2 atmosphere retards densification significantly at both the earlier
(900°C to 1100°C) and later (above 1220°C) stages of sintering.
75
4. RESEARCH RESULTS
4.1. Introduction
Similar to the approach outlined in chapter three, Research Methodology, the
research results will be presented according to the three research objectives: model the
time temperature dependent process of bonding a powder to a solid substrate, model the
deformation of the micro features once the bond between powder compact and substrate
has been established and finally model and evaluate the overall sinter bonding process.
The six posed research questions will be answered in the proper order to fulfill each
objective.
4.2. Sinter bonding
The primary objective of this research was to develop a fundamental
understanding of the process of sinter bonding a powder compact to a solid substrate and
model this process and its time-temperature dependant development.
To determine the geometrical structure of the micro features and the contact area
was the first step to be performed.
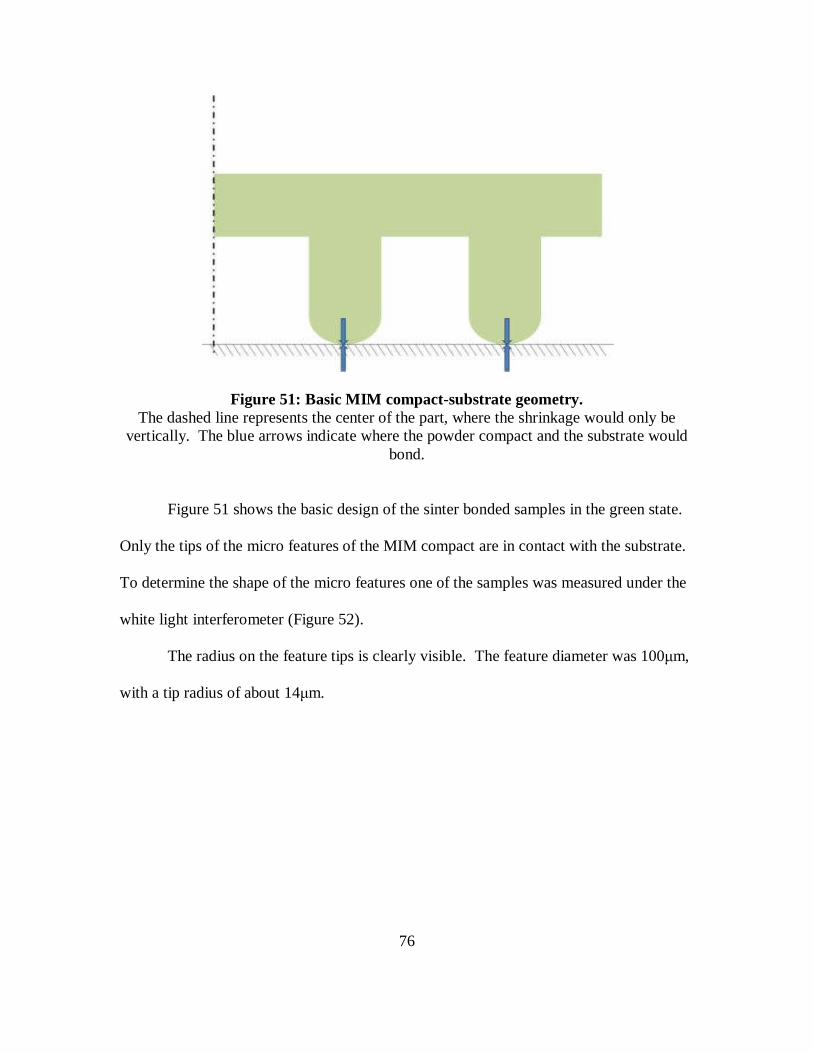
76
Figure 51: Basic MIM compact-substrate geometry. The dashed line represents the center of the part, where the shrinkage would only be
vertically. The blue arrows indicate where the powder compact and the substrate would bond.
Figure 51 shows the basic design of the sinter bonded samples in the green state.
Only the tips of the micro features of the MIM compact are in contact with the substrate.
To determine the shape of the micro features one of the samples was measured under the
white light interferometer (Figure 52).
The radius on the feature tips is clearly visible. The feature diameter was 100µm,
with a tip radius of about 14µm.
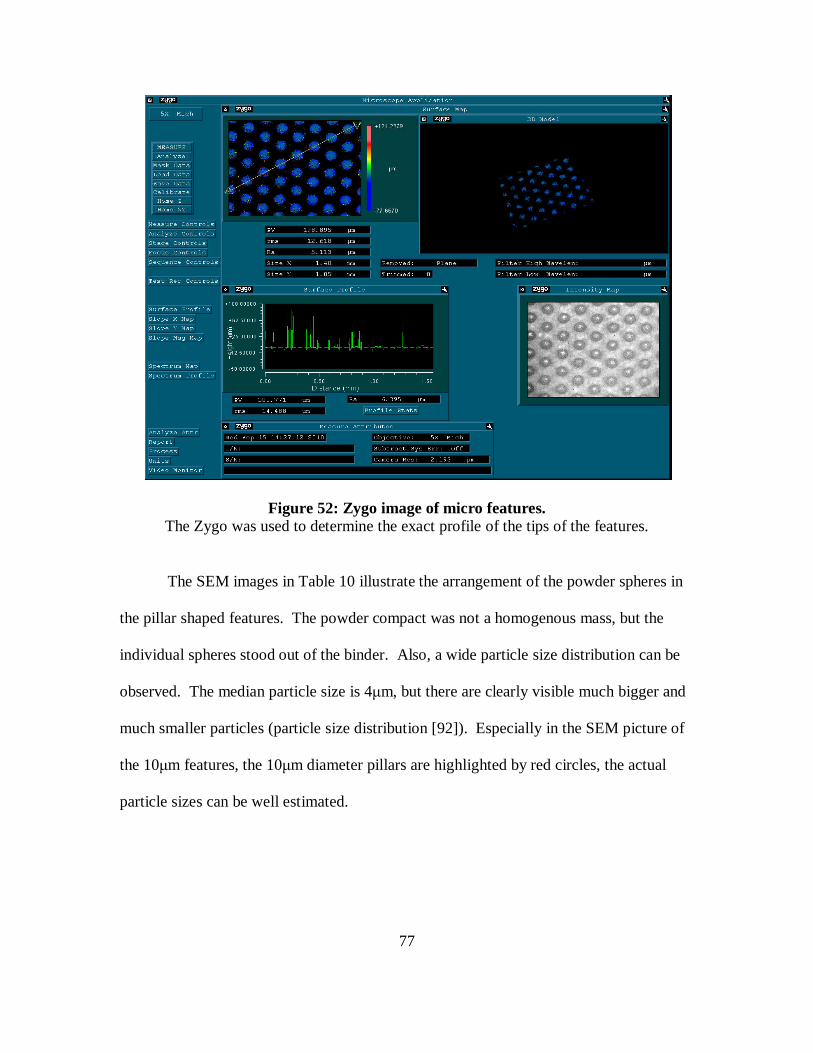
77
Figure 52: Zygo image of micro features. The Zygo was used to determine the exact profile of the tips of the features.
The SEM images in Table 10 illustrate the arrangement of the powder spheres in
the pillar shaped features. The powder compact was not a homogenous mass, but the
individual spheres stood out of the binder. Also, a wide particle size distribution can be
observed. The median particle size is 4µm, but there are clearly visible much bigger and
much smaller particles (particle size distribution [92]). Especially in the SEM picture of
the 10µm features, the 10µm diameter pillars are highlighted by red circles, the actual
particle sizes can be well estimated.
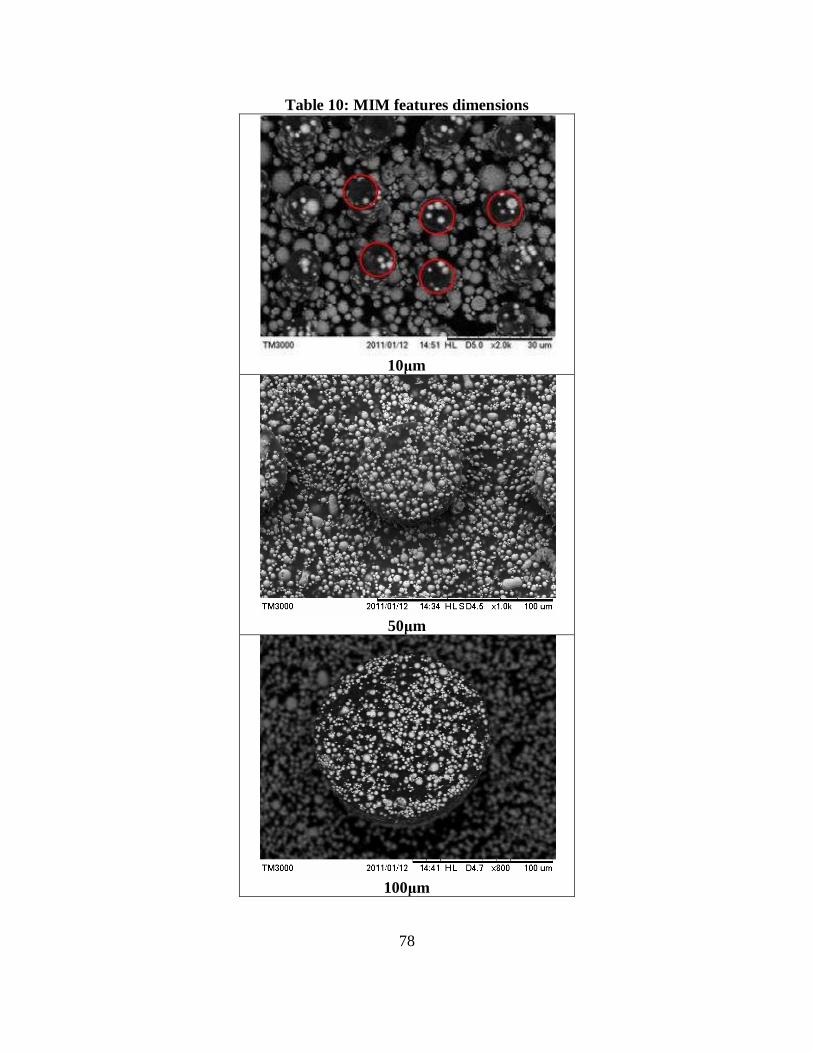
78
Table 10: MIM features dimensions
10µm
50µm
100µm
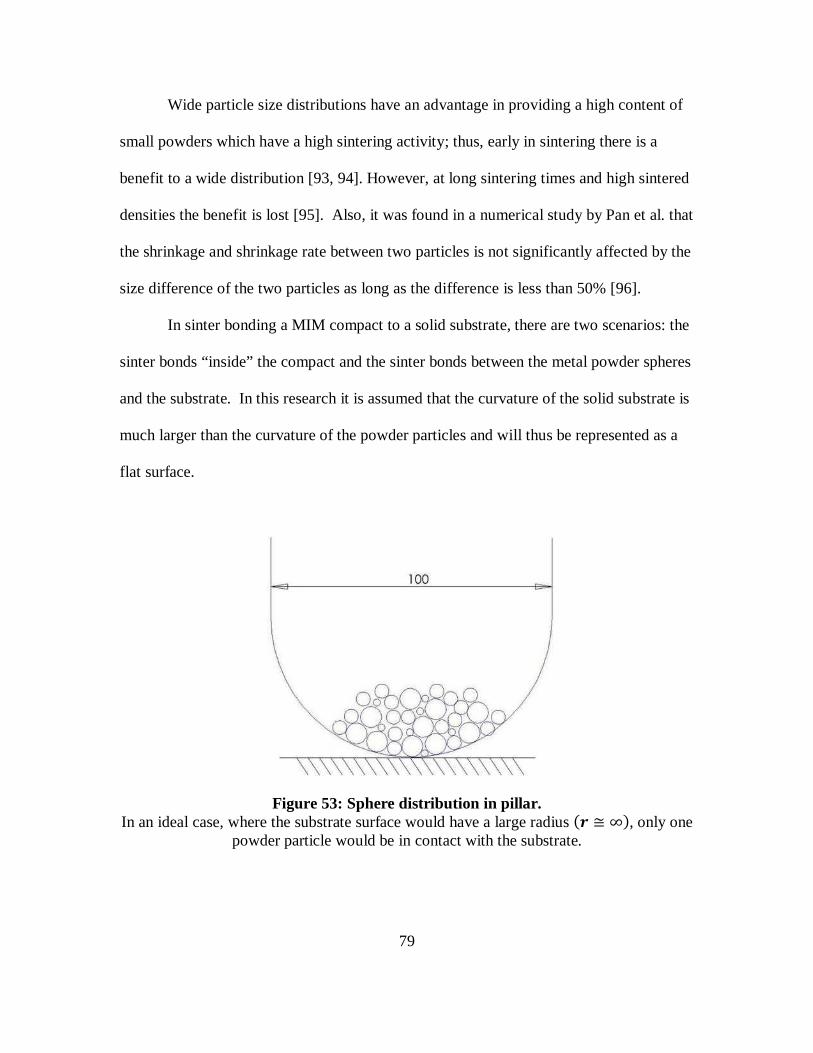
79
Wide particle size distributions have an advantage in providing a high content of
small powders which have a high sintering activity; thus, early in sintering there is a
benefit to a wide distribution [93, 94]. However, at long sintering times and high sintered
densities the benefit is lost [95]. Also, it was found in a numerical study by Pan et al. that
the shrinkage and shrinkage rate between two particles is not significantly affected by the
size difference of the two particles as long as the difference is less than 50% [96].
In sinter bonding a MIM compact to a solid substrate, there are two scenarios: the
sinter bonds “inside” the compact and the sinter bonds between the metal powder spheres
and the substrate. In this research it is assumed that the curvature of the solid substrate is
much larger than the curvature of the powder particles and will thus be represented as a
flat surface.
Figure 53: Sphere distribution in pillar. In an ideal case, where the substrate surface would have a large radius �A B ∞�, only one
powder particle would be in contact with the substrate.
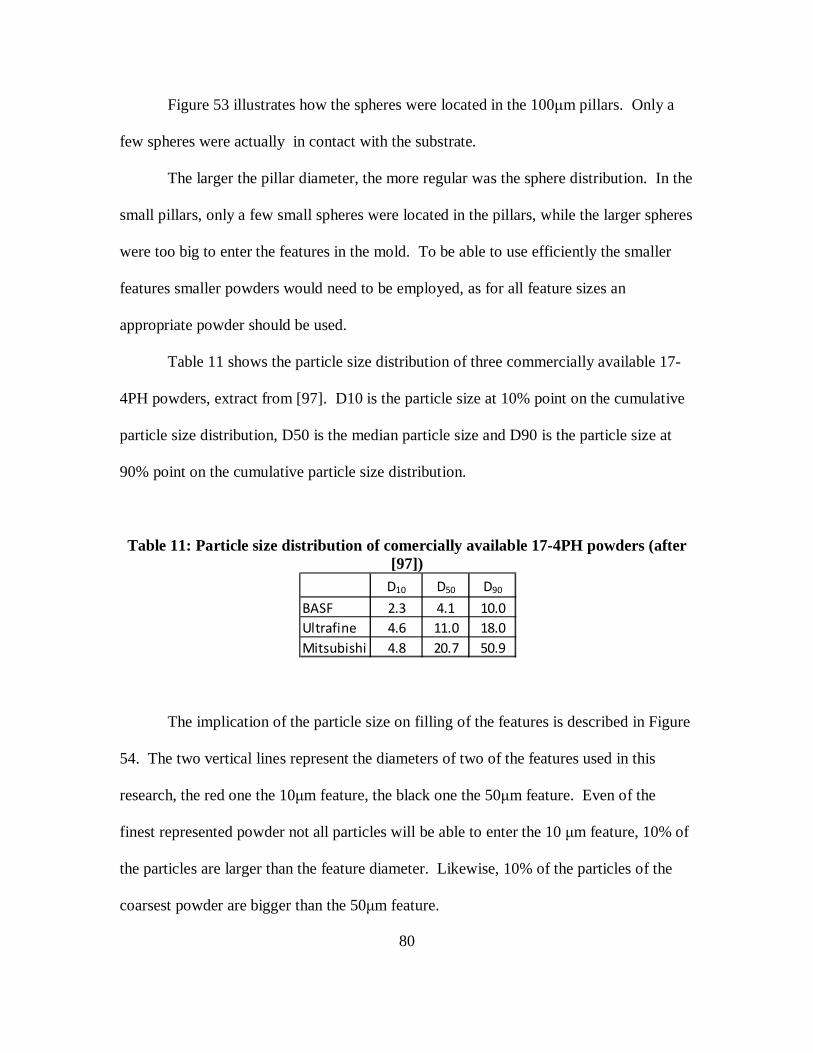
80
Figure 53 illustrates how the spheres were located in the 100µm pillars. Only a
few spheres were actually in contact with the substrate.
The larger the pillar diameter, the more regular was the sphere distribution. In the
small pillars, only a few small spheres were located in the pillars, while the larger spheres
were too big to enter the features in the mold. To be able to use efficiently the smaller
features smaller powders would need to be employed, as for all feature sizes an
appropriate powder should be used.
Table 11 shows the particle size distribution of three commercially available 17-
4PH powders, extract from [97]. D10 is the particle size at 10% point on the cumulative
particle size distribution, D50 is the median particle size and D90 is the particle size at
90% point on the cumulative particle size distribution.
Table 11: Particle size distribution of comercially available 17-4PH powders (after [97])
The implication of the particle size on filling of the features is described in Figure
54. The two vertical lines represent the diameters of two of the features used in this
research, the red one the 10µm feature, the black one the 50µm feature. Even of the
finest represented powder not all particles will be able to enter the 10 µm feature, 10% of
the particles are larger than the feature diameter. Likewise, 10% of the particles of the
coarsest powder are bigger than the 50µm feature.
D10 D50 D90
BASF 2.3 4.1 10.0Ultrafine 4.6 11.0 18.0Mitsubishi 4.8 20.7 50.9
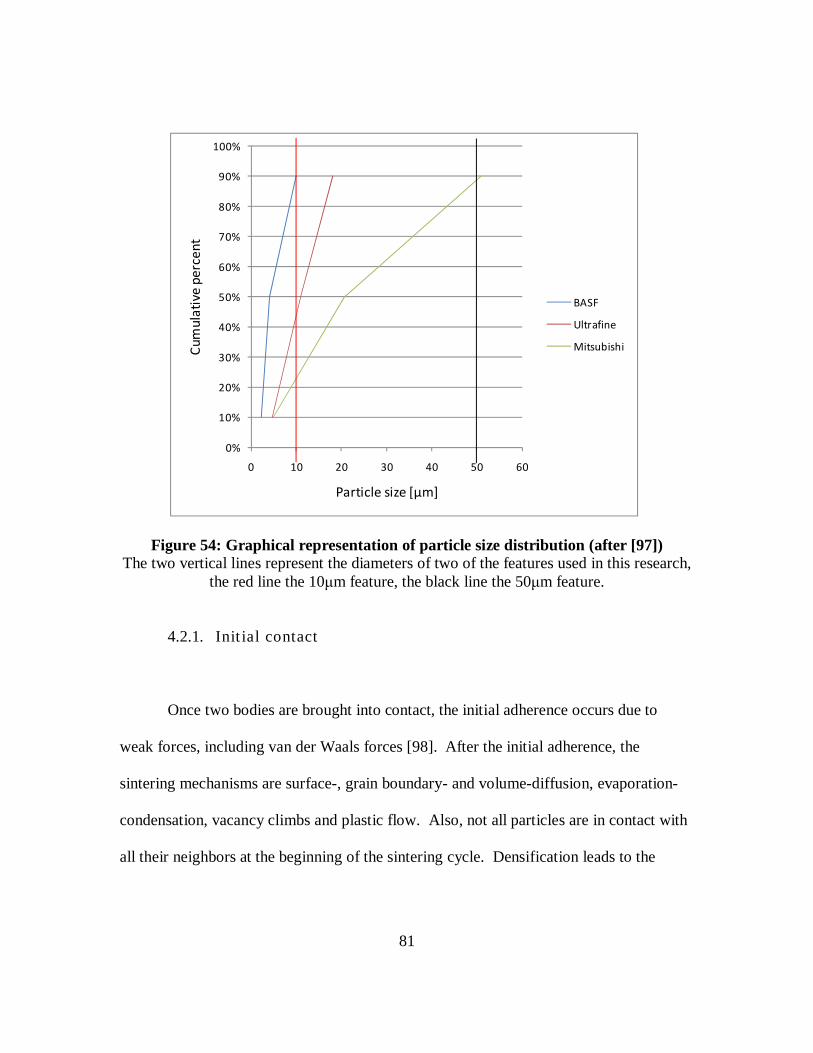
81
Figure 54: Graphical representation of particle size distribution (after [97]) The two vertical lines represent the diameters of two of the features used in this research,
the red line the 10µm feature, the black line the 50µm feature.
4.2.1. Init ial contact
Once two bodies are brought into contact, the initial adherence occurs due to
weak forces, including van der Waals forces [98]. After the initial adherence, the
sintering mechanisms are surface-, grain boundary- and volume-diffusion, evaporation-
condensation, vacancy climbs and plastic flow. Also, not all particles are in contact with
all their neighbors at the beginning of the sintering cycle. Densification leads to the
0%
10%
20%
30%
40%
50%
60%
70%
80%
90%
100%
0 10 20 30 40 50 60
Cumu
lative
perce
nt
Particle size [μm]
BASF
Ultrafine
Mitsubishi
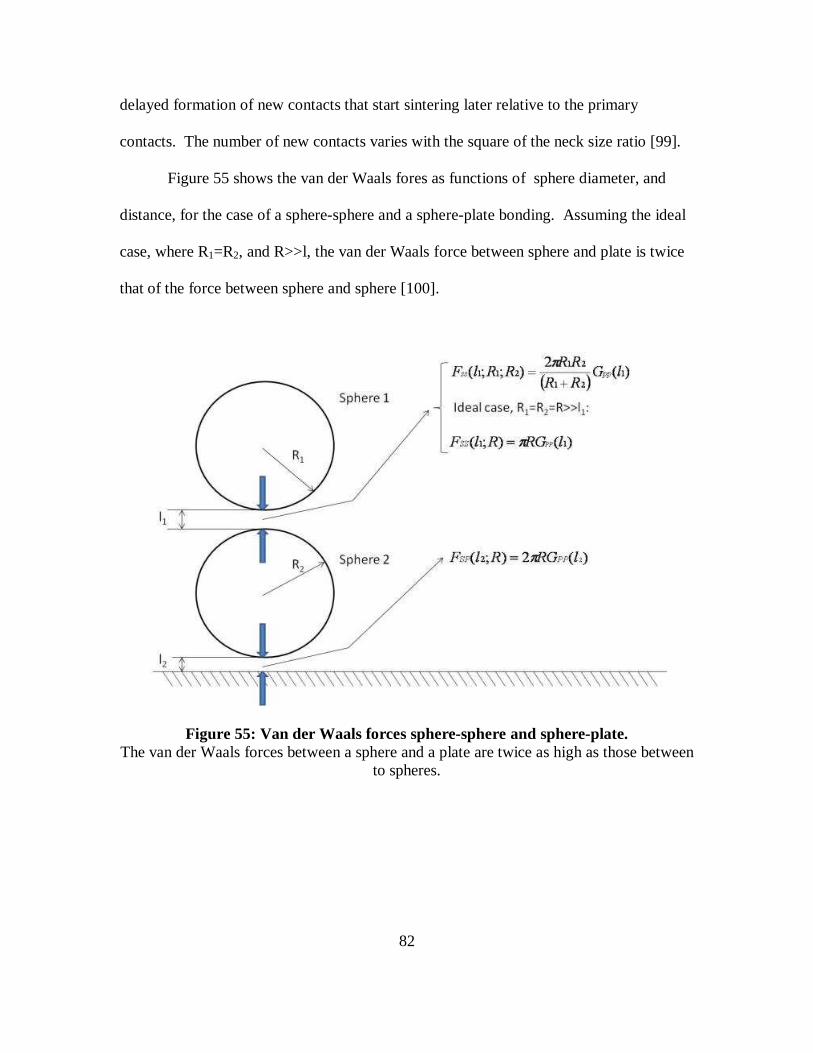
82
delayed formation of new contacts that start sintering later relative to the primary
contacts. The number of new contacts varies with the square of the neck size ratio [99].
Figure 55 shows the van der Waals fores as functions of sphere diameter, and
distance, for the case of a sphere-sphere and a sphere-plate bonding. Assuming the ideal
case, where R1=R2, and R>>l, the van der Waals force between sphere and plate is twice
that of the force between sphere and sphere [100].
Figure 55: Van der Waals forces sphere-sphere and sphere-plate. The van der Waals forces between a sphere and a plate are twice as high as those between
to spheres.
83
The interaction free energy G in the above figure is a function of the Hamaker
coefficient AHam and the geometry. The Hamaker coefficient depends on the material.
Since the bonding was between the same materials in the case of sphere-sphere and
sphere-plate, the Hamaker coefficient is the same in both cases.
Figure 56: Relative van der Waals forces. Depending on the size of the spheres, the van der Waals forces vary, but never reach the
magnitude as those between a sphere and a plate.
The van der Waals forces as functions of the geometries is illustrated in Figure
56. The three lines represent the relative forces between two spheres of the same size
(green), a sphere and a plate (red) and two spheres of different diameter, with one being
R=2.5, the second one being given on the horizontal axis (blue). The forces are
represented as relative forces and not absolut forces, because the materials are assumed to
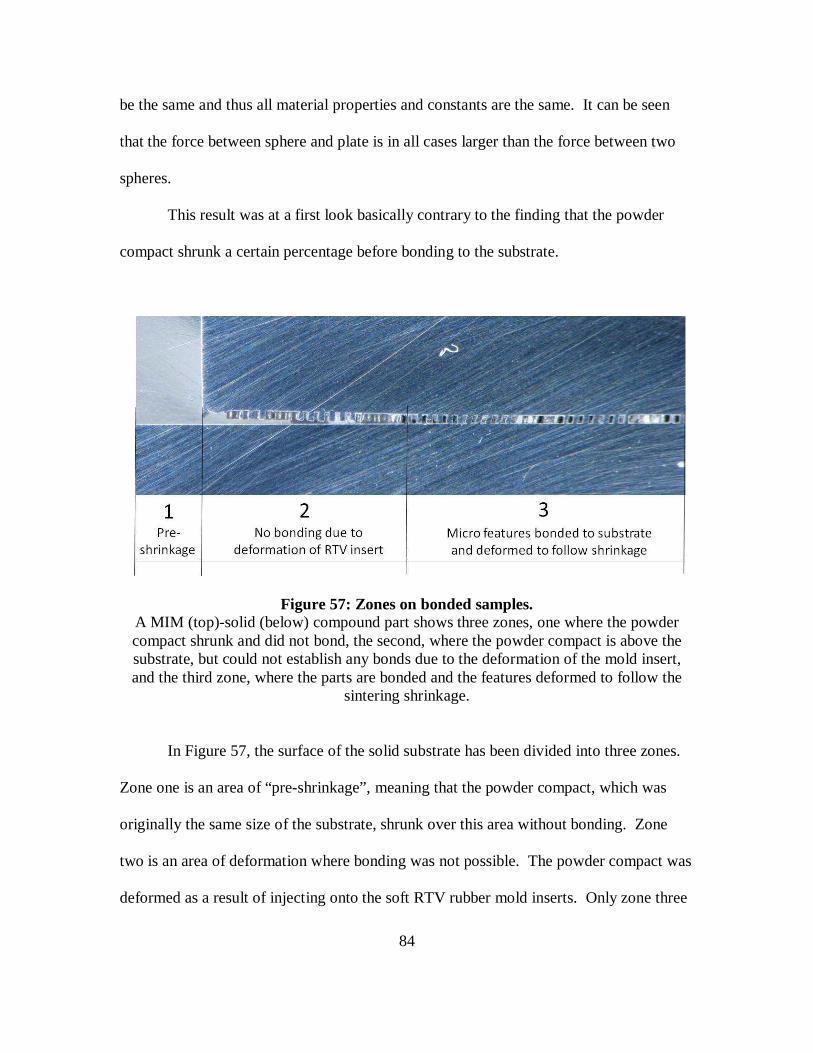
84
be the same and thus all material properties and constants are the same. It can be seen
that the force between sphere and plate is in all cases larger than the force between two
spheres.
This result was at a first look basically contrary to the finding that the powder
compact shrunk a certain percentage before bonding to the substrate.
Figure 57: Zones on bonded samples. A MIM (top)-solid (below) compound part shows three zones, one where the powder compact shrunk and did not bond, the second, where the powder compact is above the substrate, but could not establish any bonds due to the deformation of the mold insert, and the third zone, where the parts are bonded and the features deformed to follow the
sintering shrinkage.
In Figure 57, the surface of the solid substrate has been divided into three zones.
Zone one is an area of “pre-shrinkage”, meaning that the powder compact, which was
originally the same size of the substrate, shrunk over this area without bonding. Zone
two is an area of deformation where bonding was not possible. The powder compact was
deformed as a result of injecting onto the soft RTV rubber mold inserts. Only zone three
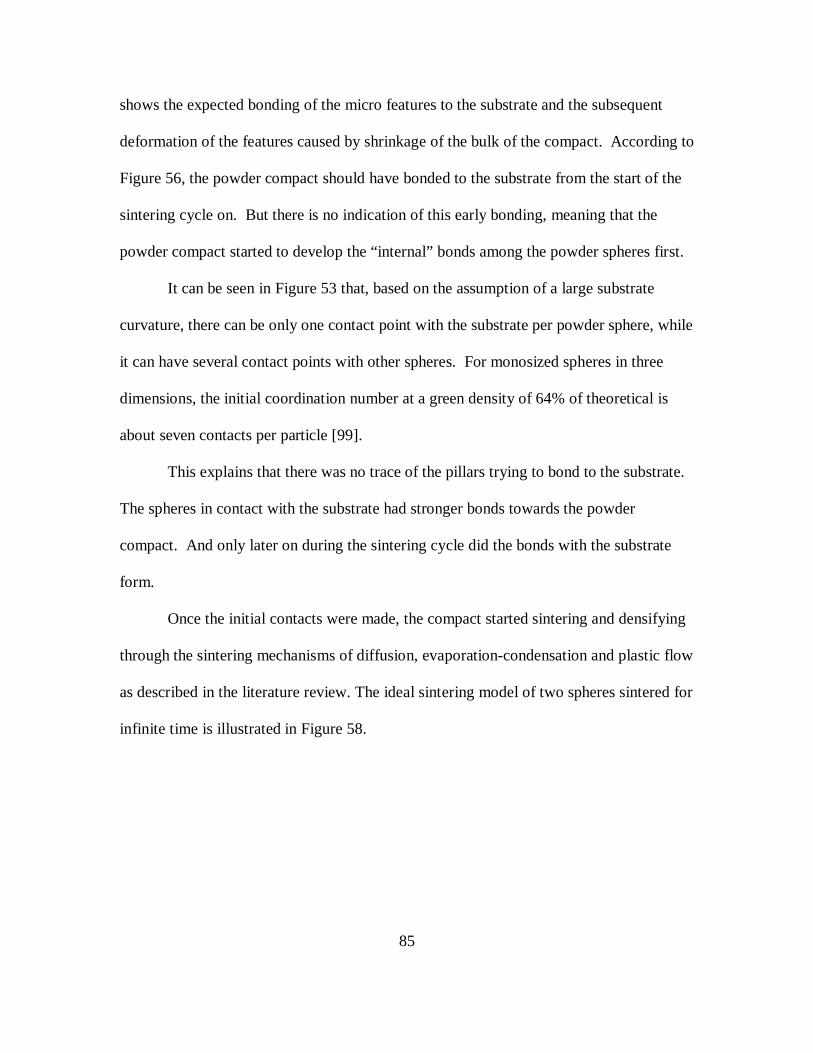
85
shows the expected bonding of the micro features to the substrate and the subsequent
deformation of the features caused by shrinkage of the bulk of the compact. According to
Figure 56, the powder compact should have bonded to the substrate from the start of the
sintering cycle on. But there is no indication of this early bonding, meaning that the
powder compact started to develop the “internal” bonds among the powder spheres first.
It can be seen in Figure 53 that, based on the assumption of a large substrate
curvature, there can be only one contact point with the substrate per powder sphere, while
it can have several contact points with other spheres. For monosized spheres in three
dimensions, the initial coordination number at a green density of 64% of theoretical is
about seven contacts per particle [99].
This explains that there was no trace of the pillars trying to bond to the substrate.
The spheres in contact with the substrate had stronger bonds towards the powder
compact. And only later on during the sintering cycle did the bonds with the substrate
form.
Once the initial contacts were made, the compact started sintering and densifying
through the sintering mechanisms of diffusion, evaporation-condensation and plastic flow
as described in the literature review. The ideal sintering model of two spheres sintered for
infinite time is illustrated in Figure 58.
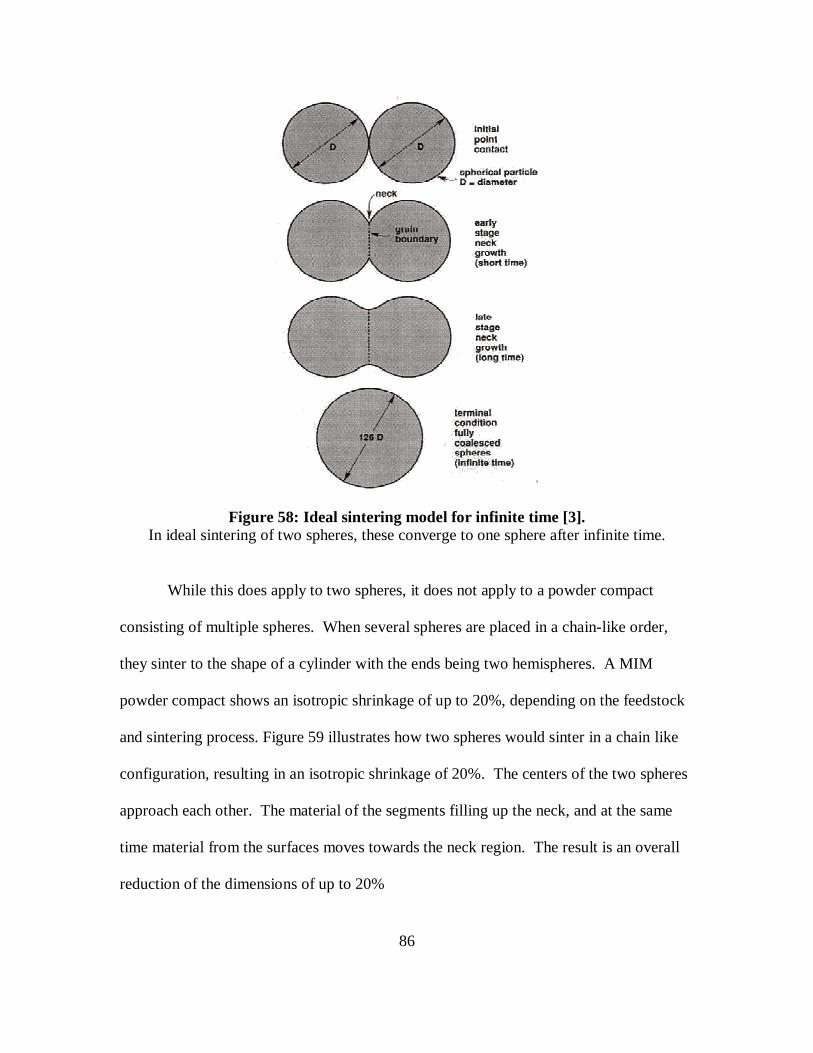
86
Figure 58: Ideal sintering model for infinite time [3]. In ideal sintering of two spheres, these converge to one sphere after infinite time.
While this does apply to two spheres, it does not apply to a powder compact
consisting of multiple spheres. When several spheres are placed in a chain-like order,
they sinter to the shape of a cylinder with the ends being two hemispheres. A MIM
powder compact shows an isotropic shrinkage of up to 20%, depending on the feedstock
and sintering process. Figure 59 illustrates how two spheres would sinter in a chain like
configuration, resulting in an isotropic shrinkage of 20%. The centers of the two spheres
approach each other. The material of the segments filling up the neck, and at the same
time material from the surfaces moves towards the neck region. The result is an overall
reduction of the dimensions of up to 20%
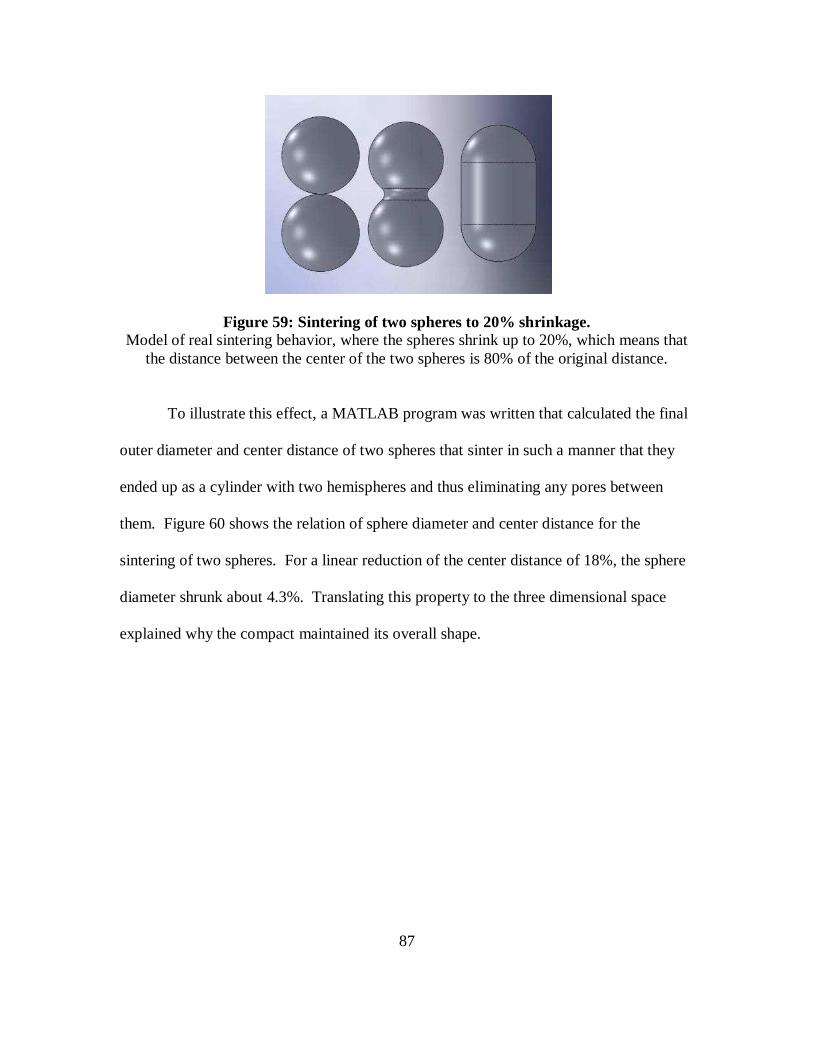
87
Figure 59: Sintering of two spheres to 20% shrinkage. Model of real sintering behavior, where the spheres shrink up to 20%, which means that
the distance between the center of the two spheres is 80% of the original distance.
To illustrate this effect, a MATLAB program was written that calculated the final
outer diameter and center distance of two spheres that sinter in such a manner that they
ended up as a cylinder with two hemispheres and thus eliminating any pores between
them. Figure 60 shows the relation of sphere diameter and center distance for the
sintering of two spheres. For a linear reduction of the center distance of 18%, the sphere
diameter shrunk about 4.3%. Translating this property to the three dimensional space
explained why the compact maintained its overall shape.
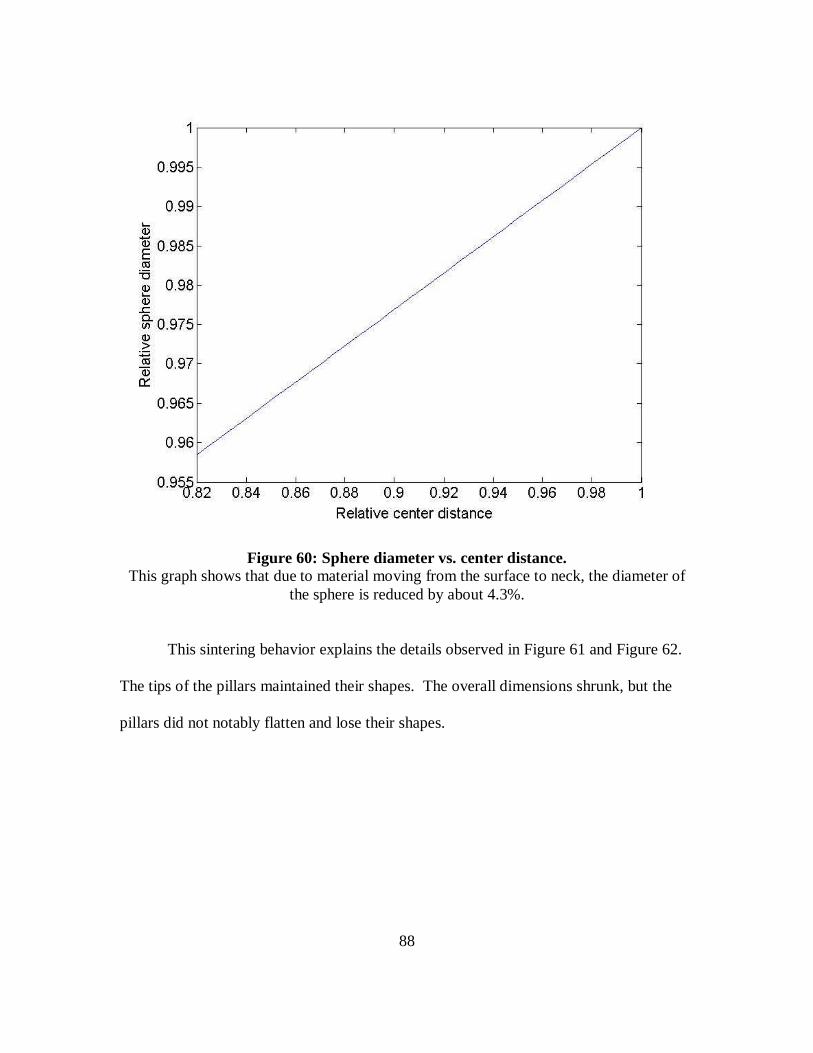
88
Figure 60: Sphere diameter vs. center distance. This graph shows that due to material moving from the surface to neck, the diameter of
the sphere is reduced by about 4.3%.
This sintering behavior explains the details observed in Figure 61 and Figure 62.
The tips of the pillars maintained their shapes. The overall dimensions shrunk, but the
pillars did not notably flatten and lose their shapes.
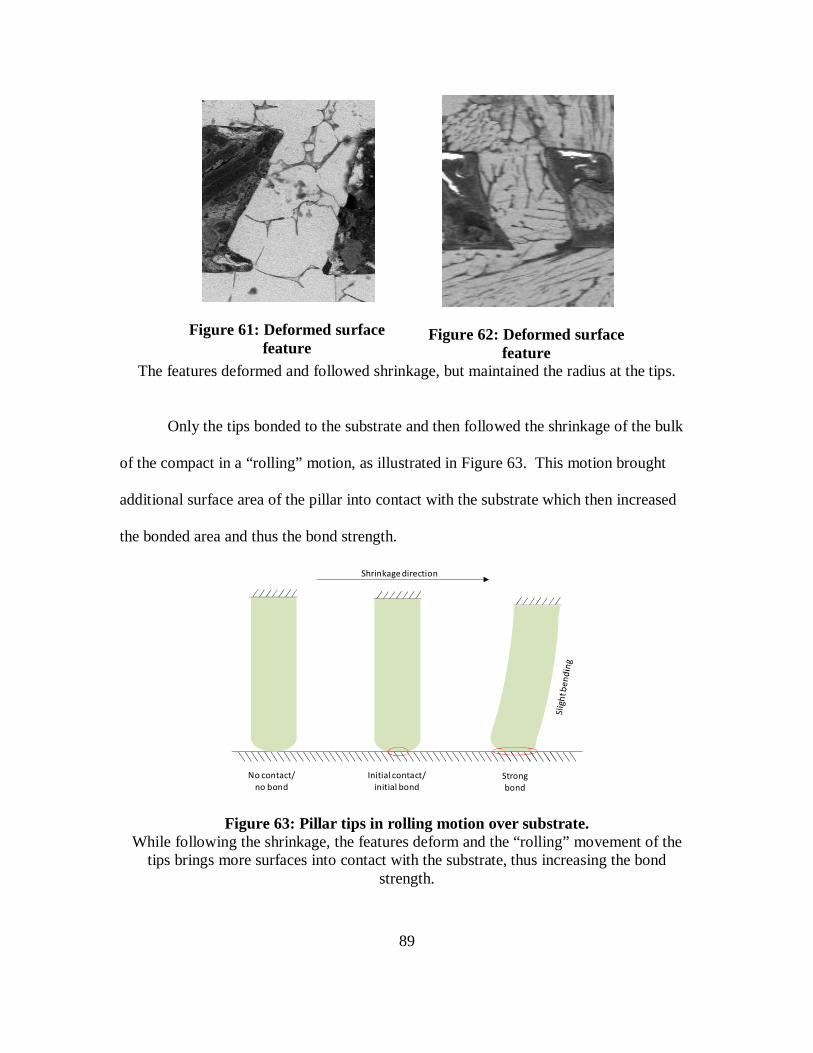
89
Figure 61: Deformed surface feature
Figure 62: Deformed surface feature
The features deformed and followed shrinkage, but maintained the radius at the tips.
Only the tips bonded to the substrate and then followed the shrinkage of the bulk
of the compact in a “rolling” motion, as illustrated in Figure 63. This motion brought
additional surface area of the pillar into contact with the substrate which then increased
the bonded area and thus the bond strength.
Figure 63: Pillar tips in rolling motion over substrate. While following the shrinkage, the features deform and the “rolling” movement of the
tips brings more surfaces into contact with the substrate, thus increasing the bond strength.
No contact/no bond
Initial contact/initial bond
Strong bond
Shrinkage direction
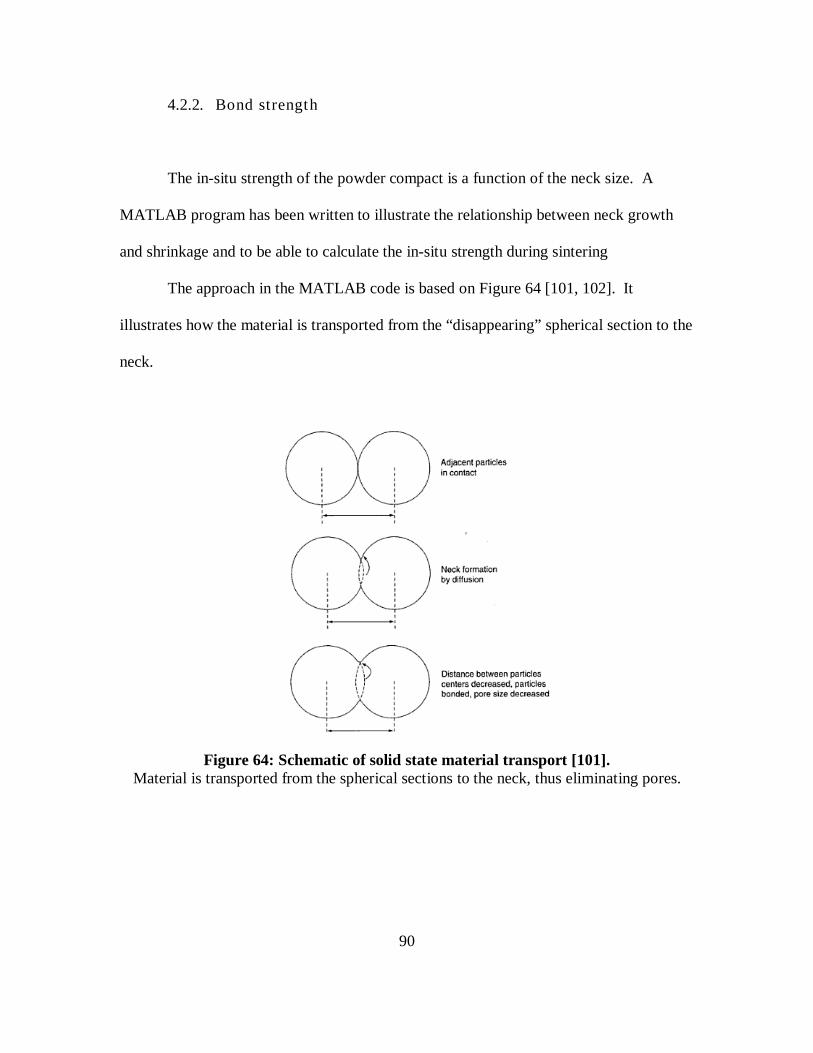
90
4.2.2. Bond strength
The in-situ strength of the powder compact is a function of the neck size. A
MATLAB program has been written to illustrate the relationship between neck growth
and shrinkage and to be able to calculate the in-situ strength during sintering
The approach in the MATLAB code is based on Figure 64 [101, 102]. It
illustrates how the material is transported from the “disappearing” spherical section to the
neck.
Figure 64: Schematic of solid state material transport [101]. Material is transported from the spherical sections to the neck, thus eliminating pores.
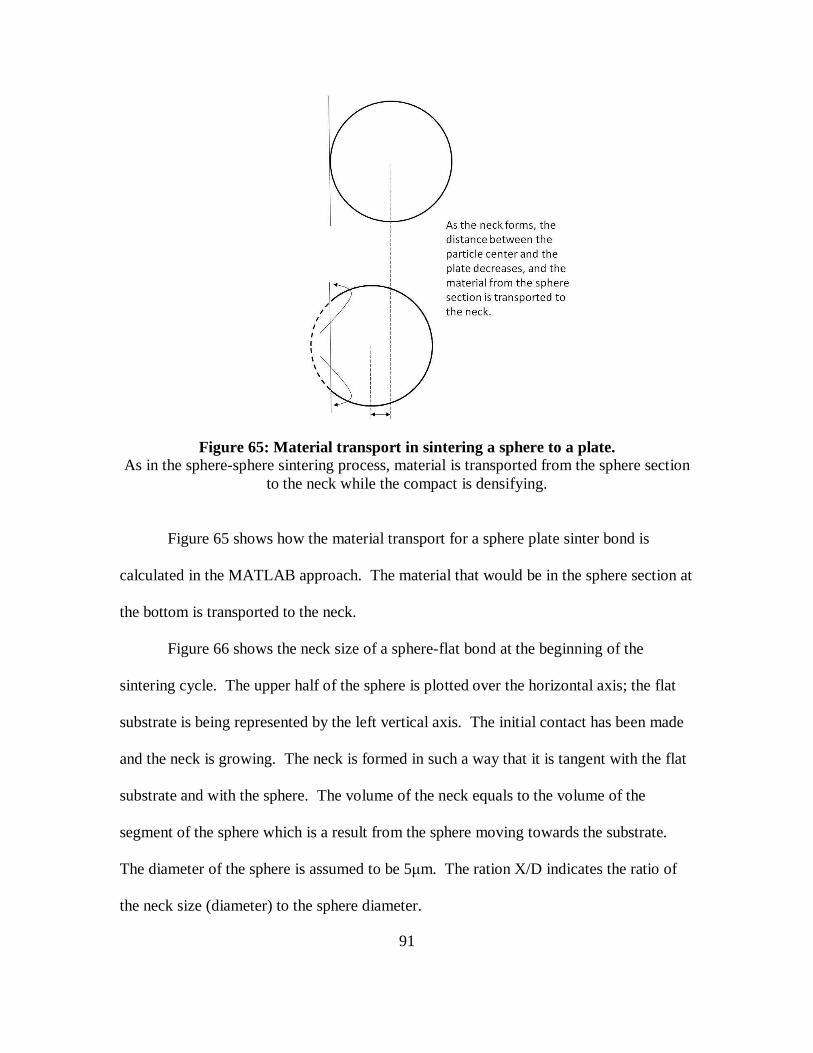
91
Figure 65: Material transport in sintering a sphere to a plate. As in the sphere-sphere sintering process, material is transported from the sphere section
to the neck while the compact is densifying.
Figure 65 shows how the material transport for a sphere plate sinter bond is
calculated in the MATLAB approach. The material that would be in the sphere section at
the bottom is transported to the neck.
Figure 66 shows the neck size of a sphere-flat bond at the beginning of the
sintering cycle. The upper half of the sphere is plotted over the horizontal axis; the flat
substrate is being represented by the left vertical axis. The initial contact has been made
and the neck is growing. The neck is formed in such a way that it is tangent with the flat
substrate and with the sphere. The volume of the neck equals to the volume of the
segment of the sphere which is a result from the sphere moving towards the substrate.
The diameter of the sphere is assumed to be 5µm. The ration X/D indicates the ratio of
the neck size (diameter) to the sphere diameter.
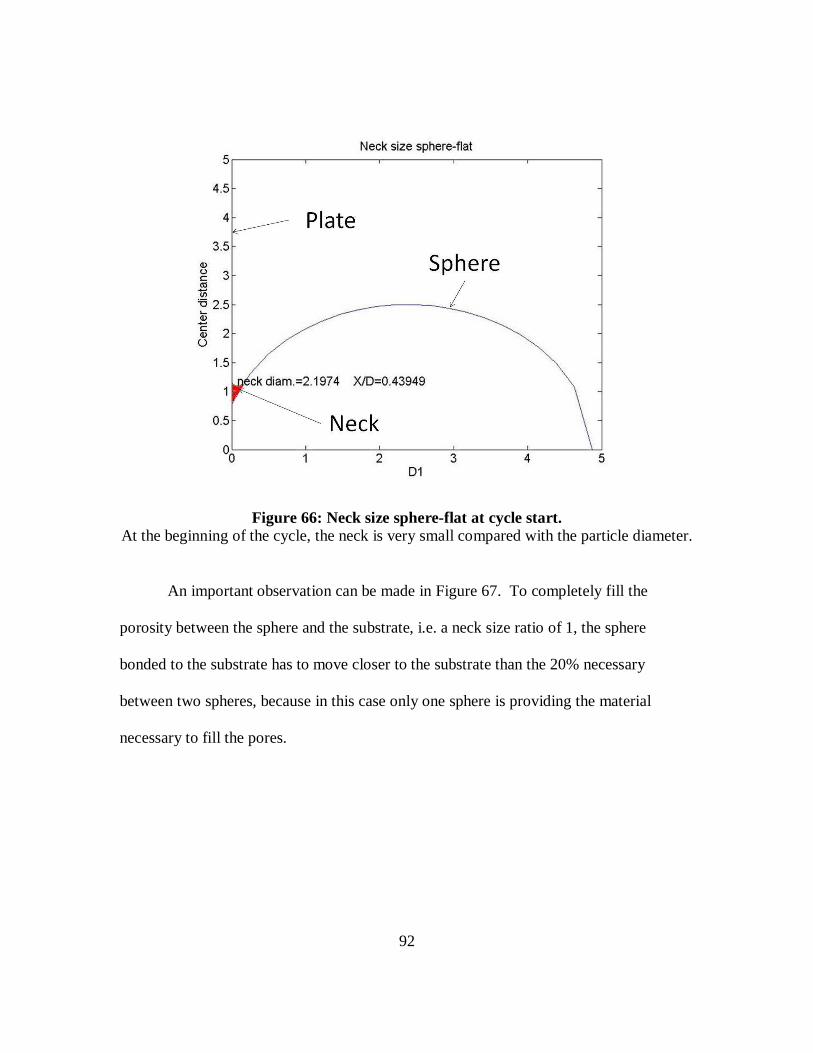
92
Figure 66: Neck size sphere-flat at cycle start. At the beginning of the cycle, the neck is very small compared with the particle diameter.
An important observation can be made in Figure 67. To completely fill the
porosity between the sphere and the substrate, i.e. a neck size ratio of 1, the sphere
bonded to the substrate has to move closer to the substrate than the 20% necessary
between two spheres, because in this case only one sphere is providing the material
necessary to fill the pores.
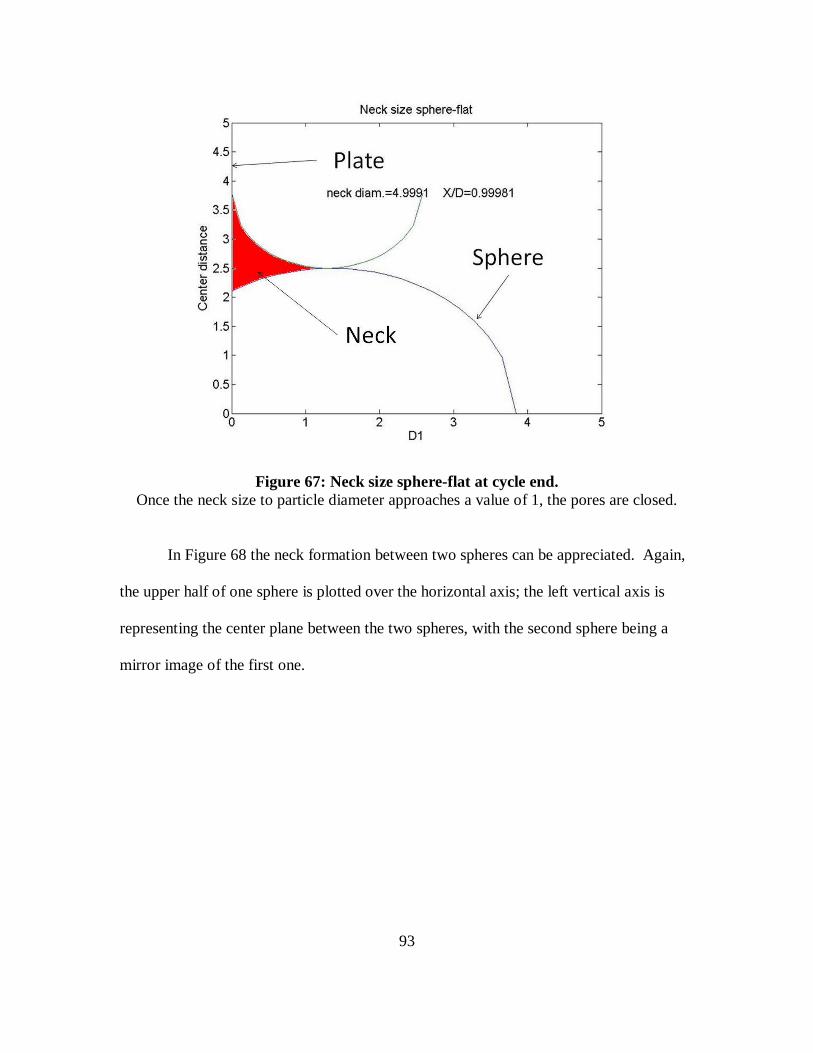
93
Figure 67: Neck size sphere-flat at cycle end. Once the neck size to particle diameter approaches a value of 1, the pores are closed.
In Figure 68 the neck formation between two spheres can be appreciated. Again,
the upper half of one sphere is plotted over the horizontal axis; the left vertical axis is
representing the center plane between the two spheres, with the second sphere being a
mirror image of the first one.
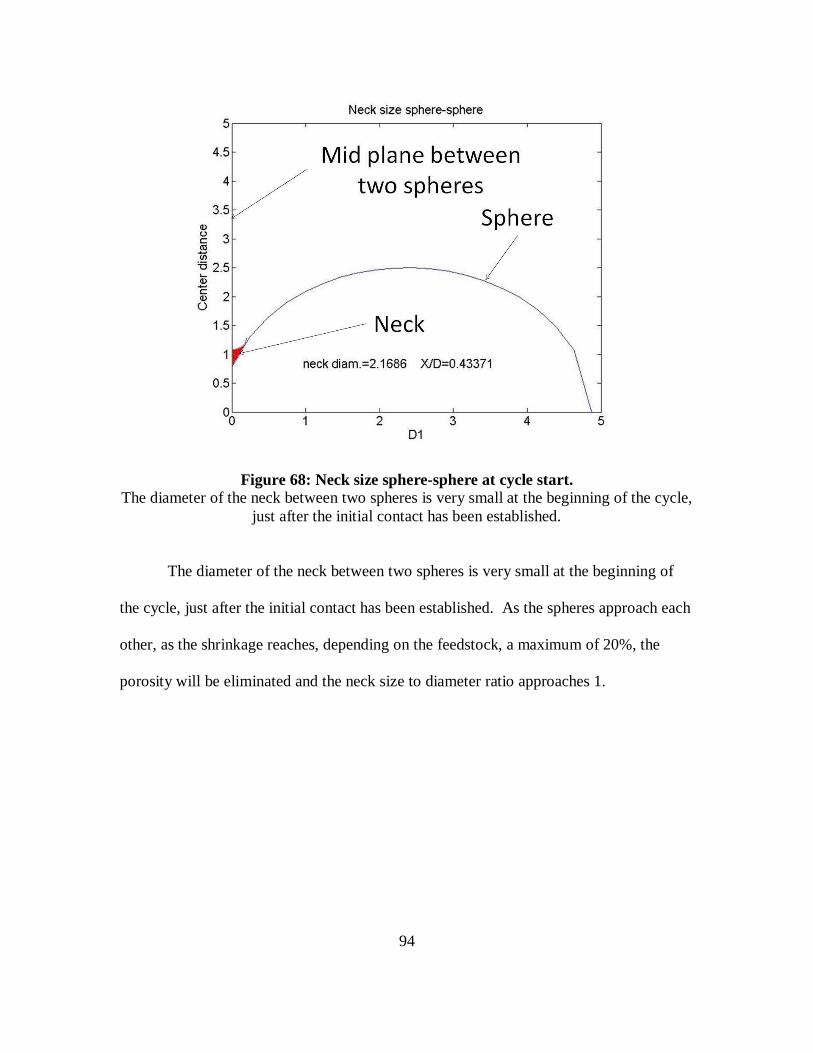
94
Figure 68: Neck size sphere-sphere at cycle start. The diameter of the neck between two spheres is very small at the beginning of the cycle,
just after the initial contact has been established.
The diameter of the neck between two spheres is very small at the beginning of
the cycle, just after the initial contact has been established. As the spheres approach each
other, as the shrinkage reaches, depending on the feedstock, a maximum of 20%, the
porosity will be eliminated and the neck size to diameter ratio approaches 1.
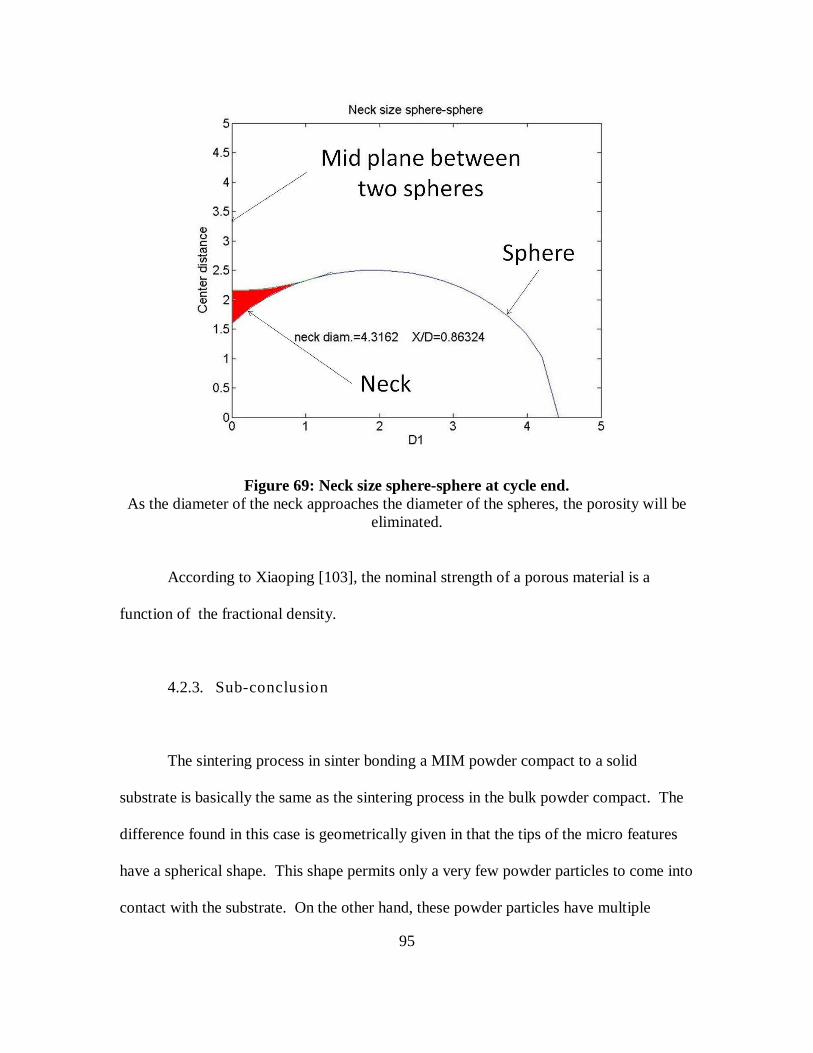
95
Figure 69: Neck size sphere-sphere at cycle end. As the diameter of the neck approaches the diameter of the spheres, the porosity will be
eliminated.
According to Xiaoping [103], the nominal strength of a porous material is a
function of the fractional density.
4.2.3. Sub-conclusion
The sintering process in sinter bonding a MIM powder compact to a solid
substrate is basically the same as the sintering process in the bulk powder compact. The
difference found in this case is geometrically given in that the tips of the micro features
have a spherical shape. This shape permits only a very few powder particles to come into
contact with the substrate. On the other hand, these powder particles have multiple

96
contacts with other particles inside the powder compact. This configuration inhibits
bonding of the MIM compact to the substrate at an early stage of the sintering cycle.
Although van der Waals forces are stronger between a sphere and a plate than between
two spheres, due to the number of contacts, initial contacts will be made inside the
powder compact. Even if the tip of the feature was flat, there could still be only one point
of contact between a powder particle and the substrate with multiple contacts between the
same powder particle and other particles in the compact. Once the bonds are established,
either between plate and sphere, or between two or more spheres, the sintering
mechanisms are the same as in the classic sintering models. The mechanisms for neck
growth and densification, surface diffusion, volume diffusion, grain boundary diffusion,
lattice diffusion evaporation-condensation and plastic flow [104] are the same as has been
shown in the literature review.
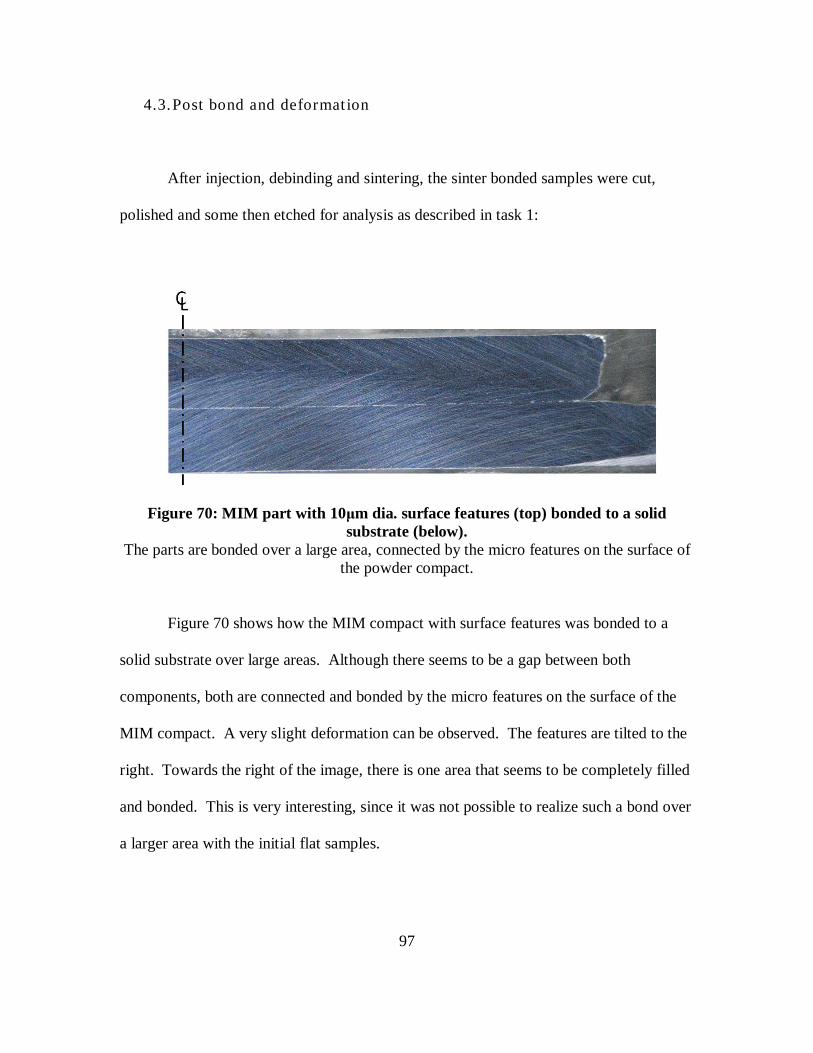
97
4.3. Post bond and deformat ion
After injection, debinding and sintering, the sinter bonded samples were cut,
polished and some then etched for analysis as described in task 1:
Figure 70: MIM part with 10 µm dia. surface features (top) bonded to a solid substrate (below).
The parts are bonded over a large area, connected by the micro features on the surface of the powder compact.
Figure 70 shows how the MIM compact with surface features was bonded to a
solid substrate over large areas. Although there seems to be a gap between both
components, both are connected and bonded by the micro features on the surface of the
MIM compact. A very slight deformation can be observed. The features are tilted to the
right. Towards the right of the image, there is one area that seems to be completely filled
and bonded. This is very interesting, since it was not possible to realize such a bond over
a larger area with the initial flat samples.
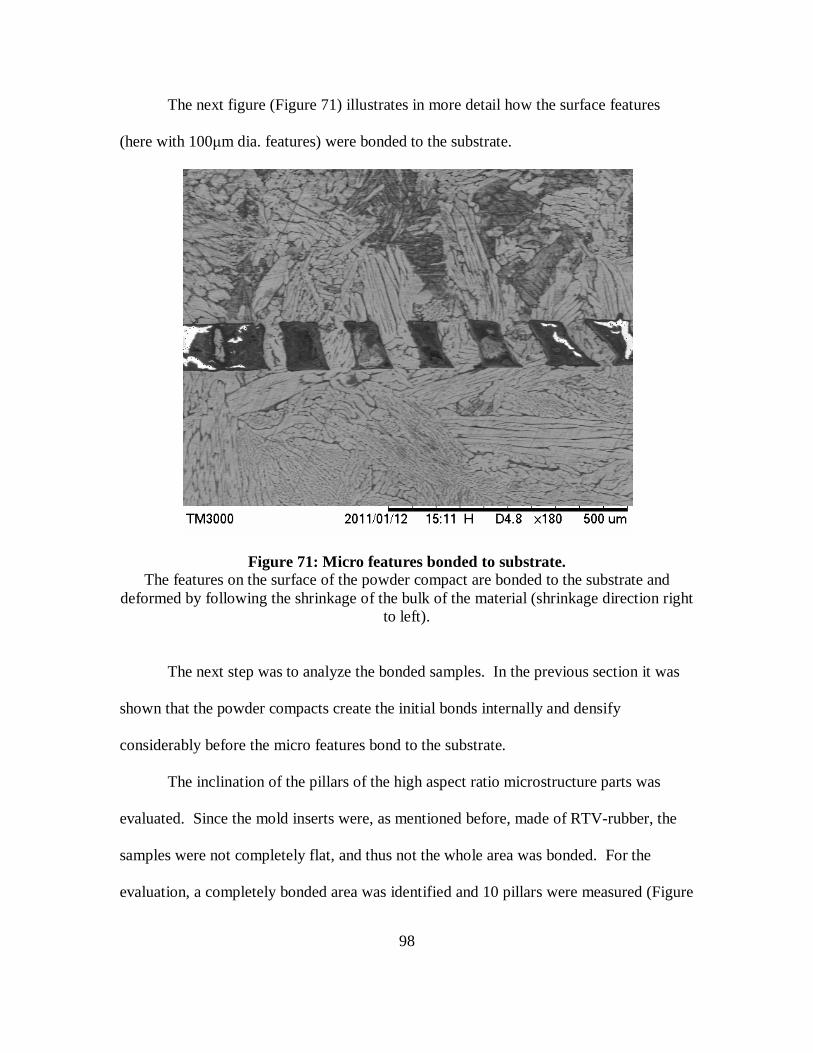
98
The next figure (Figure 71) illustrates in more detail how the surface features
(here with 100µm dia. features) were bonded to the substrate.
Figure 71: Micro features bonded to substrate. The features on the surface of the powder compact are bonded to the substrate and
deformed by following the shrinkage of the bulk of the material (shrinkage direction right to left).
The next step was to analyze the bonded samples. In the previous section it was
shown that the powder compacts create the initial bonds internally and densify
considerably before the micro features bond to the substrate.
The inclination of the pillars of the high aspect ratio microstructure parts was
evaluated. Since the mold inserts were, as mentioned before, made of RTV-rubber, the
samples were not completely flat, and thus not the whole area was bonded. For the
evaluation, a completely bonded area was identified and 10 pillars were measured (Figure
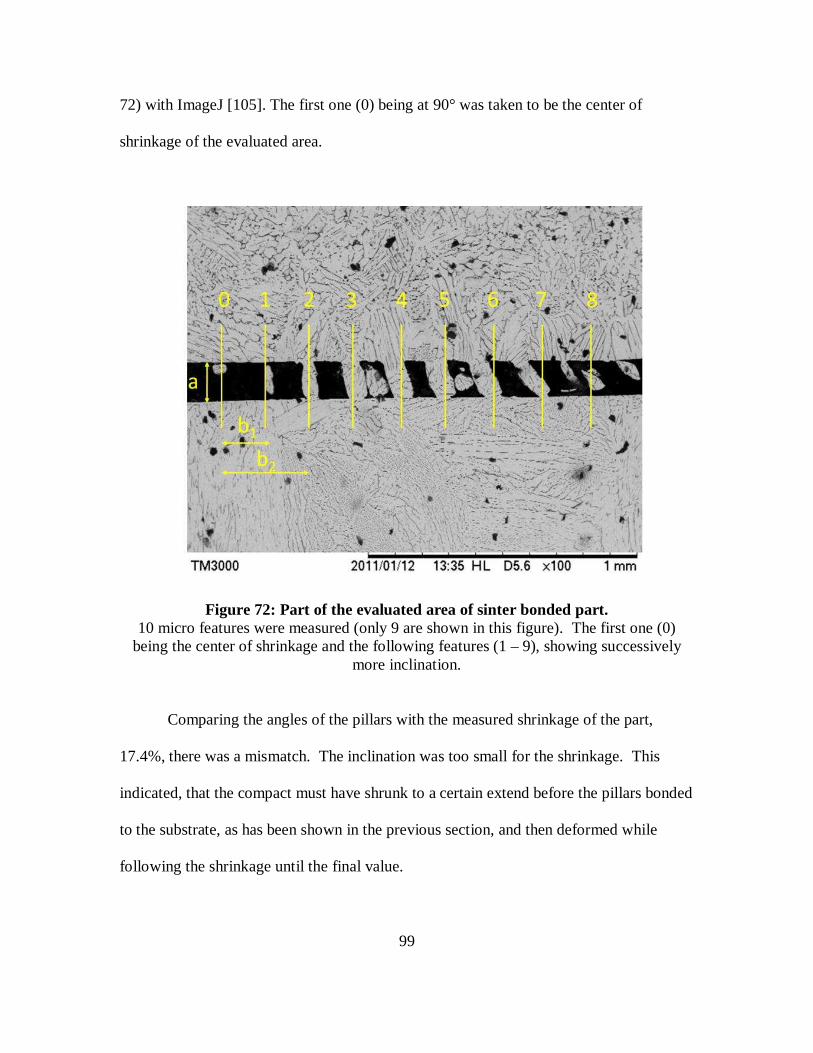
99
72) with ImageJ [105]. The first one (0) being at 90° was taken to be the center of
shrinkage of the evaluated area.
Figure 72: Part of the evaluated area of sinter bonded part. 10 micro features were measured (only 9 are shown in this figure). The first one (0)
being the center of shrinkage and the following features (1 – 9), showing successively more inclination.
Comparing the angles of the pillars with the measured shrinkage of the part,
17.4%, there was a mismatch. The inclination was too small for the shrinkage. This
indicated, that the compact must have shrunk to a certain extend before the pillars bonded
to the substrate, as has been shown in the previous section, and then deformed while
following the shrinkage until the final value.
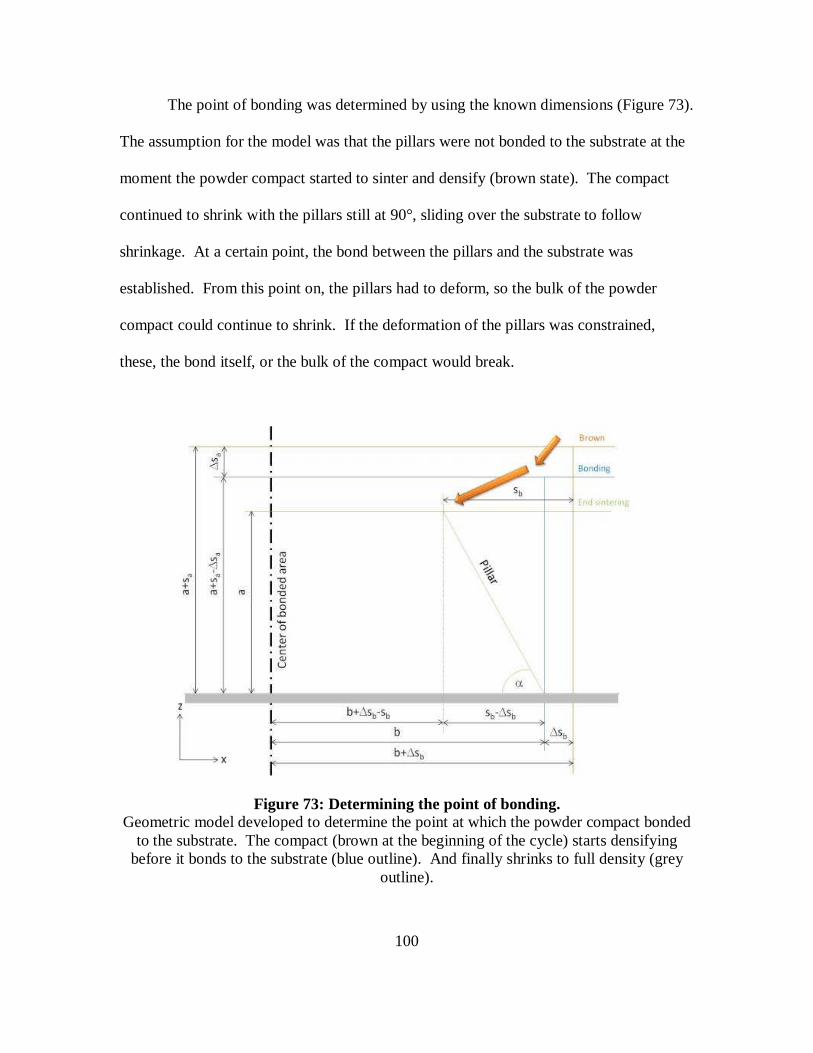
100
The point of bonding was determined by using the known dimensions (Figure 73).
The assumption for the model was that the pillars were not bonded to the substrate at the
moment the powder compact started to sinter and densify (brown state). The compact
continued to shrink with the pillars still at 90°, sliding over the substrate to follow
shrinkage. At a certain point, the bond between the pillars and the substrate was
established. From this point on, the pillars had to deform, so the bulk of the powder
compact could continue to shrink. If the deformation of the pillars was constrained,
these, the bond itself, or the bulk of the compact would break.
Figure 73: Determining the point of bonding. Geometric model developed to determine the point at which the powder compact bonded
to the substrate. The compact (brown at the beginning of the cycle) starts densifying before it bonds to the substrate (blue outline). And finally shrinks to full density (grey
outline).
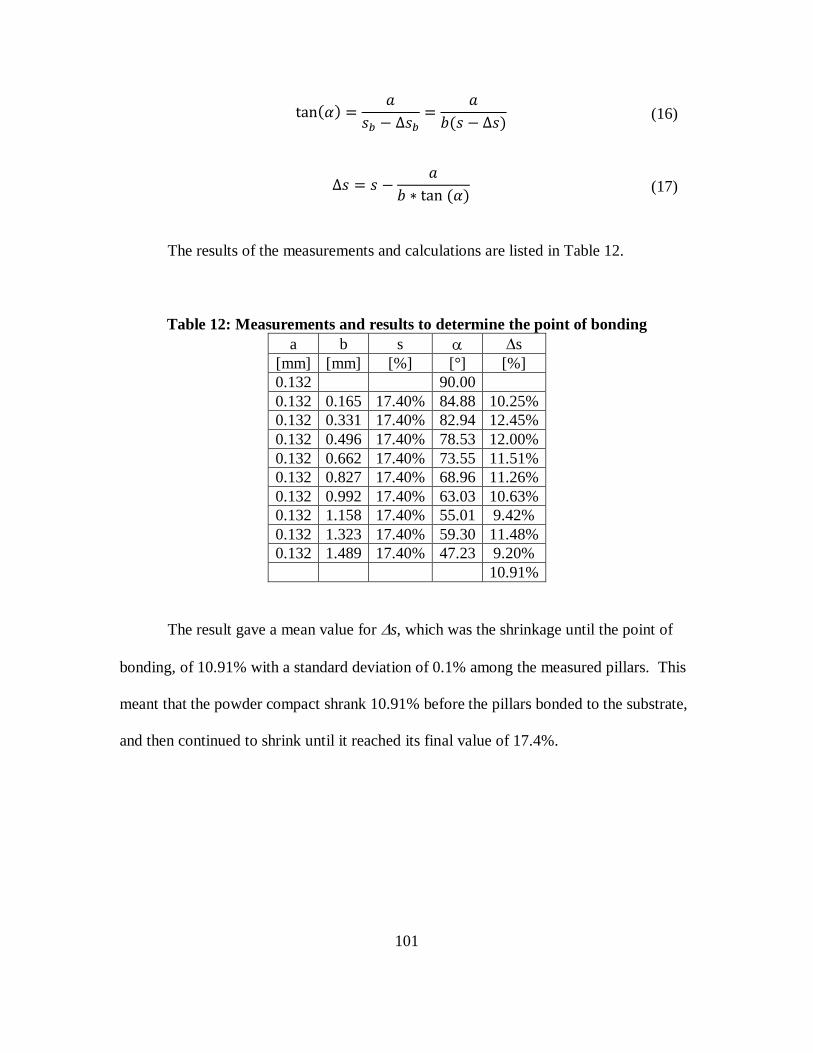
101
tan��� � �G� ∆G� � �3�G ∆G� (16)
∆G � G �3 5 tan ��� (17)
The results of the measurements and calculations are listed in Table 12.
Table 12: Measurements and results to determine the point of bonding a b s α ∆s
[mm] [mm] [%] [°] [%] 0.132 90.00 0.132 0.165 17.40% 84.88 10.25% 0.132 0.331 17.40% 82.94 12.45% 0.132 0.496 17.40% 78.53 12.00% 0.132 0.662 17.40% 73.55 11.51% 0.132 0.827 17.40% 68.96 11.26% 0.132 0.992 17.40% 63.03 10.63% 0.132 1.158 17.40% 55.01 9.42% 0.132 1.323 17.40% 59.30 11.48% 0.132 1.489 17.40% 47.23 9.20%
10.91%
The result gave a mean value for ∆s, which was the shrinkage until the point of
bonding, of 10.91% with a standard deviation of 0.1% among the measured pillars. This
meant that the powder compact shrank 10.91% before the pillars bonded to the substrate,
and then continued to shrink until it reached its final value of 17.4%.
102
4.4. Post bonding deformat ion and simulat ion
The Master Sintering Curve (MCS) approach had been chosen to calculate the
densification over the sintering cycle. As described in the literature review, the MSC
method can predict densification behavior under arbitrary temperature-time excursions
following a minimal set of preliminary experiments [59]. In this case the advantage was
that the preliminary experiments had been performed by BASF, the feedstock provider.
However, the MSC as simple empirical approach to predict densification behavior has
some limitations (i.e., a unique sintering path as function of density is prescribed) which
constrains the flexibility of the modeling [106].
4.4.1. Calculat ing sintering shrinkage
Shrinkage is caused by elimination of the pores between the powder particles
during the sintering cycle. Mass is transported by bulk transport processes as grain
boundary diffusion, volume diffusion and plastic flow. Vacancies from the pores migrate
through the lattice or along grain boundaries, giving a reverse flow of mass into the pores
[3].
The driving force for mass flow is the sintering stress. The smaller the particles,
the greater the driving force and sintering requires mass flow to respond to the inherent
stress.
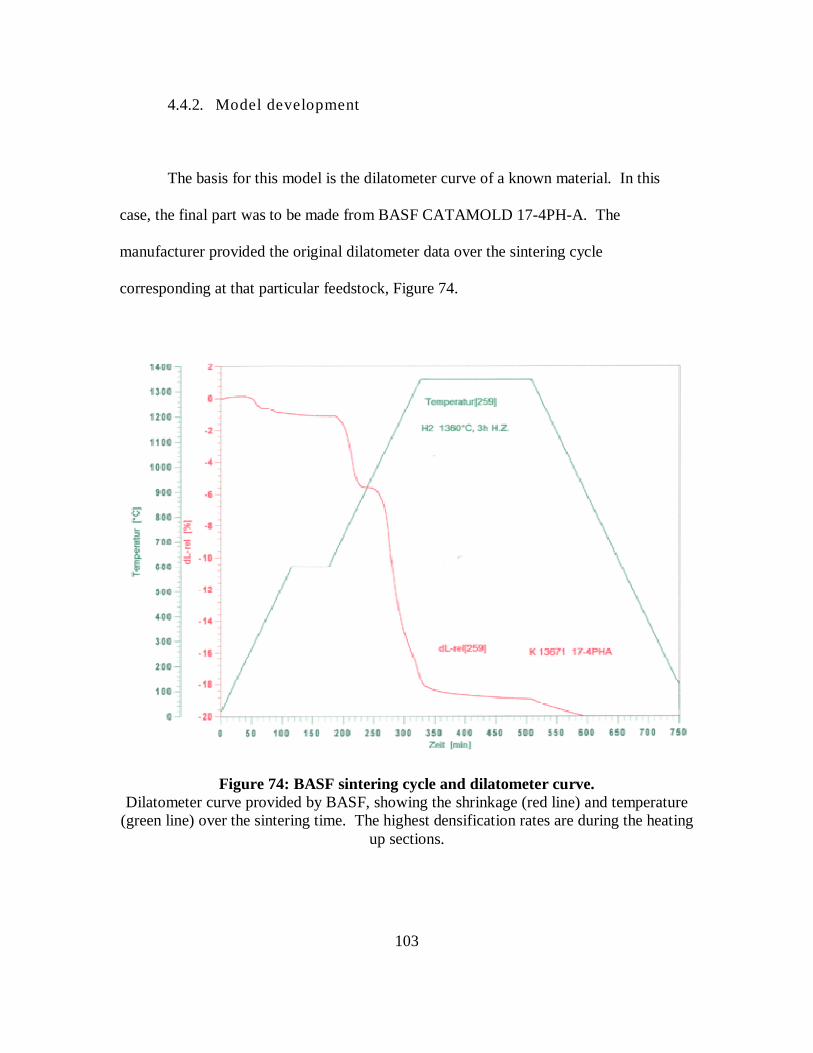
103
4.4.2. Model development
The basis for this model is the dilatometer curve of a known material. In this
case, the final part was to be made from BASF CATAMOLD 17-4PH-A. The
manufacturer provided the original dilatometer data over the sintering cycle
corresponding at that particular feedstock, Figure 74.
Figure 74: BASF sintering cycle and dilatometer curve. Dilatometer curve provided by BASF, showing the shrinkage (red line) and temperature
(green line) over the sintering time. The highest densification rates are during the heating up sections.
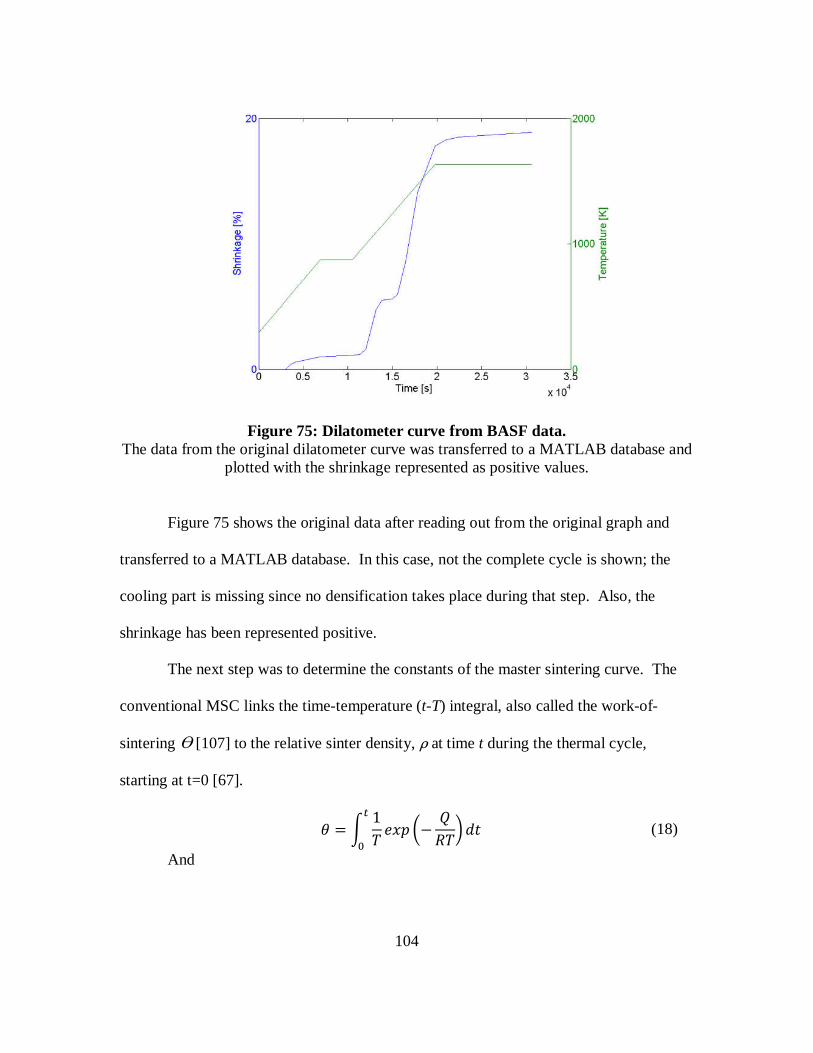
104
Figure 75: Dilatometer curve from BASF data. The data from the original dilatometer curve was transferred to a MATLAB database and
plotted with the shrinkage represented as positive values.
Figure 75 shows the original data after reading out from the original graph and
transferred to a MATLAB database. In this case, not the complete cycle is shown; the
cooling part is missing since no densification takes place during that step. Also, the
shrinkage has been represented positive.
The next step was to determine the constants of the master sintering curve. The
conventional MSC links the time-temperature (t-T) integral, also called the work-of-
sintering � [107] to the relative sinter density, ρ at time t during the thermal cycle,
starting at t=0 [67].
+ � , 1 "#� $ %� &0(�
(18)
And
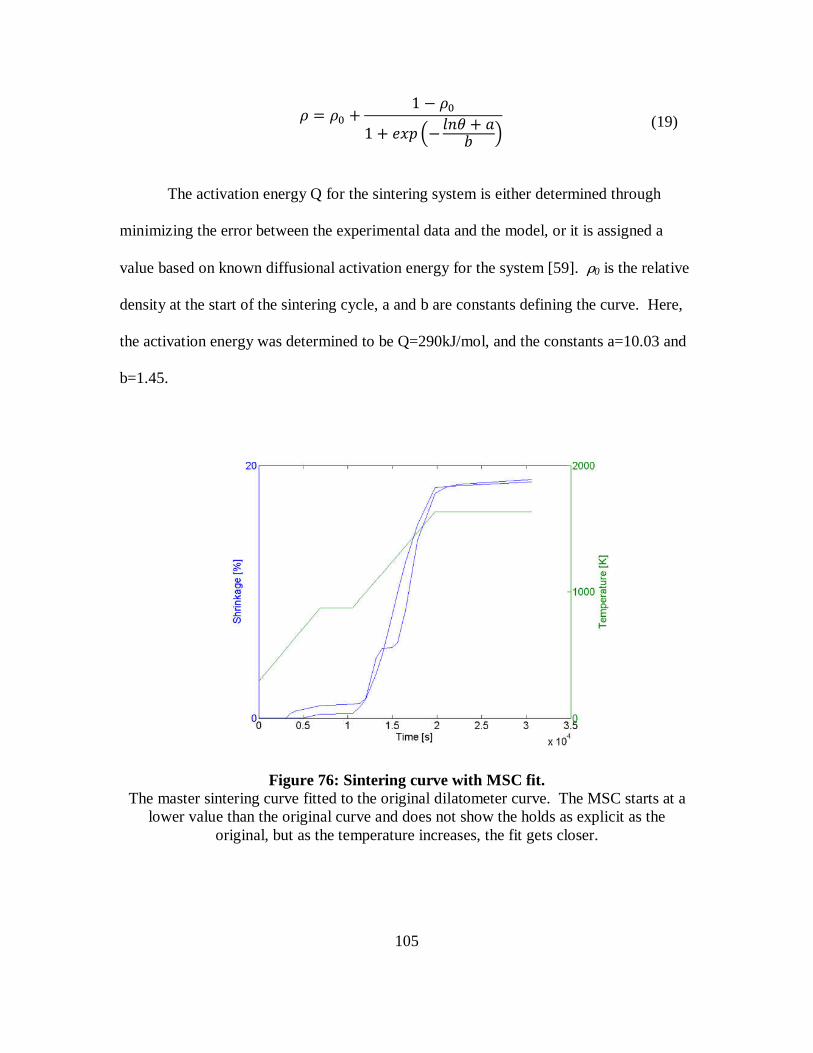
105
� � � � 1 � 1 � "#� H 42+ � �3 I (19)
The activation energy Q for the sintering system is either determined through
minimizing the error between the experimental data and the model, or it is assigned a
value based on known diffusional activation energy for the system [59]. ρ0 is the relative
density at the start of the sintering cycle, a and b are constants defining the curve. Here,
the activation energy was determined to be Q=290kJ/mol, and the constants a=10.03 and
b=1.45.
Figure 76: Sintering curve with MSC fit. The master sintering curve fitted to the original dilatometer curve. The MSC starts at a
lower value than the original curve and does not show the holds as explicit as the original, but as the temperature increases, the fit gets closer.
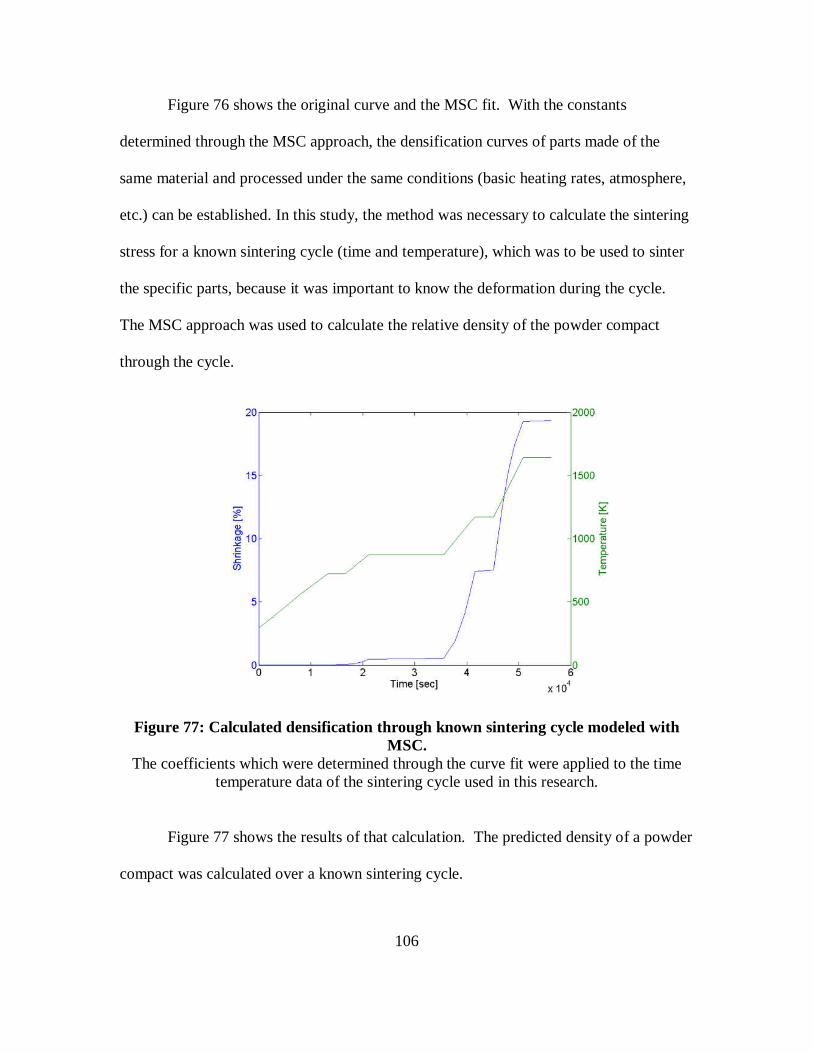
106
Figure 76 shows the original curve and the MSC fit. With the constants
determined through the MSC approach, the densification curves of parts made of the
same material and processed under the same conditions (basic heating rates, atmosphere,
etc.) can be established. In this study, the method was necessary to calculate the sintering
stress for a known sintering cycle (time and temperature), which was to be used to sinter
the specific parts, because it was important to know the deformation during the cycle.
The MSC approach was used to calculate the relative density of the powder compact
through the cycle.
Figure 77: Calculated densification through known sintering cycle modeled with MSC.
The coefficients which were determined through the curve fit were applied to the time temperature data of the sintering cycle used in this research.
Figure 77 shows the results of that calculation. The predicted density of a powder
compact was calculated over a known sintering cycle.
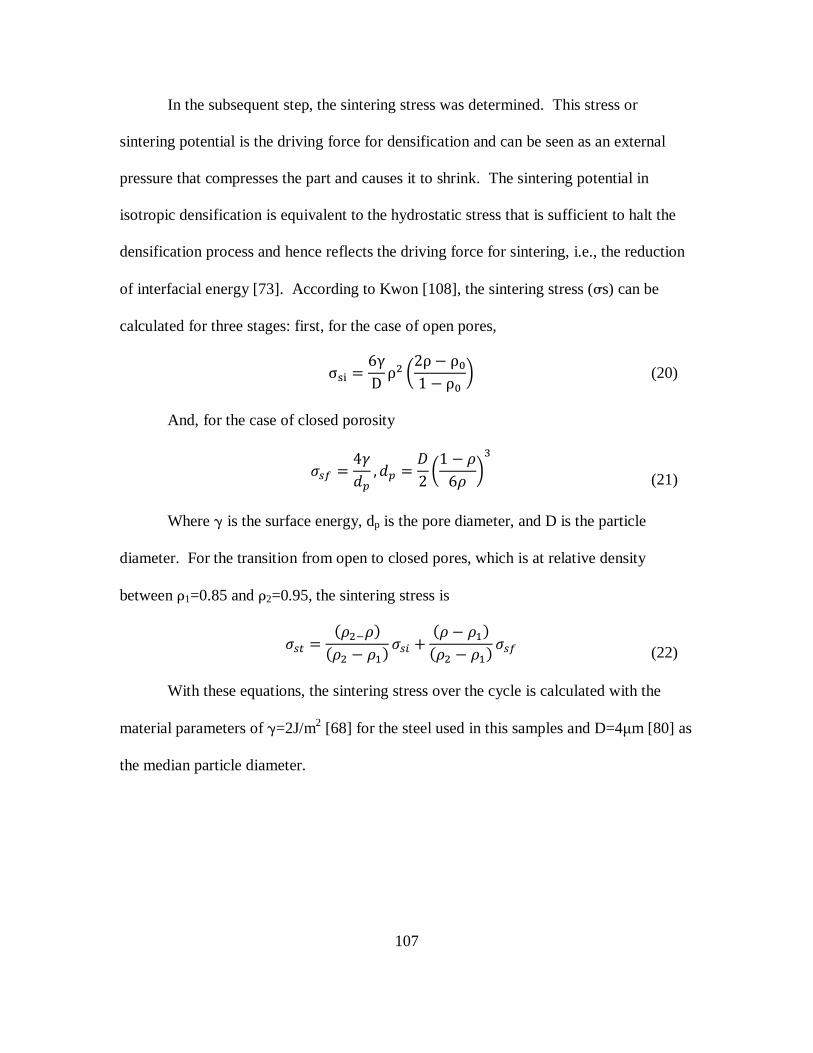
107
In the subsequent step, the sintering stress was determined. This stress or
sintering potential is the driving force for densification and can be seen as an external
pressure that compresses the part and causes it to shrink. The sintering potential in
isotropic densification is equivalent to the hydrostatic stress that is sufficient to halt the
densification process and hence reflects the driving force for sintering, i.e., the reduction
of interfacial energy [73]. According to Kwon [108], the sintering stress (σs) can be
calculated for three stages: first, for the case of open pores,
σ ! � 6γD ρ� $2ρ ρ 1 ρ & (20)
And, for the case of closed porosity
��� � 4O0�, 0� � P2 $1 �6� &� (21)
Where γ is the surface energy, dp is the pore diameter, and D is the particle
diameter. For the transition from open to closed pores, which is at relative density
between ρ1=0.85 and ρ2=0.95, the sintering stress is
��� � ���"����� ��� ��� � �� ������ ��� ���
(22)
With these equations, the sintering stress over the cycle is calculated with the
material parameters of γ=2J/m2 [68] for the steel used in this samples and D=4µm [80] as
the median particle diameter.
108
Figure 78: Sintering stress over sintering cycle. With the densification values determined through the MSC approach, the sintering stress
was calculated over the time-temperature profile of the sintering cycle.
The sintering stress over the sintering cycle is shown in Figure 78. The highest
sintering stress of 120MPa appeared at the point of the maximum shrinkage of 19.33%.
4.4.3. Simulat ion
The simulation software used in this study was ANSYS Workbench. In ANSYS,
first the geometry of the part is either generated in its own CAD application or loaded
from any commercial CAD package.
The next step is to set up the material. In this case, a new, substitution material
was inserted. As mentioned before, the shrinkage was assumed to be isotropic. The only
property of the material was isotropic elasticity, which comprised Young’s modulus and
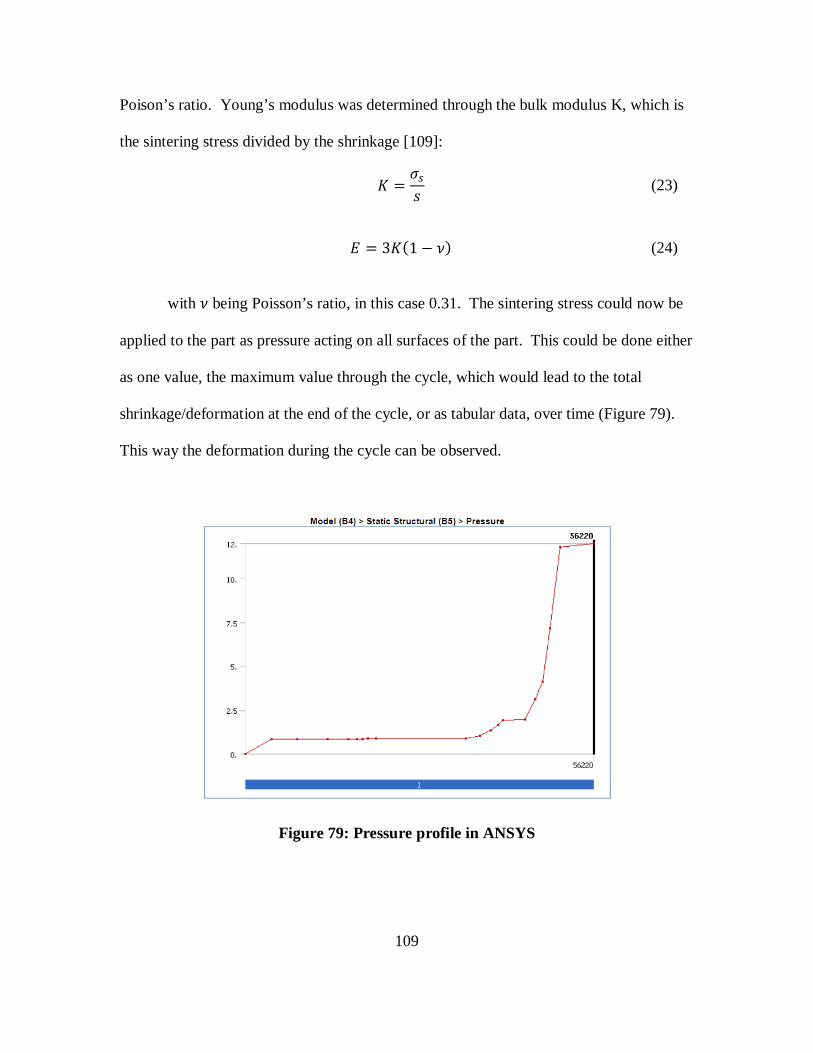
109
Poison’s ratio. Young’s modulus was determined through the bulk modulus K, which is
the sintering stress divided by the shrinkage [109]:
� ��G (23)
7 � 3 �1 Q� (24)
with Q being Poisson’s ratio, in this case 0.31. The sintering stress could now be
applied to the part as pressure acting on all surfaces of the part. This could be done either
as one value, the maximum value through the cycle, which would lead to the total
shrinkage/deformation at the end of the cycle, or as tabular data, over time (Figure 79).
This way the deformation during the cycle can be observed.
Figure 79: Pressure profile in ANSYS
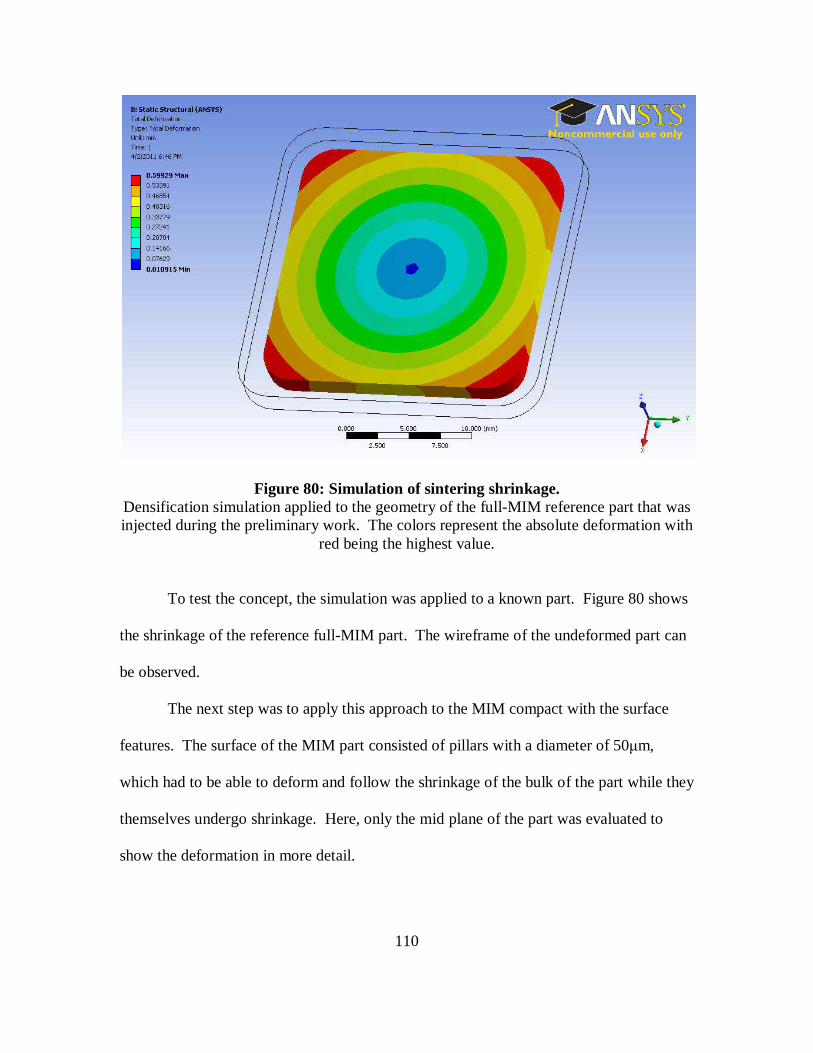
110
Figure 80: Simulation of sintering shrinkage. Densification simulation applied to the geometry of the full-MIM reference part that was injected during the preliminary work. The colors represent the absolute deformation with
red being the highest value.
To test the concept, the simulation was applied to a known part. Figure 80 shows
the shrinkage of the reference full-MIM part. The wireframe of the undeformed part can
be observed.
The next step was to apply this approach to the MIM compact with the surface
features. The surface of the MIM part consisted of pillars with a diameter of 50µm,
which had to be able to deform and follow the shrinkage of the bulk of the part while they
themselves undergo shrinkage. Here, only the mid plane of the part was evaluated to
show the deformation in more detail.
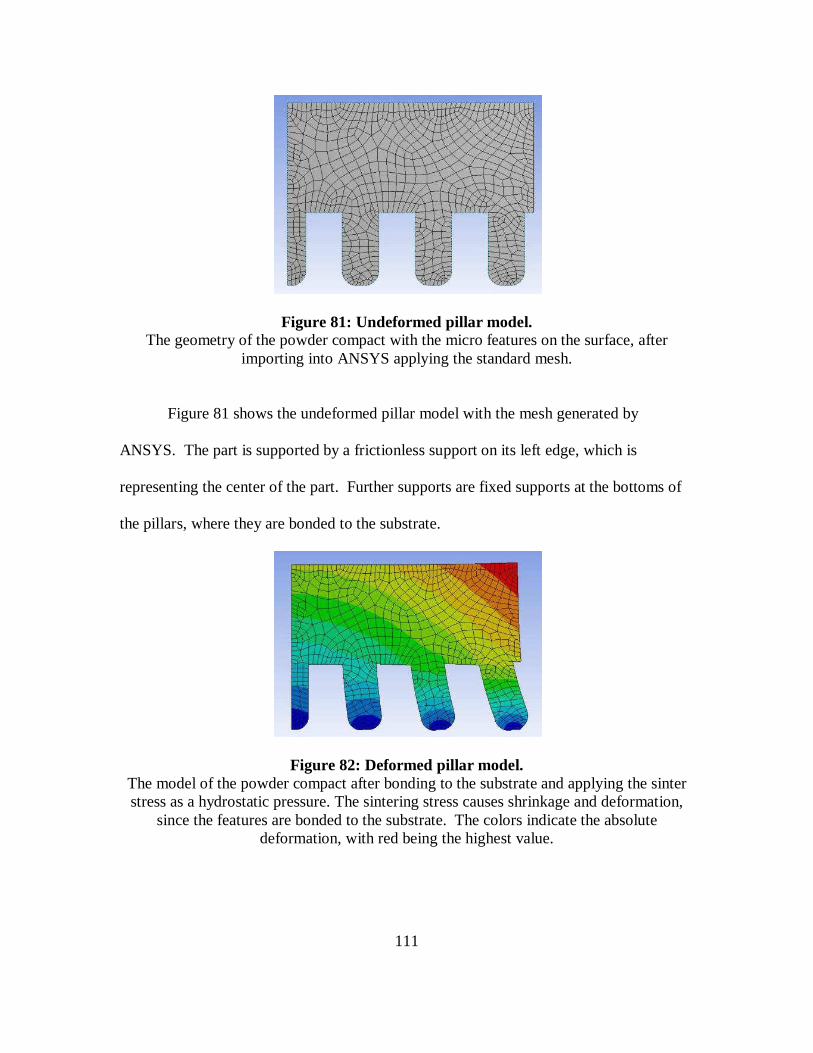
111
Figure 81: Undeformed pillar model. The geometry of the powder compact with the micro features on the surface, after
importing into ANSYS applying the standard mesh.
Figure 81 shows the undeformed pillar model with the mesh generated by
ANSYS. The part is supported by a frictionless support on its left edge, which is
representing the center of the part. Further supports are fixed supports at the bottoms of
the pillars, where they are bonded to the substrate.
Figure 82: Deformed pillar model. The model of the powder compact after bonding to the substrate and applying the sinter stress as a hydrostatic pressure. The sintering stress causes shrinkage and deformation,
since the features are bonded to the substrate. The colors indicate the absolute deformation, with red being the highest value.
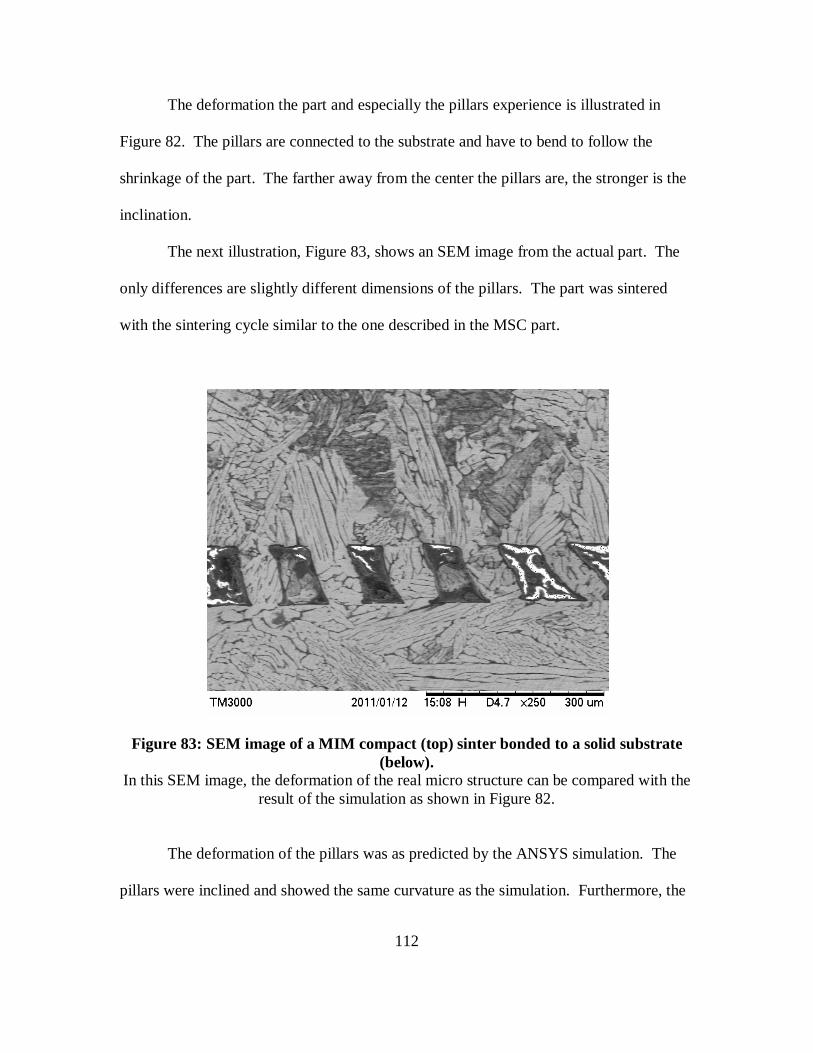
112
The deformation the part and especially the pillars experience is illustrated in
Figure 82. The pillars are connected to the substrate and have to bend to follow the
shrinkage of the part. The farther away from the center the pillars are, the stronger is the
inclination.
The next illustration, Figure 83, shows an SEM image from the actual part. The
only differences are slightly different dimensions of the pillars. The part was sintered
with the sintering cycle similar to the one described in the MSC part.
Figure 83: SEM image of a MIM compact (top) sinter bonded to a solid substrate (below).
In this SEM image, the deformation of the real micro structure can be compared with the result of the simulation as shown in Figure 82.
The deformation of the pillars was as predicted by the ANSYS simulation. The
pillars were inclined and showed the same curvature as the simulation. Furthermore, the
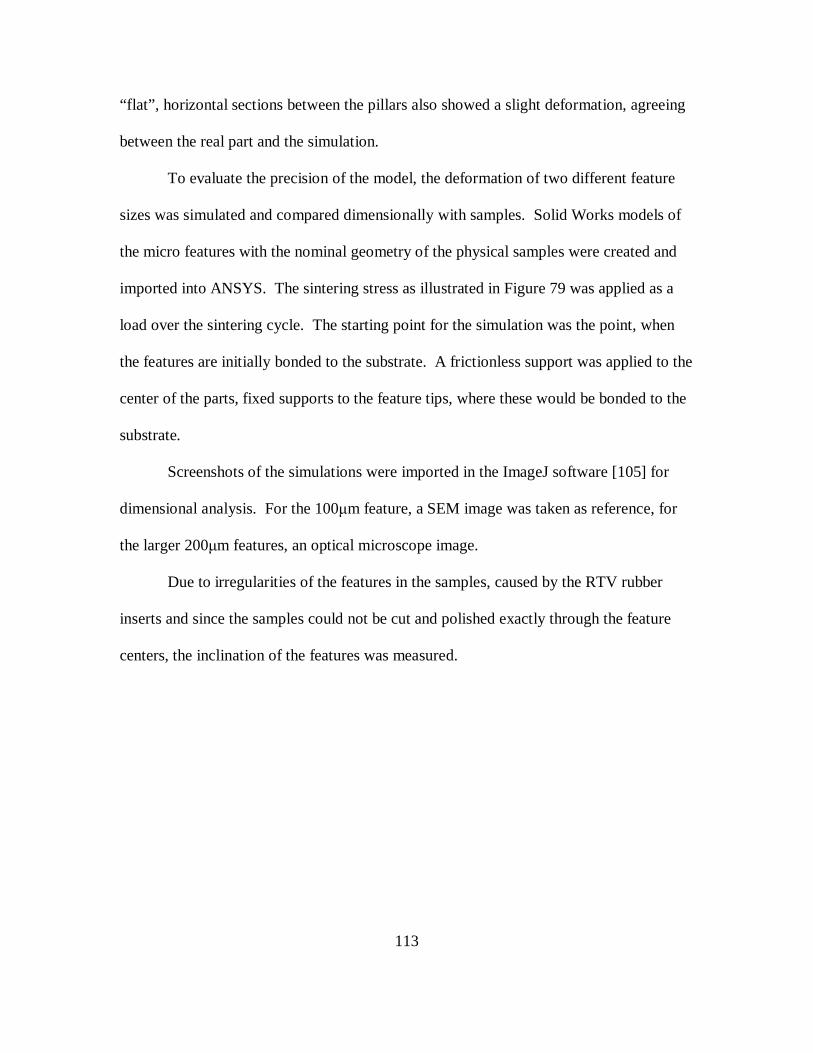
113
“flat”, horizontal sections between the pillars also showed a slight deformation, agreeing
between the real part and the simulation.
To evaluate the precision of the model, the deformation of two different feature
sizes was simulated and compared dimensionally with samples. Solid Works models of
the micro features with the nominal geometry of the physical samples were created and
imported into ANSYS. The sintering stress as illustrated in Figure 79 was applied as a
load over the sintering cycle. The starting point for the simulation was the point, when
the features are initially bonded to the substrate. A frictionless support was applied to the
center of the parts, fixed supports to the feature tips, where these would be bonded to the
substrate.
Screenshots of the simulations were imported in the ImageJ software [105] for
dimensional analysis. For the 100µm feature, a SEM image was taken as reference, for
the larger 200µm features, an optical microscope image.
Due to irregularities of the features in the samples, caused by the RTV rubber
inserts and since the samples could not be cut and polished exactly through the feature
centers, the inclination of the features was measured.
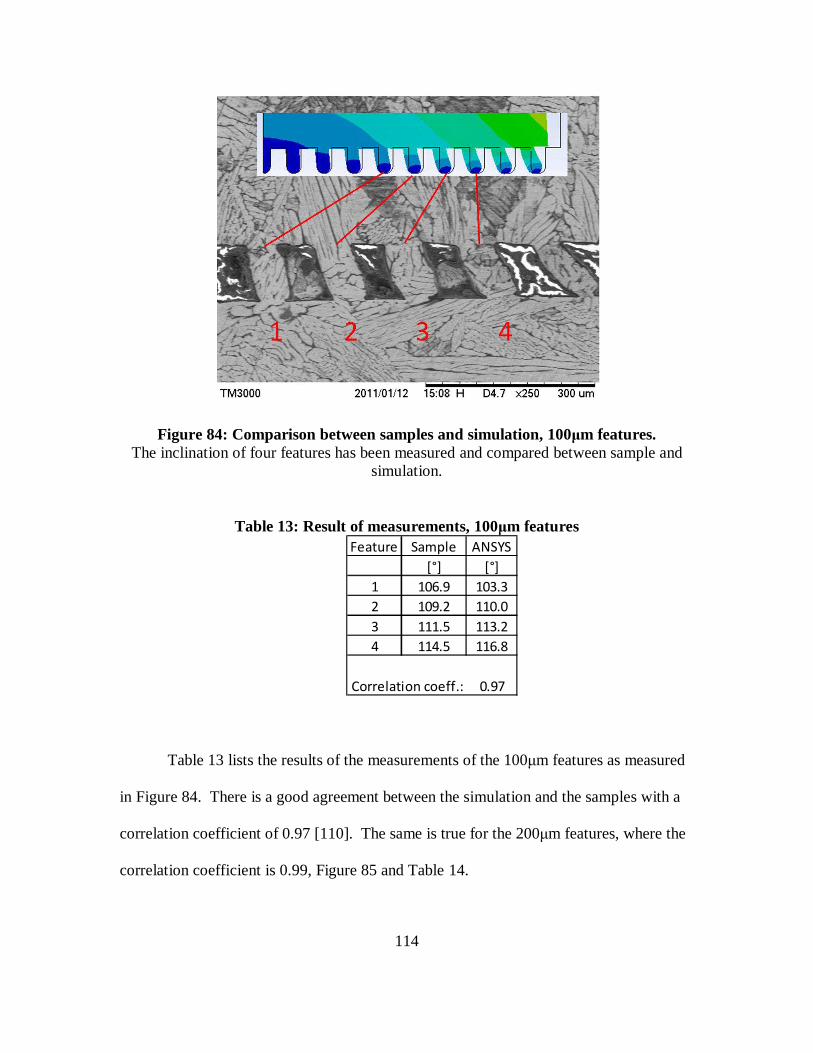
114
Figure 84: Comparison between samples and simulation, 100µm features. The inclination of four features has been measured and compared between sample and
simulation.
Table 13: Result of measurements, 100µm features
Table 13 lists the results of the measurements of the 100µm features as measured
in Figure 84. There is a good agreement between the simulation and the samples with a
correlation coefficient of 0.97 [110]. The same is true for the 200µm features, where the
correlation coefficient is 0.99, Figure 85 and Table 14.
Feature Sample ANSYS[°] [°]
1 106.9 103.32 109.2 110.03 111.5 113.24 114.5 116.8
Correlation coeff.: 0.97
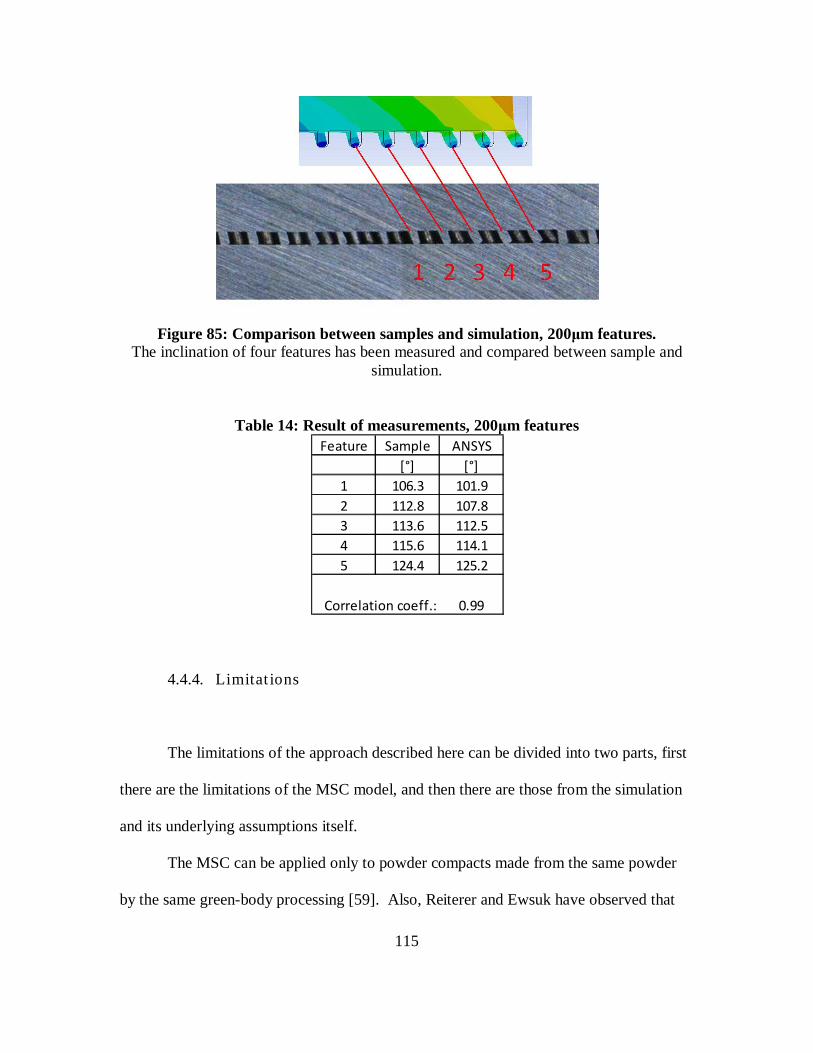
115
Figure 85: Comparison between samples and simulation, 200µm features. The inclination of four features has been measured and compared between sample and
simulation.
Table 14: Result of measurements, 200µm features
4.4.4. Limitat ions
The limitations of the approach described here can be divided into two parts, first
there are the limitations of the MSC model, and then there are those from the simulation
and its underlying assumptions itself.
The MSC can be applied only to powder compacts made from the same powder
by the same green-body processing [59]. Also, Reiterer and Ewsuk have observed that
Feature Sample ANSYS[°] [°]
1 106.3 101.92 112.8 107.83 113.6 112.54 115.6 114.15 124.4 125.2
Correlation coeff.: 0.99
116
densification curves generated using heating rates slower than 5K/min often do not fall
on the same MSC [52].
The validity of the simulation itself is basically limited by the assumptions made.
In the example presented here, isotropic shrinkage was assumed, although it has been
shown that this is not exactly the case [50, 51]. If the values of anisotropic shrinkage for
a particular material are known, they can be modeled in the ANSYS’ material database
and thus overcome this limitation. Also, gravity can be applied to the powder compact as
a load during sintering.
4.4.5. Sub-conclusion
In section 4.3 it has been shown that the bonds between the powder compact and
the substrate are not established until later in the sintering process. The goal of this
section was to determine the point in time when this bonding takes place and how the
features deform, once the bonds are established.
Analyzing the SEM images of bonded samples, the point of bonding could be
determined as taking place at a shrinkage of 10.91%. This means that the powder
compact shrunk 10.91% before the bonds were established and then the compact
continued to shrink until it reached its final value of 17.4%.
Based on the MSC approach, the shrinkage of the powder compact was
calculated. Finally, the sinter stress was calculated and applied as an external pressure in
ANSYS to simulate the shrinkage and deformation. The pressure was applied as a profile
over the sintering cycle. To this end, a substitution material was created, consisting of
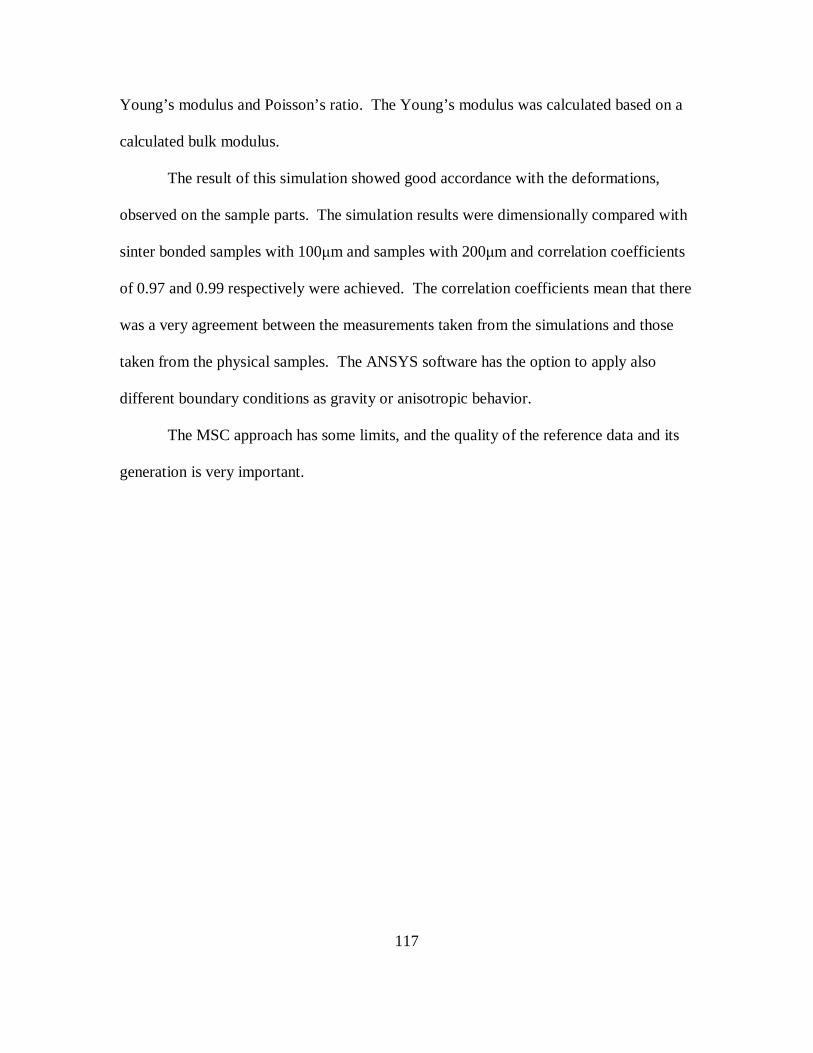
117
Young’s modulus and Poisson’s ratio. The Young’s modulus was calculated based on a
calculated bulk modulus.
The result of this simulation showed good accordance with the deformations,
observed on the sample parts. The simulation results were dimensionally compared with
sinter bonded samples with 100µm and samples with 200µm and correlation coefficients
of 0.97 and 0.99 respectively were achieved. The correlation coefficients mean that there
was a very agreement between the measurements taken from the simulations and those
taken from the physical samples. The ANSYS software has the option to apply also
different boundary conditions as gravity or anisotropic behavior.
The MSC approach has some limits, and the quality of the reference data and its
generation is very important.
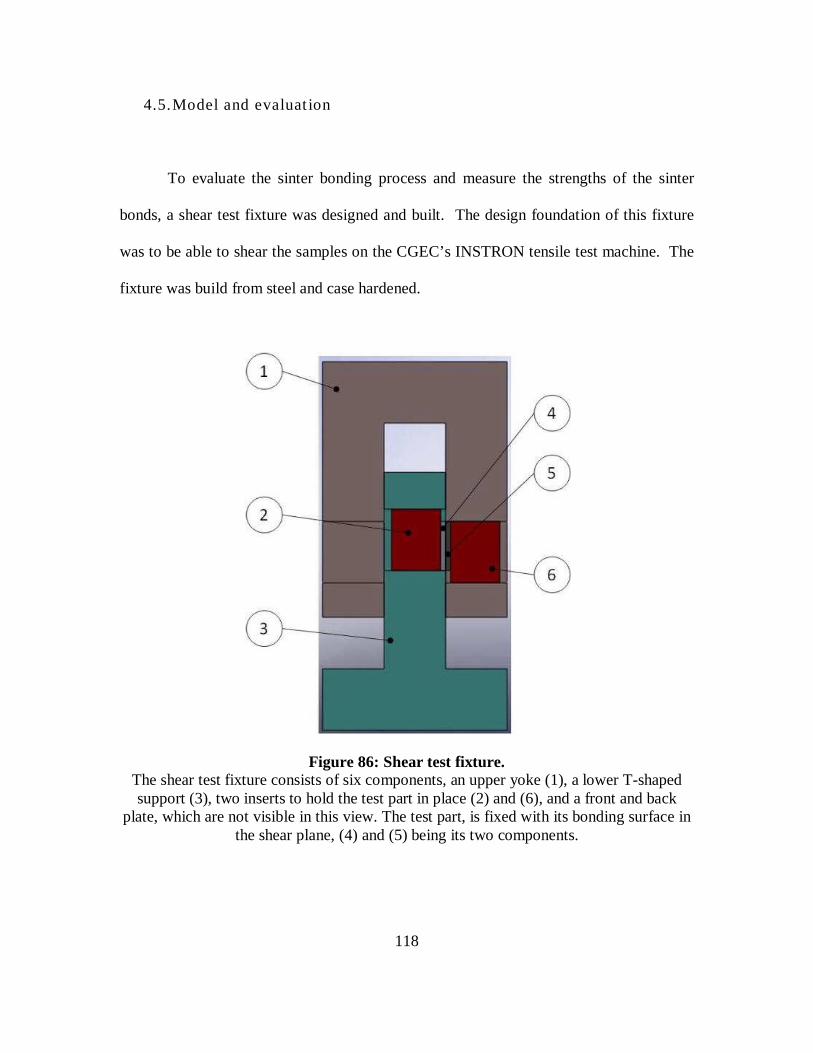
118
4.5. Model and evaluat ion
To evaluate the sinter bonding process and measure the strengths of the sinter
bonds, a shear test fixture was designed and built. The design foundation of this fixture
was to be able to shear the samples on the CGEC’s INSTRON tensile test machine. The
fixture was build from steel and case hardened.
Figure 86: Shear test fixture. The shear test fixture consists of six components, an upper yoke (1), a lower T-shaped support (3), two inserts to hold the test part in place (2) and (6), and a front and back
plate, which are not visible in this view. The test part, is fixed with its bonding surface in the shear plane, (4) and (5) being its two components.
119
The cross section in Figure 86 shows the fixture design. A yoke (1) and an
inverted “T” shaped lower part (3) constitute the main structure of the fixture. Both have
15mm x 20mm rectangular openings to install the sample to be tested. The sample,
comprised of the solid substrate (4), together with the MIM part (5) which it is bonded to,
was held and clamped by two blocks (2 and 6), which were secured by setscrews, in the
shear plane of the fixture.
Figure 87: Shear test fixture placed in INSTRON. The test fixture is located on the closed jaws of the tensile test machine, and loaded in
compression.
The upper half of the INSTRON (Figure 87) was pushed down while the lower
half remained fixed. To evaluate the bond strengths of the sinter bonded parts, a series of
samples was prepared:
120
• MIM compact with 100µm diameter surface feature bonded to a solid
substrate (3 samples)
• MIM compact with 50µm diameter surface feature bonded to a solid substrate
(3 samples)
• MIM compact with 10µm diameter surface feature bonded to a solid substrate
(3 samples)
• Two coupons of rolled sheet joined by a 2-K adhesive bond (JB Weld) (1
sample)
• Two coupons of rolled sheet joined by brazing (1 sample)
• Two coupons of rolled sheet joined by a resistance weld spot (1 sample)
All samples were EDM cut to a dimension of 15mm x 15mm. As mentioned
before, due to the properties of the soft prototype molds (RTV) used in these tests, the
parts were not completely flat, as measured after injecting, and thus the samples were not
bonded over the entire area. That is why the effectively bonded areas were measured after
the shear tests to calculate the actual shear stresses (Table 15).
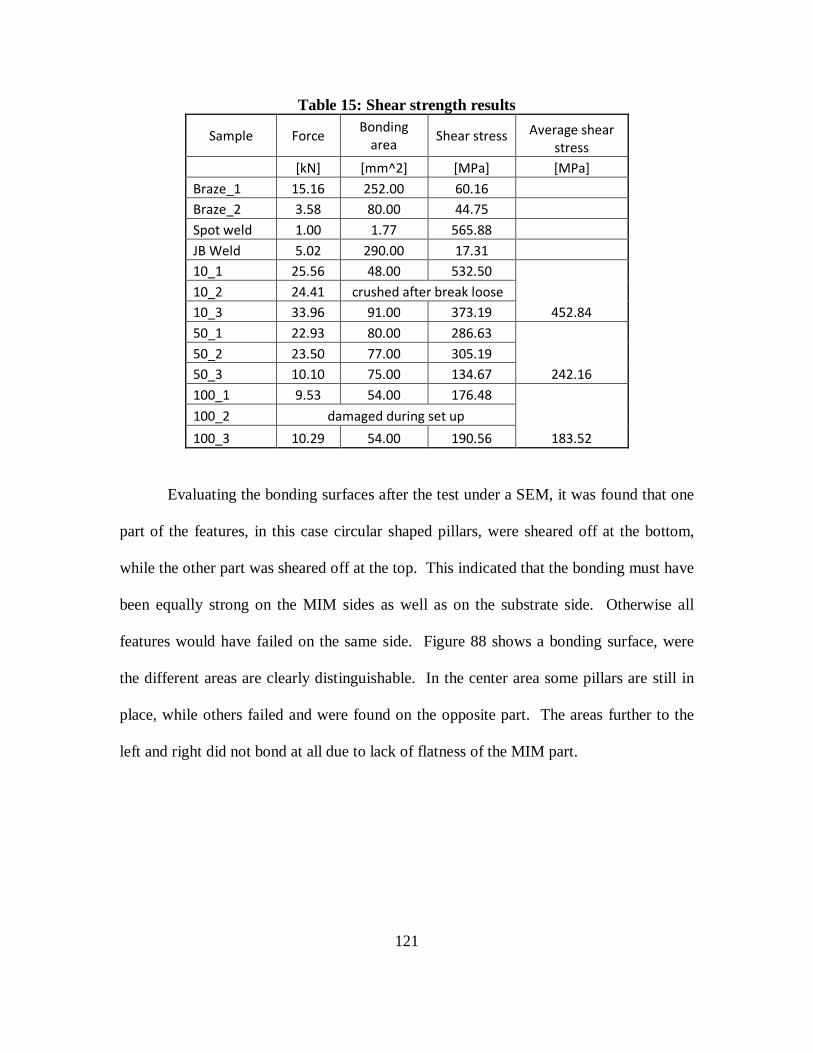
121
Table 15: Shear strength results
Sample Force Bonding area Shear stress Average shear
stress [kN] [mm^2] [MPa] [MPa] Braze_1 15.16 252.00 60.16 Braze_2 3.58 80.00 44.75 Spot weld 1.00 1.77 565.88 JB Weld 5.02 290.00 17.31 10_1 25.56 48.00 532.50
452.84 10_2 24.41 crushed after break loose 10_3 33.96 91.00 373.19 50_1 22.93 80.00 286.63
242.16 50_2 23.50 77.00 305.19 50_3 10.10 75.00 134.67 100_1 9.53 54.00 176.48
183.52 100_2 damaged during set up 100_3 10.29 54.00 190.56
Evaluating the bonding surfaces after the test under a SEM, it was found that one
part of the features, in this case circular shaped pillars, were sheared off at the bottom,
while the other part was sheared off at the top. This indicated that the bonding must have
been equally strong on the MIM sides as well as on the substrate side. Otherwise all
features would have failed on the same side. Figure 88 shows a bonding surface, were
the different areas are clearly distinguishable. In the center area some pillars are still in
place, while others failed and were found on the opposite part. The areas further to the
left and right did not bond at all due to lack of flatness of the MIM part.
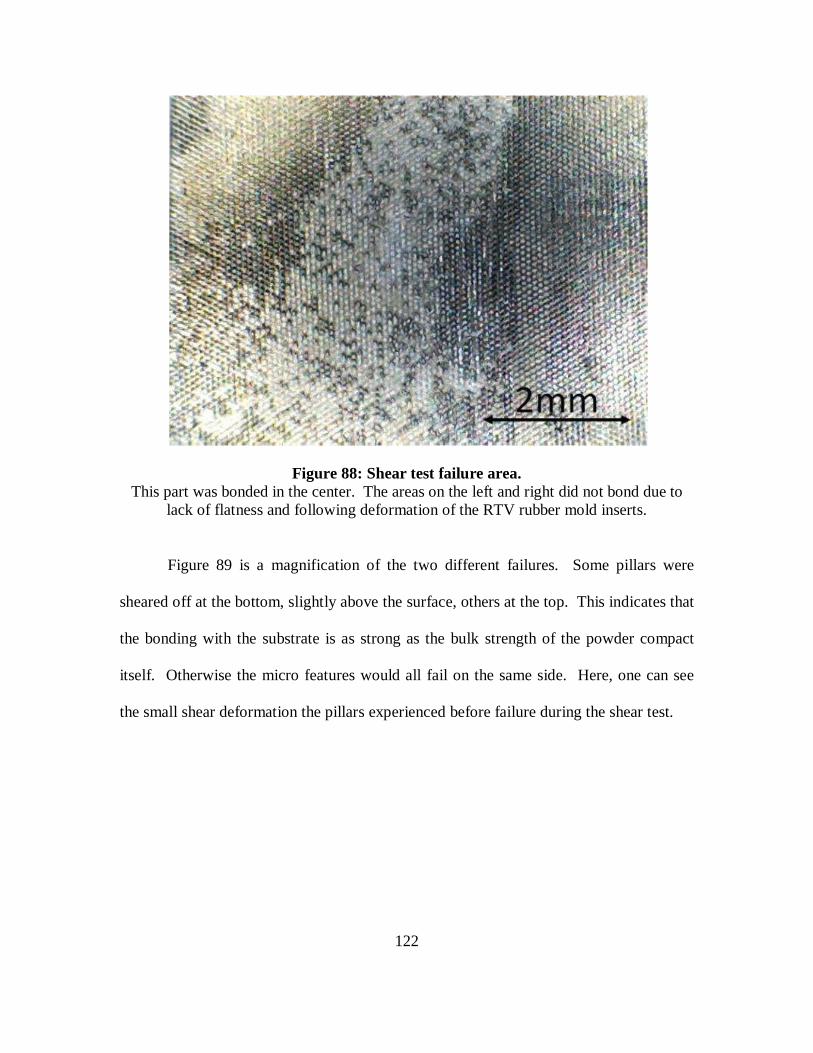
122
Figure 88: Shear test failure area. This part was bonded in the center. The areas on the left and right did not bond due to
lack of flatness and following deformation of the RTV rubber mold inserts.
Figure 89 is a magnification of the two different failures. Some pillars were
sheared off at the bottom, slightly above the surface, others at the top. This indicates that
the bonding with the substrate is as strong as the bulk strength of the powder compact
itself. Otherwise the micro features would all fail on the same side. Here, one can see
the small shear deformation the pillars experienced before failure during the shear test.
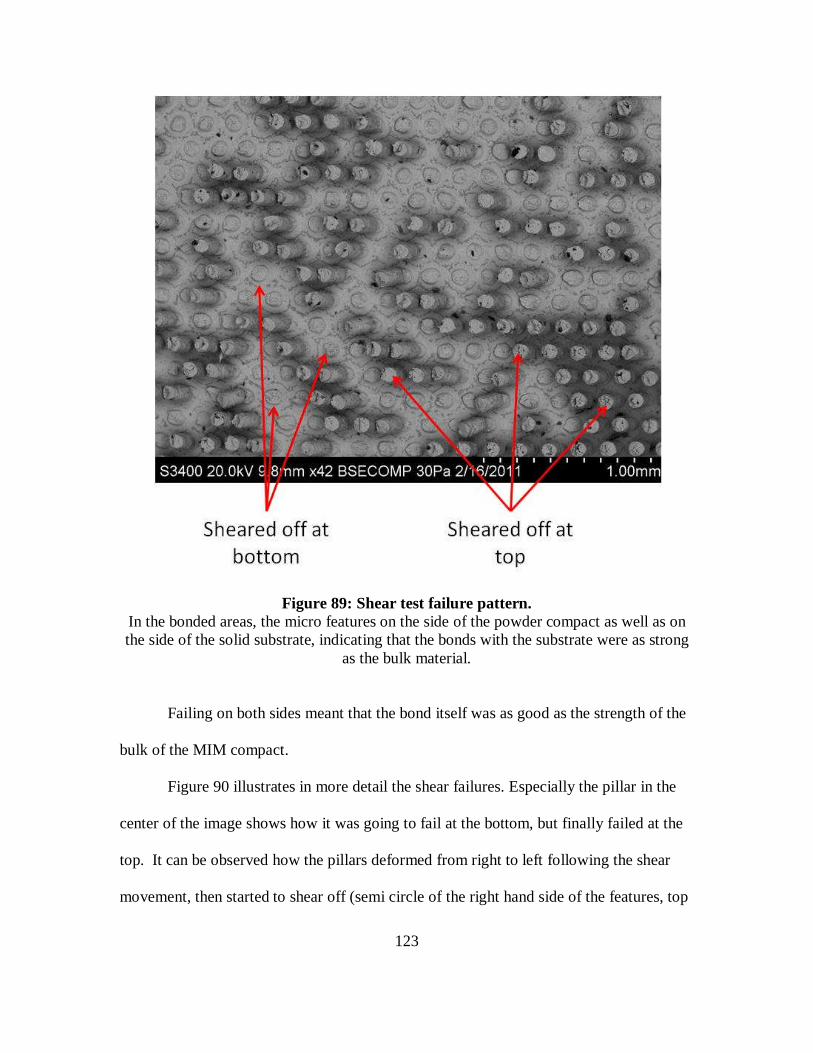
123
Figure 89: Shear test failure pattern. In the bonded areas, the micro features on the side of the powder compact as well as on the side of the solid substrate, indicating that the bonds with the substrate were as strong
as the bulk material.
Failing on both sides meant that the bond itself was as good as the strength of the
bulk of the MIM compact.
Figure 90 illustrates in more detail the shear failures. Especially the pillar in the
center of the image shows how it was going to fail at the bottom, but finally failed at the
top. It can be observed how the pillars deformed from right to left following the shear
movement, then started to shear off (semi circle of the right hand side of the features, top
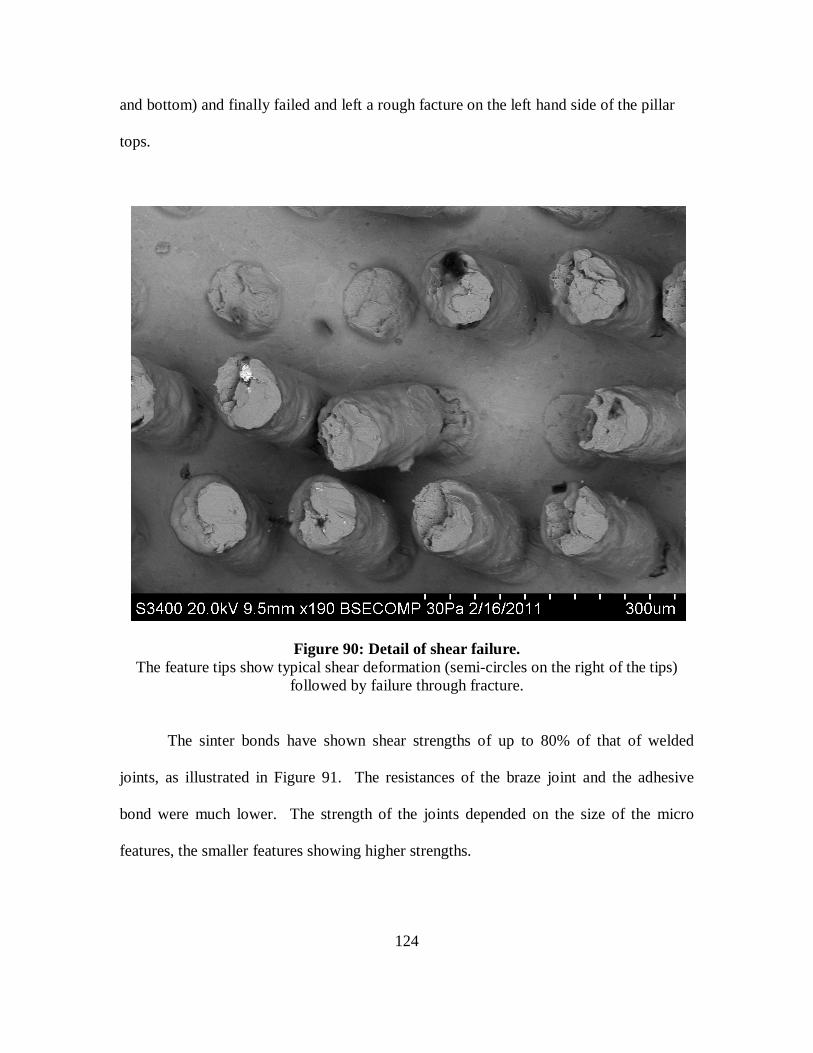
124
and bottom) and finally failed and left a rough facture on the left hand side of the pillar
tops.
Figure 90: Detail of shear failure. The feature tips show typical shear deformation (semi-circles on the right of the tips)
followed by failure through fracture.
The sinter bonds have shown shear strengths of up to 80% of that of welded
joints, as illustrated in Figure 91. The resistances of the braze joint and the adhesive
bond were much lower. The strength of the joints depended on the size of the micro
features, the smaller features showing higher strengths.
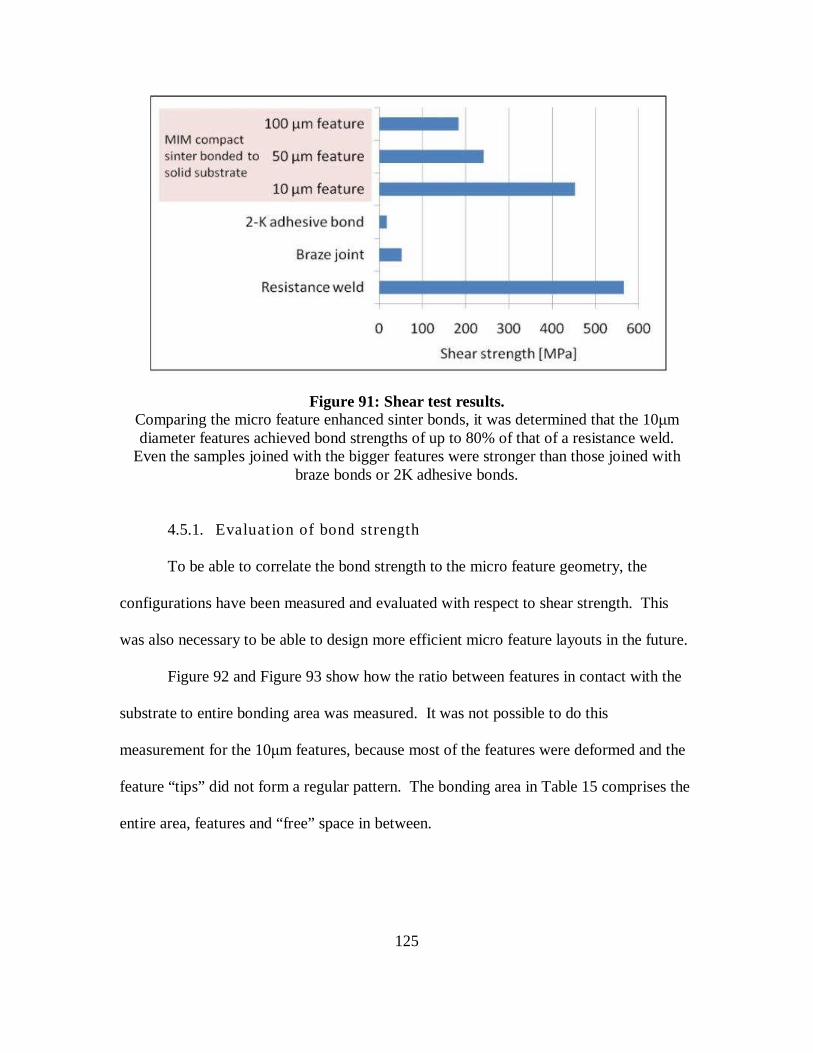
125
Figure 91: Shear test results. Comparing the micro feature enhanced sinter bonds, it was determined that the 10µm diameter features achieved bond strengths of up to 80% of that of a resistance weld.
Even the samples joined with the bigger features were stronger than those joined with braze bonds or 2K adhesive bonds.
4.5.1. Evaluat ion of bond strength
To be able to correlate the bond strength to the micro feature geometry, the
configurations have been measured and evaluated with respect to shear strength. This
was also necessary to be able to design more efficient micro feature layouts in the future.
Figure 92 and Figure 93 show how the ratio between features in contact with the
substrate to entire bonding area was measured. It was not possible to do this
measurement for the 10µm features, because most of the features were deformed and the
feature “tips” did not form a regular pattern. The bonding area in Table 15 comprises the
entire area, features and “free” space in between.
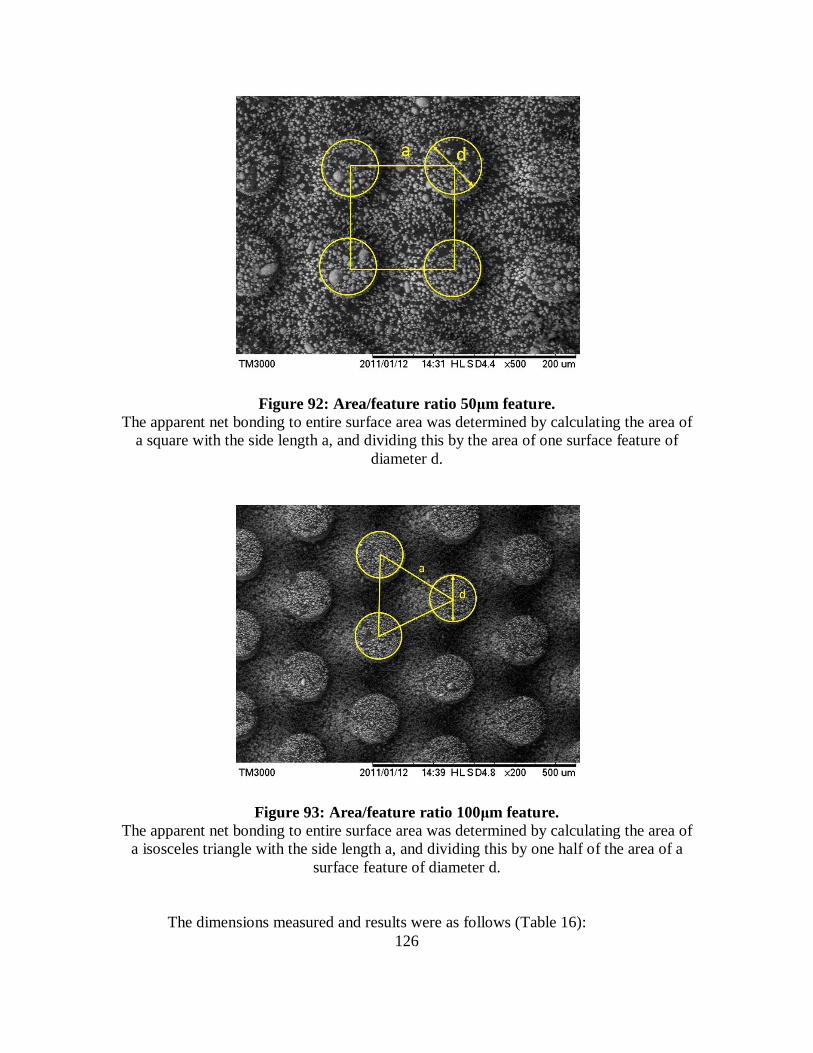
126
Figure 92: Area/feature ratio 50µm feature. The apparent net bonding to entire surface area was determined by calculating the area of
a square with the side length a, and dividing this by the area of one surface feature of diameter d.
Figure 93: Area/feature ratio 100µm feature. The apparent net bonding to entire surface area was determined by calculating the area of
a isosceles triangle with the side length a, and dividing this by one half of the area of a surface feature of diameter d.
The dimensions measured and results were as follows (Table 16):
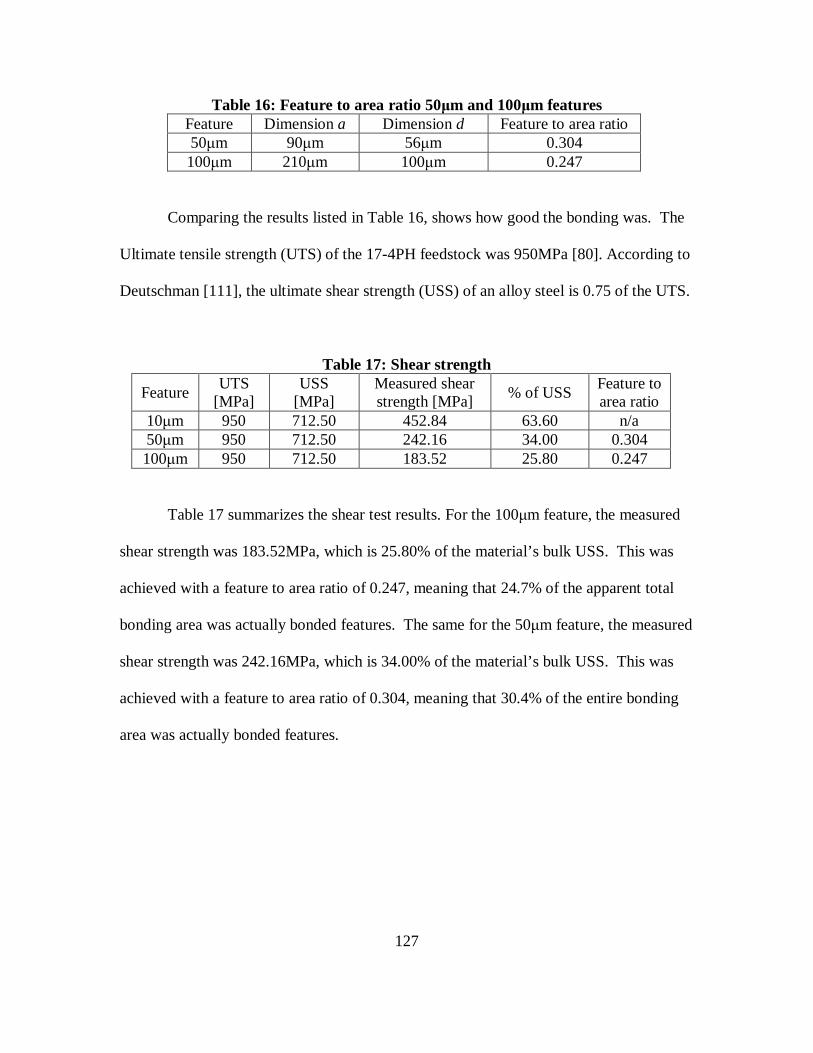
127
Table 16: Feature to area ratio 50µm and 100µm features Feature Dimension a Dimension d Feature to area ratio 50µm 90µm 56µm 0.304 100µm 210µm 100µm 0.247
Comparing the results listed in Table 16, shows how good the bonding was. The
Ultimate tensile strength (UTS) of the 17-4PH feedstock was 950MPa [80]. According to
Deutschman [111], the ultimate shear strength (USS) of an alloy steel is 0.75 of the UTS.
Table 17: Shear strength
Feature UTS
[MPa] USS
[MPa] Measured shear strength [MPa]
% of USS Feature to area ratio
10µm 950 712.50 452.84 63.60 n/a 50µm 950 712.50 242.16 34.00 0.304 100µm 950 712.50 183.52 25.80 0.247
Table 17 summarizes the shear test results. For the 100µm feature, the measured
shear strength was 183.52MPa, which is 25.80% of the material’s bulk USS. This was
achieved with a feature to area ratio of 0.247, meaning that 24.7% of the apparent total
bonding area was actually bonded features. The same for the 50µm feature, the measured
shear strength was 242.16MPa, which is 34.00% of the material’s bulk USS. This was
achieved with a feature to area ratio of 0.304, meaning that 30.4% of the entire bonding
area was actually bonded features.
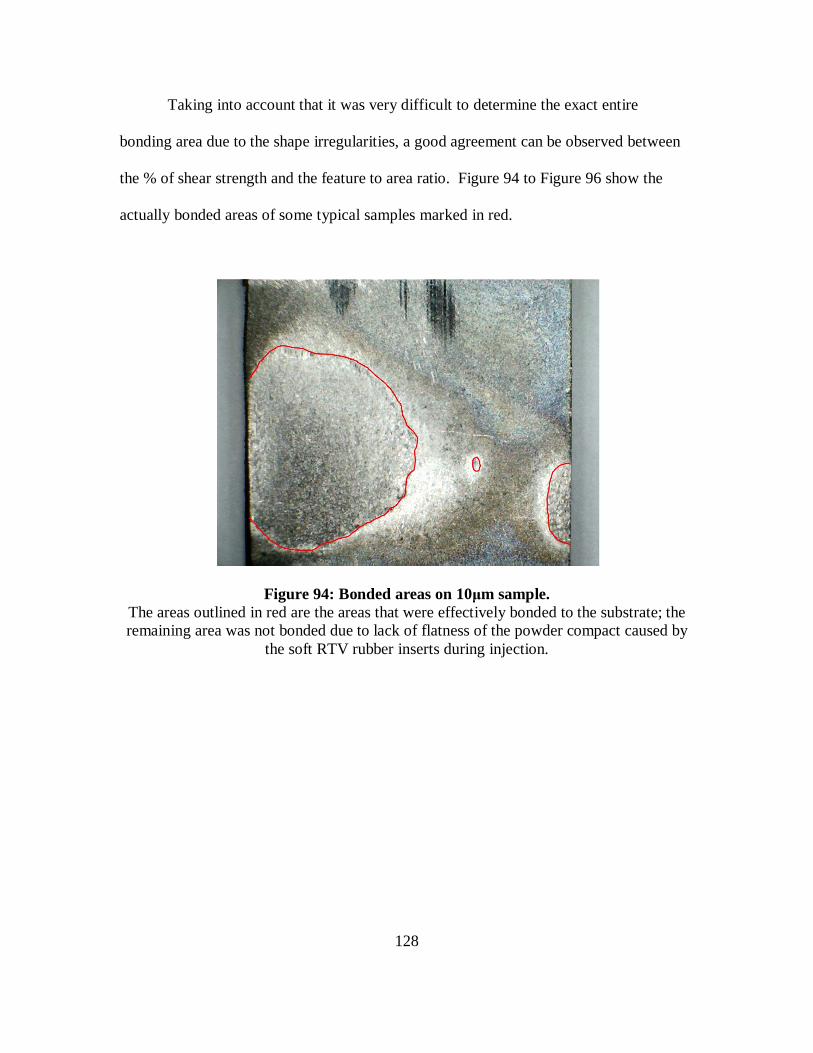
128
Taking into account that it was very difficult to determine the exact entire
bonding area due to the shape irregularities, a good agreement can be observed between
the % of shear strength and the feature to area ratio. Figure 94 to Figure 96 show the
actually bonded areas of some typical samples marked in red.
Figure 94: Bonded areas on 10µm sample. The areas outlined in red are the areas that were effectively bonded to the substrate; the remaining area was not bonded due to lack of flatness of the powder compact caused by
the soft RTV rubber inserts during injection.
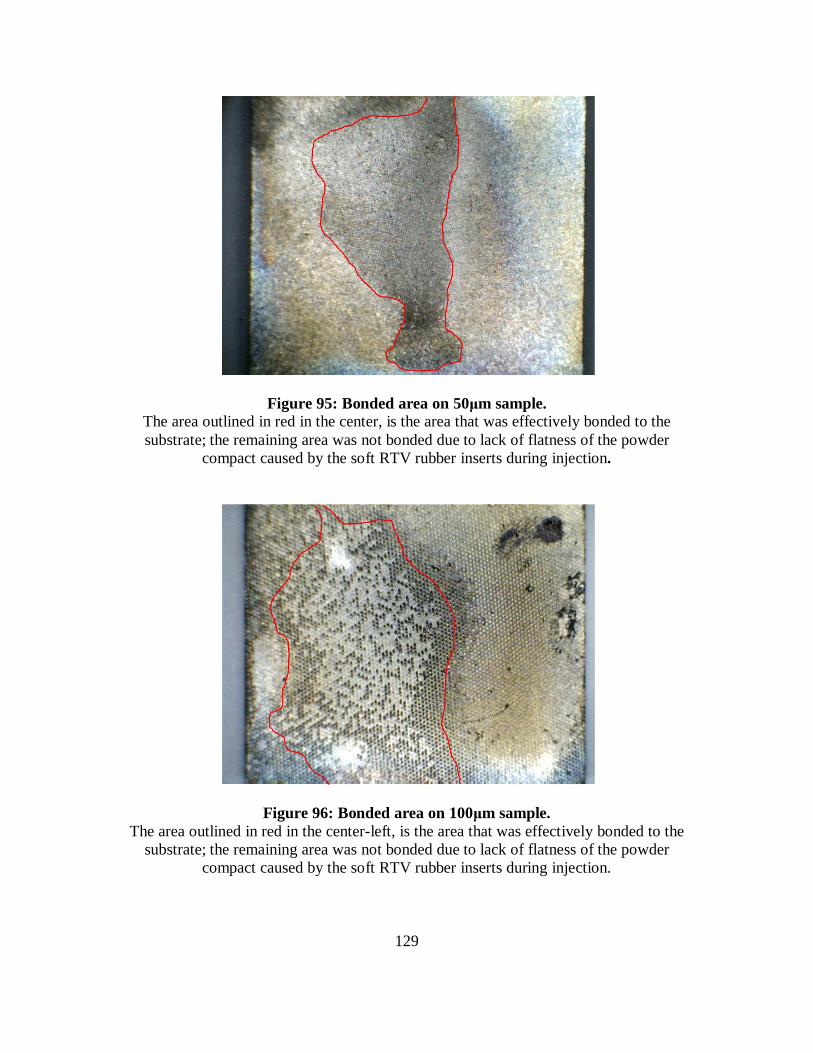
129
Figure 95: Bonded area on 50µm sample. The area outlined in red in the center, is the area that was effectively bonded to the substrate; the remaining area was not bonded due to lack of flatness of the powder
compact caused by the soft RTV rubber inserts during injection.
Figure 96: Bonded area on 100µm sample. The area outlined in red in the center-left, is the area that was effectively bonded to the
substrate; the remaining area was not bonded due to lack of flatness of the powder compact caused by the soft RTV rubber inserts during injection.
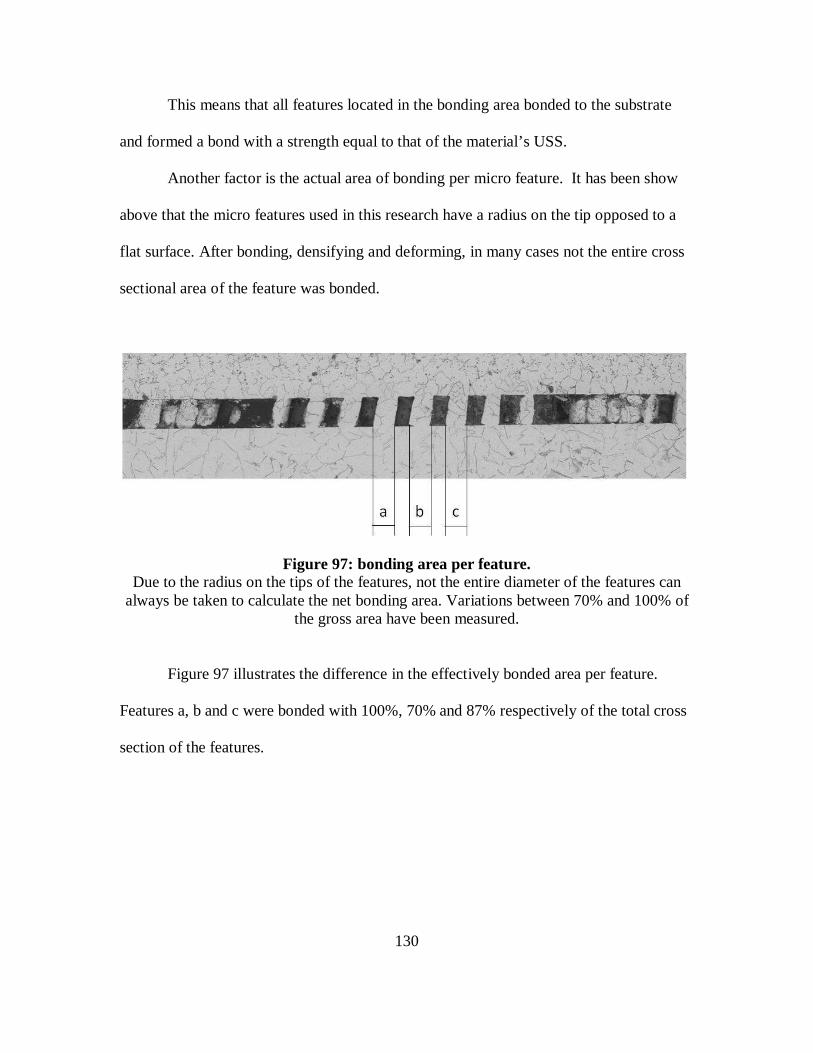
130
This means that all features located in the bonding area bonded to the substrate
and formed a bond with a strength equal to that of the material’s USS.
Another factor is the actual area of bonding per micro feature. It has been show
above that the micro features used in this research have a radius on the tip opposed to a
flat surface. After bonding, densifying and deforming, in many cases not the entire cross
sectional area of the feature was bonded.
Figure 97: bonding area per feature. Due to the radius on the tips of the features, not the entire diameter of the features can
always be taken to calculate the net bonding area. Variations between 70% and 100% of the gross area have been measured.
Figure 97 illustrates the difference in the effectively bonded area per feature.
Features a, b and c were bonded with 100%, 70% and 87% respectively of the total cross
section of the features.
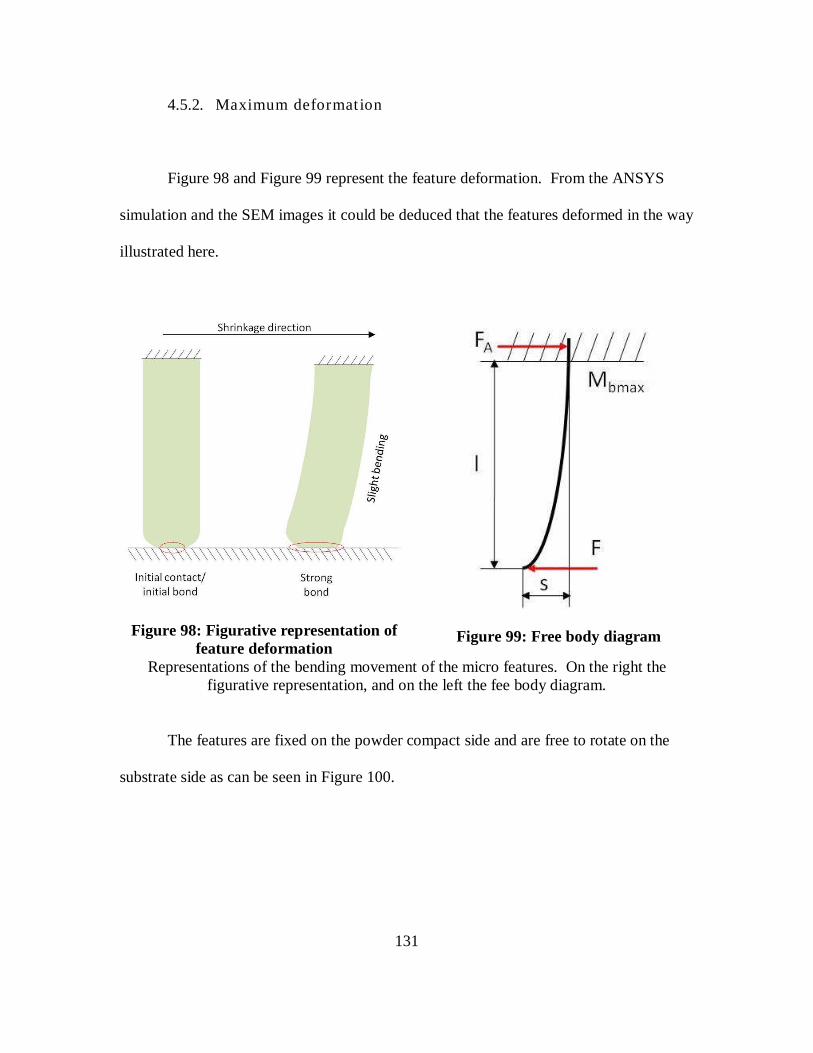
131
4.5.2. Maximum deformat ion
Figure 98 and Figure 99 represent the feature deformation. From the ANSYS
simulation and the SEM images it could be deduced that the features deformed in the way
illustrated here.
Figure 98: Figurative representation of feature deformation
Figure 99: Free body diagram
Representations of the bending movement of the micro features. On the right the figurative representation, and on the left the fee body diagram.
The features are fixed on the powder compact side and are free to rotate on the
substrate side as can be seen in Figure 100.
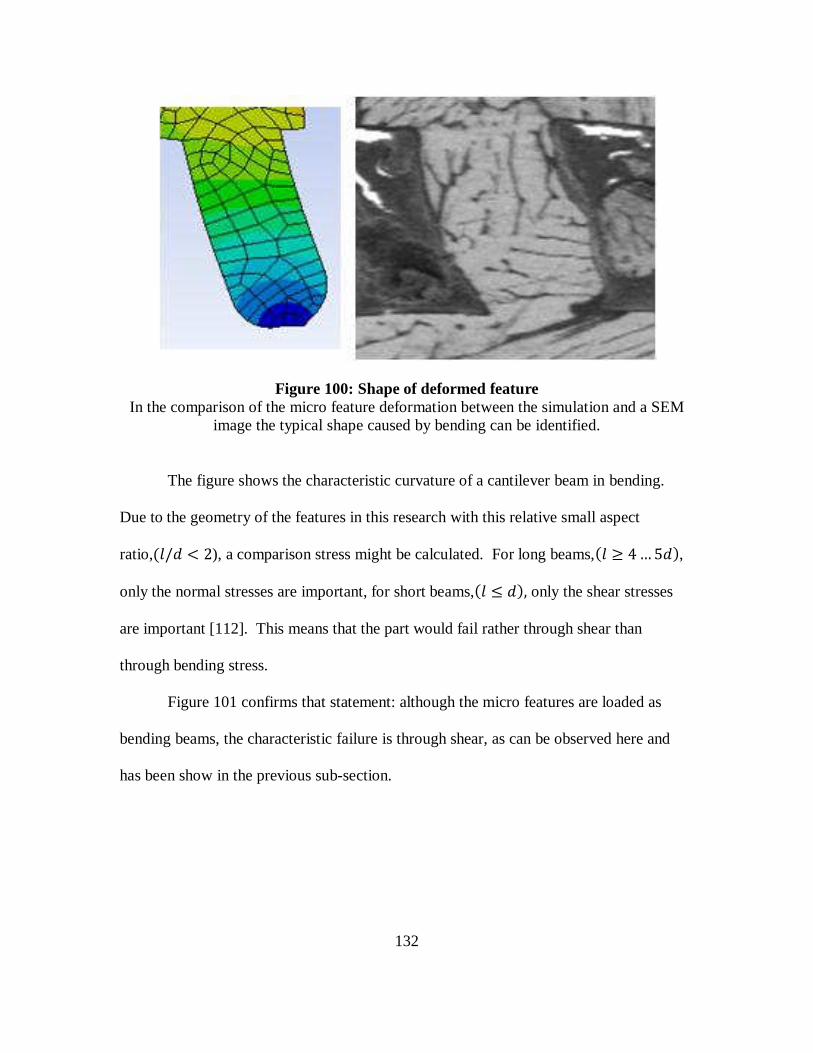
132
Figure 100: Shape of deformed feature In the comparison of the micro feature deformation between the simulation and a SEM
image the typical shape caused by bending can be identified.
The figure shows the characteristic curvature of a cantilever beam in bending.
Due to the geometry of the features in this research with this relative small aspect
ratio,�4/0 S 2), a comparison stress might be calculated. For long beams,�4 T 4…50�, only the normal stresses are important, for short beams,�4 V 0�, only the shear stresses
are important [112]. This means that the part would fail rather through shear than
through bending stress.
Figure 101 confirms that statement: although the micro features are loaded as
bending beams, the characteristic failure is through shear, as can be observed here and
has been show in the previous sub-section.
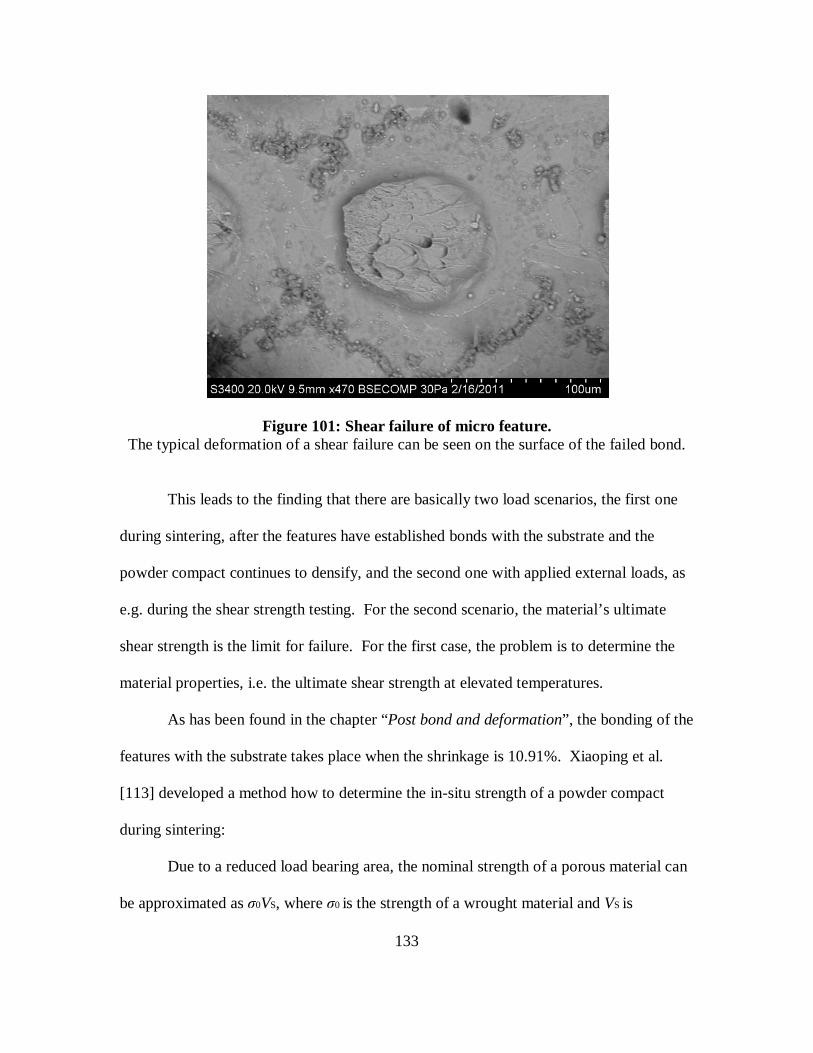
133
Figure 101: Shear failure of micro feature. The typical deformation of a shear failure can be seen on the surface of the failed bond.
This leads to the finding that there are basically two load scenarios, the first one
during sintering, after the features have established bonds with the substrate and the
powder compact continues to densify, and the second one with applied external loads, as
e.g. during the shear strength testing. For the second scenario, the material’s ultimate
shear strength is the limit for failure. For the first case, the problem is to determine the
material properties, i.e. the ultimate shear strength at elevated temperatures.
As has been found in the chapter “Post bond and deformation”, the bonding of the
features with the substrate takes place when the shrinkage is 10.91%. Xiaoping et al.
[113] developed a method how to determine the in-situ strength of a powder compact
during sintering:
Due to a reduced load bearing area, the nominal strength of a porous material can
be approximated as σ0VS, where σ0 is the strength of a wrought material and VS is
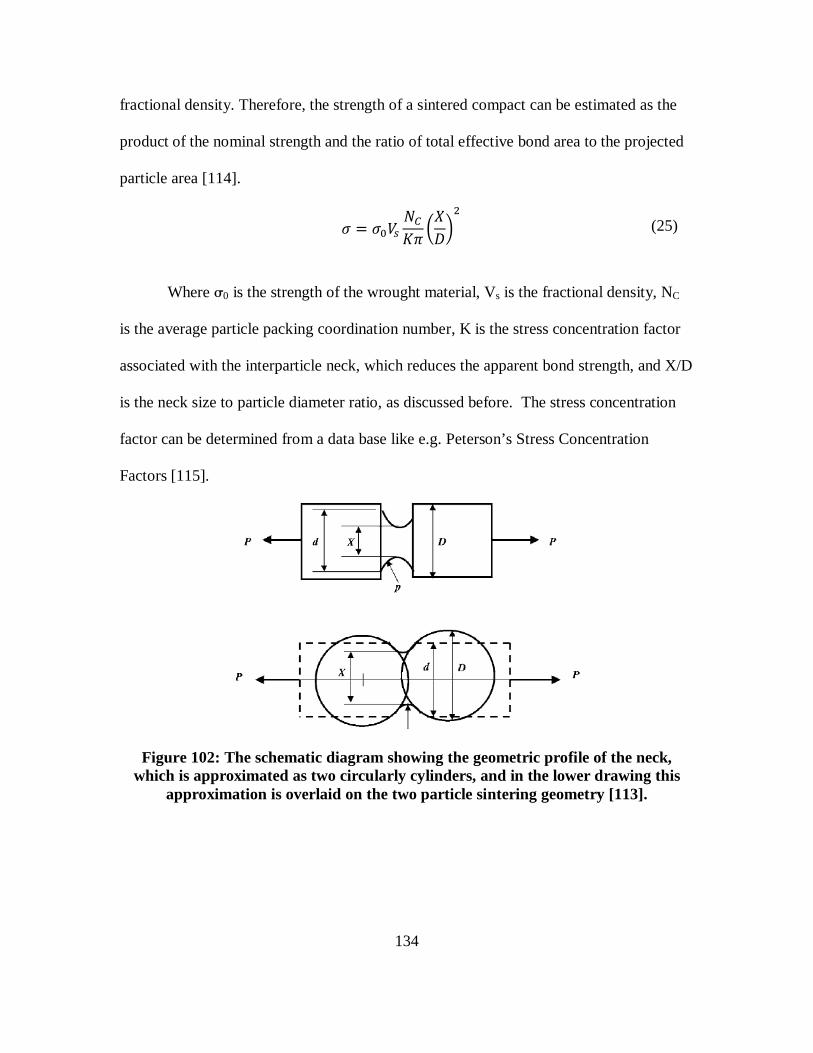
134
fractional density. Therefore, the strength of a sintered compact can be estimated as the
product of the nominal strength and the ratio of total effective bond area to the projected
particle area [114].
� � � W� *# X $YP&� (25)
Where σ0 is the strength of the wrought material, Vs is the fractional density, NC
is the average particle packing coordination number, K is the stress concentration factor
associated with the interparticle neck, which reduces the apparent bond strength, and X/D
is the neck size to particle diameter ratio, as discussed before. The stress concentration
factor can be determined from a data base like e.g. Peterson’s Stress Concentration
Factors [115].
Figure 102: The schematic diagram showing the geometric profile of the neck, which is approximated as two circularly cylinders, and in the lower drawing this
approximation is overlaid on the two particle sintering geometry [113].
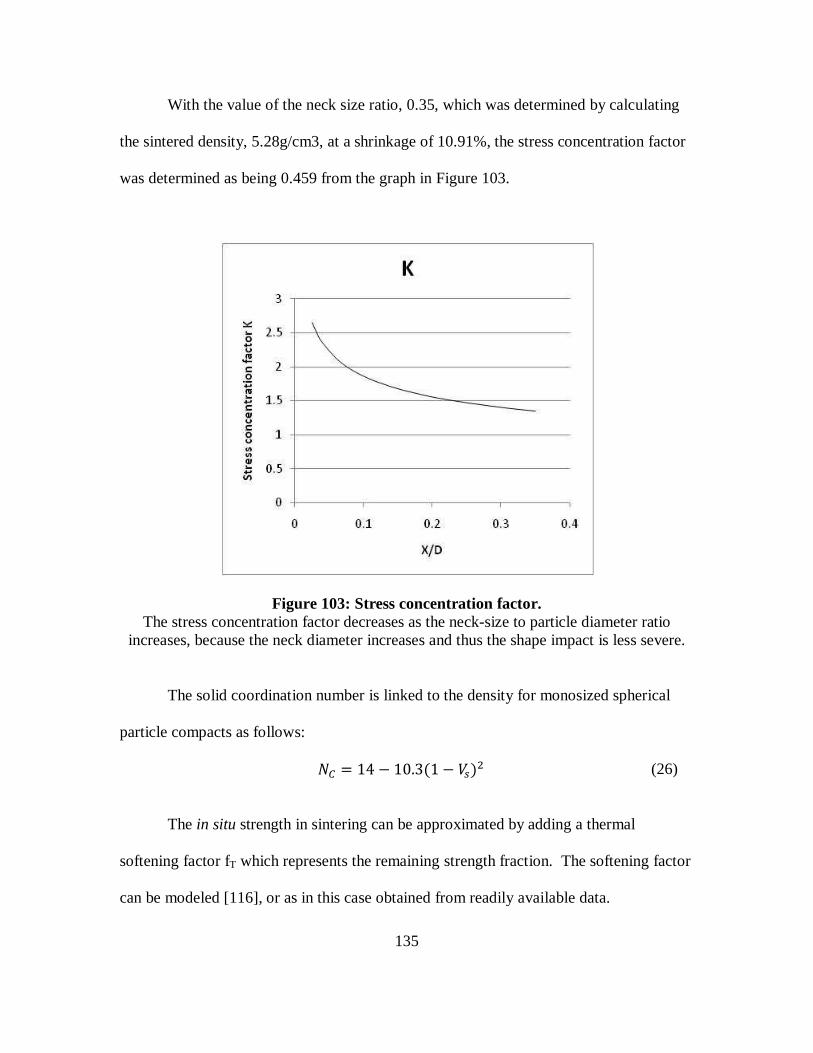
135
With the value of the neck size ratio, 0.35, which was determined by calculating
the sintered density, 5.28g/cm3, at a shrinkage of 10.91%, the stress concentration factor
was determined as being 0.459 from the graph in Figure 103.
Figure 103: Stress concentration factor. The stress concentration factor decreases as the neck-size to particle diameter ratio
increases, because the neck diameter increases and thus the shape impact is less severe.
The solid coordination number is linked to the density for monosized spherical
particle compacts as follows:
*# � 14 10.3�1 W��� (26)
The in situ strength in sintering can be approximated by adding a thermal
softening factor fT which represents the remaining strength fraction. The softening factor
can be modeled [116], or as in this case obtained from readily available data.
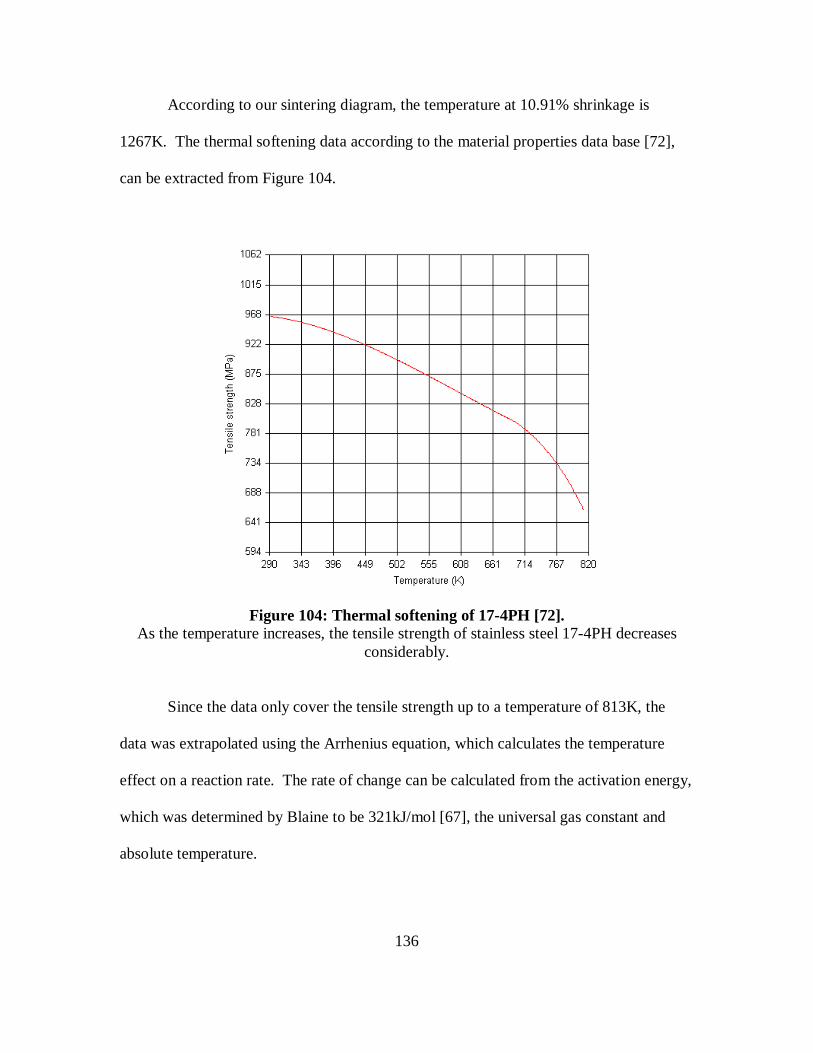
136
According to our sintering diagram, the temperature at 10.91% shrinkage is
1267K. The thermal softening data according to the material properties data base [72],
can be extracted from Figure 104.
Figure 104: Thermal softening of 17-4PH [72]. As the temperature increases, the tensile strength of stainless steel 17-4PH decreases
considerably.
Since the data only cover the tensile strength up to a temperature of 813K, the
data was extrapolated using the Arrhenius equation, which calculates the temperature
effect on a reaction rate. The rate of change can be calculated from the activation energy,
which was determined by Blaine to be 321kJ/mol [67], the universal gas constant and
absolute temperature.
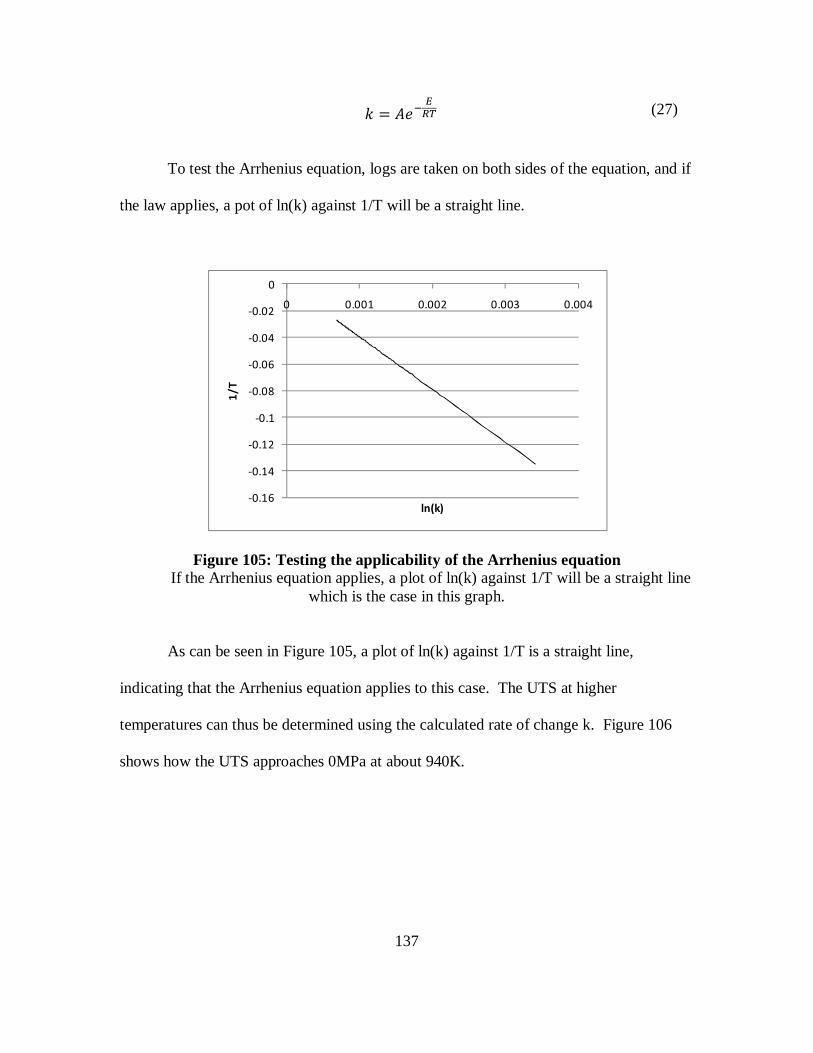
137
Z � !"" $% (27)
To test the Arrhenius equation, logs are taken on both sides of the equation, and if
the law applies, a pot of ln(k) against 1/T will be a straight line.
Figure 105: Testing the applicability of the Arrhenius equation If the Arrhenius equation applies, a plot of ln(k) against 1/T will be a straight line
which is the case in this graph.
As can be seen in Figure 105, a plot of ln(k) against 1/T is a straight line,
indicating that the Arrhenius equation applies to this case. The UTS at higher
temperatures can thus be determined using the calculated rate of change k. Figure 106
shows how the UTS approaches 0MPa at about 940K.
-0.16
-0.14
-0.12
-0.1
-0.08
-0.06
-0.04
-0.02
00 0.001 0.002 0.003 0.004
1/T
ln(k)
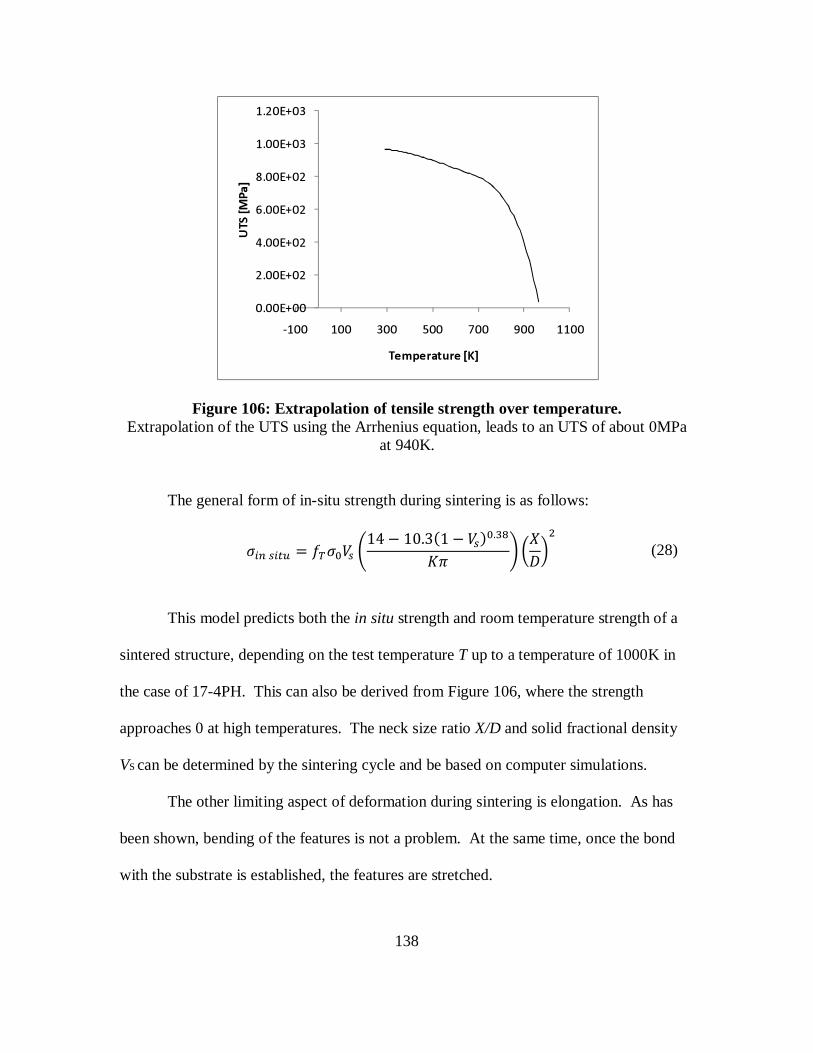
138
Figure 106: Extrapolation of tensile strength over temperature. Extrapolation of the UTS using the Arrhenius equation, leads to an UTS of about 0MPa
at 940K.
The general form of in-situ strength during sintering is as follows:
��� ���� � [%� W� �14 10.3�1 W�� .�' X �$YP&� (28)
This model predicts both the in situ strength and room temperature strength of a
sintered structure, depending on the test temperature T up to a temperature of 1000K in
the case of 17-4PH. This can also be derived from Figure 106, where the strength
approaches 0 at high temperatures. The neck size ratio X/D and solid fractional density
VS can be determined by the sintering cycle and be based on computer simulations.
The other limiting aspect of deformation during sintering is elongation. As has
been shown, bending of the features is not a problem. At the same time, once the bond
with the substrate is established, the features are stretched.
0.00E+00
2.00E+02
4.00E+02
6.00E+02
8.00E+02
1.00E+03
1.20E+03
-100 100 300 500 700 900 1100
UTS [
MPa]
Temperature [K]
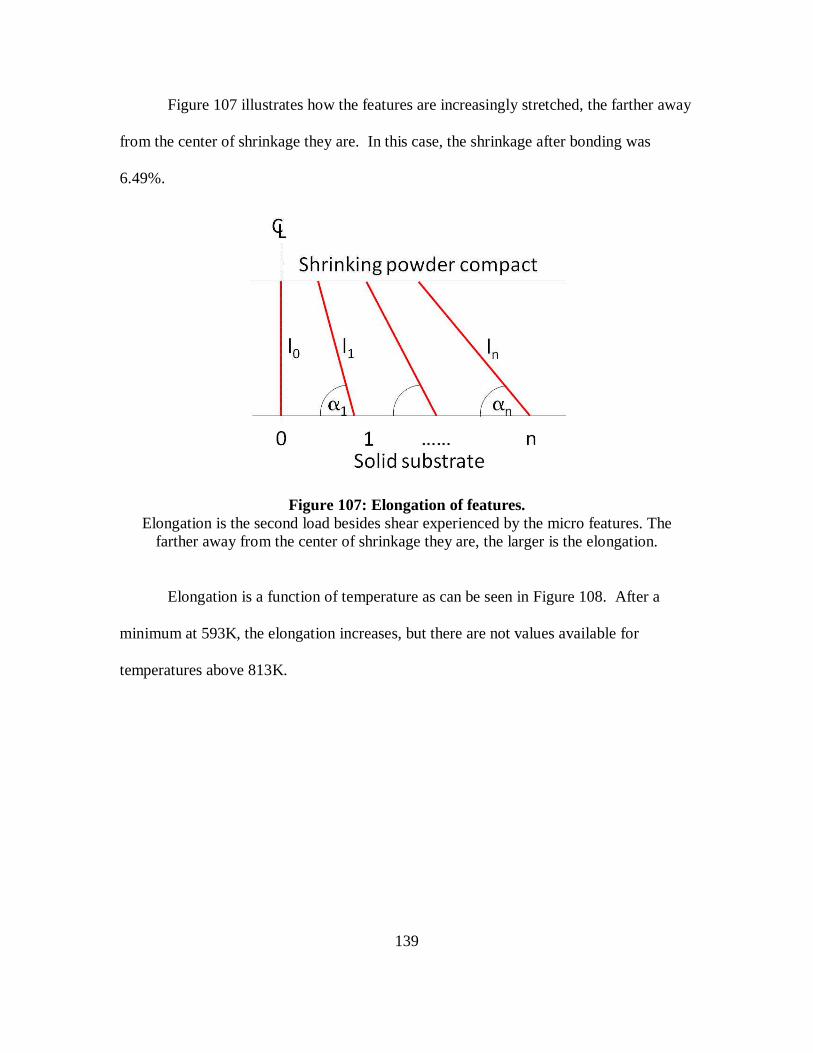
139
Figure 107 illustrates how the features are increasingly stretched, the farther away
from the center of shrinkage they are. In this case, the shrinkage after bonding was
6.49%.
Figure 107: Elongation of features. Elongation is the second load besides shear experienced by the micro features. The
farther away from the center of shrinkage they are, the larger is the elongation.
Elongation is a function of temperature as can be seen in Figure 108. After a
minimum at 593K, the elongation increases, but there are not values available for
temperatures above 813K.
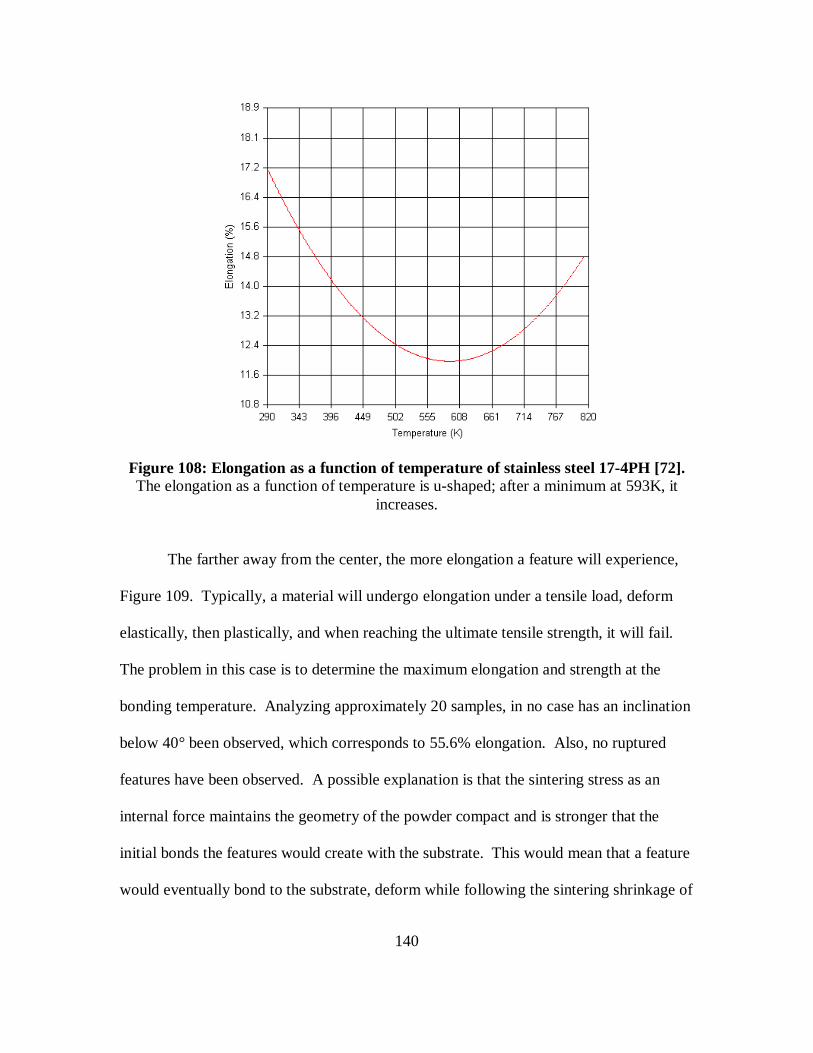
140
Figure 108: Elongation as a function of temperature of stainless steel 17-4PH [72]. The elongation as a function of temperature is u-shaped; after a minimum at 593K, it
increases.
The farther away from the center, the more elongation a feature will experience,
Figure 109. Typically, a material will undergo elongation under a tensile load, deform
elastically, then plastically, and when reaching the ultimate tensile strength, it will fail.
The problem in this case is to determine the maximum elongation and strength at the
bonding temperature. Analyzing approximately 20 samples, in no case has an inclination
below 40° been observed, which corresponds to 55.6% elongation. Also, no ruptured
features have been observed. A possible explanation is that the sintering stress as an
internal force maintains the geometry of the powder compact and is stronger that the
initial bonds the features would create with the substrate. This would mean that a feature
would eventually bond to the substrate, deform while following the sintering shrinkage of
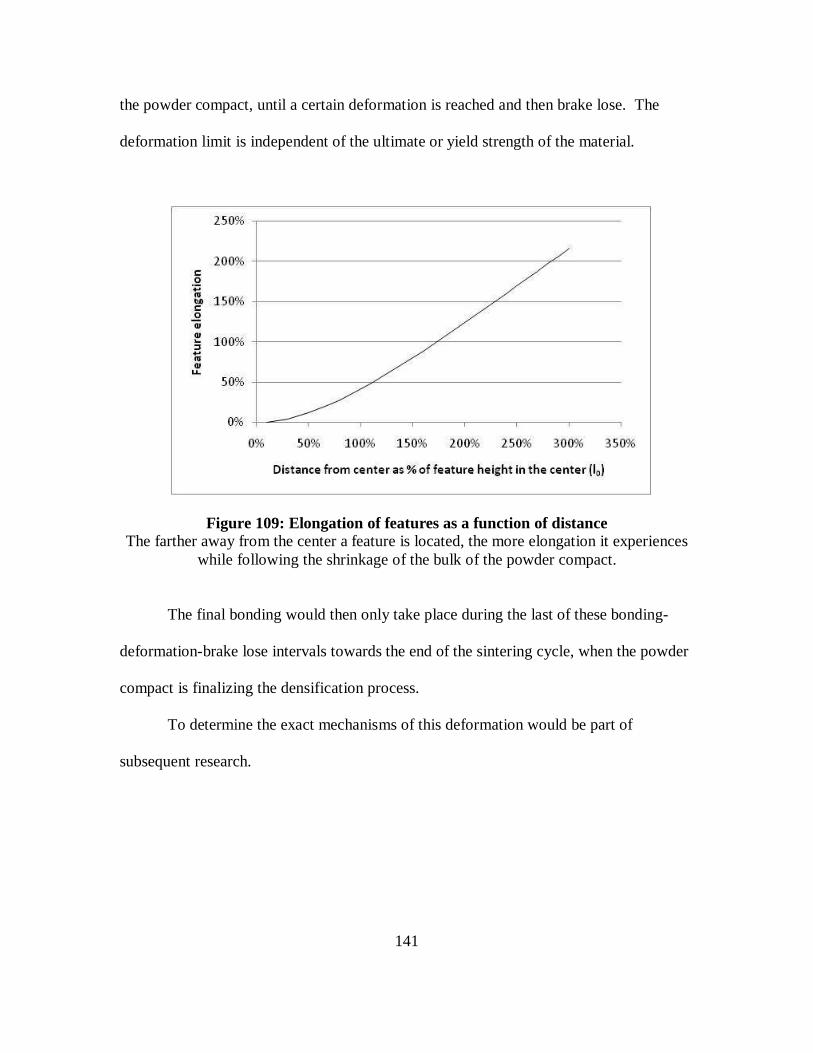
141
the powder compact, until a certain deformation is reached and then brake lose. The
deformation limit is independent of the ultimate or yield strength of the material.
Figure 109: Elongation of features as a function of distance The farther away from the center a feature is located, the more elongation it experiences
while following the shrinkage of the bulk of the powder compact.
The final bonding would then only take place during the last of these bonding-
deformation-brake lose intervals towards the end of the sintering cycle, when the powder
compact is finalizing the densification process.
To determine the exact mechanisms of this deformation would be part of
subsequent research.
142
4.5.3. Sub-conclusion
In this section, the strength of the bonds has been evaluated and compared with
the theoretical values. For this purpose, a shear test fixture has been designed and built.
The sinter bonded samples were tested with the test fixture on an INSTRON tensile test
machine and compared with reference samples, joined by welding, brazing and adhesive
bonding. The sinter bonded samples achieved bond strengths of up to 80% of the
strength of the welded sample.
This strength was confirmed by calculating the theoretically possible shear
strength of the bulk material. It was shown that the features are only loaded in shear and
not in bending
Knowing the powder compact’s relative density and temperature, it is possible to
calculate its in-situ strength. It was not possible to calculate the strength of the powder
compact at the determined point of bonding due to the temperature of 1276K. No values
for the ultimate strength nor elongation are available for that temperature range. This
limited also the calculations of the deformation limits. It was expected that there was a
limit to the deformation of the micro features, but on the samples no broken or failed
micro features were found, which leads to the assumption that the initial bonds between
the features and the substrate are broken when a certain deformation is reached, and thus
the final bonds will only be established towards the end of the sintering cycle.
143
5. DISCUSSION AND CONCLUSION
5.1. Introduction
In this chapter, the information and data obtained and collected during this
research will be referred to the relevant research questions. That information will then be
summed up to reach the research objectives and answer the overall goal of this research,
where limitations and validity will be discussed. This chapter will close with a
discussion of the results and provide an outlook and further directions.
5.2. Research quest ions
1. How does the classical two-sphere sinter model apply to sinter bonding
powder to a solid substrate?
The sintering process in sinter bonding a MIM powder compact to a solid
substrate is basically the same as the sintering process in the bulk powder
compact. The difference found in this case is geometrically given in that the
micro features bond to a substrate. This solid substrate is assumed to have a
large radius. This permits only a very few powder particles to come into
contact with the substrate. On the other hand, these powder particles have
multiple contacts with particles in the bulk of the material. Although the van
der Waals forces, which create the initial contacts, are bigger in a sphere-plate
combination, than in a sphere-sphere combination, the powder compact will

144
not bond to the substrate initially, because of the multiple contacts inside the
bulk. The initial sintering takes place in the bulk of the material.
Once the initial bonds are established, either sphere-sphere or sphere-plate, the
sintering process occurs according to current sintering models with neck
growth and densification mechanisms through diffusion and viscous flow.
2. How and when during the sinter cycle is the bond between the powder
compact and the substrate established?
A geometric model was developed that determined the point at which the
micro features of a sample bonded to the substrate. Based on the micro
feature deformation, and with the densification over the sintering cycle
modeled, based on the Master Sintering Curve approach, it was determined
that the features of the sample bonded after a shrinkage of 10.91%, after
which the sample shrunk an additional 6.49% to its final density.
This point of bonding seems to depend on several factors:
a) Contamination: in this study, the surfaces of the solid substrates have been
cleaned before assembly, some irregularities have been observed. It is
very possible that contamination or oxide layers can impede or delay the
boning of the micro features to the substrate.
b) Material: it is expected, that different materials bond at different points
during the sintering cycles. This would depend on their fundamental
material properties, particularly thermal strength and diffusivity. Also,
bonding different materials would certainly move the point of bonding.
145
c) Powder: the powder size could influence the bonding process, since
smaller powders are sintering earlier. Also, the alloying process could be
influential. Alloys in powder metallurgy can be processes as so called
master alloys, where powders of the components are blended, or as
prealloys, where the powder is made from a material that was alloyed in
the liquid phase. In the first case it might be possible that alloying
elements are first in contact with the substrate and show a different
bonding behavior than the base material or final alloy would show.
3. How can the process of sinter bonding a powder compact to a solid substrate
be modeled?
The sinter bonding process can be modeled with current sintering models.
The analysis of the samples and the literature review showed that for the sinter
bonding process currently available models (e.g. [103, 113, 117]) can be
applied. These models calculate neck growth, grain growth and strength
evolution and their validity has been widely discussed in the literature. One
important task that fed into this question was that of identifying elements of
the model and their influences. It was found that part flatness was very
important to assure good bonding. Measurements have shown that samples
made by compression molding achieved much better flatness than injection
molded parts when using RTV rubber mold inserts. As a consequence,
samples of compression molded powder compacts were sinter bonded to
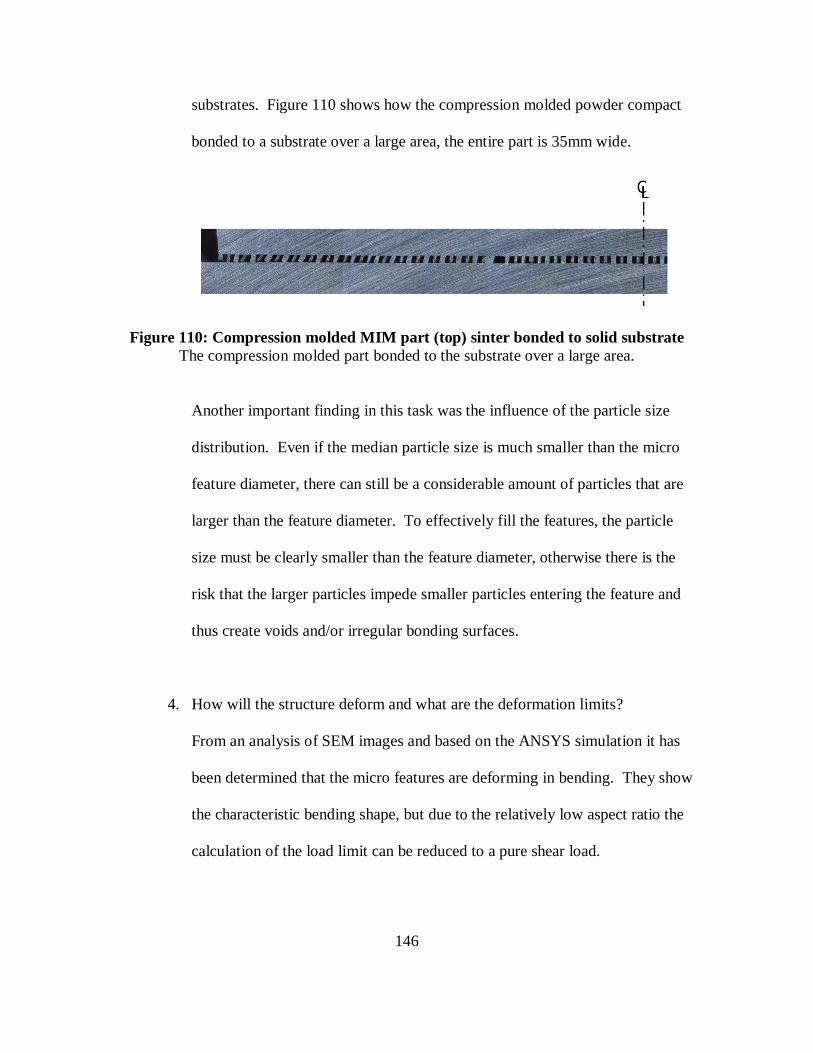
146
substrates. Figure 110 shows how the compression molded powder compact
bonded to a substrate over a large area, the entire part is 35mm wide.
Figure 110: Compression molded MIM part (top) sinter bonded to solid substrate The compression molded part bonded to the substrate over a large area.
Another important finding in this task was the influence of the particle size
distribution. Even if the median particle size is much smaller than the micro
feature diameter, there can still be a considerable amount of particles that are
larger than the feature diameter. To effectively fill the features, the particle
size must be clearly smaller than the feature diameter, otherwise there is the
risk that the larger particles impede smaller particles entering the feature and
thus create voids and/or irregular bonding surfaces.
4. How will the structure deform and what are the deformation limits?
From an analysis of SEM images and based on the ANSYS simulation it has
been determined that the micro features are deforming in bending. They show
the characteristic bending shape, but due to the relatively low aspect ratio the
calculation of the load limit can be reduced to a pure shear load.
147
The problem in finding the deformation limits during the sintering process is
the temperature at which the deformation occurs. It was found that the micro
features bond at a temperature of 1276°C and the shrinkage continues to the
maximum sintering temperature of 1360°C. For that temperature there is no
data available for the tensile strength and elongation of the material. It would
be supposed that the micro features bond to the substrate and are elongated
following the sinter shrinkage of the powder compact. This would lead to a
very large elongation of the features and eventually to distinctive necking and
finally failure. On the analyzed samples, no such necking or failure was
observed. Moreover, no feature deformation over 40° was observed, leading
to the assumption, that the bonding process might take place in several
intervals. The features could bond to the surface and these bond could be
broken loose when a certain maximum deformation is reached. The powder
compact continues to shrink and the features starts to bond again until the
maximum deformation is reached. This process would then be repeated until
the final density is reached and the features stay bonded to the substrate. The
sintering stress is assumed to be the force maintaining the shape of the
features.
To analyze this exact behavior, it would be necessary to do a series of sinter
runs which could be stopped at certain points to evaluate the parts. This
process would be very costly due to high equipment, energy and process gas
cost.
148
5. How does the micro structure behave after the initial bond is established?
This question has basically been answered together with question 4. Once the
initial bond is established, the micro feature will deform under a bending load
as has been observed on the samples in the ANSYS simulation. The question
raised above is, if there might be a sequence of bonding processes or bonding
“intents”. The deformation could take place during the first or initial bonding
and the deformed feature will maintain this shape until the final bonding
process.
Another part of the structure behavior is the bond strength. That part will be
discussed in question 6.
6. How can the pre-bonding and post-bonding phases be combined, modeled and
simulated?
It has been shown that there are models, either currently available, or
developed in this research, that comprise the pre and post bonding phases.
The key point to this question is to know the point of bonding. Current
bonding and shrinkage models apply up to this point, once the feature has
bonded to the substrate, the developed deformation model applies. The
broader implication of this question is how to model or, even better; predict
the strength of the bonds. Bond strengths of up to 80% of that of resistance
welds have been achieved with the available micro feature design. The bond
strength is a function of the apparent net bonded area. This area depends on
the feature size, spacing and tip shape. The smaller the tip radius is, the
149
smaller the bonded area will be. Although a certain “rolling” motion which
brings more material into contact with the substrate has been observed, the
basic shape will have a larger influence.
Even though the micro features deform in bending while sintering and
following the shrinkage of the powder compact, the load at failure is pure
shear because of the low aspect ratio. This has also been confirmed by
analyzing the failures through SEM images.
5.3. Research object ives
Objective 1: Sinter bonding
This objective has been achieved. The bonding and sintering
processes have been analyzed and modeled where not available. The sintering
mechanisms are the same as in currently available models, with the singularity of the
sphere-plate interface. The point at which a feature of certain shape and size bonds to a
substrate during a sintering cycle has been determined. Elements of the models and their
influences have been established.
Objective 2: Deformation
The deformation which the micro features undergo after bonding to
the substrate has been analyzed, modeled and simulated with the FE software ANSYS.
To this end, a new approach for the FE simulation, which shows good agreement with the
physical samples, has been developed. Evaluating the deformation limits of the features
150
during sintering and densification, it seems as if the “final” bonding location might be
reached only after several bonding “intents”. Under the SEM there have no traces of
these bonding intents been found, but the lack of necking and failure after extended
elongation indicate that there might be previous bonding intents which fail before the
powder compact reaches its final density. Although it would be interesting to analyze
this phenomenon in detail, it has no effect on the final bond strength.
Objective 3: Model and evaluation
The model of sinter bonding of micro features to a solid substrate,
the process is divided on two parts, the pre bonding and the post bonding part. The pre
bonding part can be modeled with currently available models; the post bonding part has
been show in this research.
The evaluation of samples showed shear strengths of up to 80% of
that of resistant weld joints. A limitation of the absolute shear strength of the sinter
bonded samples in this research was the lack of flatness of the injection molded powder
compacts, due to the soft RTV rubber mold inserts. Compression molded compacts
showed much better flatness and bonded over larger areas, which increases the absolute
strength of the bonds.
5.4. Research goal
The overall goal of this research was to investigate, understand and model the
proposed process of micro feature enhanced sinter bonding a MIM powder compact to a
151
solid substrate. This comprised three objectives: model the time temperature dependent
process of bonding a powder to a solid substrate, model the deformation of the micro
features once the bond between powder compact and substrate has been established and
finally model and evaluate the overall sinter bonding process.
“Micro feature enhanced sinter bonding of MIM compacts to solid substrates” –
this is a process to overcome the problems encountered in sinter bonding ‘traditional”
MIM compacts to solid substrates. The obstacle to sinter bonding was the sinter
shrinkage of the powder compact and other differential movements as for example
different thermal expansion and contraction between both components. Applying micro
features to the surface of the powder compact can overcome these obstacles. This
research has shown the effectiveness of this new process. High bonding strengths,
compared with traditional joining processes, have been achieved, while avoiding cracks
or deformation of the powder compact. The sintering and bonding mechanisms have
been analyzed and modeled. A new approach to simulate the sinter shrinkage has been
shown. Of course, there are some limitations to the findings in this research. First, the
material; all samples were stainless steel 17-4PH. The applicability to other materials
needs to be evaluated and is part of the future work. Also, the size of the samples needs
to be taken into consideration. Industrial applications might require much larger bonding
areas. To realize these large areas, differently shaped and sized features might be
necessary. The features analyzed in this research were limited to mold inserts that were
readily available.
152
5.5. Broader impacts
This research is the basis for future research, especially with regards to
applications in industry. So far, no literature, research or applications on sinter bonding a
MIM part to a solid substrate have been found. There are a variety of advantages to this
process, as described in the section on the motivation of this research.
The possibility to combine different materials to one component and thus be able
to specifically design the component’s physical or chemical properties could make this
process very attractive to many industries as for example electric/electronics, where
magnetic-non magnetic or conductive-non conductive behavior could be easily combined
into one component. Another application would be in the area of lightweight design,
where high strength-low strength and/or high density-low density materials could be
combined to reduce weight and increase component strength.
5.6. Outlook and further direct ions
Having finished this basic research on sinter bonding a metal injection molded
part to a solid substrate, the door is open to a wide space for further research.
There are basically two areas that need to be pursued:
a) Modeling and optimization: the ultimate goal would be to be able to
design the optimum structure for a given application. In this research
some important conditions of achieving strong bonds have been analyzed
153
and determined, as there is e.g. the feasible feature size as a function of the
powder size distribution.
b) Materials: in this research, only components of similar material, stainless
steel 17-4PH have been sinter joined. Further research is necessary for
joining others materials, and, ultimately, joining two or more different
materials. How can different materials be combined and bonded? Do the
same models apply to different materials? There is a great potential in
joining different materials.
Another important step is to identify an application for this process and prove the
concept in an industrial environment.

154
APPENDICES
155
MATLAB program to calculate van der Waals forces (vanderWaals.m):
clear; % Calculation of van der Waals forces % % R1=2.5; R2=(1/2):(20/2); for n=1:10; Fss1(1,n)=(2*(pi)*R1*R2(1,n))/(R1+R2(1,n)); end ; for o=1:10; Fss2(1,o)=(2*(pi)*R2(1,o)*R2(1,o))/(2*R2(1,o)); end ; for m=1:10; Fsp(1,m)=2*(pi)*R2(1,m); end ; plot(R2,Fss1,R2,Fss2,R2,Fsp); xlabel( 'R2 [mu]' ); ylabel( 'Relative van der Waals force' ); legend( 'Sphere-spere, R1=2.5' , 'Sphere-sphere, R1=R2' , 'Sphere-plate' , ... 'Location' , 'NorthWest' );
156
MATLAB program to calculate the neck size between two spheres
during sintering (necksizecalculat ion_einfach.m):
clear; % Program to calculate the neck size during the s intering of two spheres % % D=1; % Original sphere diameter Vg=4.21; % Green density Vs=7.75; % Sintered (final) density V0=pi()/3*D^3; % Original volume of two spheres Sf=(Vg/Vs)^(1/3); % Final of 1 - shrinkage % 1. Calculate neck size at end of sintering Xf (2 half spheres + % cylinder) with final center distance Af=Sf*D. syms R1; S=2*R1^3-(3/2*Sf)*R1-1; R1=solve(S,R1); % R1=D/X R2=double(R1(1,1)); % convert symbolic R1 into number Xf=D/R2; % final neck size % Delta radius dr=(D/2-Xf/2)/40; % Delta Abstand dA=(D-Sf*D)/40; r=D/2; L=D/2; for n=1:40; D(1,n+1)=D(1,n)-dA; L(1,n)=D(1,n)/2; r(1,n+1)=r(1,n)-dr; end ; for n1=1:40; % Volume Kugelkalotte a(1,n1)=sqrt(r(1,n1)^2-L(1,n1)^2); h(1,n1)=r(1,n1)-sqrt(r(1,n1)^2-a(1,n1)^2); Vks(1,n1)=(h(1,n1)^2*pi()/3)*(3*r(1,n1)-h(1 ,n1)); % Volumen der beiden Kugeln minus Kalotten Vk(1,n1)=2*(pi()/6*(2*r(1,n1))^3-Vks(1,n1)) ;
157
dx(1,n1)=a(1,n1)+0.1; syms x; V(1,n1)=int((2*pi()*x*(L(1,n1)-sqrt(r(1 ,n1)^2-x^2))),a(1,n1),dx(1,n1)); Vr(1,n1)=double(V(1,n1)); %Gesamter Ring: Vrg(1,n1)=2*Vr(1,n1); while (Vrg(1,n1)<(V0-Vk(1,n1))); dx(1,n1)=dx(1,n1)+0.1; syms x; V(1,n1)=int((2*pi()*x*(L(1,n1)-sqrt(r(1,n1)^2-x^2))),a(1,n1),dx(1,n1)); Vr(1,n1)=double(V(1,n1)); %Gesamter Ring: Vrg(1,n1)=2*Vr(1,n1); X(1,n1)=2*dx(1,n1); if X(1,n1)>Xf; X(1,n1)=Xf; end ; end ; end ; for n2=1:40; Ds(1,n2)=D(1,n2)/D(1,1); end ; plot(Ds(1:40),X(1:40)); xlabel( 'Relative center distance' ); ylabel( 'Relative sphere diameter' );
158
MATLAB program to determine the coefficients to fit the MSC curve
to the BASF shrinkage data (Determ_BASF_curve_coeff_1.m):
clear; % %Master Sintering Curve - Blaine Paper % Constants: Q=290000; %Original Blaine 350000 R=8.314472; a=10.03; %Original Blaine 29.93 b=1.45; %Original Blaine 1.521 load Orig_BASF_data_ext.mat temp_K_1 ; temp=temp_K_1; load Orig_BASF_data_ext.mat time_sec_1 ; time=time_sec_1; load Orig_BASF_data_ext.mat shrink_pos_1 ; rho0=4.21/7.74; % Work of Sintering: for n=1:20 Theta(1,n)=(exp(-Q/(R*temp(1,n)))*time(1,n))/temp(1 ,n); end % Relative Density for m=1:20 rho(1,m)=rho0+(1-rho0)/(1+exp(-(log10(Theta(1,m))+a )/b)); end % Absolut Density calculated rhoabs=rho*7.74; % Shrinkage calculated shrink_calc_1=((rhoabs/4.21).^(1/3)-1)*100; [AX,H1,H2]=plotyy(time,shrink_pos_1,time,temp_K_1); set(AX, 'FontSize' ,16); ylim([0 20]); set(get(AX(1), 'Ylabel' ), 'String' , 'Shrinkage [%]' ); set(get(AX(2), 'Ylabel' ), 'String' , 'Temperature [K]' );
159
MATLAB program to apply the MSC data
(MSC_applicat ion_onephase_1.m):
clear; % Application of MSC to our sinter curve with con stants from BASF curve % fit % Constants: Q=290000; %determined in "Determ_BASF_curve_coeff_1.m" R=8.314472; a=10.03; %determined in "Determ_BASF_curve_coeff_1.m" b=1.45; %determined in "Determ_BASF_curve_coeff_1.m" load sintercurve_data_1.mat temp_K_1 ; temp=temp_K_1; load sintercurve_data_1.mat time_sec_1 ; time=time_sec_1; %load Orig_BASF_data_ext.mat shrink_pos_1; rho0=4.21/7.74; % Work of Sintering: for n=1:20 Theta(1,n)=(exp(-Q/(R*temp(1,n)))*time(1,n))/temp(1 ,n); end % Relative Density for m=1:20 rho(1,m)=rho0+(1-rho0)/(1+exp(-(log10(Theta(1,m))+a )/b)); end % Absolut Density calculated rhoabs=rho*7.74; % Shrinkage calculated shrink_calc_1=((rhoabs/4.21).^(1/3)-1)*100; [AX,H1,H2]=plotyy(time,shrink_calc_1,time,temp_K_1) ; set(AX, 'FontSize' ,16); set(get(AX(1), 'Ylabel' ), 'String' , 'Shrinkage [%]' ); set(get(AX(2), 'Ylabel' ), 'String' , 'Temperature [K]' ); xlabel( 'Time [sec]' );
160
MATLAB program to calculate sintering stress (sintstress_1.m):
clear; % Sintering stress % Based on Kwon, et al paper... % % Calculate density (from MSC_application_1.m) % Constants: Q=290000; %Original 350000, test 337000 R=8.314472; a=10.03; %Original 29.93, test 25.53 b=1.45; %Original 1.521, test 4.721 load sintercurve_data_1.mat temp_K_1 ; temp=temp_K_1; load sintercurve_data_1.mat time_sec_1 ; time=time_sec_1; rho0=4.21/7.74; D=0.000005; Gamma=2; % Work of Sintering: for n=1:20 Theta(1,n)=(exp(-Q/(R*temp(1,n)))*time(1,n))/temp(1 ,n); end % Relative Density for m=1:20 rho(1,m)=rho0+(1-rho0)/(1+exp(-(log10(Theta(1,m))+a )/b)); end % Sintering stress for o=1:20 sigmasi(1,o)=(((6*Gamma)/D)*(rho(1,o)^2)*((2*rh o(1,o)-rho0)/(1-rho0))); end ; for p=1:20 sigmasf(1,p)=(4*Gamma)/((D/2)*(((1-rho(1,p))/6*rho(1,p))^(1/3))); end ; for q=1:20; if (rho(1,q)<0.85); sigmas(1,q)=sigmasi(1,q); elseif (rho(1,q)>0.95); sigmas(1,q)=sigmasf(1,q); else sigmas(1,q)=(0.95-rho(1,q))/(0.95-0.85)*sig masi(1,q)+ ...
161
(rho(1,q)-0.85)/(0.95-.85)*sigmasf(1,q) ; end ; end ; % Thermal softening t=temp_K_1; for r=1:20; if (t(1,r)>=293.0) && (t(1,r) <= 698.0); ft(1,r) = -1.222995e-005*t(1,r)^3+1.945933 e-002*t(1,r)^2- ... 1.050015e+001*t(1,r) +3.122457e+003; elseif (t(1,r) >= 698.0) && (t(1,r) <= 813.0); ft(1,r) = -5.217250e-005*t(1,r)^3 + ... 1.026377e-001*t(1,r)^2 -6.814111e+001*t (1,r) +1.641424e+004; else ft(1,r) = 1; end ; end ; ftpa=ft*1000; [AX,H1,H2]=plotyy(time,sigmas,time,temp_K_1); set(AX, 'FontSize' ,16); hold on; set(AX(1), 'nextplot' , 'add' ); set(get(AX(1), 'Ylabel' ), 'String' , 'Sintering stress [Pa]' ); set(get(AX(2), 'Ylabel' ), 'String' , 'Temperature [K]' ); xlabel( 'Time [sec]' ); hold off ;
162
MATLAB program to calculate neck size between two spheres
(necksizecalculat ion_radius.m):
clear; % % Calculation of neck between two spheres % % Given values: r1=2.5; r2=0.01; h=0.23*r1; Vks=(1/3)*h^2*pi()*(3*r1-h); x1=0:((2*r1-h)/20):(2*r1-h); % Points circle 1 upper half for n1=1:21 y1(1,n1)=sqrt(r1^2-(x1(1,n1)-(r1-h))^2); end % circle 2 lower half ym2=(sqrt((r1+r2)^2-(r1-h)^2)); % Touching point alpha=acos(ym2/(r1+r2)); tx=sin(alpha)*r2; % Neck volume syms x; V1=int(((pi()*(ym2-sqrt(r2^2-(x-r2)^2))^2)-(pi()*(s qrt(r1^2-(x-(r1-h))^2)^2))),0,tx); Vn1=double(V1); while (Vn1<Vks); r2=r2+0.01; ym2=(sqrt((r1+r2)^2-(r1-h)^2)); alpha=acos(ym2/(r1+r2)); tx=sin(alpha)*r2; syms x; V1=int(((pi()*(ym2-sqrt(r2^2-(x)^2))^2)-(pi()*( sqrt(r1^2-(x-(r1-h))^2)^2))),0,tx); Vn1=double(V1); end ; % Circle 2 lower half
163
x2=0:(r2/20):(r2); for n2=1:21; y2(1,n2)=ym2-sqrt(r2^2-(x2(1,n2))^2); end nd=2*(ym2-r2); % Neck diameter xd=nd/(2*r1); % Neck size ratio % Plot plot(x1,y1,x2,y2); axis([0 (2*r1) 0 (2*r1)]); text(r2,ym2,[ 'neck diam.=' ,num2str(nd), ' X/D=' ,num2str(xd)]); xlabel( 'D1' ); ylabel( 'Center distance' ); title( 'Neck size sphere-sphere' );
164
MATLAB program to calculate neck size between two spheres
(test_sphere_flat_neu.m):
clear; % Gegeben: r1=2.5; r2=0.01; h=0.46*r1; Vks=(1/3)*h^2*pi()*(3*r1-h); x1=0:((2*r1-h)/20):(2*r1-h); % Punkte Kreis 1 obere Haelfte for n1=1:21 y1(1,n1)=sqrt(r1^2-(x1(1,n1)-(r1-h))^2); end % Kreis 2 untere Haelfte b=r1-h-r2; ym2=(sqrt((r1+r2)^2-b^2)); % Beruehrungspunkt alpha=acos(ym2/(r1+r2)); tx=r2+sin(alpha)*r2; % Neck volume syms x; V1=int(((pi()*(ym2-sqrt(r2^2-(x-r2)^2))^2)-(pi()*(s qrt(r1^2-(x-(r1-h))^2)^2))),0,tx); Vn1=double(V1); while (Vn1<Vks); r2=r2+0.01; b=r1-h-r2; ym2=(sqrt((r1+r2)^2-b^2)); alpha=acos(ym2/(r1+r2)); tx=r2+sin(alpha)*r2; syms x; V1=int(((pi()*(ym2-sqrt(r2^2-(x-r2)^2))^2)-(pi( )*(sqrt(r1^2-(x-(r1-h))^2)^2))),0,tx); Vn1=double(V1); end ; % Punkte Kreis 2 untere Haelfte x2=0:(2*r2/20):(2*r2);

165
for n2=1:21; y2(1,n2)=ym2-sqrt(r2^2-(x2(1,n2)-r2)^2); end nd=2*(ym2-r2); % Neck diameter xd=nd/(2*r1); % Neck size ratio % Plot plot(x1,y1,x2,y2); axis([0 (2*r1) 0 (2*r1)]); text(r2,ym2,[ 'neck diam.=' ,num2str(nd), ' X/D=' ,num2str(xd)]); xlabel( 'D1' ); ylabel( 'Center distance' ); title( 'Neck size sphere-flat' );
166
REFERENCES
1. German, R.M., Injection Molding of Metals and Ceramics. 1997, Princeton, NJ: Metal Powder Industries Federation. p. 67.
2. German, R.M., Injection Molding of Metals and Ceramics. 1997, Princeton, NJ: Metal Powder Industries Federation. p. 294.
3. German, R.M., Sintering Theory and Practice. 1 ed. 1996, New York, NY: John Wiley & Sons, Inc.
4. Askeland, D.R. and P.P. Phulé, The science and engineering of materials. 5 ed. 2006: Thomson.
5. IFAM, F., The MIM process. 2010: Bremen, Germany.
6. AZoM. Metal Injection Molding. 2001 [cited 2010; Available from: http://www.azom.com/Details.asp?ArticleID=742.
7. Bhatkal, R. and T. Hannibal, The technical cost modeling of near-net-shape P/M manufacturing. JOM Journal of the Minerals, Metals and Materials Society, 1999. 51(7): p. 26-27.
8. MPIF. PICK PM. 2010 [cited 2010; Available from: http://www.pickpm.com/designcenter/MIM_overview.asp?locarr=2|1|2|3.
9. Bulger, M., North American MIM Status, in 2011 International Conference on Injection Molding of Metals, Ceramics and Carbides. 2011, Metal Powder Industries Federation (MPIF): Orlando, Fl, USA.
10. Blömacher, M., State of the European MIM industry, in 2011 International Conference on Injection Molding of Metals, Ceramics and Carbides. 2011, Metal Powder Industries Federation (MPIF): Orlando, Fl, USA.
11. Dr. Georg Schlieper, D.G.D., Bernard Williams, Dr. Frank Petzoldt, Metal Injection Moulding. 2009, European Powder Metallurgy Association (EPMA): Shrewsbury. p. 13.
12. Li, Y., et al., Critical thickness in binder removal process for injection molded compacts. Materials Science and Engineering A, 2003. 362(1-2): p. 292-299.
13. Heaney, D.F. and R. Spina, Shrinkage prediction of MIM parts by finite element simulation. International Journal of Computational Materials Science and Surface Engineering, 2007. 1(1): p. 57-72.
167
14. Olevsky, E.A. and R.M. German, Effect of gravity on dimensional change during sintering--I. Shrinkage anisotropy. Acta Materialia, 2000. 48(5): p. 1153-1166.
15. Olevsky, E.A., R.M. German, and A. Upadhyaya, Effect of gravity on dimensional change during sintering--II. Shape distortion. Acta Materialia, 2000. 48(5): p. 1167-1180.
16. Kinetics, MIM Design Guide. 2004, Kinetics Inc.: Wilsonville, Or.
17. Tabata, T. and S. Masaki. How to produce P/M composite parts from metal powder and solid metal by sinter bonding. 1985. Toronto, Ont, Can: Metal Powder Industries Federation.
18. J. P. Parmigiani, J.C.K., Joining of P/M components, in SAE International Congress and Exposition. 1999, SAE International, Warrendale, Pennsylvania, USA: Detroit, Michigan, USA.
19. Mohan, A., N.C. Soni, and V.K. Moorthy, `Definition of the term sintering'. Science of Sintering, 1983. 15(3): p. 139-40.
20. Frenkel, Y.I., Viscous flow of crystalline bodies under the action of surface tension. Science of Sintering, 1980. 12(1): p. 7-18.
21. Ristic, M.M., Frenkel's theory of sintering. Science of Sintering, 1996. 28(Special Issu): p. 1-1.
22. Mackenzie, J.K. and R. Shuttleworth, Phenomenological theory of sintering. Physical Society -- Proceedings, 1949. 62(360B): p. 833-852.
23. Kuczynski, G.C., Mechanism of densification during sintering of metallic particles. Acta Metallurgica, 1956. 4(1): p. 58-61.
24. Ashby, M.F., A first report on sintering diagrams. Acta Metallurgica, 1974. 22(3): p. 275-289.
25. German, R.M., Injection Molding of Metals and Ceramics. 1997, Princeton, NJ: Metal Powder Industries Federation. p. 226.
26. Kang, S.-J.L., Sintering: densification, grain growth, and microstructure 2005, Oxford: Elsevier Butterworth-Heinemann.
27. Danninger, H. and C. Gierl, Processes in PM steel compacts during the initial stages of sintering. Materials Chemistry and Physics, 2001. 67(1-3): p. 49-55.
28. Riedel, H., V. Kozák, and J. Svoboda, Densification and creep in the final stage of sintering. Acta Metallurgica et Materialia, 1994. 42(9): p. 3093-3103.
168
29. Riedel, H., H. Zipse, and J. Svoboda, Equilibrium pore surfaces, sintering stresses and constitutive equations for the intermediate and late stages of sintering - II. Diffusional densification and creep. Acta metallurgica et materialia, 1994. 42(2): p. 445-452.
30. Schatt, W., Sintervorgänge. 1992, Düsseldorf: VDI-Verlag GmbH. p. 77 ff.
31. Schatt, W., Werkstoffwissenschaft. 8 ed. 1996, Stuttgart: Deutscher Verlag für Grundstoffindustrie. 286.
32. Olevsky, E.A., Theory of sintering: from discrete to continuum. Materials Science & Engineering R: Reports, 1998. 23(2): p. 41-99.
33. Tabata, T., et al., Fabrication of composite parts by sinter bonding. International Journal of Powder Metallurgy (Princeton, New Jersey), 1991. 27(3): p. 265-273.
34. Genkichi Umeha, S.U., Saturo Kato, Method for Manufacturing Camshaft, U.S.P. Office, Editor. 1985, Nippon Piston Ring Co., Ltd., Tokyo, Japan: USA. p. 5.
35. Asaka, K. Diffusion Bonding methods of Green Compacts with Wrought Steel Parts During Sintering. in 2000 Advances in Powder Metallurgy & Particulate Materials. 2000. New York, N.Y.
36. German, R.M., Sintering Theory and Practice. 1 ed. 1996, New York, NY: John Wiley & Sons, Inc. p. 453.
37. Miura, H., et al., Joining for more functional and complicated parts in MIM process. Funtai Oyobi Fummatsu Yakin/Journal of the Japan Society of Powder and Powder Metallurgy, 1997. 44(5): p. 437-442.
38. Miura, H., T. Yano, and M. Matsuda, MIM In-process joining of thin and hollow parts. Funtai Oyobi Fummatsu Yakin/Journal of the Japan Society of Powder and Powder Metallurgy, 2001. 48(11): p. 1097-1101.
39. Baumgartner, R. and L.K. Tan, MIM 'marries' metals. Metal Powder Report, 2002. 57(3): p. 38-42.
40. Tan, L.-K., R. Baumgartner, and R.M. German. Powder Injection Molding of Bi-Metal Components. 2001. New Orleans, LA, United states: Metal Powder Industries Federation.
41. Harikou, T., et al., Joining of stainless steels (SUS316L) and hard materials by insert injection molding. Funtai Oyobi Fummatsu Yakin/Journal of the Japan Society of Powder and Powder Metallurgy, 2004. 51(1): p. 31-36.
42. Zhang, S.X., et al., Sinter bonding sticks MIM ahead again. Metal Powder Report, 2003. 58(12): p. 20-23.
169
43. Potente, H. and L. Wilke, Joining injection moulded sintered parts in the green compact phase, Fuegen spritzgegossener Sinterteile in der Gruenlingsphase. Kunststoffe Plast Europe, 2004. 94(11): p. 58-61.
44. Imgrund, P., et al., Manufacturing of multi-functional micro parts by two-component metal injection moulding. The International Journal of Advanced Manufacturing Technology, 2007. 33(1): p. 176-186.
45. Imgrund, P., A. Rota, and M. Wiegmann, Getting better bonding at tiny interfaces. Metal Powder Report, 2007. 62(3): p. 31-34.
46. Ruh, A., et al., Production of two-material micro-assemblies by two-component powder injection molding and sinter-joining. Microsystem Technologies, 2008. 14(12): p. 1805-1811.
47. Heaney, D.F., P. Suri, and R.M. German, Defect-free sintering of two material powder injection molded components Part 1 experimental investigations. Journal of Materials Science, 2003. 38(24): p. 4869-74.
48. Suri, P., D.F. Heaney, and R.M. German, Defect-free sintering of two material powder injection molded components Part II model. Journal of Materials Science, 2003. 38(24): p. 4875-81.
49. German, R.M., Computer modeling of sintering processes. International Journal of Powder Metallurgy (Princeton, New Jersey), 2002. 38(2): p. 48-66.
50. Heaney, D.F. and R. Spina, Numerical analysis of debinding and sintering of MIM parts. Journal of Materials Processing Technology, 2007. 191(1-3): p. 385-389.
51. Zavaliangos, A., J.M. Missiaen, and D. Bouvard, Anisotropy in shrinkage during sintering. Science of Sintering, 2006. 38(1): p. 13-25.
52. Reiterer, M.W. and K.G. Ewsuk, An Analysis of Four Different Approaches to Predict and Control Sintering. Journal of the American Ceramic Society, 2009. 92(7): p. 1419-1427.
53. Reiterer, M.W., K.G. Ewsuk, and J.G. Arguello, An Arrhenius-type viscosity function to model sintering using the Skorohod-Olevsky viscous sintering model within a finite-element code. Journal of the American Ceramic Society, 2006. 89(6): p. 1930-5.
54. Bordère, S., Original Monte Carlo Methodology Devoted to the Study of Sintering Processes. Journal of the American Ceramic Society, 2002. 85(7): p. 1845-1852.
170
55. Bordere, S. and D. Bernard, Full resolution of the Monte Carlo time scale demonstrated through the modelling of two-amorphous-particles sintering. Computational Materials Science, 2008. 43(4): p. 1074-80.
56. Bordère, S., et al., Monte Carlo Prediction of Non-Newtonian Viscous Sintering: Experimental Validation for the Two-Glass-Cylinder System. Journal of the American Ceramic Society, 2005. 88(8): p. 2071-2078.
57. Tikare, V., M. Braginsky, and E.A. Olevsky, Numerical simulation of solid-state sintering. I. Sintering of three particles. Journal of the American Ceramic Society, 2003. 86(1): p. 49-53.
58. Braginsky, M., V. Tikare, and E. Olevsky. Numerical simulation of solid state sintering. 2005: Elsevier Ltd.
59. Hunghai, S. and D.L. Johnson, Master sintering curve: a practical approach to sintering. Journal of the American Ceramic Society, 1996. 79(12): p. 3211-17.
60. Rahaman, M.N., L.C. De Jonghe, and M.-Y. Chu, Effect of green density on densification and creep during sintering. Journal of the American Ceramic Society, 1991. 74(3): p. 514-519.
61. Yeh, T.-s. and M.D. Sacks, Effect of particle size distribution on the sintering of alumina. Journal of the American Ceramic Society, 1988. 71(12): p. 484-487.
62. Blaine, D.C., et al., Application of work-of-sintering concepts in powder metals. Metallurgical and Materials Transactions A: Physical Metallurgy and Materials Science, 2006. 37(9): p. 2827-2835.
63. Kiani, S., J. Pan, and J.A. Yeomans, A New Scheme of Finding the Master Sintering Curve. Journal of the American Ceramic Society, 2006. 89(11): p. 3393-3396.
64. Kiani, S., et al., Finite element analysis of sintering deformation using densification data instead of a constitutive law. Journal of the European Ceramic Society, 2007. 27(6): p. 2377-2383.
65. Park, S.J., et al. Master sintering curve formulated from constitutive models. 2009. 350 Main Street, Malden, MA 02148, United States: Blackwell Publishing Inc.
66. Blaine, D.C., S.-J. Park, and R.M. German. Linearization of master sintering curve. 2009. 350 Main Street, Malden, MA 02148, United States: Blackwell Publishing Inc.
171
67. Blaine, D.C., Garg, P. & German, R. Master Sintering Curve for a Two-Phase Material. in 4th International Conference on Science Technology and Applications of Sintering. 2005.
68. Yunxin, W., et al., Sintering densification and microstructural evolution of injection molding grade 17-4 PH stainless steel powder. Metallurgical and Materials Transactions A (Physical Metallurgy and Materials Science), 2002. 33A(7): p. 2185-94.
69. Bordia, R.K. and G.W. Scherer, On constrained sintering. I. Constitutive model for a sintering body. Acta Metallurgica, 1988. 36(9): p. 2393-7.
70. Bordia, R.K. and G.W. Scherer, On constrained sintering. II. Comparison of constitutive models. Acta Metallurgica, 1988. 36(9): p. 2399-409.
71. Bordia, R.K. and G.W. Scherer, On constrained sintering. III. Rigid inclusions. Acta Metallurgica, 1988. 36(9): p. 2411-6.
72. JAHM Software, I., MPDB. 2011: North Reading, Ma. p. Materials properties database.
73. Green, D.J., O. Guillon, and J. Rodel, Constrained sintering: A delicate balance of scales. Journal of the European Ceramic Society, 2008. 28(7): p. 1451-1466.
74. Satyajit Banerjee, P.D., T. Martens, Editor. 2011: Cedar Grove.
75. German, R.M., Injection Molding of Metals and Ceramics. 1997, Princeton, NJ: Metal Powder Industries Federation. p. 200.
76. German, R.M., Sintering Theory and Practice. 1 ed. 1996, New York, NY: John Wiley & Sons, Inc. p. 190.
77. Jonsson, M.T.a.S. A Material Model for Simulating Volume Changes during Phase Transformations. in COMSOL Users Conference. 2007. Grenoble, France: COMSOL.
78. Porter, D.A. and K.E. Easterling, Phase transformations in metals and alloys. 1992: Nelson Thornes.
79. Liu, X.-q., et al., Deformation behavior and strength evolution of MIM compacts during thermal debinding. Transactions of Nonferrous Metals Society of China, 2008. 18(2): p. 278-284.
80. BASF, Data Sheet Catamold 17-4PH. 2006, BASF Aktiengesellschaft: Ludwigshafen, Germany.
172
81. Cannon, A.H. and W.P. King, Microstructured metal molds fabricated via investment casting. Journal of Micromechanics and Microengineering. 20(2): p. 025025 (7 pp.).
82. Rowland, H.D., et al., Simulations of nonuniform embossing: The effect of asymmetric neighbor cavities on polymer flow during nanoimprint lithography. Journal of Vacuum Science and Technology B: Microelectronics and Nanometer Structures, 2005. 23(6): p. 2958-2962.
83. ASME, Y14.5 - 2009, D.a. Tolerancing, Editor. 2009, ASME.
84. J.C. Gelin, T.B., M. Sahli, Experimental Charakterization and Manufacturing of Micro-Structured Die Mold Replications using Hot Embossing Process, in 2011 International Conference on Injection Molding of Metals, Ceramics and Carbides. 2011, Metal Powder Industries Federation (MPIF): Orlando, Fl, USA.
85. Liou, A.C. and R.H. Chen, Injection molding of polymer micro- and sub-micron structures with high-aspect ratios. International Journal of Advanced Manufacturing Technology, 2006. 28(11-12): p. 1097-1103.
86. Liu, Z.Y., et al., Sintering activation energy of powder injection molded 316L stainless steel. Scripta Materialia, 2001. 44(7): p. 1131-7.
87. Piotter, V., et al., Performance and simulation of thermoplastic micro injection molding. Microsystem Technologies, 2002. 8(6): p. 387-90.
88. Zhang, K.F. and Z. Lu. Surface features of polymer and ceramic microstructured parts manufactured by micro injection molding. 2008. Nice, France: Inst. of Elec. and Elec. Eng. Computer Society.
89. Bose, A., et al., Faster sintering and lower costs with ultra-fine MIM powders [metal injection moulding powder]. Metal Powder Report, 2008. 63(5): p. 25-30.
90. Ye, H., X.Y. Liu, and H. Hong, Sintering of 17-4PH stainless steel feedstock for metal injection molding. Materials Letters, 2008. 62(19): p. 3334-3336.
91. Sung, H.-J., et al., Powder injection molding of a 17-4 PH stainless steel and the effect of sintering temperature on its microstructure and mechanical properties. Journal of Materials Processing Technology, 2002. 130-131: p. 321-327.
92. Masuda, H., K. Higashitani, and H. Yoshida, Powder technology handbook. 3 ed. 2006: Taylor & Francis.
93. German, R.M., Sintering densification for powder mixtures of varying distribution widths. Acta Metallurgica et Materialia, 1992. 40(9): p. 2085-2089.
173
94. Patterson, B.R. and L.A. Benson. Effect of powder size distribution on sintering. 1984. New Orleans, LA, USA: Metal Powder Industries Federation.
95. German, R.M., Sintering Theory and Practice. 1 ed. 1996, New York, NY: John Wiley & Sons, Inc. p. 147.
96. Pan, J., et al., A model for the sintering of spherical particles of different sizes by solid state diffusion. Acta Materialia, 1998. 46(13): p. 4671-4690.
97. German, R.M., Injection Molding of Metals and Ceramics. 1997, Princeton, NJ: Metal Powder Industries Federation. p. 77.
98. German, R.M., Sintering Theory and Practice. 1 ed. 1996, New York, NY: John Wiley & Sons, Inc. p. 96.
99. German, R.M., Sintering Theory and Practice. 1 ed. 1996, New York, NY: John Wiley & Sons, Inc. p. 97.
100. Parsegian, V.A., Van der Waals forces. 1 ed. 2006, New York: Cambridge University Press.
101. Richerson, D.W., Modern ceramic engineering: properties, processing, and use in design. 2006: CRC Taylor & Francis.
102. German, R.M. and S.J. Park, Mathematical relations in particulate materials processing: ceramics, powder metals, cermets, carbides, hard materials, and minerals. 2008: Wiley.
103. Xiaoping, X., Y. Wuwen, and R.M. German, Densification and strength evolution in solid-state sintering. I. Experimental investigation. Journal of Materials Science, 2002. 37(3): p. 567-75.
104. German, R.M., Injection Molding of Metals and Ceramics. 1997, Princeton, NJ: Metal Powder Industries Federation. p. 225.
105. Rasband, W., ImageJ 1.42q. 2011, National Institutes of Health: Bethesda, Md.
106. Guillon, O. and J. Langer, Master sintering curve applied to the Field-Assisted Sintering Technique. Journal of Materials Science, 2010. 45(19): p. 5191-5195.
107. Blaine, D.C., et al., Master sintering curve concepts as applied to the sintering of molybdenum. Metallurgical and Materials Transactions A (Physical Metallurgy and Materials Science), 2006. 37A(3): p. 715-20.
174
108. Young-Sam, K., et al., Simulation of the sintering densification and shrinkage behavior of powder-injection-molded 17-4 PH stainless steel. Metallurgical and Materials Transactions A (Physical Metallurgy and Materials Science), 2004. 35A(1): p. 257-63.
109. Ryder, P., Classical Mechanics. 2007: Shaker.
110. Comrey, A.L. and H.B. Lee, Elementary Statistics: A Problem Solving Approach 4th Edition. 2009: Lulu.com. 111.
111. Deutschman, A.D., W.J. Michels, and C.E. Wilson, Machine design; theory and practice. 1975: Macmillan.
112. Grote, K.-H. and J. Feldhusen, Dubbel-Taschenbuch für den Maschinenbau. 22 ed. 2007, Berlin, Heidelberg, New York: Springer - Verlag 143.
113. Xiaoping, X., L. Peizen, and R.M. German, Densification and strength evolution in solid-state sintering. II. Strength model. Journal of Materials Science, 2002. 37(1): p. 117-26.
114. German, R.M., Manipulation of strength during sintering as a basis for obtaining rapid densification without distortion. Materials Transactions, 2001. 42(7): p. 1400-10.
115. Pilkey, W.D., Peterson's Stress Concentration Factors (2nd Edition). 1997, John Wiley & Sons. p. 99.
116. Shoales, G.A. and R.M. German, In situ strength evolution during the sintering of bronze powders. Metallurgical and Materials Transactions A (Physical Metallurgy and Materials Science), 1998. 29A(4): p. 1257-63.
117. Wakai, F., Modeling and Simulation of Elementary Processes in Ideal Sintering. Journal of the American Ceramic Society, 2006. 89(5): p. 1471-1484.