development of chemiluminescent elisas to ddt and its metabolites in food and environmental samples
TRANSCRIPT
www.elsevier.com/locate/jim
Journal of Immunological Methods 283 (2003) 45–57
Development of chemiluminescent ELISAs to DDT and its
metabolites in food and environmental samples
Alexandra E. Botchkarevaa, Sergei A. Eremina, Angel Montoyab, Juan J. Manclusb,Barbora Mickovac, Pavel Rauchc, Fabiana Finid, Stefano Girottid,*
aDepartment of Chemical Enzymology, Faculty of Chemistry, M.V. Lomonosov Moscow State University, Moscow 119899, RussiabLaboratorio Integrado de Bioingenierıa, Universidad Politecnica de Valencia, Camino de Vera, s/n. 46022 Valencia, Spain
cDepartment of Biochemistry and Microbiology, Faculty of Food and Biochemical Technology, Institute of Chemical Technology, Technicka 5,
16628 Prague 6, Czech Republicd Istituto di Scienze Chimiche, Universita di Bologna, via San Donato 15, 40127 Bologna, Italy
Received 24 January 2003; received in revised form 29 May 2003; accepted 5 August 2003
Abstract
Two enzyme-linked immunosorbent assays (ELISA) with chemiluminescent (CL) detection for the insecticide DDT and the
group of DDT-related compounds have been optimized and characterized. Both conjugate-coated ELISAs are based on
monoclonal antibodies (MAbs) of different specificity and homologous protein conjugates. Effects of several physicochemical
factors (ionic strength, pH, Tween-20 and Bovine serum albumin (BSA) concentrations) and solvents (methanol, ethanol,
acetone and N,NV-dimethylformamide) on the performance of the assays were studied and optimized. For the DDT-selective
assay, the sensitivity, estimated as the I50 value, was 0.6 Ag/l, with a linear working range between 0.1 and 2 Ag/l and a limit of
detection of 0.06 Ag/l. For the DDT group-selective assay, the sensitivity was 0.2 Ag/l, with a linear working range between 0.07and 1 Ag/l and a limit of detection of 0.04 Ag/l. CL-ELISAs were four times more sensitive compared to colorimetric ELISAs.
Finally, both immunoassays were applied to the detection of DDT and group of DDT-related compounds in spiked real water,
soil and food samples.
D 2003 Elsevier B.V. All rights reserved.
Keywords: DDT; Monoclonal ELISA; Enhanced chemiluminescence reaction; Environmental samples; Food
0022-1759/$ - see front matter D 2003 Elsevier B.V. All rights reserved.
doi:10.1016/j.jim.2003.08.016
Abbreviations: ARPA, Regional Agency for Environmental Protection; BSA, bovine serum albumin; CL, chemiluminescent; CR, cross-
reactivity; CV, coefficient of variation; ECD, electron-capture detectors; ECL, enhanced chemiluminescence; ELISA, enzyme-linked
immunosorbent assay; EU, European Union; GPC, gel permeation chromatography; HRP, horseradish peroxidase; I50, concentration giving
50% inhibition of maximum response; LOD, limit of detection; MAbs, monoclonal antibodies; OVA, ovalbumin; PBS, 10 mM phosphate
buffer; 150 mM NaCl, pH 7.4; PBST, 10 mM phosphate buffer; 150 mM NaCl, 0.05% Tween-20, pH 7.4; RLU, relative light units.
* Corresponding author. Tel.: +39-051-242052; fax: +39-051-249770.
E-mail address: [email protected] (S. Girotti).
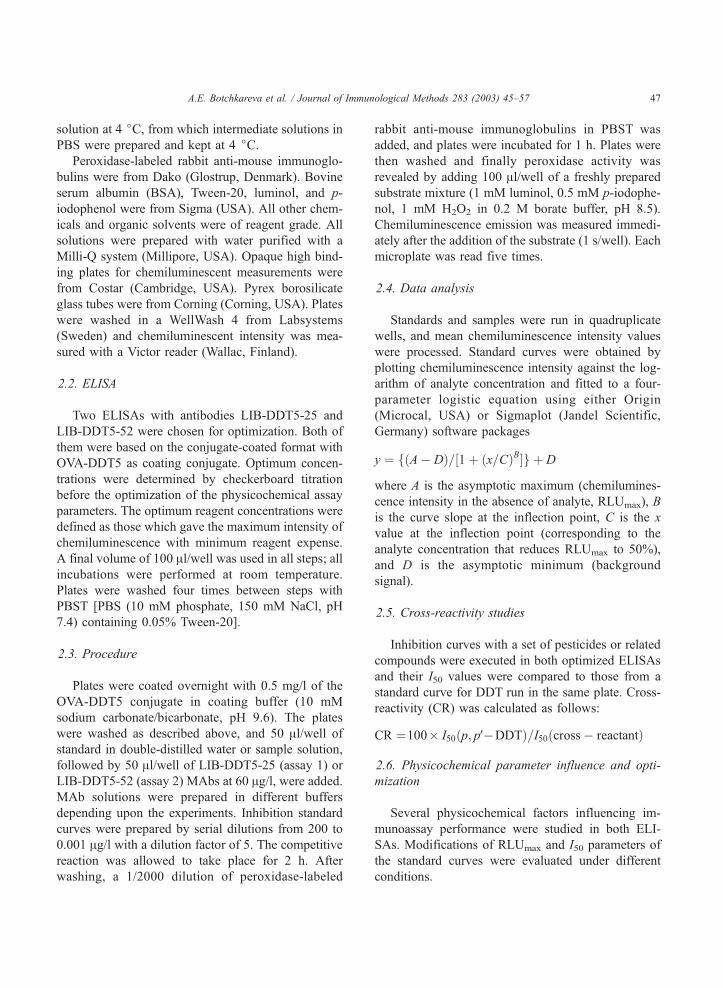
Fig. 1. Structure of p,pV-DDT and hapten DDT5.
A.E. Botchkareva et al. / Journal of Immunological Methods 283 (2003) 45–5746
1. Introduction
Immunochemical techniques have gained an in-
creasing importance for screening and quantification
of pesticides due to their sensitivity, speed, simplicity
and low cost (Hennion and Barcelo, 1998; Knopp,
1995; Dankwardt, 2001). Since the European Union
(EU) has limited the maximal level for a single
pesticide to 0.1 Ag/l and for the total of all pesticides
to 0.5 Ag/l in drinking water (EC Drinking water
quality directive, 1980, 1998), a need exists for
methods with very high sensitivity.
The sensitivity of an immunoassay strongly
depends on the affinity of specific antibodies and on
the sensitivity of the detection method. The enhanced
chemiluminescence (ECL) reaction offers the possi-
bility of improving the sensitivity of immunoassays to
at least 2–3 orders of magnitude compared to con-
ventional colorimetric detection (Dzgoev et al., 1999;
Rubtsova and Wittman, 1997). The light intensity of
ECL reaches a maximum 1–2 min after the start of
the reaction, thus providing a rapid detection of the
analytical signal (Arefyev et al., 1990). These advan-
tages of chemiluminescent (CL) techniques make
them useful detection systems for ecotoxicological
analysis (Danielsson et al., 2001; Navaz and Jimenez,
1996).
Among the several kinds of pesticides employed in
agriculture and vector control applications, DDT dis-
plays a recognized toxicity (ATSDR, 2000) and a long
persistence in the environment. Although its use was
banned in developed nations after 1970, there is still
an important presence in the food chain. In addition,
DDE and DDD, the two major metabolites of DDT,
and other DDT-related compounds are usually present
together with the parent compound in DDT-contami-
nated environmental matrices. Several groups have
developed immunoassays for DDT and related com-
pounds (Banerjee, 1987; Banerjee et al., 1996; Beas-
ley et al., 1998; Burgisser et al., 1990). Commercial
enzyme-linked immunosorbent assay (ELISA) kits for
detecting residues of DDT, available from Strategic
Diagnostics (Newark, DE, USA) and EnviroLogix
(Westbrook, MA, USA), are based on the use of
polyclonal antibodies.
Recently, we reported on the development of flow
immunoassays for DDT and related compounds with
ECL as a detection system (Botchkareva et al., 2002).
These chemiluminescent assays were based on mono-
clonal antibodies (MAbs) against DDT with different
patterns of cross-reactivity to DDT-related compounds
(DDT-selective and class-selective) (Abad et al.,
1997). Although the resulting flow assays had LODs
of 1.1 and 0.4 Ag/l with DDT-selective and class-
selective MAbs, respectively, their application for the
quantification of DDT in real samples was limited by
a short life-time of flow immunosupport. In the
present study, we adapted the ECL detection to the
development and optimization of sensitive ELISAs
based on the same monoclonal antibodies (MAbs).
We also describe the application of the developed CL-
ELISAs to the analysis of residues in water, soil and
food samples.
2. Materials and methods
2.1. Reagents and instruments
Pesticide standards (Pestanal grade) were pur-
chased from Riedel-de-Haen (Seelze, Germany).
Stock solutions were prepared in methanol (1 g/l)
and stored in the dark at 4 jC. Working standard
solutions (0.001–200 Ag/l) were prepared daily in
double-distilled water from medium stock solution in
methanol (1 mg/l) in borosilicate glass tubes and used
within 1 h to avoid pesticide loss through adhesion to
glass surfaces.
The preparation of the hapten–protein conjugate
(OVA-DDT5, hapten-to-protein molar ratio 11:1) and
the production of LIB-DDT5-25 and LIB-DDT5-52
monoclonal antibodies against DDT were previously
described (Abad et al., 1997). The chemical structure
of hapten DDT5 is shown in Fig. 1. Coating conjugate
solutions were kept frozen in PBS at � 20 jC, andconcentrated MAb solutions (1 g/l) were kept precip-
itated with 1 volume of saturated ammonium sulphate
A.E. Botchkareva et al. / Journal of Immunological Methods 283 (2003) 45–57 47
solution at 4 jC, from which intermediate solutions in
PBS were prepared and kept at 4 jC.Peroxidase-labeled rabbit anti-mouse immunoglo-
bulins were from Dako (Glostrup, Denmark). Bovine
serum albumin (BSA), Tween-20, luminol, and p-
iodophenol were from Sigma (USA). All other chem-
icals and organic solvents were of reagent grade. All
solutions were prepared with water purified with a
Milli-Q system (Millipore, USA). Opaque high bind-
ing plates for chemiluminescent measurements were
from Costar (Cambridge, USA). Pyrex borosilicate
glass tubes were from Corning (Corning, USA). Plates
were washed in a WellWash 4 from Labsystems
(Sweden) and chemiluminescent intensity was mea-
sured with a Victor reader (Wallac, Finland).
2.2. ELISA
Two ELISAs with antibodies LIB-DDT5-25 and
LIB-DDT5-52 were chosen for optimization. Both of
them were based on the conjugate-coated format with
OVA-DDT5 as coating conjugate. Optimum concen-
trations were determined by checkerboard titration
before the optimization of the physicochemical assay
parameters. The optimum reagent concentrations were
defined as those which gave the maximum intensity of
chemiluminescence with minimum reagent expense.
A final volume of 100 Al/well was used in all steps; allincubations were performed at room temperature.
Plates were washed four times between steps with
PBST [PBS (10 mM phosphate, 150 mM NaCl, pH
7.4) containing 0.05% Tween-20].
2.3. Procedure
Plates were coated overnight with 0.5 mg/l of the
OVA-DDT5 conjugate in coating buffer (10 mM
sodium carbonate/bicarbonate, pH 9.6). The plates
were washed as described above, and 50 Al/well ofstandard in double-distilled water or sample solution,
followed by 50 Al/well of LIB-DDT5-25 (assay 1) or
LIB-DDT5-52 (assay 2) MAbs at 60 Ag/l, were added.MAb solutions were prepared in different buffers
depending upon the experiments. Inhibition standard
curves were prepared by serial dilutions from 200 to
0.001 Ag/l with a dilution factor of 5. The competitive
reaction was allowed to take place for 2 h. After
washing, a 1/2000 dilution of peroxidase-labeled
rabbit anti-mouse immunoglobulins in PBST was
added, and plates were incubated for 1 h. Plates were
then washed and finally peroxidase activity was
revealed by adding 100 Al/well of a freshly prepared
substrate mixture (1 mM luminol, 0.5 mM p-iodophe-
nol, 1 mM H2O2 in 0.2 M borate buffer, pH 8.5).
Chemiluminescence emission was measured immedi-
ately after the addition of the substrate (1 s/well). Each
microplate was read five times.
2.4. Data analysis
Standards and samples were run in quadruplicate
wells, and mean chemiluminescence intensity values
were processed. Standard curves were obtained by
plotting chemiluminescence intensity against the log-
arithm of analyte concentration and fitted to a four-
parameter logistic equation using either Origin
(Microcal, USA) or Sigmaplot (Jandel Scientific,
Germany) software packages
y ¼ fðA� DÞ=½1þ ðx=CÞB�g þ D
where A is the asymptotic maximum (chemilumines-
cence intensity in the absence of analyte, RLUmax), B
is the curve slope at the inflection point, C is the x
value at the inflection point (corresponding to the
analyte concentration that reduces RLUmax to 50%),
and D is the asymptotic minimum (background
signal).
2.5. Cross-reactivity studies
Inhibition curves with a set of pesticides or related
compounds were executed in both optimized ELISAs
and their I50 values were compared to those from a
standard curve for DDT run in the same plate. Cross-
reactivity (CR) was calculated as follows:
CR ¼100 I50ðp; pV�DDTÞ=I50ðcross� reactantÞ
2.6. Physicochemical parameter influence and opti-
mization
Several physicochemical factors influencing im-
munoassay performance were studied in both ELI-
SAs. Modifications of RLUmax and I50 parameters of
the standard curves were evaluated under different
conditions.
mmunological Methods 283 (2003) 45–57
2.6.1. Tween-20 and BSA concentrations
Competitive assays were performed using different
concentrations of Tween-20 and BSA separately.
Briefly, standard analyte curves were prepared in
double-distilled water while MAbs were added to
serial dilutions of BSA (from 0.8% to 0%, w/v) or
Tween-20 (from 0.1% to 0%, v/v) in PBS. Thereafter,
assays were executed as described above.
2.6.2. Buffer ionic strength and pH
Competitive curves were performed with buffers of
different ionic strength but at constant pH (7.4).
Standard analyte curves were prepared in double-
distilled water, and a constant concentration of MAbs
was added to serial dilutions (from 10 PBS to 0) of
a concentrated buffer in double-distilled water. There-
after, assays were executed as described above. To
evaluate the influence of pH, competitive analyte
curves were prepared in double-distilled water and a
constant concentration of MAbs in 1 PBS at
different pH values covering the range 4.7–10.5
was added.
2.6.3. Studies of solvent effects
The assays tolerance to methanol, ethanol, acetone,
and DMF was evaluated between 0% and 60% solvent
concentration (v/v). Standards curves of DDT were
prepared in double-distilled water, and MAbs were
dissolved in PBS containing different amounts of
solvent.
2.6.4. Spiked water sample analysis
Water samples were fortified with DDT to evaluate
potential matrix effects on ELISA. Mean chemilumi-
nescence intensity values obtained from quadruplicate
wells were interpolated in a standard curve run in the
same plate. The water samples tested were the Bolo-
gna tap water, a commercial bottled water, and waste-
water collected in Emilia–Romagna region, Italy.
Turbid water samples were filtered prior to use.
Samples were spiked to 0, 0.1, 0.5 and 1.0 Ag/l from1 mg/ml DDT stock solution.
2.6.5. Spiked soil and food analysis
Samples kindly provided by ARPA (Regional
Agency for Environment and Prevention, Bologna,
Italy) were used: food extracts in methanol and lyoph-
ilized samples of fish (commercially available baby’s
A.E. Botchkareva et al. / Journal of I48
food) and soil. Samples were fortified in ARPA with
different amounts of p,pV-DDT, o,pV-DDT, p,pV-DDE,p,pV-DDD and other organochlorine pesticides (a- and
h-endosulfan, endosulfan ether, endosulfan sulphate,
heptachlor, aldrin, dieldrin, endrin, lindane, hexachlor-
ane, a- and h-hexachlorocyclohexane). Five hundred
grams of vegetables samples (strawberry, salad, beet
root) were homogenized with a mixer (5 min) and
added with 5 ml of acetone containing the listed
pesticides to obtain concentrations ranging from 0.03
to 2.53 mg/kg. Samples were left with agitation for 30
min and finally lyophilized and stored at 4 jC. Tengrams of soil and fish lyophilized samples were added
with 50 ml of acetone and subjected to agitation for 30
min while adding acetone containing the listed pesti-
cides (0.03–2.53 mg/kg). Samples were then lyophi-
lized and kept at 4 jC.Lyophilized samples were extracted with methanol
according to the following procedure. Fortified sam-
ples (0.1 g) were suspended in 1 ml of methanol and
shaken for 30 min. The extracts were left to settle for
16 h. The organic layer was isolated by centrifugation
for 5 min at 2056 g. Finally, extracts were dissolved
with double-distilled water (1:100, v/v) prior to use in
the immunoassays.
2.6.6. Fish meat analysis
Barbel fish (Barbus barbus) from the Elbe river
(Czech Republic) was analyzed by both immunoassay
and chromatographic methods. Thirty five grams of
homogenized tissue (anhydrous sodium sulphate
added for desiccation) were extracted for 8 h in a
Soxhlet apparatus using 340 ml of a hexane–dichloro-
methane mixture (1:1, v/v). After solvent evaporation,
approx. 300 mg of isolated lipids were dissolved in 4
ml of chloroform. A 2-ml aliquot was then purified by
gel permeation chromatography (GPC) employing a
Bio Bead SX-3 column (500 8 mm) and chloroform
as a mobile phase (flow rate 1 ml/min). Fractions
corresponding to the elution volume 13–33 ml were
collected. Chloroform was evaporated under vacuum
and the residue was dissolved in methanol prior to
dilution (1:4 with dilution buffer). Purified extracts
were then analyzed.
2.6.6.1. Analysis of fish meat samples by gas
chromatography (GC-ECD). Using the procedure
of Hajslova et al. (1993), a HP 5890 series II gas
A.E. Botchkareva et al. / Journal of Immunological Methods 283 (2003) 45–57 49
chromatograph (Agilent, Waldbronn, Germany)
equipped with two parallel capillary columns (DB-5
and DB-17, 5% and 50% fenyl-methylpolysilicon,
respectively, both 60-m column length, 0.25 mm
I.D., J&W Scientific, USA) and 63 Ni-electron-cap-
ture detectors (ECD) (Hewlett-Packard, USA) was
used for the analysis of chloroform extracts obtained
as above. Samples (1 Al) were injected splitless
(splitless time 2.5 min). Helium was used as carrier
gas (30 cm/s). The following temperature program
was applied: 60 jC (hold time 2 min), then at 30 jC/min to 220 jC, at 0.5 jC/min to 240 jC, and at 2.5
jC/min to the final temperature 280 jC (hold time 10
min). The detector was operated at 300 jC with
nitrogen (50 ml/min) as make-up gas.
For results comparison, the values obtained by GC-
ECD were recalculated on the basis of CR values of
DDT isomers and metabolites as follows:
GC� ECD recalculated ðmg=kgÞ¼ Mðp; p� DDTÞ CRðp; p� DDTÞþMðo; p� DDTÞ CRðo; p� DDTÞþMðp; p� DDEÞ CRðp; p� DDEÞþMðo; p� DDEÞ CRðo; p� DDEÞþMðp; p� DDDÞ CRðp; p� DDDÞþMðo; p� DDDÞ CRðo; p� DDDÞ
where M (analyte) is the value obtained by GC-ECD
(mg/kg) and CR (analyte) is relevant cross-reactivity
(in %/100).
3. Results and discussion
In a previous paper (Abad et al., 1997), the
synthesis of haptens and the production of high-
affinity monoclonal antibodies for DDT and related
compounds were described. In order to improve the
sensitivity of the colorimetric ELISAs based on these
reagents, the enhanced luminescence reaction (ECL)
was adapted as an end-point detection system.
The introduction of chemiluminescent detection in
ELISA leads to the utilization of nontransparent plates.
Since the adsorption capacities of different plates may
be different, the reagent concentrations should be read-
justed to achieve the best immunoassay performance.
Using a checkerboard titration, the optimum concen-
trations of the immobilized conjugate and monoclonal
antibodies that gave the highest sensitivity (lower I50value) toward p,pV-DDTwere found. The ability of the
chemiluminescent technique to detect lower concentra-
tions of HRP allowed the optimal antibody (30 Ag/l forboth LIB-DDT5-25 and LIB-DDT5-52) and conjugate
(0.5 mg/l) concentrations to be decreased, compared to
colorimetric ELISA for DDT (1 mg/l of OVA-DDT5;
100 and 200 Ag/l for LIB-DDT5-25 and LIB-DDT5-
52, respectively) (Abad et al., 1997). These concen-
trations were used in subsequent experiments.
3.1. Physicochemical parameter optimization
The application of ELISA to environmental sam-
ples requires consideration to be given to several
experimental factors such as salt concentration, pH,
and the presence of surfactants and solvents affecting
the performance of the immunoassay (Manclus and
Montoya, 1996). The RLUmax/I50 ratio has been
shown to be a useful parameter with which to estimate
the effect of a certain factor on the ELISA perfor-
mance, the highest ratio indicating the highest sensi-
tivity (Mercader and Montoya, 1999).
3.1.1. Effect of Tween-20 and BSA concentrations
Because inert proteins (such as BSA) and surfac-
tants (such as Tween-20) are commonly used in ELISA
to reduce nonspecific interactions, their influence on
assay performance (I50, RLUmax, and RLUmax/I50) was
examined in both CL-ELISAs. Tween-20 concentra-
tions higher than 0.05% reduced RLUmax, whereas I50increased with lower Tween-20 concentrations
(0.005%). RLUmax was considerably reduced with
low concentrations of BSA. Under these conditions,
I50 values did not change significantly. Fig. 2A shows
the variation of the RLUmax/I50 ratio as a function of the
concentration of additive. It was observed that Tween-
20 and BSA had similar effects on both ELISAs: the
RLUmax/I50 ratio values were higher at the lower
concentrations of additive. Therefore, the use of
Tween-20 as well as BSA should be limited to a
minimum in these ELISAs.
3.1.2. Effect of buffer ionic strength and pH
Both ion concentration and pH may affect ELISA
performance. Because antigen-antibody binding is
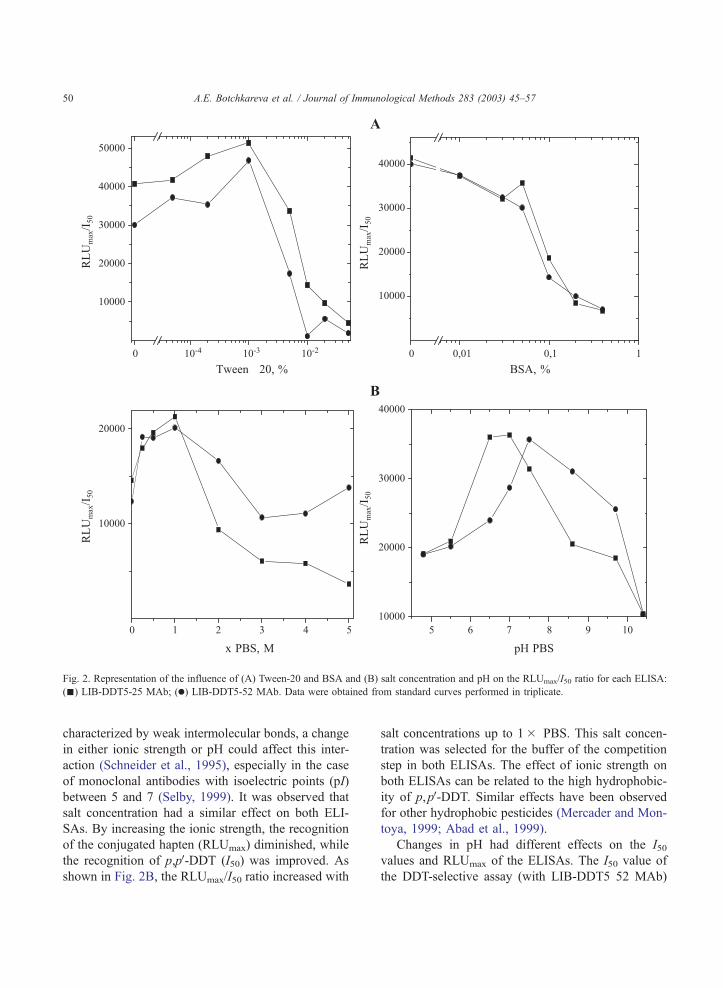
Fig. 2. Representation of the influence of (A) Tween-20 and BSA and (B) salt concentration and pH on the RLUmax/I50 ratio for each ELISA:
(n) LIB-DDT5-25 MAb; (.) LIB-DDT5-52 MAb. Data were obtained from standard curves performed in triplicate.
A.E. Botchkareva et al. / Journal of Immunological Methods 283 (2003) 45–5750
characterized by weak intermolecular bonds, a change
in either ionic strength or pH could affect this inter-
action (Schneider et al., 1995), especially in the case
of monoclonal antibodies with isoelectric points (pI)
between 5 and 7 (Selby, 1999). It was observed that
salt concentration had a similar effect on both ELI-
SAs. By increasing the ionic strength, the recognition
of the conjugated hapten (RLUmax) diminished, while
the recognition of p,pV-DDT (I50) was improved. As
shown in Fig. 2B, the RLUmax/I50 ratio increased with
salt concentrations up to 1 PBS. This salt concen-
tration was selected for the buffer of the competition
step in both ELISAs. The effect of ionic strength on
both ELISAs can be related to the high hydrophobic-
ity of p,pV-DDT. Similar effects have been observed
for other hydrophobic pesticides (Mercader and Mon-
toya, 1999; Abad et al., 1999).
Changes in pH had different effects on the I50values and RLUmax of the ELISAs. The I50 value of
the DDT-selective assay (with LIB-DDT5 52 MAb)
A.E. Botchkareva et al. / Journal of Immunological Methods 283 (2003) 45–57 51
did not change markedly up to pH 9.0, whereas an
increase of I50 was found in the class-selective ELISA
(LIB-DDT5-25 MAb). RLUmax values also showed a
maximum over different pH ranges: 7.5–9.5 and 6.5–
7.5 for LIB-DDT5-52 and LIB-DDT5-25, respective-
ly. Fig. 2B shows the dependence of the RLUmax/I50ratio on pH. This ratio reached a maximum at pH
6.5–7.5 for LIB-DDT5-25 and 7.5 for LIB-DDT5-52.
Finally, for both ELISAs, a pH of 7.5 was chosen as
optimum. Differences in the pI values of the MAbs
could explain the observed behavior.
3.2. Organic solvent tolerance
The preparation of environmental samples for
pesticide analysis often includes an extraction step
with organic solvents. Four organic solvents were
included in competitive assays of both optimized
ELISAs to evaluate their tolerance from 5% to 60%
solvent contents. RLUmax and I50 changes were in-
vestigated, and the results are shown in Fig. 3A and
B. DMF up to 10% was the best tolerated solvent in
both cases, although it caused some decrease of the
RLUmax. In contrast, RLUmax was not markedly
affected by methanol over the range 5–20%, but the
loss of sensitivity was significant, especially in the
case of LIB-DDT5-25 MAb (Fig. 3A). Ethanol and
acetone were the worst tolerated solvents in both
cases. In general, the DDT-selective assay (LIB-
DDT5-52 MAb; Fig. 3B) was more tolerant to the
presence of solvents than the class-selective assay
(LIB-DDT5-25 MAb).
3.3. Cross-reactivity studies
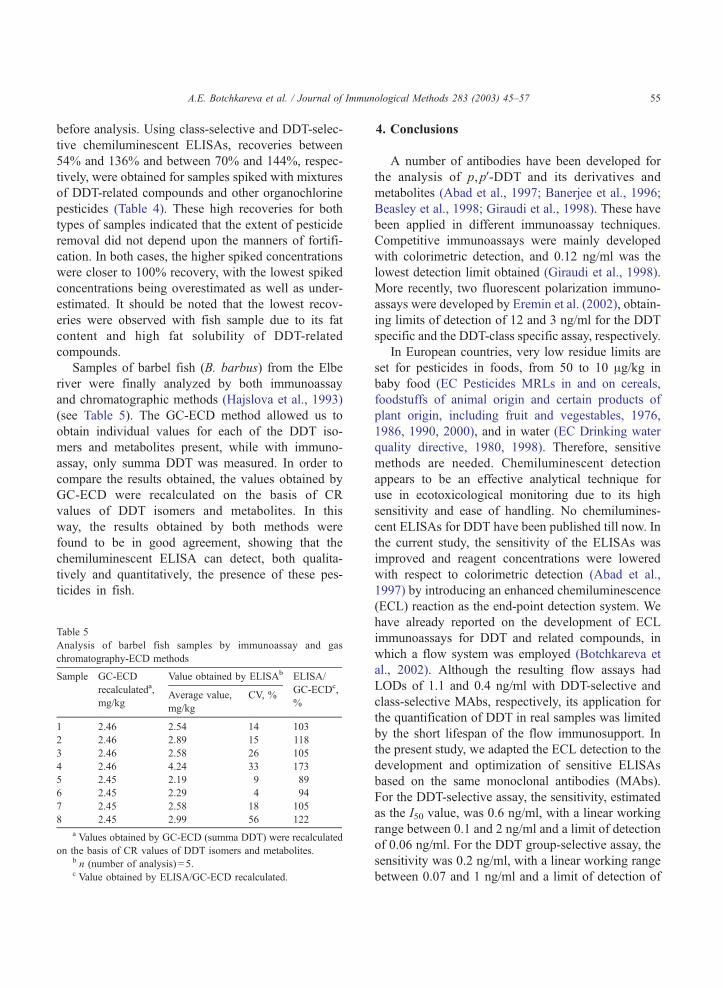
The specificity of the ELISAs was evaluated using
a wide range of compounds structurally related to
DDT and other organochlorine agrochemicals (Table
1). As previously shown using a colorimetric ELISA
(Abad et al., 1997), antibody LIB-DDT5-25 exhibited
high cross-reactivity values for almost all DDT-related
compounds, showing preferential recognition of p,pV-isomers. Therefore, it can be considered to be a class-
selective antibody. On the other hand, LIB-DDT5-52
cross-reacted only with p,pV- and o,pV-DDT and me-
thoxychlor, all containing the –CCl3 moiety and is
therefore a DDT-selective antibody. Dicofol and
DDA, sharing polar groups, were not detected by
any of the antibodies, thus suggesting that the chem-
ical nature of substituents at the central carbon plays
an important role in influencing antibody specificity.
The p-chloro groups appeared to be non-important in
analyte recognition in both ELISAs, because me-
thoxychlor, which is an analogue of p,pV-DDT with
o-methyl groups in place of the chlorine substituents
on the aromatic rings, was detected in each assay with
even greater sensitivity than p,pV-DDT itself. Per-
thane, which is identical to p,pV-DDD except for
two p-ethyl groups, was detected by the class-selec-
tive assay (LIB-DDT5-25) but not by the DDT-selec-
tive assay (LIB-DDT5-52), indicating that the
retention of trichlorethane structure of p,pV-DDT is
critical for the binding with LIB-DDT5-52 MAb.
None of the assays detected 2,4-D, hexachlorocyclo-
hexane, cyclodiene insecticides and chlorosubstituted
phenylureas (CR< 0.1%).
Results were also compared to those reported with
polyclonal antibodies (Beasley et al., 1998). Rabbit
polyclonal antibodies described in this work were
obtained against hapten 3-[4-{1-(4-chlorphenyl)-
2,2,2-trichlorethyl} benzoylamino] propanoic acid
(hapten VI), which is similar but not identical to
DDT5. Similar to our results and to those reported
by Abad et al. (1997), these antibodies did not
recognize haptens that were substituted through the
central carbon atom and did not cross-react with
dicofol and p,pV-DDA. However, in contrast to our
findings, methoxychlor was not detected by these
antibodies, and the authors concluded that the p-
chloro group appeared to be very important in analyte
recognition. The fact that the selectivity data did not
agree at all was accounted for by the use of different
antibody production methods.
3.4. Analytical parameters of the optimized DDT
immunoassays
Final assay conditions are summarized in Table 2.
Sensitivities, estimated as I50 values for p,pV-DDT,were 0.2 and 0.6 Ag/l with curve slopes 1.0 and 1.1 forclass-selective and DDT-selective ELISAs, respective-
ly. Typical competitive curves for p,pV-DDT in both
ELISAs are shown in Fig. 4. The linear working
ranges determined as the concentration causing 20–
80% inhibition of the maximal chemiluminescence
intensity were 0.07–1.1 and 0.1–2.2 Ag/l for class-
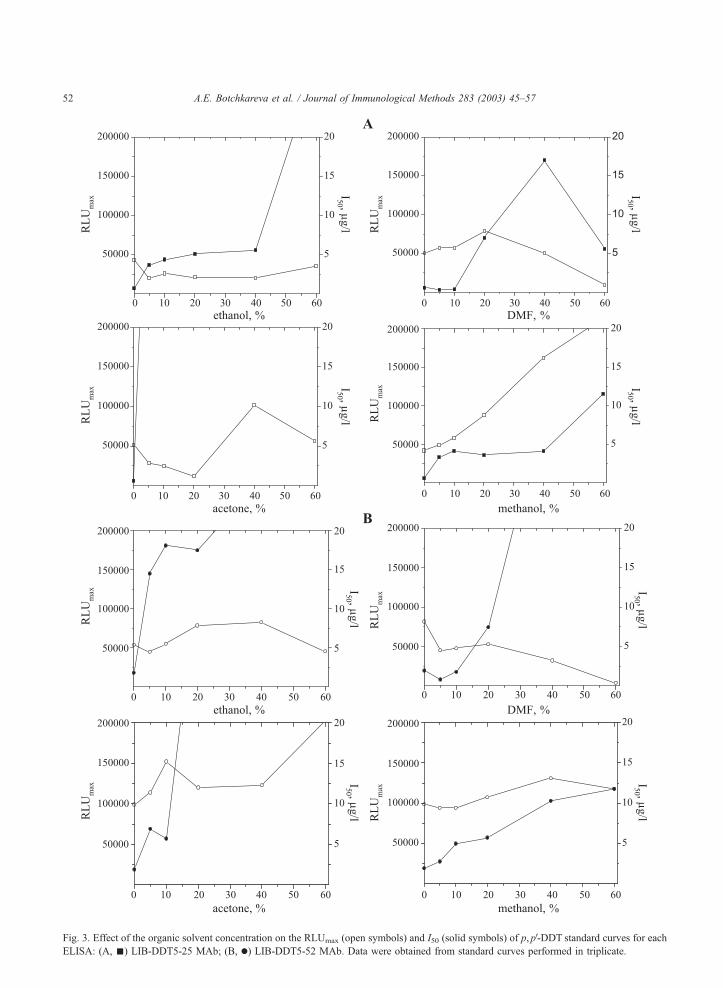
Fig. 3. Effect of the organic solvent concentration on the RLUmax (open symbols) and I50 (solid symbols) of p,pV-DDT standard curves for each
ELISA: (A, n) LIB-DDT5-25 MAb; (B, .) LIB-DDT5-52 MAb. Data were obtained from standard curves performed in triplicate.
A.E. Botchkareva et al. / Journal of Immunological Methods 283 (2003) 45–5752
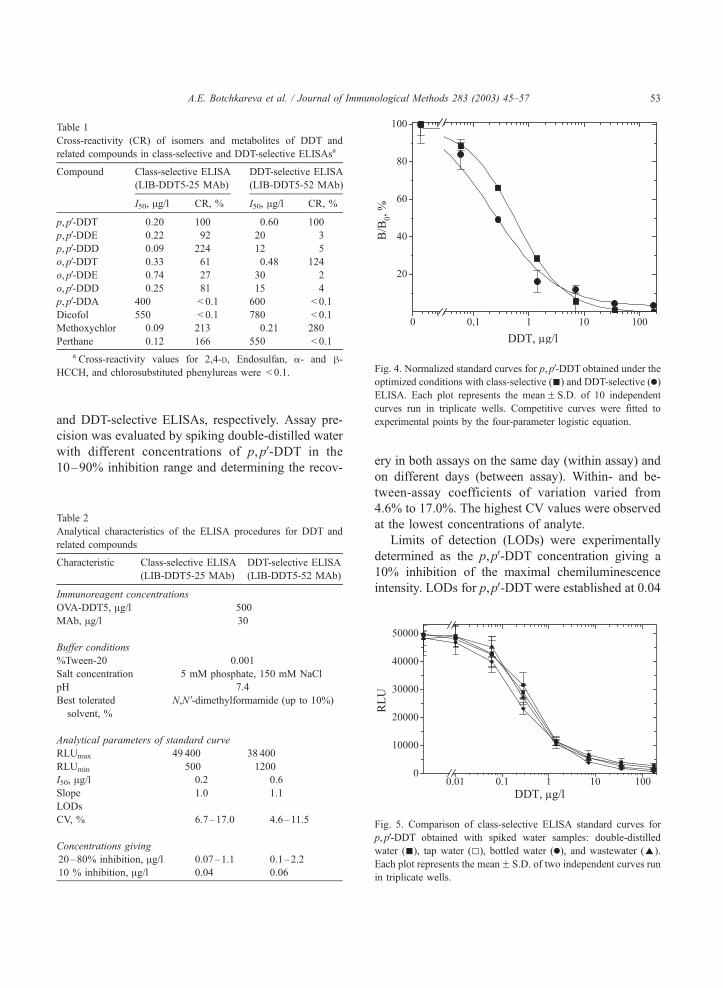
Table 1
Cross-reactivity (CR) of isomers and metabolites of DDT and
related compounds in class-selective and DDT-selective ELISAsa
Compound Class-selective ELISA
(LIB-DDT5-25 MAb)
DDT-selective ELISA
(LIB-DDT5-52 MAb)
I50, Ag/l CR, % I50, Ag/l CR, %
p,pV-DDT 0.20 100 0.60 100
p,pV-DDE 0.22 92 20 3
p,pV-DDD 0.09 224 12 5
o,pV-DDT 0.33 61 0.48 124
o,pV-DDE 0.74 27 30 2
o,pV-DDD 0.25 81 15 4
p,pV-DDA 400 < 0.1 600 < 0.1
Dicofol 550 < 0.1 780 < 0.1
Methoxychlor 0.09 213 0.21 280
Perthane 0.12 166 550 < 0.1
a Cross-reactivity values for 2,4-D, Endosulfan, a- and h-HCCH, and chlorosubstituted phenylureas were < 0.1. Fig. 4. Normalized standard curves for p,pV-DDT obtained under the
optimized conditions with class-selective (n) and DDT-selective (.)ELISA. Each plot represents the meanF S.D. of 10 independent
curves run in triplicate wells. Competitive curves were fitted to
experimental points by the four-parameter logistic equation.
A.E. Botchkareva et al. / Journal of Immunological Methods 283 (2003) 45–57 53
and DDT-selective ELISAs, respectively. Assay pre-
cision was evaluated by spiking double-distilled water
with different concentrations of p,pV-DDT in the
10–90% inhibition range and determining the recov-
Table 2
Analytical characteristics of the ELISA procedures for DDT and
related compounds
Characteristic Class-selective ELISA
(LIB-DDT5-25 MAb)
DDT-selective ELISA
(LIB-DDT5-52 MAb)
Immunoreagent concentrations
OVA-DDT5, Ag/l 500
MAb, Ag/l 30
Buffer conditions
%Tween-20 0.001
Salt concentration 5 mM phosphate, 150 mM NaCl
pH 7.4
Best tolerated
solvent, %
N,NV-dimethylformamide (up to 10%)
Analytical parameters of standard curve
RLUmax 49 400 38 400
RLUmin 500 1200
I50, Ag/l 0.2 0.6
Slope 1.0 1.1
LODs
CV, % 6.7–17.0 4.6–11.5
Concentrations giving
20–80% inhibition, Ag/l 0.07–1.1 0.1–2.2
10 % inhibition, Ag/l 0.04 0.06
ery in both assays on the same day (within assay) and
on different days (between assay). Within- and be-
tween-assay coefficients of variation varied from
4.6% to 17.0%. The highest CV values were observed
at the lowest concentrations of analyte.
Limits of detection (LODs) were experimentally
determined as the p,pV-DDT concentration giving a
10% inhibition of the maximal chemiluminescence
intensity. LODs for p,pV-DDTwere established at 0.04
Fig. 5. Comparison of class-selective ELISA standard curves for
p,pV-DDT obtained with spiked water samples: double-distilled
water (n), tap water (5), bottled water (.), and wastewater (E).
Each plot represents the meanF S.D. of two independent curves run
in triplicate wells.
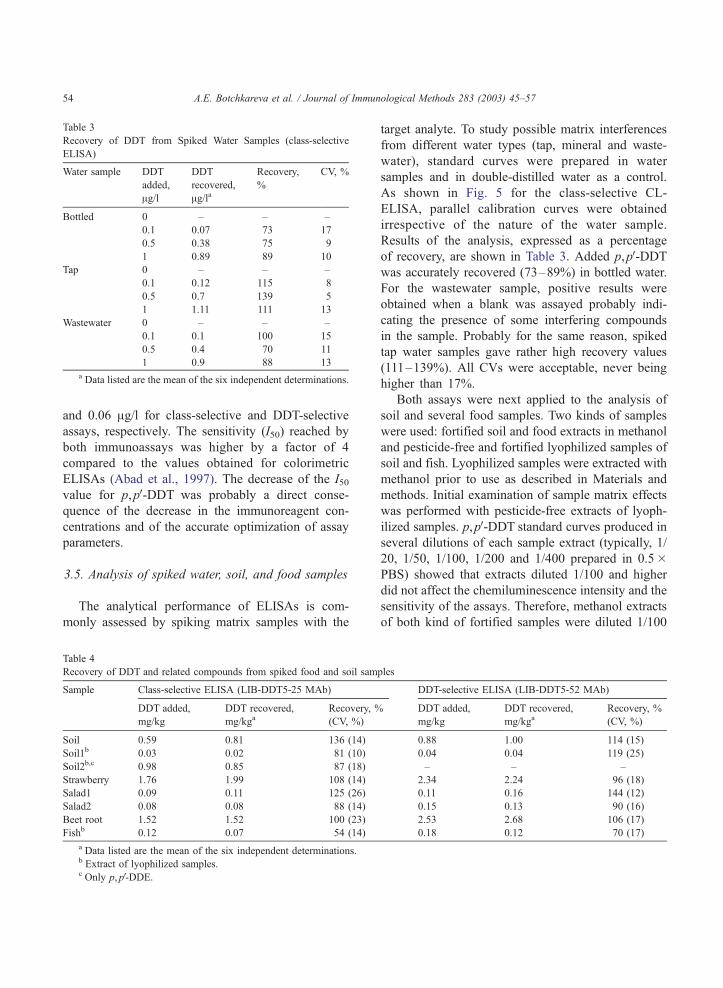
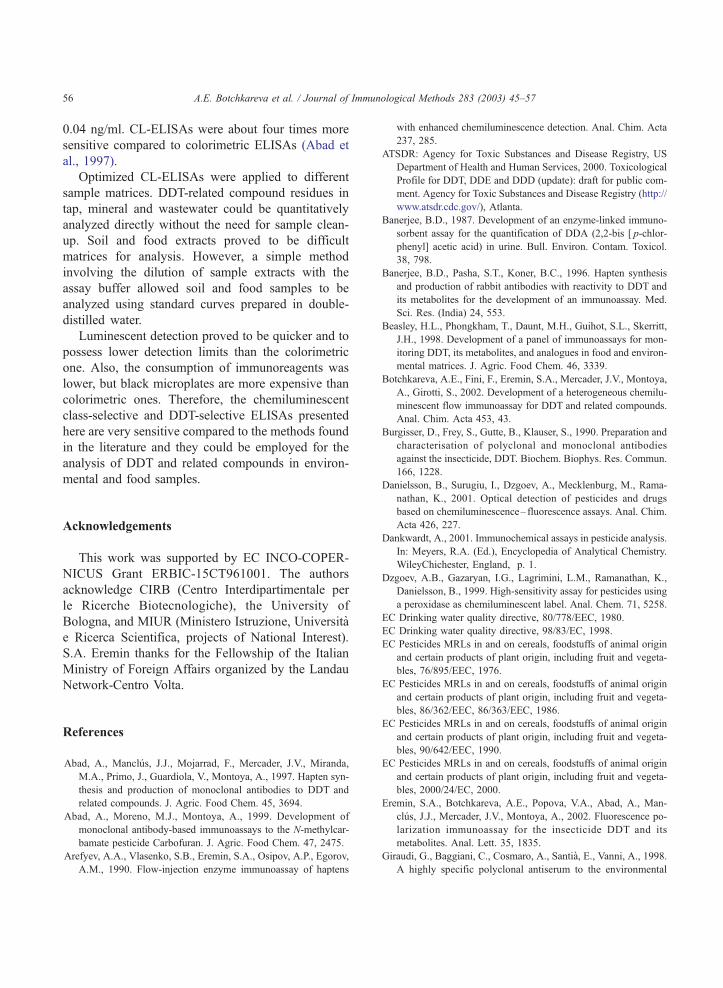
Table 3
Recovery of DDT from Spiked Water Samples (class-selective
ELISA)
Water sample DDT
added,
Ag/l
DDT
recovered,
Ag/la
Recovery,
%
CV, %
Bottled 0 – – –
0.1 0.07 73 17
0.5 0.38 75 9
1 0.89 89 10
Tap 0 – – –
0.1 0.12 115 8
0.5 0.7 139 5
1 1.11 111 13
Wastewater 0 – – –
0.1 0.1 100 15
0.5 0.4 70 11
1 0.9 88 13
a Data listed are the mean of the six independent determinations.
A.E. Botchkareva et al. / Journal of Immunological Methods 283 (2003) 45–5754
and 0.06 Ag/l for class-selective and DDT-selective
assays, respectively. The sensitivity (I50) reached by
both immunoassays was higher by a factor of 4
compared to the values obtained for colorimetric
ELISAs (Abad et al., 1997). The decrease of the I50value for p,pV-DDT was probably a direct conse-
quence of the decrease in the immunoreagent con-
centrations and of the accurate optimization of assay
parameters.
3.5. Analysis of spiked water, soil, and food samples
The analytical performance of ELISAs is com-
monly assessed by spiking matrix samples with the
Table 4
Recovery of DDT and related compounds from spiked food and soil sam
Sample Class-selective ELISA (LIB-DDT5-25 MAb)
DDT added,
mg/kg
DDT recovered,
mg/kgaRecovery, %
(CV, %)
Soil 0.59 0.81 136 (14)
Soil1b 0.03 0.02 81 (10)
Soil2b,c 0.98 0.85 87 (18)
Strawberry 1.76 1.99 108 (14)
Salad1 0.09 0.11 125 (26)
Salad2 0.08 0.08 88 (14)
Beet root 1.52 1.52 100 (23)
Fishb 0.12 0.07 54 (14)
a Data listed are the mean of the six independent determinations.b Extract of lyophilized samples.c Only p,pV-DDE.
target analyte. To study possible matrix interferences
from different water types (tap, mineral and waste-
water), standard curves were prepared in water
samples and in double-distilled water as a control.
As shown in Fig. 5 for the class-selective CL-
ELISA, parallel calibration curves were obtained
irrespective of the nature of the water sample.
Results of the analysis, expressed as a percentage
of recovery, are shown in Table 3. Added p,pV-DDTwas accurately recovered (73–89%) in bottled water.
For the wastewater sample, positive results were
obtained when a blank was assayed probably indi-
cating the presence of some interfering compounds
in the sample. Probably for the same reason, spiked
tap water samples gave rather high recovery values
(111–139%). All CVs were acceptable, never being
higher than 17%.
Both assays were next applied to the analysis of
soil and several food samples. Two kinds of samples
were used: fortified soil and food extracts in methanol
and pesticide-free and fortified lyophilized samples of
soil and fish. Lyophilized samples were extracted with
methanol prior to use as described in Materials and
methods. Initial examination of sample matrix effects
was performed with pesticide-free extracts of lyoph-
ilized samples. p,pV-DDT standard curves produced in
several dilutions of each sample extract (typically, 1/
20, 1/50, 1/100, 1/200 and 1/400 prepared in 0.5PBS) showed that extracts diluted 1/100 and higher
did not affect the chemiluminescence intensity and the
sensitivity of the assays. Therefore, methanol extracts
of both kind of fortified samples were diluted 1/100
ples
DDT-selective ELISA (LIB-DDT5-52 MAb)
DDT added,
mg/kg
DDT recovered,
mg/kgaRecovery, %
(CV, %)
0.88 1.00 114 (15)
0.04 0.04 119 (25)
– – –
2.34 2.24 96 (18)
0.11 0.16 144 (12)
0.15 0.13 90 (16)
2.53 2.68 106 (17)
0.18 0.12 70 (17)
A.E. Botchkareva et al. / Journal of Immunological Methods 283 (2003) 45–57 55
before analysis. Using class-selective and DDT-selec-
tive chemiluminescent ELISAs, recoveries between
54% and 136% and between 70% and 144%, respec-
tively, were obtained for samples spiked with mixtures
of DDT-related compounds and other organochlorine
pesticides (Table 4). These high recoveries for both
types of samples indicated that the extent of pesticide
removal did not depend upon the manners of fortifi-
cation. In both cases, the higher spiked concentrations
were closer to 100% recovery, with the lowest spiked
concentrations being overestimated as well as under-
estimated. It should be noted that the lowest recov-
eries were observed with fish sample due to its fat
content and high fat solubility of DDT-related
compounds.
Samples of barbel fish (B. barbus) from the Elbe
river were finally analyzed by both immunoassay
and chromatographic methods (Hajslova et al., 1993)
(see Table 5). The GC-ECD method allowed us to
obtain individual values for each of the DDT iso-
mers and metabolites present, while with immuno-
assay, only summa DDT was measured. In order to
compare the results obtained, the values obtained by
GC-ECD were recalculated on the basis of CR
values of DDT isomers and metabolites. In this
way, the results obtained by both methods were
found to be in good agreement, showing that the
chemiluminescent ELISA can detect, both qualita-
tively and quantitatively, the presence of these pes-
ticides in fish.
Table 5
Analysis of barbel fish samples by immunoassay and gas
chromatography-ECD methods
Sample GC-ECD Value obtained by ELISAb ELISA/
recalculateda,
mg/kgAverage value,
mg/kg
CV, %GC-ECDc,
%
1 2.46 2.54 14 103
2 2.46 2.89 15 118
3 2.46 2.58 26 105
4 2.46 4.24 33 173
5 2.45 2.19 9 89
6 2.45 2.29 4 94
7 2.45 2.58 18 105
8 2.45 2.99 56 122
a Values obtained by GC-ECD (summa DDT) were recalculated
on the basis of CR values of DDT isomers and metabolites.b n (number of analysis) = 5.c Value obtained by ELISA/GC-ECD recalculated.
4. Conclusions
A number of antibodies have been developed for
the analysis of p,pV-DDT and its derivatives and
metabolites (Abad et al., 1997; Banerjee et al., 1996;
Beasley et al., 1998; Giraudi et al., 1998). These have
been applied in different immunoassay techniques.
Competitive immunoassays were mainly developed
with colorimetric detection, and 0.12 ng/ml was the
lowest detection limit obtained (Giraudi et al., 1998).
More recently, two fluorescent polarization immuno-
assays were developed by Eremin et al. (2002), obtain-
ing limits of detection of 12 and 3 ng/ml for the DDT
specific and the DDT-class specific assay, respectively.
In European countries, very low residue limits are
set for pesticides in foods, from 50 to 10 Ag/kg in
baby food (EC Pesticides MRLs in and on cereals,
foodstuffs of animal origin and certain products of
plant origin, including fruit and vegestables, 1976,
1986, 1990, 2000), and in water (EC Drinking water
quality directive, 1980, 1998). Therefore, sensitive
methods are needed. Chemiluminescent detection
appears to be an effective analytical technique for
use in ecotoxicological monitoring due to its high
sensitivity and ease of handling. No chemilumines-
cent ELISAs for DDT have been published till now. In
the current study, the sensitivity of the ELISAs was
improved and reagent concentrations were lowered
with respect to colorimetric detection (Abad et al.,
1997) by introducing an enhanced chemiluminescence
(ECL) reaction as the end-point detection system. We
have already reported on the development of ECL
immunoassays for DDT and related compounds, in
which a flow system was employed (Botchkareva et
al., 2002). Although the resulting flow assays had
LODs of 1.1 and 0.4 ng/ml with DDT-selective and
class-selective MAbs, respectively, its application for
the quantification of DDT in real samples was limited
by the short lifespan of the flow immunosupport. In
the present study, we adapted the ECL detection to the
development and optimization of sensitive ELISAs
based on the same monoclonal antibodies (MAbs).
For the DDT-selective assay, the sensitivity, estimated
as the I50 value, was 0.6 ng/ml, with a linear working
range between 0.1 and 2 ng/ml and a limit of detection
of 0.06 ng/ml. For the DDT group-selective assay, the
sensitivity was 0.2 ng/ml, with a linear working range
between 0.07 and 1 ng/ml and a limit of detection of
A.E. Botchkareva et al. / Journal of Immunological Methods 283 (2003) 45–5756
0.04 ng/ml. CL-ELISAs were about four times more
sensitive compared to colorimetric ELISAs (Abad et
al., 1997).
Optimized CL-ELISAs were applied to different
sample matrices. DDT-related compound residues in
tap, mineral and wastewater could be quantitatively
analyzed directly without the need for sample clean-
up. Soil and food extracts proved to be difficult
matrices for analysis. However, a simple method
involving the dilution of sample extracts with the
assay buffer allowed soil and food samples to be
analyzed using standard curves prepared in double-
distilled water.
Luminescent detection proved to be quicker and to
possess lower detection limits than the colorimetric
one. Also, the consumption of immunoreagents was
lower, but black microplates are more expensive than
colorimetric ones. Therefore, the chemiluminescent
class-selective and DDT-selective ELISAs presented
here are very sensitive compared to the methods found
in the literature and they could be employed for the
analysis of DDT and related compounds in environ-
mental and food samples.
Acknowledgements
This work was supported by EC INCO-COPER-
NICUS Grant ERBIC-15CT961001. The authors
acknowledge CIRB (Centro Interdipartimentale per
le Ricerche Biotecnologiche), the University of
Bologna, and MIUR (Ministero Istruzione, Universita
e Ricerca Scientifica, projects of National Interest).
S.A. Eremin thanks for the Fellowship of the Italian
Ministry of Foreign Affairs organized by the Landau
Network-Centro Volta.
References
Abad, A., Manclus, J.J., Mojarrad, F., Mercader, J.V., Miranda,
M.A., Primo, J., Guardiola, V., Montoya, A., 1997. Hapten syn-
thesis and production of monoclonal antibodies to DDT and
related compounds. J. Agric. Food Chem. 45, 3694.
Abad, A., Moreno, M.J., Montoya, A., 1999. Development of
monoclonal antibody-based immunoassays to the N-methylcar-
bamate pesticide Carbofuran. J. Agric. Food Chem. 47, 2475.
Arefyev, A.A., Vlasenko, S.B., Eremin, S.A., Osipov, A.P., Egorov,
A.M., 1990. Flow-injection enzyme immunoassay of haptens
with enhanced chemiluminescence detection. Anal. Chim. Acta
237, 285.
ATSDR: Agency for Toxic Substances and Disease Registry, US
Department of Health and Human Services, 2000. Toxicological
Profile for DDT, DDE and DDD (update): draft for public com-
ment. Agency for Toxic Substances and Disease Registry (http://
www.atsdr.cdc.gov/), Atlanta.
Banerjee, B.D., 1987. Development of an enzyme-linked immuno-
sorbent assay for the quantification of DDA (2,2-bis [ p-chlor-
phenyl] acetic acid) in urine. Bull. Environ. Contam. Toxicol.
38, 798.
Banerjee, B.D., Pasha, S.T., Koner, B.C., 1996. Hapten synthesis
and production of rabbit antibodies with reactivity to DDT and
its metabolites for the development of an immunoassay. Med.
Sci. Res. (India) 24, 553.
Beasley, H.L., Phongkham, T., Daunt, M.H., Guihot, S.L., Skerritt,
J.H., 1998. Development of a panel of immunoassays for mon-
itoring DDT, its metabolites, and analogues in food and environ-
mental matrices. J. Agric. Food Chem. 46, 3339.
Botchkareva, A.E., Fini, F., Eremin, S.A., Mercader, J.V., Montoya,
A., Girotti, S., 2002. Development of a heterogeneous chemilu-
minescent flow immunoassay for DDT and related compounds.
Anal. Chim. Acta 453, 43.
Burgisser, D., Frey, S., Gutte, B., Klauser, S., 1990. Preparation and
characterisation of polyclonal and monoclonal antibodies
against the insecticide, DDT. Biochem. Biophys. Res. Commun.
166, 1228.
Danielsson, B., Surugiu, I., Dzgoev, A., Mecklenburg, M., Rama-
nathan, K., 2001. Optical detection of pesticides and drugs
based on chemiluminescence– fluorescence assays. Anal. Chim.
Acta 426, 227.
Dankwardt, A., 2001. Immunochemical assays in pesticide analysis.
In: Meyers, R.A. (Ed.), Encyclopedia of Analytical Chemistry.
WileyChichester, England, p. 1.
Dzgoev, A.B., Gazaryan, I.G., Lagrimini, L.M., Ramanathan, K.,
Danielsson, B., 1999. High-sensitivity assay for pesticides using
a peroxidase as chemiluminescent label. Anal. Chem. 71, 5258.
EC Drinking water quality directive, 80/778/EEC, 1980.
EC Drinking water quality directive, 98/83/EC, 1998.
EC Pesticides MRLs in and on cereals, foodstuffs of animal origin
and certain products of plant origin, including fruit and vegeta-
bles, 76/895/EEC, 1976.
EC Pesticides MRLs in and on cereals, foodstuffs of animal origin
and certain products of plant origin, including fruit and vegeta-
bles, 86/362/EEC, 86/363/EEC, 1986.
EC Pesticides MRLs in and on cereals, foodstuffs of animal origin
and certain products of plant origin, including fruit and vegeta-
bles, 90/642/EEC, 1990.
EC Pesticides MRLs in and on cereals, foodstuffs of animal origin
and certain products of plant origin, including fruit and vegeta-
bles, 2000/24/EC, 2000.
Eremin, S.A., Botchkareva, A.E., Popova, V.A., Abad, A., Man-
clus, J.J., Mercader, J.V., Montoya, A., 2002. Fluorescence po-
larization immunoassay for the insecticide DDT and its
metabolites. Anal. Lett. 35, 1835.
Giraudi, G., Baggiani, C., Cosmaro, A., Santia, E., Vanni, A., 1998.
A highly specific polyclonal antiserum to the environmental
A.E. Botchkareva et al. / Journal of Immunological Methods 283 (2003) 45–57 57
contaminant 1,1,1-trichloro-2,2-bis- (4-chlorophenyl)-ethane
( p,pV-DDT). Fresenius’ J. Anal. Chem. 360, 235.
Hajslova, J., Holadova, K., Kocourek, V., Poustka, J., Cuhra, P.,
Raverdino, V., 1993. Determination of PCBs in fatty tissues by
means of several detection techniques. Z. Lebensm.-Unters.
Forsch. 197 (6), 562.
Hennion, M.-C., Barcelo, D., 1998. Strengths and limitations of
immunoassays for effective and efficient use for pesticide anal-
ysis in water samples: a review. Anal. Chim. Acta 362, 3.
Knopp, D., 1995. Application of immunological methods for the
determination of environmental pollutants in human biomonitor-
ing: a review. Anal. Chim. Acta 311, 383.
Manclus, J.J., Montoya, A., 1996. Development of enzyme-linked
immunosorbent assays for the insecticide chlorpyrifos: 2. Assay
optimization and application to environmental waters. J. Agric.
Food Chem. 44, 4063.
Mercader, J.V., Montoya, A., 1999. Development of monoclonal
ELISAs for Azinphos-methyl: 2. Assay optimisation and water
sample analysis. J. Agric. Food Chem. 47, 1285.
Navaz, M.J., Jimenez, A.M., 1996. Review of chemiluminescent
methods in food analysis. Food Chem. 55, 7.
Rubtsova, M.Y., Wittman, C., 1997. Chemiluminescent immuno-
assay: application of a portable scanning luminometer for the
determination of 2,4-dichlorphenoxyacetic acid in microtiter and
membrane strip format. Food Agric. Immunol. 9, 235.
Schneider, P., Gee, S.J, Kreissig, S.B., Harris, A.S., Kramer,
P.M., Marco, M.P., Lucas, A.D., Hammock, B.D., 1995.
Troubleshooting during the development and use of immuno-
assays for environmental monitoring. In: Kurtz, D.A., Sker-
ritt, J.H., Stanker, L.H. (Eds.), New Frontiers in Agro-
chemical Immunoassay. AOAC International, Gaithersburg,
MD, p. 103.
Selby, C., 1999. Interference in immunoassay. Ann. Clin. Biochem.
36, 704.