development of a procedure for correcting and reducing unwrapping artefacts using a set of ers sar...
TRANSCRIPT
Development of a procedure for correcting and reducing unwrapping artefacts using a set of ERS SAR interferograms. Case of the September 7, 1999 Athens Earthquake
Panagiotis Elias(1), Olga Sykioti(1), Charalabos Kontoes(1), Antonio Avallone(2), Sebastien Van Gorp(2), Pierre Briole(2),
Dimitris Paradissis(3)
(1)National Observatory of Athens, Institute for Space Applications and Remote Sensing, Metaxa & Vas. Pavlou Str. 15236 Palaia Penteli, Athens, Hellas, Email:[email protected]
(2)Institut de Physique de Globe de Paris, Departement de Sismologie, 4, place Jussieu, 75252 Paris cedex 05, France, Email:[email protected]
(3)National Technical University of Athens, Department of Surveying Engineering, 9 Heroon Polytechniou Str, Zographos, Athens, Hellas, Email:[email protected]
ABSTRACT On September 7, 1999 a magnitude MW=5.9 earthquake occurred in the Athens area (Greece) producing a subsidence of about 6 cm detected by radar interferometry. Using seventeen ERS SAR images acquired between December 1997 and January 2001, one hundred thirty six interferograms of the area have been calculated using the CNES DIAPASON software. Among them, eighty-one have been selected on the basis of coherence and used in the processing. These interferograms have been used to produce a collective coherence map and they have been unwrapped using the SNAPHU software. Orbital effects have been reduced by tilting and shifting the unwrapped interferograms, making the assumption that no deformation has occurred in zones located at the edges of the scene, which are far away from the area affected by the earthquake. This procedure was applied constraining the deformation value of the most coherent pixels in the selected zones to a zeroed value. Twenty-four co-seismic, five pre-seismic and eight post-seismic interferograms have been finally selected on the basis of the coherence of the phase signal. The co-seismic interferograms have been stacked to produce a smoothed image of the average deformation field. The resulted deformation field is used to recalculate the deformation source and to produce a new model, which is found to be close to that proposed by Kontoes et al., 2000. The synthetic interferogram issued from the model is then subtracted from each co-seismic interferogram. The corrected residuals of the co-seismic interferograms and the corrected pre- and post-seismic interferograms are finally examined to detect any temporal evolution of the deformation before and after the main event. INTRODUCTION
On September 7, 1999, at 11:56:51 UT, a MW=5.9 earthquake struck the city of Athens (Hellas), causing extensive damages in the west and north of the city where the macroseismic intensities reached locally. It is the strongest and most damaging event that occurred at such a close distance of this city in the recent Greek history. The epicenter is located at 38.12oN; 23.60oE [8], about 20 km NNW from the Athens center. In this region none of the faults were recognized to be tectonically active [13]. As revealed by the aftershock distribution [12;17] and the focal mechanism solutions [8;10;12;13;16;18] the rupture occurred on a N110-120°, 50-60° dipping normal fault. Two N110-130°, south dipping normal faults are clearly expressed on the morphology of the epicentral area, the Fili and Thriassio faults, however, the field investigation did not allow a direct identification of the activated fault, since no extended surface rupture was observed [14]. Nevertheless, some freshly exposed dislocations observed in the area [14] suggest an activation of the Fili fault. In this study particular attention is given to the pre- or post-seismic deformation.
____________________________________________________________
Proc. of FRINGE 2003 Workshop, Frascati, Italy,1 – 5 December 2003 (ESA SP-550, June 2004) 88_elias

DATA ANALYSIS Using seventeen ERS-1 and ERS-2 SAR RAW images (descending, track 465, frame 2835, line of sight vector: 0.427E, -0.089N, 0.899U) acquired between December 1997 and January 2001 we produced one hundred thirty six interferograms of the area using the CNES DIAPASON [7] software and the precise orbits, calculated by the Delft University. Among them, eighty-one were selected. From these thirty-eight interferograms were selected on the basis of coherence and the quality of the calculated deformation pattern. Fig. 1 displays a time/baseline diagram of this dataset. The red lines in Fig.1 correspond to the interferometric combinations produced by six pre-seismic images and seven post-seismic images. The baselines range between 3 and 574 meters (altitudes of ambiguity range between 17 and 2810 meters). We used a digital elevation model (DEM) with spatial resolution of 40m obtained from the digitization of 1/50000 scale map of the area. The vertical accuracy of this DEM is of the order of ±10 metres.
13/12
15/08
19/09
28/11
26/06
31/07
08/10
09/10
13/11
18/12
01/04
10/06
15/07
19/08
28/10
02/12
06/01
-600
-300
0
300
600
1997 1998 1999 2000 2001
Time
Bas
elin
e (m
)
Fig. 1. This diagram shows the eighty-one interferograms (dashed lines) selected on the basis of the coherence of the calculated deformation patterns. The red lines correspond to the thirty-eight best pre-, co- and post-seismic interferograms. The blue line indicates the date of the earthquake occurrence. The family of eighty-one interferograms has been used to calculate a collective coherence mask of the area. For each pixel of the image, the value of the mask is the average standard deviation of the phase values in a 3x3 cell [1;3;5].
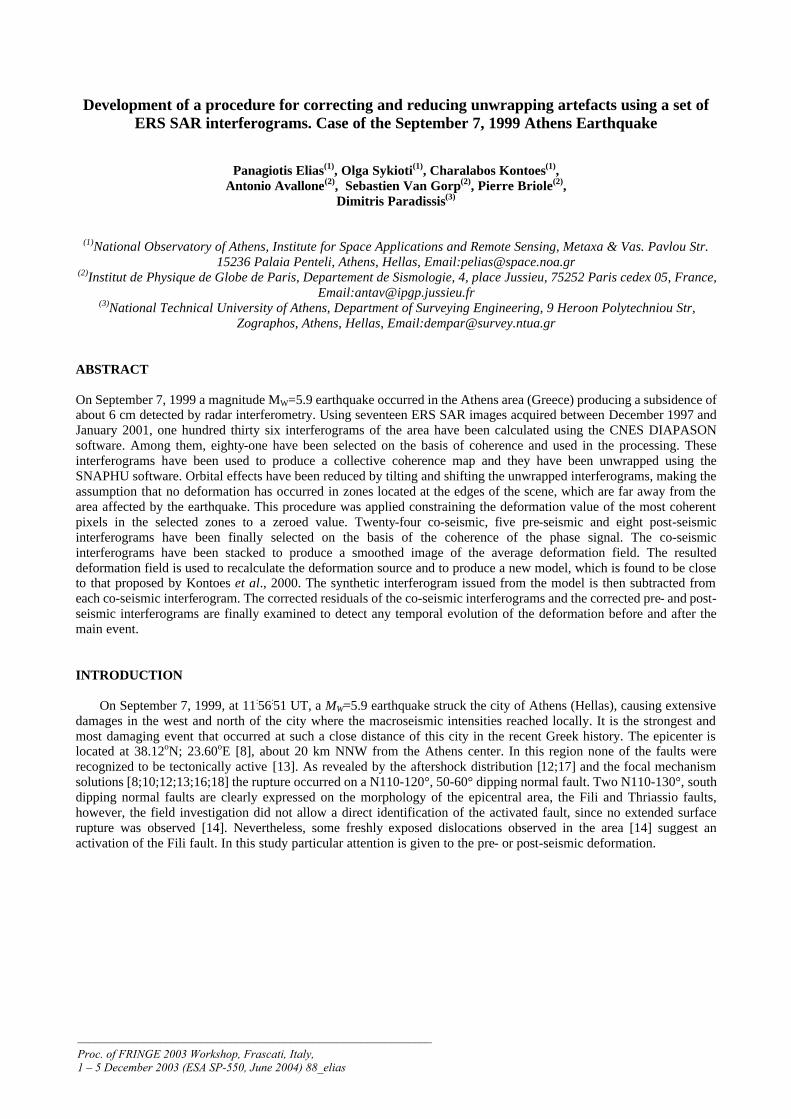
UNWRAPPING AND REMOVAL OF ORBITAL EFFECTS The sea was masked out from the set of thirty-eight initial phase interferograms. Then they were unwrapped using the SNAPHU software developed by [6]. The coherence map of each interferogram was used to weight the data during the unwrapping process.The residual orbital effects were corrected by tilting and shifting the interferograms. The tilting of the interferograms was performed assuming that the edges of the images are located in areas not deformed by the earthquake. To define this area, we used the ground displacements modelled in our previous work, [9]. In order to avoid errors in the tilting, we used the previously produced collective coherence mask in order to keep in the computations only the most coherent pixels in this peripheral area. The whole interferogram has been tilted, by applying a least square adjustment technique. An example demonstrating this procedure is shown in plate 1.
N37°52.4
E23°
24.2 30 35 40 45 50
00
05
10
55
N37°51.8
E23°
53.9
N38°13.0
E23°
25.0
N38°12.3
E23°
54.7
ATHENS
ELEYSIS
FILI MOUNTAIN
YMITO
S M
NT
AEGA
LEO
MN
T
0 5 10Km
N37°52.4
E23°
24.2 3
0
35 40 45
50
00
05
10
55
N37°51.8
E23°
53.9
N38°13.0
E23°
25.0
N38°12.3
E23°
54.7
ATHENS
ELEYSIS
FILI MOUNTAIN
YMITO
S M
NT
AEG
ALEO
MNT
0 5 10Km -50
0
50
100mm
mm
pixel-100
102030405060708090
100
0 100 200 300 400 500 600 700 800
N37°52.4
E23°
24.2 30 35 40 45 50
00
05
10
55
N37°51.8
E23°
53.9
N38°13.0E2
3°2
5.0
N38°12.3
E23
°54
.7
ATHENS
ELEYSIS
FILI MOUNTAIN
YMITO
S M
NT
AEG
ALEO
MNT
0 5 10Km -20
0
20mm
-200 100 200 300 400 500 600 700 800
-10
0
10
20
(a) (b) (c)
Plate 1. (a) An example of the initial phase interferogram output from DIAPASON [7]. spanning the period from September 19, 1998 to October 9, 1999. Residual orbital fringes are clearly visible. (b) The unwrapped phase
interferogram, using SNAPHU [6], and the W-E cross-section passing through the area of maximum deformation. (c) The tilted-shifted unwrapped phase interferogram. This procedure is performed constraining the deformation value of
the most coherent pixels to a zeroed value at the edges of the interferograms, where no deformation is expected. CO-SEISMIC DISLOCATION MODEL In this step, the twenty-four co-seismic tilted and shifted interferograms were averaged by stacking, in order to obtain a temporal mean deformation field (plate 2a).The produced image was filtered by using a low pass filter with an averaging moving window of 50 x 50 pixels (2 x 2 km), (plate 2b). This method was chosen as the most effective one compared with the procedure of filtering first and then stacking. The moving window of 2 x 2 km was retained from the corresponding 1 x 1 km and 4 x 4 km ones. The reason for this control is that not all seventeen scenes have the same weight in the population of the twenty-five interferograms (presence in 1 to 4 interferograms depending on the image) and therefore some common mode effect could be amplified when stacking first. The comparison of both solutions shows that the dominant effect when stacking the twenty-four co-seismic interferograms is a reduction of the high frequency noise (at a wavelength less than ~0.5km), without significant local amplifications due to possible common mode effect at the wavelength between 1 and 5km. The deviation between the stacked and filtered interferogram is 2.6mm. The stacked and filtered interferogram was wrapped with 10mm level contours in order to extract a set of points to be used for the data inversion and the retrieval of the model parameters. One point has been sampled, every ~0.5km along every contour, which is considered adequate for the inversion process. The total number of points finally kept for the inversion was 1893. The inversion algorithm is the same to that used in our previous work [9]. It is based on the theory of the dislocation of rectangular discontinuities in an elastic half-space [11]. The inversion was performed using a least square adjustment technique [4]. The input parameters of the model were those proposed as model 2 by [9]. The inversion was performed leaving free all parameters of the fault except the strike and dip angle which were kept fixed in order to avoid instabilities in the inversion.

Those angles are respectively 116° and 54°, both confirmed to be valid by several recent studies of the earthquake. The parameters of the best fit model are listed in Table 1.
N37°52.4
E23
°24
.2 30 35 40 45
50
00
05
10
55
N37°51.8
E23°
53.9
N38°13.0
E23°
25.0
N38°12.3
E23°
54.7
ATHENS
ELEYSIS
FILI MOUNTAIN
YMITO
S M
NT
AEGAL
EO M
NT
0 5 10Km
N37°52.4
E23
°24.
2 30 35
40 45 50
00
05
10
55
N37°51.8
E23
°53.
9
N38°13.0
E23°
25.0
N38°12.3
E23°
54.7
ATHENS
ELEYSIS
FILI MOUNTAIN
YMITO
S M
NT
AEGAL
EO M
NT
0 5 10Km-50
0
50
100mm
mm
pixel
N37°52.4
E23
°24.
2 30 35
40 45 5000
05
10
55
N37°51.8
E23
°53.
9
N38°13.0
E23°
25.0
N38°12.3
E23°
54.7
ATHENS
ELEYSIS
FILI MOUNTAIN
YMITO
S M
NT
AEGA
LEO
MNT
0 5 10Km-50
0
50
100mm
mm
-100
102030405060708090
100
-100
102030405060708090
100
0 100 200 300 400 500 600 700 800 0 100 200 300 400 500 600 700 800 (a) (b) (c)
Plate 2. (a) The stacked co-seismic interferograms, using the mean function to enhance the presence of a common signal. (b) The filtered stacked interferogram, using a 50x50 pixel (2x2km) low pass filter. (c) The deformation field
produced by the model.
Fault Lat (°) Lon(°) h (km) d(km) L(km) T(°) a(°) D(mm) M (N m) Main 38°7'33' 23°35'04'' 5.9 5.2 11.0 54 116 350 12.1 1017
Uncertainty 0.2km 0.3km 0.6 0.3 1.0 - - 30 - Secondary 38°7'23'' 23°41'14'' 4.0 4.5 3.5 54 116 260 2.5 1017
Uncertainty 0.2km 0.4km 0.4 0.4 0.4 - - 20 - Table 1. Model Parameters (all Parameters Free Except Strike Angle = 116° and Dip Angle = 54°). The rms Error for Data Fit is 5.5 mm. The Total Seismic Moment is 14.6 1017 N m. Shaded Values Denote the Formal Uncertainties for the Model Parameters. h is the Depth of the upper edge of the fault, d is the Half-length of the fault, L is the Width of
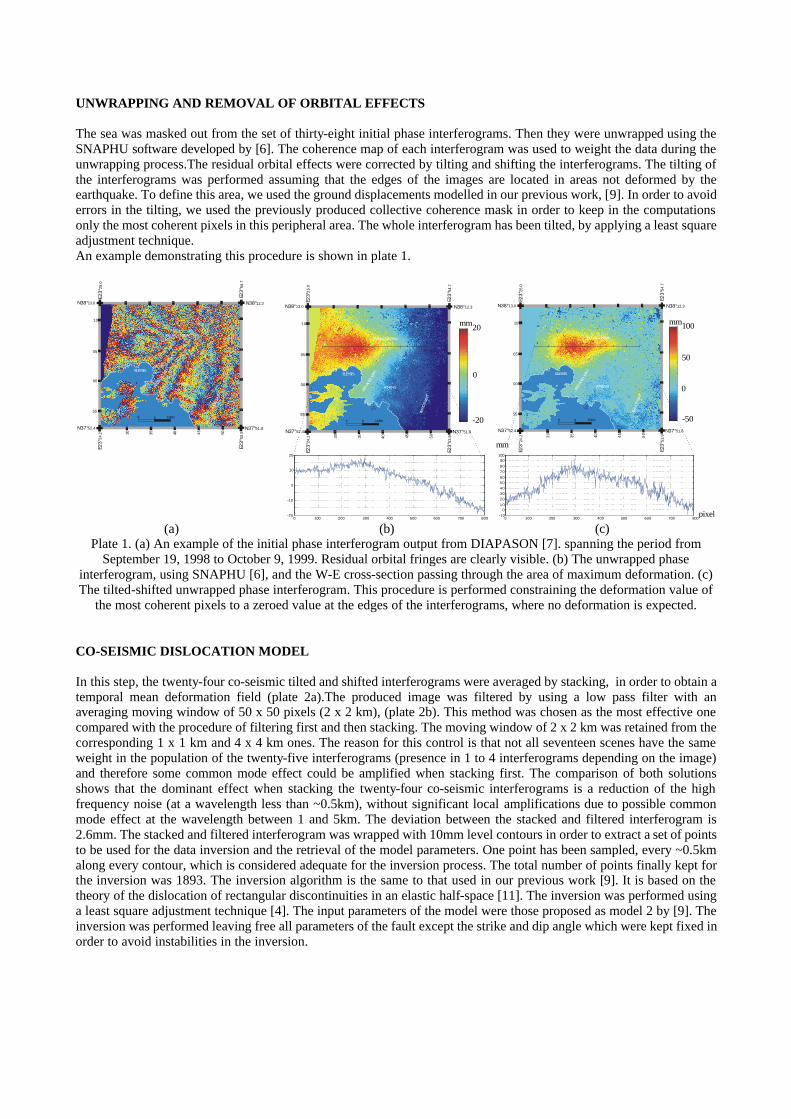
the fault, T is the Dip angle, a is the Strike, D is the Dip slip (positive normal) and M is the Seismic Moment. These results show that there is no major change with respect to [9], however the contribution of the two faults (or the two fault segments) seems to be more balanced. CORRECTION OF UNWRAPPING FAILURES The unwrapped interferograms contained intermediate frequency noise, with a wavelength of ~1km, induced by the unwrapping algorithm SNAPHU (plate 3a). These errors were corrected, by developing the following technique. The unwrapped modeled deformation is substracted from each one of the co-seismic interferograms. The residuals are filtered, by using a 100x100 pixel window (4x4 km) low pass filter, to remove the high frequency noise, (wavelength > ~1 km). Thus, only the cycle slipping noise due to unwrapping failures remains. If no unwrapping failures occur, the phase value of each pixel, must be within one cycle [-14,14] mm for all the residuals. At this step, a map of the pixels, for which the phase values exceed the [-14,14] mm range, is created. The pixels of the co-seismic interferograms, identified by the map, have been corrected and positioned to the right cycle (plate 3b). The improvement is evident with respect to the plate 3a, (which is the interferogram before the correction, the same as in plate 1c) and by examining their cross sections. The noise at wavelength ~1km, due to SNAPHU failures, has been minimized, and only the high frequency at wavelength ~0.2km remains.
N37°52.4
E23°
24.2 30 35 40 45 50
00
05
10
55
N37°51.8
E23°
53.9
N38°13.0
E23°
25.0
N38°12.3
E23°
54.7
ATHENS
ELEYSIS
FILI MOUNTAIN
YMITO
S MNT
AEGA
LEO
MNT
0 5 10Km-50
0
50
100mm
N37°52.4
E23°
24.2 30 35 40 45 50
00
05
10
55
N37°51.8
E23°
53.9
N38°13.0
E23°
25.0
N38°12.3
E23°
54.7
ATHENS
ELEYSIS
FILI MOUNTAIN
YMITO
S M
NT
AEGA
LEO
MNT
0 5 10Km -50
0
50
100mm
mm
pixelpixel
-100
102030405060708090
100
-100
102030405060708090
100
0 100 200 300 400 500 600 700 8000 100 200 300 400 500 600 700 800
(a) (b) Plate 3. An example of the effect of the correction procedure. (a) before correction. (b) after correction
The corrected interferograms have been stacked by using a mean function (plate 4a). The noise in the deformation pattern has been reduced with respect to the plate 2a. The produced image was filtered again, by using a low pass filter with an averaging moving window of 50 x 50 pixels (2 x 2 km), (plate 4b). The deviation between the stacked and filtered interferogram is 2.0mm which is reduced by 23% in comparison with the deviation of 2.6mm before the correction.
N37°52.4
E23°
24.2 30 35 40 45 50
00
05
10
55
N37°51.8
E23°
53.9
N38°13.0
E23°
25.0
N38°12.3
E23°
54.7
ATHENS
ELEYSIS
FILI MOUNTAINYM
ITOS
MNT
AEG
ALEO
MNT
0 5 10Km -50
0
50
100mm
mm
pixel
N37°52.4
E23°
24.2 30 35 40 45 50
00
05
10
55
N37°51.8
E23°
53.9
N38°13.0
E23°
25.0
N38°12.3
E23°
54.7
ATHENS
ELEYSIS
FILI MOUNTAIN
YMITO
S M
NT
AEG
ALEO
MNT
0 5 10Km-50
0
50
100mm
mm
pixel-100
102030405060708090
100
-100
102030405060708090
100
0 100 200 300 400 500 600 700 800 0 100 200 300 400 500 600 700 800 (a) (b)
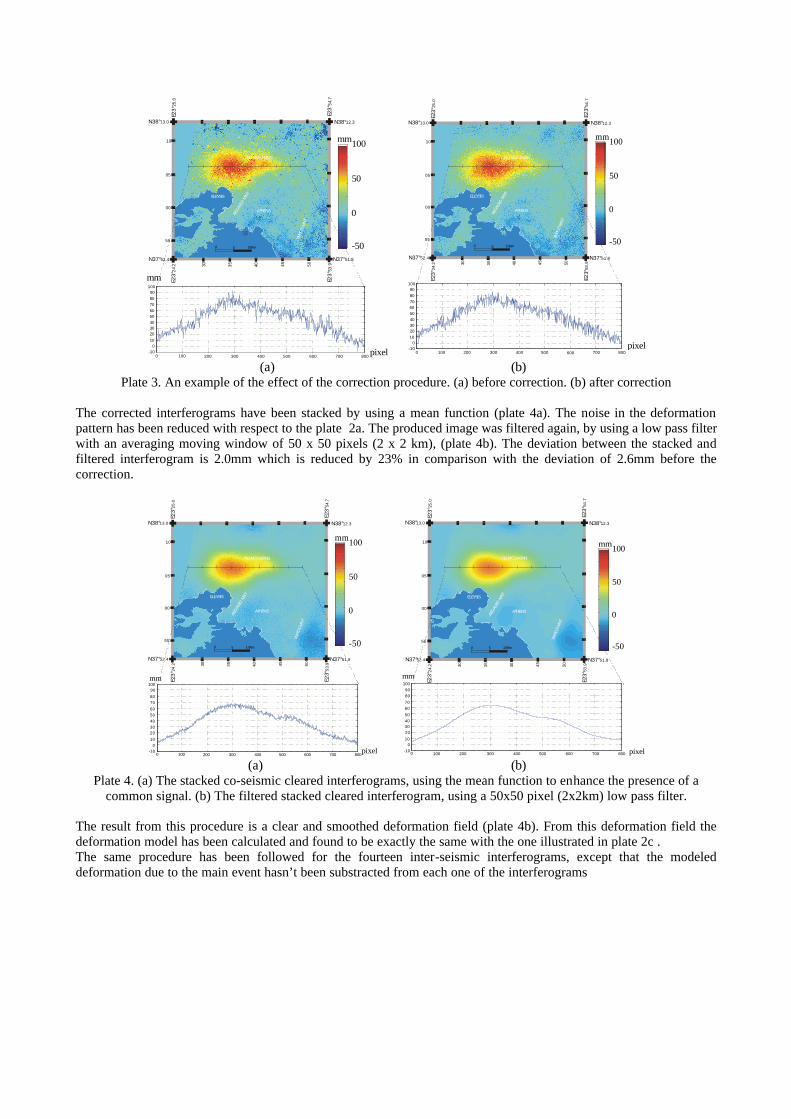
Plate 4. (a) The stacked co-seismic cleared interferograms, using the mean function to enhance the presence of a common signal. (b) The filtered stacked cleared interferogram, using a 50x50 pixel (2x2km) low pass filter.
The result from this procedure is a clear and smoothed deformation field (plate 4b). From this deformation field the deformation model has been calculated and found to be exactly the same with the one illustrated in plate 2c . The same procedure has been followed for the fourteen inter-seismic interferograms, except that the modeled deformation due to the main event hasn’t been substracted from each one of the interferograms
ANALYSIS OF THE RESIDUALS OF INTER-/CO-SEISMIC INTERFEROGRAMS The residuals of all the thirty-eight inter-/co- seismic interferograms, before and after clearing of the unwrapping failures, have been examined. All the residuals before clearing are expected to contain:
• Artefacts from tropospheric effects, of low frequency, with a wavelength of more than ~2km. • Artefacts induced by DEM errors, of high frequency, with a wavelength of less than ~0.2km. • Artefacts from unwrapping failures, of intermediate frequency, with a typical wavelength of ~1km.
Additionally, the co-seismic interferograms, before or after clearing are expected to contain: • A signal of deformation containing two components: a possible common mode signal corresponding to not
properly corrected co-seismic signal. The reasons for this are (i) the fact that the synthetic interferogram obtained from the Okada modelling is smoother than the real co-seismic signal, and (ii) the fact that the average stacked and filtered interferogram used for the modelling might contain a common mode effect masking a small part of the earthquake, for example if a significant number of interferograms contains a strong tropospheric signal.
The cleared inter-/co- seismic interferograms don’t contain the artefacts from unwrapping failures. The existence of the tropospheric noise didn’t allow the detection of any pre- or co- seismic deformation. Thus, in order to be confident whether any deformation, except from the main event, has taken place or not, the artefacts from tropospheric effects should be minimized. DISCUSSION The developed algorithm does not alter the phase value of the initial interferograms. It is completely reversible, permitting to return to the initial phase interferogram. The processing is semi-automated but a fully automated procedure is under implementation. It will be applied to other case studies in order to assess the potential and the flexibility of the method. The new inversion model does not show major changes in the deformation source with respect to [9]. However, the parameters of the two faults are more balanced due to the more precise co-seismic displacement measurements obtained by this method. The examination of the residuals of the co-seismic interferograms as well as the post-seismic ones does not reveal any pre- and post-seismic deformation. It should be noted here that improvements are still possible in order to reduce the common mode effect caused by the stacking of the interferograms, the local and global troposphere contributions as well as the high frequency noise due to DEM errors.
RERERENCES
1. Avallone A., Analyse de dix ans de deformation du rift de Corinthe (Grece) par geodesie spatiale, These de Doctorat, IPGP, 2003.
2. Baumont D., F. Courboulex, O. Scotti, N. Melis, and G. Stavrakakis, Slip distribution of the Mw 5.9, 1999 Athens earthquake inverted from regional seismological data, Geophys. Res. Lett., 29, doi: 10.1029/2001GL014261, 2002.
3. Beauducel, F., Briole, P., Froger, J.L., Volcano wide fringes in ERS SAR interferograms of Etna: Deformation or tropospheric effect?, J. Geophys. Res., 105:B7, 16,391-16,402, 2000.
4. Briole, P., G. De Natale, R. Gaulon, F. Pingue, and R. Scarpa, Inversion of geodetic data and seismicity associated with the Friuli earthquake sequence (1976-1977), Annales Geophysicae, 4, 481-492, 1986.
5. Chaabane, F. , Avallone, A., Tupin, F., Briole, P., Maître, H., "Correction of local and global tropospheric effects on differential SAR interferograms for the study of earthquake phenomena". IGARSS 2003 , Toulouse, July 21-25, 2003.
6. C. W. Chen and H. A., Zebker, “Phase unwrapping for large SAR interferograms: Statistical segmentations and generalized network models”, IEEE Transactions on Geoscienve and Remote Sensing, vol 40, pp. 1709-1719, 2000.
7. CNES, “Philosophie et mode d’emploi de la chaine logicielle interferometrique DIAPASON”, 1996. 8. Harvard – CMT, http://www.seismology.harvard.edu/. 9. Kontoes, C., P. Elias, O. Sykioti, P. Briole, D. Remy, M. Sachpazi, G. Veis, and I. Kotsis, Displacement field
and fault model for the September 7, 1999 Athens earthquake inferred from ERS2 satellite radar interferometry, Geophys. Res. Lett., 27, 3989-3992, 2000.
10. Louvari, E. and A. Kiratzi, Source parameters of the 7 September 1999 Athens (Greece) earthquake based on teleseismic data, J. of the Balkan Geophys. Soc., 4, 51-60, 2001.
11. Okada Y., Internal deformation due to shear and tensile faults in a half-space, Bull. Seis. Soc. Am., 82, 1018-1040, 1992.
12. Papadimitriou, P, N. Voulgaris, I. Kassaras, G. Kaviris, N. Delibasis, and K. Makropoulos, The Mw=6.0, 7 September 1999 Athens earthquake, Natural Hazards, 27, 15-33, 2002.
13. Papadopoulos, G. A., G. Drakatos, D. Papanastassiou, I. Kalogeras, and G. Stavrakakis, Preliminary results about the catastrophic earthquake of 7 September 1999 in Athens, Greece, Seis. Res. Lett., 71, 318-329, 2000.
14. Pavlides S.B., G. Papadopoulos, and A. Ganas, The fault that caused the Athens September 1999 Ms=5.9 earthquake: Field observations, Natural Hazards, 27, 61-84, 2002.
15. Roumelioti Z., D. Dreger, A. Kiratzi, and N. Theodoulis, Slip distribution of the September 7, 1999 Athens earthquake inferred from an empirical Green’s function study, Bull. Seis. Soc. Am., 93, 775-782, 2003.
16. Sargeant, S.L., P.W. Burton, A. Douglas, and J.R. Evans, The source mechanism of the Athens earthquake, September 7, 1999, estimated from P seismograms recorded at long range, Natural Hazards, 27, 35-45, 2002.
17. Tselentis, G.-A. and J. Zahradnik, Aftershock monitoring of the Athens earthquake of 7 September 1999, Seis. Res. Lett., 71, 330-337, 2000a.
18. USGS – NEIC, http://neic.usgs.gov/.