development and validation of pedestrian sedan bucks using finite-element simulations: a numerical...
TRANSCRIPT
Seediscussions,stats,andauthorprofilesforthispublicationat:https://www.researchgate.net/publication/233778345
Developmentandvalidationofpedestriansedanbucksusingfinite-elementsimulations:Anumericalinvestigationoftheinfluenceofvehicleautomaticbrakingonthekinematicsof...
ARTICLEinINTERNATIONALJOURNALOFCRASHWORTHINESS·NOVEMBER2010
ImpactFactor:0.81·DOI:10.1080/13588265.2010.484189
CITATIONS
4
READS
147
9AUTHORS,INCLUDING:
CostinDUntaroiu
VirginiaPolytechnicInstituteandStateUni…
81PUBLICATIONS547CITATIONS
SEEPROFILE
JeffCrandall
UniversityofVirginia
304PUBLICATIONS2,407CITATIONS
SEEPROFILE
RikardFredriksson
Autoliv
33PUBLICATIONS281CITATIONS
SEEPROFILE
YukouTakahashi
HondaResearchInstituteJapanCo.,Ltd.
19PUBLICATIONS132CITATIONS
SEEPROFILE
Allin-textreferencesunderlinedinbluearelinkedtopublicationsonResearchGate,
lettingyouaccessandreadthemimmediately.
Availablefrom:CostinDUntaroiu
Retrievedon:03February2016

PLEASE SCROLL DOWN FOR ARTICLE
This article was downloaded by: [Untaroiu, Costin D.]On: 15 November 2010Access details: Access Details: [subscription number 929641208]Publisher Taylor & FrancisInforma Ltd Registered in England and Wales Registered Number: 1072954 Registered office: Mortimer House, 37-41 Mortimer Street, London W1T 3JH, UK
International Journal of CrashworthinessPublication details, including instructions for authors and subscription information:http://www.informaworld.com/smpp/title~content=t778188386
Development and validation of pedestrian sedan bucks using finite-element simulations: a numerical investigation of the influence of vehicleautomatic braking on the kinematics of the pedestrian involved in vehiclecollisionsCostin D. Untaroiua; Jaeho Shina; Jeff R. Crandalla; Rikard Fredrikssonbc; Ola Bostromb; YukouTakahashid; Akihiko Akiyamad; Masayoshi Okamotod; Yuuji Kikuchid
a Center for Applied Biomechanics, University of Virginia, Charlottesville, Virginia, USA b Autoliv Inc,Research, Vårgårda, Sweden c Department of Public Health, Karolinska Institutet, Stockholm, Sweden d
Research, Honda R&D, Shimotakanezawa, Tochigi, Japan
Online publication date: 15 November 2010
To cite this Article Untaroiu, Costin D. , Shin, Jaeho , Crandall, Jeff R. , Fredriksson, Rikard , Bostrom, Ola , Takahashi,Yukou , Akiyama, Akihiko , Okamoto, Masayoshi and Kikuchi, Yuuji(2010) 'Development and validation of pedestriansedan bucks using finite-element simulations: a numerical investigation of the influence of vehicle automatic braking onthe kinematics of the pedestrian involved in vehicle collisions', International Journal of Crashworthiness, 15: 5, 491 — 503To link to this Article: DOI: 10.1080/13588265.2010.484189URL: http://dx.doi.org/10.1080/13588265.2010.484189
Full terms and conditions of use: http://www.informaworld.com/terms-and-conditions-of-access.pdf
This article may be used for research, teaching and private study purposes. Any substantial orsystematic reproduction, re-distribution, re-selling, loan or sub-licensing, systematic supply ordistribution in any form to anyone is expressly forbidden.
The publisher does not give any warranty express or implied or make any representation that the contentswill be complete or accurate or up to date. The accuracy of any instructions, formulae and drug dosesshould be independently verified with primary sources. The publisher shall not be liable for any loss,actions, claims, proceedings, demand or costs or damages whatsoever or howsoever caused arising directlyor indirectly in connection with or arising out of the use of this material.
International Journal of CrashworthinessVol. 15, No. 5, October 2010, 491–503
Development and validation of pedestrian sedan bucks using finite-element simulations: anumerical investigation of the influence of vehicle automatic braking on the kinematics of the
pedestrian involved in vehicle collisions
Costin D. Untaroiua∗, Jaeho Shina, Jeff R. Crandalla, Rikard Fredrikssonb,c, Ola Bostromb, Yukou Takahashid,Akihiko Akiyamad, Masayoshi Okamotod and Yuuji Kikuchid
aCenter for Applied Biomechanics, University of Virginia, Charlottesville, Virginia, USA; bAutoliv Inc, Research, Vargarda, Sweden;cKarolinska Institutet, Department of Public Health, Stockholm, Sweden; dHonda R&D, Research, Shimotakanezawa, Tochigi, Japan
(Received 28 August 2009; final version received 14 March 2010)
Previous vehicle-to-pedestrian impact simulations and experiments using pedestrian dummies and cadavers have shown thatfactors such as vehicle shape, pedestrian anthropometry and pre-impact conditions influence pedestrian kinematics and injurymechanisms. Generic pedestrian bucks, which approximate the geometrical and stiffness properties of current vehicles, wouldbe useful in studying the influence of vehicle front-end structures on pedestrian kinematics and loading. This study exploresthe design of pedestrian bucks, intended to represent the basic vehicle front-end structures, consisting of five components:lower stiffener, bumper, hood leading edge and grille, hood and windshield. The deformable parts of the bucks were designedusing types of currently manufactured materials, which allow fabricating the bucks in the future. The geometry of pedestrianbucks was approximated according to the contour cross-sections of two sedan vehicles used in previous pedestrian dummyand cadaver impact tests. Other cross-sectional dimensions and the stiffness of the buck components were determined byparameter identification using finite-element (FE) simulations of each sedan model. In the absence of a validated FE modelof human, the FE model of the POLAR II pedestrian dummy was used to validate a mid-size sedan (MS) pedestrian buck. Agood correlation of the pedestrian dummy kinematics and contact forces obtained in dummy–MS pedestrian buck with thecorresponding data from dummy–MS vehicle simulation was achieved. A parametric study using the POLAR II FE modeland different buck models – an MS buck and a large-size sedan (LS) buck – were run to study the influence of an automaticbraking system for reducing the pedestrian injuries. The vehicle braking conditions showed reductions in the relative velocityof the head to the vehicle and increases in the time of head impact and in the wrap-around-distances (WAD) to primary headcontact. The head impact velocity showed a greater sensitivity to the different buck shapes (e.g. LS buck versus MS buck)than to the braking deceleration. The buck FE models developed in this study are expected to be used in sensitivity andoptimisation studies for the development of new pedestrian protection systems.
Keywords: pedestrian impact; impact biomechanics; finite-element simulation; vehicle models
1. Introduction
Pedestrian fatalities comprise a considerable percentage oftotal traffic fatalities in industrialised nations: from 11%in the United States [12] to nearly 50% in South Korea[30]. Additionally, the probability for a pedestrian to beinjured or killed during a traffic accident is much higherthan that for a vehicle occupant. In 2007, 6.7% of vehicle–pedestrian impacts in the United States were fatal, whereasthe corresponding fatality rate for occupants in crashes wasonly 1.3% [12].
The protection of pedestrians in vehicle-to-pedestriancollisions (VPC) has recently generated increased attentionwith regulations implemented or proposed in Europe [4,5],Korea [30] and Japan [11]. While subsystem experimentsare currently being used as the basis of evaluations forthese regulations, car-to-pedestrian dummy impact tests
∗Corresponding author. Email: [email protected]
[3,6] or car-to-human/dummy impact simulations [29]provide complementary data that can better characterise thewhole-body response of vehicle–pedestrian interactions.
An advanced pedestrian dummy, called the POLARII, has been developed and continuously improved byHonda R&D (Tochigi, Japan), GESAC (Boonsboro, MD,USA), and the Japan Automobile Research Institute (JARI)[1,2,15,21]. The primary purpose of the POLAR II dummyhas been to reproduce pedestrian kinematics in a collisionwith a vehicle. Kerrigan et al. [8] performed vehicle im-pact tests on the POLAR II and postmortem human surro-gates (PMHS) in identical conditions and showed that thePOLAR II dummy generally replicates the complex kine-matics of the PMHS.
A finite-element (FE) model of the POLAR II dummyhas been developed, validated in component tests [18]
ISSN: 1358-8265 print / ISSN: 1754-2111 onlineC© 2010 Taylor & Francis
DOI: 10.1080/13588265.2010.484189http://www.informaworld.com
Downloaded By: [Untaroiu, Costin D.] At: 11:53 15 November 2010

492 C.D. Untaroiu et al.
Table 1. Material properties of steel, plastic and glass used in the pedestrian buck models.
Material ApplicationDensity(kg/m3)
Young’smodulus (GPa)
Yieldstress (MPa)
Poisson’sratio
Steel Bumper 7810 206 941 0.3Hood 7810 206 230 0.3
Plastic Bumper and grille cover 945 21 0.435 0.41Glass Windshield 2490 23 64.5 0.3
and verified at the full-scale level against kinematic data[18,19] recorded during the vehicle–dummy impact ex-periments [8]. The POLAR II FE model was developedusing Hypermesh (Altair Engineering, Troy, MI, USA)and Generis (ESI, Paris, France) as pre-processors andPAM-CRASH/PAM-SAFE FE solver (version 2001, ESI[16]) was used for impact simulations. The model contains27,880 elements that represent the head, neck, thorax, ab-domen, pelvis, upper arms, forearms, hands, thighs, knees,legs and feet, and has a total mass and height close to that ofthe 50th percentile male. Recently, injury thresholds for thePOLAR II dummy FE model are being established based onFE simulations with a human model [22] that may extendthe applicability of the dummy model to injury preventionapplications. While vehicle-to-PMHS tests or simulationsmay provide a better understanding of new protection de-vices, complexity of PMHS testing and the lack of fullyvalidated human models have turned the attention of manyresearchers towards simple tests or models. Vehicle sledbucks were used in pedestrian PMHS tests by Snedekeret al. [20] to assess the pelvis and upper leg injury risk.While these simplified bucks reasonably approximated thegeometric characteristics of current vehicle front-ends, noinformation about a correlation with the vehicle stiffnesswas provided. To study the influence of the pre-impact po-sition of pedestrian arms on pedestrian head injury, Ogoet al. [14] developed a scaled human model and vehiclebuck. The values of head injury criteria (HIC) recorded inthe vehicle buck-to-dummy tests showed a significant vari-ation with respect to the arm pre-impact position. Neal et al.[13] developed a simplified buck FE model (rigid surfacesconnected by nonlinear springs) to predict the performanceof different vehicle front-end designs in pedestrian leg im-pact tests.
The objective of the current study was to design twoFE models of simplified vehicle bucks with geometricaland stiffness characteristics similar to those of a mid-sizesedan (MS) and a large-size sedan (LS). To show a possibleapplication of the buck FE models in the development ofnew measures for pedestrian protection, a numerical studyrelated to the influence of braking on the pedestrian kine-matics was performed.
2. Methods
The pedestrian kinematics during impact with a vehi-cle is influenced by inertial properties of the pedestrian
and by the vehicle–dummy interactions. These interactionloadings highly depend on the geometry and stiffness prop-erties of the front-end structures of the vehicle involved inthe crash. Since a pre-impact position of the dummy alongthe vehicle centreline has been used in previous vehicle-to-pedestrian dummy/PMHS tests [7,8], the vehicle geometryand stiffness properties along the centreline were used inthe current study for the development of MS and LS bucks.It was hypothesised that five vehicle components (1: lowerstiffener, 2: bumper, 3: hood leading edge and grille, 4:hood and 5: windshield) can reasonably approximate thefront-end of the vehicle during a pedestrian impact. Eachcomponent was designed as a combination of deformableparts connected to a rigid part. Since a physical fabricationof the pedestrian buck is ultimately planned, material selec-tion of the deformable components of the buck was basedon readily available materials: steel, expanded polypropy-lene particle (EPP) foam (JSP, Japan) and polypropylenefascia (Boedeker Plastics, TX, USA). The material prop-erties of the steel, plastic and glass components used inthe pedestrian buck models are reported in Table 1. Thesecomponents were modelled by shell elements with threeintegration points.
The nominal stress–strain curves of foam components(Figure 1) used in the pedestrian buck were obtained fromimpact tests with weight of 85 kg (EPP 20), 90 kg (EPP 100)and 200 kg (EPP 200) at 2.2 m/s initial velocities (avail-able at http://www.arproautomotive.com/tools/dynamic-impact.php) on cubic foam samples with lengths of100 mm (EPP 20) and 50 mm (EPP 100 and 200). The
Figure 1. Stress–strain curves of EPP foams used in pedestrianbucks.
Downloaded By: [Untaroiu, Costin D.] At: 11:53 15 November 2010

International Journal of Crashworthiness 493
foam components were modelled by solid elements withone-point integration and stiffness hourglass control.
The shape and locations of buck components were de-fined according to the exterior geometry of the MS and LSvehicles used in previous testing [7,8]. The material usedfor each deformable component of the buck was set basedon the stiffness characteristics of the corresponding vehi-cle component determined by FE simulations. Then, FEsimulations in the same conditions were run to calibrate thethickness of deformable parts of the bucks based on the timehistories of contact forces. Surface-to-surface contact types(0.05 – contact interface penalty [16]) were used to modelthe pedestrian/impactor-to-vehicle/bucks contacts with thefriction coefficient defined as 0.1 [27]. The time histories ofcontact forces were recorded at sampling rates of 0.1 ms andthen filtered with an SAE 180 class filter in all FE simula-tions. Detailed information about the development of eachvehicle component is provided in the following sections.
2.1. Development of an MS pedestrian buck
A pedestrian simulation was performed using the POLARII FE model [18,19] and the FE model of an MS vehicle inorder to determine the maximum level of dummy–vehicleforces during a 40 km/h impact. In addition to the upper-body kinematics of pedestrian recorded at specified loca-tions (head centre of gravity (CG), T1, T8, pelvis [29]),the time histories of resultant forces were calculated at thecontact regions of the dummy with four components (lowerstiffener, bumper, leading edge and grille, hood – Figure 2).
To determine the stiffness characteristics of the lowerstiffener and bumper, a cylindrical rigid impactor (220 mmlength, 120 mm diameter and 10 kg mass) was launchedfreely with a 40 km/h initial velocity towards the vehicleat the middle sections of the lower stiffener (Figure 3) andthen at the corresponding section of the bumper (Figure 4).The time histories of the resultant force in the impactorwere calculated during the simulations and then werenormalised with the sum of the highest forces calculatedin these components in the POLAR II–vehicle simulation.
Figure 2. Pedestrian–MS vehicle impact simulation: initial set-up.
Figure 3. FE impact simulations at lower stiffener location: (a)MS vehicle and (b) MS buck.
It was observed that the EPP foam and the fascia couldapproximate the stiffness characteristics of the lower stiff-ener and the bumper, respectively. While the section heightsof the chosen deformable components were approximatedfrom the vehicle cross-section [8], the other dimensionswere adjusted to match the stiffness curves of vehiclecomponents.
A cylindrical rigid impactor (350 mm length, 150 mmdiameter and 10 kg mass) was also used to determine thestiffness of the hood leading edge–grille region of the ve-hicle. The impactor was launched freely at 40 km/h withan angle of 40◦ towards the hood leading edge (Figure 5).The time histories of the resultant forces in the impactorwere calculated during the simulations and then were nor-malised with the sum of the highest forces calculated inthe hood leading edge and grille components in the PO-LAR II–vehicle simulation. After evaluating several dif-ferent potential solutions, it was determined that two EPPfoam parts (20 kg/m3 density) covered with a steel sheetcould reasonably represent the leading edge and the grillestiffness.
Because the stiffness of the hood varies from the leadingedge to the cowl, two locations were chosen to determine thehood stiffness, and then were used in the buck calibration:(1) the middle region at a wrap-around distance (WAD) =1200 mm – the location frequently struck by the dummyupper extremities and (2) the cowl region at WAD = 1500mm – the location often struck by the dummy shoulder orhead. The hood structure was modelled with a steel sheet
Figure 4. FE impact simulations at bumper location: (a) MSvehicle and (b) MS buck.
Downloaded By: [Untaroiu, Costin D.] At: 11:53 15 November 2010

494 C.D. Untaroiu et al.
Figure 5. FE impact simulations at hood leading edge location: (a) MS vehicle and (b) MS buck.
connected rigidly at the corners and EPP foam layers withdifferent thickness in the centre and in the cowl regions(Figure 6). A head impactor FE model developed by Un-taroiu et al. [28] and validated against static and dynamictests reported by Matsui and Tanahashi [10] was used inthe hood impact simulations (Figure 6). The head impactorwas launched freely at an impact angle of 65◦ in agreementwith the requirements of the International Organization forStandardization (ISO) and the European Enhanced Vehicle-Safety Committee (EEVC) protocols for a sedan-type ve-hicle [28]. The time histories of the resultant forces in theimpactor were calculated during the simulations and thenwere normalised with the maximum force calculated in thehood in the POLAR II–vehicle simulation.
To verify the MS buck model, an impact simulation wasperformed with the POLAR II FE dummy with a configu-ration matched to those used in the POLAR II–MS vehicle
simulation (Figure 2). A glass windshield similar to that ofthe MS vehicle was used in the MS buck. All mountingregions were rigidly connected to the buck frame, with thetotal mass adjusted to that of the actual MS vehicle. Thekinematics of the POLAR II and the reaction forces withthe buck were calculated and then compared with the corre-sponding data from the POLAR II–MS vehicle simulation.
2.2. Development of an LS pedestrian buck
A design approach similar to that used for the MS pedestrianbuck was utilised in the development of the LS pedestrianbuck. The geometry of the LS buck was approximated basedon the exterior contour of the LS vehicle [7]. FollowingKerrigan et al. [9], the rigid impactors were constrained tomove in the impact direction with a prescribed velocity of40 km/h. The stiffness curves obtained by FE simulations
Figure 6. Adult head impactor–hood FE simulations (a) at WAD = 1200 mm and (b) WAD = 1500 mm. (c) The mounting location ofhood to the rigid buck frame.
Downloaded By: [Untaroiu, Costin D.] At: 11:53 15 November 2010
International Journal of Crashworthiness 495
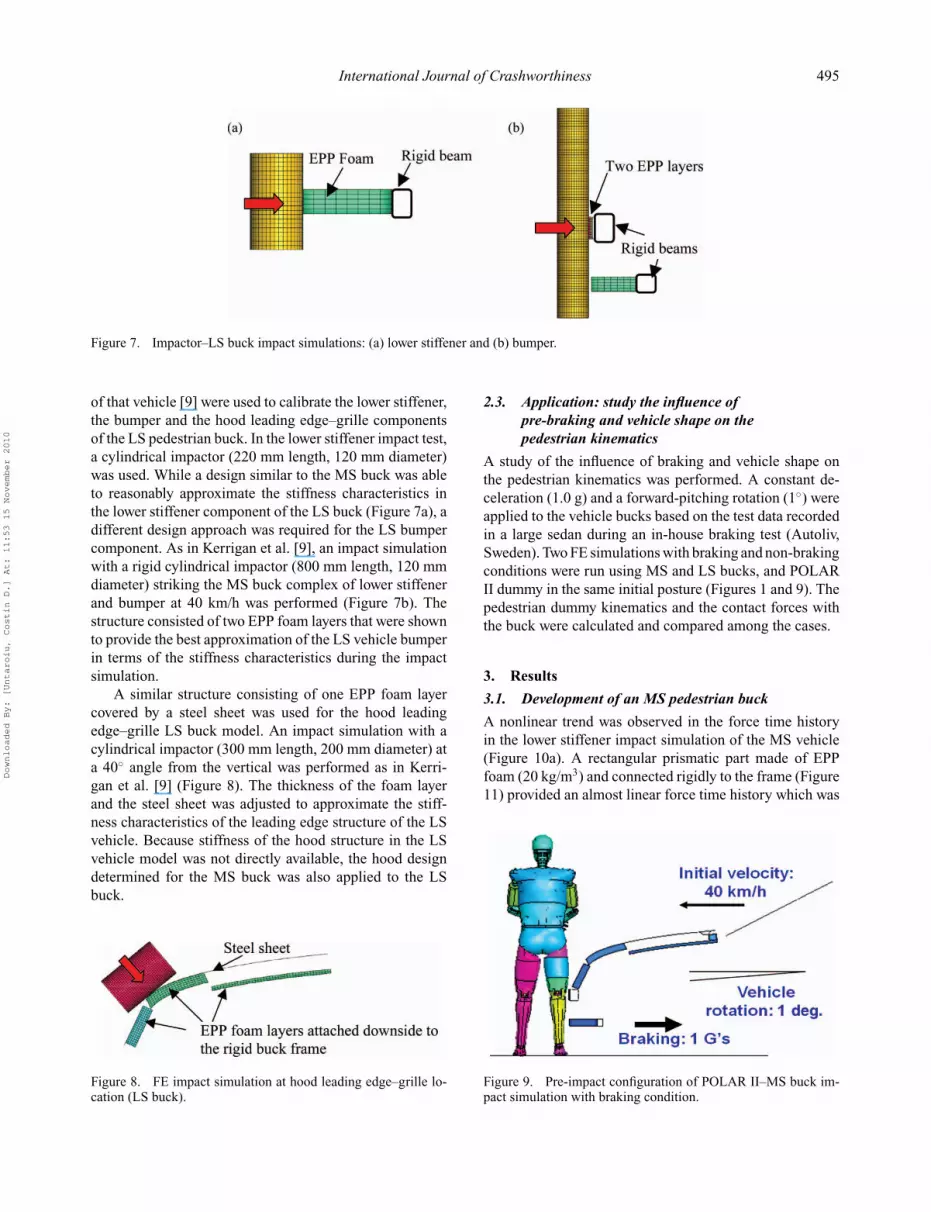
Figure 7. Impactor–LS buck impact simulations: (a) lower stiffener and (b) bumper.
of that vehicle [9] were used to calibrate the lower stiffener,the bumper and the hood leading edge–grille componentsof the LS pedestrian buck. In the lower stiffener impact test,a cylindrical impactor (220 mm length, 120 mm diameter)was used. While a design similar to the MS buck was ableto reasonably approximate the stiffness characteristics inthe lower stiffener component of the LS buck (Figure 7a), adifferent design approach was required for the LS bumpercomponent. As in Kerrigan et al. [9], an impact simulationwith a rigid cylindrical impactor (800 mm length, 120 mmdiameter) striking the MS buck complex of lower stiffenerand bumper at 40 km/h was performed (Figure 7b). Thestructure consisted of two EPP foam layers that were shownto provide the best approximation of the LS vehicle bumperin terms of the stiffness characteristics during the impactsimulation.
A similar structure consisting of one EPP foam layercovered by a steel sheet was used for the hood leadingedge–grille LS buck model. An impact simulation with acylindrical impactor (300 mm length, 200 mm diameter) ata 40◦ angle from the vertical was performed as in Kerri-gan et al. [9] (Figure 8). The thickness of the foam layerand the steel sheet was adjusted to approximate the stiff-ness characteristics of the leading edge structure of the LSvehicle. Because stiffness of the hood structure in the LSvehicle model was not directly available, the hood designdetermined for the MS buck was also applied to the LSbuck.
Figure 8. FE impact simulation at hood leading edge–grille lo-cation (LS buck).
2.3. Application: study the influence ofpre-braking and vehicle shape on thepedestrian kinematics
A study of the influence of braking and vehicle shape onthe pedestrian kinematics was performed. A constant de-celeration (1.0 g) and a forward-pitching rotation (1◦) wereapplied to the vehicle bucks based on the test data recordedin a large sedan during an in-house braking test (Autoliv,Sweden). Two FE simulations with braking and non-brakingconditions were run using MS and LS bucks, and POLARII dummy in the same initial posture (Figures 1 and 9). Thepedestrian dummy kinematics and the contact forces withthe buck were calculated and compared among the cases.
3. Results
3.1. Development of an MS pedestrian buck
A nonlinear trend was observed in the force time historyin the lower stiffener impact simulation of the MS vehicle(Figure 10a). A rectangular prismatic part made of EPPfoam (20 kg/m3) and connected rigidly to the frame (Figure11) provided an almost linear force time history which was
Figure 9. Pre-impact configuration of POLAR II–MS buck im-pact simulation with braking condition.
Downloaded By: [Untaroiu, Costin D.] At: 11:53 15 November 2010
496 C.D. Untaroiu et al.
0.000 0.005 0.010 0.015 0.0200.0
0.5
1.0
1.5
2.0
2.5
Nor
mal
ised
forc
e
Time (s)
(a)(b)
0.000 0.005 0.010 0.015 0.0200.0
0.2
0.4
0.6
Nor
mal
ised
forc
e
Time (s)
Mid-size sedan vehicle Mid-size sedan buck
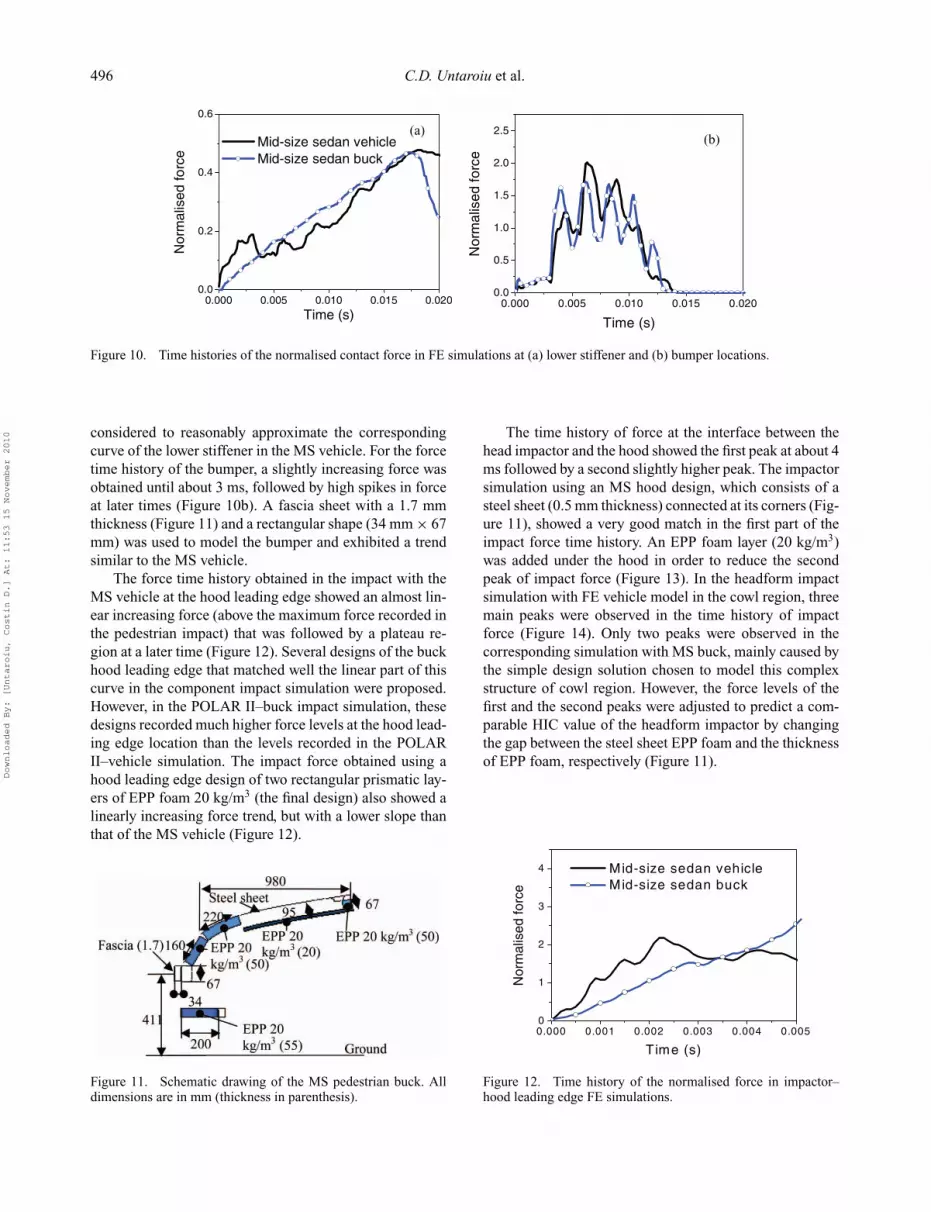
Figure 10. Time histories of the normalised contact force in FE simulations at (a) lower stiffener and (b) bumper locations.
considered to reasonably approximate the correspondingcurve of the lower stiffener in the MS vehicle. For the forcetime history of the bumper, a slightly increasing force wasobtained until about 3 ms, followed by high spikes in forceat later times (Figure 10b). A fascia sheet with a 1.7 mmthickness (Figure 11) and a rectangular shape (34 mm × 67mm) was used to model the bumper and exhibited a trendsimilar to the MS vehicle.
The force time history obtained in the impact with theMS vehicle at the hood leading edge showed an almost lin-ear increasing force (above the maximum force recorded inthe pedestrian impact) that was followed by a plateau re-gion at a later time (Figure 12). Several designs of the buckhood leading edge that matched well the linear part of thiscurve in the component impact simulation were proposed.However, in the POLAR II–buck impact simulation, thesedesigns recorded much higher force levels at the hood lead-ing edge location than the levels recorded in the POLARII–vehicle simulation. The impact force obtained using ahood leading edge design of two rectangular prismatic lay-ers of EPP foam 20 kg/m3 (the final design) also showed alinearly increasing force trend, but with a lower slope thanthat of the MS vehicle (Figure 12).
Figure 11. Schematic drawing of the MS pedestrian buck. Alldimensions are in mm (thickness in parenthesis).
The time history of force at the interface between thehead impactor and the hood showed the first peak at about 4ms followed by a second slightly higher peak. The impactorsimulation using an MS hood design, which consists of asteel sheet (0.5 mm thickness) connected at its corners (Fig-ure 11), showed a very good match in the first part of theimpact force time history. An EPP foam layer (20 kg/m3)was added under the hood in order to reduce the secondpeak of impact force (Figure 13). In the headform impactsimulation with FE vehicle model in the cowl region, threemain peaks were observed in the time history of impactforce (Figure 14). Only two peaks were observed in thecorresponding simulation with MS buck, mainly caused bythe simple design solution chosen to model this complexstructure of cowl region. However, the force levels of thefirst and the second peaks were adjusted to predict a com-parable HIC value of the headform impactor by changingthe gap between the steel sheet EPP foam and the thicknessof EPP foam, respectively (Figure 11).
0.000 0.001 0.002 0.003 0.004 0.0050
1
2
3
4
Nor
mal
ised
forc
e
T ime (s)
Mid-size sedan vehicle Mid-size sedan buck
Figure 12. Time history of the normalised force in impactor–hood leading edge FE simulations.
Downloaded By: [Untaroiu, Costin D.] At: 11:53 15 November 2010
International Journal of Crashworthiness 497
0.000 0.004 0.008 0.012 0.016 0.0200.0
0.5
1.0
1.5
2.0
2.5N
orm
alis
ed f
orce
Time (s)
Mid-size sedan vehicle Mid-size sedan buck
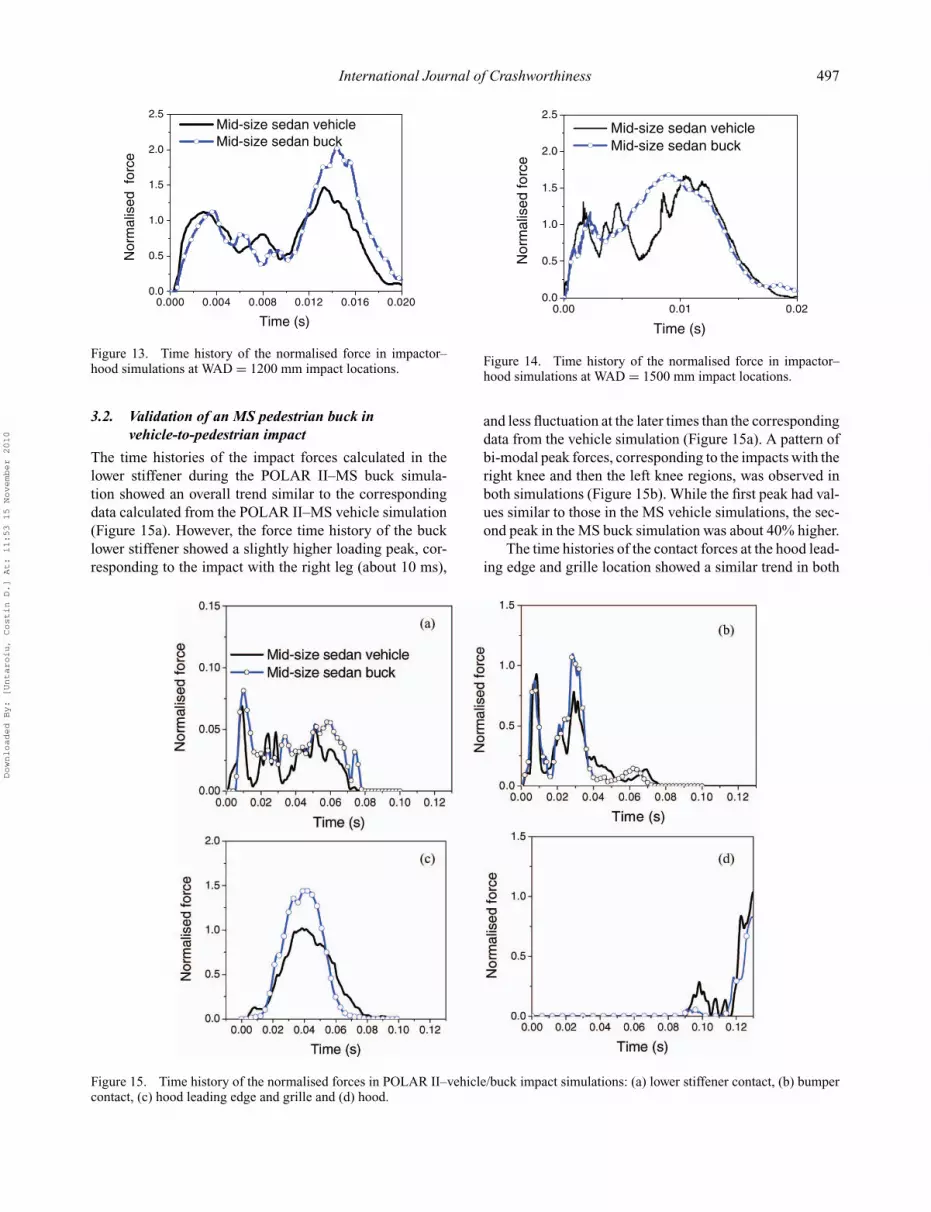
Figure 13. Time history of the normalised force in impactor–hood simulations at WAD = 1200 mm impact locations.
3.2. Validation of an MS pedestrian buck invehicle-to-pedestrian impact
The time histories of the impact forces calculated in thelower stiffener during the POLAR II–MS buck simula-tion showed an overall trend similar to the correspondingdata calculated from the POLAR II–MS vehicle simulation(Figure 15a). However, the force time history of the bucklower stiffener showed a slightly higher loading peak, cor-responding to the impact with the right leg (about 10 ms),
0.00 0.01 0.020.0
0.5
1.0
1.5
2.0
2.5
Nor
mal
ised
forc
e
Time (s)
Mid-size sedan vehicle Mid-size sedan buck
Figure 14. Time history of the normalised force in impactor–hood simulations at WAD = 1500 mm impact locations.
and less fluctuation at the later times than the correspondingdata from the vehicle simulation (Figure 15a). A pattern ofbi-modal peak forces, corresponding to the impacts with theright knee and then the left knee regions, was observed inboth simulations (Figure 15b). While the first peak had val-ues similar to those in the MS vehicle simulations, the sec-ond peak in the MS buck simulation was about 40% higher.
The time histories of the contact forces at the hood lead-ing edge and grille location showed a similar trend in both
Figure 15. Time history of the normalised forces in POLAR II–vehicle/buck impact simulations: (a) lower stiffener contact, (b) bumpercontact, (c) hood leading edge and grille and (d) hood.
Downloaded By: [Untaroiu, Costin D.] At: 11:53 15 November 2010

498 C.D. Untaroiu et al.
Figure 16. POLAR II dummy kinematics during the impact with (a) mid-size sedan vehicle FE model and (b) mid-size sedan buck FEmodel.
vehicle and buck simulations with a uniformly increasingforce response during pelvis loading and a decreasing forceduring the rebound of the pelvis (after 30–50 ms). How-ever, the peak force in the hood leading edge and the grillewas higher in the MS buck simulation than in the MS vehi-cle simulation (Figure 15c). The contact between the upperextremities and the hood occurred at the last part of thedummy–MS vehicle (buck) impact simulations. The timehistories of the hood contact showed a similar trend in thevehicle and buck simulations, with slightly lower values inthe buck simulation (Figure 15d).
The overall kinematics of the dummy during the impactwith the MS buck model showed a good visual correlationwith the corresponding data from the MS vehicle impactsimulation (Figure 16). However, at 120 and 130 ms it was
observed that the right leg and the pelvis exhibited highervertical displacements in the MS buck simulation than in theMS vehicle simulation, probably caused by a higher levelof impact force recorded in the dummy–MS buck leadingedge contact (Figure 15c).
3.3. Development of an LS pedestrian buck
The design of the MS lower stiffener was also used in theLS buck design (Figure 17). The time history curves ofthe LS vehicle and the buck (Figure 18a) at a lower stiff-ener location have different trends (linear in LS buck andnonlinear in LS vehicle), but relatively small differenceswere observed up to 1.5 kN, a level higher than that ob-served in the pedestrian–vehicle impacts (about 1 kN in MS
Downloaded By: [Untaroiu, Costin D.] At: 11:53 15 November 2010
International Journal of Crashworthiness 499
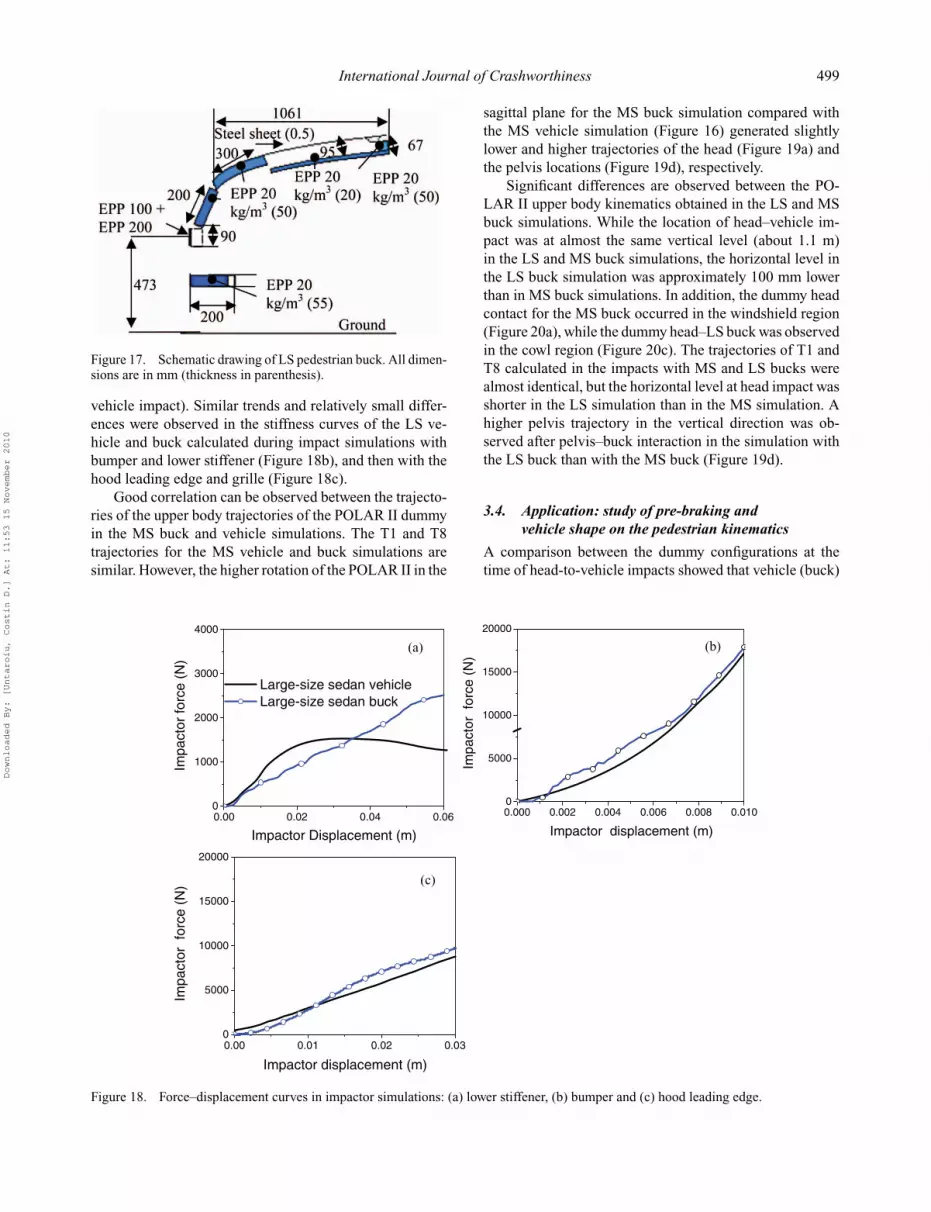
Figure 17. Schematic drawing of LS pedestrian buck. All dimen-sions are in mm (thickness in parenthesis).
vehicle impact). Similar trends and relatively small differ-ences were observed in the stiffness curves of the LS ve-hicle and buck calculated during impact simulations withbumper and lower stiffener (Figure 18b), and then with thehood leading edge and grille (Figure 18c).
Good correlation can be observed between the trajecto-ries of the upper body trajectories of the POLAR II dummyin the MS buck and vehicle simulations. The T1 and T8trajectories for the MS vehicle and buck simulations aresimilar. However, the higher rotation of the POLAR II in the
sagittal plane for the MS buck simulation compared withthe MS vehicle simulation (Figure 16) generated slightlylower and higher trajectories of the head (Figure 19a) andthe pelvis locations (Figure 19d), respectively.
Significant differences are observed between the PO-LAR II upper body kinematics obtained in the LS and MSbuck simulations. While the location of head–vehicle im-pact was at almost the same vertical level (about 1.1 m)in the LS and MS buck simulations, the horizontal level inthe LS buck simulation was approximately 100 mm lowerthan in MS buck simulations. In addition, the dummy headcontact for the MS buck occurred in the windshield region(Figure 20a), while the dummy head–LS buck was observedin the cowl region (Figure 20c). The trajectories of T1 andT8 calculated in the impacts with MS and LS bucks werealmost identical, but the horizontal level at head impact wasshorter in the LS simulation than in the MS simulation. Ahigher pelvis trajectory in the vertical direction was ob-served after pelvis–buck interaction in the simulation withthe LS buck than with the MS buck (Figure 19d).
3.4. Application: study of pre-braking andvehicle shape on the pedestrian kinematics
A comparison between the dummy configurations at thetime of head-to-vehicle impacts showed that vehicle (buck)
0.00 0.02 0.04 0.060
1000
2000
3000
4000
Impa
ctor
forc
e (N
)
Impactor Displacement (m)
Large-size sedan vehicle Large-size sedan buck
0.000 0.002 0.004 0.006 0.008 0.0100
5000
10000
15000
20000
Impa
ctor
for
ce (
N)
Impactor displacement (m)
0.00 0.01 0.02 0.030
5000
10000
15000
20000
Impa
ctor
for
ce (
N)
Impactor displacement (m)
(a) (b)
(c)
Figure 18. Force–displacement curves in impactor simulations: (a) lower stiffener, (b) bumper and (c) hood leading edge.
Downloaded By: [Untaroiu, Costin D.] At: 11:53 15 November 2010

500 C.D. Untaroiu et al.
Figure 19. Comparisons of POLAR II upper body trajectories during the impacts with mid-size sedan vehicle, mid-size sedan buck andlarge-size sedan buck: (a) head, (b) T1, (c) T8 and (d) pelvis.
shapes and braking conditions have a significant influ-ence on the head-to-vehicle contact locations (Figure 20)and to the velocity of dummy head relative to the vehi-cle (buck) (Figure 21). The contact points of the head-to-
vehicle impacts were located in the MS windshield regions(Figures 20a, b) and the LS cowl regions (Figures 20c, d) forboth the braking and no-braking conditions. However, thebraking conditions introduced a delay in the head contact
Figure 20. POLAR II–pedestrian buck configurations at the time of head–vehicle impacts: (a) mid-size buck, (b) mid-size buck withbraking, (c) large-size buck and (d) large-size buck with braking.
Downloaded By: [Untaroiu, Costin D.] At: 11:53 15 November 2010

International Journal of Crashworthiness 501
0.150.100.050.00
7
8
9
10
11
12
13
14H
ead
rela
tive
velo
city
(m
/s)
Time (s)
Mid-size buck Mid-size buck braking Large-size buck Large-size buck braking
Figure 21. Head velocity relative to the MS/LS bucks inbraking/non-braking conditions.
time and generated an increase in the WADs: 52 mm and28 mm in the MS and LS buck impacts, respectively. In ad-dition, both vehicle/buck shape and the braking conditionsinfluenced the head velocities relative to the vehicle/buck(Figure 21). The velocity of the head relative to the vehiclewas lower in the LS simulations than that in the MS impactsimulations and in the braking than non-braking conditions(Figure 21).
4. Discussion
In addition to the pedestrian impactor tests used currentlyin regulations and consumer tests for the pedestrian safety,the pedestrian dummy-to-vehicle impact test is a comple-mentary way of investigating pedestrian protection. Giventhe high cost of experimentally testing a large number ofvehicle front-end concepts, an alternative solution could bereplacing the vehicle front end with a pedestrian buck thatallows simple design changes in terms of vehicle shape andcomponent stiffness parameters.
The design of two generic pedestrian bucks (MS andLS configurations), which can reasonably replicate the be-haviour of sedan front ends in a pedestrian impact, wasproposed in the current study. The simplified structures ofbuck components were designed based on geometrical andstiffness properties of main front-end vehicle structures:lower stiffener, bumper, hood leading edge and grille, hoodand windshield.
The lower stiffener is located below the bumper systemand prevents the pedestrian’s leg from moving underneaththe vehicle. Its main role for pedestrian interactions is toreduce the risk of severe knee joint injuries such as ligamentruptures by limiting the knee-bend angle [17]. An EPP foam(20 kg/m3) component with a prismatic shape (55 mm ×200 mm in cross-section) was chosen in the buck design.The force time histories and stiffness curves of the vehiclelower stiffeners showed usually a nonlinear increasing trendin impactor tests, in contrast to linear trend observed in the
lower stiffener of the buck. However, the time history oflower stiffener force in dummy–MS buck simulation hada trend similar to the corresponding data from MS vehicleimpact, but slightly higher peaks values were observed. Al-though the lower stiffener component have a low influenceon the pedestrian kinematics (especially on upper body) bylow load applied during the impact (under 1 kN), futurestudies may try to improve the current design, especially ifthe buck will be used in prevention studies of lower extrem-ities injuries.
The bumper is the first vehicle component to contact thepedestrian and the impact force may record relatively highpeaks (above 10kN). The bumper system in sedan vehiclesusually consists of an energy absorber component (bumpercover, deformable foam etc.) in front of a semi-rigid beam.A fascia (1.7 mm thickness) connected to a rigid beamapproximated the MS bumper up to the maximum forceobserved in the dummy–MS simulation. In addition, thetime histories of the bumper force in the dummy–MS bucksimulation showed similar trends and values as the MS ve-hicle simulation. The higher peak values predicted at 30ms may be caused by the higher stiffness of buck bumperat larger deformations. The stiffness of the LS bumpershowed an increasing trend, which was well matched us-ing a two-layer bumper design (EPP foams with densities of100 and 200 kg/m3, respectively). Although current designsof buck bumpers showed to approximate well the stiffnessproperties of vehicle bumpers modelled in this study, bet-ter designs can be obtained using optimisation techniques[24,25,27,28].
The leading edge of the hood is the vehicle componentthat usually contacts the pelvis of adult pedestrian duringthe impact. Depending on its position relative to the hipjoint, the pelvis can slide along the hood or can be pinnedat the contact point [7,26,29]. Because the pelvis-to-vehiclecontact shows a complex behaviour, the design of this re-gion was the most challenging task of the pedestrian buckdesigns. After trying several design concepts, it was de-cided that a design consisting of two low density foam EPP(20 kg/m3), which approximate the shape of the hood lead-ing edge and the grille, reasonably replicates this vehiclecomponent response in the buck designs. The time historyof the MS buck force shows a linear trend relatively close tothe curve obtained from the MS vehicle impact which hasan initial slope followed by a plateau region. However, theresults of the dummy–MS buck simulation showed a higherstiffness for the MS buck in the contact with the dummypelvis, especially in the grille region. While the hood lead-ing edge and the grille of the MS buck was softer thanthe corresponding structures of MS vehicle in the impactortest, this finding suggests that the leading edge impactor testmay poorly approximate the conditions of a dummy pedes-trian impact. Therefore, a new impactor test or even thewhole dummy–vehicle simulation should be used for a bet-ter stiffness calibration of this region in a future pedestrian
Downloaded By: [Untaroiu, Costin D.] At: 11:53 15 November 2010
502 C.D. Untaroiu et al.
buck design. The stiffness curve, obtained from the impactbetween the constrained impactor with a constant impactvelocity (40 km/h) and the hood leading edge–grille com-ponent of the buck, showed a trend similar to the stiffnesscurve reported by Kerrigan et al. [9].
A steel sheet rigidly connected to the buck structure atits corners with one EPP foam layer showed to approximatewell the hood and engine room behaviour during impactsimulations with adult headform impactor at both middleand upper regions. Although the hood contact force in theMS vehicle and MS buck showed a good correlation withthe corresponding data from the POLAR II–MS vehiclesimulation, the level of force between shoulder and hoodwas low because the head impacted the windshield. There-fore, future studies of MS vehicle impacts with a dummyhaving a different anthropometry (e.g. the fifth female usedin Untaroiu et al. [29]) may be used to verify the hooddesign of buck in a dummy–vehicle simulation.
Because previous pedestrian studies have investigatedthe pedestrian kinematics until the head-to-vehicle contact[7,8], the windshield was included as a buck component, butstiffness studies of this component were not performed inthe current study. FE models of the buck may be improvedin future studies by using recently developed material modelof laminated glass [23] when dynamic test data of the sedanwindshields will be available.
A parametric study using the same dummy FE model,but different buck shapes (MS and LS), showed a possibleapplication of buck models in the study of an automaticbraking system for reducing pedestrian injuries. While thepre-braking condition showed reductions in the relative ve-locity of head with the vehicle at the head–vehicle im-pact and increase in the pedestrian WAD, the vehicle shapeshowed a significant influence on the head velocity rela-tive to vehicle and the vehicle component impacted by thepedestrian head. More parametric studies should be carriedout in the future, with different braking parameters, anddummy anthropometries in order to investigate the con-tributions of various factors on pedestrian kinematics. Thesimplified FE models of vehicle can easily be used in differ-ent optimisation studies of vehicle shape and stiffness andrestraint systems for pedestrian protection [28]. In addition,a physical buck developed based on the design conceptsof this study may be manufactured and used to validatethe new pedestrian protection design in dummy–pedestrianbuck crashes.
5. Conclusions
This numerical study showed that a simplified pedes-trian buck consisting of five components – lower stiffener,bumper, hood leading edge–grille, hood and windshield– can reasonably approximate the vehicle front structuresduring the lateral impact of a POLAR II dummy. The ge-ometries of the buck FE models were developed accordingto the contour–cross-sections corresponding to a mid-size
and a large-size sedan used in previous vehicle-to-dummyand PMHS tests. The material properties of current poly-meric products were used for the FE models of the buckcomponents in order to allow manufacturing a physical im-plementation of the generic pedestrian buck in the future.Simulations of interactions between impactors and vehiclecomponent were performed to correlate the dynamic stiff-ness of buck components with the corresponding data ofvehicle models. In a parametric study using FE models ofPOLAR II dummy and pedestrian bucks, it was shown thatthe vehicle braking conditions reduce the relative velocityof the head to the vehicle (about 6.9%–8.6%) and increasethe time of head impact (about 7.1%–8.7%) and WADs toprimary head contacts (about 1.4%–2.6%). In addition, dif-ferent buck shapes (e.g. MS and LS bucks) showed a highersensitivity to pedestrian kinematics (e.g. relative head im-pact velocity) than to the braking conditions over the rangeof conditions examined in this study. The pedestrian buckmodels developed in the current study may be used for fu-ture optimisation studies of various pedestrian protectionsystems (e.g. airbags, pop-up hood and automatic braking)and in manufacturing a physical pedestrian buck, whichcould, in turn, be used to evaluate pedestrian protectionsystems.
References[1] A. Akiyama, M. Okamoto, and N. Rangarajan, Develop-
ment and application of the new pedestrian dummy, Pro-ceedings of the 17th International Technical Conference onthe Enhanced Safety of Vehicles (ESV), Amsterdam, TheNetherlands, Paper 463, 2001.
[2] A. Akiyama, S. Yoshida, T. Matsuhashi, S. Moss, M. Sal-loum, H. Ishikawa, and A. Konosu, Development of human-like pedestrian dummy, Paper 9934546, Japanese Society ofAutomotive Engineers, Chiyoda-Ku, Tokyo, Japan, 1999.
[3] J. Crandall, K. Wiley, D. Longhitano, and A. Akiyama, De-velopment of performance specifications for a pedestrianresearch dummy, Proceedings of the 19th International Tech-nical Conference on the Enhanced Safety of Vehicles (ESV),Washington D.C., USA, Paper 389, 2005.
[4] European Union, Directive 2003/102/EC of the EuropeanParliament and of the Council of 17 November 2003 relat-ing to the protection of pedestrians and other vulnerableroad users before and in the event of a collision with a mo-tor vehicle and amending Council Directive 70/156/EEC.Brussels, Official Journal of the European Union, 2003.
[5] European Union, Regulation (EC) No 78/2009 of the Eu-ropean Parliament and of the Council of 14 January 2009on the type-approval of motor vehicles with regard to theprotection of pedestrians and other vulnerable road users,amending Directive 2007/46/EC and repealing Directives2003/102/EC and 2005/66/EC. Strasbourg, Official Journalof the European Union, 2009.
[6] R. Fredriksson, Y. Haland, and J. Yang, Evaluation of a newpedestrian head injury protection system with a sensor inthe bumper and lifting of the Bonnet’s rear part, 17th ESVConference, Amsterdam, Netherlands, 2001.
[7] J.R. Kerrigan, J.R. Crandall, and B. Deng, Pedestrian kine-matic response to mid-sized vehicle impact, Int. J. VehicleSafety 2 (2007), pp. 221–240.
Downloaded By: [Untaroiu, Costin D.] At: 11:53 15 November 2010
International Journal of Crashworthiness 503
[8] J.R. Kerrigan, D. Murphy, C. Drinkwater, C. Kam, D. Bose,and J.R. Crandall, Kinematic corridors for PMHS testedin full-scale pedestrian impact tests, Proceedings of 19thInternational Technical Conference on the Enhanced Safetyof Vehicles (ESV), Washington D.C., USA, Paper 05-0394,2005.
[9] J.R. Kerrigan, D. Parent, C. Untaroiu, J.R. Crandall, andB. Deng, New approach to multi-body model development:Pedestrian lower extremity, Traffic Inj. Prev. 10 (2009), pp.386–397.
[10] Y. Matsui and M. Tanahashi, Development of JAMA-JARIpedestrian headform impactor in compliance with ISO andIHRA standards, Int. J. Crashworthiness 9 (2004), pp. 129–139.
[11] Y. Mizuno, Development and process of the pedestrian safetyglobal technical regulation, Rev. Automotive Eng. (JSAE)29 (2008), pp. 43–48.
[12] National Highway Traffic Safety Administration (NHTSA),Traffic Safety Facts 2007. DOT HS 811 017, 2009.
[13] M.O. Neal, J. Tu, and D. Jones, A response surface basedtool for evaluating vehicle performance in the pedestrian legimpact test, SAE Congress, Paper 2008-01-1244, 2008.
[14] Y. Ogo, H. Sakai, and T. Maki, Influence of the arms onpedestrian head injury at the time of vehicle collision, JSAERev. Automotive Eng. 30 (2009), pp. 85–90.
[15] Y. Okamoto, A. Akiyama, M. Okamoto, and Y. Kikuchi, Astudy of the upper leg component tests compared with pedes-trian dummy tests, Proceedings of the 17th InternationalTechnical Conference on the Enhanced Safety of Vehicles(ESV), Amsterdam, The Netherlands, Paper 380, 2001.
[16] Pam System International, PAM-CRASH/PAM-SAFE Refer-ence Manual, Version 2001, 2001.
[17] P. Schuster, Current trends in bumper design for pedestrianimpact, Proceedings of the 2006 SAE World Congress, 2006.
[18] J. Shin, S. Lee, J.R. Kerrigan, K. Darvish, J.R. Crandall,A. Akiyama, Y. Takahashi, M. Okamoto, and Y. Kikuchi,Development and validation of a finite element model forthe POLAR II upper body, Soc. Automotive Eng. (2006),Paper 2006-01-0684.
[19] J. Shin, C.D. Untaroiu, J.R. Kerrigan, J.R. Crandall, D. Subit,Y. Takahashi, A. Akiyama, Y. Kikuchi, and D. Longitano,Investigating pedestrian kinematics with the POLAR II finiteelement model, Soc. Automotive Eng. (2007), Paper 2007-01-0756.
[20] J.G. Snedeker, F.H. Walz, M.H. Muser, C. Lanz, and G.Schroeder, Assessing femur and pelvis injury risk in car–pedestrian collisions: Comparison of full body PMTO im-
pacts, and a human body finite element model, Proceedingsof the 19th Conference on the Enhanced Safety of Vehicles(ESV), Washington DC, USA, Paper 05-0130, 2005.
[21] Y. Takahashi, Y. Kikuchi, M. Okamoto, A. Akiyama, J. Ivars-son, D. Bose, D. Subit, J. Shin, and J.R. Crandall, Biofi-delity evaluation for the knee and leg of the polar pedes-trian dummy, Proceedings of the 19th International Techni-cal Conference on the Enhanced Safety of Vehicles (ESV),Washington DC, USA, Paper 05-0280, 2005.
[22] Y. Takahashi, M. Okamoto, Y. Kikuchi, and A. Akyiama,Injury threshold and a measurement technique for thighand leg of a pedestrian dummy, IRCOBI Conference, Bern,Switzerland, 2008.
[23] M. Timmel, S. Kolling, P. Osterrieder, and P.A. Du Bois, Afinite element model for impact simulation with laminatedglass, Int. J. Impact Eng. 34 (2007), pp. 1465–1478.
[24] C.D. Untaroiu, A numerical investigation of mid-shaftfemoral injury tolerance in axial compression and bendingloading, Int. J. Crashworthiness 15 (2010), pp. 83–92.
[25] C.D. Untaroiu, J.R. Crandall, Y. Takahashi, M. Okamoto,O. Ito, and R. Fredriksson, Analysis of running child pedes-trians impacted by a vehicle using rigid-body models andoptimization techniques, Saf. Sci. 48 (2010), pp. 259–267.
[26] C.D. Untaroiu, J.R. Kerrigan, C. Kam, J.R. Crandall, K.Yamazaki, K. Fukuyama, K. Kamiji, T. Yasuki, and J. Funk,Correlation of strain and loads measured in the long boneswith observed kinematics of the lower limb during vehicle–pedestrian impacts, Stapp Car Crash J. 51 (2007), pp. 433–466.
[27] C.D. Untaroiu, M. Meissner, J.R. Crandall, Y. Takahashi,M. Okamoto, and O. Ito, Crash reconstruction of pedestrianaccidents using optimization techniques, Int. J. Impact Eng.36 (2009), pp. 210–219.
[28] C.D. Untaroiu, J. Shin, and J.R. Crandall, A design optimiza-tion approach of vehicle hood for pedestrian protection, Int.J. Crashworthiness 12 (2007), pp. 581–589.
[29] C.D. Untaroiu, J. Shin, J. Ivarsson, J.R. Crandall, D. Subit,Y. Takahashi, A. Akiyama, and Y. Kikuchi, A study of thepedestrian impact kinematics using finite element dummymodels: the corridors and dimensional analysis scaling ofupper-body trajectories, Int. J. Crashworthiness 13 (2008),pp. 469–478.
[30] Y. Youn, S. Kim, C. Oh, M. Shin, and C. Lee, Research andrule-making activities on pedestrian protection in Korea,Proceedings of the 19th International Technical Conferenceon the Enhanced Safety of Vehicles (ESV), Washington DC,United States, Paper 05-0117, 2005.
Downloaded By: [Untaroiu, Costin D.] At: 11:53 15 November 2010