symptomatic intracranial hemorrhage after stroke thrombolysis: the sedan score
TRANSCRIPT
Symptomatic intracranial hemorrhage
after stroke thrombolysis:
the SEDAN Score
Daniel Strbian, MD, PhD
Department of Neurology, Helsinki University Hospital
Helsinki, Finland
Atte Meretoja
Satu Mustanoja
Tiina Sairanen
Nina Forss
Markku Kaste
Turgut Tatlisumak
Basel, Switzerland
Stefan Engelter
Frank J Ahlhelm
Philippe Lyrer
Lausanne, Switzerland
Patrik Michel
Maria Cordier
Geneva, Switzerland
Lucka Sekoranja
Igor Kuzmanovic
Outline of the presentation
Background information
Developing the score
The score in the validation cohort
Internal cross-validation
External validation
Comparison with other scores
Summary and Implications
| background | developing the score | validation cohort | internal cross-validation | external validation | comparison | summary
tPA for ischemic stroke
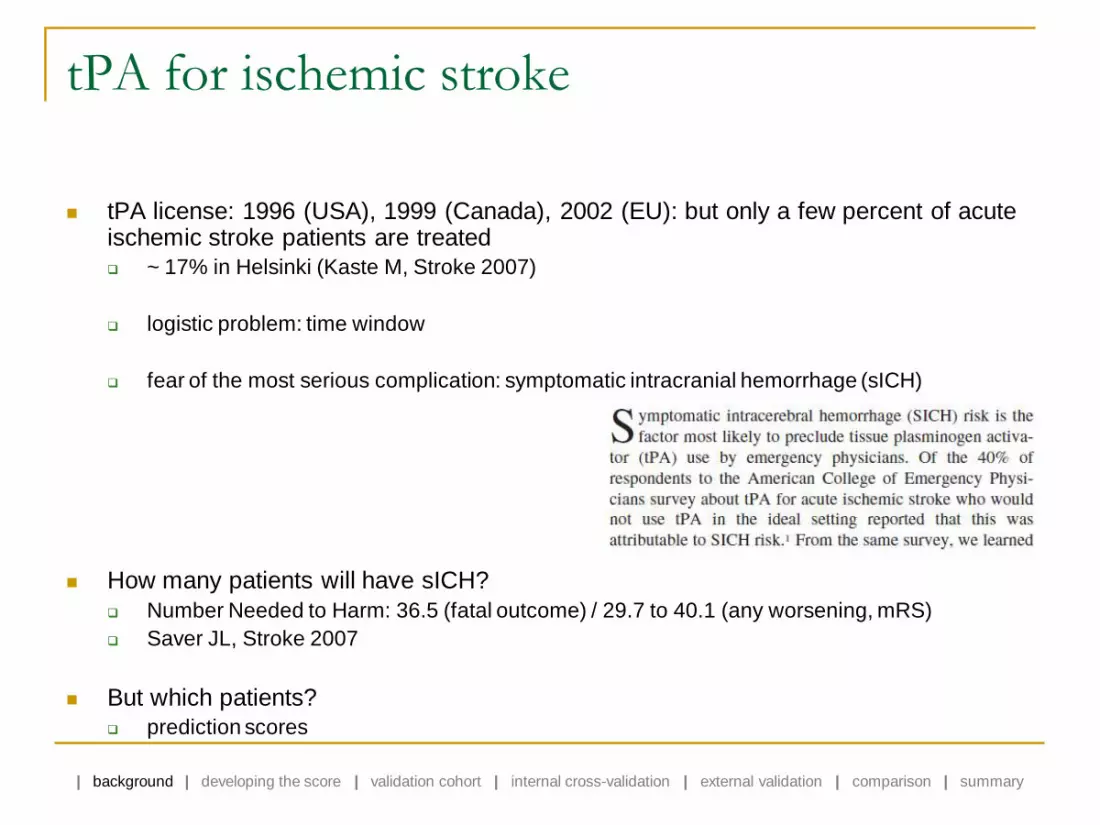
tPA license: 1996 (USA), 1999 (Canada), 2002 (EU): but only a few percent of acute ischemic stroke patients are treated
~ 17% in Helsinki (Kaste M, Stroke 2007)
logistic problem: time window
fear of the most serious complication: symptomatic intracranial hemorrhage (sICH)
How many patients will have sICH?
Number Needed to Harm: 36.5 (fatal outcome) / 29.7 to 40.1 (any worsening, mRS)
Saver JL, Stroke 2007
But which patients?
prediction scores
| background | developing the score | validation cohort | internal cross-validation | external validation | comparison | summary

Developing the score
Based on easily assessable variables
Applicable on / shortly after admission, prior to administration of iv tPA
Helsinki University Central Hospital
1104 consecutive ischemic stroke patients treated with iv tPA (1995-2008)
excluded: patients with basilar artery occlusion (n=119): very different protocol
the score was tested separately in this cohort
excluded: patients that underwent endovascular treatment (n=11): beyond the focus
final cohort: 974 patients
| background | developing the score | validation cohort | internal cross-validation | external validation | comparison | summary

Developing the score – Imaging & Criteria
Baseline CT head scan: all patients
Follow-up imaging
routinely at 24 hours post tPA
whenever hemorrhage was suspected
CT: 940 / MRI: 20 / both: 14
Neuroradiologist: radiological ICH subtypes (HI-1, HI-2, PH-1, PH-2)
Stroke neurologist (without knowledge of patients’ 3-month outcome) classified sICH according to the ECASS-II criteria:
any hemorrhage (HI-1, HI-2, PH-1, PH-2)
clinical deterioration causing an increase in the NIHSS score of ≥ 4 points
time window: 7 days
the hemorrhage was likely to be the cause of the clinical deterioration
in case of doubt regarding whether edema or hemorrhage was the leading pathology, an association of the hemorrhage with the deterioration was assumed
| background | developing the score | validation cohort | internal cross-validation | external validation | comparison | summary
Developing the score – Statistics
Univariate comparison of patients with and without sICH
the Mann-Whitney Rank Sum test or the Pearson χ2 test
Variables were entered into the logistic regression model based on univariate
associations (p<0.10)
Backward logistic regression with a stepwise removal of p<0.10
Various combinations of cut-off values of continuous baseline parameters
improvement of the model? (area under ROC curve)
Calibration of the model: the Hosmer-Lemeshow test
| background | developing the score | validation cohort | internal cross-validation | external validation | comparison | summary
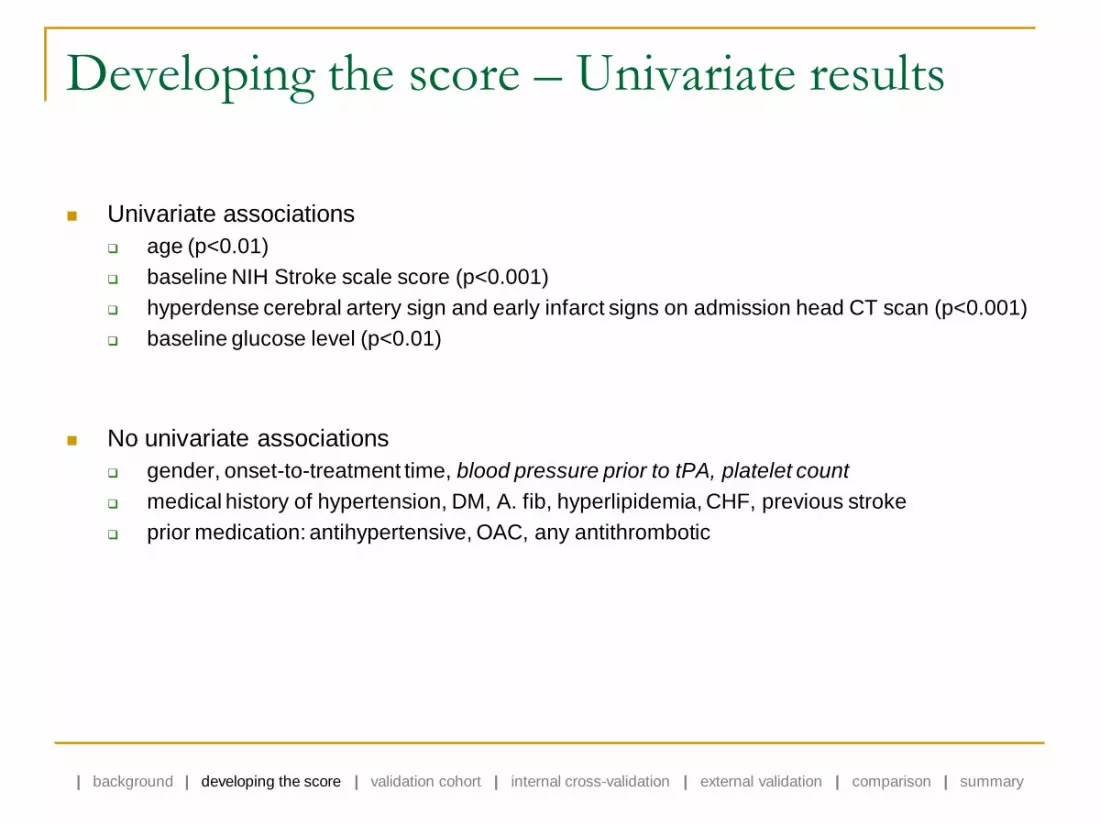
Developing the score – Univariate results
Univariate associations
age (p<0.01)
baseline NIH Stroke scale score (p<0.001)
hyperdense cerebral artery sign and early infarct signs on admission head CT scan (p<0.001)
baseline glucose level (p<0.01)
No univariate associations
gender, onset-to-treatment time, blood pressure prior to tPA, platelet count
medical history of hypertension, DM, A. fib, hyperlipidemia, CHF, previous stroke
prior medication: antihypertensive, OAC, any antithrombotic
| background | developing the score | validation cohort | internal cross-validation | external validation | comparison | summary
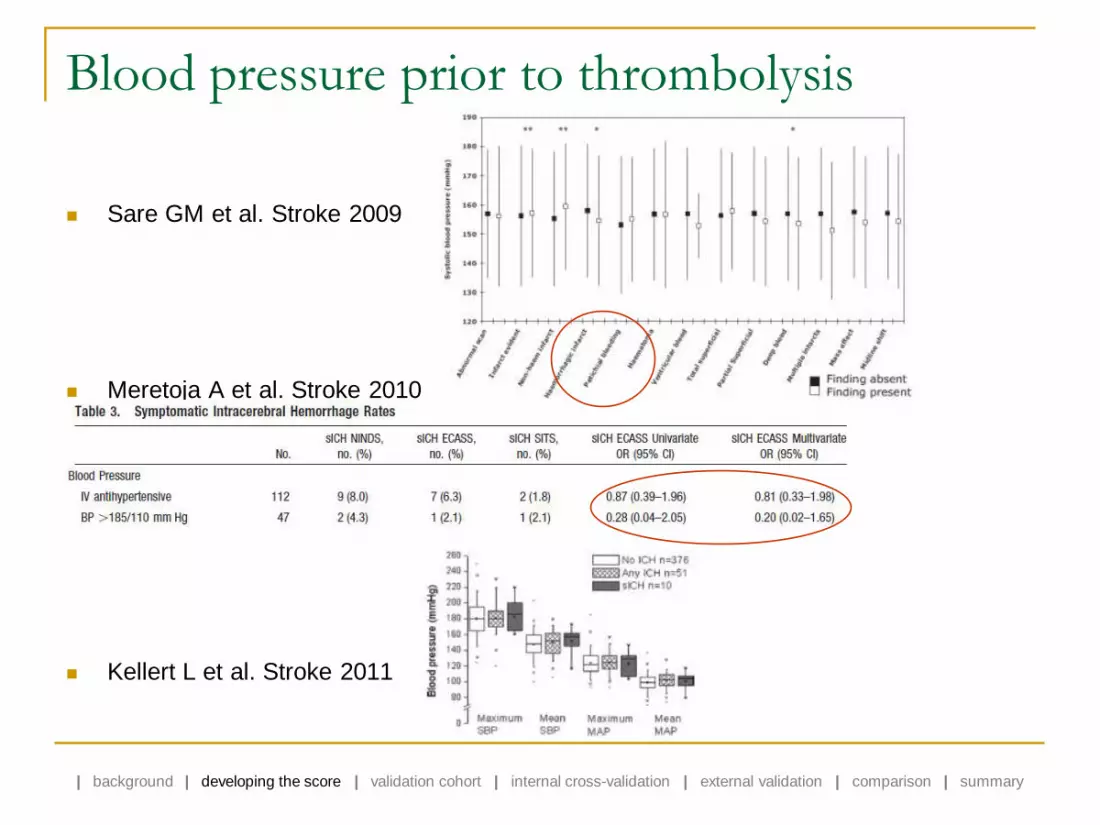
Blood pressure prior to thrombolysis
Sare GM et al. Stroke 2009
Meretoja A et al. Stroke 2010
Kellert L et al. Stroke 2011
| background | developing the score | validation cohort | internal cross-validation | external validation | comparison | summary

Blood pressure following thrombolysis Yong M & Kaste M. Stroke 2008
Ahmed N et al. Stroke 2009
unsignificant
significant Δ 0-24t
unsignificant
significant Δ 0-24t, Δ 0-7d
| background | developing the score | validation cohort | internal cross-validation | external validation | comparison | summary

Developing the score – Final model
Characteristic Category Points Regression coefficient
(95% CI) p-value
Sugar (glucose) level on admission ≤ 8 mmol/L
(≤144 mg/dL) 0 Reference
8.1-12mmol/L
(145-216 mg/dL) 1 0.80 <0.01
> 12 mmol/L
(>216 mg/dL) 2 1.70 <0.001
Early infarct signs on admission CT head scan
no 0 Reference
yes 1 0.68 0.03
(hyper)Dense cerebral artery sign on admission CT
no 0 Reference
yes 1 0.89 <0.01
Age ≤ 75 years 0 Reference
> 75 years 1 0.65 0.02
NIHSS score on admission 0-9 points 0 Reference
10- points 1 0.71 0.02
| background | developing the score | validation cohort | internal cross-validation | external validation | comparison | summary
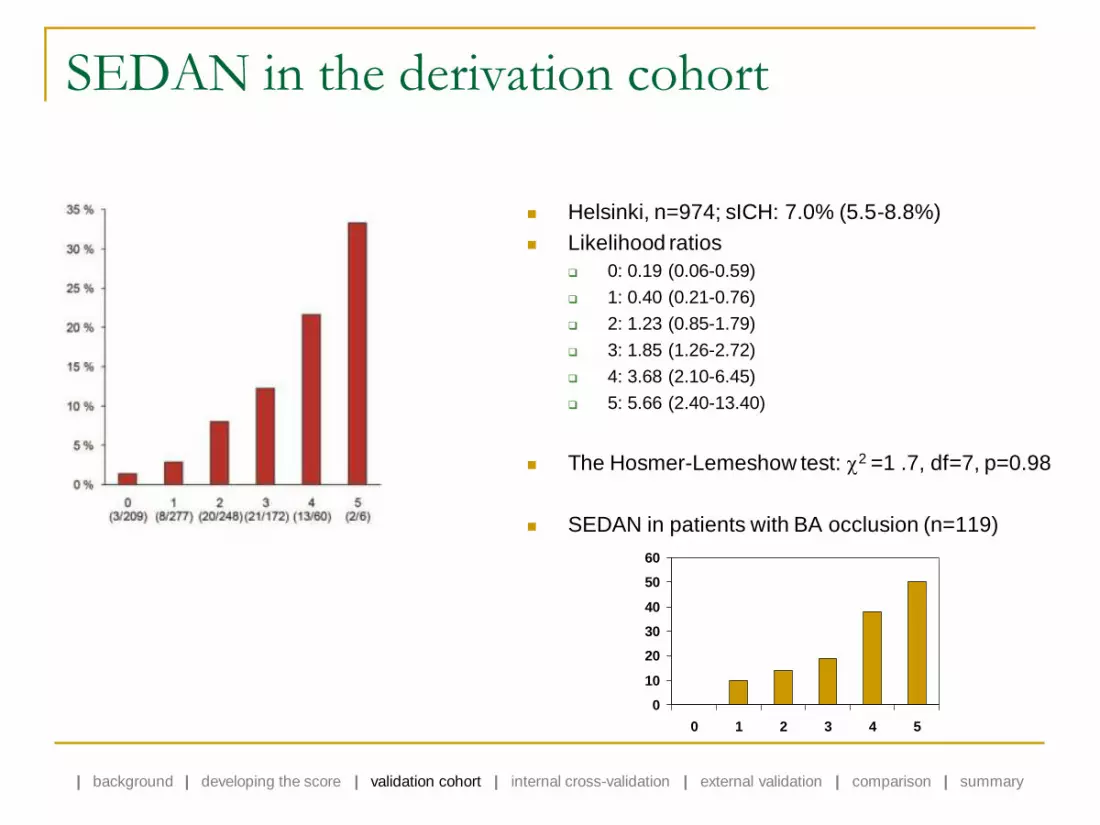
SEDAN in the derivation cohort
Helsinki, n=974; sICH: 7.0% (5.5-8.8%)
Likelihood ratios
0: 0.19 (0.06-0.59)
1: 0.40 (0.21-0.76)
2: 1.23 (0.85-1.79)
3: 1.85 (1.26-2.72)
4: 3.68 (2.10-6.45)
5: 5.66 (2.40-13.40)
The Hosmer-Lemeshow test: 2 =1 .7, df=7, p=0.98
SEDAN in patients with BA occlusion (n=119)
0
10
20
30
40
50
60
0 1 2 3 4 5
| background | developing the score | validation cohort | internal cross-validation | external validation | comparison | summary
Internal cross-validation
Accuracy of the final regression model (not of the score)
1000 bootstrap replicates (R-project 2.10.1)
93.1% (91.4-94.5)
| background | developing the score | validation cohort | internal cross-validation | external validation | comparison | summary

SEDAN in the validation cohort
| background | developing the score | validation cohort | internal cross-validation | external validation | comparison | summary
Basel, Lausanne, Geneva, n=828
sICH: 6.5% (5.0-8.4%)
Helsinki vs. Switzerland
very heterogeneous cohorts
Similar likelihood ratios
c-statistics=0.77 (0.71-0.83)
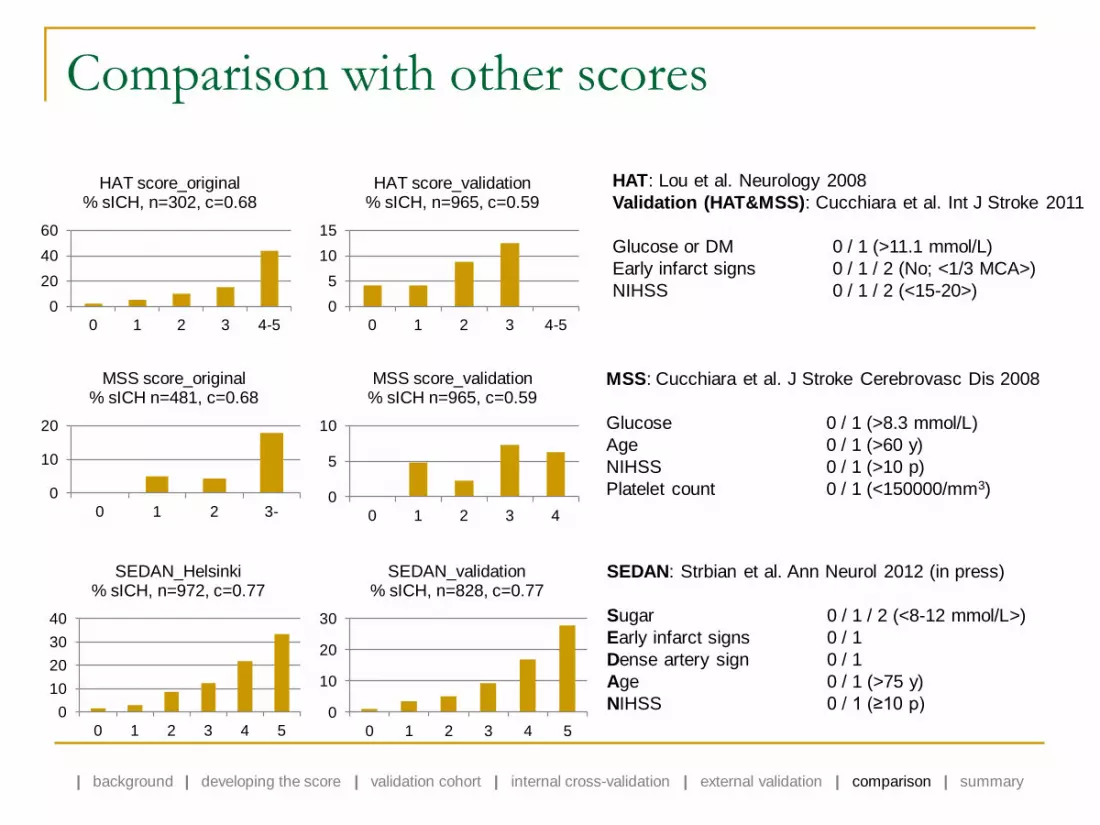
Comparison with other scores
0
20
40
60
0 1 2 3 4-5
HAT score_original % sICH, n=302, c=0.68
0
5
10
15
0 1 2 3 4-5
HAT score_validation % sICH, n=965, c=0.59
0
10
20
0 1 2 3-
MSS score_original % sICH n=481, c=0.68
0
10
20
30
40
0 1 2 3 4 5
SEDAN_Helsinki % sICH, n=972, c=0.77
0
10
20
30
0 1 2 3 4 5
SEDAN_validation % sICH, n=828, c=0.77
SEDAN: Strbian et al. Ann Neurol 2012 (in press)
Sugar 0 / 1 / 2 (<8-12 mmol/L>)
Early infarct signs 0 / 1
Dense artery sign 0 / 1
Age 0 / 1 (>75 y)
NIHSS 0 / 1 (≥10 p)
HAT: Lou et al. Neurology 2008
Validation (HAT&MSS): Cucchiara et al. Int J Stroke 2011
Glucose or DM 0 / 1 (>11.1 mmol/L)
Early infarct signs 0 / 1 / 2 (No; <1/3 MCA>)
NIHSS 0 / 1 / 2 (<15-20>)
MSS: Cucchiara et al. J Stroke Cerebrovasc Dis 2008
Glucose 0 / 1 (>8.3 mmol/L)
Age 0 / 1 (>60 y)
NIHSS 0 / 1 (>10 p)
Platelet count 0 / 1 (<150000/mm3) 0
5
10
0 1 2 3 4
MSS score_validation % sICH n=965, c=0.59
| background | developing the score | validation cohort | internal cross-validation | external validation | comparison | summary
Limitations of the study
Additional baseline parameters may have impact on sICH
leukoaraiosis?
detailed information on the status of vessel occlusion, infarct core, and salvageable tissue
based on CT imaging only
(“Time is brain”; door-to-needle-time in Helsinki: median 22 minutes)
Interpretation of early infarct signs requires radiological expertise
stroke physician + radiologist in Helsinki
telemedicine consultation systems

Summary and Implications
The SEDAN score is simple, fast to perform, and reliably assesses risk for sICH
The score is based on 5 easily accessible baseline variables
Internal cross-validation showed high accuracy of the final model
The score was validated externally with similar results, AUC=0.77
Heterogeneity between the derivation and validation cohorts supports generalization
No single cut-off above which tPA should be withheld
The score scrutinizes the sICH risk to create a single number – helps in decision-making process
High-risk patients intensive post-tPA blood pressure & hyperglycemia monitoring and management
recruitment into RCTs: “add-on” trials studying reduction of tPA-related hemorrhage
to be used together with scores predicting the final functional outcome after iv tPA informed consent
? candidates for endovascular procedures?
The SEDAN score must be evaluated prospectively
| background | developing the score | validation cohort | internal cross-validation | external validation | comparison | summary