development and decline of memory functions in normal, pathological and healthy successful aging
TRANSCRIPT
Development and Decline of Memory Functions in Normal,Pathological and Healthy Successful Aging
C. J. Aine,Department of Radiology, MSC10 5530, 1 University of New Mexico School of Medicine,Albuquerque, NM 87131-0001, USA
L. Sanfratello,Department of Radiology, MSC10 5530, 1 University of New Mexico School of Medicine,Albuquerque, NM 87131-0001, USA
J. C. Adair,Department of Neurology, 1 University of New Mexico School of Medicine, Albuquerque, NM87131, USA
J. E. Knoefel,Department of Internal Medicine, 1 University of New Mexico School of Medicine, Albuquerque,NM 87131, USA
A. Caprihan, andThe Mind Research Network, 1101 Yale Blvd. NE, Albuquerque, NM 87106, USA
J. M. StephenThe Mind Research Network, 1101 Yale Blvd. NE, Albuquerque, NM 87106, USAC. J. Aine: [email protected]; L. Sanfratello: [email protected]; J. C. Adair: [email protected]; J. E. Knoefel:[email protected]; A. Caprihan: [email protected]; J. M. Stephen: [email protected]
AbstractMany neuroimaging studies of age-related memory decline interpret resultant differences in brainactivation patterns in the elderly as reflecting a type of compensatory response or regression to asimpler state of brain organization. Here we review a series of our own studies which lead us to analternative interpretation, and highlights a couple of potential confounds in the aging literature thatmay act to increase the variability of results within age groups and across laboratories. From ourperspective, level of cognitive functioning achieved by a group of elderly is largely determined bythe health of individuals within this group. Individuals with a history of hypertension, for example,are likely to have multiple white matter insults which compromise cognitive functioning,independent of aging processes. The health of the elderly group has not been well-documented inmost previous studies and elderly participants are rarely excluded, or placed into a separate group,due to health-related problems. In addition, recent results show that white matter tracts within thefrontal and temporal lobes, regions critical for higher cognitive functions, continue to mature wellinto the 4th decade of life. This suggests that a young age group may not be the best control groupfor understanding aging effects on the brain since development is ongoing within this age range.Therefore, we have added a middle-age group to our studies in order to better understand normaldevelopment across the lifespan as well as effects of pathology on cognitive functioning in theaging brain.
© Springer Science+Business Media, LLC 2011Correspondence to: C. J. Aine, [email protected] is one of several papers published together in Brain Topography on the “Special Issue: Brain Imaging across the Lifespan”.
NIH Public AccessAuthor ManuscriptBrain Topogr. Author manuscript; available in PMC 2012 October 1.
Published in final edited form as:Brain Topogr. 2011 October ; 24(3-4): 323–339. doi:10.1007/s10548-011-0178-x.
NIH
-PA Author Manuscript
NIH
-PA Author Manuscript
NIH
-PA Author Manuscript
KeywordsMemory; Cognitive decline; White matter; Gray matter; Development; Memory strategies;Hypertension; White matter hyperintensities; Alzheimer’s disease; Mild cognitive impairment;Magnetoencephalography (MEG)
IntroductionTraditional views of aging suggest that neurocognitive decline results from an inevitableloss of tissue and functional reserves (Bellamy 1997; Cabeza et al. 2002; Reuter-Lorenz andLustig 2005; Tisserand and Jolles 2003). In support of this view, postmortem studiesrevealed microanatomical changes associated with aging such as changes in microscopicstructure, and decreases in synaptic density, neuronal density and mean neuronal size (e.g.,Anderson et al. 1983; Flood and Coleman 1988; Huttenlocher 1979; Terry et al. 1987).Similarly, studies using anatomical neuroimaging techniques (e.g., CT and MRI) havereported structural changes and some have correlated these changes with neuropsychologicaltest results (Burgmans et al. 2009; Cardenas et al. 2009; Jagust 1994; Taki et al. 2010; Yueet al. 1997). Frequently, gray matter (GM) in prefrontal regions (dorsolateral andorbitofrontal) was shown to decline linearly after adolescence or young adulthood (Gogtayet al. 2004; Raz et al. 1997; Sowell et al. 2001, 2003) (see Fig. 1, solid line). Therefore,studies of aging typically viewed young adults in their twenties as being at their peak ofneurocognitive functioning, followed by a steady linear decline. This view was furthersupported by lesion studies showing that lesions in dorsolateral prefrontal regions areassociated with poor performance on executive control tasks such as working memory,selective attention, and inhibitory control (D’Esposito et al. 1995; Grasby et al. 1994; Mullerand Knight 2006; Paulesu et al. 1993; Petrides 1994). The postmortem, structural imaging,and lesion findings were generally consistent with the frontal deficit hypothesis of cognitiveaging, i.e., cognitive processes supported by the prefrontal lobes are among the first todecline with increasing age (Moscovitch and Winocur 1995; Tisserand and Jolles 2003;West 1996).
Functional neuroimaging studies of aging began contrasting behavioral performance andbrain activation patterns between young adults (ages 20–29) and elderly participants (ages60 years and older) since the young were presumed to be at their peak of cognitivefunctioning while the elderly were on the decline. Many of these studies showed nodifferences in memory performance between the age groups (often by design in order tokeep error rates or cognitive effort the same across groups), but they did show differentbrain activation patterns, particularly in prefrontal regions, consistent with the frontal deficithypothesis mentioned above. For example, a common finding in the neuroimaging researchon aging was that during memory retrieval or recognition, older individuals showed bilateralprefrontal activity while the young showed right prefrontal activation. Different cognitivemodels for these age-related differences were evaluated, such as ‘compensation’ (i.e.,additional recruitment of brain regions during memory retrieval such as prefrontal cortex tohelp maintain good performance; e.g., Cabeza 2002; Cabeza et al. 2002; Grady et al. 2006;Madden et al. 1999; Reuter-Lorenz et al. 2000) and ‘dedifferentiation’ (i.e., the tendency ofthe older brain to revert to the less specialized organization as seen in children; e.g.,Colcombe et al. 2005; Park et al. 2010; Zarahn et al. 2007).
As noted by Craik (2006), in order to differentiate between these models it is important todetermine whether those individuals showing the best behavioral performance within theelderly group are also those showing the greatest degree of bilaterality. It turns out, however,that the individual variability witnessed between levels of brain activation and performance
Aine et al. Page 2
Brain Topogr. Author manuscript; available in PMC 2012 October 1.
NIH
-PA Author Manuscript
NIH
-PA Author Manuscript
NIH
-PA Author Manuscript
within age groups was considerable across studies. Even within the young group, somestudies showed that faster performers revealed greater prefrontal activity than slowerperformers, while other studies showed the opposite effect (Rypma et al. 2006). In addition,some studies showed that the elderly group was not necessarily slower than a young groupof subjects (Aine et al. 2006; Daselaar et al. 2003) and that some elderly participants withinthe elderly group outperformed some of the younger participants. Possible reasons for thesediscrepancies across studies range from: (1) differences in experimental designs (Daselaar etal. 2003); (2) analysis procedures differed (e.g., use of predetermined regions of interest(ROIs) vs. whole-brain analyses); (3) activation-performance associations varied by brainregion (Rypma et al. 2006); (4) variations in strategies within and between age groups (Aineet al. 2006; Daselaar et al. 2003; Reuter-Lorenz et al. 2000; Rypma et al. 2005); (5) issues ofreliability across fMRI results (Bennett and Miller 2010); (6) different activation levels maybe due to differences in error rates or cognitive effort (Daselaar et al. 2003); (7) white matter(WM) tracts in prefrontal regions may be disrupted in the elderly due to cerebrovasculardisease affecting activation levels (Aine et al. 2010; Nordahl et al. 2006); and (8) differencesbetween young and old in fMRI studies of aging may be due to non-neural, vascular changes(i.e., issues of neurovascular coupling) (D’Esposito et al. 2003; Kannurpatti et al. 2011).
Here we share some of our results on aging obtained using magnetoencephalography(MEG), along with other methods. Our goal is not to determine which cognitive model fitsour MEG data best but rather to discuss two issues that became important in our studies ofnormal aging, which need to be further addressed in aging studies. These two factors, relatedto the maturation of brain across the lifespan and degeneration due to pathologicalprocesses, are highly likely to affect both within- and between-group variability. We are inagreement with Rowe and Kahn (1987) who emphasized that the effects of the aging processitself have been exaggerated, while the modifying effects of external factors (e.g., diet,exercise) have been underestimated. For example, brain shrinkage has been shown inindividuals with hypertension (Raz et al. 2010) while aerobic activity has been associatedwith greater task-related activation in regions of prefrontal/parietal cortices (Colcombe et al.2004), greater GM volume (Erickson et al. 2010), and greater WM integrity (Marks et al.2007). Few neuroimaging studies of aging exclude participants with hypertension which isknown to adversely affect cognitive performance (there are some exceptions such as Cabezaet al. 2002, 2004) and few studies acknowledge that cognitive performance of the elderlycan improve given certain conditions such as aerobic and cognitive training (e.g., Logan etal. 2002). Specifically, our goal at present is to focus on the development of WM tractsacross the lifespan which leads to differences in how one may approach a task (i.e.,strategies) and to examine effects of pathological processes such as hypertension and type 2diabetes on WM tracts and brain volume, which also affect the strategies we utilize. In sum,from our perspective it is important to differentiate between “normal aging,” usuallyassociated with chronic pathological processes, and “healthy successful aging.” In order todifferentiate between healthy young, middle-aged and elderly groups, as well as healthyelderly and the not so healthy elderly groups, our current studies rely on diffusion tensorimaging (DTI) for assessing WM tract integrity and connectivity, MR morphometrics fordetermining WM and GM volumes, neuropsychological tests for characterizing overall levelof cognitive functioning, MR scans specialized for imaging WM lesions (FLAIR), as well asblood tests/blood pressure measurements and neurological exams for characterizing physicalhealth, in addition to MEG. We first present a brief section on why MEG methods areideally-suited for studies of aging followed by results from two of our completed studieswhich laid the foundation for our current views, along with our progress in our ongoingstudies which attempt to differentiate between healthy successful aging and theconsequences of pathology on cognitive decline.
Aine et al. Page 3
Brain Topogr. Author manuscript; available in PMC 2012 October 1.
NIH
-PA Author Manuscript
NIH
-PA Author Manuscript
NIH
-PA Author Manuscript
Rationale for and Brief Description of Our MEG MethodsOne serious barrier to using fMRI methods for examining age-related cognitive decline isthat the neurovascular coupling is most likely altered in these groups and consequentinterpretations of the BOLD changes may be incorrect (Kannurpatti et al. 2011).Neurovascular coupling is defined as the relationship between a change in neuronal activityand the hemodynamic response that is reflected by a BOLD signal change (Iannetti andWise 2007). The primary determinant of the BOLD signal, deoxyhemoglobin within eachvoxel, is dictated by the venous blood volume, blood flow and blood oxygenation, and anydisease factor that modifies the responsiveness or even the baseline values of theseparameters are likely to modify BOLD contrast even in the absence of any modulation ofneural activity (Iannetti and Wise 2007). Rossini et al. (2004) examined the neurovascularcoupling issue by comparing median nerve stimulation responses in stroke patients (a groupwith a predicted compromise in neurovascular coupling) and controls using MEG and fMRI.All of the patients showed clear MEG signals in both affected and unaffected hemisphereswhile some of the stroke patients did not reveal any fMRI activation in these regions (i.e.,uncoupling). D’Esposito et al. (2003) cautioned researchers about neurovascular couplingissues since elders, for example, are more likely to have cardiovascular problems such ashigh blood pressure. In fact, according to the National Center for Health Statistics, 67% ofadults aged 65–74 years have hypertension with percentages increasing thereafter withincreasing age. However, not only has there been an increase in the number of fMRI studieson age-related effects on memory, but the number of studies of Alzheimer’s disease (AD) inparticular has increased dramatically. Some fMRI studies have attempted to deal withcompromised neurovascular coupling (e.g., Rypma and D’Esposito 2000), while others havenot. Given the above evidence, this area of research is ideal for MEG methods sinceneurovascular coupling issues are not a concern, but ironically, there are few MEG studiesof aging and AD that attempt to localize networks of affected brain regions.
Our group has worked diligently over the past decade on methods of analysis thatadequately characterize time-course activity, as well as source locations. MEG sourcelocations, strengths and orientations are estimated using a semi-automated multidipole,spatio-temporal approach (Calibrated Start Spatial Temporal or CSST, Ranken et al. 2004)where estimation of time invariant parameters (locations) are conducted first, usingnonlinear least squares minimization, followed by linear estimation of the associated timevarying parameters (source magnitudes) (Mosher et al. 1992). CSST runs multiple instancesof a downhill simplex search from random combinations of MR-derived starting locationsfrom within the head volume on a Linux PC cluster. General steps for processing the MEGand MRI data using CSST are shown in Fig. 2. For details of our analysis procedures pleaserefer to Aine et al. (2010).
Figure 3 shows how we rigorously assess the appropriateness of our algorithms. In thisexample of realistically simulated data, late activity (e.g., 400–600 ms) was synchronousacross four cortical sites (primary visual cortex or V1, inferior lateral occipital gyrus orI.LOG, intraparietal sulcus or IPS, and dorsolateral prefrontal cortex or DLPFC), as is oftenseen in working memory studies. The upper left panel of Fig. 3 displays the locations of thecortical patches (yellow patches at the cross-hairs) that we created while the time-coursesprovided to the cortical patches are shown beneath. The lower left panel reveals theaveraged waveforms (with signals embedded in 128 trials of real spontaneous noise) as seenacross the 275 sensors. The table shown in the upper right panel from CSST output, showsthe coordinates of the actual sources, the estimated source locations from CSST, and theerrors using Euclidean distance. The lower right panel shows the estimated time-courses(inset) and source locations. In this example, the average error across all four sources was0.67 cm with the greatest error for the I.LOG source. For more examples of realistic
Aine et al. Page 4
Brain Topogr. Author manuscript; available in PMC 2012 October 1.
NIH
-PA Author Manuscript
NIH
-PA Author Manuscript
NIH
-PA Author Manuscript

simulated data and CSST fits to these data, including 6- and 7-source simulations, or foradditional information on how we create these data for testing analysis algorithms, pleasesee our web portal (http://cobre.mrn.org/megsim).
Development of Effective Cognitive StrategiesThe healthy brain develops a host of large-scale, distributed neural networks to handle themany sensory and cognitive challenges encountered on a daily basis. Interactions withinnetwork nodes are mediated to a large extent by WM tracts, or the “superhighways” of thebrain. WM contains fibers which connect various cortical and subcortical GM structures,thereby coordinating activity across disparate GM regions and creating widely distributed,functionally integrated circuitry. Maturation of WM tracts correlates with the developmentof language and memory strategies in adolescence and adulthood (Fuster 2003; Nagy et al.2004; Paus et al. 1999), which may account in part for the different activation patterns oftenseen between young and elderly groups. There is strong evidence that brain developmentand changes in higher-cognitive functions continue throughout adulthood (Adleman et al.2002; Huizinga et al. 2006; Klingberg 2006; Luna and Sweeney 2004; Zelazo et al. 2004)and that these changes are dynamic. For example, synaptic pruning or the elimination ofunnecessary synapses, resulting in a reduction of GM volumes, occurs after puberty whilemyelination of axons continues to increase into the 5th and 6th decades of life (Benes et al.1994; Lenroot and Giedd 2006). WM volumes are maximal in prefrontal and temporalregions around 47 years of age (Bartzokis et al. 2001; Sowell et al. 2003).
According to Fuster (2003), the development of representations in neocortex is acontinuation of a process that took place during phylogeny and early ontogeny in primaryareas. In other words, the phylogenetically oldest representations are those related to thesimplest physical features of the world and motor adaptations to it (perceptual memories).These representations are present at birth in the structure of the primary and sensory motorcortex. In support of this view, developmental studies have shown that children tend to relymore on visuospatial processing to compensate for the immature access to widely distributedregions required to maintain appropriate response sets (Luna and Sweeney 2004). Aschildren age, they switch from relying on visuospatial strategies to using the phonologicalloop to recode visual inputs into phonological form, via rehearsal (Gathercole et al. 2004).Rehearsal or inner speech become well-automated during adulthood and is considered to bea useful strategy to activate/retrieve currently relevant task-set representations (Emerson andMiyake 2003; Kray et al. 2004). Most participants will spontaneously cue themselves bysilently repeating cues while engaged in working memory tasks (Nystrom et al. 2000;Walter et al. 2003) which helps them to regulate their behavior (Baddeley et al. 2001; Luria1959). Linguistic abstraction in general allows adults to conserve their attentional resources(Tun et al. 1998).
One of our earlier studies examined spatial working memory by utilizing a delayed-match-to-sample (DMS) task with Walsh patterned stimuli. The task was designed to make itdifficult for subjects to attach verbal labels to the stimuli, in order to prevent participantsfrom using inner speech (Aine et al. 2006). Figure 4 shows the study design and time-courses from six cortical regions, averaged across 13 young adults (20–29 years—redtracings) superimposed on time-courses averaged across 11 elderly participants (≥65 years—blue tracings) during recognition. (Note time-courses extracted from localized sourceregions are averaged across subjects at similar cortical regions.) The red and blue “**”indicates a significant latency difference between age groups at Peak 3 (F = 22.56, P <0.0001) for the lateral occipital gyrus (LOG) region. Although there was a main effect of ageon the latency of the initial peak in primary/secondary visual cortex or the middle occipitalregion (MO—see “*”), consistent with age-related slowing of retinocalcarine signal
Aine et al. Page 5
Brain Topogr. Author manuscript; available in PMC 2012 October 1.
NIH
-PA Author Manuscript
NIH
-PA Author Manuscript
NIH
-PA Author Manuscript

conduction, the older subjects’ longer latency did not adversely affect their performance(accuracy and speed) since task performance measures were not statistically different fromthe young (see also Lindenberger et al. 2001 for a similar conclusion). Although contrastsdid not reach statistical significance, this figure suggests greater amplitudes for the elderlyover frontal and parietal regions [supramarginal gyrus (SMG), dorsolateral prefrontal cortex(DLPFC) and anterior cingulate (AC)—areas often associated with verbal processing] afterabout 200 ms. More importantly, correlations between MEG responses andneuropsychological tests suggested that young and elderly were using two differentstrategies to perform this task; the young relied on posterior brain regions (associated withspatial processing) while the elderly relied on inferior frontal and SMG regions, reminiscentof the phonological store or verbal processing (Henson et al. 2000). For example,correlations for the young clustered around visual memory (immediate and delayed recall onthe Rey Complex Figure Test) and Performance IQ. In contrast, vocabulary and verbal IQtests correlated with the MEG measures for the elders, suggesting that elders may haveresorted to attaching verbal labels to the stimuli rather than using a “posterior” visualperceptual strategy (i.e., retaining the images in mind). Many of the older subjects endorsedemploying such an approach at debriefing.
Other studies have reported a similar posterior-to-anterior shift in memory-related brainactivation with advancing age. Grady et al. (2003) used line drawings of objects and wordsrepresenting the names of objects in their PET study. They concluded that with age there is ashift in the cognitive resources used from a more perceptually-based to executive- andorganization-based functions. Although they acknowledged that elderly revealed greaterfunctional connectivity between hippocampus and DLPFC and parietal cortex than theyoung (the young showed greater connectivity between ventral prefrontal cortex,hippocampus and extrastriate regions), they did not suggest that connectivity betweenregions may still be developing across midlife which then allows different verbal-basedstrategies to be applied during the tasks. It is possible that this age-related alteration inhippocampal function may be a natural developmental change rather than a compensatoryalteration. In another study, Meulenbroek et al. (2004) used a spatial navigation task andfound a slight but significant decrement in navigation performance for the elderly (79.5%correct vs. 73.3%). More importantly, older subjects exhibited decreased task-associatedactivation of posterior, perceptually-related regions (i.e., parietal and posterior fusiform/parahippocampal regions) along with activation of anterior parahippocampal sites, whichwas not apparent in the young group. Both groups interpreted their results as reflecting theadditional recruitment of regions to facilitate memory.
Similar to other neuroimaging studies, our comparison groups included young (20–29 years)and elderly (65 years and older) subjects. However, based on the previous literaturediscussed above WM development is protracted relative to GM development suggesting abetter characterization of changes across lifespan is necessary. Unfortunately, neuroimagingstudies do not generally compare brain activation patterns and task performance betweenyoung, middle-age, and elderly groups. To extend our work, we examined the MRIs fromour young and elderly participants in addition to a separate group of participantsintermediate in age between the young and older groups which we will refer to as middle-aged subjects, and compared GM and WM volumes between these groups. Based on theliterature (e.g., Raz et al. 2005; Sowell et al. 2003), we hypothesized that the middle-agedgroup would reveal greater WM volumes than either of the other two groups. It wasassumed that young subjects’ WM was still developing while the elderly were beginning toshow age-related degradation of WM tracts. Our morphometry results did reveal a decline inboth GM and WM in frontal regions for the elderly relative to the young (P < 0.004 for GMand P < 0.0002 for WM; see Fig. 5 for WM results), consistent with the literature. But withthe addition of middle-aged participants (31–43 years), it became apparent that the frontal
Aine et al. Page 6
Brain Topogr. Author manuscript; available in PMC 2012 October 1.
NIH
-PA Author Manuscript
NIH
-PA Author Manuscript
NIH
-PA Author Manuscript
WM volume distribution followed an inverted U-shaped function. The young and elderlywere at the two extremes, while middle-aged participants showed maximal WM volume (P< 0.00005 for middle-age vs. elderly and P < 0.02 for middle-aged vs. young). It is alsointeresting that although the elderly did not have greater temporal WM volumes than theyoung or middle-aged groups, the WM volumes in the temporal region correlated withverbal IQ scores (see bottom portion of Fig. 5; r = 0.76, P < 0.02) for the elderly, but not forthe young. While conjectural, this finding may relate to how associative neocortical areassupporting receptive and productive language (such as temporal and frontal regions) are thelast to mature in terms of myelination and dendritic branching (Fuster 2003).
These results are consistent with reports suggesting that WM maturation continues well intoadulthood. Therefore, increased frontal activation with advancing age need not be viewed asreflecting a compensatory mechanism, but rather it may reflect the use of an effectivestrategy associated with normal maturational processes (e.g., WM maturation). Scherf et al.(2006), for example, found a four-fold increase in AC activity with age (up to 47 years).They claimed that adults’ usage of AC and bilateral DLPFC is most efficient for preparingand organizing working memory behavior. They also consider the use of subvocal rehearsalstrategies as a sophisticated strategy that develops with age. Bor et al. (2003) found abilateral increase in prefrontal cortex when participants (aged 21–34) used an effectivechunking strategy (i.e., reducing the amount of information to be retained into smaller,manageable pieces of information) during a spatial task which correlated with goodperformance. Data from studies examining the application of different strategies to workingmemory tasks suggest that bilateral frontal activity in the elderly may not reflect acompensatory mechanism. Instead, we suggest that the plastic nature of the nervous system,altered on the basis of development and experience throughout the lifespan (Casey et al.2005; Poldrack 2000; Sakai 2005; Schlaggar et al. 2002), may not have been considered bysome investigators. It is probable that the functional neuroanatomy underlying taskperformance differs between various age groups, and these developmental differences areassociated with the adoption of different strategies for performing the tasks. Executiveprocesses or more sophisticated strategies, for example, are apt to be utilized by middle-agedand elderly participants more than some young, since maturation of executive functionsparallel the continued development of the frontal lobes (Romine and Reynolds 2004).Consistent with this position, our elder participants’ responses to our structured interviewson the strategies they applied during the task indicate that they feel that their problem-solving skills for example, are better now than when they were in their twenties. It is notedthat recent longitudinal/cross-sectional studies (Ronnlund et al. 2005) traced the course ofepisodic and semantic memory across 35–80 year old participants and found no episodicmemory decline before age 60 while semantic memory improved up to this age. Similarly, itwas recently shown that measures of deterioration of intracortical GM, along withsubcortical WM signal intensity, weren’t observed until the late 60s and early 70s insuperior frontal areas (Westlye et al. 2010). However, to date there are still very few studiesexamining brain maturation, and the consequent emergence of executive functions(including strategies), across the adult lifespan. Hopefully a “systems” level approach (i.e.,analyses focused on networks rather than single brain regions such as prefrontal cortex) willbring forth new information on the development of memory functions across the lifespan byshowing the variety of strategies that can and are applied to working memory tasks.
Healthy Successful Versus Normal AgingAn additional factor that may account for some of the differences witnessed between youngand elderly groups is the presence of chronic diseases in the elderly, such as hypertensionand diabetes, which can result in premature memory decline. For example, WM lesions,associated with hypertension or type 2 diabetes, are considered as a surrogate marker of
Aine et al. Page 7
Brain Topogr. Author manuscript; available in PMC 2012 October 1.
NIH
-PA Author Manuscript
NIH
-PA Author Manuscript
NIH
-PA Author Manuscript
small-vessel disease (Pantoni et al. 2007; Schmidt et al. 2004). Most neuroimaging studiestypically attempt to exclude participants based on a history of neurological disease, headinjury, seizure, stroke, substance abuse, and psychiatric disorders. This exclusion is typicallydetermined by participant self-report rather than verification in medical records or actualdocumentation of blood pressure or blood sugar status, for example. However, because thedescription of exclusion criteria is usually not specific, it is unclear how many diseases thatoften affect the elderly are actually excluded. Although neuroimaging investigators of aginghave access to MR scans, participants showing evidence of white matter lesions or volumeloss are not typically excluded since the presence of white matter lesions and volume loss isoften considered to be part of “normal” aging. In many cases, MRI scans are not read by aneuroradiologist (Illes et al. 2006). A finding from our most recent auditory wordrecognition study indicated that 28% of our elderly controls revealed moderate to severeabnormalities on their MRIs (e.g., consistent with chronic white matter ischemia or volumeloss), as determined by a board-certified neuroradiologist who was blind to the diagnosticcategories (Aine et al. 2010). This result is consistent with findings reported by Inzitari(2000) and Breteler et al. (1994). From our vantage point, health of the participants is apotential cohort difference between groups, which needs to be controlled.
Recent literature indicates that the presence of WM lesions often correlates with frontal lobepathology (i.e., poor executive control and working memory performance). For example, ameta-analysis conducted by Gunning-Dixon and Raz (2000) and other studies (Oosterman etal. 2004; Tullberg et al. 2004) have shown that WM hyper-intensities (WMHs) are moreabundant in frontal regions and are associated with frontal hypometabolism, prolongedprocessing times and executive dysfunction. There is also strong evidence that hypertensionand type 2 diabetes are major risk factors for severe WMHs (Artero et al. 2004; Cook et al.2002; de Leeuw et al. 1999; DeCarli et al. 2001; Dufouil et al. 2001; Inzitari 2000; Kuo andLipsitz 2004) and there is ample evidence that the presence of WMHs is associated withcognitive decline. The severity and nature of decline relates to the density and locations ofthe lesions (Artero et al. 2004; Awad et al. 2004; De Groot et al. 2002; Inzitari 2000; Kuoand Lipsitz 2004; Manschot et al. 2006). Apparently, there is an anterior-posterior gradientin the occurrence of WMHs (Artero et al. 2004; Head et al. 2004) where frontal areas are thefirst to reveal WMHs, followed by periventricular and parietal lesions. In each stage, thedensity of lesions increases until finally temporal and occipital regions are involved.Therefore, WM lesions most likely act to perforate the WM tracts (i.e., “potholes” in the“superhighways”), which disrupt the synchronization of activity across large-scale networksthat mediate effective neurocognitive functions.
In Aine et al. (2010), patients (mild cognitive impairment or MCI and mild AD) and controlswith evidence of moderate to severe MRI abnormalities (WMHs or volume loss) performedsignificantly worse on the behavioral tasks and neuropsychological tests compared tohealthy controls. Figure 6a shows their performance on the California Verbal Learning Testand a spatial memory test, the Rey Complex Figure Test, compared to the averageperformance of the controls without moderate to severe abnormalities on their MRIs (blacklines). Figure 6b shows amplitude differences at select cortical regions as a function of MRIcategory. For the participants in whom parietal and anterior temporal lobe activity wasidentified, statistically significant hyperactivity in parietal and anterior temporal cortex wasevident for participants with WMHs (red tracings), relative to controls (black tracings) orparticipants with volume loss (blue tracings). The term hyperactivity is used here since taskand neuropsychological performance measures that were correlated with MEG time-coursemeasures, indicated that moderate activity in anterior temporal lobe correlated with goodperformance, as long as it wasn’t too much activity.
Aine et al. Page 8
Brain Topogr. Author manuscript; available in PMC 2012 October 1.
NIH
-PA Author Manuscript
NIH
-PA Author Manuscript
NIH
-PA Author Manuscript
Our results have led us to the premise that age-related pathology correlates with cognitivedecline. Therefore it is critical to parse out “normal aging,” complete with pathologicalprocesses typically found in community dwelling elderly, from “healthy successful aging”(i.e., no or only mild pathology) in order to truly understand age-related changes incognition. For example, effects of hypertension and type 2 diabetes may be a largecontributor to the frontal deficits outlined by the frontal deficit hypothesis of aging and mayadd to the considerable inter-subject variability noted within elderly age groups. In order torule out effects due to cohort differences between young and elderly groups, it is imperativeto document the health of the participants at the time of study via MRIs, neuropsychologicaland neurological exams, blood tests (e.g., HbA1c and lipid panel) and blood pressuremeasurements.
A recent study in the literature provides a nice example of why careful characterization ofhealth in aging studies is necessary. Persson et al. (2006) concluded after examining DTI-based fractional anisotropy (FA) measures and volume measures of the hippocampus thatsome members of their sample of older adults were not healthy. They examined a subset ofolder adults from an existing longitudinal study and split them into two groups. The groupsdid not differ when comparing their neuropsychological test results but they did differ ontests of memory obtained across a 10-year span (i.e., one group showed declines on memoryperformance). The elders who demonstrated a decline in memory tests also revealed eithersmaller hippocampal volumes or lower FA values, suggestive of disease processes,including early stages of AD. If the investigators did not have access to additional structuraldata, as well as longitudinal clinical data, they would not have known that some “normal”elderly were not healthy elderly.
The study from which Fig. 6 was obtained examined individual variability while participantsperformed a delayed, auditory word recognition task (for details see Aine et al. 2010). In thiscase, we reasoned that pathological processes (e.g., hypertension, type 2 diabetes, mildforms of cognitive impairment or dementia) typically encountered within the elderlypopulation are likely to modify strategies applied to memory tasks as neural pathwaysbecome affected by a variety of insults. Therefore, we purposely examined a mixed group ofelderly (n = 30); 12 were MCI or mild AD while others were healthy according to clinicalreadings from their MRIs and the study inclusion/exclusion criteria. By incorporating a widerange of abilities and health conditions, distinct strategies, both neural and behavioral shouldbe identifiable within this group. We used the term strategies, to refer to different ways ofconducting the same task and we operationally defined strategies as reflecting differentpatterns of brain activation that correlated with task performance. Effective strategiescorrelated with higher performance levels.
Since we were expecting to see a range of strategies in the present study we conducted acluster analysis using the brain regions identified with MEG and then correlated theresulting networks with task performance and neuropsychological measures. (Note we didnot use ROIs as commonly found in fMRI studies. Instead, we used an automated analysisthat is conducted across the whole brain and identifies brain regions that are dominant ineach individual case.) As Fig. 7 shows, there were three primary brain activation patternsfound in the data. Group 1 pattern of activity, heavily weighted by activation in anteriortemporal (ANT), parietal (PAR), and premotor (PRE) regions (the histogram bars reflect thepercentage of individuals within a group who showed activity within each region),correlated positively with task and neuropsychological performance measures. This was thehighest performing group and the neuroradiologist interpreted their MRIs as either showingno or mild abnormalities. Group 2, with no activity found in PRE, and Group 3, with noactivity found in ANT, both revealed considerable activity in occipital regions as if theyvisualized objects that the words represented. Because different brain activation patterns
Aine et al. Page 9
Brain Topogr. Author manuscript; available in PMC 2012 October 1.
NIH
-PA Author Manuscript
NIH
-PA Author Manuscript
NIH
-PA Author Manuscript
were found for each group which correlated differently with task and neuropsychologicalperformance measures, we concluded that these groups used different strategies forconducting the task. Both Groups 2 and 3 performed worse than Group 1 on recognition,though reaction times did not differ, and all the MCI/AD patients were spread betweenGroups 2 and 3. Delayed recall on the REY Complex Figure Test (REY), a test of spatialmemory, was very sensitive to group differences, more so than the California VerbalLearning Task (CVLT). We have found this to be true on our spatial working memory,versus verbal working memory tests as well. In general, it appears that the highlyfunctioning Group 1 relied less on FRO in order to correctly recognize target wordsrepresenting common objects from a longer list of target and foil words. In contrast, Groups2 and 3 both appeared to rely on FRO and occipital regions in order to recall the objectnames. These types of differences in activity patterns, presumably associated with differentstrategies, are quite robust (i.e., they can be observed even at the level of raw isofield maps).
Current Study: Development of Strategies and Effects of Hypertension/Type 2 Diabetes
Our current studies focus on WM tract development and degeneration via the use of DTI,morphometry, and FLAIR imaging. We hope to demonstrate that age-related changes inworking memory parallels the development of WM connectivity, which is necessary foreffective strategies (i.e., top-down processing), and that degeneration of WM tracts isassociated with pathology and decline in memory functions. As discussed above, wehypothesize that middle-aged and elderly individuals use executive strategies (e.g., verbalabstraction or top-down processing such as chunking) more frequently when performingworking memory tasks while the young rely more on a visual perceptual strategy, thephylogenetically oldest representations that are dependent upon bottom-up processing whenengaged in spatial tasks (Davis et al. 2008; Fuster 2003). This is not to say that all elderlyand middle-aged individuals use verbal or chunking strategies and all young adults use avisual perceptual strategy. Obviously, there will be a mixture of strategies in all age-groupsand even among individuals, but we suggest that there will be a greater percentage of youngparticipants using visual perceptual strategies and a greater percentage of elderly andmiddle-aged will use verbal-based or chunking strategies. The activity patterns can bedescribed briefly as anterior- and posterior-based activity patterns, respectively. Thesedifferences are easier to show using spatial working memory tasks (Fig. 8). Below wepresent preliminary data from our spatial and verbal working memory tasks. The verbal taskuses the same stimuli, only the task instruction changes (i.e., match the red digits’ identityrather than position).
According to our hypotheses, the middle-aged group (35–45 years of age) will perform best(higher percent correct) on both spatial and verbal working memory tasks compared to theother age groups due to continued maturation of white matter tracts throughout middle age.If a “traditional” view is upheld, young adults should perform best, since ample literatureshows a linear decline in GM across middle-age and old age (Fig. 1). Figure 9 shows themiddle-aged group performing significantly better than the young group (Total Correct forspatial task P < 0.03; Total Correct for verbal task P < 0.01) and the elderly group (TotalCorrect for spatial task P < 0.078; Total Correct for verbal task P < 0.05). RTs did not showsignificant differences between middle-aged and young groups. We must point out that theelderly group in this example consisted mostly of hypertensives/diabetics with concurrentMRI abnormalities (all but 1 had either global volume loss and/or notable WMHs). RTsshowed a large difference between young and old for the spatial condition only (P < 0.004).
Note that the variability for Total Correct is greater for both young and old groups comparedto the middle age group (see standard deviation bars). Based on questionnaire responses,
Aine et al. Page 10
Brain Topogr. Author manuscript; available in PMC 2012 October 1.
NIH
-PA Author Manuscript
NIH
-PA Author Manuscript
NIH
-PA Author Manuscript
there is no group where all members used the same strategy. In the young group, 12 out of14 reported using a spatial strategy at some point during the spatial task (visual perceptual—keeping the locations in mind as presented), as predicted. For the middle-age group, 6 out of7 reported using a verbal strategy at some point in time during the spatial task. The elderlyreported using a mixture of strategies. The most interesting result is that the Total Correctand RTs for the middle age group are similar for spatial and verbal conditions suggestingthat they used verbal abstraction (and chunking) for both conditions. Finally, elders withevidence of subclinical pathology performed worse on the spatial task altogether.
To investigate whether the MEG data would show different patterns of activity for youngwho reported using spatial versus verbal strategies during the spatial task, we examinedMEG data from seven healthy young. Questionnaire responses indicated that one subgroupof young predominantly used a visual perceptual strategy (i.e., spatial strategy as determinedfrom 22 questions using a 4-point Likert scale) and the other subgroup of young primarilyused verbal coding or chunking to remember the locations of the digits (i.e., verbal strategy).For young subjects using a spatial strategy, predominantly bilateral occipital activation (n =3) was evident, while the group using a verbal or chunking strategy (n = 4), demonstratedbilateral medial temporal lobe activity with some degree of occipital activation. Figure 10(top middle panel) shows sequential onsets of occipital sources with primary/secondaryoccipital activity onsetting first (red tracing). This occipital activation pattern correlates withtheir affirmative responses indicating that they were holding the matrices with red digitlocations in mind as they saw them. In contrast, for subjects reporting a verbal strategy (e.g.,subvocalizing “upper left corner”), left medial temporal lobe appears to onset first (see redtracing in bottom middle panel at 100 ms) followed by activity in occipital and right medialtemporal cortex. These preliminary data show different brain patterns associated withdifferent spatial/verbal strategies for this spatial task. If this were an fMRI study usingwhole-brain analysis methods, data from both groups of young would most likely beaveraged together, producing averaged areas of activity that are not representative of eithergroup. If ROIs were used in this study then unique differences in brain activation patternswould probably not be found either. Miller et al. (2002; Van Horn et al. 2008) specificallydiscussed the issue of inter-individual variability in fMRI studies, including variabilityassociated with different cognitive strategies (i.e., fMRI research has been heavilyinfluenced by results based on population-level inference) and emphasized the uniqueopportunity and importance of understanding individual differences. Single subject analysisis one advantage of MEG methods and a necessity for clinical studies. We predict that moreyoung will utilize a “posterior-based” visual-perceptual strategy while older subjects (andsome of the young) will use executive strategies (including verbal labeling), therebyproducing a more anterior rather than posterior distribution of activity. This study is ongoingand we have not yet performed this comparison.
As a first look at white matter integrity from our current study, preliminary DTI data from22 subjects are shown in Fig. 11 where scalar diffusion parameters such as FA using dtifit(FSL) were calculated. The FA image was aligned to a FA template (normalized to the MNIspace) with a nonlinear registration algorithm, FNIRT (FMRIB’s Nonlinear ImageRegistration Tool; FSL). The tract based spatial statistics (TBSS) method was used forgroup analysis (Smith et al. 2006). A mean FA image was calculated from the set ofspatially normalized images. The TBSS algorithm was applied to the mean FA image tocalculate a mean WM tract skeleton (Fig. 11b shows the mean FA image with a mean WMtract skeleton superimposed). The FA data of each subject was then projected on this meanskeleton to obtain a skelotonized image corresponding to each subject (Smith et al. 2006).
To examine preliminary age- (19–81 years) and pathology-related effects (four elders withhypertension or type 2 diabetes and 2 healthy controls), a voxel-wise linear regression was
Aine et al. Page 11
Brain Topogr. Author manuscript; available in PMC 2012 October 1.
NIH
-PA Author Manuscript
NIH
-PA Author Manuscript
NIH
-PA Author Manuscript
done for each point on the skeleton. The values with significant correlations at P ≤ 0.01(uncorrected for multiple comparisons) were extracted. These significant voxels on theskeleton were then mapped on an atlas to identify WM tracts that had significant FAcorrelations with age. This atlas is based on the International Consortium for Brain Mappingtemplate (Mazziotta et al. 1995) which consists of 50 regions and can be used for ROIanalysis (Mori et al. 2008). Our hypotheses led to the selection of three midline ROIs fromthis atlas (Fig. 11a) consisting of the corpus callosum and eight bilateral ROIs in frontal,limbic, and association fibers.
The significant regions (i.e., FA was negatively correlated with age) found were in theanterior corona radiata (right and left ACR), the posterior thalamic radiation (right and leftPTR), and the body of corpus callosum (BCC), and genu. Smaller regions were found in anumber of other white matter tracts which will require more careful examination in a largersample. Three regions with the greatest number of significant voxels are shown in Fig. 11c.This ongoing study will track the FA measures in healthy elderly in comparison to elderparticipants with a history of hypertension to determine if WM tract degradationaccompanies normal or healthy aging, or both. In this example, we have mixed both healthyand hypertensive elderly.
This ongoing working memory study also examines participants with at least a 5-yearhistory of hypertension (both middle-aged and elderly groups) and a separate group ofmiddle-aged participants (35–45 years) with at least a 5-year history of type 2 diabetes.These groups are being compared with healthy young (18–25 years), healthy middle-aged(35–45 years), and healthy elderly control groups (60 years of age or older). Figure 12shows preliminary behavioral data; performance from four elderly hypertensive (HT) andfour elderly healthy controls (CON) while engaged in spatial and verbal working memorytasks are shown. MRI abnormalities were identified from five of the eight MRIs by a board-certified neuroradiologist who was blind to groups. Three HTs revealed WMHs while 1 HTrevealed mild cerebral volume loss (i.e., greater than expected for age). One of four CONsshowed mild WMHs on the FLAIR images.
Figure 12 shows effects of enhancers and distracters (presented during the delay interval) onrecognition memory performance for CONs and HTs. When participants were instructed toremember digits (verbal working memory) or locations of digits (spatial working memory—refer back to Fig. 8 for design) and the same digits/locations were presented during the delayinterval (enhancers) as those that the participants were asked to remember, participantsachieved a higher percent correct during the recognition portion of the task (top row—Enhancers). In contrast, when the digits/locations presented in the delay interval weredifferent from the ones they were instructed to remember (distracters), the percent correctdecreased (top row—Distracters). HT participants generally revealed fewer percent correctand longer RTs than CON participants, except for the verbal RTs. When distracters wereinvolved, HT participants performed much worse on the spatial task (fewer percent correctand longer RTs). Although these results are very preliminary, they already suggest thatmoderate to severe WM ischemic changes result in more global deficits. In conclusion, eventhough all of our participants had better than average IQs, specific tests of memory(particularly spatial memory) reveal poorer performance for HT participants. The MRI,neuropsychological, and behavioral results suggest that HT participants may not be aging as‘successfully’ as some of the healthy controls. Our blood pressure measurements indicatethat their medications are working well in three of four HTs, but behavioral performance isstill compromised.
Aine et al. Page 12
Brain Topogr. Author manuscript; available in PMC 2012 October 1.
NIH
-PA Author Manuscript
NIH
-PA Author Manuscript
NIH
-PA Author Manuscript
Concluding RemarksThrough our studies we have identified a number of potential confounds that affect theinterpretation of studies of normal versus healthy aging. First, the health of the elderly isoften based on self-report rather than documented with neurological exams,neuropsychological tests, or MRIs confirmed to be normal by a neuroradiologist. Whitematter lesions are frequently found in the MRIs of elderly and they have been shown tocorrelate with poorer performance on cognitive tasks, particularly working memory tasks.Second, there are very few neuroimaging studies of aging that have compared performanceand active brain networks of middle-aged subjects with the elderly. There is ample evidencenow that brain maturation is a dynamic process that does not stop in early adulthood,suggesting that a middle age group is another critical comparison group. Third, it isbecoming increasingly clear that researchers should be cognizant of strategies participantsuse in order to understand the nature of the differences in neural circuitry patterns. Ourstudies, in general, suggest that one alternative explanation for the prefrontal differencestypically noted between young and elderly adults is that brain maturation and consequentcognitive abilities continue to improve at least through middle age. There is now sufficientevidence to support this position. While it is acknowledged that there is some age-relateddecline in brain function, it is important to account for the dynamic aspect of braindevelopment to better determine what changes are associated with ongoing braindevelopment as opposed to brain dysfunction with increasing age. Finally, some of ourelderly participants (including some in their late 70s) have not shown cognitive decline inour longitudinal study. These individuals are not necessarily “super normals” as someinvestigators have labeled similar entities. They are healthy normals. Therefore, our goal isto better define aging and to identify the additional modifiable risk factors that may lead tocognitive decline, previously attributed to normal aging. This information can help provideindividuals with the knowledge that one may still be able to reduce the risk of cognitivedecline by mitigating effects of metabolic syndrome and other age-related diseases.
AcknowledgmentsThis work was supported by NIH grants R01 AG029495, R01 AG020302, and CTSC Pilot Project NCRR1UL1RR031977 to UNM HSC, and P20 RR021938 to MRN. The content is solely the responsibility of the authorsand does not necessarily represent the official views of the National Institutes on Aging or the National Institutes ofHealth. This work was also supported in part by a VA Merit Review grant, by the Department of Energy underAward Number DE-FG02-99ER62764 to the Mind Research Network, the Radiology Department at UNM SOM,and the Research Service at the New Mexico VA Health Care System. The authors wish to thank Reyaad Hayek,Blaine Hart, Clifford Qualls, Jennifer Bryant, Christopher Donahue, Megan Schendel, Laura Lundy, JamieMacArthur, and Rebecca Montaño for their help with neuroradiological reports, statistics, data acquisition andanalysis.
ReferencesAdleman NE, Menon V, Blasey CM, White CD, Warsofsky IS, Glover GH, Reiss AL. A
developmental fMRI study of the Stroop color-word task. Neuroimage. 2002; 16:61–75. [PubMed:11969318]
Aine CJ, Woodruff CC, Knoefel JE, Adair JC, Hudson D, Qualls C, Bockholt J, Best E, Kovacevic S,Cobb W, Padilla D, Hart B, Stephen JM. Aging: compensation or maturation? Neuroimage. 2006;32:1891–1904. [PubMed: 16797187]
Aine CJ, Bryant JE, Knoefel JE, Adair JC, Hart B, Donahue CH, Montano R, Hayek R, Qualls C,Ranken D, Stephen JM. Different strategies for auditory word recognition in healthy versus normalaging. Neuroimage. 2010; 49:3319–3330. [PubMed: 19962439]
Anderson JM, Hubbard BM, Coghill GR, Slidders W. The effect of advanced old age on the neuronecontent of the cerebral cortex. Observations with an automatic image analyser point countingmethod. J Neurol Sci. 1983; 58:235–246. [PubMed: 6834079]
Aine et al. Page 13
Brain Topogr. Author manuscript; available in PMC 2012 October 1.
NIH
-PA Author Manuscript
NIH
-PA Author Manuscript
NIH
-PA Author Manuscript

Artero S, Tiemeier H, Prins ND, Sabatier R, Breteler MM, Ritchie K. Neuroanatomical localisationand clinical correlates of white matter lesions in the elderly. J Neurol Neurosurg Psychiatry. 2004;75:1304–1308. [PubMed: 15314121]
Awad N, Gagnon M, Messier C. The relationship between impaired glucose tolerance, type 2 diabetes,and cognitive function. J Clin Exp Neuropsychol. 2004; 26:1044–1080. [PubMed: 15590460]
Baddeley A, Chincotta D, Adlam A. Working memory and the control of action: evidence from taskswitching. J Exp Psychol Gen. 2001; 130:641–657. [PubMed: 11757873]
Bartzokis G, Beckson M, Lu PH, Nuechterlein KH, Edwards N, Mintz J. Age-related changes infrontal and temporal lobe volumes in men: a magnetic resonance imaging study. Arch GenPsychiatry. 2001; 58:461–465. [PubMed: 11343525]
Bellamy, D. Mechanism of ageing. In: Pathy, MSJ., editor. Principles and practice of geriatricmedicine. Wiley; New York: 1997. p. 13-30.
Benes FM, Turtle M, Khan Y, Farol P. Myelination of a key relay zone in the hippocampal formationoccurs in the human brain during childhood, adolescence, and adulthood. Arch Gen Psychiatry.1994; 51:477–484. [PubMed: 8192550]
Bennett CM, Miller MB. How reliable are the results from functional magnetic resonance imaging?Ann N Y Acad Sci. 2010; 1191:133–155. [PubMed: 20392279]
Bor D, Duncan J, Wiseman RJ, Owen AM. Encoding strategies dissociate prefrontal activity fromworking memory demand. Neuron. 2003; 37:361–367. [PubMed: 12546829]
Breteler MM, van Swieten JC, Bots ML, Grobbee DE, Claus JJ, van den Hout JH, van Harskamp F,Tanghe HL, de Jong PT, van Gijn J, et al. Cerebral white matter lesions, vascular risk factors, andcognitive function in a population-based study: the Rotterdam Study. Neurology. 1994; 44:1246–1252. [PubMed: 8035924]
Burgmans S, van Boxtel MP, Vuurman EF, Smeets F, Gronenschild EH, Uylings HB, Jolles J. Theprevalence of cortical gray matter atrophy may be overestimated in the healthy aging brain.Neuropsychology. 2009; 23:541–550. [PubMed: 19702408]
Cabeza R. Hemispheric asymmetry reduction in older adults: the HAROLD model. Psychol Aging.2002; 17:85–100. [PubMed: 11931290]
Cabeza R, Anderson ND, Locantore JK, McIntosh AR. Aging gracefully: compensatory brain activityin high-performing older adults. Neuroimage. 2002; 17:1394–1402. [PubMed: 12414279]
Cabeza R, Daselaar SM, Dolcos F, Prince SE, Budde M, Nyberg L. Task-independent and task-specific age effects on brain activity during working memory, visual attention and episodicretrieval. Cereb Cortex. 2004; 14:364–375. [PubMed: 15028641]
Cardenas VA, Chao LL, Studholme C, Yaffe K, Miller BL, Madison C, Buckley ST, Mungas D,Schuff N, Weiner MW. Brain atrophy associated with baseline and longitudinal measures ofcognition. Neurobiol Aging. 2009
Casey BJ, Galvan A, Hare TA. Changes in cerebral functional organization during cognitivedevelopment. Curr Opin Neurobiol. 2005; 15:239–244. [PubMed: 15831409]
Colcombe SJ, Kramer AF, Erickson KI, Scalf P, McAuley E, Cohen NJ, Webb A, Jerome GJ,Marquez DX, Elavsky S. Cardiovascular fitness, cortical plasticity, and aging. Proc Natl Acad SciUSA. 2004; 101:3316–3321. [PubMed: 14978288]
Colcombe SJ, Kramer AF, Erickson KI, Scalf P. The implications of cortical recruitment and brainmorphology for individual differences in inhibitory function in aging humans. Psychol Aging.2005; 20:363–375. [PubMed: 16248697]
Cook IA, Leuchter AF, Morgan ML, Conlee EW, David S, Lufkin R, Babaie A, Dunkin JJ, O’Hara R,Simon S, Lightner A, Thomas S, Broumandi D, Badjatia N, Mickes L, Mody RK, Arora S, ZhengZ, Abrams M, Rosenberg-Thompson S. Cognitive and physiologic correlates of subclinicalstructural brain disease in elderly healthy control subjects. Arch Neurol. 2002; 59:1612–1620.[PubMed: 12374500]
Craik FI. Brain-behavior relations across the lifespan: a commentary. Neurosci Biobehav Rev. 2006;30:885–892. [PubMed: 16919731]
D’Esposito M, Detre JA, Alsop DC, Shin RK, Atlas S, Grossman M. The neural basis of the centralexecutive system of working memory. Nature. 1995; 378:279–281. [PubMed: 7477346]
Aine et al. Page 14
Brain Topogr. Author manuscript; available in PMC 2012 October 1.
NIH
-PA Author Manuscript
NIH
-PA Author Manuscript
NIH
-PA Author Manuscript
D’Esposito M, Deouell LY, Gazzaley A. Alterations in the BOLD fMRI signal with ageing anddisease: a challenge for neuroimaging. Nat Rev Neurosci. 2003; 4:863–872. [PubMed: 14595398]
Daselaar SM, Veltman DJ, Rombouts SA, Raaijmakers JG, Jonker C. Neuroanatomical correlates ofepisodic encoding and retrieval in young and elderly subjects. Brain. 2003; 126:43–56. [PubMed:12477696]
Davis SW, Dennis NA, Daselaar SM, Fleck MS, Cabeza R. Que PASA? The posterior–anterior shift inaging. Cereb Cortex. 2008; 18:1201–1209. [PubMed: 17925295]
De Groot JC, De Leeuw FE, Oudkerk M, Van Gijn J, Hofman A, Jolles J, Breteler MM.Periventricular cerebral white matter lesions predict rate of cognitive decline. Ann Neurol. 2002;52:335–341. [PubMed: 12205646]
de Leeuw FE, de Groot JC, Oudkerk M, Witteman JC, Hofman A, van Gijn J, Breteler MM. A follow-up study of blood pressure and cerebral white matter lesions. Ann Neurol. 1999; 46:827–833.[PubMed: 10589534]
DeCarli C, Miller BL, Swan GE, Reed T, Wolf PA, Carmelli D. Cerebrovascular and brainmorphologic correlates of mild cognitive impairment in the National Heart, Lung, and BloodInstitute Twin Study. Arch Neurol. 2001; 58:643–647. [PubMed: 11295996]
Dufouil C, de Kersaint-Gilly A, Besancon V, Levy C, Auffray E, Brunnereau L, Alperovitch A,Tzourio C. Longitudinal study of blood pressure and white matter hyperintensities: the EVA MRICohort. Neurology. 2001; 56:921–926. [PubMed: 11294930]
Emerson M, Miyake A. The role of inner speech in task switching: a dual-task investigation. JMemory Lang. 2003; 48:148–168.
Erickson KI, Raji CA, Lopez OL, Becker JT, Rosano C, Newman AB, Gach HM, Thompson PM, HoAJ, Kuller LH. Physical activity predicts gray matter volume in late adulthood: the CardiovascularHealth Study. Neurology. 2010; 75:1415–1422. [PubMed: 20944075]
Flood DG, Coleman PD. Neuron numbers and sizes in aging brain: comparisons of human, monkey,and rodent data. Neurobiol Aging. 1988; 9:453–463. [PubMed: 3145463]
Fuster, JM. Cortex and mind: unifying cognition. Oxford University Press; New York: 2003.Gathercole SE, Pickering SJ, Ambridge B, Wearing H. The structure of working memory from 4 to 15
years of age. Dev Psychol. 2004; 40:177–190. [PubMed: 14979759]Giedd JN, Blumenthal J, Jeffries NO, Castellanos FX, Liu H, Zijdenbos A, Paus T, Evans AC,
Rapoport JL. Brain development during childhood and adolescence: a longitudinal MRI study. NatNeurosci. 1999; 2:861–863. [PubMed: 10491603]
Gogtay N, Giedd JN, Lusk L, Hayashi KM, Greenstein D, Vaituzis AC, Nugent TF III, Herman DH,Clasen LS, Toga AW, Rapoport JL, Thompson PM. Dynamic mapping of human corticaldevelopment during childhood through early adulthood. Proc Natl Acad Sci USA. 2004;101:8174–8179. [PubMed: 15148381]
Grady C, McIntosh A, Craik F. Age-related differences in the functional connectivity of thehippocampus during memory encoding. Hippocampus. 2003; 13:572–586. [PubMed: 12921348]
Grady CL, Springer MV, Hongwanishkul D, McIntosh AR, Winocur G. Age-related changes in brainactivity across the adult lifespan. J Cogn Neurosci. 2006; 18:227–241. [PubMed: 16494683]
Grasby PM, Frith CD, Friston KJ, Simpson J, Fletcher PC, Frackowiak RS, Dolan RJ. A graded taskapproach to the functional mapping of brain areas implicated in auditory-verbal memory. Brain.1994; 117(Pt 6):1271–1282. [PubMed: 7820565]
Gunning-Dixon FM, Raz N. The cognitive correlates of white matter abnormalities in normal aging: aquantitative review. Neuropsychology. 2000; 14:224–232. [PubMed: 10791862]
Head D, Buckner RL, Shimony JS, Williams LE, Akbudak E, Conturo TE, McAvoy M, Morris JC,Snyder AZ. Differential vulnerability of anterior white matter in nondemented aging with minimalacceleration in dementia of the Alzheimer type: evidence from diffusion tensor imaging. CerebCortex. 2004; 14:410–423. [PubMed: 15028645]
Henson RN, Burgess N, Frith CD. Recoding, storage, rehearsal and grouping in verbal short-termmemory: an fMRI study. Neuropsychologia. 2000; 38:426–440. [PubMed: 10683393]
Huizinga M, Dolan CV, van der Molen MW. Age-related change in executive function: developmentaltrends and a latent variable analysis. Neuropsychologia. 2006; 44:2017–2036. [PubMed:16527316]
Aine et al. Page 15
Brain Topogr. Author manuscript; available in PMC 2012 October 1.
NIH
-PA Author Manuscript
NIH
-PA Author Manuscript
NIH
-PA Author Manuscript
Huttenlocher PR. Synaptic density in human frontal cortex—developmental changes and effects ofaging. Brain Res. 1979; 163:195–205. [PubMed: 427544]
Iannetti GD, Wise RG. BOLD functional MRI in disease and pharmacological studies: room forimprovement? Magn Reson Imaging. 2007; 25:978–988. [PubMed: 17499469]
Illes J, Kirschen MP, Edwards E, Stanford LR, Bandettini P, Cho MK, Ford PJ, Glover GH, KulynychJ, Macklin R, Michael DB, Wolf SM. Ethics. Incidental findings in brain imaging research.Science. 2006; 311:783–784. [PubMed: 16469905]
Inzitari D. Age-related white matter changes and cognitive impairment. Ann Neurol. 2000; 47:141–143. [PubMed: 10665482]
Jagust, WJ. Neuroimaging in normal aging and dementia. In: Albert, M.; Knoefel, J., editors. Clinicalneurology of aging. 2. Oxford University Press; New York: 1994. p. 190-213.
Kannurpatti SS, Motes MA, Rypma B, Biswal BB. Increasing measurement accuracy of age-relatedBOLD signal change: minimizing vascular contributions by resting-state-fluctuation-of-amplitudescaling. Hum Brain Mapp. 2011
Klingberg T. Development of a superior frontal-intraparietal network for visuospatial workingmemory. Neuropsychologia. 2006; 44:2171–2177. [PubMed: 16405923]
Kray J, Eber J, Lindenberger U. Age differences in executive functioning across the lifespan: the roleof verbalization in task preparation. Acta Psychol (Amst). 2004; 115:143–165. [PubMed:14962398]
Kuo HK, Lipsitz LA. Cerebral white matter changes and geriatric syndromes: is there a link? JGerontol A. 2004; 59:818–826.
Lenroot RK, Giedd JN. Brain development in children and adolescents: insights from anatomicalmagnetic resonance imaging. Neurosci Biobehav Rev. 2006; 30:718–729. [PubMed: 16887188]
Lindenberger U, Scherer H, Baltes PB. The strong connection between sensory and cognitiveperformance in old age: not due to sensory acuity reductions operating during cognitiveassessment. Psychol Aging. 2001; 16:196–205. [PubMed: 11405308]
Logan JM, Sanders AL, Snyder AZ, Morris JC, Buckner RL. Under-recruitment and nonselectiverecruitment: dissociable neural mechanisms associated with aging. Neuron. 2002; 33:827–840.[PubMed: 11879658]
Luna B, Sweeney JA. The emergence of collaborative brain function: FMRI studies of thedevelopment of response inhibition. Ann N Y Acad Sci. 2004; 1021:296–309. [PubMed:15251900]
Luria AR. The directive function of speech in development and dissolution, Part 1. Word. 1959;15:341–352.
Madden DJ, Turkington TG, Provenzale JM, Denny LL, Hawk TC, Gottlob LR, Coleman RE. Adultage differences in the functional neuroanatomy of verbal recognition memory. Hum Brain Mapp.1999; 7:115–135. [PubMed: 9950069]
Manschot SM, Brands AM, van der Grond J, Kessels RP, Algra A, Kappelle LJ, Biessels GJ. Brainmagnetic resonance imaging correlates of impaired cognition in patients with type 2 diabetes.Diabetes. 2006; 55:1106–1113. [PubMed: 16567535]
Marks BL, Madden DJ, Bucur B, Provenzale JM, White LE, Cabeza R, Huettel SA. Role of aerobicfitness and aging on cerebral white matter integrity. Ann N Y Acad Sci. 2007; 1097:171–174.[PubMed: 17413020]
Mazziotta JC, Toga AW, Evans A, Fox P, Lancaster J. A probabilistic atlas of the human brain: theoryand rationale for its development. The International Consortium for Brain Mapping (ICBM).Neuroimage. 1995; 2:89–101. [PubMed: 9343592]
Meulenbroek O, Petersson KM, Voermans N, Weber B, Fernandez G. Age differences in neuralcorrelates of route encoding and route recognition. Neuroimage. 2004; 22:1503–1514. [PubMed:15275907]
Miller MB, Van Horn JD, Wolford GL, Handy TC, Valsangkar-Smyth M, Inati S, Grafton S,Gazzaniga MS. Extensive individual differences in brain activations associated with episodicretrieval are reliable over time. J Cogn Neurosci. 2002; 14:1200–1214. [PubMed: 12495526]
Mori S, Oishi K, Jiang H, Jiang L, Li X, Akhter K, Hua K, Faria AV, Mahmood A, Woods R, TogaAW, Pike GB, Neto PR, Evans A, Zhang J, Huang H, Miller MI, van Zijl P, Mazziotta J.
Aine et al. Page 16
Brain Topogr. Author manuscript; available in PMC 2012 October 1.
NIH
-PA Author Manuscript
NIH
-PA Author Manuscript
NIH
-PA Author Manuscript
Stereotaxic white matter atlas based on diffusion tensor imaging in an ICBM template.Neuroimage. 2008; 40:570–582. [PubMed: 18255316]
Moscovitch M, Winocur G. Frontal lobes, memory, and aging. Ann N Y Acad Sci. 1995; 769:119–150. [PubMed: 8595020]
Mosher JC, Lewis PS, Leahy RM. Multiple dipole modeling and localization from spatio-temporalMEG data. IEEE Trans Biomed Eng. 1992; 39:541–557. [PubMed: 1601435]
Muller NG, Knight RT. The functional neuroanatomy of working memory: contributions of humanbrain lesion studies. Neuroscience. 2006; 139:51–58. [PubMed: 16352402]
Nagy Z, Westerberg H, Klingberg T. Maturation of white matter is associated with the development ofcognitive functions during childhood. J Cogn Neurosci. 2004; 16:1227–1233. [PubMed:15453975]
Nordahl CW, Ranganath C, Yonelinas AP, Decarli C, Fletcher E, Jagust WJ. White matter changescompromise prefrontal cortex function in healthy elderly individuals. J Cogn Neurosci. 2006;18:418–429. [PubMed: 16513006]
Nystrom LE, Braver TS, Sabb FW, Delgado MR, Noll DC, Cohen JD. Working memory for letters,shapes, and locations: fMRI evidence against stimulus-based regional organization in humanprefrontal cortex. Neuroimage. 2000; 11:424–446. [PubMed: 10806029]
Oosterman JM, Sergeant JA, Weinstein HC, Scherder EJ. Timed executive functions and white matterin aging with and without cardiovascular risk factors. Rev Neurosci. 2004; 15:439–462. [PubMed:15656288]
Pantoni L, Poggesi A, Inzitari D. The relation between white-matter lesions and cognition. Curr OpinNeurol. 2007; 20:390–397. [PubMed: 17620872]
Park J, Carp J, Hebrank A, Park DC, Polk TA. Neural specificity predicts fluid processing ability inolder adults. J Neurosci. 2010; 30:9253–9259. [PubMed: 20610760]
Paulesu E, Frith CD, Frackowiak RS. The neural correlates of the verbal component of workingmemory. Nature. 1993; 362:342–345. [PubMed: 8455719]
Paus T, Zijdenbos A, Worsley K, Collins DL, Blumenthal J, Giedd JN, Rapoport JL, Evans AC.Structural maturation of neural pathways in children and adolescents: in vivo study. Science. 1999;283:1908–1911. [PubMed: 10082463]
Persson J, Nyberg L, Lind J, Larsson A, Nilsson LG, Ingvar M, Buckner RL. Structure-functioncorrelates of cognitive decline in aging. Cereb Cortex. 2006; 16:907–915. [PubMed: 16162855]
Petrides M. Frontal lobes and behaviour. Curr Opin Neurobiol. 1994; 4:207–211. [PubMed: 8038578]Poldrack RA. Imaging brain plasticity: conceptual and methodological issues—a theoretical review.
Neuroimage. 2000; 12:1–13. [PubMed: 10875897]Ranken DM, Stephen JM, George JS. MUSIC seeded multi-dipole MEG modeling using the
Constrained Start Spatio-Temporal modeling procedure. Neurol Clin Neurophysiol. 2004;2004:80. [PubMed: 16012631]
Raz N, Gunning FM, Head D, Dupuis JH, McQuain J, Briggs SD, Loken WJ, Thornton AE, Acker JD.Selective aging of the human cerebral cortex observed in vivo: differential vulnerability of theprefrontal gray matter. Cereb Cortex. 1997; 7:268–282. [PubMed: 9143446]
Raz N, Lindenberger U, Rodrigue KM, Kennedy KM, Head D, Williamson A, Dahle C, Gerstorf D,Acker JD. Regional brain changes in aging healthy adults: general trends, individual differencesand modifiers. Cereb Cortex. 2005; 15:1676–1689. [PubMed: 15703252]
Raz N, Ghisletta P, Rodrigue KM, Kennedy KM, Lindenberger U. Trajectories of brain aging inmiddle-aged and older adults: regional and individual differences. Neuroimage. 2010; 51:501–511.[PubMed: 20298790]
Reuter-Lorenz PA, Lustig C. Brain aging: reorganizing discoveries about the aging mind. Curr OpinNeurobiol. 2005; 15:245–251. [PubMed: 15831410]
Reuter-Lorenz PA, Jonides J, Smith EE, Hartley A, Miller A, Marshuetz C, Koeppe RA. Agedifferences in the frontal lateralization of verbal and spatial working memory revealed by PET. JCogn Neurosci. 2000; 12:174–187. [PubMed: 10769314]
Romine CB, Reynolds CR. Sequential memory: a developmental perspective on its relation to frontallobe functioning. Neuropsychol Rev. 2004; 14:43–64. [PubMed: 15260138]
Aine et al. Page 17
Brain Topogr. Author manuscript; available in PMC 2012 October 1.
NIH
-PA Author Manuscript
NIH
-PA Author Manuscript
NIH
-PA Author Manuscript
Ronnlund M, Nyberg L, Backman L, Nilsson LG. Stability, growth, and decline in adult life spandevelopment of declarative memory: cross-sectional and longitudinal data from a population-basedstudy. Psychol Aging. 2005; 20:3–18. [PubMed: 15769210]
Rossini PM, Altamura C, Ferretti A, Vernieri F, Zappasodi F, Caulo M, Pizzella V, Del Gratta C,Romani GL, Tecchio F. Does cerebrovascular disease affect the coupling between neuronalactivity and local haemodynamics? Brain. 2004; 127:99–110. [PubMed: 14570819]
Rowe JW, Kahn RL. Human aging: usual and successful. Science. 1987; 237:143–149. [PubMed:3299702]
Rypma B, D’Esposito M. Isolating the neural mechanisms of age-related changes in human workingmemory. Nat Neurosci. 2000; 3:509–515. [PubMed: 10769393]
Rypma B, Berger JS, Genova HM, Rebbechi D, D’Esposito M. Dissociating age-related changes incognitive strategy and neural efficiency using event-related fMRI. Cortex. 2005; 41:582–594.[PubMed: 16042034]
Rypma B, Berger JS, Prabhakaran V, Bly BM, Kimberg DY, Biswal BB, D’Esposito M. Neuralcorrelates of cognitive efficiency. Neuroimage. 2006; 33:969–979. [PubMed: 17010646]
Sakai KL. Language acquisition and brain development. Science. 2005; 310:815–819. [PubMed:16272114]
Scherf KS, Sweeney JA, Luna B. Brain basis of developmental change in visuospatial workingmemory. J Cogn Neurosci. 2006; 18:1045–1058. [PubMed: 16839280]
Schlaggar BL, Brown TT, Lugar HM, Visscher KM, Miezin FM, Petersen SE. Functionalneuroanatomical differences between adults and school-age children in the processing of singlewords. Science. 2002; 296:1476–1479. [PubMed: 12029136]
Schmidt R, Scheltens P, Erkinjuntti T, Pantoni L, Markus HS, Wallin A, Barkhof F, Fazekas F. Whitematter lesion progression: a surrogate endpoint for trials in cerebral small-vessel disease.Neurology. 2004; 63:139–144. [PubMed: 15249623]
Smith SM, Jenkinson M, Johansen-Berg H, Rueckert D, Nichols TE, MacKay CE, Watkins KE,Ciccarelli O, Cader MZ, Mathews PM, Behrens TEJ. Tract-based spatial statistics: voxelwiseanalysis of multi-subject diffusion data. Neuroimage. 2006; 31:1487–1505. [PubMed: 16624579]
Sowell ER, Thompson PM, Tessner KD, Toga AW. Mapping continued brain growth and gray matterdensity reduction in dorsal frontal cortex: inverse relationships during postadolescent brainmaturation. J Neurosci. 2001; 21:8819–8829. [PubMed: 11698594]
Sowell ER, Peterson BS, Thompson PM, Welcome SE, Henkenius AL, Toga AW. Mapping corticalchange across the human life span. Nat Neurosci. 2003; 6:309–315. [PubMed: 12548289]
Taki Y, Kinomura S, Sato K, Goto R, Wu K, Kawashima R, Fukuda H. Correlation between degree ofwhite matter hyperintensities and global gray matter volume decline rate. Neuroradiology. 2010
Terry RD, DeTeresa R, Hansen LA. Neocortical cell counts in normal human adult aging. Ann Neurol.1987; 21:530–539. [PubMed: 3606042]
Tisserand DJ, Jolles J. On the involvement of prefrontal networks in cognitive ageing. Cortex. 2003;39:1107–1128. [PubMed: 14584569]
Tullberg M, Fletcher E, DeCarli C, Mungas D, Reed BR, Harvey DJ, Weiner MW, Chui HC, JagustWJ. White matter lesions impair frontal lobe function regardless of their location. Neurology.2004; 63:246–253. [PubMed: 15277616]
Tun PA, Wingfield A, Rosen MJ, Blanchard L. Response latencies for false memories: gist-basedprocesses in normal aging. Psychol Aging. 1998; 13:230–241. [PubMed: 9640584]
Van Horn JD, Grafton ST, Miller MB. Individual variability in brain activity: a nuisance or anopportunity? Brain Imaging Behav. 2008; 2:327–334. [PubMed: 19777073]
Walter H, Bretschneider V, Gron G, Zurowski B, Wunderlich AP, Tomczak R, Spitzer M. Evidencefor quantitative domain dominance for verbal and spatial working memory in frontal and parietalcortex. Cortex. 2003; 39:897–911. [PubMed: 14584558]
West RL. An application of prefrontal cortex function theory to cognitive aging. Psychol Bull. 1996;120:272–292. [PubMed: 8831298]
Westlye LT, Walhovd KB, Dale AM, Bjornerud A, Due-Tonnessen P, Engvig A, Grydeland H,Tamnes CK, Ostby Y, Fjell AM. Differentiating maturational and aging-related changes of the
Aine et al. Page 18
Brain Topogr. Author manuscript; available in PMC 2012 October 1.
NIH
-PA Author Manuscript
NIH
-PA Author Manuscript
NIH
-PA Author Manuscript

cerebral cortex by use of thickness and signal intensity. Neuroimage. 2010; 52:172–185.[PubMed: 20347997]
Yue NC, Arnold AM, Longstreth WT Jr, Elster AD, Jungreis CA, O’Leary DH, Poirier VC, BryanRN. Sulcal, ventricular, and white matter changes at MR imaging in the aging brain: data fromthe Cardiovascular Health Study. Radiology. 1997; 202:33–39. [PubMed: 8988189]
Zarahn E, Rakitin B, Abela D, Flynn J, Stern Y. Age-related changes in brain activation during adelayed item recognition task. Neurobiol Aging. 2007; 28:784–798. [PubMed: 16621168]
Zelazo PD, Craik FI, Booth L. Executive function across the life span. Acta Psychol (Amst). 2004;115:167–183. [PubMed: 14962399]
Aine et al. Page 19
Brain Topogr. Author manuscript; available in PMC 2012 October 1.
NIH
-PA Author Manuscript
NIH
-PA Author Manuscript
NIH
-PA Author Manuscript
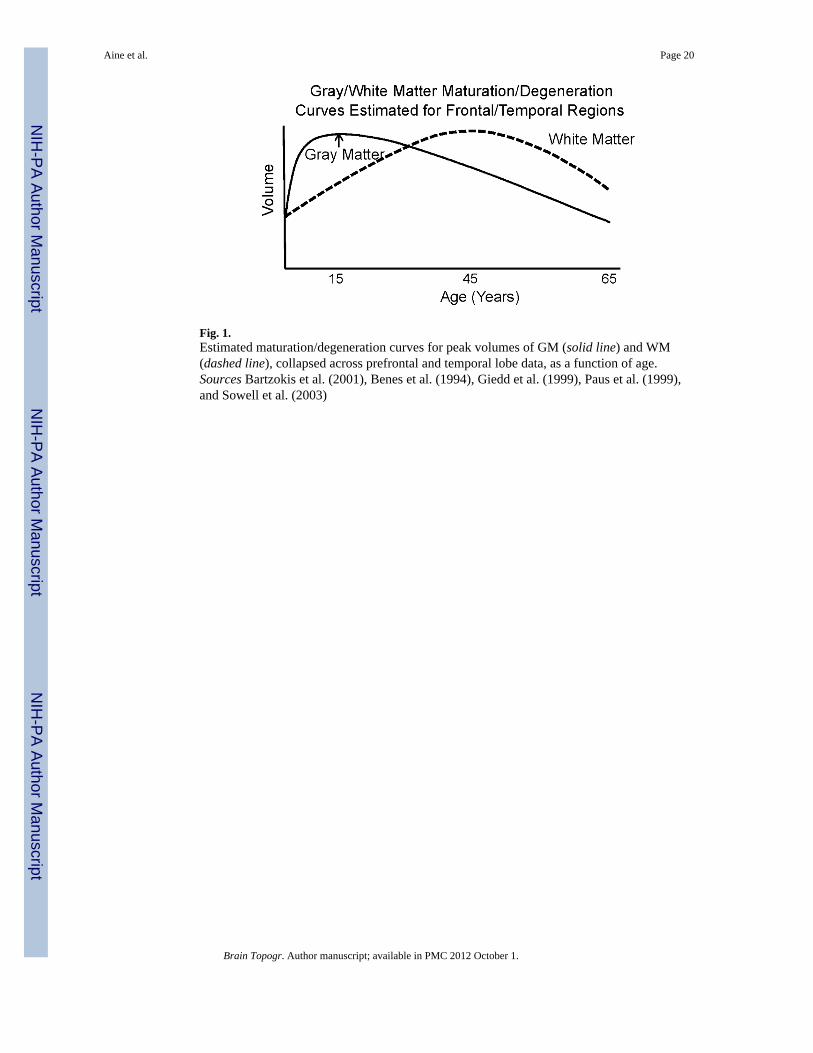
Fig. 1.Estimated maturation/degeneration curves for peak volumes of GM (solid line) and WM(dashed line), collapsed across prefrontal and temporal lobe data, as a function of age.Sources Bartzokis et al. (2001), Benes et al. (1994), Giedd et al. (1999), Paus et al. (1999),and Sowell et al. (2003)
Aine et al. Page 20
Brain Topogr. Author manuscript; available in PMC 2012 October 1.
NIH
-PA Author Manuscript
NIH
-PA Author Manuscript
NIH
-PA Author Manuscript
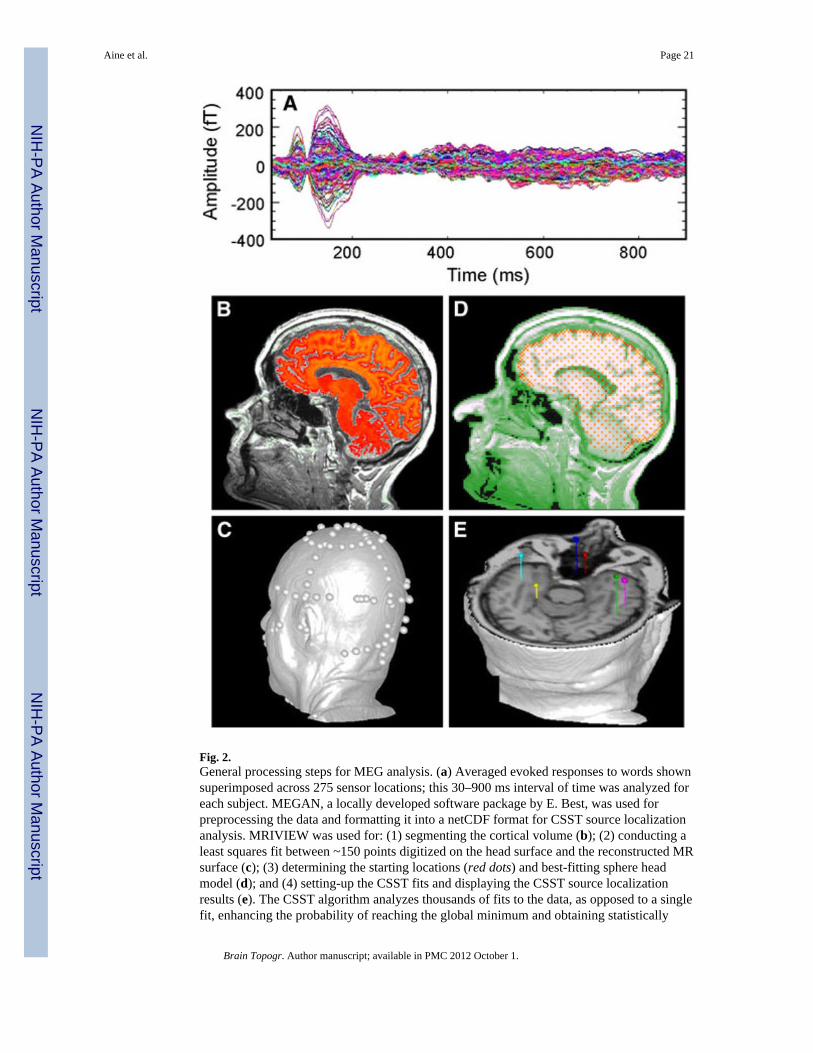
Fig. 2.General processing steps for MEG analysis. (a) Averaged evoked responses to words shownsuperimposed across 275 sensor locations; this 30–900 ms interval of time was analyzed foreach subject. MEGAN, a locally developed software package by E. Best, was used forpreprocessing the data and formatting it into a netCDF format for CSST source localizationanalysis. MRIVIEW was used for: (1) segmenting the cortical volume (b); (2) conducting aleast squares fit between ~150 points digitized on the head surface and the reconstructed MRsurface (c); (3) determining the starting locations (red dots) and best-fitting sphere headmodel (d); and (4) setting-up the CSST fits and displaying the CSST source localizationresults (e). The CSST algorithm analyzes thousands of fits to the data, as opposed to a singlefit, enhancing the probability of reaching the global minimum and obtaining statistically
Aine et al. Page 21
Brain Topogr. Author manuscript; available in PMC 2012 October 1.
NIH
-PA Author Manuscript
NIH
-PA Author Manuscript
NIH
-PA Author Manuscript

adequate and accurate solutions (e.g., 20,000–25,000 fits to the data were conducted for 7-and 8-source models with fewer numbers of fits for lower-order models)
Aine et al. Page 22
Brain Topogr. Author manuscript; available in PMC 2012 October 1.
NIH
-PA Author Manuscript
NIH
-PA Author Manuscript
NIH
-PA Author Manuscript

Fig. 3.Simulation results for a 4-source model where all sources became synchronous during thelater interval. Amplitudes and peak latencies were jittered across each of 128 single trials.Upper left: Actual source locations of the four 20 mm2 cortical patches (cross-hairs) forprimary visual cortex (V1), inferior lateral occipital gyrus (I.LOG), intraparietal sulcus (IPS),dorsolateral prefrontal cortex (DLPF). Red–orange color on the MRIs reflect segmentedcortex which was used to help establish a grid of possible starting points for the CSSTalgorithm. Left middle: Time-courses of activity supplied to each cortical patch. Lower left:Reveals the averaged waveforms as seen from the 275 sensor locations (VSM/CTF OmegaMEG system). Top right: Table of actual source locations, CSST solutions (locations), andresultant location errors. Bottom right: Locations of the CSST solutions and their time-courses (inset). Estimated time-course amplitudes differ somewhat from the currentstrengths assigned to the cortical patches (left middle plot) due to cancellation/summationbetween the individual current elements within each patch
Aine et al. Page 23
Brain Topogr. Author manuscript; available in PMC 2012 October 1.
NIH
-PA Author Manuscript
NIH
-PA Author Manuscript
NIH
-PA Author Manuscript
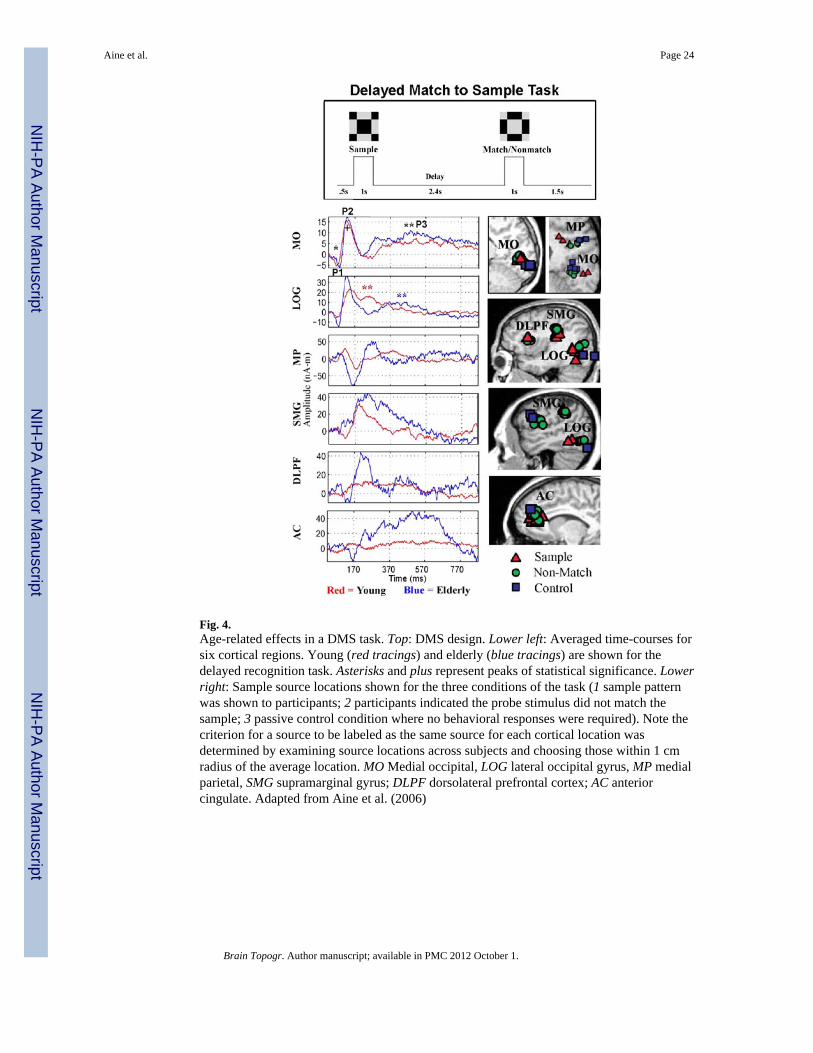
Fig. 4.Age-related effects in a DMS task. Top: DMS design. Lower left: Averaged time-courses forsix cortical regions. Young (red tracings) and elderly (blue tracings) are shown for thedelayed recognition task. Asterisks and plus represent peaks of statistical significance. Lowerright: Sample source locations shown for the three conditions of the task (1 sample patternwas shown to participants; 2 participants indicated the probe stimulus did not match thesample; 3 passive control condition where no behavioral responses were required). Note thecriterion for a source to be labeled as the same source for each cortical location wasdetermined by examining source locations across subjects and choosing those within 1 cmradius of the average location. MO Medial occipital, LOG lateral occipital gyrus, MP medialparietal, SMG supramarginal gyrus; DLPF dorsolateral prefrontal cortex; AC anteriorcingulate. Adapted from Aine et al. (2006)
Aine et al. Page 24
Brain Topogr. Author manuscript; available in PMC 2012 October 1.
NIH
-PA Author Manuscript
NIH
-PA Author Manuscript
NIH
-PA Author Manuscript
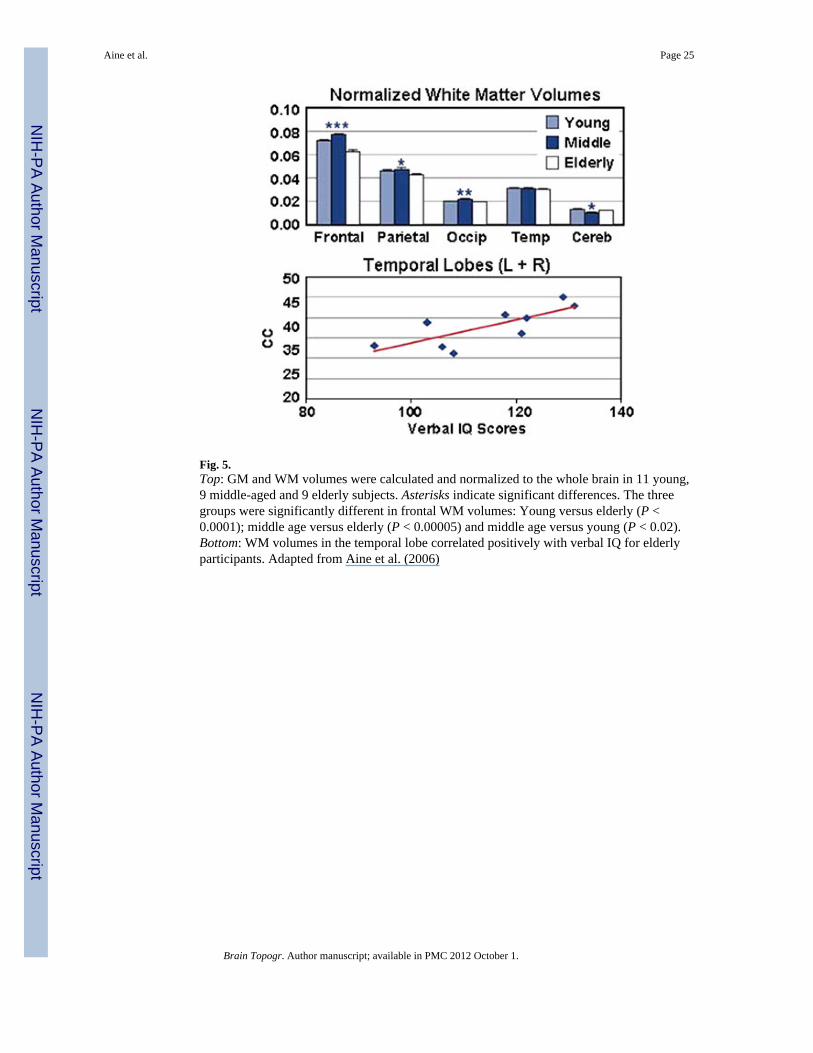
Fig. 5.Top: GM and WM volumes were calculated and normalized to the whole brain in 11 young,9 middle-aged and 9 elderly subjects. Asterisks indicate significant differences. The threegroups were significantly different in frontal WM volumes: Young versus elderly (P <0.0001); middle age versus elderly (P < 0.00005) and middle age versus young (P < 0.02).Bottom: WM volumes in the temporal lobe correlated positively with verbal IQ for elderlyparticipants. Adapted from Aine et al. (2006)
Aine et al. Page 25
Brain Topogr. Author manuscript; available in PMC 2012 October 1.
NIH
-PA Author Manuscript
NIH
-PA Author Manuscript
NIH
-PA Author Manuscript

Fig. 6.a Performance measures are shown for individuals with moderate to severe abnormalitiesrated from their MRIs. The solid black line shows the average response of all the elderlycontrol participants (i.e., no or only mild abnormalities on their MRIs). MSE refers to theirscores on the mini-mental status exam. In the California Verbal Learning Test, a list of 16words is presented five times and participants are explicitly instructed to learn these words.Trials T1–T5 records the number of words recalled. The REY complex figure tests forimplicit spatial memory; i.e., they are not told in advance to remember the details of thefigure they are instructed to copy. After they finish copying the figure the original is takenaway and they are asked to draw it from memory (immediate). After 20 min of additionaltests they are asked to draw the figure once more (delayed). b Time-courses localized toeach cortical region were averaged together for individuals within MRI groups. Parietal(PAR) and anterior temporal lobe (ANT) regions show significantly higher amplitudescompared to the control group and the group with moderate to severe volume loss. Thefrontal (FRO) region showed a trend in the opposite direction
Aine et al. Page 26
Brain Topogr. Author manuscript; available in PMC 2012 October 1.
NIH
-PA Author Manuscript
NIH
-PA Author Manuscript
NIH
-PA Author Manuscript

Fig. 7.Upper left: MRIs show three cortical regions found during source localization that helped todifferentiate between the three groups identified in a cluster analysis. Upper right: A clusteranalysis performed on the MEG data shows three different activation patterns. The bargraphs show the relative weightings for each area (i.e., the percentage of participantsshowing activity in these regions by group; 1 = 100%). Bottom: The table shows averagegroup characteristics. Full IQ Full scale IQ on WAIS-R, MSE mini mental status examscore, EDU education level, CVLT California Verbal Learning Test, REYD delayed recall ofthe REY complex figure test, ANT anterior temporal lobe, FRO frontal, PAR parietal, OCCoccipital, PRE premotor, AC anterior cingulate. Asterisks represent statistical significance.Adapted from Aine et al. (2010)
Aine et al. Page 27
Brain Topogr. Author manuscript; available in PMC 2012 October 1.
NIH
-PA Author Manuscript
NIH
-PA Author Manuscript
NIH
-PA Author Manuscript
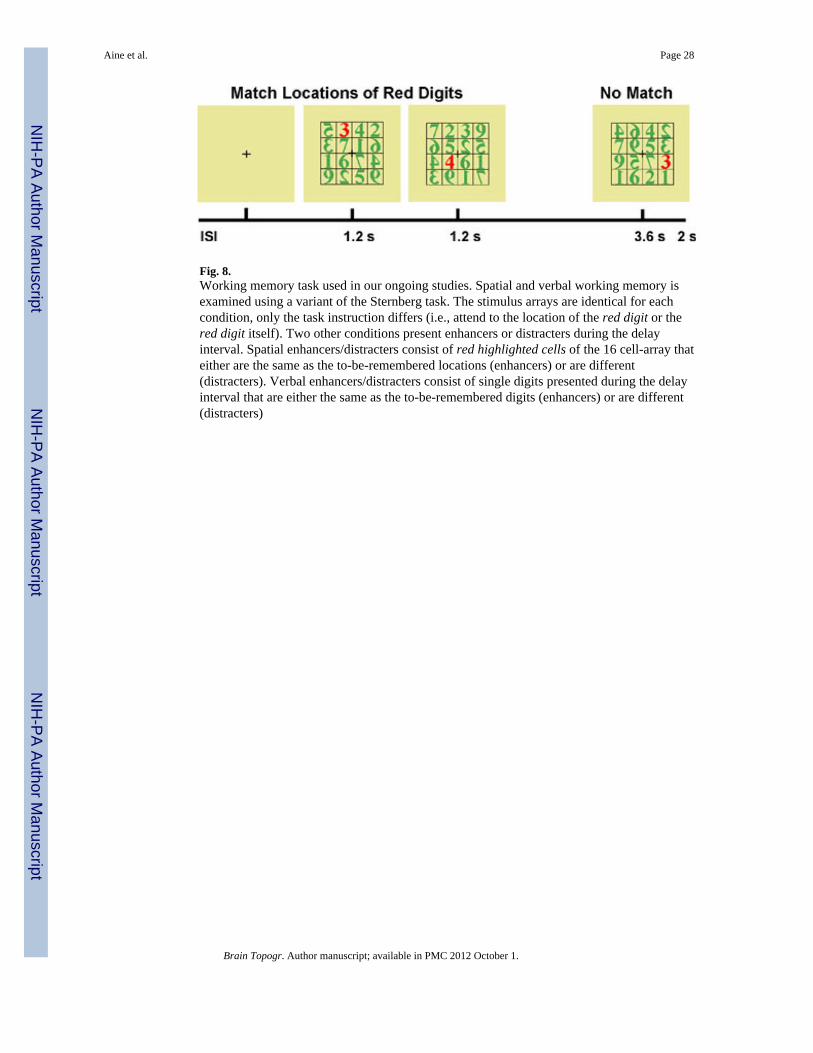
Fig. 8.Working memory task used in our ongoing studies. Spatial and verbal working memory isexamined using a variant of the Sternberg task. The stimulus arrays are identical for eachcondition, only the task instruction differs (i.e., attend to the location of the red digit or thered digit itself). Two other conditions present enhancers or distracters during the delayinterval. Spatial enhancers/distracters consist of red highlighted cells of the 16 cell-array thateither are the same as the to-be-remembered locations (enhancers) or are different(distracters). Verbal enhancers/distracters consist of single digits presented during the delayinterval that are either the same as the to-be-remembered digits (enhancers) or are different(distracters)
Aine et al. Page 28
Brain Topogr. Author manuscript; available in PMC 2012 October 1.
NIH
-PA Author Manuscript
NIH
-PA Author Manuscript
NIH
-PA Author Manuscript
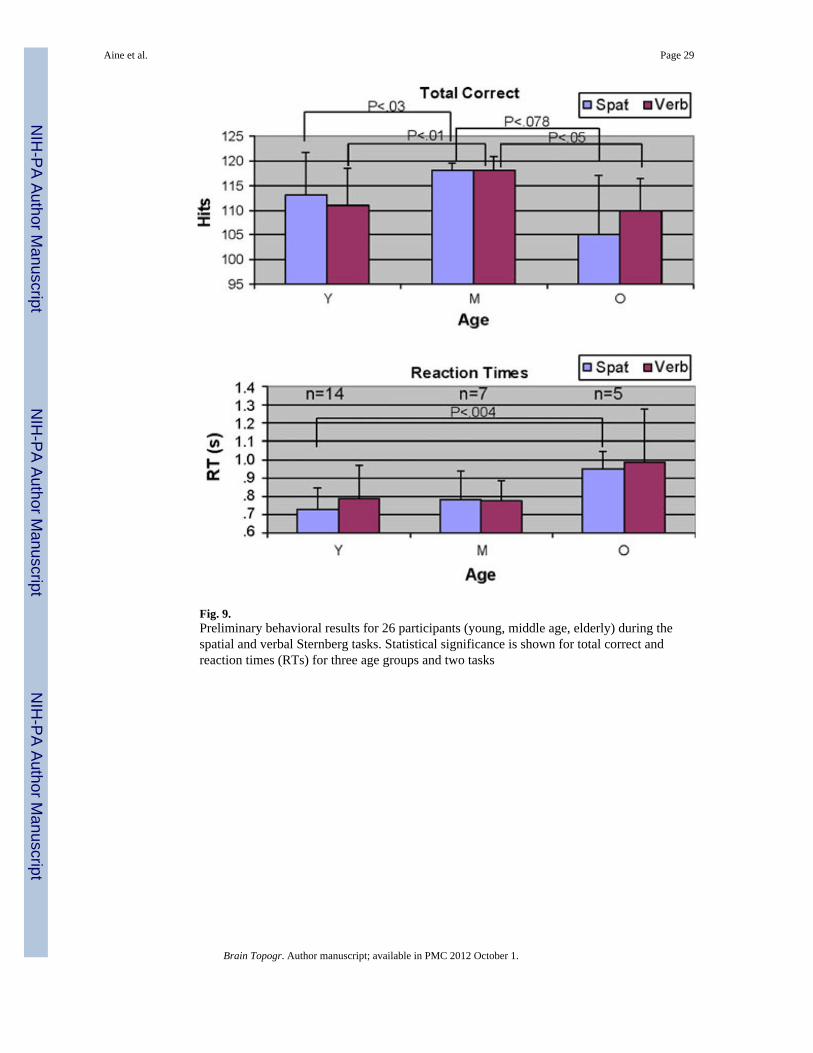
Fig. 9.Preliminary behavioral results for 26 participants (young, middle age, elderly) during thespatial and verbal Sternberg tasks. Statistical significance is shown for total correct andreaction times (RTs) for three age groups and two tasks
Aine et al. Page 29
Brain Topogr. Author manuscript; available in PMC 2012 October 1.
NIH
-PA Author Manuscript
NIH
-PA Author Manuscript
NIH
-PA Author Manuscript
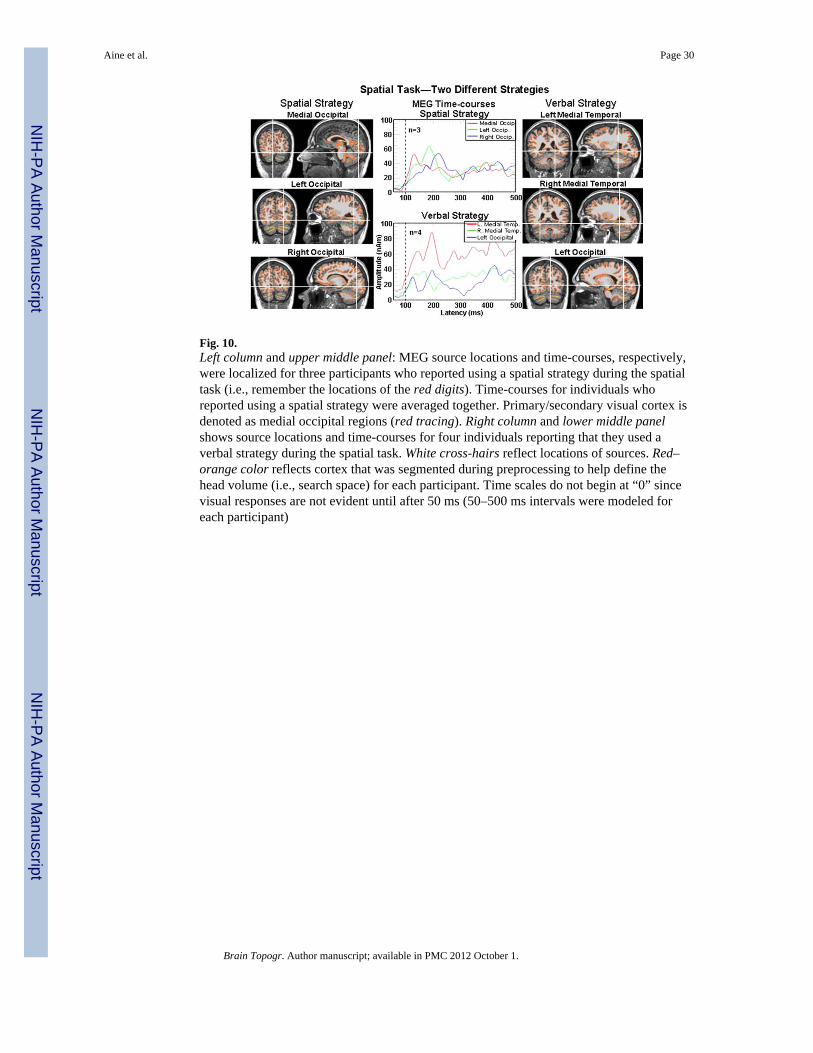
Fig. 10.Left column and upper middle panel: MEG source locations and time-courses, respectively,were localized for three participants who reported using a spatial strategy during the spatialtask (i.e., remember the locations of the red digits). Time-courses for individuals whoreported using a spatial strategy were averaged together. Primary/secondary visual cortex isdenoted as medial occipital regions (red tracing). Right column and lower middle panelshows source locations and time-courses for four individuals reporting that they used averbal strategy during the spatial task. White cross-hairs reflect locations of sources. Red–orange color reflects cortex that was segmented during preprocessing to help define thehead volume (i.e., search space) for each participant. Time scales do not begin at “0” sincevisual responses are not evident until after 50 ms (50–500 ms intervals were modeled foreach participant)
Aine et al. Page 30
Brain Topogr. Author manuscript; available in PMC 2012 October 1.
NIH
-PA Author Manuscript
NIH
-PA Author Manuscript
NIH
-PA Author Manuscript
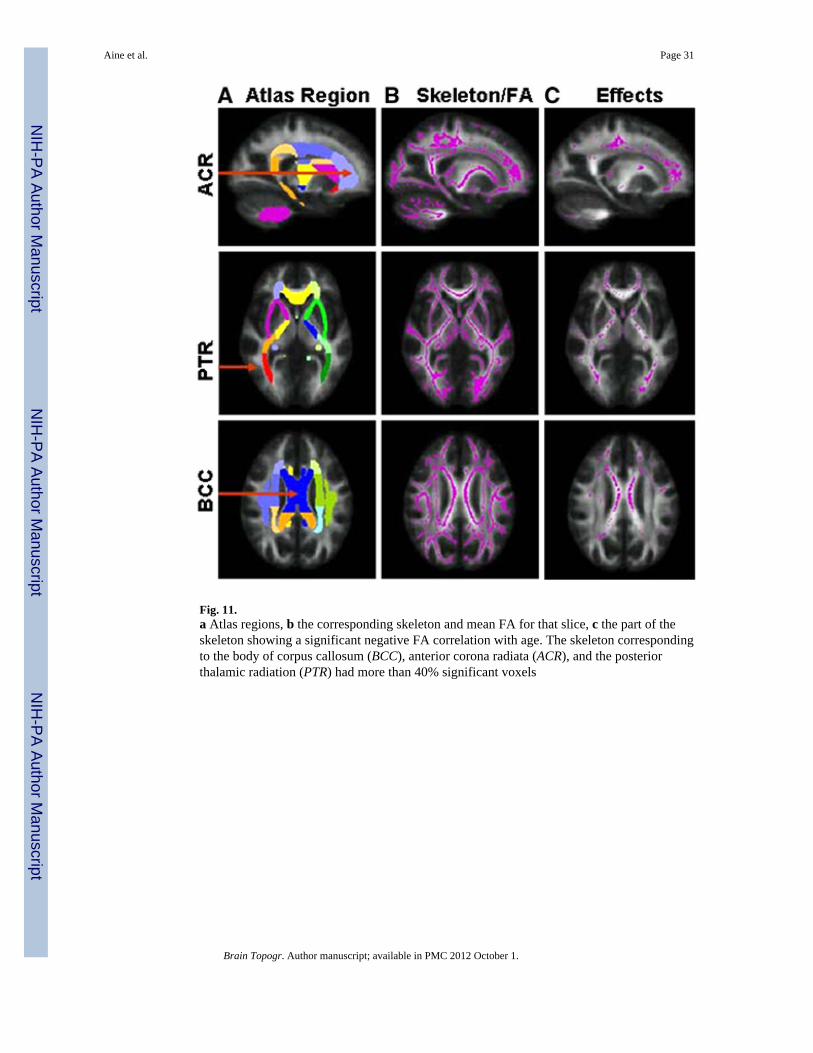
Fig. 11.a Atlas regions, b the corresponding skeleton and mean FA for that slice, c the part of theskeleton showing a significant negative FA correlation with age. The skeleton correspondingto the body of corpus callosum (BCC), anterior corona radiata (ACR), and the posteriorthalamic radiation (PTR) had more than 40% significant voxels
Aine et al. Page 31
Brain Topogr. Author manuscript; available in PMC 2012 October 1.
NIH
-PA Author Manuscript
NIH
-PA Author Manuscript
NIH
-PA Author Manuscript
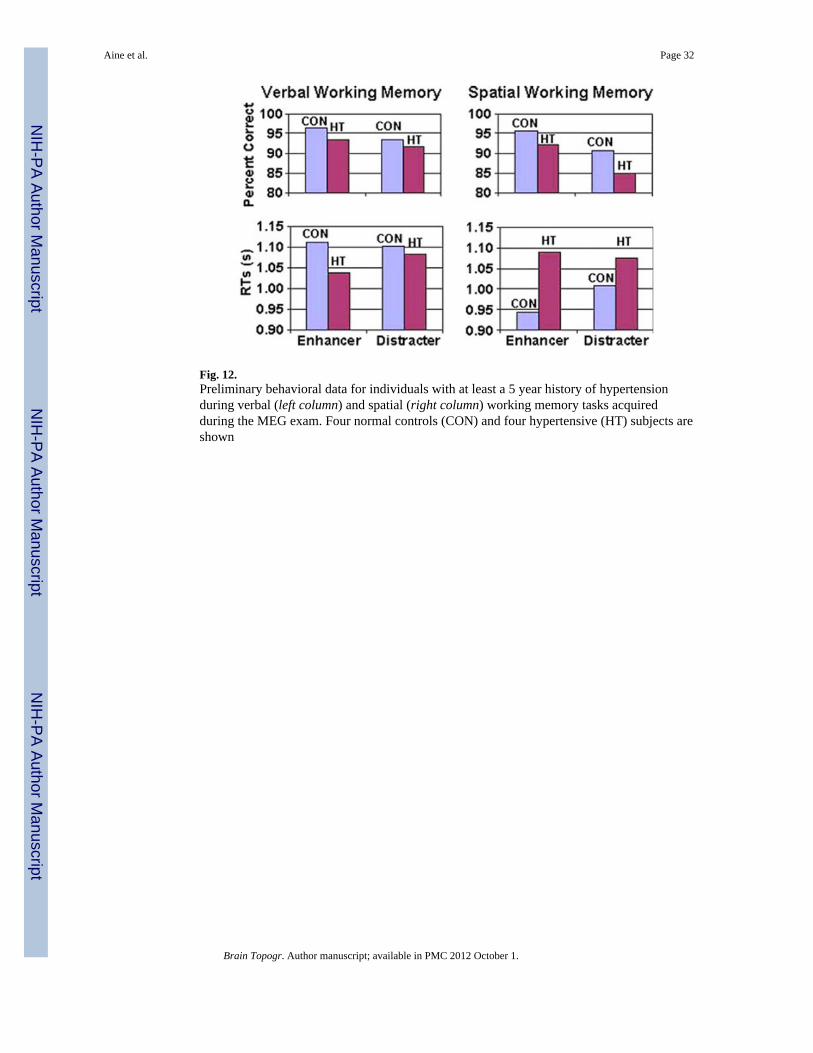
Fig. 12.Preliminary behavioral data for individuals with at least a 5 year history of hypertensionduring verbal (left column) and spatial (right column) working memory tasks acquiredduring the MEG exam. Four normal controls (CON) and four hypertensive (HT) subjects areshown
Aine et al. Page 32
Brain Topogr. Author manuscript; available in PMC 2012 October 1.
NIH
-PA Author Manuscript
NIH
-PA Author Manuscript
NIH
-PA Author Manuscript