determining the three-phase coexistence line in methane
TRANSCRIPT
Determining the three-phase coexistence line in methane hydrates usingcomputer simulations
M. M. Conde and C. Vegaa�
Dept. Química-Física I, Facultad de Ciencias Químicas, Universidad Complutense de Madrid,28040 Madrid, Spain
�Received 12 March 2010; accepted 29 June 2010; published online 12 August 2010�
Molecular dynamics simulations have been performed to estimate the three-phase �solidhydrate-liquid water-gaseous methane� coexistence line for the water-methane binary mixture. Thetemperature at which the three phases are in equilibrium was determined for three differentpressures, namely, 40, 100, and 400 bar by using direct coexistence simulations. In the simulationswater was described by using either TIP4P, TIP4P/2005, or TIP4P/Ice models and methane wasdescribed as simple Lennard-Jones interaction site. Lorentz–Berthelot combining rules were used toobtain the parameters of the cross interactions. For the TIP4P/2005 model positive deviations fromthe energetic Lorentz–Berthelot rule were also considered to indirectly account for the polarizationof methane when introduced in liquid water. To locate the three-phase coexistence point, twodifferent global compositions were used, which yielded �to within statistical uncertainty� the samepredictions for the three-phase coexistence temperatures, although with a somewhat different timeevolution. The three-phase coexistence temperatures obtained at different pressures when using theTIP4P/Ice model of water were in agreement with the experimental results. The main reason for thisis that the TIP4P/Ice model reproduces the melting point of ice Ih. © 2010 American Institute ofPhysics. �doi:10.1063/1.3466751�
I. INTRODUCTION
Gas hydrates are crystalline, nonstoichiometric inclusioncompounds1 formed under high pressure and at moderatelylow temperatures. Their structure consists of a three-dimensional framework of hydrogen-bonded water mol-ecules within which are incorporated a small number of rela-tively inert “guest” molecules, such as CH4, C2H6, C3H8,iC4H10, CO2, and H2S. Also N2, O2, H2, noble gases, andhydrocarbons such as cyclopropane can form hydrates. Mosthydrates are classified into three crystalline structures sI�Ref. 2� �cubic structure�, sII �Ref. 3� �cubic structure�, andsH �Ref. 4� �hexagonal structure� according to the arrange-ment of the water molecules, which is determined mainly bythe size of the guest molecules. The molecules occupying thecavities of the host lattice should be neither too large nor toosmall to yield a stable hydrate.1,5,6 Thus, it is not possible tostudy empty hydrates using experimental methods since theyare thermodynamically unstable, although they can be stud-ied by computer simulation7–14 due to their mechanical sta-bility. In our earlier work, we performed computer simula-tion studies using empty hydrates to estimate the phasediagram of water at negative pressures8 and the difference inthe chemical potential between ice Ih and the empty hydrates,which plays a central role within the widely used van derWaals–Platteeuw theory.15 It was found that the empty hy-drate structures sII and sH become thermodynamically stableat negative pressures.8 This is in agreement with the resultsof Molinero et al.9 who, using a coarse grained model ofwater, also found the sII structure to be stable at negative
pressures. Moreover, we have studied the quantum nucleareffects on empty hydrates analyzing several properties suchas energy, density, the radial distribution function, and theheat capacity.14
Since their discovery,16 a large number of gas hydratesystems have been studied6,17–23 for their scientific interest aswell as the role they play in industry and the environment.Recently, the sII and sH hydrates have attracted greatinterest24–29 due to the possibility of being used for hydrogenstorage. Also, it has been proposed that oceans can storecarbon dioxide in the hydrate form to mitigate its greenhouseeffect.30–33 In the area of medicine hydrate structures havebeen suggested as a medium for organ preservation.34
In nature1,35,36 there are vast quantities of methane hy-drate on the deep ocean regions where the presence of pres-sure combined with low temperatures favors itsformation31,37,38 providing a potential fuel reserve beyondconventional fossil fuel deposits.39 The use of methane hy-drates found on the sea floor as an energy source has at-tracted considerable interest in many countries. However, ifreleased, the methane trapped in hydrate form in largeamounts in oceans40 will contribute significantly to globalwarming. On the other hand, the formation of these com-pounds can cause problems in the flow of gas in natural gaspipelines, additives being needed that act as inhibitors.1,41–45
Therefore, it is desirable to predict the conditions underwhich one should expect that these compounds are formed.In recent times, computer simulation has become a usefultool to draw qualitative conclusions when applied to realsystems.46–61 A significant number of simulations have beenperformed for the methane hydrates62–83 that have helped usa�Electronic mail: [email protected].
THE JOURNAL OF CHEMICAL PHYSICS 133, 064507 �2010�
0021-9606/2010/133�6�/064507/12/$30.00 © 2010 American Institute of Physics133, 064507-1
to understand the behavior of these compounds from a mo-lecular point of view. However, there are still many questionsthat are unresolved in the simulation of methane hydrates,for instance, the mechanism of nucleation and growth. Re-cently, a study has been published by computer simulation ofspontaneous methane hydrate nucleation and growth84,85 us-ing the TIP4P/Ice model proposed by Abascal et al.86 forwater along with a simple Lennard-Jones interaction formethane. The Lennard-Jones parameters used in that workwere taken from Ref. 87. In this study a possible mechanismfor the nucleation and growth of hydrates has been proposedwhich is in line with previous suggestions.74,75,88,89 It shouldbe pointed out that at this moment the three-phase coexist-ence line �hydrate-water-methane� and the four phase coex-istence point �ice-hydrate-water-methane� for most of themodels considered in simulation studies are still unknown.One exception is the studies of Wierzchowski andMonson90,91 who determined coexistence lines using a primi-tive model92,93 of water and a simple model of methane.According to the Gibbs phase rule, for a binary system thereis only one degree of freedom when three phases are present�forming lines on the p−T projection of the phase diagram�and zero degrees of freedom when four phases are present�yielding a singular quadruple point on the p−T projection ofthe phase diagram�. Experimentally, the three-phase coexist-ence line and the quadruple point of the binary water-methane mixture are well known.1 The aspect of the phasediagram obtained by Wierzchowski and Monson was inagreement with the experimental one. Also Westacott andRodger determined the pressure �at a certain temperature� atwhich the methane hydrate becomes unstable with respect toice Ih and methane.94
Thus, there is an increasing interest in studying methanehydrates by computer simulation. These studies are neededto achieve good understanding of the molecular mechanismof nucleation and growth for these compounds. The maingoal of this paper is to estimate the three-phase �hydrate-water-methane� coexistence line using different potentialmodels of water. A comparison with experimental results willillustrate the limitations of the models, and also will showwhich, if any, among the several water models used in thiswork �TIP4P,95 TIP4P/2005,96 TIP4P/Ice86� reproduces theexperimental results. From a technical point of view this pa-per will show that direct coexistence simulations,97–99 whichwere used successfully to find melting points100 of watermodels, can also be used for binary mixtures to search forthree-phase coexistence conditions.
II. METHODOLOGY
Methane hydrate adopts the sI structure. It is simple cu-
bic and has the space group Pm3̄n. The unit cell containseight water cages �six tetradecahedra 51262 and two dodeca-hedra 512�. The unit cell consists of 46 H2O and eight CH4
molecules. For our study we used a methane hydrate con-figuration of 2�2�2 unit cells �a total of 368 watermolecules and 64 methane molecules�. The crystallographicparameters of the methane hydrate were taken from Yousufet al.101
To generate the initial configuration we followed themethodology proposed by Fernandez et al.100 obtaining asystem formed by a slab of liquid water surrounded at oneside by a slab of the methane hydrate and at the other site bya slab of methane molecules in the gas phase. In system A,the slab containing the methane molecules in the gas phasecontains 64 molecules. In system B, the slab containing themethane molecules in the gas phase contains 128 molecules.The global �including all phases within the simulation box�mole fraction of methane in system A is xCH4
�0.15, whereasits value for system B is xCH4
�0.21. The details about thecomposition of the phases are given in Table I. The typicalsize of the simulation box for the initial configuration was55�24�24 Å3 �system A� and 67�24�24 Å3 �systemB�. The interfaces between the three phases are perpendicularto the x axis. From 67 Å in the direction perpendicular to theinterface, about 24 Å was occupied by methane hydrate,about 22 Å by water, and about 21 Å by methane gas. Hy-drates present proton disorder.102–104 We used the algorithmproposed by Buch et al.105 to generate solid configurationssatisfying the Bernal–Fowler rules106 and with zero �or al-most zero� dipole moment for the sI hydrate. Periodic bound-ary conditions were employed in the three directions ofspace. The initial arrangements permit us to have each phasein contact with the other two. The number of methane mol-ecules with the same value of x �the direction perpendicularto the fluid/solid interface� in our seed crystal �which con-tains 2�2�2 unit cells of the sI hydrate� is 12, 4, 12, 4, 12,4, 12, 4 �i.e., 64 methane molecules in total�. Layers contain-ing 12 methane molecules are formed by the large cavities,whereas layers formed by four methane molecules corre-spond to the small cavities. Since our seed crystal acts as atemplate for the growth of the hydrate, each new layer duringthe hydrate growth contains either 12 or 4 methane mol-ecules.
Figure 1 shows the experimental temperature-composition coexistence diagram of the methane-water mix-ture for a certain fixed pressure as reproduced artistically
TABLE I. Number of molecules situated in the different phases for two systems A and B studied in this work.Methane mole fraction is denoted by xCH4
. We have also studied a system with double size of that of system Aand we have denoted it as system A�.
System Hydrate phase Liquid phase Vapor phase Mole fraction �xCH4�
A 368 water/64 methane 368 water 64 methane �0.15A� 736 water/128 methane 736 water 128 methane �0.15B 368 water/64 methane 368 water 128 methane �0.21
064507-2 M. M. Conde and C. Vega J. Chem. Phys. 133, 064507 �2010�
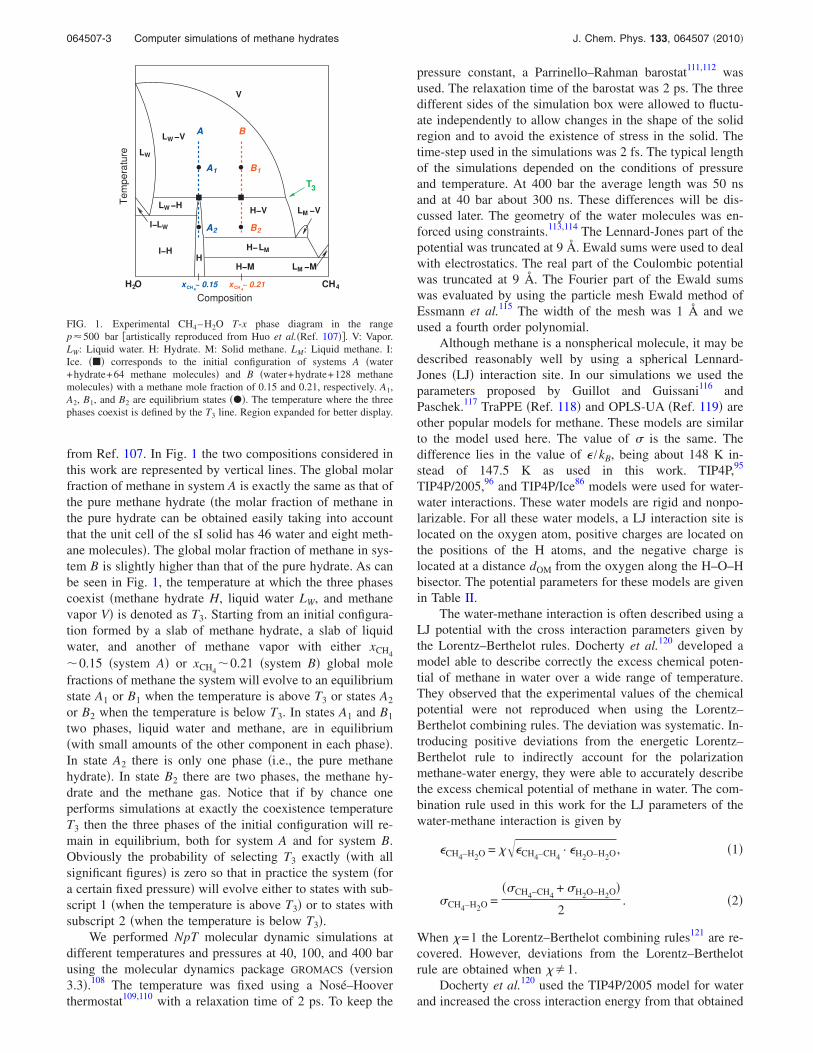
from Ref. 107. In Fig. 1 the two compositions considered inthis work are represented by vertical lines. The global molarfraction of methane in system A is exactly the same as that ofthe pure methane hydrate �the molar fraction of methane inthe pure hydrate can be obtained easily taking into accountthat the unit cell of the sI solid has 46 water and eight meth-ane molecules�. The global molar fraction of methane in sys-tem B is slightly higher than that of the pure hydrate. As canbe seen in Fig. 1, the temperature at which the three phasescoexist �methane hydrate H, liquid water LW, and methanevapor V� is denoted as T3. Starting from an initial configura-tion formed by a slab of methane hydrate, a slab of liquidwater, and another of methane vapor with either xCH4�0.15 �system A� or xCH4
�0.21 �system B� global molefractions of methane the system will evolve to an equilibriumstate A1 or B1 when the temperature is above T3 or states A2
or B2 when the temperature is below T3. In states A1 and B1
two phases, liquid water and methane, are in equilibrium�with small amounts of the other component in each phase�.In state A2 there is only one phase �i.e., the pure methanehydrate�. In state B2 there are two phases, the methane hy-drate and the methane gas. Notice that if by chance oneperforms simulations at exactly the coexistence temperatureT3 then the three phases of the initial configuration will re-main in equilibrium, both for system A and for system B.Obviously the probability of selecting T3 exactly �with allsignificant figures� is zero so that in practice the system �fora certain fixed pressure� will evolve either to states with sub-script 1 �when the temperature is above T3� or to states withsubscript 2 �when the temperature is below T3�.
We performed NpT molecular dynamic simulations atdifferent temperatures and pressures at 40, 100, and 400 barusing the molecular dynamics package GROMACS �version3.3�.108 The temperature was fixed using a Nosé–Hooverthermostat109,110 with a relaxation time of 2 ps. To keep the
pressure constant, a Parrinello–Rahman barostat111,112 wasused. The relaxation time of the barostat was 2 ps. The threedifferent sides of the simulation box were allowed to fluctu-ate independently to allow changes in the shape of the solidregion and to avoid the existence of stress in the solid. Thetime-step used in the simulations was 2 fs. The typical lengthof the simulations depended on the conditions of pressureand temperature. At 400 bar the average length was 50 nsand at 40 bar about 300 ns. These differences will be dis-cussed later. The geometry of the water molecules was en-forced using constraints.113,114 The Lennard-Jones part of thepotential was truncated at 9 Å. Ewald sums were used to dealwith electrostatics. The real part of the Coulombic potentialwas truncated at 9 Å. The Fourier part of the Ewald sumswas evaluated by using the particle mesh Ewald method ofEssmann et al.115 The width of the mesh was 1 Å and weused a fourth order polynomial.
Although methane is a nonspherical molecule, it may bedescribed reasonably well by using a spherical Lennard-Jones �LJ� interaction site. In our simulations we used theparameters proposed by Guillot and Guissani116 andPaschek.117 TraPPE �Ref. 118� and OPLS-UA �Ref. 119� areother popular models for methane. These models are similarto the model used here. The value of � is the same. Thedifference lies in the value of � /kB, being about 148 K in-stead of 147.5 K as used in this work. TIP4P,95
TIP4P/2005,96 and TIP4P/Ice86 models were used for water-water interactions. These water models are rigid and nonpo-larizable. For all these water models, a LJ interaction site islocated on the oxygen atom, positive charges are located onthe positions of the H atoms, and the negative charge islocated at a distance dOM from the oxygen along the H–O–Hbisector. The potential parameters for these models are givenin Table II.
The water-methane interaction is often described using aLJ potential with the cross interaction parameters given bythe Lorentz–Berthelot rules. Docherty et al.120 developed amodel able to describe correctly the excess chemical poten-tial of methane in water over a wide range of temperature.They observed that the experimental values of the chemicalpotential were not reproduced when using the Lorentz–Berthelot combining rules. The deviation was systematic. In-troducing positive deviations from the energetic Lorentz–Berthelot rule to indirectly account for the polarizationmethane-water energy, they were able to accurately describethe excess chemical potential of methane in water. The com-bination rule used in this work for the LJ parameters of thewater-methane interaction is given by
�CH4–H2O = ���CH4–CH4· �H2O–H2O, �1�
�CH4–H2O =��CH4–CH4
+ �H2O–H2O�
2. �2�
When �=1 the Lorentz–Berthelot combining rules121 are re-covered. However, deviations from the Lorentz–Berthelotrule are obtained when ��1.
Docherty et al.120 used the TIP4P/2005 model for waterand increased the cross interaction energy from that obtained
LW
LM −V
4CH2H O
LW
WL
LMH−
LWI−
LM −M
3T
A1 B1
2BA2
H
V
−V
I−H
−H
H−M
�
Tem
pera
ture
A B
x ~ 0.154CH 4
x ~ 0.21CH
H−V
�
��
� �
Composition
FIG. 1. Experimental CH4–H2O T-x phase diagram in the rangep�500 bar �artistically reproduced from Huo et al.�Ref. 107��. V: Vapor.LW: Liquid water. H: Hydrate. M: Solid methane. LM: Liquid methane. I:Ice. ��� corresponds to the initial configuration of systems A �water+hydrate+64 methane molecules� and B �water+hydrate+128 methanemolecules� with a methane mole fraction of 0.15 and 0.21, respectively. A1,A2, B1, and B2 are equilibrium states ���. The temperature where the threephases coexist is defined by the T3 line. Region expanded for better display.
064507-3 Computer simulations of methane hydrates J. Chem. Phys. 133, 064507 �2010�

from Lorentz–Berthelot �by using �=1.07 in Eq. �1�� as aneffective way of accounting for the polarization of methanewhen dissolved in water. They applied this methane-waterpotential to the study of the solid methane hydrate structureand found that the model described the experimental value ofthe unit cell of the hydrate with an error of about 0.2%. Theimpact of using a polarizable solute model with rigid watermodels has been studied by Dyer et al.122 Also, alternativecombining rules, such as the Kong combining rules,123 havebeen used to predict the phase equilibrium for mixtures ofpolar and nonpolar components124 and for water-n-butaneand water-n-hexane systems.125 Table III shows the cross in-teraction for the different models used in this study. Noticethat the value of �CH4–H2O obtained using the TIP4P/Icemodel of water with �=1 is almost identical to that obtainedusing the TIP4P/2005 model with �=1.07 so that thestrength of the water-methane interactions is similar in bothmodels.
In our study the configuration of hydrate has 100% ofthe cages occupied by methane. From a dynamic point ofview English et al.126 and Myshakin et al.81 found that thedecomposition rate does not depend strongly on the cageoccupancy over 80%–100% occupancy. From a thermody-namic point of view it is expected that the occupation of themethane in the hydrate at equilibrium �i.e., when the solidpresents the lowest possible free energy� is quite high butcertainly not 100%. Although it is expected that the loweroccupation of methane will move somewhat the three-phasecoexistence line �to higher temperatures�, it is expected thatthe effect will be quite small. In any case, this issue could beanalyzed in more detail in future studies. English andPhelan127 also reported a study of methane hydrate dissocia-
tion where the value of the melting point for the 85% and95% occupied systems was found to be similar to the fullyoccupied case.
Let us now present some numbers about the order ofmagnitude of several properties that are relevant for thepresent study. Results will be discussed for the TIP4P/2005.As to the diffusion coefficient of methane in water we found1.33�10−9 and 0.46�10−9 m2 /s for 300 and 265 K, respec-tively, at 400 bar. The diffusion coefficient did not changemuch with the applied pressure. The solubility of methane inTIP4P/2005 water at 373 K has been determined by com-puter simulation by Biscay et al.128 To estimate the solubilitywe have determined Henry’s constant at 280 K for methanein TIP4P/2005 water �with a value of �=1� finding it to be4.24�104 bar. From this value the molar fraction of meth-ane in the liquid phase was estimated to be about9.31�10−4, 2.35�10−3, and 9.43�10−3 for 40, 100, and400 bar, respectively. Taking into account that the liquidphase has 368 molecules, the number of methane moleculesin the water phase is about 0.34, 0.86, and 3.47 for the pres-sures of 40, 100, and 400, respectively. The surface tensionat 300 K of the vapor-liquid interface of pure water whenusing TIP4P/2005 �Refs. 129 and 130� is 69 mJ /m2. It isexpected that the surface tension for the water-methane in-terface will be about 3 mJ /m2 lower �at 40 bar� and about12 mJ /m2 lower at 400 bar �that was the reduction found byBiscay et al.128 for this model at 373 K�. Notice that forsystems of this side the surface contribution to the total freeenergy between fluid phases may be quite important and maybe responsible for driving the fluid phases into a singlephase. This is especially true for system A where the numberof methane molecules in the gas phase is rather small �64�.
III. RESULTS
The energy is expected to fluctuate in NpT simulations.Systematic changes in the energy should only be associatedwith phase transitions. For system A, at high temperaturesthe region formed by hydrate will melt, resulting in a systemwith two phases �liquid water and methane� when reachingthe equilibrium state denoted as A1. However, at low tem-peratures the water and methane will freeze forming a uniquephase of hydrate when reaching the equilibrium state de-noted as A2. At a certain temperature the three phases will be
TABLE II. Potential parameters of the TIP4P �Ref. 95�, TIP4P/2005 �Ref. 96�, and TIP4P/Ice �Ref. 86� models.The distance between the oxygen and the hydrogen sites is dOH. The angle, in degrees, formed by hydrogen,oxygen, and the other hydrogen atom is denoted by �H–O–H. The Lennard-Jones site is located on theoxygen with parameters � and �. The charge on the proton is qH. The negative charge is placed on a point Mat a distance dOM from the oxygen along the H–O–H bisector. The LJ interaction parameters for methane aretaken from Refs. 116 and 117.
ModeldOH
�Å� �H–O–H�
��� /kB
�K�qH
�e�dOM
��
TIP4P 0.9572 104.52 3.1540 78.02 0.52 0.15TIP4P/2005 0.9572 104.52 3.1589 93.2 0.5564 0.1546TIP4P/Ice 0.9572 104.52 3.1668 106.1 0.5897 0.1577CH4 3.730 147.5
TABLE III. Cross interaction parameters for the water-methane interactionas obtained from Lorentz–Berthelot rules ��=1� and from the optimizedpotential ��=1.07� taken from the work of Docherty et al.�Ref. 120�.
Cross interaction �� /kB
�K��
��
TIP4P-CH4 1 107.28 3.442TIP4P/Ice-CH4 1 125.10 3.4484TIP4P/2005-CH4 1 117.25 3.4445TIP4P/2005-CH4 1.07 125.45 3.4445
064507-4 M. M. Conde and C. Vega J. Chem. Phys. 133, 064507 �2010�
in equilibrium. We will denote this temperature �i.e., thethree-phase coexistence temperature for a considered pres-sure� as T3.
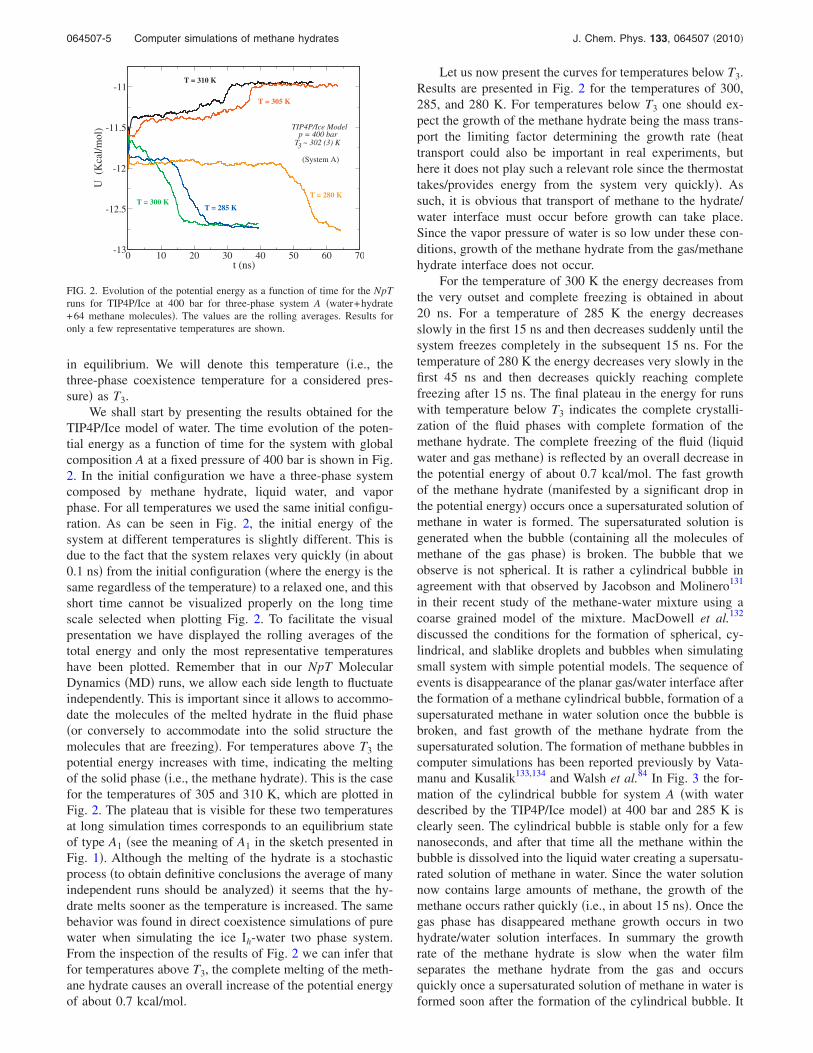
We shall start by presenting the results obtained for theTIP4P/Ice model of water. The time evolution of the poten-tial energy as a function of time for the system with globalcomposition A at a fixed pressure of 400 bar is shown in Fig.2. In the initial configuration we have a three-phase systemcomposed by methane hydrate, liquid water, and vaporphase. For all temperatures we used the same initial configu-ration. As can be seen in Fig. 2, the initial energy of thesystem at different temperatures is slightly different. This isdue to the fact that the system relaxes very quickly �in about0.1 ns� from the initial configuration �where the energy is thesame regardless of the temperature� to a relaxed one, and thisshort time cannot be visualized properly on the long timescale selected when plotting Fig. 2. To facilitate the visualpresentation we have displayed the rolling averages of thetotal energy and only the most representative temperatureshave been plotted. Remember that in our NpT MolecularDynamics �MD� runs, we allow each side length to fluctuateindependently. This is important since it allows to accommo-date the molecules of the melted hydrate in the fluid phase�or conversely to accommodate into the solid structure themolecules that are freezing�. For temperatures above T3 thepotential energy increases with time, indicating the meltingof the solid phase �i.e., the methane hydrate�. This is the casefor the temperatures of 305 and 310 K, which are plotted inFig. 2. The plateau that is visible for these two temperaturesat long simulation times corresponds to an equilibrium stateof type A1 �see the meaning of A1 in the sketch presented inFig. 1�. Although the melting of the hydrate is a stochasticprocess �to obtain definitive conclusions the average of manyindependent runs should be analyzed� it seems that the hy-drate melts sooner as the temperature is increased. The samebehavior was found in direct coexistence simulations of purewater when simulating the ice Ih-water two phase system.From the inspection of the results of Fig. 2 we can infer thatfor temperatures above T3, the complete melting of the meth-ane hydrate causes an overall increase of the potential energyof about 0.7 kcal/mol.
Let us now present the curves for temperatures below T3.Results are presented in Fig. 2 for the temperatures of 300,285, and 280 K. For temperatures below T3 one should ex-pect the growth of the methane hydrate being the mass trans-port the limiting factor determining the growth rate �heattransport could also be important in real experiments, buthere it does not play such a relevant role since the thermostattakes/provides energy from the system very quickly�. Assuch, it is obvious that transport of methane to the hydrate/water interface must occur before growth can take place.Since the vapor pressure of water is so low under these con-ditions, growth of the methane hydrate from the gas/methanehydrate interface does not occur.
For the temperature of 300 K the energy decreases fromthe very outset and complete freezing is obtained in about20 ns. For a temperature of 285 K the energy decreasesslowly in the first 15 ns and then decreases suddenly until thesystem freezes completely in the subsequent 15 ns. For thetemperature of 280 K the energy decreases very slowly in thefirst 45 ns and then decreases quickly reaching completefreezing after 15 ns. The final plateau in the energy for runswith temperature below T3 indicates the complete crystalli-zation of the fluid phases with complete formation of themethane hydrate. The complete freezing of the fluid �liquidwater and gas methane� is reflected by an overall decrease inthe potential energy of about 0.7 kcal/mol. The fast growthof the methane hydrate �manifested by a significant drop inthe potential energy� occurs once a supersaturated solution ofmethane in water is formed. The supersaturated solution isgenerated when the bubble �containing all the molecules ofmethane of the gas phase� is broken. The bubble that weobserve is not spherical. It is rather a cylindrical bubble inagreement with that observed by Jacobson and Molinero131
in their recent study of the methane-water mixture using acoarse grained model of the mixture. MacDowell et al.132
discussed the conditions for the formation of spherical, cy-lindrical, and slablike droplets and bubbles when simulatingsmall system with simple potential models. The sequence ofevents is disappearance of the planar gas/water interface afterthe formation of a methane cylindrical bubble, formation of asupersaturated methane in water solution once the bubble isbroken, and fast growth of the methane hydrate from thesupersaturated solution. The formation of methane bubbles incomputer simulations has been reported previously by Vata-manu and Kusalik133,134 and Walsh et al.84 In Fig. 3 the for-mation of the cylindrical bubble for system A �with waterdescribed by the TIP4P/Ice model� at 400 bar and 285 K isclearly seen. The cylindrical bubble is stable only for a fewnanoseconds, and after that time all the methane within thebubble is dissolved into the liquid water creating a supersatu-rated solution of methane in water. Since the water solutionnow contains large amounts of methane, the growth of themethane occurs rather quickly �i.e., in about 15 ns�. Once thegas phase has disappeared methane growth occurs in twohydrate/water solution interfaces. In summary the growthrate of the methane hydrate is slow when the water filmseparates the methane hydrate from the gas and occursquickly once a supersaturated solution of methane in water isformed soon after the formation of the cylindrical bubble. It
0 10 20 30 40 50 60 70t (ns)
-13
-12.5
-12
-11.5
-11U
(Kca
l/m
ol) TIP4P/Ice Model
T ~ 302 (3) Kp = 400 bar
T = 310 K
T = 305 K
T = 300 KT = 285 K
T = 280 K
3
(System A)
FIG. 2. Evolution of the potential energy as a function of time for the NpTruns for TIP4P/Ice at 400 bar for three-phase system A �water+hydrate+64 methane molecules�. The values are the rolling averages. Results foronly a few representative temperatures are shown.
064507-5 Computer simulations of methane hydrates J. Chem. Phys. 133, 064507 �2010�
should be pointed out that bubble formation should be in-credibly rare under marine conditions135 and that system sizeeffects are enhancing the ease of bubble formation in thepresent study. In fact we have performed a run at 400 bar and290 K for the TIP4P/Ice model using a system with the samecomposition than that of system A but with twice as manymolecules �keeping the area of the interface and multiplyingthe length along the x axis by a factor of 2�. We denoted thissystem as system A�. Details are given in Table I. Simula-tions of this system are quite expensive from a computationalpoint of view. After running 700 ns we observed a continu-ous decrease of the energy without observing bubble forma-tion, thus confirming that finite size effects are importantwhen considering bubble formation. Nevertheless, also forsystem A� the formation of bubble at the end of the growthprocess is expected �although extremely long runs would berequired to obtain total crystallization of the mixture for thissystem size�. The evolution of the potential energy as a func-tion of time for system A� is given by Fig. 4.
Let us now discuss the similarities and differences be-tween the time evolution of the potential energy for tempera-tures below T3 and that found in direct coexistence simula-tions of the Ih-water system at temperatures below themelting point. For the Ih-water interface runs at temperatures
below the melting point, the energy continuously decreasesfrom the very beginning causing the steady growth of the icephase, which is completed typically after 15 ns. Here in thecase of the methane hydrate, the energy decreases veryslowly with time while the water film separates the hydratefrom the gas �mass transport controlling the growth rate�, butcan be accelerated considerably if the methane hydrate isbrought into contact with a supersaturated solution of meth-ane in water. In summary one may expect reasonable ratesfor the growth of solids when the molecules forming thesolid are available at the solid-fluid interface.
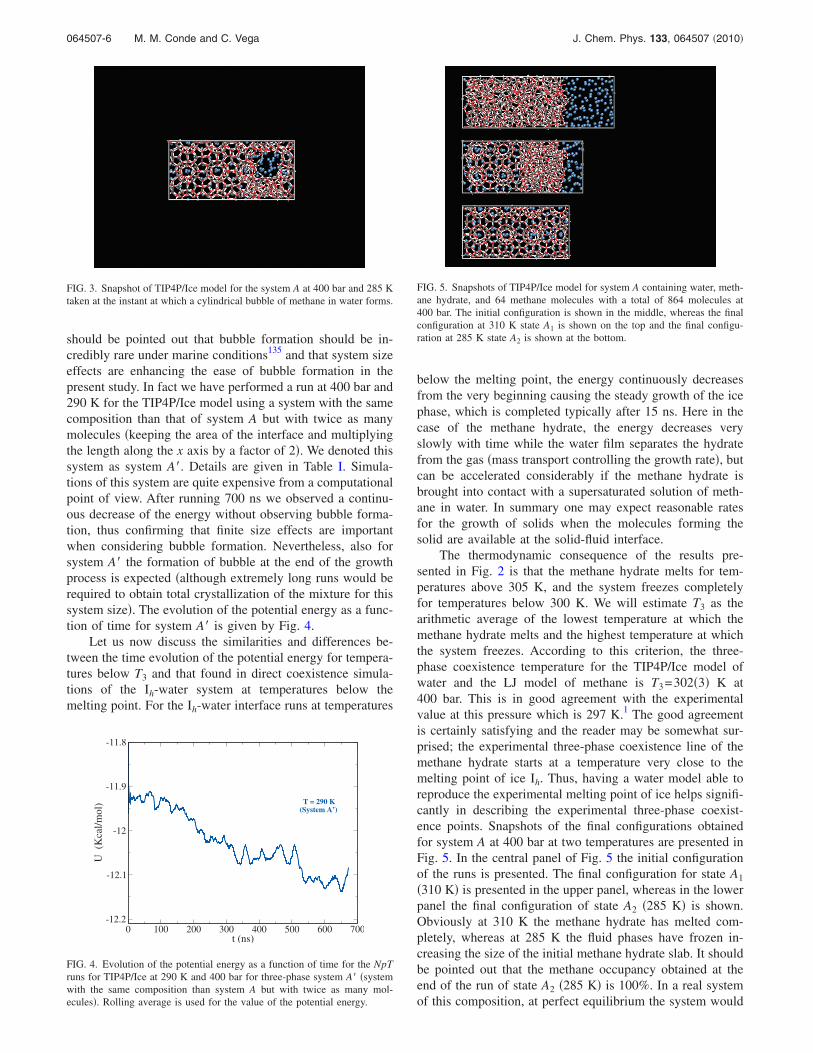
The thermodynamic consequence of the results pre-sented in Fig. 2 is that the methane hydrate melts for tem-peratures above 305 K, and the system freezes completelyfor temperatures below 300 K. We will estimate T3 as thearithmetic average of the lowest temperature at which themethane hydrate melts and the highest temperature at whichthe system freezes. According to this criterion, the three-phase coexistence temperature for the TIP4P/Ice model ofwater and the LJ model of methane is T3=302�3� K at400 bar. This is in good agreement with the experimentalvalue at this pressure which is 297 K.1 The good agreementis certainly satisfying and the reader may be somewhat sur-prised; the experimental three-phase coexistence line of themethane hydrate starts at a temperature very close to themelting point of ice Ih. Thus, having a water model able toreproduce the experimental melting point of ice helps signifi-cantly in describing the experimental three-phase coexist-ence points. Snapshots of the final configurations obtainedfor system A at 400 bar at two temperatures are presented inFig. 5. In the central panel of Fig. 5 the initial configurationof the runs is presented. The final configuration for state A1
�310 K� is presented in the upper panel, whereas in the lowerpanel the final configuration of state A2 �285 K� is shown.Obviously at 310 K the methane hydrate has melted com-pletely, whereas at 285 K the fluid phases have frozen in-creasing the size of the initial methane hydrate slab. It shouldbe pointed out that the methane occupancy obtained at theend of the run of state A2 �285 K� is 100%. In a real systemof this composition, at perfect equilibrium the system would
FIG. 3. Snapshot of TIP4P/Ice model for the system A at 400 bar and 285 Ktaken at the instant at which a cylindrical bubble of methane in water forms.
0 100 200 300 400 500 600 700t (ns)
-12.2
-12.1
-12
-11.9
-11.8
U(K
cal/
mol) (System A’)
T = 290 K
FIG. 4. Evolution of the potential energy as a function of time for the NpTruns for TIP4P/Ice at 290 K and 400 bar for three-phase system A� �systemwith the same composition than system A but with twice as many mol-ecules�. Rolling average is used for the value of the potential energy.
FIG. 5. Snapshots of TIP4P/Ice model for system A containing water, meth-ane hydrate, and 64 methane molecules with a total of 864 molecules at400 bar. The initial configuration is shown in the middle, whereas the finalconfiguration at 310 K state A1 is shown on the top and the final configu-ration at 285 K state A2 is shown at the bottom.
064507-6 M. M. Conde and C. Vega J. Chem. Phys. 133, 064507 �2010�

still have two phases present: gas and hydrate �with an oc-cupancy lower than 100%�. But in a system the size of thissimulation, surface tension probably drives a higher cage oc-cupancy to avoid the presence of any interface. It would beinteresting to analyze this in more detail in future studies.
Some aspects that may affect the value of the coexist-ence temperature are the initial solid configuration �sI hy-drate presents proton disorder, thus there is no unique initialsolid configuration� and finite size effects. We found in pre-vious work that the free energy differences between differentproton disordered configurations are small for crystals hav-ing more than 300 water molecules. For this reason we donot expect big changes in the value of T3 when using differ-ent proton disordered configurations for the initial methanehydrate slab. Also for pure water we have found100 that sys-tem size effects in direct coexistence simulations are small,at least for system having about 1000 particles, which isroughly the size of the system considered here.
In Figs. 6 and 7 the results of several NpT runs for theTIP4P/Ice model at 100 and 40 bar are presented. To aidvisualization in Figs. 2, 6, and 7 the results are presented forselected temperatures. The trend of the curves is similar to
those found at 400 bar. The main difference is that as thepressure decreases longer runs are required to either com-pletely melt the hydrate or to completely freeze the fluidphase. For 400 bar, runs of about 50 ns were sufficient. At100 bar, runs of about 400 ns were required, and finally for40 bar it was required to go to runs of about 800 ns. Ingeneral, melting occurs sooner as the temperature increases.For the runs at 100 bar the time required to freeze the systemseems to be independent of the temperature. Typically afteran induction time of about 100 ns �i.e., the time required forthe formation of the bubble� freezing occurs in about 15 ns.At the lowest pressure the time needed by the system to formthe cylindrical bubble �i.e., the induction time� increases asthe temperature increases. Thus, the results can be summa-rized by saying that melting occurs sooner as the temperatureincreases �except at 40 bar�. At 40 bar that difference may bedue to stochastic nature of the runs. Freezing occurs withinsimilar times regardless of the temperature for the interme-diate pressure, p=100 bar. At low pressures freezing re-quires more time as the temperature increases, whereas athigh pressures freezing requires more time as the tempera-ture decreases. Although these kinetic aspects are interesting,the important point here is that the coexistence lines allow usto estimate the value of T3 for the three pressures consideredin this work. Also, in some of our trajectories for the study ofgrowth in system A, we observed the presence of a fewdefects136 in the crystals, apparently independent of the im-posed conditions of pressure and temperature and the poten-tial model used.
Let us now present the results for system B which has anoverall higher mole fraction of methane than system A. Themotivation to study system B is twofold. First, the estimateof T3 obtained by performing simulations of system B shouldbe identical �within the statistical uncertainty� to that ob-tained for system A and that will constitute a cross-check ofthe methodology used in this work. The reason why T3
should be independent on composition can be seen moreclearly in the sketch of Fig. 1, where it is obvious that thetemperature at which the three phases are in equilibriumshould be identical for the system with compositions A or B.Direct coexistence simulations were then performed for asystem with composition B. Analyzing the trajectories weobserved that at high temperatures the methane hydrate meltsand the final equilibrium configuration corresponds to that ofa two phase system �liquid water and methane�. At low tem-peratures we observed growth of the methane hydrate and inthe final equilibrium configuration two phases can be found,methane hydrate and methane gas. Figure 8 shows snapshotsof the initial configuration and of the final ones for theTIP4P/Ice model at two different temperatures at 400 bar forsystem B. The final configuration at 285 K �bottom� corre-sponds to two phases in coexistence �hydrate and methane�.At 310 K �top� the equilibrium state B1 is shown. Our esti-mate of T3 for system B is 297�8� K, which agrees to withinstatistical uncertainty with the value obtained for system A,302�3� K. Thus the methodology can also be applied for thesystem with composition B. For system B we performed onlya few simulations since it has a higher computational cost�see the discussion below�, and for this reason the uncer-
0 100 200 300 400t (ns)
-13
-12.5
-12
-11.5
-11U
(Kca
l/m
ol)
TIP4P/Ice Modelp = 100 bar
T ~ 285 (3) K
T = 300 K
T = 280 K
T = 275 KT = 282 K
T = 290 K
T = 288 K
3
(System A)
FIG. 6. Evolution of the potential energy as a function of time for the NpTruns for TIP4P/Ice at 100 bar for the three-phase system A �water+hydrate+64 methane molecules�. The values are the rolling averages.Results for only a few representative temperatures are shown.
0 200 400 600 800t (ns)
-13
-12.5
-12
-11.5
-11
U(K
cal/
mol)
TIP4P/Ice Model
T ~ 284 (1) Kp = 40 barT = 290 K
T = 285 K
T = 278 KT = 275 KT = 273 K
T = 283 K
3
(System A)
FIG. 7. Evolution of the potential energy as a function of time for the NpTruns for TIP4P/Ice at 40 bar for the three-phase system A �water+hydrate+64 methane molecules�. The values are the rolling averages. Results foronly a few representative temperatures are shown.
064507-7 Computer simulations of methane hydrates J. Chem. Phys. 133, 064507 �2010�
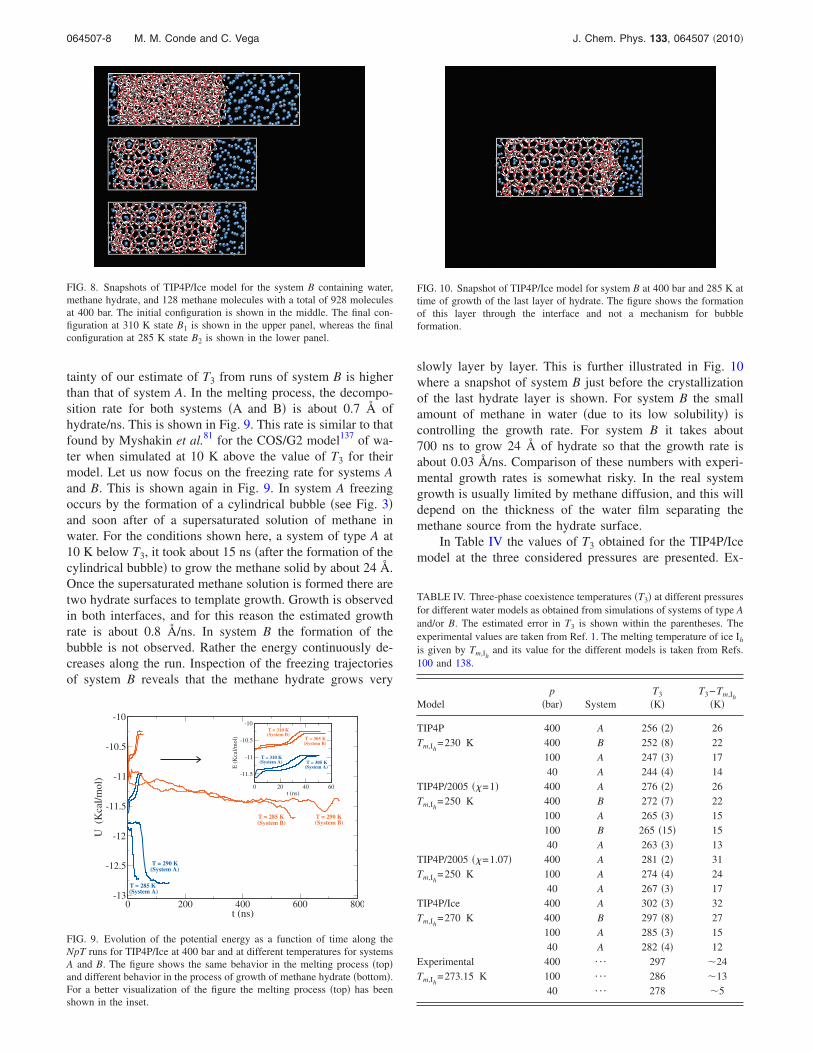
tainty of our estimate of T3 from runs of system B is higherthan that of system A. In the melting process, the decompo-sition rate for both systems �A and B� is about 0.7 Å ofhydrate/ns. This is shown in Fig. 9. This rate is similar to thatfound by Myshakin et al.81 for the COS/G2 model137 of wa-ter when simulated at 10 K above the value of T3 for theirmodel. Let us now focus on the freezing rate for systems Aand B. This is shown again in Fig. 9. In system A freezingoccurs by the formation of a cylindrical bubble �see Fig. 3�and soon after of a supersaturated solution of methane inwater. For the conditions shown here, a system of type A at10 K below T3, it took about 15 ns �after the formation of thecylindrical bubble� to grow the methane solid by about 24 Å.Once the supersaturated methane solution is formed there aretwo hydrate surfaces to template growth. Growth is observedin both interfaces, and for this reason the estimated growthrate is about 0.8 Å/ns. In system B the formation of thebubble is not observed. Rather the energy continuously de-creases along the run. Inspection of the freezing trajectoriesof system B reveals that the methane hydrate grows very
slowly layer by layer. This is further illustrated in Fig. 10where a snapshot of system B just before the crystallizationof the last hydrate layer is shown. For system B the smallamount of methane in water �due to its low solubility� iscontrolling the growth rate. For system B it takes about700 ns to grow 24 Å of hydrate so that the growth rate isabout 0.03 Å/ns. Comparison of these numbers with experi-mental growth rates is somewhat risky. In the real systemgrowth is usually limited by methane diffusion, and this willdepend on the thickness of the water film separating themethane source from the hydrate surface.
In Table IV the values of T3 obtained for the TIP4P/Icemodel at the three considered pressures are presented. Ex-
FIG. 8. Snapshots of TIP4P/Ice model for the system B containing water,methane hydrate, and 128 methane molecules with a total of 928 moleculesat 400 bar. The initial configuration is shown in the middle. The final con-figuration at 310 K state B1 is shown in the upper panel, whereas the finalconfiguration at 285 K state B2 is shown in the lower panel.
0 200 400 600 800t (ns)
-13
-12.5
-12
-11.5
-11
-10.5
-10
U(K
cal/
mol)
0 20 40 60t (ns)
-11.5
-11
-10.5
-10
E(K
cal/
mol)
T = 310 K
T = 290 K
T = 285 K
(System B)
T = 285 K
(System A)
(System A)
(System B)T = 290 K(System B)
(System A) T = 305 K(System A)
(System B)
T = 310 K
T = 305 K
FIG. 9. Evolution of the potential energy as a function of time along theNpT runs for TIP4P/Ice at 400 bar and at different temperatures for systemsA and B. The figure shows the same behavior in the melting process �top�and different behavior in the process of growth of methane hydrate �bottom�.For a better visualization of the figure the melting process �top� has beenshown in the inset.
FIG. 10. Snapshot of TIP4P/Ice model for system B at 400 bar and 285 K attime of growth of the last layer of hydrate. The figure shows the formationof this layer through the interface and not a mechanism for bubbleformation.
TABLE IV. Three-phase coexistence temperatures �T3� at different pressuresfor different water models as obtained from simulations of systems of type Aand/or B. The estimated error in T3 is shown within the parentheses. Theexperimental values are taken from Ref. 1. The melting temperature of ice Ih
is given by Tm,Ihand its value for the different models is taken from Refs.
100 and 138.
Modelp
�bar� SystemT3
�K�T3−Tm,Ih
�K�
TIP4P 400 A 256 �2� 26Tm,Ih
=230 K 400 B 252 �8� 22100 A 247 �3� 1740 A 244 �4� 14
TIP4P/2005 ��=1� 400 A 276 �2� 26Tm,Ih
=250 K 400 B 272 �7� 22100 A 265 �3� 15100 B 265 �15� 1540 A 263 �3� 13
TIP4P/2005 ��=1.07� 400 A 281 �2� 31Tm,Ih
=250 K 100 A 274 �4� 2440 A 267 �3� 17
TIP4P/Ice 400 A 302 �3� 32Tm,Ih
=270 K 400 B 297 �8� 27100 A 285 �3� 1540 A 282 �4� 12
Experimental 400 ¯ 297 �24Tm,Ih
=273.15 K 100 ¯ 286 �1340 ¯ 278 �5
064507-8 M. M. Conde and C. Vega J. Chem. Phys. 133, 064507 �2010�
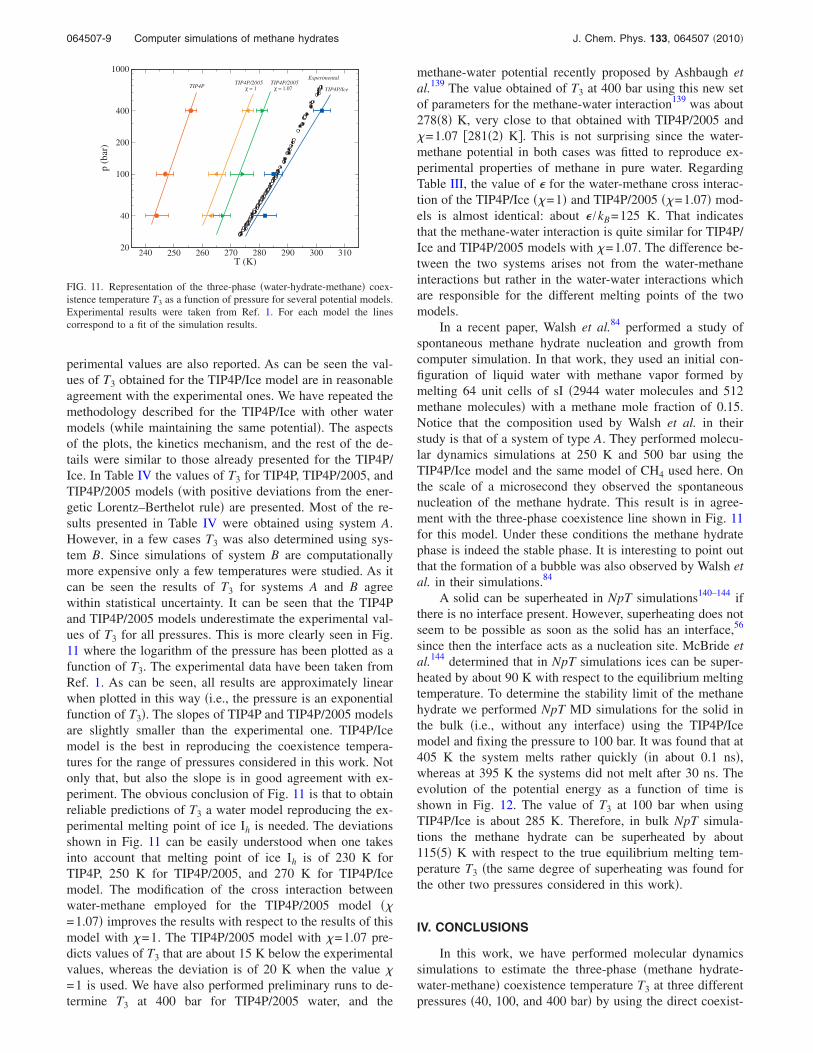
perimental values are also reported. As can be seen the val-ues of T3 obtained for the TIP4P/Ice model are in reasonableagreement with the experimental ones. We have repeated themethodology described for the TIP4P/Ice with other watermodels �while maintaining the same potential�. The aspectsof the plots, the kinetics mechanism, and the rest of the de-tails were similar to those already presented for the TIP4P/Ice. In Table IV the values of T3 for TIP4P, TIP4P/2005, andTIP4P/2005 models �with positive deviations from the ener-getic Lorentz–Berthelot rule� are presented. Most of the re-sults presented in Table IV were obtained using system A.However, in a few cases T3 was also determined using sys-tem B. Since simulations of system B are computationallymore expensive only a few temperatures were studied. As itcan be seen the results of T3 for systems A and B agreewithin statistical uncertainty. It can be seen that the TIP4Pand TIP4P/2005 models underestimate the experimental val-ues of T3 for all pressures. This is more clearly seen in Fig.11 where the logarithm of the pressure has been plotted as afunction of T3. The experimental data have been taken fromRef. 1. As can be seen, all results are approximately linearwhen plotted in this way �i.e., the pressure is an exponentialfunction of T3�. The slopes of TIP4P and TIP4P/2005 modelsare slightly smaller than the experimental one. TIP4P/Icemodel is the best in reproducing the coexistence tempera-tures for the range of pressures considered in this work. Notonly that, but also the slope is in good agreement with ex-periment. The obvious conclusion of Fig. 11 is that to obtainreliable predictions of T3 a water model reproducing the ex-perimental melting point of ice Ih is needed. The deviationsshown in Fig. 11 can be easily understood when one takesinto account that melting point of ice Ih is of 230 K forTIP4P, 250 K for TIP4P/2005, and 270 K for TIP4P/Icemodel. The modification of the cross interaction betweenwater-methane employed for the TIP4P/2005 model ��=1.07� improves the results with respect to the results of thismodel with �=1. The TIP4P/2005 model with �=1.07 pre-dicts values of T3 that are about 15 K below the experimentalvalues, whereas the deviation is of 20 K when the value �=1 is used. We have also performed preliminary runs to de-termine T3 at 400 bar for TIP4P/2005 water, and the
methane-water potential recently proposed by Ashbaugh etal.139 The value obtained of T3 at 400 bar using this new setof parameters for the methane-water interaction139 was about278�8� K, very close to that obtained with TIP4P/2005 and�=1.07 �281�2� K�. This is not surprising since the water-methane potential in both cases was fitted to reproduce ex-perimental properties of methane in pure water. RegardingTable III, the value of � for the water-methane cross interac-tion of the TIP4P/Ice ��=1� and TIP4P/2005 ��=1.07� mod-els is almost identical: about � /kB=125 K. That indicatesthat the methane-water interaction is quite similar for TIP4P/Ice and TIP4P/2005 models with �=1.07. The difference be-tween the two systems arises not from the water-methaneinteractions but rather in the water-water interactions whichare responsible for the different melting points of the twomodels.
In a recent paper, Walsh et al.84 performed a study ofspontaneous methane hydrate nucleation and growth fromcomputer simulation. In that work, they used an initial con-figuration of liquid water with methane vapor formed bymelting 64 unit cells of sI �2944 water molecules and 512methane molecules� with a methane mole fraction of 0.15.Notice that the composition used by Walsh et al. in theirstudy is that of a system of type A. They performed molecu-lar dynamics simulations at 250 K and 500 bar using theTIP4P/Ice model and the same model of CH4 used here. Onthe scale of a microsecond they observed the spontaneousnucleation of the methane hydrate. This result is in agree-ment with the three-phase coexistence line shown in Fig. 11for this model. Under these conditions the methane hydratephase is indeed the stable phase. It is interesting to point outthat the formation of a bubble was also observed by Walsh etal. in their simulations.84
A solid can be superheated in NpT simulations140–144 ifthere is no interface present. However, superheating does notseem to be possible as soon as the solid has an interface,56
since then the interface acts as a nucleation site. McBride etal.144 determined that in NpT simulations ices can be super-heated by about 90 K with respect to the equilibrium meltingtemperature. To determine the stability limit of the methanehydrate we performed NpT MD simulations for the solid inthe bulk �i.e., without any interface� using the TIP4P/Icemodel and fixing the pressure to 100 bar. It was found that at405 K the system melts rather quickly �in about 0.1 ns�,whereas at 395 K the systems did not melt after 30 ns. Theevolution of the potential energy as a function of time isshown in Fig. 12. The value of T3 at 100 bar when usingTIP4P/Ice is about 285 K. Therefore, in bulk NpT simula-tions the methane hydrate can be superheated by about115�5� K with respect to the true equilibrium melting tem-perature T3 �the same degree of superheating was found forthe other two pressures considered in this work�.
IV. CONCLUSIONS
In this work, we have performed molecular dynamicssimulations to estimate the three-phase �methane hydrate-water-methane� coexistence temperature T3 at three differentpressures �40, 100, and 400 bar� by using the direct coexist-
��������������������������������������������������������������������������������������������������������������������������������������������������������������������������������������������������������������������������������������������������������������������������������������������������
240 250 260 270 280 290 300 310T (K)
20
40
100
200
400
1000
p(b
ar)
TIP4PTIP4P/2005 TIP4P/2005
TIP4P/Ice
Experimental
χ = 1 χ = 1.07
FIG. 11. Representation of the three-phase �water-hydrate-methane� coex-istence temperature T3 as a function of pressure for several potential models.Experimental results were taken from Ref. 1. For each model the linescorrespond to a fit of the simulation results.
064507-9 Computer simulations of methane hydrates J. Chem. Phys. 133, 064507 �2010�

ence method. Two systems with different global mole frac-tions of methane were considered: system A which has amethane mole fraction of xCH4
�0.15 and system B with amethane mole fraction of xCH4
�0.21. At temperatures aboveT3 the methane hydrate melts for both compositions yieldinga two phase �water-methane� system. At temperatures belowT3 the growth of the methane hydrate is observed yielding atthe end of the run pure methane hydrate in the case of systemA and a two phase system �methane hydrate-methane� in thecase of system B. For systems A and B the methane hydratemelts layer by layer with the same mechanism. The growthof the methane hydrate takes place slowly and layer by layerin the case of system B. In the case of system A the growthof the methane hydrate took place quickly after the formationof a supersaturated methane-water solution obtained quicklyafter the formation of a methane gas bubble in the simulationbox. The value obtained for T3 for systems A and B was thesame �within the statistical uncertainty�. Thus, although thekinetic mechanism was different the thermodynamic proper-ties were not affected �as expected�. Rather long runs �in100–1000 ns� are required to determine T3 accurately. Theconclusion is that three-phase direct coexistence simulationscan be performed to determine the value of T3 for themethane-water binary mixture.
Results for T3 were obtained using three different watermodels, namely, TIP4P, TIP4P/2005, and TIP4P/Ice withmethane described by a simple LJ center. The cross interac-tion was described by the Lorentz–Berthelot rules. A systemwith positive deviations from the energetic Lorentz–Berthelot rule �as an effective way of introducing the polar-ization of methane within the water medium� was also con-sidered for the TIP4P/2005 water model. The results showedthat the three-phase coexistence line obtained with theTIP4P/Ice model was in good agreement with the experi-mental one. Results obtained by TIP4P/2005 and TIP4Pmodels were shifted to lower temperatures by about 20 and40 K, respectively, with respect to the experimental results.Introducing deviations from Lorentz–Berthelot rule in the
case of the TIP4P/2005 model reduces the disagreement withexperiment to about 15 K. The deviation found in this workbetween the T3 line of the models and that found in experi-ments correlates quite well with the deviation found betweenthe melting point of ice Ih for these models and the experi-mental value. Therefore, the message is that to obtain the T3
line correctly, a model with the correct melting point of ice Ih
is required. As a general rule it has been found in this workthat the value of T3 at 400 bar is approximately 28 K abovethe melting temperature of ice Ih for the considered watermodel.
Therefore, the combination of TIP4P/Ice model for wa-ter and a single LJ center for methane appears as adequatechoice for the study of hydrate formation. The second validoption is to combine the TIP4P/2005 model with a single LJcenter model for methane but introducing positive deviationsfrom the energetic Lorentz–Berthelot combination rule. Al-though a shift of T3 of about 15 K is expected with respect toexperiment with this second model, it presents the advantageof accurately describing the chemical potential of methane inwater120 and also of using one of the most reliable watermodels �TIP4P/2005� for equilibrium145 and transportproperties.146
ACKNOWLEDGMENTS
This work has been funded by MICINN �Grant No.FIS2010-16159�, by CAM �Project No. P2009/ESP-1691�,and by Universidad Complutense de Madrid �Project No.910570�. M.M.C. would like to thank Universidad Com-plutense de Madrid for the award of a Ph.D. studentship.
1 E. D. Sloan and C. A. Koh, Clathrate Hydrates of Natural Gases, 3rd ed.�CRC, Boca Raton, FL, 2007�.
2 R. K. McMullan and G. A. Jeffrey, J. Chem. Phys. 42, 2725 �1965�.3 C. W. Mak and R. K. McMullan, J. Chem. Phys. 42, 2732 �1965�.4 J. A. Ripmeester, J. S. Tse, C. I. Ratcliffe, and B. M. Powell, Nature�London� 325, 135 �1987�.
5 W. C. Child, Q. Rev., Chem. Soc. 18, 321 �1964�.6 J. D. Londono, W. F. Kuhs, and J. L. Finney, Nature �London� 332, 141�1988�.
7 Y. Koyama, H. Tanaka, and K. Koga, J. Chem. Phys. 122, 074503�2005�.
8 M. M. Conde, C. Vega, G. A. Tribello, and B. Slater, J. Chem. Phys. 131,034510 �2009�.
9 L. C. Jacobson, W. Hujo, and V. Molinero, J. Phys. Chem. B 113, 10298�2009�.
10 V. Molinero and E. B. Moore, J. Phys. Chem. B 113, 4008 �2009�.11 G. A. Tribello and B. Slater, J. Chem. Phys. 131, 024703 �2009�.12 C. Wei and Z. Hong-Yu, Chin. Phys. Lett. 19, 609 �2002�.13 S. W. Rick and D. L. Freeman, J. Chem. Phys. 132, 054509 �2010�.14 M. M. Conde, C. Vega, C. McBride, E. G. Noya, R. Ramírez, and L. M.
Sesé, J. Chem. Phys. 132, 114503 �2010�.15 J. van der Waals and J. Platteeuw, Adv. Chem. Phys. 2, 1 �1959�.16 H. Davy, Philos. Trans. R. Soc. London, Ser. B 101, 1 �1811�.17 K. A. Udachin, G. D. Enright, C. I. Ratcliffe, and J. A. Ripmeester, J.
Am. Chem. Soc. 119, 11481 �1997�.18 T. Uchida, T. Ebinuma, J. Kawabata, and H. Narita, J. Cryst. Growth
204, 348 �1999�.19 M. M. Mooijer-van den Heuvel, C. J. Peters, and J. de Swaan Arons,
Fluid Phase Equilib. 172, 73 �2000�.20 S. Takeya, A. Hori, T. Hondoh, and T. Uchida, J. Phys. Chem. B 104,
4164 �2000�.21 S. Takeya, T. Ebinuma, T. Uchida, J. Nagao, and H. Narita, J. Cryst.
Growth 237–239, 379 �2002�.22 D. K. Staykova, W. F. Kuhs, A. N. Salamatin, and T. Hansen, J. Phys.
Chem. B 107, 10299 �2003�.
0 0.1 0.2 0.3 0.4 0.5 0.6 0.7 0.8 0.9 1t (ns)
-13
-12.5
-12
-11.5
-11
-10.5
-10
-9.5
-9
-8.5
U(K
cal/
mol)
T = 405 K
T = 395 K
FIG. 12. Evolution of the potential energy as a function of time from NpTruns of the methane hydrate in the bulk. Results were obtained at 100 barusing the TIP4P/Ice model for water and a single LJ site for methane. At405 K �top� the methane hydrate melts quickly on a short time scale �0.1 ns�provoking an increase of the potential energy. At 395 K �bottom� the energyremains constant �with some thermal fluctuations�. Even after 30 ns themethane hydrate was stable at this temperature.
064507-10 M. M. Conde and C. Vega J. Chem. Phys. 133, 064507 �2010�

23 K. C. Hester, Z. Huo, A. L. Ballard, C. A. Koh, K. T. Miller, and E. D.Sloan, J. Phys. Chem. B 111, 8830 �2007�.
24 L. J. Florusse, C. J. Peters, J. Schoonman, K. C. Hester, C. A. Koh, S. F.Dec, K. N. Marsh, and E. D. Sloan, Science 306, 469 �2004�.
25 F. Schüth, Nature �London� 434, 712 �2005�.26 H. Lee, J. Lee, D. Y. Kim, J. Park, Y. Seo, H. Zeng, I. L. Moudrakovski,
C. I. Ratcliffe, and J. A. Ripmeester, Nature �London� 434, 743 �2005�.27 T. A. Strobel, C. A. Koh, and E. D. Sloan, J. Phys. Chem. B 112, 1885
�2008�.28 T. A. Strobel, E. D. Sloan, and C. A. Koh, J. Chem. Phys. 130, 014506
�2009�.29 A. Martín and C. J. Peters, J. Phys. Chem. B 113, 7558 �2009�.30 I. Aya, K. Yamane, and N. Yamada, in Proceedings of the First Interna-
tional Offshore and Polar Engineering Conference, edited by J. S.Chung, B. J. Natvig, K. Kaneko, and A. J. Ferrante �International Societyof Offshore and Polar Engineers, Edinburgh, 1991�, p. 427.
31 J. P. Long and E. D. Sloan, Int. J. Thermophys. 17, 1 �1996�.32 H. Herzog, K. Caldeira, and E. Adams, in Encyclopedia of Ocean Sci-
ences, edited by J. Steele, S. Thorpe, and K. Turekian �Academic, Lon-don, 2001�, Vol. 1, p. 408.
33 E. M. Yezdimer, P. T. Cummings, and A. A. Chialvo, J. Phys. Chem. A106, 7982 �2002�.
34 T. Kin, T. Nemoto, K. Makino, and K. Koide, in First InternationalConference on Innovative Computing, Information and Control (ICICIC),edited by J.-S. Pan, P. Shi, and Y. Zhao �IEEE Computer Society, Beijing,2006�, p. 4.
35 K. A. Kvenvolden, Chem. Geol. 71, 41 �1988�.36 G. J. MacDonald, Annual Review of Energy 15, 53 �1990�.37 C. Bourry, J. Charlou, J. Donval, M. Brunelli, C. Focsa, and B. Chazal-
lon, Geophys. Res. Lett. 34, L22303 �2007�.38 H. Lu, Y. Seo, J. Lee, I. Moudrakovski, J. A. Ripmeester, N. R. Chap-
man, R. B. Coffin, G. Gardner, and J. Pohlman, Nature �London� 445,303 �2007�.
39 E. D. Sloan, Nature �London� 426, 353 �2003�.40 J. P. Henriet and J. Mienert, Gas Hydrates Relevance to World Margin
Stability and Climatic Change �The Geological Society, London, 1998�.41 S. Grandum, A. Yabe, K. Nakagomi, M. Tanaka, F. Takemura, Y. Koba-
yashi, and P. E. Frivik, J. Cryst. Growth 205, 382 �1999�.42 J. S. Pic, J. M. Herri, and M. Cournil, Can. J. Chem. Eng. 79, 374
�2001�.43 C. A. Koh, R. E. Westacott, W. Zhang, K. Hirachand, J. L. Creek, and A.
K. Soper, Fluid Phase Equilib. 194–197, 143 �2002�.44 C. Moon, P. C. Taylor, and P. M. Rodger, Can. J. Phys. 81, 451 �2003�.45 D. M. Duffy, C. Moon, and P. M. Rodger, Mol. Phys. 102, 203 �2004�.46 I. M. Svishchev and P. G. Kusalik, Phys. Rev. Lett. 73, 975 �1994�.47 I. R. Craig and D. E. Manolopoulos, J. Chem. Phys. 123, 034102 �2005�.48 M. Martin-Conde, C. Vega, and L. G. MacDowell, J. Chem. Phys. 125,
116101 �2006�.49 L. Vrbka and P. Jungwirth, J. Mol. Liq. 134, 64 �2007�.50 Y. Takii, K. Koga, and H. Tanaka, J. Chem. Phys. 128, 204501 �2008�.51 T. E. Markland and D. E. Manolopoulos, J. Chem. Phys. 129, 024105
�2008�.52 C. Vega, E. Sanz, J. L. F. Abascal, and E. Noya, J. Phys.: Condens.
Matter 20, 153101 �2008�.53 E. G. Noya, M. M. Conde, and C. Vega, J. Chem. Phys. 129, 104704
�2008�.54 E. G. Noya, C. Vega, L. M. Sesé, and R. Ramírez, J. Chem. Phys. 131,
124518 �2009�.55 C. McBride, C. Vega, E. G. Noya, R. Ramírez, and L. M. Sesé, J. Chem.
Phys. 131, 024506 �2009�.56 C. Vega, M. Martin-Conde, and A. Patrykiejew, Mol. Phys. 104, 3583
�2006�.57 P. Ungerer, C. Nieto-Draghi, B. Rousseau, G. Ahunbay, and V. Lachet, J.
Mol. Liq. 134, 71 �2007�.58 M. M. Conde, C. Vega, and A. Patrykiejew, J. Chem. Phys. 129, 014702
�2008�.59 D. Quigley and P. M. Rodger, J. Chem. Phys. 128, 154518 �2008�.60 J. L. Aragones, M. M. Conde, E. G. Noya, and C. Vega, Phys. Chem.
Chem. Phys. 11, 543 �2009�.61 C. Vega, M. M. Conde, C. McBride, J. L. F. Abascal, E. G. Noya, R.
Ramírez, and L. M. Sesé, J. Chem. Phys. 132, 046101 �2010�.62 J. S. Tse, M. L. Klein, and I. R. McDonald, J. Phys. Chem. 4198, 87
�1983�.63 P. M. Rodger, J. Phys. Chem. 93, 6850 �1989�.
64 P. M. Rodger, J. Phys. Chem. 94, 6080 �1990�.65 L. A. Báez and P. Clancy, Ann. N.Y. Acad. Sci. 715, 177 �1994�.66 K. R. O. Forrisdahl, B. Kvamme, and A. D. Haymet, Mol. Phys. 89, 819
�1996�.67 H. Tanaka, Y. Tamai, and K. Koga, J. Phys. Chem. B 101, 6560 �1997�.68 A. A. Chialvo, M. Houssa, and P. T. Cummings, J. Phys. Chem. B 106,
442 �2002�.69 C. Moon, P. C. Taylor, and P. M. Rodger, J. Am. Chem. Soc. 125, 4706
�2003�.70 N. J. English and J. M. D. MacElroy, J. Comput. Chem. 24, 1569 �2003�.71 N. J. English and J. M. D. MacElroy, J. Chem. Phys. 120, 10247 �2004�.72 B. J. Anderson, M. Z. Bazanta, J. W. Tester, and B. L. Trout, J. Am.
Chem. Soc. 109, 8153 �2005�.73 V. Chihaia, S. Adams, and W. F. Kuhs, Chem. Phys. 317, 208 �2005�.74 C. Moon, R. W. Hawtin, and P. M. Rodger, Faraday Discuss. 136, 367
�2007�.75 G. Guo, Y. Zhang, M. Li, and C. Wu, J. Chem. Phys. 128, 194504
�2008�.76 H. Jiang, E. M. Myshakin, K. D. Jordan, and R. P. Warzinski, J. Phys.
Chem. B 112, 10207 �2008�.77 J. F. Zhang, R. W. Hawtin, Y. Yang, E. Nakagava, M. Rivero, S. K. Choi,
and P. M. Rodger, J. Phys. Chem. B 112, 10608 �2008�.78 S. K. Reed and R. E. Westacott, Phys. Chem. Chem. Phys. 10, 4614
�2008�.79 B. Peters, N. E. R. Zimmermann, G. T. Beckham, J. W. Tester, and B. L.
Trout, J. Am. Chem. Soc. 130, 17342 �2008�.80 E. A. Mastny, C. A. Miller, and J. J. de Pablo, J. Chem. Phys. 129,
034701 �2008�.81 E. M. Myshakin, H. Jiang, R. Warzinski, and K. D. Jordan, J. Phys.
Chem. A 113, 1913 �2009�.82 N. J. English, J. S. Tse, and D. J. Carey, Phys. Rev. B 80, 134306 �2009�.83 M. Matsumoto, Journal of Physical Chemistry Letters 1, 1552 �2010�.84 M. R. Walsh, C. A. Koh, E. D. Sloan, A. K. Sum, and D. T. Wu, Science
326, 1095 �2009�.85 P. G. Debenedetti and S. Sarupria, Science 326, 1070 �2009�.86 J. L. F. Abascal, E. Sanz, R. G. Fernandez, and C. Vega, J. Chem. Phys.
122, 234511 �2005�.87 S. J. Goodbody, K. Watanabe, D. MacGowan, J. P. R. B. Walton, and N.
Quirke, J. Chem. Soc., Faraday Trans. 87, 1951 �1991�.88 G. J. Guo, Y. G. Zhang, Y. J. Zhao, K. Refson, and S. G. H. Shan, J.
Chem. Phys. 121, 1542 �2004�.89 G. J. Guo, Y. G. Zhang, and H. Liu, J. Phys. Chem. C 111, 2595 �2007�.90 S. J. Wierzchowski and P. A. Monson, Ind. Eng. Chem. Res. 45, 424
�2006�.91 S. J. Wierzchowski and P. A. Monson, J. Phys. Chem. B 111, 7274
�2007�.92 I. Nezbeda, W. R. Smith, and J. Kolafa, J. Chem. Phys. 100, 2191
�1994�.93 I. Nezbeda, J. Kolafa, J. Pavlicek, and W. R. Smith, J. Chem. Phys. 102,
9638 �1995�.94 R. E. Westacott and P. M. Rodger, Chem. Phys. Lett. 262, 47 �1996�.95 W. L. Jorgensen, J. Chandrasekhar, J. D. Madura, R. W. Impey, and M. L.
Klein, J. Chem. Phys. 79, 926 �1983�.96 J. L. F. Abascal and C. Vega, J. Chem. Phys. 123, 234505 �2005�.97 A. J. C. Ladd and L. Woodcock, Chem. Phys. Lett. 51, 155 �1977�.98 A. J. C. Ladd and L. Woodcock, Mol. Phys. 36, 611 �1978�.99 J. Neil Cape and L. V. Woodcock, Chem. Phys. Lett. 59, 271 �1978�.
100 R. G. Fernández, J. L. F. Abascal, and C. Vega, J. Chem. Phys. 124,144506 �2006�.
101 M. Yousuf, S. B. Qadri, D. L. Knies, K. S. Grabowski, R. B. Coffin, andJ. W. Pohlman, Appl. Phys. A: Mater. Sci. Process. 78, 925 �2004�.
102 L. Pauling, The Nature of the Chemical Bond and the Structure of Mol-ecules and Crystals; An Introduction to Modern Structural Chemistry�Cornell University Press, Ithaca, 1960�.
103 F. Hollander and G. A. Jeffrey, J. Chem. Phys. 66, 4699 �1977�.104 S. W. Peterson and H. A. Levy, Acta Crystallogr. 1957, 72 �1957�.105 V. Buch, P. Sandler, and J. Sadlej, J. Phys. Chem. B 102, 8641 �1998�.106 J. D. Bernal and R. H. Fowler, J. Chem. Phys. 1, 515 �1933�.107 Z. Huo, K. Hester, E. D. Sloan, and K. T. Miller, AIChE J. 49, 1300
�2003�.108 D. Van Der Spoel, E. Lindahl, B. Hess, G. Groenhof, A. E. Mark, and H.
J. C. Berendsen, J. Comput. Chem. 26, 1701 �2005�.109 S. Nosé, J. Chem. Phys. 81, 511 �1984�.110 W. G. Hoover, Phys. Rev. A 31, 1695 �1985�.
064507-11 Computer simulations of methane hydrates J. Chem. Phys. 133, 064507 �2010�
111 M. Parrinello and A. Rahman, J. Appl. Phys. 52, 7182 �1981�.112 S. Nosé and M. L. Klein, Mol. Phys. 50, 1055 �1983�.113 J. P. Ryckaert, G. Ciccotti, and H. J. C. Berendsen, J. Comput. Phys. 23,
327 �1977�.114 H. J. C. Berendsen and W. F. van Gusteren, Proceedings of the NATO
Advanced Study Institute on Molecular Liquids �Reidel, Dordrecht,1984�, pp. 475–500.
115 U. Essmann, L. Perera, M. L. Berkowitz, T. Darden, H. Lee, and L. G.Pedersen, J. Chem. Phys. 103, 8577 �1995�.
116 B. Guillot and Y. Guissani, J. Chem. Phys. 99, 8075 �1993�.117 D. Paschek, J. Chem. Phys. 120, 6674 �2004�.118 M. G. Martin and J. I. Siepmann, J. Phys. Chem. B 102, 2569 �1998�.119 W. L. Jorgensen, J. D. Madura, and C. J. Swenson, J. Am. Chem. Soc.
106, 6638 �1984�.120 H. Docherty, A. Galindo, C. Vega, and E. Sanz, J. Chem. Phys. 125,
074510 �2006�.121 J. S. Rowlinson and F. L. Swinton, Liquids and Liquid Mixtures �Butter-
worths, London, 1982�.122 P. J. Dyer, H. Docherty, and P. T. Cummings, J. Chem. Phys. 129,
024508 �2008�.123 C. L. Kong, J. Chem. Phys. 59, 2464 �1973�.124 J. J. Potoff, J. R. Errington, and A. Z. Panagiotopoulos, Mol. Phys. 97,
1073 �1999�.125 G. C. Boulougouris, J. R. Errington, I. G. Economou, A. Z. Panagioto-
poulos, and D. N. Theodorou, J. Phys. Chem. B 104, 4958 �2000�.126 N. J. English, J. K. Johnson, and C. E. Taylor, J. Chem. Phys. 123,
244503 �2005�.127 N. J. English and G. M. Phelan, J. Chem. Phys. 131, 074704 �2009�.128 F. Biscay, A. Ghoufi, V. Lachet, and P. Malfreyt, J. Chem. Phys. 131,
124707 �2009�.129 C. Vega and E. de Miguel, J. Chem. Phys. 126, 154707 �2007�.130 A. Ghoufi, F. Goujon, V. Lachet, and P. Malfreyt, J. Chem. Phys. 128,
154716 �2008�.131 L. C. Jacobson and V. Molinero, J. Phys. Chem. B 114, 7302 �2010�.132 L. G. MacDowell, V. K. Shen, and J. R. Errington, J. Chem. Phys. 125,
034705 �2006�.133 J. Vatamanu and P. G. Kusalik, J. Phys. Chem. B 110, 15896 �2006�.134 J. Vatamanu and P. G. Kusalik, J. Chem. Phys. 126, 124703 �2007�.135 B. A. Buffett and O. Y. Zatsepina, Mar. Geol. 164, 69 �2000�.136 J. Vatamanu and P. G. Kusalik, J. Phys. Chem. B 112, 2399 �2008�.137 H. Yu and W. F. van Gunsteren, J. Chem. Phys. 121, 9549 �2004�.138 C. Vega, E. Sanz, and J. L. F. Abascal, J. Chem. Phys. 122, 114507
�2005�.139 H. S. Ashbaugh, N. J. Collett, H. W. Hatch, and J. A. Staton, J. Chem.
Phys. 132, 124504 �2010�.140 M. P. Allen and D. J. Tildesley, Computer Simulation of Liquids �Oxford
University Press, New York, 1987�.141 G. E. Norman and V. V. Stegailov, Mol. Simul. 30, 397 �2004�.142 S.-N. Luo, A. Strachan, and D. C. Swift, J. Chem. Phys. 120, 11640
�2004�.143 C. McBride, C. Vega, E. Sanz, and J. L. F. Abascal, J. Chem. Phys. 121,
11907 �2004�.144 C. McBride, C. Vega, E. Sanz, L. G. MacDowell, and J. L. F. Abascal,
Mol. Phys. 103, 1 �2005�.145 C. Vega, J. L. F. Abascal, M. M. Conde, and J. L. Aragones, Faraday
Discuss. 141, 251 �2009�.146 M. A. González and J. L. F. Abascal, J. Chem. Phys. 132, 096101
�2010�.
064507-12 M. M. Conde and C. Vega J. Chem. Phys. 133, 064507 �2010�