determining the optimal location and amount of distributed
TRANSCRIPT
International Journal of Smart Electrical Engineering, Vol.9, No.1, Winter 2020 ISSN: 2251-9246 EISSN: 2345-6221
41
Determining the Optimal Location and Amount of
Distributed Generation Sources in an Unbalanced Radial
Distribution Grid
Abbas Seif Department of Electrical Engineering, Tehran Branch, Islamic Azad University, Tehran, Iran, [email protected]
Abstract
Optimal placement of scattered generator sources in the main and secondary feeders of radial grid reduces energy losses,
releases the capacity of existing feeders and improves the existing voltage profile. In this project determine the location and
suitable for the production of production resources S cattered in radial feeders of unbalanced distribution networks, a new
formulation solution is proposed. The application of scattering generation sources proposed in this project is independent of
the voltage level of the system under study and its limitation is radial and unbalanced distribution system under study.
Keywords: disperse production resources, distribution grid, Unbalanced
Article history: Received 20-Dec-2020; Revised 16-Jan-2021; Accepted 20-Jan-2021.
© 2020 IAUCTB-IJSEE Science. All rights reserved
1. Introduction
With the growth of industry and the increasing
need for electricity in recent years, the creation of
large power plants is not economically and
environmentally justified [1, 2]. By creating and
operating a small grid-connected power plant that is
simply renewable energy based on the needs of the
electricity industry. Scattered generation (DG)
generally refers to the generation of electricity at the
point of consumption of livestock information.
According to the IEEE definition, electricity
generation is by equipment that is a sufficient
candidate for smaller central power plants and is
able to install and operate at their point of use to use
existing compounds. Electricity supply companies
have a duty to provide the required power to the grid
in all circumstances. The use of distributed
generation resources allows power companies to
supply energy in proportion to the load connected to
the grid. On the other hand, these resources can be
used as backups in the network that enter the circuit
when necessary and reduce the number of
consumers who leave the circuit in the event of a
breakdown or disruption of the network [4].
Research shows that the connection of distributed
generation units in some grid substations can
improve the power transfer imbalance due to the
difference in power transfer coefficient of different
parts of the network by adjusting the direction of
flow and load distribution [5]. The use of distributed
generation sources will reduce the load seen by the
manufacturer and consequently reduce the voltage
drop across the transmission lines. Reducing voltage
drop is one of the most important factors in
increasing the life of grid equipment and heat loss in
them. Utilization of distributed generation resources
reduces power losses in the grid due to reduced
transmission current from large generators to
distribution transformers and reduced voltage drop
in transmission lines. This advantage will have other
side effects such as reduced production and related
costs [5].
A) The effect of distributed generation sources
on the distribution system voltage
According to various standards, certain limits
are allowed for the distribution grid voltage, in most
of which this value is between 10% of the nominal
voltage. In distribution systems, by passing current
pp. 41:46
International Journal of Smart Electrical Engineering, Vol.9, No.1, Winter 2020 ISSN: 2251-9246 EISSN: 2345-6221
42
through the resistance and impedance of the lines, it
causes power losses and voltage drops, which will
be more acute at the end points of the grid with
increasing load and due to the radial structure of this
system. To control the voltage of the distribution
system, there are two traditional methods of control
by pulse changers in transformer substations and
control of reactive power with shunt capacitors [6].
In the presence of DG in the distribution grid, if the
DG output changes in harmony with the load (DG
output increases with increasing load and decreases
with decreasing load), then DG will act as a negative
load and reduce voltage changes. However, in some
types of distributed generation sources such as
photovoltaics and wind power plants, this is not
possible and the voltage changes in the grid increase.
In general, the presence of DGs to control voltage
can cause it to be confronted with traditional voltage
control equipment such as pulsators, which indicates
the need for new methods to control the voltage in
the presence of DGs in distribution networks. Of
course, DG connection technology to the
distribution network will be very effective in
controlling the grid voltage [2, 6, 7]. As mentioned,
the presence of DG, provided proper placement,
reduces the post-load flow. Therefore, the current
passing through the line resistance is reduced and
the losses (RI2) are reduced [1, 8].
The LLRI line loss reduction index is defined
as follows:
𝐿𝐿𝑊/𝐷𝐺 = 3 ∑ 𝐼𝐴,𝑖2𝑀
𝐼=1 𝑅𝐷𝑖 (1)
Where LLW / DG and LLWO / DG are the line
losses in the two modes of connection and non-
connection of DG to the grid, respectively, which
are obtained from the following relations:
𝐿𝐿𝑊/𝐷𝐺 = 3 ∑ 𝐼𝐴,𝑖2𝑀
𝐼=1 𝑅𝐷𝑖 (2)
𝐿𝐿𝑊𝑂/𝐷𝐺 = 3 ∑ 𝐼𝐿,𝑖2
𝑀
𝐼=1
𝑅𝐷𝑖 (3)
Where IA, i, line prionite current in a grid
supplied by DG, and IL, i, line prionite current in a
device without DG, line resistance R in terms of Di,
Pu / km, distribution line length, and M, number of
lines Is the system. Therefore, the following states
can be defined in the grid:
Increasing line losses with the presence of DG
(LLRI <1)
No effect on line losses in the presence of DG
(LLRI = 1)
Reduction of line losses with the presence of
DG (LLRI> 1)
B) Unbalanced consequences
Increase of power losses: Power losses in low
voltage grid include two categories of power losses
in phases and power losses in neutral wire.
Assuming that the total current of the three phases is
constant, the power losses in the phases in the load
imbalance state are more than the losses in the load
equilibrium state, to which the losses in zero are
added. Phases and therefore the ohmic resistance of
the neutral wire is about twice the resistance of the
phase wires, the losses are still noticeable even in the
case of low currents. Voltage drops due to
unbalance: Even assuming that the phase wires in
the grid have the same cross-sections and therefore
the same impedance, due to unequal current flow,
the phase wires have different voltage drops and
therefore have unbalanced voltage on the consumers
side, especially the most sensitive consumers. they
will be. This will have adverse effects on three-
phase consumers. Dangers due to neutral current:
With the current unbalanced in the three-phase
system and the current passing through the neutral
wire, it has a voltage relative to the ground, which is
undesirable in terms of safety if it exceeds the
allowable limit, and if the consumer contacts the
neutral wire Slowly, there will be a possibility of
electric shock. In addition to the mentioned issues,
the unbalanced high load of the grid will cause
unfavorable situation in other components of the
grid, including transformers.
C) Modeling of transformers under abnormal
operating conditions -Modeling in non-
sinusoidal load conditions:
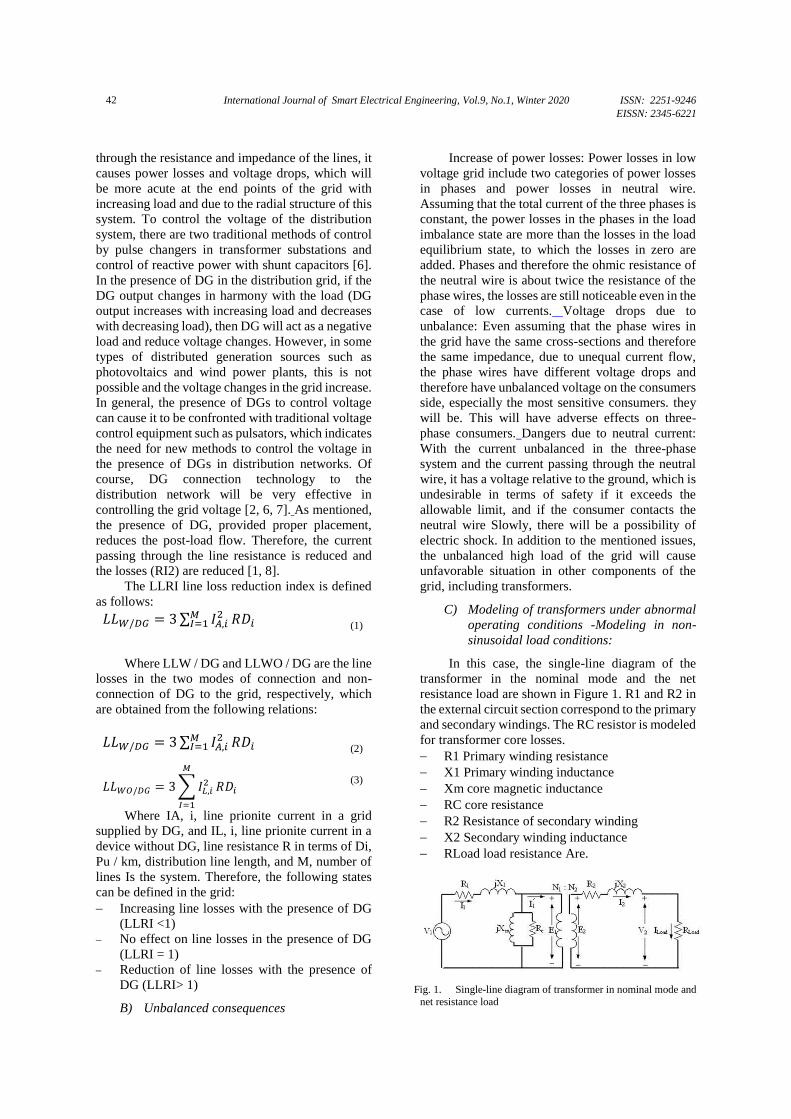
In this case, the single-line diagram of the
transformer in the nominal mode and the net
resistance load are shown in Figure 1. R1 and R2 in
the external circuit section correspond to the primary
and secondary windings. The RC resistor is modeled
for transformer core losses.
R1 Primary winding resistance
X1 Primary winding inductance
Xm core magnetic inductance
RC core resistance
R2 Resistance of secondary winding
X2 Secondary winding inductance
RLoad load resistance Are.
Fig. 1. Single-line diagram of transformer in nominal mode and
net resistance load
International Journal of Smart Electrical Engineering, Vol.9, No.1, Winter 2020 ISSN: 2251-9246 EISSN: 2345-6221
43
Transformer core losses include hysteresis
losses and Foucault losses. In this software, the
complete cycle of the core magnetization curve is
not considered, so the hysteresis component of the
core losses is ignored and only Foucault losses are
considered as core losses. The magnetic inductance
of the Xm core is automatically calculated by the
software and taken into account in the FEM
calculations according to the magnetic curve defined
for the core and the type of transformer power
supply in the external circuit part of the software. V1
The transformer supply voltage is supplied through
the supply drive. In the drive section, there are
various functions for powering the transformer.
Among these functions, we can mention sine,
cosine, step, exponential, and so on. Each of these
functions is defined by assigning a value to its
principal attribute. According to the sine power
supply, a sine function is used as the supply voltage
of the three-phase transformer in its primary. The
frequency characteristic and phase angle of the sine
function in the drive section are applied to the first
three phases and the voltage range is considered in
terms of its maximum value in the external circuit
section. Since nonlinear load modeling is not
possible through harmonic current sources, an
alternative method is considered for this purpose.
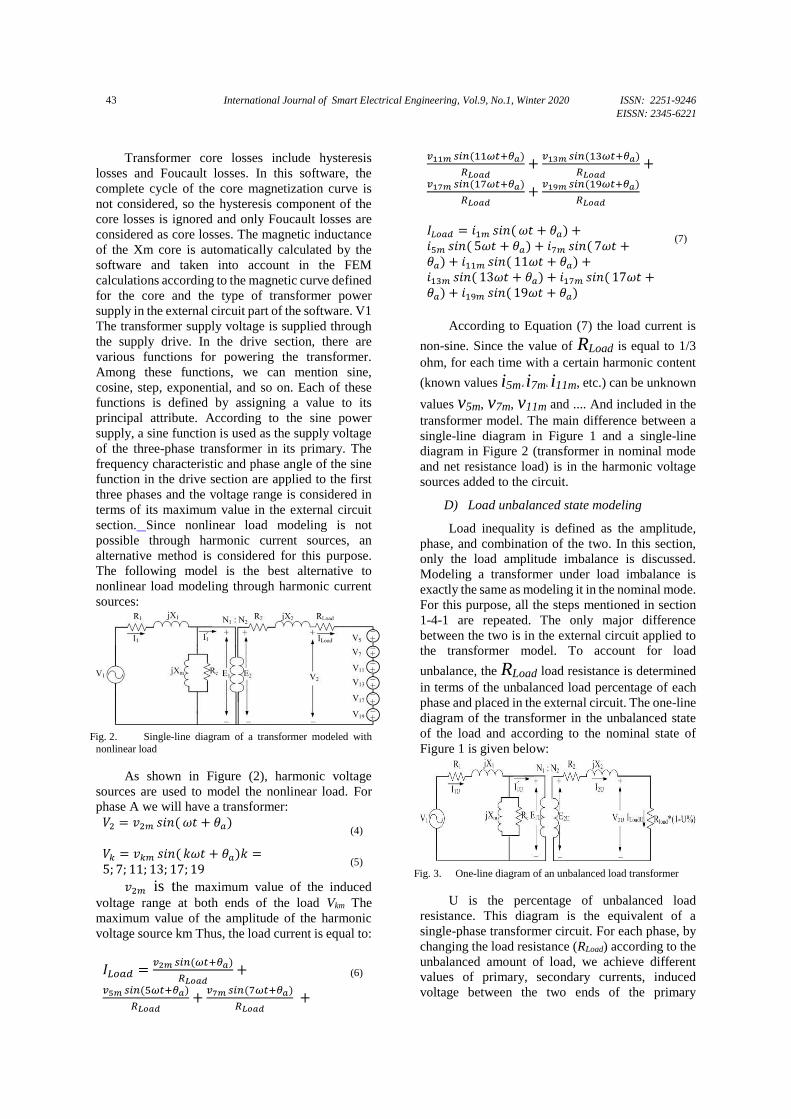
The following model is the best alternative to
nonlinear load modeling through harmonic current
sources:
Fig. 2. Single-line diagram of a transformer modeled with
nonlinear load
As shown in Figure (2), harmonic voltage
sources are used to model the nonlinear load. For
phase A we will have a transformer:
𝑉2 = 𝑣2𝑚 𝑠𝑖𝑛( 𝜔𝑡 + 𝜃𝑎) (4)
𝑉𝑘 = 𝑣𝑘𝑚 𝑠𝑖𝑛( 𝑘𝜔𝑡 + 𝜃𝑎)𝑘 =5; 7; 11; 13; 17; 19
(5)
𝑣2𝑚 is the maximum value of the induced
voltage range at both ends of the load Vkm The
maximum value of the amplitude of the harmonic
voltage source km Thus, the load current is equal to:
𝐼𝐿𝑜𝑎𝑑 =𝑣2𝑚 𝑠𝑖𝑛(𝜔𝑡+𝜃𝑎)
𝑅𝐿𝑜𝑎𝑑+
𝑣5𝑚 𝑠𝑖𝑛(5𝜔𝑡+𝜃𝑎)
𝑅𝐿𝑜𝑎𝑑+
𝑣7𝑚 𝑠𝑖𝑛(7𝜔𝑡+𝜃𝑎)
𝑅𝐿𝑜𝑎𝑑 +
(6)
𝑣11𝑚 𝑠𝑖𝑛(11𝜔𝑡+𝜃𝑎)
𝑅𝐿𝑜𝑎𝑑+
𝑣13𝑚 𝑠𝑖𝑛(13𝜔𝑡+𝜃𝑎)
𝑅𝐿𝑜𝑎𝑑+
𝑣17𝑚 𝑠𝑖𝑛(17𝜔𝑡+𝜃𝑎)
𝑅𝐿𝑜𝑎𝑑+
𝑣19𝑚 𝑠𝑖𝑛(19𝜔𝑡+𝜃𝑎)
𝑅𝐿𝑜𝑎𝑑
𝐼𝐿𝑜𝑎𝑑 = 𝑖1𝑚 𝑠𝑖𝑛( 𝜔𝑡 + 𝜃𝑎) +𝑖5𝑚 𝑠𝑖𝑛( 5𝜔𝑡 + 𝜃𝑎) + 𝑖7𝑚 𝑠𝑖𝑛( 7𝜔𝑡 +𝜃𝑎) + 𝑖11𝑚 𝑠𝑖𝑛( 11𝜔𝑡 + 𝜃𝑎) +𝑖13𝑚 𝑠𝑖𝑛( 13𝜔𝑡 + 𝜃𝑎) + 𝑖17𝑚 𝑠𝑖𝑛( 17𝜔𝑡 +𝜃𝑎) + 𝑖19𝑚 𝑠𝑖𝑛( 19𝜔𝑡 + 𝜃𝑎)
(7)
According to Equation (7) the load current is
non-sine. Since the value of RLoad is equal to 1/3
ohm, for each time with a certain harmonic content
(known values i5m، i7m، i11m, etc.) can be unknown
values v5m, v7m, v11m and .... And included in the
transformer model. The main difference between a
single-line diagram in Figure 1 and a single-line
diagram in Figure 2 (transformer in nominal mode
and net resistance load) is in the harmonic voltage
sources added to the circuit.
D) Load unbalanced state modeling
Load inequality is defined as the amplitude,
phase, and combination of the two. In this section,
only the load amplitude imbalance is discussed.
Modeling a transformer under load imbalance is
exactly the same as modeling it in the nominal mode.
For this purpose, all the steps mentioned in section
1-4-1 are repeated. The only major difference
between the two is in the external circuit applied to
the transformer model. To account for load
unbalance, the RLoad load resistance is determined
in terms of the unbalanced load percentage of each
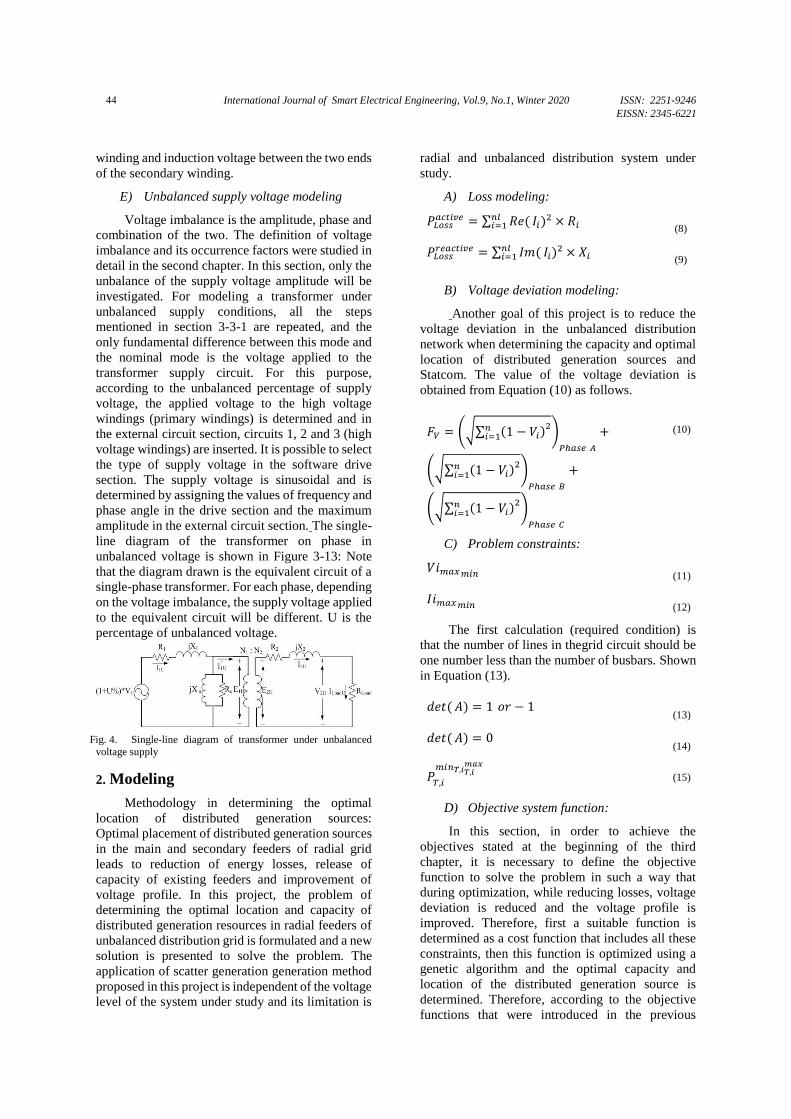
phase and placed in the external circuit. The one-line
diagram of the transformer in the unbalanced state
of the load and according to the nominal state of
Figure 1 is given below:
Fig. 3. One-line diagram of an unbalanced load transformer
U is the percentage of unbalanced load
resistance. This diagram is the equivalent of a
single-phase transformer circuit. For each phase, by
changing the load resistance (RLoad) according to the
unbalanced amount of load, we achieve different
values of primary, secondary currents, induced
voltage between the two ends of the primary
International Journal of Smart Electrical Engineering, Vol.9, No.1, Winter 2020 ISSN: 2251-9246 EISSN: 2345-6221
44
winding and induction voltage between the two ends
of the secondary winding.
E) Unbalanced supply voltage modeling
Voltage imbalance is the amplitude, phase and
combination of the two. The definition of voltage
imbalance and its occurrence factors were studied in
detail in the second chapter. In this section, only the
unbalance of the supply voltage amplitude will be
investigated. For modeling a transformer under
unbalanced supply conditions, all the steps
mentioned in section 3-3-1 are repeated, and the
only fundamental difference between this mode and
the nominal mode is the voltage applied to the
transformer supply circuit. For this purpose,
according to the unbalanced percentage of supply
voltage, the applied voltage to the high voltage
windings (primary windings) is determined and in
the external circuit section, circuits 1, 2 and 3 (high
voltage windings) are inserted. It is possible to select
the type of supply voltage in the software drive
section. The supply voltage is sinusoidal and is
determined by assigning the values of frequency and
phase angle in the drive section and the maximum
amplitude in the external circuit section. The single-
line diagram of the transformer on phase in
unbalanced voltage is shown in Figure 3-13: Note
that the diagram drawn is the equivalent circuit of a
single-phase transformer. For each phase, depending
on the voltage imbalance, the supply voltage applied
to the equivalent circuit will be different. U is the
percentage of unbalanced voltage.
Fig. 4. Single-line diagram of transformer under unbalanced
voltage supply
2. Modeling
Methodology in determining the optimal
location of distributed generation sources:
Optimal placement of distributed generation sources
in the main and secondary feeders of radial grid
leads to reduction of energy losses, release of
capacity of existing feeders and improvement of
voltage profile. In this project, the problem of
determining the optimal location and capacity of
distributed generation resources in radial feeders of
unbalanced distribution grid is formulated and a new
solution is presented to solve the problem. The
application of scatter generation generation method
proposed in this project is independent of the voltage
level of the system under study and its limitation is
radial and unbalanced distribution system under
study.
A) Loss modeling:
𝑃𝐿𝑜𝑠𝑠𝑎𝑐𝑡𝑖𝑣𝑒 = ∑ 𝑅𝑒( 𝐼𝑖)2 × 𝑅𝑖
𝑛𝑙𝑖=1
(8)
𝑃𝐿𝑜𝑠𝑠𝑟𝑒𝑎𝑐𝑡𝑖𝑣𝑒 = ∑ 𝐼𝑚( 𝐼𝑖)
2 × 𝑋𝑖𝑛𝑙𝑖=1
(9)
B) Voltage deviation modeling:
Another goal of this project is to reduce the
voltage deviation in the unbalanced distribution
network when determining the capacity and optimal
location of distributed generation sources and
Statcom. The value of the voltage deviation is
obtained from Equation (10) as follows.
𝐹𝑉 = (√∑ (1 − 𝑉𝑖)𝑛𝑖=1
2)
𝑃ℎ𝑎𝑠𝑒 𝐴
+
(√∑ (1 − 𝑉𝑖)𝑛𝑖=1
2)
𝑃ℎ𝑎𝑠𝑒 𝐵
+
(√∑ (1 − 𝑉𝑖)𝑛𝑖=1
2)
𝑃ℎ𝑎𝑠𝑒 𝐶
(10)
C) Problem constraints:
𝑉𝑖𝑚𝑎𝑥 𝑚𝑖𝑛
(11)
𝐼𝑖𝑚𝑎𝑥𝑚𝑖𝑛
(12)
The first calculation (required condition) is
that the number of lines in thegrid circuit should be
one number less than the number of busbars. Shown
in Equation (13).
𝑑𝑒𝑡( 𝐴) = 1 𝑜𝑟 − 1 (13)
𝑑𝑒𝑡( 𝐴) = 0 (14)
𝑃𝑇,𝑖
𝑚𝑖𝑛𝑇,𝑖𝑇,𝑖𝑚𝑎𝑥
(15)
D) Objective system function:
In this section, in order to achieve the
objectives stated at the beginning of the third
chapter, it is necessary to define the objective
function to solve the problem in such a way that
during optimization, while reducing losses, voltage
deviation is reduced and the voltage profile is
improved. Therefore, first a suitable function is
determined as a cost function that includes all these
constraints, then this function is optimized using a
genetic algorithm and the optimal capacity and
location of the distributed generation source is
determined. Therefore, according to the objective
functions that were introduced in the previous
International Journal of Smart Electrical Engineering, Vol.9, No.1, Winter 2020 ISSN: 2251-9246 EISSN: 2345-6221
45
sections, respectively; The cost function of the
whole system is defined as relation (16):
𝐹𝑆𝑦𝑠𝑡𝑒𝑚 = 𝑃𝐿𝑜𝑠𝑠 + 𝐹𝑣 (16)
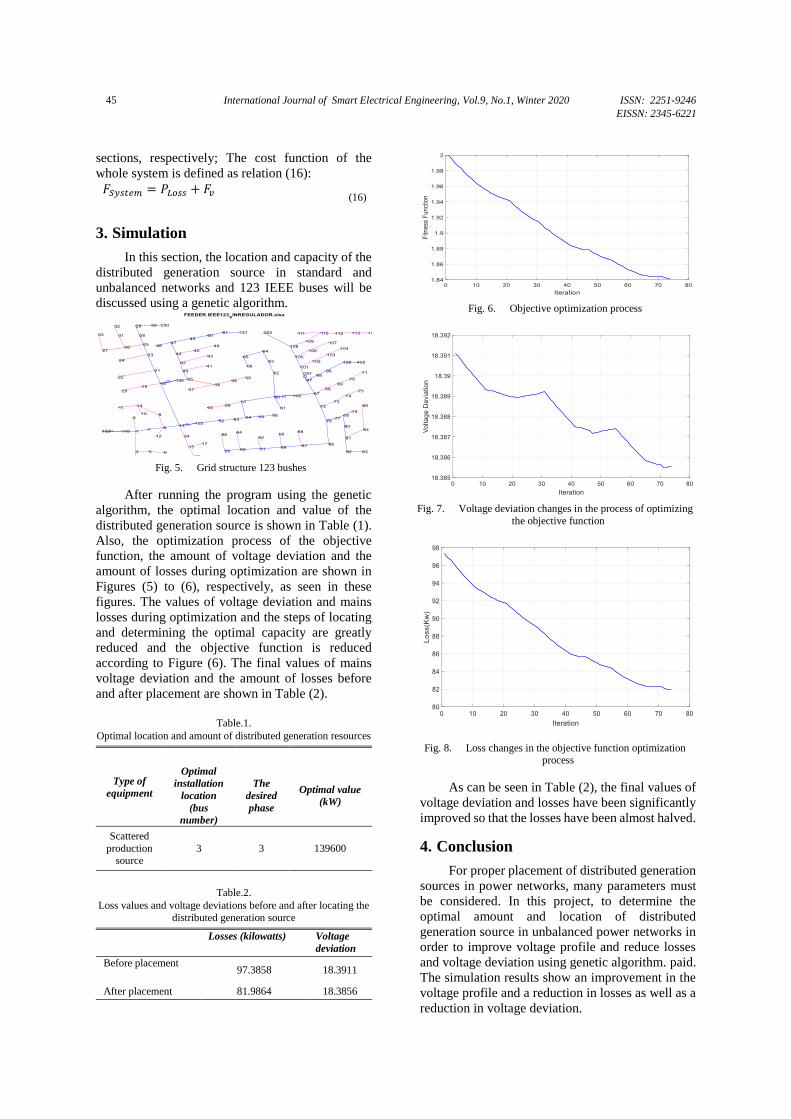
3. Simulation
In this section, the location and capacity of the
distributed generation source in standard and
unbalanced networks and 123 IEEE buses will be
discussed using a genetic algorithm.
Fig. 5. Grid structure 123 bushes
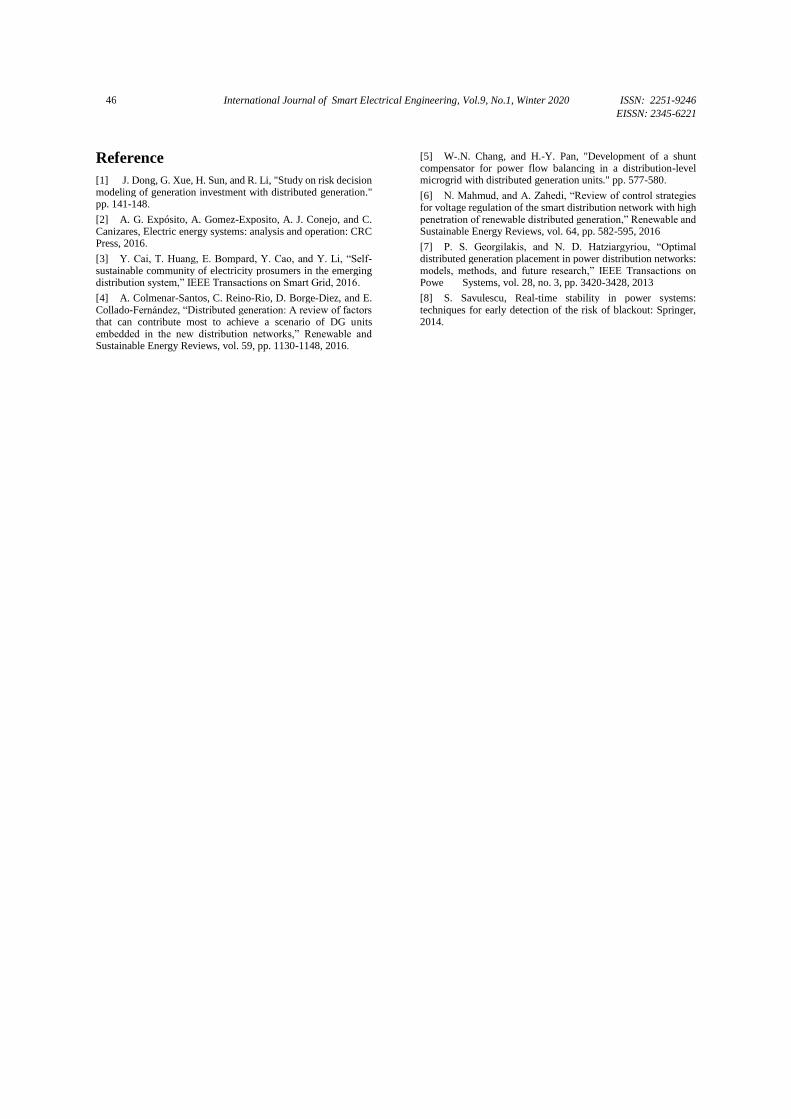
After running the program using the genetic
algorithm, the optimal location and value of the
distributed generation source is shown in Table (1).
Also, the optimization process of the objective
function, the amount of voltage deviation and the
amount of losses during optimization are shown in
Figures (5) to (6), respectively, as seen in these
figures. The values of voltage deviation and mains
losses during optimization and the steps of locating
and determining the optimal capacity are greatly
reduced and the objective function is reduced
according to Figure (6). The final values of mains
voltage deviation and the amount of losses before
and after placement are shown in Table (2).
Table.1. Optimal location and amount of distributed generation resources
Optimal value
(kW)
The
desired
phase
Optimal
installation
location
(bus
number)
Type of
equipment
139600 3 3
Scattered
production source
Table.2. Loss values and voltage deviations before and after locating the
distributed generation source
Voltage
deviation Losses (kilowatts)
18.3911 97.3858 Before placement
18.3856 81.9864 After placement
Fig. 6. Objective optimization process
Fig. 7. Voltage deviation changes in the process of optimizing
the objective function
Fig. 8. Loss changes in the objective function optimization process
As can be seen in Table (2), the final values of
voltage deviation and losses have been significantly
improved so that the losses have been almost halved.
4. Conclusion
For proper placement of distributed generation
sources in power networks, many parameters must
be considered. In this project, to determine the
optimal amount and location of distributed
generation source in unbalanced power networks in
order to improve voltage profile and reduce losses
and voltage deviation using genetic algorithm. paid.
The simulation results show an improvement in the
voltage profile and a reduction in losses as well as a
reduction in voltage deviation.
International Journal of Smart Electrical Engineering, Vol.9, No.1, Winter 2020 ISSN: 2251-9246 EISSN: 2345-6221
46
Reference
[1] J. Dong, G. Xue, H. Sun, and R. Li, "Study on risk decision modeling of generation investment with distributed generation." pp. 141-148.
[2] A. G. Expósito, A. Gomez-Exposito, A. J. Conejo, and C. Canizares, Electric energy systems: analysis and operation: CRC Press, 2016.
[3] Y. Cai, T. Huang, E. Bompard, Y. Cao, and Y. Li, “Self-sustainable community of electricity prosumers in the emerging distribution system,” IEEE Transactions on Smart Grid, 2016.
[4] A. Colmenar-Santos, C. Reino-Rio, D. Borge-Diez, and E. Collado-Fernández, “Distributed generation: A review of factors that can contribute most to achieve a scenario of DG units embedded in the new distribution networks,” Renewable and Sustainable Energy Reviews, vol. 59, pp. 1130-1148, 2016.
[5] W-.N. Chang, and H.-Y. Pan, "Development of a shunt compensator for power flow balancing in a distribution-level microgrid with distributed generation units." pp. 577-580.
[6] N. Mahmud, and A. Zahedi, “Review of control strategies for voltage regulation of the smart distribution network with high penetration of renewable distributed generation,” Renewable and Sustainable Energy Reviews, vol. 64, pp. 582-595, 2016
[7] P. S. Georgilakis, and N. D. Hatziargyriou, “Optimal distributed generation placement in power distribution networks: models, methods, and future research,” IEEE Transactions on Powe Systems, vol. 28, no. 3, pp. 3420-3428, 2013
[8] S. Savulescu, Real-time stability in power systems: techniques for early detection of the risk of blackout: Springer, 2014.