determining feed intake and feed efficiency of individual cattle fed in groups
TRANSCRIPT

1
DETERMINING FEED INTAKE AND FEED EFFICIENCY OF INDIVIDUAL CATTLE FED IN GROUPS
D. G. Fox, L.O. Tedeschi and P. J. Guiroy Animal Science Dept., Cornell University
Introduction The beef industry in the United States is developing programs to minimize excess fat produced, increase consistency of product and to identify and reward individual owners for superior performance in the feedlot. In the U.S., Strategic Alliances between cow-calf, feedlot and packer segments of the industry are being developed to accomplish this goal. Integrated production and marketing systems are being developed that can make Strategic Alliances work. Their objective is to market animals at their optimum economic endpoint, considering live and carcass incremental cost of gain and carcass prices for various grades, and avoiding discounts. To accomplish this, cattle are marketed as individuals when at their optimum carcass composition, which typically requires having cattle with different owners in the same pen. This requires allocating and billing feed fed to a pen to the individual animals in the pen. To make individual animal management work, the method used to allocate the feed consumed by animals from different owners that share the same pen must accurately determine cost of gain of each animal in a pen.
We (Perry and Fox, 1997, and Guiroy et al., 2001a) developed and validated a model to predict the composition of gain, feed requirements for maintenance and growth and carcass composition of individual animals. This model is being used to allocate feed fed to a pen to the individuals in the pen, based on their body size, rate and composition of growth and effects of environment. This information can be used by beef herd owners to account for differences in mature size, rate and composition of gain and finished weight in selecting for feed efficiency. The objective of this paper is to discuss the variables that must be accounted for in determining individual animal feed requirements and feed efficiency, and the models we have developed that are being used in feedlots to allocate feed to individual cattle fed in pens. Economic importance of selecting for feed efficiency
The average steer in the U.S. is approximately 1170 lb when marketed (National Research Council Nutrient Requirements of Beef Cattle Update 2000; NRC, 2000), with approximately 50% grading choice. Table 1 shows the effects of growth rate and feed efficiency for this steer on cost to gain 600 lb (570 lb initial weight to 1170 lb at low choice grade), based on simulations performed with our computer program called Cornell Value Discovery System (Tedeschi et al., 2001a). This computer program is based on the growth model of Fox et al. (1992) and Tylutki et al. (1994) as applied in the NRC (2000), and the models developed by Guiroy et al. (2001a,b).

2
Table 1. The effect of improvement in rate of gain and feed efficiency on profits1
Average steer Effect of 10% higher ADG
Effect of 10% higher feed efficiency
Dry matter intake, lb/day 18.7 20.0 18.7 Daily gain, lb 3.21 3.53 3.61 Feed/gain ratio 5.82 5.67 5.18 Feed cost, $ 176 172 157 Non feed cost, $ 98 91 89 Total cost of gain, $ 274 263 246 Profit, $ 65 77 93 1Computed with Cornell Value Discovery System (Tedeschi et al., 2001a).
This table shows that a 10% improvement in rate of gain alone, as the result of a 7% increase in appetite, improved profits 18%, primarily as the result of fewer days on feed and thus less non feed costs. The reduction in feed cost was due to a reduction in feed required for maintenance due to fewer days required to gain 600 lb. When the intake remained the same but efficiency of Metabolizable Energy use by the animal was improved by an amount that resulted in a 10% improvement in feed efficiency, profits were improved by 43%.
The impact of selecting for growth rate alone to improve feed efficiency
The observation that increased growth rate was associated with reduced cost of gain has led us to select for growth rate over the last 40 years since it is relatively easy to measure. Koch et al. (1963) concluded that “selecting for gain should be effective and lead to both increased feed efficiency and increased feed consumption”. The observation that increased growth rate was associated with reduced cost of gain has led us to select for growth rate over the last 40 years since it is relatively easy to measure. The question is: has selecting for growth alone led to improved feed efficiency? Keep in mind that until the late 1960’s, our national beef cow herd was predominately Angus and Hereford breeds and their crosses, with most of the steers grading choice within the range of 1000 to 1100 lb.
One of the most complete studies to look at the results of this approach was
conducted over several years at Michigan State University in the 60’s and 70’s (Harpster et al., 1978). Four types of cattle were developed from a herd of Hereford cows through the use of selection for weaning and feedlot growth rate. The types included Unselected Herefords, Selected Herefords, Angus x Hereford x Charolais (AHC), and Angus x Hereford x Holstein. At weaning, steer calves were finished in the feedlot on all corn silage or high grain based rations to the low choice grade, and heifer calves not kept for herd replacements were fed all corn silage rations to the low choice grade. Table 2 shows the results of that study.

3
Table 2. The effect of selecting for growth rate1
Item
Unselected Hereford
Selected Hereford
Angus x Hereford x Charolais
Angus x Hereford x Holstein
Steers fed high grain rations Initial weight, lb 379 438 537 563 Final weight, lb 1043 1136 1268 1241 Daily gain, lb 2.82 2.96 3.09 2.86 Daily DM intake, lb 15.7 16.8 18.8 19.3 Feed/gain ratio 5.58 5.66 6.08 6.76 Carcass weight at 29% carcass fat (lb) Steers 588 665 733 768 Heifers 468 552 584 627 1Harpster et al., 1978. Cattle were harvested when estimated to be at low Choice grade.
Differences in initial weights reflect differences in weaning weights, since the
calves were placed on the feedlot trial within 30 days of weaning. The following were our conclusions from that study (Harpster et al., 1978):
1. Selection for growth rate increased cow mature weights and steer and heifer
weaning weights, and weights at a similar degree of body fat (low choice grade). 2. Selection and crossbreeding based on growth rate alone did not improve feed
efficiency in the feedlot-finishing phase. 3. Crossbreeding with dairy to improve milk production increased weaning weights
but reduced feed efficiency in the feedlot-finishing phase. 4. Heifers reach the same degree of body fat at about 80% of the weight of their
steer mates. Using today’s criteria for window of acceptability for carcasses in many markets
(minimum of 600 and a maximum of 850 lb at low choice grade) selection for growth rate was beneficial in that carcass weights across both steers and heifers were the most acceptable in weight in the selected and crossbred groups. Thus, selection for growth rate until the mature size is reached where carcass weights are of an optimum size is beneficial. Then other criteria must be considered if feed efficiency is to be improved. Model for predicting feed requirements of individual animals fed in pens Because of the wide variations in breed types and their crosses used for beef production in North America and environments in which they are fed prior to marketing as finished beef, modeling systems to predict feed requirements and cost of gain must be able to account for differences in basal maintenance requirement, the effect of environment on maintenance requirement, and differences in body size, implant program and feeding

4
system. Table 3 contains a glossary of terms we use in describing our model developed to accomplish this objective.
Table 3. Glossary of terms
Term Description ADG Shrunk weight average daily gain, kg/d AFBW Final SBW adjusted to 28% EBF, kg BW Body weight, kg EBF Empty body fat, % EBG Empty body gain, and is 0.956 ADG, kg/d EBW Empty body weight, kg EQSW Equivalent shrunk, kg EQEBW Equivalent empty body weight, kg FT 12th rib fat thickness, cm FFG Feed for gain, kg/d FFM Feed for maintenance, kg/d HCW Hot carcass weight, kg LMA Longissimus muscle area, cm2 NEg
a Net energy for gain NEm
a Net energy for maintenance RE Retained energy, Mcal/d SBW Shrunk body weight, and is 0.96 full BW, kg QG USDA quality grade, 4 = Select, 5 = Choice-, 6 =
Choice, 7 = Choice +, and 8 = Prime aMcal/kg if diet energy concentration or Mcal/d if animal requirements. Diet NEg and NEm can be calculated using CNCPS 4.0 or NRC (2000) models level 2.
Accounting for body composition at the marketing target. The critical first step for predicting feed required for the observed growth and incremental cost of gain and body composition as cattle grow is to identify the body composition at the marketing target. Carcass value in most markets and cost of gain can be related to proportion of protein and fat in the carcass. Body fat in finished cattle when marketed typically varies from 16 to 21% empty body fat (EBF) in the French (INRA, 1989) and Brazilian (Leme et al., 2000) markets to over 30% EBF in segments of the Japanese and Korean Markets. Most other markets range between these two. The single most recognizable quality grade in the world is USDA choice. Premium brand name products typically utilize the prime and upper 2/3 of the Choice grades and are increasing the value of U.S. beef products. Table 4 shows a summary of data from our experiments (Guiroy et al., 2001a) that support the value of the Choice and prime grades level of fatness to minimize the percent of the beef that is unacceptable to consumers in the U.S.

5
Table 4. Relationship of carcass and empty body fat to quality grade (total of 1,355 animals; Guiroy et al., 2001a). Values in a row are means for that grade.
Number
of animals USDA Quality Gradea
Mean carcass fat,
%
Mean EBF, %b
EBF SEM
Taste panel scorec
Percent unacceptablec
45 3.5 23.55 21.13u 0.63 5.3 40 470 4.5 28.98 26.15v 0.19 5.6 13 461 5.5 31.64 28.61w 0.20 5.8 8 206 6.5 33.02 29.88x 0.29 6.2 0 90 7.5 34.23 31.00xy 0.44 - - 51 8.5 35.24 31.94y 0.59 - - 32 9.5 35.80 32.45z 0.74 - -
aStandard = 3 to 4; Select = 4 to 5; low Choice = 5 to 6; mid Choice = 6 to 7; high Choice = 7 to 8; low Prime = 8 to 9; mid Prime = 9 to 10. bColumn means with different superscripts are significantly different at P < 0.05. cTaste panel scores (from 1 to 8) and percent unacceptable values are from a subset of this data base.
These data show that EBF was significantly (P < 0.05) higher with each incremental increase in grade up to the mid Choice grade. Taste panel scores and percent unacceptable followed the same trend. This data also indicate we can correlate grade to changes in body composition as cattle grow. The most critical factor in this table for our model is the percent EBF at Standard (21.1%), Select (26.2%), and low Choice grade (28.6%) grade since these are the body composition endpoints for different marketing targets used to identify feed requirements during growth. The National Beef Quality Audit (Smith et al., 1995) reported the percent of steaks with low eating quality for the USDA Prime, Choice, Select, and Standard grades were 5.6, 10.8, 26,4, and 59.1 percent, respectively in data collected from typical feedlot cattle. The percent unacceptable values were lower for the Cornell data, likely because they were uniform calves fed a 90% concentrate diet beginning at approximately 7 months of age. The 1995 National Beef Quality Audit also reported that up to 20% of all beef does not pass U.S. consumer satisfaction in eating quality and recommends that the percentage of cattle grading low Choice and above be increased. Based on a survey of retailers, purveyors, and exporters, the ideal mix would be 62% low Choice or better and 38% Select, with no Standard grade beef. This compares to the current 51% low Choice or better, 42% Select and 7% Standard grade and lower (McKenna et al., 2001). The 10% of U.S. beef that is exported would have none below low Choice. The strong message from our consumers is that the external fat must be removed from beef, but intramuscular (marbling) fat is required in the edible product. This is likely due at least in part to the method of cookery commonly used compared to what is common in most other countries (Dikeman et al., 1987). Accounting for differences in requirements for growth. Numerous studies, including those discussed previously, have indicated that cattle of different genotypes

6
are at different weights when they are at the same degree of fatness. Based on these and other studies, we (Fox et al., 1992) developed the following relationship between frame size and weight at 28% body fat (low Choice grade), which can be used to develop the target frame size in breeding programs, based on weight desired at low choice grade (Table 5).
Table 5. The relationship between frame size and 28% body fat or mature weight1
Frame size2 Weight at 28% body fat in kg Weight at 28% body fat in lb
Steers3 Heifers4 Steers Heifers 1 400 320 882 705 2 433 346 954 763 3 467 374 1029 824 4 500 400 1102 882 5 533 426 1175 939 6 567 454 1250 1001 7 600 480 1322 1058 8 633 506 1395 1115 9 667 534 1470 1177
1 Adapted from Fox et al. (1992). 2Can be computed from The Beef Improvement Federation Guidelines (1991); Frame size for bulls = -11.548 + 0.4878 x (hip height, inches) - 0.0289 x (age, days). + 0.00001947 (age, days)2 + 0.0000334 x (hip height, inches) x (age, days). It is assumed in this paper to be the same for implanted steers. Frame size for heifers = -11.7086 + 0.4723 x (hip height, inches) - 0.0239 x (age, days) + 0.0000146 x (age, days)2 + 0.0000759 x (hip height, inches) x (age, days). 3Steer weight at 28% body fat or cow mature weight (kg) = 33.35 x frame size + 366.52. 4Heifer weight at 28% body fat (kg) = 26.7 x frame size + 293.2.
We also determined that cattle of different mature sizes had different fat and protein content of the weight gain at the same weight during growth (Fox and Black, 1984). Therefore we developed a size scaling procedure to account for differences in energy and protein requirements for growth among cattle of different frame sizes and sexes (Fox and Black, 1984; Fox et al., 1988; Fox et al., 1992, Tylutki et al., 1994; Fox et al., 1999) which was adapted by the National Research Council Nutrient Requirements of Beef Cattle (2000) and Dairy Cattle (2001). In this model, the animal’s weight at 28% fat is divided into the weight of the standard reference animal at that composition. This ratio is then multiplied by the animal’s actual weight to adjust it to the standard reference animal for use in the energy requirement equation. The standard reference animal represents the cattle body size used to develop the equations to predict the net energy content of weight gain. Table 6 shows requirements for growth computed with this model for 3 mature sizes of cattle. This table shows that as mature size increases, weight at the same energy content of gain increases, because larger size animals are at an earlier stage of growth at the same weight and therefore have

7
more protein and less fat in the gain. It also shows that energy requirements increase with increasing stage of growth and rate of gain.
Table 6. Relationship of stage of growth and rate of gain to body composition
28% fat weight, lb Weight during growth, lb 1100 lb 600 800 1000 1300 lb 708 944 1180 % of 28% fat wt. 55 73 91 ADG, lb/day Net energy required, Mcal/day 2.0 3.23 4.01 4.74 3.0 5.04 6.26 7.40 4.0 6.92 8.58 10.14
Three data sets were used to test this system (NRC, 2000). With two of the data sets (82 pen observations of Bos taurus implanted steers and heifers varying in breed type, body size and diet type and 142 serially slaughtered nonimplanted steers, heifers and bulls varying in body size aggregated into “pens” by slaughter groups), this system accounted for 94% of the variation in energy retained with only a 2% underprediction bias. However, it cannot be assumed that this accuracy will apply to individual animals at a particular point in time during growth, since these results were obtained from pen averages and total energy retained. Many factors can alter estimates of finished weight of individuals, such as previous nutrition, implant programs, level of intake and energy derived from the diet, limits in daily protein and fat synthesis, and daily energy retained. The problem is to be able to predict those effects in individual animals based on information that will be available and is practical to apply. Accounting for differences in requirements for maintenance. The model used for this purpose is described by Fox and Tylutki (1998). The effects of breed type are accounted for by adjusting the base NEm requirement of 77 kcal/kg MBW (metabolic body weight) for Bos indicus and dairy types (-10 and +20% compared to Bos taurus). The effects of previous nutrition are accounted for by relating body condition score to NEm requirement. On a 1 to 9 scale, maintenance requirement is reduced 5% for each condition score below 5 and is increased 5% for each score above 5. The effects of acclimatization are accounted for by adjusting for previous month’s average temperature (ranges from 70 kcal/kg MBW at 30 oC to 105 kcal/kg MBW at -20 oC). This adjustment is continuous, with no effect at 20 oC. Current environmental effects are accounted for by computing heat lost vs heat produced, based on current temperature, internal and external insulation, wind, and hair coat depth and condition. This becomes important when the animal is below the computed lower critical temperature, and can range from no effect at 20 oC to twice as high (thin, dirty hide at -12 oC and 1 mph wind).
System of equations to predict individual feed requirements. The system of
equations we developed (Guiroy et al., 2001a) to predict individual animal feed

8
requirements is summarized in Table 7. A computer program (Cornell Value Discovery System) has been developed to implement this model (Tedeschi et al., 2001a).
Table 7. Equations to predict individual dry matter requirements (1) EBW = 1.316 HCW + 32.29; from Garrett et al. (1978) (2) EBF% = 17.76207 + 4.68142 FT + 0.01945 HCW + 0.81855 QG – 0.06754 LMA (3) AFBW = (EBW + ((28 - EBF%) x 14.26)) / 0.891 (4) EQSW = SBW (478/AFBW); from NRC (2000) (5) RE = 0.0635EQEBW0.75 EBG1.097; EQEBW is 0.891EQSW; from NRC (2000) (6) FFG = RE/diet NEg (7) FFM = NEm required/diet NEm; NEm required can be calculated as described by
Fox et al. (1992) and NRC (2000) (8) Individual DM required is FFM + FFG (9) Adjusted individual DM required = individual DM required x (total actual pen DM
consumed/ total pen DM required)
Individual feed required is the sum of the feed required for maintenance (FFM), and the feed required for growth (FFG). Feed for maintenance is a function of the NE required for maintenance and the NEm concentration of the diet. Similarly, FFG is a function of the energy retained in the weight gain and the NEg concentration of the diet. Animal differences in mature body size are accounted for as described previously. Perry and Fox (1997) and Guiroy et al. (2001a) presented a detailed description of the development of these equations. Table 8 shows a summary of the calculations for an Angus steer fed in a group pen.
Table 8. Example calculation with the feed allocation model1
Inputs Results
Initial shrunk weight = 713 lb Daily gain = 4.64 lb Final shrunk weight = 1265 lb 28% fat weight = 1241 lb Days on feed = 119 Net energy for gain = 10.82 Mcal/day Hot carcass weight = 803 lb Feed DM for gain = 17.64 lb/day Quality grade = 5.0 Net energy for maintenance = 6.83 lb/day Rib eye area = 79.4 cm2 Feed DM for maintenance = 7.49 lb/day Backfat depth = 1.5 cm Total feed DM required = 25.16 lb/day Diet NEm = 0.91 Mcal/lb Feed efficiency = 5.42 Diet NEg = 0.61 Mcal/lb 1Group inputs included pen dry matter intake for the entire feeding period, and ration NEm and NEg values.

9
Evaluation of the Cornell Value Discovery System The set of equations to predict dry matter consumed by individuals (Table 7) was evaluated with data from the studies of Nour (1982), Perry et al. (1991), Perry and Fox (1997) and Guiroy et al. (2000). This data used included 365 individually fed steers of diverse biological types in which chemical body composition was determined and carcass measurements were taken, and complete information on feeds fed were available to accurately predict diet net energy values in each experimental group. Guiroy et al. (2001a) presented a complete description of this data base. Figure 1 shows the regression plots of DM requirements predicted by the Cornell Value Discovery System against actual DM consumed. The equations presented in Table 7 accounted for 74% of the variation in actual DM consumed, with essentially no bias (0.34%) and a coefficient of variation of 8.18%.
Figure 1. Evaluation of prediction of feed requirements (DM) of individual animals. Data include 365 individually fed steers.
y = 0.82x + 1.39R2 = 0.74
4
6
8
10
12
14
4 6 8 10 12 14
Predicted DM required, kg
Obs
erve
d D
M c
onsu
med
, kg
Y = X
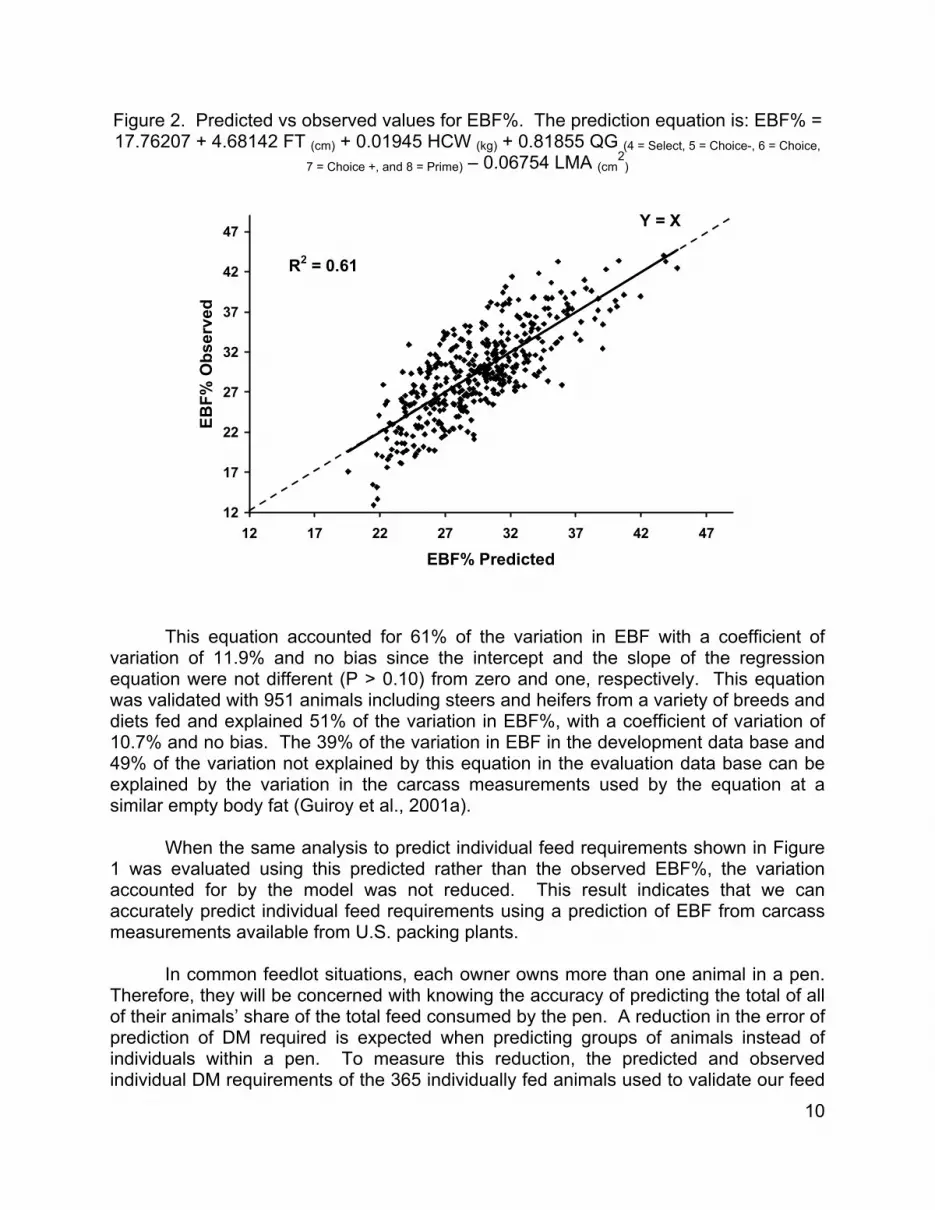
To compute EBF under feedlot conditions, we developed a new equation to predict EBF percentage from carcass measurements commonly taken in U.S. packing plants with a large database. Figure 2 shows the regression of predicted values compared to observed values.
10
Figure 2. Predicted vs observed values for EBF%. The prediction equation is: EBF% = 17.76207 + 4.68142 FT (cm) + 0.01945 HCW (kg) + 0.81855 QG (4 = Select, 5 = Choice-, 6 = Choice,
7 = Choice +, and 8 = Prime) – 0.06754 LMA (cm2
)
R2 = 0.61
12
17
22
27
32
37
42
47
12 17 22 27 32 37 42 47
EBF% Predicted
EBF%
Obs
erve
dY = X
This equation accounted for 61% of the variation in EBF with a coefficient of variation of 11.9% and no bias since the intercept and the slope of the regression equation were not different (P > 0.10) from zero and one, respectively. This equation was validated with 951 animals including steers and heifers from a variety of breeds and diets fed and explained 51% of the variation in EBF%, with a coefficient of variation of 10.7% and no bias. The 39% of the variation in EBF in the development data base and 49% of the variation not explained by this equation in the evaluation data base can be explained by the variation in the carcass measurements used by the equation at a similar empty body fat (Guiroy et al., 2001a).
When the same analysis to predict individual feed requirements shown in Figure 1 was evaluated using this predicted rather than the observed EBF%, the variation accounted for by the model was not reduced. This result indicates that we can accurately predict individual feed requirements using a prediction of EBF from carcass measurements available from U.S. packing plants.
In common feedlot situations, each owner owns more than one animal in a pen.
Therefore, they will be concerned with knowing the accuracy of predicting the total of all of their animals’ share of the total feed consumed by the pen. A reduction in the error of prediction of DM required is expected when predicting groups of animals instead of individuals within a pen. To measure this reduction, the predicted and observed individual DM requirements of the 365 individually fed animals used to validate our feed

11
allocation model were summarized by groups of 5, 10, 20, 40, or 80 animals; these groups were randomly created for this analysis. Figure 3 shows the result of this analysis.
Figure 3. Reduction in the coefficient of variation of predicting DM required from an individual animal to groups of animals with increasing number of animals per group.
0
1
2
3
4
5
6
7
8
9
0 10 20 30 40 50 60 70 80
Number of animals per group
Coe
ffici
ent o
f var
iatio
n, %
The coefficient of variation was reduced more than 50% (from 8.18 to 3.76%) when predicting DM required for groups of 5 animals instead of individuals, and was less than 2% in groups of more than 20 animals. This analysis shows that even though we can account for 74% of the variation in individual animal feed requirements with a coefficient of variation of 8.18, the error in our prediction is greatly reduced when predicting groups of animals, which is an important concept for producers using this system to allocate feed consumed among groups of cattle within a pen.
Figure 4 shows predicted vs measured feed efficiency in this data set. The model accounted for 82% of the variation in actual feed efficiency. We conclude the use of Cornell Net Carbohydrate and Protein System model (Fox et al., 2000) predicted energy values for the diet and pen feed intakes along with individual measurements that can be obtained (individual body weight and ADG, and carcass measurements) accounted for 82% of the differences in feed efficiency. The variation not accounted for in this system is due to individual animal variations that the system cannot fully account for, including differences in maintenance requirements, diet digestibility and metabolizability, and body composition. Predicted DM requirements also contain all of the accumulated errors in predicting each component. However, all of the feed is allocated by multiplying the ratio of the total actual pen DM consumed to the total pen DM required times each animal’s DM

12
required (Equation 9 in Table 7). Therefore, this system provides a fair method for allocating feed to individuals fed in a group on a biological basis, considering differences known to affect requirements (breed type, body size, stage and rate of growth).
Figure 4. Evaluation of prediction of feed efficiency of individual animals. Data include 365 individually fed steers.
y = 0.9746x + 0.1405R2 = 0.82
3
4
5
6
7
8
9
10
11
12
3 4 5 6 7 8 9 10 11 12
Predicted feed:gain ratio
Obse
rved
feed
:gai
n ra
tio
Predicting growth, carcass weight, body fat, quality and yield grade during growth We have developed a model to predict daily gain, feed required, body fat, and quality and yield grade on a daily basis as an animal grows (Guiroy et al., 2001b; Tedeschi et al., 2001a,b; Guiroy et al., 2001c). This model (DAYSTEP) has been incorporated into the Cornell Value Discovery System (Tedeschi et al., 2001a). Equations to predict carcass weight and composition, and the above prediction of DM required in live cattle during growth must rely on estimates of AFBW, and data that can be obtained on individuals during growth, such as current weight, ADG and ultrasound estimates of fat depth, marbling and rib eye area. Perry and Fox (1997) developed equations for utilizing ultrasound measurements for this purpose, and the reader is referred to that paper for details of those equations. Two example applications of the Cornell Value Discovery System Application in large commercial feedlots to market cattle at the most profitable endpoint. A computerized Electronic Cattle Management sorting and tracking system (Accu-Trac ; Micro Beef Technologies, Inc., Amarillo, TX) is being

13
marketed to predict the most profitable endpoint in feedlot cattle. The objective of the Accu-Trac system is to predict carcass and empty body weight and composition so that incremental live and carcass cost of gain, quality and yield grade can be predicted as cattle progress during the feeding period to determine optimum profitability sale point. The application of the Cornell Value Discovery System involves allocating feed post harvest, as well as during growth to predict the optimum time to market. The equations in Table 7 are used in this system post harvest to accurately allocate feed, based on final EBF predicted from carcass measurements. The equations from Fox et al. (1992) and NRC (2000) are used to predict feed requirements during growth and optimum time to market. The key components of the Accu-Trac system are:
1. Cattle are processed on arrival through a series of low stress stations in a processing snake where they are measured for frame size by video imaging to predict body size, are weighed, vaccinated, implanted and given an electronic ear tag, and ultrasound backfat depth between the 12th and 13th rib measurements are taken. Cattle are measured again at re-implanting and are re-sorted based on new predicted finished dates. This data is processed and stored in a computer database that automatically places them in one of seven pens according to their projected optimum finish date. The computer analyzes the animal, opens the gate to the destination pen, senses when the animal passes the gate and automatically closes it.
2. The model described is used to determine each animal’s share of pen feed consumption, based on predicted shrunk body weight at 28% empty body fat to determine composition of gain, and actual body weight and daily gain.
The Accu-Trac system contains two key components to predict optimum endpoints:
• The Cornell Value Discovery System equations are used to predict energy requirements and carcass weight and chemical composition.
• Ultrasound technology developed at Cornell University and backfat deposition rates developed at Kansas State University are used to predict carcass fat depth during growth.
A feedlot data set of 12,105 steers and heifers (Table 9) was developed to
evaluate the system. The feedlot data was provided by Micro Beef Technologies, Inc. (Amarillo, TX), which was collected with the computerized electronic cattle-tracking system described above. Total feed DM delivered vs the sum of each individual animal predicted DM required was compared using our model. Results from this comparison (Table 5) shows DM required was predicted with very little bias with our modified model (underprediction of –0.91% for steers, and overprediction of 0.89% for heifers). The small bias for each sex indicates the model works equally well for steers and heifers. An underprediction bias of up to 2% in the total DM consumed by feedlot cattle can be expected due to feed fed that was lost and not consumed by cattle (bunk cleaning, wind, etc). A bias is also expected by using a theoretical maintenance requirement of

14
0.077 Mcal/d/kg SBW0.75, which likely varies within and between feedlots due to animal interactions with actual environmental conditions. However, in this data set evaluated, the effects of environment are accounted for in the diet NEm and NEg provided by the feedlot consultant, since those values reflect diet NE values required to have predicted and observed ADG agree in the historical data base used to develop their performance projection program.
Table 9. Prediction of individual feed requirements with actual feedlot data1
Variable
Steers (n = 8,624)
Heifers (n = 3,481)
Total (n = 12,105)
Predicted EBF percentage 28.22 ± 2.25 28.37 ± 2.26 28.26 ± 2.25 Predicted AFBW, kg 529 ± 56 492 ± 57 519 ± 59 Observed feed DM consumed, kg 9.97 9.47 9.83 Predicted DM required, kg 9.88 ± 1.50 9.56 ± 1.51 9.79 ± 1.51 Bias, % -0.91 0.89 -0.41 1 Values are mean ± SD.
An evaluation of the Accu-Trac system was conducted under commercial feedlot conditions with 735 steers (unpublished data supplied by Thomas Eck and Max Garrison; test sponsored by Allflex USA, Inc. and Micro Beef Technologies, Inc.). The cattle were allowed to continue on feed until the maximum carcass weight or the maximum back fat thickness reached 0.5 inches as predicted by the Accu-Trac system. As a result, the cattle finished at an average predicted 29.4 (SD of 2.3) percent body fat, which was above the target of 28% body fat. Actual backfat depth averaged 0.47 (SD of 0.15) inches. Ninety three percent of the Cattle achieved the targeted yield grade of 3 or better, 73% of the cattle were YG 2 or better, and 99% of the cattle had a YG of less than 3.99. The cattle graded 73% Choice or better and 98.5% of the carcasses were within the targeted hot carcass range (550 to 950 lb). The carcass discounts ($/cwt) were $7 for select, $12 for yield grade 4, $10 for carcasses under 550 lb, $5 for carcasses 950 to 1000 lb and $25 for carcasses over 1000 lb. The economic benefit was $23.69/head for using the Accu-Trac system to avoid these discounts. This data was used to demonstrate how a historical database can be used to establish diet NEm and NEg values for a particular feedlot. The diet contained 79.7% flaked corn, 2.3% cottonseed meal, 2.5% cottonseed hulls, 6.5% alfalfa hay, 4% sugarcane molasses and 5% supplement. Diet ME was used to predict NEm and NEg (NRC, 1996), and was adjusted until actual and predicted ADG agreed, using actual DMI. The apparent feed NEm and NEg values resulting were 0.927 and 0.628, compared to initial calculated values of 0.961 and 0.624. These apparent net energy values reflect feedlot feed processing, environmental and seasonal effects not accounted for in the system or any tabular values. An alternative approach is to use the Cornell Net Carbohydrate and Protein System version 4.0 (Fox et al., 2000) to predict diet net energy values. The values

15
predicted by this model are diet and location specific, by accounting for animal, environmental, feed composition, and level of intake effects.
Application in evaluating a breeding herd. We use the Cornell Value Discovery System to provide feeder calf producers with information on individual animals from their herd for use in selection programs. In the fall of 1997, feeder steers (74) of seven sire breeds from different herds in New York were used in our first group to be evaluated with this system. The steers were implanted with Synovex-S and were re-implanted 70 days later with Revalor, placed on a high-energy diet, and were weighed every 28 days. The research center manager estimated final shrunk body weights at low Choice grade for each steer; some of these estimates were corrected during the study. It was not possible to send each steer to slaughter when they were at their optimum finished point, because of the cost of trucking and collecting the carcass data. For these reasons, we sent the steers to slaughter at Taylor Packing Co. at Wyalusing, PA in two groups. Those chosen for the first group were expected to be at the fatness of low Choice grade. All remaining steers were sent in the second group. The NCBA carcass data service was utilized to obtain complete carcass data. The carcass data was entered into the computer program to compute adjusted final 28% fat weight and feed requirements.
Table 10 summarizes the performance of that year’s program. The total feed DM consumed by all cattle was within 1% of the sum of individual predicted feed requirement. The summary in table 10 is based on computing the feed required by each individual, based on the averages (SBW, ADG, and expected final SBW) during the entire trial. The range (minimum and maximum) and standard deviation (SD) are provided to evaluate the variation within this group. The SD added and subtracted from the average gives the range in values that includes two thirds of the cattle.
The days on feed averaged 183 days, with an ADG of 3.47 lb. The weight at
slaughter averaged 1235 lb; the average estimated weight at low choice was 1250 lb. The cattle varied widely in finished weight, with the extremely large steers having carcass weights outside of the range desired by the industry. The individual feed requirement varied from 2652 to 4616 lb, depending on total weight gain, composition of gain, and feed efficiency. Feed required per lb of gain varied from 4.77 to 7.19; the most efficient required 20% less than the average and the least efficient required 20% more than the average. Part of this variation is due to differences in stage of growth when started on feed. However, much of it is due to differences in rate of gain relative to average body size. Those that gain faster relative to their body weight use a higher proportion of the feed consumed for growth.
The quality grade indicates on the average, the target of low choice grade was achieved; 86% graded choice or above. None were below select and some were prime grade. The yield grades, which indicate trimmable fat, varied greatly, with the average being above the target of three. Base choice carcass price was $1.12/lb for group 1 sold on May 14, 1997 and $1.09 for group 2 sold on June 2, 1997. Carcass discounts $/lb) were $0.05 for carcass weight (over 929 lb or under 599 lb), $0.10 for grade

16
(select), and $.12 for yield grade (above 4). The prices paid for different weights and grades varied, depending on differences between the USDA grader and grades taken by the carcass data service, and needs of the packer for different markets.
Table 10. Performance of the 1997 herd evaluation steers
Variables ( n = 71 ) Average Min Max SD Days on feed 183 174 193 13.4 Initial SBW, lb 592 412 741 79 Final SBW, lb 1235 960 1536 108 ADG, lb 3.47 2.25 4.62 0.40 Individual feed requirement, lb 3815 2652 4616 411 Feed conversion lb DM/lb Gain 5.97 4.77 7.19 0.45 Individual feed cost, $ 191 133 231 20 Feed cost per lb ADG 0.3 0.24 0.36 0.02 Carcass weight, lb 803 596 1027 73 Marbling Scorea 5.2 4 8 0.78 Quality Gradeb 5.2 4 8 0.78 Yield Grade 3.4 1.9 4.7 0.61 Price, $/lb carcass weight 1.08 0.99 1.12 0.04 Initial Value, $/head 355 247 445 48 Profitability, $/head 251 59 411 48 a3 = traces; 4 = slight; 5 = small; 6 = modest; 7 = moderate; 8 = slightly abundant; 9 = abundant. b3 = Standard; 4 = Select; 5.0 = Choice-; 6.0 = Choice0; 7.0 = Choice+; 8 = Prime-; 9 = Prime0; and 10 = Prime+.
Average profits per head were high, because of the dramatic improvement in the
market during the trial. However, individual profitability range ranged from $59 to $411, with a SD of $48. To identify factors most associated with profitability, prices paid for each category (base price adjusted for yield and quality grade and carcass weight) were averaged to allow the data to be pooled over both slaughter groups to compute correlation coefficients. Correlations of various factors with profitability were: carcass weight, 0.57; total live weight gain, 0.54; average daily gain, 0.42; and feed efficiency, 0.41. Thus the most profitable steers in each group were characterized by maximum carcass weight without discounts that would grade choice at less than yield grade 4 and a high rate of gain and feed efficiency during feedlot finishing. The range in carcass weights without discounts is wider than industry standards, which are more typically 650 to 850 lb. We encourage producers to target that weight range to insure that their cattle size will be acceptable in various markets.
Summary A modeling system is presented that provides a method for allocating feed to individuals fed in a group on a biological basis, considering differences known to affect

17
requirements (breed type, body size, stage and rate of growth). Post harvest, feed can be accurately allocated based on prediction of final EBF from carcass measures. This modeling system along with additional equations developed by Perry and Fox (1997) to predict carcass weight and compositional changes during growth can be used to market cattle on an individual basis at the optimum time, considering incremental cost of gain and carcass weight and composition discounts. The data can also be used in selecting for feed efficiency that accounts for differences in body size and rate and composition of gain. However, when allocating feed to animals fed in groups, it does not account for differences in efficiency of use of metabolizable energy; to make this calculation, actual individual intake must be known. Literature Cited Beef Improvement Federation. 1991. Guidelines for uniform Beef Improvement
programs. Beef Improvement Federation, Raleigh, NC. Dikeman, M. E. 1987. Fat reduction in animals and the effects on palatability and
consumer acceptance of meat products. Proceedings 40th Annual Reciprocal Meat Conference. National Livestock and Meat Board, Chicago, ILL 60611.
Fox, D.G. and J.R. Black. 1984. A system for predicting body composition and performance of growing cattle. J. Anim. Sci. 68:725.
Fox, D.G., C.J. Sniffen, J.D. O’Connor, J.B. Russell, and P.J. Van Soest. 1992. A net carbohydrate and protein system for evaluating cattle diets: III. Cattle requirements and diet adequacy. J. Anim. Sci. 70:3578-3596.
Fox, D. G. and T. P. Tylutki, 1998. Accounting for the effects of environment on the nutrient requirements of dairy cattle. J. Dairy Sci. 81:3085.
Fox, D.G., M.E. Van Amburgh, and T.P. Tylutki. 1999. Predicting requirements for growth, maturity, and body reserves in dairy cattle. J. Dairy Sci. 82:1968-1977.
Fox, D. G., T.P. Tylutki, M.E. Van Amburgh, L.E. Chase, A.N. Pell, T.R. Overton, L.O. Tedeschi, C.N. Rasmussen, and V.M. Durbal. 2000. The Net Carbohydrate and Protein System for evaluating herd nutrition and nutrient excretion. Cornell Animal Science Department Mimeo 213.
Guiroy, P.J.; D.G. Fox, D.H. Beermann, and D.J. Ketchen. 2000. Performance and meat quality of beef breed steers fed corn-based or bread by-product-based diets. J. Anim. Sci. 78:784-790.
Guiroy, P. J., D.G. Fox, L.O. Tedeschi, M.J. Baker, and M.D. Cravey. 2001a. Predicting individual feed requirements of cattle fed in groups. J. Anim. Sci. 79:1983-1995.
Guiroy, P.J.; L.O. Tedeschi, and D.G. Fox. 2001b. A decision support system for individual management. I. A DAYSTEP model to reach a target market composition. J. Anim. Sci. (Submitted).
Guiroy, P.J.; L.O. Tedeschi, D.G. Fox and J.P. Hutcheson. 2001c. A decision support system for individual management. III. Accounting for the effect of anabolic implants on finished weight. J. Anim. Sci. (submitted).
Harpster, H.W., D.G. Fox, W.T. Magee, and J.R. Black. 1978. Energy requirements of cows and the effects of sex, selection and crossbreeding on feedlot performance of calves of four genetic types. Michigan Agricultural Experiment Station Beef Cattle- Forage Research report AH-BC-7704.

18
Institut National de la Reecherche Agronomique. 1989. Ruminant Nutrition. Montrouge, France: John Libbey Eurotext.
Koch, R.M., L.A. Swiger, D.Chambers, and K.E. Gregory. 1963. Efficiency of feed use in beef cattle. J. Anim. Sci. 22, 2:486-494.
Leme, P. R., C. Boin, R. C. C. Margarido, L. O. Tedeschi, J. C. O. V. Hausknecht, G. F. Alleoni, and A. Luchiari Filho. 2000. Growth performance in feedlot and carcass characteristics of beef cattle from several crossbreds slaughtered in three body weight ranges. Revista Brasileira de Zootecnia. 29:2347-2353.
McKenna, D.R., P.K. Bates, D.L. Roeber, T.B. Schmidt, D.S. Hale, D.B. Griffin, J.W. Savell, J.B. Morgan, T.H. Montgomery, and G.C. Smith. 2001. National Beef Quality Audit-2000: Results of carcass assessments. J. Anim. Sci. 79 (Suppl. 1):62.
Nour, A. Y. M., 1982. Bovine carcass characteristics: quality, yield, palatability, chemical composition, and mineral profile of early and late maturing breeds of cattle fed two diets in two locations and serially slaughtered over a wide weight range. PhD Dissertation. Cornell University, Ithaca, NY.
National Research Council. 2000. Nutrient Requirements of Beef Cattle (7th Ed.) Update 2000. National Academy Press, Washington, DC.
National Research Council. 2001. Nutrient Requirements of Dairy Cattle (7th Ed.) National Academy Press, Washington, DC.
Perry T. C., D. G. Fox, and D. H. Beermann. 1991. Effect of an implant of trenbolone acetate and estradiol on growth, feed efficiency, and carcass composition of Holstein and beef breed steers. J. Anim. Sci. 69:4696.
Perry, T. C. and D. G. Fox. 1997. Predicting carcass composition and individual feed requirement in live cattle widely varying in body size. J. Animal Sci. 7:300.
Smith, G. C., J. W. Savell, H. G. Dolezal, T. G. Field, D. R. Gill, D. B. Griffin, D. S. Hale, J. B. Morgan, S. L. Northcutt, and J. D. Tatum. 1995. Improving the Quality, Consistency, Competitiveness and Market Share of beef. National Beef Quality Audit 1995.
Tedeschi, L.O.; D.G. Fox, P.J. Guiroy, M.J. Baker, and T.P. Tylutki. 2001a. Cornell Value Discovery System for Individual Cattle Management. Dept. of Animal Science, 130 Morrison Hall, Cornell University, Ithaca, NY. 14853.
Tedeschi, L.O., D.G. Fox and P.H. Doane. 2001b. A decision Support System for individudal animal management. II. Predicting feed energy values. J. Anim. Sci. (submitted).
Tylutki, T.P., D.G. Fox, and R.G. Anrique. 1994. Predicting net energy and protein requirements for growth of implanted and nonimplanted heifers and steers and nonimplanted bulls varying in body size. J. Anim. Sci. 72:1806-1813.