detection of blood vessels in ophthalmoscope images using mf/ant (matched filter/ant colony)...
TRANSCRIPT
DM
Ma
b
a
A
R
R
1
A
K
R
b
M
A
D
1
Spg
vibbi
at
mr
0d
c o m p u t e r m e t h o d s a n d p r o g r a m s i n b i o m e d i c i n e 9 6 ( 2 0 0 9 ) 85–95
journa l homepage: www. int l .e lsev ierhea l th .com/ journa ls /cmpb
etection of blood vessels in ophthalmoscope images usingF/ant (matched filter/ant colony) algorithm
uhammed Gökhan Cinsdikici a,∗, Dogan Aydınb
Ege University Int’l Computer Institute, Bornova 35100, Izmir, TurkeyEge University Computer Engineering Department, Bornova 35100, Izmir, Turkey
r t i c l e i n f o
rticle history:
eceived 19 February 2009
eceived in revised form
9 February 2009
ccepted 6 April 2009
a b s t r a c t
Blood vessels in ophthalmoscope images play an important role in diagnosis of some serious
pathologies on retinal images. Hence, accurate extraction of vessels is becoming a main topic
of this research area. Matched filter (MF) implementation for blood vessel detection is one
of the methods giving more accurate results. Using this filter alone might not recover all
the vessels (especially the capillaries). In this paper, a novel approach (MF/ant algorithm) is
proposed to overcome the deficiency of the MF. The proposed method is a hybrid model of
matched filter and ant colony algorithm. In this work, the accuracy and parameters of the
eywords:etinal (Ophthalmoscope) image
lood vessel segmentation
atched filter
nt algorithm
hybrid algorithm are also discussed. The proposed method shows its success using the well
known reference ophthalmoscope images of DRIVE database.
© 2009 Elsevier Ireland Ltd. All rights reserved.
to detect edges [10]. In their method, candidate edge fieldsare wandered by ants according to probabilistic translation
RIVE database
. Introduction
egmentation of blood vessels in ophthalmoscope imageslays an important role in diagnosis of some serious patholo-ies like diabetes, glaucoma and hypertension.
Since illumination, geometry and reflectance propertiesary image by image, accurate vessels extraction takes crit-cal role. The other factors affecting the segmentation cane summarized as presence of noise, low contrast betweenackground and vessel regions, vessel widths, lesions over the
nterested area and exudates.The methods for extracting blood vessels proposed in liter-
ture are mainly based on kernel-based, classifier-based andracking-based approaches [1].
In kernel-based methods [2,3], a Gaussian shaped curve
odels the cross-section of a vessel and detects vessels usingotated matched filters.
∗ Corresponding author. Tel.: +90 232 342 3232x129.E-mail address: [email protected] (M.G. Cinsdikici).
169-2607/$ – see front matter © 2009 Elsevier Ireland Ltd. All rights resoi:10.1016/j.cmpb.2009.04.005
Classifier-based methods [4–6] are given in two steps: first,a segmentation of spatially connected regions is producedby a low-level algorithm. Then blood vessels are detected byclassification of these candidate regions according to manyfeatures.
Tracking-based methods [7–9] start locating interested ves-sel points for tracing, and then segment the vessels accordingto some local image features.
Ant-based approaches, inspired from real ant colonies,are becoming state-of-the-art in image segmentation. Theyare going to be popular in edge detection [10,11], histogramthresholding, and clustering.
Nezamabadi-pour et al. applied an ant-based approach
decision rule and ants deposit some amount of pheromonesindicating the likelihood of the pixel belongs to an edge field.
erved.
m s i
86 c o m p u t e r m e t h o d s a n d p r o g r aIn histogram thresholding, ant-based approaches are usedto find optimum threshold values and some different imple-mentations can be found in [12–15].
The clustering by ant algorithms is examined in to twoways [16]. First, for those directly mimics real ant colonies, theclustering behaviors can be seen as patch sorting and annualsorting [17–20]. Other is examined as heuristics reformulatingthe clustering problem as an optimization task [21,22]. Besides,hybridized methods were also presented in [23–25].
In this paper, a hybrid model of ant-based clustering andMF algorithms is introduced. Although ant-based algorithmsor MF algorithms are sufficient to extract blood vessels, usingthe hybrid form can improve the accuracy and false/true ratiosperformance of the resultant images. In Section 2, definitionsand design considerations of ant, MF and our proposed MF/antalgorithms are given. Section 3 demonstrates the experimen-tal results. In the final section, our proposed algorithm isdiscussed and concluded.
2. Materials and methods
2.1. Ant algorithms
Ant algorithms based on the foraging behavior of ants havefirst been introduced by Dorigo et al. in [26–28] and were for-malized as a new meta-heuristic in [29] by Dorigo and DiCaro.
In ant algorithms, a number of artificial ants build solutionsto the considered optimization problem at hand and exchangeinformation on the quality of these solutions via a communi-cation scheme that is reminiscent of the one adapted by realants [30]. The skeleton of ant algorithms is shown below:
Procedure Ant algorithmSet parameters, initialize pheromone trails
while (termination condition not met) doConstructSolutionsApplyLocalSearch % optionalUpdateTrails
endend Ant algorithm
As seen from algorithm that there are four steps of the algo-rithm: Preprocessing, Solution Construction, Local Searchingand Pheromone Updating. They are described as follows:
Preprocessing: The parameters of the ant algorithm such asthe number of ants, iteration and memory sizes are initial-ized according to priori-knowledge obtained from empiricaldata. Besides, pheromone trails are also initialized with smallnumbers (i.e. <10−5) [31].
ConstructSolutions: For the given problem instance, each antstarts with a random state then traverses the states one byone according to the probability distribution function. Eachant chooses its new state through the comparison of its ran-dom threshold value with the produced probabilities of states
primarily defined by the Eq. (1). This random selection is called“random proportional transition rule (RPT)” [31] (also called aspseudo-random proportional rule) and depends on the com-bination of two values:n b i o m e d i c i n e 9 6 ( 2 0 0 9 ) 85–95
• Attractiveness of the move (i.e. visibility), is a heuristic func-tion (that is depends on the problem) indicating the prioridesirability of that move.
• The trail level of artificial pheromone, indicates posterioridesirability of the move based on learned (i.e. historical)experiences. In other words trail level indicates the aware-ness level of the candidate state.
The first ant algorithm, ant system (AS) [28], defines theRPT rule as in Eq. (1);
Pij =
⎧⎨⎩
[�ij]˛[�ij]
ˇ∑h∈˝[�ih]˛[�ih]ˇ
if j∈˝
0 otherwise
(1)
where �ij is intensity of trail between states i and j, �ij is visibil-ity of state j from state i (�ij changes according to the problemdefinition), � is the set of unvisited states and finally, ˛ and ˇare two adjustable parameters that affect the algorithm per-formance.
All ant algorithms except ant colony system (ACS) [32] usethe same RPT rule. In ACS, it is modified to allow explicitly forexploration as follows:
j ={
arg maxj∈˝
{�ij�
ˇij
}if q ≤ q0
J otherwise(2)
where q0 is a controller parameter for the exploration and isa constant (0 ≤ q0 ≤ 1) assigned at the preprocessing level. q isa uniformly distributed random number determined at eachmove (i.e. transition from the state i to state j). J is the previ-ous probability distribution function given in Eq. (1). If q ≤ q0
then the best state is chosen (exploitation), otherwise a stateis chosen according to Eq. (1) (biased exploration) [33].
ApplyLocalSearch: Before updating trail levels, local searchmethods can be applied on each solution constructed in cur-rent iteration. Although this process is optional and problemspecific, it improves the solutions obtained by the ants andhas been used by state of art ant algorithms.
UpdateTrails After the solutions constructed and calculated,pheromone levels on paths increase (pheromone depositing)and decrease (pheromone evaporation) related to the betterand worse solutions respectively.
Indirect multiple communication of the colony is providedby the positive and negative feedbacks of the pheromoneupdates. Positive feedback is implemented by pheromone lay-ing on the better solutions for reinforcement. Unfortunately,increasing pheromone level without evaporation leads thestagnation state. To avoid this, negative feedback mechanismis introduced through the pheromone evaporation.
In AS, every ant deposits certain amount of pheromonedepicted in Eq. (3) at the end of each iteration.
1
Pheromone =Lk(3)
In (3) “k” represents the ant and Lk is the cost of the tour (i.e.path) completed by that ant.
s i n b i o m e d i c i n e 9 6 ( 2 0 0 9 ) 85–95 87
eta
�
u
pi
�
w
it
�
wfi
2
Do
a
b
c
l
ab
c
c o m p u t e r m e t h o d s a n d p r o g r a m
After depositing accomplished, pheromone level of everydges decreased by the Eq. (4) where constant � (0 ≤ �≤ 1) ishe coefficient of decay determined at the beginning of thelgorithm.
ij(t + 1) = (1 − �)�ij(t) (4)
In ACS, two types of pheromone updating strategies aresed: Local and global.
In global updating, after each iteration, only theheromones on globally best path (gbp) are updated by
ncreasing pheromone level of Eq. (5);
ij(t + 1) = (1 − �)�ij(t) + �
Lgbp(5)
here � is the decay parameter mentioned for AS.In local updating, the pheromone level of the current state
s modified by the Eq. (6) before visiting to the next state in aour.
ij = (1 − ϕ)�ij + ϕ�0 (6)
here constant ϕ (0 <ϕ≤ 1) is the local pheromone decay coef-cient and �0 is the initial value of the pheromone.
.2. Matching filters (MF)
esigning MF for ophthalmoscope images is based on numberf properties for blood vessels;
. Blood vessel shapes shows small curvatures, so anti-parallel pairs may be approximated.
. Vessels are observed as darker areas compared with back-ground.
. Vessel widths are ranged in 2–20 pixels
Retinal images are convolved with the MF through the fol-owing steps;
. Green Channel of the image is extracted to be processed.
. Rotation matrix is defined as in Eq. (7);
r =[
cos �i −sin �isin �i cos �i
](7)
. Construct MF kernels spanning possible orientations withthe rotation matrix. (� is changed with predefined angle).In Eq. (8), N indicates the neighborhood defined in the areaof [u,v] where |u|≤3� and |v| ≤L/2 [2]. L is used as kernelsize of priori information about vessel length. So the newcoordinate calculated with multiplication of Kernel by the
transpose of rotation matrix [2].pi =[u v
]= K(x, y) ∗ rT
Ki(x, y) = −exp(−u2/2�2) ∀ pi ∈N(8)
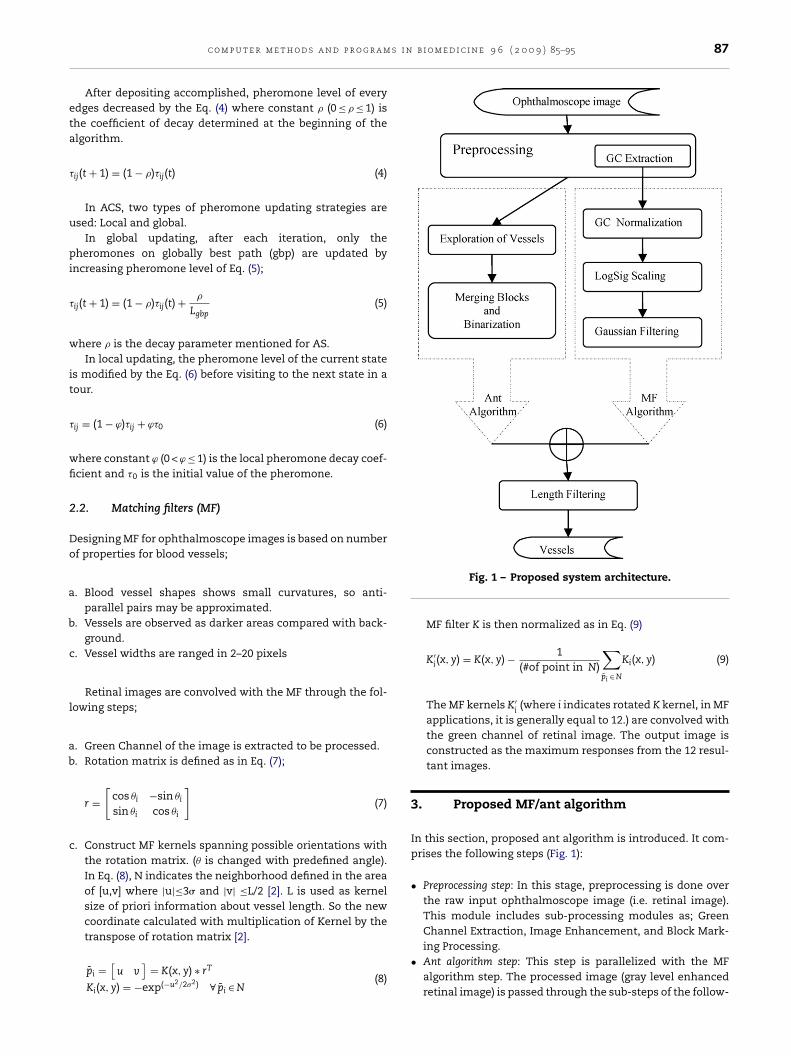
Fig. 1 – Proposed system architecture.
MF filter K is then normalized as in Eq. (9)
K′i(x, y) = K(x, y) − 1
(#of point in N)
∑pi ∈N
Ki(x, y) (9)
The MF kernels K′i(where i indicates rotated K kernel, in MF
applications, it is generally equal to 12.) are convolved withthe green channel of retinal image. The output image isconstructed as the maximum responses from the 12 resul-tant images.
3. Proposed MF/ant algorithm
In this section, proposed ant algorithm is introduced. It com-prises the following steps (Fig. 1):
• Preprocessing step: In this stage, preprocessing is done overthe raw input ophthalmoscope image (i.e. retinal image).This module includes sub-processing modules as; GreenChannel Extraction, Image Enhancement, and Block Mark-
ing Processing.• Ant algorithm step: This step is parallelized with the MFalgorithm step. The processed image (gray level enhancedretinal image) is passed through the sub-steps of the follow-
88 c o m p u t e r m e t h o d s a n d p r o g r a m s i n b i o m e d i c i n e 9 6 ( 2 0 0 9 ) 85–95
l of
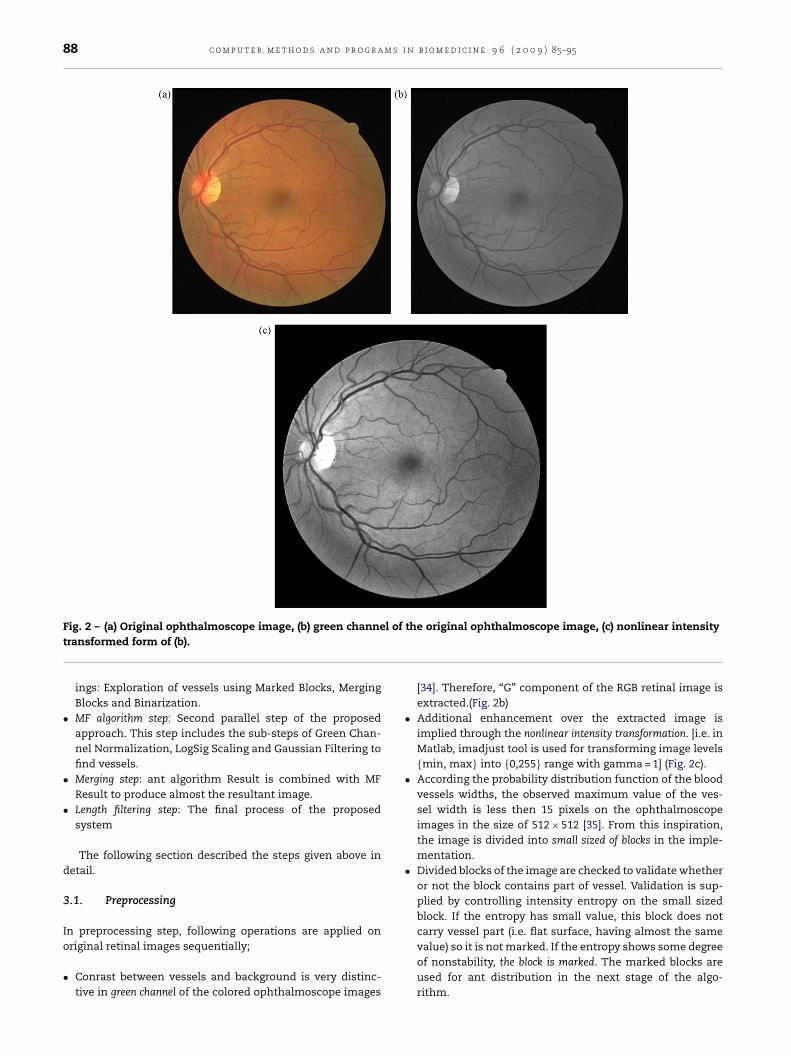
Fig. 2 – (a) Original ophthalmoscope image, (b) green channetransformed form of (b).ings: Exploration of vessels using Marked Blocks, MergingBlocks and Binarization.
• MF algorithm step: Second parallel step of the proposedapproach. This step includes the sub-steps of Green Chan-nel Normalization, LogSig Scaling and Gaussian Filtering tofind vessels.
• Merging step: ant algorithm Result is combined with MFResult to produce almost the resultant image.
• Length filtering step: The final process of the proposedsystem
The following section described the steps given above indetail.
3.1. Preprocessing
In preprocessing step, following operations are applied on
original retinal images sequentially;• Conrast between vessels and background is very distinc-tive in green channel of the colored ophthalmoscope images
the original ophthalmoscope image, (c) nonlinear intensity
[34]. Therefore, “G” component of the RGB retinal image isextracted.(Fig. 2b)
• Additional enhancement over the extracted image isimplied through the nonlinear intensity transformation. [i.e. inMatlab, imadjust tool is used for transforming image levels{min, max} into {0,255} range with gamma = 1] (Fig. 2c).
• According the probability distribution function of the bloodvessels widths, the observed maximum value of the ves-sel width is less then 15 pixels on the ophthalmoscopeimages in the size of 512 × 512 [35]. From this inspiration,the image is divided into small sized of blocks in the imple-mentation.
• Divided blocks of the image are checked to validate whetheror not the block contains part of vessel. Validation is sup-plied by controlling intensity entropy on the small sizedblock. If the entropy has small value, this block does not
carry vessel part (i.e. flat surface, having almost the samevalue) so it is not marked. If the entropy shows some degreeof nonstability, the block is marked. The marked blocks areused for ant distribution in the next stage of the algo-rithm.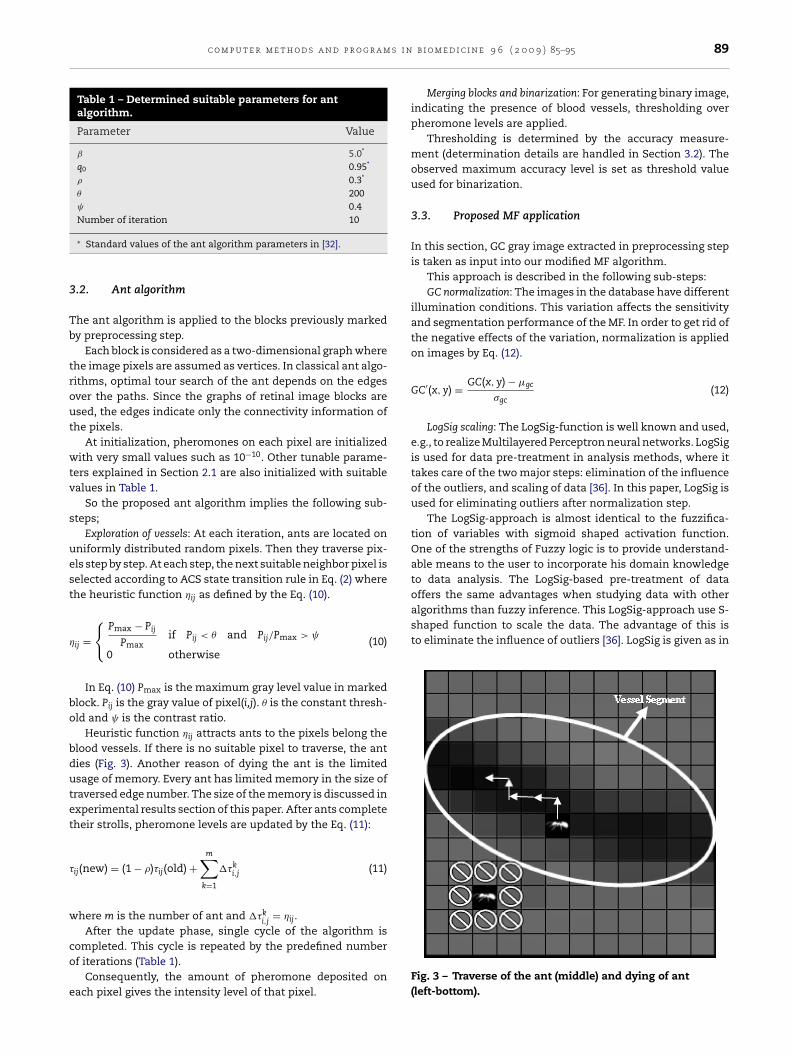
c o m p u t e r m e t h o d s a n d p r o g r a m s i n
Table 1 – Determined suitable parameters for antalgorithm.
Parameter Value
ˇ 5.0*
q0 0.95*
� 0.3*
� 200 0.4Number of iteration 10
3
Tb
trout
wtv
s
uest
�
bo
bdutet
�
w
co
e
offers the same advantages when studying data with otheralgorithms than fuzzy inference. This LogSig-approach use S-shaped function to scale the data. The advantage of this isto eliminate the influence of outliers [36]. LogSig is given as in
∗ Standard values of the ant algorithm parameters in [32].
.2. Ant algorithm
he ant algorithm is applied to the blocks previously markedy preprocessing step.
Each block is considered as a two-dimensional graph wherehe image pixels are assumed as vertices. In classical ant algo-ithms, optimal tour search of the ant depends on the edgesver the paths. Since the graphs of retinal image blocks aresed, the edges indicate only the connectivity information ofhe pixels.
At initialization, pheromones on each pixel are initializedith very small values such as 10−10. Other tunable parame-
ers explained in Section 2.1 are also initialized with suitablealues in Table 1.
So the proposed ant algorithm implies the following sub-teps;
Exploration of vessels: At each iteration, ants are located onniformly distributed random pixels. Then they traverse pix-ls step by step. At each step, the next suitable neighbor pixel iselected according to ACS state transition rule in Eq. (2) wherehe heuristic function �ij as defined by the Eq. (10).
ij ={Pmax − Pij
Pmaxif Pij < � and Pij/Pmax >
0 otherwise(10)
In Eq. (10) Pmax is the maximum gray level value in markedlock. Pij is the gray value of pixel(i,j). � is the constant thresh-ld and is the contrast ratio.
Heuristic function �ij attracts ants to the pixels belong thelood vessels. If there is no suitable pixel to traverse, the anties (Fig. 3). Another reason of dying the ant is the limitedsage of memory. Every ant has limited memory in the size ofraversed edge number. The size of the memory is discussed inxperimental results section of this paper. After ants completeheir strolls, pheromone levels are updated by the Eq. (11):
ij(new) = (1 − �)�ij(old) +m∑k=1
�ki,j (11)
here m is the number of ant and �ki,j
= �ij.After the update phase, single cycle of the algorithm is
ompleted. This cycle is repeated by the predefined numberf iterations (Table 1).
Consequently, the amount of pheromone deposited onach pixel gives the intensity level of that pixel.
b i o m e d i c i n e 9 6 ( 2 0 0 9 ) 85–95 89
Merging blocks and binarization: For generating binary image,indicating the presence of blood vessels, thresholding overpheromone levels are applied.
Thresholding is determined by the accuracy measure-ment (determination details are handled in Section 3.2). Theobserved maximum accuracy level is set as threshold valueused for binarization.
3.3. Proposed MF application
In this section, GC gray image extracted in preprocessing stepis taken as input into our modified MF algorithm.
This approach is described in the following sub-steps:GC normalization: The images in the database have different
illumination conditions. This variation affects the sensitivityand segmentation performance of the MF. In order to get rid ofthe negative effects of the variation, normalization is appliedon images by Eq. (12).
GC′(x, y) = GC(x, y) − gc
�gc(12)
LogSig scaling: The LogSig-function is well known and used,e.g., to realize Multilayered Perceptron neural networks. LogSigis used for data pre-treatment in analysis methods, where ittakes care of the two major steps: elimination of the influenceof the outliers, and scaling of data [36]. In this paper, LogSig isused for eliminating outliers after normalization step.
The LogSig-approach is almost identical to the fuzzifica-tion of variables with sigmoid shaped activation function.One of the strengths of Fuzzy logic is to provide understand-able means to the user to incorporate his domain knowledgeto data analysis. The LogSig-based pre-treatment of data
Fig. 3 – Traverse of the ant (middle) and dying of ant(left-bottom).
90 c o m p u t e r m e t h o d s a n d p r o g r a m s i n b i o m e d i c i n e 9 6 ( 2 0 0 9 ) 85–95
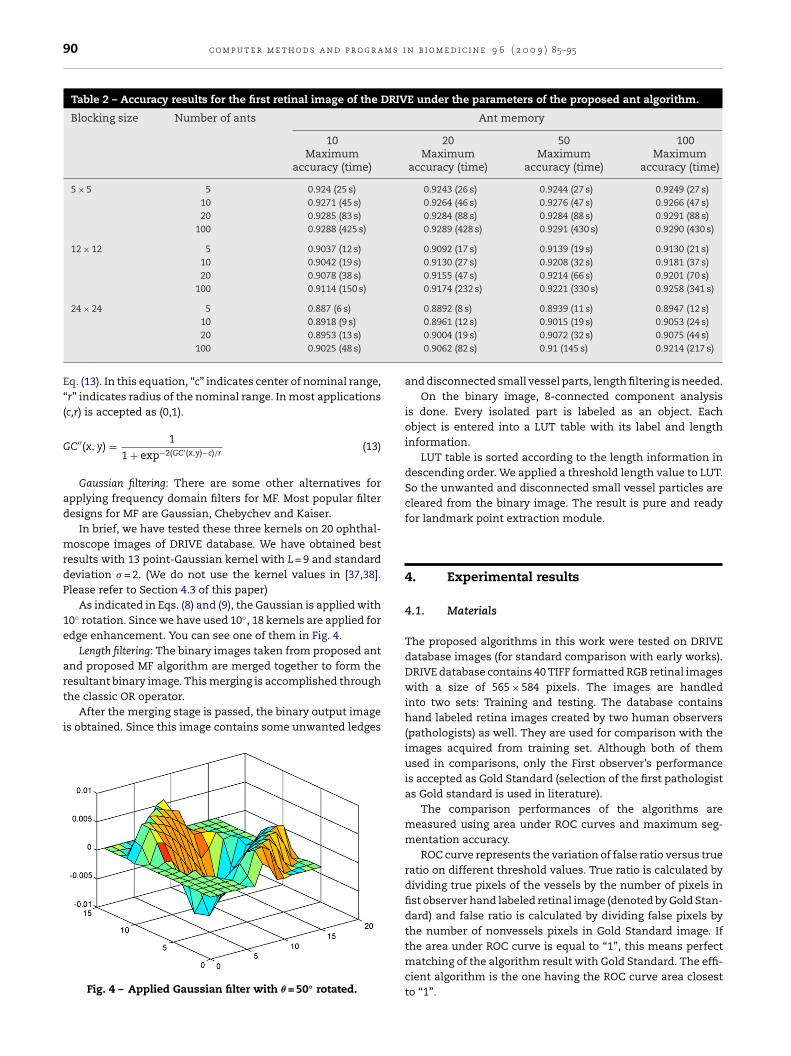
Table 2 – Accuracy results for the first retinal image of the DRIVE under the parameters of the proposed ant algorithm.
Blocking size Number of ants Ant memory
10 20 50 100Maximum
accuracy (time)Maximum
accuracy (time)Maximum
accuracy (time)Maximum
accuracy (time)
5 × 5 5 0.924 (25 s) 0.9243 (26 s) 0.9244 (27 s) 0.9249 (27 s)10 0.9271 (45 s) 0.9264 (46 s) 0.9276 (47 s) 0.9266 (47 s)20 0.9285 (83 s) 0.9284 (88 s) 0.9284 (88 s) 0.9291 (88 s)
100 0.9288 (425 s) 0.9289 (428 s) 0.9291 (430 s) 0.9290 (430 s)
12 × 12 5 0.9037 (12 s) 0.9092 (17 s) 0.9139 (19 s) 0.9130 (21 s)10 0.9042 (19 s) 0.9130 (27 s) 0.9208 (32 s) 0.9181 (37 s)20 0.9078 (38 s) 0.9155 (47 s) 0.9214 (66 s) 0.9201 (70 s)
100 0.9114 (150 s) 0.9174 (232 s) 0.9221 (330 s) 0.9258 (341 s)
24 × 24 5 0.887 (6 s) 0.8892 (8 s) 0.8939 (11 s) 0.8947 (12 s)
10 0.8918 (9 s)20 0.8953 (13 s)100 0.9025 (48 s)
Eq. (13). In this equation, “c” indicates center of nominal range,“r” indicates radius of the nominal range. In most applications(c,r) is accepted as (0,1).
GC′′(x, y) = 1
1 + exp−2(GC′(x,y)−c)/r (13)
Gaussian filtering: There are some other alternatives forapplying frequency domain filters for MF. Most popular filterdesigns for MF are Gaussian, Chebychev and Kaiser.
In brief, we have tested these three kernels on 20 ophthal-moscope images of DRIVE database. We have obtained bestresults with 13 point-Gaussian kernel with L = 9 and standarddeviation � = 2. (We do not use the kernel values in [37,38].Please refer to Section 4.3 of this paper)
As indicated in Eqs. (8) and (9), the Gaussian is applied with10◦ rotation. Since we have used 10◦, 18 kernels are applied foredge enhancement. You can see one of them in Fig. 4.
Length filtering: The binary images taken from proposed antand proposed MF algorithm are merged together to form the
resultant binary image. This merging is accomplished throughthe classic OR operator.After the merging stage is passed, the binary output imageis obtained. Since this image contains some unwanted ledges
Fig. 4 – Applied Gaussian filter with � = 50◦ rotated.
0.8961 (12 s) 0.9015 (19 s) 0.9053 (24 s)0.9004 (19 s) 0.9072 (32 s) 0.9075 (44 s)0.9062 (82 s) 0.91 (145 s) 0.9214 (217 s)
and disconnected small vessel parts, length filtering is needed.On the binary image, 8-connected component analysis
is done. Every isolated part is labeled as an object. Eachobject is entered into a LUT table with its label and lengthinformation.
LUT table is sorted according to the length information indescending order. We applied a threshold length value to LUT.So the unwanted and disconnected small vessel particles arecleared from the binary image. The result is pure and readyfor landmark point extraction module.
4. Experimental results
4.1. Materials
The proposed algorithms in this work were tested on DRIVEdatabase images (for standard comparison with early works).DRIVE database contains 40 TIFF formatted RGB retinal imageswith a size of 565 × 584 pixels. The images are handledinto two sets: Training and testing. The database containshand labeled retina images created by two human observers(pathologists) as well. They are used for comparison with theimages acquired from training set. Although both of themused in comparisons, only the First observer’s performanceis accepted as Gold Standard (selection of the first pathologistas Gold standard is used in literature).
The comparison performances of the algorithms aremeasured using area under ROC curves and maximum seg-mentation accuracy.
ROC curve represents the variation of false ratio versus trueratio on different threshold values. True ratio is calculated bydividing true pixels of the vessels by the number of pixels infist observer hand labeled retinal image (denoted by Gold Stan-dard) and false ratio is calculated by dividing false pixels bythe number of nonvessels pixels in Gold Standard image. If
the area under ROC curve is equal to “1”, this means perfectmatching of the algorithm result with Gold Standard. The effi-cient algorithm is the one having the ROC curve area closestto “1”.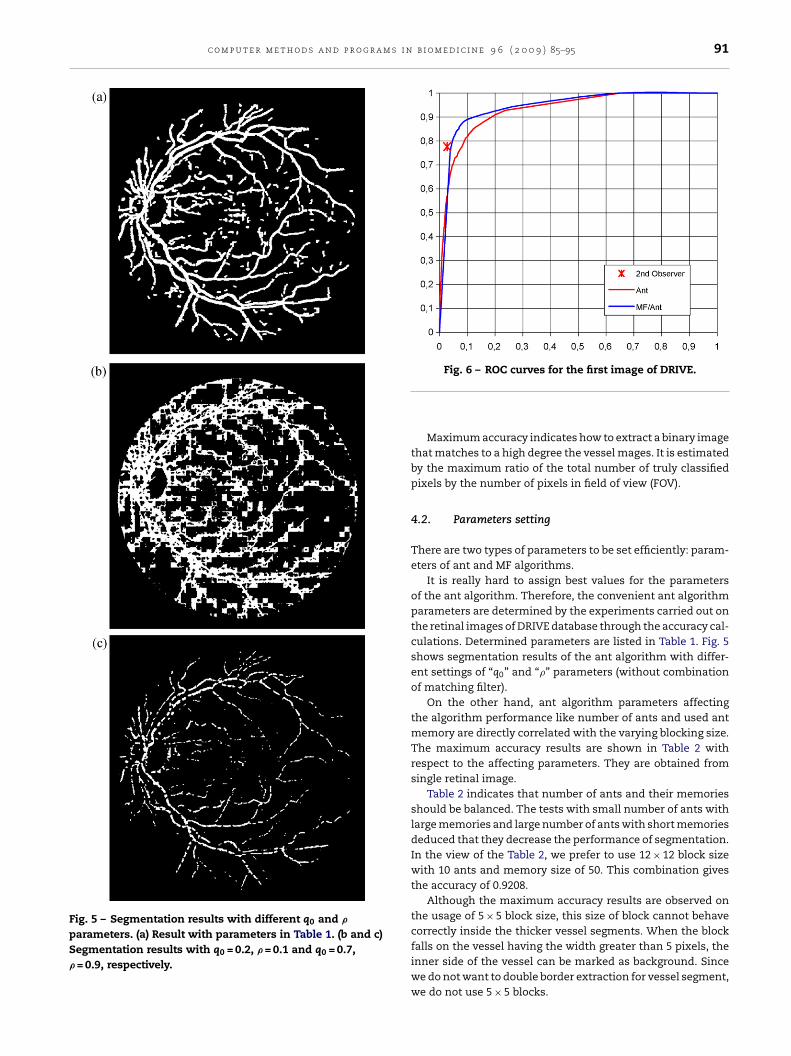
c o m p u t e r m e t h o d s a n d p r o g r a m s i n b i o m e d i c i n e 9 6 ( 2 0 0 9 ) 85–95 91
Fig. 5 – Segmentation results with different q0 and �
parameters. (a) Result with parameters in Table 1. (b and c)Segmentation results with q0 = 0.2, � = 0.1 and q0 = 0.7,� = 0.9, respectively.
Fig. 6 – ROC curves for the first image of DRIVE.
Maximum accuracy indicates how to extract a binary imagethat matches to a high degree the vessel mages. It is estimatedby the maximum ratio of the total number of truly classifiedpixels by the number of pixels in field of view (FOV).
4.2. Parameters setting
There are two types of parameters to be set efficiently: param-eters of ant and MF algorithms.
It is really hard to assign best values for the parametersof the ant algorithm. Therefore, the convenient ant algorithmparameters are determined by the experiments carried out onthe retinal images of DRIVE database through the accuracy cal-culations. Determined parameters are listed in Table 1. Fig. 5shows segmentation results of the ant algorithm with differ-ent settings of “q0” and “�” parameters (without combinationof matching filter).
On the other hand, ant algorithm parameters affectingthe algorithm performance like number of ants and used antmemory are directly correlated with the varying blocking size.The maximum accuracy results are shown in Table 2 withrespect to the affecting parameters. They are obtained fromsingle retinal image.
Table 2 indicates that number of ants and their memoriesshould be balanced. The tests with small number of ants withlarge memories and large number of ants with short memoriesdeduced that they decrease the performance of segmentation.In the view of the Table 2, we prefer to use 12 × 12 block sizewith 10 ants and memory size of 50. This combination givesthe accuracy of 0.9208.
Although the maximum accuracy results are observed onthe usage of 5 × 5 block size, this size of block cannot behavecorrectly inside the thicker vessel segments. When the blockfalls on the vessel having the width greater than 5 pixels, the
inner side of the vessel can be marked as background. Sincewe do not want to double border extraction for vessel segment,we do not use 5 × 5 blocks.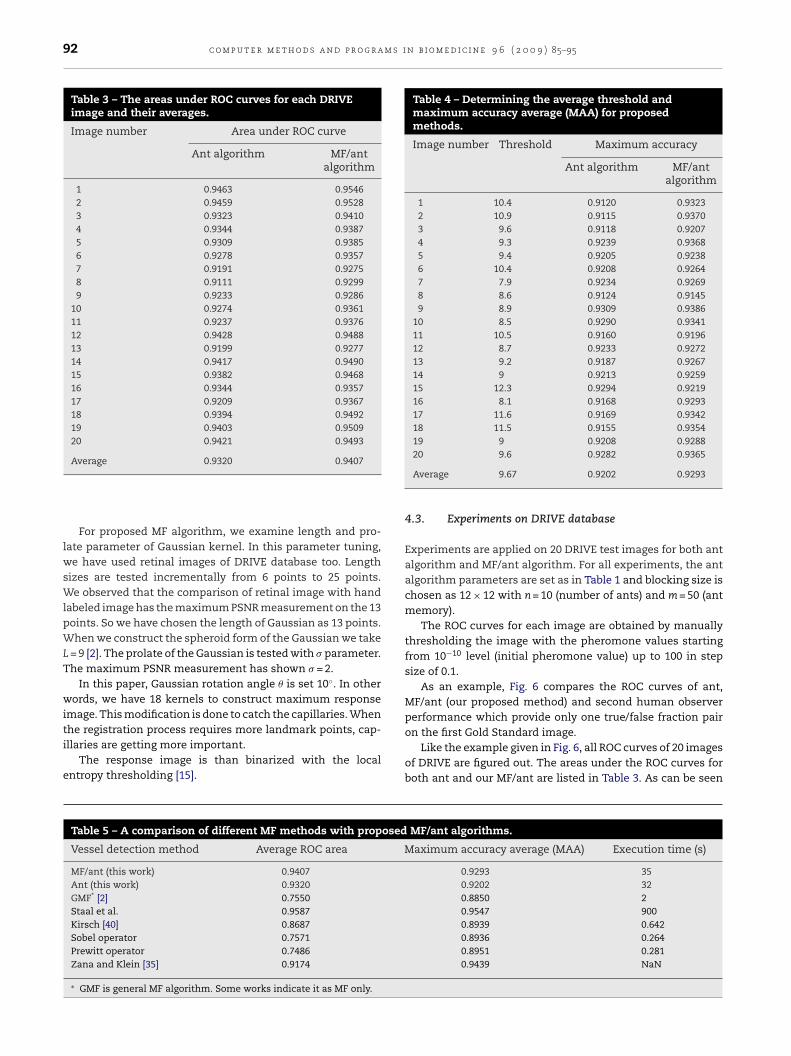
92 c o m p u t e r m e t h o d s a n d p r o g r a m s i n b i o m e d i c i n e 9 6 ( 2 0 0 9 ) 85–95
Table 3 – The areas under ROC curves for each DRIVEimage and their averages.
Image number Area under ROC curve
Ant algorithm MF/antalgorithm
1 0.9463 0.95462 0.9459 0.95283 0.9323 0.94104 0.9344 0.93875 0.9309 0.93856 0.9278 0.93577 0.9191 0.92758 0.9111 0.92999 0.9233 0.9286
10 0.9274 0.936111 0.9237 0.937612 0.9428 0.948813 0.9199 0.927714 0.9417 0.949015 0.9382 0.946816 0.9344 0.935717 0.9209 0.936718 0.9394 0.949219 0.9403 0.950920 0.9421 0.9493
Average 0.9320 0.9407
Table 4 – Determining the average threshold andmaximum accuracy average (MAA) for proposedmethods.
Image number Threshold Maximum accuracy
Ant algorithm MF/antalgorithm
1 10.4 0.9120 0.93232 10.9 0.9115 0.93703 9.6 0.9118 0.92074 9.3 0.9239 0.93685 9.4 0.9205 0.92386 10.4 0.9208 0.92647 7.9 0.9234 0.92698 8.6 0.9124 0.91459 8.9 0.9309 0.9386
10 8.5 0.9290 0.934111 10.5 0.9160 0.919612 8.7 0.9233 0.927213 9.2 0.9187 0.926714 9 0.9213 0.925915 12.3 0.9294 0.921916 8.1 0.9168 0.929317 11.6 0.9169 0.934218 11.5 0.9155 0.935419 9 0.9208 0.9288
on the first Gold Standard image.Like the example given in Fig. 6, all ROC curves of 20 images
For proposed MF algorithm, we examine length and pro-late parameter of Gaussian kernel. In this parameter tuning,we have used retinal images of DRIVE database too. Lengthsizes are tested incrementally from 6 points to 25 points.We observed that the comparison of retinal image with handlabeled image has the maximum PSNR measurement on the 13points. So we have chosen the length of Gaussian as 13 points.When we construct the spheroid form of the Gaussian we takeL = 9 [2]. The prolate of the Gaussian is tested with � parameter.The maximum PSNR measurement has shown � = 2.
In this paper, Gaussian rotation angle � is set 10◦. In otherwords, we have 18 kernels to construct maximum responseimage. This modification is done to catch the capillaries. Whenthe registration process requires more landmark points, cap-illaries are getting more important.
The response image is than binarized with the localentropy thresholding [15].
Table 5 – A comparison of different MF methods with proposed
Vessel detection method Average ROC area
MF/ant (this work) 0.9407Ant (this work) 0.9320GMF* [2] 0.7550Staal et al. 0.9587Kirsch [40] 0.8687Sobel operator 0.7571Prewitt operator 0.7486Zana and Klein [35] 0.9174
∗ GMF is general MF algorithm. Some works indicate it as MF only.
20 9.6 0.9282 0.9365
Average 9.67 0.9202 0.9293
4.3. Experiments on DRIVE database
Experiments are applied on 20 DRIVE test images for both antalgorithm and MF/ant algorithm. For all experiments, the antalgorithm parameters are set as in Table 1 and blocking size ischosen as 12 × 12 with n = 10 (number of ants) and m = 50 (antmemory).
The ROC curves for each image are obtained by manuallythresholding the image with the pheromone values startingfrom 10−10 level (initial pheromone value) up to 100 in stepsize of 0.1.
As an example, Fig. 6 compares the ROC curves of ant,MF/ant (our proposed method) and second human observerperformance which provide only one true/false fraction pair
of DRIVE are figured out. The areas under the ROC curves forboth ant and our MF/ant are listed in Table 3. As can be seen
MF/ant algorithms.
Maximum accuracy average (MAA) Execution time (s)
0.9293 350.9202 320.8850 20.9547 9000.8939 0.6420.8936 0.2640.8951 0.2810.9439 NaN
c o m p u t e r m e t h o d s a n d p r o g r a m s i n b i o m e d i c i n e 9 6 ( 2 0 0 9 ) 85–95 93
nt ou
fa
bcmive
o[m0tWiGSnhass
a
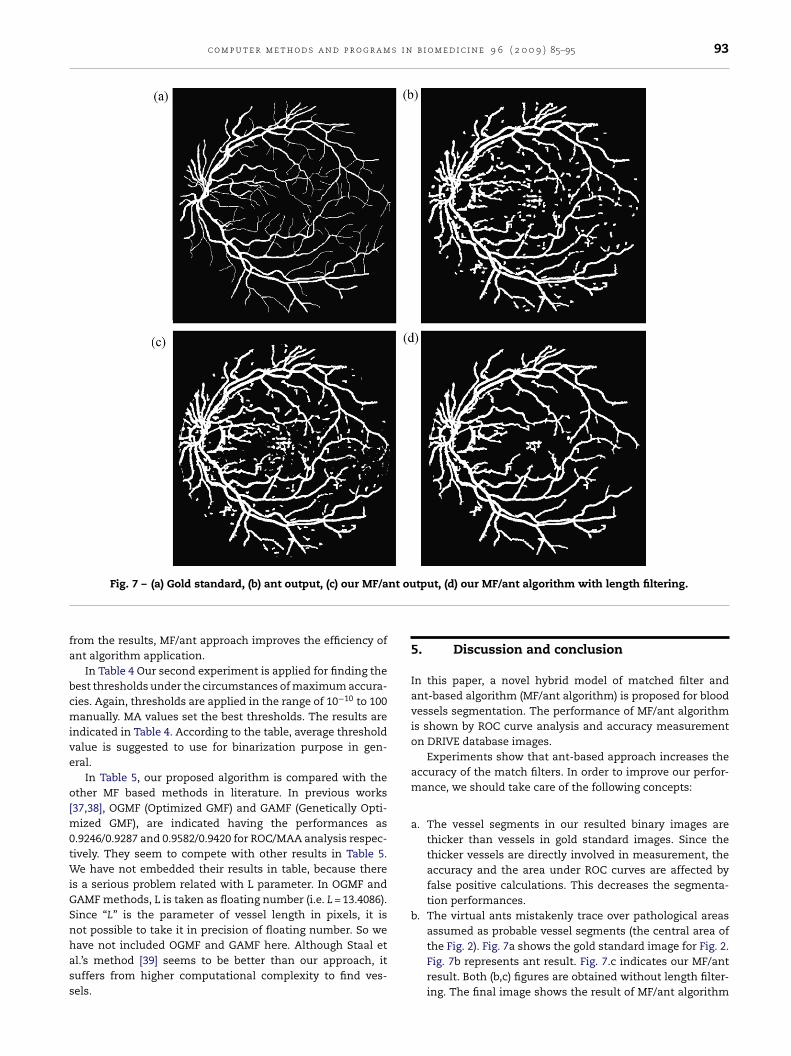
Fig. 7 – (a) Gold standard, (b) ant output, (c) our MF/a
rom the results, MF/ant approach improves the efficiency ofnt algorithm application.
In Table 4 Our second experiment is applied for finding theest thresholds under the circumstances of maximum accura-ies. Again, thresholds are applied in the range of 10−10 to 100anually. MA values set the best thresholds. The results are
ndicated in Table 4. According to the table, average thresholdalue is suggested to use for binarization purpose in gen-ral.
In Table 5, our proposed algorithm is compared with thether MF based methods in literature. In previous works
37,38], OGMF (Optimized GMF) and GAMF (Genetically Opti-ized GMF), are indicated having the performances as
.9246/0.9287 and 0.9582/0.9420 for ROC/MAA analysis respec-ively. They seem to compete with other results in Table 5.
e have not embedded their results in table, because theres a serious problem related with L parameter. In OGMF andAMF methods, L is taken as floating number (i.e. L = 13.4086).ince “L” is the parameter of vessel length in pixels, it isot possible to take it in precision of floating number. So we
ave not included OGMF and GAMF here. Although Staal etl.’s method [39] seems to be better than our approach, ituffers from higher computational complexity to find ves-els.tput, (d) our MF/ant algorithm with length filtering.
5. Discussion and conclusion
In this paper, a novel hybrid model of matched filter andant-based algorithm (MF/ant algorithm) is proposed for bloodvessels segmentation. The performance of MF/ant algorithmis shown by ROC curve analysis and accuracy measurementon DRIVE database images.
Experiments show that ant-based approach increases theaccuracy of the match filters. In order to improve our perfor-mance, we should take care of the following concepts:
. The vessel segments in our resulted binary images arethicker than vessels in gold standard images. Since thethicker vessels are directly involved in measurement, theaccuracy and the area under ROC curves are affected byfalse positive calculations. This decreases the segmenta-tion performances.
b. The virtual ants mistakenly trace over pathological areasassumed as probable vessel segments (the central area of
the Fig. 2). Fig. 7a shows the gold standard image for Fig. 2.Fig. 7b represents ant result. Fig. 7.c indicates our MF/antresult. Both (b,c) figures are obtained without length filter-ing. The final image shows the result of MF/ant algorithm
m s i
r
94 c o m p u t e r m e t h o d s a n d p r o g r a
with length filtering. As can be seen from the final image,MF/ant extracts vessels perfectly but pathological area canaffect the result.
We aim to get rid of pathological areas in the future work.In order to achieve this goal, we are going to use chromaticitychannel extraction.
e f e r e n c e s
[1] A. Hoover, V. Kouznetsova, M. Goldbaum, Locating bloodvessels in retinal images by piecewise threshold probing of amatched filter response, IEEE Trans. Med. Imaging 19 (3)(2000) 203–210.
[2] S. Chaudhuri, S. Chatterjee, N. Katz, et al., Detection of bloodvessels in retinal images using two-dimensional matchedfilters, IEEE Trans. Med. Imaging 8 (3) (1989)263–269.
[3] R. Nekovei, Y. Sun, Back-propagation network and itsconfiguration for blood vessel detection in angiograms, IEEETrans. Neural Networks 6 (1) (1995) 64–72.
[4] B. Cote, W. Hart, M. Goldbaum, P. Kube, M. Nelson,Classification of blood vessels in ocular fundus images,Computer Science and Engineering Department, Universityof California, San Diego, Tech Report, 1994.
[5] S. Tamura, K. Tanaka, S. Ohmori, K. Okazaki, A. Okada, M.Hoshi, Semiautomatic leakage analyzing system for timeseries fluorescein ocular fundus angiography, PatternRecognit. 16 (2) (1983) 149–162.
[6] M.E. Martinez-Perez, A.D. Hughes, A.V. Stanton, S.A. Thom,A.A. Bharath, K.H. Parker, Segmentation of retinal bloodvessels based on the second directional derivative andregion growing, Proc. ICIP (1999) 173–176.
[7] O. Chutatape, L. Zheng, S.M. Krishnan, Retinal blood vesseldetection and tracking by matched Gaussian and Kalmanfilters, in: Proc. of 20th Annu. Int. Conf. IEEE Eng Med. Biol.,1998, pp. 3144–3149.
[8] Y. Tolias, S.M. Panas, A fuzzy vessel tracking algorithm forretinal images based on fuzzy clustering, IEEE Trans. Med.Imag. 17 (2) (1998) 263–273, Apr.
[9] A. Can, H. Shen, J.N. Turner, H.L. Tanenbaum, B. Roysam,Rapid automated tracing and feature extraction from retinalfundus images using direct exploratory algorithms, IEEETrans. Inf. Technol. Biomed. 3 (2) (1999) 125–138.
[10] H. Nezamabadi-pour, S. Saryazdi, E. Rashedi, Edge detectionusing ant algorithms, Soft Comput. 10 (2006)623–628.
[11] D.-S. Lu, C.-C. Chen, Edge detection improvement by antcolony optimization, Pattern Recognit. Lett. 29 (4) (2008)416–425.
[12] Y.-C. Liang, A.H.-L. Chen, C.-C. Chyu, Application of a hybridant colony optimization for the multilevel thresholding inimage processing, in: ICONIP’06, Part II, LNCS, vol. 4233,2006, pp. 1183–1192.
[13] A.R. Malisia, H.R. Tizhoosh, Image thresholding using antcolony optimization, crv, in: The 3rd Canadian Conferenceon Computer and Robot Vision (CRV’06), 2006, p. 26.
[14] X. Zhao, M.-E. Lee, S.-H. Kim, Improved image thresholdingusing ant colony optimization algorithm, Int. Conf. Adv.Lang. Process. Web Inf. Technol. (2008) 210–215.
[15] A.R. Malisia, H.R. Tizhoosh, Applying ant colonyoptimization to binary thresholding, IEEE Int. Conf. ImageProcess. (2006) 2409–2412.
[16] J. Handl, B. Meyer, Ant-based and swarm-based clustering,Swarm Intell. 1 (2007) 95–113.
n b i o m e d i c i n e 9 6 ( 2 0 0 9 ) 85–95
[17] E. Lumer, B. Faieta, Diversity and adaptation in populationsof clustering ants, in: From Animals to Animats 3:Proceedings of the Third International Conference onSimulation of Adaptive Behavior, 1994, pp. 501–508.
[18] J. Handl, J. Knowles, M. Dorigo, Ant-based clustering andtopographic mapping, Artif. Life 12 (1) (2006) 35–61.
[19] Q. Li, Z. Shi, J. Shi, Z. Shi, Swarm intelligence clusteringalgorithm based on attractor, in: L. Wang, K. Chen, Y.-S. Ong(Eds.), Lecture Notes in Computer Science: vol. 3612.Advances in Natural Computation, First InternationalConference, ICNC, 2005, pp. 496–504.
[20] S. Ouadfel, M. Batouche, AntClust: an ant algorithm forswarm based image clustering, Inf. Technol. J. 6 (2) (2007)196–201.
[21] X.-N. Wang, Y.-J. Feng, Z.-R. Feng, Ant colony optimizationfor image segmentation, in: Proc. of the Fourth InternationalConf. on Mach. Learn. and Cyber, Guangzhou, 2005, pp.5355–5360.
[22] R. Laptik, D. Navakauskas, Application of ant colonyoptimization for image segmentation, Electron. ElectricalEng. 8 (80) (2007) 13–18.
[23] S. Saatchi, C.C. Hung, Hybridization of the ant colonyoptimization with the k-means algorithm for clustering,Lecture Notes Comput. Sci. 3540 (2005).
[24] B. Zhao, Z. Zhu, E. Mao, Z. Song, Image segmentation basedon ant colony optimization and K-means clustering, in: Porc.of Int. Conf. Automat. Logistics, 2007, pp. 459–463.
[25] Y. Weili, G. Lei, Z. Tianyun, X. Guchu, Image segmentationmethod by combining watersheds and ant colony clustering,Proc. Control Conf. (2007) 526–529.
[26] M. Dorigo, V. Maniezzo, A. Colorni, Positive feedback as asearch strategy, Technical Report, Dipartimento diElettronica, Politecnico di Milano, Milano, Italy, 1991.
[27] M. Dorigo, Ottimizzazione, Apprendimento Automatico, edAlgoritmi Basati su Metafora Naturale, PhD thesis,Politecnico di Milano, 1992.
[28] M. Dorigo, V. Maniezzo, A. Colorni, The ant system:optimization by a colony of cooperating agents, IEEE Trans.Syst. Man Cybern. Part B 26 (1996) 29–41.
[29] M. Dorigo, G. Di Caro, Ant colony optimization: a newmetaheuristic, Proc. Congr. Evol. Comput. 2 (1999) 1470–1477.
[30] M. Dorigo, M. Birattari, T. Stützle, Ant colony optimization:artificial ants as a computational intelligence technique,IEEE Comput. Intell. Mag. (1999) 28–38.
[31] E. Bonabeau, M. Dorigo, G. Theraulaz, Swarm IntelligenceFrom Natural to Artificial Systems, Oxford University Press,New York, NY, 1999.
[32] M. Dorigo, L.M. Gambardella, Ant colony system: acooperative learning approach to the traveling salesmanproblem, IEEE Trans. Evol. Comput. 1 (1997) 53–66.
[33] M. Dorigo, L.M. Gambardella, Ant colonies for the travelingsalesman problem, Bio Syst. 43 (1997) 73–81.
[34] R. Perfetti, E. Ricci, D. Casali, G. Costantini, Cellular neuralnetworks with virtual template expansion for retinal vesselsegmentation, IEEE Trans. Circuits Syst. 54 (2) (2007) 141–146.
[35] F. Zana, J.C. Klein, A multimodal registration algorithm ofeye fundus images using vessels detection and Houghtransform, IEEE Trans. Med. Imaging 18 (5) (1999) 419–428.
[36] K. Hätönen, S. Laine, T. Similä, Using the LogSig function tointegrate expert knowledge to self-organizing map (SOM)based analysis, in: IEEE Int. Workshop Soft Comput. Ind.Appl. (SMCia/03), 2003, pp. 145–150.
[37] M. Al-Rawi, M. Qutaishat, M. Arrar, An improvementmatched filter for blood vessel detecetion of digital retinalimages, Comput. Biol. Med. 37 (2007) 262–267.
[38] M. Al-Rawi, H. Karajeh, Genetic algorithm matched filteroptimization for automated detection of blood vessels fromdigital retinal images, Comput. Methods Programs Biomed.87 (2007) 248–253.
s i n
c o m p u t e r m e t h o d s a n d p r o g r a m[39] J. Staal, B. Ginneken, M. Niemeijer, A. Viegever, M.D.Abramoff, Ridge based vessel segmentation in color imagesof retina, IEEE Trans. Med. Imaging 23-4 (2004) 501–509.
b i o m e d i c i n e 9 6 ( 2 0 0 9 ) 85–95 95
[40] H. Li, O. Chutatape, Fundus image feature extraction, in:Proceeding of the 22nd IEEE Conference on Engineering inMedicine and Biology Society, vol. 1, 2000, pp. 3071–3073.