lic mf factsheet march 2022.cdr
TRANSCRIPT

1800-258-5678
Call Toll FreeTo know more, please consult your Financial Advisor
OR
Investors understand that their principalwill be at Very High risk
Low
Low toModerate
Moderate ModeratelyHigh
High
Very High
RISKOMETER HIGHLOW
* Subject to ₹ 1.5 lakh under Section 80C of the Income Tax Act, 1961(As per prevailing tax laws in India).
Invest in
MARCH 2022
Less taxing!
Making your journey great
Tax benefit u/s 80C*
This product is suitable for investors who are seeking*:
• Long-term capital growth.
• Investment in equity and equity-related securities.
• Risk - Very High
MUTUAL FUND INVESTMENTS ARE SUBJECT TO MARKET RISKS, READ ALL SCHEME RELATED DOCUMENTS CAREFULLY.
/LICMutual /company/LICMutual/LICMutual 1800-258-5678Connect with us: www.licmf.com
*Investors should consult their financial advisors if in doubt about whether the product is suitable for them. Risk-o-meter is based on evaluation of risk level of Scheme's portfolio as on 28th February 2022 and the change in Risk-o-meter will be evaluated on a monthly basis. For more details, please visit our website www.licmf.com
FACTSHEET

2
At the outset, I am humbled to assume the responsibility of MD & CEO of this esteemed company. My 34 years of
illustrious career span with LIC of India and its associates have enabled me to have a better understanding of investor's
needs. My union with LICMF is a natural progression as I started my career with LIC of India then moved to LIC Housing
Finance before assuming leadership role in LIC Mutual Fund.
A responsible Indian middle class has primarily 3 major milestones in his life. Firstly, to secure his family through life
insurance, secondly, build a roof by availing housing loan and thereafter building his financial wealth by investing in
Mutual Fund. I am privileged to offer my service to the society in insurance, housing finance and now mutual fund.
Mutual fund industry is poised to take strides of AUM growth in the medium to long term. Our industry is still at the
nascent stage despite the industry managing ~Rs. 38trn of AuM as on February 2022 (Source: AMFI). The world
average of MF AUM to GDP is 63%, whereas India is only 12%. US is highest at 120%. Also, in terms of Equity AUM as a
% of GDP, the world average is 36%, India has only started its journey with 5% (Source: IMF, CRISIL Research). India's
population as compared to the world is relatively younger. Moreover, India is placed better than other emerging markets
on growth front substantiated by its improving macroeconomic indicators, rising GST collections, rising rural income
and relatively better government finance. Thus, the long-term optimism of Indian economic growth remains intact, yet
we have only scratched the surface of mutual fund potential.
LICMF has been successful in extending its Parent LIC's 'Trusted Brand' image in the mutual fund space. LICMF strives
to gain mindshare in locations where we are witnessing rising affinity towards the Mutual Fund asset class, by offering
relevant product and superior investor experience. As the famous saying goes, 'Motivation gets you going, but
discipline keeps you growing', it is our discipline more than our motivation that has helped us earn respect and trust of
our investors over the years.
India's middle-class segment has immense potential to participate in equity growth story and there is a lot of ground to
cover. LICMF strives to increase the participation of this mass segment and make them beneficiary to the country's
favourable economic growth over the next few decades, by being present, relevant and consistent.
At LICMF we continue to remain committed to our Investor's Trust, offer them relevant products and help them build
long term wealth. We are hopeful that the seeds of growth & development sown by all of us bear fruits in the days to
come.
Keep Investing, Keep Growing!
From Managing Director's Desk
Warm regards,
T Ramakrishnan MD & CEO

Mr. Yogesh Patil
Head - Equity
3
EQUITYMarket Review
Ÿ After a stable Jan'22, Feb'22 witnessed heightened volatility in Indian equity market (Nifty VIX touched 52 weeks high of 33.97 in Feb'22, currently at 27-28 levels) primarily on account of the global cues. At the start of Feb'22, investors were discussing about the possible rate hike in the developed markets and its impact on the global capital flows, however, post mid Feb'22 focus shifted towards the geopolitical tension between Russia and Ukraine and its probable impacts on global markets especially commodities. Russia did launch army operations against Ukraine, leading to a wave of negative sentiments in the global markets. Indian equities too were impacted and both the key indices – Sensex and Nifty were down by c.4-5% during the month.
Ÿ On the macro front, unfavourable base effect pushed Jan'22 headline CPI inflation slightly above RBI's tolerance limit as the reported number came in at 6.01% compared to 5.66% in Dec 21. Core inflation eased mildly to 6.20% as the impact of the telecom tariff hike was offset by the tax cut-led decline in motor fuels, while other core components barring housing saw stable sequential momentum.
Ÿ Industrial production growth eased to 0.4% in Dec'21 from 1.3% in Nov'21 led by mining (2.6% from 4.9% in Nov'21) and manufacturing output (declined by -0.1% from an increase of 0.8%). Within manufacturing, output of furniture and electrical equipment disappointed the most. Capital goods output contracted to 11-month low of 4.6% in Dec'21. Notably, IIP growth over a 2-year basis (2.6% in Dec'21) is back up to pre-pandemic levels – reflecting continued improvement post pandemic.
Ÿ Other key developments during the month— (1) the government prioritized economic growth over fiscal consolidation in FY2023 union budget. It targeted central GFD/GDP at 6.4% in FY2023BE, (2) the RBI kept policy rate unchanged. Meanwhile, the BoE, raised its key policy rate by 25bps to 0.5%. The ECB maintained status quo on rates despite record increase in inflation. The PBoC left its 1-year and 5-year loan prime rates unchanged, The BoK, in line with market expectations, left its policy rate unchanged. Reserve Bank of New Zealand (RBNZ) in line with expectations, raised its key policy rate by 25bps to 0.75%, (3) Indian government introduced green hydrogen policy, (4) real GDP in 3QFY22 grew 5.4% led by private consumption growth of 7% and (5) five Indian states have gone for assembly election; results will be announced on 10th Mar'22.
Ÿ On the sectoral indices front, Metals (+9.5%), Consumer Durables (+2.8%) and Power (-2.1%), outperformed the key indices while Oil & Gas (-7.3%), Auto (-6.8%), Cap Goods (-5.1%), Banks (-4.4%), IT (-3.6%) and FMCG (-3.4%) underperformed the key indices during the month.
Capital Flows:
Ÿ FIIs continued to be net sellers for the month. Net equity selling by FIIs stood at ₹ 35,592 Cr (USD 4.7bn) in Feb'22. Due to continuous selling
since last five months, FIIs have turned net sellers to the tune of ₹ 88,405 cr (USD 11.7bn) in last twelve months i.e., from Mar'21 – Feb'22. On the
other side, DIIs bought equity worth ₹ 1,87,188 Cr (USD 25.1bn) for the same period. (As on Feb'22 Source: SEBI) (Feb'22 Avg. 1 USD = INR
75.00)
Outlook
Ÿ The ongoing geopolitical tension between Russia and Ukraine could have significant ramification on global trade scenario over near to
medium term as most countries will align to new world realities. We have seen the impact on commodity prices which are inching up higher and the
supply chain is also getting disrupted again after it stabilised post Covid pandemic. Along with this, the uncertain environment on the interest rate
could further add to volatility in the markets. While we believe its too early to judge impact on the growth trend of global economy, we expect
negative sentiments to prevail over near term which could impact the capital flows, especially to the emerging markets.
Ÿ On the domestic front, while the lead indicators such as GST collection, freight data, electricity consumption – all continue to show good
traction on incremental basis, rising inflation has created concerns for the corporates and investors. India's Benchmark 10-year yield has risen
sharply during the month as Government announced a sharp increase in gross borrowing for the year FY23. Interest rate also faces risk from
higher than anticipated increase in inflation due to global developments.
Ÿ On the economic growth front, 3QFY22 GDP growth in YoY terms came in at 5.4% YoY (8.4% in 2QFY22). The moderation in activity is not only
driven by the base effect as some moderation is expected after the 'V' shaped bounce back from COVID 2.0 in Sept'21, but the pace of expansion
in 3QFY22 is underwhelming when considered in the backdrop of unwinding COVID restrictions across the nation. Overall pace of improvement
has been curtailed by manufacturing on the supply side and investments as well as exports on the demand side. Personal consumption has
improved despite higher inflation which means demand has been mainly driven by mid to high income households. In this backdrop, consumer
sentiments improving is positive for the economy which we have been highlighting. We believe India will see a consumption led demand recovery
growth as the per capita GDP has crossed the USD 2000 barrier and should flow down to growth in the non-discretionary consumption.
Ÿ Overall, the Indian equity markets looks to be on strong footing as the earnings growth finally seems to be on track after a lull of last five to seven
years and the recent correction in the markets has brought down the valuations near to historical levels in various pockets / sectors. The current
ongoing Geopolitical events may pose a risk to equities in the near term, however, we continue to like India's long term growth story. We prefer to
focus on existing leaders who are likely to disrupt/ innovate in their respective business segments to ensure that their leadership or competitive
moat remains strong. Value creation is imperative as our investment process gives high regard to , high standards of governance, high capital
efficiency, strong moats and sustainable growth.
MARKET REVIEW

4
DEBT
Ÿ Market started on a jittery note with yields hardening across the curve post union budget due to higher-than-expected gross market
borrowing of Rs. 14.95 lakh crores for FY2023 and absence of any announcement related to index inclusion. However later during the
month yields corrected due to dovish RBI policy and reduced market supply due to cancellation of G-Sec auctions and incremental monthly
switches. RBI in its monetary policy kept key rates unchanged and maintained accommodative stance, however Prof. Jayant Varma
continued voting against retaining accommodative stance. Also, MPC projected CPI inflation for FY2023 at much lower at 4.5%. During
end of month RBI announced revised Treasury bill calendar for month of march raising issuance by Rs. 60,000 crores. Higher global bond
yields and rising oil prices due to escalating geopolitical tension between Russia and Ukraine added to the negativity. 10-year Gsec
benchmark traded in a wide range of 6.65%-6.94%. 5-year OIS has also hardened by 10 bps during the month from 5.78% and then
softened to settle at 5.77% at the end of month, however 1-year OIS softened 16 bps to 4.33% .
Ÿ System liquidity remained in surplus range with average surplus liquidity in February increased to Rs. 6.88 lakh crores vs Rs. 6.29 lakh
crores in the month of January. Currency in Circulation (CIC) marginally rose to Rs. 30.80 lakh crore (end February) vs Rs. 30.32 lakh crore
(end January).
Ÿ CPI inflation accelerated slightly above RBI threshold band of 2%-6% to 6.01% in December as against 5.66% in December mainly
because of unfavourable base effect especially in food and fuel components.
Ÿ Slight decline in gross GST collection seen in February at Rs. 1.33 lakh crore vs Rs. 1.38 lakh crore collected in January, however it has
crossed Rs. 1.30 lakh crore mark for 5th time this year. Gross average monthly GST collection till date for current FY2022 stands at Rs.
1.22 lakh crore.
Ÿ India's GDP grew at 5.4% YOY during third quarter of FY 2021-22 lower than 8.4% YOY registered during Second quarter, yearly GDP
growth estimate for FY 2021-22 is revised lower to 8.9% compared to earlier estimate of 9.2%. YOY GVA growth for same quarter came at
4.7%.
Mr. Marzban Irani
CIO - Fixed Income
Ÿ Foreign portfolio investors sold Rs. 2,586 crores (Net) in debt market in February 2022 as against an inflow of Rs. 3,080 crores (Net) in
January 2022
Ÿ Bank of England's MPC provided a hawkish surprise to market by raising its key policy rates by 25 bps to 0.50% due to persistent higher
inflation. ECB kept rates unchanged and maintained accommodative stance.
Outlook
Ÿ In mid of ongoing war between Russia and Ukraine commodity prices are rising especially crude, hence it's expected that government
will also raise domestic fuel prices which will be inflationary in nature. Market participants will be watchful for inflation print both domestic
and in US. Also, whether FED is rising rates by 25 bps or 50 bps in its upcoming monetary policy in mid-march and governments first half
borrowing calendar figures. Investors appetite specially insurance companies and pension funds will provide support to yields in
secondary market in absence of any G-sec auctions during the month.
MARKET REVIEW
Source: Bloomberg
28-Feb-22 01-Feb-22 Change
USD/INR 75.34 74.80 0.72%
Brent Crude Oil ($/bbl) 100.99 89.16 13.27%
Gold ($/oz) 1,908.99 1,801.19 5.98%
T-Repo 3.23% 3.39% -0.16%
10-year G-Sec 6.77% 6.85% -0.08%
10-year AAA PSU 7.11% 7.10% 0.01%
US 10-year Gilt 1.83% 1.83% -0.01%
Market Indicators
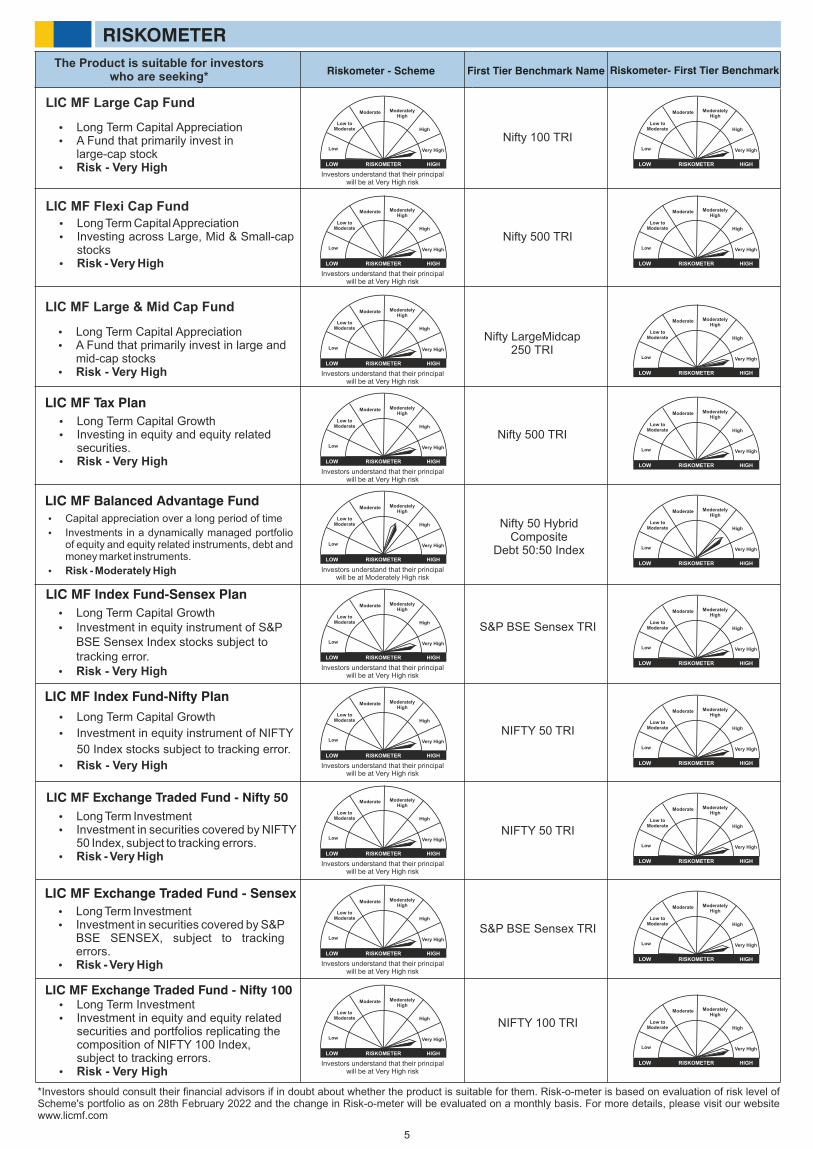
RISKOMETER
Riskometer - Scheme
LIC MF Large Cap Fund
LIC MF Flexi Cap Fund
LIC MF Large & Mid Cap Fund
LIC MF Tax Plan
LIC MF Index Fund-Sensex Plan
LIC MF Index Fund-Nifty Plan
LIC MF Exchange Traded Fund - Nifty 50
LIC MF Exchange Traded Fund - Sensex
LIC MF Exchange Traded Fund - Nifty 100
Ÿ Long Term Capital AppreciationŸ A Fund that primarily invest in
large-cap stockŸ Risk - Very High
Ÿ Long Term Capital AppreciationŸ Investing across Large, Mid & Small-cap
stocksŸ Risk - Very High
Ÿ Long Term Capital AppreciationŸ A Fund that primarily invest in large and
mid-cap stocksŸ Risk - Very High
Ÿ Long Term Capital GrowthŸ Investing in equity and equity related
securities.Ÿ Risk - Very High
Ÿ Long Term Capital GrowthŸ Investment in equity instrument of S&P
BSE Sensex Index stocks subject to tracking error.
Ÿ Risk - Very High
Ÿ Long Term Capital Growth
Ÿ Investment in equity instrument of NIFTY
50 Index stocks subject to tracking error.
Ÿ Risk - Very High
Ÿ Long Term InvestmentŸ Investment in securities covered by NIFTY
50 Index, subject to tracking errors.Ÿ Risk - Very High
Ÿ Long Term InvestmentŸ Investment in securities covered by S&P
BSE SENSEX, subject to tracking errors.
Ÿ Risk - Very High
Ÿ Long Term InvestmentŸ Investment in equity and equity related
securities and portfolios replicating the composition of NIFTY 100 Index, subject to tracking errors.
Ÿ Risk - Very High
Low
Low toModerate
Moderate ModeratelyHigh
High
Very High
RISKOMETER HIGHLOW
Investors understand that their principalwill be at Very High risk
*Investors should consult their financial advisors if in doubt about whether the product is suitable for them. Risk-o-meter is based on evaluation of risk level of Scheme's portfolio as on 28th February 2022 and the change in Risk-o-meter will be evaluated on a monthly basis. For more details, please visit our website www.licmf.com
The Product is suitable for investorswho are seeking*
Riskometer- First Tier Benchmark
Nifty 100 TRI
First Tier Benchmark Name
Low
Low toModerate
Moderate ModeratelyHigh
High
Very High
RISKOMETER HIGHLOW
Low
Low toModerate
Moderate ModeratelyHigh
High
Very High
RISKOMETER HIGHLOW
Investors understand that their principalwill be at Very High risk
Nifty 500 TRILow
Low toModerate
Moderate ModeratelyHigh
High
Very High
RISKOMETER HIGHLOW
Low
Low toModerate
Moderate ModeratelyHigh
High
Very High
RISKOMETER HIGHLOW
Investors understand that their principalwill be at Very High risk
Nifty LargeMidcap250 TRI
Low
Low toModerate
Moderate ModeratelyHigh
High
Very High
RISKOMETER HIGHLOW
Low
Low toModerate
Moderate ModeratelyHigh
High
Very High
RISKOMETER HIGHLOW
Investors understand that their principalwill be at Very High risk
Nifty 500 TRILow
Low toModerate
Moderate ModeratelyHigh
High
Very High
RISKOMETER HIGHLOW
Low
Low toModerate
Moderate ModeratelyHigh
High
Very High
RISKOMETER HIGHLOW
Investors understand that their principalwill be at Very High risk
S&P BSE Sensex TRI
Low
Low toModerate
Moderate ModeratelyHigh
High
Very High
RISKOMETER HIGHLOW
Low
Low toModerate
Moderate ModeratelyHigh
High
Very High
RISKOMETER HIGHLOW
Investors understand that their principalwill be at Very High risk
Low
Low toModerate
Moderate ModeratelyHigh
High
Very High
RISKOMETER HIGHLOW
NIFTY 50 TRI
Low
Low toModerate
Moderate ModeratelyHigh
High
Very High
RISKOMETER HIGHLOW
Investors understand that their principalwill be at Very High risk
Low
Low toModerate
Moderate ModeratelyHigh
High
Very High
RISKOMETER HIGHLOW
NIFTY 50 TRI
Low
Low toModerate
Moderate ModeratelyHigh
High
Very High
RISKOMETER HIGHLOW
Investors understand that their principalwill be at Very High risk
Low
Low toModerate
Moderate ModeratelyHigh
High
Very High
RISKOMETER HIGHLOW
S&P BSE Sensex TRI
Low
Low toModerate
Moderate ModeratelyHigh
High
Very High
RISKOMETER HIGHLOW
Investors understand that their principalwill be at Very High risk
Low
Low toModerate
Moderate ModeratelyHigh
High
Very High
RISKOMETER HIGHLOW
NIFTY 100 TRI
5
LIC MF Balanced Advantage Fund
Ÿ Capital appreciation over a long period of time
Ÿ Investments in a dynamically managed portfolio of equity and equity related instruments, debt and money market instruments.
Ÿ Risk - Moderately High
Low
Low toModerate
Moderate ModeratelyHigh
High
Very High
RISKOMETER HIGHLOW
Investors understand that their principalwill be at Moderately High risk
Nifty 50 HybridComposite
Debt 50:50 Index Low
Low toModerate
Moderate ModeratelyHigh
High
Very High
RISKOMETER HIGHLOW
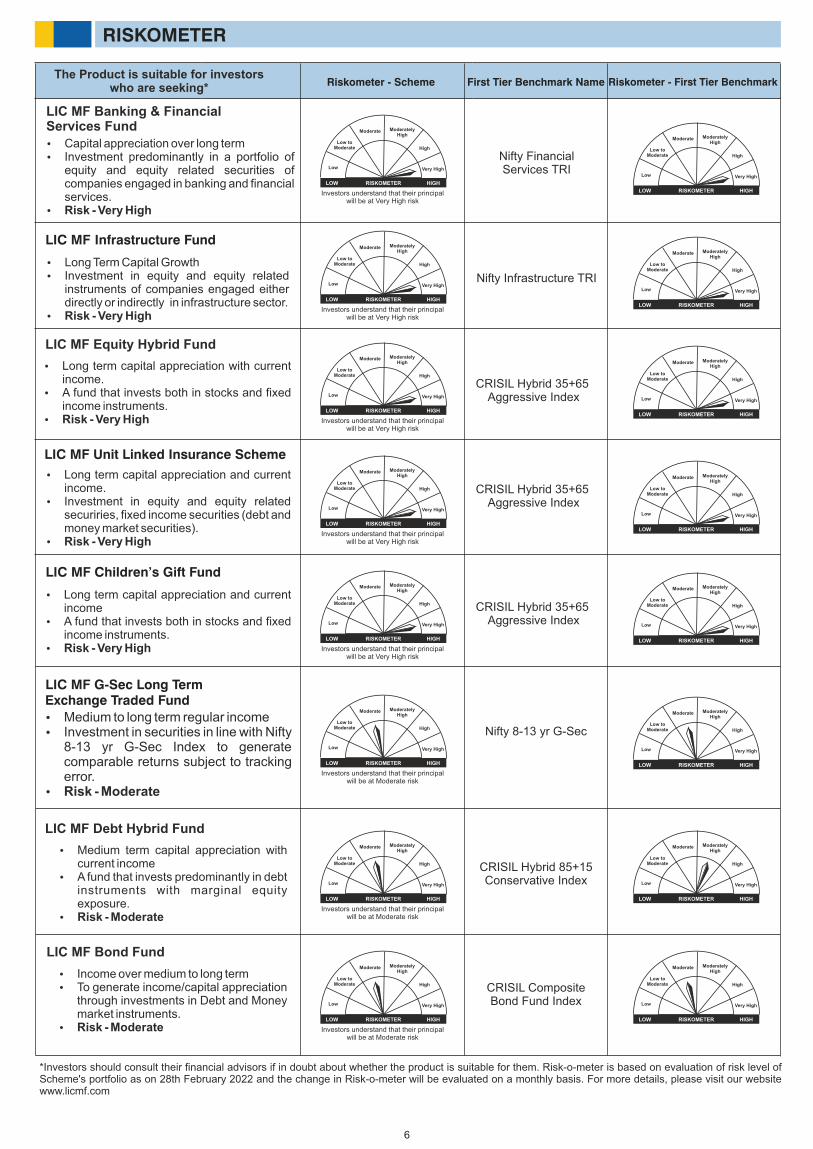
RISKOMETER
Riskometer - Scheme
LIC MF Infrastructure Fund
Ÿ Capital appreciation over long termŸ Investment predominantly in a portfolio of
equity and equity related securities of companies engaged in banking and financial services.
Ÿ Risk - Very High
Ÿ Long Term Capital GrowthŸ Investment in equity and equity related
instruments of companies engaged either directly or indirectly in infrastructure sector.
Ÿ Risk - Very High
LIC MF Banking & Financial Services Fund
LIC MF Children’s Gift Fund
LIC MF Equity Hybrid Fund
LIC MF Unit Linked Insurance Scheme
Ÿ Long term capital appreciation with current income.
Ÿ A fund that invests both in stocks and fixed income instruments.
Ÿ Risk - Very High
Ÿ Long term capital appreciation and current income.
Ÿ Investment in equity and equity related securiries, fixed income securities (debt and money market securities).
Ÿ Risk - Very High
Ÿ Long term capital appreciation and current income
Ÿ A fund that invests both in stocks and fixed income instruments.
Ÿ Risk - Very High
Low
Low toModerate
Moderate ModeratelyHigh
High
Very High
RISKOMETER HIGHLOW
Investors understand that their principalwill be at Very High risk
The Product is suitable for investorswho are seeking*
Riskometer - First Tier Benchmark
Nifty FinancialServices TRI
First Tier Benchmark Name
Low
Low toModerate
Moderate ModeratelyHigh
High
Very High
RISKOMETER HIGHLOW
Low
Low toModerate
Moderate ModeratelyHigh
High
Very High
RISKOMETER HIGHLOW
Investors understand that their principalwill be at Very High risk
Nifty Infrastructure TRILow
Low toModerate
Moderate ModeratelyHigh
High
Very High
RISKOMETER HIGHLOW
Low
Low toModerate
Moderate ModeratelyHigh
High
Very High
RISKOMETER HIGHLOW
Investors understand that their principalwill be at Very High risk
CRISIL Hybrid 35+65 Aggressive Index Low
Low toModerate
Moderate ModeratelyHigh
High
Very High
RISKOMETER HIGHLOW
Low
Low toModerate
Moderate ModeratelyHigh
High
Very High
RISKOMETER HIGHLOW
Investors understand that their principalwill be at Very High risk
Low
Low toModerate
Moderate ModeratelyHigh
High
Very High
RISKOMETER HIGHLOW
Low
Low toModerate
Moderate ModeratelyHigh
High
Very High
RISKOMETER HIGHLOW
Investors understand that their principalwill be at Very High risk
Low
Low toModerate
Moderate ModeratelyHigh
High
Very High
RISKOMETER HIGHLOW
CRISIL Hybrid 35+65 Aggressive Index
CRISIL Hybrid 35+65 Aggressive Index
LIC MF Debt Hybrid Fund
Ÿ Medium term capital appreciation with current income
Ÿ A fund that invests predominantly in debt instruments with marginal equity exposure.
Ÿ Risk - Moderate
LIC MF G-Sec Long Term Exchange Traded Fund
Ÿ Medium to long term regular incomeŸ Investment in securities in line with Nifty
8-13 yr G-Sec Index to generate comparable returns subject to tracking error.
Ÿ Risk - Moderate
Low
Low toModerate
Moderate ModeratelyHigh
High
Very High
RISKOMETER HIGHLOW
Investors understand that their principalwill be at Moderate risk
Low
Low toModerate
Moderate ModeratelyHigh
High
Very High
RISKOMETER HIGHLOW
Nifty 8-13 yr G-Sec
Low
Low toModerate
Moderate ModeratelyHigh
High
Very High
RISKOMETER HIGHLOW
Investors understand that their principalwill be at Moderate risk
Low
Low toModerate
Moderate ModeratelyHigh
High
Very High
RISKOMETER HIGHLOW
CRISIL Hybrid 85+15Conservative Index
LIC MF Bond Fund
Ÿ Income over medium to long termŸ To generate income/capital appreciation
through investments in Debt and Money market instruments.
Ÿ Risk - Moderate
Low
Low toModerate
Moderate ModeratelyHigh
High
Very High
RISKOMETER HIGHLOW
Investors understand that their principalwill be at Moderate risk
Low
Low toModerate
Moderate ModeratelyHigh
High
Very High
RISKOMETER HIGHLOW
CRISIL CompositeBond Fund Index
*Investors should consult their financial advisors if in doubt about whether the product is suitable for them. Risk-o-meter is based on evaluation of risk level of Scheme's portfolio as on 28th February 2022 and the change in Risk-o-meter will be evaluated on a monthly basis. For more details, please visit our website www.licmf.com
6
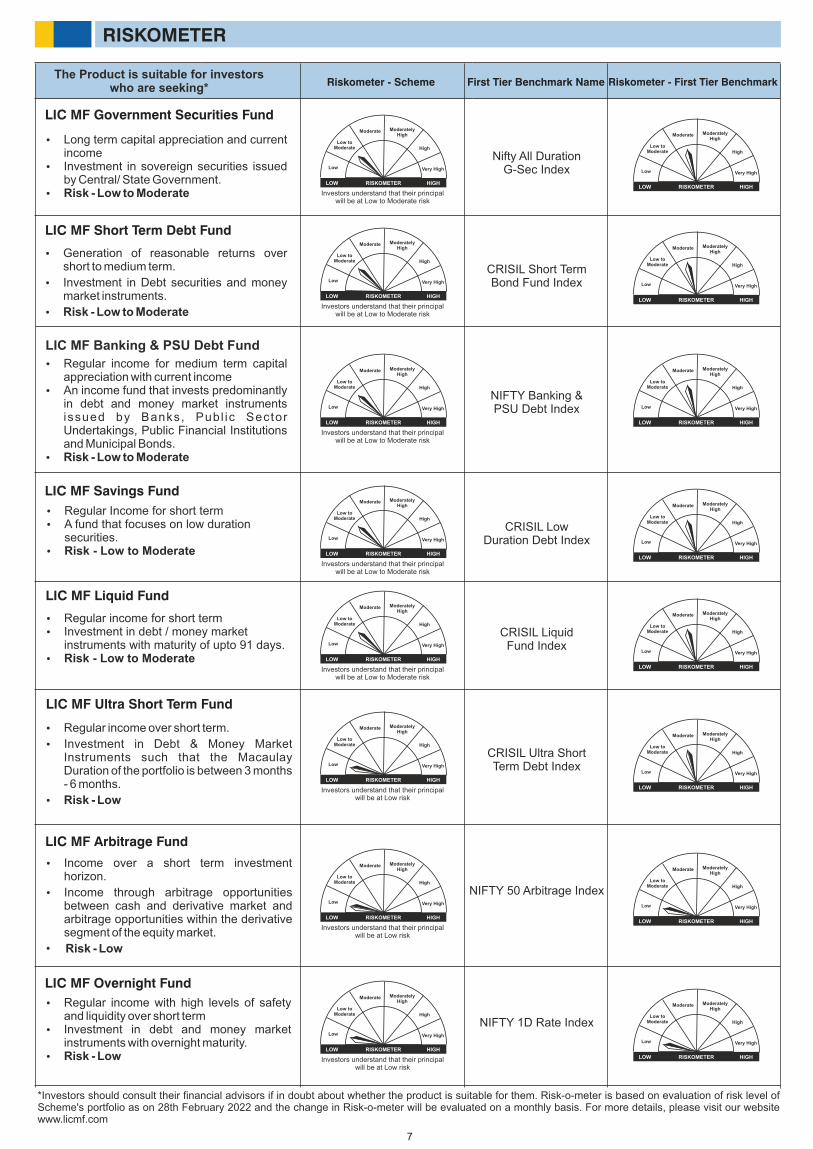
RISKOMETER
Riskometer - Scheme
Low
Low toModerate
Moderate ModeratelyHigh
High
Very High
RISKOMETER HIGHLOW
Investors understand that their principalwill be at Low to Moderate risk
The Product is suitable for investorswho are seeking*
Nifty All DurationG-Sec Index Low
Low toModerate
Moderate ModeratelyHigh
High
Very High
RISKOMETER HIGHLOW
LIC MF Government Securities Fund
Ÿ Long term capital appreciation and current income
Ÿ Investment in sovereign securities issued by Central/ State Government.
Ÿ Risk - Low to Moderate
LIC MF Short Term Debt Fund
Ÿ Generation of reasonable returns over short to medium term.
Ÿ Investment in Debt securities and money market instruments.
Ÿ Risk - Low to Moderate
Low
Low toModerate
Moderate ModeratelyHigh
High
Very High
RISKOMETER HIGHLOW
Investors understand that their principalwill be at Low to Moderate risk
CRISIL Short TermBond Fund Index Low
Low toModerate
Moderate ModeratelyHigh
High
Very High
RISKOMETER HIGHLOW
LIC MF Banking & PSU Debt Fund
LIC MF Savings Fund
Ÿ Regular income for medium term capital appreciation with current income
Ÿ An income fund that invests predominantly in debt and money market instruments issued by Banks, Publ ic Sector Undertakings, Public Financial Institutions and Municipal Bonds.
Ÿ Risk - Low to Moderate
Ÿ Regular Income for short termŸ A fund that focuses on low duration
securities.Ÿ Risk - Low to Moderate
Low
Low toModerate
Moderate ModeratelyHigh
High
Very High
RISKOMETER HIGHLOW
Investors understand that their principalwill be at Low to Moderate risk
NIFTY Banking &PSU Debt Index Low
Low toModerate
Moderate ModeratelyHigh
High
Very High
RISKOMETER HIGHLOW
Low
Low toModerate
Moderate ModeratelyHigh
High
Very High
RISKOMETER HIGHLOW
Investors understand that their principalwill be at Low to Moderate risk
CRISIL LowDuration Debt Index Low
Low toModerate
Moderate ModeratelyHigh
High
Very High
RISKOMETER HIGHLOW
LIC MF Ultra Short Term Fund
Ÿ Regular income over short term.
Ÿ Investment in Debt & Money Market Instruments such that the Macaulay Duration of the portfolio is between 3 months - 6 months.
Ÿ Risk - Low
LIC MF Liquid Fund
Ÿ Regular income for short termŸ Investment in debt / money market
instruments with maturity of upto 91 days. Ÿ Risk - Low to Moderate
Low
Low toModerate
Moderate ModeratelyHigh
High
Very High
RISKOMETER HIGHLOW
Investors understand that their principalwill be at Low to Moderate risk
CRISIL LiquidFund Index
Low
Low toModerate
Moderate ModeratelyHigh
High
Very High
RISKOMETER HIGHLOW
Low
Low toModerate
Moderate ModeratelyHigh
High
Very High
RISKOMETER HIGHLOW
Investors understand that their principalwill be at Low risk
CRISIL Ultra ShortTerm Debt Index
Low
Low toModerate
Moderate ModeratelyHigh
High
Very High
RISKOMETER HIGHLOW
LIC MF Arbitrage Fund
Ÿ Income over a short term investment horizon.
Ÿ Income through arbitrage opportunities between cash and derivative market and arbitrage opportunities within the derivative segment of the equity market.
• Risk - Low
LIC MF Overnight Fund
Ÿ Regular income with high levels of safety and liquidity over short term
Ÿ Investment in debt and money market instruments with overnight maturity.
Ÿ Risk - Low
Low
Low toModerate
Moderate ModeratelyHigh
High
Very High
RISKOMETER HIGHLOW
Investors understand that their principalwill be at Low risk
NIFTY 50 Arbitrage IndexLow
Low toModerate
Moderate ModeratelyHigh
High
Very High
RISKOMETER HIGHLOW
Low
Low toModerate
Moderate ModeratelyHigh
High
Very High
RISKOMETER HIGHLOW
Investors understand that their principalwill be at Low risk
NIFTY 1D Rate Index
Low
Low toModerate
Moderate ModeratelyHigh
High
Very High
RISKOMETER HIGHLOW
*Investors should consult their financial advisors if in doubt about whether the product is suitable for them. Risk-o-meter is based on evaluation of risk level of Scheme's portfolio as on 28th February 2022 and the change in Risk-o-meter will be evaluated on a monthly basis. For more details, please visit our website www.licmf.com
7
Riskometer - First Tier BenchmarkFirst Tier Benchmark Name
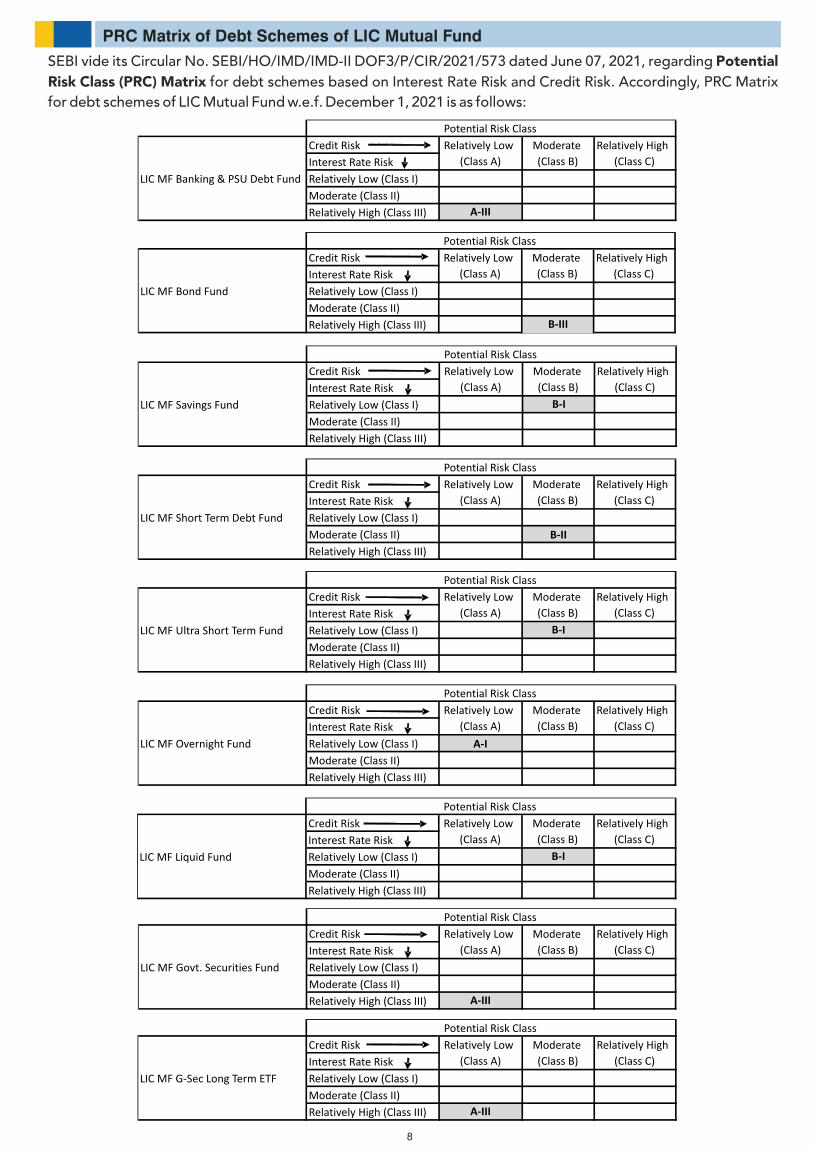
PRC Matrix of Debt Schemes of LIC Mutual Fund
SEBI vide its Circular No. SEBI/HO/IMD/IMD-II DOF3/P/CIR/2021/573 dated June 07, 2021, regarding Potential Risk Class (PRC) Matrix for debt schemes based on Interest Rate Risk and Credit Risk. Accordingly, PRC Matrix for debt schemes of LIC Mutual Fund w.e.f. December 1, 2021 is as follows:
Credit Risk
Interest Rate Risk
Relatively Low (Class I)
Moderate (Class II)
Relatively High (Class III) A-III
LIC MF Banking & PSU Debt Fund
Relatively Low
(Class A)
Moderate
(Class B)
Relatively High
(Class C)
Potential Risk Class
LIC MF Bond Fund
Credit Risk
Interest Rate Risk
Relatively Low (Class I)
Moderate (Class II)
Relatively High (Class III) B-III
Relatively Low
(Class A)
Moderate
(Class B)
Relatively High
(Class C)
Potential Risk Class
Credit Risk
Interest Rate Risk
Relatively Low (Class I) B-I
Moderate (Class II)
Relatively High (Class III)
LIC MF Savings Fund
Relatively Low
(Class A)
Moderate
(Class B)
Relatively High
(Class C)
Potential Risk Class
Credit Risk
Interest Rate Risk
Relatively Low (Class I)
Moderate (Class II) B-II
Relatively High (Class III)
LIC MF Short Term Debt Fund
Relatively Low
(Class A)
Moderate
(Class B)
Relatively High
(Class C)
Potential Risk Class
Credit Risk
Interest Rate Risk
Relatively Low (Class I) B-I
Moderate (Class II)
Relatively High (Class III)
LIC MF Ultra Short Term Fund
Relatively Low
(Class A)
Moderate
(Class B)
Relatively High
(Class C)
Potential Risk Class
Credit Risk
Interest Rate Risk
Relatively Low (Class I) A-I
Moderate (Class II)
Relatively High (Class III)
LIC MF Overnight Fund
Relatively Low
(Class A)
Moderate
(Class B)
Relatively High
(Class C)
Potential Risk Class
Credit Risk
Interest Rate Risk
Relatively Low (Class I) B-I
Moderate (Class II)
Relatively High (Class III)
LIC MF Liquid Fund
Relatively Low
(Class A)
Moderate
(Class B)
Relatively High
(Class C)
Potential Risk Class
Credit Risk
Interest Rate Risk
Relatively Low (Class I)
Moderate (Class II)
Relatively High (Class III) A-III
LIC MF Govt. Securities Fund
Relatively Low
(Class A)
Moderate
(Class B)
Relatively High
(Class C)
Potential Risk Class
Credit Risk
Interest Rate Risk
Relatively Low (Class I)
Moderate (Class II)
Relatively High (Class III) A-III
LIC MF G-Sec Long Term ETF
Relatively Low
(Class A)
Moderate
(Class B)
Relatively High
(Class C)
Potential Risk Class
8
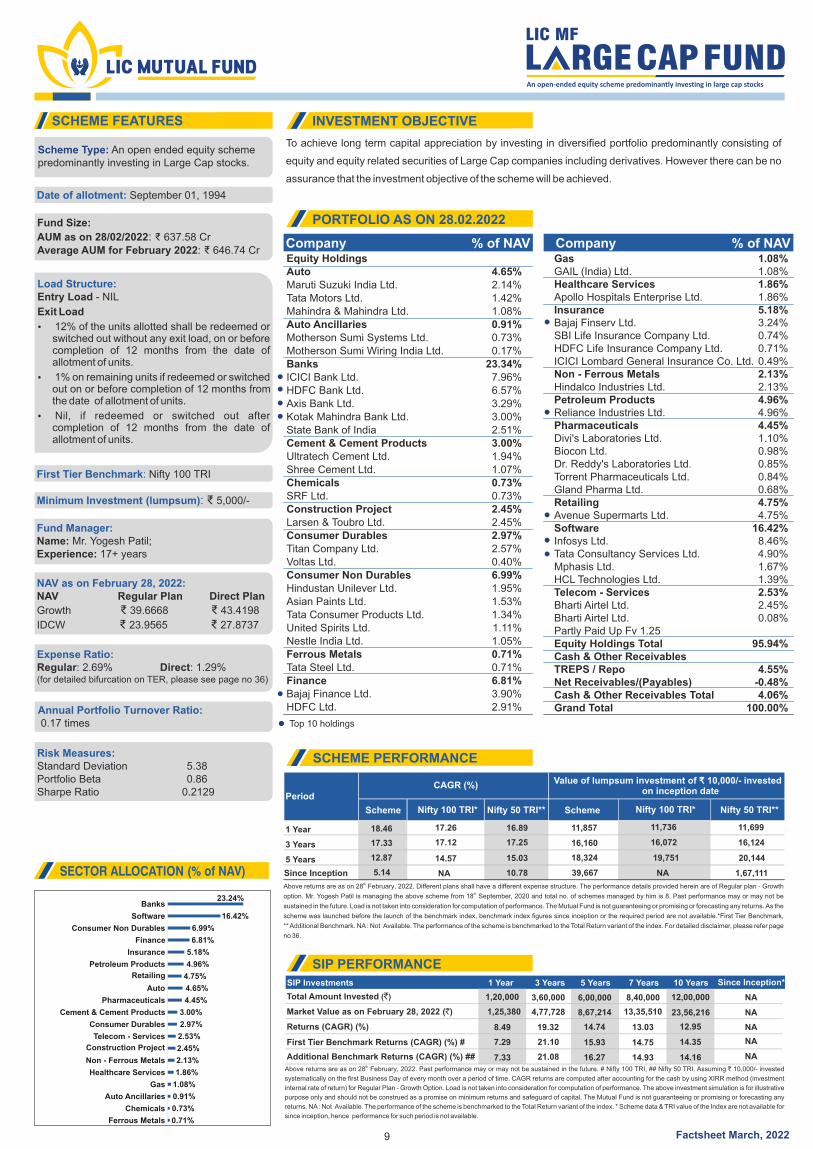
To achieve long term capital appreciation by investing in diversified portfolio predominantly consisting of
equity and equity related securities of Large Cap companies including derivatives. However there can be no
assurance that the investment objective of the scheme will be achieved.
thAbove returns are as on 28 February, 2022. Past performance may or may not be sustained in the future. # Nifty 100 TRI, ## Nifty 50 TRI. Assuming ` 10,000/- invested
systematically on the first Business Day of every month over a period of time. CAGR returns are computed after accounting for the cash by using XIRR method (investment
internal rate of return) for Regular Plan - Growth Option. Load is not taken into consideration for computation of performance. The above investment simulation is for illustrative
purpose only and should not be construed as a promise on minimum returns and safeguard of capital. The Mutual Fund is not guaranteeing or promising or forecasting any
returns. NA : Not Available. The performance of the scheme is benchmarked to the Total Return variant of the index. * Scheme data & TRI value of the Index are not available for
since inception, hence performance for such period is not available.
SCHEME PERFORMANCE
SIP PERFORMANCE
PORTFOLIO AS ON 28.02.2022
INVESTMENT OBJECTIVESCHEME FEATURES
SECTOR ALLOCATION (% of NAV)
Company % of NAV Company % of NAV
SIP Investments 1 Year 3 Years 7 Years5 Years 10 Years Since Inception*
Total Amount Invested (`) 1,20,000 3,60,000 8,40,0006,00,000 12,00,000 NA
Market Value as on February 28, 2022 (`) 1,25,380 4,77,728 8,67,214 23,56,216 NA
Returns (CAGR) (%) 8.49 19.32 13.0314.74 12.95 NA
First Tier Benchmark Returns (CAGR) (%) #
Additional Benchmark Returns (CAGR) (%) ##
7.29
7.33
21.10 14.75
21.08 14.93
15.93
16.27
14.35
14.16
NA
NA
Scheme Nifty 100 TRI* Nifty 100 TRI* Nifty 50 TRI** Nifty 50 TRI** Scheme
1 Year 18.46 17.26 16.89 11,857 11,736 11,699
3 Years 17.33 17.12 17.25 16,160 16,072 16,124
5 Years 12.87 14.57 15.03 18,324 19,751 20,144
Since Inception 5.14 NA 10.78 39,667 NA 1,67,111
CAGR (%)Value of lumpsum investment of 10,000/- invested ₹
on inception datePeriod
thAbove returns are as on 28 February, 2022. Different plans shall have a different expense structure. The performance details provided herein are of Regular plan - Growth
thoption. Mr. Yogesh Patil is managing the above scheme from 18 September, 2020 and total no. of schemes managed by him is 8. Past performance may or may not be
sustained in the future. Load is not taken into consideration for computation of performance. The Mutual Fund is not guaranteeing or promising or forecasting any returns. As the
scheme was launched before the launch of the benchmark index, benchmark index figures since inception or the required period are not available.*First Tier Benchmark,
** Additional Benchmark. NA : Not Available. The performance of the scheme is benchmarked to the Total Return variant of the index. For detailed disclaimer, please refer page
no 36.
Factsheet March, 2022
Scheme Type: An open ended equity scheme predominantly investing in Large Cap stocks.
Date of allotment: September 01, 1994
Fund Size:
AUM as on 28/02/2022: ₹ 637.58 CrAverage AUM for February 2022: ₹ 646.74 Cr
First Tier Benchmark: Nifty 100 TRI
Minimum Investment (lumpsum): ₹ 5,000/-
Fund Manager:Name: Mr. Yogesh Patil;Experience: 17+ years
NAV as on February 28, 2022:NAV Regular Plan Direct Plan
Growth ₹ 39.6668 ₹ 43.4198
IDCW ₹ 23.9565 ₹ 27.8737
Expense Ratio:Regular: 2.69% Direct: 1.29%(for detailed bifurcation on TER, please see page no 36)
Annual Portfolio Turnover Ratio: 0.17 times
Risk Measures:Standard Deviation 5.38Portfolio Beta 0.86Sharpe Ratio 0.2129
Load Structure:Entry Load - NIL
Exit Load
Ÿ 12% of the units allotted shall be redeemed or switched out without any exit load, on or before completion of 12 months from the date of allotment of units.
Ÿ 1% on remaining units if redeemed or switched out on or before completion of 12 months from the date of allotment of units.
Ÿ Nil, if redeemed or switched out after completion of 12 months from the date of allotment of units.
13,35,510
9
23.24%
16.42%
6.99%
6.81%
5.18%
4.96%
4.75%
4.65%
4.45%
3.00%
2.97%
2.53%
2.45%
2.13%
1.86%
1.08%
0.91%
0.73%
0.71%
Banks
Software
Consumer Non Durables
Finance
Pharmaceuticals
Insurance
Petroleum Products
Auto
Retailing
Cement & Cement Products
Consumer Durables
Telecom - Services
Construction Project
Non - Ferrous Metals
Healthcare Services
Gas
Auto Ancillaries
Chemicals
Ferrous Metals
Equity HoldingsAutoMaruti Suzuki India Ltd.Tata Motors Ltd.Mahindra & Mahindra Ltd.Auto AncillariesMotherson Sumi Systems Ltd.Motherson Sumi Wiring India Ltd.BanksICICI Bank Ltd.HDFC Bank Ltd.Axis Bank Ltd.Kotak Mahindra Bank Ltd.State Bank of IndiaCement & Cement ProductsUltratech Cement Ltd.Shree Cement Ltd.ChemicalsSRF Ltd.Construction ProjectLarsen & Toubro Ltd.Consumer DurablesTitan Company Ltd.Voltas Ltd.Consumer Non DurablesHindustan Unilever Ltd.Asian Paints Ltd.Tata Consumer Products Ltd.United Spirits Ltd.Nestle India Ltd.Ferrous MetalsTata Steel Ltd.FinanceBajaj Finance Ltd.HDFC Ltd.
4.65%2.14%1.42%1.08%0.91%0.73%0.17%
23.34%7.96%6.57%3.29%3.00%2.51%3.00%1.94%1.07%0.73%0.73%2.45%2.45%2.97%2.57%0.40%6.99%1.95%1.53%1.34%1.11%1.05%0.71%0.71%6.81%3.90%2.91%
GasGAIL (India) Ltd.Healthcare ServicesApollo Hospitals Enterprise Ltd.InsuranceBajaj Finserv Ltd.SBI Life Insurance Company Ltd.HDFC Life Insurance Company Ltd.ICICI Lombard General Insurance Co. Ltd.Non - Ferrous MetalsHindalco Industries Ltd.Petroleum ProductsReliance Industries Ltd.PharmaceuticalsDivi's Laboratories Ltd.Biocon Ltd.Dr. Reddy's Laboratories Ltd.Torrent Pharmaceuticals Ltd.Gland Pharma Ltd.RetailingAvenue Supermarts Ltd.SoftwareInfosys Ltd.Tata Consultancy Services Ltd.Mphasis Ltd.HCL Technologies Ltd.Telecom - ServicesBharti Airtel Ltd.Bharti Airtel Ltd. Partly Paid Up Fv 1.25Equity Holdings TotalCash & Other ReceivablesTREPS / RepoNet Receivables/(Payables)Cash & Other Receivables TotalGrand Total
1.08%1.08%1.86%1.86%5.18%3.24%0.74%0.71%0.49%2.13%2.13%4.96%4.96%4.45%1.10%0.98%0.85%0.84%0.68%4.75%4.75%
16.42%8.46%4.90%1.67%1.39%2.53%2.45%0.08%
95.94%
4.55%-0.48%4.06%
100.00%
Top 10 holdings

To generate long term capital appreciation by investing substantially in a portfolio of equity and equity linked
instruments of large cap and midcap companies.
thAbove returns are as on 28 February, 2022. Past performance may or may not be sustained in the future. # Nifty LargeMidcap 250 TRI, ## NIFTY 50 TRI. Assuming ̀ 10,000/-
invested systematically on the first Business Day of every month over a period of time. CAGR returns are computed after accounting for the cash by using XIRR method
(investment internal rate of return) for Regular Plan - Growth Option. Load is not taken into consideration for computation of performance. The above investment simulation is
for illustrative purpose only and should not be construed as a promise on minimum returns and safeguard of capital. The Mutual Fund is not guaranteeing or promising or
forecasting any returns. Since inception returns are assumed to be starting from the beginning of the subsequent month from the date of inception. The performance of the
scheme is benchmarked to the Total Return variant of the index.
SIP Investments 1 Year 3 Years 5 Years 7 Years 10 Years Since Inception
Total Amount Invested (`) 1,20,000 3,60,000 6,00,000 - - 8,40,000
Market Value as on February 28, 2022 (`) 1,27,142 5,02,573 9,00,491 - - 14,54,305
Returns (CAGR) (%) 11.31 22.98 16.27 - - 15.42
First Tier Benchmark Returns (CAGR) (%) #
Additional Benchmark Returns (CAGR) (%) ##
6.31 25.24 17.54
7.33 21.08 16.27
-
-
-
-
16.16
14.93
SCHEME FEATURES INVESTMENT OBJECTIVE
PORTFOLIO AS ON 28.02.2022
SCHEME PERFORMANCE
SIP PERFORMANCE
Company % of NAV Company % of NAV
SECTOR ALLOCATION (% of NAV)
Scheme Nifty LargeMidcap 250 TRI* Nifty LargeMidcap 250 TRI*SchemeNifty 50 TRI**
Nifty 50 TRI**
1 Year 23.02 19.50 16.89 12,316 11,962 11,699
3 Years 19.25 19.72 17.25 16,965 17,166 16,124
5 Years 14.34 15.14 15.03 19,552 20,244 20,144
Since Inception 12.93 13.11 11.10 23,466 23,733 20,919
PeriodCAGR (%)
Value of lumpsum investment of 10,000/- ₹invested on inception date
thAbove returns are as on 28 February, 2022. Different plans shall have a different expense structure. The performance details provided herein are of Regular plan - Growth th thoption. Mr. Yogesh Patil is managing the above scheme from 18 September, 2020 and total no. of schemes managed by him is 8. Date of allotment is 25 Feb’2015. Past
performance may or may not be sustained in the future. Load is not taken into consideration for computation of performance. NA : Not Available. The Mutual Fund is not
guaranteeing or promising or forecasting any returns. The performance of the scheme is benchmarked to the Total Return variant of the index. For detailed disclaimer, please
Scheme Type: An open ended equity scheme investing in both Large Cap and Mid Cap stocks
Date of Allotment: February 25, 2015
Fund Size:
AUM as on 28/02/2020: ₹ 1,565.92 Cr
: 1,589.77 CrAverage AUM for February 2022 ₹
First Tier Benchmark: Nifty LargeMidcap 250 TRI
Minimum Investment (lumpsum): ₹ 5,000/-
Fund Manager:Name: Mr. Yogesh PatilExperience: 17+ years
NAV as on February 28, 2022:NAV Regular Plan Direct Plan
Growth ₹ 23.4664 ₹ 25.7998
IDCW ₹ 20.2640 ₹ 21.7285
Expense Ratio:Regular: 2.37% Direct: 0.81%(for detailed bifurcation on TER, please see page no 36)
Annual Portfolio Turnover Ratio: 0.41 times
Risk Measures:Standard Deviation 5.77Portfolio Beta 0.86Sharpe Ratio 0.2282
Load Structure:
Entry Load - NIL
Exit Load
Ÿ 12% of the units allotted shall be redeemed or switched out without any exit load, on or before completion of 12 months from the date of allotment of units.
Ÿ 1% on remaining units if redeemed or switched out on or before completion of 12 months from the date of allotment of units.
Ÿ Nil, if redeemed or switched out after completion of 12 months from the date of allotment of units.
10
16.26%
11.32%
8.93%
6.11%
6.05%
6.04%
5.28%
4.53%
4.45%
3.98%
3.44%
2.86%
2.60%
2.14%
1.83%
1.76%
1.54%
1.49%
1.42%
1.31%
1.16%
0.91%
0.88%
Banks
Software
Chemicals
Retailing
Industrial Products
Consumer Durables
Consumer Non Durables
Pharmaceuticals
Finance
Gas
Construction
Capital Markets
Leisure Services
Petroleum Products
Telecom - Services
Fertilisers
Healthcare Services
Other Services
Textile Products
Industrial Capital Goods
Transportation
Auto Ancillaries
Pesticides
Factsheet March, 2022
Equity HoldingsAuto AncillariesWABCO India Ltd.BanksICICI Bank Ltd.HDFC Bank Ltd.Axis Bank Ltd.Kotak Mahindra Bank Ltd.State Bank of IndiaThe Federal Bank Ltd.City Union Bank Ltd.Capital MarketsICICI Securities Ltd.Nippon Life India Asset Management Ltd.ChemicalsAtul Ltd.Tata Chemicals Ltd.SRF Ltd.Linde India Ltd.Vinati Organics Ltd.Navin Fluorine International Ltd.ConstructionBrigade Enterprises Ltd.Puravankara Ltd.Ashoka Buildcon Ltd.Consumer DurablesVoltas Ltd.Crompton Greaves Cons Electrical Ltd.Whirlpool of India Ltd.Bajaj Electricals Ltd.Consumer Non DurablesTata Consumer Products Ltd.Hindustan Unilever Ltd.Kansai Nerolac Paints Ltd.3M India Ltd.FertilisersCoromandel International Ltd.FinanceBajaj Finance Ltd.Cholamandalam Financial Holdings Ltd.Shriram City Union Finance Ltd.GasGAIL (India) Ltd.Gujarat State Petronet Ltd.Gujarat Gas Ltd.Healthcare ServicesApollo Hospitals Enterprise Ltd.
0.91%0.91%
16.26%5.93%3.86%1.92%1.39%1.19%1.06%0.90%2.86%1.70%1.15%8.89%1.94%1.85%1.70%1.40%1.30%0.70%3.44%1.60%1.01%0.84%6.04%1.85%1.61%1.36%1.22%5.28%1.70%1.39%1.38%0.81%1.42%1.42%4.45%2.13%1.24%1.08%3.98%1.71%1.44%0.83%1.76%1.31%
Dr. Lal Path Labs Ltd.Industrial Capital GoodsLakshmi Machine Works Ltd.Industrial ProductsCummins India Ltd.Carborundum Universal Ltd.Schaeffler India Ltd.Supreme Industries Ltd.RHI Magnesita India Ltd.Leisure ServicesDevyani International Ltd.The Indian Hotels Company Ltd.Other ServicesQuess Corp Ltd.PesticidesAstec LifeSciences Ltd.Petroleum ProductsReliance Industries Ltd.PharmaceuticalsIPCA Laboratories Ltd.Biocon Ltd.Ajanta Pharma Ltd.Dr. Reddy's Laboratories Ltd.RetailingAvenue Supermarts Ltd.Info Edge (India) Ltd.Aditya Birla Fashion and Retail Ltd.Trent Ltd.SoftwareInfosys Ltd.Tata Consultancy Services Ltd.HCL Technologies Ltd.Mphasis Ltd.Birlasoft Ltd.Telecom - ServicesBharti Airtel Ltd.Bharti Airtel Ltd. Partly Paid Up Fv 1.25Textile ProductsPage Industries Ltd.TransportationTransport Corporation Of India Ltd.Equity Holdings TotalCash & Other ReceivablesTREPS / RepoNet Receivables/(Payables)Cash & Other Receivables TotalGrand Total
0.45%1.31%1.31%6.05%1.86%1.26%1.17%1.01%0.75%2.60%1.59%1.01%1.54%1.54%0.88%0.88%2.14%2.14%4.53%1.65%1.33%0.78%0.76%6.11%2.58%1.25%1.19%1.09%
11.32%5.31%2.74%1.46%0.98%0.83%1.83%1.77%0.06%1.49%1.49%1.16%1.16%
96.27%
4.19%-0.46%3.73%
100.00%
Top 10 holdings
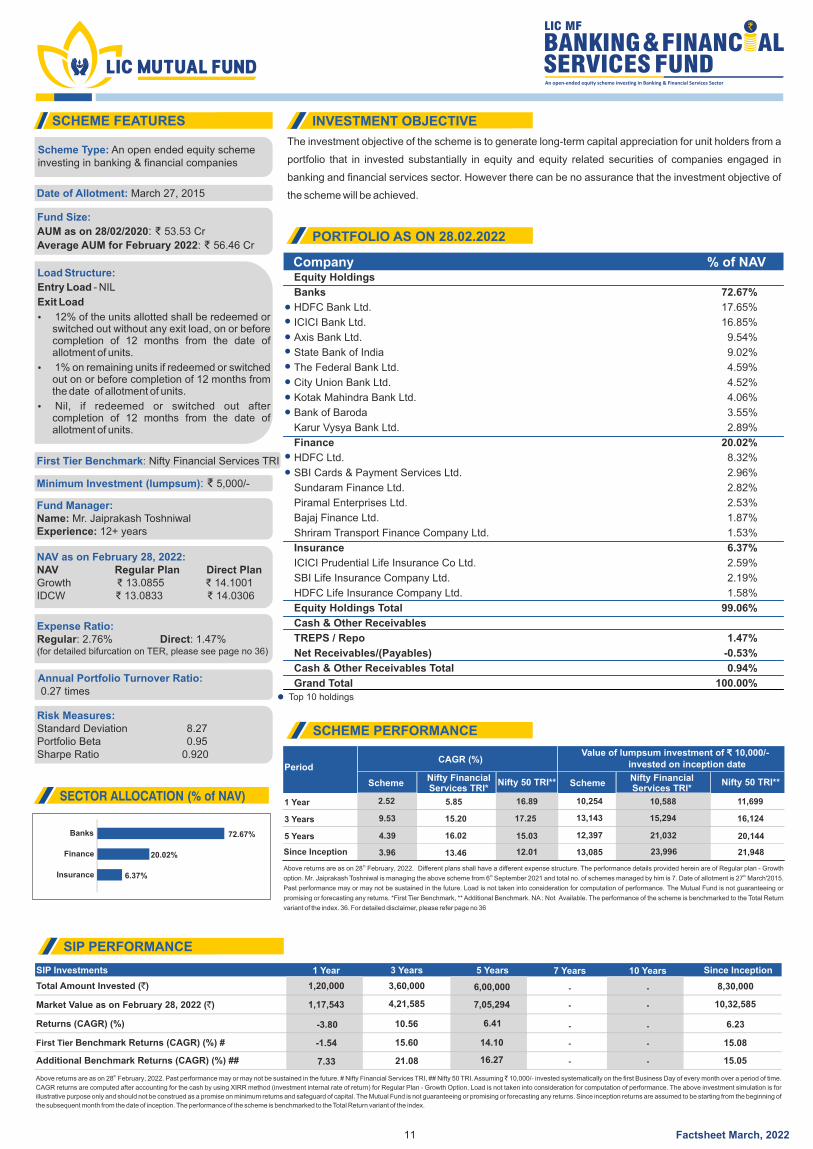
The investment objective of the scheme is to generate long-term capital appreciation for unit holders from a
portfolio that in invested substantially in equity and equity related securities of companies engaged in
banking and financial services sector. However there can be no assurance that the investment objective of
the scheme will be achieved.
SCHEME FEATURES INVESTMENT OBJECTIVE
PORTFOLIO AS ON 28.02.2022
SCHEME PERFORMANCE
Company % of NAV
SECTOR ALLOCATION (% of NAV)Scheme
Nifty Financial Services TRI*
Nifty Financial Services TRI*
Nifty 50 TRI** Nifty 50 TRI**Scheme
1 Year 2.52 5.85 16.89 10,254 10,588
23,996
11,699
21,948
3 Years 13,143 15,294 16,124
5 Years 4.39
9.53
16.02
15.20
15.03
17.25
12,397 21,032 20,144
Since Inception 3.96 13.46 12.01 13,085
PeriodCAGR (%)
Value of lumpsum investment of 10,000/-₹invested on inception date
thAbove returns are as on 28 February, 2022. Different plans shall have a different expense structure. The performance details provided herein are of Regular plan - Growth
th thoption. Mr. Jaiprakash Toshniwal is managing the above scheme from 6 September 2021 and total no. of schemes managed by him is 7. Date of allotment is 27 March'2015.
Past performance may or may not be sustained in the future. Load is not taken into consideration for computation of performance. The Mutual Fund is not guaranteeing or
promising or forecasting any returns. *First Tier Benchmark, ** Additional Benchmark. NA : Not Available. The performance of the scheme is benchmarked to the Total Return
variant of the index. 36. For detailed disclaimer, please refer page no 36
Scheme Type: An open ended equity scheme investing in banking & financial companies
Date of Allotment: March 27, 2015
Fund Size:
AUM as on 28/02/2020: ₹ 53.53 Cr
: 56.46 CrAverage AUM for February 2022 ₹
First Tier Benchmark: Nifty Financial Services TRI
Minimum Investment (lumpsum): ₹ 5,000/-
Fund Manager:Name: Mr. Jaiprakash Toshniwal
12+Experience: years
NAV as on February 28, 2022:NAV Regular Plan Direct PlanGrowth ₹ 13.0855 ₹ 14.1001IDCW ₹ 13.0833 ₹ 14.0306
Expense Ratio:Regular: 2.76% Direct: 1.47%(for detailed bifurcation on TER, please see page no 36)
Annual Portfolio Turnover Ratio: 0.27 times
Risk Measures:Standard Deviation 8.27Portfolio Beta 0.95Sharpe Ratio 0.920
thAbove returns are as on 28 February, 2022. Past performance may or may not be sustained in the future. # Nifty Financial Services TRI, ## Nifty 50 TRI. Assuming ̀ 10,000/- invested systematically on the first Business Day of every month over a period of time.
CAGR returns are computed after accounting for the cash by using XIRR method (investment internal rate of return) for Regular Plan - Growth Option. Load is not taken into consideration for computation of performance. The above investment simulation is for
illustrative purpose only and should not be construed as a promise on minimum returns and safeguard of capital. The Mutual Fund is not guaranteeing or promising or forecasting any returns. Since inception returns are assumed to be starting from the beginning of
the subsequent month from the date of inception. The performance of the scheme is benchmarked to the Total Return variant of the index.
SIP Investments 1 Year 3 Years 5 Years 10 Years7 Years Since Inception
Total Amount Invested (`) 1,20,000 3,60,000
1,17,543 4,21,585
-3.80 10.56
-1.54 15.60
7.33 21.08
6,00,000 -- 8,30,000
Market Value as on February 28, 2022 (`) 7,05,294 -- 10,32,585
Returns (CAGR) (%) 6.41 -- 6.23
First Tier Benchmark Returns (CAGR) (%) #
Additional Benchmark Returns (CAGR) (%) ##
14.10
16.27
--
--
15.08
15.05
SIP PERFORMANCE
11
Load Structure:
Entry Load - NIL
Exit Load
Ÿ 12% of the units allotted shall be redeemed or switched out without any exit load, on or before completion of 12 months from the date of allotment of units.
Ÿ 1% on remaining units if redeemed or switched out on or before completion of 12 months from the date of allotment of units.
Ÿ Nil, if redeemed or switched out after completion of 12 months from the date of allotment of units.
72.67%
20.02%
Banks
Finance
6.37%Insurance
Factsheet March, 2022
Equity Holdings
Banks
HDFC Bank Ltd.
ICICI Bank Ltd.
Axis Bank Ltd.
State Bank of India
The Federal Bank Ltd.
City Union Bank Ltd.
Kotak Mahindra Bank Ltd.
Bank of Baroda
Karur Vysya Bank Ltd.
Finance
HDFC Ltd.
SBI Cards & Payment Services Ltd.
Sundaram Finance Ltd.
Piramal Enterprises Ltd.
Bajaj Finance Ltd.
Shriram Transport Finance Company Ltd.
Insurance
ICICI Prudential Life Insurance Co Ltd.
SBI Life Insurance Company Ltd.
HDFC Life Insurance Company Ltd.
Equity Holdings Total
Cash & Other Receivables
TREPS / Repo
Net Receivables/(Payables)
Cash & Other Receivables Total
Grand Total
72.67%
17.65%
16.85%
9.54%
9.02%
4.59%
4.52%
4.06%
3.55%
2.89%
20.02%
8.32%
2.96%
2.82%
2.53%
1.87%
1.53%
6.37%
2.59%
2.19%
1.58%
99.06%
1.47%
-0.53%
0.94%
100.00%
Top 10 holdings
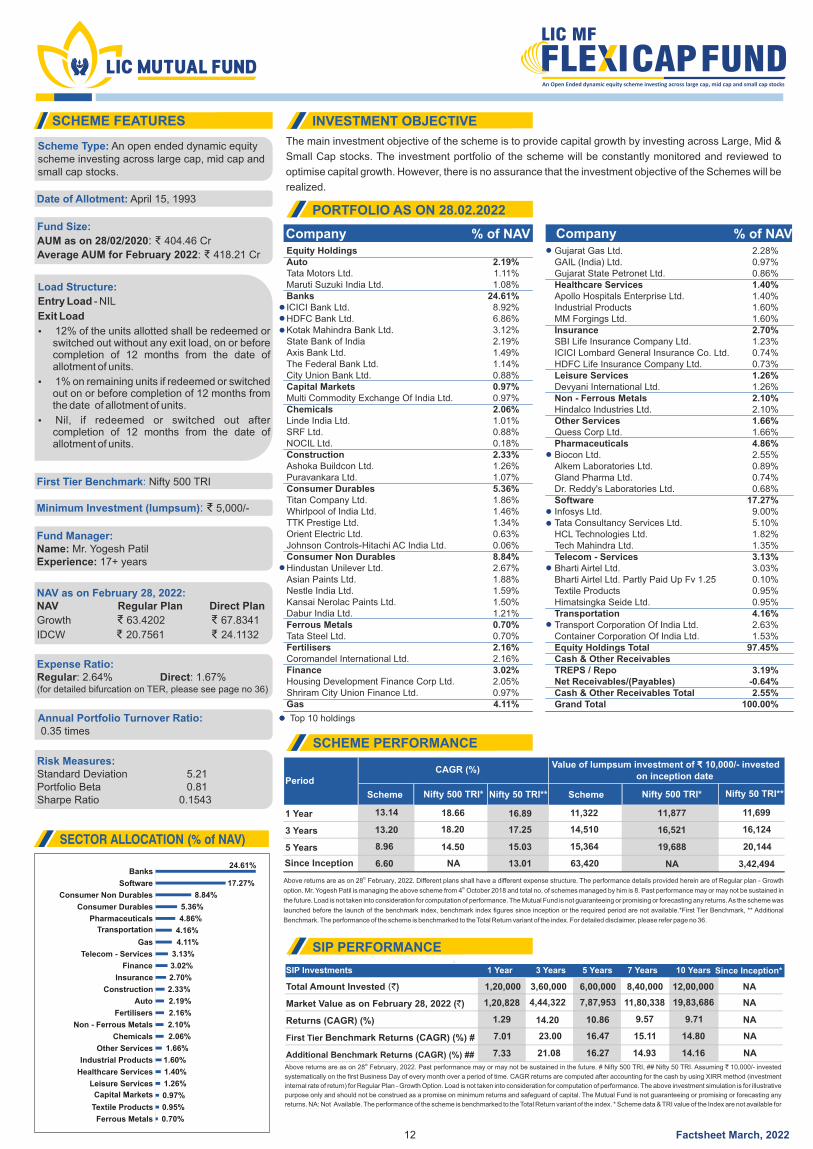
The main investment objective of the scheme is to provide capital growth by investing across Large, Mid &
Small Cap stocks. The investment portfolio of the scheme will be constantly monitored and reviewed to
optimise capital growth. However, there is no assurance that the investment objective of the Schemes will be
realized.
thAbove returns are as on 28 February, 2022. Past performance may or may not be sustained in the future. # Nifty 500 TRI, ## Nifty 50 TRI. Assuming ` 10,000/- invested
systematically on the first Business Day of every month over a period of time. CAGR returns are computed after accounting for the cash by using XIRR method (investment
internal rate of return) for Regular Plan - Growth Option. Load is not taken into consideration for computation of performance. The above investment simulation is for illustrative
purpose only and should not be construed as a promise on minimum returns and safeguard of capital. The Mutual Fund is not guaranteeing or promising or forecasting any
returns. NA: Not Available. The performance of the scheme is benchmarked to the Total Return variant of the index. * Scheme data & TRI value of the Index are not available for
SIP Investments 1 Year 3 Years 5 Years 10 Years7 Years Since Inception*
Total Amount Invested ( )` 1,20,000 3,60,000 6,00,000 12,00,0008,40,000 NA
Market Value as on February 28, 2022 ( ) ` 1,20,828 4,44,322 7,87,953 19,83,68611,80,338 NA
Returns (CAGR) (%) 1.29 14.20 10.86 9.719.57 NA
First Tier Benchmark Returns (CAGR) (%) #
Additional Benchmark Returns (CAGR) (%) ##
7.01
7.33
23.00
21.08
16.47
16.27
14.8015.11
14.1614.93
NA
NA
SCHEME FEATURES INVESTMENT OBJECTIVE
PORTFOLIO AS ON 28.02.2022
SCHEME PERFORMANCE
SIP PERFORMANCE
Company % of NAV Company % of NAV
SECTOR ALLOCATION (% of NAV)
Scheme Scheme
1 Year 13.14 18.66 16.89 11,322 11,877 11,699
3 Years 13.20 18.20 17.25 14,510 16,521 16,124
5 Years 8.96 14.50 15.03 15,364 19,688 20,144
Since Inception 6.60 NA 13.01 63,420 NA 3,42,494
PeriodCAGR (%)
Value of lumpsum investment of 10,000/- invested ₹on inception date
thAbove returns are as on 28 February, 2022. Different plans shall have a different expense structure. The performance details provided herein are of Regular plan - Growth thoption. Mr. Yogesh Patil is managing the above scheme from 4 October 2018 and total no. of schemes managed by him is 8. Past performance may or may not be sustained in
the future. Load is not taken into consideration for computation of performance. The Mutual Fund is not guaranteeing or promising or forecasting any returns. As the scheme was
launched before the launch of the benchmark index, benchmark index figures since inception or the required period are not available.*First Tier Benchmark, ** Additional
Benchmark. The performance of the scheme is benchmarked to the Total Return variant of the index. For detailed disclaimer, please refer page no 36.
Nifty 500 TRI* Nifty 500 TRI* Nifty 50 TRI** Nifty 50 TRI**
Scheme Type: An open ended dynamic equity scheme investing across large cap, mid cap andsmall cap stocks.
Date of Allotment: April 15, 1993
Fund Size:
AUM as on 28/02/2020: ₹ 404.46 Cr
: 418.21 CrAverage AUM for February 2022 ₹
First Tier Benchmark: Nifty 500 TRI
Minimum Investment (lumpsum): ₹ 5,000/-
Fund Manager:Name: Mr. Yogesh PatilExperience: years17+
NAV as on February 28, 2022:NAV Regular Plan Direct Plan
Growth ₹ 63.4202 ₹ 67.8341
IDCW ₹ 20.7561 ₹ 24.1132
Expense Ratio:Regular: 2.64% Direct: 1.67%(for detailed bifurcation on TER, please see page no 36)
Annual Portfolio Turnover Ratio: 0.35 times
Risk Measures:Standard Deviation 5.21Portfolio Beta 0.81Sharpe Ratio 0.1543
12
Load Structure:
Entry Load - NIL
Exit Load
Ÿ 12% of the units allotted shall be redeemed or switched out without any exit load, on or before completion of 12 months from the date of allotment of units.
Ÿ 1% on remaining units if redeemed or switched out on or before completion of 12 months from the date of allotment of units.
Ÿ Nil, if redeemed or switched out after completion of 12 months from the date of allotment of units.
24.61%
17.27%
8.84%
5.36%
4.86%
4.16%
4.11%
3.13%
3.02%
2.70%
2.33%
2.19%
2.16%
2.10%
2.06%
1.66%
1.60%
1.40%
1.26%
0.97%
0.95%
0.70%
Banks
Software
Consumer Non Durables
Consumer Durables
Pharmaceuticals
Transportation
Gas
Telecom - Services
Finance
Insurance
Fertilisers
Construction
Auto
Chemicals
Non - Ferrous Metals
Other Services
Leisure Services
Healthcare Services
Capital Markets
Industrial Products
Textile Products
Ferrous Metals
Factsheet March, 2022
Equity HoldingsAutoTata Motors Ltd.Maruti Suzuki India Ltd.BanksICICI Bank Ltd.HDFC Bank Ltd.Kotak Mahindra Bank Ltd.State Bank of IndiaAxis Bank Ltd.The Federal Bank Ltd.City Union Bank Ltd.Capital MarketsMulti Commodity Exchange Of India Ltd.ChemicalsLinde India Ltd.SRF Ltd.NOCIL Ltd.ConstructionAshoka Buildcon Ltd.Puravankara Ltd.Consumer DurablesTitan Company Ltd.Whirlpool of India Ltd.TTK Prestige Ltd.Orient Electric Ltd.Johnson Controls-Hitachi AC India Ltd.Consumer Non DurablesHindustan Unilever Ltd.Asian Paints Ltd.Nestle India Ltd.Kansai Nerolac Paints Ltd.Dabur India Ltd.Ferrous MetalsTata Steel Ltd.FertilisersCoromandel International Ltd.FinanceHousing Development Finance Corp Ltd.Shriram City Union Finance Ltd.Gas
2.19%1.11%1.08%
24.61%8.92%6.86%3.12%2.19%1.49%1.14%0.88%0.97%0.97%2.06%1.01%0.88%0.18%2.33%1.26%1.07%5.36%1.86%1.46%1.34%0.63%0.06%8.84%2.67%1.88%1.59%1.50%1.21%0.70%0.70%2.16%2.16%3.02%2.05%0.97%4.11%
Gujarat Gas Ltd.GAIL (India) Ltd.Gujarat State Petronet Ltd.Healthcare ServicesApollo Hospitals Enterprise Ltd.Industrial ProductsMM Forgings Ltd.InsuranceSBI Life Insurance Company Ltd.ICICI Lombard General Insurance Co. Ltd.HDFC Life Insurance Company Ltd.Leisure ServicesDevyani International Ltd.Non - Ferrous MetalsHindalco Industries Ltd.Other ServicesQuess Corp Ltd.PharmaceuticalsBiocon Ltd.Alkem Laboratories Ltd.Gland Pharma Ltd.Dr. Reddy's Laboratories Ltd.SoftwareInfosys Ltd.Tata Consultancy Services Ltd.HCL Technologies Ltd.Tech Mahindra Ltd.Telecom - ServicesBharti Airtel Ltd.Bharti Airtel Ltd. Partly Paid Up Fv 1.25Textile ProductsHimatsingka Seide Ltd.TransportationTransport Corporation Of India Ltd.Container Corporation Of India Ltd.Equity Holdings TotalCash & Other ReceivablesTREPS / RepoNet Receivables/(Payables)Cash & Other Receivables TotalGrand Total
2.28%0.97%0.86%1.40%1.40%1.60%1.60%2.70%1.23%0.74%0.73%1.26%1.26%2.10%2.10%1.66%1.66%4.86%2.55%0.89%0.74%0.68%
17.27%9.00%5.10%1.82%1.35%3.13%3.03%0.10%0.95%0.95%4.16%2.63%1.53%
97.45%
3.19%-0.64%2.55%
100.00%
Top 10 holdings
thAbove returns are as on 28 February, 2022. Past performance may or may not be sustained in the future. # Nifty 500 TRI, ## Nifty 50 TRI. Assuming ` 10,000/- invested
systematically on the first Business Day of every month over a period of time. CAGR returns are computed after accounting for the cash by using XIRR method (investment
internal rate of return) for Regular Plan - Growth Option. Load is not taken into consideration for computation of performance. The above investment simulation is for illustrative
purpose only and should not be construed as a promise on minimum returns and safeguard of capital. The Mutual Fund is not guaranteeing or promising or forecasting any
returns. NA: Not Available. The performance of the scheme is benchmarked to the Total Return variant of the index. * Scheme data & TRI value of the Index are not available for
since inception, hence performance for such period is not available.
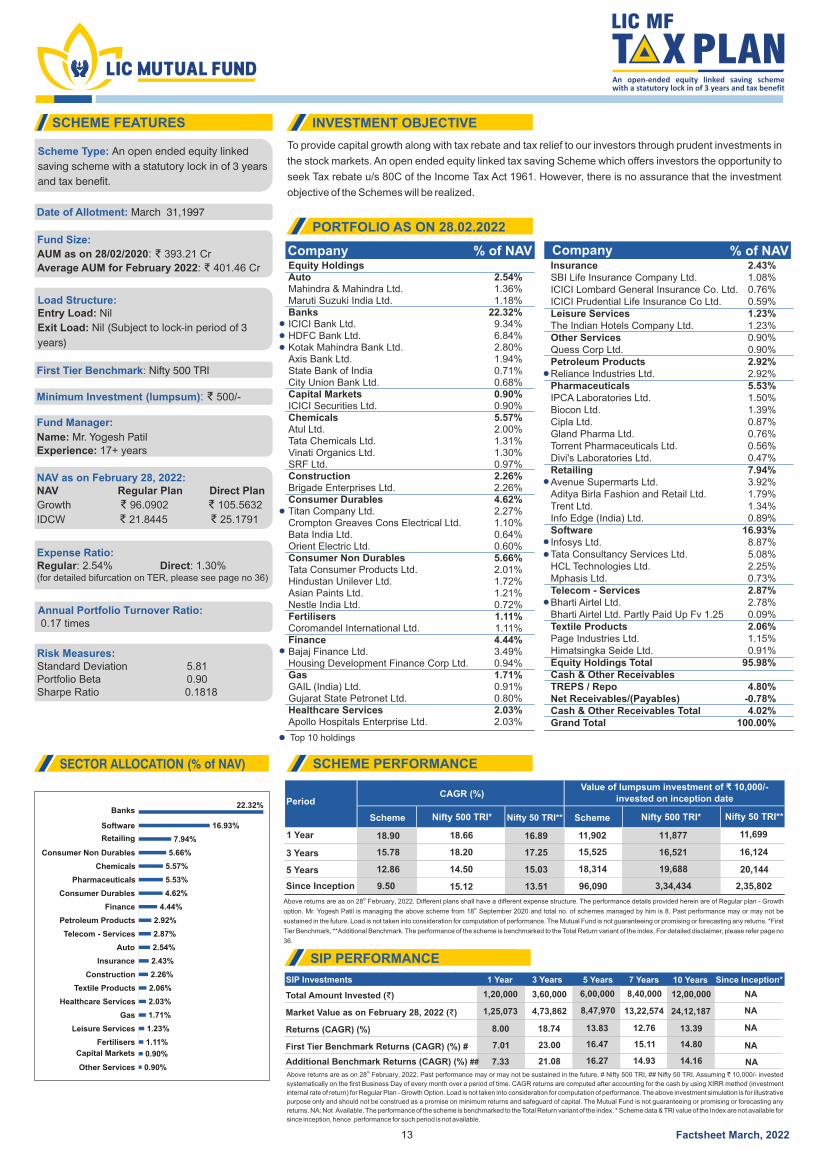
To provide capital growth along with tax rebate and tax relief to our investors through prudent investments in
the stock markets. An open ended equity linked tax saving Scheme which offers investors the opportunity to
seek Tax rebate u/s 80C of the Income Tax Act 1961. However, there is no assurance that the investment
objective of the Schemes will be realized.
SIP Investments 1 Year 3 Years 5 Years 7 Years 10 Years Since Inception*
Total Amount Invested ( )₹ 1,20,000 3,60,000 6,00,000 8,40,000 12,00,000 NA
NA
NA
NA
NA
Market Value as on February 28, 2022 ( ) ₹ 1,25,073 4,73,862 8,47,970 13,22,574 24,12,187
Returns (CAGR) (%) 8.00 18.74 13.83 12.76 13.39
First Tier Benchmark Returns (CAGR) (%) #
Additional Benchmark Returns (CAGR) (%) ##
7.01
7.33
23.00
21.08
16.47 15.11
16.27 14.93
14.80
14.16
SCHEME FEATURES INVESTMENT OBJECTIVE
PORTFOLIO AS ON 28.02.2022
SCHEME PERFORMANCE
SIP PERFORMANCE
Company % of NAV Company % of NAV
SECTOR ALLOCATION (% of NAV)
Scheme Nifty 500 TRI* Nifty 500 TRI*Nifty 50 TRI** Nifty 50 TRI**Scheme
1 Year 18.90 18.66 16.89 11,902
15,525
11,877 11,699
3 Years 15.78 18.20 17.25 16,521 16,124
5 Years 12.86 14.50 15.03 18,314 19,688 20,144
Since Inception 9.50 15.12 13.51 96,090 3,34,434 2,35,802
PeriodCAGR (%)
Value of lumpsum investment of 10,000/- ₹invested on inception date
thAbove returns are as on 28 February, 2022. Different plans shall have a different expense structure. The performance details provided herein are of Regular plan - Growth
thoption. Mr. Yogesh Patil is managing the above scheme from 18 September 2020 and total no. of schemes managed by him is 8. Past performance may or may not be
sustained in the future. Load is not taken into consideration for computation of performance. The Mutual Fund is not guaranteeing or promising or forecasting any returns. *First
Tier Benchmark, **Additional Benchmark. The performance of the scheme is benchmarked to the Total Return variant of the index. For detailed disclaimer, please refer page no
36.
Scheme Type: An open ended equity linked
saving scheme with a statutory lock in of 3 years
and tax benefit.
Date of Allotment: March 31,1997
Fund Size:
AUM as on 28/02/2020: ₹ 393.21 Cr
: 401.46 CrAverage AUM for February 2022 ₹
Load Structure:Entry Load: Nil
Exit Load: Nil (Subject to lock-in period of 3
years)
First Tier Benchmark: Nifty 500 TRI
Minimum Investment (lumpsum): ₹ 500/-
Fund Manager:
Name: Mr. Yogesh Patil
Experience: years17+
NAV as on February 28, 2022:NAV Regular Plan Direct Plan
Growth ₹ 96.0902 ₹ 105.5632
IDCW ₹ 21.8445 ₹ 25.1791
Expense Ratio:Regular: 2.54% Direct: 1.30%(for detailed bifurcation on TER, please see page no 36)
Annual Portfolio Turnover Ratio: 0.17 times
Risk Measures:Standard Deviation 5.81Portfolio Beta 0.90Sharpe Ratio 0.1818
13
22.32%
16.93%
7.94%
5.66%
5.57%
5.53%
4.62%
4.44%
2.92%
2.87%
2.54%
2.43%
2.26%
2.06%
2.03%
1.71%
1.23%
1.11%
0.90%
0.90%
Banks
Software
Retailing
Pharmaceuticals
Chemicals
Consumer Durables
Consumer Non Durables
Finance
Telecom - Services
Petroleum Products
Insurance
Auto
Construction
Healthcare Services
Textile Products
Gas
Leisure Services
Fertilisers
Capital Markets
Other Services
Factsheet March, 2022
Equity HoldingsAutoMahindra & Mahindra Ltd.Maruti Suzuki India Ltd.BanksICICI Bank Ltd.HDFC Bank Ltd.Kotak Mahindra Bank Ltd.Axis Bank Ltd.State Bank of IndiaCity Union Bank Ltd.Capital MarketsICICI Securities Ltd.ChemicalsAtul Ltd.Tata Chemicals Ltd.Vinati Organics Ltd.SRF Ltd.ConstructionBrigade Enterprises Ltd.Consumer DurablesTitan Company Ltd.Crompton Greaves Cons Electrical Ltd.Bata India Ltd.Orient Electric Ltd.Consumer Non DurablesTata Consumer Products Ltd.Hindustan Unilever Ltd.Asian Paints Ltd.Nestle India Ltd.FertilisersCoromandel International Ltd.FinanceBajaj Finance Ltd.Housing Development Finance Corp Ltd.GasGAIL (India) Ltd.Gujarat State Petronet Ltd.Healthcare ServicesApollo Hospitals Enterprise Ltd.
2.54%1.36%1.18%
22.32%9.34%6.84%2.80%1.94%0.71%0.68%0.90%0.90%5.57%2.00%1.31%1.30%0.97%2.26%2.26%4.62%2.27%1.10%0.64%0.60%5.66%2.01%1.72%1.21%0.72%1.11%1.11%4.44%3.49%0.94%1.71%0.91%0.80%2.03%2.03%
InsuranceSBI Life Insurance Company Ltd.ICICI Lombard General Insurance Co. Ltd.ICICI Prudential Life Insurance Co Ltd.Leisure ServicesThe Indian Hotels Company Ltd.Other ServicesQuess Corp Ltd.Petroleum ProductsReliance Industries Ltd.PharmaceuticalsIPCA Laboratories Ltd.Biocon Ltd.Cipla Ltd.Gland Pharma Ltd.Torrent Pharmaceuticals Ltd.Divi's Laboratories Ltd.RetailingAvenue Supermarts Ltd.Aditya Birla Fashion and Retail Ltd.Trent Ltd.Info Edge (India) Ltd.SoftwareInfosys Ltd.Tata Consultancy Services Ltd.HCL Technologies Ltd.Mphasis Ltd.Telecom - ServicesBharti Airtel Ltd.Bharti Airtel Ltd. Partly Paid Up Fv 1.25Textile ProductsPage Industries Ltd.Himatsingka Seide Ltd.Equity Holdings TotalCash & Other ReceivablesTREPS / RepoNet Receivables/(Payables)Cash & Other Receivables TotalGrand Total
2.43%1.08%0.76%0.59%1.23%1.23%0.90%0.90%2.92%2.92%5.53%1.50%1.39%0.87%0.76%0.56%0.47%7.94%3.92%1.79%1.34%0.89%
16.93%8.87%5.08%2.25%0.73%2.87%2.78%0.09%2.06%1.15%0.91%
95.98%
4.80%-0.78%4.02%
100.00%
Top 10 holdings
thAbove returns are as on 28 February, 2022. Past performance may or may not be sustained in the future. # Nifty Infrastructure TRI, ## Nifty 50 TRI. Assuming ` 10,000/-
invested systematically on the first Business Day of every month over a period of time. CAGR returns are computed after accounting for the cash by using XIRR method
(investment internal rate of return) for Regular Plan - Growth Option. Load is not taken into consideration for computation of performance. The above investment simulation is
for illustrative purpose only and should not be construed as a promise on minimum returns and safeguard of capital. The Mutual Fund is not guaranteeing or promising or
forecasting any returns. Since inception returns are assumed to be starting from the beginning of the subsequent month from the date of inception. The performance of the
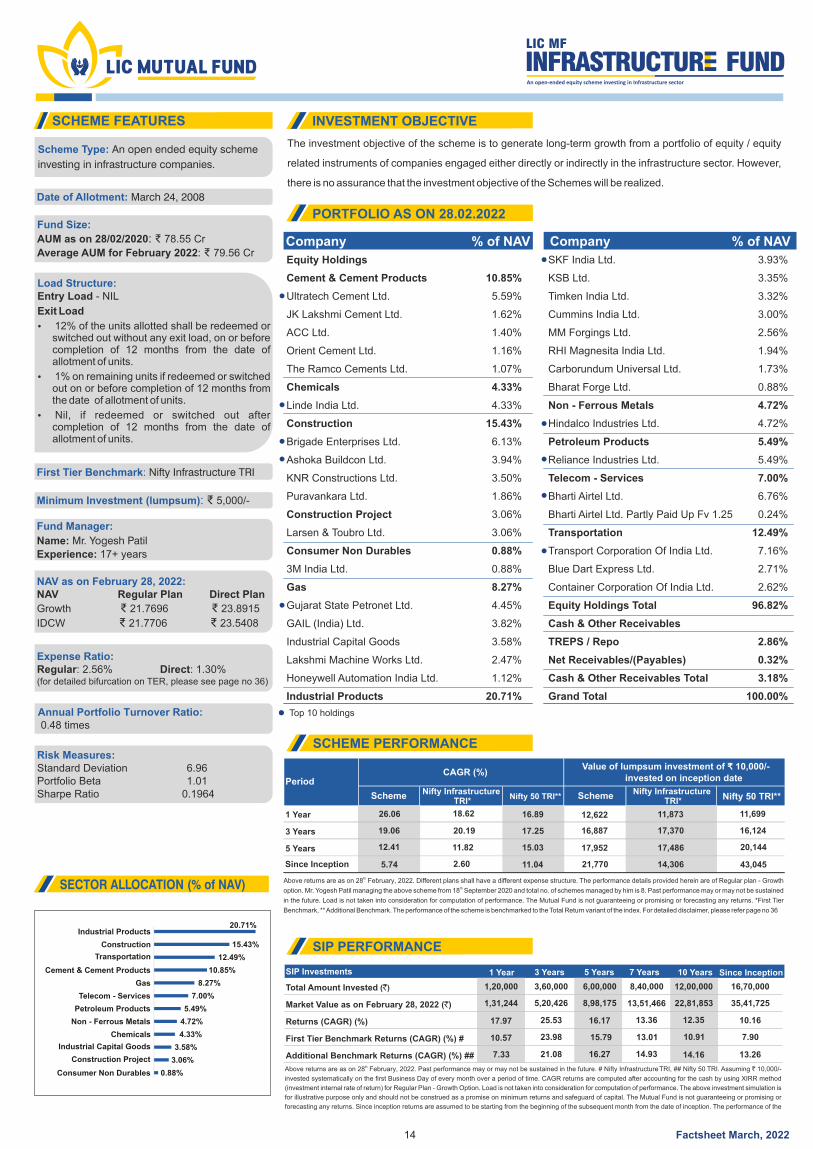
The investment objective of the scheme is to generate long-term growth from a portfolio of equity / equity
related instruments of companies engaged either directly or indirectly in the infrastructure sector. However,
there is no assurance that the investment objective of the Schemes will be realized.
SIP Investments 1 Year 3 Years 5 Years 7 Years 10 Years Since Inception
Total Amount Invested ( )` 1,20,000
1,31,244
17.97
10.57
7.33
3,60,000 6,00,000 8,40,000 16,70,00012,00,000
Market Value as on February 28, 2022 (`) 5,20,426 8,98,175 13,51,466 35,41,72522,81,853
Returns (CAGR) (%) 25.53 16.17 13.36 10.1612.35
First Tier Benchmark Returns (CAGR) (%) #
Additional Benchmark Returns (CAGR) (%) ##
23.98
21.08
15.79 13.01
16.27 14.93
7.9010.91
13.2614.16
SCHEME FEATURES INVESTMENT OBJECTIVE
PORTFOLIO AS ON 28.02.2022
SCHEME PERFORMANCE
SIP PERFORMANCE
Company % of NAV Company % of NAV
SECTOR ALLOCATION (% of NAV)
SchemeNifty Infrastructure
TRI*Nifty Infrastructure
TRI*Nifty 50 TRI** Nifty 50 TRI**Scheme
1 Year 26.06 18.62 16.89 12,622 11,873 11,699
3 Years 19.06 20.19 17.25 16,887 17,370 16,124
5 Years 12.41 11.82 15.03 17,952 17,486 20,144
Since Inception 5.74 2.60 11.04 21,770 14,306 43,045
PeriodCAGR (%)
Value of lumpsum investment of 10,000/- ₹invested on inception date
thAbove returns are as on 28 February, 2022. Different plans shall have a different expense structure. The performance details provided herein are of Regular plan - Growth thoption. Mr. Yogesh Patil managing the above scheme from 18 September 2020 and total no. of schemes managed by him is 8. Past performance may or may not be sustained
in the future. Load is not taken into consideration for computation of performance. The Mutual Fund is not guaranteeing or promising or forecasting any returns. *First Tier
Benchmark, ** Additional Benchmark. The performance of the scheme is benchmarked to the Total Return variant of the index. For detailed disclaimer, please refer page no 36
Scheme Type: An open ended equity scheme
investing in infrastructure companies.
Date of Allotment: March 24, 2008
Fund Size:
AUM as on 28/02/2020: ₹ 78.55 Cr
: 79.56 CrAverage AUM for February 2022 ₹
First Tier Benchmark: Nifty Infrastructure TRI
Minimum Investment (lumpsum): ₹ 5,000/-
Fund Manager:
Name: Mr. Yogesh Patil
Experience: years17+
NAV as on February 28, 2022:NAV Regular Plan Direct Plan
Growth ₹ 21.7696 ₹ 23.8915
IDCW ₹ 21.7706 ₹ 23.5408
Expense Ratio:Regular: 2.56% Direct: 1.30%(for detailed bifurcation on TER, please see page no 36)
Annual Portfolio Turnover Ratio: 0.48 times
Risk Measures:Standard Deviation 6.96Portfolio Beta 1.01Sharpe Ratio 0.1964
14
Load Structure:Entry Load - NIL
Exit Load
Ÿ 12% of the units allotted shall be redeemed or switched out without any exit load, on or before completion of 12 months from the date of allotment of units.
Ÿ 1% on remaining units if redeemed or switched out on or before completion of 12 months from the date of allotment of units.
Ÿ Nil, if redeemed or switched out after completion of 12 months from the date of allotment of units.
20.71%
15.43%
12.49%
10.85%
8.27%
7.00%
5.49%
4.72%
4.33%
3.58%
3.06%
0.88%
Industrial Products
Construction
Transportation
Cement & Cement Products
Gas
Petroleum Products
Telecom - Services
Non - Ferrous Metals
Chemicals
Industrial Capital Goods
Construction Project
Consumer Non Durables
Factsheet March, 2022
Equity Holdings
Cement & Cement Products
Ultratech Cement Ltd.
JK Lakshmi Cement Ltd.
ACC Ltd.
Orient Cement Ltd.
The Ramco Cements Ltd.
Chemicals
Linde India Ltd.
Construction
Brigade Enterprises Ltd.
Ashoka Buildcon Ltd.
KNR Constructions Ltd.
Puravankara Ltd.
Construction Project
Larsen & Toubro Ltd.
Consumer Non Durables
3M India Ltd.
Gas
Gujarat State Petronet Ltd.
GAIL (India) Ltd.
Industrial Capital Goods
Lakshmi Machine Works Ltd.
Honeywell Automation India Ltd.
Industrial Products
10.85%
5.59%
1.62%
1.40%
1.16%
1.07%
4.33%
4.33%
15.43%
6.13%
3.94%
3.50%
1.86%
3.06%
3.06%
0.88%
0.88%
8.27%
4.45%
3.82%
3.58%
2.47%
1.12%
20.71%
SKF India Ltd.
KSB Ltd.
Timken India Ltd.
Cummins India Ltd.
MM Forgings Ltd.
RHI Magnesita India Ltd.
Carborundum Universal Ltd.
Bharat Forge Ltd.
Non - Ferrous Metals
Hindalco Industries Ltd.
Petroleum Products
Reliance Industries Ltd.
Telecom - Services
Bharti Airtel Ltd.
Bharti Airtel Ltd. Partly Paid Up Fv 1.25
Transportation
Transport Corporation Of India Ltd.
Blue Dart Express Ltd.
Container Corporation Of India Ltd.
Equity Holdings Total
Cash & Other Receivables
TREPS / Repo
Net Receivables/(Payables)
Cash & Other Receivables Total
Grand Total
3.93%
3.35%
3.32%
3.00%
2.56%
1.94%
1.73%
0.88%
4.72%
4.72%
5.49%
5.49%
7.00%
6.76%
0.24%
12.49%
7.16%
2.71%
2.62%
96.82%
2.86%
0.32%
3.18%
100.00%
Top 10 holdings
thAbove returns are as on 28 February, 2022. Past performance may or may not be sustained in the future. # S&P BSE SENSEX TRI, ## NIFTY 50 TRI. Assuming ̀ 10,000/-
invested systematically on the first Business Day of every month over a period of time.CAGR returns are computed after accounting for the cash by using XIRR method
(investment internal rate of return) for Regular Plan - Growth Option. Load is not taken into consideration for computation of performance. The above investment simulation is
for illustrative purpose only and should not be construed as a promise on minimum returns and safeguard of capital. The Mutual Fund is not guaranteeing or promising or
forecasting any returns. Since inception returns are assumed to be starting from the beginning of the subsequent month from the date of inception. The performance of the
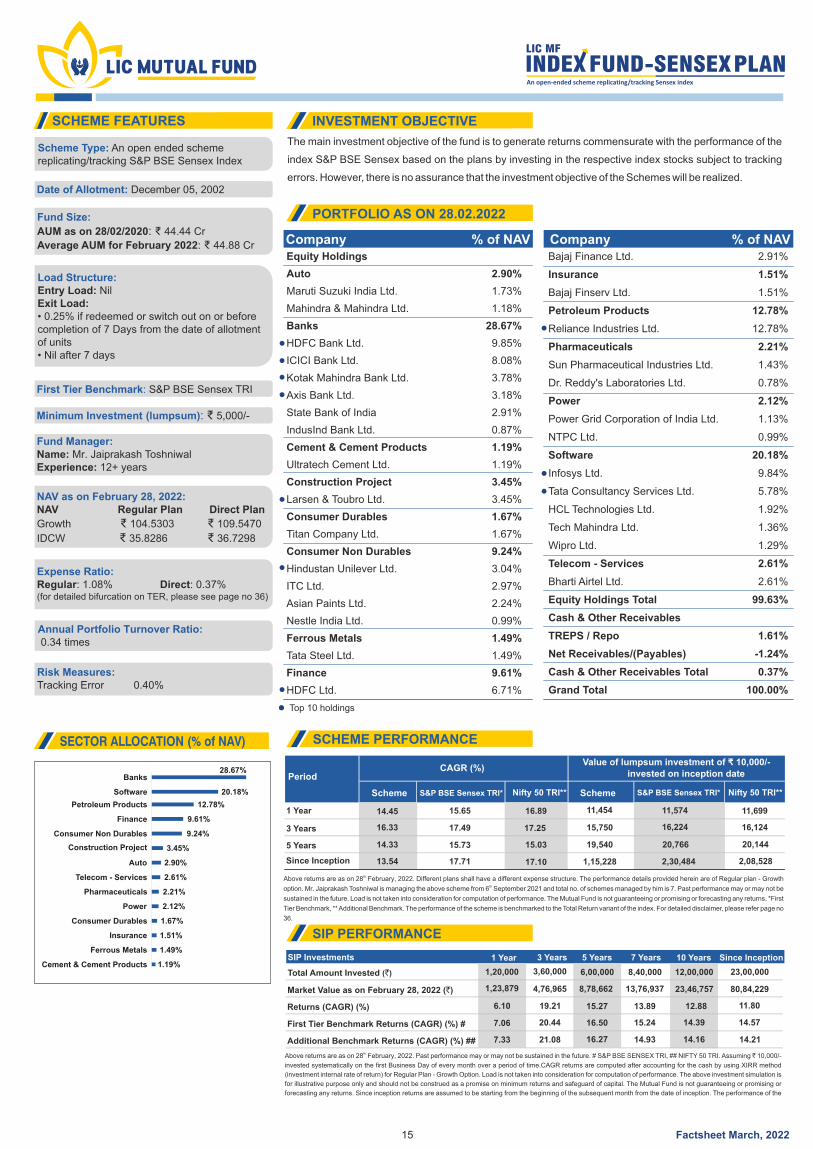
The main investment objective of the fund is to generate returns commensurate with the performance of the
index S&P BSE Sensex based on the plans by investing in the respective index stocks subject to tracking
errors. However, there is no assurance that the investment objective of the Schemes will be realized.
SIP Investments 1 Year 3 Years 5 Years 7 Years 10 Years Since Inception
Total Amount Invested ( )` 1,20,000 3,60,000 6,00,000 8,40,000 12,00,000 23,00,000
14.57
Market Value as on February 28, 2022 (`) 1,23,879 4,76,965 8,78,662 13,76,937 23,46,757 80,84,229
Returns (CAGR) (%) 6.10 19.21 15.27 13.89 12.88 11.80
First Tier Benchmark Returns (CAGR) (%) #
Additional Benchmark Returns (CAGR) (%) ##
7.06
7.33
20.44
21.08
16.50 15.24
16.27 14.93
14.39
14.2114.16
SCHEME FEATURES INVESTMENT OBJECTIVE
PORTFOLIO AS ON 28.02.2022
SCHEME PERFORMANCE
SIP PERFORMANCE
Company % of NAV Company % of NAV
SECTOR ALLOCATION (% of NAV)
Scheme S&P BSE Sensex TRI* S&P BSE Sensex TRI*Nifty 50 TRI** Nifty 50 TRI**Scheme
1 Year 14.45 15.65 16.89 11,454 11,574 11,699
3 Years 16.33 17.49 17.25 15,750 16,224 16,124
5 Years
Since Inception
14.33 15.73 15.03 19,540 20,766 20,144
13.54 17.71 17.10 1,15,228 2,30,484 2,08,528
PeriodCAGR (%)
Value of lumpsum investment of 10,000/-₹invested on inception date
thAbove returns are as on 28 February, 2022. Different plans shall have a different expense structure. The performance details provided herein are of Regular plan - Growth
thoption. Mr. Jaiprakash Toshniwal is managing the above scheme from 6 September 2021 and total no. of schemes managed by him is 7. Past performance may or may not be
sustained in the future. Load is not taken into consideration for computation of performance. The Mutual Fund is not guaranteeing or promising or forecasting any returns. *First
Tier Benchmark, ** Additional Benchmark. The performance of the scheme is benchmarked to the Total Return variant of the index. For detailed disclaimer, please refer page no
36.
Scheme Type: An open ended scheme replicating/tracking S&P BSE Sensex Index
Date of Allotment: December 05, 2002
Fund Size:
AUM as on 28/02/2020: ₹ 44.44 Cr
: 44.88 CrAverage AUM for February 2022 ₹
Load Structure:Entry Load: NilExit Load: • 0.25% if redeemed or switch out on or before completion of 7 Days from the date of allotment of units• Nil after 7 days
First Tier Benchmark: S&P BSE Sensex TRI
Minimum Investment (lumpsum): ₹ 5,000/-
Fund Manager:Name: M . r Jaiprakash ToshniwalExperience: years12+
NAV as on February 28, 2022:NAV Regular Plan Direct Plan
Growth ₹ 104.5303 ₹ 109.5470
IDCW ₹ 35.8286 ₹ 36.7298
Expense Ratio:Regular: 1.08% Direct: 0.37%(for detailed bifurcation on TER, please see page no 36)
Annual Portfolio Turnover Ratio: 0.34 times
Risk Measures:Tracking Error 0.40%
15
28.67%
20.18%
12.78%
9.61%
9.24%
3.45%
2.90%
2.61%
2.21%
2.12%
1.67%
1.51%
1.49%
1.19%
Banks
Software
Petroleum Products
Finance
Consumer Non Durables
Construction Project
Auto
Telecom - Services
Pharmaceuticals
Power
Consumer Durables
Insurance
Ferrous Metals
Cement & Cement Products
Factsheet March, 2022
Equity Holdings
Auto
Maruti Suzuki India Ltd.
Mahindra & Mahindra Ltd.
Banks
HDFC Bank Ltd.
ICICI Bank Ltd.
Kotak Mahindra Bank Ltd.
Axis Bank Ltd.
State Bank of India
IndusInd Bank Ltd.
Cement & Cement Products
Ultratech Cement Ltd.
Construction Project
Larsen & Toubro Ltd.
Consumer Durables
Titan Company Ltd.
Consumer Non Durables
Hindustan Unilever Ltd.
ITC Ltd.
Asian Paints Ltd.
Nestle India Ltd.
Ferrous Metals
Tata Steel Ltd.
Finance
HDFC Ltd.
2.90%
1.73%
1.18%
28.67%
9.85%
8.08%
3.78%
3.18%
2.91%
0.87%
1.19%
1.19%
3.45%
3.45%
1.67%
1.67%
9.24%
3.04%
2.97%
2.24%
0.99%
1.49%
1.49%
9.61%
6.71%
Bajaj Finance Ltd.
Insurance
Bajaj Finserv Ltd.
Petroleum Products
Reliance Industries Ltd.
Pharmaceuticals
Sun Pharmaceutical Industries Ltd.
Dr. Reddy's Laboratories Ltd.
Power
Power Grid Corporation of India Ltd.
NTPC Ltd.
Software
Infosys Ltd.
Tata Consultancy Services Ltd.
HCL Technologies Ltd.
Tech Mahindra Ltd.
Wipro Ltd.
Telecom - Services
Bharti Airtel Ltd.
Equity Holdings Total
Cash & Other Receivables
TREPS / Repo
Net Receivables/(Payables)
Cash & Other Receivables Total
Grand Total
2.91%
1.51%
1.51%
12.78%
12.78%
2.21%
1.43%
0.78%
2.12%
1.13%
0.99%
20.18%
9.84%
5.78%
1.92%
1.36%
1.29%
2.61%
2.61%
99.63%
1.61%
-1.24%
0.37%
100.00%
Top 10 holdings
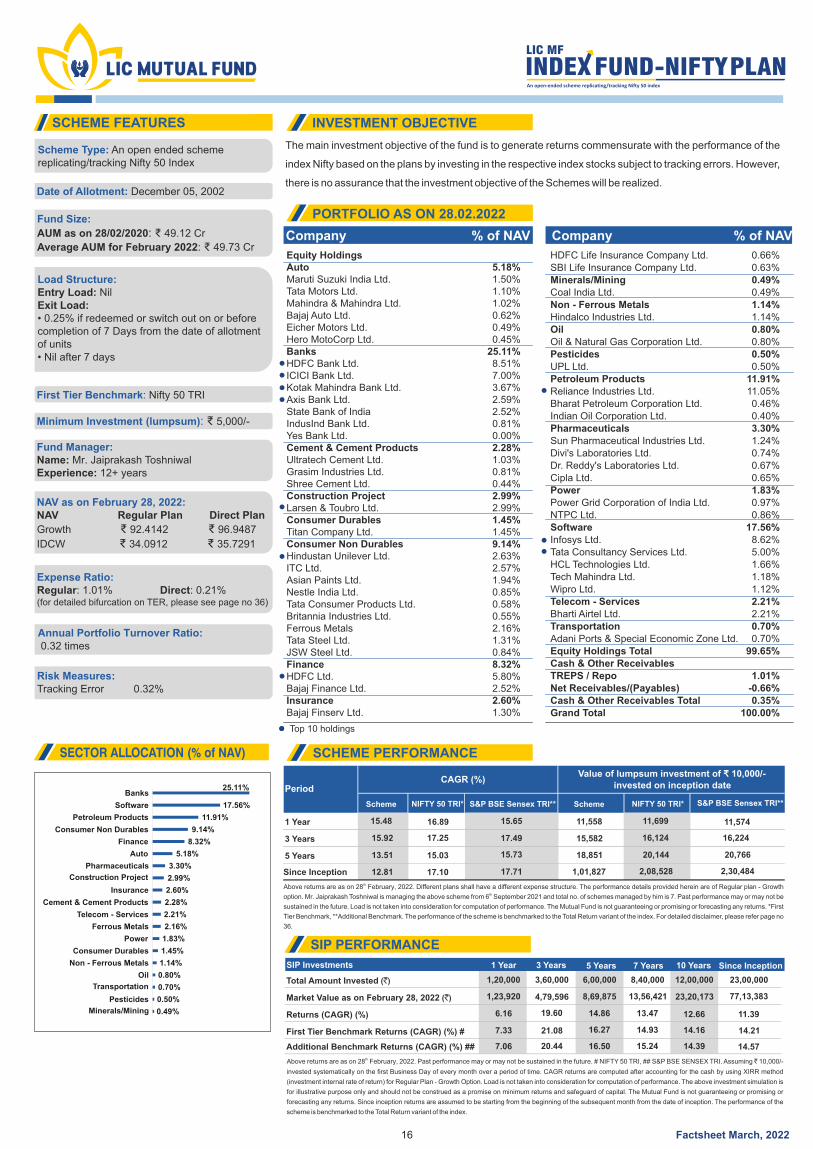
thAbove returns are as on 28 February, 2022. Past performance may or may not be sustained in the future. # NIFTY 50 TRI, ## S&P BSE SENSEX TRI. Assuming ̀ 10,000/-
invested systematically on the first Business Day of every month over a period of time. CAGR returns are computed after accounting for the cash by using XIRR method
(investment internal rate of return) for Regular Plan - Growth Option. Load is not taken into consideration for computation of performance. The above investment simulation is
for illustrative purpose only and should not be construed as a promise on minimum returns and safeguard of capital. The Mutual Fund is not guaranteeing or promising or
forecasting any returns. Since inception returns are assumed to be starting from the beginning of the subsequent month from the date of inception. The performance of the
scheme is benchmarked to the Total Return variant of the index.
The main investment objective of the fund is to generate returns commensurate with the performance of the
index Nifty based on the plans by investing in the respective index stocks subject to tracking errors. However,
there is no assurance that the investment objective of the Schemes will be realized.
SIP Investments 1 Year 3 Years 5 Years 7 Years 10 Years Since Inception
Total Amount Invested (`) 1,20,000 3,60,000 6,00,000 8,40,000 12,00,000 23,00,000
14.57
Market Value as on February 28, 2022 (`) 1,23,920 4,79,596 8,69,875 13,56,421 23,20,173 77,13,383
Returns (CAGR) (%) 6.16 19.60 14.86 13.47 12.66 11.39
First Tier Benchmark Returns (CAGR) (%) #
Additional Benchmark Returns (CAGR) (%) ##
7.33
7.06
21.08
20.44
16.27 14.93
16.50 15.24
14.16 14.21
14.39
SCHEME FEATURES INVESTMENT OBJECTIVE
PORTFOLIO AS ON 28.02.2022
SCHEME PERFORMANCE
SIP PERFORMANCE
Company % of NAV Company % of NAV
SECTOR ALLOCATION (% of NAV)
Scheme NIFTY 50 TRI* NIFTY 50 TRI*S&P BSE Sensex TRI** S&P BSE Sensex TRI**Scheme
1 Year 15.48 16.89 15.65 11,558 11,699 11,574
3 Years 15.92 17.25 17.49 15,582 16,124 16,224
5 Years 13.51 15.03 15.73 18,851 20,144 20,766
Since Inception 12.81 17.10 17.71 1,01,827 2,08,528 2,30,484
PeriodCAGR (%)
Value of lumpsum investment of 10,000/- ₹invested on inception date
thAbove returns are as on 28 February, 2022. Different plans shall have a different expense structure. The performance details provided herein are of Regular plan - Growth thoption. Mr. Jaiprakash Toshniwal is managing the above scheme from 6 September 2021 and total no. of schemes managed by him is 7. Past performance may or may not be
sustained in the future. Load is not taken into consideration for computation of performance. The Mutual Fund is not guaranteeing or promising or forecasting any returns. *First
Tier Benchmark, **Additional Benchmark. The performance of the scheme is benchmarked to the Total Return variant of the index. For detailed disclaimer, please refer page no
36.
Scheme Type: An open ended scheme replicating/tracking Nifty 50 Index
Date of Allotment: December 05, 2002
Fund Size:
AUM as on 28/02/2020: ₹ 49.12 Cr
: 49.73 CrAverage AUM for February 2022 ₹
Load Structure:Entry Load: NilExit Load: • 0.25% if redeemed or switch out on or before completion of 7 Days from the date of allotment of units• Nil after 7 days
First Tier Benchmark: Nifty 50 TRI
Minimum Investment (lumpsum): ₹ 5,000/-
Fund Manager:Name: M . r Jaiprakash ToshniwalExperience: years12+
NAV as on February 28, 2022:NAV Regular Plan Direct Plan
Growth ₹ 92.4142 ₹ 96.9487
IDCW ₹ 34.0912 ₹ 35.7291
Expense Ratio:Regular: 1.01% Direct: 0.21%(for detailed bifurcation on TER, please see page no 36)
Annual Portfolio Turnover Ratio: 0.32 times
Risk Measures:Tracking Error 0.32%
16
25.11%
17.56%
11.91%
9.14%
8.32%
5.18%
3.30%
2.99%
2.60%
2.28%
2.21%
2.16%
1.83%
1.45%
1.14%
0.80%
0.70%
0.50%
0.49%
Banks
Software
Petroleum Products
Consumer Non Durables
Finance
Auto
Pharmaceuticals
Construction Project
Insurance
Cement & Cement Products
Telecom - Services
Ferrous Metals
Power
Consumer Durables
Non - Ferrous Metals
Oil
Transportation
Pesticides
Minerals/Mining
Factsheet March, 2022
Equity HoldingsAutoMaruti Suzuki India Ltd.Tata Motors Ltd.Mahindra & Mahindra Ltd.Bajaj Auto Ltd.Eicher Motors Ltd.Hero MotoCorp Ltd.BanksHDFC Bank Ltd.ICICI Bank Ltd.Kotak Mahindra Bank Ltd.Axis Bank Ltd.State Bank of IndiaIndusInd Bank Ltd.Yes Bank Ltd.Cement & Cement ProductsUltratech Cement Ltd.Grasim Industries Ltd.Shree Cement Ltd.Construction ProjectLarsen & Toubro Ltd.Consumer DurablesTitan Company Ltd.Consumer Non DurablesHindustan Unilever Ltd.ITC Ltd.Asian Paints Ltd.Nestle India Ltd.Tata Consumer Products Ltd.Britannia Industries Ltd.Ferrous MetalsTata Steel Ltd.JSW Steel Ltd.FinanceHDFC Ltd.Bajaj Finance Ltd.InsuranceBajaj Finserv Ltd.
5.18%1.50%1.10%1.02%0.62%0.49%0.45%
25.11%8.51%7.00%3.67%2.59%2.52%0.81%0.00%2.28%1.03%0.81%0.44%2.99%2.99%1.45%1.45%9.14%2.63%2.57%1.94%0.85%0.58%0.55%2.16%1.31%0.84%8.32%5.80%2.52%2.60%1.30%
HDFC Life Insurance Company Ltd.SBI Life Insurance Company Ltd.Minerals/MiningCoal India Ltd.Non - Ferrous MetalsHindalco Industries Ltd.OilOil & Natural Gas Corporation Ltd.PesticidesUPL Ltd.Petroleum ProductsReliance Industries Ltd.Bharat Petroleum Corporation Ltd.Indian Oil Corporation Ltd.PharmaceuticalsSun Pharmaceutical Industries Ltd.Divi's Laboratories Ltd.Dr. Reddy's Laboratories Ltd.Cipla Ltd.PowerPower Grid Corporation of India Ltd.NTPC Ltd.SoftwareInfosys Ltd.Tata Consultancy Services Ltd.HCL Technologies Ltd.Tech Mahindra Ltd.Wipro Ltd.Telecom - ServicesBharti Airtel Ltd.TransportationAdani Ports & Special Economic Zone Ltd.Equity Holdings TotalCash & Other ReceivablesTREPS / RepoNet Receivables/(Payables)Cash & Other Receivables TotalGrand Total
0.66%0.63%0.49%0.49%1.14%1.14%0.80%0.80%0.50%0.50%
11.91%11.05%0.46%0.40%3.30%1.24%0.74%0.67%0.65%1.83%0.97%0.86%
17.56%8.62%5.00%1.66%1.18%1.12%2.21%2.21%0.70%0.70%
99.65%
1.01%-0.66%0.35%
100.00%
Top 10 holdings
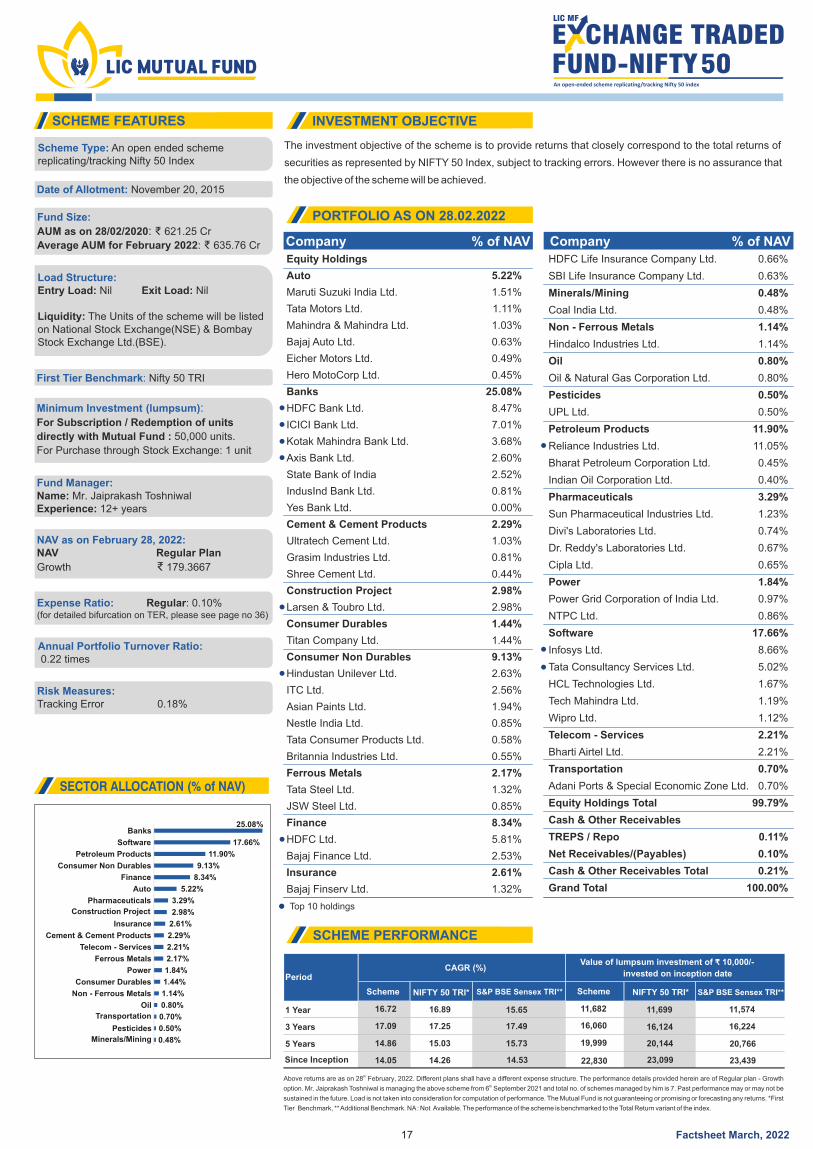
The investment objective of the scheme is to provide returns that closely correspond to the total returns of
securities as represented by NIFTY 50 Index, subject to tracking errors. However there is no assurance that
the objective of the scheme will be achieved.
SCHEME FEATURES INVESTMENT OBJECTIVE
PORTFOLIO AS ON 28.02.2022
SCHEME PERFORMANCE
Company % of NAV Company % of NAV
SECTOR ALLOCATION (% of NAV)
Scheme NIFTY 50 TRI* NIFTY 50 TRI*S&P BSE Sensex TRI** S&P BSE Sensex TRI**Scheme
1 Year 16.72
17.09
16.89
17.25
15.65
17.49
11,682
16,060
11,699
16,124
11,574
16,2243 Years
14.86 15.03 15.73 19,999 20,144 20,7665 Years
Since Inception 14.05 14.26 14.53 22,830 23,099 23,439
PeriodCAGR (%)
Value of lumpsum investment of 10,000/- ₹invested on inception date
thAbove returns are as on 28 February, 2022. Different plans shall have a different expense structure. The performance details provided herein are of Regular plan - Growth thoption. Mr. Jaiprakash Toshniwal is managing the above scheme from 6 September 2021 and total no. of schemes managed by him is 7. Past performance may or may not be
sustained in the future. Load is not taken into consideration for computation of performance. The Mutual Fund is not guaranteeing or promising or forecasting any returns. *First
Tier Benchmark, ** Additional Benchmark. NA : Not Available. The performance of the scheme is benchmarked to the Total Return variant of the index.
Scheme Type: An open ended scheme replicating/tracking Nifty 50 Index
Date of Allotment: November 20, 2015
Fund Size:
AUM as on 28/02/2020: ₹ 621.25 Cr
: 635.76 CrAverage AUM for February 2022 ₹
Load Structure:Entry Load: Exit Load: Nil Nil
Liquidity: The Units of the scheme will be listed on National Stock Exchange(NSE) & Bombay Stock Exchange Ltd.(BSE).
First Tier Benchmark: Nifty 50 TRI
Minimum Investment (lumpsum): For Subscription / Redemption of units
directly with Mutual Fund : 50,000 units.
For Purchase through Stock Exchange: 1 unit
Fund Manager:Name: M . r Jaiprakash ToshniwalExperience: years12+
NAV as on February 28, 2022:NAV Regular Plan
Growth ₹ 179.3667
Expense Ratio: Regular: 0.10%(for detailed bifurcation on TER, please see page no 36)
Annual Portfolio Turnover Ratio: 0.22 times
Risk Measures:Tracking Error 0.18%
17
25.08%
17.66%
11.90%
9.13%
8.34%
5.22%
3.29%
2.98%
2.61%
2.29%
2.21%
2.17%
1.84%
1.44%
1.14%
0.80%
0.70%
0.50%
0.48%
Banks
Software
Petroleum Products
Consumer Non Durables
Finance
Auto
Pharmaceuticals
Construction Project
Insurance
Cement & Cement Products
Telecom - Services
Ferrous Metals
Power
Consumer Durables
Non - Ferrous Metals
Oil
Transportation
Pesticides
Minerals/Mining
Factsheet March, 2022
Equity Holdings
Auto
Maruti Suzuki India Ltd.
Tata Motors Ltd.
Mahindra & Mahindra Ltd.
Bajaj Auto Ltd.
Eicher Motors Ltd.
Hero MotoCorp Ltd.
Banks
HDFC Bank Ltd.
ICICI Bank Ltd.
Kotak Mahindra Bank Ltd.
Axis Bank Ltd.
State Bank of India
IndusInd Bank Ltd.
Yes Bank Ltd.
Cement & Cement Products
Ultratech Cement Ltd.
Grasim Industries Ltd.
Shree Cement Ltd.
Construction Project
Larsen & Toubro Ltd.
Consumer Durables
Titan Company Ltd.
Consumer Non Durables
Hindustan Unilever Ltd.
ITC Ltd.
Asian Paints Ltd.
Nestle India Ltd.
Tata Consumer Products Ltd.
Britannia Industries Ltd.
Ferrous Metals
Tata Steel Ltd.
JSW Steel Ltd.
Finance
HDFC Ltd.
Bajaj Finance Ltd.
Insurance
Bajaj Finserv Ltd.
5.22%
1.51%
1.11%
1.03%
0.63%
0.49%
0.45%
25.08%
8.47%
7.01%
3.68%
2.60%
2.52%
0.81%
0.00%
2.29%
1.03%
0.81%
0.44%
2.98%
2.98%
1.44%
1.44%
9.13%
2.63%
2.56%
1.94%
0.85%
0.58%
0.55%
2.17%
1.32%
0.85%
8.34%
5.81%
2.53%
2.61%
1.32%
HDFC Life Insurance Company Ltd.
SBI Life Insurance Company Ltd.
Minerals/Mining
Coal India Ltd.
Non - Ferrous Metals
Hindalco Industries Ltd.
Oil
Oil & Natural Gas Corporation Ltd.
Pesticides
UPL Ltd.
Petroleum Products
Reliance Industries Ltd.
Bharat Petroleum Corporation Ltd.
Indian Oil Corporation Ltd.
Pharmaceuticals
Sun Pharmaceutical Industries Ltd.
Divi's Laboratories Ltd.
Dr. Reddy's Laboratories Ltd.
Cipla Ltd.
Power
Power Grid Corporation of India Ltd.
NTPC Ltd.
Software
Infosys Ltd.
Tata Consultancy Services Ltd.
HCL Technologies Ltd.
Tech Mahindra Ltd.
Wipro Ltd.
Telecom - Services
Bharti Airtel Ltd.
Transportation
Adani Ports & Special Economic Zone Ltd.
Equity Holdings Total
Cash & Other Receivables
TREPS / Repo
Net Receivables/(Payables)
Cash & Other Receivables Total
Grand Total
0.66%
0.63%
0.48%
0.48%
1.14%
1.14%
0.80%
0.80%
0.50%
0.50%
11.90%
11.05%
0.45%
0.40%
3.29%
1.23%
0.74%
0.67%
0.65%
1.84%
0.97%
0.86%
17.66%
8.66%
5.02%
1.67%
1.19%
1.12%
2.21%
2.21%
0.70%
0.70%
99.79%
0.11%
0.10%
0.21%
100.00%
Top 10 holdings
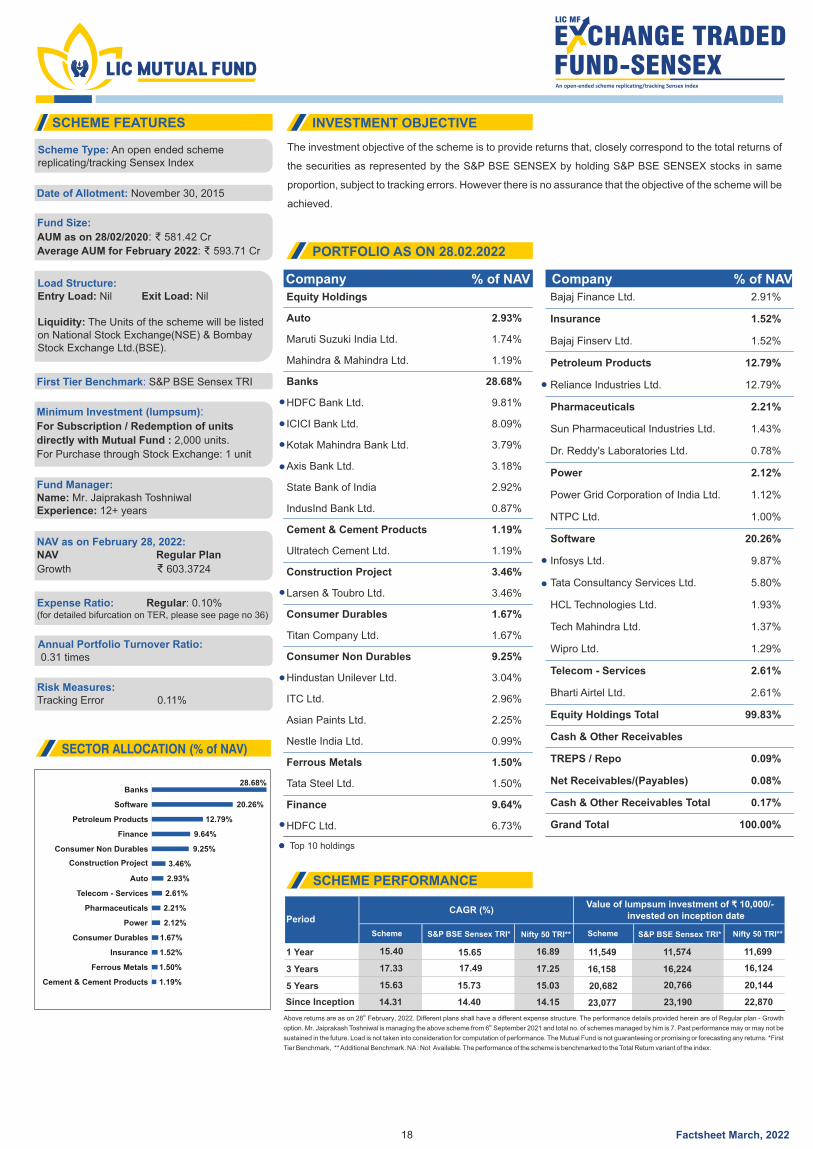
The investment objective of the scheme is to provide returns that, closely correspond to the total returns of
the securities as represented by the S&P BSE SENSEX by holding S&P BSE SENSEX stocks in same
proportion, subject to tracking errors. However there is no assurance that the objective of the scheme will be
achieved.
SCHEME FEATURES INVESTMENT OBJECTIVE
PORTFOLIO AS ON 28.02.2022
SCHEME PERFORMANCE
Company % of NAV Company % of NAV
SECTOR ALLOCATION (% of NAV)
Scheme S&P BSE Sensex TRI* S&P BSE Sensex TRI*Nifty 50 TRI** Nifty 50 TRI**Scheme
1 Year 15.40 15.65 16.89 11,549
16,158
11,574
16,224
11,699
16,1243 Years 17.33 17.49 17.25
15.63 15.73 15.03 20,682 20,766 20,1445 Years
Since Inception 14.31 14.40 14.15 23,077 23,190 22,870
PeriodCAGR (%)
Value of lumpsum investment of 10,000/-₹invested on inception date
thAbove returns are as on 28 February, 2022. Different plans shall have a different expense structure. The performance details provided herein are of Regular plan - Growth
thoption. Mr. Jaiprakash Toshniwal is managing the above scheme from 6 September 2021 and total no. of schemes managed by him is 7. Past performance may or may not be
sustained in the future. Load is not taken into consideration for computation of performance. The Mutual Fund is not guaranteeing or promising or forecasting any returns. *First
Tier Benchmark, ** Additional Benchmark. NA : Not Available. The performance of the scheme is benchmarked to the Total Return variant of the index.
Scheme Type: An open ended scheme replicating/tracking Sensex Index
Date of Allotment: November 30, 2015
Fund Size:
AUM as on 28/02/2020: ₹ 581.42 Cr
: 593.71 CrAverage AUM for February 2022 ₹
Load Structure:Entry Load: Exit Load: Nil Nil
Liquidity: The Units of the scheme will be listed on National Stock Exchange(NSE) & Bombay Stock Exchange Ltd.(BSE).
First Tier Benchmark: S&P BSE Sensex TRI
Minimum Investment (lumpsum): For Subscription / Redemption of units
directly with Mutual Fund : ,000 units.2
For Purchase through Stock Exchange: 1 unit
Fund Manager:Name: M . r Jaiprakash ToshniwalExperience: years12+
NAV as on February 28, 2022:NAV Regular Plan
Growth ₹ 603.3724
Expense Ratio: Regular: 0.10%(for detailed bifurcation on TER, please see page no 36)
Annual Portfolio Turnover Ratio: 0.31 times
Risk Measures:Tracking Error 0.11%
18
28.68%
20.26%
12.79%
9.64%
9.25%
3.46%
2.93%
2.61%
2.21%
2.12%
1.67%
1.52%
1.50%
1.19%
Banks
Software
Petroleum Products
Finance
Consumer Non Durables
Construction Project
Auto
Telecom - Services
Pharmaceuticals
Power
Consumer Durables
Insurance
Ferrous Metals
Cement & Cement Products
Factsheet March, 2022
Equity Holdings
Auto
Maruti Suzuki India Ltd.
Mahindra & Mahindra Ltd.
Banks
HDFC Bank Ltd.
ICICI Bank Ltd.
Kotak Mahindra Bank Ltd.
Axis Bank Ltd.
State Bank of India
IndusInd Bank Ltd.
Cement & Cement Products
Ultratech Cement Ltd.
Construction Project
Larsen & Toubro Ltd.
Consumer Durables
Titan Company Ltd.
Consumer Non Durables
Hindustan Unilever Ltd.
ITC Ltd.
Asian Paints Ltd.
Nestle India Ltd.
Ferrous Metals
Tata Steel Ltd.
Finance
HDFC Ltd.
2.93%
1.74%
1.19%
28.68%
9.81%
8.09%
3.79%
3.18%
2.92%
0.87%
1.19%
1.19%
3.46%
3.46%
1.67%
1.67%
9.25%
3.04%
2.96%
2.25%
0.99%
1.50%
1.50%
9.64%
6.73%
Bajaj Finance Ltd.
Insurance
Bajaj Finserv Ltd.
Petroleum Products
Reliance Industries Ltd.
Pharmaceuticals
Sun Pharmaceutical Industries Ltd.
Dr. Reddy's Laboratories Ltd.
Power
Power Grid Corporation of India Ltd.
NTPC Ltd.
Software
Infosys Ltd.
Tata Consultancy Services Ltd.
HCL Technologies Ltd.
Tech Mahindra Ltd.
Wipro Ltd.
Telecom - Services
Bharti Airtel Ltd.
Equity Holdings Total
Cash & Other Receivables
TREPS / Repo
Net Receivables/(Payables)
Cash & Other Receivables Total
Grand Total
2.91%
1.52%
1.52%
12.79%
12.79%
2.21%
1.43%
0.78%
2.12%
1.12%
1.00%
20.26%
9.87%
5.80%
1.93%
1.37%
1.29%
2.61%
2.61%
99.83%
0.09%
0.08%
0.17%
100.00%
Top 10 holdings
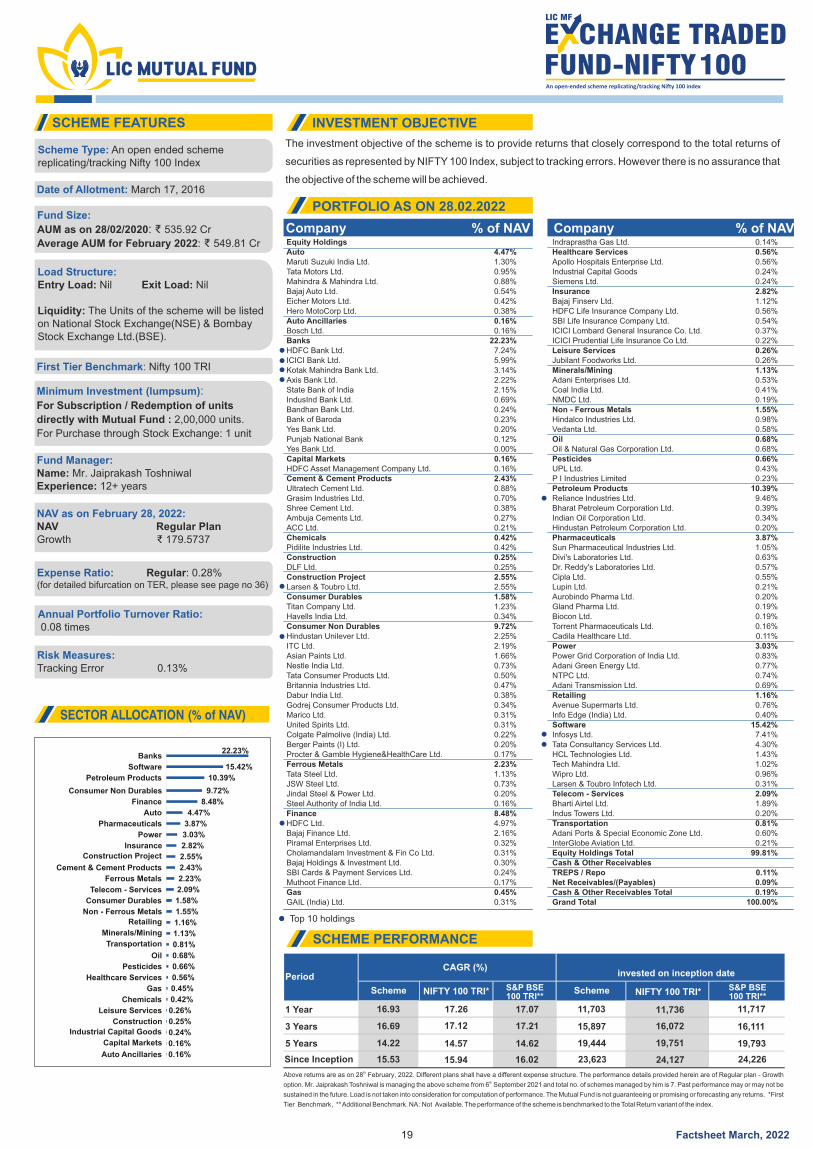
The investment objective of the scheme is to provide returns that closely correspond to the total returns of
securities as represented by NIFTY 100 Index, subject to tracking errors. However there is no assurance that
the objective of the scheme will be achieved.
SCHEME FEATURES INVESTMENT OBJECTIVE
PORTFOLIO AS ON 28.02.2022
SCHEME PERFORMANCE
Company % of NAV Company % of NAV
SECTOR ALLOCATION (% of NAV)
Scheme NIFTY 100 TRI* NIFTY 100 TRI*S&P BSE100 TRI**
Scheme
1 Year 16.93
16.69
17.26
17.12
17.07
17.21
11,703
15,897
11,736
16,072
11,717
16,1113 Years
14.22 14.57 14.62 19,444 19,751 19,7935 Years
Since Inception 15.53 15.94 16.02 23,623 24,127 24,226
PeriodCAGR (%)
invested on inception date
thAbove returns are as on 28 February, 2022. Different plans shall have a different expense structure. The performance details provided herein are of Regular plan - Growth
thoption. Mr. Jaiprakash Toshniwal is managing the above scheme from 6 September 2021 and total no. of schemes managed by him is 7. Past performance may or may not be
sustained in the future. Load is not taken into consideration for computation of performance. The Mutual Fund is not guaranteeing or promising or forecasting any returns. *First
Tier Benchmark, ** Additional Benchmark. NA : Not Available. The performance of the scheme is benchmarked to the Total Return variant of the index.
Scheme Type: An open ended scheme replicating/tracking Nifty 100 Index
Date of Allotment: March 17, 2016
Fund Size:
AUM as on 28/02/2020: ₹ 535.92 Cr
: 549.81 CrAverage AUM for February 2022 ₹
Load Structure:Entry Load: Exit Load: Nil Nil
Liquidity: The Units of the scheme will be listed on National Stock Exchange(NSE) & Bombay Stock Exchange Ltd.(BSE).
First Tier Benchmark: Nifty 100 TRI
Minimum Investment (lumpsum): For Subscription / Redemption of units
directly with Mutual Fund : 0,000 units.2,0
For Purchase through Stock Exchange: 1 unit
Fund Manager:Name: M . r Jaiprakash ToshniwalExperience: years12+
NAV as on February 28, 2022:NAV Regular Plan Growth ₹ 179.5737
Expense Ratio: Regular: 0.28%(for detailed bifurcation on TER, please see page no 36)
Annual Portfolio Turnover Ratio: 0.08 times
Risk Measures:Tracking Error 0.13%
19
S&P BSE100 TRI**
22.23%
15.42%
10.39%
9.72%
8.48%
4.47%
3.87%
3.03%
2.82%
2.55%
2.43%
2.23%
2.09%
1.58%
1.55%
1.16%
1.13%
0.81%
0.68%
0.66%
0.56%
0.45%
0.42%
0.26%
0.25%
0.24%
0.16%
0.16%
Banks
Software
Petroleum Products
Consumer Non Durables
Finance
Auto
Pharmaceuticals
Insurance
Power
Construction Project
Cement & Cement Products
Telecom - Services
Ferrous Metals
Consumer Durables
Non - Ferrous Metals
Retailing
Minerals/Mining
Transportation
Oil
Pesticides
Healthcare Services
Gas
Chemicals
Leisure Services
Construction
Industrial Capital Goods
Capital Markets
Auto Ancillaries
Factsheet March, 2022
Equity HoldingsAutoMaruti Suzuki India Ltd.Tata Motors Ltd.Mahindra & Mahindra Ltd.Bajaj Auto Ltd.Eicher Motors Ltd.Hero MotoCorp Ltd.Auto AncillariesBosch Ltd.BanksHDFC Bank Ltd.ICICI Bank Ltd.Kotak Mahindra Bank Ltd.Axis Bank Ltd.State Bank of IndiaIndusInd Bank Ltd.Bandhan Bank Ltd.Bank of BarodaYes Bank Ltd.Punjab National BankYes Bank Ltd.Capital MarketsHDFC Asset Management Company Ltd.Cement & Cement ProductsUltratech Cement Ltd.Grasim Industries Ltd.Shree Cement Ltd.Ambuja Cements Ltd.ACC Ltd.ChemicalsPidilite Industries Ltd.ConstructionDLF Ltd.Construction ProjectLarsen & Toubro Ltd.Consumer DurablesTitan Company Ltd.Havells India Ltd.Consumer Non DurablesHindustan Unilever Ltd.ITC Ltd.Asian Paints Ltd.Nestle India Ltd.Tata Consumer Products Ltd.Britannia Industries Ltd.Dabur India Ltd.Godrej Consumer Products Ltd.Marico Ltd.United Spirits Ltd.Colgate Palmolive (India) Ltd.Berger Paints (I) Ltd.Procter & Gamble Hygiene&HealthCare Ltd.Ferrous MetalsTata Steel Ltd.JSW Steel Ltd.Jindal Steel & Power Ltd.Steel Authority of India Ltd.FinanceHDFC Ltd.Bajaj Finance Ltd.Piramal Enterprises Ltd.Cholamandalam Investment & Fin Co Ltd.Bajaj Holdings & Investment Ltd.SBI Cards & Payment Services Ltd.Muthoot Finance Ltd.GasGAIL (India) Ltd.
4.47%1.30%0.95%0.88%0.54%0.42%0.38%0.16%0.16%
22.23%7.24%5.99%3.14%2.22%2.15%0.69%0.24%0.23%0.20%0.12%0.00%0.16%0.16%2.43%0.88%0.70%0.38%0.27%0.21%0.42%0.42%0.25%0.25%2.55%2.55%1.58%1.23%0.34%9.72%2.25%2.19%1.66%0.73%0.50%0.47%0.38%0.34%0.31%0.31%0.22%0.20%0.17%2.23%1.13%0.73%0.20%0.16%8.48%4.97%2.16%0.32%0.31%0.30%0.24%0.17%0.45%0.31%
Indraprastha Gas Ltd.Healthcare ServicesApollo Hospitals Enterprise Ltd.Industrial Capital GoodsSiemens Ltd.InsuranceBajaj Finserv Ltd.HDFC Life Insurance Company Ltd.SBI Life Insurance Company Ltd.ICICI Lombard General Insurance Co. Ltd.ICICI Prudential Life Insurance Co Ltd.Leisure ServicesJubilant Foodworks Ltd.Minerals/MiningAdani Enterprises Ltd.Coal India Ltd.NMDC Ltd.Non - Ferrous MetalsHindalco Industries Ltd.Vedanta Ltd.OilOil & Natural Gas Corporation Ltd.PesticidesUPL Ltd.P I Industries LimitedPetroleum ProductsReliance Industries Ltd.Bharat Petroleum Corporation Ltd.Indian Oil Corporation Ltd.Hindustan Petroleum Corporation Ltd.PharmaceuticalsSun Pharmaceutical Industries Ltd.Divi's Laboratories Ltd.Dr. Reddy's Laboratories Ltd.Cipla Ltd.Lupin Ltd.Aurobindo Pharma Ltd.Gland Pharma Ltd.Biocon Ltd.Torrent Pharmaceuticals Ltd.Cadila Healthcare Ltd.PowerPower Grid Corporation of India Ltd.Adani Green Energy Ltd.NTPC Ltd.Adani Transmission Ltd.RetailingAvenue Supermarts Ltd.Info Edge (India) Ltd.SoftwareInfosys Ltd.Tata Consultancy Services Ltd.HCL Technologies Ltd.Tech Mahindra Ltd.Wipro Ltd.Larsen & Toubro Infotech Ltd.Telecom - ServicesBharti Airtel Ltd.Indus Towers Ltd.TransportationAdani Ports & Special Economic Zone Ltd.InterGlobe Aviation Ltd.Equity Holdings TotalCash & Other ReceivablesTREPS / RepoNet Receivables/(Payables)Cash & Other Receivables TotalGrand Total
0.14%0.56%0.56%0.24%0.24%2.82%1.12%0.56%0.54%0.37%0.22%0.26%0.26%1.13%0.53%0.41%0.19%1.55%0.98%0.58%0.68%0.68%0.66%0.43%0.23%
10.39%9.46%0.39%0.34%0.20%3.87%1.05%0.63%0.57%0.55%0.21%0.20%0.19%0.19%0.16%0.11%3.03%0.83%0.77%0.74%0.69%1.16%0.76%0.40%
15.42%7.41%4.30%1.43%1.02%0.96%0.31%2.09%1.89%0.20%0.81%0.60%0.21%
99.81%
0.11%0.09%0.19%
100.00%
Top 10 holdings
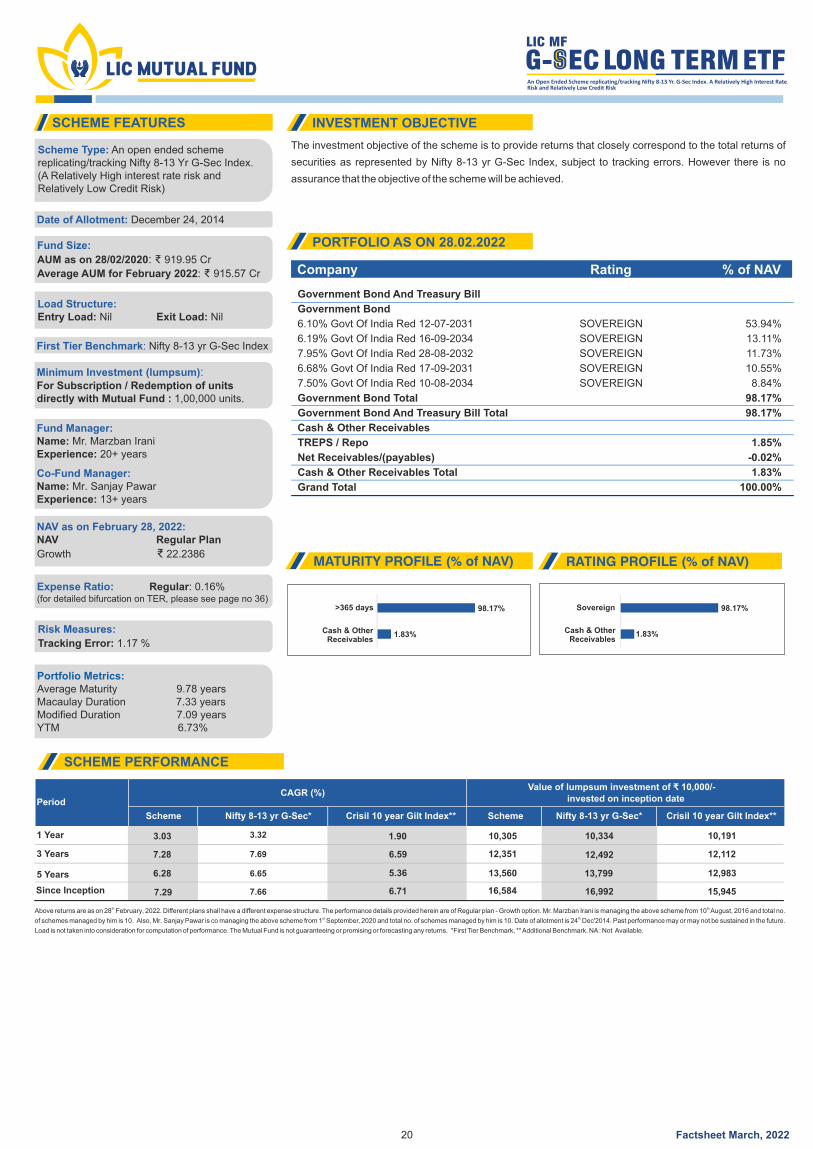
The investment objective of the scheme is to provide returns that closely correspond to the total returns of
securities as represented by Nifty 8-13 yr G-Sec Index, subject to tracking errors. However there is no
assurance that the objective of the scheme will be achieved.
Company Rating % of NAV
98.17%
1.83%
>365 days
Cash & OtherReceivables
SCHEME FEATURES INVESTMENT OBJECTIVE
PORTFOLIO AS ON 28.02.2022
SCHEME PERFORMANCE
MATURITY PROFILE (% of NAV) RATING PROFILE (% of NAV)
Scheme Nifty 8-13 yr G-Sec* Crisil 10 year Gilt Index** Crisil 10 year Gilt Index**Scheme Nifty 8-13 yr G-Sec*
1 Year 3.03 3.32 1.90 10,305 10,334 10,191
3 Years 7.28 7.69 6.59 12,351 12,492 12,112
6.28 6.65 5.36 13,560 13,799 12,983 5 Years
Since Inception 7.29 7.66 6.71 16,584 16,992 15,945
PeriodCAGR (%)
Value of lumpsum investment of 10,000/- ₹invested on inception date
th thAbove returns are as on 28 February, 2022. Different plans shall have a different expense structure. The performance details provided herein are of Regular plan - Growth option. Mr. Marzban Irani is managing the above scheme from 10 August, 2016 and total no.
st thof schemes managed by him is 10. Also, Mr. Sanjay Pawar is co managing the above scheme from 1 September, 2020 and total no. of schemes managed by him is 10. Date of allotment is 24 Dec'2014. Past performance may or may not be sustained in the future.
Load is not taken into consideration for computation of performance. The Mutual Fund is not guaranteeing or promising or forecasting any returns. *First Tier Benchmark, ** Additional Benchmark. NA : Not Available.
Scheme Type: An open ended scheme replicating/tracking Nifty 8-13 Yr G-Sec Index. (A Relatively High interest rate risk and Relatively Low Credit Risk)
Date of Allotment: December 24, 2014
Fund Size:
AUM as on 28/02/2020: ₹ 919.95 Cr
: 915.57 CrAverage AUM for February 2022 ₹
Load Structure:Entry Load: Exit Load: Nil Nil
First Tier Benchmark: Nifty 8-13 yr G-Sec Index
Minimum Investment (lumpsum):For Subscription / Redemption of units directly with Mutual Fund : 1,00,000 units.
Fund Manager:Name: Mr. Marzban IraniExperience: years20+
NAV as on February 28, 2022:NAV Regular Plan
Growth ₹ 22.2386
Expense Ratio: Regular: 0.16%(for detailed bifurcation on TER, please see page no 36)
Risk Measures:
Tracking Error: 1.17 %
Portfolio Metrics:Average Maturity 9.78 yearsMacaulay Duration 7.33 yearsModified Duration 7.09 yearsYTM 6.73%
20
Co-Fund Manager:Name: Mr. Sanjay PawarExperience: 13+ years
98.17%
1.83%
Sovereign
Cash & OtherReceivables
An Open Ended Scheme replicating/tracking Nifty 8-13 Yr. G-Sec Index. A Relatively High Interest Rate Risk and Relatively Low Credit Risk
Factsheet March, 2022
Government Bond And Treasury Bill
Government Bond
6.10% Govt Of India Red 12-07-2031
6.19% Govt Of India Red 16-09-2034
7.95% Govt Of India Red 28-08-2032
6.68% Govt Of India Red 17-09-2031
7.50% Govt Of India Red 10-08-2034
Government Bond Total
Government Bond And Treasury Bill Total
Cash & Other Receivables
TREPS / Repo
Net Receivables/(payables)
Cash & Other Receivables Total
Grand Total
SOVEREIGN
SOVEREIGN
SOVEREIGN
SOVEREIGN
SOVEREIGN
53.94%
13.11%
11.73%
10.55%
8.84%
98.17%
98.17%
1.85%
-0.02%
1.83%
100.00%
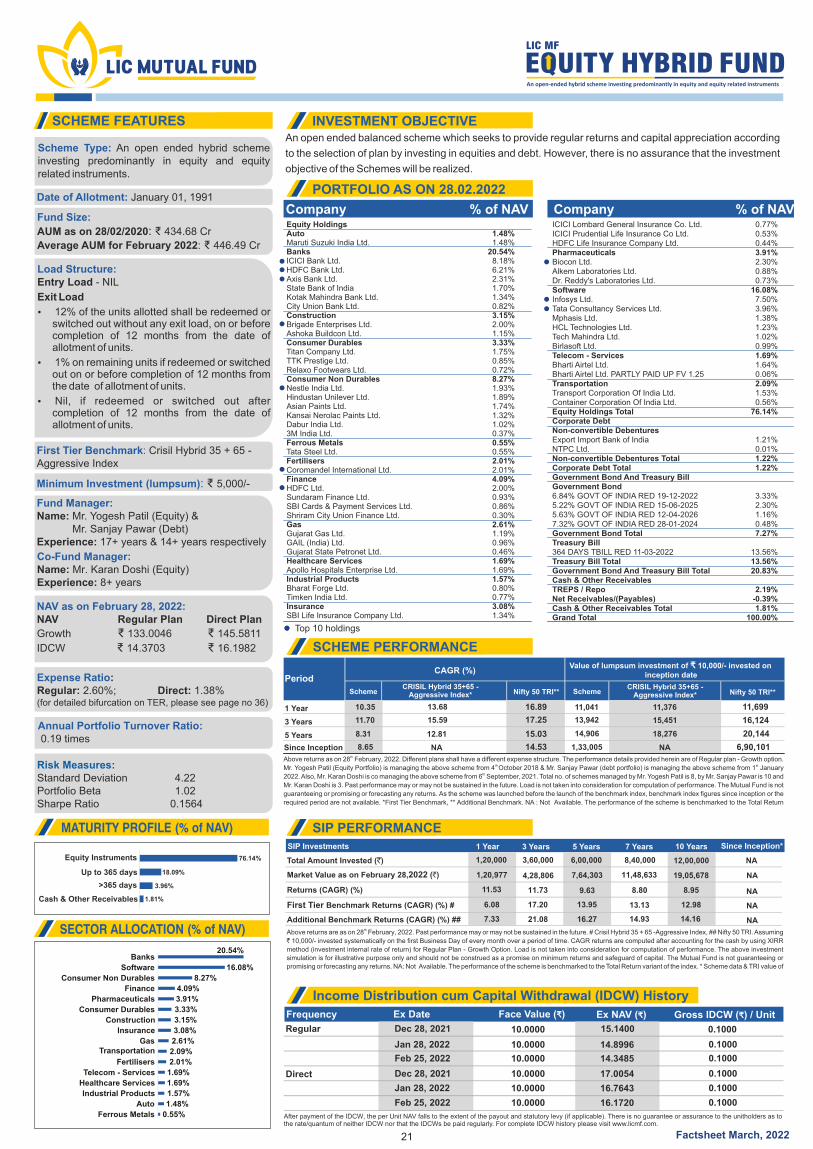
An open ended balanced scheme which seeks to provide regular returns and capital appreciation according
to the selection of plan by investing in equities and debt. However, there is no assurance that the investment
objective of the Schemes will be realized.
thAbove returns are as on 28 February, 2022. Past performance may or may not be sustained in the future. # Crisil Hybrid 35 + 65 -Aggressive Index, ## Nifty 50 TRI. Assuming
` 10,000/- invested systematically on the first Business Day of every month over a period of time. CAGR returns are computed after accounting for the cash by using XIRR
method (investment internal rate of return) for Regular Plan - Growth Option. Load is not taken into consideration for computation of performance. The above investment
simulation is for illustrative purpose only and should not be construed as a promise on minimum returns and safeguard of capital. The Mutual Fund is not guaranteeing or
promising or forecasting any returns. NA: Not Available. The performance of the scheme is benchmarked to the Total Return variant of the index. * Scheme data & TRI value of
Frequency Ex Date Face Value ( )₹ Ex NAV ( )₹ Gross IDCW ( ) / Unit₹
Regular Dec 28, 2021
Dec 28, 2021
Jan 28, 2022
Jan 28, 2022
10.0000 15.1400 0.1000
Direct
10.0000
10.0000
10.0000 17.0054
16.7643
14.8996
0.1000
0.1000
0.1000
18.09%
1.81%
3.96%
76.14%
Cash & Other Receivables
Up to 365 days
Equity Instruments
>365 days
SIP Investments 1 Year 3 Years 5 Years 7 Years 10 Years Since Inception*
Total Amount Invested (`) 1,20,000 3,60,000 6,00,000 8,40,000 12,00,000 NA
NA
NA
NA
NA
Market Value as on February 28,2022 (`) 1,20,977 4,28,806 7,64,303 11,48,633 19,05,678
Returns (CAGR) (%) 11.53 11.73 9.63 8.80 8.95
First Tier Benchmark Returns (CAGR) (%) #
Additional Benchmark Returns (CAGR) (%) ##
6.08
7.33
17.20
21.08
13.95 13.13
16.27 14.93
12.98
14.16
SCHEME FEATURES INVESTMENT OBJECTIVE
PORTFOLIO AS ON 28.02.2022
SCHEME PERFORMANCE
SIP PERFORMANCEMATURITY PROFILE (% of NAV)
Income Distribution cum Capital Withdrawal (IDCW) History
Company % of NAV Company % of NAV
SECTOR ALLOCATION (% of NAV)
SchemeCRISIL Hybrid 35+65 -
Aggressive Index*CRISIL Hybrid 35+65 -
Aggressive Index*SchemeNifty 50 TRI** Nifty 50 TRI**
1 Year 10.35 13.68 16.89 11,041 11,376 11,699
3 Years 11.70 15.59 17.25 13,942 15,451 16,124
5 Years 8.31 12.81 15.03 14,906 18,276 20,144
Since Inception 8.65 NA 14.53 1,33,005 NA 6,90,101
PeriodCAGR (%)
Value of lumpsum investment of 10,000/- invested on ₹inception date
thAbove returns as on 28 February, 2022. Different plans shall have a different expense structure. The performance details provided herein are of Regular plan - Growth option. th st
Mr. Yogesh Patil (Equity Portfolio) is managing the above scheme from 4 October 2018 & Mr. Sanjay Pawar (debt portfolio) is managing the above scheme from 1 January th
2022. Also, Mr. Karan Doshi is co managing the above scheme from 6 September, 2021. Total no. of schemes managed by Mr. Yogesh Patil is 8, by Mr. Sanjay Pawar is 10 and
Mr. Karan Doshi is 3. Past performance may or may not be sustained in the future. Load is not taken into consideration for computation of performance. The Mutual Fund is not
guaranteeing or promising or forecasting any returns. As the scheme was launched before the launch of the benchmark index, benchmark index figures since inception or the
required period are not available. *First Tier Benchmark, ** Additional Benchmark. NA : Not Available. The performance of the scheme is benchmarked to the Total Return
After payment of the IDCW, the per Unit NAV falls to the extent of the payout and statutory levy (if applicable). There is no guarantee or assurance to the unitholders as to the rate/quantum of neither IDCW nor that the IDCWs be paid regularly. For complete IDCW history please visit www.licmf.com.
Scheme Type: An open ended hybrid scheme investing predominantly in equity and equity related instruments.
Date of Allotment: January 01, 1991
Fund Size:
AUM as on 28/02/2020: ₹ 434.68 Cr
: 446.49 CrAverage AUM for February 2022 ₹
First Tier Benchmark: Crisil Hybrid 35 + 65 - Aggressive Index
Minimum Investment (lumpsum): ₹ 5,000/-
Fund Manager:Name: Mr. (Equity) &Yogesh Patil Mr. (Debt)Sanjay PawarExperience: years & years respectively17+ 14+
NAV as on February 28, 2022:NAV Regular Plan Direct Plan
Growth ₹ 133.0046 ₹ 145.5811
IDCW ₹ 14.3703 ₹ 16.1982
Expense Ratio: Regular: 2.60%; Direct: 1.38%
(for detailed bifurcation on TER, please see page no 36)
Annual Portfolio Turnover Ratio: 0.19 times
Risk Measures:Standard Deviation .4 22Portfolio Beta 1.02 Sharpe Ratio 0.1564
21
Load Structure:Entry Load - NIL
Exit Load
Ÿ 12% of the units allotted shall be redeemed or switched out without any exit load, on or before completion of 12 months from the date of allotment of units.
Ÿ 1% on remaining units if redeemed or switched out on or before completion of 12 months from the date of allotment of units.
Ÿ Nil, if redeemed or switched out after completion of 12 months from the date of allotment of units.
Co-Fund Manager:Name: Mr. Karan Doshi (Equity)Experience: 8+ years
20.54%
16.08%
8.27%
4.09%
3.91%
3.33%
3.15%
3.08%
2.61%
2.09%
2.01%
1.69%
1.69%
1.57%
1.48%
0.55%
Banks
Software
Consumer Non Durables
Pharmaceuticals
Finance
Insurance
Consumer Durables
Construction
GasTransportation
Fertilisers
Telecom - Services
Industrial Products
Auto
Healthcare Services
Ferrous Metals
Factsheet March, 2022
Feb 25, 2022 10.0000 16.1720 0.1000
Feb 25, 2022 10.0000 14.3485 0.1000
Equity HoldingsAutoMaruti Suzuki India Ltd.BanksICICI Bank Ltd.HDFC Bank Ltd.Axis Bank Ltd.State Bank of IndiaKotak Mahindra Bank Ltd.City Union Bank Ltd.ConstructionBrigade Enterprises Ltd.Ashoka Buildcon Ltd.Consumer DurablesTitan Company Ltd.TTK Prestige Ltd.Relaxo Footwears Ltd.Consumer Non DurablesNestle India Ltd.Hindustan Unilever Ltd.Asian Paints Ltd.Kansai Nerolac Paints Ltd.Dabur India Ltd.3M India Ltd.Ferrous MetalsTata Steel Ltd.FertilisersCoromandel International Ltd.FinanceHDFC Ltd.Sundaram Finance Ltd.SBI Cards & Payment Services Ltd.Shriram City Union Finance Ltd.GasGujarat Gas Ltd.GAIL (India) Ltd.Gujarat State Petronet Ltd.Healthcare ServicesApollo Hospitals Enterprise Ltd.Industrial ProductsBharat Forge Ltd.Timken India Ltd.InsuranceSBI Life Insurance Company Ltd.
1.48%1.48%
20.54%8.18%6.21%2.31%1.70%1.34%0.82%3.15%2.00%1.15%3.33%1.75%0.85%0.72%8.27%1.93%1.89%1.74%1.32%1.02%0.37%0.55%0.55%2.01%2.01%4.09%2.00%0.93%0.86%0.30%2.61%1.19%0.96%0.46%1.69%1.69%1.57%0.80%0.77%3.08%1.34%
ICICI Lombard General Insurance Co. Ltd.ICICI Prudential Life Insurance Co Ltd.HDFC Life Insurance Company Ltd.PharmaceuticalsBiocon Ltd.Alkem Laboratories Ltd.Dr. Reddy's Laboratories Ltd.SoftwareInfosys Ltd.Tata Consultancy Services Ltd.Mphasis Ltd.HCL Technologies Ltd.Tech Mahindra Ltd.Birlasoft Ltd.Telecom - ServicesBharti Airtel Ltd.Bharti Airtel Ltd. PARTLY PAID UP FV 1.25TransportationTransport Corporation Of India Ltd.Container Corporation Of India Ltd.Equity Holdings TotalCorporate DebtNon-convertible DebenturesExport Import Bank of IndiaNTPC Ltd.Non-convertible Debentures TotalCorporate Debt TotalGovernment Bond And Treasury BillGovernment Bond6.84% GOVT OF INDIA RED 19-12-20225.22% GOVT OF INDIA RED 15-06-20255.63% GOVT OF INDIA RED 12-04-20267.32% GOVT OF INDIA RED 28-01-2024Government Bond TotalTreasury Bill364 DAYS TBILL RED 11-03-2022Treasury Bill TotalGovernment Bond And Treasury Bill TotalCash & Other ReceivablesTREPS / RepoNet Receivables/(Payables)Cash & Other Receivables TotalGrand Total
0.77%0.53%0.44%3.91%2.30%0.88%0.73%
16.08%7.50%3.96%1.38%1.23%1.02%0.99%1.69%1.64%0.06%2.09%1.53%0.56%
76.14%
1.21%0.01%1.22%1.22%
3.33%2.30%1.16%0.48%7.27%
13.56%13.56%20.83%
2.19%-0.39%1.81%
100.00%
Top 10 holdings
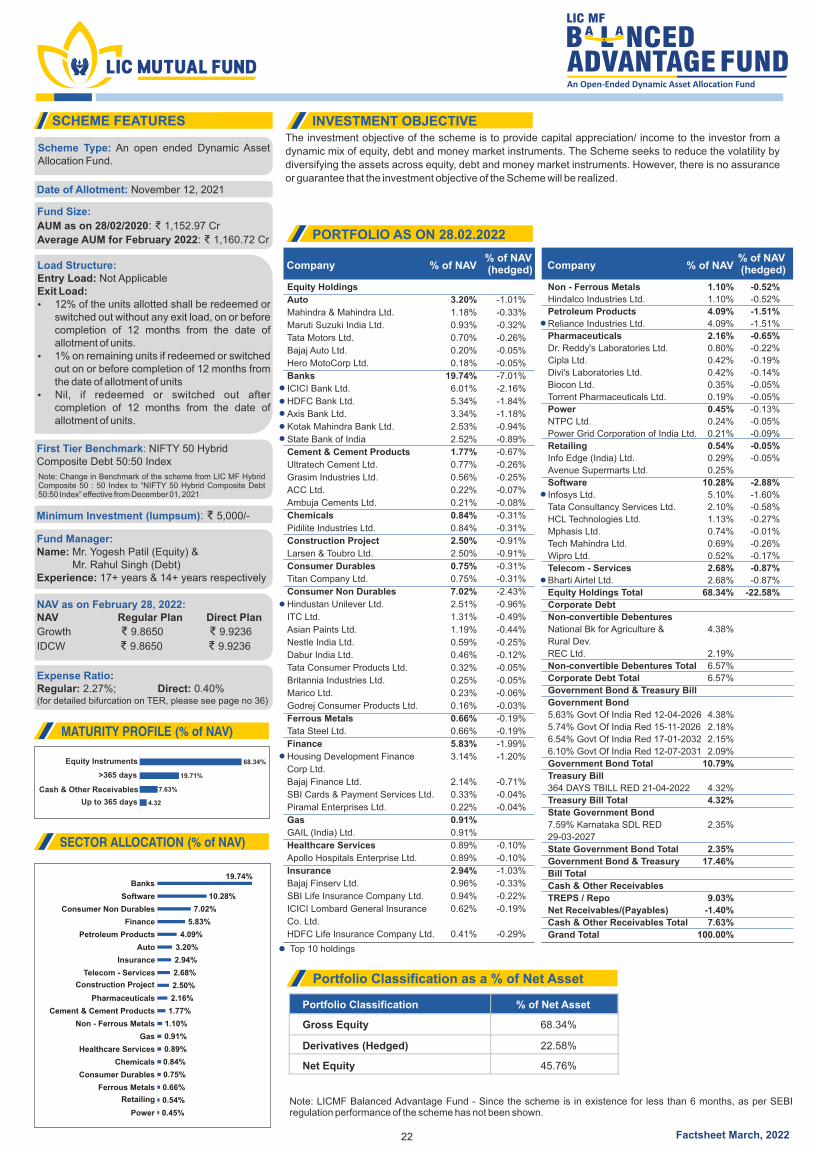
The investment objective of the scheme is to provide capital appreciation/ income to the investor from a
dynamic mix of equity, debt and money market instruments. The Scheme seeks to reduce the volatility by
diversifying the assets across equity, debt and money market instruments. However, there is no assurance
or guarantee that the investment objective of the Scheme will be realized.
19.71%
4.32
7.63%
68.34%
Cash & Other Receivables
Up to 365 days
Equity Instruments
>365 days
SCHEME FEATURES INVESTMENT OBJECTIVE
PORTFOLIO AS ON 28.02.2022
MATURITY PROFILE (% of NAV)
SECTOR ALLOCATION (% of NAV)
Scheme Type: An open ended Dynamic Asset Allocation Fund.
Date of Allotment: November 12, 2021
Fund Size:
AUM as on 28/02/2020: ₹ 1,152.97 Cr
: 1,160.72 CrAverage AUM for February 2022 ₹
First Tier Benchmark: NIFTY 50 Hybrid Composite Debt 50:50 Index
Minimum Investment (lumpsum): ₹ 5,000/-
Fund Manager:Name: Mr. (Equity) &Yogesh Patil Mr. (Debt)Rahul SinghExperience: years & years respectively17+ 14+
NAV as on February 28, 2022:NAV Regular Plan Direct Plan
Growth ₹ 9.8650 ₹ 9.9236
IDCW ₹ 9.8650 ₹ 9.9236
Expense Ratio: Regular: 2.27%; Direct: 0.40%
(for detailed bifurcation on TER, please see page no 36)
22
Load Structure:Entry Load: Not Applicable Exit Load: Ÿ 12% of the units allotted shall be redeemed or
switched out without any exit load, on or before completion of 12 months from the date of allotment of units.
Ÿ 1% on remaining units if redeemed or switched out on or before completion of 12 months from the date of allotment of units
Ÿ Nil, if redeemed or switched out after completion of 12 months from the date of allotment of units.
Note: Change in Benchmark of the scheme from LIC MF Hybrid Composite 50 : 50 Index to “NIFTY 50 Hybrid Composite Debt 50:50 Index” effective from December 01, 2021
Company Company% of NAV % of NAV% of NAV (hedged)
% of NAV (hedged)
Note: LICMF Balanced Advantage Fund - Since the scheme is in existence for less than 6 months, as per SEBI regulation performance of the scheme has not been shown.
Portfolio Classification as a % of Net Asset
Portfolio Classification
% of Net Asset
Gross Equity
68.34%
Derivatives (Hedged) 22.58%
Net Equity 45.76%
19.74%
10.28%
7.02%
5.83%
4.09%
3.20%
2.94%
2.68%
2.50%
2.16%
1.77%
1.10%
0.91%
0.89%
0.84%
0.75%
0.66%
0.54%
0.45%
Banks
Software
Consumer Non Durables
Finance
Petroleum Products
Auto
Telecom - Services
Construction Project
Insurance
Pharmaceuticals
Cement & Cement Products
Non - Ferrous Metals
Chemicals
Consumer Durables
Healthcare Services
Ferrous Metals
Retailing
Gas
Power
Factsheet March, 2022
Non - Ferrous Metals
Hindalco Industries Ltd.
Petroleum Products
Reliance Industries Ltd.
Pharmaceuticals
Dr. Reddy's Laboratories Ltd.
Cipla Ltd.
Divi's Laboratories Ltd.
Biocon Ltd.
Torrent Pharmaceuticals Ltd.
Power
NTPC Ltd.
Power Grid Corporation of India Ltd.
Retailing
Info Edge (India) Ltd.
Avenue Supermarts Ltd.
Software
Infosys Ltd.
Tata Consultancy Services Ltd.
HCL Technologies Ltd.
Mphasis Ltd.
Tech Mahindra Ltd.
Wipro Ltd.
Telecom - Services
Bharti Airtel Ltd.
Equity Holdings Total
Corporate Debt
Non-convertible Debentures
National Bk for Agriculture &
Rural Dev.
REC Ltd.
Non-convertible Debentures Total
Corporate Debt Total
Government Bond & Treasury Bill
Government Bond
5.63% Govt Of India Red 12-04-2026
5.74% Govt Of India Red 15-11-2026
6.54% Govt Of India Red 17-01-2032
6.10% Govt Of India Red 12-07-2031
Government Bond Total
Treasury Bill
364 DAYS TBILL RED 21-04-2022
Treasury Bill Total
State Government Bond
7.59% Karnataka SDL RED
29-03-2027
State Government Bond Total
Government Bond & Treasury
Bill Total
Cash & Other Receivables
TREPS / Repo
Net Receivables/(Payables)
Cash & Other Receivables Total
Grand Total
Equity Holdings
Auto
Mahindra & Mahindra Ltd.
Maruti Suzuki India Ltd.
Tata Motors Ltd.
Bajaj Auto Ltd.
Hero MotoCorp Ltd.
Banks
ICICI Bank Ltd.
HDFC Bank Ltd.
Axis Bank Ltd.
Kotak Mahindra Bank Ltd.
State Bank of India
Cement & Cement Products
Ultratech Cement Ltd.
Grasim Industries Ltd.
ACC Ltd.
Ambuja Cements Ltd.
Chemicals
Pidilite Industries Ltd.
Construction Project
Larsen & Toubro Ltd.
Consumer Durables
Titan Company Ltd.
Consumer Non Durables
Hindustan Unilever Ltd.
ITC Ltd.
Asian Paints Ltd.
Nestle India Ltd.
Dabur India Ltd.
Tata Consumer Products Ltd.
Britannia Industries Ltd.
Marico Ltd.
Godrej Consumer Products Ltd.
Ferrous Metals
Tata Steel Ltd.
Finance
Housing Development Finance
Corp Ltd.
Bajaj Finance Ltd.
SBI Cards & Payment Services Ltd.
Piramal Enterprises Ltd.
Gas
GAIL (India) Ltd.
Healthcare Services
Apollo Hospitals Enterprise Ltd.
Insurance
Bajaj Finserv Ltd.
SBI Life Insurance Company Ltd.
ICICI Lombard General Insurance
Co. Ltd.
HDFC Life Insurance Company Ltd.
3.20%
1.18%
0.93%
0.70%
0.20%
0.18%
19.74%
6.01%
5.34%
3.34%
2.53%
2.52%
1.77%
0.77%
0.56%
0.22%
0.21%
0.84%
0.84%
2.50%
2.50%
0.75%
0.75%
7.02%
2.51%
1.31%
1.19%
0.59%
0.46%
0.32%
0.25%
0.23%
0.16%
0.66%
0.66%
5.83%
3.14%
2.14%
0.33%
0.22%
0.91%
0.91%
0.89%
0.89%
2.94%
0.96%
0.94%
0.62%
0.41%
-1.01%
-0.33%
-0.32%
-0.26%
-0.05%
-0.05%
-7.01%
-2.16%
-1.84%
-1.18%
-0.94%
-0.89%
-0.67%
-0.26%
-0.25%
-0.07%
-0.08%
-0.31%
-0.31%
-0.91%
-0.91%
-0.31%
-0.31%
-2.43%
-0.96%
-0.49%
-0.44%
-0.25%
-0.12%
-0.05%
-0.05%
-0.06%
-0.03%
-0.19%
-0.19%
-1.99%
-1.20%
-0.71%
-0.04%
-0.04%
-0.10%
-0.10%
-1.03%
-0.33%
-0.22%
-0.19%
-0.29%
1.10%
1.10%
4.09%
4.09%
2.16%
0.80%
0.42%
0.42%
0.35%
0.19%
0.45%
0.24%
0.21%
0.54%
0.29%
0.25%
10.28%
5.10%
2.10%
1.13%
0.74%
0.69%
0.52%
2.68%
2.68%
68.34%
4.38%
2.19%
6.57%
6.57%
4.38%
2.18%
2.15%
2.09%
10.79%
4.32%
4.32%
2.35%
2.35%
17.46%
9.03%
-1.40%
7.63%
100.00%
-0.52%
-0.52%
-1.51%
-1.51%
-0.65%
-0.22%
-0.19%
-0.14%
-0.05%
-0.05%
-0.13%
-0.05%
-0.09%
-0.05%
-0.05%
-2.88%
-1.60%
-0.58%
-0.27%
-0.01%
-0.26%
-0.17%
-0.87%
-0.87%
-22.58%
Top 10 holdings
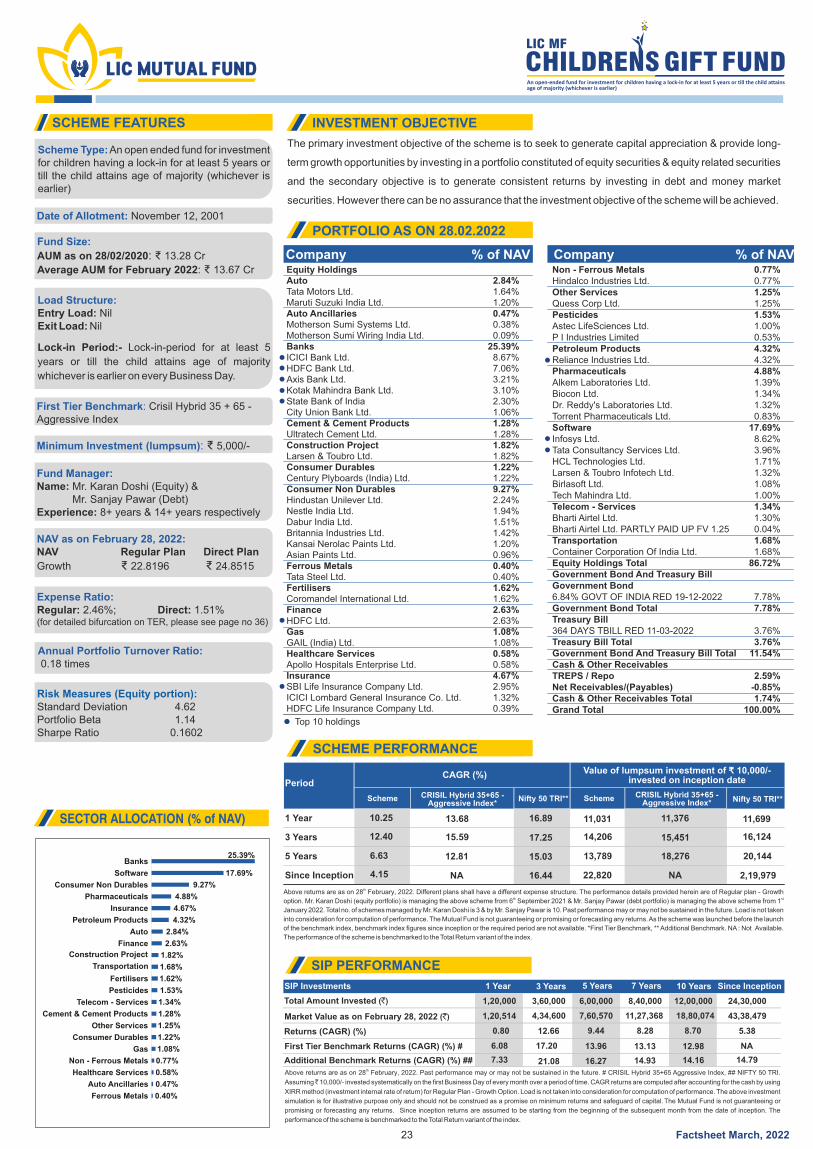
The primary investment objective of the scheme is to seek to generate capital appreciation & provide long-
term growth opportunities by investing in a portfolio constituted of equity securities & equity related securities
and the secondary objective is to generate consistent returns by investing in debt and money market
securities. However there can be no assurance that the investment objective of the scheme will be achieved.
SCHEME FEATURES INVESTMENT OBJECTIVE
PORTFOLIO AS ON 28.02.2022
SCHEME PERFORMANCE
SECTOR ALLOCATION (% of NAV)
Scheme CRISIL Hybrid 35+65 - Aggressive Index*
CRISIL Hybrid 35+65 - Aggressive Index*
SchemeNifty 50 TRI** Nifty 50 TRI**
1 Year 10.25 13.68 16.89 11,031 11,376 11,699
3 Years 12.40 15.59 17.25 14,206 15,451 16,124
5 Years 6.63 12.81 15.03 13,789 18,276 20,144
Since Inception 4.15 NA 16.44 22,820 NA 2,19,979
PeriodCAGR (%) Value of lumpsum investment of 10,000/- ₹
invested on inception date
thAbove returns are as on 28 February, 2022. Different plans shall have a different expense structure. The performance details provided herein are of Regular plan - Growth
th st option. Mr. Karan Doshi (equity portfolio) is managing the above scheme from 6 September 2021 & Mr. Sanjay Pawar (debt portfolio) is managing the above scheme from 1
January 2022. Total no. of schemes managed by Mr. Karan Doshi is 3 & by Mr. Sanjay Pawar is 10. Past performance may or may not be sustained in the future. Load is not taken
into consideration for computation of performance. The Mutual Fund is not guaranteeing or promising or forecasting any returns. As the scheme was launched before the launch
of the benchmark index, benchmark index figures since inception or the required period are not available. *First Tier Benchmark, ** Additional Benchmark. NA : Not Available.
The performance of the scheme is benchmarked to the Total Return variant of the index.
Scheme Type: An open ended fund for investment for children having a lock-in for at least 5 years or till the child attains age of majority (whichever is earlier)
Date of Allotment: November 12, 2001
Fund Size:
AUM as on 28/02/2020: ₹ 13.28 Cr
: 13.67 CrAverage AUM for February 2022 ₹
Load Structure:Entry Load: NilExit Load: Nil
Lock-in Period:- Lock-in-period for at least 5
years or till the child attains age of majority
whichever is earlier on every Business Day.
First Tier Benchmark: Crisil Hybrid 35 + 65 - Aggressive Index
Minimum Investment (lumpsum): ₹ 5,000/-
Fund Manager:Name: Mr. (Equity) &Karan Doshi Mr. (Debt)Sanjay PawarExperience: years & years respectively8+ 14+
NAV as on February 28, 2022:NAV Regular Plan Direct Plan
Growth ₹ 22.8196 ₹ 24.8515
Expense Ratio: Regular: 2.46%; Direct: 1.51%
(for detailed bifurcation on TER, please see page no 36)
Annual Portfolio Turnover Ratio: 0.18 times
Risk Measures (Equity portion):Standard Deviation 4.62
1 14Portfolio Beta .Sharpe Ratio 0.1 602
Company % of NAV Company % of NAV
23
thAbove returns are as on 28 February, 2022. Past performance may or may not be sustained in the future. # CRISIL Hybrid 35+65 Aggressive Index, ## NIFTY 50 TRI.
Assuming ̀ 10,000/- invested systematically on the first Business Day of every month over a period of time. CAGR returns are computed after accounting for the cash by using
XIRR method (investment internal rate of return) for Regular Plan - Growth Option. Load is not taken into consideration for computation of performance. The above investment
simulation is for illustrative purpose only and should not be construed as a promise on minimum returns and safeguard of capital. The Mutual Fund is not guaranteeing or
promising or forecasting any returns. Since inception returns are assumed to be starting from the beginning of the subsequent month from the date of inception. The
performance of the scheme is benchmarked to the Total Return variant of the index.
SIP Investments 1 Year 3 Years 5 Years 7 Years 10 Years Since Inception
Total Amount Invested (`) 1,20,000 3,60,000 6,00,000 8,40,000 12,00,000 24,30,000
Market Value as on February 28, 2022 (`) 1,20,514 4,34,600 7,60,570 11,27,368 18,80,074 43,38,479
Returns (CAGR) (%) 0.80 12.66 9.44 8.28 8.70 5.38
First Tier Benchmark Returns (CAGR) (%) #
Additional Benchmark Returns (CAGR) (%) ##
6.08 17.20 13.96 13.13 12.98
7.33 21.08 16.27 14.93 14.16
NA
14.79
SIP PERFORMANCE
25.39%
17.69%
9.27%
4.88%
4.67%
4.32%
2.84%
2.63%
1.82%
1.68%
1.62%
1.53%
1.34%
1.28%
1.25%
1.22%
1.08%
0.77%
0.58%
0.47%
0.40%
Banks
Software
Consumer Non Durables
Insurance
Pharmaceuticals
Petroleum Products
Auto
Finance
Fertilisers
Construction Project
Transportation
Telecom - Services
Other Services
Cement & Cement Products
Pesticides
Consumer Durables
Gas
Non - Ferrous Metals
Auto Ancillaries
Healthcare Services
Ferrous Metals
Factsheet March, 2022
Equity HoldingsAutoTata Motors Ltd.Maruti Suzuki India Ltd.Auto AncillariesMotherson Sumi Systems Ltd.Motherson Sumi Wiring India Ltd.BanksICICI Bank Ltd.HDFC Bank Ltd.Axis Bank Ltd.Kotak Mahindra Bank Ltd.State Bank of IndiaCity Union Bank Ltd.Cement & Cement ProductsUltratech Cement Ltd.Construction ProjectLarsen & Toubro Ltd.Consumer DurablesCentury Plyboards (India) Ltd.Consumer Non DurablesHindustan Unilever Ltd.Nestle India Ltd.Dabur India Ltd.Britannia Industries Ltd.Kansai Nerolac Paints Ltd.Asian Paints Ltd.Ferrous MetalsTata Steel Ltd.FertilisersCoromandel International Ltd.FinanceHDFC Ltd.GasGAIL (India) Ltd.Healthcare ServicesApollo Hospitals Enterprise Ltd.InsuranceSBI Life Insurance Company Ltd.ICICI Lombard General Insurance Co. Ltd.HDFC Life Insurance Company Ltd.
2.84%1.64%1.20%0.47%0.38%0.09%
25.39%8.67%7.06%3.21%3.10%2.30%1.06%1.28%1.28%1.82%1.82%1.22%1.22%9.27%2.24%1.94%1.51%1.42%1.20%0.96%0.40%0.40%1.62%1.62%2.63%2.63%1.08%1.08%0.58%0.58%4.67%2.95%1.32%0.39%
Non - Ferrous MetalsHindalco Industries Ltd.Other ServicesQuess Corp Ltd.PesticidesAstec LifeSciences Ltd.P I Industries LimitedPetroleum ProductsReliance Industries Ltd.PharmaceuticalsAlkem Laboratories Ltd.Biocon Ltd.Dr. Reddy's Laboratories Ltd.Torrent Pharmaceuticals Ltd.SoftwareInfosys Ltd.Tata Consultancy Services Ltd.HCL Technologies Ltd.Larsen & Toubro Infotech Ltd.Birlasoft Ltd.Tech Mahindra Ltd.Telecom - ServicesBharti Airtel Ltd.Bharti Airtel Ltd. PARTLY PAID UP FV 1.25TransportationContainer Corporation Of India Ltd.Equity Holdings TotalGovernment Bond And Treasury BillGovernment Bond6.84% GOVT OF INDIA RED 19-12-2022Government Bond TotalTreasury Bill364 DAYS TBILL RED 11-03-2022Treasury Bill TotalGovernment Bond And Treasury Bill TotalCash & Other ReceivablesTREPS / RepoNet Receivables/(Payables)Cash & Other Receivables TotalGrand Total
0.77%0.77%1.25%1.25%1.53%1.00%0.53%4.32%4.32%4.88%1.39%1.34%1.32%0.83%
17.69%8.62%3.96%1.71%1.32%1.08%1.00%1.34%1.30%0.04%1.68%1.68%
86.72%
7.78%7.78%
3.76%3.76%
11.54%
2.59%-0.85%1.74%
100.00%
Top 10 holdings
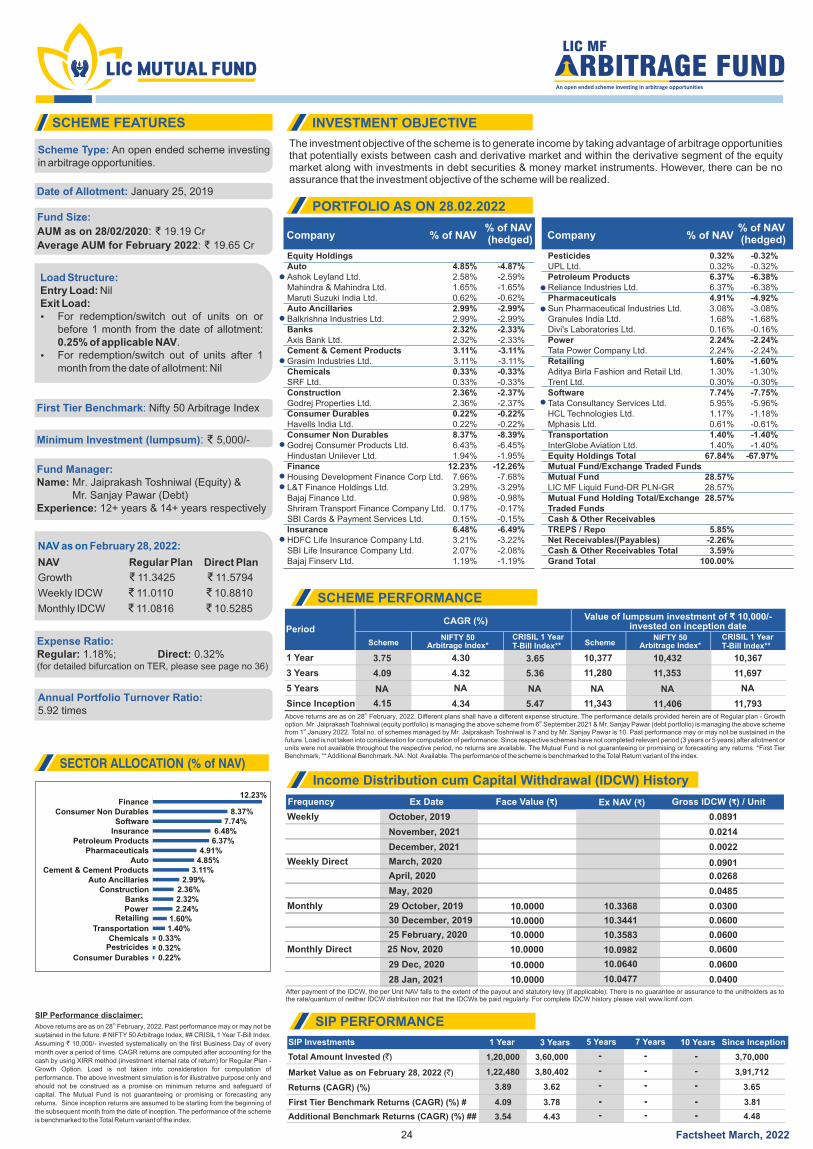
The investment objective of the scheme is to generate income by taking advantage of arbitrage opportunities that potentially exists between cash and derivative market and within the derivative segment of the equity market along with investments in debt securities & money market instruments. However, there can be no assurance that the investment objective of the scheme will be realized.
SCHEME FEATURES INVESTMENT OBJECTIVE
PORTFOLIO AS ON 28.02.2022
SECTOR ALLOCATION (% of NAV)
Scheme Type: An open ended scheme investing in arbitrage opportunities.
Date of Allotment: January 25, 2019
Fund Size:
AUM as on 28/02/2020: ₹ 19.19 Cr
: 19.65 CrAverage AUM for February 2022 ₹
First Tier Benchmark: Nifty 50 Arbitrage Index
Minimum Investment (lumpsum): ₹ 5,000/-
Fund Manager:Name: M . (Equity) &r Jaiprakash Toshniwal Mr. (Debt)Sanjay PawarExperience: years & years respectively12+ 14+
Expense Ratio: Regular: 1.18%; Direct: 0.32%
(for detailed bifurcation on TER, please see page no 36)
Annual Portfolio Turnover Ratio:5.92 times
24
LIC MF
An open ended scheme investing in arbitrage opportunities
RBITRAGE FUND
NAV as on 2:February 28, 202
NAV Regular Plan Direct Plan
Growth ₹ 11.3425 ₹ 11.5794
Weekly IDCW ₹ 11.0110 ₹ 10.8810
Monthly IDCW ₹ 11.0816 ₹ 10.5285
Company Company% of NAV % of NAV% of NAV (hedged)
% of NAV (hedged)
Frequency Ex Date Face Value ( )₹ Ex NAV ( )₹ Gross IDCW ( ) / Unit₹
Weekly
Weekly Direct
Monthly
Monthly Direct
May, 2020
December, 2021
28 Jan, 2021
29 October, 2019
25 February, 2020
30 December, 2019
0.0022
0.0485
0.0400
0.0300
0.0600
0.0600
10.0477
10.3368
10.3583
10.3441
10.0000
10.0000
10.0000
10.0000
10.0000
10.0000
After payment of the IDCW, the per Unit NAV falls to the extent of the payout and statutory levy (if applicable). There is no guarantee or assurance to the unitholders as to the rate/quantum of neither IDCW distribution nor that the IDCWs be paid regularly. For complete IDCW history please visit www.licmf.com.
SCHEME PERFORMANCE
SchemeNIFTY 50
Arbitrage Index*NIFTY 50
Arbitrage Index*SchemeCRISIL 1 YearT-Bill Index**
1 Year 3.75 4.30 3.65 10,377 10,432 10,367
3 Years 4.09 4.32 5.36 11,280 11,353 11,697
5 Years NA NA NA NA NA NA
Since Inception 4.15 4.34 5.47 11,343 11,406 11,793
PeriodCAGR (%) Value of lumpsum investment of 10,000/- ₹
invested on inception date
thAbove returns are as on 28 February, 2022. Different plans shall have a different expense structure. The performance details provided herein are of Regular plan - Growth
thoption. Mr. Jaiprakash Toshniwal (equity portfolio) is managing the above scheme from 6 September 2021 & Mr. Sanjay Pawar (debt portfolio) is managing the above scheme
stfrom 1 January 2022. Total no. of schemes managed by Mr. Jaiprakash Toshniwal is 7 and by Mr. Sanjay Pawar is 10. Past performance may or may not be sustained in the future. Load is not taken into consideration for computation of performance. Since respective schemes have not completed relevant period (3 years or 5 years) after allotment or units were not available throughout the respective period, no returns are available. The Mutual Fund is not guaranteeing or promising or forecasting any returns. *First Tier Benchmark, ** Additional Benchmark. NA : Not Available. The performance of the scheme is benchmarked to the Total Return variant of the index.
thAbove returns are as on 28 February, 2022. Past performance may or may not be
sustained in the future. # NIFTY 50 Arbitrage Index, ## CRISIL 1 Year T-Bill Index.
Assuming ` 10,000/- invested systematically on the first Business Day of every
month over a period of time. CAGR returns are computed after accounting for the
cash by using XIRR method (investment internal rate of return) for Regular Plan -
Growth Option. Load is not taken into consideration for computation of
performance. The above investment simulation is for illustrative purpose only and
should not be construed as a promise on minimum returns and safeguard of
capital. The Mutual Fund is not guaranteeing or promising or forecasting any
returns. Since inception returns are assumed to be starting from the beginning of
the subsequent month from the date of inception. The performance of the scheme
is benchmarked to the Total Return variant of the index.
SIP Investments 1 Year 3 Years 5 Years 7 Years 10 Years Since Inception
Total Amount Invested (`) 1,20,000 3,60,000 3,70,000
Market Value as on February 28, 2022 (`) 1,22,480 3,91,712
Returns (CAGR) (%) 3.89 3.65
First Tier Benchmark Returns (CAGR) (%) #
Additional Benchmark Returns (CAGR) (%) ##
4.09
3.54
3.81
4.48
SIP PERFORMANCE
3,80,402
3.62
3.78
4.43
-
-
-
-
-
-
-
-
-
-
-
-
-
-
-
-
-
-
-
-
-
-
-
-
-
-
-
-
-
-
SIP Performance disclaimer:
March, 2020 0.0901
April, 2020 0.0268
0.0600
0.0600
25 Nov, 2020 10.0982
29 Dec, 2020 10.0640
CRISIL 1 YearT-Bill Index**
Income Distribution cum Capital Withdrawal (IDCW) History
Load Structure:Entry Load: NilExit Load: Ÿ For redemption/switch out of units on or
before 1 month from the date of allotment: 0.25% of applicable NAV.
Ÿ For redemption/switch out of units after 1 month from the date of allotment: Nil
October, 2019 0.0891
November, 2021 0.0214
12.23%
8.37%7.74%
6.48%6.37%
4.91%4.85%
3.11%2.99%
2.36%2.32%2.24%
1.60%1.40%
0.33%0.32%0.22%
Pharmaceuticals
Finance
InsuranceSoftware
PowerBanks
Auto
Construction
Consumer Non Durables
Cement & Cement Products
Transportation
Consumer Durables
Pestricides
Retailing
Factsheet March, 2022
Petroleum Products
Auto Ancillaries
Chemicals
Equity HoldingsAutoAshok Leyland Ltd.Mahindra & Mahindra Ltd.Maruti Suzuki India Ltd.Auto AncillariesBalkrishna Industries Ltd.BanksAxis Bank Ltd.Cement & Cement ProductsGrasim Industries Ltd.ChemicalsSRF Ltd.ConstructionGodrej Properties Ltd.Consumer DurablesHavells India Ltd.Consumer Non DurablesGodrej Consumer Products Ltd.Hindustan Unilever Ltd.FinanceHousing Development Finance Corp Ltd.L&T Finance Holdings Ltd.Bajaj Finance Ltd.Shriram Transport Finance Company Ltd.SBI Cards & Payment Services Ltd.InsuranceHDFC Life Insurance Company Ltd.SBI Life Insurance Company Ltd.Bajaj Finserv Ltd.
PesticidesUPL Ltd.Petroleum ProductsReliance Industries Ltd.PharmaceuticalsSun Pharmaceutical Industries Ltd.Granules India Ltd.Divi's Laboratories Ltd.PowerTata Power Company Ltd.RetailingAditya Birla Fashion and Retail Ltd.Trent Ltd.SoftwareTata Consultancy Services Ltd.HCL Technologies Ltd.Mphasis Ltd.TransportationInterGlobe Aviation Ltd.Equity Holdings TotalMutual Fund/Exchange Traded FundsMutual FundLIC MF Liquid Fund-DR PLN-GRMutual Fund Holding Total/Exchange Traded FundsCash & Other ReceivablesTREPS / RepoNet Receivables/(Payables)Cash & Other Receivables TotalGrand Total
4.85%2.58%1.65%0.62%2.99%2.99%2.32%2.32%3.11%3.11%0.33%0.33%2.36%2.36%0.22%0.22%8.37%6.43%1.94%
12.23%7.66%3.29%0.98%0.17%0.15%6.48%3.21%2.07%1.19%
0.32%0.32%6.37%6.37%4.91%3.08%1.68%0.16%2.24%2.24%1.60%1.30%0.30%7.74%5.95%1.17%0.61%1.40%1.40%
67.84%
28.57%28.57%28.57%
5.85%-2.26%3.59%
100.00%
-4.87%-2.59%-1.65%-0.62%-2.99%-2.99%-2.33%-2.33%-3.11%-3.11%-0.33%-0.33%-2.37%-2.37%-0.22%-0.22%-8.39%-6.45%-1.95%
-12.26%-7.68%-3.29%-0.98%-0.17%-0.15%-6.49%-3.22%-2.08%-1.19%
-0.32%-0.32%-6.38%-6.38%-4.92%-3.08%-1.68%-0.16%-2.24%-2.24%-1.60%-1.30%-0.30%-7.75%-5.96%-1.18%-0.61%-1.40%-1.40%
-67.97%
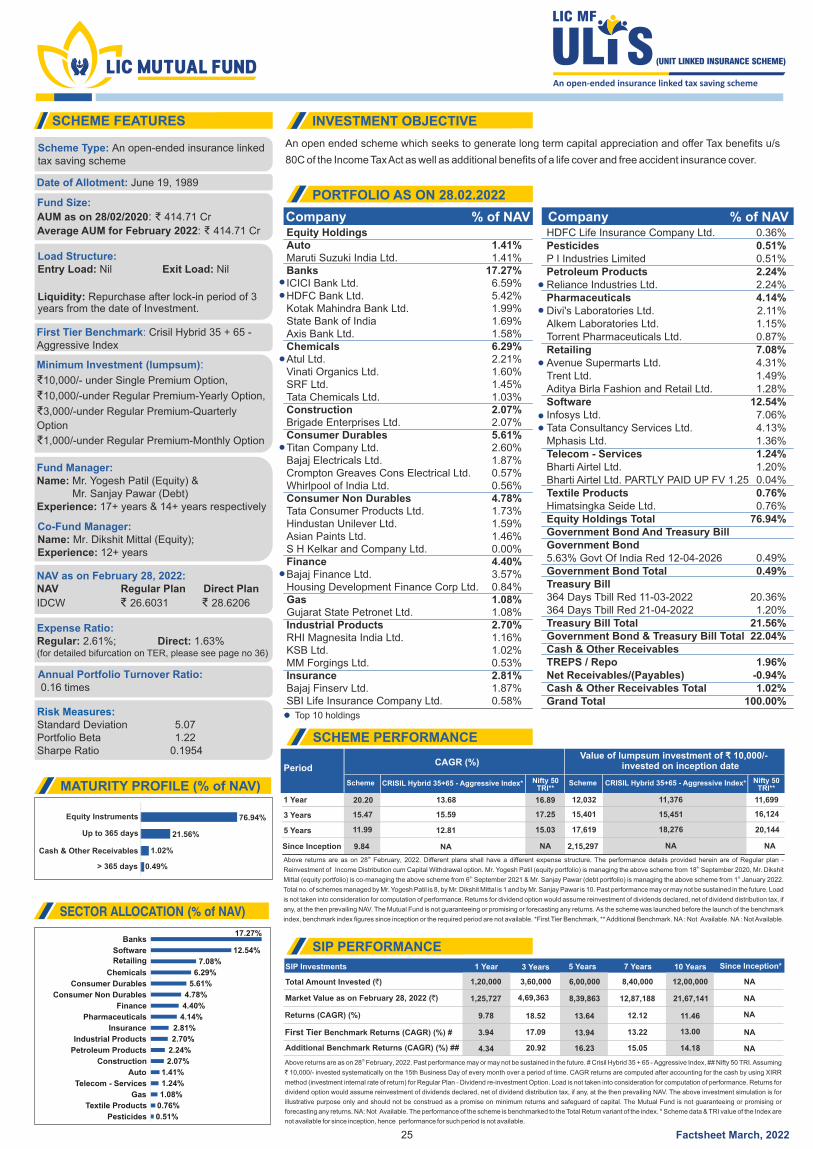
An open ended scheme which seeks to generate long term capital appreciation and offer Tax benefits u/s
80C of the Income Tax Act as well as additional benefits of a life cover and free accident insurance cover.
thAbove returns are as on 28 February, 2022. Past performance may or may not be sustained in the future. # Crisil Hybrid 35 + 65 - Aggressive Index, ## Nifty 50 TRI. Assuming
` 10,000/- invested systematically on the 15th Business Day of every month over a period of time. CAGR returns are computed after accounting for the cash by using XIRR
method (investment internal rate of return) for Regular Plan - Dividend re-investment Option. Load is not taken into consideration for computation of performance. Returns for
dividend option would assume reinvestment of dividends declared, net of dividend distribution tax, if any, at the then prevailing NAV. The above investment simulation is for
illustrative purpose only and should not be construed as a promise on minimum returns and safeguard of capital. The Mutual Fund is not guaranteeing or promising or
forecasting any returns. NA: Not Available. The performance of the scheme is benchmarked to the Total Return variant of the index. * Scheme data & TRI value of the Index are
not available for since inception, hence performance for such period is not available.
76.94%
0.49%
21.56%Up to 365 days
Equity Instruments
Cash & Other Receivables
SIP Investments 1 Year 3 Years 5 Years 7 Years 10 Years Since Inception*
Total Amount Invested ( )` 1,20,000 3,60,000 6,00,000 8,40,000 12,00,000 NA
NA
NA
NA
NA
Market Value as on February 28, 2022 (`) 1,25,727 4,69,363 8,39,863 12,87,188 21,67,141
Returns (CAGR) (%) 9.78 18.52 13.64 12.12 11.46
First Tier Benchmark Returns (CAGR) (%) #
Additional Benchmark Returns (CAGR) (%) ##
3.94
4.34
17.09
20.92
13.94 13.22
16.23 15.05
13.00
14.18
SCHEME FEATURES INVESTMENT OBJECTIVE
PORTFOLIO AS ON 28.02.2022
SCHEME PERFORMANCE
SIP PERFORMANCE
MATURITY PROFILE (% of NAV)
Company % of NAV Company % of NAV
SECTOR ALLOCATION (% of NAV)
Scheme CRISIL Hybrid 35+65 - Aggressive Index* CRISIL Hybrid 35+65 - Aggressive Index*SchemeNifty 50TRI**
Nifty 50 TRI**
1 Year 20.20 13.68 16.89 12,032 11,376 11,699
3 Years 15.47 15.59 17.25 15,401 15,451 16,124
5 Years 11.99 12.81 15.03 17,619 18,276 20,144
Since Inception 9.84 NA NA 2,15,297 NA NA
PeriodCAGR (%)
Value of lumpsum investment of 10,000/- ₹invested on inception date
thAbove returns are as on 28 February, 2022. Different plans shall have a different expense structure. The performance details provided herein are of Regular plan -
thReinvestment of Income Distribution cum Capital Withdrawal option. Mr. Yogesh Patil (equity portfolio) is managing the above scheme from 18 September 2020, Mr. Dikshit
th stMittal (equity portfolio) is co-managing the above scheme from 6 September 2021 & Mr. Sanjay Pawar (debt portfolio) is managing the above scheme from 1 January 2022.
Total no. of schemes managed by Mr. Yogesh Patil is 8, by Mr. Dikshit Mittal is 1 and by Mr. Sanjay Pawar is 10. Past performance may or may not be sustained in the future. Load
is not taken into consideration for computation of performance. Returns for dividend option would assume reinvestment of dividends declared, net of dividend distribution tax, if
any, at the then prevailing NAV. The Mutual Fund is not guaranteeing or promising or forecasting any returns. As the scheme was launched before the launch of the benchmark
index, benchmark index figures since inception or the required period are not available. *First Tier Benchmark, ** Additional Benchmark. NA : Not Available. NA : Not Available.
Scheme Type: An open-ended insurance linked tax saving scheme
Date of Allotment: June 19, 1989
Fund Size:
AUM as on 28/02/2020: ₹ 414.71 Cr
: 414.71 CrAverage AUM for February 2022 ₹
Load Structure:Entry Load: Exit Load: Nil Nil
Liquidity: Repurchase after lock-in period of 3 years from the date of Investment.
First Tier Benchmark: Crisil Hybrid 35 + 65 - Aggressive Index
Minimum Investment (lumpsum):
₹10,000/- under Single Premium Option,
₹10,000/-under Regular Premium-Yearly Option,
₹3,000/-under Regular Premium-Quarterly
Option
₹1,000/-under Regular Premium-Monthly Option
Fund Manager:Name: Mr. (Equity) &Yogesh Patil Mr. (Debt)Sanjay PawarExperience: years & years respectively17+ 14+
NAV as on February 28, 2022:NAV Regular Plan Direct Plan
IDCW ₹ 26.6031 ₹ 28.6206
Expense Ratio: Regular: 2.61%; Direct: 1.63%
(for detailed bifurcation on TER, please see page no 36)
Annual Portfolio Turnover Ratio: 0.16 times
Risk Measures:Standard Deviation 5.07Portfolio Beta 1.22Sharpe Ratio 0.1954
25
Co-Fund Manager:Name: Mr. Dikshit Mittal (Equity);Experience: 12+ years
1.02%
> 365 days
17.27%
12.54%
7.08%
6.29%
5.61%
4.78%
4.40%
4.14%
2.81%
2.70%
2.24%
2.07%
1.41%
1.24%
1.08%
0.76%
0.51%
Banks
Software
Retailing
Chemicals
Consumer Durables
Consumer Non Durables
Finance
Pharmaceuticals
Industrial Products
Insurance
Petroleum Products
Construction
Auto
Telecom - Services
Gas
Textile Products
Pesticides
Factsheet March, 2022
Equity HoldingsAutoMaruti Suzuki India Ltd.BanksICICI Bank Ltd.HDFC Bank Ltd.Kotak Mahindra Bank Ltd.State Bank of IndiaAxis Bank Ltd.ChemicalsAtul Ltd.Vinati Organics Ltd.SRF Ltd.Tata Chemicals Ltd.ConstructionBrigade Enterprises Ltd.Consumer DurablesTitan Company Ltd.Bajaj Electricals Ltd.Crompton Greaves Cons Electrical Ltd.Whirlpool of India Ltd.Consumer Non DurablesTata Consumer Products Ltd.Hindustan Unilever Ltd.Asian Paints Ltd.S H Kelkar and Company Ltd.FinanceBajaj Finance Ltd.Housing Development Finance Corp Ltd.GasGujarat State Petronet Ltd.Industrial ProductsRHI Magnesita India Ltd.KSB Ltd.MM Forgings Ltd.InsuranceBajaj Finserv Ltd.SBI Life Insurance Company Ltd.
1.41%1.41%
17.27%6.59%5.42%1.99%1.69%1.58%6.29%2.21%1.60%1.45%1.03%2.07%2.07%5.61%2.60%1.87%0.57%0.56%4.78%1.73%1.59%1.46%0.00%4.40%3.57%0.84%1.08%1.08%2.70%1.16%1.02%0.53%2.81%1.87%0.58%
HDFC Life Insurance Company Ltd.PesticidesP I Industries LimitedPetroleum ProductsReliance Industries Ltd.PharmaceuticalsDivi's Laboratories Ltd.Alkem Laboratories Ltd.Torrent Pharmaceuticals Ltd.RetailingAvenue Supermarts Ltd.Trent Ltd.Aditya Birla Fashion and Retail Ltd.SoftwareInfosys Ltd.Tata Consultancy Services Ltd.Mphasis Ltd.Telecom - ServicesBharti Airtel Ltd.Bharti Airtel Ltd. PARTLY PAID UP FV 1.25Textile ProductsHimatsingka Seide Ltd.Equity Holdings TotalGovernment Bond And Treasury BillGovernment Bond5.63% Govt Of India Red 12-04-2026Government Bond TotalTreasury Bill364 Days Tbill Red 11-03-2022364 Days Tbill Red 21-04-2022Treasury Bill TotalGovernment Bond & Treasury Bill TotalCash & Other ReceivablesTREPS / RepoNet Receivables/(Payables)Cash & Other Receivables TotalGrand Total
0.36%0.51%0.51%2.24%2.24%4.14%2.11%1.15%0.87%7.08%4.31%1.49%1.28%
12.54%7.06%4.13%1.36%1.24%1.20%0.04%0.76%0.76%
76.94%
0.49%0.49%
20.36%1.20%
21.56%22.04%
1.96%-0.94%1.02%
100.00%
Top 10 holdings

The primary objective of the scheme is to generate credit risk free and reasonable returns for its investors
through investments in sovereign securities issued by the central and /or state Government and/or any
security unconditionally guaranteed by the central/ state government for repayment of Principal and interest
and/or reverse repos in such securities as and when permitted by RBI. However, there is no assurance that
the investment objective of the Schemes will be realized.
Company Rating % of NAV
Frequency Ex Date Face Value ( )₹ Ex NAV ( )₹ Gross IDCW ( ) / Unit₹
Quarterly (Regular) 10.0000 0.1500
10.0000 0.1500
December 28, 2017
September 29, 2017
June 29, 2017
March 27, 2018
December 28, 2017
September 29, 2017
10.0000 10.4179
10.8006
10.9665
0.1500
Quarterly (Direct) 10.0000 0.1500
10.0000 0.1500
10.0000 10.9575
10.9013
11.2701
0.1500
Quarterly (PF) December 27, 2012 10.0000 11.1882 0.2500
March 28, 2013 10.0000 10.1606 1.0000
June 26, 2013 10.0000 10.0868 0.3000
63.22%>365 days
91.61%
8.39%
Sovereign
Cash & Other Receivables
SCHEME FEATURES INVESTMENT OBJECTIVE
PORTFOLIO AS ON 28.02.2022
SCHEME PERFORMANCE
MATURITY PROFILE (% of NAV)
RATING PROFILE (% of NAV)
Scheme NIFTY All Duration G-Sec Index*
Crisil 10 yr Gilt Index**
Crisil 10 yr Gilt Index**
Scheme
1 Year 3.34 1.90 10,336 10,191
3 Years 7.49 6.59 12,422 12,112
5 Years 6.69 5.36 13,823 12,983
Since Inception 7.43 NA
7.19
8.32
4.89
NA 49,181 NA
14,151
12,711
10,492
NA
PeriodCAGR (%)
Value of lumpsum investment of 10,000/- ₹invested on inception date
thAbove returns are as on 28 February, 2022, 2022. Different plans shall have a different expense structure. The performance details provided herein are of Regular plan -
thGrowth option. Mr. Marzban Irani is managing the above scheme from 10 August, 2016 and total no. of schemes managed by him is 5. Also, Mr. Sanjay Pawar is co managing stthe above scheme from 1 January, 2022 and total no. of schemes managed by him is 10. . Past performance may or may not be sustained in the future. Load is not taken into
consideration for computation of performance. The Mutual Fund is not guaranteeing or promising or forecasting any returns. As the scheme was launched before the launch of
the benchmark index, benchmark index figures since inception or the required period are not available. *First Tier Benchmark, ** Additional Benchmark. NA : Not Available.
After payment of the IDCW, the per Unit NAV falls to the extent of the payout and statutory levy (if applicable). There is no guarantee or assurance to the unitholders as to the rate/quantum of neither IDCW nor that the IDCWs be paid regularly. For complete IDCW history please visit www.licmf.com.
Scheme Type: An open ended debt scheme investing in government securities across maturity. (A Relatively High interest rate risk and Relatively Low Credit Risk)
Date of Allotment: December 10, 1999
Fund Size:
AUM as on 28/02/2020: ₹ 70.40 Cr
: 68.72 CrAverage AUM for February 2022 ₹
Load Structure:Entry Load: Nil
Exit Load: 0.25% if exit within 30 days from date of
allotment of units
First Tier Benchmark: NIFTY All Duration G-Sec Index
Minimum Investment (lumpsum): ₹ 10,000/-
Expense Ratio:Regular: 1.48; Direct: 0.76%(for detailed bifurcation on TER, please see page no 36)
Portfolio Metrics:Average Maturity 1.79 yearsMacaulay Duration 1.65 yearsModified Duration 1.61 yearsYTM 4.58%
NAV as on 2:February 28, 202
NAV Regular Plan Direct Plan PF
Growth ₹ 49.1807 ₹ 52.8943 ₹ 28.4049
IDCW ₹ 14.1763 ₹ 15.2501 ₹ 18.3808
26
8.39%Cash & Other Receivables
Income Distribution cum Capital Withdrawal (IDCW) History
28.39%Up to 365 days
NIFTY All Duration G-Sec Index*
An Open Ended Debt Scheme investing in government securities across maturity. A Relatively High Interest Rate Risk and Relatively Low Credit Risk.
Fund Manager:
Name: Mr. Marzban Irani & Mr. Sanjay Pawar
Experience: 20+ years & 14+ years respectively
Factsheet March, 2022
Government Bond And Treasury BillGovernment Bond7.68% Govt Of India Red 15-12-20235.74% Govt Of India Red 15-11-20265.63% Govt Of India Red 12-04-2026Government Bond TotalTreasury Bill364 Days Tbill Red 11-03-2022364 Days Tbill Red 03-03-202291 Days Tbill Red 10-03-2022Treasury Bill TotalState Government Bond7.37% Maharashtra SDL Red 14-09-2026State Government Bond TotalGovernment Bond And Treasury Bill TotalCash & Other ReceivablesTREPS / RepoNet Receivables/(payables)Cash & Other Receivables TotalGrand Total
SOVEREIGNSOVEREIGNSOVEREIGN
SOVEREIGNSOVEREIGNSOVEREIGN
SOVEREIGN
37.79%14.27%
3.51%55.57%
14.19%7.10%7.10%
28.39%
7.65%7.65%
91.61%
8.44%-0.05%8.39%
100.00%
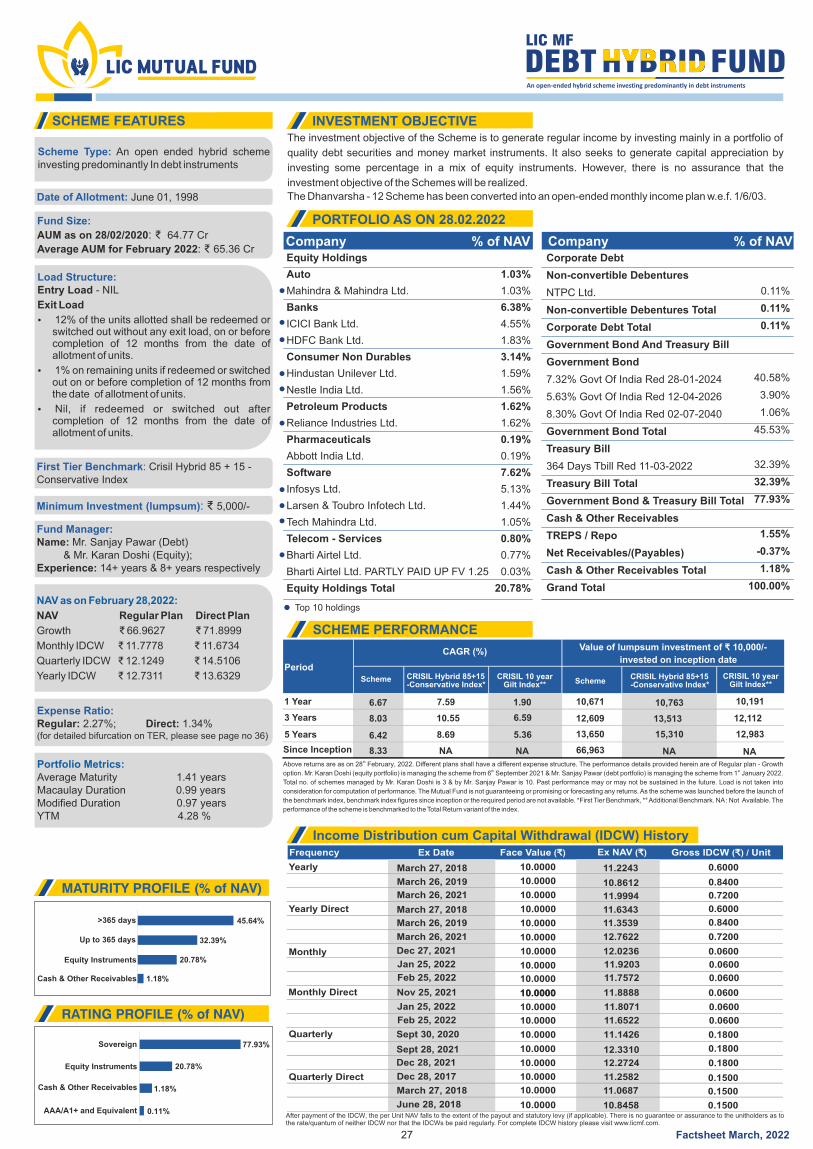
The investment objective of the Scheme is to generate regular income by investing mainly in a portfolio of
quality debt securities and money market instruments. It also seeks to generate capital appreciation by
investing some percentage in a mix of equity instruments. However, there is no assurance that the
investment objective of the Schemes will be realized.
The Dhanvarsha - 12 Scheme has been converted into an open-ended monthly income plan w.e.f. 1/6/03.
Frequency Ex Date Face Value ( )₹ Ex NAV ( )₹ Gross IDCW ( ) / Unit₹
Yearly 10.0000
10.0000
March 26, 2021
March 27, 2018
10.0000 11.9994
11.2243
0.7200
0.6000
Yearly Direct 10.0000
10.0000
0.6000
March 26, 2021
March 27, 2018
10.0000 12.7622
11.6343
0.7200
Monthly 10.0000Dec 27, 2021
10.0000
12.0236 0.0600
Monthly Direct 10.0000
10.0000
10.0000Nov 25, 2021
Jan 25, 2022
Jan 25, 2022
11.8888
11.8071
11.9203
0.0600
0.0600
0.0600
Quarterly 10.0000
Dec 28, 2021 10.0000
10.0000
12.2724 0.1800
0.1800
0.1800
Quarterly Direct 10.0000
June 28, 2018
March 27, 2018
Dec 28, 2017
10.0000
10.0000
10.8458
11.0687
11.2582
0.1500
0.1500
0.1500
45.64%
32.39%
20.78%
>365 days
Up to 365 days
Equity Instruments
SCHEME FEATURES INVESTMENT OBJECTIVE
PORTFOLIO AS ON 28.02.2022
SCHEME PERFORMANCE
MATURITY PROFILE (% of NAV)
RATING PROFILE (% of NAV)
Company % of NAV Company % of NAV
Scheme CRISIL Hybrid 85+15-Conservative Index*
CRISIL Hybrid 85+15-Conservative Index*
CRISIL 10 year Gilt Index**
CRISIL 10 year Gilt Index**Scheme
1 Year 6.67 7.59 1.90 10,671 10,763 10,191
3 Years 8.03 10.55 6.59 12,609 13,513 12,112
5 Years 6.42 8.69 5.36 13,650 15,310 12,983
Since Inception 8.33 NA NA 66,963 NA NA
Period
CAGR (%) Value of lumpsum investment of 10,000/- ₹invested on inception date
thAbove returns are as on 28 February, 2022. Different plans shall have a different expense structure. The performance details provided herein are of Regular plan - Growth
th stoption. Mr. Karan Doshi (equity portfolio) is managing the scheme from 6 September 2021 & Mr. Sanjay Pawar (debt portfolio) is managing the scheme from 1 January 2022.
Total no. of schemes managed by Mr. Karan Doshi is 3 & by Mr. Sanjay Pawar is 10. Past performance may or may not be sustained in the future. Load is not taken into
consideration for computation of performance. The Mutual Fund is not guaranteeing or promising or forecasting any returns. As the scheme was launched before the launch of
the benchmark index, benchmark index figures since inception or the required period are not available. *First Tier Benchmark, ** Additional Benchmark. NA : Not Available. The
performance of the scheme is benchmarked to the Total Return variant of the index.
77.93%
20.78%
1.18%
0.11%AAA/A1+ and Equivalent
Sovereign
Equity Instruments
Cash & Other Receivables
After payment of the IDCW, the per Unit NAV falls to the extent of the payout and statutory levy (if applicable). There is no guarantee or assurance to the unitholders as to the rate/quantum of neither IDCW nor that the IDCWs be paid regularly. For complete IDCW history please visit www.licmf.com.
Scheme Type: An open ended hybrid scheme investing predominantly In debt instruments
Date of Allotment: June 01, 1998
Fund Size:
AUM as on 28/02/2020: ₹ 64.77 Cr
: 65.36 CrAverage AUM for February 2022 ₹
First Tier Benchmark: Crisil Hybrid 85 + 15 - Conservative Index
Minimum Investment (lumpsum): ₹ 5,000/-
Fund Manager:Name: Mr. Sanjay Pawar (Debt) & Mr. Karan Doshi (Equity); Experience: 14+ years & 8+ years respectively
Expense Ratio:Regular: 2.27%; Direct: 1.34%(for detailed bifurcation on TER, please see page no 36)
Portfolio Metrics:Average Maturity 1.41 yearsMacaulay Duration 0.99 yearsModified Duration 0.97 yearsYTM 4.28 %
27
Load Structure:Entry Load - NIL
Exit Load
Ÿ 12% of the units allotted shall be redeemed or switched out without any exit load, on or before completion of 12 months from the date of allotment of units.
Ÿ 1% on remaining units if redeemed or switched out on or before completion of 12 months from the date of allotment of units.
Ÿ Nil, if redeemed or switched out after completion of 12 months from the date of allotment of units.
1.18%Cash & Other Receivables
March 26, 2019 11.3539 0.8400
March 26, 2019 10.8612 0.8400
Income Distribution cum Capital Withdrawal (IDCW) History
Sept 30, 2020 11.1426
Sept 28, 2021 12.3310
Factsheet March, 2022
10.0000Feb 25, 2022 11.6522 0.0600
10.0000Feb 25, 2022 11.7572 0.0600
NAV as on February 28,2022:
NAV Regular Plan Direct Plan
Growth ₹ 66.9627 ₹ 71.8999
Monthly IDCW ₹ 11.7778 ₹ 11.6734
Quarterly IDCW ₹ 12.1249 ₹ 14.5106
Yearly IDCW ₹ 12.7311 ₹ 13.6329
Equity Holdings
Auto
Mahindra & Mahindra Ltd.
Banks
ICICI Bank Ltd.
HDFC Bank Ltd.
Consumer Non Durables
Hindustan Unilever Ltd.
Nestle India Ltd.
Petroleum Products
Reliance Industries Ltd.
Pharmaceuticals
Abbott India Ltd.
Software
Infosys Ltd.
Larsen & Toubro Infotech Ltd.
Tech Mahindra Ltd.
Telecom - Services
Bharti Airtel Ltd.
Bharti Airtel Ltd. PARTLY PAID UP FV 1.25
Equity Holdings Total
Corporate Debt
Non-convertible Debentures
NTPC Ltd.
Non-convertible Debentures Total
Corporate Debt Total
Government Bond And Treasury Bill
Government Bond
7.32% Govt Of India Red 28-01-2024
5.63% Govt Of India Red 12-04-2026
8.30% Govt Of India Red 02-07-2040
Government Bond Total
Treasury Bill
364 Days Tbill Red 11-03-2022
Treasury Bill Total
Government Bond & Treasury Bill Total
Cash & Other Receivables
TREPS / Repo
Net Receivables/(Payables)
Cash & Other Receivables Total
Grand Total
1.03%
1.03%
6.38%
4.55%
1.83%
3.14%
1.59%
1.56%
1.62%
1.62%
0.19%
0.19%
7.62%
5.13%
1.44%
1.05%
0.80%
0.77%
0.03%
20.78%
0.11%
0.11%
0.11%
40.58%
3.90%
1.06%
45.53%
32.39%
32.39%
77.93%
1.55%
-0.37%
1.18%
100.00%
Top 10 holdings
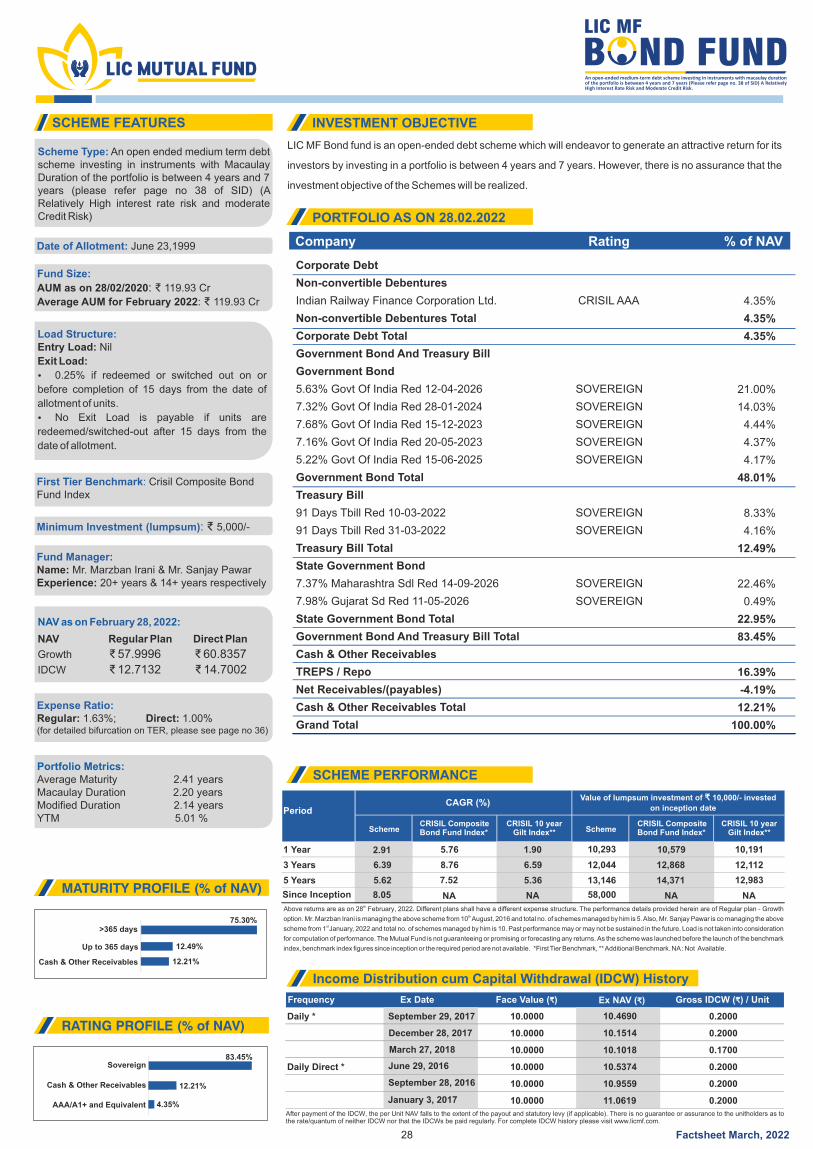
LIC MF Bond fund is an open-ended debt scheme which will endeavor to generate an attractive return for its
investors by investing in a portfolio is between 4 years and 7 years. However, there is no assurance that the
investment objective of the Schemes will be realized.
Frequency Ex Date Face Value ( )₹ Ex NAV ( )₹ Gross IDCW ( ) / Unit₹
Daily * 10.0000 0.2000
10.0000 0.2000
March 27, 2018
December 28, 2017
September 29, 2017
10.0000 10.1018
10.1514
10.4690
0.1700
Daily Direct * June 29, 2016 10.0000 10.5374 0.2000
September 28, 2016 10.0000 10.9559 0.2000
January 3, 2017 10.0000 11.0619 0.2000
Company Rating % of NAV
>365 days
83.45%Sovereign
Cash & Other Receivables
SCHEME FEATURES INVESTMENT OBJECTIVE
PORTFOLIO AS ON 28.02.2022
SCHEME PERFORMANCE
MATURITY PROFILE (% of NAV)
RATING PROFILE (% of NAV)
SchemeCRISIL Composite Bond Fund Index*
CRISIL 10 year Gilt Index**
CRISIL 10 year Gilt Index**Scheme
CRISIL Composite Bond Fund Index*
1 Year 2.91 5.76 1.90 10,293 10,579 10,191
3 Years 6.39 8.76 6.59 12,044 12,868 12,112
5 Years 5.62 7.52 5.36 13,146 14,371 12,983
Since Inception 8.05 NA NA 58,000 NA NA
PeriodCAGR (%)
Value of lumpsum investment of 10,000/- invested ₹on inception date
thAbove returns are as on 28 February, 2022. Different plans shall have a different expense structure. The performance details provided herein are of Regular plan - Growth
thoption. Mr. Marzban Irani is managing the above scheme from 10 August, 2016 and total no. of schemes managed by him is 5. Also, Mr. Sanjay Pawar is co managing the above
st scheme from 1 January, 2022 and total no. of schemes managed by him is 10. Past performance may or may not be sustained in the future. Load is not taken into consideration
for computation of performance. The Mutual Fund is not guaranteeing or promising or forecasting any returns. As the scheme was launched before the launch of the benchmark
index, benchmark index figures since inception or the required period are not available. *First Tier Benchmark, ** Additional Benchmark. NA : Not Available.
After payment of the IDCW, the per Unit NAV falls to the extent of the payout and statutory levy (if applicable). There is no guarantee or assurance to the unitholders as to the rate/quantum of neither IDCW nor that the IDCWs be paid regularly. For complete IDCW history please visit www.licmf.com.
Scheme Type: An open ended medium term debt scheme investing in instruments with Macaulay Duration of the portfolio is between 4 years and 7 years (please refer page no 38 of SID) (A Relatively High interest rate risk and moderate Credit Risk)
Date of Allotment: June 23,1999
Fund Size:
AUM as on 28/02/2020: ₹ 119.93 Cr
: 119.93 CrAverage AUM for February 2022 ₹
Load Structure:Entry Load: Nil
Exit Load:
Ÿ 0.25% if redeemed or switched out on or
before completion of 15 days from the date of
allotment of units.
Ÿ No Exit Load is payable if units are
redeemed/switched-out after 15 days from the
date of allotment.
First Tier Benchmark: Crisil Composite Bond Fund Index
Minimum Investment (lumpsum): ₹ 5,000/-
Expense Ratio:Regular: 1.63%; Direct: 1.00%(for detailed bifurcation on TER, please see page no 36)
Portfolio Metrics:Average Maturity 2.41 yearsMacaulay Duration 2.20 yearsModified Duration 2.14 yearsYTM 5.01 %
NAV as o 2:n February 28, 202
NAV Regular Plan Direct Plan
Growth ₹ 57.9996 ₹ 60.8357
IDCW ₹ 12.7132 ₹ 14.7002
28
Cash & Other Receivables
12.21%
Income Distribution cum Capital Withdrawal (IDCW) History
Up to 365 days
AAA/A1+ and Equivalent 4.35%
An open-ended medium-term debt scheme investing in instruments with macaulay duration of the portfolio is between 4 years and 7 years (Please refer page no. 38 of SID) A Relatively High Interest Rate Risk and Moderate Credit Risk.
Fund Manager:Name: Mr. Marzban Irani & Mr. Sanjay Pawar Experience: 20+ years & 14+ years respectively
Factsheet March, 2022
75.30%
12.21%
12.49%
Corporate Debt
Non-convertible Debentures
Indian Railway Finance Corporation Ltd.
Non-convertible Debentures Total
Corporate Debt Total
Government Bond And Treasury Bill
Government Bond
5.63% Govt Of India Red 12-04-2026
7.32% Govt Of India Red 28-01-2024
7.68% Govt Of India Red 15-12-2023
7.16% Govt Of India Red 20-05-2023
5.22% Govt Of India Red 15-06-2025
Government Bond Total
Treasury Bill
91 Days Tbill Red 10-03-2022
91 Days Tbill Red 31-03-2022
Treasury Bill Total
State Government Bond
7.37% Maharashtra Sdl Red 14-09-2026
7.98% Gujarat Sd Red 11-05-2026
State Government Bond Total
Government Bond And Treasury Bill Total
Cash & Other Receivables
TREPS / Repo
Net Receivables/(payables)
Cash & Other Receivables Total
Grand Total
CRISIL AAA
SOVEREIGN
SOVEREIGN
SOVEREIGN
SOVEREIGN
SOVEREIGN
SOVEREIGN
SOVEREIGN
SOVEREIGN
SOVEREIGN
4.35%
4.35%
4.35%
21.00%
14.03%
4.44%
4.37%
4.17%
48.01%
8.33%
4.16%
12.49%
22.46%
0.49%
22.95%
83.45%
16.39%
-4.19%
12.21%
100.00%
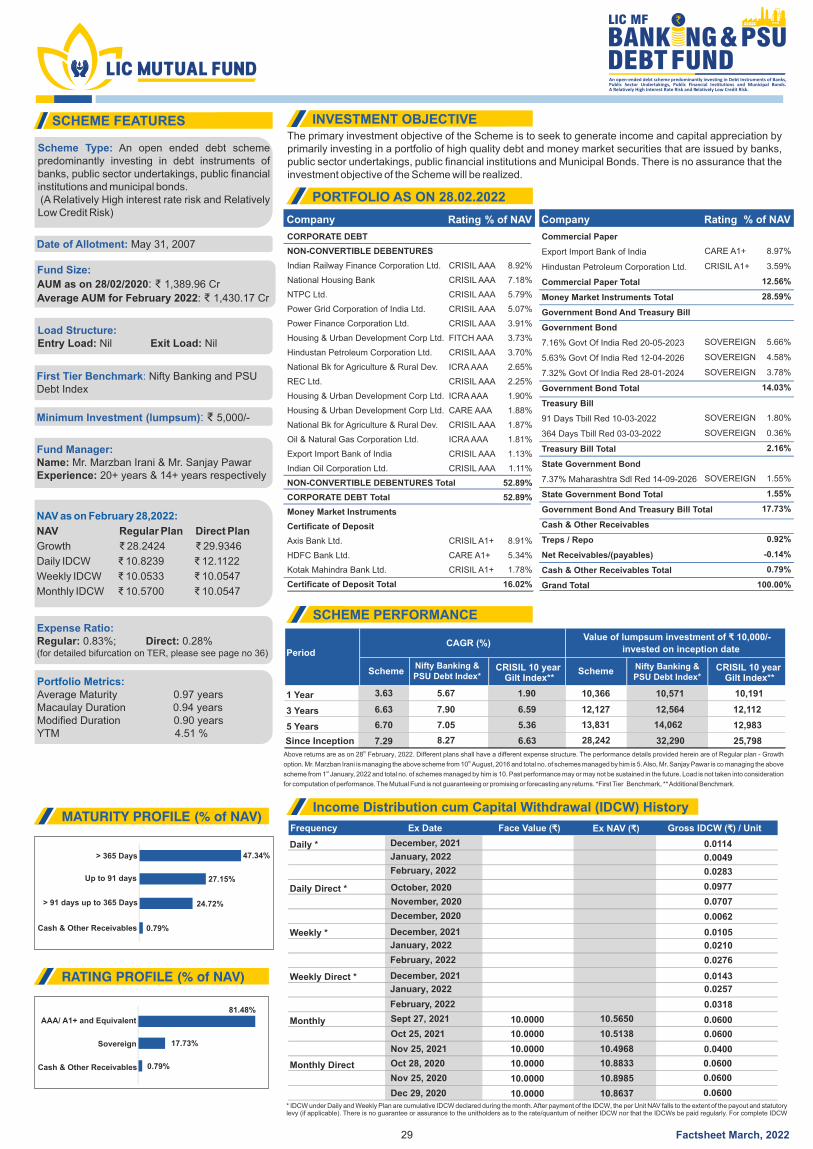
The primary investment objective of the Scheme is to seek to generate income and capital appreciation by primarily investing in a portfolio of high quality debt and money market securities that are issued by banks, public sector undertakings, public financial institutions and Municipal Bonds. There is no assurance that the investment objective of the Scheme will be realized.
Frequency Ex Date Face Value ( )₹ Ex NAV ( )₹ Gross IDCW ( ) / Unit₹
Daily * December, 2021 0.0114
0.0049
Daily Direct *
December, 2020 0.0062
Weekly *
Weekly Direct * December, 2021
February, 2022
February, 2022
0.0143
0.0318
0.0276
Monthly
Nov 25, 2021 10.0000
10.0000
10.4968 0.0400
Monthly Direct
Dec 29, 2020 10.0000
10.0000
10.0000
10.8637 0.0600
0.0600
47.34%
27.15%
24.72%
Up to 91 days
Cash & Other Receivables
> 365 Days
81.48%
17.73%
0.79%
AAA/ A1+ and Equivalent
Sovereign
Cash & Other Receivables
SCHEME FEATURES INVESTMENT OBJECTIVE
PORTFOLIO AS ON 28.02.2022
SCHEME PERFORMANCE
MATURITY PROFILE (% of NAV)
RATING PROFILE (% of NAV)
SchemeNifty Banking & PSU Debt Index*
Nifty Banking & PSU Debt Index*
CRISIL 10 year Gilt Index**
Scheme
1 Year 3.63 5.67 1.90 10,366 10,571 10,191
3 Years 6.63 7.90 6.59 12,127 12,564 12,112
5 Years 6.70 7.05 5.36 13,831 14,062 12,983
Since Inception 7.29 8.27 6.63 28,242 32,290 25,798
PeriodCAGR (%)
Value of lumpsum investment of 10,000/- ₹invested on inception date
thAbove returns are as on 28 February, 2022. Different plans shall have a different expense structure. The performance details provided herein are of Regular plan - Growth thoption. Mr. Marzban Irani is managing the above scheme from 10 August, 2016 and total no. of schemes managed by him is 5. Also, Mr. Sanjay Pawar is co managing the above
stscheme from 1 January, 2022 and total no. of schemes managed by him is 10. Past performance may or may not be sustained in the future. Load is not taken into consideration
for computation of performance. The Mutual Fund is not guaranteeing or promising or forecasting any returns. *First Tier Benchmark, ** Additional Benchmark.
* IDCW under Daily and Weekly Plan are cumulative IDCW declared during the month. After payment of the IDCW, the per Unit NAV falls to the extent of the payout and statutory levy (if applicable). There is no guarantee or assurance to the unitholders as to the rate/quantum of neither IDCW nor that the IDCWs be paid regularly. For complete IDCW
Scheme Type: An open ended debt scheme predominantly investing in debt instruments of banks, public sector undertakings, public financial institutions and municipal bonds. (A Relatively High interest rate risk and Relatively Low Credit Risk)
Date of Allotment: May 31, 2007
Fund Size:
AUM as on 28/02/2020: ₹ 1,389.96 Cr
: 1,430.17 CrAverage AUM for February 2022 ₹
Load Structure:Entry Load: Exit Load: Nil Nil
First Tier Benchmark: Nifty Banking and PSU Debt Index
Minimum Investment (lumpsum): ₹ 5,000/-
Expense Ratio:Regular: 0.83%; Direct: 0.28%(for detailed bifurcation on TER, please see page no 36)
Portfolio Metrics:Average Maturity 0.97 yearsMacaulay Duration 0.94 yearsModified Duration 0.90 yearsYTM 4.51 %
29
Company CompanyRating Rating% of NAV % of NAV
0.79%
> 91 days up to 365 Days
0.0600
October, 2020 0.0977
Oct 28, 2020 10.8833
November, 2020 0.0707
Nov 25, 2020 10.8985
CRISIL 10 year Gilt Index**
10.0000
0.0600
0.0600
Income Distribution cum Capital Withdrawal (IDCW) History
Sept 27, 2021 10.5650
An open-ended debt scheme predominantly investing in Debt Instruments of Banks, Public Sector Undertakings, Public Financial Institutions and Municipal Bonds.A Relatively High Interest Rate Risk and Relatively Low Credit Risk.
Oct 25, 2021 10.5138
January, 2022
Fund Manager:Name: Mr. Marzban Irani & Mr. Sanjay Pawar Experience: 20+ years & 14+ years respectively
January, 2022 0.0257
Factsheet March, 2022
December, 2021 0.0105
January, 2022 0.0210
0.0283February, 2022
NAV as on February 28,2022:
NAV Regular Plan Direct Plan
Growth ₹ 28.2424 ₹ 29.9346
Daily IDCW ₹ 10.8239 ₹ 12.1122
Weekly IDCW ₹ 10.0533 ₹ 10.0547
Monthly IDCW ₹ 10.5700 ₹ 10.0547
CORPORATE DEBT
NON-CONVERTIBLE DEBENTURES
Indian Railway Finance Corporation Ltd.
National Housing Bank
NTPC Ltd.
Power Grid Corporation of India Ltd.
Power Finance Corporation Ltd.
Housing & Urban Development Corp Ltd.
Hindustan Petroleum Corporation Ltd.
National Bk for Agriculture & Rural Dev.
REC Ltd.
Housing & Urban Development Corp Ltd.
Housing & Urban Development Corp Ltd.
National Bk for Agriculture & Rural Dev.
Oil & Natural Gas Corporation Ltd.
Export Import Bank of India
Indian Oil Corporation Ltd.
NON-CONVERTIBLE DEBENTURES Total
CORPORATE DEBT Total
Money Market Instruments
Certificate of Deposit
Axis Bank Ltd.
HDFC Bank Ltd.
Kotak Mahindra Bank Ltd.
Certificate of Deposit Total
Commercial Paper
Export Import Bank of India
Hindustan Petroleum Corporation Ltd.
Commercial Paper Total
Money Market Instruments Total
Government Bond And Treasury Bill
Government Bond
7.16% Govt Of India Red 20-05-2023
5.63% Govt Of India Red 12-04-2026
7.32% Govt Of India Red 28-01-2024
Government Bond Total
Treasury Bill
91 Days Tbill Red 10-03-2022
364 Days Tbill Red 03-03-2022
Treasury Bill Total
State Government Bond
7.37% Maharashtra Sdl Red 14-09-2026
State Government Bond Total
Government Bond And Treasury Bill Total
Cash & Other Receivables
Treps / Repo
Net Receivables/(payables)
Cash & Other Receivables Total
Grand Total
CRISIL AAA
CRISIL AAA
CRISIL AAA
CRISIL AAA
CRISIL AAA
FITCH AAA
CRISIL AAA
ICRA AAA
CRISIL AAA
ICRA AAA
CARE AAA
CRISIL AAA
ICRA AAA
CRISIL AAA
CRISIL AAA
CRISIL A1+
CARE A1+
CRISIL A1+
CARE A1+
CRISIL A1+
SOVEREIGN
SOVEREIGN
SOVEREIGN
SOVEREIGN
SOVEREIGN
SOVEREIGN
8.92%
7.18%
5.79%
5.07%
3.91%
3.73%
3.70%
2.65%
2.25%
1.90%
1.88%
1.87%
1.81%
1.13%
1.11%
52.89%
52.89%
8.91%
5.34%
1.78%
16.02%
8.97%
3.59%
12.56%
28.59%
5.66%
4.58%
3.78%
14.03%
1.80%
0.36%
2.16%
1.55%
1.55%
17.73%
0.92%
-0.14%
0.79%
100.00%

The primary investment objective of the scheme is to generate returns commensurate with risk from a
portfolio constituted of Debt securities and/or Money Market instruments. However, there can be no
assurance that the investment objective of the scheme will be achieved.
55.62%
37.47%
6.91%Cash & Other Receivables
> 365 Days
Up to 365 Days
SCHEME FEATURES INVESTMENT OBJECTIVE
PORTFOLIO AS ON 28.02.2022
MATURITY PROFILE (% of NAV)
RATING PROFILE (% of NAV)
Company Rating % of NAV
Scheme Type: An Open Ended Short Term Debt scheme investing in instruments with Macaulay duration between 1 year and 3 years. (please refer page no 37 of SID). (A Moderate interest rate risk and moderate Credit Risk)
Date of Allotment: February 1, 2019
Fund Size:
AUM as on 28/02/2020: ₹ 259.11 Cr
: 262.65 CrAverage AUM for February 2022 ₹
Load Structure:Entry Load: Exit Load: Nil Nil
First Tier Benchmark: CRISIL Short Term Bond Fund Index
Minimum Investment (lumpsum): ₹ 5,000/-
Fund Manager:Name: Mr. Marzban Irani Experience: 20+ years
Expense Ratio:Regular: 1.44%; Direct: 0.39%(for detailed bifurcation on TER, please see page no 36)
Portfolio Metrics:Average Maturity 1.19 yearsMacaulay Duration 1.15 yearsModified Duration 1.11 yearsYTM 4.54 %
NAV as on 2:February 28 , 202
NAV Regular Plan Direct Plan
Growth ₹ 12.0478 ₹ 12.4444
IDCW ₹ 12.0478 ₹ 12.4444
30
50.46%
42.63%
6.91%
AAA/A1+ and Equivalent
Cash & Other Receivables
Sovereign
SCHEME PERFORMANCE
Scheme CRISIL Short TermBond Fund Index*
CRISIL Short TermBond Fund Index*
CRISIL 10 YearGilt Index**
Scheme
1 Year 3.40 5.66 1.90 10,342 10,569 10,191
3 Years 6.16 11,966
NA NA
7.90 12,566
NA NA
6.59 12,112
NA NA5 Years
Since Inception 6.24 7.97 6.68 12,048 12,662 12,200
PeriodCAGR (%)
Value of lumpsum investment of 10,000/- ₹invested on inception date
thAbove returns are as on 28 February, 2022. Different plans shall have a different expense structure. The performance details provided herein are of Regular plan - Growth
stoption. Mr. Marzban Irani is managing the above scheme from 1 February, 2019 and total no. of schemes managed by him is 5. Also, Mr. Sanjay Pawar is co managing the above
st scheme from 1 September, 2020 and total no. of schemes managed by him is 10. Past performance may or may not be sustained in the future. Load is not taken into
consideration for computation of performance. Since respective schemes have not completed relevant period (3 years or 5 years) after allotment or units were not available
throughout the respective period, no returns are available. The Mutual Fund is not guaranteeing or promising or forecasting any returns. *First Tier Benchmark, ** Additional
Benchmark.
Co-Fund Manager:Name: Mr. Sanjay PawarExperience: 13+ years
CRISIL 10 YearGilt Index**
An Open Ended Short Term Debt scheme investing in instruments with Macaulay duration between 1 year and 3 years (Refer page no. 37 of the SID) A Moderate Interest Rate Risk and Moderate Credit Risk.
Factsheet March, 2022
Corporate Debt
Non-convertible Debentures
REC Ltd.
National Bk for Agriculture & Rural Dev.
Power Grid Corporation of India Ltd.
NTPC Ltd.
Export Import Bank of India
Indian Oil Corporation Ltd.
National Housing Bank
Non-convertible Debentures Total
Corporate Debt Total
Money Market Instruments
Certificate of Deposit
Axis Bank Ltd.
Certificate of Deposit Total
Money Market Instruments Total
Government Bond And Treasury Bill
Government Bond
7.35% Govt Of India Red 22-06-2024
5.15% Govt Of India Red 09-11-2025
7.16% Govt Of India Red 20-05-2023
7.32% Govt Of India Red 28-01-2024
Government Bond Total
Treasury Bill
364 Days Tbill Red 03-03-2022
364 Days Tbill Red 21-04-2022
Treasury Bill Total
Government Bond And Treasury Bill Total
Cash & Other Receivables
TREPS / Repo
Net Receivables/(Payables)
Cash & Other Receivables Total
Grand Total
CRISIL AAA
ICRA AAA
CRISIL AAA
CRISIL AAA
CRISIL AAA
CRISIL AAA
CRISIL AAA
CRISIL A1+
SOVEREIGN
SOVEREIGN
SOVEREIGN
SOVEREIGN
SOVEREIGN
SOVEREIGN
8.49%
6.10%
4.34%
4.15%
4.04%
3.96%
2.01%
33.09%
33.09%
9.54%
9.54%
9.54%
20.50%
7.68%
6.07%
0.81%
35.06%
7.72%
7.68%
15.40%
50.46%
14.72%
-7.81%
6.91%
100.00%
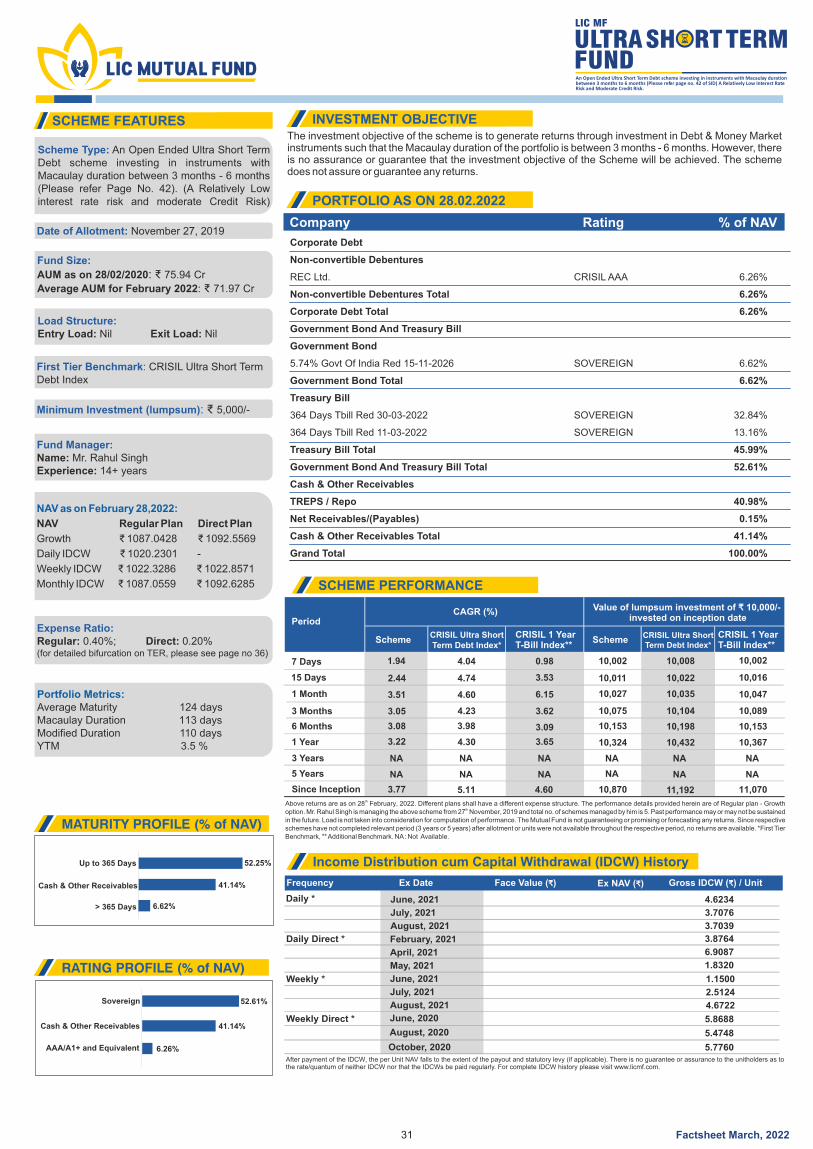
The investment objective of the scheme is to generate returns through investment in Debt & Money Market instruments such that the Macaulay duration of the portfolio is between 3 months - 6 months. However, there is no assurance or guarantee that the investment objective of the Scheme will be achieved. The scheme does not assure or guarantee any returns.
52.25%
41.14%Cash & Other Receivables
Up to 365 Days
SCHEME FEATURES INVESTMENT OBJECTIVE
PORTFOLIO AS ON 28.02.2022
MATURITY PROFILE (% of NAV)
RATING PROFILE (% of NAV)
Company Rating % of NAV
Scheme Type: An Open Ended Ultra Short Term Debt scheme investing in instruments with Macaulay duration between 3 months - 6 months (Please refer Page No. 42). (A Relatively Low interest rate risk and moderate Credit Risk)
Date of Allotment: November 27, 2019
Fund Size:
AUM as on 28/02/2020: ₹ 75.94 Cr
: 71.97 CrAverage AUM for February 2022 ₹
Load Structure:Entry Load: Exit Load: Nil Nil
First Tier Benchmark: CRISIL Ultra Short Term Debt Index
Minimum Investment (lumpsum): ₹ 5,000/-
Fund Manager:Name: Mr. Rahul Singh Experience: 14+ years
Expense Ratio:Regular: 0.40%; Direct: 0.20%(for detailed bifurcation on TER, please see page no 36)
Portfolio Metrics:Average Maturity 124 daysMacaulay Duration 113 daysModified Duration 110 daysYTM 3.5 %
31
52.61%
41.14%
AAA/A1+ and Equivalent
Sovereign
Frequency Ex Date Face Value ( )₹ Ex NAV ( )₹ Gross IDCW ( ) / Unit₹
After payment of the IDCW, the per Unit NAV falls to the extent of the payout and statutory levy (if applicable). There is no guarantee or assurance to the unitholders as to the rate/quantum of neither IDCW nor that the IDCWs be paid regularly. For complete IDCW history please visit www.licmf.com.
SCHEME PERFORMANCE
SchemeCRISIL Ultra ShortTerm Debt Index*
CRISIL Ultra ShortTerm Debt Index*
CRISIL 1 Year T-Bill Index**
CRISIL 1 Year T-Bill Index**
Scheme
1 Year
7 Days
3 Years
15 Days
10,324
NA
10,153
10,002
10,011
10,027
10,075
NA
3.22
NA
3.08
1.94
2.44
3.51
3.05
NA
10,432
NA
10,198
10,008
10,022
10,035
10,104
NA
4.30
NA
3.98
4.04
4.74
4.60
4.23
NA
10,367
NA
10,153
10,002
10,016
10,047
10,089
NA
3.65
NA
3.09
0.98
3.53
6.15
3.62
NA5 Years
1 Month
3 Months
6 Months
Since Inception 3.77 5.11 4.60 10,870 11,192 11,070
PeriodCAGR (%)
invested on inception date
thAbove returns are as on 28 February, 2022. Different plans shall have a different expense structure. The performance details provided herein are of Regular plan - Growth
thoption. Mr. Rahul Singh is managing the above scheme from 27 November, 2019 and total no. of schemes managed by him is 5. Past performance may or may not be sustained in the future. Load is not taken into consideration for computation of performance. The Mutual Fund is not guaranteeing or promising or forecasting any returns. Since respective schemes have not completed relevant period (3 years or 5 years) after allotment or units were not available throughout the respective period, no returns are available. *First Tier Benchmark, ** Additional Benchmark. NA : Not Available.
Value of lumpsum investment of 10,000/- ₹
Daily *
August, 2021 3.7039
Daily Direct *
May, 2021
October, 2020
1.8320
5.7760
Weekly *
Weekly Direct *
6.26%
Cash & Other Receivables
August, 2021 4.6722
June, 2020 5.8688
August, 2020 5.4748
February, 2021 3.8764
Income Distribution cum Capital Withdrawal (IDCW) History
April, 2021 6.9087
June, 2021 4.6234
June, 2021 1.1500
July, 2021 3.7076
July, 2021 2.5124
An Open Ended Ultra Short Term Debt scheme investing in instruments with Macaulay duration between 3 months to 6 months (Please refer page no. 42 of SID) A Relatively Low Interest Rate Risk and Moderate Credit Risk.
6.62%> 365 Days
Factsheet March, 2022
NAV as on February 28,2022:
NAV Regular Plan Direct Plan
Growth ₹ 1087.0428 ₹ 1092.5569
Daily IDCW ₹ 1020.2301 -
Weekly IDCW ₹ 1022.3286 ₹ 1022.8571
Monthly IDCW ₹ 1087.0559 ₹ 1092.6285
Corporate Debt
Non-convertible Debentures
REC Ltd.
Non-convertible Debentures Total
Corporate Debt Total
Government Bond And Treasury Bill
Government Bond
5.74% Govt Of India Red 15-11-2026
Government Bond Total
Treasury Bill
364 Days Tbill Red 30-03-2022
364 Days Tbill Red 11-03-2022
Treasury Bill Total
Government Bond And Treasury Bill Total
Cash & Other Receivables
TREPS / Repo
Net Receivables/(Payables)
Cash & Other Receivables Total
Grand Total
CRISIL AAA
SOVEREIGN
SOVEREIGN
SOVEREIGN
6.26%
6.26%
6.26%
6.62%
6.62%
32.84%
13.16%
45.99%
52.61%
40.98%
0.15%
41.14%
100.00%

An open ended scheme which seeks to generate reasonable returns with low risk and high liquidity through
judicious mix of investment in money market instruments and quality debt instruments. However, there is no
assurance that the investment objective of the Schemes will be realized.
Frequency Ex Date Face Value ( )₹ Ex NAV ( )₹ Gross IDCW ( ) / Unit₹
Daily * Dec, 2021 2.8567
Daily Direct * Dec, 2021
Jan, 2022
Jan, 2022
3.0158
2.9925
2.8335
41.55%
38.72%
Up to 60 days
> 60 Days
SCHEME FEATURES INVESTMENT OBJECTIVE
PORTFOLIO AS ON 28.02.2022
SCHEME PERFORMANCE
MATURITY PROFILE (% of NAV)
RATING PROFILE (% of NAV)
49.25%
38.72%
AAA/A1+ and Equivalent
Sovereign
Cash & Other Receivables
12.03%
SchemeCRISIL Liquid Fund Index*
CRISIL Liquid Fund Index*
CRISIL 1 Year T-Bill Index**
CRISIL 1 Year T-Bill Index**
Scheme
1 Year
7 Days
3.31
3.40
3.65
3.62
3.65
0.98
10,331
10,007
10,365
10,007
10,365
10,002
3 Years
15 Days
4.47
3.42
4.82
3.84
5.36
3.43
11,402
10,014
11,518
10,016
11,697
10,014
5 Years
1 Month
3 Months
6 Months
5.47
3.48
3.40
3.30
5.76
3.88
3.73
3.64
5.84
6.15
3.62
3.09
13,055
10,027
10,084
10,164
13,231
10,030
10,092
10,181
13,283
10,047
10,089
10,153
Since Inception 6.94 NA 5.94 38,147 NA 31,643
PeriodCAGR (%)
invested on inception date
thAbove returns are as on 28 February, 2022. Different plans shall have a different expense structure. The performance details provided herein are of Regular plan - Growth option. Mr. Rahul Singh is managing the above scheme from 5th October, 2015 and total no. of schemes managed by him is 5. Past performance may or may not be sustained in the future. Load is not taken into consideration for computation of performance. The Mutual Fund is not guaranteeing or promising or forecasting any returns. As the scheme was launched before the launch of the benchmark index, benchmark index figures since inception or the required period are not available. *First Tier Benchmark, ** Additional Benchmark. NA : Not Available.
* IDCW under Daily and Weekly Plan are cumulative IDCW declared during the month. After payment of the IDCW, the per Unit NAV falls to the extent of the payout and statutory levy (if applicable). There is no guarantee or assurance to the unitholders as to the rate/quantum of neither IDCW nor that the IDCWs be paid regularly. For complete IDCW history please visit www.licmf.com.
Scheme Type: An open-ended liquid scheme(A Relatively Low interest rate risk and moderate Credit Risk)
Date of Allotment: March 18, 2002
Fund Size:
AUM as on 28/02/2020: ₹ 4,977.06 Cr
: 5,739.71 CrAverage AUM for February 2022 ₹
Load Structure:Entry Load: Nil Exit Load:
First Tier Benchmark: Crisil Liquid Fund Index
Minimum Investment (lumpsum): ₹ 5,000/-
Fund Manager:Name: Mr. Rahul Singh
14+ yearsExperience:
Expense Ratio:Regular: 0.25%; Direct: 0.11%(for detailed bifurcation on TER, please see page no 36)
Portfolio Metrics:Average Maturity 30 daysMacaulay Duration 30 daysModified Duration 30 daysYTM 3.62 %
32
Company Rating % of NAV
Value of lumpsum investment of 10,000/- ₹
Investor exit uponSubscription
Exit load as a % ofredemption / switch out
proceeds
Day 1 0.0070%
Day 2 0.0065%
Day 3 0.0060%
Day 4 0.0055%
Day 5 0.0050%
Day 6 0.0045%
Day 7 onwards 0.0000%
19.73%
Cash & Other Receivables
Income Distribution cum Capital Withdrawal (IDCW) History
An Open Ended Liquid Scheme. A Relatively Low Interest Rate Risk and Moderate Credit Risk.
Factsheet March, 2022
Feb, 2022 2.8128
Feb, 2022 2.6677
NAV as on 2:February 28 , 202
NAV Regular Plan Direct Plan
Growth ₹ 1000.1000 ₹ 3854.6295
IDCW ₹ 3814.6550 ₹ 1013.6000
Money Market Instruments
Certificate of Deposit
Axis Bank Ltd.
Bank of Baroda
Canara Bank
Certificate of Deposit Total
Commercial Paper
Chennai Petroleum Corporation Ltd.
Export Import Bank of India
Indian Oil Corporation Ltd.
National Bk for Agriculture & Rural Dev.
TVS Credit Services Ltd.
Kotak Securities Ltd.
Birla Group Holdings Pvt Ltd.
NTPC Ltd.
ICICI Securities Ltd.
Godrej Industries Ltd.
Commercial Paper Total
Money Market Instruments Total
Government Bond And Treasury Bill
Treasury Bill
91 DAYS TBILL RED 24-03-2022
91 DAYS TBILL RED 31-03-2022
Treasury Bill Total
Government Bond And Treasury Bill Total
Cash & Other Receivables
TREPS / Repo
Net Receivables/(Payables)
Cash & Other Receivables Total
Grand Total
CRISIL A1+
FITCH A1+
CRISIL A1+
ICRA A1+
CARE A1+
CRISIL A1+
CRISIL A1+
CRISIL A1+
ICRA A1+
CRISIL A1+
FITCH A1+
CRISIL A1+
ICRA A1+
SOVEREIGN
SOVEREIGN
4.49%
3.99%
1.99%
10.47%
8.01%
6.01%
5.00%
4.00%
3.99%
3.98%
2.51%
2.50%
1.49%
1.30%
38.78%
49.25%
7.02%
5.01%
12.03%
12.03%
38.60%
0.12%
38.72%
100.00%
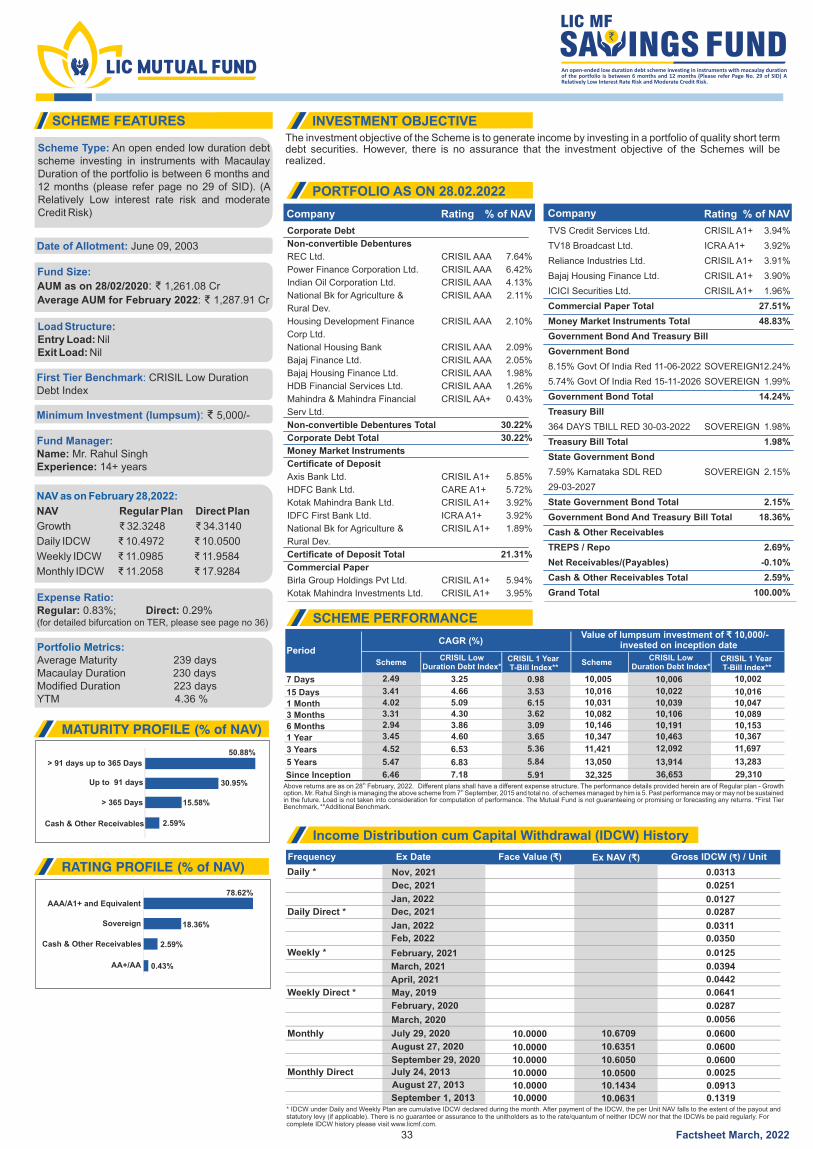
The investment objective of the Scheme is to generate income by investing in a portfolio of quality short term debt securities. However, there is no assurance that the investment objective of the Schemes will be realized.
Frequency Ex Date Face Value ( )₹ Ex NAV ( )₹ Gross IDCW ( ) / Unit₹
Daily *
Daily Direct * Dec, 2021
Jan, 2022
Jan, 2022
0.0287
0.0311
0.0127
Weekly *
April, 2021 0.0442
Weekly Direct *
March, 2020
May, 2019
0.0056
0.0641
Monthly 10.0000
September 29, 2020 10.0000
10.0000
10.6050 0.0600
Monthly Direct July 24, 2013 10.0000 10.0500 0.0025
August 27, 2013 10.0000 10.1434 0.0913
September 1, 2013 10.0000 10.0631 0.1319
50.88%
30.95%
15.58%
2.59%
Up to 91 days
> 365 Days
> 91 days up to 365 Days
Cash & Other Receivables
SCHEME FEATURES INVESTMENT OBJECTIVE
PORTFOLIO AS ON 28.02.2022
SCHEME PERFORMANCE
MATURITY PROFILE (% of NAV)
RATING PROFILE (% of NAV)
78.62%
18.36%
2.59%
0.43%
AAA/A1+ and Equivalent
AA+/AA
Sovereign
Cash & Other Receivables
SchemeCRISIL Low
Duration Debt Index*CRISIL Low
Duration Debt Index*CRISIL 1 Year T-Bill Index**
CRISIL 1 Year T-Bill Index**
Scheme
1 Year
6 Months
3 Months
1 Month
15 Days
7 Days
3.45
2.94
3.31
4.02
3.41
2.49
4.60
3.86
4.30
5.09
4.66
3.25
3.65
3.09
3.62 6.15
3.53
0.98
10,347
10,146
10,082
10,031
10,016
10,005
10,463
10,191
10,106
10,039
10,022
10,006
10,367 10,153
10,089
10,047
10,016
10,002
3 Years 4.52 6.53 5.36 11,421 12,092 11,697
5 Years 5.47 6.83 5.84 13,050 13,914 13,283
Since Inception 6.46 7.18 5.91 32,325 36,653 29,310
PeriodCAGR (%)
Value of lumpsum investment of 10,000/- ₹invested on inception date
thAbove returns are as on 28 February, 2022. Different plans shall have a different expense structure. The performance details provided herein are of Regular plan - Growth
thoption. Mr. Rahul Singh is managing the above scheme from 7 September, 2015 and total no. of schemes managed by him is 5. Past performance may or may not be sustained in the future. Load is not taken into consideration for computation of performance. The Mutual Fund is not guaranteeing or promising or forecasting any returns. *First Tier Benchmark, **Additional Benchmark.
* IDCW under Daily and Weekly Plan are cumulative IDCW declared during the month. After payment of the IDCW, the per Unit NAV falls to the extent of the payout and statutory levy (if applicable). There is no guarantee or assurance to the unitholders as to the rate/quantum of neither IDCW nor that the IDCWs be paid regularly. For complete IDCW history please visit www.licmf.com.
Scheme Type: An open ended low duration debt scheme investing in instruments with Macaulay Duration of the portfolio is between 6 months and 12 months (please refer page no 29 of SID). (A Relatively Low interest rate risk and moderate Credit Risk)
Date of Allotment: June 09, 2003
Fund Size:
AUM as on 28/02/2020: ₹ 1,261.08 Cr
: 1,287.91 CrAverage AUM for February 2022 ₹
Load Structure:Entry Load: Nil Exit Load: Nil
First Tier Benchmark: CRISIL Low Duration Debt Index
Minimum Investment (lumpsum): ₹ 5,000/-
Fund Manager:Name: Mr. Rahul Singh
14+ yearsExperience:
Expense Ratio:Regular: 0.83%; Direct: 0.29%(for detailed bifurcation on TER, please see page no 36)
Portfolio Metrics:Average Maturity 239 daysMacaulay Duration 230 daysModified Duration 223 daysYTM 4.36 %
33
February, 2020 0.0287
Dec, 2021 0.0251
Company CompanyRating Rating% of NAV % of NAV
0.0600July 29, 2020 10.6709
0.060010.6351August 27, 2020
February, 2021 0.0125
March, 2021 0.0394
Income Distribution cum Capital Withdrawal (IDCW) History
An open-ended low duration debt scheme investing in instruments with macaulay duration of the portfolio is between 6 months and 12 months (Please refer Page No. 29 of SID) A Relatively Low Interest Rate Risk and Moderate Credit Risk.
Nov, 2021 0.0313
Factsheet March, 2022
Feb, 2022 0.0350
NAV as on February 28,2022:
NAV Regular Plan Direct Plan
Growth ₹ 32.3248 ₹ 34.3140
Daily IDCW ₹ 10.4972 ₹ 10.0500
Weekly IDCW ₹ 11.0985 ₹ 11.9584
Monthly IDCW ₹ 11.2058 ₹ 17.9284
Corporate Debt
Non-convertible Debentures
REC Ltd.
Power Finance Corporation Ltd.
Indian Oil Corporation Ltd.
National Bk for Agriculture &
Rural Dev.
Housing Development Finance
Corp Ltd.
National Housing Bank
Bajaj Finance Ltd.
Bajaj Housing Finance Ltd.
HDB Financial Services Ltd.
Mahindra & Mahindra Financial
Serv Ltd.
Non-convertible Debentures Total
Corporate Debt Total
Money Market Instruments
Certificate of Deposit
Axis Bank Ltd.
HDFC Bank Ltd.
Kotak Mahindra Bank Ltd.
IDFC First Bank Ltd.
National Bk for Agriculture &
Rural Dev.
Certificate of Deposit Total
Commercial Paper
Birla Group Holdings Pvt Ltd.
Kotak Mahindra Investments Ltd.
TVS Credit Services Ltd.
TV18 Broadcast Ltd.
Reliance Industries Ltd.
Bajaj Housing Finance Ltd.
ICICI Securities Ltd.
Commercial Paper Total
Money Market Instruments Total
Government Bond And Treasury Bill
Government Bond
8.15% Govt Of India Red 11-06-2022
5.74% Govt Of India Red 15-11-2026
Government Bond Total
Treasury Bill
364 DAYS TBILL RED 30-03-2022
Treasury Bill Total
State Government Bond
7.59% Karnataka SDL RED
29-03-2027
State Government Bond Total
Government Bond And Treasury Bill Total
Cash & Other Receivables
TREPS / Repo
Net Receivables/(Payables)
Cash & Other Receivables Total
Grand Total
CRISIL AAA
CRISIL AAA
CRISIL AAA
CRISIL AAA
CRISIL AAA
CRISIL AAA
CRISIL AAA
CRISIL AAA
CRISIL AAA
CRISIL AA+
CRISIL A1+
CARE A1+
CRISIL A1+
ICRA A1+
CRISIL A1+
CRISIL A1+
CRISIL A1+
CRISIL A1+
ICRA A1+
CRISIL A1+
CRISIL A1+
CRISIL A1+
SOVEREIGN
SOVEREIGN
SOVEREIGN
SOVEREIGN
7.64%
6.42%
4.13%
2.11%
2.10%
2.09%
2.05%
1.98%
1.26%
0.43%
30.22%
30.22%
5.85%
5.72%
3.92%
3.92%
1.89%
21.31%
5.94%
3.95%
3.94%
3.92%
3.91%
3.90%
1.96%
27.51%
48.83%
12.24%
1.99%
14.24%
1.98%
1.98%
2.15%
2.15%
18.36%
2.69%
-0.10%
2.59%
100.00%
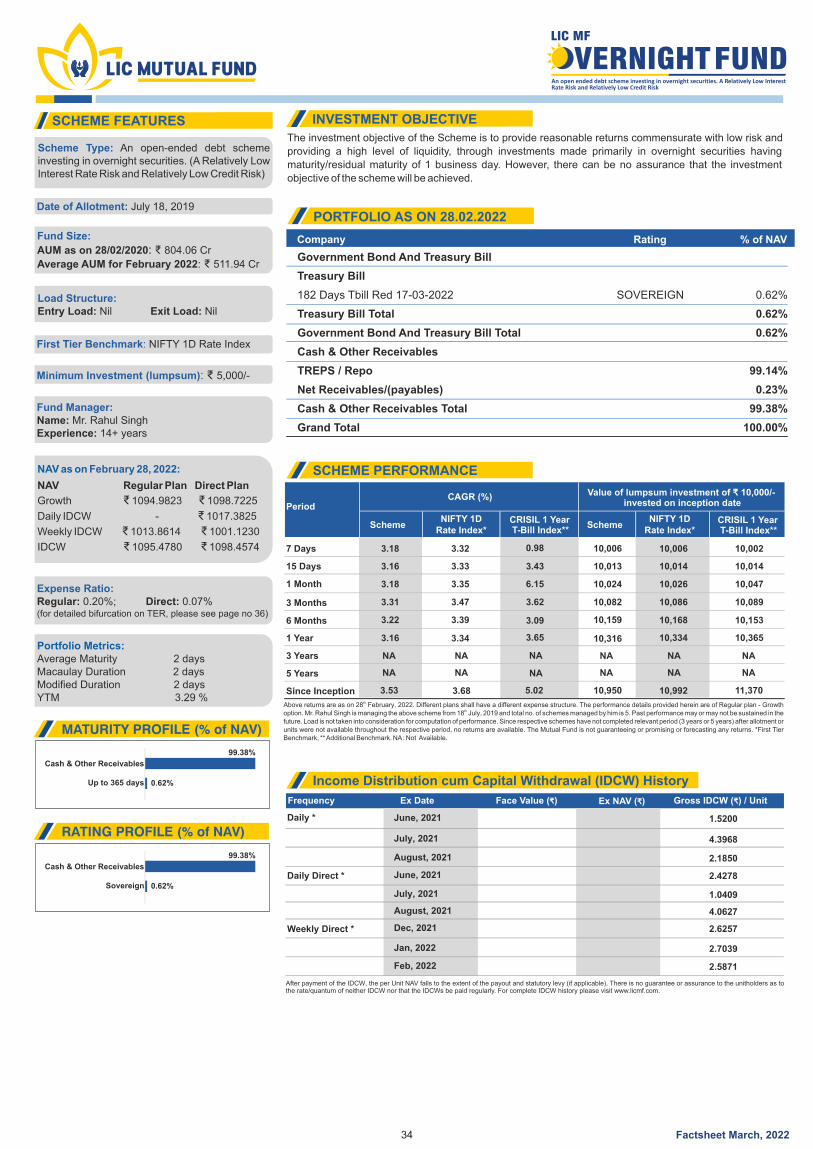
The investment objective of the Scheme is to provide reasonable returns commensurate with low risk and
providing a high level of liquidity, through investments made primarily in overnight securities having
maturity/residual maturity of 1 business day. However, there can be no assurance that the investment
objective of the scheme will be achieved.
SCHEME FEATURES INVESTMENT OBJECTIVE
PORTFOLIO AS ON 28.02.2022
Scheme Type: An open-ended debt scheme investing in overnight securities. (A Relatively Low Interest Rate Risk and Relatively Low Credit Risk)
Date of Allotment: July 18, 2019
Fund Size:
AUM as on 28/02/2020: ₹ 804.06 Cr
: 511.94 CrAverage AUM for February 2022 ₹
Load Structure:Entry Load: Exit Load: Nil Nil
First Tier Benchmark: NIFTY 1D Rate Index
Minimum Investment (lumpsum): ₹ 5,000/-
Fund Manager:Name: Mr. Rahul Singh
14+ yearsExperience:
Expense Ratio:Regular: 0.20%; Direct: 0.07%(for detailed bifurcation on TER, please see page no 36)
Portfolio Metrics:Average Maturity 2 daysMacaulay Duration 2 daysModified Duration 2 daysYTM 3.29 %
34
NAV as on 2: February 28, 202
NAV Regular Plan Direct Plan
Growth ₹ 1094.9823 ₹ 1098.7225
Daily IDCW - ₹ 1017.3825
Weekly IDCW ₹ 1013.8614 ₹ 1001.1230
IDCW ₹ 1095.4780 ₹ 1098.4574
Frequency Ex Date Face Value ( )₹ Ex NAV ( )₹ Gross IDCW ( ) / Unit₹
Daily *
Daily Direct *
Weekly Direct *
August, 2021
Dec, 2021
Jan, 2022
August, 2021
2.1850
2.6257
2.7039
4.0627
After payment of the IDCW, the per Unit NAV falls to the extent of the payout and statutory levy (if applicable). There is no guarantee or assurance to the unitholders as to the rate/quantum of neither IDCW nor that the IDCWs be paid regularly. For complete IDCW history please visit www.licmf.com.
SCHEME PERFORMANCE
SchemeNIFTY 1D
Rate Index*NIFTY 1D
Rate Index*CRISIL 1 Year T-Bill Index**
CRISIL 1 Year T-Bill Index**
Scheme
1 Year
7 Days 3.18 3.32 0.98 10,006 10,006 10,002
3 Years
15 Days 3.16 10,013
10,024
10,082
10,316
NA
10,159
NA
3.18
3.31
3.16
NA
3.22
NA
3.33 10,014
10,026
10,086
10,334
NA
10,168
NA
3.35
3.47
3.34
NA
3.39
NA
3.43 10,014
10,047
10,089
10,365
NA
10,153
NA
6.15
3.62
3.65
NA
3.09
NA5 Years
1 Month
3 Months
6 Months
Since Inception 3.53 3.68 5.02 10,950 10,992 11,370
PeriodCAGR (%)
invested on inception date
thAbove returns are as on 28 February, 2022. Different plans shall have a different expense structure. The performance details provided herein are of Regular plan - Growth
thoption. Mr. Rahul Singh is managing the above scheme from 18 July, 2019 and total no. of schemes managed by him is 5. Past performance may or may not be sustained in the future. Load is not taken into consideration for computation of performance. Since respective schemes have not completed relevant period (3 years or 5 years) after allotment or units were not available throughout the respective period, no returns are available. The Mutual Fund is not guaranteeing or promising or forecasting any returns. *First Tier Benchmark, ** Additional Benchmark. NA : Not Available.
Value of lumpsum investment of 10,000/- ₹
Income Distribution cum Capital Withdrawal (IDCW) History
June, 2021 2.4278
June, 2021 1.5200
July, 2021 1.0409
July, 2021 4.3968
An open ended debt scheme investing in overnight securities. A Relatively Low Interest Rate Risk and Relatively Low Credit Risk
LIC MF
FUNDVERNIGHT
Factsheet March, 2022
Feb, 2022 2.5871
99.38%
0.62%Up to 365 days
Cash & Other Receivables
MATURITY PROFILE (% of NAV)
RATING PROFILE (% of NAV)
99.38%
0.62%Sovereign
Cash & Other Receivables
Company Rating % of NAV
Government Bond And Treasury Bill
Treasury Bill
182 Days Tbill Red 17-03-2022
Treasury Bill Total
Government Bond And Treasury Bill Total
Cash & Other Receivables
TREPS / Repo
Net Receivables/(payables)
Cash & Other Receivables Total
Grand Total
SOVEREIGN 0.62%
0.62%
0.62%
99.14%
0.23%
99.38%
100.00%
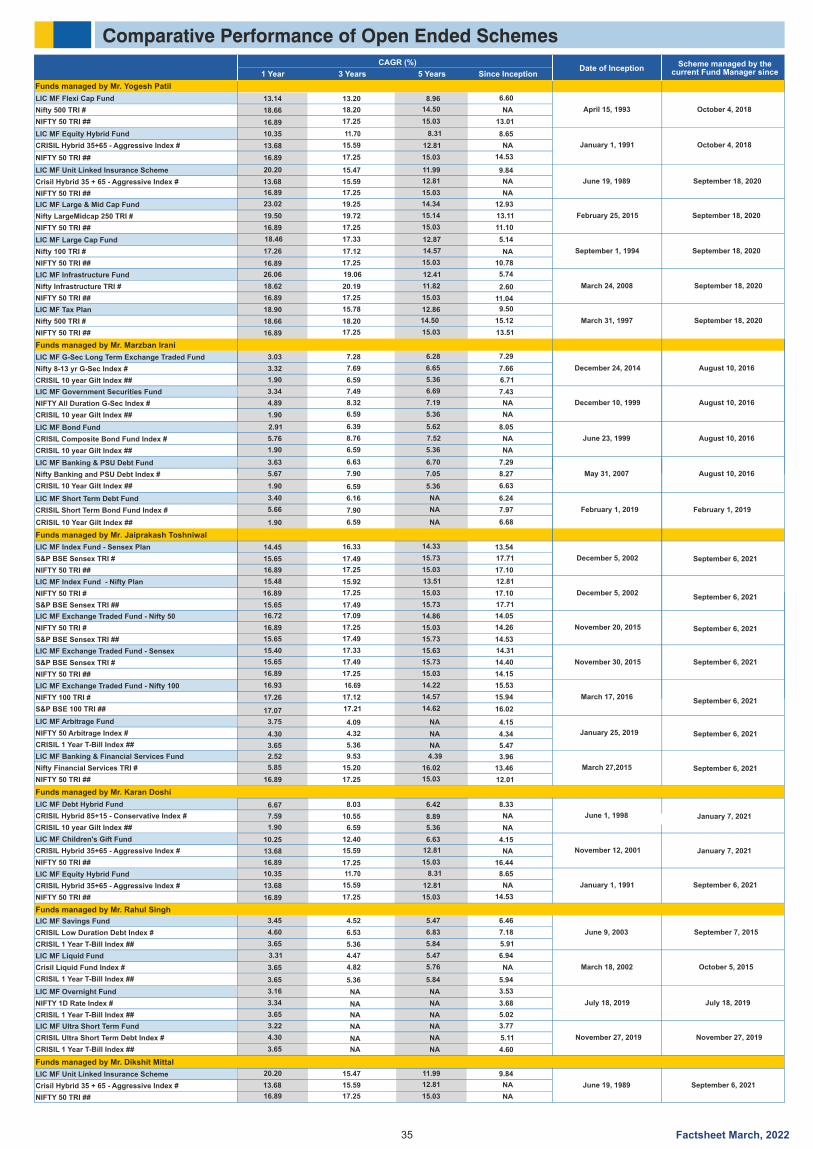
35
Comparative Performance of Open Ended Schemes
1 Year 3 Years 5 Years Since Inception
LIC MF Flexi Cap Fund 13.14
3.75 4.09
6.60
4.15
8.96
NA
Nifty 500 TRI #
4.30
18.20
13.20
4.32
NA
4.34
14.50
NA
NIFTY 50 TRI ##
18.66
16.89
3.65
17.25
5.36
13.01
5.47
15.03
NA
LIC MF Banking & Financial Services Fund 2.52 4.39 9.53 3.96
Nifty Financial Services TRI # 5.85 16.02 15.20 13.46
NIFTY 50 TRI ## 15.03 17.25 12.01
LIC MF Index Fund - Sensex Plan 14.45 16.33 13.54 14.33
S&P BSE Sensex TRI # 15.65 17.49 17.71 15.73
NIFTY 50 TRI ## 16.89 17.25 17.10 15.03
LIC MF Index Fund - Nifty Plan 15.48 15.92 12.81 13.51
NIFTY 50 TRI # 16.89 17.25 17.10 15.03
S&P BSE Sensex TRI ## 15.65 17.49 17.71 15.73
LIC MF Equity Hybrid Fund 10.35 11.70 8.65 8.31
CRISIL Hybrid 35+65 - Aggressive Index # 13.68 15.59 NA 12.81
NIFTY 50 TRI ## 16.89 17.25 14.53 15.03
1.65
LIC MF G-Sec Long Term Exchange Traded Fund 3.03 7.28 7.29 6.28
Nifty 8-13 yr G-Sec Index # 3.32 7.69 7.66 6.65
CRISIL 10 year Gilt Index ## 1.90 6.59 6.71 5.36
LIC MF Large Cap Fund 18.46 17.33 5.14 12.87
Nifty 100 TRI # 17.26 17.12 NA 14.57
NIFTY 50 TRI ## 16.89 17.25 10.78 15.03
LIC MF Large & Mid Cap Fund 23.02 19.25 12.93 14.34
Nifty LargeMidcap 250 TRI # 19.50 19.72 13.11 15.14
NIFTY 50 TRI ## 16.89 17.25 11.10
16.02
15.03
LIC MF Infrastructure Fund 26.06 19.06 5.74 12.41
Nifty Infrastructure TRI # 18.62 20.19 2.60 11.82
NIFTY 50 TRI ## 16.89 17.25 11.04 15.03
LIC MF Tax Plan 18.90 15.78 9.50 12.86
Nifty 500 TRI # 18.66 18.20 15.12 14.50
NIFTY 50 TRI ## 16.89 17.25 13.51 15.03
LIC MF Exchange Traded Fund - Nifty 50 16.72 17.09 14.05 14.86
NIFTY 50 TRI # 16.89 17.25 14.26 15.03
S&P BSE Sensex TRI ## 15.65 17.49 14.53
LIC MF Exchange Traded Fund - Sensex 15.40 17.33 14.31 15.63
S&P BSE Sensex TRI # 15.65 17.49 14.40 15.73
NIFTY 50 TRI ## 16.89 17.25 14.15 15.03
LIC MF Exchange Traded Fund - Nifty 100 16.93 16.69 15.53 14.22
NIFTY 100 TRI # 17.26 17.12 15.94 14.57
S&P BSE 100 TRI ## 17.07 17.21 14.62
LIC MF Unit Linked Insurance Scheme 20.20 15.47 9.84 11.99
Crisil Hybrid 35 + 65 - Aggressive Index # 13.68 15.59 NA 12.81
NIFTY 50 TRI ## 16.89 17.25 NA 15.03
CAGR (%)
September 18, 2020
September 18, 2020
September 18, 2020
September 18, 2020
September 18, 2020
Funds managed by Mr. Jaiprakash Toshniwal
August 10, 2016
September 1, 1994
February 25, 2015
December 24, 2014
Scheme managed by the current Fund Manager since
October 4, 2018
October 4, 2018
Funds managed by Mr. Yogesh Patil
March 24, 2008
March 31, 1997
November 20, 2015
November 30, 2015
March 17, 2016
June 19, 1989
Date of Inception
April 15, 1993
March 27,2015
December 5, 2002
December 5, 2002
January 1, 1991
Funds managed by Mr. Marzban Irani
LIC MF Arbitrage Fund
NIFTY 50 Arbitrage Index #
CRISIL 1 Year T-Bill Index ##
January 25, 2019
LIC MF Short Term Debt Fund 3.40 6.16 6.24 NA
CRISIL Short Term Bond Fund Index # 5.66 7.90 7.97 NA
CRISIL 10 Year Gilt Index ## 1.90 6.59 6.68 NA
February 1, 2019February 1, 2019
15.73
16.89
Funds managed by Mr. Karan Doshi
LIC MF Debt Hybrid Fund
CRISIL Hybrid 85+15 - Conservative Index #
CRISIL 10 year Gilt Index ##
January 7, 2021June 1, 1998
LIC MF Children's Gift Fund
CRISIL Hybrid 35+65 - Aggressive Index #
NIFTY 50 TRI ##
January 7, 2021November 12, 2001
LIC MF Equity Hybrid Fund
CRISIL Hybrid 35+65 - Aggressive Index #
NIFTY 50 TRI ##
September 6, 2021January 1, 1991
September 6, 2021
September 6, 2021
September 6, 2021
September 6, 2021
September 6, 2021
September 6, 2021
September 6, 2021
6.67 8.03 8.33 6.42
7.59
1.90
10.55 NA
NA
8.89
6.59 5.36
10.25 12.40 4.15 6.63
13.68 15.59 NA 12.81
16.89 17.25 16.44 15.03
10.35 11.70 8.65 8.31
13.68 15.59 NA 12.81
16.89 17.25 14.53 15.03
LIC MF Government Securities Fund 3.34 7.49 7.43 6.69
NIFTY All Duration G-Sec Index # 4.89 8.32 NA 7.19
CRISIL 10 year Gilt Index ## 1.90 6.59 NA 5.36
LIC MF Bond Fund 2.91 6.39 8.05 5.62
CRISIL Composite Bond Fund Index # 5.76 8.76 NA 7.52
CRISIL 10 year Gilt Index ## 1.90 6.59 NA 5.36
LIC MF Banking & PSU Debt Fund 3.63 6.63 7.29 6.70
Nifty Banking and PSU Debt Index # 5.67 7.90 8.27 7.05
CRISIL 10 Year Gilt Index ## 1.90 6.59 6.63 5.36
August 10, 2016
August 10, 2016
August 10, 2016
May 31, 2007
December 10, 1999
June 23, 1999
LIC MF Savings Fund 3.45 4.52 6.46 5.47
CRISIL Low Duration Debt Index # 4.60 6.53 7.18 6.83
CRISIL 1 Year T-Bill Index ## 3.65 5.36 5.91 5.84
LIC MF Liquid Fund 3.31 4.47 6.94 5.47
Crisil Liquid Fund Index # 3.65 4.82 NA 5.76
CRISIL 1 Year T-Bill Index ## 3.65 5.36 5.94 5.84
October 5, 2015
September 7, 2015
Funds managed by Mr. Rahul Singh
June 9, 2003
March 18, 2002
LIC MF Overnight Fund 3.16 3.53
NIFTY 1D Rate Index # 3.34 3.68
CRISIL 1 Year T-Bill Index ## 3.65 5.02
July 18, 2019
NA NA
NA NA
NA NA
July 18, 2019
LIC MF Ultra Short Term Fund 3.22 3.77
CRISIL Ultra Short Term Debt Index # 4.30 5.11
CRISIL 1 Year T-Bill Index ## 3.65 4.60
November 27, 2019
NA NA
NA NA
NA NA
November 27, 2019
Funds managed by Mr. Dikshit Mittal
LIC MF Unit Linked Insurance Scheme
Crisil Hybrid 35 + 65 - Aggressive Index #
NIFTY 50 TRI ##
September 6, 2021June 19, 1989
20.20 15.47 9.84 11.99
13.68 15.59 NA 12.81
16.89 17.25 NA 15.03
Factsheet March, 2022
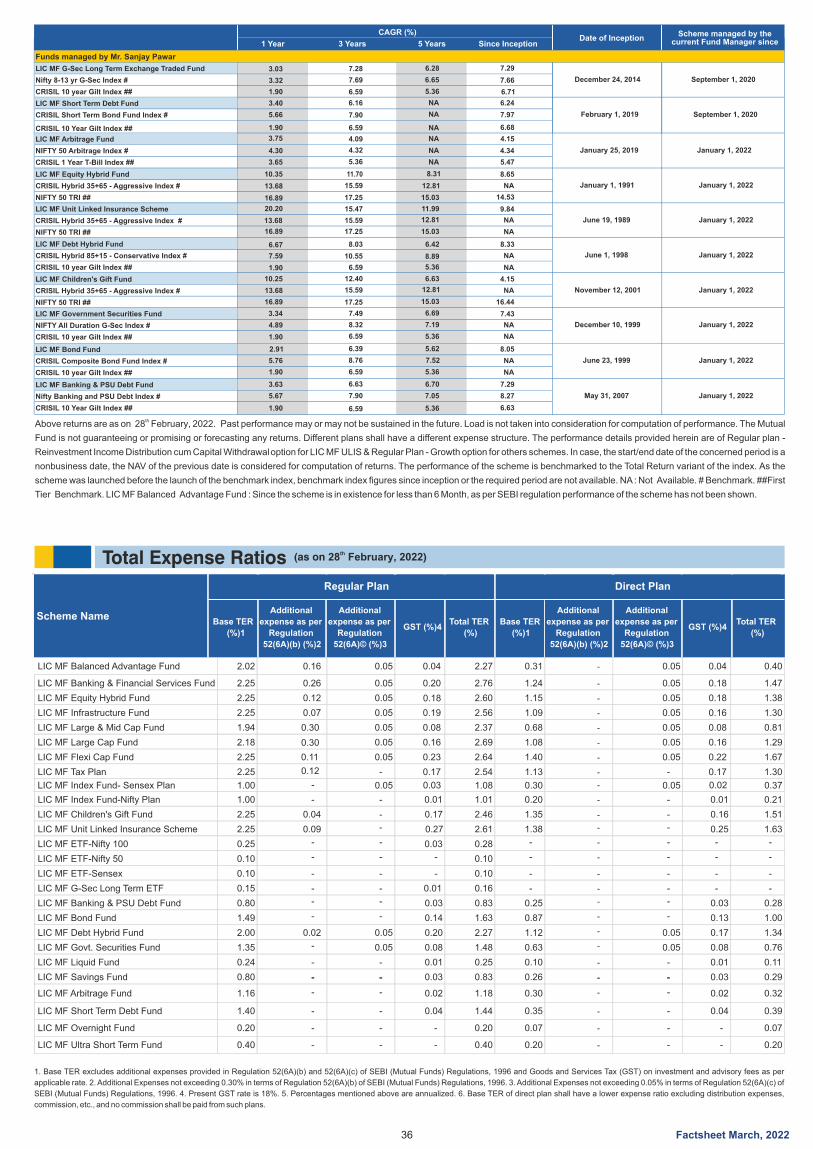
Total Expense Ratios th(as on 28 February, 2022)
1. Base TER excludes additional expenses provided in Regulation 52(6A)(b) and 52(6A)(c) of SEBI (Mutual Funds) Regulations, 1996 and Goods and Services Tax (GST) on investment and advisory fees as per
applicable rate. 2. Additional Expenses not exceeding 0.30% in terms of Regulation 52(6A)(b) of SEBI (Mutual Funds) Regulations, 1996. 3. Additional Expenses not exceeding 0.05% in terms of Regulation 52(6A)(c) of
SEBI (Mutual Funds) Regulations, 1996. 4. Present GST rate is 18%. 5. Percentages mentioned above are annualized. 6. Base TER of direct plan shall have a lower expense ratio excluding distribution expenses,
commission, etc., and no commission shall be paid from such plans.
Scheme NameBase TER
(%)1
Additional
expense as per
Regulation
52(6A)(b) (%)2
Additional
expense as per
Regulation
52(6A)© (%)3
GST (%)4Total TER
(%)
Base TER
(%)1
Additional
expense as per
Regulation
52(6A)(b) (%)2
Additional
expense as per
Regulation
52(6A)© (%)3
GST (%)4Total TER
(%)
Regular Plan Direct Plan
LIC MF Banking & Financial Services Fund 2.25 0.26 0.05
0.20 2.76
1.24 - 0.05 0.18 1.47
LIC MF Equity Hybrid Fund 2.25 0.12
0.05
0.18
2.60
1.15
- 0.05 0.18 1.38
LIC MF Infrastructure Fund 2.25 0.07
0.05
0.19
2.56
1.09
- 0.05 0.16 1.30
LIC MF Large & Mid Cap Fund 1.94
0.30
0.30
0.12
0.05
0.08
2.37
0.68
- 0.05 0.08 0.81
LIC MF Large Cap Fund 2.18
0.05
0.16
2.69
1.08
- 0.05 0.16 1.29
LIC MF Flexi Cap Fund 2.25 0.11
0.05
0.23
2.64
1.40
- 0.05 0.22 1.67
LIC MF Tax Plan 2.25
-
0.17
2.54
1.13
- - 0.17 1.30
LIC MF Index Fund- Sensex Plan 1.00
- 0.03
0.05
1.08
0.30
- 0.020.05 0.37
LIC MF Index Fund-Nifty Plan 1.00
-
- 0.01
1.01
0.20
- - 0.01 0.21
LIC MF Children's Gift Fund 2.25 0.04
-
0.17
2.46
1.35
- - 0.16 1.51
LIC MF Unit Linked Insurance Scheme 2.25 0.09
-
0.27
2.61
1.38
- - 0.25 1.63
LIC MF ETF-Nifty 100 0.25
-
- 0.03
0.28
-
- - - -
LIC MF ETF-Nifty 50 0.10
-
- -
0.10
-
- - - -
LIC MF ETF-Sensex 0.10 - - - 0.10 - - - - -
LIC MF G-Sec Long Term ETF 0.15 - - 0.01 0.16 - - - - -
LIC MF Banking & PSU Debt Fund 0.80 - - 0.03 0.83 0.25 - - 0.03 0.28
LIC MF Bond Fund 1.49 - - 0.14 1.63 0.87 - - 0.13 1.00
LIC MF Debt Hybrid Fund 2.00 0.02 0.05 0.20 2.27 1.12 - 0.05 0.17 1.34
LIC MF Govt. Securities Fund 1.35 - 0.05 0.08 1.48 0.63 - 0.05 0.08 0.76
LIC MF Liquid Fund 0.24 -
-
-
-
0.01 0.25 0.10 -
-
-
-
0.01 0.11
LIC MF Savings Fund
LIC MF Arbitrage Fund
LIC MF Short Term Debt Fund
LIC MF Overnight Fund
LIC MF Ultra Short Term Fund
0.80
1.16
1.40
0.20
0.40
-
-
-
-
-
-
-
-
-
-
0.03
0.02
0.04
-
-
0.83
1.18
1.44
0.20
0.40
0.26
0.30
0.35
0.07
0.20
-
-
-
-
-
-
-
-
-
-
0.03
0.02
0.04
-
-
0.29
0.32
0.39
0.07
0.20
36
thAbove returns are as on 28 February, 2022. Past performance may or may not be sustained in the future. Load is not taken into consideration for computation of performance. The Mutual
Fund is not guaranteeing or promising or forecasting any returns. Different plans shall have a different expense structure. The performance details provided herein are of Regular plan -
Reinvestment Income Distribution cum Capital Withdrawaloption for LIC MF ULIS & Regular Plan - Growth option for others schemes. In case, the start/end date of the concerned period is a
nonbusiness date, the NAV of the previous date is considered for computation of returns. The performance of the scheme is benchmarked to the Total Return variant of the index. As the
scheme was launched before the launch of the benchmark index, benchmark index figures since inception or the required period are not available. NA : Not Available. # Benchmark. ##First
Tier Benchmark. LIC MF Balanced Advantage Fund : Since the scheme is in existence for less than 6 Month, as per SEBI regulation performance of the scheme has not been shown.
LIC MF Balanced Advantage Fund 2.02 0.16 0.05 0.04 2.27 0.31 - 0.05 0.04 0.40
Funds managed by Mr. Sanjay Pawar
LIC MF G-Sec Long Term Exchange Traded Fund
Nifty 8-13 yr G-Sec Index #
CRISIL 10 year Gilt Index ##
September 1, 2020December 24, 2014
LIC MF Short Term Debt Fund 3.40 6.16 6.24 NA
CRISIL Short Term Bond Fund Index # 5.66 7.90 7.97 NA
CRISIL 10 Year Gilt Index ## 1.90 6.59 6.68 NA
September 1, 2020February 1, 2019
3.03 7.28 7.29 6.28
3.32 7.69 7.66 6.65
1.90 6.59 6.71 5.36
LIC MF Arbitrage Fund 3.75 4.09 4.15 NA
NIFTY 50 Arbitrage Index # 4.30 4.32 4.34 NA
CRISIL 1 Year T-Bill Index ## 3.65 5.36 5.47 NA
January 1, 2022January 25, 2019
LIC MF Unit Linked Insurance Scheme
CRISIL Hybrid 35+65 - Aggressive Index #
NIFTY 50 TRI ##
20.20 15.47 9.84 11.99
13.68 15.59 NA 12.81
16.89 17.25 NA 15.03
January 1, 2022June 19, 1989
10.35 11.70 8.65 8.31
13.68 15.59 NA 12.81
16.89 17.25 14.53 15.03
LIC MF Equity Hybrid Fund
CRISIL Hybrid 35+65 - Aggressive Index #
NIFTY 50 TRI ##
January 1, 2022January 1, 1991
6.67 8.03 8.33 6.42
7.59 10.55 NA
NA
8.89
1.90 6.59 5.36
LIC MF Debt Hybrid Fund
CRISIL Hybrid 85+15 - Conservative Index #
CRISIL 10 year Gilt Index ##
January 1, 2022June 1, 1998
10.25 12.40 4.15 6.63
13.68 15.59 NA 12.81
16.89 17.25 16.44 15.03
LIC MF Children's Gift Fund
CRISIL Hybrid 35+65 - Aggressive Index #
NIFTY 50 TRI ##
January 1, 2022November 12, 2001
LIC MF Government Securities Fund 3.34 7.49 7.43 6.69
NIFTY All Duration G-Sec Index # 4.89 8.32 NA 7.19
CRISIL 10 year Gilt Index ## 1.90 6.59 NA 5.36
LIC MF Bond Fund 2.91 6.39 8.05 5.62
CRISIL Composite Bond Fund Index # 5.76 8.76 NA 7.52
CRISIL 10 year Gilt Index ## 1.90 6.59 NA 5.36
LIC MF Banking & PSU Debt Fund 3.63 6.63 7.29 6.70
Nifty Banking and PSU Debt Index # 5.67 7.90 8.27 7.05
CRISIL 10 Year Gilt Index ## 1.90 6.59 6.63 5.36
January 1, 2022
January 1, 2022
January 1, 2022
May 31, 2007
December 10, 1999
June 23, 1999
1 Year 3 Years 5 Years Since Inception
CAGR (%) Scheme managed by the current Fund Manager sinceDate of Inception
Factsheet March, 2022
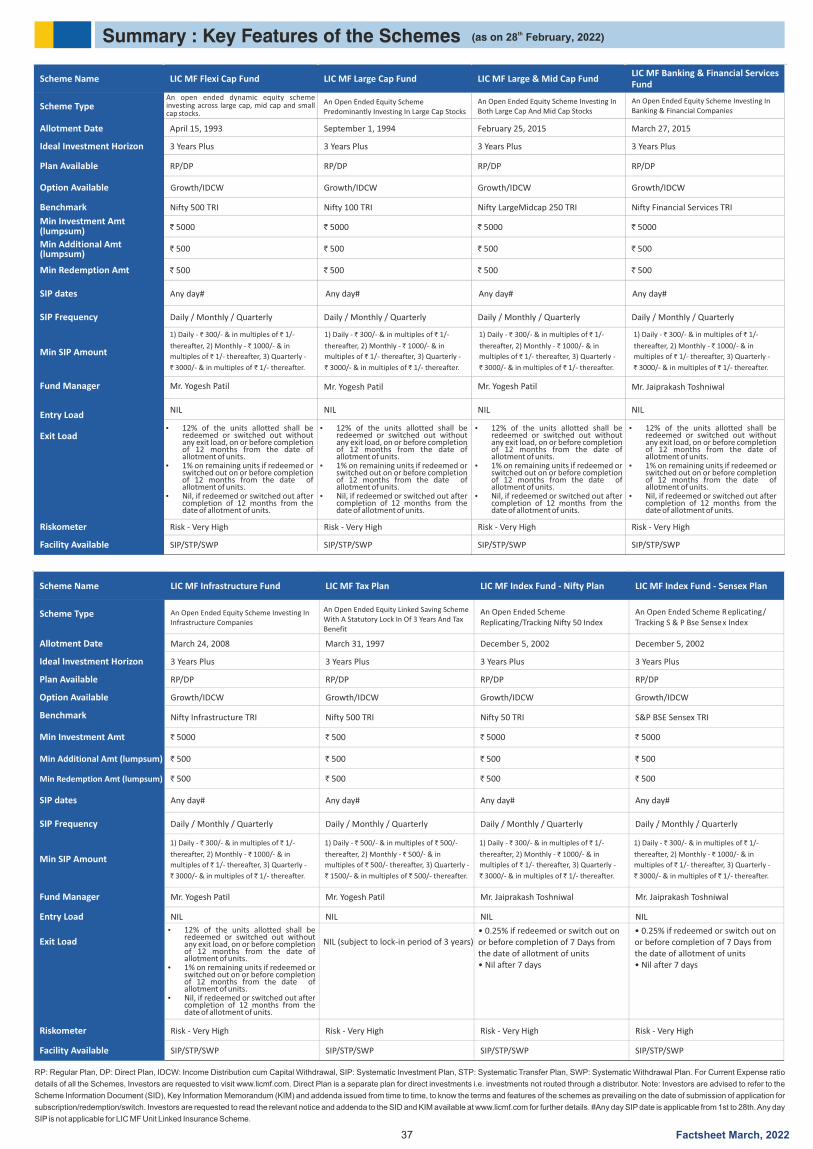
Summary : Key Features of the Schemes th(as on 28 February, 2022)
RP: Regular Plan, DP: Direct Plan, , SIP: Systematic Investment Plan, STP: Systematic Transfer Plan, SWP: Systematic Withdrawal Plan. For Current Expense ratio IDCW: Income Distribution cum Capital Withdrawal
details of all the Schemes, Investors are requested to visit www.licmf.com. Direct Plan is a separate plan for direct investments i.e. investments not routed through a distributor. Note: Investors are advised to refer to the
Scheme Information Document (SID), Key Information Memorandum (KIM) and addenda issued from time to time, to know the terms and features of the schemes as prevailing on the date of submission of application for
subscription/redemption/switch. Investors are requested to read the relevant notice and addenda to the SID and KIM available at www.licmf.com for further details. #Any day SIP date is applicable from 1st to 28th. Any day
SIP is not applicable for LIC MF Unit Linked Insurance Scheme.
Scheme Name LIC MF Flexi Cap Fund LIC MF Large Cap Fund LIC MF Large & Mid Cap FundLIC MF Banking & Financial ServicesFund
Scheme TypeAn open ended dynamic equity scheme investing across large cap, mid cap and small cap stocks.
An Open Ended Equity Scheme Predominantly Investing In Large Cap Stocks
An Open Ended Equity Scheme Investing In Both Large Cap And Mid Cap Stocks
An Open Ended Equity Scheme Investing In Banking & Financial Companies
Allotment Date April 15, 1993 September 1, 1994 February 25, 2015 March 27, 2015
Ideal Investment Horizon 3 Years Plus 3 Years Plus 3 Years Plus 3 Years Plus
Plan Available RP/DP RP/DP RP/DP RP/DP
Option Available Growth/IDCW Growth/IDCW Growth/IDCW
Benchmark Nifty 500 TRI Nifty 100 TRI Nifty LargeMidcap 250 TRI Nifty Financial Services TRI
Min Investment Amt(lumpsum) ` 5000 ` 5000 ` 5000 ` 5000
Min Additional Amt(lumpsum)
` 500 ` 500 ` 500 ` 500
Min Redemption Amt ` 500 ` 500 ` 500 ` 500
SIP dates Any day# Any day# Any day# Any day#
SIP Frequency Daily / Monthly / Quarterly Daily / Monthly / Quarterly Daily / Monthly / Quarterly Daily / Monthly / Quarterly
Min SIP Amountthereafter, 2) Monthly - ` 1000/- & in
1) Daily - ` 300/- & in multiples of ` 1/-
multiples of ` 1/- thereafter, 3) Quarterly -
` 3000/- & in multiples of ` 1/- thereafter.
thereafter, 2) Monthly - ` 1000/- & in
1) Daily - ` 300/- & in multiples of ` 1/-
multiples of ` 1/- thereafter, 3) Quarterly -
` 3000/- & in multiples of ` 1/- thereafter.
thereafter, 2) Monthly - ` 1000/- & in
1) Daily - ` 300/- & in multiples of ` 1/-
multiples of ` 1/- thereafter, 3) Quarterly -
` 3000/- & in multiples of ` 1/- thereafter.
thereafter, 2) Monthly - ` 1000/- & in
1) Daily - ` 300/- & in multiples of ` 1/-
multiples of ` 1/- thereafter, 3) Quarterly -
` 3000/- & in multiples of ` 1/- thereafter.
Fund Manager Mr. Yogesh Patil Mr. Yogesh Patil Mr. Yogesh Patil Mr. Jaiprakash Toshniwal
Entry LoadNIL NIL NIL NIL
Exit Load
• 0.25% if redeemed or switch out onor before completion of 7 Days fromthe date of allotment of units• Nil after 7 days
Riskometer Risk - Very High Risk - Very High Risk - Very High Risk - Very High
Facility Available SIP/STP/SWP SIP/STP/SWP SIP/STP/SWP SIP/STP/SWP
Scheme Name LIC MF Infrastructure Fund LIC MF Tax Plan LIC MF Index Fund - Nifty Plan LIC MF Index Fund - Sensex Plan
Scheme Type An Open Ended Equity Scheme Investing In Infrastructure Companies
An Open Ended Equity Linked Saving Scheme With A Statutory Lock In Of 3 Years And Tax Benefit
An Open Ended Scheme Replicating/Tracking Nifty 50 Index
An Open Ended Scheme Replicating/ Tracking S & P Bse Sensex Index
Allotment Date March 24, 2008 March 31, 1997 December 5, 2002 December 5, 2002
Ideal Investment Horizon 3 Years Plus 3 Years Plus 3 Years Plus 3 Years Plus
Plan Available RP/DP RP/DP RP/DP RP/DP
Option Available Growth/IDCW Growth/IDCW Growth/IDCW Growth/IDCW
Benchmark Nifty Infrastructure TRI Nifty 500 TRI Nifty 50 TRI S&P BSE Sensex TRI
Min Investment Amt ` 5000 ` 500 ` 5000 ` 5000
Min Additional Amt (lumpsum) ` 500 ` 500 ` 500 ` 500
Min Redemption Amt (lumpsum) ` 500 ` 500 ` 500 ` 500
SIP dates Any day# Any day# Any day# Any day#
SIP Frequency Daily / Monthly / Quarterly Daily / Monthly / Quarterly Daily / Monthly / Quarterly Daily / Monthly / Quarterly
Min SIP Amount
Fund Manager Mr. Yogesh Patil Mr. Yogesh Patil Mr. Jaiprakash Toshniwal Mr. Jaiprakash Toshniwal
Entry Load NIL NIL NIL NIL
Exit Load NIL (subject to lock-in period of 3 years)
Riskometer Risk - Very High Risk - Very High Risk - Very High Risk - Very High
Facility Available SIP/STP/SWP SIP/STP/SWP SIP/STP/SWP SIP/STP/SWP
thereafter, 2) Monthly - ` 1000/- & in
1) Daily - ` 300/- & in multiples of ` 1/-
multiples of ` 1/- thereafter, 3) Quarterly -
` 3000/- & in multiples of ` 1/- thereafter.
thereafter, 2) Monthly - ` 500/- & in
1) Daily - ` 500/- & in multiples of ` 500/-
multiples of ` 500/- thereafter, 3) Quarterly -
` 1500/- & in multiples of ` 500/- thereafter.
thereafter, 2) Monthly - ` 1000/- & in
1) Daily - ` 300/- & in multiples of ` 1/-
multiples of ` 1/- thereafter, 3) Quarterly -
` 3000/- & in multiples of ` 1/- thereafter.
thereafter, 2) Monthly - ` 1000/- & in
1) Daily - ` 300/- & in multiples of ` 1/-
multiples of ` 1/- thereafter, 3) Quarterly -
` 3000/- & in multiples of ` 1/- thereafter.
37
Ÿ 12% of the units allotted shall be redeemed or switched out without any exit load, on or before completion of 12 months from the date of allotment of units.
Ÿ 1% on remaining units if redeemed or switched out on or before completion of 12 months from the date of allotment of units.
Ÿ Nil, if redeemed or switched out after completion of 12 months from the date of allotment of units.
• 0.25% if redeemed or switch out onor before completion of 7 Days fromthe date of allotment of units• Nil after 7 days
Growth/IDCW
Factsheet March, 2022
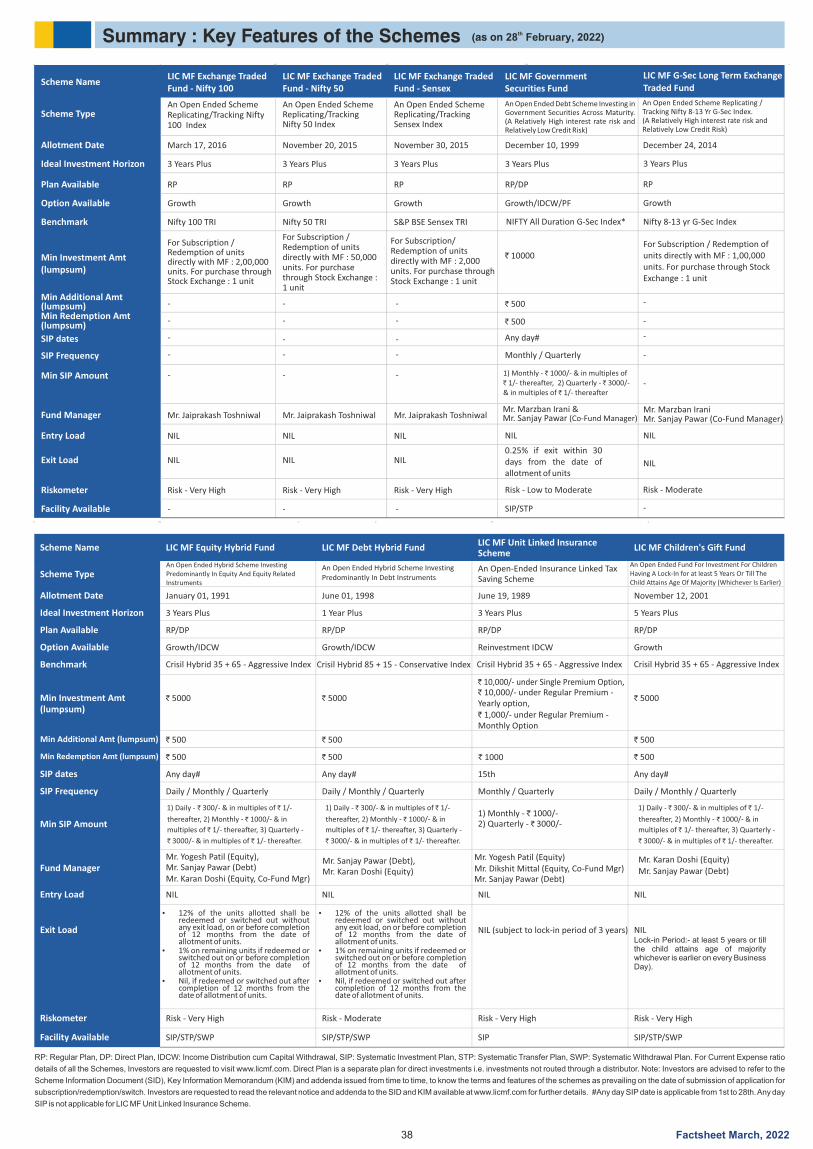
Summary : Key Features of the Schemes th(as on 28 February, 2022)
RP: Regular Plan, DP: Direct Plan, SIP: Systematic Investment Plan, STP: Systematic Transfer Plan, SWP: Systematic Withdrawal Plan. For Current Expense ratio IDCW: Income Distribution cum Capital Withdrawal,
details of all the Schemes, Investors are requested to visit www.licmf.com. Direct Plan is a separate plan for direct investments i.e. investments not routed through a distributor. Note: Investors are advised to refer to the
Scheme Information Document (SID), Key Information Memorandum (KIM) and addenda issued from time to time, to know the terms and features of the schemes as prevailing on the date of submission of application for
subscription/redemption/switch. Investors are requested to read the relevant notice and addenda to the SID and KIM available at www.licmf.com for further details. #Any day SIP date is applicable from 1st to 28th. Any day
SIP is not applicable for LIC MF Unit Linked Insurance Scheme.
Scheme NameLIC MF Exchange Traded Fund - Nifty 100
LIC MF Exchange Traded Fund - Nifty 50
LIC MF Exchange Traded Fund - Sensex
Scheme TypeAn Open Ended Scheme Replicating/Tracking Nifty 100 Index
An Open Ended Scheme Replicating/Tracking Nifty 50 Index
An Open Ended Scheme Replicating/Tracking Sensex Index
Allotment Date March 17, 2016 November 20, 2015 November 30, 2015
Ideal Investment Horizon 3 Years Plus 3 Years Plus 3 Years Plus
Plan Available RP RP RP
Option Available Growth Growth Growth
Benchmark Nifty 100 TRI Nifty 50 TRI S&P BSE Sensex TRI
Min Investment Amt(lumpsum)
For Subscription / Redemption of units directly with MF : 2,00,000 units. For purchase through Stock Exchange : 1 unit
For Subscription / Redemption of units directly with MF : 50,000 units. For purchase through Stock Exchange : 1 unit
For Subscription/ Redemption of units directly with MF : 2,000 units. For purchase through Stock Exchange : 1 unit
Min Additional Amt(lumpsum)Min Redemption Amt(lumpsum)
SIP dates
SIP Frequency
Min SIP Amount
Fund Manager Mr. Jaiprakash Toshniwal Mr. Jaiprakash Toshniwal Mr. Jaiprakash Toshniwal
Entry Load NIL
- - -
-
-
- - -
- -
- -
-
-
-
-
-
-
NIL NIL
Exit Load NIL NIL NIL
Riskometer Risk - Very High Risk - Very High Risk - Very High
Facility Available
Scheme Name LIC MF Equity Hybrid Fund LIC MF Debt Hybrid FundLIC MF Unit Linked InsuranceScheme
LIC MF Children's Gift Fund
Scheme TypeAn Open Ended Hybrid Scheme Investing Predominantly In Equity And Equity Related Instruments
An Open Ended Hybrid Scheme Investing Predominantly In Debt Instruments
An Open-Ended Insurance Linked Tax Saving Scheme
An Open Ended Fund For Investment For Children Having A Lock-In for at least 5 Years Or Till The Child Attains Age Of Majority (Whichever Is Earlier)
Allotment Date January 01, 1991 June 01, 1998 June 19, 1989 November 12, 2001
Ideal Investment Horizon 3 Years Plus 1 Year Plus 3 Years Plus 5 Years Plus
Plan Available RP/DP RP/DP RP/DP RP/DP
Option Available Growth/IDCW Growth/IDCW Reinvestment IDCW Growth
Benchmark Crisil Hybrid 35 + 65 - Aggressive Index Crisil Hybrid 35 + 65 - Aggressive Index Crisil Hybrid 35 + 65 - Aggressive IndexCrisil Hybrid 85 + 15 - Conservative Index
Min Investment Amt(lumpsum)
` 5000 ` 5000
` 10,000/- under Single Premium Option, ` 10,000/- under Regular Premium - Yearly option, 1,000/- under Regular Premium - `
Monthly Option
` 5000
Min Additional Amt (lumpsum) ` 500 ` 500 ` 500
Min Redemption Amt (lumpsum) ` 500 ` 500 ` 1000 ` 500
SIP dates Any day# Any day# 15th Any day#
SIP Frequency Daily / Monthly / Quarterly Daily / Monthly / Quarterly Monthly / Quarterly Daily / Monthly / Quarterly
Min SIP Amount1) Monthly - ` 1000/- 2) Quarterly - ` 3000/-
Fund ManagerMr. Yogesh Patil (Equity), Mr. Sanjay Pawar (Debt)Mr. Karan Doshi (Equity, Co-Fund Mgr)
Mr. Sanjay Pawar (Debt), Mr. Karan Doshi (Equity)
Mr. Yogesh Patil (Equity)Mr. Dikshit Mittal (Equity, Co-Fund Mgr)Mr. Sanjay Pawar (Debt)
Mr. Sanjay Pawar (Debt) Mr. Karan Doshi (Equity)
Entry Load NIL NIL NIL NIL
Exit Load NIL (subject to lock-in period of 3 years) NILLock-in Period:- at least 5 years or till the child attains age of majority whichever is earlier on every Business Day).
Riskometer Risk - Very High Risk - Moderate Risk - Very High Risk - Very High
Facility Available SIP/STP/SWP SIP/STP/SWP SIP SIP/STP/SWP
thereafter, 2) Monthly - ` 1000/- & in
1) Daily - ` 300/- & in multiples of ` 1/-
multiples of ` 1/- thereafter, 3) Quarterly -
` 3000/- & in multiples of ` 1/- thereafter.
thereafter, 2) Monthly - ` 1000/- & in
1) Daily - ` 300/- & in multiples of ` 1/-
multiples of ` 1/- thereafter, 3) Quarterly -
` 3000/- & in multiples of ` 1/- thereafter.
thereafter, 2) Monthly - ` 1000/- & in
1) Daily - ` 300/- & in multiples of ` 1/-
multiples of ` 1/- thereafter, 3) Quarterly -
` 3000/- & in multiples of ` 1/- thereafter.
LIC MF Government Securities Fund
An Open Ended Debt Scheme Investing in Government Securities Across Maturity. (A Relatively High interest rate risk and Relatively Low Credit Risk)
December 10, 1999
3 Years Plus
RP/DP
Growth/IDCW/PF
NIFTY All Duration G-Sec Index*
` 10000
` 500
` 500
Any day#
Monthly / Quarterly
1) Monthly - 1000/- & in multiples of `
` ` 1/- thereafter, 2) Quarterly - 3000/- & in multiples of 1/- thereafter `
Mr. Marzban Irani &Mr. Sanjay Pawar (Co-Fund Manager)
NIL
0.25% if exit within 30 days from the date of allotment of units
Risk - Low to Moderate
SIP/STP
LIC MF G-Sec Long Term Exchange
Traded Fund
An Open Ended Scheme Replicating / Tracking Nifty 8-13 Yr G-Sec Index. (A Relatively High interest rate risk and Relatively Low Credit Risk)
December 24, 2014
3 Years Plus
RP
-
-
-
-
-
-
Growth
Nifty 8-13 yr G-Sec Index
For Subscription / Redemption of units directly with MF : 1,00,000 units. For purchase through Stock Exchange : 1 unit
Mr. Marzban Irani
NIL
NIL
Risk - Moderate
38
Ÿ 12% of the units allotted shall be redeemed or switched out without any exit load, on or before completion of 12 months from the date of allotment of units.
Ÿ 1% on remaining units if redeemed or switched out on or before completion of 12 months from the date of allotment of units.
Ÿ Nil, if redeemed or switched out after completion of 12 months from the date of allotment of units.
Mr. Sanjay Pawar (Co-Fund Manager)
Factsheet March, 2022
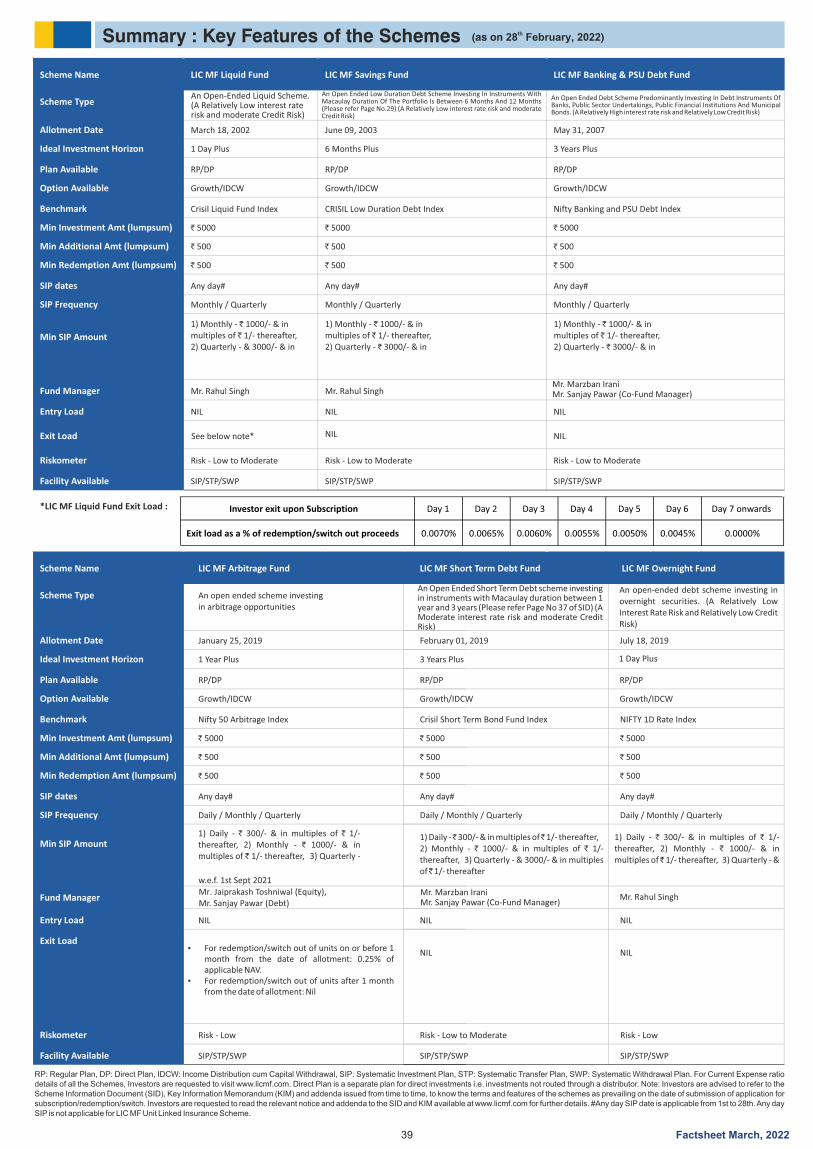
Summary : Key Features of the Schemes
RP: Regular Plan, DP: Direct Plan, SIP: Systematic Investment Plan, STP: Systematic Transfer Plan, SWP: Systematic Withdrawal Plan. For Current Expense ratio IDCW: Income Distribution cum Capital Withdrawal,details of all the Schemes, Investors are requested to visit www.licmf.com. Direct Plan is a separate plan for direct investments i.e. investments not routed through a distributor. Note: Investors are advised to refer to the Scheme Information Document (SID), Key Information Memorandum (KIM) and addenda issued from time to time, to know the terms and features of the schemes as prevailing on the date of submission of application for subscription/redemption/switch. Investors are requested to read the relevant notice and addenda to the SID and KIM available at www.licmf.com for further details. #Any day SIP date is applicable from 1st to 28th. Any day SIP is not applicable for LIC MF Unit Linked Insurance Scheme.
Scheme Name
Scheme Name
LIC MF Liquid Fund
LIC MF Arbitrage Fund LIC MF Short Term Debt Fund LIC MF Overnight Fund
LIC MF Savings Fund LIC MF Banking & PSU Debt Fund
Scheme Type
Scheme Type
An Open-Ended Liquid Scheme. (A Relatively Low interest rate risk and moderate Credit Risk)
An open ended scheme investing in arbitrage opportunities
An Open Ended Short Term Debt scheme investing in instruments with Macaulay duration between 1 year and 3 years (Please refer Page No 37 of SID) (A Moderate interest rate risk and moderate Credit Risk)
An open-ended debt scheme investing in overnight securities. (A Relatively Low Interest Rate Risk and Relatively Low Credit Risk)
An Open Ended Low Duration Debt Scheme Investing In Instruments With Macaulay Duration Of The Portfolio Is Between 6 Months And 12 Months (Please refer Page No.29) (A Relatively Low interest rate risk and moderate Credit Risk)
An Open Ended Debt Scheme Predominantly Investing In Debt Instruments Of Banks, Public Sector Undertakings, Public Financial Institutions And Municipal Bonds. (A Relatively High interest rate risk and Relatively Low Credit Risk)
Allotment Date
Allotment Date
March 18, 2002
January 25, 2019 February 01, 2019 July 18, 2019
June 09, 2003 May 31, 2007
Ideal Investment Horizon
Ideal Investment Horizon
1 Day Plus
1 Day Plus1 Year Plus 3 Years Plus
6 Months Plus 3 Years Plus
Plan Available
Plan Available
RP/DP
RP/DP RP/DP RP/DP
RP/DP RP/DP
Option Available
Option Available
Growth/IDCW
Growth/IDCW Growth/IDCW Growth/IDCW
Growth/IDCW Growth/IDCW
Benchmark
Benchmark
Crisil Liquid Fund Index
Nifty 50 Arbitrage Index Crisil Short Term Bond Fund Index NIFTY 1D Rate Index
CRISIL Low Duration Debt Index Nifty Banking and PSU Debt Index
Min Investment Amt (lumpsum)
Min Investment Amt (lumpsum)
` 5000
` 5000 ` 5000 ` 5000
` 5000 ` 5000
Min Additional Amt (lumpsum)
Min Additional Amt (lumpsum)
` 500
` 500 ` 500 ` 500
` 500 ` 500
Min Redemption Amt (lumpsum)
Min Redemption Amt (lumpsum)
` 500
` 500 ` 500 ` 500
` 500 ` 500
SIP dates
SIP dates
Any day#
Any day# Any day# Any day#
Any day# Any day#
SIP Frequency
SIP Frequency
Monthly / Quarterly
Daily / Monthly / Quarterly Daily / Monthly / Quarterly Daily / Monthly / Quarterly
Monthly / Quarterly Monthly / Quarterly
Min SIP Amount
Min SIP Amount
1) Monthly - ` 1000/- & in multiples of ` 1/- thereafter, 2) Quarterly - & 3000/- & in
1) Daily - ` 300/- & in multiples of ` 1/- thereafter, 2) Monthly - ` 1000/- & in multiples of ` 1/- thereafter, 3) Quarterly -
1) Daily - ̀ 300/- & in multiples of ̀ 1/- thereafter,2) Monthly - ` 1000/- & in multiples of ` 1/- thereafter, 3) Quarterly - & 3000/- & in multiples of ̀ 1/- thereafter
1) Daily - ` 300/- & in multiples of ` 1/- thereafter, 2) Monthly - ` 1000/- & in multiples of ̀ 1/- thereafter, 3) Quarterly - &
1) Monthly - ` 1000/- & in multiples of ` 1/- thereafter, 2) Quarterly - ` 3000/- & in
1) Monthly - ` 1000/- & in multiples of ` 1/- thereafter, 2) Quarterly - ` 3000/- & in
Fund Manager
Fund Manager
Mr. Rahul Singh Mr. Rahul Singh
Entry Load
Entry Load
NIL
NIL NIL NIL
NIL NIL
NIL
NIL
NIL
Exit Load
Exit Load
See below note* NIL
Riskometer
Riskometer
Risk - Low to Moderate
Risk - Low Risk - Low to Moderate Risk - Low
Risk - Low to Moderate Risk - Low to Moderate
Facility Available
*LIC MF Liquid Fund Exit Load :
Facility Available
SIP/STP/SWP
SIP/STP/SWP SIP/STP/SWP SIP/STP/SWP
SIP/STP/SWP SIP/STP/SWP
39
Mr. Jaiprakash Toshniwal (Equity),Mr. Sanjay Pawar (Debt)
Mr. Marzban IraniMr. Sanjay Pawar (Co-Fund Manager)
Mr. Rahul Singh
th(as on 28 February, 2022)
Investor exit upon Subscription Day 1 Day 2 Day 3 Day 4 Day 5 Day 6 Day 7 onwards
Exit load as a % of redemption/switch out proceeds 0.0070% 0.0065% 0.0060% 0.0055% 0.0050% 0.0045% 0.0000%
w.e.f. 1st Sept 2021
Ÿ For redemption/switch out of units on or before 1 month from the date of allotment: 0.25% of applicable NAV.
Ÿ For redemption/switch out of units after 1 month from the date of allotment: Nil
Mr. Marzban IraniMr. Sanjay Pawar (Co-Fund Manager)
Factsheet March, 2022
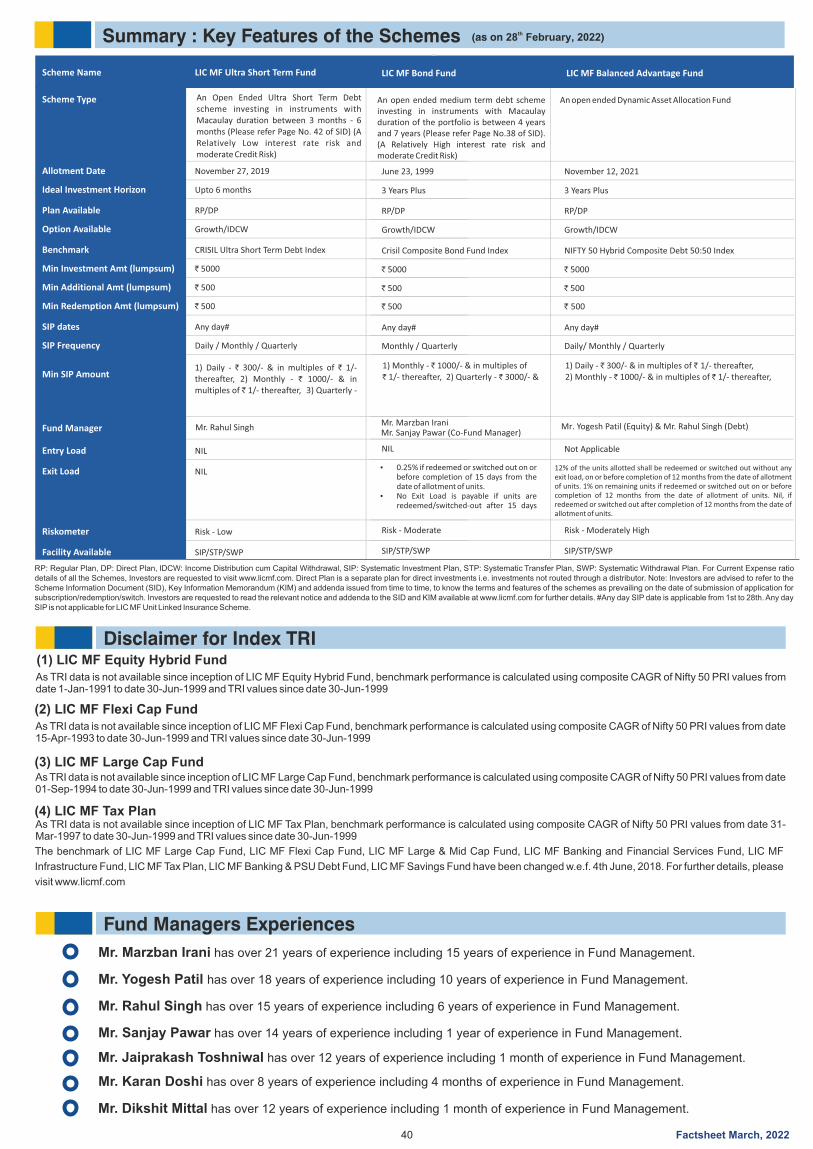
Summary : Key Features of the Schemes
RP: Regular Plan, DP: Direct Plan, SIP: Systematic Investment Plan, STP: Systematic Transfer Plan, SWP: Systematic Withdrawal Plan. For Current Expense ratio IDCW: Income Distribution cum Capital Withdrawal,details of all the Schemes, Investors are requested to visit www.licmf.com. Direct Plan is a separate plan for direct investments i.e. investments not routed through a distributor. Note: Investors are advised to refer to the Scheme Information Document (SID), Key Information Memorandum (KIM) and addenda issued from time to time, to know the terms and features of the schemes as prevailing on the date of submission of application for subscription/redemption/switch. Investors are requested to read the relevant notice and addenda to the SID and KIM available at www.licmf.com for further details. #Any day SIP date is applicable from 1st to 28th. Any day SIP is not applicable for LIC MF Unit Linked Insurance Scheme.
Scheme Name LIC MF Ultra Short Term Fund
Scheme Type An Open Ended Ultra Short Term Debt scheme investing in instruments with Macaulay duration between 3 months - 6 months (Please refer Page No. 42 of SID) (A Relatively Low interest rate risk and moderate Credit Risk)
Allotment Date November 27, 2019
Ideal Investment Horizon Upto 6 months
Plan Available RP/DP
Option Available Growth/IDCW
Benchmark CRISIL Ultra Short Term Debt Index
Min Investment Amt (lumpsum) ` 5000
Min Additional Amt (lumpsum) ` 500
Min Redemption Amt (lumpsum) ` 500
SIP dates Any day#
SIP Frequency Daily / Monthly / Quarterly
Min SIP Amount1) Daily - ` 300/- & in multiples of ` 1/- thereafter, 2) Monthly - ` 1000/- & in multiples of ` 1/- thereafter, 3) Quarterly -
Fund Manager
Entry Load NIL
Exit Load
Riskometer Risk - Low
Facility Available SIP/STP/SWP
40
Mr. Rahul Singh
th(as on 28 February, 2022)
NIL
1) Monthly - ` 1000/- & in multiples of ` 1/- thereafter, 2) Quarterly - ` 3000/- &
LIC MF Bond Fund
An open ended medium term debt scheme investing in instruments with Macaulay duration of the portfolio is between 4 years and 7 years (Please refer Page No.38 of SID). (A Relatively High interest rate risk and moderate Credit Risk)
June 23, 1999
3 Years Plus
RP/DP
Growth/IDCW
Crisil Composite Bond Fund Index
` 5000
` 500
` 500
Any day#
Monthly / Quarterly
NIL
Risk - Moderate
SIP/STP/SWP
Ÿ 0.25% if redeemed or switched out on or before completion of 15 days from the date of allotment of units.
Ÿ No Exit Load is payable if units are redeemed/switched-out after 15 days
Disclaimer for Index TRI
As TRI data is not available since inception of LIC MF Equity Hybrid Fund, benchmark performance is calculated using composite CAGR of Nifty 50 PRI values from date 1-Jan-1991 to date 30-Jun-1999 and TRI values since date 30-Jun-1999
(1) LIC MF Equity Hybrid Fund
(2) LIC MF Flexi Cap Fund
(3) LIC MF Large Cap Fund
(4) LIC MF Tax Plan
As TRI data is not available since inception of LIC MF Flexi Cap Fund, benchmark performance is calculated using composite CAGR of Nifty 50 PRI values from date 15-Apr-1993 to date 30-Jun-1999 and TRI values since date 30-Jun-1999
As TRI data is not available since inception of LIC MF Large Cap Fund, benchmark performance is calculated using composite CAGR of Nifty 50 PRI values from date 01-Sep-1994 to date 30-Jun-1999 and TRI values since date 30-Jun-1999
As TRI data is not available since inception of LIC MF Tax Plan, benchmark performance is calculated using composite CAGR of Nifty 50 PRI values from date 31-Mar-1997 to date 30-Jun-1999 and TRI values since date 30-Jun-1999
The benchmark of LIC MF Large Cap Fund, LIC MF Flexi Cap Fund, LIC MF Large & Mid Cap Fund, LIC MF Banking and Financial Services Fund, LIC MF
Infrastructure Fund, LIC MF Tax Plan, LIC MF Banking & PSU Debt Fund, LIC MF Savings Fund have been changed w.e.f. 4th June, 2018. For further details, please
visit www.licmf.com
Mr. Marzban Irani has over 21 years of experience including 15 years of experience in Fund Management.
Fund Managers Experiences
Mr. Yogesh Patil has over 18 years of experience including 10 years of experience in Fund Management.
Mr. Rahul Singh has over 15 years of experience including 6 years of experience in Fund Management.
Mr. Sanjay Pawar has over 14 years of experience including 1 year of experience in Fund Management.
Mr. Karan Doshi has over 8 years of experience including 4 months of experience in Fund Management.
Mr. Jaiprakash Toshniwal has over 12 years of experience including 1 month of experience in Fund Management.
Mr. Dikshit Mittal has over 12 years of experience including 1 month of experience in Fund Management.
1) Daily - ` 300/- & in multiples of ` 1/- thereafter,2) Monthly - ` 1000/- & in multiples of ` 1/- thereafter,
An open ended Dynamic Asset Allocation Fund
November 12, 2021
3 Years Plus
RP/DP
Growth/IDCW
NIFTY 50 Hybrid Composite Debt 50:50 Index
` 5000
` 500
` 500
Any day#
Daily/ Monthly / Quarterly
Mr. Yogesh Patil (Equity) & Mr. Rahul Singh (Debt)
Not Applicable
Risk - Moderately High
SIP/STP/SWP
LIC MF Balanced Advantage Fund
12% of the units allotted shall be redeemed or switched out without any exit load, on or before completion of 12 months from the date of allotment of units. 1% on remaining units if redeemed or switched out on or before completion of 12 months from the date of allotment of units. Nil, if redeemed or switched out after completion of 12 months from the date of allotment of units.
Mr. Marzban IraniMr. Sanjay Pawar (Co-Fund Manager)
Factsheet March, 2022
41
GLOSSARY OF TERMSApplication Amount for Fresh Subscription: This is the minimum investment amount for a new investor in a mutual fund scheme
Asset allocation: Investment of certain proportions of a portfolio in different assets classes like Equity, Debt, Gold etc..
Asset allocation for Equity: The allocation is based on industry classification and not any separate sector classification.
AUM: AUM or assets under management refers to the recent / updated cumulative market value of investments managed by a mutual fund or any investment firm.
Benchmark: A group of securities, usually a market index, whose performance is used as a standard or benchmark to measure investment performance of mutual funds, among other investments. Some typical benchmarks include the Nifty, Sensex, BSE200, BSE500, 10-year Gsec.
Beta: Beta is a measure of an investment’s volatility vis-a-vis the market. Beta of less than 1 means that the security will be less volatile than the market. A beta of greater than 1 implies that the security’s price will be more volatile than the market.
Entry Load: A mutual fund may have a sales charge or load at the time of entry and/or exit to compensate the distributor/agent. Entry Load is charged at the time an investor purchases the units of a mutual fund. The entry load is added to the prevailing NAV at the time of investment. For instance, if the NAV is Rs 100 and the entry load is 1%, the investor will enter the fund at Rs 101.
Exit Load: Exit load is charged at the time an investor redeems the units of a mutual fund. The exit load is reduced from the prevailing NAV at the time of redemption. The investor will receive redemption proceed at net value of NAV less Exit Load. For instance if the NAV is Rs 100 and the exit load is 1%, the investor will receive Rs 99.
Expense ratio: The expense ratio is the annual fee that funds or ETFs charge their unit holders. It expresses the percentage of assets deducted each fiscal year for fund expenses.
Fund Manager: An Employee of the asset management company such as a mutual fund or life insurer, who manages investments of the scheme. He is usually part of a larger team of fund managers and research analysts.
Maturity profile: Maturity is a term defined with respect to Debt Instruments which have fixed maturities after which they cease to exist on payment of the principal and the stipulated interest. A fund's profile consisting of the allocation of the value of assets in terms of percentage and their time left to maturity respectively is called a maturity profile. It gives a summary of the breakup of the value of assets with different specified maturities.
Holdings: The holdings or the portfolio is a mutual fund’s latest or updated report statement of investments/securities. These are usually displayed in terms of percentage to net assets or the rupee value or both. The objective is to give investors an idea of where their money is being invested by the fund manager.
Minimum Additional Amount: This is the minimum investment amount for an existing investor in a mutual fund scheme.
Macaulay Duration: Macaulay Duration is the weighted average term to maturity of the cash flows from a bond. The weight of each cash flow is determined by dividing the present value of the cash flow by the price.
Nature of Scheme: The investment objective and underlying investments determine the nature of the mutual fund scheme. For instance, a mutual fund that aims at generating capital appreciation by investing in stock markets is an equity fund or growth fund. Likewise, a mutual fund that aims at capital preservation by investing in debt markets is a debt fund or income fund. Each of these categories may have subcategories.
NAV: The NAV or the net asset value is the total asset value per unit of the mutual fund after deducting all related and permissible expenses. The NAV is calculated at the end of every business day. It is the value at which the investor enters or exits the mutual fund.
Portfolio turnover ratio: Portfolio turnover is a measure of how frequently assets within a fund are bought and sold by the managers. This ratio measures the fund's trading activity, which is computed by taking the lesser of purchases or sales and dividing by average monthly net assets.
Portfolio Yield: Disclosure only required for Debt Funds.
Rating Profile: Mutual funds invest in securities after evaluating their creditworthiness as disclosed by the ratings. A depiction of the mutual fund in various investments based on their ratings becomes the rating profile of the fund. Typically, this is a feature of debt funds.
Risk Free Returns: MIBOR rate for 1 day. To be sourced from FIMMDA (http://www.fimmda.org) for last day of the month.
Sector allocation: Sector allocation may be defined as an allocation of funds in a certain percentage of the portfolio in different sectors of the economy.
Sharpe Ratio: The Sharpe Ratio, names after its founder, the Nobel Laureate William Sharpe, is a measure of risk-adjusted returns. It is calculated using standard deviation and excess return to determine reward per unit of risk.
SIP: SIP or systematic investment plan works on the principle of making periodic investments of a fixed sum. Its works similar to a recurring bank deposit. For instance, an investor may opt for an SIP that the invests Rs 500 every 15 of the month in an equity fund for a period of three years.
SIP Return: The SIP return calculation should be based on Rs. 10,000 invested every month. Returns would be 1 year, 3 year, 5 year, 7 year etc.
Standard Deviation: Standard deviation is a statistical measure of the range of an investment’s performance. When a mutual fund has a high standard deviation, its means its range of performance is wide, implying greater volatility.
Tracking error: Tracking error is the difference between a portfolio's returns and the benchmark or index it was meant to mimic or beat. Tracking error is sometimes called active risk.
Yield to Maturity: The Yield to Maturity or the YTM is the rate of return anticipated on a bond if held until maturity. YTM is expressed as an annual rate. The YTM factors in the bond’s current market price, par value, coupon interest rate and time to maturity.
BRANCH OFFICES Ahmedabad: Jeevan Sadan, 3rd Flr, LIC Bldg, Opp. Capital Commercial Center, Ahmedabad 380006. Tel.: 079-26588301/40380568. Bangalore: No.4, Canara Mutual Building (Opp. Cash
Pharmacy), 2nd Floor, Residency Rd, Bangalore 560025. Tel.: 080-22118478/22295598. Bhubaneswar: Plot no-2B&2C, Ground floor, Behind Ram Mandir, Unit-3, Kharavel Nagar,
Bhubaneswar 751001, Odisha. Tel.: 9439455522. Borivali: Shop No.3, Raghuviir Tower, SVP Road, Chamunda Circle, Borivali West, Mumbai-400092. Chandigarh: S.C.O.-20-30, Jeevan
Prakash Building, Ground Floor, LIC Divisional Office, Sector-17B, Chandigarh 160017. Tel.: 0172-4622030. Chennai: 15, Anna Salai, Next to V.G.P. Bldg., Chennai 600002. Tel.: 044-
28411984/28555883. Coimbatore: 'India Life Building', LIC Divisional Office, No:1543/44,Trichy Road, Coimbatore-641018. Tel.: 0422-4393014 Ernakulam: 11th Floor, Jeevan Prakash,
M.G. Road, Ernakulam, Kochi 682011. Tel.: 0484-2367643. Goa: Jeevan Vishwas Building, Edc Complex, Plot No. 2, Patto, Panaji, Goa - 403001. Tel.: 0832-2988100 Gurugram: Unit No -
208, 2nd floor, Building Vipul agora, Near Sahara Mall, MG Road, Gurugram, Haryana -122002. Guwahati: LIC Mutual Fund Asset Management Limited, Jeevan Prakash Building, Ground Floor,
S. S. Road, Fancy Bazar, Guwahati - 781 001. Hyderabad: House No. 5-9-57, 4th Floor, Jeevan Jyoti Building, Basheerbagh, Hyderabad 500029. Tel.: 040-23244445/23210572. Indore: U.V.
House, 1st Floor, Snehil 9/1-A South Tukoganj, Indore 452001. Tel.: 0731-2520262. Jaipur: LIC Divisional Office-1 Campus, Ground Floor, Jeevan Nidhi-II (Investment Building), Bhawani
Singh Road, Ambedkar Circle, Jaipur 302005. Tel.: 0141-2743620. Kanpur: Jeevan Vikas, Ground Floor, 16/98, M.G. Road, Kanpur 208001. Tel.: 0512-2360240/3244949. Kolkata: Ground
Floor, Hindustan Building Annexe, 4, Chittaranjan Avenue, Kolkata 700072. Tel.: 033-22129455. Lucknow: Jeevan Prakash, Ground Floor, Main & Annexe Building, 30, Hazratganj, Lucknow
226001. Tel.: 0522-2231186. Mangalore: LIC Mutual Fund Asset Management Limited, No. 6, Ground Floor, Popular Building, K S Rao Road, Mangalore - 575 001. Tel. No.: 0824-2411482.
Mumbai: Gr. Floor, Industrial Assurance Bldg., Opp. Churchgate Station, Mumbai 400020. Tel.: 022-22885971/22817163. Thane: 2nd Floor, Jeevan Chintamani, Near R.T.O., Eastern Express
Highway, Thane - 400 604. Tel.: 022-25804738. Nagpur: Jeevan Seva Bldg., Mount Road, Sadar, Nagpur 440001. Tel.: 0712-2542497. Nashik: Shop No.2, Ground Floor, Rajvee Enclave, New
Pandit Colony, Nashik 422002. Tel.: 0253-2579507. New Delhi: 7th Floor, Jeevan Prakash, 25 K.G. Marg, New Delhi 110001. Tel.: 011-23359190/23314396. Patna: LIC Mutual Fund Asset
Management Limited, Office No. 212, Adison Arcade, Fraser Rod, Near Maurya Hotel, Dist. Patna - 800001. Pune: LIC of India, Pune D.O.-I, 6/7, Shivaji Nagar, University Road, Pune 411005.
Tel.: 020-25537301. Raipur: 1st Floor, Phase 1, Investment Building, LIC of India, Jeevan Bima Marg, Pandri, Raipur, Chhattisgarh - 492004. Phone No.: 0771 - 2236780. Rajkot: LIC of India
Bldg., Jeevan Prakash, Tagore Marg, Rajkot 360002. Tel.: 0281- 2461522. Ranchi: 2nd Floor, Narasaria Tower, Opposite Lalpur Police Station, Ranchi-834001. Tel.: 0651-2206372 Surat:
Office No – D- 117, International Trade Centre (Itc), Majuragate Crossing, Ring Road- Surat- 395002. Tel.: 0261-4862626. Varanasi: CBO 4, LIC of India Divisional Office, Bhelupur Gauriganj,
Varanasi U.P.: 221 001Landline No.: 0542 - 2450 015
Factsheet March, 2022
42
Agartala: Ols Rms Chowmuhani, Mantri Bari Road,1St Floor, Near Traffic Point, Tripura West, Agartala, Tripura, 799001 / 0381-2317519; Agra: House No. 17/2/4, 2Nd Floor, Deepak Wasan Plaza, Behind Hotel Holiday
Inn, Sanjay Place, In The City Of Agra, Agra, Uttar Pradesh, 282002 / 7518801801; Ahmedabad: 201/202 Shail Complex, Opp: Madhusudan House, B/H Girish Cold Drink, Off C G Road, Navrangpura, Ahmedabad,
Gujarat, 380006 / 9081903021; Ajmer: 302, 3Rd Floor, Ajmer Auto Building, Opposite City Power House, Jaipur Road; Ajmer, Rajasthan, 305001 / 0145-5120725; Akola: Yamuna Tarang Complex, Shop No 30, Ground
Floor, N.H. No- 06, Murtizapur Road, Opp Radhakrishna Talkies, Akola, Maharashthra, 444004 / 0724-2451874; Aligarh: Sebti Complex Centre Point, In The City Of Aligarh, Aligarh, Uttar Pradesh, 202001 / 7518801802;
Allahabad: Meena Bazar" 2Nd Floor, 10, S. P. Marg, Civil Lines, Subhash Chauraha, In The City Of Allahabad, Allahabad, Uttar Pradesh, 211001 / 7518801803; Alleppy: 1St Floor, Jp Towers, Mullackal, Ksrtc Bus Stand,
Alleppy, Kerala, 688011 / 0477 2263055; Alwar: Office Number 137, First Floor, Jai Complex Road No – 2, Alwar, Rajasthan, 301001 / 0144-2335550 / 0144-2335551; Amaravathi: Shop No. 21, 2Nd Floor, Gulshan
Tower, Near Panchsheel Talkies, Jaistambh Square, Amaravathi, Maharashthra, 444601 / 0721 2569198; Ambala: 6349,2Nd Floor, Nicholson Road, Adjacent Kos Hospitalambala Cant, Ambala, Haryana, 133001 /
7518801804; Amritsar: 72-A, Taylor'S Road, Opp Aga Heritage Club, Amritsar, Punjab, 143001 / 0183-5053802; Anand: B-42 Vaibhav Commercial Center, Nr Tvs Down Town Shrow Room, Grid Char Rasta, Anand,
Gujarat, 380001 / 9081903038; Ananthapur: Plot No: 12-313, Balaji Towers, Srinagar, Ananthapur Village, Anantapur, Andhra Pradesh, 515001 / 8554244449; Asansol: 114/71 G T Road, Bhanga Panchil Near Nokia
Care, Asansol, West Bengal, 713303 / 0341-2220077; Aurangabad: Shop No B 38, Motiwala Trade Centre, Nirala Bazar, Aurangabad, Maharashthra, 431005 / 0240-2343414; Azamgarh: House No. 290, Ground Floor,
Civil Lines, Near Sahara Office, In The City Of Azamgarh, Azamgarh, Uttar Pradesh, 276001 / 7518801805; Balasore: 1-B. 1St Floor, Kalinga Hotel Lane, Baleshwa, Baleshwar Sadar, Balasore, Orissa, 756001 / 06782-
260503; Bangalore: 59, Skanda Puttanna Road, Basavanagudi, Bangalore, Karnataka, 560004 / 080-26602852; Bankura: Plot Nos- 80/1/A,Natunchati Mahalla, 3Rd Floor,, Ward No-24, Opposite P.C Chandra,
Bankura Town, Bankura, West Bengal, 722101 / 9434480586; Bareilly: 54-Civil Lines, Ayub Khan Chauraha, Civil Lines Road, In The City Of Deoria, , Bareilly, Uttar Pradesh, 243001 / 7518801806; Barhampore (Wb):
Thakur Market Complex, Gorabazar, Post Berhampore Dist Murshidabad, 72 No Nayasarak Road, Barhampore (Wb), West Bengal, 742101 / 0348- 2274494; Baroda: 203, Corner Point, Jetalpur Road, Baroda, Gujarat,
Baroda, Gujarat, 390007 / 0265-2353506; Begusarai: C/O Dr Hazari Prasad Sahu, Ward No 13, Behind Alka Cinema, Begusarai (Bihar), Begusarai, Bihar, 851117 / 7518801807; Belgaum: Cts No 3939/ A2 A1, Above
Raymonds Show Room |Beside Harsha Appliances, Club Road, Belgaum, Karnataka, 590001 / 0831 2402544; Bellary: Shree Gayathri Towers, #4, 1St Floor, K.H.B.Colony, Gopalaswamy Mudaliar Road,, Gandhi
Nagar-Bellary, Karnataka, 583103 / 08392 – 254750; Berhampur (Or): Opp Divya Nandan Kalyan Mandap, 3Rd Lane Dharam Nagar, Near Lohiya Motor, Berhampur (Or), Orissa, 760001 / 0680-2228106; Betul:
107,1St Floor, Hotel Utkarsh, J. H. College Road, Betul, Madhya Pradesh, 460001 / 07141 - 231301; Bhagalpur: 2Nd Floor, Chandralok Complex, Near Ghanta Ghar, In The City Of Bhagalpur, Bihar, Bhagalpur, Bihar,
812001 / 7518801808; Bharuch: 123 Nexus Business Hub, Near Gangotri Hotel, B/S Rajeshwari Petroleum, Makampur Road, Bharuch, Gujarat, 392001 / 9081903042; Bhatinda: Second Floor, Mcb -2-3-01043
Goniana Road, Opp: Nippon India Mf Gt Rode, Near Hanuman Chowk Bhatinda, Bhatinda, Punjab, 161001 / 0164- 5006725; Bhavnagar: 303, Sterling Point, Waghawadi Road, Bhavnagar, Gujarat, 364001 / 278-
3003149; Bhilai: Shop No -1, First Floor Plot No -1, Commercial Complex Nehru Nagar - East, Bhilai, Chatisgarh, 490020 / 0788-2289499 / 2295332; Bhilwara: Shop No. 27-28, 1St Floor, Heera Panna Market, Pur
Road, Bhilwara, Rajasthan, 311001 / 01482-246362 / 246364; Bhopal: Gurukripa Plaza, Plot No. 48A, Opposite City, Hospital, Zone-2, M P Nagar, Bhopal, Madhya Pradesh, Bhopal, Madhya Pradesh, 462011 / 0755-
4092712,0755-4092715; Bhubaneswar: A/181, Saheed Nagar, Janardan House, Room #: 07; 3Rd Floor, Bhubaneswar, Orissa, 751007 / 0674-2548981; Bikaner: 70-71, 2Nd Floor | Dr.Chahar Building, Panchsati
Circle, Sadul Ganj, Bikaner, Rajasthan, 334003 / 0151-2200014; Bilaspur: Shop No -225,226 & 227,2Nd Floor, Narayan Plaza, Link Road, Bilaspur, Chatisgarh, 495001 / 07752-470070; Bokaro: City Centre, Plot No.
He-07, Sector-Iv; Bokaro Steel City, Bokaro, Jharkhand, 827004 / 7542979444; Borivali: Gomati Smuti,Ground Floor, Jambli Gully, Near Railway Station, Borivali, Mumbai, Maharashtra, 400 092 / 022- 28916319;
Burdwan: Anima Bhavan, 1St Floor, Holding No.-42, Sreepally, G. T. Road, West Bengal, Burdwan, West Bengal, 713103 / 0342-2665140; Calicut: Second Floor, Manimuriyil Centre, Bank Road, Kasaba Village,
Calicut, Kerala, 673001 / 0495-4022480; Chandigarh: Sco- 2423-2424, Above Mirchi Restaurent, New Aroma Hotel, First Floor, Sector 22-C, Chandigarh, Union Territory, 160022 / 0172-5101342; Chandrapur: Shop
No-6 Office No-2, 1St Floor Rauts Raghuvanshi Complex, Beside Azad Garden Main Road, Chandrapur, Maharashthra, 442402 / 07172-270262; Chembur: Shop No 4, Ground Floor, Shram Saflya Bldg, N G Acharya
Marg, Chembur, Mumbai, Maharashtra, , 022-662215536; Chennai: F-11, Akshaya Plaza, 1St Floor, 108, Adhithanar Salai, Egmore, Opp To Chief Metropolitan Court, Chennai, Tamil Nadu, 600002 / 044-42028512;
Chinsura: 96, Doctors Lane; Po: Chinsurah; Dt: Hooghly, , Chinsurah, West Bengal, 712101 / 033-26810164; Cochin: Ali Arcade, 1St Floor,Kizhavana Road, Panampilly Nagar, Near Atlantis Junction, Ernakualm,
Kerala, 682036 / 0484 - 4025059; Coimbatore: 3Rd Floor, Jaya Enclave, 1057 Avinashi Road, , Coimbatore, Tamil Nadu, 641018 / 0422 - 4388011; Cuttack: Shop No-45,2Nd Floor, Netaji Subas Bose Arcade, (Big Bazar
Building), Adjacent To Reliance Trends, Dargha Bazar, Cuttack, Orissa, 753001 / 8658691094; Darbhanga: Jaya Complex,2Nd Floor, Above Furniture Planet,Donar, Chowk, Darbhanga, Bihar, 846003 / 7518801809;
Davangere: D.No 162/6 , 1St Floor, 3Rd Main, P J Extension, Davangere Taluk,, Davangere Mandal,Davangere, Davangere, Karnataka, 577002 / 0819-2258714; Dehradun: Kaulagarh Road, Near Sirmaur Margabove,
Reliance Webworld, Dehradun, Uttaranchal, 248001 / 7518801810; Deoria: K. K. Plaza, Above Apurwa Sweets, Deoria, Uttar pradesh, 274001 / 7518801811; Dewas: 27 Rmo House, Station Road, Above Maa
Chamunda Gaes Agency, Dewas, Madhya Pradesh, 455001 / 07272-426010; Dhanbad: 208 New Market 2Nd Floor, Bank More, Dhanbad, Jharkhand, 826001 / 9264445981; Dharwad: 307/9-A 1St Floor, Nagarkar
Colony, Elite Business Center, Nagarkar Colony,P B Road, Dharwad, Karnataka, 580001 / 0836- 2744207; Dhule: Ground Floor Ideal Laundry, Lane No 4, Khol Galli, Near Muthoot Finance, Opp Bhavasar General Store,
Dhule, Maharashthra, 424001 / 02562-282823; Dindigul: No 59B New Pensioner Street, Opp Gomathi Lodge, Palani Road, Dindigul, Dindigul, Tamil Nadu, 624001 / 0451- 2436177; Durgapur: Mwav-16 Bengal
Ambuja, 2Nd Floor City Centre, Distt. Burdwan, Durgapur-16, Durgapur, West Bengal, 713216 / 0343-6512111; Eluru: House No 22B-12-1/1, Ground Floor, Gade Vari Street, Power Peta, Eluru 2, Eluru-West Godavari,
Eluru, Andhra Pradesh, 534002 / 08812-227851 / 52 / 53 / 54; Erode: No: 4, Veerappan Traders Complex, Address No 38/1, Sathy Road, (Vctv Main Road),, Sorna Krishna Complex,Ground Floor, Erode, Tamil Nadu,
638003 / 0424-4021212; Faridabad: A-2B 2Nd Floor, Neelam Bata Road Peerki Mazar, Nehru Ground Nit, Faridabad, Haryana, 121001 / 7518801812; Ferozpur: The Mall Road, Chawla Bulding, Ist Floor, Opp. Centrail
Jail, Near Hanuman Mandir, Ferozepur, Punjab, 152002 / 01632-241814; Gandhidham: Shop # 12, Shree Ambica Arcade, Plot # 300, Ward 12. Opp. Cg High School, Near Hdfc Bank, Gandhidham, Gujarat, 370201 /
9081903027; Gandhinagar: 123, First Floor, Megh Malhar Complex, Opp. Vijay Petrol Pump, Sector - 11, Gandhinagar, Gujarat, 382011 / 079 23244955; Gaya: 54 Lal Kothi Compound, Shree Krishna Road, 2Nd Floor,
North Side, Near Royal Surya Hotel, Gaya, Bihar, 823001 / 0631-2220065; Ghaziabad: Ff - 31, Konark Building, Rajnagar, Lohia Nagar, Ghaziabad, Uttar Pradesh, 201003 / 7518801813; Ghazipur: House No. 148/19,
Mahua Bagh, In The City Of Ghazipur, Ghazipur, Uttar Pradesh, 233001 / 7518801814; Gonda: Shri Market, Sahabgunj, Station Road, Gonda, Uttar Pradesh, 271001 / 7518801815; Gorakhpur: Above V.I.P. House
Ajdacent, A.D. Girls College, Bank Road, Gorakpur, Uttar Pradesh, 273001 / 7518801816; Gulbarga: H No 2-231, Krishna Complex, 2Nd Floor Opp. Municipal Corporation Office, Jagat, Station Main Road, Kalaburagi,
Gulbarga, Karnataka, 585105 / 8088934338; Guntur: 2Nd Shatter, 1St Floor. Hno. 6-14-48, 14/2 Lane, Arundal Pet, Guntur, Andhra Pradesh, 522002 / 0863-2339094; Gurgaon: 2Nd Floor, Vipul Agora, M. G. Road, In
The City Of Gurgaon, Gurgaon, Haryana, 122001 / 7518801817; Guwahati: 1St Floor, Bajrangbali Building, Near Bora Service Station, Gs Road, Guwahati, Assam, 781007 / 8811036746; Gwalior: City Centre, Near
Axis Bank, In The City Of Gwalior, Madhya Pradesh, Gwalior, Madhya Pradesh, 474009 / 7518801818; Haldwani: Above Kapilaz, Sweet House, Opp Lic Building, Pilikothi, Kaladhungi Road, Haldwani, Uttaranchal,
263139 / 7518801819; Haridwar: Shop No. - 17, Bhatia Complex, Near Jamuna Palace, Haridwar (Uttarakhand.), Haridwar, Uttaranchal, 249410 / 7518801820; Hassan: Sas No-212, Ground Floor, Sampige Road 1St
Cross, Near Hotel Souther Star, K R Puram, Hassan, Karnataka, 573201 / 08172 262065; Hissar: Shop No. 20, Ground Floor, R D City Centre, Railway Road, In The City Of Hissar, Hissar, Haryana, 125001 /
7518801821; Hoshiarpur: 1St Floor, The Mall Tower, Opp Kapila Hospital, Sutheri Road, Hoshiarpur, Punjab, 146001 / 01882-500143; Hubli: Ctc No.483/A1/A2, Ground Floor, Shri Ram Palza, Behind Kotak Mahindra
Bank, Club Road, Hubli, Karnataka, 580029 / 0836-2252444; Hyderabad: 303, Vamsee Estates, Opp Bigbazaar, Ameerpet, Hyderabad-16, Telangana-, Hyderabad, Telangana, 500034 / 040-44857874 / 75 / 76; Indore:
101, Diamond Trade Centre, Indore, Madhya Pradesh - Indore, Nearcurewell Hospital, Janjeerwala Square Indore, Indore, Madhya Pradesh, 452001 / 0731-4266828/4218902; Jabalpur: 3Rd Floor, R.R. Tower.5,
Lajpatkunj, Near Tayabali Petrol Pump, Jabalpur, Madhya Pradesh, 482001 / 0761-4923301; Jaipur: Office Number 101, 1St Floor, Okay Plus Tower, Next To Kalyan Jewellers, Government Hostel Circle, Ajmer Road,
Jaipur, Rajasthan, 302001 / 01414167715/17; Jalandhar: 1St Floor,Shanti Towers, Sco No. 37, Puda Complex,, Opposite Tehsil Complex, Jalandhar, Punjab, 144001 / 0181-5094410; Jalgaon: 3Rd Floor, 22
Yashodhan Ring Road, Jalgaon, Jalgaon, Maharashthra, 425001 / 9421521406; Jalpaiguri: D B C Road Opp Nirala Hotel, Opp Nirala Hotel, Opp Nirala Hotel, Jalpaiguri, West Bengal, 735101 / 03561-222136; Jammu:
Gupta'S Tower, 2Nd Floor, Cb-12, Rail Head Complex, Jammu, Jammu & Kashmir, 180012 / 0191-2458820 / 2458818; Jamnagar: 136-137-138 Madhav Palaza, Opp Sbi Bank, Nr Lal Bunglow, Jamnagar, Gujarat,
361001 / 0288 3065810; Jamshedpur: 2Nd Floor, R R Square, Sb Shop Area,Near Reliance Foot Print & Hotel- Bs Park Plaza, Main Road, Bistupur, Jamshedpur, Jharkhand, 831001 / 0657-6655003/ 6655004/
6655005/ 6655006/ 6655007; Jaunpur: R. N. Complex, Opposite Pathak Honda, Above Oriental Bank Of Commerce, In The City Of Jaunpur, Jaunpur, Uttar Pradesh, 222002 / 7518801822; Jhansi: 1St Floor, Puja
Tower, Near 48 Chambers, In The City Of Jhansi, Jhansi, Uttar Pradesh, 284001 / 7518801823; Jodhpur: Shop No. 6, Ground Floor, Gang Tower, Opposite Arora Moter Service Centre, Near Bombay Moter Circle,
Jodhpur, Jodhpur, Rajasthan, 342001 / 7737014590; Junagadh: 124-125 Punit Shopping Center, M.G Road, Ranavav Chowk, Junagadh, Gujarat, 362001 / 0285-2652220; Kannur: 2 Nd Floor, Prabhath Complex, Fort
Road, Nr.Icici Bank, Kannur, Kerala, 670001 / 0497-2764190; Kanpur: 15/46, B, Ground Floor, Opp : Muir Mills, Civil Lines, Kanpur, Uttar Pradesh, 208001 / 7518801824; Karimnagar: D.No: 2-10-1298,2Nd Floor,
Rathnam Arcade, Jyothi Nagar, Karimnagar, Telangana, 505001 / 0878-2244773; Karnal: 18/369, Char Chaman, Kunjpura Road, Behind Miglani Hospital, Karnal, Haryana, 132001 / 0184-2252524; Karur: No 88/11 B B
Plaza, Nrmp Street, K S Mess Back Side, Karur, Tamil Nadu, 639002 / 04324-241755; Khammam: 11-4-3/3, Shop No. S-9, Srivenkata Sairam Arcade, Old Cpi Office, Near Priyadarshini College,Nehru Nagar,,
Khammam, Telangana, 507002 / 8008865802; Kharagpur: Sbi Building, Malancha Road, Po: Kharagpur, Ps: Kharagpur, Holding No 254/220, Ward No.16, Dist: Paschim Medinipur, Kharagpur, West Bengal, 721304 /
03222-253380; Kolhapur: 605/1/4 E Ward, Shahupuri 2Nd Lane, Laxmi Niwas, Near Sultane Chambers, Kolhapur, Maharashthra, 416001 / 0231 2653656; Kolkata: Apeejay House (Beside Park Hotel), C Block,3Rd
Floor, 15 Park Street, Kolkata, West Bengal, 700016 / 033 66285900; Kollam: Ground Floor,A Narayanan Shopping Complex, Kausthubhsree Block, Kadapakada, Kollam, Kerala, 691008 / 474-2747055; Korba: Nidhi
Biz Complex, Plot No 5, Near Patidar Bhawan, T. P. Nagar, In The City Of Korba, Korba, Chatisgarh, 495677 / 7518801826; Kota: D-8, Shri Ram Complex, Opposite Multi, Purpose School, Gumanpura, Kota, Kota,
Rajasthan, 324007 / 0744-5100964; Kottayam: 1St Floor Csiascension Square, Railway Station Road, Collectorate P O, Kottayam, Kerala, 686002 / 0481-2300868/2302420; Kurnool: Shop No:47, 2Nd Floor, S Komda
Shoping Mall, Kurnool, Andhra Pradesh, 518004 / 08518-228550; Lucknow: Ist Floor, A. A. Complex, 5 Park Road, Hazratganj, Thaper House, Lucknow, Uttar Pradesh, 226001 / 7518801830; Ludhiana: Sco - 136, 1St
Floor Above Airtel Showroom, Feroze Gandhi Market, Ludhiana, Punjab, 141001 / 0161-4648747; Madurai: Rakesh Towers, 30-C, Ist Floor, Bye Pass Road, Opp Nagappa Motors, Madurai, Tamil Nadu, 625010 / 0452-
2605856; Malappuram: First Floor, Peekays Arcade, Down Hill, Malappuram, Kerala, 676505 / 0483-2731480; Malda: Ram Krishna Pally, No.1 Govt Colony, Ground Floor, English Bazar; Malda, West Bengal, 732101 /
03512-223763; Mandi: House No. 99/11, 3Rd Floor, Opposite Gss Boy School, School Bazar, In The City Of Mandi, Mandi, Uttar Pradesh, 175001 / 7518801833; Mangalore: Mahendra Arcade Opp Court Road,
Fin Technologies Private Limited OfficesK
Factsheet March, 2022

Investment Manager:LIC MUTUAL FUND ASSET MANAGEMENT LIMITED
Fax : +91 22 2283 5606 E-mail: [email protected] Floor, Industrial Assurance Bldg., Opp. Churchgate Station, Mumbai 400 020. Board : +91 22 6601 6000
MUTUAL FUND INVESTMENTS ARE SUBJECT TO MARKET RISKS, READ ALL SCHEME RELATED DOCUMENTS CAREFULLY.
/LICMutual /company/LICMutual/LICMutual 1800-258-5678Connect with us: www.licmf.com
Karangal Padi, , Mangalore, Karnataka, 575003 / 0824-2496289; Margao: 2Nd Floor, Dalal Commercial Complex, Pajifond, Margao, Goa, 403601 / 0832-2731823; Mathura: Shop No. 9, Ground Floor, Vihari Lal Plaza,
Opposite Brijwasi Centrum, Near New Bus Stand, In The City Of Mathura, Mathura, Uttar Pradesh, 281001 / 7518801834; Meerut: H No 5, Purva Eran, Opp Syndicate Bank, Hapur Road, Meerut, Meerut, Uttar Pradesh,
250002 / 7518801835; Mehsana: Ff-21 Someshwar Shopping Mall, Modhera Char Rasta, Mehsana, Gujarat, 384002 / 02762-242950; Mirzapur: House No. 404, Ward No. 8, Dankeenganj, Mirzapur, , Mirzapur, Uttar
Pradesh, 231001 / 7518801836;Moga: 1St Floor,Dutt Road, Mandir Wali Gali, Civil Lines, Barat Ghar, Moga, Punjab, 142001 / 01636 - 230792; Moradabad: Chadha Complex, G. M. D. Road, Near Tadi Khana, Chowk, In
The City Of Moradabad, Moradabad, Uttar Pradesh, 244001 / 7518801837; Morena: House No. Hig 959, Near Court, Front Of Dr. Lal Lab, Old Housing Board Colony, Morena, Madhya Pradesh, 476001 / 7518801838;
Mumbai: 24/B, Raja Bahadur Compound, Ambalal Doshi Marg, Behind Bse Bldg, Fort, Maharashthra, 400001 / 022-66235353; Muzaffarpur: First Floor Saroj Complex, Diwam Road, Near Kalyani Chowk, Muzaffarpur,
Muzaffarpur, Bihar, 842001 / 7518801839; Mysore: L-350, Silver Tower, Ashoka Road, Opp.Clock Tower, Mysore, Karnataka, 570001 / 0821-2438006; Nadiad: 311-3Rd Floor City Center, Near Paras Circle, Nadiad,
Gujarat, 387001 / 0268-2563245; Nagerkoil: Hno 45,1St Floor, East Car Street, Nagercoil, Tamil Nadu, 629001 / 04652 - 233552; Nagpur: Plot No. 2, Survey No. 1032 And 1033 Of Gagdakhare Town, Dharampeth,, ,
Nagpur, Maharashthra, 440010 / 0712-2533040; Nanded: Shop No.4, Santakripa Market, G G Road, Opp.Bank Of India, Nanded, Maharashthra, 431601 / 02462-237885; Nashik: S-9, Second Floor, Suyojit Sankul,
Sharanpur Road, Nasik, Maharashthra, 422002 / 0253-6608999; Navsari: 103, 1St Floore Landmark Mall, Near Sayaji Library, Navsari Gujarat, Navsari, Gujarat, 396445 / 9081903040; Nellore: D No:16-5-66 Ramarao
Complex No:2Shop No:305, 3Rd Floor Nagula Mitta Rode, Opp Bank Of Baroda. Nellore, Nellore, Andhra Pradesh, 524001 / 0861 2349940; New Delhi: 305 New Delhi House, 27 Barakhamba Road, New Delhi, New
Delhi, 110001 / 011- 43681700; Nizamabad: H No:5-6-430, Above Bank Of Baroda First Floor, Beside Hdfc Bank,Hyderabad Road, Nizamabad, Telangana, 503003 / 08462-224366; Noida: F - 21, Sector - 18, In The City
Of Noida, , Noida, Uttar Pradesh, 201301 / 7518801840; Palghat: No: 20 & 21, Metro Complex H.P.O.Road Palakkad, H.P.O.Road, Palakkad, Kerala, 678001 / 9895968533; Panipat: 3Rd Floor Preet Tower, Behind
Akash Institute, Gt Road-Panipat, Panipat, Haryana, 132103 / 7518801841; Panjim: Flat No.1-A, H. No. 13/70, Timotio Bldg, Heliodoro Salgado Road, Next To Navhind Bhavan (Market Area), Panjim, Goa, 403001 /
0832-2426874; Pathankot: 2Nd Floor, Sahni Arcade Complex, Adj.Indra Colony Gate Railway Road, Pathankot, Pathankot, Punjab, 145001 / 0186-5080188; Patiala: Sco 27 D, Chotti Baradari, Near Car Bazaar, Patiala,
Punjab, 147001 / 0175-5004349; Patna: 3A, 3Rd Floor Anand Tower, Exhibition Road, Opp Icici Bank, Patna, Bihar, 800001 / 0612-4323066; Pollachi: 1St Floor, Mkg Complex, Opp To Gowri Shankar Hotel, Pollachi,
Tamil Nadu, 642002 / 04259- 235111; Pondicherry: Building No:7, 1St Floor, Thiayagaraja Street, Pondicherry, Pondicherry, 605001 / 0413-45490253; Proddatur: D.No: 4/625, Bhairavi Complex, Bhairavi Complex,
Upstairs Karur Vysya Bank, Gandhi Road, Proddatur, Andhra Pradesh, 516360 / 08564 - 242898; Pune: Office No 207-210, 2Nd Floor, Kamla Arcade, Jangli Maharaj Road, Opposite Balgandharva, Shivaji Nagar, Pune,
Maharashthra, 411005 / 020 -66210449; Raipur: Office No S-13, Second Floor, Reheja Tower, Fafadih Chowk, Jail Road, Raipur, Chatisgarh, 492001 / 0771-4912611; Rajahmundry: D.No.6-1-4, Rangachary Street,
T.Nagar, Near Axis Bank Street, Rajahmundry, Andhra Pradesh, 533101 / 0883-2434468/70; Rajkot: 302, Metro Plaza, Near Moti Tanki Chowk, Rajkot, Rajkot, Gujarat, 360001 / 9081903025; Ranchi: Room No 307 3Rd
Floor, Commerce Tower, Beside Mahabir Tower, Ranchi, Jharkhand, 834001 / 0651-2331320; Ratlam: 1 Nagpal Bhawan Free Ganj Road, Do Batti, Near Nokia Care, Ratlam, Madhya Pradesh, 457001 / 07412-320398;
Renukoot: C/O Mallick Medical Store, Bangali Katra, Main Road, Renukoot, (Dist. Sonebhadra ), Renukoot, Uttar Pradesh, 231217 / 7518801842; Rewa: In Front Of Teerth Memorial Hospital, In The City Of Reewa, ,
Rewa, Madhya Pradesh, 486001 / 7518801843; Rohtak: Shop No 14, Ground Floor, Ashoka Plaza,Delhi Road, , Rohtak, Haryana, 124001 / 7518801844; Roorkee: Shree Ashadeep Complex 16, Tyagi Dairy Road, Civil
Lines,Near Income Tax Office, , Roorkee, Uttaranchal, 247667 / 7518801845; Rourkela: 2Nd Floor, Main Road, Udit Nagar, Rourkela, Sundargarh, Rourekla, Orissa, 769012 / 0661-2500005; Sagar: Ii Floor, Above Shiva
Kanch Mandir., 5 Civil Lines, Sagar, Sagar, Madhya Pradesh, 470002 / 07582-402404; Saharanpur: 18 Mission Market, Court Road, Saharanpur, Uttar Pradesh, 247001 / 7518801846; Salem: No 3/250, Brindavan
Road, 6Th Cross,Perumal Kovil Back Side, Fairland'S, Salem, Tamil Nadu, 636016 / 0427-4020300; Sambalpur: Sahej Plaza; First Floor, Shop No. 219; Golebazar, Sambalpur, Sambalpur, Orissa, 768001 / 0663-
2533437; Satna: Jainam Market, Purana Power House Chauraha, Panni Lal Chowk, In The City Of Satna, Rewa Road, Satna, Madhya Pradesh, 485001 / 7518801847; Shillong: Annex Mani Bhawan, Lower Thana
Road, Near R K M Lp School, Shillong, Meghalaya, 793001 / 0364 - 2506106; Shimla: Triveni Building, By Pas Chowkkhallini, Shimla, Himachal Pradesh, 171002 / 7518801849; Shimoga: Sri Matra Naika Complex, 1St
Floor, Above Shimoga Diagnostic Centre, Llr Road, Durgigudi, Shimoga, Karnataka, 577201 / 08182-228799; Shivpuri: Near Hotel Vanasthali, In Front Of Sawarkar Park, A. B. Road, In The City Of Shivpuri, Shivpuri,
Madhya Pradesh, 473551 / 7518801850; Sikar: First Floor, Super Tower, Behind Ram Mandir Near Taparya Bagichi, Sikar, Rajasthan, 332001 / 01572-250398; Silchar: N.N. Dutta Road, Chowchakra Complex,
Premtala, Silchar, Assam, 788001 / 3842261714; Siliguri: Nanak Complex, Sevoke Road, Siliguri, West Bengal, 734001 / 0353-2522579; Sitapur: 12/12, Surya Complex, Station Road, Sitapur, Sitapur, Uttar Pradesh,
261001 / 7518801851; Solan: Disha Complex, 1St Floor, Above Axis Bank, Rajgarh Road, In The City Of Solan, Solan, Himachal Pradesh, 173212 / 7518801852; Solapur: Block No 06, Vaman Nagar, Opp D-Mart, Jule
Solapur, Solapur, Maharashthra, 413004 / 0217-2300021 / 2300318; Sonepat: 2Nd Floor, Dp Tower, Model Town, Near Subhash Chowk, Sonepat, Haryana, 131001 / 7518801853; Sri Ganganagar: Address Shop No. 5,
Opposite Bihani Petrol Pump, Near Baba Ramdev Mandir Nh - 15, Sri Ganganagar, Rajasthan, 335001 / 0154-2470177; Srikakulam: D No 4-4-97, First Floor, Behind Sri Vijayaganapathi Temple, Pedda Relli Veedhi,
Palakonda Road, Srikakulam, Andhra Pradesh, 532001 / 8942229925; Sultanpur: 1077/3, Civil Lines Opp Bus Stand, Civil Lines, Sultanpur, Uttar Pradesh, 228001 / 7518801854; Surat: Office No: -516, 5Th Floor,
Empire State Building, Near Udhna Darwaja, Ring Road, Surat, Gujarat, 395002 / 9081903041; T Nagar: No 23, Cathedral Garden Road Nungambakkam, Chennai, Tamilnadu, 600 017 / 044 - 28151034; Thanjavur: No
1, Underground,Nallaiyah Complex,, Srinivasam Pillai Road,, , Tanjore, Tamil Nadu, 613001 / 04362-275415; Tirunelveli: 55/18, Jeney Building, S N Road, Near Aravind Eye Hospital, Tirunelveli, Tamil Nadu, 627001 /
0462-4001416; Tirupathi: H.No:10-13-425, 1St Floor , Tilak Road,, Opp: Sridevi Complex ,, Tirupathi, Andhra Pradesh, 517501 / 9885995544 / 0877-2255797; Tirupur: No 669A,Kamaraj Road, Near Old Collector
Office, , Tirupur, Tamil Nadu, 641604 / 0421-4202780; Tiruvalla: 2Nd Floor,Erinjery Complex, Ramanchira, Opp Axis Bank, Thiruvalla, Kerala, 689107 / 04862-211209; Trichur: 2Nd Floor,Brothers Complex, Naikkanal
Junction,Shornur Road, Near Dhanalakshmi Bank H O, Thrissur, Kerala, 680001 / 0487- 6999987; Trichy: No 23C/1 E V R Road, Near Vekkaliamman Kalyana Mandapam, Putthur, Trichy, Tamil Nadu, 620017 / 0431-
4020227; Trivandrum: 2Nd Floor, Akshaya Tower, Sasthamangalam, Trivandrum, Kerala, 695010 / 0471 - 2725728; Tuticorin: 4B/A-10Mani Nagar, Mangal Mall,, Palayamkottai Road, Tuticorin, Tamil Nadu, 628003 /
0461-2334603; Udaipur: Shop No. 202, 2Nd Floor Business Centre, 1C Madhuvan, Udaipur, Udaipur, Rajasthan, 313001 / 0294 2429370; Ujjain: Heritage Shop No. 227, 87 Vishvavidhyalaya Marg, Station Road, Near
Icici Bank Above Vishal Megha Mart, Ujjain, Madhya Pradesh, 456010 / 0734-4250007 / 08; Valsad: 406 Dreamland Arcade, Opp Jade Blue, Tithal Road, Tithal Road, Valsad, Gujarat, 396001 / 02632-258481; Vapi: A-8,
First Floor, Solitaire Business Centre, Opp Dcb Bank, Gidc Char Rasta, Silvassa Road, Vapi, Gujarat, 396191 / 9081903028; Varanasi: D-64/132, 2Nd Floor, Ka, Mauza, Shivpurwa, Settlement Plot No 478, Pargana :
Dehat Amanat, Mohalla Sigra, Varanasi, Uttar Pradesh, 221010 / 7518801855; Vashi: C, Wing Flat NO. 324, 1st Floor, Vashi Plaza, Sector 17 Vashi, Navi Mumbai, Maharashtra, 400 703 / 22-27802684; Vellore: No. 6,
Nexus Towers, 2Nd Floor, Officer'S Line, Above Peter England & Bata Showroom Opp. To Voorhees School, Vellore, Tamil Nadu, 632001 / 0416-41603806; Vijayanagaram: D No : 20-20-29, 1St Floor, Surya Nagar,
Kalavapuvvu Meda, Near Ayodhya Stadium, Dharmapuri Road, Vizianagaram, Vizianagaram, Andhra Pradesh, 535002 / 08922-236965; Vijayawada: Address-1Stfloor, Hno26-23-,
Sundarammastreet,Gandhinagar,Vijayawada,Krishna Ap, Labbipet, Vijayawada, Andhra Pradesh, 520010 / 0866-6604032/39/40; Vile Parle: Shop No.1 Ground Floor, Dipti Jyothi Co-operative Housing Society, Near
MTNL office P M Road, Vile Parle East, Mumbai, Maharashtra / 022 26100967; Visakhapatnam: Ground Floor, 48-10-40, Sri Nagar Colony, Visakhapatnam, Andhra Pradesh, 530016 / 0891-2714125; Warangal: Shop
No22, Ground Floor Warangal, City Center,15-1-237, Mulugu Road Junction, Warangal, Telangana, 506001 / 0870-2441513; Yamuna Nagar: B-V, 185/A, 2Nd Floor, Jagadri Road, Near Dav Girls College, (Uco Bank
Building) Pyara Chowk, Yamuna Nagar, Haryana, 135001 / 7518801857;

Muskuraein BAF ke sang
Chahe market laye koi bhi rang
MUTUAL FUND INVESTMENTS ARE SUBJECT TO MARKET RISKS, READ ALL SCHEME RELATED DOCUMENTS CAREFULLY.
/LICMutual /company/LICMutual/LICMutual 1800-258-5678Connect with us: www.licmf.com
1800-258-5678
Call Toll FreeTo know more, please consult your Financial Advisor
OR
Investors understand that their principalwill be at Moderately High risk
Low
Low toModerate
Moderate ModeratelyHigh
High
Very High
RISKOMETER HIGHLOW
Invest In
This product is suitable for investors who are seeking*:
Ÿ Capital appreciation over a long period of time
Ÿ Investments in a dynamically managed portfolio of equity and equity related instruments, debt and money market instruments.
• Risk - Moderately High
*Investors should consult their financial advisors if in doubt about whether the product is suitable for them. Risk-o-meter is based on evaluation of risk level of Scheme's portfolio as on 28th February 2022 and the change in Risk-o-meter will be evaluated on a monthly basis. For more details, please visit our website BAF stands for Balanced Advantage Fund. www.licmf.com