democracy under uncertainty
TRANSCRIPT

Democracy Under Uncertainty 1
Democracy Under Uncertainty:
The “Wisdom of Crowds” and the Free-Rider Problem in Group Decision Making
Tatsuya Kameda
Center for Advanced Study in the Behavioral Sciences, Stanford University
Takafumi Tsukasaki
Department of Behavioral Science, Hokkaido University
Reid Hastie
Center for Decision Research, Booth School of Business, University of Chicago
Nathan Berg
School of Economic, Political, and Policy Sciences, University of Texas-Dallas
Running Head: Democracy Under Uncertainty
Correspondence should be addressed to:
Tatsuya Kameda
Department of Behavioral Science, Hokkaido University, N10 W7, Kita-ku, Sapporo,
Japan 060-0810. +81-11-706-3042 (office), -3066 (fax), [email protected]

Democracy Under Uncertainty 2
Abstract
We introduce a game theory model of individual decisions to cooperate by contributing
personal resources to group decisions versus by free-riding on the contributions of other
members. In contrast to most public-goods games that assume group returns are linear
in individual contributions, the present model assumes decreasing marginal group
production as a function of aggregate individual contributions. This diminishing
marginal returns assumption is more realistic and generates starkly different predictions
compared to the linear model. One important implication is that, under most conditions,
there exist equilibria where some, but not all members of a group contribute, even with
completely self-interested motives. An agent-based simulation confirms the individual
and group advantages of the equilibria in which behavioral asymmetry emerges from a
game structure that is a priori perfectly symmetric for all agents (all agents have the same
payoff function and action space, but take different actions in equilibria). And a
behavioral experiment demonstrates that cooperators and free-riders coexist in a stable
manner in groups performing with the non-linear production function. A collateral result
demonstrates that, compared to a ―dictatorial‖ decision scheme guided by the best
member in a group, the majority-plurality decision rules can pool information effectively
and produce greater individual net welfare at equilibrium, even if free-riding is not
sanctioned. This is an original proof that cooperation in ad hoc decision-making groups
can be understood in terms of self-interested motivations and that, despite the free-rider
problem, majority-plurality decision rules can function robustly as simple, efficient social

Democracy Under Uncertainty 3
decision heuristics.
Key words: group decision making under uncertainty, free-rider problem,
majority-plurality rules, marginally-diminishing group returns, evolutionary games,
behavioral experiment

Democracy Under Uncertainty 4
Democracy Under Uncertainty:
The “Wisdom of Crowds” and the Free-Rider Problem in Group Decision Making
Every human society relies on groups to make important decisions because,
among other advantages, groups have more problem-solving resources than any
individual member (e.g., Kerr & Tindale, 2004). Indeed, there are many tasks that can
be achieved only by a group effort and that could never be accomplished by one
individual or by many individuals working separately. For example, a group of
geologists, engineers, demographers, and business executives have complementary skill
sets that could allow them to make much more precise decisions about where to locate a
large construction project than any one of the individuals in these groups could alone.
Similarly, in a primitive setting, five tribesmen could cooperate to decide where to forage
for prey much more effectively than if all worked independently.
But, despite such a potential for ―collective wisdom,‖ there is a fundamental
trade-off between selfish, individualistic goals and the more general social welfare.
Participation in a group activity is often described as a sacrifice of personal utility. Who
hasn‘t pondered whether to ―blow-off‖ preparation for a group assignment (e.g., not to
study the candidates‘ resumes before a hiring committee meeting, to shirk one‘s
homework before a joint study committee meeting, etc.) and to ―free-ride‖ on the efforts
of those who have fulfilled their social obligation? Many theoretical analyses of small
group cooperation conceptualize group enterprises as social dilemmas, and treat
cooperative behavior as a puzzle (Dawes, 1980). In social dilemma situations, the

Democracy Under Uncertainty 5
personal payoff to an individual group member is always less when s/he cooperates in the
group enterprise than it would be if s/he acted as a free rider, even though the overall
group welfare is larger when all members cooperate than when nobody cooperates.
Consistent with the ―sacrifice theme,‖ most behavioral experiments on social dilemmas
show that average contributions to public goods deteriorate significantly after a few
iterations if no punishment opportunity exists (e.g., Fehr & Gächter, 2002; Herrmann,
Thöni & Gächter, 2008; for reviews, see Camerer, 2003; Fehr & Fischbacher, 2003;
Ledyard, 1995). Even with an alternative public goods game featuring a preliminary
binding commitment round, which produces more theoretical and empirical support for at
least some players to make social contributions, the prevailing interpretation holds that
cooperation is difficult to sustain (Saijo and Yamato, 1999; Cason, Saijo and Yamato,
2002; Cason, Saijo, Yamato and Yokotani, 2004). And, in conventional group
production and problem-solving tasks, social psychological research has provided
considerable evidence of social loafing (Latané, Williams & Harkins, 1979; see also Kerr
& Tindale, 2004; Williams, Harkins & Karau, 2003 for reviews). If members of small
decision-making groups (e.g., juries, panels, committees) are playing such a game, the
theory predicts that cooperation is hard to sustain without enforcement mechanisms.
This framing of group enterprises as social dilemmas leads to a pessimistic view of
groups as problem solvers or decision makers and implies that public goods requiring
group cooperation will be severely under-supplied.
The above sketch illustrates a fundamental gap between the two images of group

Democracy Under Uncertainty 6
decision mechanisms – a highly intelligent device that can achieve collective wisdom
versus a defective social process that degrades towards sub-optimal performance (Janis,
1972). How can we reconcile the two contrasting images? The central puzzle is as
follows: How can the ―wisdom of crowds‖ (Surowiecki, 2004) be sustained in face of the
free-rider problem? Do groups require some policing mechanism that enforces
members‘ contributions toward group enterprises to yield collective wisdom?
Is Group Decision Making Necessarily a Social Dilemma?
To defend the viability of group decision processes, some social choice theorists
have argued that people may feel good, experiencing ―expressive benefits‖ (Brennan &
Lomasky, 1993), when they contribute to the functioning of a group (Downs, 1957) or
when they fulfill civic duties (Meehl, 1997; Riker & Ordeshook, 1973). Survey data
from large-scale elections provide modest support for this view, while identifying other
social-psychological factors as well, including social norms (Knack, 1992) and cognitive
biases (Opp, 2001). Applying this view to small-group decision making, we would
expect some people to be cooperative – for example, turning out for group meetings,
engaging in costly information search prior to meetings – driven by these prosocial
motives.
Although prosocial motives underlie some contributions to group enterprises,
such an account begs questions concerning the ultimate sources of these motives (see
Posner, 2000). The present paper proposes an alternative theoretical framework in
which to interpret positive contributions to group enterprises without invoking prosocial

Democracy Under Uncertainty 7
motives. After all, there must be some personal advantage to individual members in
cases where no collection of individuals acting independently could achieve even part of
the group product that can be achieved by the collective. But even in tasks where
contributions are incremental, we argue that contrary to the social dilemma interpretation,
cooperation can in many real-world and theoretical contexts (i.e., with diminishing
marginal group returns to individual contributions) be both self-interested and beneficial
tothe group. Such an analysis would explain the widespread cooperation in human
societies as a function of the benefits of individual cooperation without adding any new
prosocial motives. Our argument draws on a diverse sample of empirical and
theoretical literatures, ranging from theoretical biology to experimental economics. We
first analyze structures of various group tasks in natural settings, in terms of functional
relations between members‘ inputs and group productivity (McGrath, 1984; Steiner,
1972). We then discuss the implications of this analysis for cooperation in group
decision making.
The ubiquity of marginally-diminishing-returns group production function
in naturally-occurring tasks. When a group of people collaborates to make a decision
or to produce some other tangible good (e.g., investment committee, strategic planning
staff, production line), productivity usually increases monotonically with increases in
group size, at least over some range. But the relationship often falls short of linearity.
Although we cannot conduct a census of all group production tasks in our society, we are
confident that the almost universal relationship between group size and productivity is

Democracy Under Uncertainty 8
monotonically increasing but with marginally-diminishing returns over an appropriately
specified range in group size. This can be observed in many natural settings.
The behavioral ecology literature studying animal behavior provides a useful
starting point to see why this is the case. Marginally-diminishing returns are common in
many systems of the animal kingdom, including social vertebrates and social insects
(Foster, 2004). For example, sentinel behavior of many mammals and birds is a
collective endeavor with marginally-diminishing returns (Trivers, 1971; Bednekoff,
1997). Think of it this way: if you are camping with a group of 10 people, there are
much larger benefits from the first and perhaps second person staying awake to warn the
other campers about approaching bears than there are from the 9th
and 10th
campers
staying awake, whose contributions generate virtually zero marginal benefits.
To illustrate, let us denote the average probability of a single sentinel detecting
an approaching predator as p. Assuming that there is no process loss (Steiner, 1972),
the probability that a group with n individuals being on watch detects the danger
successfully is then approximated by 1-(1-p)n (Laughlin, 1980; Lorge & Solomon, 1955).
This means that the group success in vigilance increases monotonically but diminishes at
the margin, with an increase in the number of sentinels, n, in the group. Social foraging,
another key survival task, shares this structure. When a flock of birds is searching for
food, discovery of a rich food patch by a single bird results in other birds joining to
forage in the same patch (Giraldeau & Caraco, 2000). The group success in locating a
rich food patch is thus approximated by the identical function, 1-(1-p)n, where p denotes

Democracy Under Uncertainty 9
the average probability of a single bird encountering a rich patch and n refers to the flock
size (Barnard & Sibly, 1981; see Foster, 2004, for other examples in the animal
kingdom).
Although many core everyday group-production tasks for humans also revolve
around foraging and risk-monitoring (see Kameda & Tindale 2006 for review), ―groups‖
in these animal examples are surely nothing more than collections of individuals, where
no substantial coordination activities exist. Birds do not deliberately orchestrate their
sentinel or food-searching behavior, and group performance is best described as a
probabilistic aggregation of individual outputs rather than the product of a systematic
group design (e.g., group decision making), which is more typical of human social
coordination.
Interestingly, however, explicit coordination efforts do not necessarily eliminate
the marginally-diminishing nature of group production for the following reasons. First,
difficulties in coordination among members multiply with group size, and interpersonal
conflicts are also likelier to occur, among other production-cutting social factors (see
Steiner, 1972; Thompson, 2004, especially Chapter 2, for comprehensive reviews).
Second and more importantly, the fundamental structure of many natural tasks mandates
diminishing returns in productivity from later contributions. When information is
redundant or task-relevant skills overlap from member to member, diminishing returns
are inevitable even with perfect coordination (Clemen & Winkler, 1999; Makradakis &
Winkler, 1983); and when any task is not perfectly divisible into independent sub-tasks,
Democracy Under Uncertainty 10
individual performances must be somewhat redundant, producing diminishing
productivity as more individuals are added to the collective enterprise.
For example, consider group judgments that rely on information aggregation,
which represents an essential sub-task in group performance (McGrath, 1984).
Members collectively estimate a quantity, such as the future price of a stock. Let us
presume that the group estimate is approximated by the arithmetic mean, or simple
average, of the individual estimates, which is a valid description of many behavioral
judgment aggregation processes (see Clemen & Winkler, 1999; Hastie, 1986; Kerr,
MacCoun, & Kramer, 1996, for review). Furthermore, if individual estimates have
equal signal-to-noise ratios and vary around the true value of the stock price with
uncorrelated random errors, the arithmetic mean is a statistically optimal aggregation rule
(Larrick & Soll, 2006; Surowiecki, 2004). For an average computed from a randomly
drawn sample, the law of large numbers tells us the group estimate should converge on
the true value, and well-known calculations of the variance of the arithmetic mean show
explicitly that the precision of this group estimate improves with each additional
observation (i.e., an individual‘s judgment in the present example). The reduction in
expected squared error by adding one more member to an n-person group,
)1
()1(
222
nnnn
, is greater than zero, where σ
2 is the variance of the individual
estimates. But note the marginal improvements in the aggregate estimate (in terms of
smaller random deviations from the true value) diminish with increasing group size, n
(see Condorcet, 1785/1994, for an analogous proof when the judgment is categorical, e.g.,

Democracy Under Uncertainty 11
between political candidates).
Indeed, if we turn to classic analyses of group performance and productivity in
social psychology (McGrath, 1982; Steiner, 1972), we find that many abstract task types
imply that group performance indices (amount of goods produced, time to produce,
accuracy of estimates) will be related to group size with a monotonically increasing but
marginally diminishing returns function. This includes decisions based on unanimous,
majority, and truth-wins group decision rules (see Condorcet 1785/1994; Smoke &
Zajonc, 1962); disjunctive tasks (Steiner, 1972) where a success of only one member is
sufficient to achieve a collective goal (e.g., risk-monitoring, resource-finding, and other
―Eureka problems‖: see Kameda & Tamura, 2007; Laughlin, 1980; Lorge & Solomon,
1955; Taylor & Faust, 1952); and additive tasks (Steiner, 1972) where members‘ inputs
are summed to determine an overall group performance (e.g., group estimation by
averaging, physical tasks as exemplified by a tug of war: see Hastie, 1986; Ingham,
Levinger, Graves & Peckham, 1974; Kravitz & Martin 1986). The only clear
exceptions to this generalization are conjunctive tasks (Steiner, 1972) where the ―weakest
link‖ member determines the overall group performance and more members mean poorer
performance, and synergistic tasks where the group production function would be
positively accelerated. We know of no examples of the deliberate use of groups to solve
conjunctive tasks (unless institutional or situational constraints impose conjunctive task
demands) and we know of very few examples of verified synergistic group performances
in the scientific literature (see Larson 2009 for a recent comprehensive review).

Democracy Under Uncertainty 12
In summary, a marginally-diminishing group production function seems to apply
in many group performance domains in natural settings. Perhaps because of the
mathematical convenience of the linear group production function, this widespread
diminishing marginal returns feature is conspicuously missing from most of the group
performance and public goods literatures (see also Kerr 1983 for one of early attempts to
link group performance with social dilemmas). The linear public goods model assumes
that each individual‘s contribution yields a constant return for the group, and the return,
which is shared evenly by all members, is less than individual cost of cooperation,
regardless of the number of other contributors. This implies the overly pessimistic
prediction that we should almost never expect to see contributors to public goods because,
at all levels of inputs in the group production function, defection is the dominant strategy
(Ledyard, 1995; but see Laury & Holt, 2008).1
Emergence of a mixed equilibrium. Given a marginally-diminishing
production function, is defection still the dominant strategy? The answer turns out to be
not necessarily. A theoretical biologist, Motro (1991), concerned with abstract foraging
problems, has provided a general powerful framework in which to analyze this question.
Let us suppose that we have a six-person group and that the group production function
(e.g., mapping the number of contributors who search for food into the expected quantity
of food available for each member of the group, humans, non-human animals, robots,
etc.) takes a marginally diminishing form as shown in Figure 1. As in social dilemmas,
we assume the group production benefit is shared equally by all group members, but that

Democracy Under Uncertainty 13
production costs are borne by each producing or contributing member individually
(Dawes, 1980; Kameda, Takezawa, & Hastie, 2003). The x-axis represents the number
of cooperators, while the y-axis represents the expected gross return to each member of
the group (group gross return / 6). ―Gross‖ refers to the fact that the costs of
contributing are not yet represented in Figure 1. The production function‘s concave
increasing form generates marginal returns to individual contributions to the group,
labeled δn when the number of cooperators increases from n to n+1, that are indeed
diminishing as more individuals contribute.
Motro (1991) analytically identified an Evolutionarily Stable Strategy (ESS) in
this situation: Cooperate as long as the increment, δ, exceeds individual cost (denoted c),
but switch to defection otherwise.2
In other words, keep cooperating while your
contribution yields an individually positive expected net return. Note that, even when
the increment δ representing the marginal individual return to contributing is too small to
justify the cost to contribute for an individual, additional contribution by the individual
may still be beneficial to the entire group (i.e., while the marginal individual return, δm,
by joining m other cooperators in the group is less than individual cost, c, aggregate
group return, 6*δm, may still be greater than the individual cost). This means that, as in
linear social dilemmas (Dawes, 1980), each individual‘s rational action may lead to the
inefficient level of contributions at the group level (―Pareto inefficient‖). However, in
the nonlinear case depicted in Figure 1, δ is not constant but is a function of the number
of cooperators. As long as c < δn for some small n, the model predicts that some

Democracy Under Uncertainty 14
members in the group will contribute/cooperate; in other words, the important
implication of diminishing returns in this empirically more realistic group production
function is that defection is no longer a universally (i.e., over the entire range of number
of cooperators) dominant strategy. Thus, many naturally-occurring tasks with
marginally-diminishing return curves do not necessarily constitute social dilemmas.
---------------------------------------------
INSERT FIGURE 1 – ILLUSTRATION OF A MARGINALLY-DIMINISHING
RETURN CURVE
---------------------------------------------
Figure 2 re-expresses the production function from Figure 1 as a net (individual
gross return – cost) payoff function for a cooperator (solid curve), and as a net payoff
function for a defector (dashed curve), both expressed as functions of the number of other
group members who contribute (individual cooperation cost was fixed at 0.7 in Figure 2).
Note that the two curves intersect at an equilibrium, specifying the number that is
predicted by the theory of Nash Equilibrium of rationally self-interested cooperators in
the group. As can be seen in the figure, an individual is personally better off
cooperating when there are few cooperators, and better off defecting when there are
already several cooperators among the other group members. The net benefits of
cooperating or defecting depends on the frequency of the alternative strategy within the
group; neither strategy is dominant (Laury & Holt, 2008). Too many players opting for
one strategy reduces its relative profitability while increasing the profitability of its

Democracy Under Uncertainty 15
alternative, providing an incentive for individuals to switch. Since the two strategies are
mutually constrained in terms of relative profitability, we expect a mixed equilibrium to
emerge (Gintis, 2000; Maynard Smith, 1982). At equilibrium, the group reaches a
stable state in which complementary proportions of cooperators and defectors coexist,
achieving an average frequency of cooperators given by the point at which the two
individual net payoff curves intersect. In Figure 2, the two curves intersect when the
number of other cooperators is between 1 and 2, which predicts 2 cooperators and 4
defectors on average in the group with the illustrative costs and benefits of cooperation in
this example.
---------------------------------------------
INSERT FIGURE 2 – EXPECTED INDIVIDUAL NET PAYOFFS (INDIDUAL GROSS
RETURN – COST)
---------------------------------------------
Group Decision Making Under Uncertainty
Motro‘s (1991) model provides a powerful theoretical benchmark to re-consider
realistic cooperation levels in group performance and public goods provision (Kerr, 1983;
Laury & Holt, 2008). We apply this model to a stylized group decision situation, which
constitutes a core group-production task in everyday life. We have two goals in this
paper: (1) to examine the degree to which Motro‘s framework captures members‘
cooperation for the group enterprise, and (2) to examine the effects of various voting

Democracy Under Uncertainty 16
rules (e.g., Majority/Plurality, Best Member Rule) on the quality of group decision
outcomes when free-riding is possible.
Applicability of Motro’s model to group decision making. Suppose that a
group of six members needs to select a single location in which they will search together
for food. Each member decides whether to ―cooperate‖ (produce) by seeking
decision-relevant information, an activity with some personal costs; or to free-ride (defect,
scrounge) on the decisions of the other members. Obviously, if no member decides to
seek information, the group decision will be uninformed and far from optimal. But, it is
also true that, if all members seek information, there will be redundancy and a loss of
potential production value. Motro (1991) proved that it is wasteful for all individuals to
seek information precisely because of the diminishing marginal returns of the group
production function. We apply this logic to group decision making under uncertainty,
where the objective value of a choice alternative, or ―truth‖ (Laughlin, 1980), must be
inferred through imperfect stochastic information. We predict that group decision
making under uncertainty, which forms the core of modern committee meetings as well
as ―primordial‖ team foraging, would yield a mixed equilibrium in which cooperators and
free-riders coexist, rather than the all-defect equilibrium in social dilemmas (with the
unrealistic linear-additive production function; see also footnote 1). An equilibrium
mixture of cooperators and defectors will be determined by the Motro function.
Robustness of majority/plurality group decision rule. Although the
argument so far has depicted group decision making as if it were a uniform concept,

Democracy Under Uncertainty 17
each group decision setting entails specific design features. Even if we limit our focus
to ―consensual‖ decision making (e.g., juries, committees, panels), there are numerous
variations about how to implement the group decision system. This includes choices of
quorum rules, polling procedures, aggregation rules, and so on (e.g., Hastie, Penrod &
Pennington, 1983; Kameda, Tindale, & Davis, 2003; Regenwetter, Grofman, Marley &
Tsetlin, 2006). How do these design features affect members‘ cooperation levels and
consequentially determine the quality of final group decision outcomes? In this paper,
we test whether the Majority/Plurality rule, whereby the option in the group‘s choice set
with the most votes becomes the group‘s final choice, can sustain members‘ cooperation
and serve as a robust truth-seeking decision procedure in uncertain environments (Hastie
& Kameda, 2005; Sorkin, Hays & West, 2001).
Using computer simulations and a behavioral experiment, Hastie and Kameda
(2005) evaluated various group decision rules based on their adaptive accuracy in
choosing the mutually most beneficial alternative in an uncertain, simulated test bed
environment. These aggregation rules included Averaging, the Best Member Rule,
Condorcet Majority, Majority/Plurality, and so on (see Hastie & Kameda, 2005 for
details). When the adaptive success standard is applied to evaluate the rules
(Hammond & Stewart, 2001; Hastie, 1986; Gigerenzer, Todd, and the ABC Research
Group, 1999), the Majority/Plurality rule fares quite well, performing at levels
comparable to much more cognitively-taxing rules such as the averaging rule. The
Majority/Plurality rule also matches the computationally demanding Condorcet Majority
Winner that is the common standard in evaluations of preferential choice rules (Arrow,

Democracy Under Uncertainty 18
1951; Mueller, 2003; Regenwetter, Ho & Tsetlin, 2007). These results indicate that,
despite its computational simplicity, the Majority/Plurality rule can achieve surprisingly
high levels of performance under uncertainty.
In these previous studies, however, it was assumed that everybody would
cooperate to support the group enterprise (Hastie & Kameda, 2005; Sorkin et al., 2001).
Thus, it is an open question, whether the Majority/Plurality rule would be theoretically
and behaviorally successful when there is a personal cost to be an informed voter.
Several key questions in the present research concern the performance of the
Majority/Plurality rule under more realistic assumptions about the group production
function and individual cooperation costs. If a mixed equilibrium holds (Motro, 1991),
how efficient is the productivity at the equilibrium under the Majority/Plurality group
decision rule? Does the Majority/Plurality rule degrade into a universal free-riding
―tragedy of the commons‖ situation where decisions are made by uninformed voters
(Downs, 1957; Mueller, 2003)? How does it compare with the group outcome guided
by the best and brightest ―benevolent dictator‖ in a group – a logically coherent decision
system that has been pitted against democratic rules in the social choice literature
(Arrow, 1951; Laughlin, 2006) and a solution that is selected in some
naturally-occurring human groups?
In the following, we first report on an evolutionary computer simulation
(Kameda et al., 2003; Smith & Conrey, 2007; Kenrick, Li & Butner, 2003) to determine if
there is a mixed equilibrium in a ―group-foraging‖ task with significant and stable levels
of cooperation under different group decision rules, and then compare adaptive success of

Democracy Under Uncertainty 19
the different decision rules at respective equilibria. Next, we report a behavioral
experiment that implements a group foraging task under uncertainty in an interactive
laboratory set-up. In both cases, individuals (computer agents in the simulation study
and human participants in the behavioral experiment) were required to decide whether to
cooperate or defect before voting on a foraging location.
EVOLUTIONARY COMPUTER SIMULATION
Overview
We rely on an evolutionary simulation model based on Darwinian logic to explore
the implications of the diminishing group returns model and to evaluate the theoretical
viability of a Majority/Plurality group decision rule when informed participation in the
decision is individually costly. In the evolutionary simulation, we first specify a set of
behavioral strategies, and then let them interact in the same population (e.g., Axelrod,
1984; Gintis, 2000; Kameda et al., 2003). The strategies are defined in terms of the
basic cooperate (at personal cost) versus defect (at no personal cost) distinction. The
Darwinian logic dictates that more successful strategies in the current population
reproduce at higher rates for the next generation, analogous to biological evolution in an
ecological niche. In social scientific applications, such changes are not necessarily
evolutionary but may reflect, most notably, social imitative learning of successful
strategies in a group (Gintis, 2000). We observe whether such a change in the
population structure leads to a stable collective state where the population is dominated
by a set of strategies (or a strategy) and no further changes occur. If it does, the stable

Democracy Under Uncertainty 20
end state is called an evolutionary equilibrium (Gintis, 2000; Maynard Smith, 1982).
In the following simulations, we formulate four behavioral strategies in terms of
the basic distinction between cooperating (at a personal cost) versus defecting (at no
personal cost): (a) whether to pay a cost to acquire the information needed to make
well-informed individual judgments, and (b) whether to pay a cost in order to vote.
Individual cooperation (information search and voting) can increase the quality of group
decisions and thus enhance overall group return, but it entails a personal cost as well,
which presents a dilemma for the agent in deciding at what level to take part in collective
action.
Given such a dilemma, it seems that uncooperative members are unilaterally
better off than cooperative members, and we might expect them eventually to dominate
the population, which would yield an all-defect equilibrium. But based on Motro‘s
model (1991), we posit that a mixed equilibrium will emerge, where both cooperative and
uncooperative individuals coexist in the population. We test this prediction in two
populations governed by contrasting decision rules: the Majority/Plurality Rule (based on
the winner with the most votes in a one-member-one-vote election) versus the
Best-Member Rule (where the member with the best long-term ability/accuracy dictates
the choice). As a benchmark, we also examine a population operating with the
Random-Member Rule (where a randomly-chosen member dictates the choice to the
other members) as in Hastie & Kameda (2005).
If a mixed equilibrium indeed emerges for each population as predicted by the

Democracy Under Uncertainty 21
model, we will consider our second question: Does the Majority/Plurality Rule produce
better outcomes in terms of individual net benefit than the Best-Member Rule at the
respective equilibrium in each population? Is the ―wisdom of crowds‖ sustained over
time or does the Majority/Plurality Rule unravel into a free-riding world in which
decisions are made predominantly by uninformed voters?
Simulation Method
Simulation platform
To illustrate the basic features of our simulation, we rely on the metaphor of a
primitive forager seeking resources at locations in an uncertain physical environment (see
Hastie & Kameda, 2005, for more details on the procedure). This task represents the
essential features of a general decision problem faced by any organism: Which option
among a set of alternatives to choose, given noisy information about the payoff
contingent on choosing each option. The simulation world has two major components,
environmental events, namely the amounts of reward (gain or loss) available at various
locations, and foragers whose fitness depends on accurate judgments of the
environmental events (see Figure 3). The state of an environmental event (reward
available) is known probabilistically to foragers through proximal, partially valid cues
(i.e., a noisy cue is the true value plus a white-noise error term). Thus, each individual
faces the adaptive task of aggregating the information contained in these noisy cues to
infer whether environmental locations are rewarding or punishing. The individual
reward judgment process is a direct implementation of Brunswik‘s general ―Lens Model‖

Democracy Under Uncertainty 22
framework for perception and judgment (Brunswik, 1955; Cooksey, 1998; Hammond &
Stewart, 2001; Gigerenzer et al., 1999).
--------------------------------------
INSERT FIGURE 3 - STRUCTURE OF THE ENVIRONMENT
--------------------------------------
Structure of the environment. In the simulation, we set up the stochastic
features of environmental events as follows. Let j index one of 10 possible foraging
locations, j ∈{1, 2, …, 10}. To represent the true value of the food available at each of
these 10 locations, we generated random numbers from a normal distribution N(0, 30)
denoted, Qj (we refer to this quantity as the ―payoff‖ in this paper). Motivation for the
units used (e.g., standard deviation equal to 30) is discussed below. These true values,
however, cannot be directly known; information about each of the 10 values represented
by Qj is available in three noisy cues. These cues were generated by taking each
location‘s true resource value, Qj, and adding normally distributed error to it, creating a
cue value composed of true value + error. The normally distributed error terms were
specified with standard deviations of 10, 20, and 30. Therefore, the cues, denoted (C1,
C2, C3), differed in validity as predictors of the true value of each patch, with validities of
0.90, 0.69, and 0.50, respectively, on a proportion-of-variance-accounted-for metric (i.e.,
R-squared). As shown in the left portion of Figure 3, the optimal linear combination of
these cues for estimation (explaining 92% of the variance of Qj) was:
E[Qj |C1,C2,C3] = 0.68C1+0.17C2+0.08C3 . (1)

Democracy Under Uncertainty 23
Foragers. As evident from the discussion above, the adaptive goal for each
individual ―forager‖ is to combine the cues, in the same manner as the optimal linear
combination rule, to yield an estimate for value of the payoff (i.e., ―expected nutritional
value‖) available at each location. Such an individual estimation process, which we
refer to as a judgment policy (Brunswik, 1955; Hammond & Stewart, 2001), can be
represented by how the person weights the three proximal cues to form an estimate.
Our simulation implemented this feature by assigning judgment policies to foragers at
random as follows (see the right portion of Figure 3).
Member i‘s estimation of location j‘s value is expressed (i = member, j = location,
and k = cue):
estimated Qij = wi.1Cij1 + wi.2Cij2 + wi.3Cij3 (2)
where wi.1 is the weight forager i gives to his or her perception of Cue 1 for location j,
denoted Cij1. The model allows agents to experience perceptual errors. In other words,
cue values are not usually perceived veridically and different judges make different errors.
Each perceived cue value, Cijk, has two components: a true cue value (C.jk) that is
common to all members, plus an environmental-perceptual error (eijk), associated
uniquely with each member i‘s perception of the cue ( ijkjkijk eCC . ). The error
component, eijk, is generated randomly from N(0, 20).
We relied on Dawes‘ (1979; also Brehmer & Joyce, 1988, and Anderson, 1981)
observation that, in judgment tasks such as the one in our simulations, people appear to
use simplified linear aggregation rules. Instead of using optimal weights (e.g., Equation

Democracy Under Uncertainty 24
1), people judge as though they rely on approximate weights and often on equal weights,
getting the predictive ―direction‖ right, but only approximating relative cue importance.
(Dawes [1979] also demonstrated that such ―improper linear models‖ achieve levels of
accuracy comparable to optimal linear aggregation rules in many situations; see also
Gigerenzer, et al., 1999, for analyses of other simplified estimation rules).
Dawes‘ (1979) conclusion implies that most people would weight the three cues
approximately equally in aggregation. Based on this reasoning, our simulation used the
following procedure in the implementation of wi.k. For each member of each foraging
group, we generated three random numbers once and then standardized them so that their
sum equaled 1. The standardized fractions determined the member‘s judgment policy
which remained identical throughout the group‘s 100 ―hunts‖. Thus, the modal
judgment policy under this procedure is equal cue weighting, (.33, .33, .33), but there is
considerable variation in individual cue weighting policies. The important point is that
a modal forager‘s estimates in the basic simulation are not statistically optimal (see Eq. 1),
but on average are based on equal cue weights.
Behavioral strategies of the foragers
Members‘ judgment policies for cue-weighting were the only individual
differences that Hastie and Kameda (2005) considered in their simulation platform; these
are cognitive differences among members. To address the issue of the free-rider
problem in group decision-making, the current simulation introduced members‘
motivational differences for cooperation as a key element in the evolutionary algorithm.
Initially, we focused on two dimensions that often underlie members‘ cooperation in

Democracy Under Uncertainty 25
group decision-making (Downs, 1957; Riker & Ordeshook, 1973): (a) whether to accept
the information search cost to make well-informed individual judgments (Lupia, 2002;
Kameda & Nakanishi, 2002, 2003), and (b) whether to bear the cost of participating
(voting) in group meetings (Knack, 1992). As shown in Table 1, each dimension had
two behavioral options, creating four ―genotypes‖.
--------------------------------------
INSERT TABLE 1 – FOUR BEHAVIORAL STRATEGIES
--------------------------------------
For the search dimension, some agents engage in individual information search
about the environment and personally incur some cost (a simulation parameter to be
varied systematically) to obtain that information. These ―searchers‖ have access to the
environmental cues in all ten locations (Figure 3) and combine them according to their
judgment policies. Other agents (―non-searchers‖) skip information search to avoid the
search cost. Accordingly, they have no cue information to inform their judgments, and
if non-searchers ―vote‖ (see below), they endorse one alternative randomly (essentially
introducing ―noise‖ into the group decision). As in many public goods situations, group
payoffs are equally available to all irrespective of members‘ cooperation levels.
We quickly discovered, however, that only two of the four original strategies
could survive at the equilibrium: searcher/voter hybrids and non-searcher/abstainer
hybrids. The other two hybrids, searcher/abstainer and non-searcher/voter, disappeared
in the course of Darwinian selection. These two hybrids are ―evolutionarily irrational‖

Democracy Under Uncertainty 26
behavioral choices in this model in that they cannot sustain themselves (searchers who
abstain from voting harm themselves by wasting resources expended on information
search, while non-searchers who vote also harm themselves by degrading the accuracy of
group decisions in terms of average payoff). Thus, we collapsed the 2 x 2 system of
genotypes into a dichotomous cooperator (producer) versus defector (scrounger)
classification, which we use from now on in reporting the results of the simulation study.
(In the behavioral experiment to be reported subsequently, it remains an empirical
question what frequencies of these four behavioral genotypes will be observed.)
These strategies were subject to evolutionary selection in the simulation in that
the prevalence of each genotype in the population was adjusted over time based on the
behavioral payoffs that they received in the past; more successful strategies reproduced at
a higher rate in later generations.3
Evolutionary algorithm
The evolutionary algorithm is summarized in Figure 4. For illustration, let us
consider a population governed by the Majority/Plurality Rule. For each simulation run,
we started with an equal probability (0.50) that any member would be assigned to one of
the two behavioral strategies. Next, 12-person teams were formed by randomly
selecting individuals of various genotypes. Using the metaphor of foraging, this
twelve-person team goes on a ―hunt‖ together.
--------------------------------------
INSERT FIGURE 4 – EVOLUTIONARY ALGORITHM

Democracy Under Uncertainty 27
--------------------------------------
For each hunt, members behave according to their assigned strategies. The
group members are first provided an opportunity to acquire information about the current
environment. Searcher/voters engage in individual learning of the three cues for each of
ten locations at some personal cost which was assumed to be constant across foragers
(cost was varied as a simulation parameter). They rely on these three cues to choose the
best alternative based on their judgment policies (Figure 3; see also footnote 3).
Non-searcher/abstainers skip the individual learning, avoid the cost, and do not vote or
otherwise influence the group decision.
Searcher/voters‘ opinions are then aggregated by the Majority/Plurality Rule;
selecting the location endorsed by the greatest number of voters in the meeting. In case
of a tie, one of the alternatives (of those endorsed by at least one voter) is selected at
random. Payoff accruing from the group‘s collective choice (i.e., the payoff available in
the chosen patch) is equally shared among all members, whereas the corresponding costs
are subtracted from the shares for the cooperative searcher/voters.
The group repeats the same process for 100 different hunts in a new environment
on each hunt. The entire routine runs for 10,000 12-member groups, based upon which
we calculated the mean net benefit (fitness) for each of the two strategies, by collapsing
their net behavioral outcomes (individual gross return – cost) over 1,000,000 (100 x
10,000) trials.
One ―generation‖ ends here and, according to the Darwinian logic, agents with

Democracy Under Uncertainty 28
more fit strategies produce slightly more offspring for the next generation. We
formulated the selection mechanism by a standard numerical technique called the
replicator dynamic (see Gintis, 2000). In the replicator dynamic, a strategy associated
with a fitness greater than the average fitness in the current generation increases in
frequency in the next generation, while a strategy associated with a fitness less than the
average decreases (see Appendix A for details). Using this idealized evolutionary
process, we observed adjustments in the population strategy structure over generations.
The simulation repeated the above steps for many generations until an equilibrium
state emerged in the population. The equilibrium refers to a state where no further
changes occur in the distribution of strategies in the population. In the simulation, we
terminated iterations when changes in proportions of the strategies between two
consecutive generations dropped below .0001.
As noted, we created three types of populations (―societies‖), one governed by the
Majority/Plurality Rule; one governed by a Best-Member Rule, where the most
competent member (i.e., the member whose judgment policy was closest to the optimal
weighting) among the searcher/voters in each group was initially designated the leader
and made the decisions for the subsequent 100 hunts, and the other governed by a
Random-Member Rule, where one searcher/voter in each group was initially selected at
random and made decisions for the 100 hunts. For each of the three decision rule
societies respectively, we conducted separate simulation runs to see if an equilibrium
state emerged. When the equilibrium was reached in each society, we compared the

Democracy Under Uncertainty 29
three societies (governed by different decision-making rules) in terms of average
individual net benefits (―individual fitness‖).
Simulation Results and Discussion
Emergence of a mixed equilibrium over time
We systematically varied the cost parameters for cooperation (cost parameters for
information search and voting) and the number-of-resource-locations parameter. We
fixed the group size at 12 throughout the simulation runs. Figure 5 displays equilibrium
proportions of the two viable strategies (searcher/voters versus non-searcher/abstainers)
in each population (Majority/Plurality Rule, Best-Member Rule, or Random-Member
Rule), as a function of the total cooperation cost (the figure shows simulation results
when the number of resource locations was set at 10; later we will show results from a
sensitivity analysis where the two parameters were varied simultaneously).
--------------------------------------
INSERT FIGURE 5 – EQUILIBRIUM PROPORTIONS OF THE STRATEGIES
--------------------------------------
As expected, a mixed equilibrium emerged in each of the three societies. For
example, when the cooperation cost was set at 0.03, 45% were cooperative searcher/voter
hybrids in the Majority/Plurality Rule population, 39% in the Best-Member Rule
population, and 35% in the Random-Member Rule population.4
Rather than being
dominated solely by the free-riding non-searcher/abstainer hybrids, the cooperative

Democracy Under Uncertainty 30
searcher/voter hybrids sustained themselves in a stable manner. These results support
our hypothesis that cooperation in group decision-making under uncertainty can be
conceptualized as a game where a mixed equilibrium exists (Motro, 1991; Laury & Holt,
2008).
Individual net benefits
Given the emergence of the mixed equilibrium, we can address our nextl question:
Does the Majority/Plurality Rule produce better results for individuals in terms of
average net benefits than the Best-Member Rule, when incentives for free-riding exist?
Figure 6 displays individual net benefits (individual gross return – cost) at the respective
equilibriums in the three societies, as a function of total cooperation cost.
--------------------------------------
INSERT FIGURE 6 – INDVIDUAL NET PAYOFF AT THE EQUILIBRIUM
--------------------------------------
Individuals in the Majority/Plurality Rule population were better off than those in
the Best-Member Rule population, who were substantially better off than the
Random-Member Rule population, for the parameter range displayed in Figure 6.
However, notice also that the difference in net benefits between the two key populations
decreased as the cooperation costs increased. This suggests that the superiority of the
Majority/Plurality Rule over the Best-Member Rule may be eliminated and even reversed
when cooperation costs are high. Indeed, this was the case in all the simulations we ran.

Democracy Under Uncertainty 31
When the cooperation cost was 0.27 or higher (see footnote 4), the relative standings of
the two rules were reversed [these points are not displayed in Figure 6 to simplify the
graphic representation].
How can we interpret these patterns? A close inspection of the equilibrium
proportions of cooperative and defecting individuals in the population (see Figure 5)
provides some insights. Figure 5 shows that the proportions of searcher/voter hybrids
decreased monotonically with a higher cooperation-cost. For example, in the
Majority/Plurality Rule population, the proportion of the cooperative individuals dropped
to 27% when the cost was 0.15 (on the right side of the diagram). This implies that,
with the increase in cooperation cost, the average frequency of searcher/voter hybrids
(cooperators) in each 12-person group could eventually fall below three (≈ 12 x 0.27).
Notice that three is the minimum number of voters for the Majority/Plurality Rule to be
meaningfully compared with the Best-Member Rule and other group decision processes,
as if the frequency of voters is less than three, no majority/plurality can be defined among
the voters, except for the theoretically trivial case of perfect agreement. In other words,
when the cooperation cost is high, searcher/voter hybrids become so rare that most
decision-making groups fail to assemble the critical voter-quorum (three). In these
circumstances, the Best-Member Rule beats the ―indecisive‖ Majority/Plurality Rule.
Sensitivity analysis
In order to see how robust these findings were, we conducted a sensitivity
analysis varying key parameters: the number of choice alternatives (from two to 11) and

Democracy Under Uncertainty 32
the cooperation costs (from 0.03 to 0.27), with group size held constant at 12. A mixed
equilibrium, as we observed in Figure 5, emerged for all combinations of these parameter
values. Given this, we only report relative standings of the Majority/Plurality Rule to
the Best-Member Rule in terms of individual net payoffs at the respective equilibria.
Figure 7 displays differences in individual net benefits between the two populations
(Majority/Plurality Rule minus Best-Member Rule) as a joint function of the cooperation
costs and the number of alternatives. In the iceberg-shaped surface, the unshaded
(―above water‖) regions refer to parametric combinations where the Majority/Plurality
Rule outperformed the Best-Member Rule (i.e., the net benefits difference score was
greater than zero), and the shaded (―underwater‖) regions refer to the reverse situation.
--------------------------------------
INSERT FIGURE 7 – SENSITIVITY ANALYSIS
--------------------------------------
First, as we saw in Figure 6, the relative advantage of the Majority/Plurality Rule
over the Best-Member Rule decreased monotonically, and was eventually reversed with
higher cooperation costs (represented on the x-axis). As the cooperation costs increased,
the equilibrium proportion of searcher/voter hybrids in the population decreased and
groups operating with the Majority/Plurality Rule could rarely assemble 3 voters.
Second, the Majority/Plurality Rule was more successful with greater numbers of choice
alternatives (the second abscissa). As can be seen in the figure, the unshaded regions in
the graph, where the Majority/Plurality Rule outperformed the Best-Member Rule, were
Democracy Under Uncertainty 33
larger with more locations (in general, more elements in the group‘s choice set).
To summarize, the sensitivity analysis demonstrated that the Majority/Plurality
Rule was more successful than the Best-Member Rule when the cooperation cost was
small and when there were more locations (i.e., choice-alternatives in the group‘s choice
set). (Of course, if cooperation costs are extremely high, no one will cooperate and all
decision rules will perform at equally low levels.) These results suggest that, despite the
inherent free-rider problems in group decision making, there exist large parametric
regions where the Majority/Plurality Rule is successful in an uncertain game against
nature.
BEHAVIORAL EXPERIMENT
The next step is to see how these theoretical results fare as hypotheses about the
behavior of human decision-making groups. For this purpose, we designed a laboratory
task where we could compare the performance of the Majority/Plurality Rule and the
Best-Member Rule, while measuring each member‘s cooperation during the
decision-making process. Based on the simulation results, we predict: (a) that
participants will be divided into one of the two behavioral types, searcher/voter hybrids
(cooperators) or non-searcher/abstainer (defectors) hybrids, and (b) that the proportions
of these two types of members will stabilize over time, consistent with the expectation of
a mixed equilibrium. We also predict (c) that groups governed by Majority/Plurality
Rule will be better off than those governed by the Best-Member Rule in terms of
individual net payoffs. Of course, the simulation model suggests that this prediction is

Democracy Under Uncertainty 34
parameter-dependent (Figure 7); our aim is to provide an empirical demonstration (or an
―existence proof‖) of one case where majoritarian decision rule works well under
uncertainty in face of the free-rider problem.
Method
Participants
Participants were 180 undergraduate students (127 males and 53 females)
enrolled in introductory psychology classes at Hokkaido University.
Group Decision Task
We implemented a hunting-under-uncertainty task through a Local Area Network
in a behavioral laboratory. We told participants that they were members of six-person
teams that must choose one of ten locations in which to hunt (instead of 12-person groups
assumed in the simulation, we used 6-person groups in the experiment due to practical
constraints). Resource levels (e.g., prey values) in each location were generated
randomly from a normal distribution N(80, 30) [unit = 1 yen]. The resource levels
could only be estimated on the basis of three stochastic cues that differed in predictive
validity and ―perceptual errors,‖ analogous to the model in the previous section. The
parametric set-ups for the cue structure and the perception errors were identical to those
used in the simulation reported here in Figure 3.5
The group decision task was to select the most profitable location, using either the
Majority/Plurality Rule or the Best-Member Rule. These rules were assigned to each

Democracy Under Uncertainty 35
group at the outset. Participants‘ rewards were made contingent upon their performance
in the hunts. Specifically, resources in the chosen patch were divided evenly among all
six members, although cooperative members (who engaged in information search and/or
voting) incurred personal costs, which were subtracted from their individual accounts.
Procedure
Six participants were randomly assigned to one of two decision-rule conditions
(Majority/Plurality or Best-Member), in experimental sessions lasting approximately one
hour. There were 15 groups (90 participants) in each condition. Upon arrival, each
participant was seated in a private cubicle and received instructions individually via
computer displays. After the hunting-under-uncertainty task was explained, participants
were provided an opportunity to familiarize themselves about how to use the three
stochastic cues (see Figure 3 for the cue structure), displayed on the screen for each of the
ten locations. For 20 practice trials, each participant made personal judgments as to the
most profitable location out of ten alternatives. On each of the 20 practice trials, they
received feedback about their choice success, in terms of the discrepancy in resource
levels between the chosen location and the most profitable one (the most profitable
location was also identified on the screen). Because this was a practice session, all the
judgments in this phase were individual, without reward.
Majority/Plurality Rule versus Best-Member Rule. After practicing the
cue-based judgment under uncertainty task, participants were told they were members of
a six-person hunting-team seeking the most profitable location out of ten. They were

Democracy Under Uncertainty 36
told that their rewards in the experiment would be contingent on the success of their
group decisions. Participants in the Majority/Plurality Rule condition were told that the
location endorsed by the greatest number of voters would be designated as their
collective choice by the computer. Participants in the Best-Member Rule condition
were told that the best individual (who was most accurate in the practice session) among
the voters on each ―hunt‖ would be automatically selected by the computer
(anonymously), and that participant‘s choice would be designated the group choice.
Costs for cooperation. Costs (incentives for free-riding) were introduced as
follows: First, members who chose to collect environmental information, when forming
individual judgments, had to pay 3 yen. Second, voters who chose to participate in a
group meeting to express their preferences had to pay another 3 yen. However, the
payoff from the selected location was to be equally shared among all six members
whether they incurred costs or not. The experiment consisted of 24 trials with 3 new
hunts in each trial. Before each of the 24 trials, each participant was asked whether he
or she wanted to pay 3 yen for information search and whether to pay 3 yen to vote on the
trial (these decisions were made independently).6
Only individuals who had paid the
information search cost could access the environmental cues when forming individual
judgments, while those who had not paid the search cost could not access the cue
information in the three hunts during that trial. And, only individuals who had paid the
voting cost were able to express their preferences during that trial. For each hunt, the
group decision was reached by aggregating these voters‘ preferences via either the

Democracy Under Uncertainty 37
Majority/Plurality Rule or the Best-Member Rule (the aggregation was conducted by the
computer).
Outcome feedback. After each of the 24 trials, participants were provided
private feedback. The feedback consisted of their personal net benefit earned during the
trial (i.e., evenly split share of the sum of group outcomes from the three hunts minus an
individual‘s own cooperation costs) and the number of group members who voted during
the trial.7
Through the summary feedback, participants could learn how well they
performed on the trial and adjust their cooperation levels on the next trial. Unlike the
practice session, no specific feedback was provided as to personal accuracy.
Results and Discussion
Emergence of stable cooperation over time
Our evolutionary simulation model suggested that group decision making under
uncertainty would eventually yield a mixed equilibrium, where cooperative and
uncooperative individuals coexist in a stable manner. Specifically, we predicted that
participants would be divided into one of the two behavioral types over time,
searcher/voter hybrids versus non-searcher/abstainer hybrids, and that proportions of
these two types of members would stabilize.8
Interlocked information-search strategies and the voting strategies. We
examined how frequently each participant showed the behavioral linkage between the
choices of information search strategy and voting that we observed in the simulation.
For this analysis, we divided the 24 trials into three 8-trial-blocks. Figure 8 shows mean

Democracy Under Uncertainty 38
proportions of the trials in each block, where participants‘ strategic choices were coherent,
i.e., either totally cooperative (searcher/voter hybrid) or totally uncooperative
(non-searcher/abstainer hybrid).
--------------------------------------
INSERT FIGURE 8 – INTERLOCKING BETWEEN THE TWO STRATEGIES
--------------------------------------
Consistent with the simulation, mean proportions of the coherent choices
(searcher/voter hybrids and non-searcher/abstainer hybrids) increased over time, reaching
nearly 100% coherence in the last block. A 2 (condition) x 3 (block) x 15 (group)
Analysis of Variance (using a hierarchical linear model) yielded a main effect for block,
F(2, 52) = 36.52, p<.001. This means that, if an individual voted in the last block of the
experiment, she or he, with probability very close to 1, had also engaged in costly
individual information search. Voting by ignorant members in truth-seeking situations
(e.g., ―group foraging‖) would be self-defeating in terms of individual net payoff,
because it would degrade the overall quality of group decisions, while exacting a
personal voting cost (Lupia, 1994). If members are aware of these cost issues, a
behavioral linkage between information search strategy and voting should emerge
voluntarily without social enforcement mechanisms in truth-seeking groups, as in the
present experiment.
Stabilization of cooperation (searcher/voter hybrids) over time. Were the
cooperative members (search/voter hybrids) able to sustain themselves in actual groups,

Democracy Under Uncertainty 39
as predicted by the evolutionary simulation model? Or, was the coherent-choice pattern
due to the tendency of uncooperative members (non-searcher/abstainer hybrids)
eventually to dominate groups? For this analysis, we estimated the theoretical
equilibrium frequency of cooperators in each condition. We first estimated the
empirical group and individual payoff functions by means of an econometric procedure,
and then estimated the equilibrium frequency and the Pareto-optimum frequency for the
Majority/Plurality Rule (see Appendix B for the estimation procedure).
Figure 9 displays mean frequencies of the cooperative members in each group
across the 24 trials, along with the equilibrium frequency and the Pareto optimum (local
and global) frequency in the Majority/Plurality Rule condition.9
Although the mean
frequencies of cooperative searcher/voter hybrids slightly decreased over trials, about
half of members remained cooperative on the last trial. Notice that the mean frequency
of cooperative members in the Majority/Plurality Rule condition was 3.13 on the final
trial and was significantly greater than the equilibrium frequency (t(14) = 3.89, p < .001).
Indeed, the modal number of cooperators across all groups in all trials in the
Majority/Plurality Rule condition was 3, with more than 75% of observed action profiles
containing 3 or more cooperators. Figure 10 displays the empirical distribution of the
numbers of group members who cooperated (N) across 360 observations (15 groups x 24
trials).
--------------------------------------
INSERT FIGURE 9 – MEAN FREQUENCIES OF COOPERATIVE MEMBERS

Democracy Under Uncertainty 40
INSERT FIGURE 10 – FREQUENCY DISTRIBUTION OF NUMBER OF
COOPERATORS IN GROUPS IN THE MAJORITY/PLURALTIY RULE CONDITION
--------------------------------------
Notice also that variances associated with the mean frequencies, as depicted by
vertical bars in Figure 9, decreased over time in both conditions. Dividing the 24 trials
into three 8-trial-blocks, a 2 (condition) x 3 (block) repeated measures ANOVA on the
variability index revealed a significant main effect for block, F(2,56) = 8.02, p < .001.
Thus, most groups stably functioned at a locally Pareto efficient level of public goods
contributions, with 3 contributors and 3 free-riders per group. The unambiguous modal
value (Figure 10) is remarkable in finding a locally best outcome in group terms despite
the fact that the individual incentives built into the game structure would predict far less
cooperation at N=1 (see Appendix B).
Did the stabilization in cooperation rates occur at the aggregate level or at the
individual level? That is, did different individuals cooperate on each trial or did the
same individuals cooperate (and the others consistently defect) across trials? Figure 11
displays how frequently individual participants cooperated during each of the three
blocks in the Majority/Plurality Rule and the Best-Member Rule conditions. Since each
block is composed of 8 trials, the frequency of cooperation (search and vote) during a
block could range from 0 (a total free-rider) to 8 (a total cooperator). As can be seen in
Figure 11, the relatively symmetric distribution pattern in the first block dissolved over
time and the distribution in the last block was U-shaped, with the 100%-consistent

Democracy Under Uncertainty 41
cooperators and 100% consistent free-riders jointly representing 32% (the
Majority/Plurality Rule) and 42% (Best-Member Rule) of the participants. This
indicates that, at least when individual adjustment is the basis for sorting into strategies,
there is a trend towards polymorphic role self-assignment, with ―types‖ of individuals
adopting different consistent strategies.
Taken together, these results indicate that both uncooperative
non-searcher/abstainer hybrids and cooperative searcher/voter hybrids persisted across
trials, and that their proportions in each group stabilized over time.
--------------------------------------
INSERT FIGURE 11 – OBSERVED FREQUENCIES OF INDIVIDUAL STRATEGIES
--------------------------------------
Did the Majority/Plurality Rule outperform the Best-Member Rule?
Given that the rates of cooperation stabilized in each group over time, we can
address our next question: Did the Majority/Plurality Rule produce better net benefits to
group members than the Best-Member Rule? Figure 12 shows that average per-trial
individual net benefits were higher in the Majority/Plurality Rule condition than in the
Best-Member Rule condition across the three blocks of trials. A 2 (condition) x 3
(block) x 15 (group) repeated ANOVA using a Hierarchical Linear Model revealed a
significant main effect for the group decision rule, F(1, 28) = 11.90, p < .002.
--------------------------------------

Democracy Under Uncertainty 42
INSERT FIGURE 12 – MEAN INDIVIDUAL NET PAYOFFS
--------------------------------------
How does this pattern relate to the theoretical results from the evolutionary
computer simulations? Notice that the theoretical equilibrium frequency of cooperators,
estimated by fitting an econometric model to the data (Appendix B), was 1 in the
Majority/Plurality Rule condition (see Figure 9). This means that, theoretically, the
Majority/Plurality Rule should yield worse (at least no better) outcomes than the
Best-Member Rule, because the minimal effective voting quorum for the
Majority/Plurality Rule (three members) could not be assembled. However, as we
observed in Figure 9, the mean frequencies of the cooperative, searcher/voter hybrids
stabilized at slightly above three under the Majority/Plurality rule. The minimal quorum
(three searcher/voter hybrids) persisted in the experiment and, consequently, the
Majority/Plurality Rule yielded higher individual net payoffs than the Best-Member Rule
(shown in Figure 12). These results imply that behaviorally—although not predicted by
theory—the parametric range where the Majority/Plurality Rule outperforms the
Best-Member Rule may be much wider than that predicted by theory (shown in Figure 7).
Even in cases where individual cooperation cost is theoretically too high to secure the
minimal quorum (three) for the Majority/Plurality Rule, observed frequencies of
cooperators in each group often surpassed the quorum (Laury, Walker, & Williams, 1999;
Sefton & Steinberg, 1996).

Democracy Under Uncertainty 43
GENERAL DISCUSSION
The present research develops an explanation for the fact that human groups that
engage in production often contain a share of highly cooperative individuals who
contribute to public enterprises at a cost to themselves, such as those who prepare well
for committee meetings, devote substantive time and energy writing a joint grant
proposal, or stay on lookout to protect their village from enemies/predators. It provides
a principled alternative to the over-generalized prediction of the linear model that the
only rational choice is to free-ride. Recall that group production function in the linear
model is often set arbitrarily by researchers. For example, it is common practice in
public-goods game experiments to multiply an individual‘s contribution by some
arbitrary number and then divide it by group size to determine a (constant) personal
return from the contribution; and, this personal return is set to be less than the individual
cooperation cost, regardless of the number of contributors in the group (Ledyard, 1995).
Although such a linear model is a useful device to consider some theoretical problems
concerning cooperation (e.g., effects of punishment; Fehr & Gächter, 2000), it is a serious
misconception to assume that most natural group production tasks fall into this category.
The analysis of the cooperate-or-free-ride, produce-or-scrounge decisions in terms of the
Motro framework, with its plausible assumptions of a marginally-diminishing-returns
group production function is conceptually compelling, realistic, and supported by
theoretical simulations and a behavioral experiment. Our conceptual framework, based
on the ubiquity of the marginally-diminishing returns group production function common

Democracy Under Uncertainty 44
in natural settings, provides a useful benchmark explanation for realistic levels of
cooperation in broad range of small group activities (McGrath, 1984; Steiner, 1972). It
also seems more convincing than alternate, somewhat contrived explanations that posit
special sources of indirect utility satisfaction such as ―expressive functions‖ and utility
derived from fulfilling ―civic duty‖, though these prosocial motives may be important in
some cases (Brennan & Lomasky, 1993).
The insight that guides the present research is that group performance is not
necessarily a strict social dilemma if group production is a marginally-diminishing
function of the number of productive members (as it usually is) and if personal
production costs add up (as they usually do). If the marginal individual return to
contributing is greater than its cost for some members (i.e., c < δm for some m between 0
and group size), the equilibrium is a mixture of cooperation and free-riding. In simpler
terms, in most groups it is to the individual member‘s personal advantage to produce
(contribute), unless an equilibrium number of other members is already contributing.
We believe that group decision making tasks and many other group tasks in natural
settings are of this type. Perhaps most surprising of all, we found that experimental
human decision making groups yielded a stable behavioral equilibrium at a locally Pareto
efficient level of public goods contributions, with 3 contributors and 3 free-riders per
group. Finally, we found that majoritarian group decision rules have an adaptive value
under uncertainty, and this result may explain why majority-plurality rules are popular
across the full spectrum of human groups from hunter-gatherer or tribal societies (Boehm,

Democracy Under Uncertainty 45
1996; Boyd & Richerson, 1985; Wilson, 1994) to modern industrial democracies (Hastie
et al., 1983; Kameda et al., 2003; Mueller, 2003).
Our results are conceptually relevant to the long-term puzzle in political science
about why citizens invest resources to become well-informed and to vote (e.g., Mueller,
2003; Riker & Ordeshook, 1973). In an election, the cost associated with voting is
personal and seems to outweigh any individual benefit that the act of voting can possibly
yield. Why would rational individuals bother to spend time and resources to become
well-informed and go to the polls, if the chance of having an impact on the outcome of
the election is virtually zero (―the Voter‘s Paradox,‖ Downs, 1957)?
We should emphasize that there are several key differences between small-group
decision making and elections. First, there is the obvious difference in the size of
electorate, implying that each vote is much more consequential in small-group decision
making than in a large-scale election. Second, most theoretical analyses of small-group
decision making, including our own, have posited that ―common values‖ (Feddersen &
Pesendorfer, 1996) or ―truth‖ (Condorcet, 1785/1994) underlie group decisions; members
seek the mutually most beneficial outcome via group decisions (e.g., finding the most
valuable investment, finding the truth in a criminal jury trial). In contrast, a large scale
election is a competition among several factions (e.g., parties) with disparate ideologies
and preferences. This difference is important because, in the political domain, two
motives operate when each individual decides whether to vote or to not – free-riding and
competition (Dhillon & Peralta, 2002; Palfrey & Rosenthal, 1983). Within each faction

Democracy Under Uncertainty 46
(e.g., supporters of ―Candidate A‖) sharing the same preference, each individual is
personally better off free-riding if a sufficient number of individuals are already voting
for the alternative. However, in the political domain, competition is also a motive. In
order for your party to win the election, you must assemble more voters than the other
parties. This competition factor is absent in our group decision making situation where
members collectively play a ―game against nature‖ (Bornstein, 2003).
In this sense, it remains to be seen how exactly the two decision situations relate
to each other, both theoretically and behaviorally. One possible extension of our group
decision-making paradigm might be to have two teams of hunters compete for the same
resource. The team with the more accurate group decision monopolizes the resource
and distributes it evenly among members on the winning team, as found in some political
domains. How cooperative will members be in situations where the competitive and
free-riding motives conflict? Will a stable equilibrium emerge over time? Is the
Majority/Plurality Rule better in those settings than the Best-Member Rule? These
questions are important and provide another test of the adaptive robustness of
majoritarian decision making under uncertainty.
There are several limitations on the conclusions of this paper. Perhaps most
obvious is the assumption that group members develop individual judgments
independently from each other. Although this assumption has been common in the
previous theoretical work (Hastie & Kameda, 2005; Sorkin et al., 2001), future work
should relax this condition to see its impact on group decisions. Indeed, if members

Democracy Under Uncertainty 47
conform (Asch, 1956) or mimic (Hung & Plott, 2001) each other when forming
individual judgments, majoritarian aggregation could be subject to ―herding‖ effects,
where erroneous information cascades across individuals to yield defective outcomes
(e.g., Anderson & Holt, 1997; Banerjee, 1992; Bikhchandani, Hirshleifer, & Welch, 1992;
Kameda & Tamura, 2007). Because the Majority/Plurality Rule works under
uncertainty via its error-cancellation function (Hastie & Kameda, 2005; Hung & Plott,
2001), independence among members is a key contributor to its success (Surowiecki,
2004). One possible extension to address this question is to provide each individual
(computer agent or human participant) an option to mimic another‘s judgments (i.e.,
free-riders who skip information search can mimic other members, rather than deciding
randomly as assumed in the current model) and to examine the performance of the
majoritarian aggregation when social learning is possible (Henrich & Boyd, 1999;
Kameda & Nakanishi, 2002, 2003).
Second, our results are obviously contingent on the distribution of competence
among group members. In the simulation, group members‘ modal judgment policies
were not statistically optimal (Eq. 1) but were based on the suboptimal, ―equal
cue-weighting‖ (Dawes, 1979) with substantive variation; members‘ preferences were
thus affected not only by random error in cue perception but also by the systematic biases
built in their judgment policies. However, if these modal members had even more
deviating judgment policies while the most competent member had a near perfect
judgment policy, then the parametric range where the Majority/Plurality Rule
Democracy Under Uncertainty 48
outperforms the Best-Member Rule would necessarily become much narrower (Kerr et
al., 1996). It remains to be seen how and under what conditions the accuracy of modal
group members‘ preferences, relative to that of the brightest member, can be guaranteed
in naturally-occurring settings (Surowiecki, 2004).
Third, in our simulation and experiment, group members had no direct
opportunities to coordinate their actions ex ante. However, if members are allowed to
coordinate their behaviors in advance, they may eventually develop some social norms to
produce more equitable outcomes within a group, rather than allowing some members to
free ride on others unilaterally (Figure 11). For example, such social norms may take
the form of turn-taking to bear the cost of cooperation equally among all members.
Given the central importance of ―inequity aversion‖ in human cooperation (Fehr &
Schmidt, 1999), it will be interesting to see how such egalitarian norms and mutual
expectations (Fehr & Fischbacher, 2004; Kameda, Takezawa, Ohtsubo & Hastie, 2010;
Kerr, 1983) may develop in groups working on tasks with
marginally-diminishing-return-curves.
Lastly, the model we have developed in this paper is an
evolutionary/population-level model whereby ultimate causes (Tinbergen, 1963) for
cooperation in group decision making are considered. It still remains to see how each
individual actually computes costs and benefits of their cooperation in a group task with a
marginally-diminishing-return-curve, and especially how they coordinate their behaviors.
Behavioral ecologists studying group decision making by non-human animals have

Democracy Under Uncertainty 49
begun to address these questions to understand computational algorithms for collective
nest search by honey bees, collective navigation by baboons, and so on (see the special
issue of Philosophical Transactions of the Royal Society B, 2009, edited by Larissa
Conradt and Christian List). Given the robustness of marginally-diminishing-returns
group production function in nature (Foster, 2004), cross-fertilization between human and
non-human animal researchers will be useful to delineate proximate mechanisms
underlying cooperation and coordination in group endeavors.
We hope our methodology, starting with a description of the situation in game
theory terms, followed by computer simulation explorations, and then behavioral
experiments is appealing to other researchers. And, we hope that the virtues of this
eclectic approach are self-evident. Social behavior is often more adaptive and more
rational than it sometimes appears at first glance. Thinking about functional, adaptive,
and rational properties of a system will often reveal a deeper structure that is not apparent
to a superficial descriptive analysis (Barkow, Cosmides & Tooby, 1992; Gigerenzer et al.,
1999; Schelling, 1978). The wisdom of crowds can arise from fundamental laws of
social ecology that emerge from individually adaptive strategies (Surowiecki, 2004).

Democracy Under Uncertainty 50
References
Aldrich, J.A. (1997). When is it rational to vote? In D. Mueller (Ed.), Perspectives on
public choice: A handbook (pp.379-390). Cambridge: Cambridge University
Press.
Anderson, L. R., & Holt, C. A. (1997). Information cascades in the laboratory.
American Economic Review, 87, 847-862.
Anderson, N.H. (1981). Foundations of Information Integration Theory. New York:
Academic Press.
Arrow, K. J. (1951). Social choice and individual values (1st ed.). New Haven, CT:
Yale University Press.
Asch, S. E. (1956). Studies of independence and conformity: A minority of one against
a unanimous majority. Psychological Monographs, 70 (Whole No.416).
Axelod, R. (1984). The evolution of cooperation. New York: Basic Books.
Banerjee, A. V. (1992). A simple model of herd behavior. Quarterly Journal of
Economics, 107, 797-817.
Barkow, J. H., Cosmides, L., & Tooby, J. (Eds.) (1992). The adapted mind:
Evolutionary psychology and the generation of culture. Oxford: Oxford
University Press.
Barnard, C.J., & Sibly, R.M. (1981). Producers and scroungers: A general model and its
application to captive flocks of house sparrows. Animal Behaviour, 29,

Democracy Under Uncertainty 51
543-555.
Bednekoff, P. (1997). Mutualism among safe, selfish sentinels: a dynamic game.
American Naturalist, 150, 373-392.
Bikhchandani, S., Hirshleifer, D., & Welch, I. (1992). A theory of fads, fashion, custom,
and cultural change as informational cascades. Journal of Political Economy,
100, 992-1026.
Boehm, C. (1996). Emergency decisions, cultural-selection mechanics, and group
selection. Current Anthropology, 37, 763-793.
Bornstein, G. (2003). Intergroup conflict: Individual, group, and collective
interests. Personality and Social Psychology Review, 7, 129-145.
Boyd, R., & Richerson, P. J. (1985). Culture and the evolutionary process. Chicago:
The University of Chicago Press.
Brehmer, B., & Joyce, C.R.B. (Eds.) (1988). Human judgment: The SJT view.
Amsterdam: North-Holland.
Brennan, G., & Lomasky, N. (1993). The pure theory of electoral preference.
Cambridge: Cambridge University Press.
Brunswik, E. (1956). Perception and the representative design of psychological
experiments (2nd
ed.). Berkley, CA: University of California Press.
Camerer, C.F. (2003). Behavioral game theory. Princeton, NJ: Princeton University
Press.

Democracy Under Uncertainty 52
Campbell, D.T. (1988). A general ‗selection theory,‘ as implemented in biological
evolution and social belief-transmission-with-modification in science. Biology
and Philosophy, 3, 171-177.
Cason, T. N., Saijo, T., & Yamato, T. (2002). Voluntary Participation and Spite in
Public Good Provision Experiments: An International Comparison. Experimental
Economics , 5, 133–153.
Cason, T. N., Saijo, T., Yamato, T., & Yokotani, K. (2004). Non-excludable public
goods experiments. Games and Economic Behavior, 49, 81-102.
Clemen, R.T., & Winkler, R.L. (1999). Combining probability distributions from
experts in risk analysis. Risk Analysis, 19, 187-203.
Condorcet, M. (1785/1994). Éssai su l’application de l’analyse à la probabilité des
décisions rendues à la pluralité des voix. Paris (translated by McLean & Hewitt,
1994).
Conradt, L., & List, C. (Eds.) (2009). Theme issue: group decision making in humans
and animals. Philosophical Transactions of the Royal Society B, 364, 719-852.
Cooksey, R.W. (1996). Judgment analysis: Theory, methods, and applications. San
Diego: Academic Press.
Dawes, R.M. (1979). The robust beauty of improper linear models. American
Psychologist, 34, 571-582.
Dawes, R. M. (1980). Social dilemmas. Annual Review of Psychology, 31, 169-193.

Democracy Under Uncertainty 53
Dhillon, A., & Peralta, S. (2002). Economic theories of voter turnout. Economic
Journal, 112, 332-352.
Downs, A. (1957). An economic theory of democracy. New York: Harper and Row.
Feddersen, T., & Pesendorfer, W. (1998). Convicting the innocent: The inferiority of
unanimous jury verdicts under strategic voting. American Political Science
Review, 92, 23-36.
Fehr, E., & Fischbacher, U. (2003). The nature of human altruism. Nature, 425,
785-791.
Fehr, E., & Fischbacher, U. (2004). Social norms and human cooperation. Trends in
Cognitive Sciences, 8, 185-190.
Fehr, E., & Gächter, S. (2000). Cooperation and punishment in public goods
experiment. American Economic Review, 90, 984-994.
Fehr, E., & Gächter, S. (2002). Altruistic punishment in humans. Nature, 415, 137-140.
Fehr, E., & Schmidt, K.M. (1999). A theory of fairness, competition, and cooperation.
Quarterly Journal of Economics, 114, 817-868.
Foster, K.R. (2004). Diminishing returns in social evolution: the not-so-tragic commons.
Journal of Evolutionary Biology, 17, 1058-1072.
Gigerenzer, G., Todd, P. M. & the ABC Research Group (1999). Simple heuristics that
make us smart. New York: Oxford University Press.
Gilardeau, L-A., & Caraco, T. (2000). Social foraging theory. Princeton, NJ:

Democracy Under Uncertainty 54
Princeton University Press.
Gintis, H. (2000). Game theory evolving. Princeton, NJ: Princeton University Press.
Gintis, H. (2007). A framework for the unification of the behavioral sciences.
Behavioral and Brain Sciences, 30, 1-61.
Hammond, K.R., & Stewart, T.R. (2001). The essential Brunswik: Beginnings,
explications, and applications. New York: Oxford University Press.
Hastie, R. (1986). Review essay: Experimental evidence on group accuracy. In B.
Grofman & G. Owen (Eds.), Information pooling and group decision making.
Greenwich, CT: JAI Press.
Hastie, R., & Kameda, T. (2005). The robust beauty of majority rules in group
decisions. Psychological Review, 112, 494-508.
Hastie, R., Penrod, S.D., & Pennington, N. (1983). Inside the jury. Cambridge:
Harvard University Press.
Henrich, J., & Boyd, R. (1998). The evolution of conformist transmission and the
emergence of between-group differences. Evolution and Human Behavior, 19,
215-241.
Herrmann, B., Thöni, C., & Gächter, S. (2008). Antisocial punishment across societies.
Science, 319, 1362-1367.
Hung, A. A., & Plott, C. R. (2001). Information cascades: Replication and an extension
to Majority Rule and conformity-rewarding institutions. American Economic

Democracy Under Uncertainty 55
Review, 91, 1508-1520.
Ingham, A.G., Levinger, G., Graves, J. and Peckham, V. (1974). The Ringelmann Effect:
Studies of group size and group performance. Journal of Experimental Social
Psychology, 10, 371-84.
Janis, I. L. (1972). Victims of groupthink. Boston, MA: Houghton Mifflin.
Kameda, T., & Nakanishi, D. (2002). Cost-benefit analysis of social/cultural learning in
a non-stationary uncertain environment: An evolutionary simulation and an
experiment with human subjects. Evolution and Human Behavior, 23, 373-393.
Kameda, T., & Nakanishi, D. (2003). Does social/cultural learning increase human
adaptability? Rogers‘s question revisited. Evolution and Human Behavior, 24,
242-260.
Kameda, T., Takezawa, M., & Hastie, R. (2003). The logic of social sharing: An
evolutionary game analysis of adaptive norm development. Personality and
Social Psychology Review, 7, 2-19.
Kameda, T., Takezawa, M., Ohtsubo, Y., & Hastie, R. (2010). Are our minds
fundamentally egalitarian? Adaptive bases of different sociocultural models
about distributive justice. In M. Schaller, A. Norenzyan, S.J. Heine, T. Yamagishi
& T. Kameda (Eds.), Evolution, culture, and the human mind (pp.151-163). New
York: Psychology Press.

Democracy Under Uncertainty 56
Kameda, T., & Tamura, R. (2007). ―To eat or not to be eaten?‖ Collective
risk-monitoring in groups. Journal of Experimental Social Psychology, 43,
168-179.
Kameda, T., & Tindale, R. S. (2006). Groups as adaptive devices: Human docility and
group aggregation mechanisms in evolutionary context. In M. Schaller, J.
Simpson, & D. Kenrick (Eds.), Evolution and Social Psychology. New York:
Psychology Press.
Kameda, T., Tindale, R. S., & Davis, J. H. (2003). Cognitions, preferences, and social
sharedness: Past, present, and future directions in group decision making. In S.L.
Schneider & J. Shanteau (Eds.), Emerging perspectives on judgment and decision
research (pp.215-240). Cambridge, UK: Cambridge University Press.
Kenrick, D. T., Li, N. L., & Butner, J. (2003). Dynamical evolutionary psychology:
Individual decision rules and emergent social norms. Psychological Review,
110, 3-28.
Kerr, N.L. (1983). Motivation losses in small groups: A social dilemma analysis.
Journal of Personality and Social Psychology, 45, 819-828
Kerr, N.L., MacCoun, R., & Kramer, G.P. (1996). Bias in judgment: Comparing
individuals and groups. Psychological Review, 103, 687-719.
Kerr, N.L., & Tindale, R.S. (2004). Group performance and decision making. Annual
Review of Psychology, 55, 623-655.

Democracy Under Uncertainty 57
Knack, S. (1992). Civic norms, social norms and voter turn out. Rationality and
Society, 4, 133-156.
Kravitz, D.A. and Martin, B. (1986). Ringelmann rediscovered: The original article.
Journal of Personality and Social Psychology, 50, 936-941.
Larrick, R.P., & Soll, J.B. (2006). Intuitions about combining opinions:
Misappreciation of the averaging principle. Management Science, 112, 111-127.
Larson, J.R. (2009). In search of synergy in small group performance. New York:
Psychology Press.
Latané, B., Williams, K., & Harkins, S. (1979). Many hands make light the work: The
causes and consequences of social loafing. Journal of Personality and Social
Psychology, 37, 822-832.
Laughlin, P. R. (1980). Social combination processes of cooperative problem-solving
groups on verbal intellectual tasks. In M. Fishbein (Ed.), Progress in social
psychology, Vol. 1 (pp.127-155). Hillsdale, NJ: Erlbaum.
Laughlin, P. R. (2006). Groups perform better than the best individuals on
letters-to-numbers problems: Effects of group size. Journal of Personality and
Social Psychology, 90, 644-651.
Laury, S. K., & Holt, C. A. (2008). Voluntary provision of public goods: Experimental
results with interior Nash Equilibria. In C. R. Plott & V. L. Smith (Eds.),
Handbook of experimental economics results. Vol. 1(pp.792-801). New York:

Democracy Under Uncertainty 58
Elsevier.
Laury, S. K., Walker, J., & Williams, A. (1999). The voluntary provision of a pure
public good with diminishing marginal returns. Public Choice, 99, 139-160.
Ledyard, J. (1995). Public goods experiments. In J. Kagel & A. Roth (Eds.),
Handbook of experimental economics (pp.111-173). Princeton, NJ: Princeton
University Press.
Lorge, I., & Solomon, H. (1955). Two models of group behavior in the solution of
eureka-type problems. Psychometrica, 20, 139-148.
Lupia, A. (2002). Deliberation disconnected: What it takes to improve civic
competence. Law and Contemporary Problems, 65, 132-150.
Makradakis, S., & Winkler, R.L. (1983). Averages of forecasts: Some empirical
results. Management Science, 29, 987-996.
Maynard Smith, J. (1982). Evolution and the theory of games. Cambridge: Cambridge
University Press.
McGrath, J.E. (1984). Groups: Interaction and performance. Englewood Cliffs, NJ:
Prentice-Hall.
Meehl, P.E. (1997). The selfish voter paradox and the thrown-away vote argument.
American Political Science Review, 71, 11-30.
Motro, U. (1991). Co-operation and defection: Playing the Field and the ESS. Journal
of Theoretical Biology, 151, 145-154.

Democracy Under Uncertainty 59
Mueller, D.C. (2003). Public choice III. New York: Cambridge University Press.
Opp, K-D. (2001). Why do people vote? The cognitive-illusion proposition and its
test. Kyklos, 54, 355-378.
Palfrey, T., & Rosenthal, H. (1983). A strategic calculus of voting. Public Choice, 41,
7-53.
Posner, E. A. (2000). Law and social norms. Cambridge, MA: Harvard University
Press.
Regenwetter, M., Grofman, B., Marley, A. A. J., & Tsetlin, I. (2006). Behavioral Social
Choice. Cambridge, UK: Cambridge University Press.
Regenwetter, M., Ho, M.-H. & Tsetlin, I. (2007). Sophisticated approval voting,
ignorance priors, and plurality heuristics: A behavioral social choice analysis in a
Thurstonian framework. Psychological Review, 114, 994-1114.
Riker, W.H., & Ordeshook, P. (1973). An introduction to positive political theory.
Englewood Cliffs, NJ: Prentice-Hall.
Saijo, T., & Yamato, T. (1999). A Voluntary participation Game with a non-excludable
public good. Journal of Economic Theory, 84, 227-242.
Schelling, T.C. (1978). Micromotives and macrobehavior. New York: Norton.
Sefton, M., & Steinberg, R. (1996). Reward structures in public goods experiments.
Journal of Public Economics, 61, 263-287.
Smith, E.R., & Conrey, F.R. (2007). Agent-based modeling: A new approach for theory

Democracy Under Uncertainty 60
building in social psychology. Personality and Social Psychology Review, 11,
87-104.
Smoke, W. H., & Zajonc, R. B. (1962). On the reliability of group judgments and
decisions. In J. Criswell, H. Solomon, & P. Suppes (Eds.), Mathematical
methods in group processes (pp.322-333). Stanford, CA: Stanford University
Press.
Sorkin, R. D., Hays, C., & West, R. (2001). Signal-detection analysis of group decision
making. Psychological Review, 108, 183-203.
Steiner, I.D. (1972). Group process and productivity. New York: Academic Press.
Surowiecki, J. (2004). The wisdom of crowds. New York: Doubleday.
Taylor, D.W., & Faust, W.L. (1952). Twenty questions: Efficiency in problem solving as a
function of size of group. Journal of Experimental Psychology, 44, 360-368.
Thompson, L.L. (2004, 2nd
edition). Making the team: A guide for managers. Upper
Saddle River, NJ: Pearson Education.
Tinbergen, N. (1963). On aims and methods in ethology. Zeitschrift für
Tierpsychologie, 20, 410-433.
Trivers, R.L. (1971). The evolution of reciprocal altruism. Quarterly Review of
Biology, 46, 35-57.
Williams, K. D., Harkins, S. G., & Karau, S. J. (2003). Social performance. In M. A.
Hogg & J. Cooper (Eds.), Sage handbook of social psychology (pp. 327-346).

Democracy Under Uncertainty 61
London: Sage.
Wilson, D.S. (1994). Reintroducing group selection to the human behavior sciences.
Behavior and Brain Sciences, 17, 585-654.

Democracy Under Uncertainty 62
Author Note
This study was supported by the Grant-in-Aid for Scientific Research 17330133
from the Ministry of Education, Culture, Sports, Science and Technology of Japan to the
first author. This paper was prepared while the first author was a residential fellow of
Center for Advanced Study in the Behavioral Sciences at Stanford University, 2008-2009.
Takafumi Tsukasaki died on January 23, 2005, at age 25. Correspondence concerning
this paper should be addressed to Tatsuya Kameda, Department of Behavioral Science,
Hokkaido University, Bungakubu, N10 W7 Kita-ku, Sapporo, 060-0810, Japan;
[email protected]; Phone: +81-11-706-3042, FAX: +81-11-706-3066.

Democracy Under Uncertainty 63
Table 1. Four behavioral strategies implemented in the evolutionary simulation
Participate in group meetings?
Yes No
Engage in individual
information search?
Yes Searcher/Voter Searcher/Abstainer
No Non-searcher/Voter Non-searcher/Abstainer
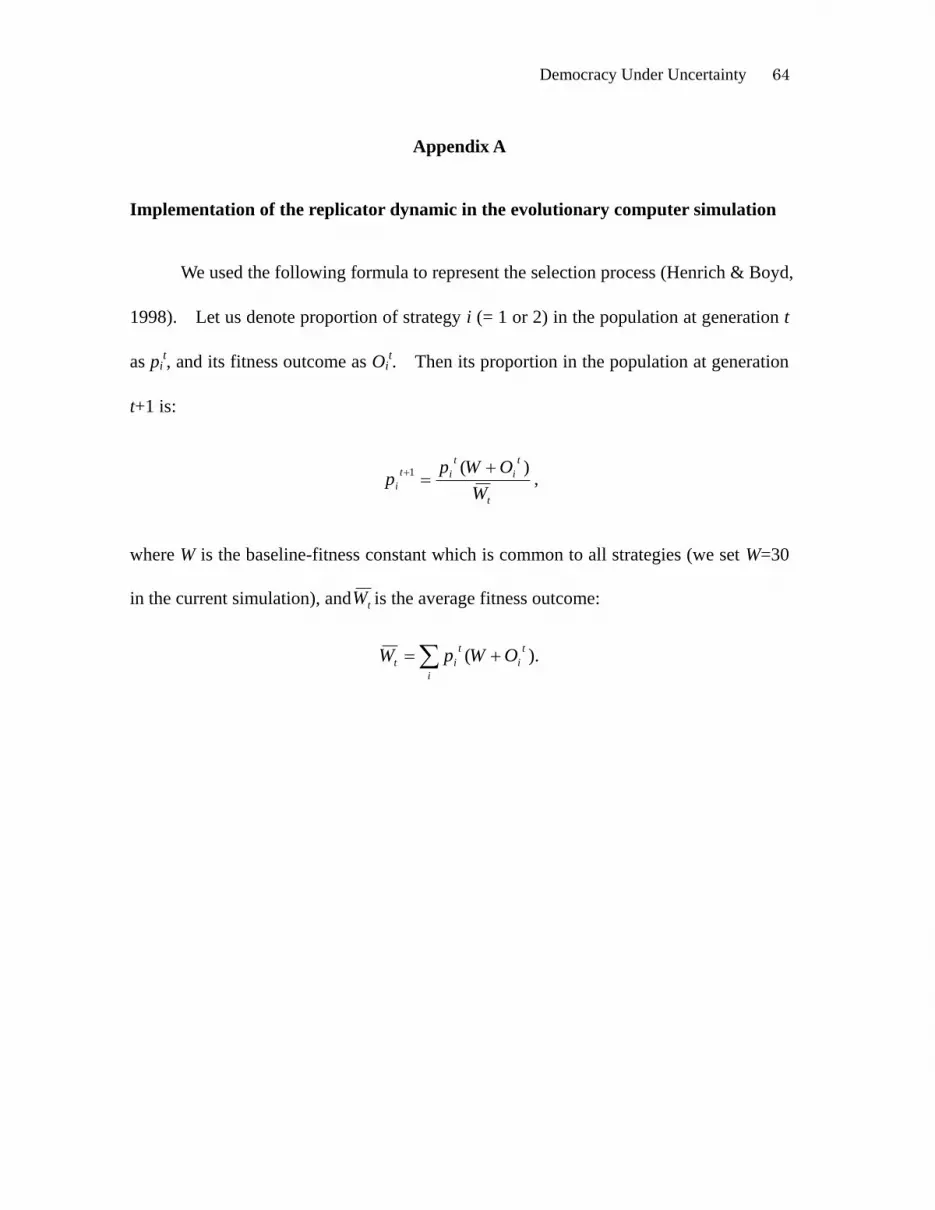
Democracy Under Uncertainty 64
Appendix A
Implementation of the replicator dynamic in the evolutionary computer simulation
We used the following formula to represent the selection process (Henrich & Boyd,
1998). Let us denote proportion of strategy i (= 1 or 2) in the population at generation t
as pit, and its fitness outcome as Oi
t. Then its proportion in the population at generation
t+1 is:
t
t
i
t
it
iW
OWpp
)(1
,
where W is the baseline-fitness constant which is common to all strategies (we set W=30
in the current simulation), and tW is the average fitness outcome:
i
t
i
t
it OWpW ).(

Democracy Under Uncertainty 65
Appendix B
Estimation of the empirical group and individual payoff functions
We describe a simple model in which the group‘s aggregate payoff as a function
of the number of group members who contribute information has diminishing marginal
returns. For analytic tractability, we make standard assumptions that result in an
objective function that rewards predictive accuracy by providing a fixed reward from
which the squared error of the group‘s prediction is deducted. Accurate predictions
have smaller squared errors and consequently higher payoffs according to this objective
function. A priori, errors can be expected but are not known until ex post values of all
random variables are realized. It is straightforward to show that the resulting expected
payoff function is increasing in the quantity of information, but concave, implying
diminishing marginal returns to information.
Consider a group trying to predict the unknown outcome x. Denote its
forecast m. The group receives (in the aggregate) a fixed payoff B if its forecast is
perfectly accurate (i.e., m = x). The group‘s payoff, however, decreases as the group‘s
squared prediction error grows larger. Denoting the scaling of squared errors into the
units used in the payoff function asλ, we can assemble the symbols defined above to
form the group‘s (aggregate) gross payoff function:
gross group payoff = B –λ(m – x)2.
Let N denote the number of noisy pieces of information that the group forecast depends
on, so that the functional notation m(N) describes the mapping from quantity of

Democracy Under Uncertainty 66
information into group forecasts. Denoting the cost of information as p per unit, then
the net group payoff function becomes:
net group payoff = B –λ(m(N) – x)2 – pN.
In general, the best use of N noisy signals, (x +ε1), …, (x +εN), is to construct the
forecast m(N) as the conditional expectation of x, which is very often assumed to take a
linear form:
E[x |ε1, …,εN] =α+β1 (x +ε1) + …+βN (x +εN).
A simpler and more robust approach (in the absence of enough stability in the
environment to estimate the parameters in the regression) would be the simple average:
m(N) = 𝑁𝑖=1 (x +εi)/N = x + (ε1 +ε2 + … +εN )/N.
We now compute the expected value of the net group payoff function:
E[B –λ(m – x)2 – pN] = B –λE[(ε1 +ε2 + … +εN )
2] /N – pN
= B –λσε2/N – pN.
Applying this function as the group‘s expected net payoff function, we can
examine the individual-level incentives for a single member of this group who is facing
a binary decision of whether to pay p and provide one more noisy signal to be included
in the group‘s forecast, or to free-ride on the information acquisition of others. We
assume, as everywhere else in this paper, that gross group payoffs are divided evenly
among all group members (cooperators and free-riders alike) but the costs of
information are borne individually. Thus, if there are n other group members
cooperating in a group with M members in total, after netting out costs for the cooperator,
the individual‘s expected net payoff is:

Democracy Under Uncertainty 67
Expected net individual payoff for a cooperator = (1/M)(B –λσε2 /(n+1)) - p,
Expected net individual payoff for a free-rider = (1/M)(B –λσε2 /n).
The point at which the individual payoff curves intersect defines the so-called
Nash point (see footnote 10):
n* = - 0.5 + 0.5[1 + 4λσε2 / (pM)]
0.5.
At integer values to the left of n*, the strategy of cooperation maximizes individual
payoffs even though some other members are free-riding. At integer values to the right
of n*, free-riding maximizes individual payoffs. As intuition would suggest, n* is a
decreasing function of the price of information, p, holding all else equal. Also, n* is
increasing inλ, because higher penalties for forecasting error increase the individual
rationale for contributing information. Similarly, n* is increasing inσε2, because,
when each single piece of information is lower in quality (i.e., less precise), the marginal
returns from additional units of information diminish less rapidly, implying a rightward
shift in the cooperator-free-rider cross-over point. Finally, holding all else equal, n* is
decreasing in group size. The incentive to cooperate is present for fewer group
members, the larger the group is.
Recall that the expected aggregate net payoff function for the group is:
Expected aggregate net payoff = B –λσε2 /N – pN.
We refer to the total number of cooperators N that maximizes the expected aggregate net
payoff as the Pareto point and denote this special value of N as N* (see footnote 10):
N* = (λσε2 /p)
0.5.
Notice that the Pareto point is independent from the parameters B and M. It depends

Democracy Under Uncertainty 68
positively on the penalty for forecast error and on the imprecision of private information,
and is decreasing in the price of information.
This model is used to estimate the empirical group and individual payoff
functions in the body of the paper. The estimation procedure is as follows. First, we
estimate the gross individual payoff conditional on the reciprocal of the total number of
cooperators in each group, 1/N. The notation introduced here uses subscripts g to index
groups and t to index experimental trials. Because gross payoffs (before netting out the
cost of individual information acquisition) are the same for all group members, the
notation here does not index individuals‘ identities, although this is straightforward to
add. Using the definitions from above, any individual in group g receives an individual
gross payoff in trial t given by the following expression
individual‘s gross payoff = E[ygt |1/Ngt] = (1/M)(B –λσε2 /Ngt),
where g ranges from 1 to 15, and t ranges from 1 to 72, for a total of 15 x 72 = 1080
observations that are obviously not statistically independent. Because the same group
is observed 72 times, the statistical model allows for within-group correlation of the 72
error terms in the regression model, which affects the size of estimated standard errors
but not the estimated coefficients. There were only three observations in which N = 0.
The model is valid only when N > 0, and therefore the regression coefficients were
estimated using the 1077 observations for which N ranged between 1 and 6. This
produced statistically significant regression coefficients, and the following estimated
regression line where coefficients are rounded to the nearest integer:
E[y | 1/N] = a + b (1/N) = 60 – 9/N.

Democracy Under Uncertainty 69
This regression line is plotted in Appendix-Figure 1 together with mean values of y at
each value of N, the total number of cooperators in the group. It is straightforward to
estimate expected individual net payoff for a cooperator and for a free-rider as a function
of n, the number of other group members who cooperate, from Appendix-Figure 1. For
a free-rider, there are no costs to net out, and the gross individual payoff in
Appendix-Figure 1 is identical to the net payoff, plotted as a dashed line in
Appendix-Figure 2. For a free-rider, the total number of cooperators in the group is
equal to the number of other group members cooperating: N = n. For a cooperator,
however, the total number of cooperators includes the others plus him or herself, and
therefore N = n + 1, plotted in Appendix-Figure 2 as the solid line after subtracting 6 yen
for the cost of contributing to the public good. The figure shows that the two payoff
curves cross strictly to the left of n=1, where n represents the number of other group
members who cooperate. This implies that cooperation maximizes individual payoffs
when no other group members cooperate (at n = 0), and free-riding maximizes
individual payoffs as soon as there is at least one other group member cooperating (when
n > 0). Thus, any Nash equilibrium is a profile of binary actions in which there is one
cooperator and five free-riders.
--------------------------------------
INSERT APPENDIX-FIGURES 1 & 2
--------------------------------------
Appendix-Figure 3 shows the empirical net aggregate payoff for groups as a

Democracy Under Uncertainty 70
function of the total number of cooperators. The points on this curve are empirical
averages over 1080 observations of group payoffs and numbers of cooperators. The
curve has a local maximum at 3 and a global maximum at 6. Thus, three is a local
Pareto point, although a benevolent dictator aiming to maximize aggregate payoffs
would choose the global Pareto point, 6.
--------------------------------------
INSERT APPENDIX-FIGURE 3
--------------------------------------
In linear public goods games, the dominant strategy is usually to contribute zero
and, if not zero, then the other boundary point of the action space (i.e., contributing the
maximum amount). In contrast, nonlinear public goods payoff structures can generate
Nash equilibria on the strict interior of the agents‘ action spaces. Our model‘s Nash
equilibrium requires 1 contributor per group, which falls short of the socially efficient
Pareto points of 3 (local) and 6 (global) contributors per group. As shown in Figure 10,
the data revealed a pronounced mode at 3 and showed that the groups we observed
regularly achieve larger aggregate payoffs than the Nash equilibrium predicts. We
found that groups stably functioned at a locally Pareto efficient level of public goods
contributions, with 3 contributors and 3 free-riders per group. The unambiguous modal
value is remarkable, in that subjects find a locally best social outcome as a group that
requires asymmetric action profiles among group members, without any mechanism to
coordinate action. The subjects in our study earn more by cooperating more than is

Democracy Under Uncertainty 71
predicted from the individual incentives built into the game structure.

Democracy Under Uncertainty 72
Figure Captions
Figure 1. An illustration of a marginally-diminishing return curve (unit here is
arbitrary) as a function of number of cooperators. The y-axis has been adjusted to
expected gross return to each individual (group gross return / 6). An ESS is defined as
follows (Motro, 1991): Cooperate as long as the marginal increment (δ) exceeds
individual cost (c), but switch to defection beyond that.
Figure 2. Expected individual net payoffs (individual gross return – cost) for a
cooperator (solid curve) and a defector (dashed curve), as a function of the number of
other members who cooperate (derived from the gross return curve in Figure 1 with
individual cooperation cost fixed at 0.7).
Figure 3. Structure of the simulated judgment environment
Figure 4. Outline of the evolutionary simulation platform
Figure 5. Equilibrium proportions of the strategies in each population
Figure 6. Individual net payoff at the equilibrium in each population
Figure 7. Sensitivity analysis about the superiority of Majority/Plurality Rule to the
Best-Member Rule in individual net payoff
Figure 8. Interlocking between the two strategic choices. Participant‘s behavioral
choices of information search strategy and voting became more coherent over time.

Democracy Under Uncertainty 73
Figure 9. Mean frequencies of cooperative members (searcher/voter hybrids) across
the 24 trials. Vertical lines indicate one standard error (solid line for the
Majority/Plurality Rule condition, and dotted line for the Best-Member Rule condition).
Empirically-estimated Nash point in the Majority/Plurality Rule condition was 1,
whereas Pareto optimal points were 3 (local Pareto optimal) and 6 (global Pareto
optimal). See Appendix B for details of the estimation procedure.
Figure 10. Frequency distribution of number of cooperators (searcher/voter hybrids) in
groups in the Majority/Plurality Rule condition across 360 observations (15 groups in 24
trials).
Figure 11. Observed frequencies of individual strategies in the Majority/Plurality Rule
condition and the Best-Member Rule condition. Individual strategies could range from
full defection (0) to full cooperation (8) in each block of trials.
Figure 12. Mean per-trial individual net payoffs (in Yen) in the Majority/Plurality Rule
condition and the Best-Member Rule condition.
Appendix-Figure 1. Fitted regression line for individual gross payoffs (and observed
means) as a function of N, the total number of cooperators in the group. The regression
model is E[individual gross payoff | 1/N] = a + b(1/N) = 60 - 9/N, for 1 ≤ N ≤ 6. The
mean of three payoff observations for N = 0 is plotted in the figure as well, although it is
not derived from the regression model with the restricted range of N. The model was fit
with 1077 observations, and the coefficients were statistically significant at the 5% level.

Democracy Under Uncertainty 74
Appendix-Figure 2. Estimated net individual payoffs for cooperators (solid line) and
free-riders (dotted line) as a function of the number of other cooperators in the group.
Appendix-Figure 3. Empirical net aggregate payoff for groups as a function of N, the
total number of cooperators in the group (summing over 6 group members‘ individual
payoffs after netting out costs for cooperation). The curve has a local maximum at 3
and a global maximum at 6. Thus, three is a local Pareto point, although a benevolent
dictator aiming to maximize aggregate payoffs would choose the global Pareto point, 6.

Democracy Under Uncertainty 75
Footnotes
1 Laury and Holt (2008) provides a survey on the economics literature regarding
nonlinear public goods games. To understand the motivation that has led economists to
study nonlinear public goods games, which is very different from the present study‘s
motivation, it is helpful to recall that the standard linear public good game most
frequently studied in laboratory experiments has a unique Nash equilibrium in which all
group members contribute zero. Thus, the theoretical model upon which most public
goods experiments are based predicts universal and absolute free riding. In contrast
with this theoretical prediction, participants in experiments usually contribute
significantly more than zero. These contributions typically decline with repeated trials,
but contributions remain well above zero even after as many as 60 rounds. Interpreting
this frequently replicated finding of greater than zero contributions in linear public
goods games remains difficult, however, because of the statistical difficulty of
measuring closeness to a boundary in any action space (in this case, the
zero-contribution Nash equilibrium). At a boundary point in participants‘ action space,
deviations can occur only in one direction; random error of any kind will push empirical
averages away from their true value and the law of large numbers no longer holds.
Faced with this statistical problem of measuring deviations from an equilibrium located
at the boundary of the range of individual contributions, economists turned to nonlinear
public goods games as a mechanism for generating incentive structures with Nash
equilibria located on the ―strict interior‖ (0 < equilibrium frequency < group size) of the

Democracy Under Uncertainty 76
range of possible contributions. This is the primary motivation for most of the existing
experimental economics literature on nonlinear public goods (see Laury and Holt, 2008).
In contrast, this paper reconsiders nonlinear public goods incentive structures as a
widespread empirical regularity and investigates what insights they have to offer to
psychology and the neighboring social science literatures dealing with social dilemmas,
information acquisition, and voting behavior, concerning the commonplace observation
of heterogeneous groups consisting of both cooperators and free-riders.
2 In game theory, an evolutionarily stable strategy is a strategy that if adopted by all
players in a population cannot be invaded (outperformed) by any competing alternative
strategy (Maynard Smith, 1982; Gintis, 2000). Suppose a situation in which a group is
composed only of individuals with the focal strategy, x. Now a question arises
concerning if such an all-x group is robust enough to block a small number of
individuals with another strategy (y) from intruding into the group. Does strategy x
outperform strategy y in terms of average profit? If strategy x actually outperforms
strategy y, it can block y‘s intrusion into the group, analogous to biological ―competition‖
for an ecological niche. If strategy x is dominant in this sense over all other strategies
in the game, then strategy x is called an Evolutionarily Stable Strategy (ESS).
3 Notice that, different from the behavioral strategies, no game-theoretic aspect is
involved in member‘s judgment policy. The theoretically best judgment policy always
corresponds to the optimal linear combination model (e.g., Eq. 1), which is solely
determined by the environmental structure, independent of other members‘ judgment

Democracy Under Uncertainty 77
policies in a group. In other words, a member‘s judgment policy is not a strategy in the
game-theoretic sense. Thus, after being randomly generated for each group member at
the outset (see the text), the judgment policy was fixed and not under evolutionary
control throughout a simulation run. Elsewhere, we have discussed how such cognitive
differences can affect qualities of group decisions under different aggregation rules (see
Hastie and Kameda, 2005 for details).
4 To illustrate, let us suppose that a group picked up a location with 36 resource units,
where value of resource available at each of 10 locations had been generated randomly
from N(0, 30). Because each member of the 12-person group receives an equal share,
this yields 3 resource units per person, which means that the total cost for cooperation to
be subtracted from a cooperator‘s share, 0.03, corresponds to 1% of the gross individual
payoff.
5 N(80, 30) was used to generate resource levels in each location in the experiment,
instead of N(0, 30) in the simulation; the change in mean value does not affect
uncertainty level in the foraging task because the standard deviation of the distribution
was held identical. The only exception was that both the true resource value (Qj) and
the true cue value (C.jk) in each of 72 hunts during the experiment were held to be
common across all groups in the experiment. These common ―seeds‖ had been
generated randomly from the respective normal distributions (identical to those used in
the simulation), for once, prior to the experiment. This procedure was different from
the simulation, where the true resource value (Qj) and the true cue value (C.jk) were

Democracy Under Uncertainty 78
generated randomly for each hunt by each group. Given the much smaller sample size
in the experiment (n = 3 hunts * 15 groups per trial as compared to n = 100 hunts *
10,000 groups per generation in the simulation), making the value-generation procedure
exactly parallel to that of the simulation would introduce too much random noise.
Because this change is theoretically trivial, we chose the current procedure for the
experiment. For each hunt by each group, however, we newly added individual
perception error terms (eijk) to generate perceived cue values (Cijk) as in the simulation.
Thus, the cue values that participants actually observed in each hunt could be different
from person to person.
6 The total cost for cooperation (information search + voting) implemented in the
experiment (6 yen per trial) may seem small. Yet, this was not the case because, as
seen in Figure 12, it actually corresponded to about 10% of the average gross payoff to
each individual in the trial (see Figure 12).
7 Our own experience tells us that it is hard to tell whether other members have actually
prepared for committee meetings (e.g., engaged in costly information search), thus the
number of searchers during the trial was not included in the outcome feedback.
88 It is important to note that the simulation and the behavioral tests involved different
manifestations of what we think are the same basic principles of functional adaptation.
In the simulation, an evolutionary algorithm determined the surviving strategies over
thousands of generations using a replicator dynamic. However, in the behavioral
experiment, individual learning and inference processes composed the mechanism

Democracy Under Uncertainty 79
through which an adaptive equilibrium was discovered. We believe that both routes,
population cross-generational and individual learning, yield adaptive behavioral
strategies, but we do not want to obscure the differences between the two mechanisms
(but see Campbell, 1988).
9 The equilibrium (Nash) frequency occurs where the marginal individual return is
equal to the cost of cooperation (Figures 1 & 2; see also Appendix-Figures 1 & 2). The
Pareto-optimum frequency occurs where the marginal group return is equal to the cost of
cooperation; net group payoff function is maximized at the Pareto point. In the
econometric analysis reported in Appendix B, we estimated the equilibrium (Nash)
frequency and the Pareto-optimum frequency. As shown in Appendix-Figure 3, the
empirical net group payoff function reveals two Pareto-optimal points, a local maximum
where the number of cooperators in the group is 3, and a global maximum at 6. At
each of these Pareto points, net group payoff is maximized locally or globally.

0
0.5
1
1.5
2
2.5
3
3.5
4
0 1 2 3 4 5 6
Exp
ecte
d g
ross r
etu
rn t
o e
ach
gro
up
me
mb
er
Number of cooperators in a group
δ0
δ1
δ2
δ3
δ4
δ5 If c <δ, cooperate for
group production.
If c >δ, defect.
Figure 1. An illustration of a marginally-diminishing return curve (unit here is arbitrary) as a function of number
of cooperators. The y-axis has been adjusted to expected gross return to each individual (group gross return / 6).
An ESS is defined as follows (Motro, 1991): Cooperate as long as the marginal increment (δ) exceeds individual
cost (c), but switch to defection beyond that.

Figure 2. Expected individual net payoffs (individual gross return – cost) for a cooperator (solid curve)
and a defector (dashed curve), as functions of the number of other members who cooperate (derived from
the gross return curve in Figure 1 with individual cooperation cost fixed at 0.7).
0
0.5
1
1.5
2
2.5
3
3.5
4
0 1 2 3 4 5
Exp
ecte
d in
div
idua
l ne
t pa
yo
ffs
Number of other cooperators in a group
Cooperator
Defector

Figure 3. Structure of the simulated judgment environment
Foragers Environmental Events
location j’s value,
Qj
forager i’s estimate of location j’s value,
i jQ
.68
40
.17
.08
Wi.1
Wi.2
Wi.3
Cij1
Cij2
Cij3
Proximal Cues

At the start of each simulation run (generation 1), the prevalence of the
two behavioral strategies, searcher/voters and non-searcher/abstainers (Table
1), in the (infinite) population was set equal, 50% each.
A twelve-person “hunting team” is composed by random sampling.
Only searcher/voters engage in individual learning about the
environment for some personal cost. They can access to the three
environmental cues (Figure 3) and make judgments according to their policies.
Depending on a given aggregation rule (majority/plurality, best
member, or random member), the group picks up one alternative for
hunting. The resource in the chosen patch is shared equally among all
members. For the cooperative searcher/voters, however, the respective
costs are subtracted from their shares.
Mean outcome (fitness) for each of the two strategies is calculated by
collapsing their net outcomes (benefit – cost) over 1,000,000 (=100x10,000)
trials.
Depending on their mean outcomes (fitness), the two strategies are
selected using a replicator dynamic, with the greater fit strategy yielding slightly
more offspring for next generation.
Population at generation t
Sampling of a twelve-person group from the population
Opportunity for information search about the environment
Go
to n
ext g
en
era
tion
t+1
Voting and group aggregation
100 “h
unts
” in n
ew
en
viro
nm
ents
Figure 4. Outline of the evolutionary algorithm
Calculating mean outcomes
Selection
Re
plic
atio
n fo
r 10,0
00
gro
ups

Figure 5. Equilibrium proportions of the strategies in each population
Non-searcher / Abstainer Searcher / Voter
(a) Majority/Plurality rule (b) Best-Member rule (c) Random-Member rule
34.7430.48 27.87 25.96 24.44
65.2669.52 72.13 74.04 75.56
0%
10%
20%
30%
40%
50%
60%
70%
80%
90%
100%
0.03 0.06 0.09 0.12 0.15
Cooperation costs
39.3333.19 29.9 27.63 25.87
60.6766.81 70.1 72.37 74.13
0%
10%
20%
30%
40%
50%
60%
70%
80%
90%
100%
0.03 0.06 0.09 0.12 0.15
Cooperation costs
44.5635.85
31.64 28.88 26.82
55.4464.15
68.36 71.12 73.18
0%
10%
20%
30%
40%
50%
60%
70%
80%
90%
100%
0.03 0.06 0.09 0.12 0.15
Cooperation costs (Search +
Vote)
Pro
port
ions in the p
opula
tion

Figure 6. Individual net payoff at the equilibrium in each population
3.000
3.050
3.100
3.150
3.200
3.250
3.300
3.350
3.400
3.450
3.500
0.03 0.06 0.09 0.12 0.15
Indiv
idual
net
payoff
Cooperation costs (Search + Vote)
Majority/plurality
Best-member
Random-member

Figure 7. Sensitivity analysis about the superiority of Majority/Plurality Rule to the Best Member Rule
in individual net payoff
2
6
10
-0.02
-0.01
0
0.01
0.02
0.03
0.04
0.05
0.03 0.06 0.09 0.12 0.150.18
0.210.24
0.27
Number of
alternatives (patches)
Differences in
individual net payoffs
(majority/pluarity - best)
Cooperation costs (search + vote)
Majority/plurality > Best
Best > Majority/plurality

0.80
0.82
0.84
0.86
0.88
0.90
0.92
0.94
0.96
0.98
1.00
1st 2nd 3rd
Block
Mean p
ropo
rtio
ns o
f coh
ere
nt
beh
avio
ral cho
ice
s
Majority/plurality
Best member
Figure 8. Interlocking between the two strategic choices. Participant’s behavioral choices of
information search strategy and voting became more coherent over time.
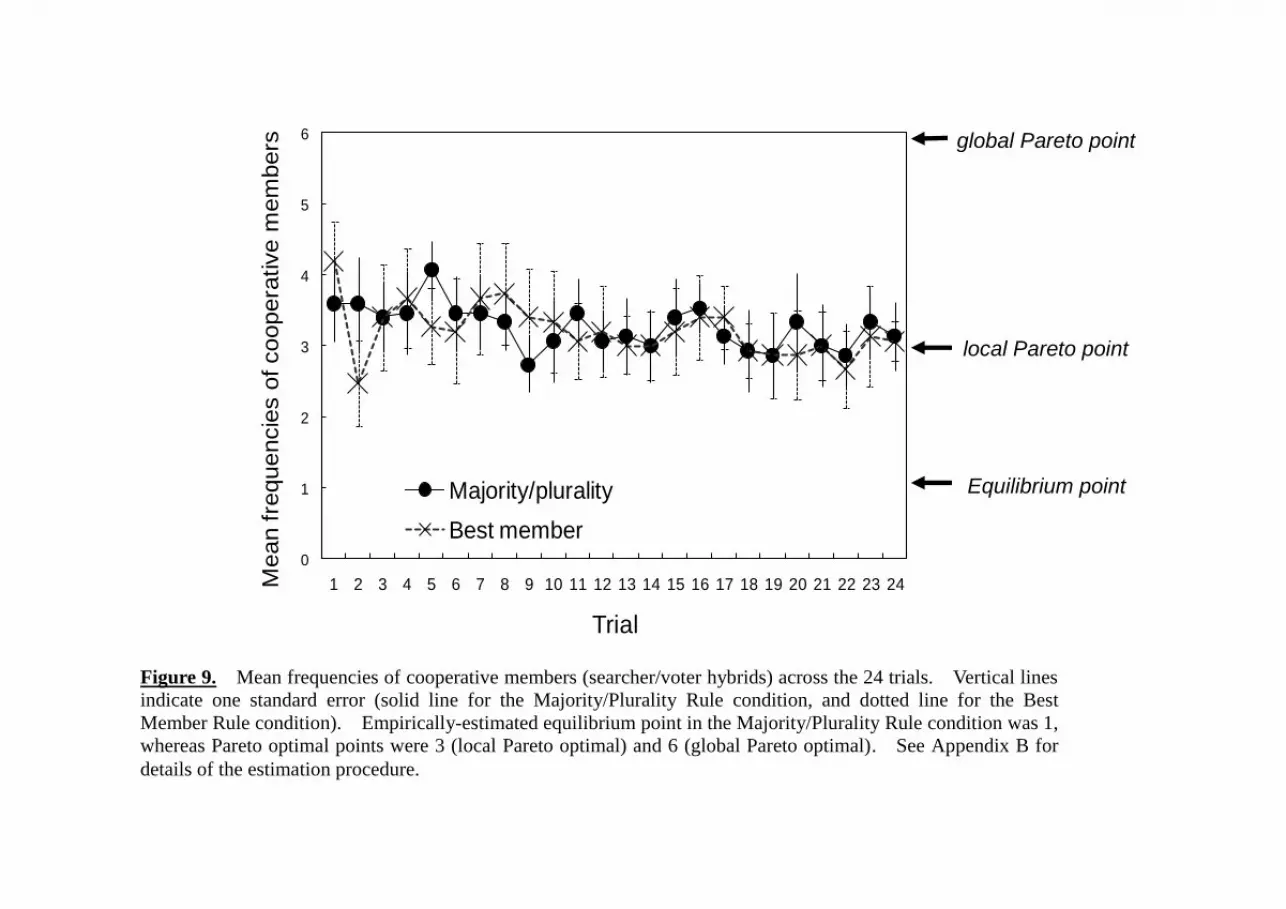
0
1
2
3
4
5
6
1 2 3 4 5 6 7 8 9 10 11 12 13 14 15 16 17 18 19 20 21 22 23 24Mean fre
quencie
s o
f coopera
tive m
em
bers
Trial
Majority/plurality
Best member
global Pareto point
Equilibrium point
local Pareto point
Figure 9. Mean frequencies of cooperative members (searcher/voter hybrids) across the 24 trials. Vertical lines
indicate one standard error (solid line for the Majority/Plurality Rule condition, and dotted line for the Best
Member Rule condition). Empirically-estimated equilibrium point in the Majority/Plurality Rule condition was 1,
whereas Pareto optimal points were 3 (local Pareto optimal) and 6 (global Pareto optimal). See Appendix B for
details of the estimation procedure.

Figure 10. Frequency distribution of number of cooperators (searcher/voter hybrids) in groups in the
Majority/Plurality Rule condition across 360 observations (15 groups in 24 trials).
0
20
40
60
80
100
120
140
0 1 2 3 4 5 6
Ob
se
rve
d f
req
ue
nc
y
Total number of cooperators in a group (N)

Figure 11. Observed frequencies of individual strategies in the Majority/Plurality Rule condition and the Best
Member Rule condition. Individual strategies could range from full defection (0) to full cooperation (8) in each
block of trials.
Majority/Plurarity Rule condition
0
5
10
15
20
25
1st 2nd 3rd
Block
Ob
se
rve
d fre
qu
en
cie
s
0 8 0 0 8 8
Best Member Rule condition
0
5
10
15
20
25
1st 2nd 3rd
Block
Ob
se
rve
d fre
qu
en
cie
s
8 8 8 0 0 0

0
10
20
30
40
50
60
70
80
1st 2nd 3rd
Block
Mean p
er-
tria
l in
div
idual net
payoff
(in
Yen)
Majority/plurality
Best member
Figure 12. Mean per-trial individual net payoffs (in Yen) in the Majority/Plurality Rule condition and the
Best Member Rule condition

Appendix-Figure 1. Fitted regression line for individual gross payoffs (and observed means) as a function of N, the total
number of cooperators in the group. The regression model is E[individual gross payoff | 1/N] = a + b(1/N) = 60 - 9/N, for
1 ≤ N ≤ 6. The mean of three payoff observations for N = 0 is plotted in the figure as well, although it is not derived from
the regression model with the restricted range of N. The model was fit with 1077 observations, and the coefficients were
statistically significant at the 5% level.
40
45
50
55
60
65
0 1 2 3 4 5 6
Mean
in
div
idu
al g
ross p
ayo
ffs
Total number of group members who contribute (N)

40
42
44
46
48
50
52
54
56
58
60
0 1 2 3 4 5
Ex
pe
cte
d n
et
ind
ivid
ua
l p
ayo
ffs
Number of other group members who cooperate (n)
Cooperator
Free-rider
Appendix-Figure 2. Estimated net individual payoffs for cooperators (solid line) and free-riders
(dashed line) as a function of the number of other cooperators in the group.

Appendix-Figure 3. Empirical net aggregate payoff for groups as a function of N, the total number of cooperators in the group
(summing over 6 group members’ individual payoffs after netting out costs for cooperation). The curve has a local maximum at
3 and a global maximum at 6. Thus, three is a local Pareto point, although a benevolent dictator aiming to maximize aggregate
payoffs would choose the global Pareto point, 6.
250
260
270
280
290
300
310
320
330
340
0 1 2 3 4 5 6
Em
pir
ica
l n
et
ag
gre
ga
te p
ayo
ffs
Total number of group members who contribute(N)