dedication - kfupm eprints
TRANSCRIPT

iii
DEDICATION
This work is dedicated to my late father, Atanda Adeyinka, to my mother, Atanda
Serifat and the entirety of my loving family for their immeasurable love, moral and
financial support.
iv
ACKNOWLEDGEMENT
First and foremost I am grateful to Allah (SWT), the Lord of the worlds, for
giving me life to accomplish this far. To Him belongs all praise in the Heavens and on
Earth.
I am heartily grateful to my supervisor, Dr Sulaiman Al-Khattaf, whose
encouragement, guidance and support from the initial to the final level enabled me to
develop an understanding of the subject. I would like to thank other members of my
committee, Dr. Nabil Al-Yassir for his numerous contributions of his expertise and Dr.
Mohammed Ba-Shammakh for the assistance he provided at all levels of the research
project. I would like to thank Mr. Mariano Gica who greatly helped out on the
experimental work.
To my parents, brothers (Hakeem, Nurudeen), and sister (Anifat), I am deeply
appreciative of your patience, encouragement and love throughout the study.
I also want to offer my regards and appreciation to all of those who supported me
in any respect during the completion of the project.
In conclusion, I recognize that this research would not have been possible without
the financial assistance of KACST, the Center for Refining and Petrochemicals, King
Fahd University of Petroleum & Minerals Graduate Studies (Graduate Research
Assistanship), and the Department of Chemical Engineering.
v
TABLE OF CONTENT
DEDICATION …………………………………………………………………… iii
ACKNOWLEDGEMENT ………………………………………………………. iv
TABLE OF CONTENT …………………………………………………………. v
LIST OF TABLES ……………………………………………………………….. ix
LIST OF FIGURES ……………………………………………………………… xi
THESIS ABSTRACT ……………………………………………………………. xiv
THESIS ABSTRACT (ARABIC) ……………………………………………….. xv
CHAPTER 1 ……………………………………………………………………… 1
1.0 INTRODUCTION ……………………………………………………….. 1
1.1. BACKGROUND …………………………………………………………... 1
1.2. MAIN INDUSTRIAL TECHNOLOGIES FOR STYRENE PRODUCTION …. 4
1.2.1. Catalytic dehydrogenation of ethylbenzene ………………………. 4
1.2.2. Styrene and propylene oxide (SMPO) process ……………………. 7
1.3. OTHER TECHNOLOGIES ………………………………………………… 9
1.3.1. Styrene production from ethane and benzene ……………………... 9
1.3.2. Styrene production from methanol and toluene …………………... 9
1.4. MOTIVATION …………………………………………………………...... 10
1.5. THESIS OBJECTIVES …………………………………………………...... 12
1.5.1. Synthesis and characterization of hydrotalcites and mesoporous
iron oxide – alumina catalysts ………………………………………..
12
1.5.2. Catalysts test performance ………………………………………… 12
1.5.3. Kinetic Modeling ………………………………………………….. 13
vi
1.6. THESIS OUTLINE ………………………………………………………… 13
CHAPTER 2 ……………………………………………………………………… 15
2.0 LITERATURE REVIEW ……………………………………………….. 15
2.1. INTRODUCTION ……………………………………………………………….. 15
2.2. CATALYSTS FOR ETHYLBENZENE DEHYDROGENATION …………….. 17
2.3. CATALYST DEACTIVATION ………………………………………………… 19
2.4. REACTION KINETICS AND MECHANISMS ………………………………... 21
2.5. CATALYST DEVELOPMENT FOR ETHYLBENZENE
DEHYDROGENATION …………………………………………………………
23
2.5.1. Hydrotalcites ………………………………………………………. 23
2.5.2. Mesoporous alumina doped with iron …………………………….. 29
CHAPTER 3 ……………………………………………………………………… 32
3.0 EXPERIMENTAL SECTION …………………………………………... 32
3.1. EXPERIMENTAL SET-UP ……………………………………………………... 32
3.1.1. Riser simulator …………………………………………………….. 35
3.1.2. Gas chromatography (GC) system ………………………………... 37
3.1.3. Coke Analyzer …………………………………………………….. 39
3.2. EXPERIMENTAL PROCEDURE ……………………………………………… 40
3.2.1. Materials …………………………………………………………... 40
3.2.2. Catalyst preparation ……………………………………………….. 40
3.2.2.1. Synthesis of hydrotalcite catalysts ………………………… 40
3.2.2.2. Synthesis of mesoporous alumina doped with iron ……….. 41
3.2.3. Catalyst characterization …………………………………………... 42
vii
3.3. GC CALIBRATION …………………………………………………………….. 44
3.3.1. Determination of retention time for the different components ……. 44
3.3.2. Correlating GC response and actual weight percentage of each
compound …………………………………………………………….
44
3.4. CATALYST EVALUATION …………………………………………………… 44
3.4.1. Testing procedure …………………………………………………. 45
3.5. COKE ANALYSIS ……………………………………………………………… 46
CHAPTER 4 ……………………………………………………………………… 47
4.0 RESULTS AND DISCUSSIONS ………………………………………... 47
4.1. ETHYLBENZENE DEHYDROGENATION OVER HT PRECURSORS OF
Mg3Fe0.25Me0.25Al0.5 (Me = Co, Mn and Ni) CATALYSTS ……………............
47
4.1.1. Physico-chemical properties ………………………………………. 47
4.1.1.1. Chemical composition and textural properties ……………. 47
4.1.1.2. Surface analysis of the catalysts …………………………... 50
4.1.1.3. Bulk phase identification ………………………………….. 50
4.1.1.4. Reducibility of the active specie on the catalysts ………… 52
4.1.2. Catalytic activity …………………………………………………... 54
4.1.2.1. Styrene/Benzene Selectivity ………………………………. 60
4.1.2.2. Styrene/Benzene Yield ……………………………………. 63
4.1.3. Coke Content Measurement ………………………………………. 65
4.1.4. Kinetic Modeling ………………………………………………….. 67
4.1.4.1. Model development ……………………………………….. 67
4.1.4.2. Catalyst activity decay function based on reactant
viii
conversion (RC) ………………………………………………... 68
4.1.4.3. Catalyst activity decay function based on time-on-stream
(TOS) …………………………………………………………...
72
4.1.4.4. Determination of model parameters ………………………. 73
4.2. ETHYLBENZENE DEHYDROGENATION OVER Fe2O3/Al2O3 …………….. 82
4.2.1. Catalyst characterization …………………………………………... 82
4.2.1.1. N2 adsorption-desorption isotherm ………………………... 82
4.2.1.2. X-ray diffraction patterns …………………………………. 85
4.2.1.3. Transmission electron microscopy ………………………... 87
4.2.2. Catalyst activity …………………………………………………… 89
4.2.3. Kinetic Modeling ………………………………………………….. 97
4.2.3.1. Model development ……………………………………….. 97
4.2.3.2. Determination of model parameters ………………………. 102
CHAPTER 5 ……………………………………………………………………… 109
5.0 CONCLUSION AND RECOMMENDATIONS ……………………….. 109
5.1. Conclusions ………………………………………………………………. 109
5.2. Recommendations ………………………………………………………... 110
APPENDIX ……………………………………………………………………….. 111
NOMENCLATURE ……………………………………………………………... 113
REFERENCES …………………………………………………………………... 115
VITAE …………………………………………………………………………….. 122
ix
LIST OF TABLES
Table 4.1 Specific surface area, metal composition, and XPS analytical data of
Mg3Fe0.25Me0.25Al0.5 (Me = Co, Mn and Ni) ……………………………………….
48
Table 4.2 Product distribution at various reaction conditions for the
dehydrogenation of ethylbenzene over Mg3Fe0.25Co0.25Al0.5 mixed oxides catalyst
55
Table 4.3 Product distribution at various reaction conditions for the
dehydrogenation of ethylbenzene over Mg3Fe0.25Mn0.25Al0.5 mixed oxides catalyst
56
Table 4.4 Product distribution at various reaction conditions for the
dehydrogenation of ethylbenzene over Mg3Fe0.25Ni0.25Al0.5 mixed oxides catalyst .
57
Table 4.5 Coke formation of Ethylbenzene dehydrogenation reaction at different
reaction conditions …………………………………………………………………
66
Table 4.6 Estimated kinetic parameters for hydrotalcite mixed oxides catalyst
based on reactant conversion model ……………………………………………….
74
Table 4.7 Correlation matrix for ethylbenzene dehydrogenation over hydrotalcite
mixed oxides catalyst (RC model) …………………………………………………
75
Table 4.8 Estimated kinetic parameters for hydrotalcite mixed oxides catalyst
based on time-on-stream model ……………………………………………………
77
Table 4.9 Correlation matrix for ethylbenzene dehydrogenation over hydrotalcite
mixed oxides catalyst (TOS model) ……………………………………………….
78
Table 4.10 Physical and structural properties of Fe2O3/Al2O3 ……………………. 84
Table 4.11 Product distribution at various reaction conditions for the
dehydrogenation of ethylbenzene over 21%Fe-meso.Al2O3 (one pot) catalyst …...
90
Table 4.12 Product distribution at various reaction conditions for the
x
dehydrogenation of ethylbenzene over 21%Fe/meso.Al2O3 (impregnation)
catalyst ……………………………………………………………………………..
91
Table 4.13 Product distribution at various reaction conditions for the
dehydrogenation of ethylbenzene over 21%Fe-con.Al2O3 (impregnation) catalyst..
92
Table 4.14 Effects of reaction temperature on catalytic properties of iron doped
mesoporous alumina catalysts ……………………………………………………..
96
Table 4.15 Estimated kinetic parameters for all the Fe2O3/Al2O3 catalyst based on
reactant conversion model (Mechanism I) ………………………………………...
103
Table 4.16 Correlation matrix for ethylbenzene dehydrogenation over all the
Fe2O3/Al2O3 catalyst based on reactant conversion model (Mechanism I) ………..
104
Table 4.17 Estimated kinetic parameters for all the Fe2O3/Al2O3 catalyst based on
reactant conversion model (Mechanism II) ………………………………………..
105
Table 4.18 Correlation matrix for ethylbenzene dehydrogenation over all the
Fe2O3/Al2O3 catalyst based on reactant conversion model (Mechanism II) ………
106
Table A3.1 Retention time of different compounds in the GC …………………… 112
xi
LIST OF FIGURES
Figure 1.1a Global styrene capacity (2008) ……………………………………….. 3
Figure 1.1b Global styrene consumption (2008) ………………………………….. 3
Figure 1.2 Lummus/UOP Classic SM process of adiabatic ethylbenzene
dehydrogenation plant ……………………………………………………………..
6
Figure 1.3 Simplified flow diagram of the SMPO process ……………………….. 8
Figure 2.1 Reaction scheme of catalytic dehydrogenation of ethylbenzene ……… 16
Figure 2.2 Schematic life cycle of a prototype catalyst without any promoter
additives ……………………………………………………………………………
20
Figure 2.3 Structure of hydrotalcite ……………………………………………….. 25
Figure 2.4 The dehydrogenation of ethylbenzene over Mg2FexAl1-x mixed oxides
catalysts ○ethylbenzene conversion; ●styrene selectivity; ■benzene selectivity;
▲toluene selectivity ……………………………………………………………….
28
Figure 3.1 Schematic diagram of the riser simulator experimental set-up ………... 34
Figure 3.2a Schematic diagram of the riser simulator …………………………….. 36
Figure 3.2b Cross section of the riser simulator displaying the unit components … 36
Figure 3.3 Schematic diagram of the gas chromatograph ………………………… 38
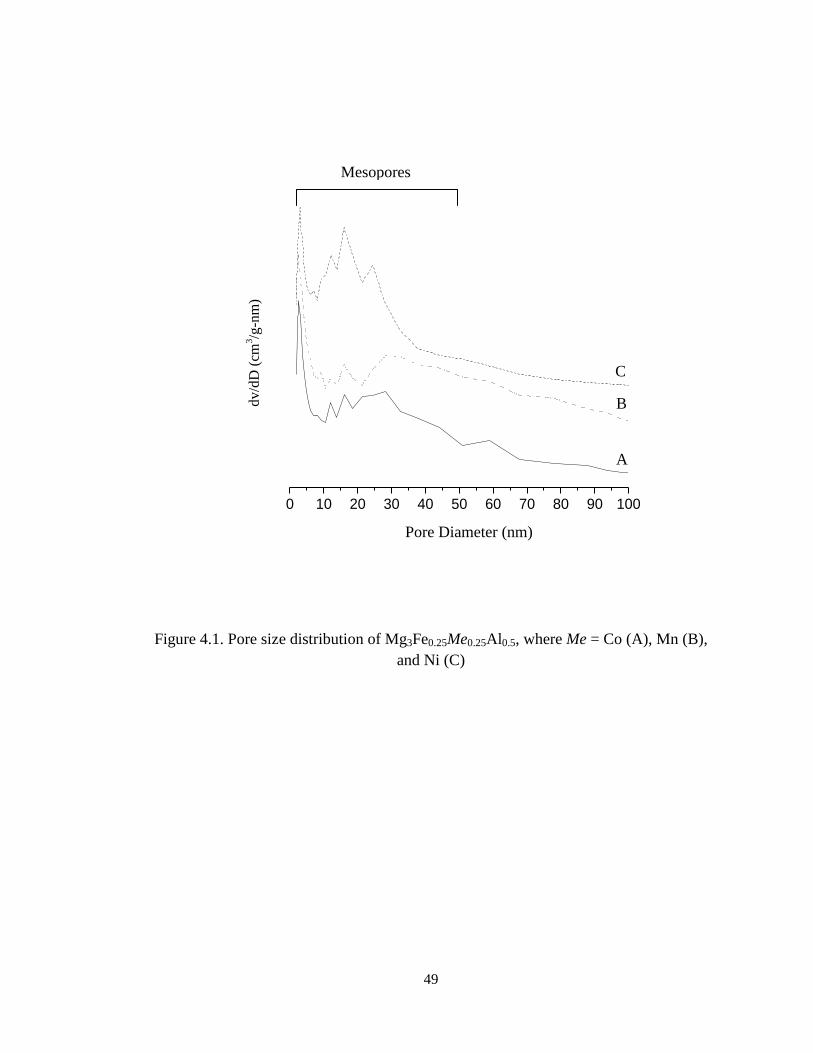
Figure 4.1 Pore size distribution of Mg3Fe0.25Me0.25Al0.5, where Me = Co (A), Mn
(B), and Ni (C) ……………………………………………………………………..
49
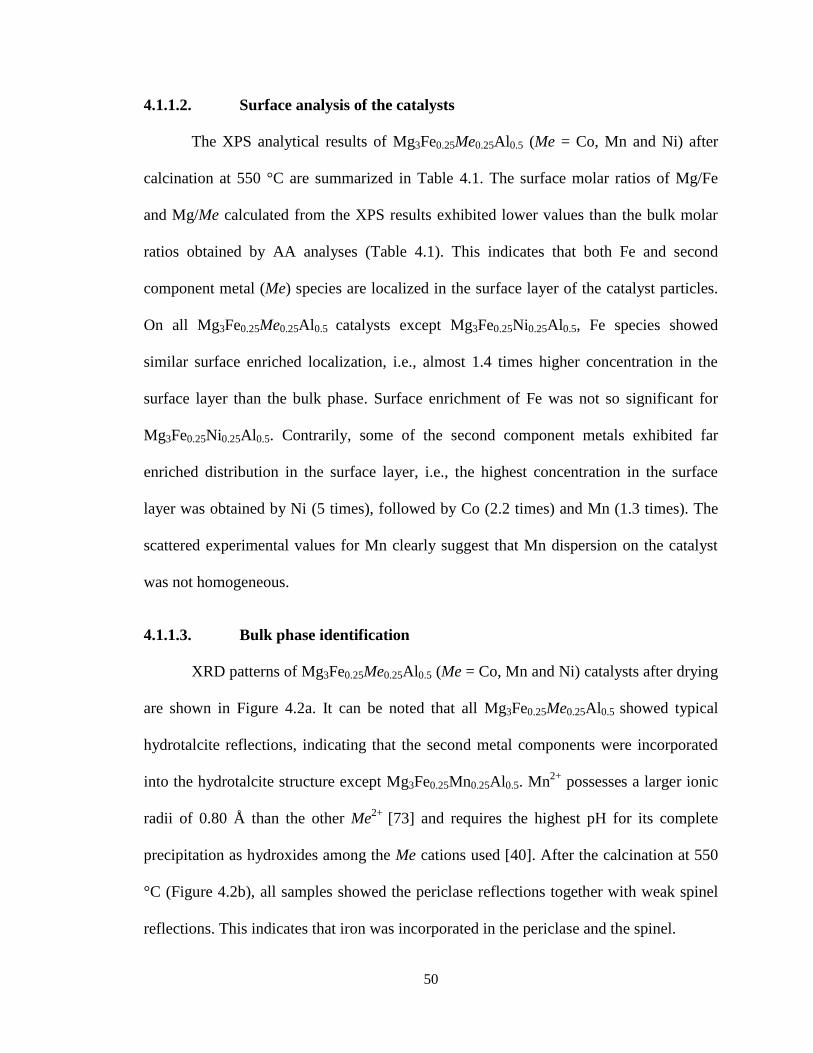
Figure 4.2 XRD patterns of Mg3Fe0.25Me0.25Al0.5 (Me = Co (a), Mn (b) and Ni (c))
after A) drying and B) calcination at 550 °C (■: Hydrotalcites; ♦: unknown and
▼: periclase) .............................................................................................................
51
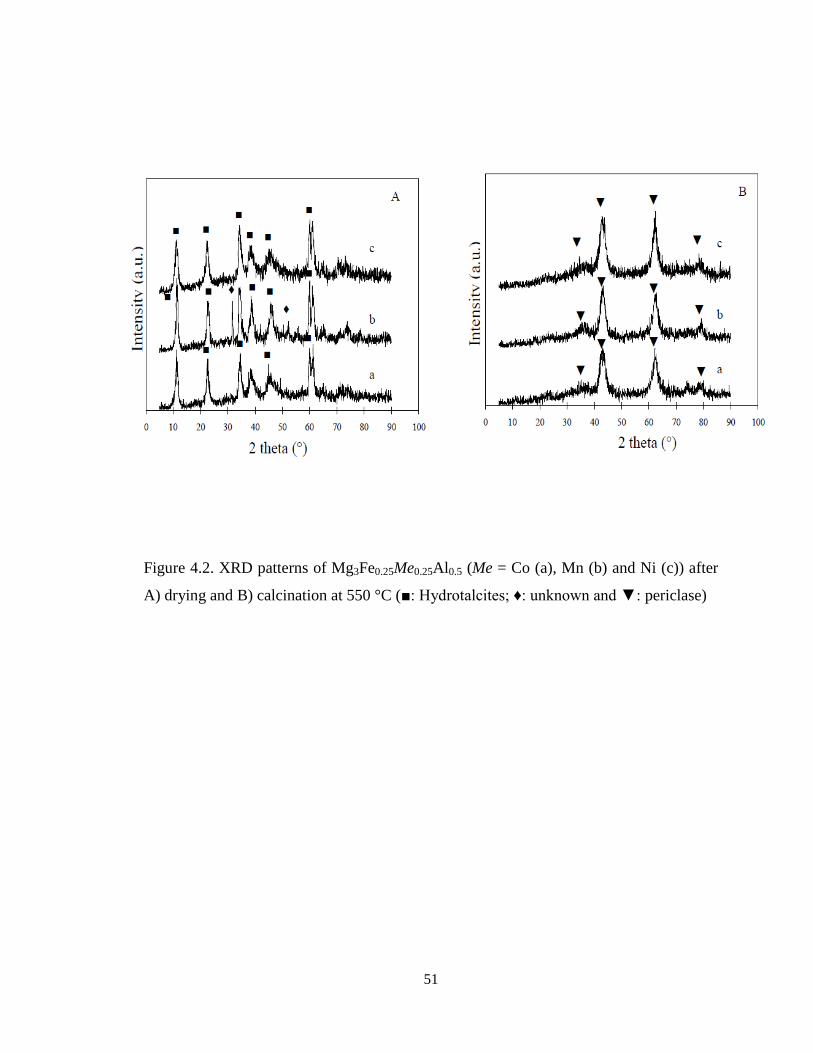
Figure 4.3 H2-TPR of Mg3Fe0.25Me0.25Al0.5 (Me = Co, Mn, and Ni) catalysts. a)
xii
Mg3Fe1; b) Mg3Fe0.5Al0.5; c) Mg3Fe0.25Mn0.25Al0.5; d) Mg3Fe0.25Co0.25Al0.5; and f)
Mg3Fe0.25Ni0.25Al0.5 ………………………………………………………………...
53
Figure 4.4 Conversion of ethylbenzene with respect to time at various
temperatures over different hydrotalcite mixed oxides; A) Mg3Fe0.25Co0.25Al0.5, B)
Mg3Fe0.25Mn0.25Al0.5, and C) Mg3Fe0.25Ni0.25Al0.5 …………………………………
58
Figure 4.5 Conversion of ethylbenzene with respect to time at 500 °C,
comparison between commercial and HT catalysts ……………………………….
59
Figure 4.6 Product selectivity of ethylbenzene dehydrogenation over the different
catalysts at ~ 6% ethylbenzene conversion ………………………………………..
61
Figure 4.7 Selectivity with respect to conversion and temperature for
Mg3Fe0.25Mn0.25Al0.5 ……………………………………………………………….
62
Figure 4.8 Styrene (A) and benzene (B) yields vs. ethylbenzene conversion at
various temperatures for Mg3Fe0.25Mn0.25Al0.5 …………………………………….
64
Figure 4.9 Overall comparisons between the experimental results and model
predictions of all HTs catalysts for scheme 1: A) RC model, B) TOS model ……..
81
Figure 4.10 N2 adsorption-desorption isotherm …………………………………... 83
Figure 4.11a XRD pattern of pure alumina support ………………………………. 86
Figure 4.11b XRD pattern of 21%Fe doped on alumina support …………………. 86
Figure 4.12a Mesoporous alumina doped with iron ………………………………. 88
Figure 4.12b Conventional alumina doped with iron ……………………………... 88
Figure 4.13 Comparison of styrene yield for all reaction temperatures over
Fe2O3/Al2O3 ………………………………………………………………………..
93
Figure 4.14 Effect of reaction condition on ethylbenzene conversion (Mechanism
xiii
I) over: A) 21%Fe-meso.Al2O3 (one-pot), B) 21%Fe/meso.Al2O3 (impregnation),
C) 21%Fe-con.Al2O3 (impregnation) ……………………………………………...
95
Figure 4.15 Overall comparison between the experimental results and model
predictions of all the catalysts for: A) scheme 2, B) scheme 3 ……………………
108
xiv
THESIS ABSTRACT
Name: ATANDA LUQMAN ABIOLA
Title of Study: ETHYLBENZENE DEHYDROGENATION TO STYRENE
OVER MESOPOROUS MIXED OXIDE CATALYSTS:
SYNTHESIS, CHARACTERIZATION AND KINETIC
MODELING
Degree: MASTER OF SCIENCE
Major Field: CHEMICAL ENGINEERING
Date of Degree: May, 2011
A steamless process for ethylbenzene dehydrogenation to styrene was studied in a
fluidized bed reactor over mesoporous mixed oxides based catalysts. Experimental runs
were carried out over hydrotalcite and Fe2O3 supported on Al2O3 catalysts in a riser
simulator at different operating conditions. The reaction temperature was varied in the
range of 350–550 °C, and the reaction time was varied from 5-20 seconds. Both catalyst
systems were significantly active for the ethylbenzene dehydrogenation reaction. This
behaviour is ascribed to the high surface area and porosity of the catalysts which enhaced
the diffusion of reactant molecules into and the reaction products out of the catalyst
pores. This is also coupled with the effective catalytic cycle due to mixed acidic-basic
sites and reduction-oxidation reaction of the active specie. A kinetic model was derived
to better understand the reaction behaviour. Modeling of the experimental results was
based on both reactant conversion (RC) and time-on-stream (TOS) models.
xv
THESIS ABSTRACT (ARABIC)
يهخص انبحث
اتاذا ابيىالنقا : االسى
اصطاع و ىزج حركي: اعادة هذرجت ايثيم انبسي انى االستيري فىق انحفازاث: عىا انبحث
ياجستير انعهىو: انذرجت
انهذست انكييائيت: انجال انعاو
3122يايى : تاريخ يح انذرجت
اثم انبس بذ بخبر انبء حى حج دراست اخبج االسخر ف يفبعم انطبق انخع ع طرق اعبدة ذرخت
اخراء انخدبرة ببسخخذاو حفبزاث انذرحبنسج اكسذ انحذذ انذعى ببالنيب ف يفبعم حدرب رافع ححج
03ان 5درخ يئ بسي حفبعم ي 553 053ظرف حشغم يخخهف حى دراست يذ درخت حرارة انخشغم ب
فبعم باسطت كريبحغرافب انغبز اظر ا انبحح انرئس االسخر خذ ا ع انحفبز ثب ححهم بحح انخ
شطب العبدة ذرخت اثم انبس سا انشبط عس نسبحت انسطح انكبر انفبز نهعايم انحفبز انخ حسبعذ
ضبف ان خدة درة انحفبز سبت نخد قبط عه ححس اخشبر خسئبث انخفبعم انذاخه نسبيبث انحفبز ببال
شط حبيض قبعذ حفبعم االكسذ االخخسال انذر نهقبط انشط حى حطر زج نحركت انخفبعم نفى
يكبكت انخفبعم ببء عه يعذل ححل انخفبعالث ان احح زج زي انخفبعم انذاخه
1
CHAPTER 1
1.0 INTRODUCTION
1.1. Background
Styrene is one of the most important monomers in modern petrochemical
industry. The market has grown from around 20 million tons in 2000 and is expected to
reach around 28 million tons in 2010 [1]. However, prior to World War II, the styrene
industry, which uses ethylbenzene as a starting material was relatively insignificant. The
tremendous demand for synthetic styrene – butadiene rubber (SBR) during the war
prompted accelerated technology improvements and capacity expansion. The styrene
process was developed in the 1930s by BASF (Germany) and Dow Chemical (USA) and
this effort have led to the construction of several large-scale factories, and styrene
production became a significant industry.
Styrene is a basic building block in making a variety of materials, most
recognizable is polystyrene. Other materials include acrylonitrile-butadiene styrene
(ABS) plastic, styrene-acrylonitrile (SAN) plastic, styrene-butadiene rubber (SBR),
unsaturated polyester resins and expanded polystyrene foam (EPS). These materials can
further be transformed to produce variety of products across a wide range of industries as
there is no direct end use for styrene. Products made from styrene are of high
performance, durable, safety, value and high quality [1]. Many of these products offer
very good insulation qualities and the ability to be recycled. These products range from
2
packaging materials to a myriad of consumer electronics, construction, transportation and
medical applications. Therefore, styrene production is done indeed in a large scale that
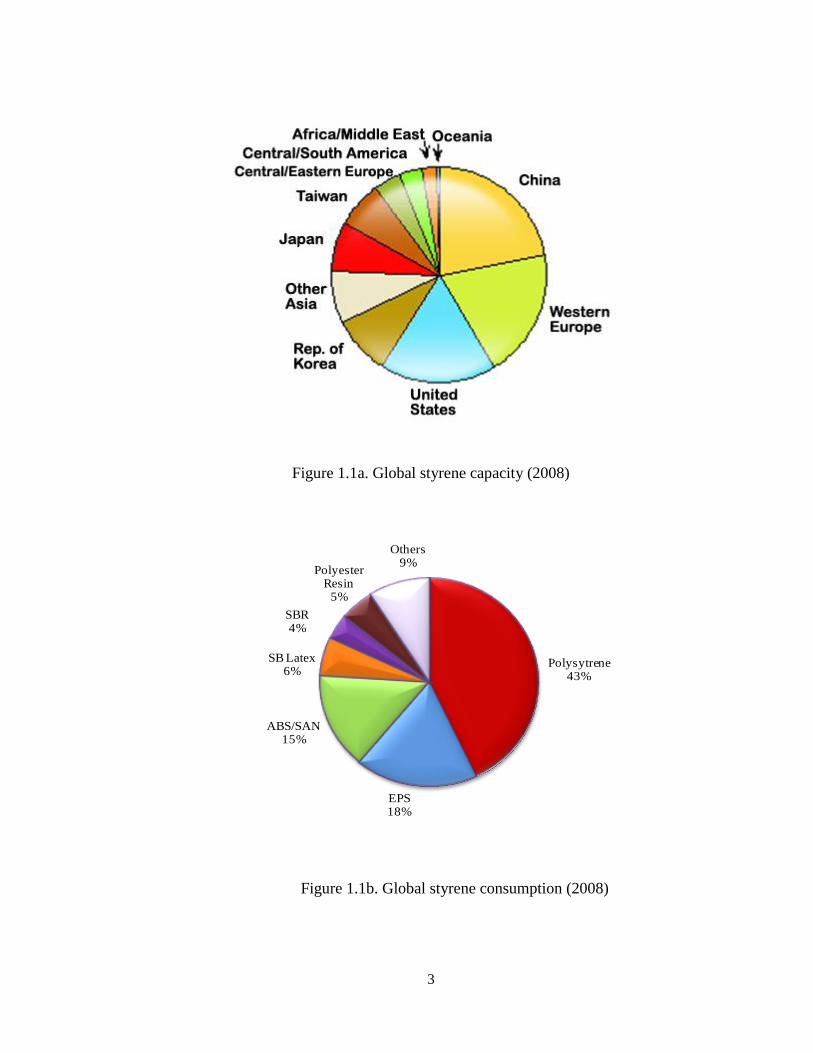
follows those of ethylene, propylene and vinyl chloride. The global styrene capacity in
2008 is 26million tons per year. The global distribution of the styrene production
facilities is shown in Figure 1.1a. while global distribution of styrene consumption by
product is shown in Figure 1.1b [2].
3
Figure 1.1a. Global styrene capacity (2008)
Figure 1.1b. Global styrene consumption (2008)
Polysytrene43%
EPS18%
ABS/SAN15%
SB Latex6%
SBR4%
Polyester Resin
5%
Others9%
4
1.2. Main Industrial Technologies for styrene production
Industrially, styrene is produced mainly through two process routes:
dehydrogenation of ethylbenzene and co-production with propylene oxide in a process
known as SM/PO (Styrene Monomer/Propylene Oxide) or POSM. Both routes use
ethylbenzene (EB) as the intermediate, EB is first made by the catalytic alkylation of
benzene with ethylene, using either aluminium chloride or, more recently, zeolite
catalysts [3]. Ethylbenzene and styrene units are almost always installed together with
matching capacities because nearly all of the ethylbenzene produced commercially is
converted to styrene. Alkylation is exothermic and dehydrogenation is endothermic, as a
result energy economy in a typical ethylbenzene-styrene complex is achieved by
integrating the energy flows of the two units.
1.2.1. Catalytic Dehydrogenation of Ethylbenzene
This route accounts for 90% of the total world production. Dehydrogenation of
ethylbenzene can be run industrially using either multiple bed adiabatic or tubular
isothermal reactors in which the reactants are passed over the catalyst bed employing
radial or axial flow. In this process, EB is dehydrogenated to styrene in the presence of
potassium promoted iron oxide catalyst and a super-heated steam was fed to supply the
heat of endothermic dehydrogenation and further to suppress the coking. Formations of
by-products are suppressed by reducing the partial pressure of the reaction. Generally,
adiabatic dehydrogenation in multiple bed reactors is preferred but both methods are
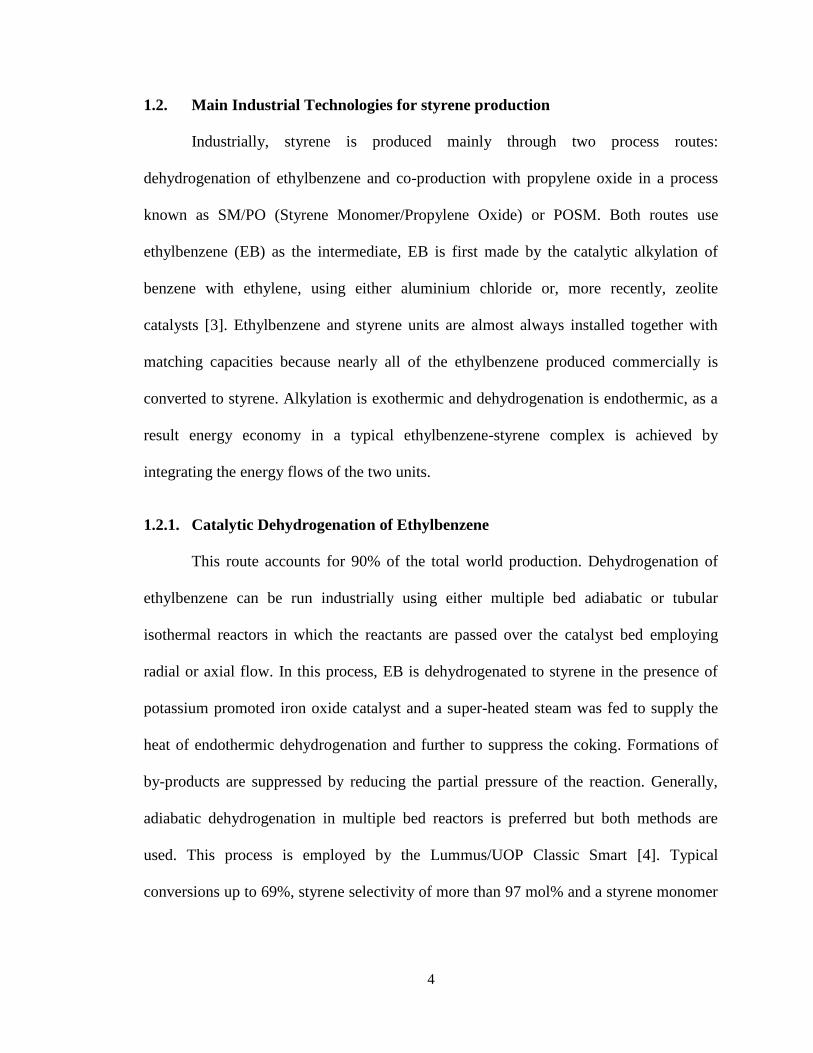
used. This process is employed by the Lummus/UOP Classic Smart [4]. Typical
conversions up to 69%, styrene selectivity of more than 97 mol% and a styrene monomer

5
purity of 99.85 wt% are achieved. Flow scheme of a typical Lummus/UOP adiabatic
ethylbenzene dehydrogenation plant is shown below:
6
Figure 1.2. Lummus/UOP Classic SM process of adiabatic ethylbenzene dehydrogenation plant
7
To eliminate the costly interstage reheating and reduce superheated steam
requirements, the technology has been modified and improved to Lummus/UOP Smart
SM process [4]. This modified technology combines oxidative reheat technology with
adiabatic dehydrogenation technology. In this approach, heat needed for the
dehydrogenation reaction is generated by controlled combustion of hydrogen. By
removing hydrogen from the reaction mixture, the reaction equilibrium is shifted towards
higher EB conversion. Increased conversion up to 80 % is achieved without
compromising the purity of the styrene monomer.
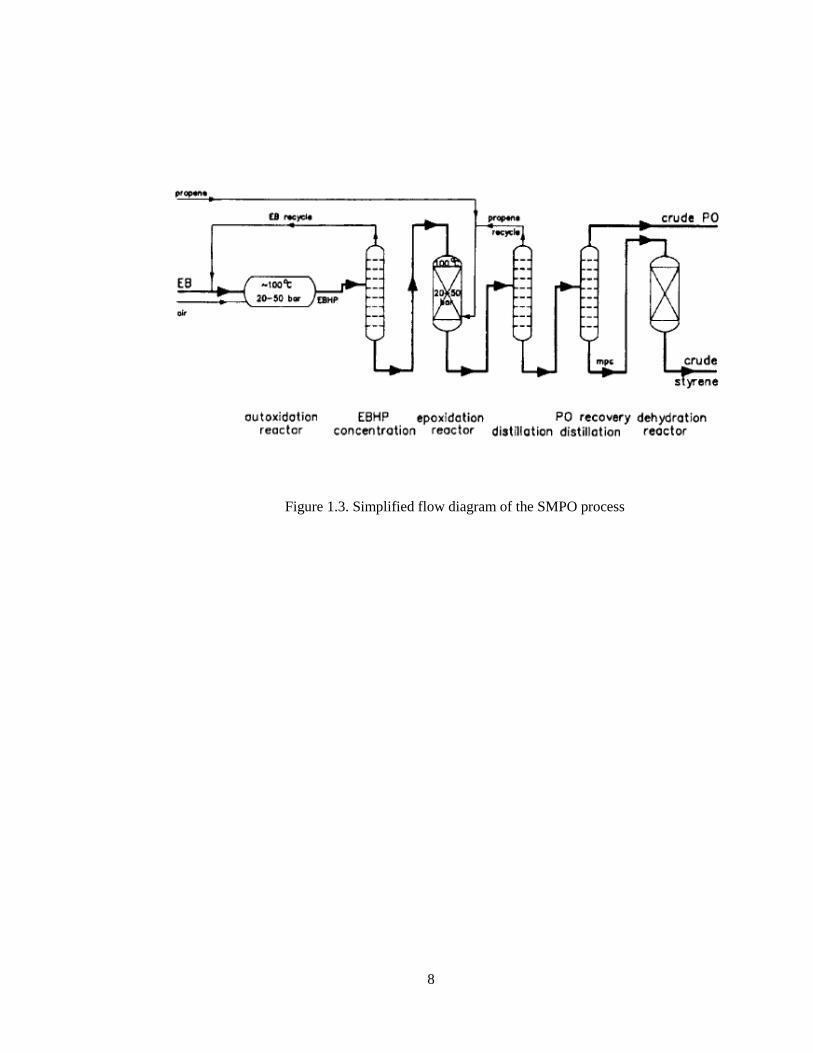
1.2.2. Styrene and Propylene Oxide (SMPO) Process
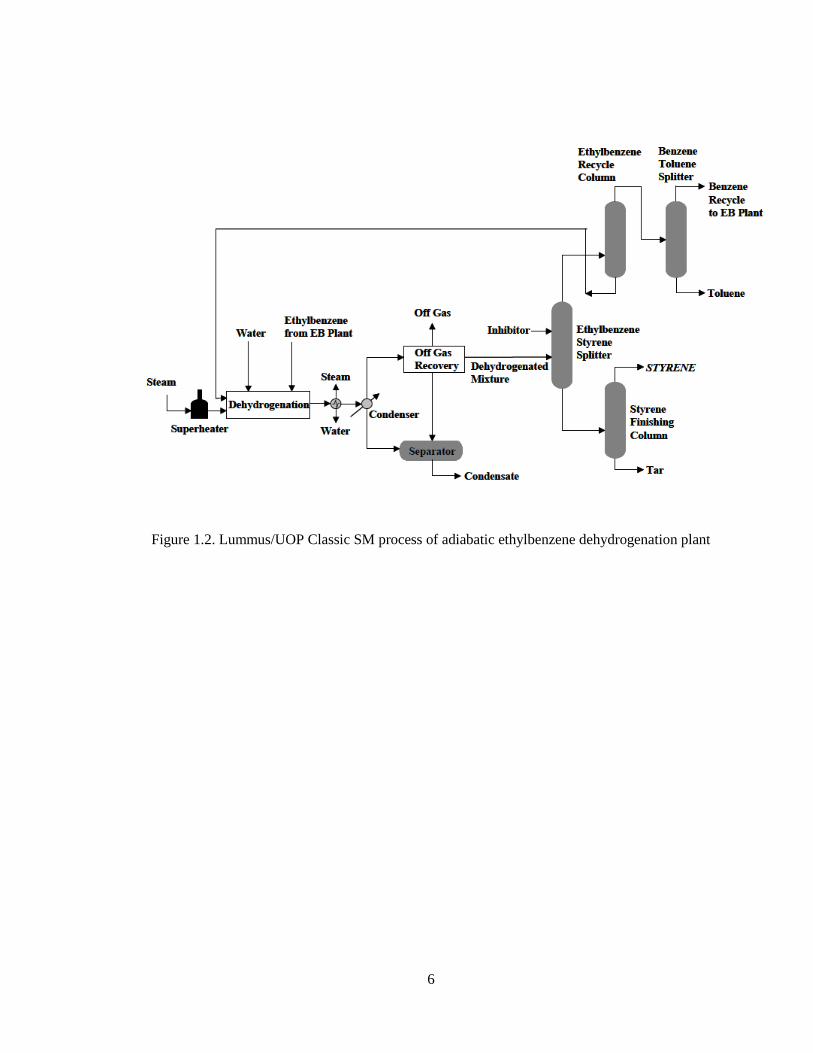
This process was discovered in the 1970’s by Halcon and improved by Royal
Dutch SHELL [5]. The coproduction of propylene oxide (PO) and styrene (SM) route is
complex and capital-intensive in comparison to dehydrogenation of ethylbenzene. The
process includes three reaction steps: oxidation of ethylbenzene to ethylbenzene
hydroperoxide (EBHP), epoxidation of ethylbenzene hydroperoxide (EBHP) with
propylene to form α-phenylethanol and propylene oxide, and dehydration of α-
phenylethanol to styrene.
H2
O2
CH2
CH5
H6
C2
O3
CH2
CH5
H6
C
O2
CHCH3
CHOH2
CH2
CH5
H6
C2
CHCH3
CHH2
O2
CH2
CH5
H6
C
O2
H2
CHCH5
H6
COH2
CH2
CH5
H6
C
8
Figure 1.3. Simplified flow diagram of the SMPO process
9
The SMPO process is cleaner and much less energy intensive than the
conventional dehydrogenation route (less by-products). Its major drawback is that
production of styrene is limited by the amount of propylene oxide that can be sold [6].
The process flow diagram is shown in Figure 1.3
1.3. Other Technologies
Other technologies in the manufacture of styrene include:
1.3.1. Styrene production from ethane and benzene
This is a joint technology developed by Snamprogetti S.p.A and Dow [7, 8]. It is
an alternative dehydrogenation process that use ethane rather ethylbenzene as feed to the
process. Ethane and ethylbenzene from the alkylation unit is fed to a circulating fluidized
bed reactor system that simultaneously produces styrene and ethylene and allows
continuous catalyst regeneration. The dehydrogenation reactor effluent is cooled and
separated and the ethylene stream is recycled to the alkylation unit. The catalyst
composition suitable for this process consists of microspheroidal catalyst particles of
Gallium/Platinum/Potassium supported on alumina with a silica binder. This novel route
of styrene production integrates the processes of producing ethylene, ethylbenzene and
styrene. Another advantage of the process is the recovery of commercial grade hydrogen
as a by-product.
1.3.2. Styrene production from methanol and toluene
The side chain alkylation of toluene with methanol is a potential alternative
technology to produce styrene. Direct side alkylation of toluene over basic zeolites is an
interesting reaction, considering the industrial importance of its products, especially
10
ethylbenzene and styrene [9]. It is generally accepted that zeolites with some basicity
catalyze side-chain alkylation to styrene which is subsequently hydrogenated to
ethylbenzene while those which compose of acid sites accomplish only ring alkylation.
Styrene monomer production via alkylation of toluene occurs in gas phase at condition
420 °C, 4-7 bar with the presence of zeolite X and Y catalyst. The reactions occur in a
two parallel reaction that produces styrene and ethyl benzene. The raw material being
used are liquid toluene and liquid methanol that are preheated to 420 °C before enter the
reactor. The catalyst used in this process has high styrene selectivity so that the styrene
yield could reach 85%. This process has been claimed to be economically attractive
offering the advantage of lower raw material cost compared with the traditional process
[10].
Other processes for the production of styrene are: side-chain chlorination of
ethylbenzene, styrene extraction from pyrolysis gasoline (Toray’s STEX process) and
oxidative conversion of ethylbenzene to a-phenylethanol via acetophenone and
subsequent dehydration of the alcohol [11].
1.4. Motivation
Research and development of new catalysts, reactor designs, and process routes
has been continuously pursued to achieve process improvement. Recently a good
collaboration has been done between catalyst research and process development, and
such collaboration evidently enabled the development of new much energy-saving
catalytic process, to decrease the cost unit of raw materials and finally to enhance the
production capability. BASF and DOW processes composed of multitubular fixed-bed
reactor have been known as industrial processes, whereas Lummus and Badger (Stone &
11
Webster, Shaw group) processes composed of radial-flow type reactor are recently used
due to its adiabatic character applicable for the large scale production. Now the size of
reactor is increasing and new plants possessing 500,000~600,000 t/y productivity are
under construction. SMART process developed by UOP is known by its unique
technology combining dehydrogenation and oxidation; hydrogen formed by
dehydrogenation was consumed by reacting with oxygen gas. This favors thermodynamic
equilibrium to styrene production and simultaneously steam and heat are supplied to the
reactor. Actually, this process is frequently adopted when the reactor is reformed to
increase the productivity.
In view of this, a plausible new catalytic process of ethylbenzene dehydrogenation
to improve styrene production will be developed which is going to be a steamless process
without the promotional role of potassium. Development of this process depends
primarily on the development of highly efficient catalysts, which will be achieved by
fundamental studies of the catalyst preparations as well as the catalytic reactions involved
in the process. For the dehydrogenation at a low temperature, highly dispersed Fe catalyst
derived from Mg/Fe/Al ternary hydrotalcite precursors is a promising candidate due to its
high activity. Alumina-supported metal oxides with well ordered mesoporosity are also a
choice for the dehydrogenation process. We aim to optimize the catalysts by modifying
the preparative conditions and the metal compositions in the catalysts. The catalytic
process will make use of a fluidized bed reactor instead of the more commonly used fixed
bed reactors. A fluid bed process can offer several potential advantages over the fixed
bed process. These include enhanced reactant-catalyst contact resulting in higher reaction
rates and hence shorter reaction times, uniform product quality as a result of extensive
12
bed mixing and heat distribution. It also enhances easy and timely catalyst regeneration in
contrast to the fixed bed process where catalyst regeneration is often laborious, expensive
and time consuming [12]. The reaction will be studied under several conditions (reaction
times and temperatures) for catalyst testing and kinetic modeling of catalytic reactions.
Finally, by optimizing the reaction conditions, highly efficient process can be established
in the dehydrogenation of ethylbenzene to styrene, as well as lead to an energetically and
environmentally benign chemical production.
1.5. Thesis Objectives
The main objectives of this work are of two-fold; i) to develop highly efficient catalysts
for dehydrogenation of ethylbenzene to styrene, and ii) kinetic studies of the reaction.
The detailed specific objectives are as follows:
1.5.1. Synthesis and characterization of hydrotalcite and mesoporous iron oxide-
alumina based catalysts
i. Mg/Fe/Al hydrotalcite precursor is selected as a base catalyst which is to be
modified by Cobalt, Manganese and Nickel.
ii. Facile synthesis of mesoporous alumina on which iron oxide shall be doped.
iii. Determination of the physico-chemical properties of the catalysts through some
characterization techniques.
1.5.2. Catalysts Test Performance
The prepared catalysts’ activity and selectivity will be determined for the
dehydrogenation process. Fluidized bed reactor will be used for the catalytic
dehydrogenation of ethylbenzene at short reaction time (5 – 20 s) and reaction
13
temperature (350 – 550 °C) lower than that used industrially. It is expected that the short
reaction times will limit the tendencies of undesired reactions from taking place and the
relatively low temperature will prevent the occurrence of thermal reactions.
1.5.3. Kinetic modeling
Key to any process development is the availability of important design
parameters such as the activation energy of the reaction, rate constants, etc. This will
involve the following:
i. Proposing different possible reaction models
ii. Fitting experimental data into the proposed models to check the suitability of the
models
iii. Determination of kinetic parameters; apparent activation energies, apparent
reaction rate constants.
1.6. Thesis Outline
Chapter 2 presents a literature review on dehydrogenation of ethylbenzene. An overview
of its reaction mechanism is given, catalyst composition and deactivation. Challenges
facing the commercial catalyst used for the dehydrogenation process were discussed, and
what has been done so far in terms of catalysts development to tackle these challenges.
Overview of the kinetic studies of the reactions involved was also reviewed.
Chapter 3 deals with the experimental section. Description of the equipment used for the
experimental set-up is given as well as the procedures adopted. This chapter also explains
catalyst synthesis, characterization and evaluation.
Chapter 4 focuses on the results of the experimental work. Discussion of the effects of
reaction conditions (temperature and time) are given in details. In addition, a detailed

14
kinetic modeling of the reaction over all the catalysts (hydrotalcites and mesoporous iron
oxide-alumina) is presented starting first with model formulation and then estimation of
the kinetic parameters using non-linear regression analysis.
Chapter 5 gives the summary of our contribution, conclusions and recommendation for
future work
15
CHAPTER 2
2.0 LITERATURE REVIEW
2.1. Introduction
The catalytic dehydrogenation of ethylbenzene is an important reaction used
commercially for the production of styrene. The dehydrogenation reaction is
thermodynamically favored at high temperature and low pressure. The dehydrogenation
reaction must overcome the constraint resulting from the fact that energy required to
break a C-C bond (245 kJ/mol) is less than the energy necessary to break C-H bond (365
kJ/mol) [13]. Therefore, thermal reaction is not advisable, since it would lead to a
predominance of cracking reactions over dehydrogenation reactions. However, in the
presence of a suitable catalyst, dehydrogenation can be carried out with minimal C-C
bond rupture. Therefore, typical dehydrogenation of ethylbenzene industrially is carried
out on iron oxide based catalysts at temperatures above 600 °C. The reaction is highly
endothermic (∆H = 124.9 kJ/mol) and reversible, therefore steam is used in large amount
since; steam plays a prominent role in shifting of the reaction equilibrium towards
products, prolonging the catalyst activity and most significantly acts as a heat carrier. The
dilution with steam also reduces the potential for the formation of coke [14]. The
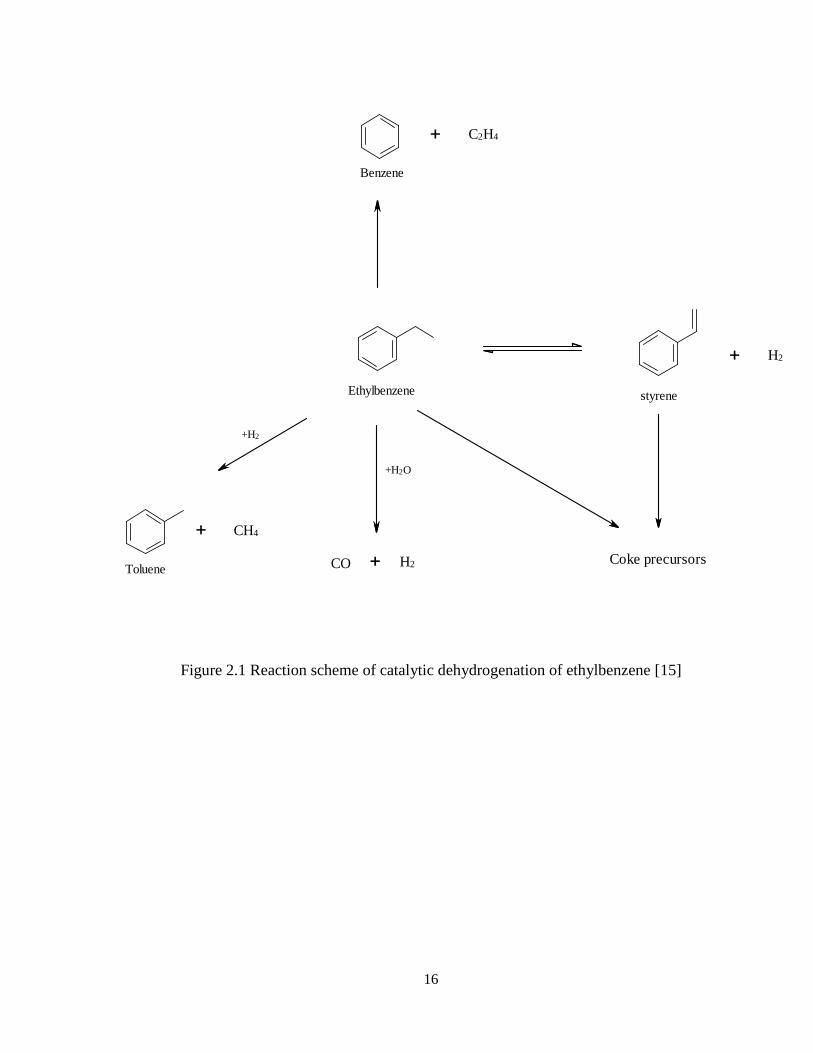
conversion per pass is generally 60-70%, with styrene selectivity between 93-95%. A
simplified reaction scheme of catalytic dehydrogenation of ethylbenzene is shown in
Figure 2.1.
16
Figure 2.1 Reaction scheme of catalytic dehydrogenation of ethylbenzene [15]
H2
Ethylbenzene styrene
Benzene
C2H4
Toluene
+H2
+H2O
CO H2 Coke precursors
CH4
17
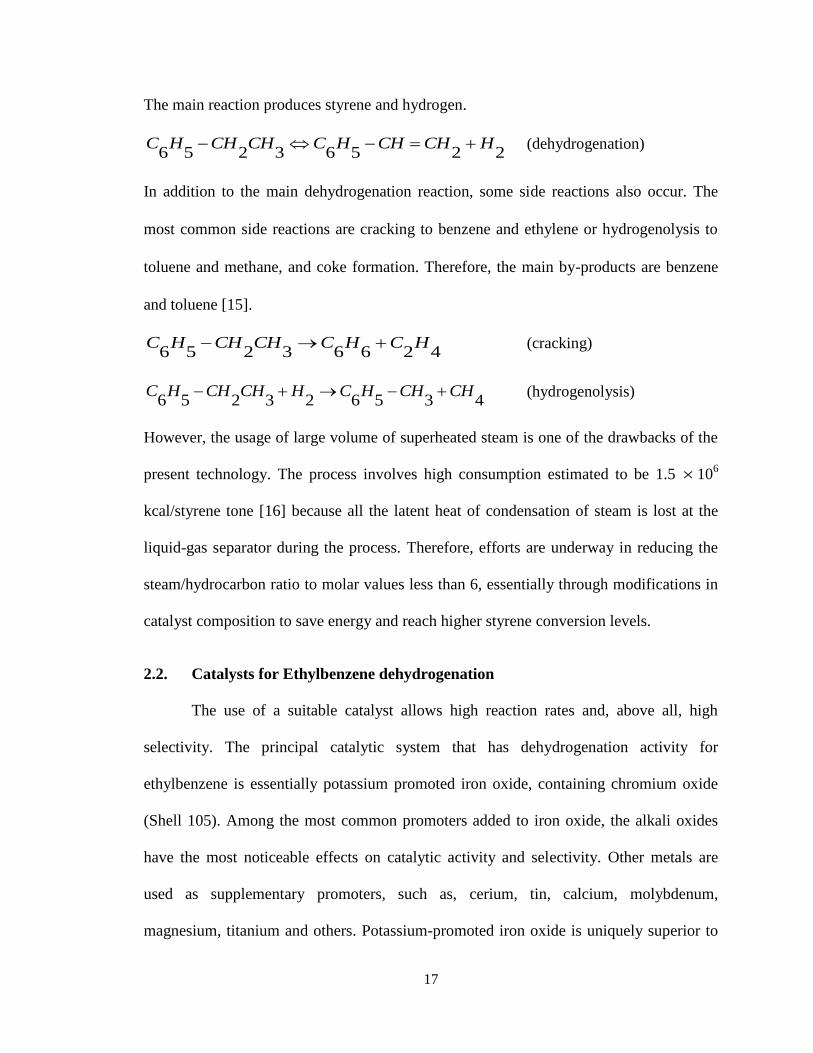
The main reaction produces styrene and hydrogen.
22563256HCHCHHCCHCHHC
(dehydrogenation)
In addition to the main dehydrogenation reaction, some side reactions also occur. The
most common side reactions are cracking to benzene and ethylene or hydrogenolysis to
toluene and methane, and coke formation. Therefore, the main by-products are benzene
and toluene [15].
42663256HCHCCHCHHC
(cracking)
435623256CHCHHCHCHCHHC
(hydrogenolysis)
However, the usage of large volume of superheated steam is one of the drawbacks of the
present technology. The process involves high consumption estimated to be 1.5 106
kcal/styrene tone [16] because all the latent heat of condensation of steam is lost at the
liquid-gas separator during the process. Therefore, efforts are underway in reducing the
steam/hydrocarbon ratio to molar values less than 6, essentially through modifications in
catalyst composition to save energy and reach higher styrene conversion levels.
2.2. Catalysts for Ethylbenzene dehydrogenation
The use of a suitable catalyst allows high reaction rates and, above all, high
selectivity. The principal catalytic system that has dehydrogenation activity for
ethylbenzene is essentially potassium promoted iron oxide, containing chromium oxide
(Shell 105). Among the most common promoters added to iron oxide, the alkali oxides
have the most noticeable effects on catalytic activity and selectivity. Other metals are
used as supplementary promoters, such as, cerium, tin, calcium, molybdenum,
magnesium, titanium and others. Potassium-promoted iron oxide is uniquely superior to
18
any other known catalyst for the dehydrogenation of ethylbenzene in the presence of
steam [17], particularly efficient with respect to both selectivity and activity. Promotion
of iron oxide with potassium enhances the activity of iron oxide by an order of magnitude
and reduces the formation of carbonaceous surface deposits or coke that deactivates the
catalysts [14,18-19]. A study of the structure and composition of the catalysts established
the promotional role of potassium to consist of the formation of KFeO2, which constitutes
the active phase. Muhler et. al. [20] also confirmed the active phase to be a thin layer of
KFeO2 supported on a solid solution of K2Fe22O34 in Fe3O4. The existence of the ternary
K2Fe22O34 serves as storage medium from which the active surface is continuously
supplied with a near monolayer coverage of potassium ions in an environment of Fe3+
ions. Lee and Holmes [21] suggested that potassium increase activity by encouraging
electron transfer at the solid-gas interface. Potassium further stabilizes the catalyst against
reduction [22] and supports the removal of coke. The formation of well dispersed K2CO3
is believed to be the active center for carbon gasification [23]. However, a major setback
of potassium is its deactivation with time which is caused by migration and susceptibility
to poisoning by halides and residual organic chloride impurities [14]. Small amounts of
other promoters are added to favor the formation and stability of the active phase under
reaction conditions at lower steam to hydrocarbon ratios. Aluminum and chromium act as
structural promoters and increase the lifetime of the catalysts. Titanium increased the
number of active phase KFeO2 and improves the dispersion of CeO2 [24], while the
addition of both Ce and Mo improved the catalyst composition, increasing both activity
and selectivity [19]. Addition of alkaline earth oxides especially MgO to the potassium
promoted iron oxide catalysts improved its activity and stability [25].
19
2.3. Catalyst deactivation
Several forms of catalyst deactivation have been identified for this type of
catalysts under ethylbenzene dehydrogenation. The catalyst slowly deactivates and
typically needs to be replaced every 1-2 years. The major cause of catalyst deactivation is
carbon deposition. The temperatures and low pressures necessary to achieve high
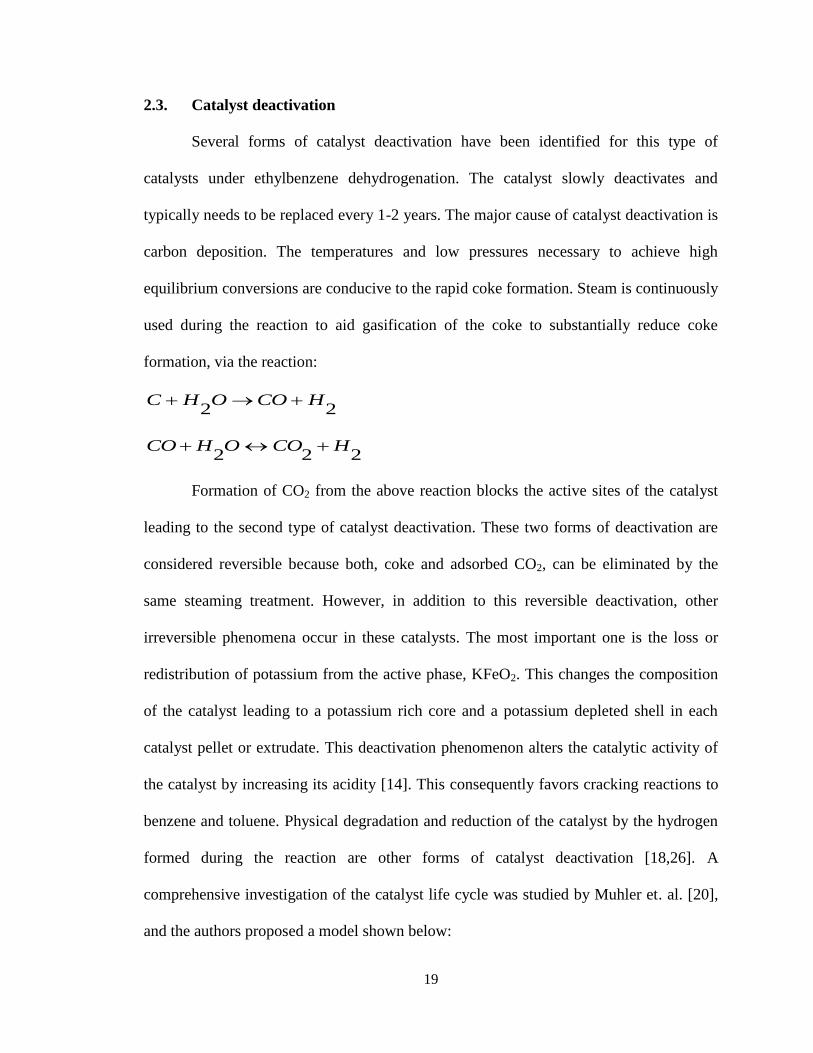
equilibrium conversions are conducive to the rapid coke formation. Steam is continuously
used during the reaction to aid gasification of the coke to substantially reduce coke
formation, via the reaction:
22HCOOHC
222HCOOHCO
Formation of CO2 from the above reaction blocks the active sites of the catalyst
leading to the second type of catalyst deactivation. These two forms of deactivation are
considered reversible because both, coke and adsorbed CO2, can be eliminated by the
same steaming treatment. However, in addition to this reversible deactivation, other
irreversible phenomena occur in these catalysts. The most important one is the loss or
redistribution of potassium from the active phase, KFeO2. This changes the composition
of the catalyst leading to a potassium rich core and a potassium depleted shell in each
catalyst pellet or extrudate. This deactivation phenomenon alters the catalytic activity of
the catalyst by increasing its acidity [14]. This consequently favors cracking reactions to
benzene and toluene. Physical degradation and reduction of the catalyst by the hydrogen
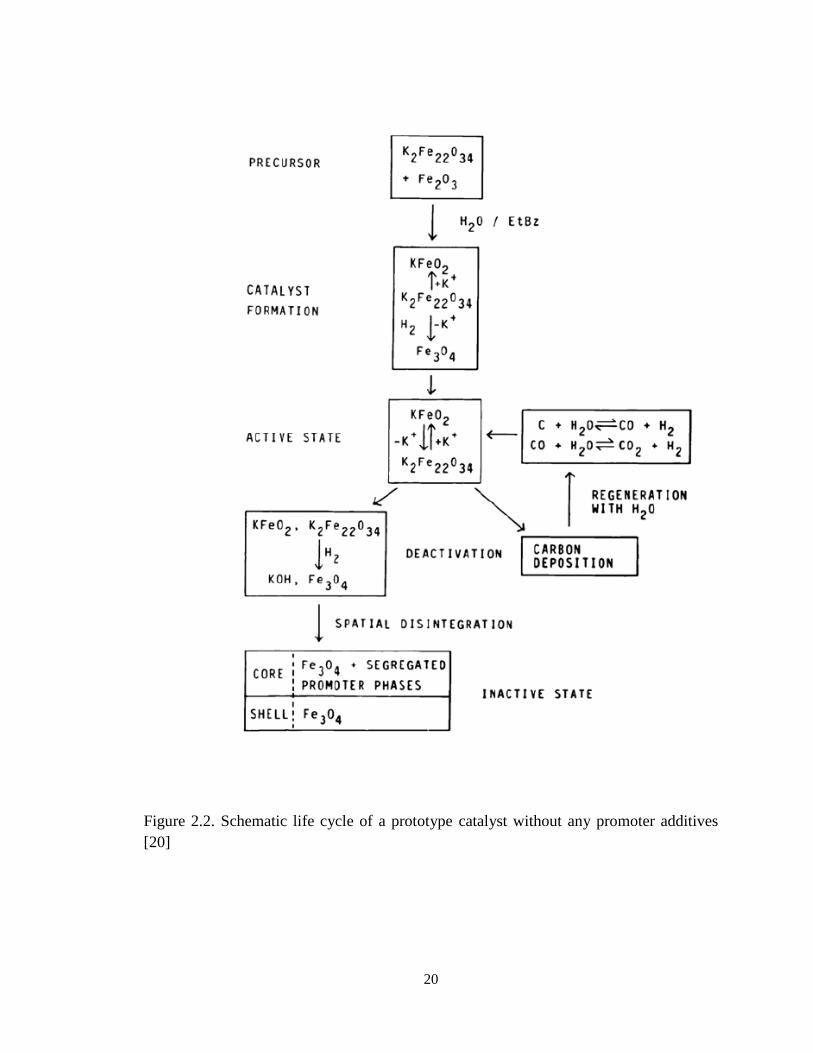
formed during the reaction are other forms of catalyst deactivation [18,26]. A
comprehensive investigation of the catalyst life cycle was studied by Muhler et. al. [20],
and the authors proposed a model shown below:
20
Figure 2.2. Schematic life cycle of a prototype catalyst without any promoter additives
[20]
21
2.4. Reaction Kinetics and Mechanisms
Kinetics of ethylbenzene dehydrogenation has been extensively investigated with
the aim of obtaining a kinetic model useful for both industrial application and
interpretation of the reaction mechanism. Kinetic models based on pseudo-homogeneous
reactor model have been used to determine intrinsic reaction rates [27,28]. A reaction
scheme composed of six independent reactions: the main reaction, i.e., ethylbenzene to
styrene, and five side reactions were proposed. The rate constants thus were effective but
not intrinsic. Therefore, a rigorous heterogeneous model has been developed and used to
extract intrinsic rate constants based on dusty gas models accounting for diffusion and
reaction in the catalyst pellets [29]. Carrà and Forni [30] performed kinetic studies in the
temperature range of 770–900 K over the industrial catalyst, Shell 105. The intrinsic rate
of styrene formation was developed, based upon unimolecular Langmuir-Hinshelwood
mechanism, where the reaction rate depends on the adsorption-desorption equilibrium of
ethylbenzene and styrene. It is believed that water does not take part in the reaction itself
i.e. not involved in the rate determining step of the reaction mechanism, but acts purely as
inert diluents agent. Hirano [18-19, 31] investigated the kinetics over various iron oxide
catalysts in a differential reactor. The rate of styrene formation was independent of the
partial pressure of steam and of ethylbenzene. However, styrene addition to the
ethylbenzene feed decreased the rate of styrene formation, which confirmed the earlier
suggestion of Carrà and Forni that preferred adsorption of styrene can lead to site-
blocking effect by the product. Dittmeyer et. al. [32] studied the reaction kinetics of
ethylbenzene dehydrogenation in a gradientless recycle reactor. The rate equations were
developed based on the Langmuir-Hinshelwood-Hougen-Watson (LHHW) type formula
22
for the main reaction and the power law for the steam reforming reactions. The authors
found out that the formation of styrene and toluene were suppressed due to controlled
CO2 addition and production of CO2 was attributed to the stream reforming of
ethylbenzene and CH4. A mechanistic catalyst model neglecting side reactions towards
benzene and toluene was derived by Schüle et al. [33]. The model assumes overall
conversion consists of individual steps adsorption, surface reaction and desorption.
Another single-step reaction considered is the gas-solid reactions related to formation of
coke and phase transformation of iron oxide. More recently Lee and Froment [34]
developed a set of intrinsic rate equations for a commercial potassium-promoted iron
catalyst based on Hougen-Watson model. The model was applied in the simulation of the
dehydrogenation in industrial multibed adiabatic reactors which accounts for thermal
radical-type reactions, internal diffusion limitations, coke formation, and gasification.
Kinetic studies on model catalysts by Coulter et al. [35] showed similar apparent
activation energies for K-promoted and unpromoted iron oxide catalysts. They suggested
that potassium only increases the number of active sites, but does not change their nature.
Several authors have investigated the reaction mechanism of dehydrogenation of
ethylbenzene on the Fe-K mixed oxide catalyst. An infrared spectroscopy study by
Addiego et al [36] observed that ethylbenzene dehydrogenation from which styrene is
formed was bonded to the catalyst surface through the vinyl group, whereas styrene
adsorbed from the gas phase was bound via the aromatic ring. Miura et al. [37]
investigated dehydrogenation of alkylbenzenes over an Fe2O3- K2CO3- Cr2O3 catalyst by
means of isotope exchange experiments. According to them, dissociation of α-hydrogen
is the first step followed by dissociation of β-hydrogen, which is the rate-determining
23
step or post rate-determining step. They concluded that the α-hydrogen is dissociated as a
proton on a basic site. Dulamiţă et al. [38] proposed a mixed acid-basic and reduction-
oxidation mechanism based on the kinetic study on the same catalyst as ref. 37; a
formation of π-adsorbed intermediate on Fe3+
acid centers, followed by elimination of
two hydrogen ions from two C-H ethylic groups on basic centers with electrons transfer
to Fe3+
to form styrene and H2. Oliveira et al. [39] proposed acid-base mechanism to
operate to adsorb ethylbenzene and abstract the β-hydrogen in the ethylbenzene
dehydrogenation over Fe-MCM-41.
2.5. Catalyst development for ethylbenzene dehydrogenation
Improvement of styrene production includes development of high selectivity catalyst
and reactor design. The presence of several consecutive reactions is responsible for the
typical trade-off between conversion and selectivity to the desired product. Therefore, the
main challenges in the area of catalyst development for ethylbenzene dehydrogenation
are the development of a catalyst which:
i. Stabilize the active specie in the absence of potassium promoter and superheated
steam
ii. Possess high surface area
iii. Minimizes coke formation and catalyst deactivation
iv. Active and selective towards increased styrene yield
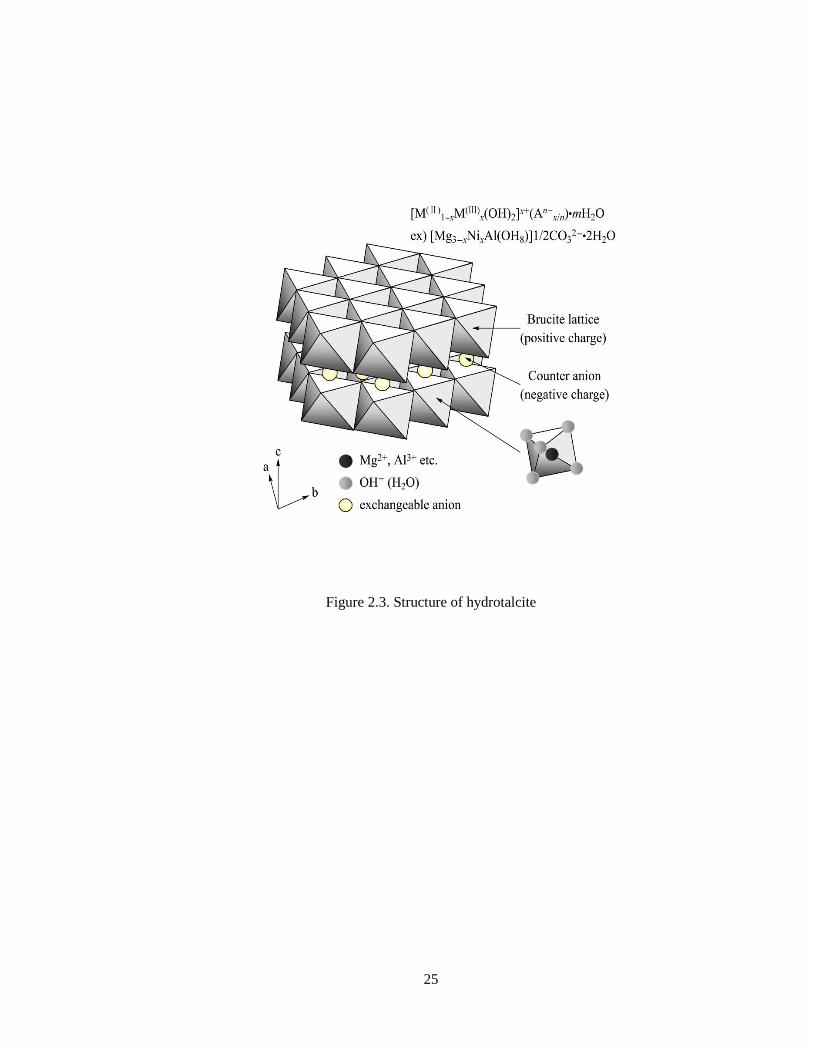
2.5.1. Hydrotalcites
Hydrotalcite-like compounds or more generally speaking layered double
hydroxides (LDHs) have the general formula [M(II)1-xM(III)x·(OH)2]x+
(An-
)x/n·mH2O
where M(II) is a divalent cation (Mg2+
, Ni2+
, Co2+
, Zn2+
, Mn2+
), M(III) is a trivalent
24
cation (Fe3+
, Cr3+
, Al3+
), A is an anion. It is of importance to choose the appropriate ratio
of cations and anions in order to obtain a pure HTlc during preparation: 0.2 ≤ x ≤0.4 and
l/n ≤ An-
/M(III) ≤ 1, where x = M(III)/[M(II)+M(III)] [40]. HTlcs are usually carbonate
in natural minerals and belong to the class of anionic clays. They are structurally similar
to brucite Mg(OH)2; they are layered materials made of positively charged two-
dimensional sheets of mixed hydroxides with water and exchangeable charge-
compensating anions [40,41].
25
Figure 2.3. Structure of hydrotalcite
26
HTlcs are gaining considerable interest in several technological fields, particularly
for base-catalyzed reactions. This is because the catalysts contain various transition metal
cations as the catalytically active species well dispersed on the basic support materials.
Their properties and applications have been the subject of detailed reviews, [40-43] and
many publications have provided examples of their practical uses. Isomorphous
substitution of divalent cations by trivalent ones generates positive charges on the layers,
which are compensated by anions located in the interlayer region. The possibility of
accommodation of cations of different natures in the sheets, atomic scale homogeneity,
possibility of intercalation of several types of anions (inorganic, organic, organometallic,
polyoxometalates) and formation of mixed oxides under thermal treatment makes HT
applicable to wide range of applications. They are usually activated by thermal
decomposition to serve as precursors for mixed oxide catalysts which offer unique basic
properties that make them very attractive for catalytic applications. The resultant oxides
upon calcinations exhibit high surface area, high thermal stability and highly
homogeneous metal dispersion [40] which improves their catalytic performance.
Moreover, they are potentially recoverable and recyclable [44]. In addition to the basic
sites, acid sites or acid-base pairs on HTs also influence catalytic performance. Acid-base
sites on mixed oxides are highly active sites for many reactions. Acid-base properties of
Mg-Al mixed oxides are governed by the Mg/Al molar ratio, calcination temperature and
preparation condition [45]. A further improvement to the catalysts has been obtained by
modification of the HTlcs through the addition of other elements. Mg/Fe/Al mixed oxides
prepared from Mg-Al(Fe) HTs has been reported to effectively catalyze the
dehydrogenation of ethylbenzene [46]. The high catalytic performance was attributed to
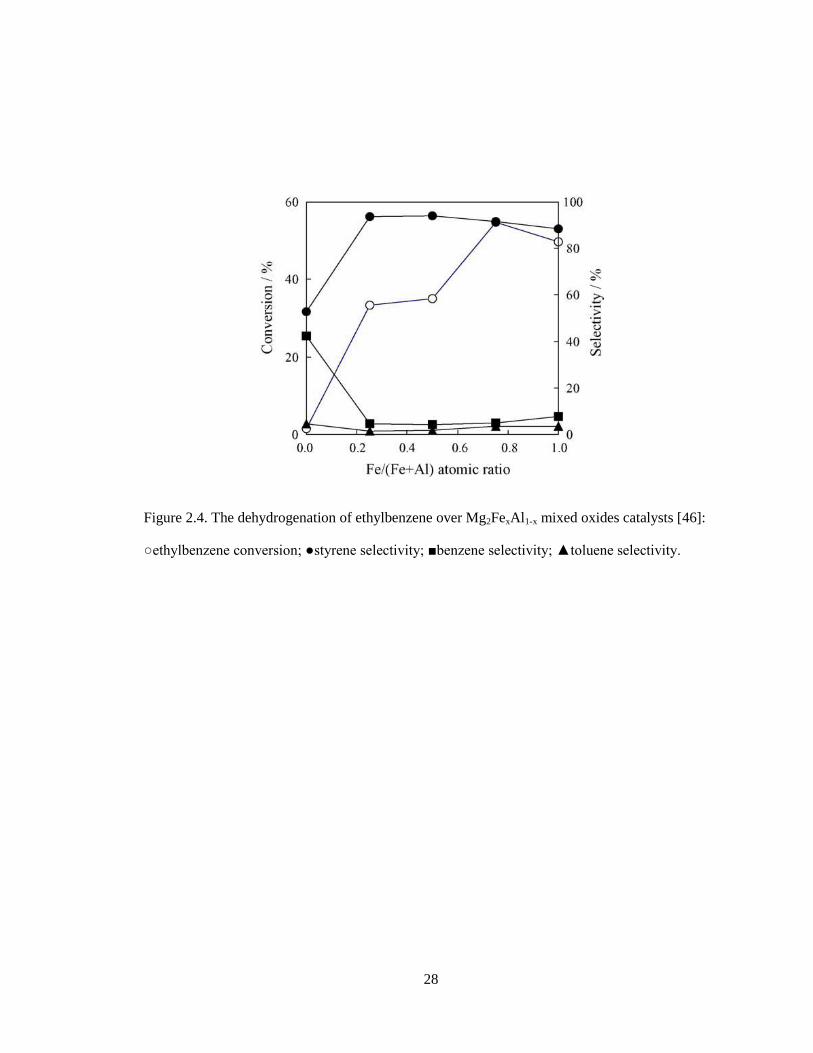
27
the formation of partially reduced iron oxides on the surface of catalyst and to the high
surface area along with the porous structure, which originated from the Mg/Fe/Al
hydrotalcite structure in the precursors. The main phase was identified as the formation of
periclase Mg(Fe,Al)O. Catalytic tests of the Mg2FexAl1-x mixed oxides catalysts showed
that the styrene conversion increased with increasing the iron content up to x = 0.75 and
then decreased, while the selectivity was the highest at x = 0.25 (Figure 2.3). The
optimum temperature for the reaction was 550 ºC, which was lower than that used in the
commercial process. The ethylbenzene conversion of 60% and the styrene selectivity of
95% were kept for 3 h over Mg3Fe0.5Al0.5 mixed oxide catalyst at 550 ºC. After the
reaction for 3 h, the iron species on the catalyst was partially reduced to the valence state
between Fe2+
and Fe3+
.
28
Figure 2.4. The dehydrogenation of ethylbenzene over Mg2FexAl1-x mixed oxides catalysts [46]:
○ethylbenzene conversion; ●styrene selectivity; ■benzene selectivity; ▲toluene selectivity.
29
A further study to elucidate the role of MgO as basic support for this catalyst
showed that the mixed acid-basic and reduction-oxidation reaction on the Mg2+
-O2-
-Fe3+
active species leads to an effective catalytic cycle, responsible for its high catalytic
performance [47]. MgO effectively initiated dehydrogenation by H+ abstraction of EB on
the basic site, and proceeded by the accelerated reduction-oxidation of Fe3+
active
species. Furthermore, improvement of the activity of the Mg3Fe0.5Al0.5 mixed oxide
catalyst can be achieved by optimizing the Mg/Fe/Al metal composition and further by
adding the second metal component to the Fe catalyst. This has been proven to be true
from a recent study on the activity of various FeOx-MeOy/Mg(Al)O catalysts derived
from HTs [48]. Addition of cobalt (Me = Co; FeOx-CoOy/Mg(Al)O) improved the
activity of the catalyst due to the formation of Fe3+
- Co2+
(1/1) bimetallic species. This
further facilitated the reduction-oxidation of Fe3+
/Fe2+
and stabilized the active Fe3+
species.
2.5.2. Mesoporous Alumina doped with iron
The importance of alumina as a catalyst or support has been widely recognized.
As a support or co-catalyst it is used in many catalytic processes of industrial importance
such as isomerization, alkylation, catalytic cracking, hydroforming, hydrodesulfurization
of petroleum products [49, 50]. Transition aluminas are disordered crystalline phases
formed through the thermal dehydration of aluminum hydroxides and oxyhydroxides
[51]. Seven transition alumina phases have been identified which include the γ-, η-, δ-, θ-,
κ-, χ-, and the stable α-alumina phase. Among these, γ-Al2O3 is widely used in catalysis
as an active phase and is characterized by having acid sites which determines the activity
and selectivity of the catalyst for specific catalytic reactions [52]. The utility of γ-Al2O3
30
as well as other transition aluminas can also be traced to a favorable combination of
textural properties (i.e. surface area, pore volume and pore size). Mesoporous alumina
supports with large surface areas, large pore volumes, narrow pore size and suitable
surface acidic–basic properties often result in favorable enhancements in catalytic
performance [53, 54]. Therefore, synthesis of organized mesoporous aluminas attracted
particular research activities in the last decade, which provided new synthetic approaches
using novel structure-directing agents. Synthetic approaches such as sol gel,
hydrothermal, precipitation, cation-anion double hydrolysis and microemulsion
templating methods [55-62], have been used to synthesize mesoporous alumina with a
large surface area. However, it has been observed that relatively low thermal instability
associated with as-synthesized alumina constituted a major setback. This is because phase
transition often occurs during high calcinations temperatures. Recently, a facile synthesis
developed by Yuan et. al. [63] has been used to develop a highly ordered mesoporous
amorphous and/or crystalline γ-aluminas with high thermal stability and large amount of
lewis acid sites. This method has been extended to the development of alumina-supported
metal oxides with well-developed mesoporosity, relatively high surface area and
crystalline pore walls through one-pot synthesis [64]. A new synthetic procedure for
ordered mesoporous γ-alumina with a large surface area has been proposed by Huang et.
al., suggested to be catalyst supports in high temperature reactions [65]. Few works have
been reported on the use of iron doped alumina catalyst for ethylbenzene
dehydrogenation. Fe2O3 supported on γ-alumina has been suggested to interact with each
other to form FeAl2O4 spinel and stabilize the Fe2O3 phase [66]. This was in line with the
observation of Giecko et. al. [67] and they further proposed that iron aluminates
31
(FeAl2O4) are reducible species formed due to high temperature sintering process.
Mimura and Saito [68] suggested that high activity is attainable using coprecipitation
method for Fe2O3/Al2O3 catalyst and the active sites are composed of iron and aluminium
which might be amorphous and/or highly dispersed. Their investigation further shows the
effectiveness of Fe2O3/Al2O3 for the dehydrogenation of ethylbenzene in the presence of
CO2. Lee [14] also suggests that Al2O3 is effective for EB dehydrogenation in the absence
of steam as diluents. However, rare works has been reported on the use of Fe2O3/Al2O3
catalyst for non-oxidative or direct ethylbenzene dehydrogenation.
32
CHAPTER 3
3.0 EXPERIMENTAL SECTION
3.1. Experimental Set-up
Experimental runs for the dehydrogenation process were carried out in a riser
simulator reactor. The reactor was connected to a vacuum box through a four-port valve.
The products were removed from the riser simulator at the end of the pre-set reaction
period. A time/actuator assembly linked to the feed injection system controlled the four-
port valve. The vacuum system was connected to a manually operated six-port sampling
valve. This sampling valve was connected on-line to the gas chromatograph.
Furthermore, the riser simulator reactor and the vacuum box were equipped with pressure
transducers to monitor the pressure during and after the reaction periods. Both the reactor
and the vacuum system were supplied by separated heating systems and both were well
insulated.
The feed injecting system includes a gas tight syringe connected to switches to
control the timer/actuator assembly on the four port valve and the data acquisition
system. The data acquisition system allowed monitoring the change of pressure with time
from both the reactor and the vacuum box. A four-port valve, controlled by a
timer/actuator assembly, was linked to the injection system. A vacuum system was also
connected to the manually operated six port sampling valve which allows for sampling
injections into the gas chromatograph. Both, the reactor and the vacuum system are
33
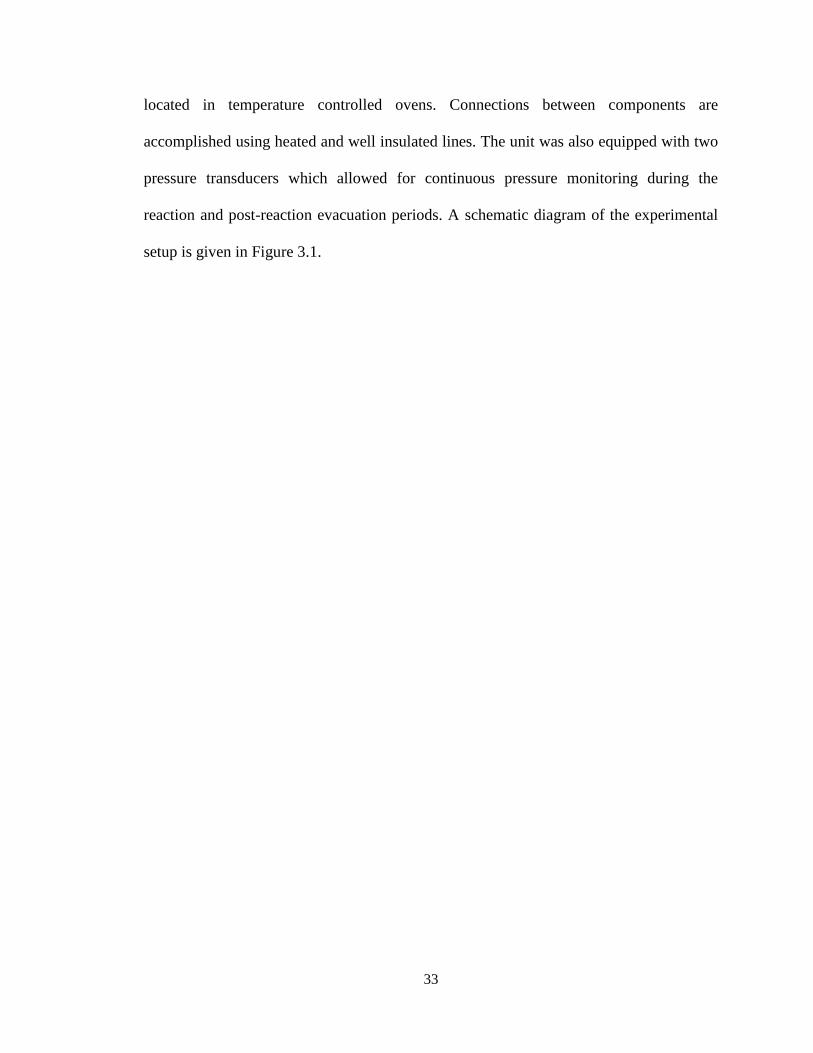
located in temperature controlled ovens. Connections between components are
accomplished using heated and well insulated lines. The unit was also equipped with two
pressure transducers which allowed for continuous pressure monitoring during the
reaction and post-reaction evacuation periods. A schematic diagram of the experimental
setup is given in Figure 3.1.
34
Figure 3.1. Schematic diagram of the riser simulator experimental set-up
35
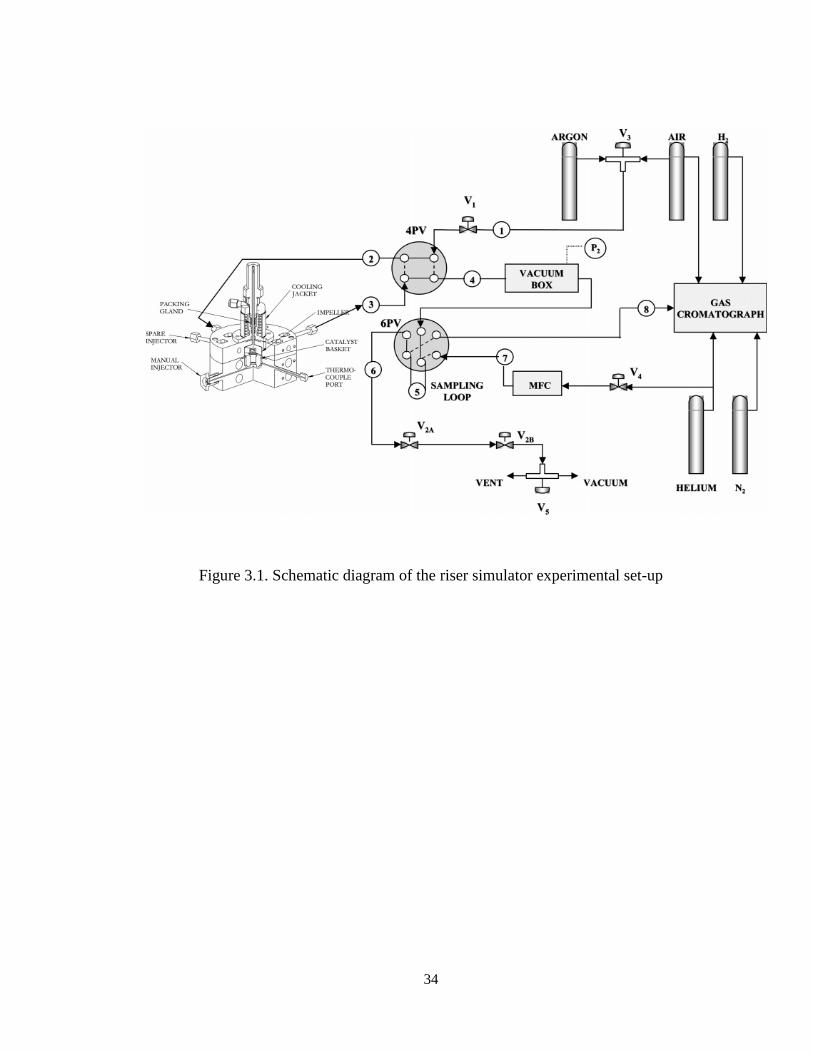
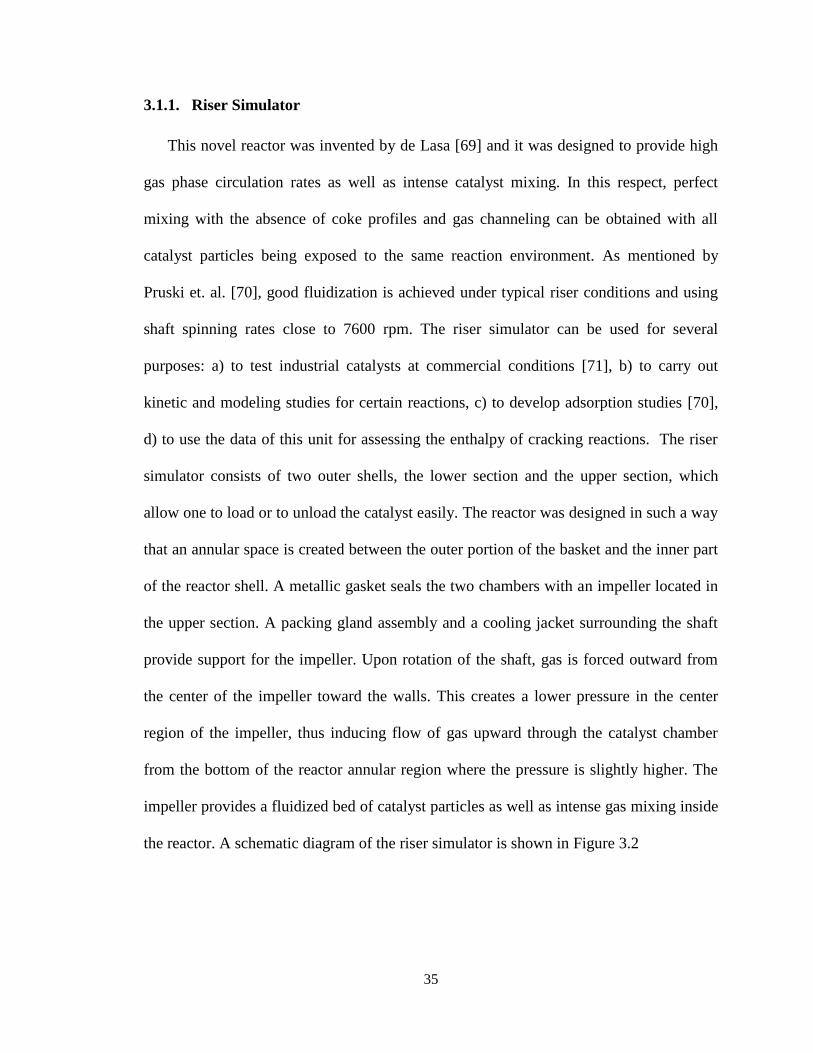
3.1.1. Riser Simulator
This novel reactor was invented by de Lasa [69] and it was designed to provide high
gas phase circulation rates as well as intense catalyst mixing. In this respect, perfect
mixing with the absence of coke profiles and gas channeling can be obtained with all
catalyst particles being exposed to the same reaction environment. As mentioned by
Pruski et. al. [70], good fluidization is achieved under typical riser conditions and using
shaft spinning rates close to 7600 rpm. The riser simulator can be used for several
purposes: a) to test industrial catalysts at commercial conditions [71], b) to carry out
kinetic and modeling studies for certain reactions, c) to develop adsorption studies [70],
d) to use the data of this unit for assessing the enthalpy of cracking reactions. The riser
simulator consists of two outer shells, the lower section and the upper section, which
allow one to load or to unload the catalyst easily. The reactor was designed in such a way
that an annular space is created between the outer portion of the basket and the inner part
of the reactor shell. A metallic gasket seals the two chambers with an impeller located in
the upper section. A packing gland assembly and a cooling jacket surrounding the shaft
provide support for the impeller. Upon rotation of the shaft, gas is forced outward from
the center of the impeller toward the walls. This creates a lower pressure in the center
region of the impeller, thus inducing flow of gas upward through the catalyst chamber
from the bottom of the reactor annular region where the pressure is slightly higher. The
impeller provides a fluidized bed of catalyst particles as well as intense gas mixing inside
the reactor. A schematic diagram of the riser simulator is shown in Figure 3.2
36
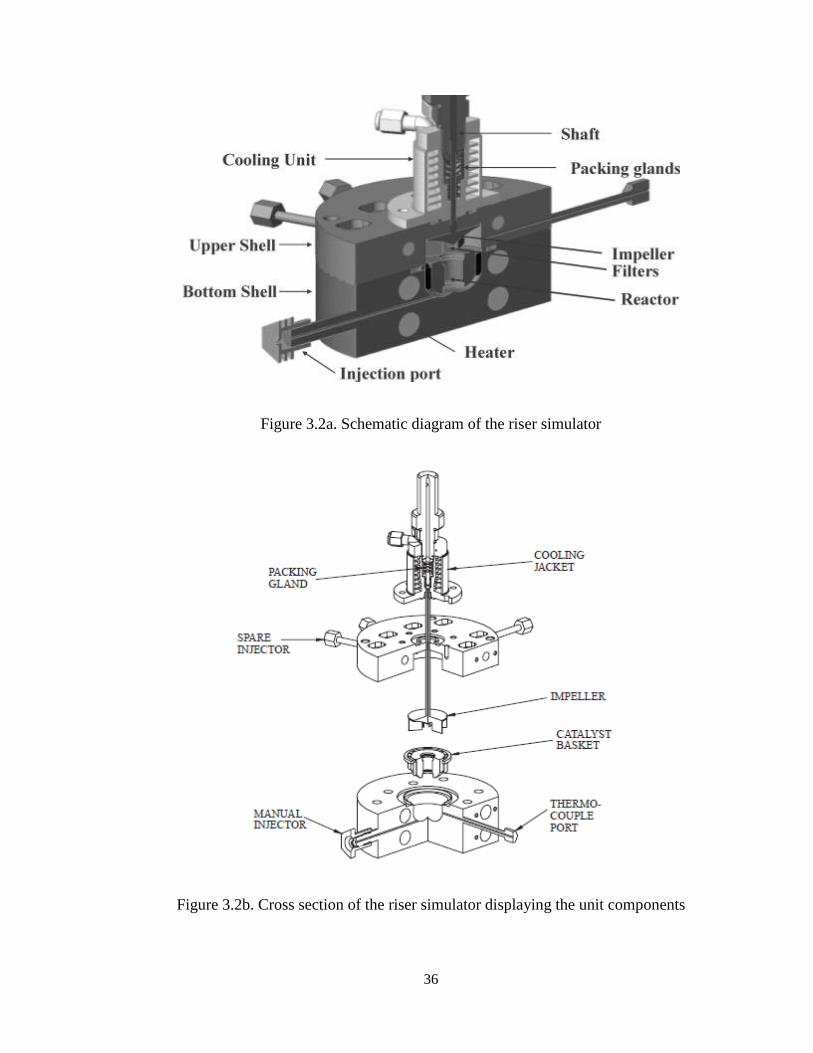
Figure 3.2a. Schematic diagram of the riser simulator
Figure 3.2b. Cross section of the riser simulator displaying the unit components
37
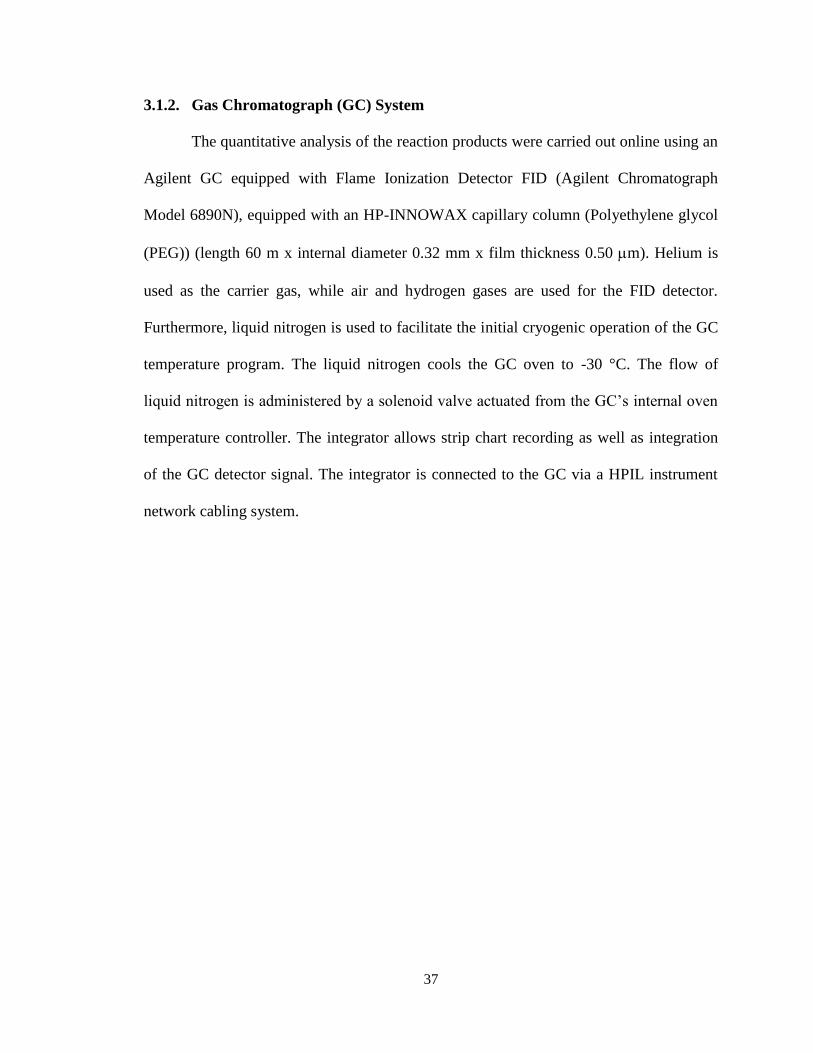
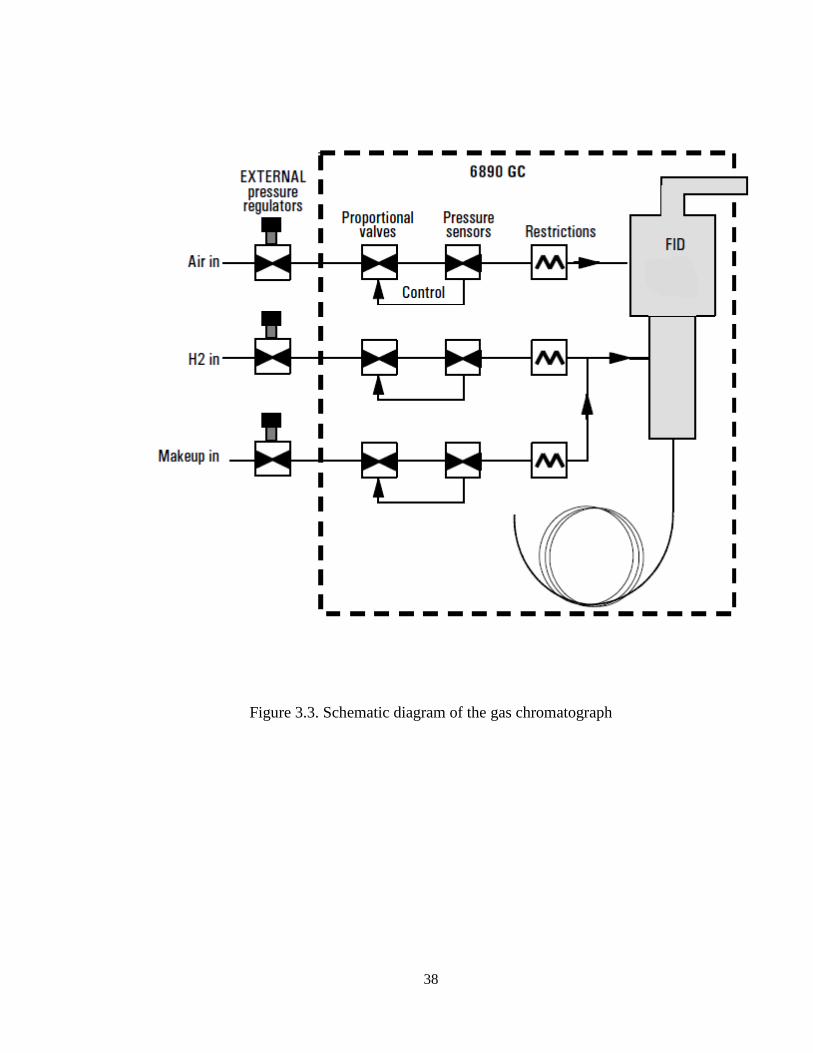
3.1.2. Gas Chromatograph (GC) System
The quantitative analysis of the reaction products were carried out online using an
Agilent GC equipped with Flame Ionization Detector FID (Agilent Chromatograph
Model 6890N), equipped with an HP-INNOWAX capillary column (Polyethylene glycol
(PEG)) (length 60 m x internal diameter 0.32 mm x film thickness 0.50 m). Helium is
used as the carrier gas, while air and hydrogen gases are used for the FID detector.
Furthermore, liquid nitrogen is used to facilitate the initial cryogenic operation of the GC
temperature program. The liquid nitrogen cools the GC oven to -30 °C. The flow of
liquid nitrogen is administered by a solenoid valve actuated from the GC’s internal oven
temperature controller. The integrator allows strip chart recording as well as integration
of the GC detector signal. The integrator is connected to the GC via a HPIL instrument
network cabling system.
38
Figure 3.3. Schematic diagram of the gas chromatograph
39
3.1.3 Coke Analyzer
A carbon analyzer multi EA 2000 (Analytikjena) is used. This multi EA 2000
equipped with CS Module is a specially developed system which permits simultaneous or
separate determination of the total carbon and total sulphur in samples of solids, pastes
and liquids by means of high temperature oxidation in a current of oxygen supplied
directly to the unit. It is based on special high temperature ceramics (HTC) technology
which renders a catalyst superfluous. By combining the finely tuned non-dispersive
infrared gas analysis (NDIR) detection which is selective to CO2/SO2 with the patented
Verweilzeitgekoppelte Integration fur TOC-Analysen (VITA) procedure, which takes
into account the dwelling time, the analysis possible is very precise. The aliquot of the
sample is accurately weighed into the combustion boat and delivered complete into the
hot zone of the furnace. There, pyrolysis and oxidation of the sample occurs at a high
temperature in the stream of oxygen (R + O2→ CO2 + H2O, where R is a substance with
carbon content). The gas produced in the pyrolysis is drawn through a glass tube filled
with a specialist desiccant. This desiccation tube also serves as a particle filter, so that no
water or dust can get into the detection system of the device. An NDIR detector is used to
determine the CO2 content in the carrier gas. Gases whose molecules are composed of
different types of atom possess specific absorption bands in the infrared wavelength
range. The concentration of CO2 is signaled several times per second. An integral over
time is created from the series of signals. The integral is proportional to the concentration
of carbon in the sample analyzed. A calibration function is then used to calculate the
amount of carbon in the sample. The calibrations allows for any changes to flow arising
over time because of such factors as the ageing process, dirt getting into flow regulators,
40
or the desiccants going lumpy, will not automatically necessitate recalibration, which is a
positive factor reducing the frequency of desiccant replacement. A small amount of the
spent catalyst (0.09-0.1 g) is used for the analysis.
3.2. EXPERIMENTAL PROCEDURE
3.2.1. Materials
All the precursors used in the synthesis of the HT quaternary mixed oxides
Mg3Fe0.25Me0.25Al0.5 (Me = Co, Mn and Ni) and iron doped organized mesoporous
alumina catalysts were obtained from Sigma-Aldrich and used as received. The chemical
feedstock (ethylbenzene, 99%) was also supplied by Sigma-Aldrich.
3.2.2. Catalyst Preparation
3.2.2.1. Synthesis of hydrotalcite catalysts
The HT precursors of Mg3Fe0.25Me0.25Al0.5 (Me = Co, Mn and Ni) catalysts were
prepared by co-precipitation of metal nitrates, following the method by Miyata and
Okada [72] after minor modifications. An aqueous solution containing the nitrates of
Mg2+
, Fe3+
, Me2+
(Co2+
, Mn2+
or Ni2+
) and Al3+
(200 ml) was added slowly with vigorous
stirring into an aqueous solution of sodium carbonate (400 ml). The pH of the solution
was adjusted at 10.0 by dropping a 1 M aqueous solution of sodium hydroxide, leading to
a precipitation of heavy slurry. After the solution was aged at 60 °C for 24 h, the solution
was filtrated and the precipitates were washed with de-ionized water (1000 ml), dried in
air at 100 °C for 4 h, and calcined at 550 °C for 12 h using a muffle furnace in a static air
atmosphere. The concentration of Na2+
in the catalysts after the calcination was
confirmed to be less than 10 ppm by atomic absorption.
41
3.2.2.2.Synthesis of mesoporous alumina doped with iron-oxide
Iron doped organized mesoporous alumina was synthesized using aluminium
isopropoxide (98%, Aldrich). Alumina powders were synthesized using the neutral
template approach as described by Yuan et al. [63]. The procedures were modified in
order to accommodate the iron. In a typical synthesis, 1.0 g of Pluronic P123 (Mav = 5-
800, EO20PO70EO20) was dissolved in 10.0 ml of ethanol at ambient temperature. Then
1.5 ml of 67 wt% HNO3 and 2.04 g of aluminium iso-propoxide were added after 2 h into
the above solution with vigorous stirring. The mixture was covered with PE film and let
stir at ambient temperature for 5 h. After solvent evaporation, which was carried out at 40
°C for 72 h, samples were calcined in standing air from 25 to 550 °C (1 °C/min ramping
rate, 5 h hold time). Pure organized mesoporous alumina is noted as meso.Al2O3.
Iron was added to organized mesoporous alumina via two different methods;
direct (one-pot) synthesis and post synthesis. The direct synthesis procedures were
similar to that of pure alumina powder except that the required amount of iron precursor
(iron (III) nitrate hexahydrate, unless otherwise specified) that corresponds to Fe content
of 21 wt% was dissolved with triblock copolymer template. Post synthesis was carried
out using the conventional incipient (wetness) impregnation method. In a typical
preparation, iron (III) nitrate hexahydrate was dissolved in distilled water. Subsequently,
alumina powder was slowly added. The slurry was mixed at ambient temperature for 2 h,
and then water was slowly evaporated while stirring. Samples were then dried at 120 °C
overnight followed by calcinations treatment similar to that of pure alumina powder. Iron
based samples obtained by direct and post synthesis are noted as xFe-meso.Al2O3, and
xFe/meso.Al2O3, respectively (where x is 21 corresponding to Fe content in wt%).
42
3.2.3. Catalyst Characterization
A comprehensive catalyst characterization was done to determine the physico-
chemical properties of the synthesized catalysts. The following characterization
techniques were employed:
i. BET Surface Area and pore size distribution
The textural properties of synthesized samples were characterized by N2
adsorption measurements at 77 K, using Quantachrome Autosorb 1-C adsorption
analyzer. Samples were outgassed at 220 °C under vacuum (10-5
Torr) for 3 h
before N2 physisorption. The BET specific surface areas were determined from
the adsorption data in the relative pressure (P/Po) range from 0.06-0.2, assuming a
value of 0.164 nm2 for the cross-section of the nitrogen molecule. The pore size
distribution (PSD) was calculated from the adsorption branch using the Barrett-
Joyner-Halenda (BJH) method.
ii. Atomic Absorption
The chemical compositions of synthesized HT quaternary mixed oxides of
Mg/Fe/Me/Al (Me = Co, Mn, Ni) and Fe2O3/Al2O3 were determined by atomic
absorption spectroscopy, using the Perkin-Elmer equipment (Model AAnalyst
100).
iii. X-ray Diffraction
XRD was recorded on a Mac Science MX18XHF-SRA powder diffractometer
with monochromatized CuKα radiation (λ = 0.154 nm) at 40 kV and 30 mA. The
diffraction pattern was identified through comparison with those included in the
43
JCPDS (Joint Committee of Powder Diffraction Standards) database and
literatures.
iv. X-ray Photoelectron Spectroscopy
XPS measurements were performed on a Perkin Elmer 1600E spectrometer using
Mg Kα radiation as excitation source. In charge-up correction, the calibration of
binding energy (BE) of the spectra was referenced to the C 1s electron bond
energy corresponding to graphitic carbon at 284.5 eV. In addition, relative
atomic sensitivity factors (ASF) were corrected to determine practically more
accurate chemical compositions on the surface.
v. Fourier Transform Infrared Spectroscopy
Infrared spectroscopy of adsorbed pyridine was used to determine the types of
acid sites present on the alumina at different extents of Fe surface coverage. The
measurements were carried out using a Fourier transform infrared Nicolet
spectrometer (Magna 500 model).
vi. Temperature - Programmed Desorption
Temperature-programmed desorption of NH3 (NH3-TPD) was carried out using
Quantachrome Autosorb 1-C/TCD. Samples were pretreated at 300 °C in a flow
of He (50 ml min-1
) for 3 h. This was followed by the adsorption of ammonia (5
vol.% in He) at 100 °C for 30 min. Samples were then purged in a He stream for 2
h at 100 °C in order to remove loosely bound ammonia (i.e. physisorbed and H-
bonded ammonia). Then, the samples were heated again from 100 to 550 °C at a
heating rate of 10 °C/min in a flow of He (25 ml/min) while monitoring the
evolved ammonia using TCD.
44
3.3. GC calibration
The calibration of the gas chromatograph used in determining the product
composition of the ethylbenzene dehydrogenation reaction was done as explained in
sections 3.3.1 and 3.3.2 below:
3.3.1. Determination of retention time for the different compounds
The retention times of all compounds of interest in this work were determined by
analyzing pure samples of each of the compounds in the GC in turns. Table A3.1
(Appendix) shows the different compounds and their corresponding retention times.
These retention times were used to identify each component of the reaction products.
3.3.2. Correlating GC response and actual weight percentage of each compound
In calibrating the GC, standard samples of different compositions containing
ethylbenzene and the main reaction products (styrene, benzene, toluene) were prepared.
The composition of the prepared samples were carefully chosen to reflect all the possible
product compositions (obtained from preliminary experimental runs) under the different
reaction conditions to be investigated. 0.2µl of the first sample was then injected into the
GC and the GC responses (area %) for each of the components in sample were obtained.
The sample procedure was repeated for all the other samples.
3.4. Catalyst Evaluation
Ethylbenzene dehydrogenation was carried out over the synthesized hydrotalcite
and Fe2O3/Al2O3 catalysts in order to test their catalytic activity. The HT catalysts were
evaluated for the dehydrogenation process at reaction temperatures of 400, 450, 500 and
550 oC while Fe2O3/Al2O3 catalysts are tested at reaction temperatures of 350, 400, 450,
45
500 and 550 oC. For each reaction temperature, all catalysts were tested for reaction times
of 5, 10, 15 and 20 sec. To enhance the reproducibility of the data, experimental runs for
each reaction condition was repeated at least twice.
3.4.1. Testing Procedure
In a typical experiment, the reactor was charged with 0.8g of catalyst previously
crushed and sieved to a particle size of ~ 60 μm diameter. The catalyst/reactant ratio was
5 (weight of catalyst = 0.81 g, weight of reactant injected = 0.162 g). The system is then
sealed and tested for any pressure leaks by monitoring the pressure changes in the
system. Furthermore, the reactor is heated to the desired reaction temperature. The
vacuum box is also heated to around 250oC and evacuated to around 0.5 psi to prevent
any condensation of hydrocarbons inside the box. The heating of the riser simulator is
conducted under continuous flow of inert gases (argon) and the process usually takes few
hours until thermal equilibrium is finally attained. Meanwhile, before the initial
experimental run, the catalyst is activated for 15 minutes at 620oC with air. The
temperature controller is set to the desired reaction temperature likewise the timer is set
to the desired reaction time. At this point the GC is started and set to the desired
conditions.
Once the reactor and the gas chromatograph have reached their desired operating
conditions, 200μl of the feed stock is injected directly into the reactor via a loaded
syringe while the impeller is rotating at a speed of 6000rpm. After the reaction, the four
port valve opens immediately ensuring that the reaction is terminated and the entire
product stream sent online to the gas chromatograph via the pre-heated vacuum box
chamber. The products are then analyzed in the gas chromatograph .After each
46
experimental run, the catalyst is regenerated at conditions similar to initial activation.
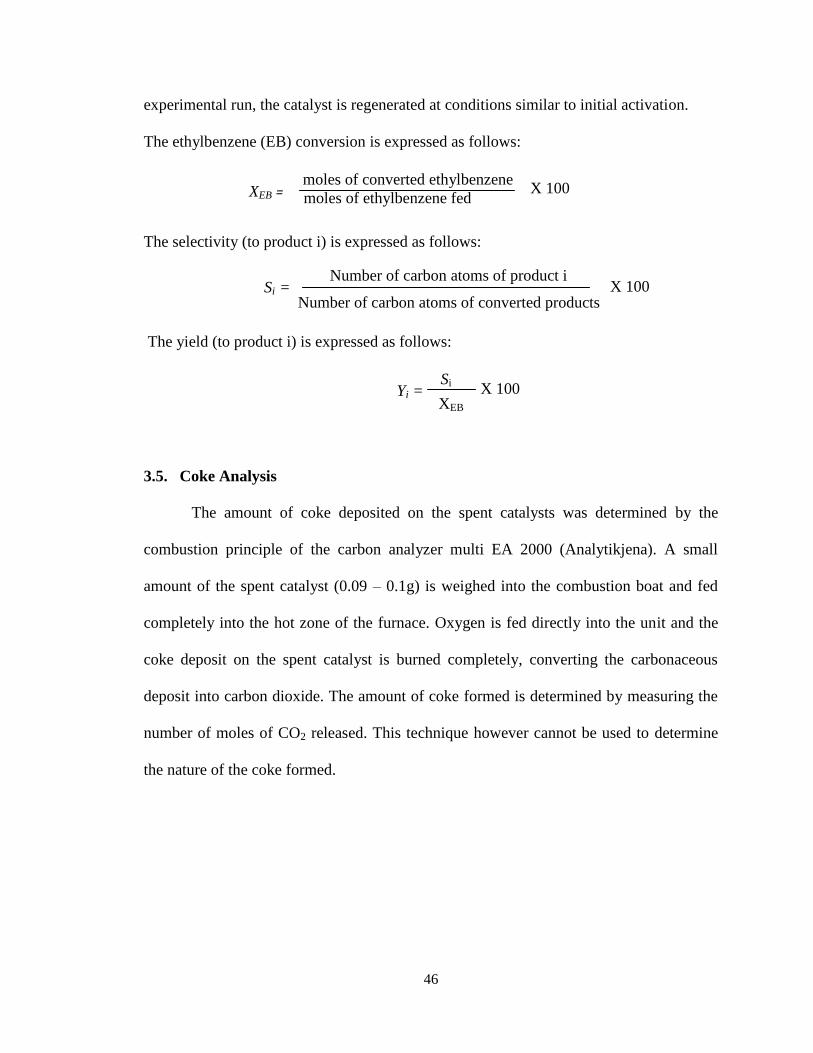
The ethylbenzene (EB) conversion is expressed as follows:
The selectivity (to product i) is expressed as follows:
The yield (to product i) is expressed as follows:
3.5. Coke Analysis
The amount of coke deposited on the spent catalysts was determined by the
combustion principle of the carbon analyzer multi EA 2000 (Analytikjena). A small
amount of the spent catalyst (0.09 – 0.1g) is weighed into the combustion boat and fed
completely into the hot zone of the furnace. Oxygen is fed directly into the unit and the
coke deposit on the spent catalyst is burned completely, converting the carbonaceous
deposit into carbon dioxide. The amount of coke formed is determined by measuring the
number of moles of CO2 released. This technique however cannot be used to determine
the nature of the coke formed.
XEB = moles of converted ethylbenzene
moles of ethylbenzene fed X 100
Si = Number of carbon atoms of product i
Number of carbon atoms of converted products X 100
Yi = Si
XEB X 100
47
CHAPTER 4
4.0 RESULTS AND DISCUSSIONS
4.1 Ethylbenzene dehydrogenation over HT precursors of Mg3Fe0.25Me0.25Al0.5
(Me = Co, Mn and Ni) catalysts.
4.1.1. Physico-chemical properties
4.1.1.1. Chemical composition and textural properties
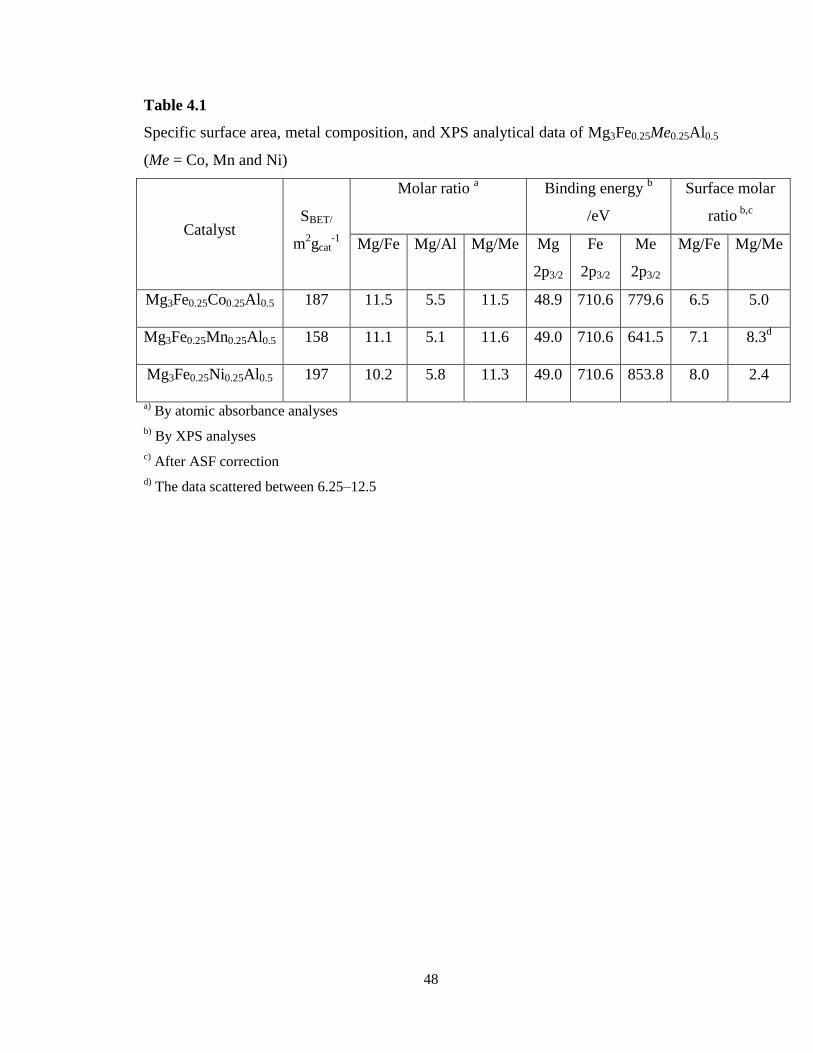
The textural properties along with metal composition of Mg3Fe0.25Me0.25Al0.5 (Me =
Co, Mn and Ni) catalysts after the calcination at 550 °C are shown in Table 4.1. It can be
clearly seen from Table 4.1 that all Mg3Fe0.5Me0.5Al0.5 catalysts exhibit large SBET
between 150 and 200 m2 gcat
-1. This can be mainly attributed to the ability of Mg–Al and
Mg–Fe to form the hydrotalcite structure, resulting in large surface area after the
calcination. The relatively low SBET (158 m2g
-1) of Mg3Fe0.25Mn0.25Al0.5 compared to
other catalysts is probably due to plugging of the pores with segregated bulk manganese
oxide particles. This was suggested by XRD and H2-TPR, which are discussed in the
following paragraphs. It is also worth mentioning that the metal compositions are in
complete agreement with the nominal values. This is due to the formation of hydrotalcite
structure as the precursors during the coprecipitation, which accommodates many metal
cations in the structure. Furthermore, the average pore diameter of hydrotalcites based
samples is in the mesopore region (2-50 nm), as suggested by the pore size distributions
(Figure 4.1A-C).
48
Table 4.1
Specific surface area, metal composition, and XPS analytical data of Mg3Fe0.25Me0.25Al0.5
(Me = Co, Mn and Ni)
Catalyst SBET/
m2gcat
-1
Molar ratio a
Binding energy b
/eV
Surface molar
ratio b,c
Mg/Fe Mg/Al Mg/Me Mg
2p3/2
Fe
2p3/2
Me
2p3/2
Mg/Fe Mg/Me
Mg3Fe0.25Co0.25Al0.5 187 11.5 5.5 11.5 48.9 710.6 779.6 6.5 5.0
Mg3Fe0.25Mn0.25Al0.5 158 11.1 5.1 11.6 49.0 710.6 641.5 7.1 8.3d
Mg3Fe0.25Ni0.25Al0.5 197 10.2 5.8 11.3 49.0 710.6 853.8 8.0 2.4
a) By atomic absorbance analyses
b) By XPS analyses
c) After ASF correction
d) The data scattered between 6.25–12.5
49
Figure 4.1. Pore size distribution of Mg3Fe0.25Me0.25Al0.5, where Me = Co (A), Mn (B),
and Ni (C)
0 10 20 30 40 50 60 70 80 90 100
dv/d
D (
cm3/g
-nm
)
Pore Diameter (nm)
A
C
B
Mesopores
50
4.1.1.2. Surface analysis of the catalysts
The XPS analytical results of Mg3Fe0.25Me0.25Al0.5 (Me = Co, Mn and Ni) after
calcination at 550 °C are summarized in Table 4.1. The surface molar ratios of Mg/Fe
and Mg/Me calculated from the XPS results exhibited lower values than the bulk molar
ratios obtained by AA analyses (Table 4.1). This indicates that both Fe and second
component metal (Me) species are localized in the surface layer of the catalyst particles.
On all Mg3Fe0.25Me0.25Al0.5 catalysts except Mg3Fe0.25Ni0.25Al0.5, Fe species showed
similar surface enriched localization, i.e., almost 1.4 times higher concentration in the
surface layer than the bulk phase. Surface enrichment of Fe was not so significant for
Mg3Fe0.25Ni0.25Al0.5. Contrarily, some of the second component metals exhibited far
enriched distribution in the surface layer, i.e., the highest concentration in the surface
layer was obtained by Ni (5 times), followed by Co (2.2 times) and Mn (1.3 times). The
scattered experimental values for Mn clearly suggest that Mn dispersion on the catalyst
was not homogeneous.
4.1.1.3. Bulk phase identification
XRD patterns of Mg3Fe0.25Me0.25Al0.5 (Me = Co, Mn and Ni) catalysts after drying
are shown in Figure 4.2a. It can be noted that all Mg3Fe0.25Me0.25Al0.5 showed typical
hydrotalcite reflections, indicating that the second metal components were incorporated
into the hydrotalcite structure except Mg3Fe0.25Mn0.25Al0.5. Mn2+
possesses a larger ionic
radii of 0.80 Å than the other Me2+
[73] and requires the highest pH for its complete
precipitation as hydroxides among the Me cations used [40]. After the calcination at 550
°C (Figure 4.2b), all samples showed the periclase reflections together with weak spinel
reflections. This indicates that iron was incorporated in the periclase and the spinel.
51
Figure 4.2. XRD patterns of Mg3Fe0.25Me0.25Al0.5 (Me = Co (a), Mn (b) and Ni (c)) after
A) drying and B) calcination at 550 °C (■: Hydrotalcites; ♦: unknown and ▼: periclase)
52
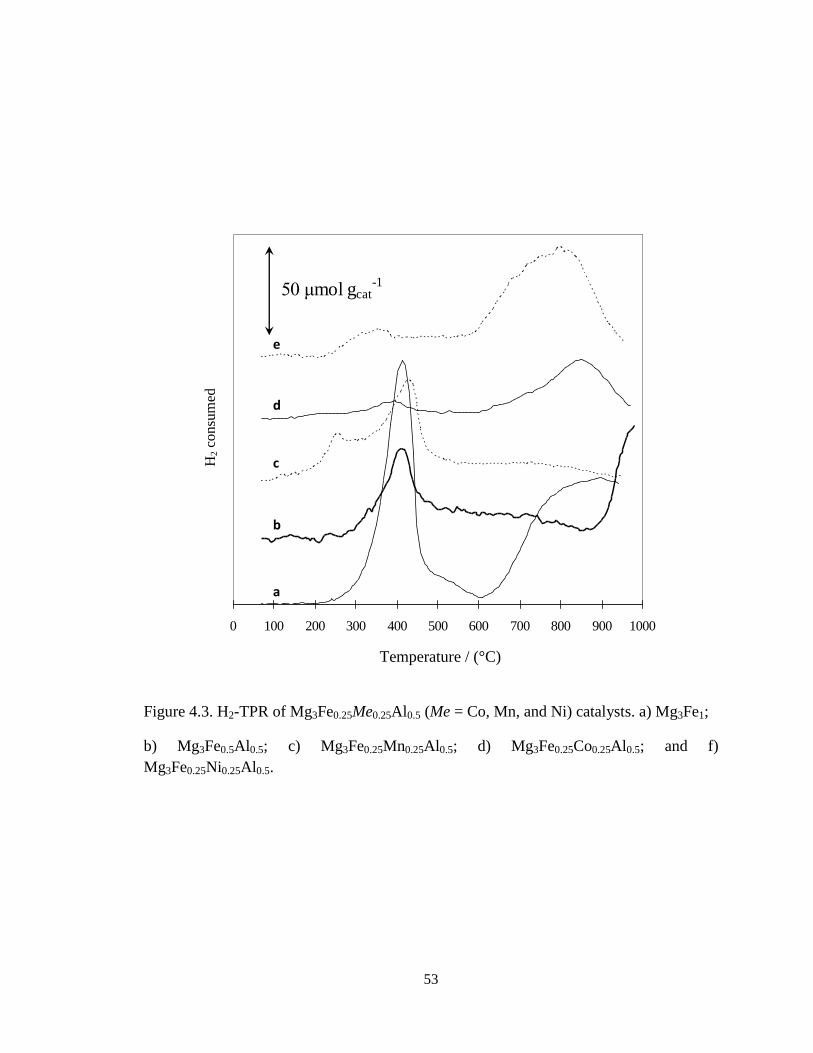
4.1.1.4. Reducibility of the active specie on the catalysts
H2-TPR data of Mg3Fe0.25Me0.25Al0.5 (Me = Mn, Ni, and Co) are shown in Figure
4.3. Mg3Fe1 showed a reduction peak at 418 °C and a broad peak above 650 °C (Figure
4.3a). The first peak is attributed to the reduction of spinel (MgFe3+
2O4) to periclase
(Mg1-xFe2+
xO) and the latter is to the reduction of Mg1-xFe2+
xO to Fe0, as reported by
Shen et al. [74], Mg3Fe0.25Ni0.25Al0.5 showed a weak reduction peak at 353 °C and broad
reduction peak above 800 °C. The latter is attributed to the reduction of Ni2+
in the
Mg(Ni)O periclase [75]. Therefore, the one observed at 353 °C can be attributed the
reduction of Fe3+
species. Mg3Fe0.25Mn0.25Al0.5 exhibited rather strong two reduction
peaks at 257 °C and 428 °C (Figure 4.3c). This catalyst exhibited unknown reflections
together with those of hydrotalcite after drying (Figure 4.2b), suggesting that manganese
oxides were separated from periclase after calcination. It was reported that a mixed oxide
of Mg0.2Mn1.8Al1 composition derived from hydrotalcite and cacined at 500 °C showed
two reduction peaks at 333 °C and 460 °C [76]. This also suggests that manganese oxides
were separated from periclase structure in Mg3Fe0.25Mn0.25Al0.5 and showed the reduction
peaks at 257 °C and 428 °C.
53
Figure 4.3. H2-TPR of Mg3Fe0.25Me0.25Al0.5 (Me = Co, Mn, and Ni) catalysts. a) Mg3Fe1;
b) Mg3Fe0.5Al0.5; c) Mg3Fe0.25Mn0.25Al0.5; d) Mg3Fe0.25Co0.25Al0.5; and f)
Mg3Fe0.25Ni0.25Al0.5.
0 100 200 300 400 500 600 700 800 900 1000
50 μmol gcat-1
Temperature / (°C)
H2 c
onsu
med
a
b
c
d
e
54
4.1.2. Catalytic Activity
The product distribution of the ethylbenzene dehydrogenation reaction over
Mg3Fe0.25Me0.25Al0.5 (Me = Co, Mn and Ni) catalysts at different reaction temperatures
and reaction times are presented in Tables 4.2–4.4. The experimental results showed
styrene to be the main reaction product, although small amounts of benzene were
obtained as by product. Traces of toluene, gaseous hydrocarbons, diethylbenzene (DEB)
were also observed; however the yields of these products were neglected in subsequent
analysis. In all the catalysts investigated, EB conversion increased with both reaction
temperature and time and maximum conversion of approximately 15.5, 19.7, 18.0% was
attained at 20 s of time on stream and temperature of 550 °C for Mg3Fe0.25Co0.25Al0.5,
Mg3Fe0.25Mn0.25Al0.5, and Mg3Fe0.25Ni0.25Al0.5 catalysts respectively as shown in Figure
4.4(A-C). The mixed oxides catalyst consisting of Mn2+
gave the highest activity
regardless of its low surface area. This may be accounted for by the isolation of
manganese oxides from the periclase structure, as suggested by XRD, XPS and H2-TPR.
Therefore, the inhomogeneous dispersion of Mn2+
on the catalyst (i.e. presence of
segregated (bulk) Mn oxide) is assumed to increase the active sites of the catalyst. One
may suggest that the segregated manganese oxide further contributes to the basicity of
MgO which has been reported to initiate H+ abstraction
[48]. The investigation of iron
oxide catalysts containing various transition metal oxides by Hirano [77] also showed that
increase in basicity due to reduction in electronegativity of the promoter gave rise to the
dehydrogenation activity of the catalyst. As a control, a commercial catalyst was also
tested. It showed a low activity as shown in Figure 4.5 which can be attributed to the
absence of steam.
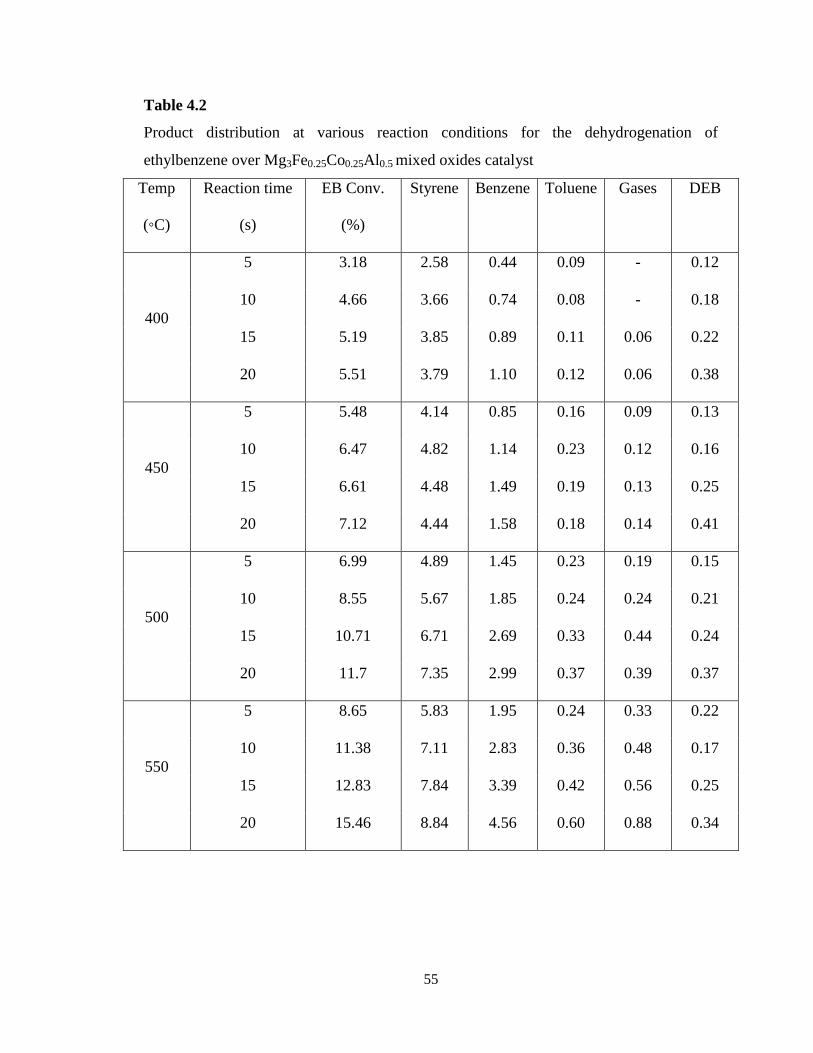
55
Table 4.2
Product distribution at various reaction conditions for the dehydrogenation of
ethylbenzene over Mg3Fe0.25Co0.25Al0.5 mixed oxides catalyst
Temp
(◦C)
Reaction time
(s)
EB Conv.
(%)
Styrene Benzene Toluene
Gases DEB
400
5 3.18 2.58 0.44 0.09 - 0.12
10 4.66 3.66 0.74 0.08 - 0.18
15 5.19 3.85 0.89 0.11 0.06 0.22
20 5.51 3.79 1.10 0.12 0.06 0.38
450
5 5.48 4.14 0.85 0.16 0.09 0.13
10 6.47 4.82 1.14 0.23 0.12 0.16
15 6.61 4.48 1.49 0.19 0.13 0.25
20 7.12 4.44 1.58 0.18 0.14 0.41
500
5 6.99 4.89 1.45 0.23 0.19 0.15
10 8.55 5.67 1.85 0.24 0.24 0.21
15 10.71 6.71 2.69 0.33 0.44 0.24
20 11.7 7.35 2.99 0.37 0.39 0.37
550
5 8.65 5.83 1.95 0.24 0.33 0.22
10 11.38 7.11 2.83 0.36 0.48 0.17
15 12.83 7.84 3.39 0.42 0.56 0.25
20 15.46 8.84 4.56 0.60 0.88 0.34
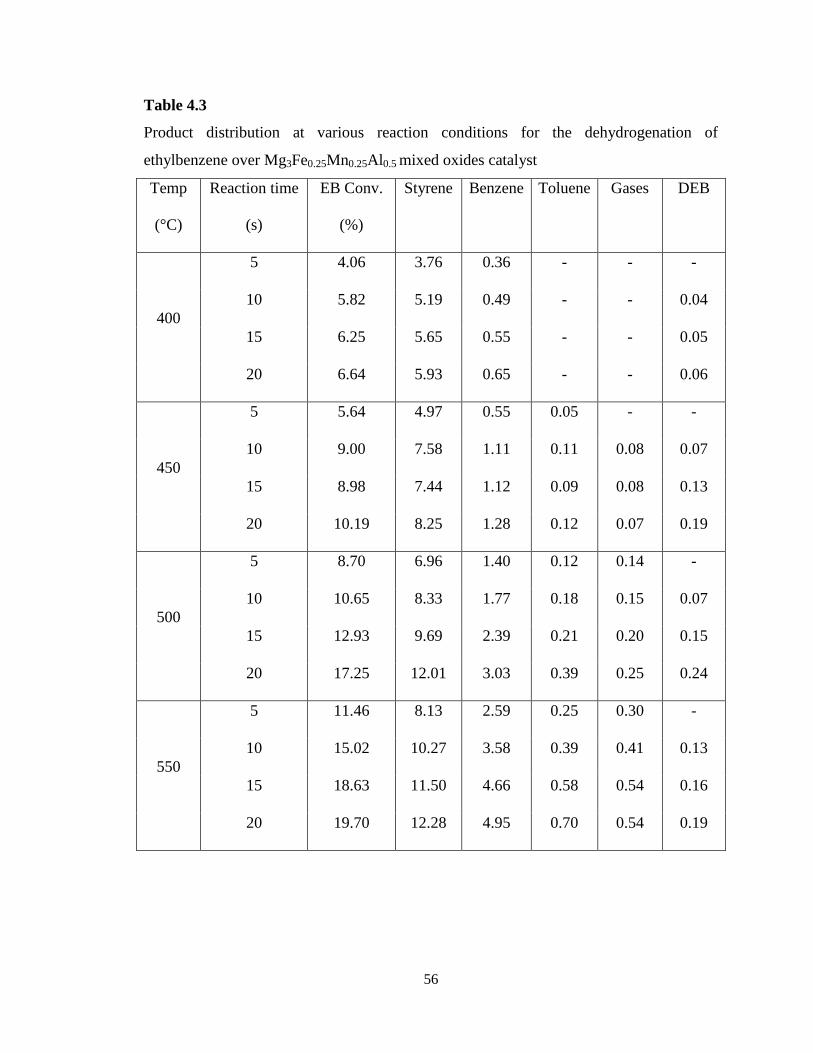
56
Table 4.3
Product distribution at various reaction conditions for the dehydrogenation of
ethylbenzene over Mg3Fe0.25Mn0.25Al0.5 mixed oxides catalyst
Temp
(°C)
Reaction time
(s)
EB Conv.
(%)
Styrene Benzene Toluene Gases DEB
400
5 4.06 3.76 0.36 - - -
10 5.82 5.19 0.49 - - 0.04
15 6.25 5.65 0.55 - - 0.05
20 6.64 5.93 0.65 - - 0.06
450
5 5.64 4.97 0.55 0.05 - -
10 9.00 7.58 1.11 0.11 0.08 0.07
15 8.98 7.44 1.12 0.09 0.08 0.13
20 10.19 8.25 1.28 0.12 0.07 0.19
500
5 8.70 6.96 1.40 0.12 0.14 -
10 10.65 8.33 1.77 0.18 0.15 0.07
15 12.93 9.69 2.39 0.21 0.20 0.15
20 17.25 12.01 3.03 0.39 0.25 0.24
550
5 11.46 8.13 2.59 0.25 0.30 -
10 15.02 10.27 3.58 0.39 0.41 0.13
15 18.63 11.50 4.66 0.58 0.54 0.16
20 19.70 12.28 4.95 0.70 0.54 0.19
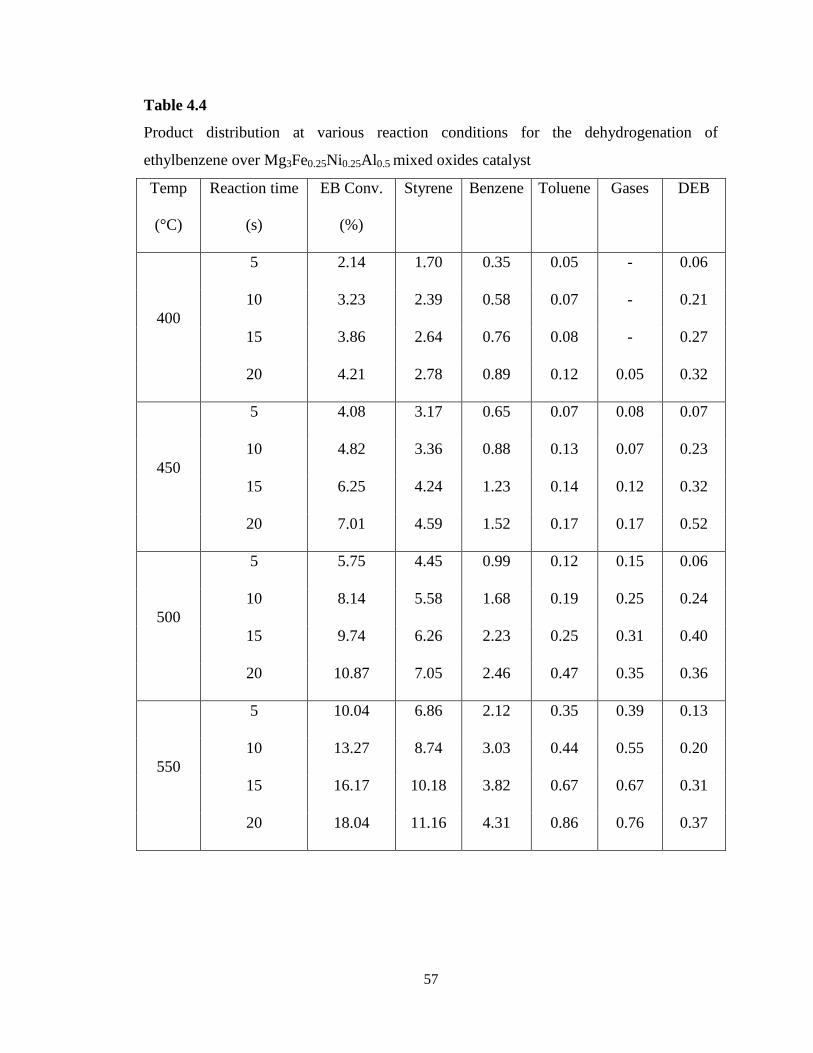
57
Table 4.4
Product distribution at various reaction conditions for the dehydrogenation of
ethylbenzene over Mg3Fe0.25Ni0.25Al0.5 mixed oxides catalyst
Temp
(°C)
Reaction time
(s)
EB Conv.
(%)
Styrene Benzene Toluene Gases DEB
400
5 2.14 1.70 0.35 0.05 - 0.06
10 3.23 2.39 0.58 0.07 - 0.21
15 3.86 2.64 0.76 0.08 - 0.27
20 4.21 2.78 0.89 0.12 0.05 0.32
450
5 4.08 3.17 0.65 0.07 0.08 0.07
10 4.82 3.36 0.88 0.13 0.07 0.23
15 6.25 4.24 1.23 0.14 0.12 0.32
20 7.01 4.59 1.52 0.17 0.17 0.52
500
5 5.75 4.45 0.99 0.12 0.15 0.06
10 8.14 5.58 1.68 0.19 0.25 0.24
15 9.74 6.26 2.23 0.25 0.31 0.40
20 10.87 7.05 2.46 0.47 0.35 0.36
550
5 10.04 6.86 2.12 0.35 0.39 0.13
10 13.27 8.74 3.03 0.44 0.55 0.20
15 16.17 10.18 3.82 0.67 0.67 0.31
20 18.04 11.16 4.31 0.86 0.76 0.37
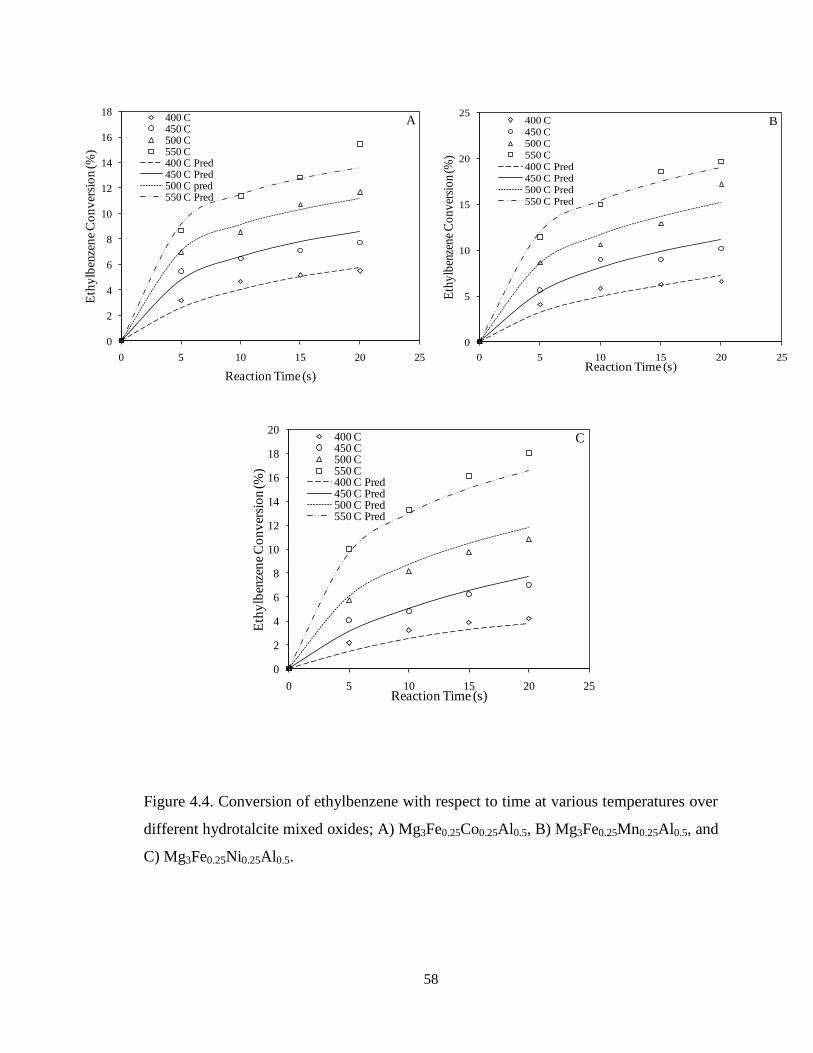
58
Figure 4.4. Conversion of ethylbenzene with respect to time at various temperatures over
different hydrotalcite mixed oxides; A) Mg3Fe0.25Co0.25Al0.5, B) Mg3Fe0.25Mn0.25Al0.5, and
C) Mg3Fe0.25Ni0.25Al0.5.
0
5
10
15
20
25
0 5 10 15 20 25
Eth
ylb
enze
ne
Co
nv
ersi
on
(%)
Reaction Time (s)
400 C450 C
500 C550 C
400 C Pred
450 C Pred500 C Pred
550 C Pred
B
0
2
4
6
8
10
12
14
16
18
0 5 10 15 20 25
Eth
ylb
enze
ne
Co
nv
ersi
on (%
)
Reaction Time (s)
400 C450 C500 C550 C400 C Pred450 C Pred500 C pred550 C Pred
A
0
2
4
6
8
10
12
14
16
18
20
0 5 10 15 20 25
Eth
ylb
enze
ne
Co
nv
ersi
on (%
)
Reaction Time (s)
400 C450 C500 C550 C400 C Pred450 C Pred500 C Pred550 C Pred
C
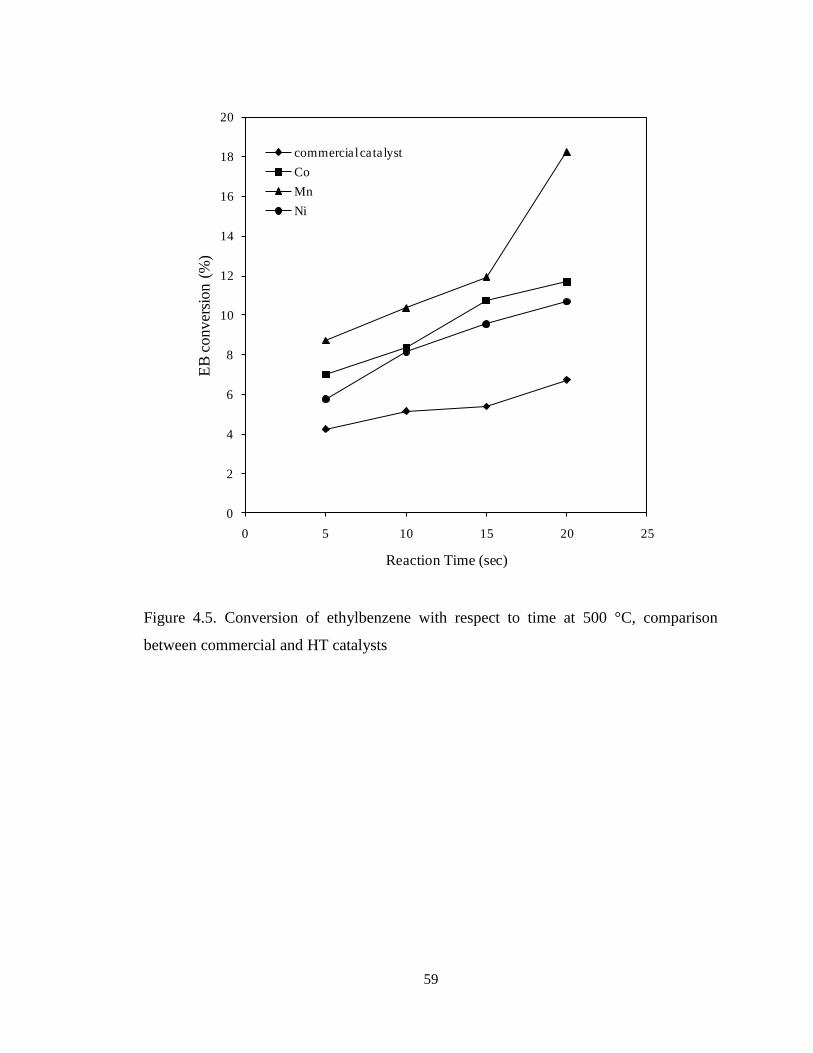
59
Figure 4.5. Conversion of ethylbenzene with respect to time at 500 °C, comparison
between commercial and HT catalysts
0
2
4
6
8
10
12
14
16
18
20
0 5 10 15 20 25
EB
conv
ersi
on (
%)
Reaction Time (sec)
commercial catalyst
Co
Mn
Ni
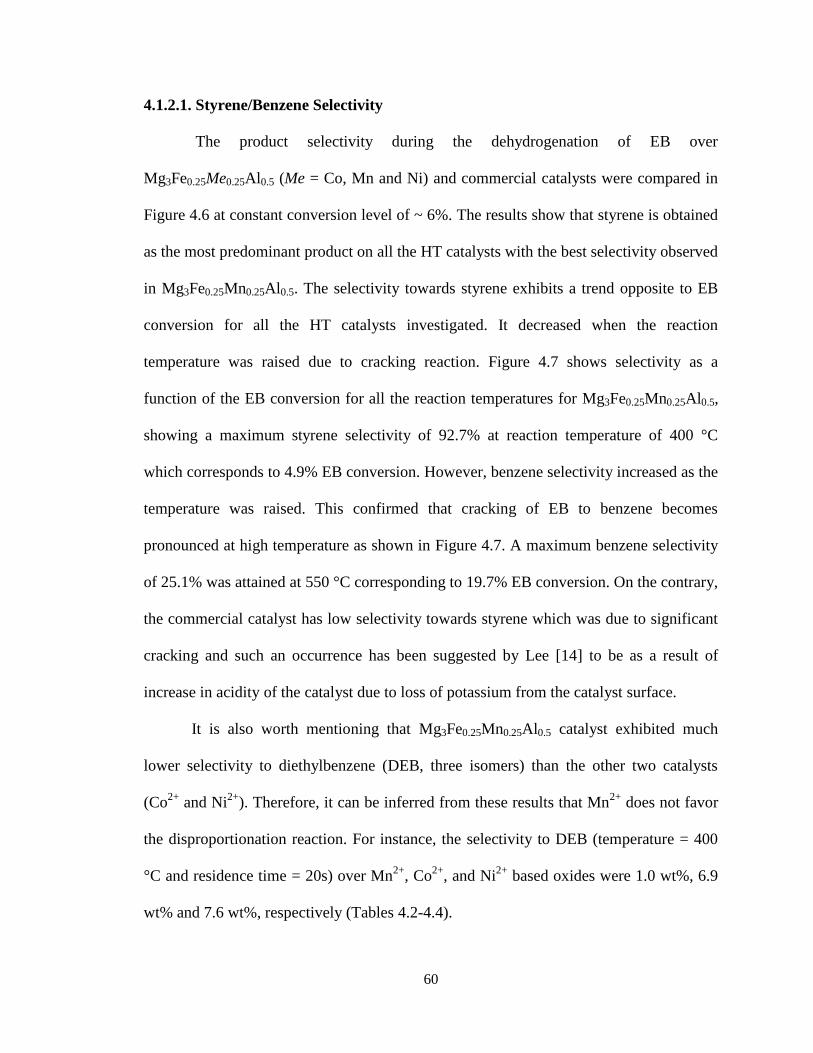
60
4.1.2.1. Styrene/Benzene Selectivity
The product selectivity during the dehydrogenation of EB over
Mg3Fe0.25Me0.25Al0.5 (Me = Co, Mn and Ni) and commercial catalysts were compared in
Figure 4.6 at constant conversion level of ~ 6%. The results show that styrene is obtained
as the most predominant product on all the HT catalysts with the best selectivity observed
in Mg3Fe0.25Mn0.25Al0.5. The selectivity towards styrene exhibits a trend opposite to EB
conversion for all the HT catalysts investigated. It decreased when the reaction
temperature was raised due to cracking reaction. Figure 4.7 shows selectivity as a
function of the EB conversion for all the reaction temperatures for Mg3Fe0.25Mn0.25Al0.5,
showing a maximum styrene selectivity of 92.7% at reaction temperature of 400 °C
which corresponds to 4.9% EB conversion. However, benzene selectivity increased as the
temperature was raised. This confirmed that cracking of EB to benzene becomes
pronounced at high temperature as shown in Figure 4.7. A maximum benzene selectivity
of 25.1% was attained at 550 °C corresponding to 19.7% EB conversion. On the contrary,
the commercial catalyst has low selectivity towards styrene which was due to significant
cracking and such an occurrence has been suggested by Lee [14] to be as a result of
increase in acidity of the catalyst due to loss of potassium from the catalyst surface.
It is also worth mentioning that Mg3Fe0.25Mn0.25Al0.5 catalyst exhibited much
lower selectivity to diethylbenzene (DEB, three isomers) than the other two catalysts
(Co2+
and Ni2+
). Therefore, it can be inferred from these results that Mn2+
does not favor
the disproportionation reaction. For instance, the selectivity to DEB (temperature = 400
°C and residence time = 20s) over Mn2+
, Co2+
, and Ni2+
based oxides were 1.0 wt%, 6.9
wt% and 7.6 wt%, respectively (Tables 4.2-4.4).
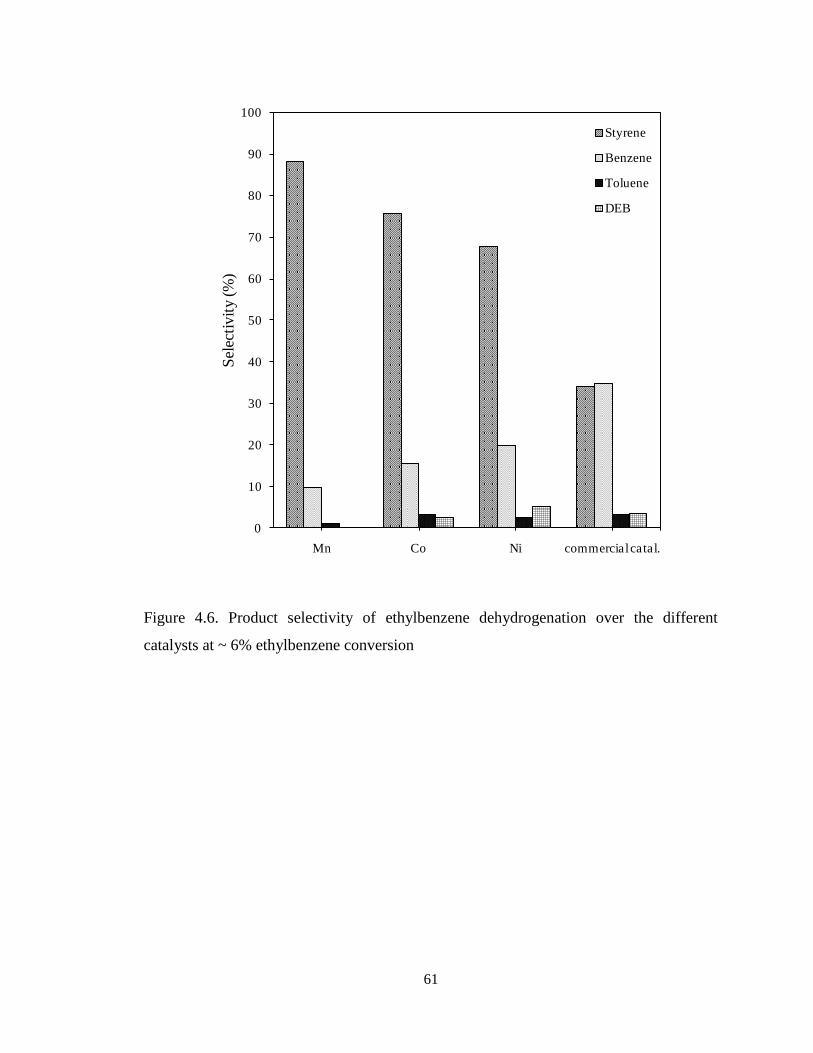
61
Figure 4.6. Product selectivity of ethylbenzene dehydrogenation over the different
catalysts at ~ 6% ethylbenzene conversion
0
10
20
30
40
50
60
70
80
90
100
Mn Co Ni commercial catal.
Sel
ecti
vit
y (%
)
Styrene
Benzene
Toluene
DEB
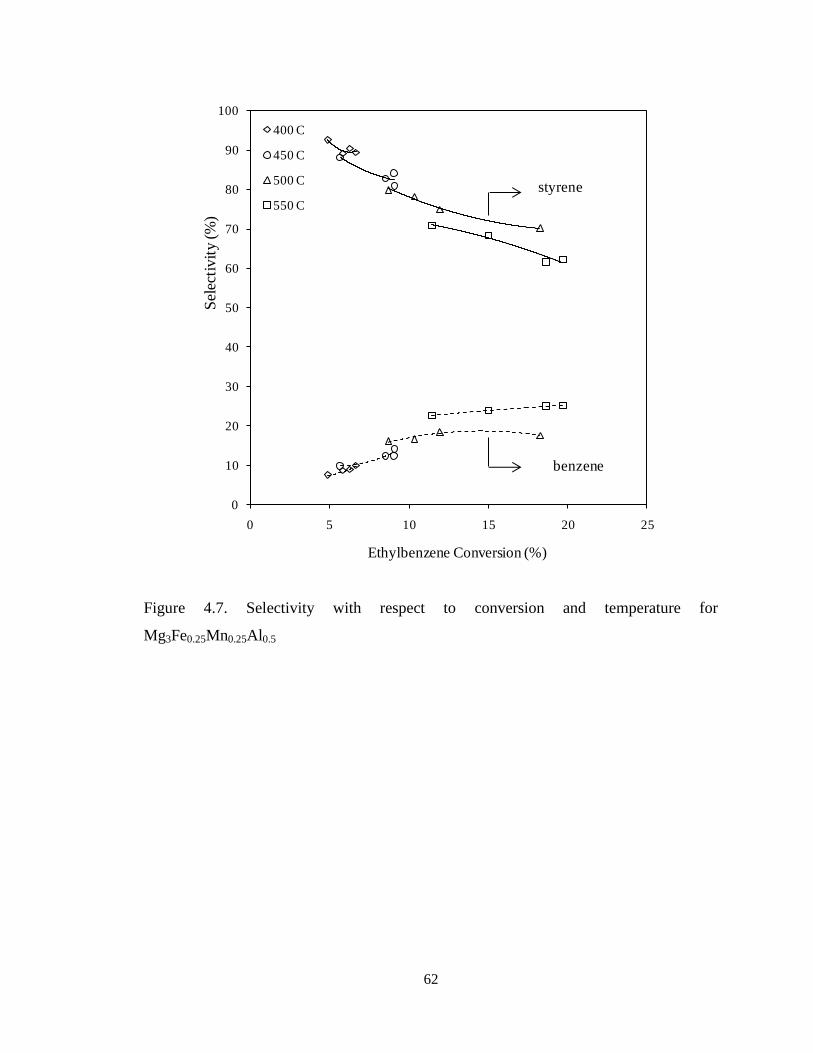
62
Figure 4.7. Selectivity with respect to conversion and temperature for
Mg3Fe0.25Mn0.25Al0.5
0
10
20
30
40
50
60
70
80
90
100
0 5 10 15 20 25
Sel
ecti
vit
y (%
)
Ethylbenzene Conversion (%)
400 C
450 C
500 C
550 C
styrene
benzene
63
4.1.2.2. Styrene/Benzene Yield
The yield of styrene was found to increase with both temperature and time, in a
similar manner with EB conversion. Maximum styrene yield of approximately 8.8, 12.3,
and 11.2% for Mg3Fe0.25Co0.25Al0.5, Mg3Fe0.25Mn0.25Al0.5 and Mg3Fe0.25Ni0.25Al0.5
catalysts respectively were attained at reaction temperature of 550 °C and 20 s time on
stream. Mg3Fe0.25Mn0.25Al0.5 gave the maximum styrene yield, and its variation with
temperature is shown in Figure 4.8A. Similarly, benzene yield was equally increasing
with both temperature and time with a maximum of approximately 4.6, 4.9, and 4.3% for
Mg3Fe0.25Co0.25Al0.5, Mg3Fe0.25Mn0.25Al0.5, and Mg3Fe0.25Ni0.25Al0.5 catalysts respectively
at 550 °C for reaction time of 20 s. Figure 4.8B shows the variation of benzene yield with
temperature for Mg3Fe0.25Mn0.25Al0.5. It can thus be concluded that for longer reaction
time, EB undergoes both dehydrogenation and dealkylation reactions to give styrene and
benzene respectively. It can also be seen from Tables 4.2-4.4 that both the yield of DEB
(disproportionation product) and toluene (cracking product) increased with temperature.
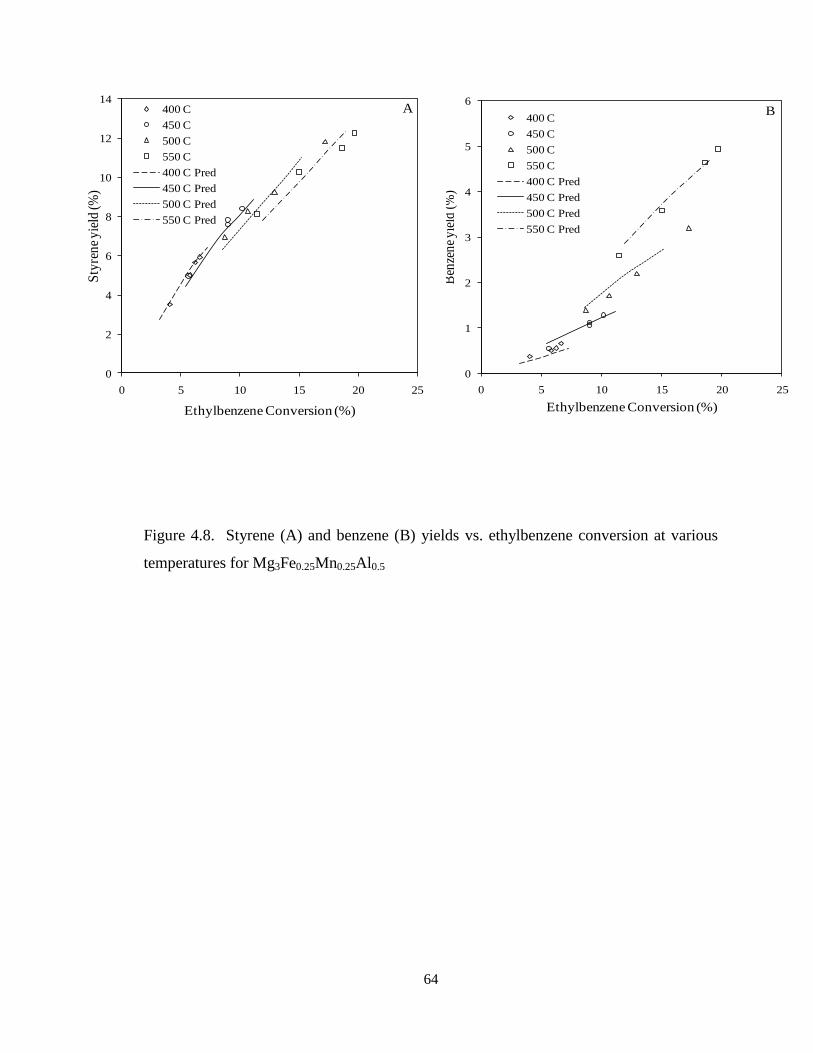
64
Figure 4.8. Styrene (A) and benzene (B) yields vs. ethylbenzene conversion at various
temperatures for Mg3Fe0.25Mn0.25Al0.5
0
1
2
3
4
5
6
0 5 10 15 20 25
Ben
zen
e y
ield
(%
)
Ethylbenzene Conversion (%)
400 C
450 C
500 C
550 C
400 C Pred
450 C Pred
500 C Pred
550 C Pred
B
0
2
4
6
8
10
12
14
0 5 10 15 20 25
Sty
ren
e y
ield
(%)
Ethylbenzene Conversion (%)
400 C
450 C
500 C
550 C
400 C Pred
450 C Pred
500 C Pred
550 C Pred
A
65
4.1.3. Coke Content Measurement
Table 4.5 shows the amount of coke deposited for the catalysts investigated at 550
°C. The data revealed low coke yield, and the ratio of coke weight percent to percent
conversion is small. Similarly, coking on the commercial catalyst was low. This implies
that dehydrogenation of ethylbenzene over the catalysts is not accompanied by
substantial coke deposition. It can thus be inferred that loss of activity of this commercial
catalyst in the absence of steam was not due to coking but as a result of solid state
transformation, though the exact deactivation mechanism was not studied.
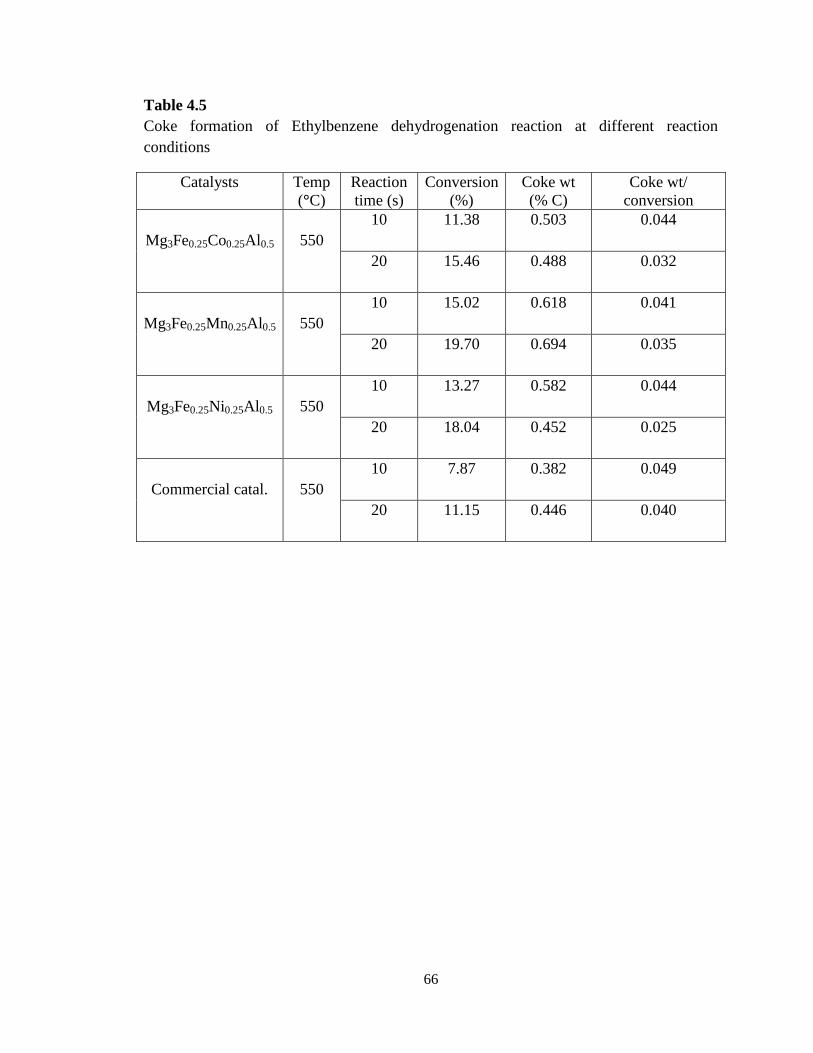
66
Table 4.5
Coke formation of Ethylbenzene dehydrogenation reaction at different reaction
conditions
Catalysts Temp
(°C)
Reaction
time (s)
Conversion
(%)
Coke wt
(% C)
Coke wt/
conversion
Mg3Fe0.25Co0.25Al0.5 550
10 11.38 0.503 0.044
20 15.46 0.488 0.032
Mg3Fe0.25Mn0.25Al0.5 550
10 15.02 0.618 0.041
20 19.70 0.694 0.035
Mg3Fe0.25Ni0.25Al0.5 550
10 13.27 0.582 0.044
20 18.04 0.452 0.025
Commercial catal. 550
10 7.87 0.382 0.049
20 11.15 0.446 0.040
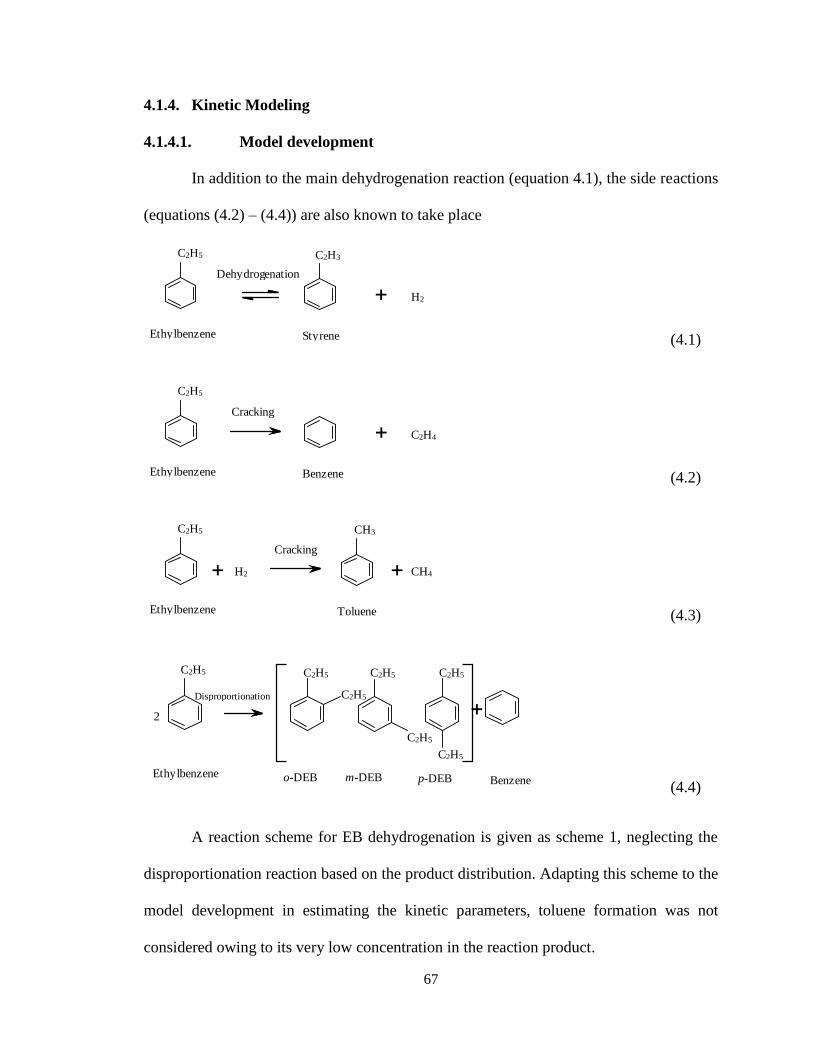
67
4.1.4. Kinetic Modeling
4.1.4.1. Model development
In addition to the main dehydrogenation reaction (equation 4.1), the side reactions
(equations (4.2) – (4.4)) are also known to take place
C2H5
Dehydrogenation
C2H3
H2
Ethylbenzene Styrene (4.1)
C2H5
Cracking
C2H4
Ethylbenzene Benzene (4.2)
C2H5
Cracking
CH4
CH3
H2
Ethylbenzene Toluene (4.3)
Disproportionation
C2H5
C2H5
C2H5
C2H5
m-DEB p-DEBo-DEB
C2H5
C2H5
2
C2H5
EthylbenzeneBenzene
(4.4)
A reaction scheme for EB dehydrogenation is given as scheme 1, neglecting the
disproportionation reaction based on the product distribution. Adapting this scheme to the
model development in estimating the kinetic parameters, toluene formation was not
considered owing to its very low concentration in the reaction product.
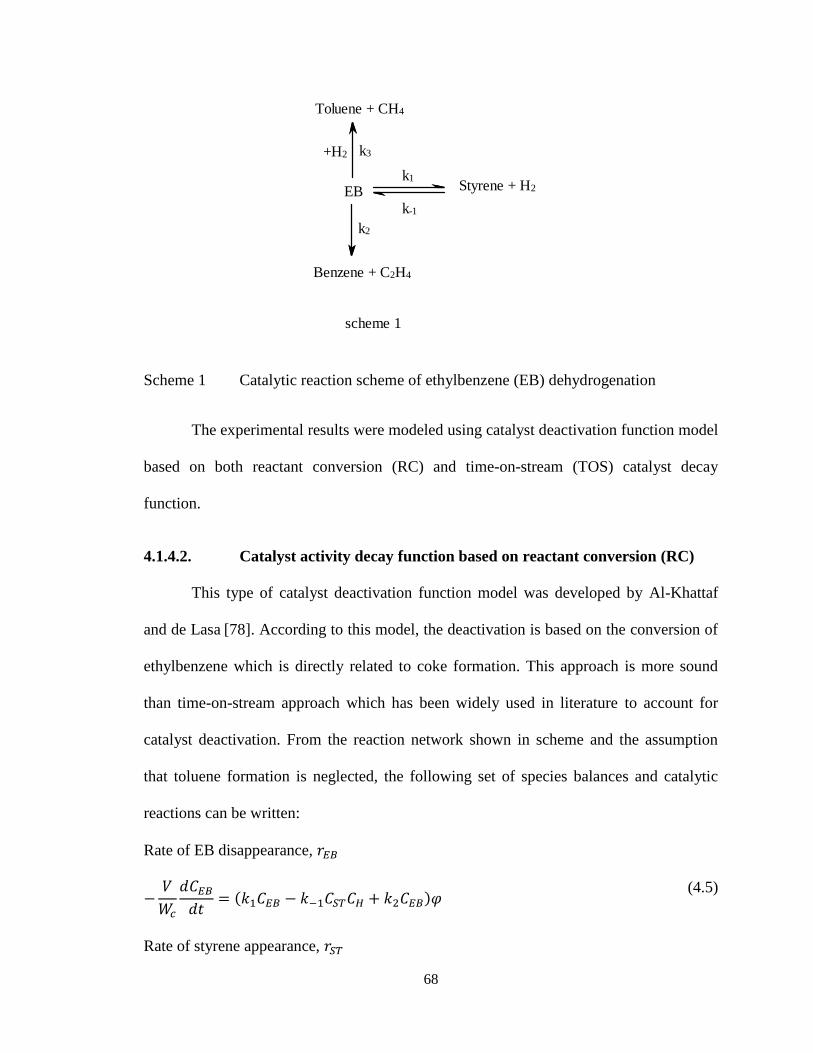
68
Toluene + CH4
+H2 k3
scheme 1
EB
Benzene + C2H4
k1
k-1
k2
Styrene + H2
Scheme 1 Catalytic reaction scheme of ethylbenzene (EB) dehydrogenation
The experimental results were modeled using catalyst deactivation function model
based on both reactant conversion (RC) and time-on-stream (TOS) catalyst decay
function.
4.1.4.2. Catalyst activity decay function based on reactant conversion (RC)
This type of catalyst deactivation function model was developed by Al-Khattaf
and de Lasa [78]. According to this model, the deactivation is based on the conversion of
ethylbenzene which is directly related to coke formation. This approach is more sound
than time-on-stream approach which has been widely used in literature to account for
catalyst deactivation. From the reaction network shown in scheme and the assumption
that toluene formation is neglected, the following set of species balances and catalytic
reactions can be written:
Rate of EB disappearance,
(4.5)
Rate of styrene appearance,
69
(4.6)
Rate of formation of benzene,
(4.7)
where is molar concentration of each of the species in the riser simulator, is the
volume of the riser (45 cm3), is the mass of the catalyst (0.81 g-cat), is time (in
seconds), is the rate constant (cm3/(g-cat·s)), and , the catalyst decay function, which
accounts for the loss of catalytic activity as a result of deactivation due to coking. For the
reactant conversion model, the catalyst deactivation function is given as:
(4.8)
where is catalyst deactivation constant
By definition, the molar concentration of each species can be written in terms of its
mass fraction , which are the measurable variables from our chromatographic analysis,
by the following relation:
(4.9)
where is the weight of feedstock injected into the reactor, is the molecular
weights of the individual species and is the volume of the riser simulator.
To ensure thermodynamic consistency at equilibrium, the temperature dependent
equilibrium constant for the reversible reaction was found to be:
(4.10)
which has been calculated from literature as [32]:
70
(4.11)
Substituting Eq. (4–6) into Eqs (1–3) and simplifying gives the following:
(4.12)
(4.13)
(4.14)
, , , and are lumped constants given as:
The activation energy, , for the dehydrogenation reaction is related to temperature
dependent rate constants according to the Arrhenius equation given below:
(4.15)
where is called the pre-exponential factor. Agarwal and Brisk have suggested re-
parameterization of equation above during kinetic modeling to help reduce parameter
interaction. Therefore, constants were re-parameterized by centering the values around
which is the value of the rate constant for reaction i at the average temperature of
the investigated temperatures [79]:
71
(4.16)
Since the experimental runs were done at 400, 450, 500 and 550 °C, To was calculated to
be 475 °C.
The above reaction model equations were derived based on the following assumptions:
1. Catalyst deactivation was assumed to be a function of reactant conversion. And, a
single deactivation function was defined for all the reactions.
2. The model assumes only catalytic reactions and neglects thermal conversion.
3. The reactor operates under isothermal conditions, justified by the negligible
temperature change observed during the reaction.
4. Toluene yield is negligible.
5. The model also neglects the disproportionation reaction.
72
4.1.4.3.Catalyst activity decay function based on time-on-stream (TOS)
The catalyst activity decay model based on time-on-stream was initially suggested
by Voorhies [80]. Since then, this model has been used extensively throughout the FCC
literature. This model is empirically based given it does not incorporate a mechanistic
description of catalyst deactivation. As a result, extrapolations of activity decay with this
model are quite uncertain.
Modeling of the catalytic reactions based on TOS follows the same procedure as
RC. In this case catalyst deactivation due to coke formation is related to time. Carbon
deposit on catalyst increases with time, therefore the catalyst deactivation function is
given as:
(4.17)
The model equations obtained based on similar assumptions for RC are thus:
(4.18)
(4.19)
(4.20)
where , , , and are lumped constants already defined.
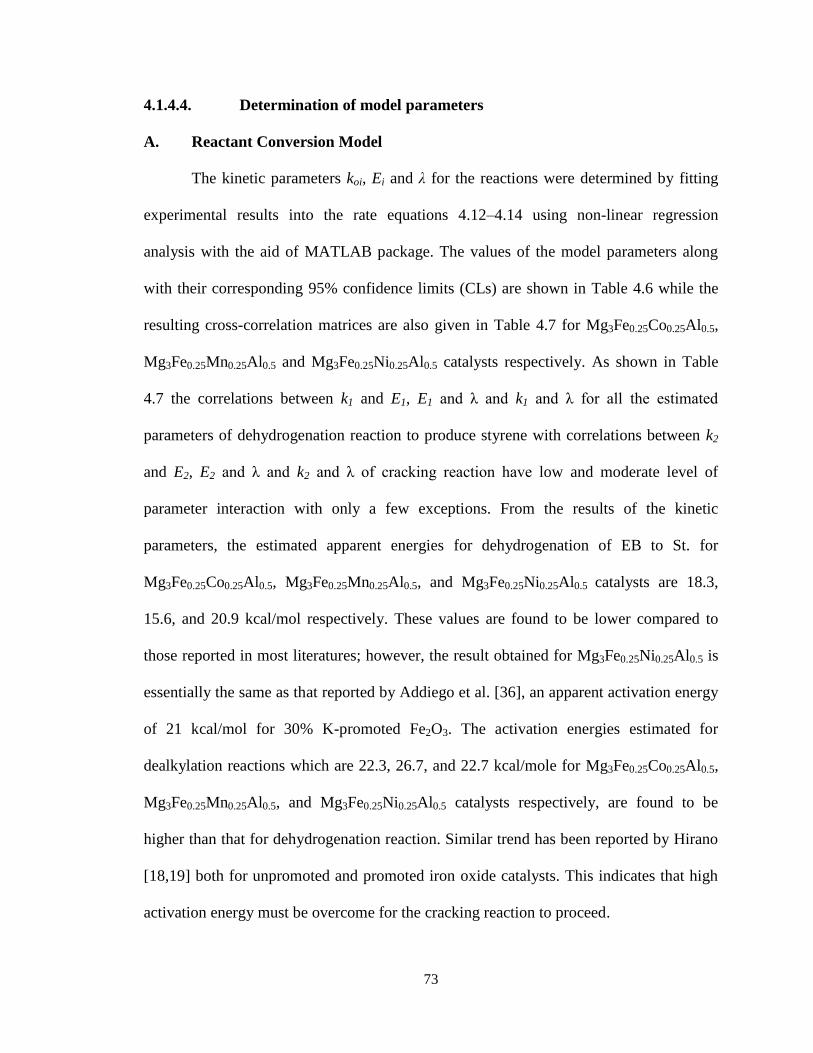
73
4.1.4.4. Determination of model parameters
A. Reactant Conversion Model
The kinetic parameters koi, Ei and λ for the reactions were determined by fitting
experimental results into the rate equations 4.12–4.14 using non-linear regression
analysis with the aid of MATLAB package. The values of the model parameters along
with their corresponding 95% confidence limits (CLs) are shown in Table 4.6 while the
resulting cross-correlation matrices are also given in Table 4.7 for Mg3Fe0.25Co0.25Al0.5,
Mg3Fe0.25Mn0.25Al0.5 and Mg3Fe0.25Ni0.25Al0.5 catalysts respectively. As shown in Table
4.7 the correlations between k1 and E1, E1 and λ and k1 and λ for all the estimated
parameters of dehydrogenation reaction to produce styrene with correlations between k2
and E2, E2 and λ and k2 and λ of cracking reaction have low and moderate level of
parameter interaction with only a few exceptions. From the results of the kinetic
parameters, the estimated apparent energies for dehydrogenation of EB to St. for
Mg3Fe0.25Co0.25Al0.5, Mg3Fe0.25Mn0.25Al0.5, and Mg3Fe0.25Ni0.25Al0.5 catalysts are 18.3,
15.6, and 20.9 kcal/mol respectively. These values are found to be lower compared to
those reported in most literatures; however, the result obtained for Mg3Fe0.25Ni0.25Al0.5 is
essentially the same as that reported by Addiego et al. [36], an apparent activation energy
of 21 kcal/mol for 30% K-promoted Fe2O3. The activation energies estimated for
dealkylation reactions which are 22.3, 26.7, and 22.7 kcal/mole for Mg3Fe0.25Co0.25Al0.5,
Mg3Fe0.25Mn0.25Al0.5, and Mg3Fe0.25Ni0.25Al0.5 catalysts respectively, are found to be
higher than that for dehydrogenation reaction. Similar trend has been reported by Hirano
[18,19] both for unpromoted and promoted iron oxide catalysts. This indicates that high
activation energy must be overcome for the cracking reaction to proceed.
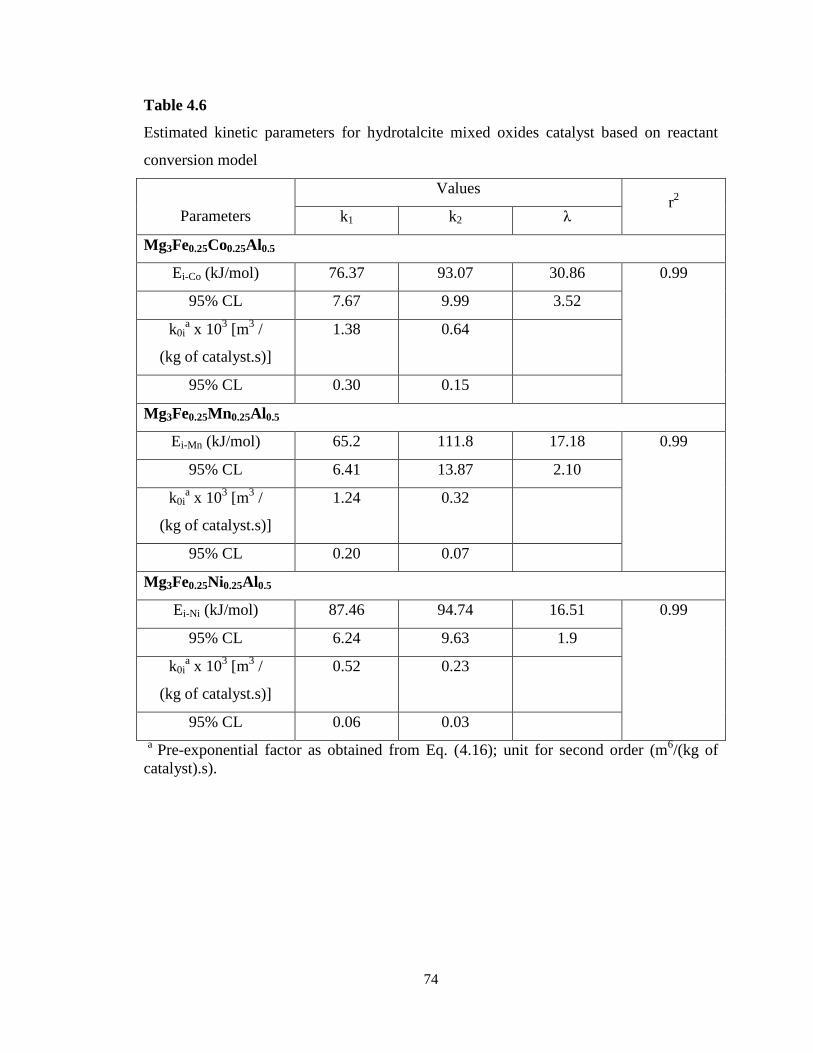
74
Table 4.6
Estimated kinetic parameters for hydrotalcite mixed oxides catalyst based on reactant
conversion model
Parameters
Values r2
k1 k2 λ
Mg3Fe0.25Co0.25Al0.5
Ei-Co (kJ/mol) 76.37 93.07 30.86 0.99
95% CL 7.67 9.99 3.52
k0ia x 10
3 [m
3 /
(kg of catalyst.s)]
1.38 0.64
95% CL 0.30 0.15
Mg3Fe0.25Mn0.25Al0.5
Ei-Mn (kJ/mol) 65.2 111.8 17.18 0.99
95% CL 6.41 13.87 2.10
k0ia x 10
3 [m
3 /
(kg of catalyst.s)]
1.24 0.32
95% CL 0.20 0.07
Mg3Fe0.25Ni0.25Al0.5
Ei-Ni (kJ/mol) 87.46 94.74 16.51 0.99
95% CL 6.24 9.63 1.9
k0ia x 10
3 [m
3 /
(kg of catalyst.s)]
0.52 0.23
95% CL 0.06 0.03
a
Pre-exponential factor as obtained from Eq. (4.16); unit for second order (m6/(kg of
catalyst).s).

75
Table 4.7
Correlation matrix for ethylbenzene dehydrogenation over hydrotalcite mixed oxides
catalyst (RC model)
k1 E1 k2 E2 λ
Mg3Fe0.25Co0.25Al0.5
k1-Co 1.0000 0.8342 0.9290 0.6689 0.9788
E1-Co 0.8342 1.0000 0.8147 0.6937 0.8645
k2-Co 0.9290 0.8147 1.0000 0.4810 0.9251
E2-Co 0.6689 0.6937 0.4810 1.0000 0.6714
λ 0.9788 0.8645 0.9251 0.6714 1.0000
Mg3Fe0.25Mn0.25Al0.5
k1-Mn 1.0000 0.7903 0.6898 0.4180 0.9696
E1-Mn 0.7903 1.0000 0.6074 0.4035 0.8374
k2-Mn 0.6898 0.6074 1.0000 -0.2421 0.6962
E2-Mn 0.4180 0.4035 -0.2421 1.0000 0.4154
λ 0.9696 0.8374 0.6962 0.4154 1.0000
Mg3Fe0.25Ni0.25Al0.5
k1-Ni 1.0000 0.6215 0.6349 0.5320 0.9260
E1-Ni 0.6215 1.0000 0.6500 0.3865 0.8041
k2-Ni 0.6349 0.6500 1.0000 -0.0659 0.7173
E2-Ni 0.5320 0.3865 -0.0659 1.0000 0.5097
λ 0.9260 0.8041 0.7173 0.5097 1.0000
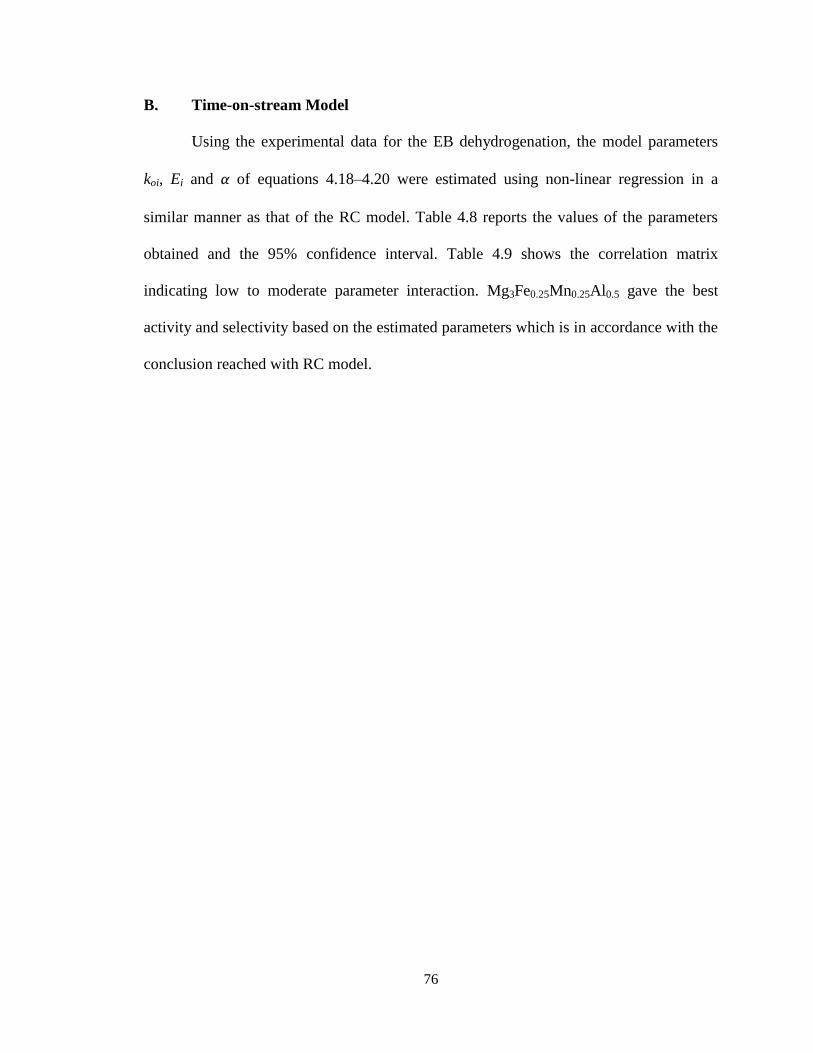
76
B. Time-on-stream Model
Using the experimental data for the EB dehydrogenation, the model parameters
koi, Ei and α of equations 4.18–4.20 were estimated using non-linear regression in a
similar manner as that of the RC model. Table 4.8 reports the values of the parameters
obtained and the 95% confidence interval. Table 4.9 shows the correlation matrix
indicating low to moderate parameter interaction. Mg3Fe0.25Mn0.25Al0.5 gave the best
activity and selectivity based on the estimated parameters which is in accordance with the
conclusion reached with RC model.
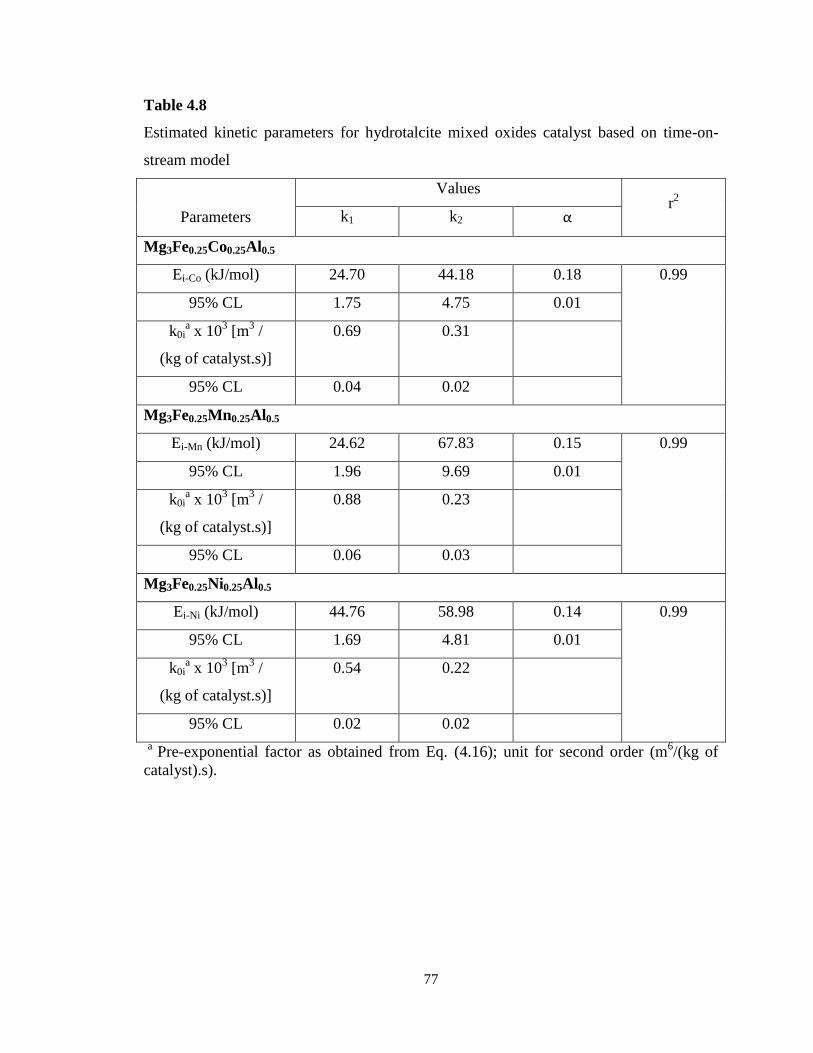
77
Table 4.8
Estimated kinetic parameters for hydrotalcite mixed oxides catalyst based on time-on-
stream model
Parameters
Values r2
k1 k2 α
Mg3Fe0.25Co0.25Al0.5
Ei-Co (kJ/mol) 24.70 44.18 0.18 0.99
95% CL 1.75 4.75 0.01
k0ia x 10
3 [m
3 /
(kg of catalyst.s)]
0.69 0.31
95% CL 0.04 0.02
Mg3Fe0.25Mn0.25Al0.5
Ei-Mn (kJ/mol) 24.62 67.83 0.15 0.99
95% CL 1.96 9.69 0.01
k0ia x 10
3 [m
3 /
(kg of catalyst.s)]
0.88 0.23
95% CL 0.06 0.03
Mg3Fe0.25Ni0.25Al0.5
Ei-Ni (kJ/mol) 44.76 58.98 0.14 0.99
95% CL 1.69 4.81 0.01
k0ia x 10
3 [m
3 /
(kg of catalyst.s)]
0.54 0.22
95% CL 0.02 0.02
a
Pre-exponential factor as obtained from Eq. (4.16); unit for second order (m6/(kg of
catalyst).s).
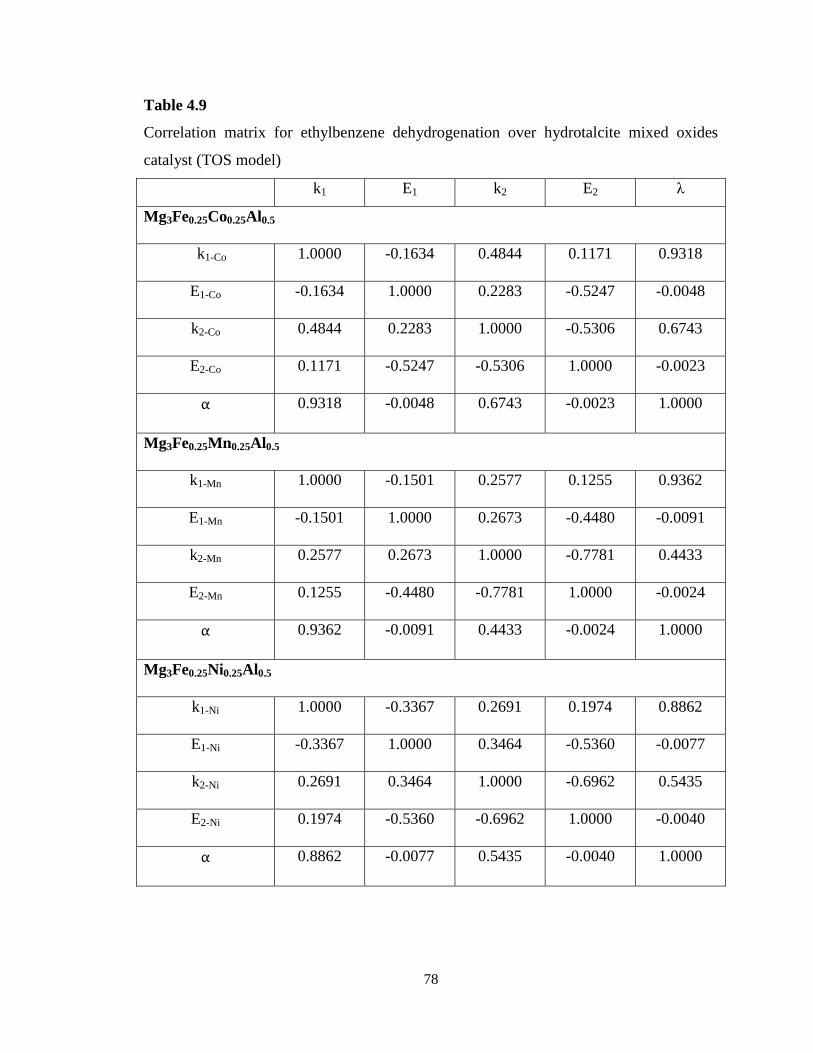
78
Table 4.9
Correlation matrix for ethylbenzene dehydrogenation over hydrotalcite mixed oxides
catalyst (TOS model)
k1 E1 k2 E2 λ
Mg3Fe0.25Co0.25Al0.5
k1-Co 1.0000 -0.1634 0.4844 0.1171 0.9318
E1-Co -0.1634 1.0000 0.2283 -0.5247 -0.0048
k2-Co 0.4844 0.2283 1.0000 -0.5306 0.6743
E2-Co 0.1171 -0.5247 -0.5306 1.0000 -0.0023
α 0.9318 -0.0048 0.6743 -0.0023 1.0000
Mg3Fe0.25Mn0.25Al0.5
k1-Mn 1.0000 -0.1501 0.2577 0.1255 0.9362
E1-Mn -0.1501 1.0000 0.2673 -0.4480 -0.0091
k2-Mn 0.2577 0.2673 1.0000 -0.7781 0.4433
E2-Mn 0.1255 -0.4480 -0.7781 1.0000 -0.0024
α 0.9362 -0.0091 0.4433 -0.0024 1.0000
Mg3Fe0.25Ni0.25Al0.5
k1-Ni 1.0000 -0.3367 0.2691 0.1974 0.8862
E1-Ni -0.3367 1.0000 0.3464 -0.5360 -0.0077
k2-Ni 0.2691 0.3464 1.0000 -0.6962 0.5435
E2-Ni 0.1974 -0.5360 -0.6962 1.0000 -0.0040
α 0.8862 -0.0077 0.5435 -0.0040 1.0000
79
From the estimated activation energies, the addition of Mn2+
to ternary Mg/Fe/Al
HT best improved its catalyst activity even though both Co2+
and Ni2+
are well
incorporated into the HT structure. Mg3Fe0.25Mn0.25Al0.5 has the least activation energy to
produce styrene and highest energy to be overcome to crack EB to yield Bz. This further
depicts that Mn2+
gave the best selectivity towards styrene formation which is consistent
with the experimental data. This assertion can be justified from the results of the
characterization of the catalysts. Mn2+
has been reported to possess a higher ionic radius
than the other Me2+
which may have led to its incomplete incorporation into the HT
structure [47]. The result of XPS from Table 4.1 shows Mn
2+ to have the least binding
energy. Binding energy has being reported to be linked to the strength of basicity of a
catalyst [81], the lower the binding energy, the more basic the surface of the catalyst. It
can thus be suggested that the segregation of Mn2+
serves as additional active sites which
increased the basicity of the catalyst, responsible for initiating dehydrogenation by H+
abstraction [48]. The active specie however is still identified as the metastable Fe
3+.
The use of fluidized bed reactor is suggested to have improved the overall
performance of this process. This same experiment (EB dehydrogenation) was conducted
using a continuous gas-flow fixed bed reactor at atmospheric pressure [47] over
Mg3Fe0.25Co0.25Al0.5. The reaction was carried out for 3 h of time-on-stream at 550 °C
with the catalyst after been pre-treated with a He gas. Activation energy of 29.1 kcal/mol
was estimated from the Arrhenius plot. It can thus be assumed that the extensive bed
mixing and heat distribution within the fluidized bed enhanced reactant-catalyst contact
and uniform product quality, hence reduction of activation energy towards styrene
formation.
80
In order to ascertain the proposed models developed for the dehydrogenation
process of EB in the riser simulator, validation of the estimated kinetic parameters is
imperative. Therefore, the estimated parameters were substituted into the set of
differential equations developed and solved numerically using fourth-order-Runge-Kutta
routine. The numerical results were compared with experimental data as shown in Figure
4.4(A-C). As observed from the Figure, the model predictions compared favorably with
the obtained experimental data. This demonstrates that the proposed kinetic model fits
well into our experimental observations. To further determine the adequacy of the model,
a reconciliation plot (Figure 4.9) showing the overall agreement of experimental data and
model predictions was done. The two agrees very well as suggested by the value of
regression coefficient, r2 (0.99).
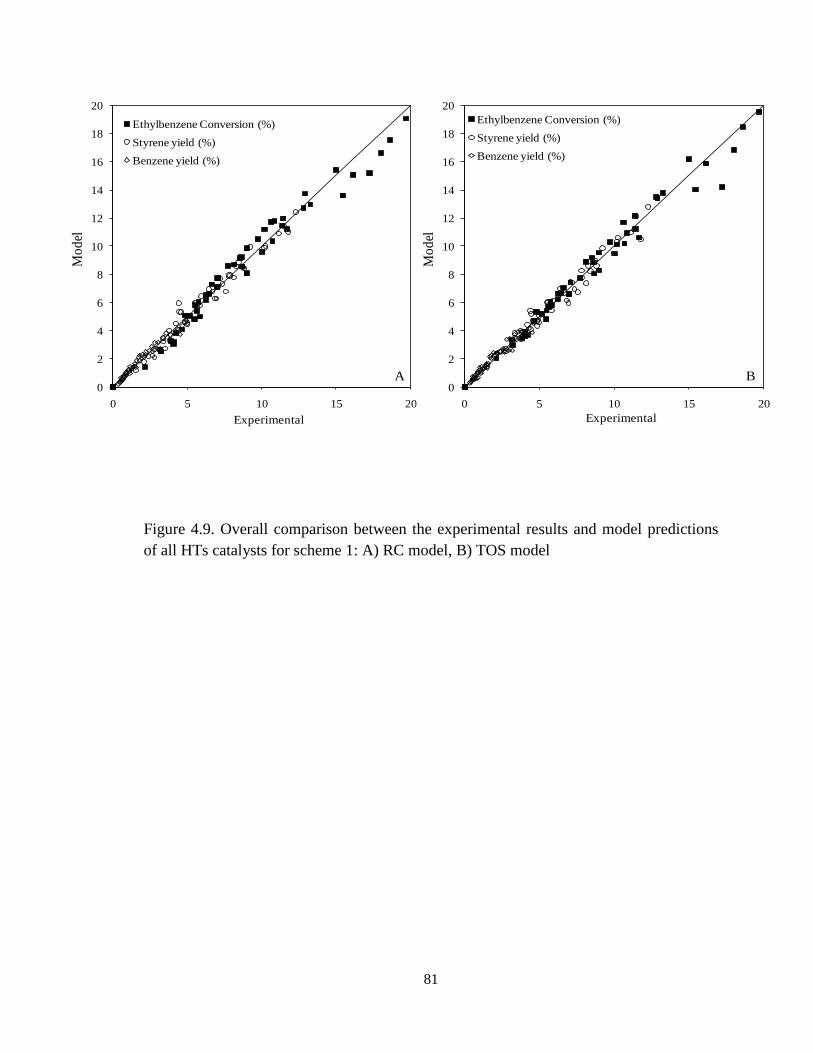
81
Figure 4.9. Overall comparison between the experimental results and model predictions
of all HTs catalysts for scheme 1: A) RC model, B) TOS model
0
2
4
6
8
10
12
14
16
18
20
0 5 10 15 20
Mo
del
Experimental
Ethylbenzene Conversion (%)
Styrene yield (%)
Benzene yield (%)
A0
2
4
6
8
10
12
14
16
18
20
0 5 10 15 20
Mo
del
Experimental
Ethylbenzene Conversion (%)
Styrene yield (%)
Benzene yield (%)
B
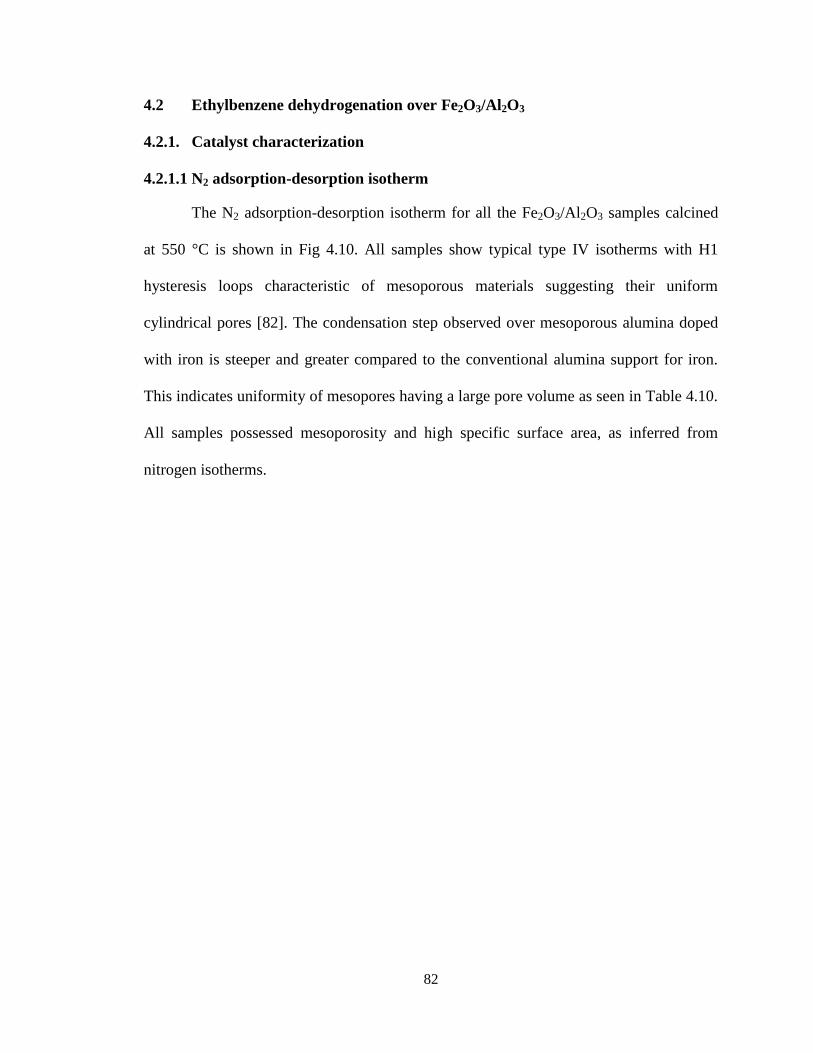
82
4.2 Ethylbenzene dehydrogenation over Fe2O3/Al2O3
4.2.1. Catalyst characterization
4.2.1.1 N2 adsorption-desorption isotherm
The N2 adsorption-desorption isotherm for all the Fe2O3/Al2O3 samples calcined
at 550 °C is shown in Fig 4.10. All samples show typical type IV isotherms with H1
hysteresis loops characteristic of mesoporous materials suggesting their uniform
cylindrical pores [82]. The condensation step observed over mesoporous alumina doped
with iron is steeper and greater compared to the conventional alumina support for iron.
This indicates uniformity of mesopores having a large pore volume as seen in Table 4.10.
All samples possessed mesoporosity and high specific surface area, as inferred from
nitrogen isotherms.
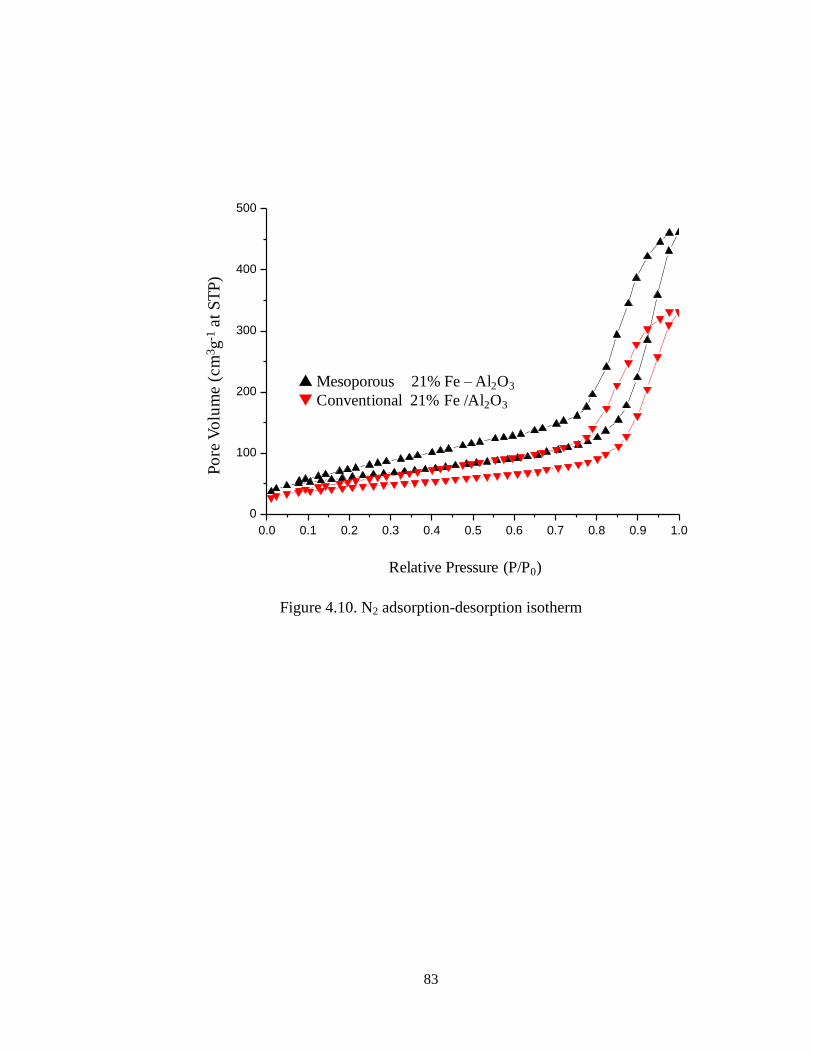
83
Figure 4.10. N2 adsorption-desorption isotherm
0.0 0.1 0.2 0.3 0.4 0.5 0.6 0.7 0.8 0.9 1.0
0
100
200
300
400
500
Relative Pressure (P/P0)
▲Mesoporous 21% Fe – Al2O3
▼Conventional 21% Fe /Al2O3
Po
re V
olu
me (
cm
3g
-1at
ST
P)
84
Table 4.10. Physical and structural properties of Fe2O3/Al2O3
Sample 21% Fe /conventional
alumina
21% Fe /Meso. alumina
SBET (m2/g) 116 225
Total Pore Volume
(cc/g)
0.23 0.66
Average Pore
Diameter (nm)
5.80 11.0
85
4.2.1.2 X-ray Diffraction patterns
XRD patterns of mesoporous alumina, obtained by self-induced evaporation
methods reveal no evidence of crystalline alumina phase. Yuan et al. has attributed this
occurrence to the presence of γ-Al2O3 which only crystallizes at higher calcinations
temperature (> 700 °C) while peaks which are attributed to the presence of crystalline
alumina phase were observed on the pure conventional Al2O3. When loaded with 21%Fe
by both direct and post synthesis methods, the XRD patterns were similar to that of the
pure alumina support, however indistinctive reflections were noticed on iron doped on
alumina by post synthesis method. This depicts that the metal specie were
homogeneously distributed over mesoporous alumina support irrespective of the
preparation method. XRD analysis of the conventional Al2O3 doped with 21%Fe
indicates the presence of bulk Fe2O3 phase. The sample exhibits well defined reflections
which are assigned to Fe2O3.
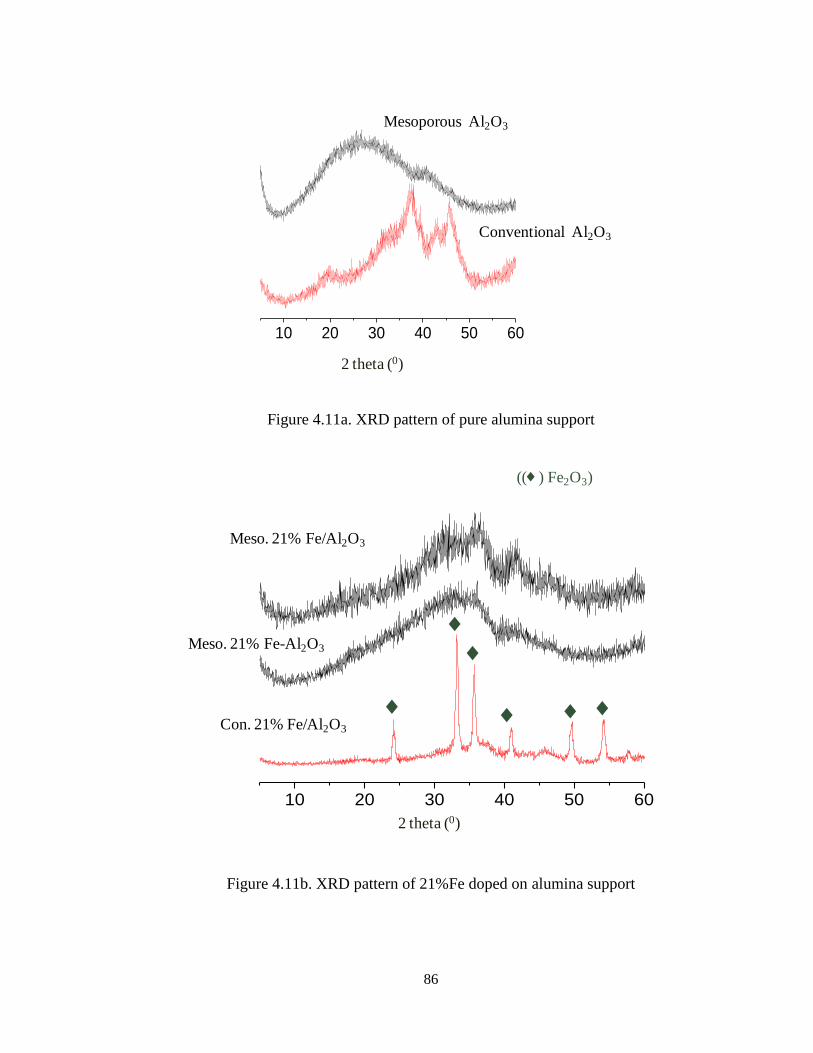
86
Figure 4.11a. XRD pattern of pure alumina support
Figure 4.11b. XRD pattern of 21%Fe doped on alumina support
10 20 30 40 50 60
Mesoporous Al2O3
Conventional Al2O3
2 theta (0)
Con. 21% Fe/Al2O3
10 20 30 40 50 60
Meso. 21% Fe/Al2O3
Meso. 21% Fe-Al2O3
2 theta (0)
♦
♦♦
♦ ♦ ♦
((♦ ) Fe2O3)
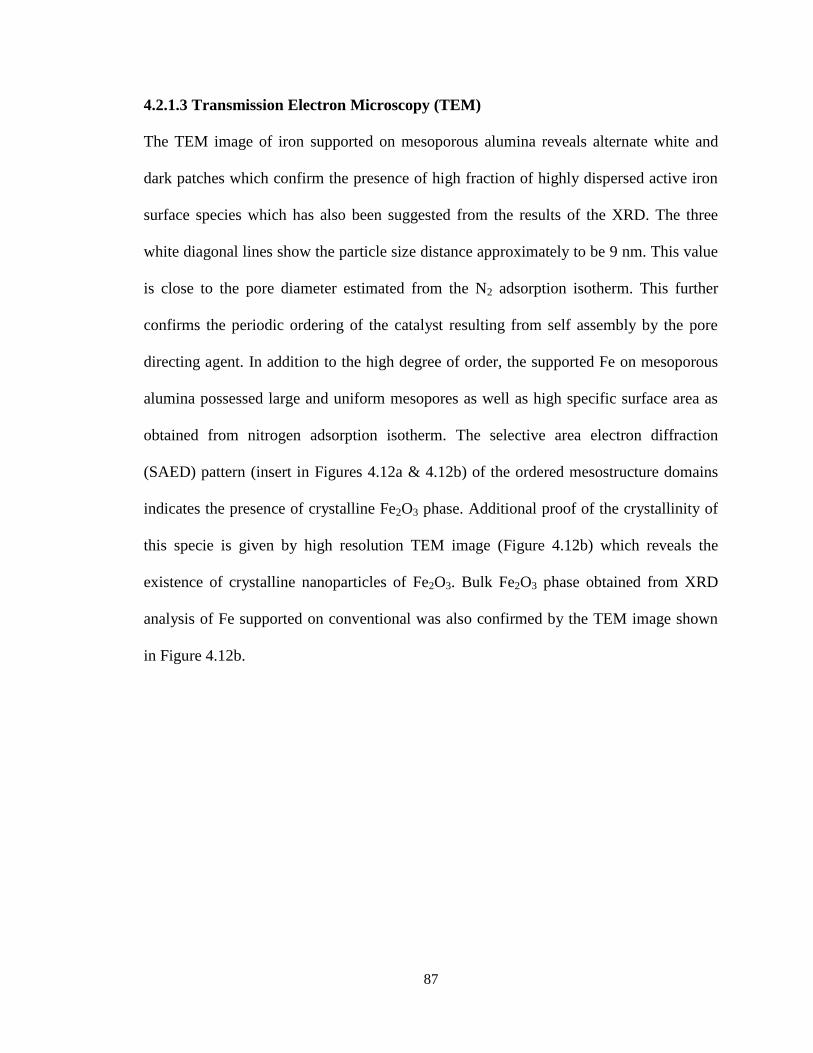
87
4.2.1.3 Transmission Electron Microscopy (TEM)
The TEM image of iron supported on mesoporous alumina reveals alternate white and
dark patches which confirm the presence of high fraction of highly dispersed active iron
surface species which has also been suggested from the results of the XRD. The three
white diagonal lines show the particle size distance approximately to be 9 nm. This value
is close to the pore diameter estimated from the N2 adsorption isotherm. This further
confirms the periodic ordering of the catalyst resulting from self assembly by the pore
directing agent. In addition to the high degree of order, the supported Fe on mesoporous
alumina possessed large and uniform mesopores as well as high specific surface area as
obtained from nitrogen adsorption isotherm. The selective area electron diffraction
(SAED) pattern (insert in Figures 4.12a & 4.12b) of the ordered mesostructure domains
indicates the presence of crystalline Fe2O3 phase. Additional proof of the crystallinity of
this specie is given by high resolution TEM image (Figure 4.12b) which reveals the
existence of crystalline nanoparticles of Fe2O3. Bulk Fe2O3 phase obtained from XRD
analysis of Fe supported on conventional was also confirmed by the TEM image shown
in Figure 4.12b.
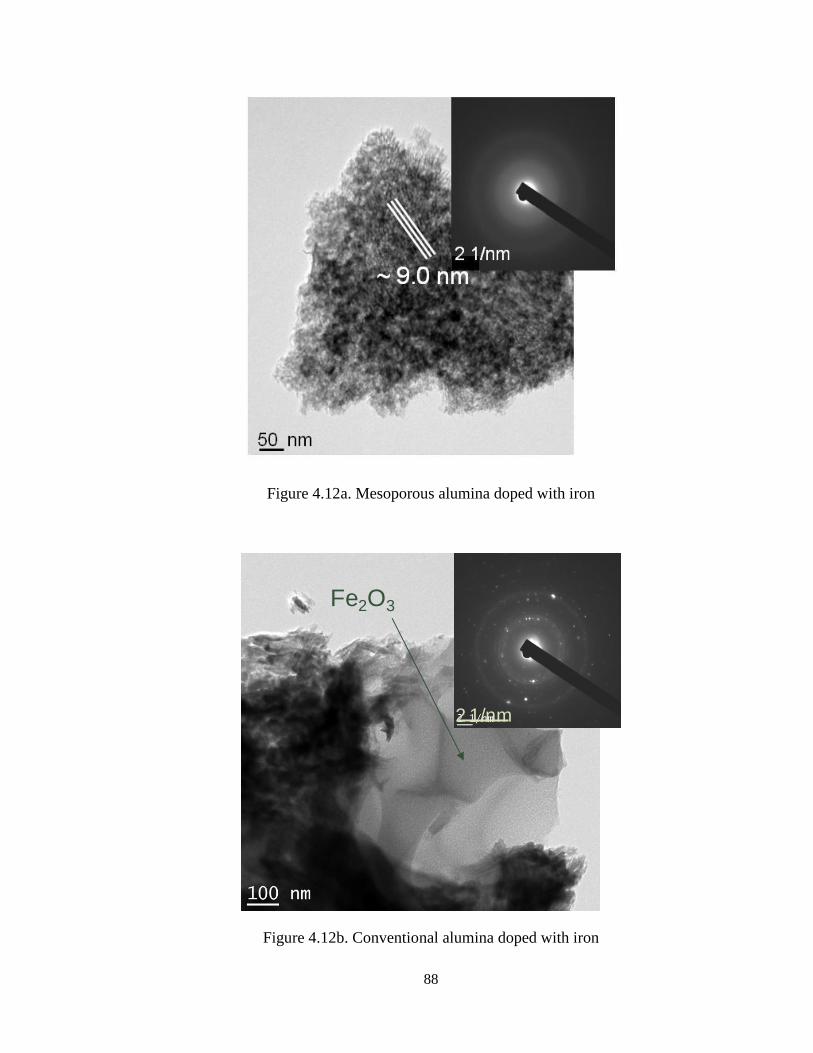
88
Figure 4.12a. Mesoporous alumina doped with iron
Figure 4.12b. Conventional alumina doped with iron
Fe2O3
2 1/nm
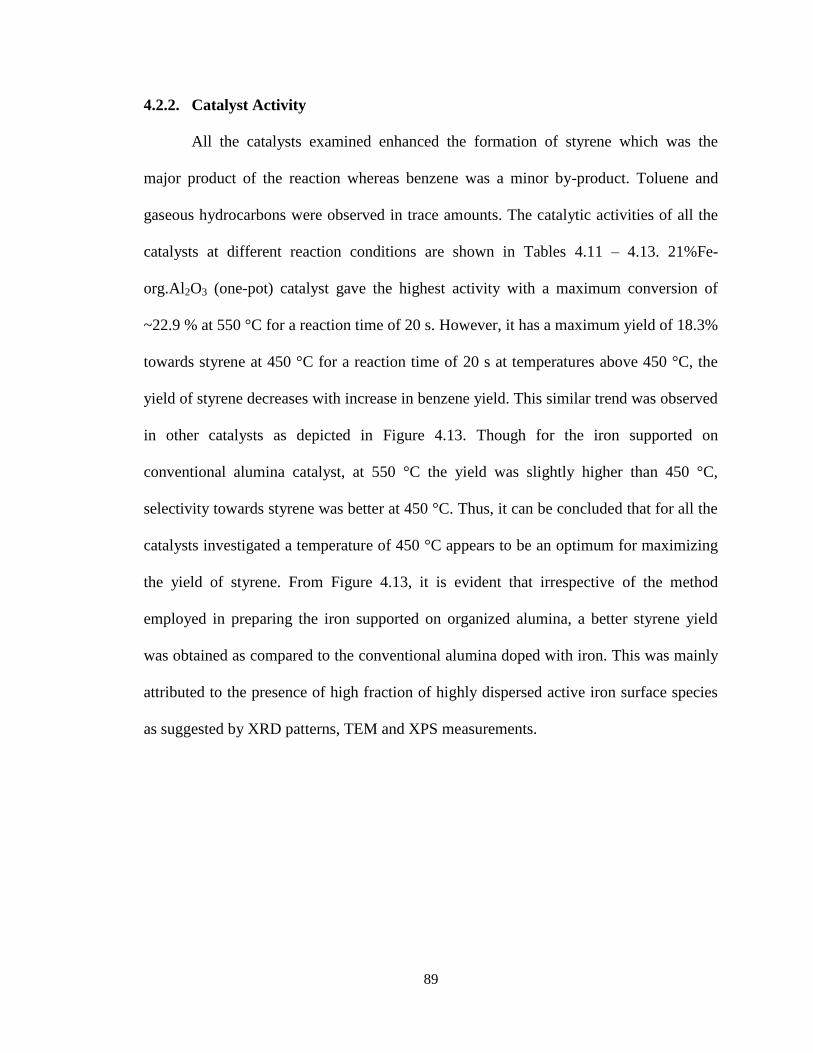
89
4.2.2. Catalyst Activity
All the catalysts examined enhanced the formation of styrene which was the
major product of the reaction whereas benzene was a minor by-product. Toluene and
gaseous hydrocarbons were observed in trace amounts. The catalytic activities of all the
catalysts at different reaction conditions are shown in Tables 4.11 – 4.13. 21%Fe-
org.Al2O3 (one-pot) catalyst gave the highest activity with a maximum conversion of
~22.9 % at 550 °C for a reaction time of 20 s. However, it has a maximum yield of 18.3%
towards styrene at 450 °C for a reaction time of 20 s at temperatures above 450 °C, the
yield of styrene decreases with increase in benzene yield. This similar trend was observed
in other catalysts as depicted in Figure 4.13. Though for the iron supported on
conventional alumina catalyst, at 550 °C the yield was slightly higher than 450 °C,
selectivity towards styrene was better at 450 °C. Thus, it can be concluded that for all the
catalysts investigated a temperature of 450 °C appears to be an optimum for maximizing
the yield of styrene. From Figure 4.13, it is evident that irrespective of the method
employed in preparing the iron supported on organized alumina, a better styrene yield
was obtained as compared to the conventional alumina doped with iron. This was mainly
attributed to the presence of high fraction of highly dispersed active iron surface species
as suggested by XRD patterns, TEM and XPS measurements.
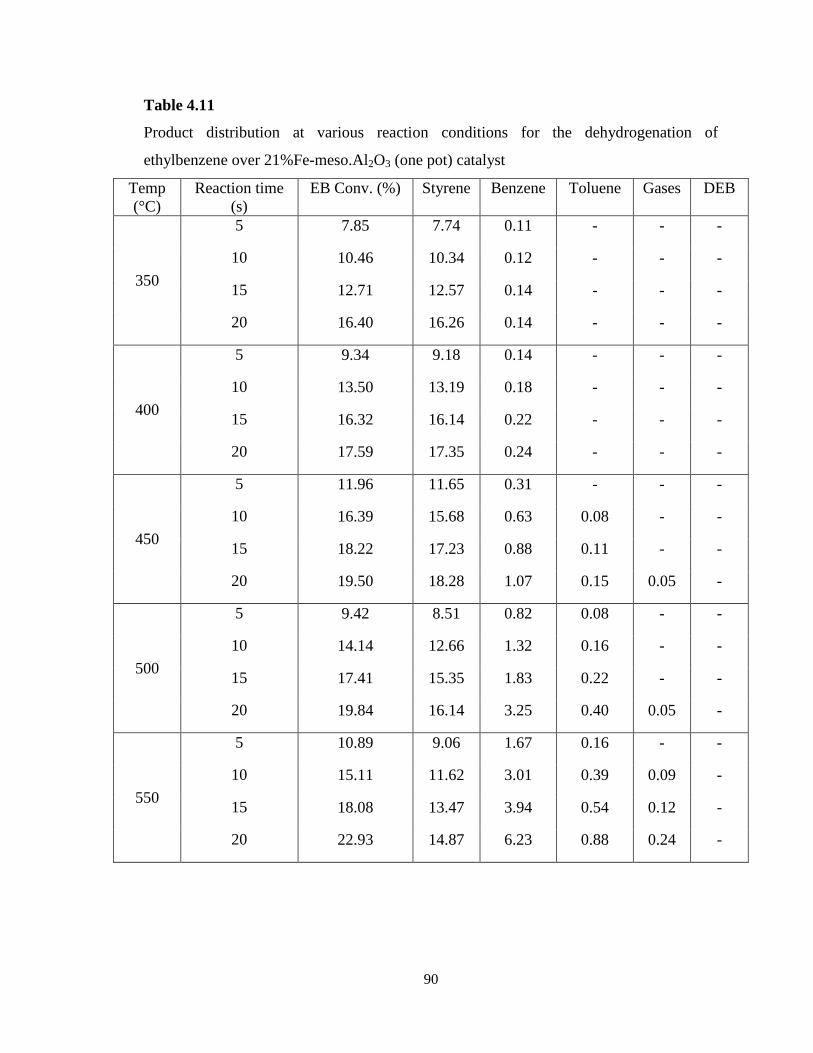
90
Table 4.11
Product distribution at various reaction conditions for the dehydrogenation of
ethylbenzene over 21%Fe-meso.Al2O3 (one pot) catalyst
Temp
(°C)
Reaction time
(s)
EB Conv. (%) Styrene Benzene Toluene
Gases DEB
350
5 7.85 7.74 0.11 - - -
10 10.46 10.34 0.12 - - -
15 12.71 12.57 0.14 - - -
20 16.40 16.26 0.14 - - -
400
5 9.34 9.18 0.14 - - -
10 13.50 13.19 0.18 - - -
15 16.32 16.14 0.22 - - -
20 17.59 17.35 0.24 - - -
450
5 11.96 11.65 0.31 - - -
10 16.39 15.68 0.63 0.08 - -
15 18.22 17.23 0.88 0.11 - -
20 19.50 18.28 1.07 0.15 0.05 -
500
5 9.42 8.51 0.82 0.08 - -
10 14.14 12.66 1.32 0.16 - -
15 17.41 15.35 1.83 0.22 - -
20 19.84 16.14 3.25 0.40 0.05 -
550
5 10.89 9.06 1.67 0.16 - -
10 15.11 11.62 3.01 0.39 0.09 -
15 18.08 13.47 3.94 0.54 0.12 -
20 22.93 14.87 6.23 0.88 0.24 -
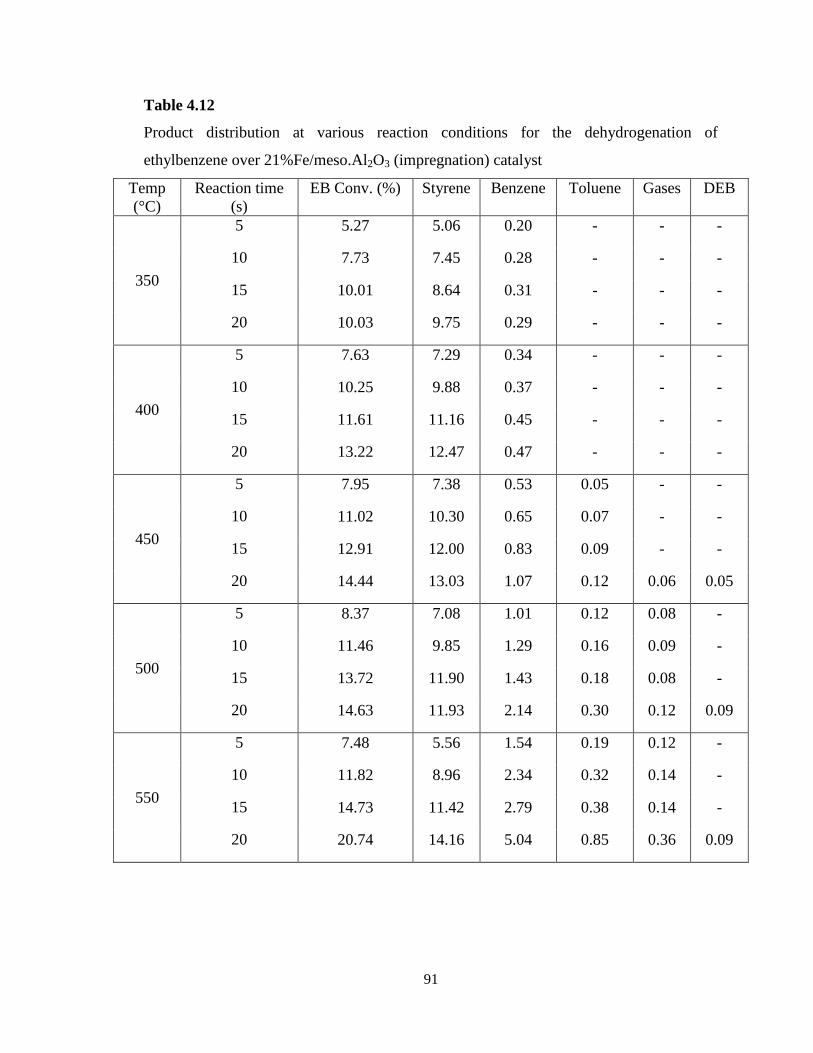
91
Table 4.12
Product distribution at various reaction conditions for the dehydrogenation of
ethylbenzene over 21%Fe/meso.Al2O3 (impregnation) catalyst
Temp
(°C)
Reaction time
(s)
EB Conv. (%) Styrene Benzene Toluene
Gases DEB
350
5 5.27 5.06 0.20 - - -
10 7.73 7.45 0.28 - - -
15 10.01 8.64 0.31 - - -
20 10.03 9.75 0.29 - - -
400
5 7.63 7.29 0.34 - - -
10 10.25 9.88 0.37 - - -
15 11.61 11.16 0.45 - - -
20 13.22 12.47 0.47 - - -
450
5 7.95 7.38 0.53 0.05 - -
10 11.02 10.30 0.65 0.07 - -
15 12.91 12.00 0.83 0.09 - -
20 14.44 13.03 1.07 0.12 0.06 0.05
500
5 8.37 7.08 1.01 0.12 0.08 -
10 11.46 9.85 1.29 0.16 0.09 -
15 13.72 11.90 1.43 0.18 0.08 -
20 14.63 11.93 2.14 0.30 0.12 0.09
550
5 7.48 5.56 1.54 0.19 0.12 -
10 11.82 8.96 2.34 0.32 0.14 -
15 14.73 11.42 2.79 0.38 0.14 -
20 20.74 14.16 5.04 0.85 0.36 0.09
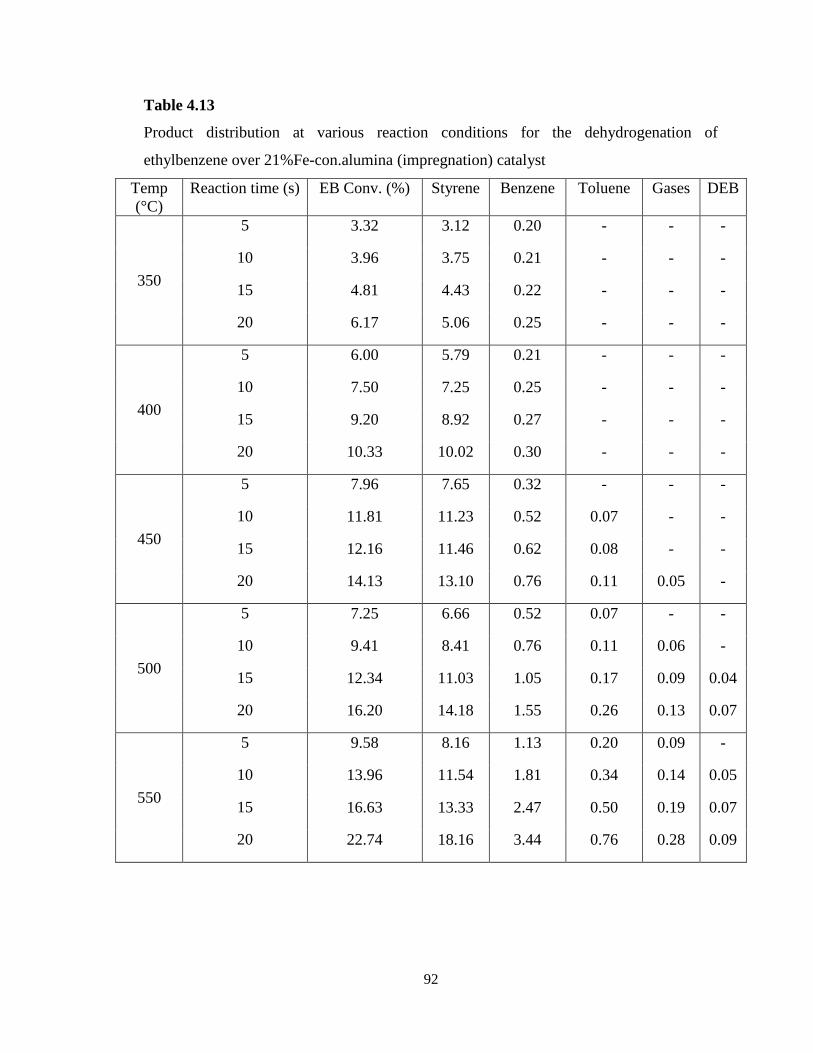
92
Table 4.13
Product distribution at various reaction conditions for the dehydrogenation of
ethylbenzene over 21%Fe-con.alumina (impregnation) catalyst
Temp
(°C)
Reaction time (s) EB Conv. (%) Styrene Benzene Toluene
Gases DEB
350
5 3.32 3.12 0.20 - - -
10 3.96 3.75 0.21 - - -
15 4.81 4.43 0.22 - - -
20 6.17 5.06 0.25 - - -
400
5 6.00 5.79 0.21 - - -
10 7.50 7.25 0.25 - - -
15 9.20 8.92 0.27 - - -
20 10.33 10.02 0.30 - - -
450
5 7.96 7.65 0.32 - - -
10 11.81 11.23 0.52 0.07 - -
15 12.16 11.46 0.62 0.08 - -
20 14.13 13.10 0.76 0.11 0.05 -
500
5 7.25 6.66 0.52 0.07 - -
10 9.41 8.41 0.76 0.11 0.06 -
15 12.34 11.03 1.05 0.17 0.09 0.04
20 16.20 14.18 1.55 0.26 0.13 0.07
550
5 9.58 8.16 1.13 0.20 0.09 -
10 13.96 11.54 1.81 0.34 0.14 0.05
15 16.63 13.33 2.47 0.50 0.19 0.07
20 22.74 18.16 3.44 0.76 0.28 0.09
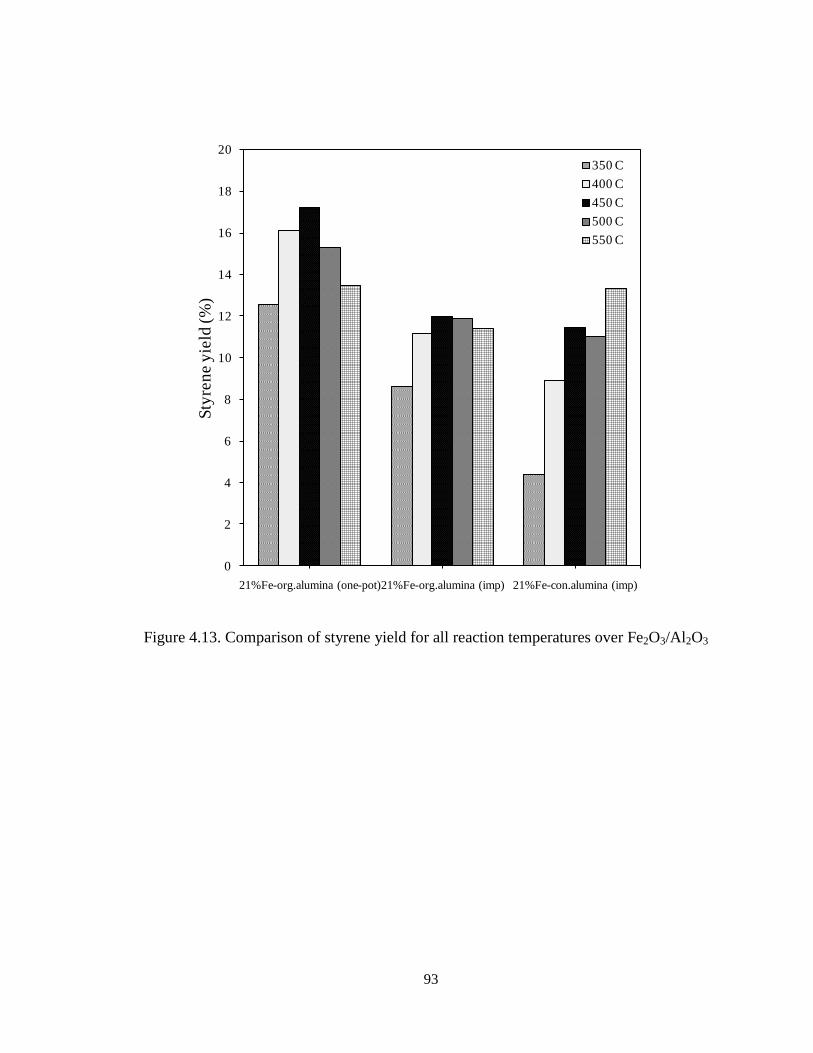
93
Figure 4.13. Comparison of styrene yield for all reaction temperatures over Fe2O3/Al2O3
0
2
4
6
8
10
12
14
16
18
20
21%Fe-org.alumina (one-pot)21%Fe-org.alumina (imp) 21%Fe-con.alumina (imp)
Sty
ren
e y
ield
(%
)
350 C
400 C
450 C
500 C
550 C
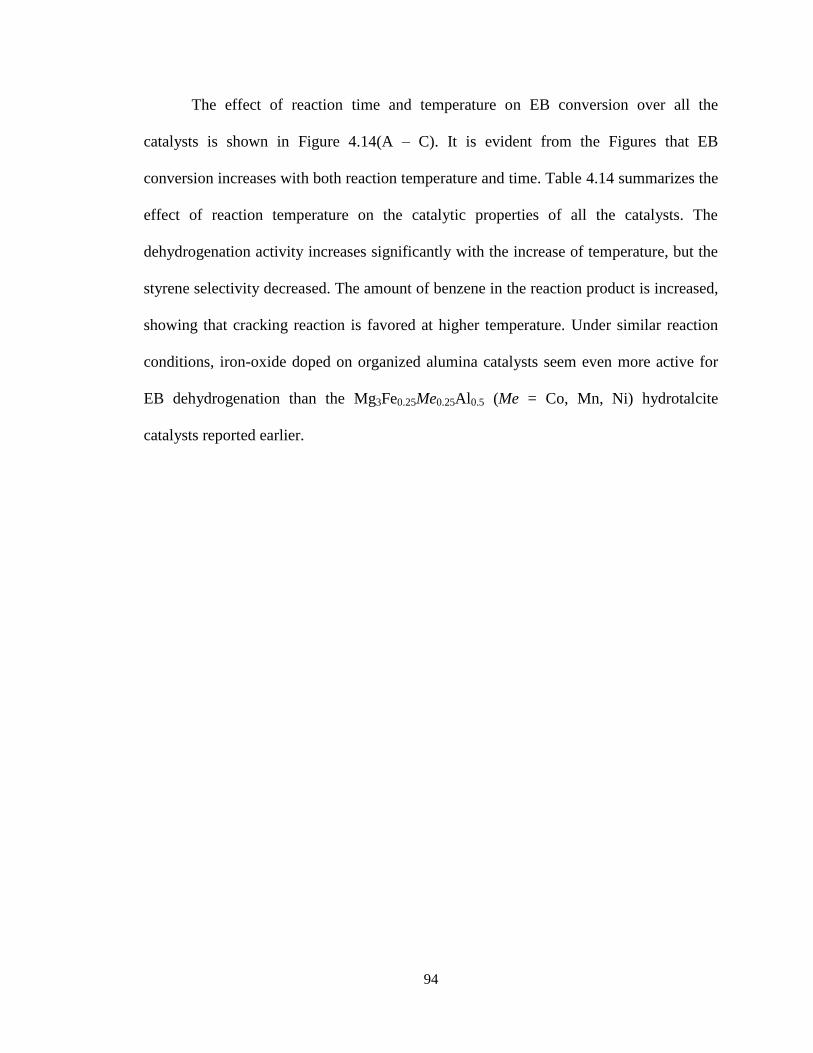
94
The effect of reaction time and temperature on EB conversion over all the
catalysts is shown in Figure 4.14(A – C). It is evident from the Figures that EB
conversion increases with both reaction temperature and time. Table 4.14 summarizes the
effect of reaction temperature on the catalytic properties of all the catalysts. The
dehydrogenation activity increases significantly with the increase of temperature, but the
styrene selectivity decreased. The amount of benzene in the reaction product is increased,
showing that cracking reaction is favored at higher temperature. Under similar reaction
conditions, iron-oxide doped on organized alumina catalysts seem even more active for
EB dehydrogenation than the Mg3Fe0.25Me0.25Al0.5 (Me = Co, Mn, Ni) hydrotalcite
catalysts reported earlier.
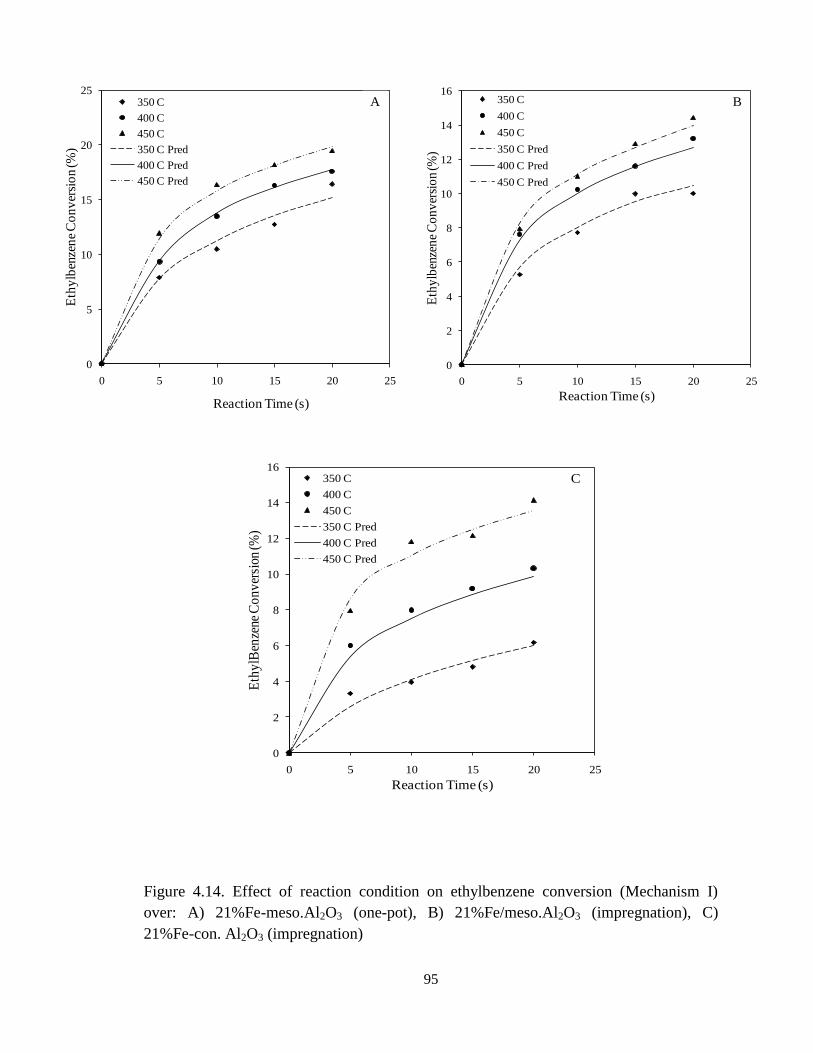
95
Figure 4.14. Effect of reaction condition on ethylbenzene conversion (Mechanism I)
over: A) 21%Fe-meso.Al2O3 (one-pot), B) 21%Fe/meso.Al2O3 (impregnation), C)
21%Fe-con. Al2O3 (impregnation)
0
2
4
6
8
10
12
14
16
0 5 10 15 20 25
Eth
ylb
enze
ne
Co
nv
ersi
on
(%)
Reaction Time (s)
350 C
400 C
450 C
350 C Pred
400 C Pred
450 C Pred
B
0
5
10
15
20
25
0 5 10 15 20 25
Eth
ylb
enze
ne
Co
nv
ersi
on (%
)
Reaction Time (s)
350 C
400 C
450 C
350 C Pred
400 C Pred
450 C Pred
A
0
2
4
6
8
10
12
14
16
0 5 10 15 20 25
Eth
ylB
enze
ne C
on
ver
sion
(%)
Reaction Time (s)
350 C
400 C
450 C
350 C Pred
400 C Pred
450 C Pred
C
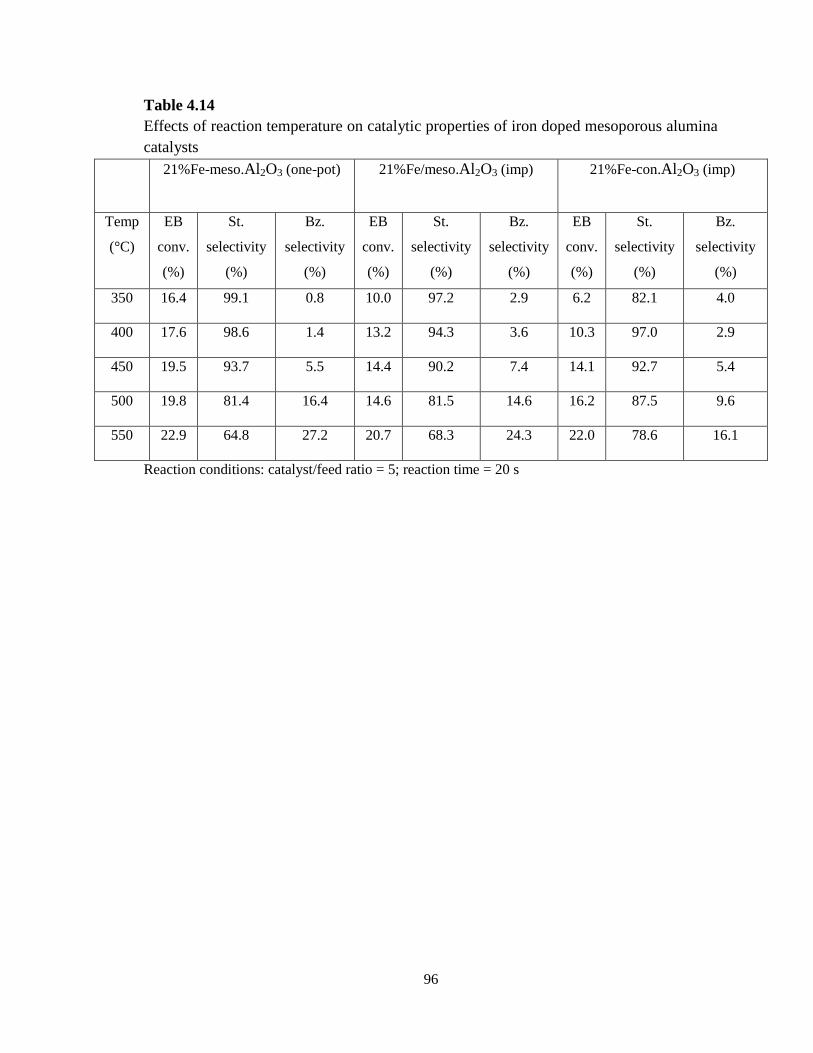
96
Table 4.14
Effects of reaction temperature on catalytic properties of iron doped mesoporous alumina
catalysts
21%Fe-meso.Al2O3 (one-pot)
21%Fe/meso.Al2O3 (imp)
21%Fe-con.Al2O3 (imp)
Temp
(°C)
EB
conv.
(%)
St.
selectivity
(%)
Bz.
selectivity
(%)
EB
conv.
(%)
St.
selectivity
(%)
Bz.
selectivity
(%)
EB
conv.
(%)
St.
selectivity
(%)
Bz.
selectivity
(%)
350 16.4 99.1 0.8 10.0 97.2 2.9 6.2 82.1 4.0
400 17.6 98.6 1.4 13.2 94.3 3.6 10.3 97.0 2.9
450 19.5 93.7 5.5 14.4 90.2 7.4 14.1 92.7 5.4
500 19.8 81.4 16.4 14.6 81.5 14.6 16.2 87.5 9.6
550 22.9 64.8 27.2 20.7 68.3 24.3 22.0 78.6 16.1
Reaction conditions: catalyst/feed ratio = 5; reaction time = 20 s
97
4.2.3. Kinetic Modeling
4.2.3.1. Model development
In addition to the main dehydrogenation reaction (equation 4.21), the side
reactions (equations (4.22) – (4.23)) are also known to take place
C2H5
Dehydrogenation
C2H3
H2
Ethylbenzene Styrene (4.21)
C2H5
Cracking
C2H4
Ethylbenzene Benzene (4.22)
C2H5
Cracking
CH4
CH3
H2
Ethylbenzene Toluene (4.23)
A reaction scheme for EB dehydrogenation is given as scheme 1. To develop a
suitable kinetic model based on the product distribution, two mechanisms are postulated
to represent the disappearance of EB: one mechanism for low temperature range (350 –
450 °C), and another for the complete temperature range. Scheme 2 was adapted for the
low temperature range whereby formation of both toluene and benzene were negligible
while overall temperature range adopts scheme 3 in which formation of benzene is
considered significant, however toluene is still negligible. Reaction schemes 2 and 3 will
be employed to obtain the kinetic parameters of scheme 1.
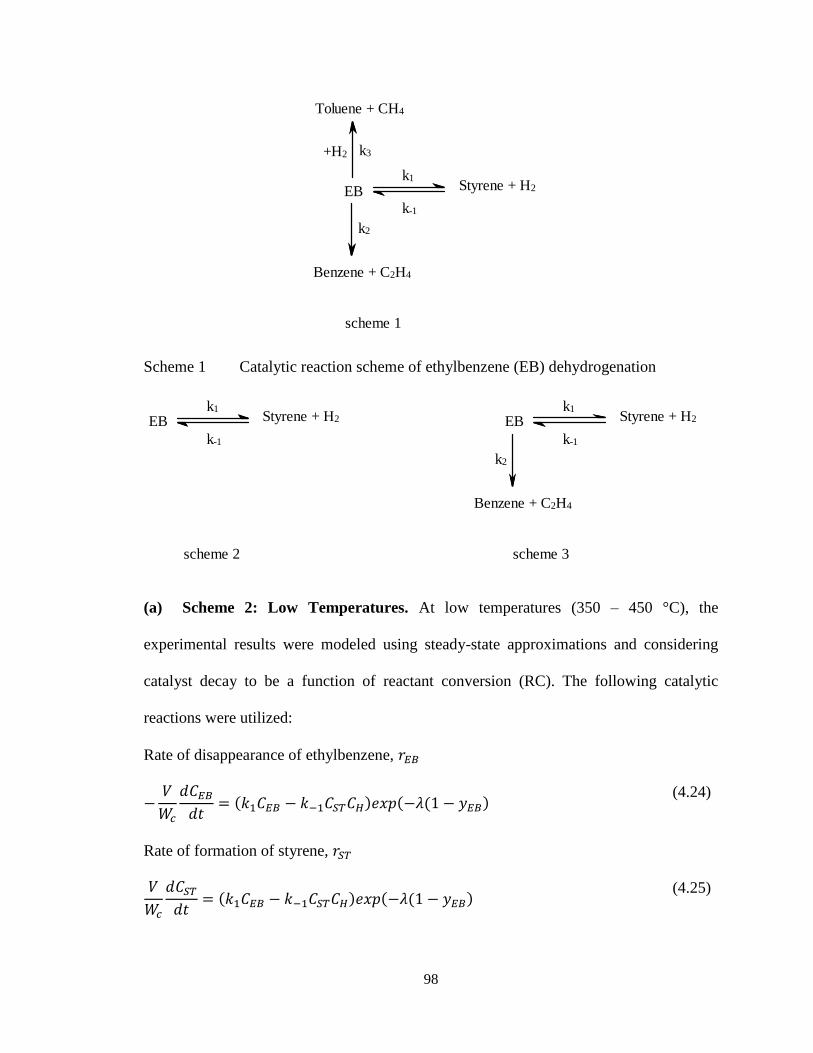
98
Toluene + CH4
+H2 k3
scheme 1
EB
Benzene + C2H4
k1
k-1
k2
Styrene + H2
Scheme 1 Catalytic reaction scheme of ethylbenzene (EB) dehydrogenation
scheme 2
EBk1
k-1
Styrene + H2
scheme 3
EB
Benzene + C2H4
k1
k-1
k2
Styrene + H2
(a) Scheme 2: Low Temperatures. At low temperatures (350 – 450 °C), the
experimental results were modeled using steady-state approximations and considering
catalyst decay to be a function of reactant conversion (RC). The following catalytic
reactions were utilized:
Rate of disappearance of ethylbenzene,
(4.24)
Rate of formation of styrene,
(4.25)
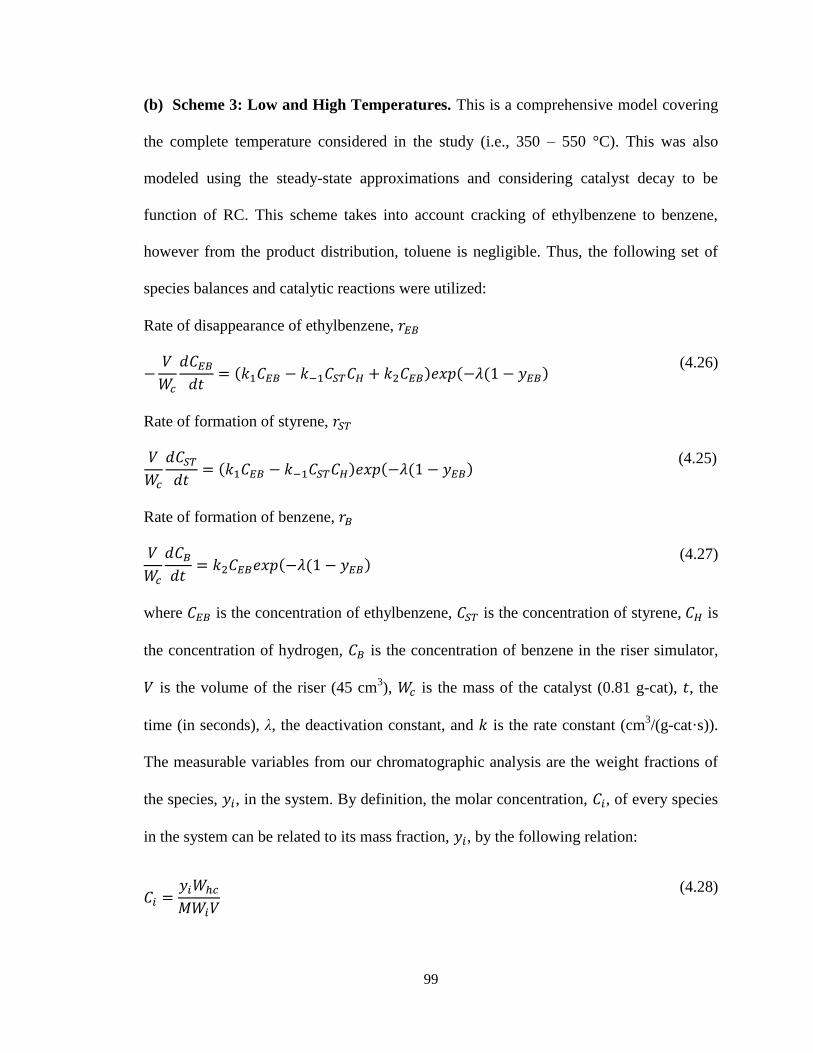
99
(b) Scheme 3: Low and High Temperatures. This is a comprehensive model covering
the complete temperature considered in the study (i.e., 350 – 550 °C). This was also
modeled using the steady-state approximations and considering catalyst decay to be
function of RC. This scheme takes into account cracking of ethylbenzene to benzene,
however from the product distribution, toluene is negligible. Thus, the following set of
species balances and catalytic reactions were utilized:
Rate of disappearance of ethylbenzene,
(4.26)
Rate of formation of styrene,
(4.25)
Rate of formation of benzene,
(4.27)
where is the concentration of ethylbenzene, is the concentration of styrene, is
the concentration of hydrogen, is the concentration of benzene in the riser simulator,
is the volume of the riser (45 cm3), is the mass of the catalyst (0.81 g-cat), , the
time (in seconds), λ, the deactivation constant, and is the rate constant (cm3/(g-cat·s)).
The measurable variables from our chromatographic analysis are the weight fractions of
the species, , in the system. By definition, the molar concentration, , of every species
in the system can be related to its mass fraction, , by the following relation:
(4.28)
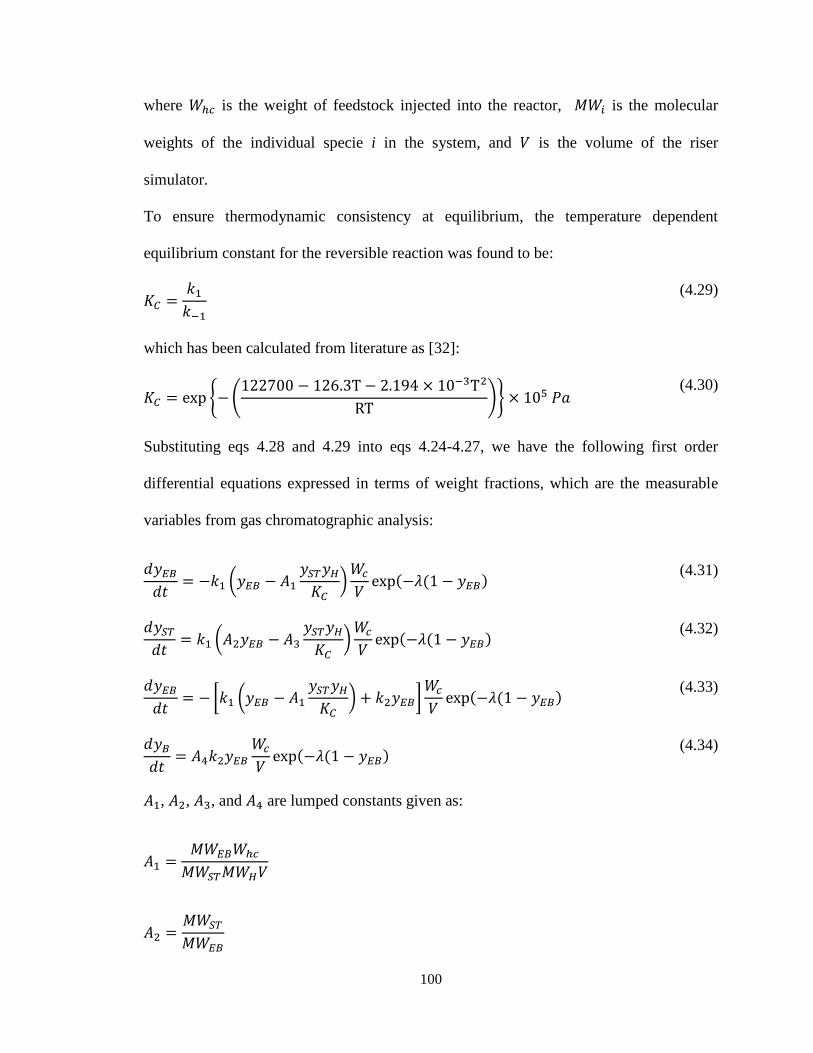
100
where is the weight of feedstock injected into the reactor, is the molecular
weights of the individual specie i in the system, and is the volume of the riser
simulator.
To ensure thermodynamic consistency at equilibrium, the temperature dependent
equilibrium constant for the reversible reaction was found to be:
(4.29)
which has been calculated from literature as [32]:
(4.30)
Substituting eqs 4.28 and 4.29 into eqs 4.24-4.27, we have the following first order
differential equations expressed in terms of weight fractions, which are the measurable
variables from gas chromatographic analysis:
(4.31)
(4.32)
(4.33)
(4.34)
, , , and are lumped constants given as:
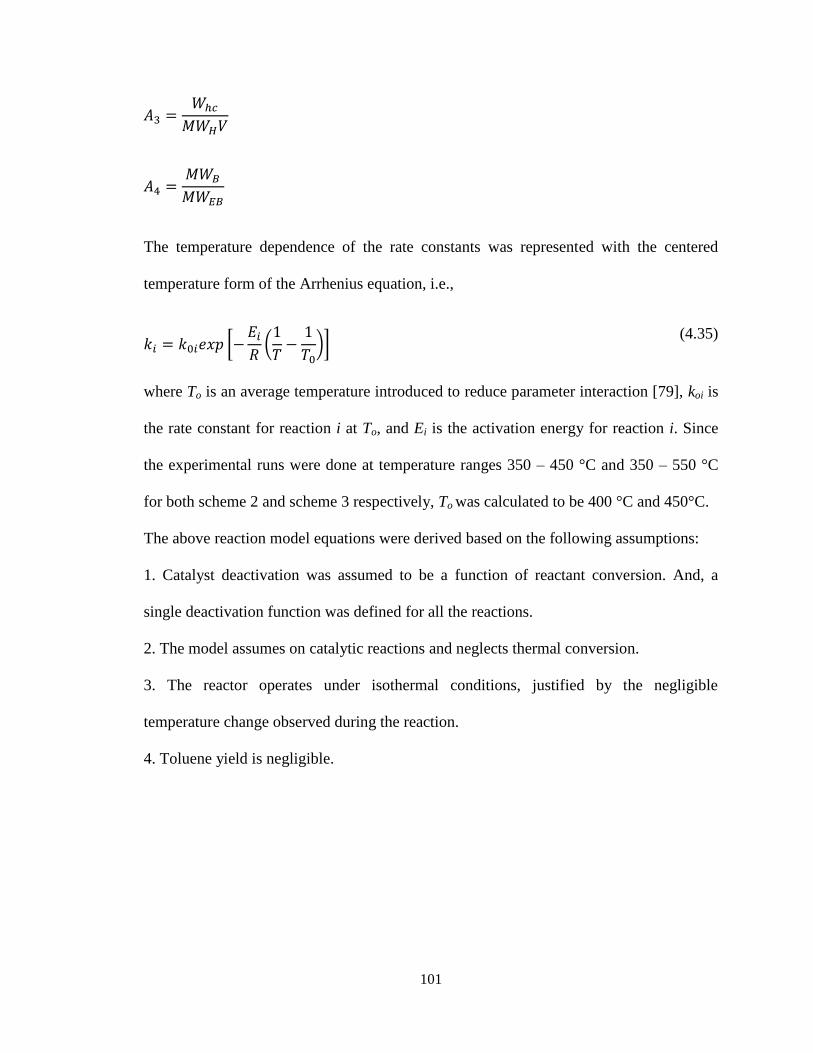
101
The temperature dependence of the rate constants was represented with the centered
temperature form of the Arrhenius equation, i.e.,
(4.35)
where To is an average temperature introduced to reduce parameter interaction [79], koi is
the rate constant for reaction i at To, and Ei is the activation energy for reaction i. Since
the experimental runs were done at temperature ranges 350 – 450 °C and 350 – 550 °C
for both scheme 2 and scheme 3 respectively, To was calculated to be 400 °C and 450°C.
The above reaction model equations were derived based on the following assumptions:
1. Catalyst deactivation was assumed to be a function of reactant conversion. And, a
single deactivation function was defined for all the reactions.
2. The model assumes on catalytic reactions and neglects thermal conversion.
3. The reactor operates under isothermal conditions, justified by the negligible
temperature change observed during the reaction.
4. Toluene yield is negligible.
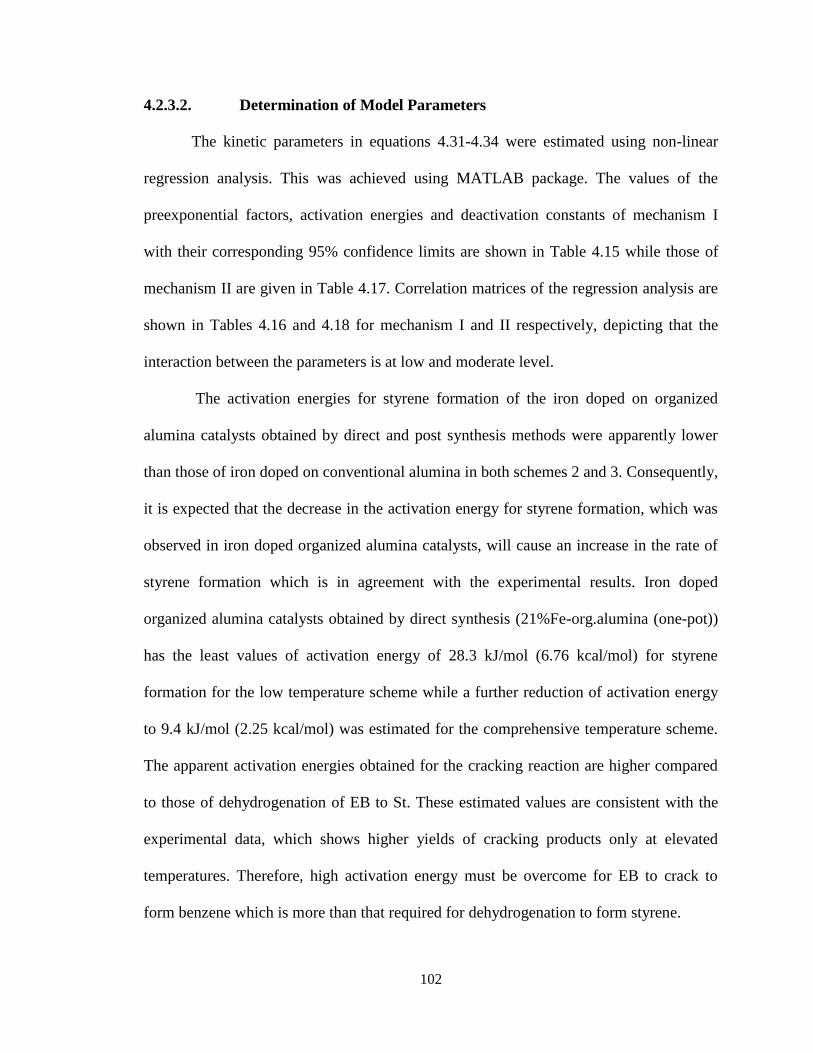
102
4.2.3.2. Determination of Model Parameters
The kinetic parameters in equations 4.31-4.34 were estimated using non-linear
regression analysis. This was achieved using MATLAB package. The values of the
preexponential factors, activation energies and deactivation constants of mechanism I
with their corresponding 95% confidence limits are shown in Table 4.15 while those of
mechanism II are given in Table 4.17. Correlation matrices of the regression analysis are
shown in Tables 4.16 and 4.18 for mechanism I and II respectively, depicting that the
interaction between the parameters is at low and moderate level.
The activation energies for styrene formation of the iron doped on organized
alumina catalysts obtained by direct and post synthesis methods were apparently lower
than those of iron doped on conventional alumina in both schemes 2 and 3. Consequently,
it is expected that the decrease in the activation energy for styrene formation, which was
observed in iron doped organized alumina catalysts, will cause an increase in the rate of
styrene formation which is in agreement with the experimental results. Iron doped
organized alumina catalysts obtained by direct synthesis (21%Fe-org.alumina (one-pot))
has the least values of activation energy of 28.3 kJ/mol (6.76 kcal/mol) for styrene
formation for the low temperature scheme while a further reduction of activation energy
to 9.4 kJ/mol (2.25 kcal/mol) was estimated for the comprehensive temperature scheme.
The apparent activation energies obtained for the cracking reaction are higher compared
to those of dehydrogenation of EB to St. These estimated values are consistent with the
experimental data, which shows higher yields of cracking products only at elevated
temperatures. Therefore, high activation energy must be overcome for EB to crack to
form benzene which is more than that required for dehydrogenation to form styrene.
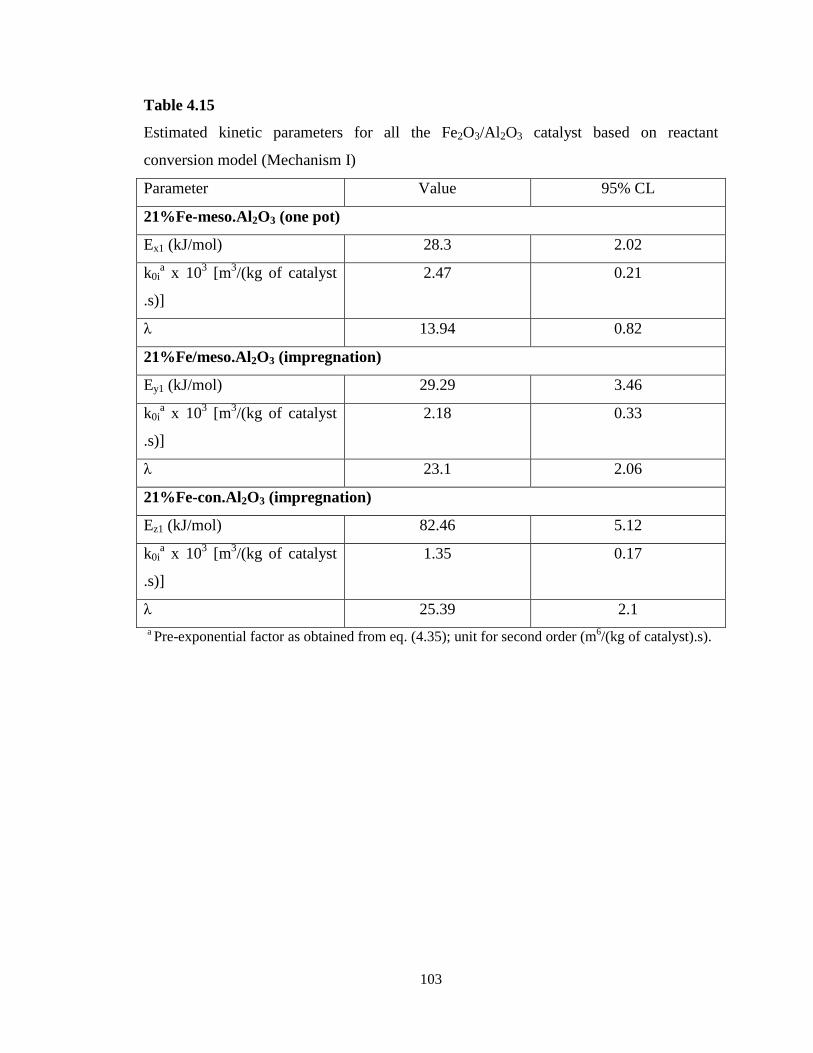
103
Table 4.15
Estimated kinetic parameters for all the Fe2O3/Al2O3 catalyst based on reactant
conversion model (Mechanism I)
Parameter Value 95% CL
21%Fe-meso.Al2O3 (one pot)
Ex1 (kJ/mol) 28.3 2.02
k0ia x 10
3 [m
3/(kg of catalyst
.s)]
2.47 0.21
λ 13.94 0.82
21%Fe/meso.Al2O3 (impregnation)
Ey1 (kJ/mol) 29.29 3.46
k0ia x 10
3 [m
3/(kg of catalyst
.s)]
2.18 0.33
λ 23.1 2.06
21%Fe-con.Al2O3 (impregnation)
Ez1 (kJ/mol) 82.46 5.12
k0ia x 10
3 [m
3/(kg of catalyst
.s)]
1.35 0.17
λ 25.39 2.1
a Pre-exponential factor as obtained from eq. (4.35); unit for second order (m
6/(kg of catalyst).s).
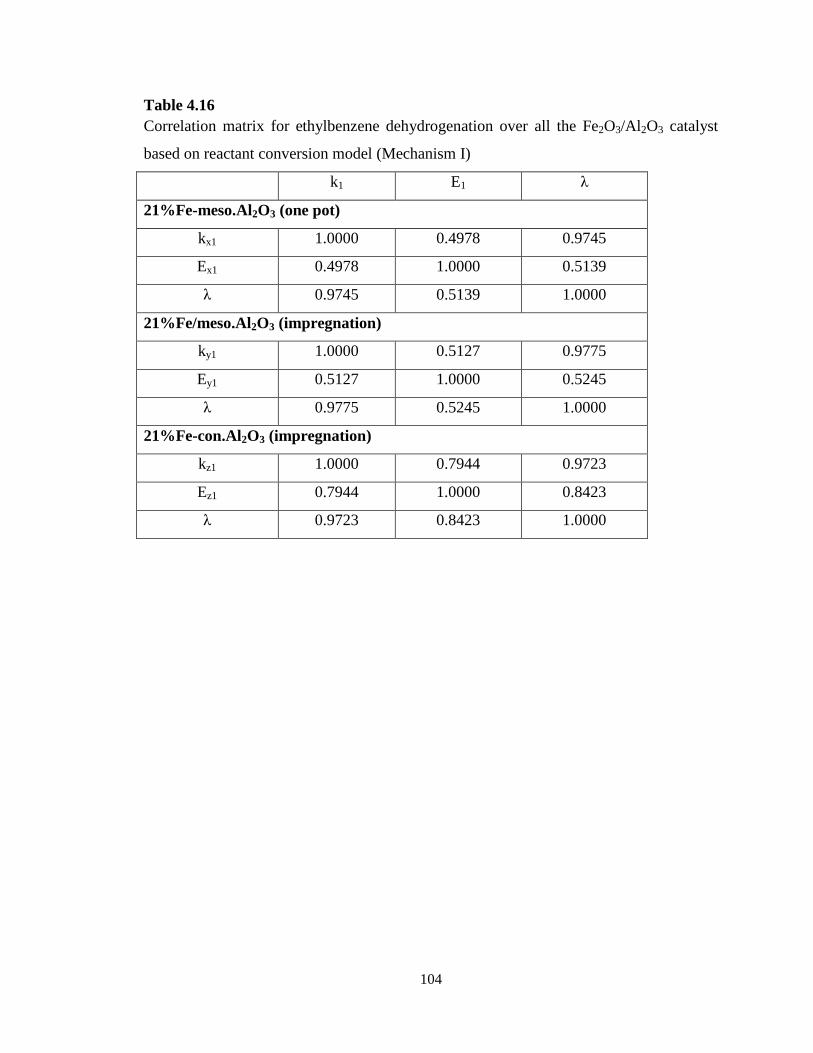
104
Table 4.16
Correlation matrix for ethylbenzene dehydrogenation over all the Fe2O3/Al2O3 catalyst
based on reactant conversion model (Mechanism I)
k1 E1 λ
21%Fe-meso.Al2O3 (one pot)
kx1 1.0000 0.4978 0.9745
Ex1 0.4978 1.0000 0.5139
λ 0.9745 0.5139 1.0000
21%Fe/meso.Al2O3 (impregnation)
ky1 1.0000 0.5127 0.9775
Ey1 0.5127 1.0000 0.5245
λ 0.9775 0.5245 1.0000
21%Fe-con.Al2O3 (impregnation)
kz1 1.0000 0.7944 0.9723
Ez1 0.7944 1.0000 0.8423
λ 0.9723 0.8423 1.0000
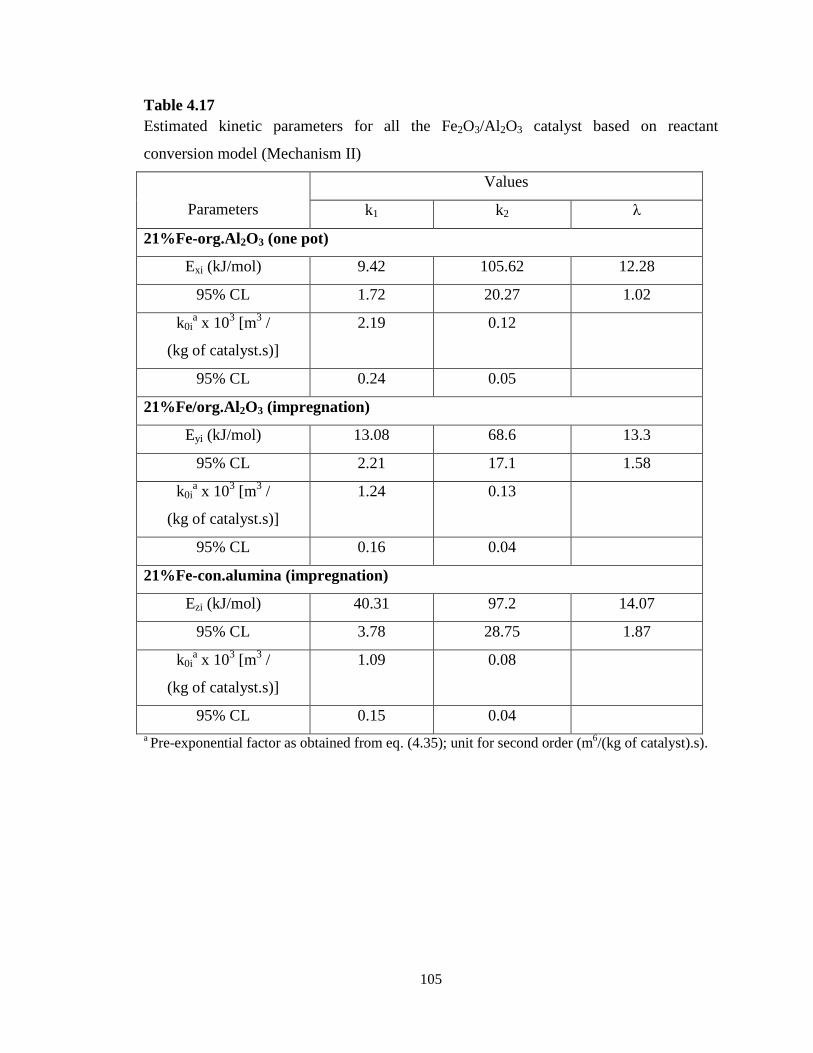
105
Table 4.17
Estimated kinetic parameters for all the Fe2O3/Al2O3 catalyst based on reactant
conversion model (Mechanism II)
Parameters
Values
k1 k2 λ
21%Fe-org.Al2O3 (one pot)
Exi (kJ/mol) 9.42 105.62 12.28
95% CL 1.72 20.27 1.02
k0ia x 10
3 [m
3 /
(kg of catalyst.s)]
2.19 0.12
95% CL 0.24 0.05
21%Fe/org.Al2O3 (impregnation)
Eyi (kJ/mol) 13.08 68.6 13.3
95% CL 2.21 17.1 1.58
k0ia x 10
3 [m
3 /
(kg of catalyst.s)]
1.24 0.13
95% CL 0.16 0.04
21%Fe-con.alumina (impregnation)
Ezi (kJ/mol) 40.31 97.2 14.07
95% CL 3.78 28.75 1.87
k0ia x 10
3 [m
3 /
(kg of catalyst.s)]
1.09 0.08
95% CL 0.15 0.04
a Pre-exponential factor as obtained from eq. (4.35); unit for second order (m
6/(kg of catalyst).s).
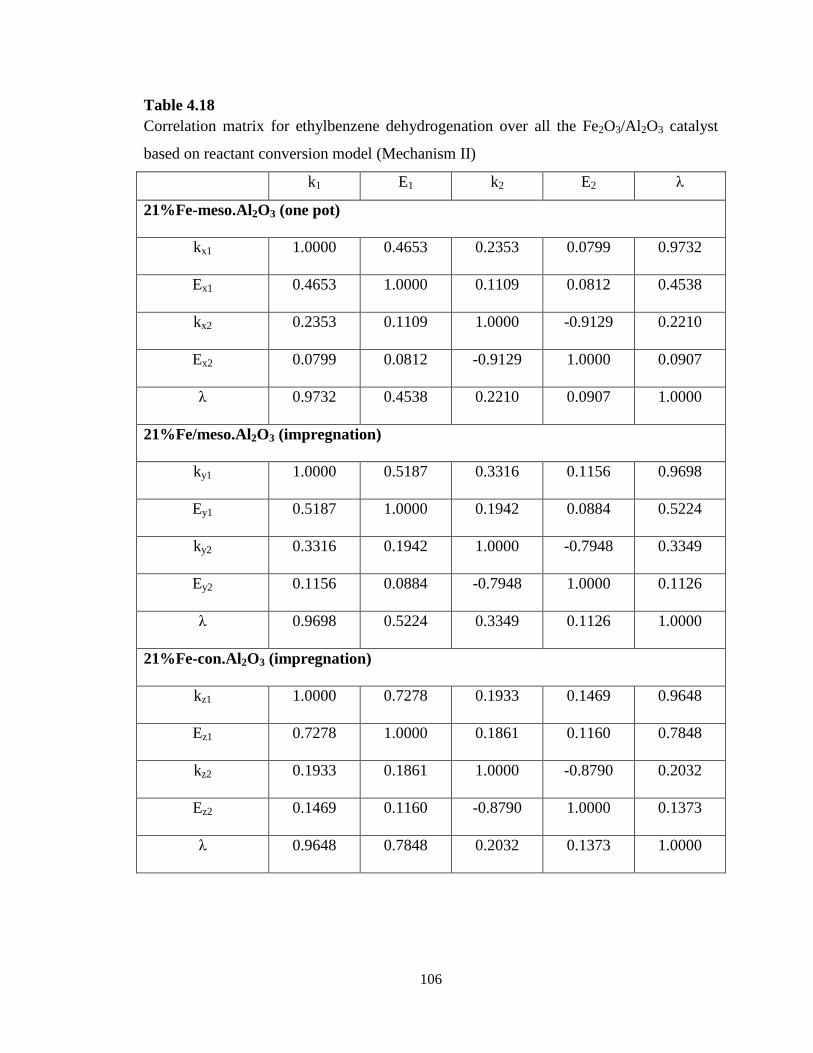
106
Table 4.18
Correlation matrix for ethylbenzene dehydrogenation over all the Fe2O3/Al2O3 catalyst
based on reactant conversion model (Mechanism II)
k1 E1 k2 E2 λ
21%Fe-meso.Al2O3 (one pot)
kx1 1.0000 0.4653 0.2353 0.0799 0.9732
Ex1 0.4653 1.0000 0.1109 0.0812 0.4538
kx2 0.2353 0.1109 1.0000 -0.9129 0.2210
Ex2 0.0799 0.0812 -0.9129 1.0000 0.0907
λ 0.9732 0.4538 0.2210 0.0907 1.0000
21%Fe/meso.Al2O3 (impregnation)
ky1 1.0000 0.5187 0.3316 0.1156 0.9698
Ey1 0.5187 1.0000 0.1942 0.0884 0.5224
ky2 0.3316 0.1942 1.0000 -0.7948 0.3349
Ey2 0.1156 0.0884 -0.7948 1.0000 0.1126
λ 0.9698 0.5224 0.3349 0.1126 1.0000
21%Fe-con.Al2O3 (impregnation)
kz1 1.0000 0.7278 0.1933 0.1469 0.9648
Ez1 0.7278 1.0000 0.1861 0.1160 0.7848
kz2 0.1933 0.1861 1.0000 -0.8790 0.2032
Ez2 0.1469 0.1160 -0.8790 1.0000 0.1373
λ 0.9648 0.7848 0.2032 0.1373 1.0000
107
From the estimated parameters for both mechanisms I and II, organized alumina
favorably supports the active specie and this accounts for the low activation energies as
compared to the conventional alumina as support. The activity of all the Fe2O3/Al2O3
compared to the Mg3Fe0.25Me0.25Al0.5 (Me = Co, Mn, Ni) catalysts shows better
performance, which can be attributed to the orderliness of the mesopores of the alumina
support. Amongst the Fe2O3/Al2O3 catalysts, iron doped organized alumina catalysts
showed improvement in the dehydrogenation of EB to styrene, and the direct synthesis
method best modifies the catalyst activity and selectivity.
Validity check of the estimated parameters was done by substituting the values in
the developed model and then solved numerically using fourth order Runge-Kutta
routine. Figure 4.15(A,B) show the reconciliation plots of the model predictions
compared to experimental data for schemes 2 and 3 respectively. The plot shows an
excellent fit of the experimental data and a regression coefficient, r2 (0.99), was achieved.
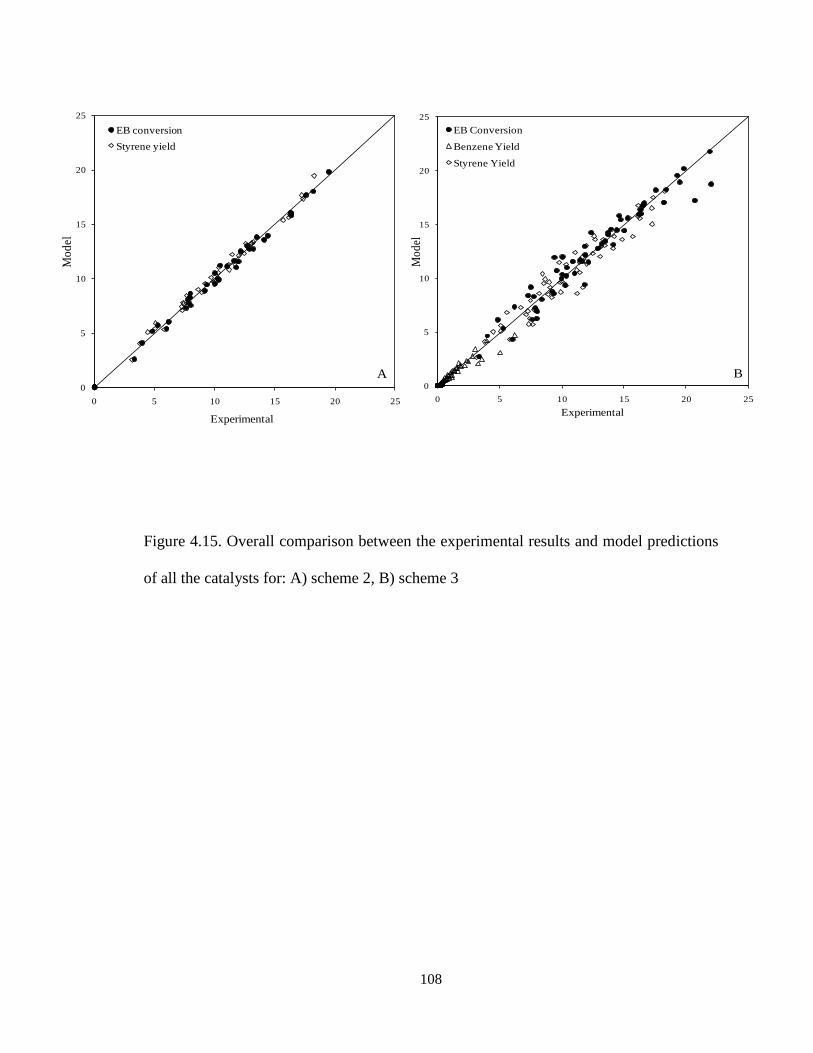
108
Figure 4.15. Overall comparison between the experimental results and model predictions
of all the catalysts for: A) scheme 2, B) scheme 3
0
5
10
15
20
25
0 5 10 15 20 25
Mo
del
Experimental
EB Conversion
Benzene Yield
Styrene Yield
B0
5
10
15
20
25
0 5 10 15 20 25
Mo
del
Experimental
EB conversion
Styrene yield
A
109
CHAPTER 5
5.0 CONCLUSIONS AND RECOMMENDATIONS
5.1 Conclusions
The catalytic dehydrogenation of ethylbenzene into styrene was investigated in a
fluidized bed (novel riser simulator) over hydrotalcite and Fe2O3/Al2O3 catalysts in the
absence of steam. These catalysts were synthesized and characterized and their activities
were compared to the commercial catalyst under similar operating conditions. The
synthesized catalysts exhibited high surface area and mesopore character. The finely
dispersed active species on the catalyst enhanced the catalytic activity and this led to
improved efficiency of the process. In addition to catalyst design, change in reactor
configuration from conventionally used fixed bed reactor to fluidized bed was explored.
Fluidization as a result of high gas recirculation led to a more uniform product
distribution due to elimination of temperature gradient which can adversely affect the
product quality. Furthermore lowering the reaction temperature and short reaction time
limits considerably the occurrence of undesirable reactions due to thermal cracking and
suppressed coking on the catalysts.
Among the series of catalysts synthesized for ethylbenzene dehydrogenation
Fe2O3/Al2O3 catalyst prepared by direct synthesis of loading iron on mesoporous alumina
support (21%Fe-meso.Al2O3) exhibits the highest activity and selectivity. The results of
the XRD, TEM and XPS clearly attribute the presence of highly dispersed active specie
over large catalyst surface area to have increased the active sites of the catalyst which
110
play a role in H-abstraction from hydrocarbons especially β-hydrogen from ethylbenzene.
Ethylbenzene conversion of 19.5% was achieved with a styrene selectivity of ~94% at
reaction temperature of 450 °C and reaction time of 20 s.
Kinetic modeling of the dehydrogenation process was carried out to determine
parameters such as activation energy and rate constants. The significance of the model
was ascertained by the correlation matrix which indicated low and moderate parameter
interaction. The estimated kinetic parameters also had a tolerable confidence limit, and an
excellent fit of the experimental data was obtained. These results confirmed the observed
product distribution over the catalysts which have been attributed to the catalyst
composition.
5.2 Recommendations
Based on the results of this study,
i. Adsorption kinetics of ethylbenzene dehydrogenation over the hydrotalcite and
Fe2O3/Al2O3 catalyst should be investigated.
ii. Oxidative dehydrogenation of ethylbenzene to styrene using CO2 as a soft oxidant
over both catalyst systems.
iii. Detailed study of catalyst deactivation mechanism.

111
APPENDIX
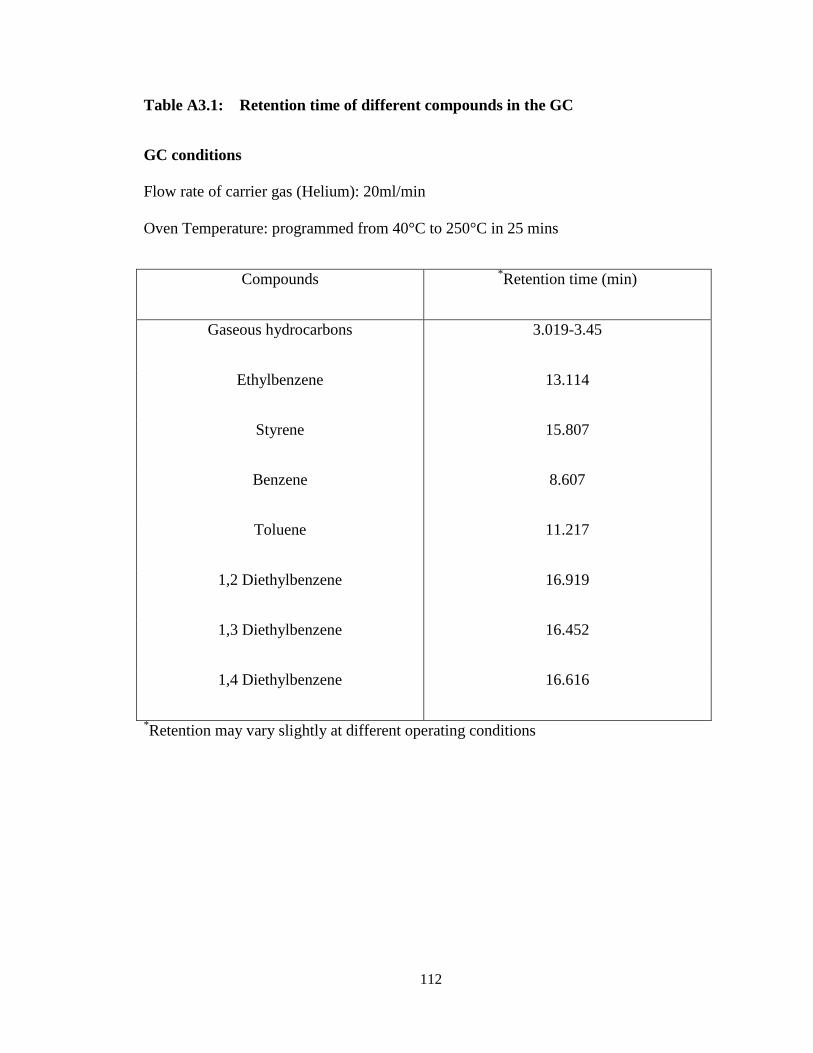
112
Table A3.1: Retention time of different compounds in the GC
GC conditions
Flow rate of carrier gas (Helium): 20ml/min
Oven Temperature: programmed from 40°C to 250°C in 25 mins
Compounds *Retention time (min)
Gaseous hydrocarbons 3.019-3.45
Ethylbenzene 13.114
Styrene 15.807
Benzene 8.607
Toluene 11.217
1,2 Diethylbenzene 16.919
1,3 Diethylbenzene 16.452
1,4 Diethylbenzene 16.616
*Retention may vary slightly at different operating conditions
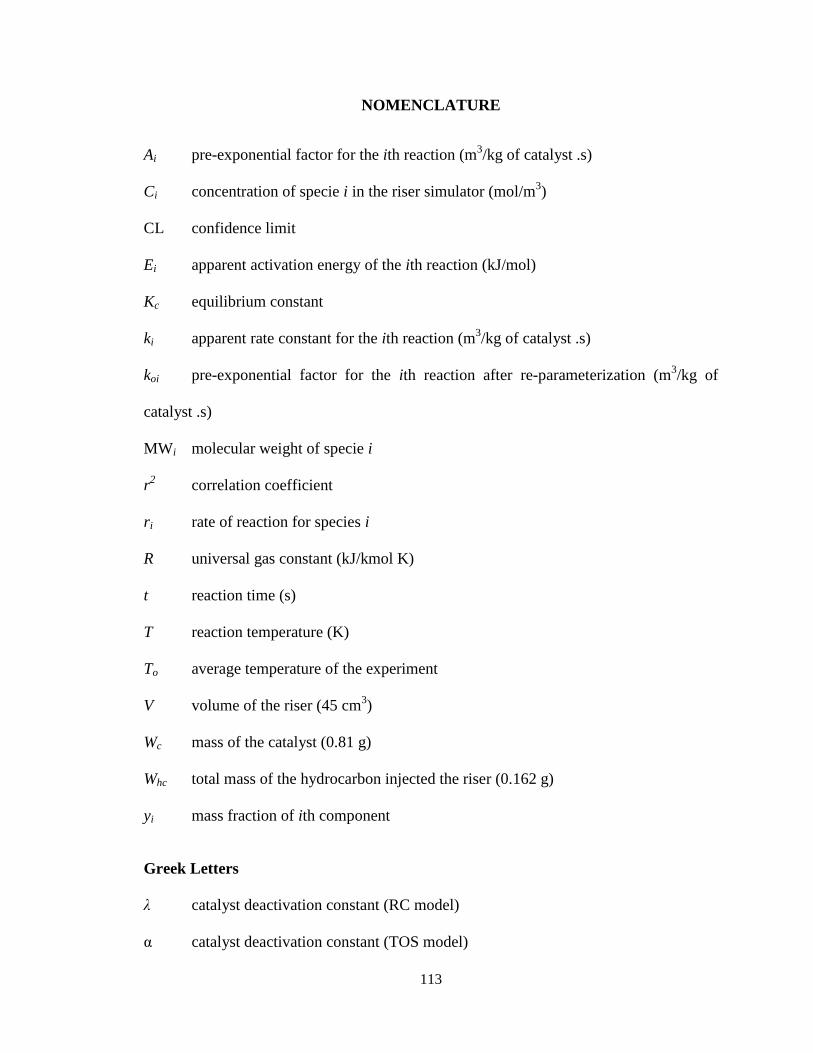
113
NOMENCLATURE
Ai pre-exponential factor for the ith reaction (m3/kg of catalyst .s)
Ci concentration of specie i in the riser simulator (mol/m3)
CL confidence limit
Ei apparent activation energy of the ith reaction (kJ/mol)
Kc equilibrium constant
ki apparent rate constant for the ith reaction (m3/kg of catalyst .s)
koi pre-exponential factor for the ith reaction after re-parameterization (m3/kg of
catalyst .s)
MWi molecular weight of specie i
r2 correlation coefficient
ri rate of reaction for species i
R universal gas constant (kJ/kmol K)
t reaction time (s)
T reaction temperature (K)
To average temperature of the experiment
V volume of the riser (45 cm3)
Wc mass of the catalyst (0.81 g)
Whc total mass of the hydrocarbon injected the riser (0.162 g)
yi mass fraction of ith component
Greek Letters
λ catalyst deactivation constant (RC model)
α catalyst deactivation constant (TOS model)
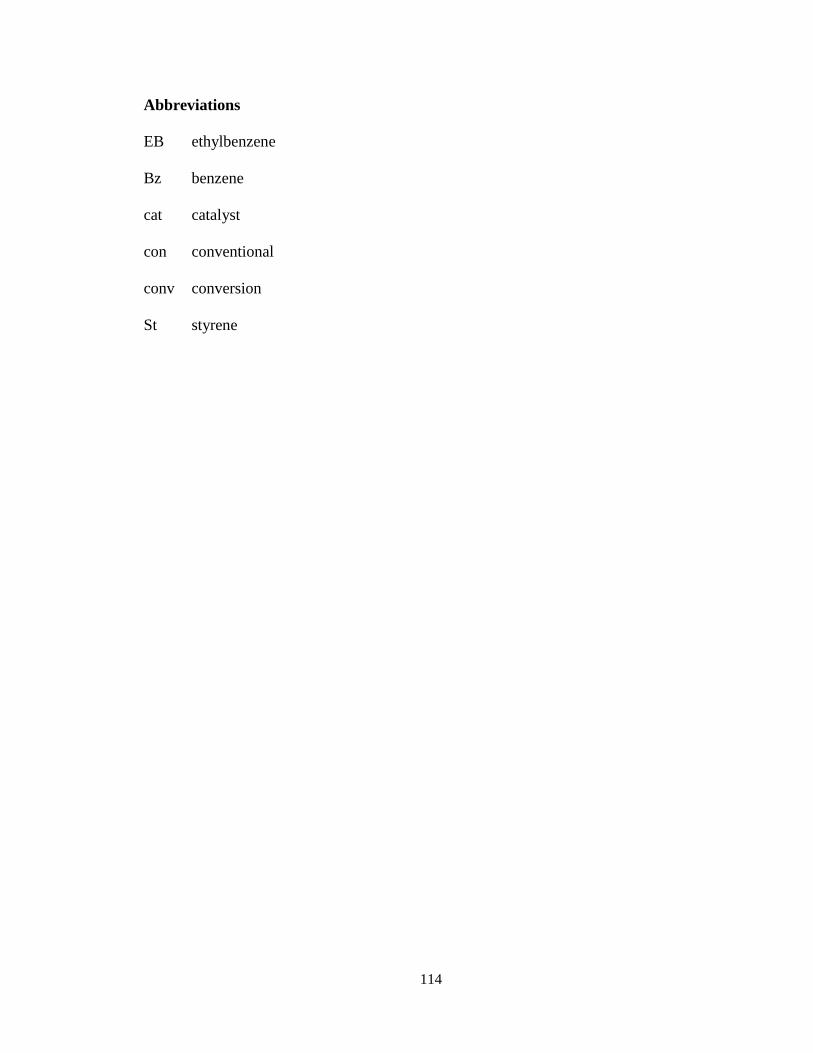
114
Abbreviations
EB ethylbenzene
Bz benzene
cat catalyst
con conventional
conv conversion
St styrene
115
REFERENCES
[1] http://www.styreneforum.org/
[2]http://www.chemsystems.com/about/cs/news/items/PPE%20PCMD%20Styrenics%20
2009.cfm
[3] K. Tanabe, W. F. Hölderich, Industrial application of solid acid-base catalysts.
Appl. Catal. A Gen. 181 (1999) 399-434.
[4] www.dequi.eel.usp.br/~barcza/EstirenoUOP.pdf
[5] J.P. Lange, C. M. A. M. Mesters, Mass transport limitations in zeolite catalysts:
the dehydration of 1-phenyl-ethanol to styrene. Appl. Catal. A: Gen. 210 (2001)
247-255.
[6] Studies in surface science and catalysis 123 (1999) 29-80
[7] F. Buonomo, R. Iezzi, E. Micheli, D. Sanfilippo, Catalytic system and process for
dehydrogenating ethylbenzene to styrene, US Patent 5,994,258, 1999.
[8] F. Buonomo, G. Donati, E. Micheli, L. Tagliabue, Process for the production of
styrene, US Patent 6,031,143, 2000
[9] H. Hattori, Heterogeneous basic catalysis. Chem. Rev. 95 (1995) 537-558.
[10] Brownstein, A. M., “Chem. Indus. Ser. 5, Catalysis of Organic Reactions,”
Moser, New York, 1981.
[11] http://www.freepatentsonline.com/4851599.html
[12] Y. Jin, W. Liang, Z. Wang, Z. Yu, E. Min, M. He, Z. Da, Aromatic hydrocarbons
alkylation and liquid-solid circulating fluidized bed for alkylation, US Patent
5,789,640 (1998).
[13] Griesbaum K. et al. (1989) Hydrocarbons, in: Ullmann’s encyclopedia of
industrial chemistry, Weinheim, VCH, 1985-1996, 37v.; v. A13, 227-281.
[14] E. H. Lee, Iron oxide catalysts for dehydrogenation of ethylbenzene in the
presence of steam, Catal. Rev. Eng. Sci. 8 (1973) 285-305.
[15] F. Cavani, F. Trifirò, Alternative processes for the production of styrene. Appl.
Catal. A 133 (1995) 219-239.
116
[16] N. Mimura, I. Takahara, M. Saito, T. Hattori, K. Ohkuma, M. Ando,
Dehydrogenation of ethylbenzene over iron oxide-based catalyst in the presence
of carbon dioxide. Catal. Today, 45 (1998) 61-64.
[17] Kearby, K. K. (to Standard Oil Development Company) U.S. Patent 2426829,
Sept 2, 1947
[18] T. Hirano, Roles of potassium in potassium-promoted iron-oxide catalyst for
dehydrogenation of ethylbenzene. Appl. Catal. 26 (1986) 65-79.
[19] T. Hirano, Dehydrogenation of ethylbenzene over potassium-promoted iron oxide
containing cerium and molybdenum oxides. Appl. Catal. 28 (1986) 119-132.
[20] M. Muhler, J. Schütze, M. Wesemann, T. Rayment, A. Dent, R. Schlögl, G. Ertl.
Nature of the iron oxide-based catalyst for dehydrogenation of ethylbenzene to
styrene. 1. Solid-state chemistry and bulk characterization. J. Catal. 126 (1990)
339-360.
[21] E. H. Lee, L. H. Holmes Jr., Effect of alkali and alkaline earth promoters on iron
oxide catalysts for dehydrogenation of ethylbenzene in the presence of steam. J.
Phys. Chem. 67 (1963) 947-949.
[22] S. C. Ndlela, B. H. Shanks, Reducibilty of potassium-promoted iron oxide under
hydrogen conditions. Ind. Eng. Chem. Res. 42 (2003) 2112-2121.
[23] R. L. Hirsch, J. E. Gallagher, R. R. Lessard, R. D. Wesselhoft, Science 215 (1982)
121-127.
[24] S. -J. Liao, T. Chen, C. -X. Miao, W. -M. Yang, Z. -K. Xie, Q. -L. Chen, Effect of
TiO2 on the structure and catalytic behavior of iron-potassium oxide catalyst for
dehydrogenation of ethylbenzene to styrene. Catal. Comm. 9 (2008) 1817-1821
[25] T. Hirano, Dehydrogenation of ethylbenzene on potassium-promoted iron-oxide
catalysts containing magnesium oxide. Bull. Chem. Soc. Jpn. 59 (1986) 2672-
2674
[26] G. R. Meima, P. G. Menon, Catalyst deactivation phenomena in styrene
production Applied Catalysis A: Gen. 212 (2001) 239–245
[27] J. G. P. Sheel, C. M. Crowe, Simulation and optimization of an existing
ethylbenzene dehydrogenation reactor. Can. J. Chem. Eng. 47 (1969) 183-187
117
[28] D. E. Clough, W. F. Ramirez, Mathematical modeling and optimization of the
dehydrogenation of ethylbenzene to form styrene. AIChE J. 22 (1976) 1097-1105.
[29] S. S. E. H. Elnashaie, B. K. Abdalla, R. Hughes, Simulation of the Industrial
Fixed-Bed Catalytic Reactor for the Dehydrogenation of Ethylbenzene to Styrene
- Heterogeneous Dusty Gas-Model. Ind. Eng. Chem. Res. 32 (1993) 2537-2541.
[30] S. Carrà, L. Forni, Kinetics of catalytic dehydrogenation of ethylbenzene to
styrene. Ind. Eng. Chem. Process Des. Dev. 4 (1965) 281–285.
[31] T. Hirano, Active Phase in Potassium-Promoted Iron-Oxide Catalyst for
Dehydrogenation of Ethylbenzene. Appl. Catal. 26 (1986) 81-90.
[32] R. Dittmeyer, V. Höllein, P. Quicker, G. Emig, G. Hausinger, F. Schmidt, Factors
Controlling the Performance of Catalytic Dehydrogenation of Ethylbenzene in
Palladium Composite Membrane Reactors. Chem. Eng. Sci. 54 (1999) 1431–
1439.
[33] A. Schüle, O. Shekhah, W. Ranke, R. Schlögl, G. Kolios, Microkinetic Modelling
of the Dehydrogenation of Ethylbenzene to Styrene over Unpromoted Iron
Oxides. J. Catal. 231 (2005) 172–180.
[34] W. J. Lee, G. F. Froment, Ethylbenzene dehydrogenation to styrene: kinetic
modeling and reactor simulation. Ind. Eng. Chem. Res. 47 (2008) 9183–9194.
[35] K. Coulter, D. W. Goodman, R. G. Moore, Kinetics of the Dehydrogenation of
Ethylbenzene to Styrene over Unpromoted and K Promoted Model Iron-Oxide
Catalysts. Catal. Lett. 31 (1995) 1–8.
[36] W. P Addiego, C. A. Estrada, D. W. Goodman, M. P. Rosynek, R. G. Windham,
An infrared study of the dehydrogenation of ethylbenzene to styrene over iron-
based catalysts. J. Catal. 146 (1994) 407-414.
[37] H. Miura, R. Ansai, H. Kawai. Deuterium exchange reaction of ethylbenzene over
an Fe2O3- K2CO3- Cr2O3 catalyst. React. Kinet. Catal. Lett. 53 (1994) 323-329.
[38] N. Dulamiţă, A. Măicăneanu, D. C. Sayle, M. Stanca, R. Crăciun, M. Olea, C.
Afloroaei, A. Fodor, Ethylbenzene dehydrogenation on Fe2O3- K2CO3- Cr2O3
catalysts promoted with transitional metal oxides. Appl. Catal. A: General 287
(2005) 9-18.
[39] A. H. de Morais Batista, F. F. de Sousa, S. B. Honorato, A. P. Ayala, J. M. Filho,
F. W. de Sousa, A. N. Pinheiro, J. C. S. de Araujo, R. F. Nascimento, A.
118
Valentini, A. C. Oliveira, Ethylbenzene to chemcials: catalytic conversion of
ethylbenzene into styrene over metal-containing MCM-41. J. Mol. Catal. A:
Chemical 315 (2010) 86-98.
[40] F. Cavani, F. Trifirò, A. Vaccari, Hydrotalcite-type anionic clays: Preparation,
properties and applications. Catal. Today, 11 (1991) 173-301.
[41] A. Vaccari, Preparation and catalytic properties of cationic and anionic clays.
Catal. Today 41 (1998) 53-71.
[42] J. L. Atwood, J. E. Davies, J. E. D. MacNicol D. D. Vogtle, F. Eds, In
Comprehensive Supramolecular Chemistry. Pergamon Press: Oxford, U.K., 1996;
Vol. 7, pp 251-91.
[43] D. P. Debecker, E. M. Gaigneaux, G. Busca, Exploring, tuning, and exploiting the
basicity of hydrotalcites for applications in heterogeneous catalysis. Chem. Eur. J.
15 (2009) 3920-3935.
[44] Y. Liu, E. Lotero, J. G. Goodwin, X. Mo, Transesterification of poultry fat with
methanol using Mg–Al hydrotalcite derived catalysts. Appl. Catal. A Gen. 331
(2007) 138-148.
[45] M. J. Climent, A. Corma, S. Iborra, K. Epping, A. Velty, Increasing the basicity
and catalytic activity of hydrotalcites by different synthesis procedures. J. Catal.
225 (2004) 316–326.
[46] Y. Ohishi, T. Kawabata, T. Shishido, K. Takaki, Q. Zhang, Y. Wang, K. Nomura,
K. Takehira, Mg-Fe-Al mixed oxides with mesoporous properties prepared from
hydrotalcite as precursors: Catalytic behavior in ethylbenzene dehydrogenation.
Appl. Catal. A Gen. 288 (2005) 220-231.
[47] R. J. Balasamy, A. Khurshid, A. A. S Al-Ali, L. A. Atanda, K. Sagata, H Yahiro,
K. Nomura, T. Sano, K. Takehira, S. S. Al-Khattaf, Ethylbenzene
dehydrogenation over binary FeOx-MeOy/Mg(Al)O catalysts derived from
hydrotalcites. Appl. Catal. A Gen. 390 (2010) 225-234.
[48] R. J. Balasamy, B. B. Tope, A. Khurshid, A. A. S. Al-Ali, L. A Atanda, K.
Sagata, M. Asamoto, H. Yahiro, K. Nomura, T. Sano, K. Takehira, S. S. Al-
Khattaf, Ethylbenzene dehydrogenation over FeOx/(Mg,Zn)(Al)O catalysts
derived from hydrotalcites: Role of MgO as the catalyst support. Appl. Catal. A
Gen. 398 (2011) 113-122.
119
[49] H. Pines, W. O. Haag, Alumina: Catalyst and Support. I. Alumina, its Intrinsic
Acidity and Catalytic Activity. J. Am. Chem. Soc. 82 (1960) 2471-2483
[50] C. Misra Industrial Alumina Chemicals; ACS Monograph 184; American
Chemical Society: Washington, DC, 1986.
[51] K. Wefers, C. Misra, Oxides and Hydroxides of Aluminum. Alcoa Technical
Paper No. 19, Revised; Alcoa Laboratories: Alcoa Center, PA, 1987.
[52] J. S. Valente, X. Bokhimi, F. Hermandez, Physicochemical and Catalytic
Properties of Sol−Gel Aluminas Aged under Hydrothermal Conditions.
Langmuir, 19 (2003) 3583-3588
[53] J. Cejka, Organized mesoporous alumina: synthesis, structure and potential in
catalysis. Appl. Catal. A Gen. 254 (2003) 327-338.
[54] Q. Liu, A. Q. Wang, X. H. Wang, W. D. Guo, T. Zhang, Synthesis,
characterization and catalytic applications of mesoporous gamma-alumina from
boehmite sol. Micropor. Mesopor. Mater. 111 (2008) 323-333.
[55] H. C. Lee, H. J. Kim, C. H. Rhee, K. H. Lee, S. H. Chung, Synthesis of
nanostructured γ-alumina with a cationic surfactant and controlled amounts of
water. Micropor. Mesopor. Mater. 79 (2005) 61-68.
[56] V. G. Pena, I. Diaz, C. M. Alvarez, Thermally stable mesoporous alumina
synthesized with nonionic surfactants in the presence of amines. Micropor.
Mesopor. Mater. 44 (2001) 203-210.
[57] Q. Liu, A. Q. Wang, X. D. Wang, Mesoporous gamma-alumina synthesized by
hydro-carboxylic acid as structure-directing agent. Micropor. Mesopor. Mater. 92
(2006) 10-21.
[58] L. J. Wan, H. G. Fu, K. Y. Shi, X. Q. Tian, Facile synthesis of ordered
nanocrystalline alumina thin films with tunable mesopore structure. Micropor.
Mesopor. Mater. 115 (2008) 301-307.
[59] S. M. Kim, Y. J. Lee, K. W. Jun, J. Y. Park, H. S. Potdar, Synthesis of thermo-
stable high surface area alumina powder from sol–gel derived boehmite. Mater.
Chem. Phys. 104 (2007) 56-61.
[60] R. H. Zhao, F. Guo, Y. Q. Hu, Self-assembly synthesis of organized mesoporous
alumina by precipitation method in aqueous solution. Micropor. Mesopor. Mater.
93 (2006) 212-216.
120
[61] P. Bai, W. Xing, Z. X. Zhang, Facile synthesis of thermally stable mesoporous
crystalline alumina by using a novel cation-anion double hydrolysis method.
Mater. Lett. 59 (2005) 3128-3131.
[62] X. Zhang, F. Zhang, K. Y. Chan, The synthesis of large mesopores alumina by
microemulsion templating, their characterization and properties as catalyst
support Mater. Lett. 58 (2004) 2872-2877.
[63] Q. Yuan, A. X. Yin, C. Luo, L. –D. Sun, Y. –W. Zhang, W. –T. Duan, H. –C. Liu,
C. –H. Yan, Facile synthesis for ordered mesoporous γ-aluminas with high
thermal stability. J. Am. Chem. Soc. 130 (2008) 3465-3472
[64] S. M. Morris, P. F. Fulvio, M. Jaroniec, Ordered mesoporous alumina-supported
metal oxides. J. Am. Chem. Soc. 130 (2008) 15210-15216
[65] F. Huang, Y. Zheng, G. Cai, Y. Zheng, Y. Xiao, K. Wei, A new synthetic
procedure for ordered mesoporous γ-alumina with a large surface area. Scripta
Materialia 63 (2010) 339-342
[66] P. Michorczyk, P. Kuśtrowski, L. Chmielarz, J. Ogonowski, Influence of redox
properties on the activity of iron oxide catalysts in dehydrogenation of propane
with CO2. React. Kinet. Catal. Lett. 82 (2004) 121-130
[67] G. Giecko, T. Borowiecki, W. Gac, J. Kruk, Fe2O3/Al2O3 catalysts for the N2O
decomposition in the nitric acid industry. Catal. Today 137 (2008) 403–409
[68] N. Mimura, M. Saito, Dehydrogenation of ethylbenzene to styrene over
Fe2O3/Al2O3 catalysts in the presence of carbon dioxide. Catal. Lett. 58 (1999)
59–62
[69] de Lasa, H. Riser Simulator for Catalytic Cracking Studies. U.S. Patent
5,102,628, 1992
[70] J. Pruski, A. Pekediz, H. de Lasa, Catalytic cracking of hydrocarbons in a novel
riser simulator. Lump adsorption parameters under reaction conditions, Chem.
Engng. Sci. 51 (1996) 1799-1806.
[71] D.W. Kraemer, U. Sedran, H.I. de Lasa, Catalytic cracking kinetics in a novel
riser simulator, Chem. Engng. Sci. 45 (1990) 2447–2452.
[72] S. Miyata, A. Okada, Synthesis of hydrotalcite-like compounds and their
physicochemical properties-the systems Mg2+
-Al3+
-SO2−
4 and Mg2+
-Al3+
-
CrO2−
4. Clays Clay Miner. 25 (1977) 14–18.
121
[73] R.D. Shannon, Revised effective ionic radii and systematic studies of interatomic
distances in halides and chalcogenides. Acta Crystallogr. A 32 (1976) 751–767.
[74] X. Ge, M. Li, J. Shen, The reduction of Mg-Fe-O and Mg-Fe-Al-O complex
oxides studied by temperature-programmed reduction combined with in situ
mössbauer spectroscopy. J. Solid State Chem. 161 (2001) 38-44.
[75] D. Li, I. Atake, T. Shishido, Y. Oumi, T. Sano, K. Takehira, Self-regenerative
activity of Ni/Mg(Al)O catalysts with trace Ru during daily start-up and shut-
down operation of CH4 steam reforming. J. Catal. 250 (2007) 299-312.
[76] A. Chen, H. Xu, Y. Yue, W. Hua, W. Shen, Z. Gao, Hydrogenation of methyl
benzoate to benzaldehyde over manganese oxide catalysts prepared from
Mg/Mn/Al hydrotalcite-like compounds. Appl. Catal. A 274 (2004) 101-109.
[77] T. Hirano, Dehydrogenation of ethylbenzene on potassium-promoted iron-oxide
catalysts containing various transitional-metal oxides. Bull. Chem. Soc. Jpn. 59
(1986) 1653-1655.
[78] S. Al-Khattaf, H. de Lasa, Catalytic Cracking of Cumene in a Riser Simulator: A
Catalyst Activity Decay Model. Ind. Eng. Chem. Res 40 (2001) 5398-5404.
[79] A. K. Agarwal, M. L. Brisk, Sequential experimental design for precise parameter
estimation. 1. Use of reparameterization. Ind. Eng. Chem. Process Des. Dev. 24,
(1985) 203-207.
[80] A. Voorhies, Carbon formation in catalytic cracking, Ind. Eng. Chem. Res. 37
(1945) 318–322.
[81] J. S. Valente, F. Figueras, M. Gravelle, P. Kumbhar, J. Lopez, J. P. Besse, Basic
properties of the mixed oxides obtained by thermal decomposition of
hydrotalcites containing different metallic compositions. J. Catal. 189 (2000) 370-
381.
[82] M. Kruk, M. Jaroniec, Gas adsorption characterization of ordered organic-
inorganic nanocomposite materials. Chem. Mater. 2001 13 (10) 3169-3183.
122
VITAE
NAME: Luqman Abiola Atanda
NATIONALITY: Nigerian
DATE OF BIRTH: March 15, 1985
PLACE OF BIRTH: Ogun State, Nigeria
EDUCATION: B.Sc. Metallurgical and Materials
Engineering (First Class)
University of Lagos, Akoka,
Nigeria, November 2007
M.Sc. Chemical Engineering (Distinction)
King Fahd University of Petroleum &
Minerals, Dhahran,
Kingdom of Saudi Arabia, May 2011.
EMAIL ADDRESS: [email protected]
CONTACT ADDRESS: 7/9 Olabode Tomori Close, Idi-Aba,
Abeokuta,
Ogun State, Nigeria
PHONE NUMBER: +966535443431