dataflow-inspired parallel and distributed computing - lirias
TRANSCRIPT
ARENBERG DOCTORAL SCHOOLFaculty of Engineering Science
Dataflow-inspired parallel anddistributed computingPractical techniques and real-world use cases
Zubair Wadood Bhatti
Dissertation presented in partialfulfillment of the requirements for the
degree of Doctor in Engineering
July 2014

Dataflow-inspired parallel and distributed computing
Practical techniques and real-world use cases
Zubair Wadood BHATTI
Supervisory Committee:Prof. dr. ir. Hendrik Van Brussel, chairProf. dr. ir. Yolande Berbers, supervisorProf. dr. Roel Wuyts, co-supervisorProf. dr. ir. Geert DeconinckProf. dr. Danny HugesProf. dr.ir. Tom Holvoet
Prof. dr. Wim Vanroose(Universiteit Antwerpen)
Dissertation presented in partialfulfillment of the requirements forthe degree of Doctorin Engineering
July 2014

© 2013 KU Leuven – Faculty of Engineering ScienceUitgegeven in eigen beheer, Zubair Wadood Bhatti, Celestijnenlaan 200A box 2402, B-3001Heverlee (Belgium)
Alle rechten voorbehouden. Niets uit deze uitgave mag worden vermenigvuldigd en/of openbaargemaakt worden door middel van druk, fotokopie, microfilm, elektronisch of op welke andere wijzeook zonder voorafgaande schriftelijke toestemming van de uitgever.
All rights reserved. No part of the publication may be reproduced in any form by print, photoprint,microfilm, electronic or any other means without written permission from the publisher.
ISBN 978-94-6018-874-9D/2014/7515/98

i
In the name of God, the Most Gracious, the Most Merciful


Acknowledgments
The research presented in this dissertation has only been possible withthe help and support of many. I wish to acknowledge some of them.
I am grateful to my supervisors Yolande Berbers and Roel Wuyts forproviding me with the support, help and guidance for accomplishing thisresearch. I thank Yolande for providing me the opportunity to start myPhD at KU Leuven. She always encouraged me by being positive aboutmy research throughout the span of the PhD. I learned not only researchfrom her but also improved various soft skills under her guidance. I amthankful to Roel for always being available to guide me at every step andhelp me write papers. Roel always asked the right questions that helpedme develop a deep understanding of the different topics in my thesis.
I am grateful to Geert Deconinck, Danny Huges, Wim Vanroose,Tom Holvoet and Hendrik Van Brussel for being a part of my PhDcommittee and for their insightful comments that helped significantly inimproving this text.
I am indebted to Davy Preuveneers for always showing his sincere concernin my work. His advice and guidance has been fundamental to theprogress of my research. Thank you Davy for proof reading most of mytext and for always being very prompt with all kinds of help and supportthroughout my PhD.
I would like to thank all members of DistriNet. It was indeed a pleasureand an honor to be a part of this research group. I would like to thankespecially the members of the embedded and ubiquitous systems taskforce for their suggestions and feedback in our meetings. Thank you,
iii

iv ACKNOWLEDGMENTS
Koosha Paridel, Naeem Muhammad, Ansar-Ul-Haque Yasar, Nayyab ZiaNaqvi, Arun Ramakrishnan, Dries Langsweirdt, Aram Hovsepyan, BertVanhoof, Stefan Van Baelen and Yves Vanrompay. It was great to be amember of this team.
My sincere regards to the partners in the OptiMMA project. Thank youNarasinga Rao Miniskar, Shahid Mehmood Satti, Dirk Stroobant, Mar-garete Sackmann, Poona Behrabar, Leon Denis and Geert Vanmeerbeeck.It was delightful to work with all of you.
I would also like to acknowledge the members of the Intel ExaScience Labfor the technical/non-technical support and exchange of ideas. Thankyou, Pascal Costanza, Albert-Jan Yzelman, Wim Heirman, CharlotteHerzeel, Gert Pauwels and everyone else. It was a great experience tocollaborate with you.
Not forgetting the important contribution of my dear friends in Leuven.Thank you, Aftab, Amir, Ashraf, Ali, Asim, Azeem, Ansar, Zubair,Waqas, Hidayat, Pervaiz Baig, Sughis, Shahab, Shaza, Obaid, Nizabat,Ramzan, Ahmed Zaib, Bivragh, Khurram, Rehan, Zohaib, Muneeb,Salman, Amir Shah and Shakeeb for always being there for me. I wouldlike to thank my office mates Italo and Andreas for their wonderfulcompany.
Most importantly I would like to show my deepest gratitude to my family.I have no words to thank my dearest parents for their endless and sinceresupport throughout my life. Without their encouragement and guidanceI would not have been able to achieve anything. I would like to thank mysiblings Rabiya and Usman for their continuous concern and affection.My deepest gratitude to my lovely wife Zahra, not only for proof readingthis text but also for her unconditional love and care throughout thejourney. Her support in so many different forms was fundamental to thesuccess of this thesis.
Abstract
Due to the advent of multi-processor system-on-chip (MPSoC), paralleland distributed computing has become one of the most activefields of research in computational science. Key challenges inparallel and distributed computing include: development of concurrentprogramming models, deployment, scheduling, memory management andsynchronization. Dataflow inspired modeling and execution techniqueshave emerged as promising enabling technologies for addressing theseconcerns by organizing computation and data at a high level ofabstraction.
While deemed promising, practical application of dataflow programmingfaces a number of challenges: (1) Unavailability of reusable librariesand kernels, (2) limitations of dataflow models in expressing dynamicdata-dependent program structures, (3) inadequate middleware supportand (4) lack of adaptions of existing techniques for different domains ofparallel and distributed computing.
In this thesis, we show how these challenges can be overcome, not in ageneral way, but for specific applications, chosen from different applicationdomains and with different characteristics. The first domain is high-performance computing, where we applied a dataflow-based programmingmodel to stencil computations. The second domain is real-time embeddedcomputing where we improved middleware support for dataflow models,focusing on optimizing schedules of applications on MPSoCs. The thirddomain is ubiquitous computing, where we apply dataflow-based modelingand optimization techniques, in order to deploy applications in ubiquitousenvironments.
v
vi ABSTRACT
Our results show that programming stencil operations with dynamictask graphs reduces their synchronization overhead, resulting in animplementation that scales better than the state-of-the-art. For mappingand scheduling applications on MPSoCs, we observe that modeling theinter-dependencies that enable tighter coupling between different aspectsof the system i.e. computation, communication and memory, improvesthe energy efficiency and/or performance of the system. The executionsemantics of dataflow models play a key role in enabling this tightly-coupled scheduling. Use cases in the domain of ubiquitous computingdemonstrate the usage of dataflow-based modeling and optimizationtechniques for the deployment and configuration of dynamic applicationsin highly heterogeneous and distributed systems.
This dissertation showed how dataflow programming improves theprogramming of parallel and distributed systems for use cases in threedifferent domains. We hope these are the first steps in the directions ofa widely adopted dataflow-based renaissance in parallel and distributedcomputing.
Samenvatting
Als gevolg van de komst van multi-processor system-on-chip (MPSoC) isparallel en gedistribueerd rekenen uitgegroeid tot één van de meest actievegebieden voor onderzoek in computerwetenschappen. De belangrijksteuitdagingen in parallel en gedistribueerd rekenen zijn het ontwikkelenvan parallelle programmeermodellen en de implementatie, planning,geheugenbeheer en synchronizatie ervan. Een veelbelovende techniek omdeze problemen aan te pakken zijn dataflow geïnspireerde modellerings-en uitvoer technieken.
Hoewel veelbelovend zijn er evenwel nog uitdagingen voor de praktischetoepassing van dataflow programmering zoals (1) het niet beschikbaar zijnvan herbruikbare bibliotheken, (2) de beperkingen in het uitdrukken vandynamische data-afhankelijkheden, (3) matige middleware ondersteuning,en (4) niet voldoende modellen die aangepast zijn aan de specifiekecontext van parallel en gedistribueerd rekenen.
Dit proefschrift laat zien hoe deze problemen kunnen worden aangepakt inde context van specifieke toepassingen. Deze toepassingen werden gekozenuit verschillende domeinen en hebben verschillende karakteristieken. Heteerste domein is high-performance computing, waar we een dynamischdataflow-gebaseerd model gebruiken voor het uitvoeren van stencilberekeningen. Het tweede domain is real-time embedded computing waarwe een verbeterde middleware ondersteuning voor dataflow modellenaanbieden gericht op het optimaliseren van toepassingen voor MPSoCplatformen. Het derde domein is ubiquitous computing waar we dataflow-gebaseerde modellering en optimalisaties gebruiken voor toepassingen inalomtegenwoordige omgevingen.
vii

viii SAMENVATTING
Onze resultaten met het gebruiken van dynamische dataflow voorstencil operaties laten zien dat we vooral de synchronisatie overheadbeperken, wat resulteert in een betere performantie dan wat mogelijkis met de state-of-the-art stencil compilers. Wat het optimaliseren vantoepassingen voor MPSoC systemen betreft blijkt dat onze oplossingdie de drie belangrijkste deelaspecten van een applicatie (berekening,communicatie en geheugengebruik) samen modelleert een verbeterdeenergie-efficiëntie en/of prestatie van het systeem oplevert. Het is deuitvoerings-semantiek van dataflow modellering die een belangrijke rolspeelt in het behalen van deze verbeterde resultaten. In het derdedomein van alomtegenwoordige omgevingen demonstreren we het gebruikvan dataflow-gebaseerde modellerings- en optimalisatietechnieken voorde implementatie en configuratie van dynamische toepassingen in zeerheterogene gedistribueerde systemen.
Dit proefschrift laat zien hoe dataflow-gebaseerde technieken hetprogrammeren en uitvoeren van parallelle en gedistribueerde systemenverbetert in drie verschillende domeinen. We hopen dat dit de eerstestappen zijn in de richting van een algemeen aanvaarde dataflow-gebaseerde renaissance in parallelle en gedistribueerd rekenen.
Contents
Abstract v
Contents ix
List of Figures xv
List of Tables xix
1 Introduction 1
1.1 Stagnation of the single core performance . . . . . . . . . 2
1.2 Challenges of parallel and distributed computing . . . . . 3
1.2.1 Programming models . . . . . . . . . . . . . . . . . 5
1.2.2 Memory management . . . . . . . . . . . . . . . . 5
1.2.3 Scheduling . . . . . . . . . . . . . . . . . . . . . . . 6
1.2.4 Synchronization . . . . . . . . . . . . . . . . . . . . 6
1.3 Dataflow-based approaches to concurrent software . . . . 7
1.3.1 Dataflow programming models . . . . . . . . . . . 7
1.3.2 Dataflow-based memory management of concurrentprograms . . . . . . . . . . . . . . . . . . . . . . . 8
ix
x CONTENTS
1.3.3 Dataflow-based scheduling of concurrent programs 9
1.3.4 Synchronization of Dataflow programs . . . . . . . 9
1.4 Use cases . . . . . . . . . . . . . . . . . . . . . . . . . . . 9
1.4.1 Stencil operations in high-performance computing 9
1.4.2 Real-time applications in embedded systems . . . . 10
1.4.3 Component based applications in ubiquitous envi-ronments . . . . . . . . . . . . . . . . . . . . . . . 10
1.5 Contributions . . . . . . . . . . . . . . . . . . . . . . . . . 11
1.5.1 Contribution 1: Parallel stencil operation usingdynamic task graphs . . . . . . . . . . . . . . . . . 11
1.5.2 Contribution 2: Design-time exploration of Paretooptimal mappings for embedded applications . . . 12
1.5.3 Contribution 3: Exploring deployment and configu-ration tradeoffs for ubiquitous computing applications 13
1.6 Structure of the thesis . . . . . . . . . . . . . . . . . . . . 14
2 Parallel programming using dataflow models 15
2.1 Dataflow programming models . . . . . . . . . . . . . . . 15
2.1.1 Task based dataflow models . . . . . . . . . . . . . 17
2.1.2 Process based dataflow models . . . . . . . . . . . 17
2.2 Scheduling of dataflow programs . . . . . . . . . . . . . . 18
2.2.1 Static scheduling . . . . . . . . . . . . . . . . . . . 18
2.2.2 Dynamic scheduling . . . . . . . . . . . . . . . . . 19
2.2.3 Quasi-static and scenario-aware scheduling . . . . 21
2.3 Memory management of dataflow programs . . . . . . . . 22
2.3.1 Buffer dimensioning . . . . . . . . . . . . . . . . . 22

CONTENTS xi
2.3.2 Cache optimization techniques . . . . . . . . . . . 23
2.3.3 Scratchpad allocation techniques . . . . . . . . . . 24
2.4 Synchronization of dataflow programs . . . . . . . . . . . 25
2.5 Conclusion . . . . . . . . . . . . . . . . . . . . . . . . . . 26
3 Parallel stencil computations using dynamic task graphs 27
3.1 Introduction . . . . . . . . . . . . . . . . . . . . . . . . . . 27
3.2 Scalability of stencil operations . . . . . . . . . . . . . . . 32
3.2.1 Over-synchronization . . . . . . . . . . . . . . . . . 32
3.2.2 Memory bandwidth saturation . . . . . . . . . . . 34
3.3 Execution of dynamic task graphs . . . . . . . . . . . . . 34
3.3.1 Minimizing synchronization overhead . . . . . . . . 37
3.3.2 Memory de-allocation . . . . . . . . . . . . . . . . 37
3.4 Stencil computations as dynamic task graphs . . . . . . . 38
3.4.1 Avoiding dynamic task creation hazards: dead andunborn predecessors . . . . . . . . . . . . . . . . . 38
3.4.2 Memory de-allocation . . . . . . . . . . . . . . . . 40
3.4.3 Time tiled stencil computations . . . . . . . . . . . 40
3.5 Implementation . . . . . . . . . . . . . . . . . . . . . . . . 42
3.5.1 TBB Flowgraphs . . . . . . . . . . . . . . . . . . . 42
3.5.2 Dynamic task graphs using TBB Flowgraphs . . . 44
3.5.3 Optimizing runtime edge creation for stencilcomputations . . . . . . . . . . . . . . . . . . . . . 45
3.6 Performance evaluation . . . . . . . . . . . . . . . . . . . 45
3.6.1 Game of life . . . . . . . . . . . . . . . . . . . . . . 46
3.6.2 Heat benchmark . . . . . . . . . . . . . . . . . . . 47
xii CONTENTS
3.7 Discussion . . . . . . . . . . . . . . . . . . . . . . . . . . . 49
3.7.1 Synchronization overhead . . . . . . . . . . . . . . 49
3.7.2 Vectorization . . . . . . . . . . . . . . . . . . . . . 52
3.7.3 Cost of re-establishing NUMA locality at runtime . 53
3.8 Related work . . . . . . . . . . . . . . . . . . . . . . . . . 54
3.9 Conclusion . . . . . . . . . . . . . . . . . . . . . . . . . . 56
4 Mapping applications to MPSoCs 59
4.1 Introduction . . . . . . . . . . . . . . . . . . . . . . . . . . 59
4.2 Coupling effects in mapping exploration . . . . . . . . . . 63
4.2.1 Horizontal coupling: Memory-aware task schedul-ing on processing elements . . . . . . . . . . . . . . 63
4.2.2 Vertical coupling: Scratchpad aware dimensioningof buffer sizes . . . . . . . . . . . . . . . . . . . . . 64
4.2.3 Putting it all together . . . . . . . . . . . . . . . . 67
4.3 Overview of the mapping methodology . . . . . . . . . . . 68
4.4 Platform and Application Models . . . . . . . . . . . . . . 71
4.4.1 Platform Model . . . . . . . . . . . . . . . . . . . . 71
4.4.2 Annotated Synchronous Dataflow Graph . . . . . . 71
4.4.3 Model transformation to a task graph . . . . . . . 73
4.5 Co-Exploration . . . . . . . . . . . . . . . . . . . . . . . . 76
4.5.1 Search Space . . . . . . . . . . . . . . . . . . . . . 77
4.5.2 Constraints . . . . . . . . . . . . . . . . . . . . . . 82
4.5.3 Optimization objective and exploration . . . . . . 86
4.6 Evaluation . . . . . . . . . . . . . . . . . . . . . . . . . . . 86
4.6.1 H.264 Decoder use-case . . . . . . . . . . . . . . . 86
CONTENTS xiii
4.6.2 Cavity detector use-case . . . . . . . . . . . . . . . 90
4.6.3 Scalability . . . . . . . . . . . . . . . . . . . . . . . 91
4.7 Related Work . . . . . . . . . . . . . . . . . . . . . . . . . 92
4.8 Conclusion . . . . . . . . . . . . . . . . . . . . . . . . . . 94
5 Deployment and configuration of ubiquitous computingapplications 97
5.1 Introduction . . . . . . . . . . . . . . . . . . . . . . . . . . 97
5.2 Use cases . . . . . . . . . . . . . . . . . . . . . . . . . . . 99
5.2.1 Energy-aware application deployment for a CaPIbased WSNs . . . . . . . . . . . . . . . . . . . . . 99
5.2.2 Fitness monitoring and fall detection . . . . . . . . 101
5.3 Overview of the deployment and configuration methodology104
5.3.1 Design time phase . . . . . . . . . . . . . . . . . . 105
5.4 Results and discussions . . . . . . . . . . . . . . . . . . . . 111
5.4.1 Energy-aware application deployment on CaPIbased WSNs . . . . . . . . . . . . . . . . . . . . . 111
5.4.2 Deployment trade-offs of fitness monitoring andfall detection application . . . . . . . . . . . . . . . 114
5.5 Conclusions . . . . . . . . . . . . . . . . . . . . . . . . . . 118
6 Conclusion and future work 119
6.1 Recapitulating the contributions . . . . . . . . . . . . . . 119
6.2 Important lessons learned . . . . . . . . . . . . . . . . . . 121
6.3 Critical reflections . . . . . . . . . . . . . . . . . . . . . . 122
6.3.1 Parallel stencil operations using dynamic task graphs123
xiv CONTENTS
6.3.2 Design-time exploration of Pareto optimal map-pings for embedded applications . . . . . . . . . . 124
6.3.3 Dataflow centric component deployment for ubiq-uitous computing applications . . . . . . . . . . . . 125
6.4 Future work . . . . . . . . . . . . . . . . . . . . . . . . . . 125
6.4.1 Dynamic task graph based stencil operations forapplications with adaptive mesh refinement . . . . 125
6.4.2 Mapping embedded real-time applications onnetwork-on-chips . . . . . . . . . . . . . . . . . . . 126
Glossary 127
Bibliography 133
List of Figures
1.1 Some key challenges for parallel and distributed computing 4
2.1 Taxonomy of dataflow programming models . . . . . . . . 16
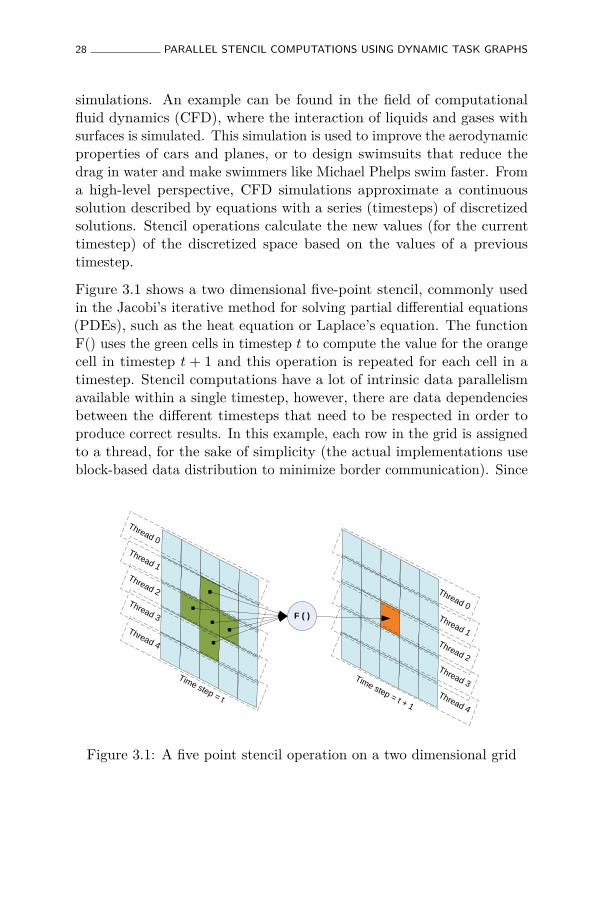
3.1 A five point stencil operation on a two dimensional grid . 28
3.2 A naively parallelized 2D five-point stencil: (a) AnOpenMP C++ implementation, (b) a thread modelshowing barrier synchronizations between subsequenttimesteps, (c) memory access pattern and (d) performancescaling results on a 16 core system. . . . . . . . . . . . . . 33
3.3 A dynamic task graph snapshot highlighting the hazardsof dynamic node creation. Task E is executing and createstask F, tasks B and D are already finished, whereas taskA will create task C when it executes sometime in the future 35
3.4 A scheduling illustration showing a snapshot of the DTGwhen the tasks C and B finish execution on the processorsP1 and P2 respectively. . . . . . . . . . . . . . . . . . . . 36
3.5 (a) Shows a DTG for a square tilled 2-dimensional 5point stencil computation, the green regions show thedata dependencies for updating the red regions. (b) Showsa corresponding dynamic task graph A0, B0, C0 and D0are tasks that perform the stencil operation on the tilesA,B,C and D in timestep 0. . . . . . . . . . . . . . . . . 39
xv
xvi LIST OF FIGURES
3.6 Frustum based time tiling of a 2D stencil operation.Horizontal and vertical overlapping regions are shadedblue, whereas, diagonal overlapping regions are shadedgreen. . . . . . . . . . . . . . . . . . . . . . . . . . . . . . 41
3.7 Example of a static dependence graph using TBBFlowgraphs. . . . . . . . . . . . . . . . . . . . . . . . . . . 44
3.8 Mapping DTG tasks to TBB flowgraphs . . . . . . . . . . 45
3.9 A one dimensional 3-point dynamic task graph organizedas linked lists for faster edge creation . . . . . . . . . . . . 46
3.10 Strong scaling results of Conways game of life benchmarkon dual socket Xeon® E5-2670, domain size 8192× 8192(higher is better). . . . . . . . . . . . . . . . . . . . . . . . 47
3.11 Strong scaling results of the 2D heat simulation benchmarkon dual socket Xeon® E5-2670, domain size 8192× 8192(higher is better). . . . . . . . . . . . . . . . . . . . . . . . 48
3.12 Performance vs domain size for the 2D heat simulationbenchmark on dual socket Xeon® E5-2670 (higher is better) 48
3.13 Intel® VTuneTM Amplifier screen-shots of the locks-and-waits analysis, for the 2048 × 2048 grid experiments ofthe heat benchmark on dual socket Xeon® E5-2670. Eachgreen bar shows the execution of a thread with time onthe horizontal axis. The dark green portion represents theuseful work, whereas the light green portion representssynchronization overhead. Note that the timescales on thethree graphs are different, observe the red markers thatindicate 1.2s of execution time. . . . . . . . . . . . . . . . 50
3.14 Synchronization overhead (less is better) for the 2D heatbenchmark with respect to threads, the domain size is8192× 8192 and a dual socket Xeon Sandy Bridge E7-2670. 51
3.15 Synchronization overhead on a 40 core system (4 socket,10 Westmere-EX E7-4870). . . . . . . . . . . . . . . . . . 52
3.16 Single core vectorization speed-ups for the heat benchmark 53
LIST OF FIGURES xvii
4.1 Anatomy of an MPSoC platform . . . . . . . . . . . . . . 60
4.2 Buffer size trade-off with context switches and parallelism 65
4.3 Scratchpad allocation for a multi-processor system . . . . 67
4.4 An abstract view of interdependencies between differentaspects of mapping software applications to MPSoCplatforms . . . . . . . . . . . . . . . . . . . . . . . . . . . 68
4.5 Overview illustrating different steps in the methodology. . 69
4.6 Model Transformation . . . . . . . . . . . . . . . . . . . . 74
4.7 An example task-graph, a possible schedules for itsresource usage and the corresponding cumulative memoryusage on the target platform. Edge E1 is mapped as local-main-local and edge E2 as main-memory. The intervallabel T1-P1 indicated that the task T1 is executed on theprocessor P1. . . . . . . . . . . . . . . . . . . . . . . . . . 77
4.8 ProcessorTime & ProcessorEnergy sequences . . . . . . . 81
4.9 Elementary Functions . . . . . . . . . . . . . . . . . . . . 82
4.10 Relations between activities and resources . . . . . . . . . 83
4.11 Synchronous Dataflow Graph for H.264 decoder . . . . . . 87
4.12 Energy throughput trade-off under varying scratchpad sizes 88
4.13 Memory sharing vs baseline allocation . . . . . . . . . . . 89
4.14 Mapping pipelined cavity detector on MPSoC . . . . . . . 90
4.15 Exploration results for the different techniques . . . . . . 91
xviii LIST OF FIGURES
5.1 Illustrates four representative scenarios for the WSN usecase: (a) One Raven node forwards its data to anotherRaven node, which then forwards it to a base station. (b)Ten Raven nodes are connected to one Raven node inthe form of a star topology. The central node is actingas a mote; it collects data from the surrounding nodesand forwards it to the base station. (c) The central moteis a SunSpot, it collects data from ten Raven nodes andforwards it to the base station. (d) A SunSpot mote iscollecting data from hundred Raven nodes and sends it tothe base station . . . . . . . . . . . . . . . . . . . . . . . . 100
5.2 UML 2.0 component diagram for the fitness monitoringand fall detection application . . . . . . . . . . . . . . . . 102
5.3 Overview of the approach illustrating the offline andruntime phases . . . . . . . . . . . . . . . . . . . . . . . . 106
5.4 Overview of the offline exploration phase . . . . . . . . . . 110
5.5 One Raven node sending messages to another Raven node 112
5.6 Ten Raven nodes sending messages to a Raven cluster head113
5.7 Ten Raven nodes sending messages to a Sun SPOT clusterhead . . . . . . . . . . . . . . . . . . . . . . . . . . . . . . 113
5.8 Hundred Raven nodes sending messages to a Sun Spotcluster head . . . . . . . . . . . . . . . . . . . . . . . . . . 114
5.9 Functional non-functional Pareto-optimal trade-offs be-tween quality of service (error rate) and CPU load on theSunSPOT. . . . . . . . . . . . . . . . . . . . . . . . . . . . 115
5.10 A fuzzy Pareto space of the tradeoff between CPU loadand network communication for different deploymentconfigurations . . . . . . . . . . . . . . . . . . . . . . . . . 118
List of Tables
2.1 Schedulability and buffer size analysis for different dataflowmodels . . . . . . . . . . . . . . . . . . . . . . . . . . . . . 21
4.1 List of selected interval variables used in the model . . . . 79
4.2 Co-Exploration Scalability . . . . . . . . . . . . . . . . . . 92
5.1 Performance benchmark of the individual components onthe SunSPOT sensor . . . . . . . . . . . . . . . . . . . . . 115
xix


Chapter 1
Introduction
Almost half a century ago, Gordon Moore predicted [94] the exponentialgrowth of the number of transistors on integrated circuits (IC) andhe is proving to be almost1 right, thanks to transistor scaling. Astransistors shrank in size, it not only allowed more transistors to bepackaged on a chip but also faster switching and thus higher frequenciesfor microprocessors. Transistor and frequency scaling combined withsome architectural gizmos such as, instruction level parallelism (ILP),deep pipelining and out-of-order execution (OOO), resulted in a freelunch of performance for the software community. Unfortunately, thisfree lunch is now over [124].
The single core performance of the Von Neumann architecture basedmicroprocessors hit several walls and hardware vendors now move towardsmulti-core parallel and distributed platforms. Concurrency becomes theprimary way to get more performance on these platforms. However,concurrent programming is more difficult compared to sequentialprogramming [125]. In this thesis we employ dataflow-inspired techniquesto address certain challenges of parallel and distributed computing forsome real world applications.
The rest of this chapter is structured as follows. Section 1.1 lists the1The International Technology Roadmap for Semiconductors report for 2011
predicts the growth slowing down beyond 2013. It expects the number of transistorsper IC to double every three years instead of two years, as predicted by Moore’s law.
1
2 INTRODUCTION
key factors driving the multi-core trend. Section 1.2 describes somechallenges for the development and execution of parallel software, withrespect to these multi-core platforms. Section 1.3 presents an overviewof existing dataflow-based solutions to address these challenges. Section1.4 introduces the use cases studied in this thesis. Section 1.5 gives aquick overview of the contributions of this PhD and section 1.6 presentsthe structure of the thesis.
1.1 Stagnation of the single core performance
The thesis focuses on software challenges of parallel and distributedcomputing. A major driving force behind the recent wave of parallel anddistributed computing is the stagnation of the single core performanceof microprocessors. This section highlights some aspects of the evolutionof microprocessors that lead to the eventual slow down of the single coreperformance. Three problems that stall single-core performance scalingare: (1) The frequency wall, energy dissipation and thermal problems. (2)The tapered scaling of architectural features, such as ILP and pipelining.(3) The design complexity wall, i.e. the gap between technology scalingand hardware design productivity.
1. Power and energy dissipation have emerged as the Achilles heel forcomputing in several different domains. In embedded systems, itresults in shorter battery lives of ubiquitous and mobile devices.In high performance computing, it manifests in the form ofexcessive electricity bills for datacenters. The power dissipation ofa microprocessor increases super-linearly with the frequency [29],thus making it unfeasible to further increase the frequency.Thermal limitations are another reason why the frequency maynot be further increased and seem to saturate below 4GHz forcurrent semiconductor technologies. On a chip level, we are alreadyreaching the limits of the amount of heat extractable from the chipusing conventional methods of cooling. At the level of datacenters,the electricity cost of cooling the datacenters already exceeds thatof the actual computation.
CHALLENGES OF PARALLEL AND DISTRIBUTED COMPUTING 3
2. Even though the frequency may not increase, transistor scaling stillcontinues exponentially. We may still design bigger processors,with more instruction level parallelism and deeper pipelines.Unfortunately, performance improvements with increasing ILPare observed to saturate at less ten instructions per cycle [124] anddeeper pipelines reduce the energy efficiency of the processor [30].The increase of single core performance with respect to tran-sistor scaling is summarized by Pollacks’s rule [103] whereby,performance increases (when not limited by other parts of thesystem) as the square root of the number of transistors or areaof a processor. According to Pollack’s Rule, each new technologygeneration doubles the number of transistors on a chip, enabling anew microarchitecture that delivers a 40% performance increase.
3. Design and verification of a modern day microprocessor requires3-5 years while hundreds of engineers are employed for theproject. Historically the productivity of digital hardware designhas increased at 21% per year (measured in transistors per staffmonths), whereas, the number of transistor per chip has grown ata much faster rate of 58% per year. This leaves an unmanageabledesign complexity gap [60, 100] between increasing number oftransistors and productivity; leaving the vendors no choice but toreplicate design in the form of multi-cores.
This section briefly summarized some of the reasons that drive theproliferation of multi-cores in different computing domains. Thishardware trend has implications for software, which now needs to beparallel. However, developing parallel software or parallelizing existingones are non-trivial tasks. The next section describes some of thechallenges of developing and executing parallel and distributed software.
1.2 Challenges of parallel and distributed comput-ing
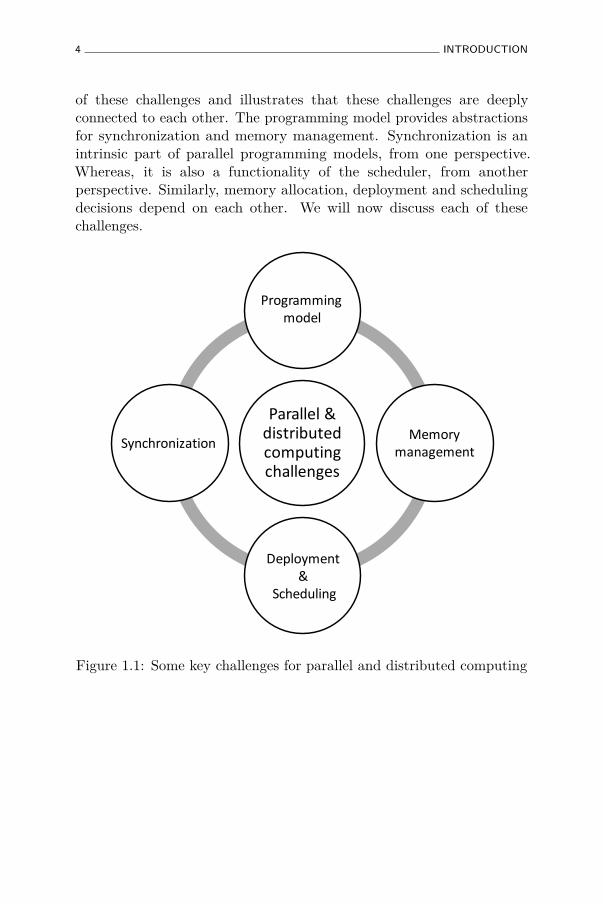
This section highlights some important software challenges associatedwith parallel and distributed computing. Figure 1.1 gives a quick overview
4 INTRODUCTION
of these challenges and illustrates that these challenges are deeplyconnected to each other. The programming model provides abstractionsfor synchronization and memory management. Synchronization is anintrinsic part of parallel programming models, from one perspective.Whereas, it is also a functionality of the scheduler, from anotherperspective. Similarly, memory allocation, deployment and schedulingdecisions depend on each other. We will now discuss each of thesechallenges.
Parallel & distributed computing challenges
Programming model
Synchronization
Memory management
Deployment &
Scheduling
Figure 1.1: Some key challenges for parallel and distributed computing
CHALLENGES OF PARALLEL AND DISTRIBUTED COMPUTING 5
1.2.1 Programming models
From the early days of Al-Khwarizmi, algorithms have been formulatedwith sequential semantics. Perhaps one of the biggest challenges ofparallel programming is developing models and languages that allowdevelopers to think about concurrency in a natural way. With theincreasing parallelism in the underlying hardware, there is a need toexpose higher levels of concurrency in the software applications. Formany applications higher levels of concurrency require combining differentforms of implicit and explicit parallelism, e.g. combining explicitfunctional parallelism with implicit data parallelism. Moreover, theprogramming model must guarantee functional correctness without overconstraining the available parallelism, e.g. guarantee a race conditionfree execution. Furthermore, it must support a broad range of platforms,ranging from symmetric multi-processors with uniform memory access toheterogeneous multi-cores with non-uniform memory access. In addition,the programming model must allow the developer to reason aboutconcurrency at a high level of abstraction. All these requirements makedeveloping a parallel programming model an extremely difficult task.
Thread based programming models, such as POSIX threads [33] andOpenMP [42], have been considered the de-facto standard in parallelprogramming. More recently, task based programming models, suchas Cilk [27], Threading Building Blocks [108] and OpenMP tasks [10]are gaining popularity. All of these programming models are controlflow-based i.e. the programmer specifies the control flow of the parallelprogram. Different forms of concurrency have to be explicitly expressedand the programming models do not guarantee race condition freeexecution i.e. they are non-determinate. Section 1.3.1 discusses howdataflow-based programming models address these challenges.
1.2.2 Memory management
On the one hand, the “memory wall” [92] (i.e. bottleneck caused by thelack of memory bandwidth) is often considered a killer for the scalabilityof high performance parallel applications; if an application is starved ofmemory bandwidth adding more cores causes a performance degradation
6 INTRODUCTION
due to contention on the shared resource. On the other hand, the memorysubsystem dissipates a major chunk of the battery power in hand-helddevices for data intensive applications (such as multimedia) [134]. Onesolution to these problems is using a multi-level memory subsystem thatplaces fast and energy efficient caches and/or scratchpads [13] close to theprocessing cores. However, these caches and scratchpads are often limitedin size and must be efficiently utilized in order to overcome memorybandwidth limitations in data intensive applications. Most existing cacheand scratchpad allocation techniques [9, 115] for control flow-basedprogramming models, often work in isolation from other aspects of thesystem i.e. processing and communication. Section 1.3.2 discusses howdataflow-based models help improve memory management techniques forparallel programs.
1.2.3 Scheduling
Optimal scheduling of parallel applications on parallel platforms is an NP-complete problem [43]. Scheduling is a crosscutting concern with aspectsthat often conflict with each other. For example, balanced workloaddistribution improves processor utilization but at the same time it usuallyputs more pressure on the communication network. In a heterogeneoussystem, particular types of workloads perform better on particular typesof processors (e.g. CPU, GPU, DSP) and this type of affinity must betaken into account during the scheduling process. Similarly, the schedulermust also maintain locality for effective cache utilization. Furthermore,the algorithms/heuristics used must be scalable and the runtime overheadminimal. The analyzability of dataflow models (discussed in section 2.2)facilitates the development of efficient and comprehensive schedulingtechniques.
1.2.4 Synchronization
Threads of a parallel application often need to synchronize due todependencies, typically data or control flow dependencies. Synchro-nization points (e.g. locks and barriers) are necessary to avoid raceconditions. Two important challenges are associated with synchronization;
DATAFLOW-BASED APPROACHES TO CONCURRENT SOFTWARE 7
(1) verifying that all the necessary synchronization points have beeninserted and (2) the cost of synchronization. It is difficult to verifythat all the necessary synchronization points are inserted becausethreads interact differently on different systems [84] and a race freeexecution on one system does not guarantee correctness on another.The cost of synchronization keeps rising with the increasing amount ofparallelism and has a direct trade-off with the level of abstraction of thesynchronization mechanisms. Control flow-based programming modelssuch as Pthreads [33], OpenMP [42], TBB [108] and Cilk [27] providetwo types of synchronization mechanisms; high-level all-to-all barriersthat are expensive and low-level locks and semaphores that substantiallyincrease the complexity of programming. Section 1.3.4 discusses thesynchronization of dataflow programs.
1.3 Dataflow-based approaches to concurrent soft-ware
The previous section highlighted some key challenges in parallel anddistributed software. We use dataflow-inspired techniques to organizecomputation and data at a high-level of abstraction, in order to addressthem. This section introduces dataflow models, discussing how theyapproach these challenges.
1.3.1 Dataflow programming models
In imperative (or control flow) styles of programming, programs arerepresented as sequences of operations. This is in line with the VonNeumann vision of computing. However, due to the inherent sequentialnature of these programming models concurrency has to be expressedexplicitly. In dataflow programming languages, a program is comprisedof functions (nodes) and the flow of data between these functions (edges),where any set of functions may be executed in parallel as long as thedataflow dependencies are respected. Therefore, concurrency is anintrinsic property of the dataflow programming model.
8 INTRODUCTION
Dataflow programming languages are classified according to the semanticsof their models of computation; directed acyclic graphs (task graphs anddynamic task graphs [73]) or auto-concurrent models (e.g. synchronousdataflow graphs [85] and the actor model [3]). The edges in directedacyclic graphs are not allowed to form cycles and the nodes are executedonly once during the execution of the program. DAG based programmingmodels are often used for high performance computing applications e.g. inQUARK [145], SMPSs [101] and StarPU [8]. Whereas, in auto-concurrentmodels, the edges are allowed to form cycles and the nodes may beexecuted multiple times. Auto-concurrent programming models are moreoften used for embedded systems and real-time streaming applicatione.g. in StreamIt [128], brook [31], OpenDF [23], Caltrop [48], Erlang [7].
1.3.2 Dataflow-based memory management of concurrentprograms
Pure dataflow programming models are characterized by ordered queuesof data along the edges, single assignment variables and the absence ofglobal memory store, thus, there are no side effects and the execution isdeterminate2. In dataflow graphs, nodes only process data locally andcommunication between nodes occurs only via the edges explicitly. Thislocality of effects property of dataflow programming models has beenused to devise memory allocation schemes [16, 17, 34, 35] or to relaxcache consistency models [116].
It is not possible to guarantee that an arbitrary dataflow graph canexecute in a limited amount of memory. The sizes of the buffers thatstore the data flowing along the edges of the dataflow graph depends onthe firing sequence of the nodes and hence the scheduler. A variant ofdataflow graphs that specifies the amount of data produced and consumedat design time to make them statically schedulable is proposed in [83].The requirements of scheduling more generic Kahn process networks inbounded memory are discussed in [58]
2The execution of dataflow programs in not necessarily deterministic but alwaysdeterminate i.e. the sequence of how the nodes are fired may vary but the end resultis always the same.
USE CASES 9
1.3.3 Dataflow-based scheduling of concurrent programs
In pure dataflow semantics, functions are scheduled on the basis of theavailability of data. However, when executing dataflow programs onVon Neumann machines the availability of resources (such as cores forprocessing) also need to be considered alongside the logical availabilityof data. A number of scheduling algorithms and heuristics exist fordifferent dataflow models, ranging from centralized static [142] and quasi-static [22] scheduling to distributed dynamic scheduling [4]; each havingtheir own merits and de-merits (discussed in detail in section 2.2).
1.3.4 Synchronization of Dataflow programs
Synchronization in dataflow programming is implicit; the edges thatrepresent dataflow abstract away the need for explicit synchronization.However, the implementation of these edges depends on the type ofscheduler used. For statically scheduled dataflow programs, the edges maybe implemented using asynchronous forms of communication. However,for dynamically scheduled dataflow programs, the implementation ofthese edges requires active synchronization (e.g. locks or mutexes).
1.4 Use cases
In this thesis we apply dataflow-inspired parallel and distributedcomputing techniques to use cases in three different domains: (1)High-performance computing, (2) real-time embedded software and (3)ubiquitous computing. This section describes the use case applicationsand the challenges addressed in each of these applications.
1.4.1 Stencil operations in high-performance computing
Stencil operations are at the heart of many high-performance computing(HPC) applications; such as, computational fluid dynamics (CFD)simulations, seismic simulations, plasma physics and partial differentialequation (PDE) solvers. They often constitute a significant portion of
10 INTRODUCTION
the computational time for these applications, therefore optimizing themusually has a big impact on the overall performance of these applications.With the ever-increasing number of on-chip cores in HPC servers,the scalability of parallel stencil operations is getting more and moreimportant. Scalability of conventional parallel implementations of stenciloperations face two important challenges: (1) Reducing synchronizationoverhead and (2) overcoming memory bandwidth bottleneck. We presentan approach for addressing these challenges, thereby improving thescalability of parallel stencil operations.
1.4.2 Real-time applications in embedded systems
Modern embedded systems such as smartphones, tablets and otherbattery powered devices are often based on multi-processor systems-on-chip (MPSoCs) platforms with complex memory hierarchies andinterconnects. Real-time applications that run on these devices oftenprocess large amounts of data with strict time constraints. Energyefficient deployment and scheduling of these software applications oncomplex hardware platforms taking into account the timing aspects is adaunting task. We present a technique for improving this deploymentand scheduling, and validate it using two real life use cases: (1) Cavitydetector (an image processing application) and (2) H.264 decoder (avideo decompression application).
1.4.3 Component based applications in ubiquitous environ-ments
Ubiquitous computing (ubicomp) is an advanced computing conceptwhere computing is pervasive and deeply embedded into everydayobjects. Propelled by decreasing costs and sizes of microprocessors,it is becoming the next big wave in the world of computing. Componentbased applications are often used in ubiquitous computing, wherecomponents are distributed in a ubiquitous environment and collaboratewith each other to realize an application. Ubiquitous computingenvironments are a heterogeneous network of things, with differentsensing, actuating, computing and communication capabilities. Moreover,
CONTRIBUTIONS 11
they are characterized by an open-ended and highly dynamic ecosystemwith variable workload and resource availability, which adds to thecomplexity of deployment and configuration of application componentsin these environments. We present a methodology for the deploymentconfiguration and runtime reconfiguration of application components inubiquitous environments and validate it with two use cases: (1) Energy-aware application deployment of software applications in wireless sensornetworks (WSNs) based on the Component and Policy InfrastructureCaPI [91]. (2) An ambient assisted living application that monitors fitnessby recording activity and detects falls for people with special needs inorder to inform care givers in case of an emergency.
1.5 Contributions
The previous section introduced the use cases studied in this thesis anddiscussed some challenges for each of these use cases. In this section wehighlight the main contributions of the dissertation.
1.5.1 Contribution 1: Parallel stencil operation using dynamictask graphs
A stencil operation iteratively updates elements of an array using valuesof other elements (often the neighboring elements) of the array. Parallelversions of these stencil operations often suffer from over-synchronizationand memory bandwidth saturation. We use dynamic task graphs (adataflow-based programming model) to parallelize stencil operations inorder to reduce the synchronization overhead. Moreover, time-tiling (anadvanced algorithmic transformation) is used to reduce cache missesand avoid memory bandwidth saturation. Performance benchmarkingresults on a 16 core parallel system indicate performance improvementsof at least 20% compared to the state-of-the-art heavily optimized stencilcompilers while the synchronization costs are reduced by at least a factorof five.
12 INTRODUCTION
Related publication:
• Zubair Wadood Bhatti, Roel Wuyts, Pascal Costanza, Davy Preuve-neers, Yolande Berbers, “Efficient Synchronization for StencilComputations Using Dynamic Task Graphs,” Elsevier ProcediaComputer Science, special issue on International Conference onComputational Science. Volume 18, 2013, ISSN 1877-0509.
1.5.2 Contribution 2: Design-time exploration of Paretooptimal mappings for embedded applications
Scheduling and executing software efficiently on contemporary embeddedsystems, featuring heterogeneous multiprocessors, multiple power modes,complex memory hierarchies and advanced interconnects, is a dauntingtask. State-of-the-art tools that schedule software tasks to hardwareresources face limitations: (1) either they do not take into accountthe inter-dependencies among processing, memory and communicationconstraints (2) or they decouple the problem of spatial assignmentfrom temporal scheduling. As a result existing tools make sub-optimalspatio-temporal scheduling decisions. This dissertation presents atechnique to find globally optimized solutions by co-exploring spatio-temporal schedules for computation, data storage and communicationsimultaneously, considering the inter-dependencies between them. Casestudies of mapping image processing applications on a heterogeneousMPSoC platform show that this co-exploration methodology findsschedules that are more energy efficient when compared to decoupledexploration techniques for the particular application and target platform.
Related publications:
• Zubair Wadood Bhatti, Narasinga Rao Miniskar, Roel Wuyts,Davy Preuveneers, Yolande Berbers, “SAMOSA: Scratchpad awaremapping of streaming applications,” Proceedings of the 13thInternational Symposium on System-on-Chip, IEEE, pp.48,55, Oct.31 2011-Nov. 2 2011, Tampere, Finland.
CONTRIBUTIONS 13
• Zubair Wadood Bhatti, Narasinga Rao Miniskar, Roel Wuyts, DavyPreuveneers, Yolande Berbers, Francky Catthoor, “Memory andcommunication driven spatio-temporal scheduling on MPSoCs,"Proceedings of the 25th Symposium on Integrated Circuits andSystems Design, IEEE, pp.1,6, Aug. 30 2012-Sept. 2 2012, Brasilia,Brazil.
1.5.3 Contribution 3: Exploring deployment and configurationtradeoffs for ubiquitous computing applications
We present a methodology for the deployment, configuration and runtimereconfiguration of component based ubiquitous computing applications.Results from two use cases are presented: (1) A component and policyinfrastructure based WSN and (2) Mobility monitoring and fall detectionapplication. The first use case results demonstrate the ability of theapproach to find optimal deployment configurations for different scenariosand topologies in a distributed and heterogeneous system. The seconduse case takes a step further by relaxing the fixed quality of serviceconstraints and exploring the trade-offs between quality of service andCPU load.
Related publications:
• Zubair Wadood Bhatti, Nayyab Naqvi, Arun Ramakrishnan,Davy Preuveneers and Yolande Berbers, “Learning DistributedDeployment and Configuration Trade-offs for Context-AwareApplications in Intelligent Environments” to appear in Journal ofAmbient Intelligence and Smart Environments, IOS press, Volume6, 2014.
• Arun Ramakrishnan, Syeda Nayyab Zia Naqvi, Zubair WadoodBhatti, Davy Preuveneers, Yolande Berbers, “Learning deploymenttrade-offs for self-optimization of Internet of Things applications”,Proceedings of the 10th International Conference on AutonomicComputing, ICAC 2013, pages 213-224, San Jose, CA, U.S.A.,26-28 June 2013.

14 INTRODUCTION
• Arun Ramakrishnan, Zubair Wadood Bhatti, Davy Preuveneers,Yolande Berbers, Aliaksei Andrushevich, Rolf Kistler, AlexanderKlapproth, “Behavior modeling and recognition methods to facilitatetransitions between application-specific personalized assistancesystems”, International Joint Conference on Ambient Intelligence,Pisa, Italy, 13-15 November 2012.
1.6 Structure of the thesis
The rest of the thesis is structured as follows: Chapter 2 givesbackground information on dataflow programming models and theirexecution. Chapter 3 describes the first contribution, using a dataflowprograming model for better parallelization of stencil operations in thearea of high performance computing, reducing the synchronization costs.Chapter 4 presents the second contribution, improving the mapping andscheduling of real-time streaming applications by modeling the inter-dependencies between the different aspects. Chapter 5 explains thethird contribution of exploring non-functional deployment trade-offs forcomponent based applications in ubiquitous environments. Chapter 6presents the conclusions and future work.
Chapter 2
Parallel programming usingdataflow models
The previous chapter gave an overview of the dissertation, which usesdataflow-based programming models to address some key challenges inparallel programming. This chapter provides background on dataflowmodels and their execution on parallel Von Neumann computers. Thefirst section presents a taxonomy of dataflow programming models.The second section discusses different scheduling techniques used forexecuting dataflow programming models on parallel computers. Thethird section gives an overview of memory management; discussing bufferdimensioning methodologies, optimizations for improved cache utilizationand scratchpad allocation techniques. The last section highlights thesynchronization of dataflow models.
2.1 Dataflow programming models
Dataflow programming models are a class of concurrent programmingmodels. In contrast to imperative programming models that focus on thecontrol flow of the program, dataflow programming models focus on thedataflow of the program. In dataflow programming models, the programis represented as a directed graph. The nodes of the graph represent the
15

16 PARALLEL PROGRAMMING USING DATAFLOW MODELS
computation and the edges represent the flow of data between these nodes.Dataflow models are implicitly parallel: the nodes in dataflow programscan be executed in parallel as long as they have the required data on theirinput edges. To structure the discussion of different dataflow models wemade a taxonomy, illustrated in figure 2.1. At the top level dataflowmodels are classified by the type of their nodes i.e. tasks or processes.Tasks execute once during the span of the program, whereas, processesmay execute (fire) multiple times. Sections 2.1.1 and 2.1.2 describe thetask and process based models respectively.
Dataflow programming
models
Process based models
Static
Homogeneous
Single rate dataflow graphs
Marked graphs
Heterogeneous
Synchronous dataflow graphs
Windowed dataflow graphs
Computational graphs
Dynamic
Cyclo-static dataflow
Cyclo-dynamic dataflow
Scenario-aware dataflow
Variable rate dataflow
Task based models
Static
Dataflow task graphs
Dynamic
Dynamic task graphs
Figure 2.1: Taxonomy of dataflow programming models
DATAFLOW PROGRAMMING MODELS 17
2.1.1 Task based dataflow models
Task based dataflow models are structurally acyclic; an arbitrary pairof tasks may have a dependency between them as long as they do notform cycles. These models are further classified as static or dynamic.For static task graphs, the structure of the graphs does not change atruntime and new nodes or edges may not be created once the execution ofthe program starts. In contrast, dynamic task graphs [73] allow creationor deletion of nodes and edges at runtime. Both static and dynamic taskgraphs are often found in high performance computing applications e.g.QUARK [145], StarPU [8] SMPSs [101] and Nabbit [4].
Dataflow-based task models are conceptually different from the taskgraph models in imperative programming that impose a tree structurefor the graphs, e.g. spawn-sync graphs in Cilk [27] or fork/join graphs inTBB [108] or java. These imperative task graphs only support parent-child dependencies between tasks; unlike dataflow task models arbitrarydependencies cannot be directly expressed.
2.1.2 Process based dataflow models
In process based dataflow programming models, the program may containcycles. The processes may fire (execute) multiple times during the spanof the program, consuming data from the input edges and producing dataon the output edges each time. In figure 2.1, these models are classifiedas static or dynamic models.
In static dataflow graphs, the amount of data produced and/or consumedduring a single execution of a process (data rate) remains staticthroughout the execution of the program. These models have two sub-classes; homogeneous [95] and heterogeneous. In homogeneous models[40, 95], all processes have the same data rates; whereas, in heterogeneousmodels [54, 83, 139] different processes have different data rates.
In dynamic dataflow graphs, the data rates are allowed to vary over time.In cyclo-static dataflow graphs[25], the data rates of different processesfollow fixed periodic sequences. Cyclo-dynamic dataflow graphs [136]are an extension of cyclo-static dataflow graphs, where the sequence of
18 PARALLEL PROGRAMMING USING DATAFLOW MODELS
data rate is not fixed but rather a function of the given input(s). Inscenario-aware dataflow graphs [120], the data rates of processes arecontrolled by a Markov model, where the states of the Markov modelrepresent different runtime scenarios.
2.2 Scheduling of dataflow programs
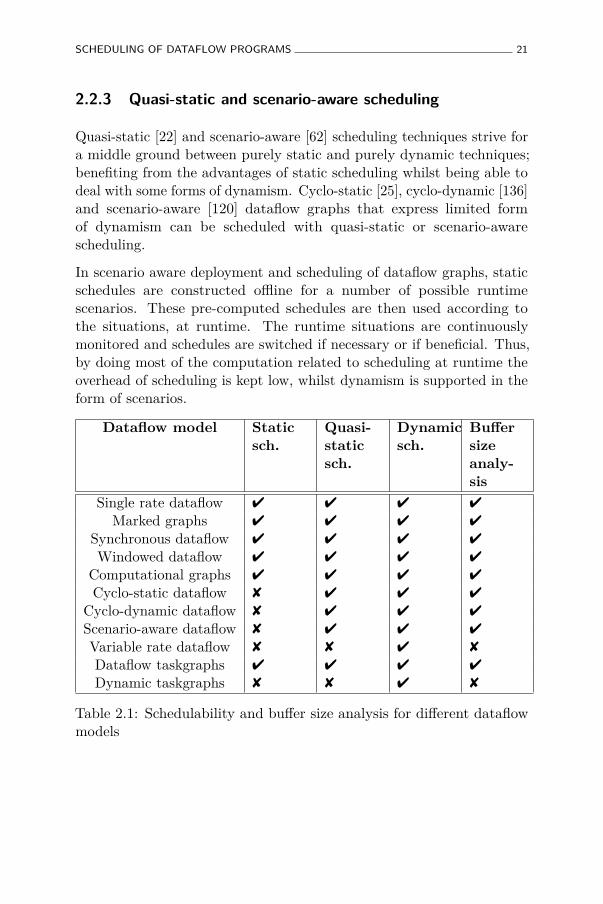
Theoretically, processes or tasks of a dataflow program are executedas soon as the required data arrives at their incoming edges. Inpractice, other aspects are also taken into account while schedulingdataflow programs on Von Neumann computers, along with the executionsemantics of dataflow models. First of all, hard constraints such as theavailability of processing cores, memory and communication bandwidthneed to be ensured. Secondly, due to the often-large number of feasiblepossibilities of deploying and scheduling dataflow programs, optimizationobjectives such as maximizing throughput and/or minimizing energydissipation are usually considered. A number of scheduling algorithmsand heuristics exist for different dataflow models, ranging from static toquasi-static and dynamic. Table 2.1 summarizes what type of schedulingtechniques are applicable for the different dataflow models shown infigure 2.1.
2.2.1 Static scheduling
Static (task or process based) dataflow models can be scheduled offline,statically. Lee and Messerschmitt [85] proposed techniques for schedulingsynchronous dataflow graphs (SDFs) onto single and multiple processors.These techniques find periodically admissible sequential schedules (PASS)and periodically admissible parallel schedules (PAPS). First, a topologymatrix for the program is constructed from the SDF model. In a topologymatrix, the columns represent the processes and the rows represent theedges; an entry at row r and column c represents the number of tokens(data objects) produced (positive number) or consumed (negative number)by process c on edge r. A PASS only exists if the rank of the topologymatrix is one less than the number of rows in the matrix. Otherwise,
SCHEDULING OF DATAFLOW PROGRAMS 19
the program is unschedulable. Calculating the PASS involves finding thefiring vector ~q; such that,
~q ×A = ~0
where A is the topology matrix of the SDF and the elements of ~q arepositive integers. If a PASS exists, PAPS can always be computed withthe following steps:
1. Compute a PASS.
2. Determine the unroll factor that is the number of PASS that formsa PAPS. Higher unroll factors normally improve the utilization ina multi-processor system at the cost of increased complexity.
3. Construct a precedence graph.
4. Compute PAPS using the Hu-Level algorithm [69].
Static scheduling is done offline before the application starts. Thus, thereis minimum overhead at runtime and complex optimizations that areunfeasible for purely runtime scheduling techniques can be performed.However, static scheduling techniques lack in their ability to cope withdynamism. Often, worst-case estimates are taken in order to deal withdynamism in static dataflow models. These worst-case estimates aresometimes too conservative and cause severe performance penalties.Therefore, dynamic dataflow models are used. However, these dynamicdataflow models cannot be scheduled with static scheduling techniques;instead, quasi-static [22], scenario-aware [62] or fully dynamic schedulingtechniques are used.
2.2.2 Dynamic scheduling
Dynamic schedulers make all the scheduling decisions at runtime. Thekey advantage of these schedulers over their static counterparts is theability to cope with dynamism. The main objectives for dynamicschedulers include meeting timing deadlines, fulfilling quality of servicerequirements, maximizing system utilization, preserving locality andbalancing workloads etc. Different types of dynamic schedulers are
20 PARALLEL PROGRAMMING USING DATAFLOW MODELS
found in the literature, e.g., deadline driven schedulers, priority drivenschedulers and best effort schedulers.
• Deadline driven scheduling is often used for real-time systems.The most common deadline driven schedulers are Earliest DeadlineFirst (EDF) [71] and Least Slack First (LST) [1]. In EDF, thetasks or processes with the closest deadline are scheduled first.Similarly, in LST the tasks or processes with the least slack timeare scheduled first. Slack time is the difference between the timeremaining before deadline and the time required to finish the taskor process. These schedulers work with both periodic and sporadictasks.
• Priority driven scheduling is used in interrupt driven systems andoperating systems for embedded or real-time systems, such as theRate Monotonic Scheduler (RMS) [86] in microC/OS. In prioritydriven schedulers, tasks (or processes) are assigned predefinedpriorities by the application developers or by the system architects.A task is only allowed to execute if it has the highest priorityamong all ready tasks. The disadvantage of both priority drivenand deadline driven schedulers is the often-low system utilizationlevel (e.g. as low as 69% for RMS [86]).
• Best effort scheduling is more commonly used in high performancecomputing. The most common best effort schedulers includework-sharing schedulers (e.g. in OpenMP [42]) and work-stealingschedulers (e.g. in TBB [108] and cilk [27]). Best effort schedulersgenerally provide better system utilization, workload balancing andlocality awareness than deadline or priority driven; however, theydo not provide guarantees for meeting specific task deadlines. Inwork sharing schedulers, when processors create new tasks theytry to assign them to underutilized processors. In work stealingschedulers, when a processor runs out of tasks it steals a taskrandomly from another processor.
SCHEDULING OF DATAFLOW PROGRAMS 21
2.2.3 Quasi-static and scenario-aware scheduling
Quasi-static [22] and scenario-aware [62] scheduling techniques strive fora middle ground between purely static and purely dynamic techniques;benefiting from the advantages of static scheduling whilst being able todeal with some forms of dynamism. Cyclo-static [25], cyclo-dynamic [136]and scenario-aware [120] dataflow graphs that express limited formof dynamism can be scheduled with quasi-static or scenario-awarescheduling.
In scenario aware deployment and scheduling of dataflow graphs, staticschedules are constructed offline for a number of possible runtimescenarios. These pre-computed schedules are then used according tothe situations, at runtime. The runtime situations are continuouslymonitored and schedules are switched if necessary or if beneficial. Thus,by doing most of the computation related to scheduling at runtime theoverhead of scheduling is kept low, whilst dynamism is supported in theform of scenarios.
Dataflow model Staticsch.
Quasi-staticsch.
Dynamicsch.
Buffersizeanaly-sis
Single rate dataflow 4 4 4 4
Marked graphs 4 4 4 4
Synchronous dataflow 4 4 4 4
Windowed dataflow 4 4 4 4
Computational graphs 4 4 4 4
Cyclo-static dataflow 8 4 4 4
Cyclo-dynamic dataflow 8 4 4 4
Scenario-aware dataflow 8 4 4 4
Variable rate dataflow 8 8 4 8
Dataflow taskgraphs 4 4 4 4
Dynamic taskgraphs 8 8 4 8
Table 2.1: Schedulability and buffer size analysis for different dataflowmodels
22 PARALLEL PROGRAMMING USING DATAFLOW MODELS
2.3 Memory management of dataflow programs
Modern computing systems consist of complex memory hierarchies, e.g.in the form of multi-level caches and scratchpads in MPSoCs, andccNUMA (cache coherent Non-Uniform Memory Access) [80] interfaces forrandom access memories (RAMs) in multi-socket compute nodes. Cachesand scratchpads are smaller and faster memories, near the processor.Caches are managed by a dedicated hardware unit the cache controller,whereas, scratchpads are software managed. In multi-socket computenodes, the main memory is logically shared but physically distributed.The bandwidth and latency of a data access depends on the physicallocation of the data. Efficient execution dataflow programs on thesesystems (MPSoCs or compute nodes) requires that the memory sub-system is taken into account. Firstly, the buffers required to execute theprogram must be smaller than the available memory in order to avoiddeadlocks and ensure correctness. Secondly, caches and scratchpadsmust be efficiently utilized in order to get maximum throughput andenergy efficiency. The remainder of this section gives an overview ofbuffer dimensioning techniques for dataflow graphs followed by cacheoptimizations and scratchpad allocation techniques.
2.3.1 Buffer dimensioning
Sizes of the memory buffers required to execute a dataflow programdepend on its schedule [58]. Table 2.1 shows which dataflow models canbe analyzed for buffer size requirements. For statically or quasi-staticallyscheduled dataflow programs, it is possible to calculate the buffersizes by analyzing the schedules. Model checkers and constraint basedoptimization tools are often used to calculate the buffer requirements forthese dataflow models. In [57] a heuristic is presented for the calculation ofminimum buffer requirements for which a schedule can exist that executesan SDF program without deadlocking. The operational semantics of theSDF and arbitrary channel bounds are encoded in a model checker, themodel checker is then challenged to disprove the claim that a schedulethat fulfills all the constraints does not exists. If the model checkerdisproves the claim, the memory limit is lowered to find the minimum
MEMORY MANAGEMENT OF DATAFLOW PROGRAMS 23
buffer sizes for which a schedule exist. This technique is extended in[121] for exploring tradeoffs between buffer sizes and throughput. Ananalytical technique for approximating buffer requirements for a giventhroughput constraint is presented in [138].
2.3.2 Cache optimization techniques
From a software perspective, caches transparently store data, so thatfuture requests for this data are served faster. In essence they relyon the notion of spatial and temporal locality; a data object accessedonce has a higher probability of being accessed again and that otherdata objects nearby are also likely to be accessed in the near future.Therefore, increasing the spatio-temporal locality of data references ofa program usually improves the caching performance. Two types ofoptimization techniques are commonly employed in order to improve thespatio-temporal locality of programs: (1) Data access optimizations and(2) data layout optimizations.
1. Data access optimizations are code transformations that changethe order of data accesses. These include basic loop transformationsfor perfectly nested loops1, e.g., loop interchange, loop fusion,loop fission and loop tiling. However, real-life programs are oftennot perfectly nested and certain pre-conditioning transformationsare usually required [76]. Examples of such pre-conditioningtransformations are loop skewing, loop unrolling and loop peeling.
2. Data layout optimizations rearrange data in the memory inorder to improve spatial locality and/or reduce cache conflicts andfalse sharing [129]. A common data layout transformation is arraypadding. When data elements mapped onto the same cache lineare accessed in an alternating fashion, they cause cache conflicts.Array padding adds unused variables (pads) between the dataelements in order to map them to different cache lines. Similarly,data coping [141] is used to copy data from non-contiguous memorylocations to contiguous areas of memory, thus improving caching
1Perfectly nested loops are nested loops where all assignment statements arecontained in the innermost loop.
24 PARALLEL PROGRAMMING USING DATAFLOW MODELS
performance. Other examples of data layout transformationsinclude array merging and array transpose.
Beside these basic optimizations, other advanced domain specifictransformations are used for specific applications. For example, inthe domain of numerical applications, space filling curves (such asPeano curve, Hilbert curve and Z-order curve) are used to maximizespatial locality of multi-dimensional matrix multiplication [66]. Similarly,time tiling [53] is used to increase the arithmetic density of stencilcomputations much beyond conventional loop tiling. Thus memorybandwidth bottlenecks are avoided in these applications.
2.3.3 Scratchpad allocation techniques
The need for energy efficiency requires that the most frequently useddata objects be kept in faster and more energy efficient memories. Upuntil the early 2000s, caches were considered the de facto standard forsuch memories. In [14], it is shown that scratchpad memories generallyconsume 40% less energy and 34% less area as compared to caches of thesame storage capacity. The effect on energy consumption of the systemoverall is however dependent on the efficiency of scratchpad management.Two of the biggest challenges in scratchpad allocation are data reuseanalysis and dynamically changing the set of objects assigned to thescratchpad. Evolution of scratchpad allocation techniques is classified asfollows:
1. Data objects types:The initial techniques only considered static variables for scratchpadallocation. Later techniques started considering stacks as well [9,115] and more recent techniques work with all variables includingthe ones that go on the heap [47].
2. Program structure requirements:Early work required the code to be very well structured. Forexample, variables could only be accessed in the inner most loopsand without control flow statements such as if-else and continue-
SYNCHRONIZATION OF DATAFLOW PROGRAMS 25
break [75, 110]. But recent techniques are more generalized to workwith irregular control flow and non-affine access patterns [130].
3. Data-reuse analysis:One way of analyzing data-reuse is through offline static analysisof the source code[9, 110], however, these techniques usuallyimpose limitation on the structure and semantics of the application.Another way is through profiling [5] but this has limitations fordynamic applications.
4. Dynamism:The set of most frequently used data objects may change over time.This requires that the data objects allocated to the scratchpadare also replaced over time. The challenge lies in evaluatingthe expected performance gains by allocating new objects to thescratchpad verses the cost of allocations/de-allocations [52, 75].
2.4 Synchronization of dataflow programs
Parallel programs that work with shared variables require synchronizationat runtime if they are dynamically scheduled. Synchronization is primarilyneeded to avoid race conditions. A race condition [99] occurs when aparallel program produces an incorrect output due to violation of a readafter write dependency on a shared variable. Pure dataflow models [25,83, 120] do not allow shared variables and all communication betweennodes is explicit. However, implementations of dataflow models on VonNeumann computers often use shared variables to realize communicationon shared memory systems and therefore require synchronization.
Synchronization is usually defined by specifying synchronization points inthe program. Mechanisms for specifying these synchronization points varyin their levels of abstraction, ranging from low-level locks and semaphoresto high-level barriers (e.g. in OpenMP [42],Pthreads [33],TBB [70, 77,108] and Cilk [27]). Low-level synchronization mechanisms, such aslocks and semaphores have minimal overhead and provide point-to-point synchronization, thus are generally more efficient. However, thisefficiency comes at the price of increased complexity. The complexity

26 PARALLEL PROGRAMMING USING DATAFLOW MODELS
of developing applications with low-level synchronization mechanismsincreases not only with the scale of the application but also with theincreasing concurrency. High-level synchronization mechanisms, suchas barriers provide system wide all-to-all synchronization thus decreasethe complexity of developing applications, however, they have a largeroverhead and often cause over-synchronization.
2.5 Conclusion
This chapter provided background on parallel programming with dataflowmodels. It classifies different dataflow models in the form of a taxonomyand discusses the scheduling, memory management and synchronizationfor these models. The following chapters discuss the contributions of thisdissertation in detail.
Chapter 3
Parallel stencil computationsusing dynamic task graphs
The previous chapter provided background on parallel programmingusing dataflow models. This chapter uses a dataflow programmingmodel, dynamic task graph (section 2.1.1) to program stencil operations.Evaluation with two benchmark applications show that the dynamictask graph based stencil implementation has minimal synchronizationoverhead and scales better than the state-of-the-art implementations ofthe same kernel, demonstrating the competitive potential of dataflowmodels in the domain of high performance computing.
3.1 Introduction
Stencil operations
Stencil operations are a class of iterative methods which update arrayelements according to a fixed pattern, called a stencil. The array usuallyrepresents a 2 or 3 dimensional grid, where each element of the arrayrepresents a grid cell. A complete sweep applying a stencil operationover the whole grid is called a timestep. One of the primary applicationsof stencil operations in high-performance computing is for numerical
27
28 PARALLEL STENCIL COMPUTATIONS USING DYNAMIC TASK GRAPHS
simulations. An example can be found in the field of computationalfluid dynamics (CFD), where the interaction of liquids and gases withsurfaces is simulated. This simulation is used to improve the aerodynamicproperties of cars and planes, or to design swimsuits that reduce thedrag in water and make swimmers like Michael Phelps swim faster. Froma high-level perspective, CFD simulations approximate a continuoussolution described by equations with a series (timesteps) of discretizedsolutions. Stencil operations calculate the new values (for the currenttimestep) of the discretized space based on the values of a previoustimestep.
Figure 3.1 shows a two dimensional five-point stencil, commonly usedin the Jacobi’s iterative method for solving partial differential equations(PDEs), such as the heat equation or Laplace’s equation. The functionF() uses the green cells in timestep t to compute the value for the orangecell in timestep t + 1 and this operation is repeated for each cell in atimestep. Stencil computations have a lot of intrinsic data parallelismavailable within a single timestep, however, there are data dependenciesbetween the different timesteps that need to be respected in order toproduce correct results. In this example, each row in the grid is assignedto a thread, for the sake of simplicity (the actual implementations useblock-based data distribution to minimize border communication). Since
F ( )
Time step = t
Time step = t + 1
Thread 0
Thread 1Thread 2Thread 3
Thread 4
Thread 0
Thread 1Thread 2Thread 3Thread 4
x
for (t=begin to t=end) {parallel_for(y=y_min to y=y_max) {for(x=x_min to x=x_max) {grid[t+1,y,x] =
K*(grid[t,y,x-1] + grid[t,y,x+1]+ grid[t,y-1,x] + grid[t,y+1,x] - 4*grid[t,y,x]) + grid[t,y,x];
}} //Barrier synchronization
}
y
Element updatedElements readElements needed for next update
Thread 0
Thread 1
Thread 2
Thread 3
Thread 4
Barrier synchronization
Thread 0 Thread 1 Thread 2 Thread 3 Thread 4
Barrier synchronization
Barrier synchronization
(a)
(b)
(c)
(d)
Figure 3.1: A five point stencil operation on a two dimensional grid
INTRODUCTION 29
neighboring rows are assigned to different threads, threads must ascertainthat the required input data is available before starting computation.For example, thread 2 in figure 3.1 must synchronize with threads 1and 3 to make sure all the data required for its computation is ready.Stencil computations usually have a low arithmetic intensity (arithmeticoperations per memory access), therefore, efficient use of the cache playsa pivotal role in the overall performance of the kernel.
Other examples of high-performance computing applications that relyheavily on stencil computations include: Simulation of plasma in nuclearphysics or space research, weather simulations, shock hydrodynamics,combustion simulations etc. Most of these high performance computingapplications involve solving linear systems of partial differential equations(PDEs) or non-linear systems of hyperbolic partial differential equations.Stencil operations lie at the heart of all these systems [45], whether theyinvolve structured (rectangular) grid methods, multigrid methods [63] orblock-structured adaptive mesh refinement based techniques [39].
Parallel stencil operations in high-performance computing
Over the past decade the computing industry has witnessed a shiftfrom exponential frequency scaling to increasing number of cores onchip. This trend is expected to continue in the foreseeable future forvarious reasons, including energy efficiency, performance, reliability andprocessor design costs. It is projected that, during the next decadethe amount of parallelism on a single microprocessor will rival thatof the early supercomputers built in the 1980s [111]. This trend ofincreasing parallelism is seen in nearly all computing devices, rangingfrom smart-phones and tablets to multi-socket servers. ContemporaryHigh Performance Computing (HPC) clusters are based on connectingindividual compute nodes with fast (low-latency, high-bandwidth)interconnects, such as Infiniband networks. Each compute node usuallyhas multiple sockets that house multi-core processors and additionalco-processors (such as Intel Xeon Phi in Tianhe-2 [41]) or acceleratorcards (such as NVidia Tesla in Titan). The result is a hardware setupwith a complex memory hierarchy and communication topology.
30 PARALLEL STENCIL COMPUTATIONS USING DYNAMIC TASK GRAPHS
The software applications that use stencil codes typically run on high-performance computing infrastructure and therefore have to deal withthis complex hardware setups. In general, software for high-performancecomputing needs to combine parallel programming (on the compute nodes,that are shared-memory systems) and distributed programming (acrosscompute nodes). While attempts are being made to develop programmingmodels that span the complete systems (such as the Partitioned GlobalAddress Space model [146]), no efficient generally applicable programmingmodel exists at the time of writing. State-of-the-art software for HPCis therefore typically developed in a so-called hybrid fashion, wherea shared memory parallel programming model (such as OpenMP orThreaded Building Blocks) is combined with a distributed programmingmodel (such as MPI). This chapter focuses on the optimization of stencilcomputations on shared memory parallel platforms consisting of multiplesockets with multi-core processors.
The scalability of high performance computing applications becomes moreand more important with the ever increasing number of cores per chip.Two problems that hamper the continued scalability of parallel stencilcomputations are: (1) Over-synchronization and (2) memory bandwidthsaturation. Several stencil compilers and auto-tuning frameworks havebeen developed that focus on optimizing stencil computations on multi-core hardware, for example, Pochoir [126], Pluto [15], Patus [37] andthe Berkeley auto-tuner [44, 45]. These stencil compilers and auto-tuning frameworks take a stencil description (written in a domainspecific language) and generate optimized multi-threaded code. Theyuse techniques like time-tiling [53] and cache blocking to increase thearithmetic intensity i.e. doing more arithmetic operations per memoryaccess. While these techniques are very effective in increasing thearithmetic intensity, they use global barriers for the synchronization,which cause a lot of overhead. Techniques that propose low-level point-to-point synchronization for stencil computations using Phasers arepresented in [112, 113]; section 3.8 discusses them in more detail.

INTRODUCTION 31
Stencil operations using dynamic task graphs
We model stencil computations using dynamic task graphs (DTGs) [73],which are directed acyclic graphs dynamically created at runtime andtypically executed using a work-stealing scheduler (section 2.1.1). Byconstruction, this approach avoids global barriers, but uses point-to-point synchronization instead. This point-to-point synchronization isfurther reduced because of lazy task spawning i.e. delayed spawning oftasks until they can execute without the need for any synchronization.Furthermore we exploit basic properties of stencil computations formemory management and performance optimization of dynamic taskgraphs. Moreover, time-tiling is used to increase the arithmetic intensityof the stencil operations in order to reduce the cache misses and eliminatethe memory bandwidth bottleneck. To the best of our knowledge thisis the first dataflow implementation of stencil operations that employestime-tiling, resulting in fast and scalable stencil operations.
The approach is implemented using the Flowgraph library [135] includedin the Intel Threading Building Blocks (TBB) version 4.1. The TBBFlowgraph library supports static task graphs with dataflow executionsemantics. By adding support for dynamic task creation at runtime, weare able to model dynamic task graphs using Flowgraph objects. Thesedynamic task graphs are then executed using the TBB work-stealingscheduler. We use two benchmarks for validation and compare our resultsto the state-of-the art stencil compilers Pochoir [126] and Pluto [15].
The rest of the chapter is structured as follows. Section 3.2 highlights keyproblems in the scalability of parallel stencil operations. Section 3.3explains dynamic task graphs and their execution. Section 3.4presents the modeling of stencil operations as dynamic tasks graphs.Section 3.5 explains our implementation of dynamic task graphs usingTBB Flowgraphs. Our experimental results are shown in section 3.6.Section 3.7 presents further discussions on some aspects of our approach,including synchronization, vectorization and non-uniform memory access(NUMA) awareness. Section 3.8 gives an overview of the state-of-the-artin the field of stencil computations. Section 3.9 presents our conclusions.
32 PARALLEL STENCIL COMPUTATIONS USING DYNAMIC TASK GRAPHS
3.2 Scalability of stencil operations
This section describes in detail the problems with developing efficientstencil codes for multi-socket multi-core compute nodes. Figure 3.2(a)shows an implementation of the stencil operation of figure 3.1 parallelizedusing an OpenMP parallel_for construct. Figure 3.2(b) shows a threadmodel of the implementation, with a barrier between each timestep.Figure 3.2(c) shows the memory access pattern for the stencil as itmoves in the increasing x direction. The performance scaling of thisimplementation on a dual socket Intel Xeon E5-2670 (2x8 cores) is shownin figure 3.2(d). With compiler based vectorization, pre-fetching and-O3 optimization for speed, the system performs only 23 GFLOPS1 (23billion floating point operations per second), which is less than 15%of the computational power of the node. Two reasons for this lack ofcomputational efficiency are: (1) over-synchronization and (2) memorybandwidth saturation.
3.2.1 Over-synchronization
One of the major factor inhibiting the scalability of parallel softwareon multi-core systems is the synchronization overhead. Consider theparallel stencil implementation shown in figure 3.2(a). The top loop(using variable t) cannot be parallelized using parallel_for due tothe dependencies between successive iterations, where a later iterationrequires values of the previous iteration and therefore can only start whenthe previous one has finished. The second loop (using variable y) can beparallelized because its iterations can be executed independently of eachother. However, the parallel_for end with barrier synchronization, thusby parallelizing the second loop a barrier is inserted between iterationsof the top loop (timesteps).
Figure 3.2(b) shows a corresponding thread model of the implementationin figure 3.2(a), showing the barriers between successive timesteps. In thisparallel version of the stencil operation neighboring rows are assignedto different threads. Before thread 2 starts computing timestep 1 it
1Similar implementations using Cilk Plus or Threading Building blocks havecomparable performance.

SCALABILITY OF STENCIL OPERATIONS 33
F ( )
Time step = t
Time step = t + 1
Thread 0
Thread 1Thread 2Thread 3
Thread 4
Thread 0
Thread 1Thread 2Thread 3Thread 4
x
for (t=begin to t=end) {parallel_for(y=y_min to y=y_max) {for(x=x_min to x=x_max) {grid[t+1,y,x] =
K*(grid[t,y,x-1] + grid[t,y,x+1]+ grid[t,y-1,x] + grid[t,y+1,x] - 4*grid[t,y,x]) + grid[t,y,x];
}} //Barrier synchronization
}
y
Element updatedElements readElements needed for next update
Thread 0
Thread 1
Thread 2
Thread 3
Thread 4
Barrier synchronization
Thread 0 Thread 1 Thread 2 Thread 3 Thread 4
Barrier synchronization
Barrier synchronization
(a)
(b)
(c)
(d)
Figure 3.2: A naively parallelized 2D five-point stencil: (a) AnOpenMP C++ implementation, (b) a thread model showing barriersynchronizations between subsequent timesteps, (c) memory accesspattern and (d) performance scaling results on a 16 core system.
must make sure that threads 1 and 3 are finished with timestep 0, inorder to avoid a race condition. This synchronization is provided by animplicit barrier at the end of the parallel_for loop. Note that thread2 only required synchronization with threads 1 and 3 but due to the“all-to-all" nature of the barrier it is forced to synchronize needlesslywith threads 0 and 4 as well, thus causing over synchronization. Similarover-synchronization problems are even found in the state-of-the-art
34 PARALLEL STENCIL COMPUTATIONS USING DYNAMIC TASK GRAPHS
implementations of stencil operations, as we will show in Section 3.7.1.The next section shows how our approach minimizes the synchronizationoverhead by using the execution semantics of a dynamic task graph.
3.2.2 Memory bandwidth saturation
A second important factor inhibiting the scalability of stencil operationsis memory bandwidth saturation. Naive implementations of stenciloperations are usually unable to exploit the computational power of theplatform due to the bottleneck caused by bandwidth saturation. Considerthe stencil operation in figure 3.2. Assuming that the domain of thestencil (e.g. the grid on which the stencil operation is performed) ismuch larger than the cache, every lattice update requires (apart fromthe boundaries) 7 floating point operations for 32 bytes of data transfer(3 reads and 1 write) to/from the memory, resulting in a low 0.219FLOPS/byte ratio. To improve this so-called cache-aware loop tilingtechniques we divide the domain into tiles such that two complete rowsof the tile may be cached. This reduces the main memory traffic downto a single read and write, resulting in an overall 0.438 FLOPS/byte.However this is still lower than what most modern processors can achieve,which has historically been more than 1 FLOPS/Byte and expectedto increase even more in the future [111]. Therefore, the program stillremains memory bandwidth bound according to the roofline model forperformance of multicores [140]. Section 3.4 shows how our approachovercomes this bottleneck by incorporating time-tiling [53] to increasethe data reuse from the caches.
3.3 Execution of dynamic task graphs
In the previous section we saw how over-synchronization effects thescalability of stencil computations. In order to reduce this synchronizationoverhead we program stencil operations as dynamic task graphs (section2.1.1). These dynamic task graphs are executed with a dynamic work-stealing scheduler. However, the seemingly simple execution semanticsof dataflow are not trivial to maintain in dynamic task graphs, where
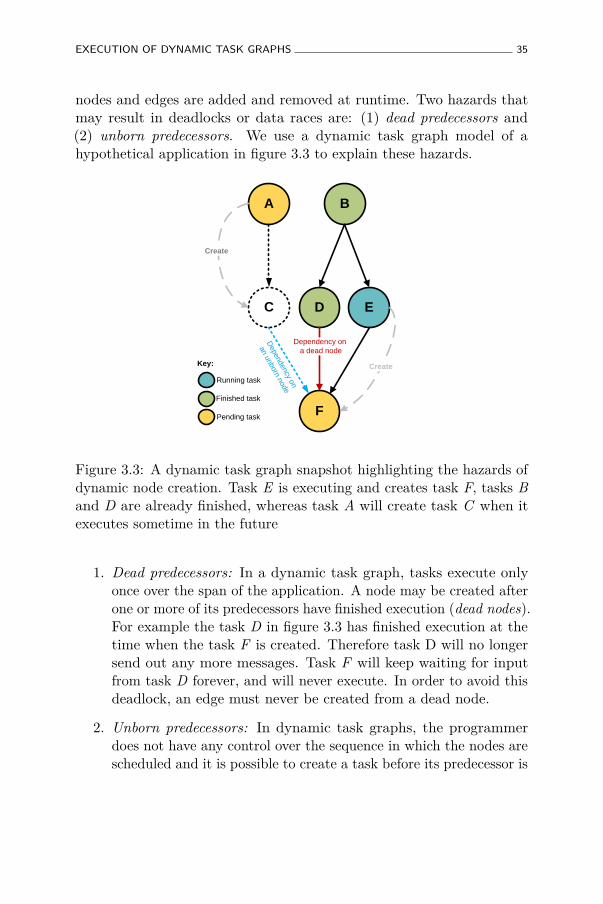
EXECUTION OF DYNAMIC TASK GRAPHS 35
nodes and edges are added and removed at runtime. Two hazards thatmay result in deadlocks or data races are: (1) dead predecessors and(2) unborn predecessors. We use a dynamic task graph model of ahypothetical application in figure 3.3 to explain these hazards.
F
DC E
Dependency ona dead node
BA
Create
Key:
Running task
Finished task
Pending task
Dependency on
an unborn node
Create
Figure 3.3: A dynamic task graph snapshot highlighting the hazards ofdynamic node creation. Task E is executing and creates task F, tasks Band D are already finished, whereas task A will create task C when itexecutes sometime in the future
1. Dead predecessors: In a dynamic task graph, tasks execute onlyonce over the span of the application. A node may be created afterone or more of its predecessors have finished execution (dead nodes).For example the task D in figure 3.3 has finished execution at thetime when the task F is created. Therefore task D will no longersend out any more messages. Task F will keep waiting for inputfrom task D forever, and will never execute. In order to avoid thisdeadlock, an edge must never be created from a dead node.
2. Unborn predecessors: In dynamic task graphs, the programmerdoes not have any control over the sequence in which the nodes arescheduled and it is possible to create a task before its predecessor is
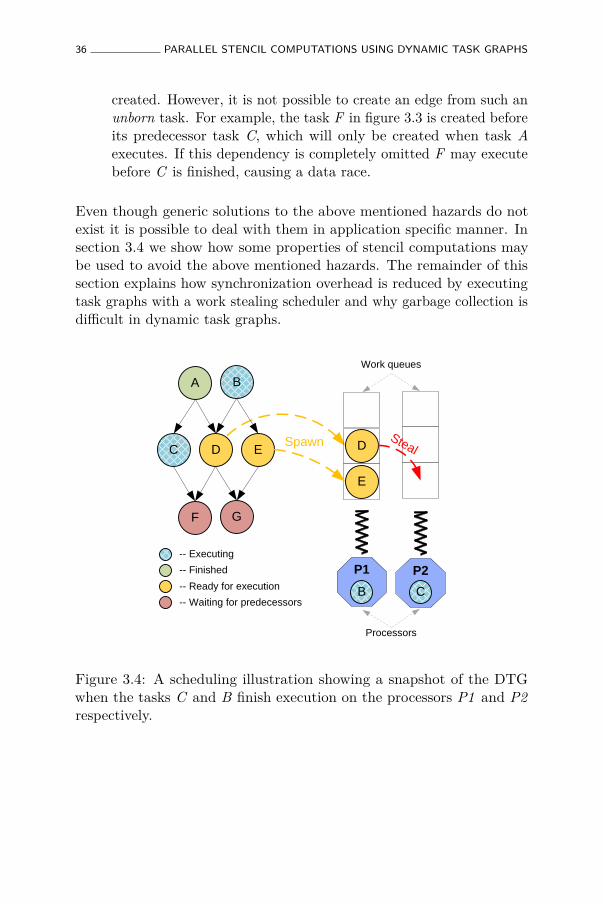
36 PARALLEL STENCIL COMPUTATIONS USING DYNAMIC TASK GRAPHS
created. However, it is not possible to create an edge from such anunborn task. For example, the task F in figure 3.3 is created beforeits predecessor task C, which will only be created when task Aexecutes. If this dependency is completely omitted F may executebefore C is finished, causing a data race.
Even though generic solutions to the above mentioned hazards do notexist it is possible to deal with them in application specific manner. Insection 3.4 we show how some properties of stencil computations maybe used to avoid the above mentioned hazards. The remainder of thissection explains how synchronization overhead is reduced by executingtask graphs with a work stealing scheduler and why garbage collection isdifficult in dynamic task graphs.
-- Finished
-- Ready for execution
-- Waiting for predecessors
SpawnC D E
F G
A B
P2P1
E
B
D
C
Steal
-- Executing
Work queues
Processors
Figure 3.4: A scheduling illustration showing a snapshot of the DTGwhen the tasks C and B finish execution on the processors P1 and P2respectively.
EXECUTION OF DYNAMIC TASK GRAPHS 37
3.3.1 Minimizing synchronization overhead
Work-stealing schedulers are a proven way to execute task graphs [108].In a work stealing scheduler, each processor runs a work-stealing thread(worker). Each thread has a pool (queue) of tasks waiting to be executedcalled a work queue. The worker threads execute tasks from their ownwork queues as long as they are not empty. When the work queuebecomes empty the worker tries to randomly steal a task from thepools of other workers. A task becomes ready for execution after ithas received messages on all its incoming edges. When a task becomesready for execution it is spawned as a task in a work queue. Thus, thescheduling is a combination of work stealing and dataflow.
Figure 3.4 shows a snapshot to illustrate the scheduling mechanism ofdynamic task graphs. When the task B finishes execution messagesare sent to the tasks D and E which are then ready for execution andare therefore spawned on the work queue of processor P1. When taskC completes a message is sent to the task F. However, it can not bespawned on a work queue until it receives a message from the task D aswell. The work queue of P2 then becomes empty. Therefore, it steals atask from the work queue of P1.
Note that tasks are only spawned on a work queue when all the datarequired for their execution is available and the cores executing thesetasks do not have to synchronize during their execution, thus furtherreducing synchronization overhead. Our results also show that all coresare fully utilized and lazy task spawning does not decrease processorutilization for stencil computations.
3.3.2 Memory de-allocation
In applications based on iterative algorithms, the number of tasks createdat runtime may be large (in millions). For such an application, a dynamictask-graph based system might run out of memory in the absence of atask de-allocation scheme. Since DTGs allow arbitrary dependenciesbetween any pair of tasks in the dynamic graph, the results computedby a task may be required not only by other tasks that exist at presentbut also by tasks yet to be created in future.
38 PARALLEL STENCIL COMPUTATIONS USING DYNAMIC TASK GRAPHS
Due to the difficulties in analyzing the dataflow of future tasks a genericmemory de-allocation scheme that can remove finished tasks and theirresults, does not exist [4]. However, for applications with more regulardependency patterns, such as for stencil computations, it is possibleto devise application-specific memory de-allocation schemes. This isoutlined in the following section.
3.4 Stencil computations as dynamic task graphs
In this section we describe how stencil operations are expressed asdynamic tasks graphs. Figure 3.5 shows a dynamic task graph for a 2-dimensional 5 point stencil computation. The domain is divided into fourtiles A,B,C and D and initial tasks which perform the stencil operationon these tiles are created. These initial tasks then create successor tasksthat work on the same regions for the subsequent timesteps. The lefthand side of figure 3.5 shows the upper right corner of tile B beingupdated, the data required for this operation resides not only in the tileB itself but also in the tiles A and D. Therefore, a task updating tile Bin the timestep t may not start before the tasks working on the tiles A, B,and D in timestep t-1 are finished, the DTG takes all these dependenciesinto account. Note that these dependencies cannot be expressed usingspawn-sync or fork-join mechanisms without using all-to-all barriers.This is why our dynamic task-graph based stencil operations minimizesynchronization costs, which will be shown in Section 3.6.
3.4.1 Avoiding dynamic task creation hazards: dead andunborn predecessors
During the initialization phase tasks are created for the first two timestepsto solve regions of the matrix e.g. tiles for a 2D domain. These initialtasks then create other tasks (along with their incoming edges) workingon the same regions for the subsequent timesteps. Tasks are created twotimesteps in advance e.g. the task A0 in figure 3.5 creates the task A2.This ensures that deadlocks due to dead predecessors do not occur.
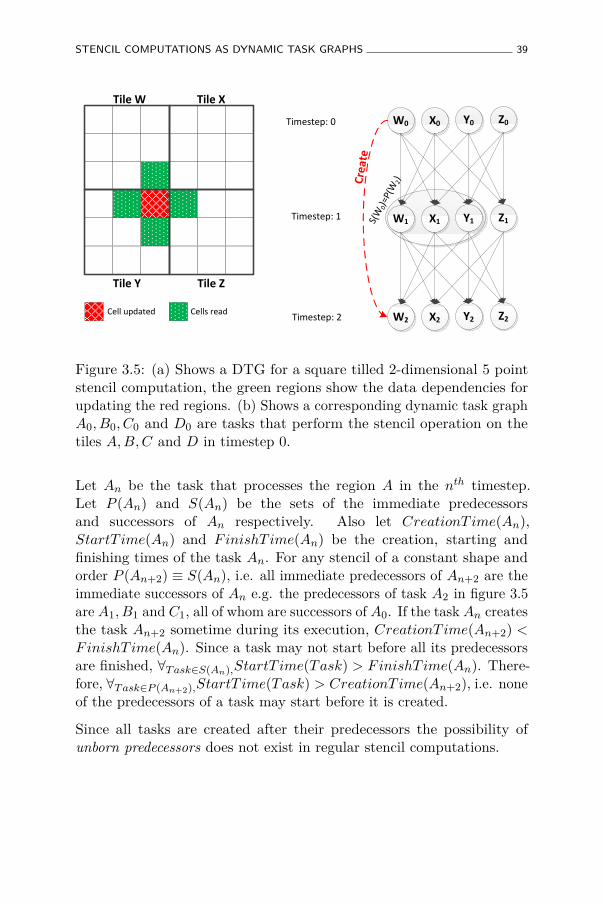
STENCIL COMPUTATIONS AS DYNAMIC TASK GRAPHS 39
Tile W Tile X
Tile Y Tile Z
Timestep: 0
Timestep: 1
Timestep: 2
S(W
0)=P(
W2)Cr
eate
W1 X1 Y1 Z1
W0 X0 Y0 Z0
W2 X2 Y2 Z2Cell updated Cells read
Figure 3.5: (a) Shows a DTG for a square tilled 2-dimensional 5 pointstencil computation, the green regions show the data dependencies forupdating the red regions. (b) Shows a corresponding dynamic task graphA0, B0, C0 and D0 are tasks that perform the stencil operation on thetiles A,B,C and D in timestep 0.
Let An be the task that processes the region A in the nth timestep.Let P (An) and S(An) be the sets of the immediate predecessorsand successors of An respectively. Also let CreationT ime(An),StartT ime(An) and FinishT ime(An) be the creation, starting andfinishing times of the task An. For any stencil of a constant shape andorder P (An+2) ≡ S(An), i.e. all immediate predecessors of An+2 are theimmediate successors of An e.g. the predecessors of task A2 in figure 3.5are A1, B1 and C1, all of whom are successors of A0. If the task An createsthe task An+2 sometime during its execution, CreationT ime(An+2) <FinishT ime(An). Since a task may not start before all its predecessorsare finished, ∀T ask∈S(An),StartT ime(Task) > FinishT ime(An). There-fore, ∀T ask∈P (An+2),StartT ime(Task) > CreationT ime(An+2), i.e. noneof the predecessors of a task may start before it is created.
Since all tasks are created after their predecessors the possibility ofunborn predecessors does not exist in regular stencil computations.
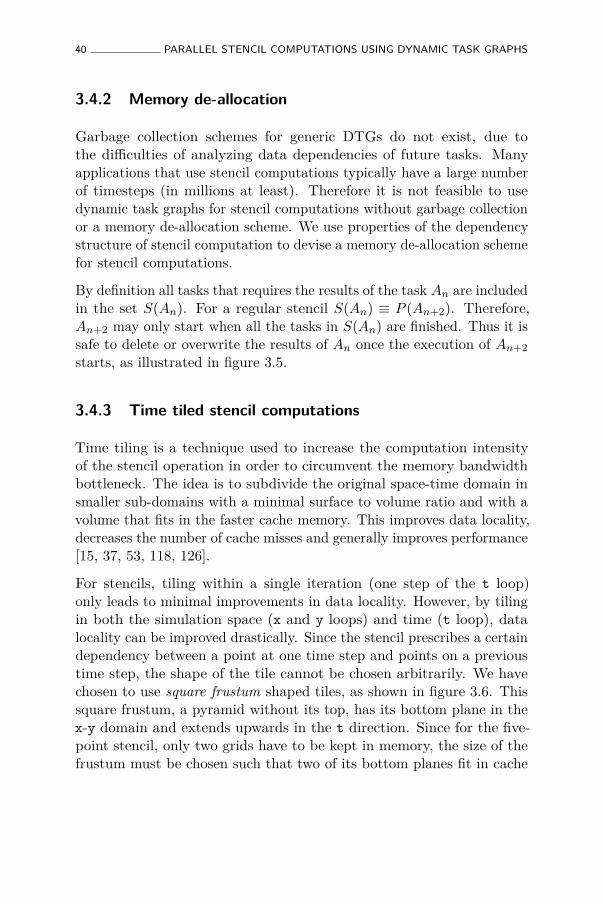
40 PARALLEL STENCIL COMPUTATIONS USING DYNAMIC TASK GRAPHS
3.4.2 Memory de-allocation
Garbage collection schemes for generic DTGs do not exist, due tothe difficulties of analyzing data dependencies of future tasks. Manyapplications that use stencil computations typically have a large numberof timesteps (in millions at least). Therefore it is not feasible to usedynamic task graphs for stencil computations without garbage collectionor a memory de-allocation scheme. We use properties of the dependencystructure of stencil computation to devise a memory de-allocation schemefor stencil computations.
By definition all tasks that requires the results of the task An are includedin the set S(An). For a regular stencil S(An) ≡ P (An+2). Therefore,An+2 may only start when all the tasks in S(An) are finished. Thus it issafe to delete or overwrite the results of An once the execution of An+2starts, as illustrated in figure 3.5.
3.4.3 Time tiled stencil computations
Time tiling is a technique used to increase the computation intensityof the stencil operation in order to circumvent the memory bandwidthbottleneck. The idea is to subdivide the original space-time domain insmaller sub-domains with a minimal surface to volume ratio and with avolume that fits in the faster cache memory. This improves data locality,decreases the number of cache misses and generally improves performance[15, 37, 53, 118, 126].
For stencils, tiling within a single iteration (one step of the t loop)only leads to minimal improvements in data locality. However, by tilingin both the simulation space (x and y loops) and time (t loop), datalocality can be improved drastically. Since the stencil prescribes a certaindependency between a point at one time step and points on a previoustime step, the shape of the tile cannot be chosen arbitrarily. We havechosen to use square frustum shaped tiles, as shown in figure 3.6. Thissquare frustum, a pyramid without its top, has its bottom plane in thex-y domain and extends upwards in the t direction. Since for the five-point stencil, only two grids have to be kept in memory, the size of thefrustum must be chosen such that two of its bottom planes fit in cache
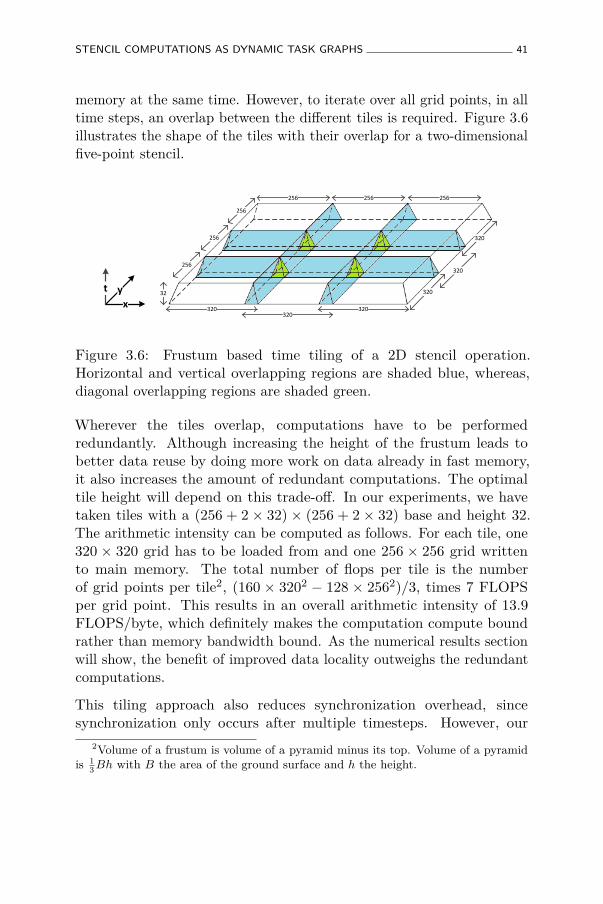
STENCIL COMPUTATIONS AS DYNAMIC TASK GRAPHS 41
memory at the same time. However, to iterate over all grid points, in alltime steps, an overlap between the different tiles is required. Figure 3.6illustrates the shape of the tiles with their overlap for a two-dimensionalfive-point stencil.
320
256
256
256 256
256
256
320 320
320
320
320
32yx
t
Figure 3.6: Frustum based time tiling of a 2D stencil operation.Horizontal and vertical overlapping regions are shaded blue, whereas,diagonal overlapping regions are shaded green.
Wherever the tiles overlap, computations have to be performedredundantly. Although increasing the height of the frustum leads tobetter data reuse by doing more work on data already in fast memory,it also increases the amount of redundant computations. The optimaltile height will depend on this trade-off. In our experiments, we havetaken tiles with a (256 + 2 × 32) × (256 + 2 × 32) base and height 32.The arithmetic intensity can be computed as follows. For each tile, one320 × 320 grid has to be loaded from and one 256 × 256 grid writtento main memory. The total number of flops per tile is the numberof grid points per tile2, (160 × 3202 − 128 × 2562)/3, times 7 FLOPSper grid point. This results in an overall arithmetic intensity of 13.9FLOPS/byte, which definitely makes the computation compute boundrather than memory bandwidth bound. As the numerical results sectionwill show, the benefit of improved data locality outweighs the redundantcomputations.
This tiling approach also reduces synchronization overhead, sincesynchronization only occurs after multiple timesteps. However, our
2Volume of a frustum is volume of a pyramid minus its top. Volume of a pyramidis 1
3 Bh with B the area of the ground surface and h the height.
42 PARALLEL STENCIL COMPUTATIONS USING DYNAMIC TASK GRAPHS
results (section 3.7.1) show that the all-to-all barriers are still expensiveand their overhead is severely aggravated with load balancing problems.Therefore, we consider each tile as a task in the dynamic task graphapproach and take into account the dependencies between the tiles. Thisavoids all explicit barriers.
Data dependencies of time tiled stencil computations The dependen-cies of a simple tiled (non time-tiled) version as shown in figure 3.5 aresimilar to the stencil operation itself, where every tile requires valuesfrom its horizontal and vertical neighboring tiles3. However, when time-tiling is applied the resulting frustums not only require values from theirhorizontal and vertical neighbors but also from their diagonal neighbors.This is illustrated in figure 3.6. The horizontal and vertical overlappingregions are shaded blue whereas the diagonal overlapping regions areshaded green. Also note that the horizontal and vertical overlappingregions have a computational redundancy of 2, whereas, the diagonaloverlapping regions have a computational redundancy of 4.
3.5 Implementation
In order to validate and benchmark our approach we first need toimplement it. The implementation uses TBB flowgraphs as an enablingtechnology to implement dynamic task graphs and execute them with theTBB scheduler. As alternative for TBB flowgraphs we could have usedthe Nabbit library [4], which is conceptually similar but unfortunatelyis no longer maintained and relies on a now-obsolete version of Cilk. Inthe remainder of this section we first give a brief introduction to TBBFlowgraphs and then explain the mapping of DTGs to TBB Flowgraphs.
3.5.1 TBB Flowgraphs
The Intel Threading Building Blocks (TBB) Flowgraph [77] provideabstractions that allow the programmer to express algorithms in the
3Considering x-axis and y-axis as the horizontal and vertical domains respectively.
IMPLEMENTATION 43
form of graphs that represent the data and control flow of the program.A flowgraph consists of two types of objects: ‘nodes’ and ‘edges’. Thenodes are further classified into four categories:
1. Functional: source, continue node, function node and multi-outputfunction nodes.
2. Buffering: buffer node, queue, priority queue & sequencer nodes.
3. Split/Join: queuing join, reserving join, tag matching join & splitnodes.
4. Others: broadcast, write once, overwrite & limiter nodes.
Detailed documentation on the syntax and semantics of all these nodesis included in the TBB reference manual and beyond the scope of thisthesis. We focus our discussion on the function nodes and queuing joinnodes. A function node executes a block of code whenever it receives aninput on one if its incoming edges and broadcasts the output on all itsoutgoing edges upon completion. A join node gathers inputs from allits incoming edges and forwards them in the form of an output tuplecontaining one message from every input.
Consider the flow graph example shown in figure 3.7. The graph gconsists of five function nodes a,b,c,d,e and one join node. The functionnodes a, b, c, d, e execute the user provided functions F(), G(), H(),I(), J() respectively. The execution of the graph starts when an inputmessage is sent to the node a using the try_put() function. The node aexecutes the function F() and sends a message to the nodes b and c. Thenode d can start execution as soon as it receives a message from eithernode b or node c i.e. as soon as one of its predecessors finishes execution.The join node waits for one input from both nodes b and c before sendingthem as a tuple to node e, therefore, the node e can only start after bothits predecessors b and c are finished. Also note that node d fires twiceduring the execution of the graph (once for every one of its predecessors),whereas node e only fires once. The g.wait_for_all() function returnswhen there are no more messages to process in the graph ‘g’ and none ofthe nodes are executing.
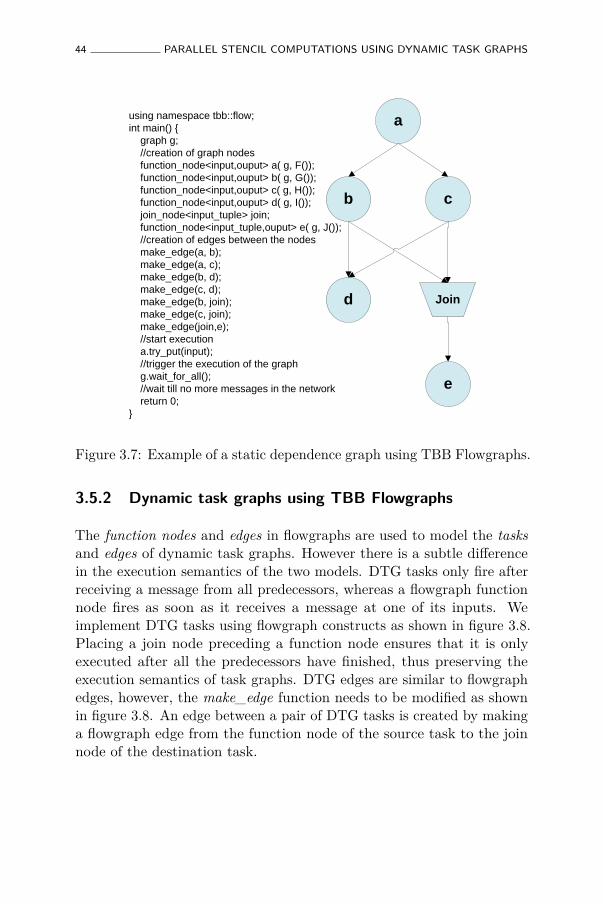
44 PARALLEL STENCIL COMPUTATIONS USING DYNAMIC TASK GRAPHS
using namespace tbb::flow;int main() {
graph g;//creation of graph nodesfunction_node<input,ouput> a( g, F());function_node<input,ouput> b( g, G());function_node<input,ouput> c( g, H());function_node<input,ouput> d( g, I());join_node<input_tuple> join; function_node<input_tuple,ouput> e( g, J()); //creation of edges between the nodes make_edge(a, b);make_edge(a, c);make_edge(b, d);make_edge(c, d);make_edge(b, join);make_edge(c, join);make_edge(join,e);//start executiona.try_put(input);//trigger the execution of the graphg.wait_for_all(); //wait till no more messages in the networkreturn 0;
}
b c
d
e
a
Join
Figure 3.7: Example of a static dependence graph using TBB Flowgraphs.
3.5.2 Dynamic task graphs using TBB Flowgraphs
The function nodes and edges in flowgraphs are used to model the tasksand edges of dynamic task graphs. However there is a subtle differencein the execution semantics of the two models. DTG tasks only fire afterreceiving a message from all predecessors, whereas a flowgraph functionnode fires as soon as it receives a message at one of its inputs. Weimplement DTG tasks using flowgraph constructs as shown in figure 3.8.Placing a join node preceding a function node ensures that it is onlyexecuted after all the predecessors have finished, thus preserving theexecution semantics of task graphs. DTG edges are similar to flowgraphedges, however, the make_edge function needs to be modified as shownin figure 3.8. An edge between a pair of DTG tasks is created by makinga flowgraph edge from the function node of the source task to the joinnode of the destination task.
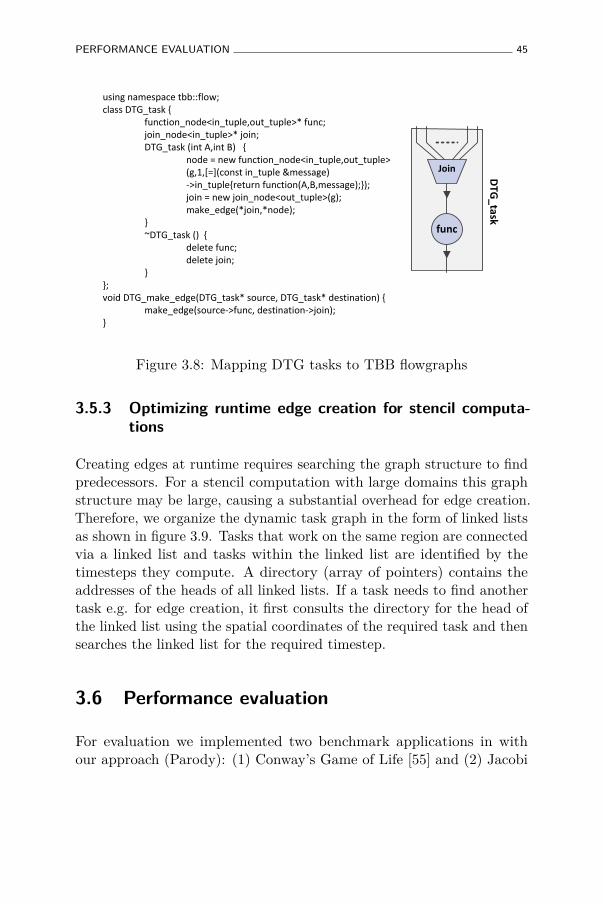
PERFORMANCE EVALUATION 45
func
Join
using namespace tbb::flow;class DTG_task {
function_node<in_tuple,out_tuple>* func;join_node<in_tuple>* join;DTG_task (int A,int B) {
node = new function_node<in_tuple,out_tuple> (g,1,[=](const in_tuple &message)->in_tuple{return function(A,B,message);});join = new join_node<out_tuple>(g);make_edge(*join,*node);
}~DTG_task () {
delete func;delete join;
}};void DTG_make_edge(DTG_task* source, DTG_task* destination) {
make_edge(source->func, destination->join);}
DTG_task
Figure 3.8: Mapping DTG tasks to TBB flowgraphs
3.5.3 Optimizing runtime edge creation for stencil computa-tions
Creating edges at runtime requires searching the graph structure to findpredecessors. For a stencil computation with large domains this graphstructure may be large, causing a substantial overhead for edge creation.Therefore, we organize the dynamic task graph in the form of linked listsas shown in figure 3.9. Tasks that work on the same region are connectedvia a linked list and tasks within the linked list are identified by thetimesteps they compute. A directory (array of pointers) contains theaddresses of the heads of all linked lists. If a task needs to find anothertask e.g. for edge creation, it first consults the directory for the head ofthe linked list using the spatial coordinates of the required task and thensearches the linked list for the required timestep.
3.6 Performance evaluation
For evaluation we implemented two benchmark applications in withour approach (Parody): (1) Conway’s Game of Life [55] and (2) Jacobi
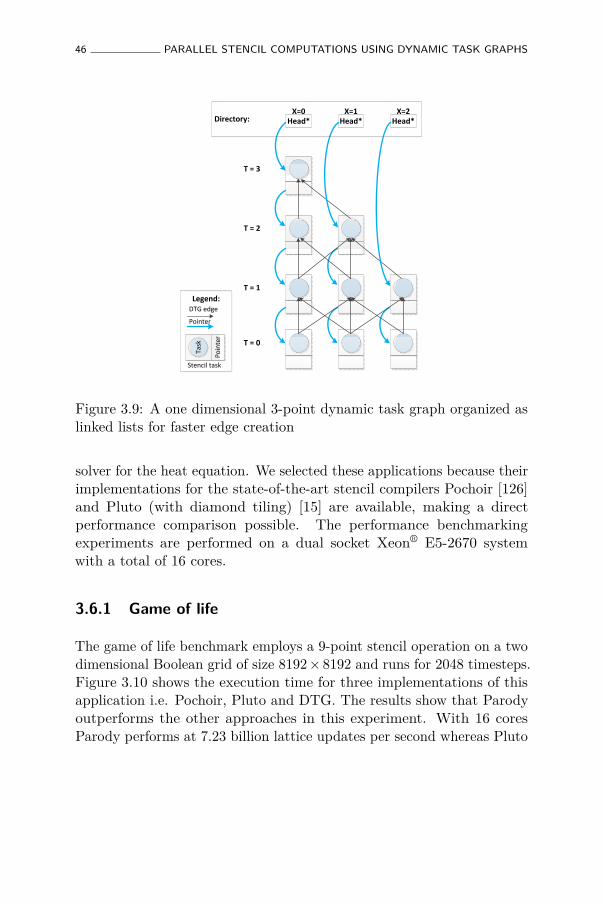
46 PARALLEL STENCIL COMPUTATIONS USING DYNAMIC TASK GRAPHS
X=0 X=1 X=2Head* Head* Head*
T = 0
T = 1
T = 2
T = 3
Poin
ter
Task
Pointer
DTG edge
Stencil task
Legend:
Directory:
Figure 3.9: A one dimensional 3-point dynamic task graph organized aslinked lists for faster edge creation
solver for the heat equation. We selected these applications because theirimplementations for the state-of-the-art stencil compilers Pochoir [126]and Pluto (with diamond tiling) [15] are available, making a directperformance comparison possible. The performance benchmarkingexperiments are performed on a dual socket Xeon® E5-2670 systemwith a total of 16 cores.
3.6.1 Game of life
The game of life benchmark employs a 9-point stencil operation on a twodimensional Boolean grid of size 8192× 8192 and runs for 2048 timesteps.Figure 3.10 shows the execution time for three implementations of thisapplication i.e. Pochoir, Pluto and DTG. The results show that Parodyoutperforms the other approaches in this experiment. With 16 coresParody performs at 7.23 billion lattice updates per second whereas Pluto

PERFORMANCE EVALUATION 47
and Pochoir versions produce at 4.89 and 3.46 billion lattice updates persecond respectively.
0
1
2
3
4
5
6
7
8
1 2 4 6 8 10 12 14 16
Latt
ice u
pd
ate
s/s
ec (
10
9)
Threads
Scaling: Game of Life
Parody
Pluto
Pochoir
Figure 3.10: Strong scaling results of Conways game of life benchmark ondual socket Xeon® E5-2670, domain size 8192× 8192 (higher is better).
Besides these scaling experiments on the 16 core machine we alsoperformed a larger scale experiment with a domain size of 16384× 16384on a 120 core shared memory system. The Pluto and Parody versionclocked at 12.54 and 37.72 billion lattice updates per second, resultingin net performance improvements by a factor of 3.01.
3.6.2 Heat benchmark
The heat benchmark employs a 5-point stencil operation on a twodimensional double precision grid of size 8192× 8192 and runs for 2048timesteps. Each stencil update requires seven floating point operations.Figure 3.11 shows the average speed in billion lattice updates per second,the values reported are for the useful work done only i.e. not countingin the redundant work done due to time tiling. Again the results showthat Parody outperforms the other approaches. With 16 cores Parodyperforms at 9.88 billion lattice updates per second whereas Pluto andPochoir versions run at 5.61 and 8.28 billion lattice updates per secondrespectively. The performance degradation for Pluto at 14 and 16 threadsis because of workload balancing problems.
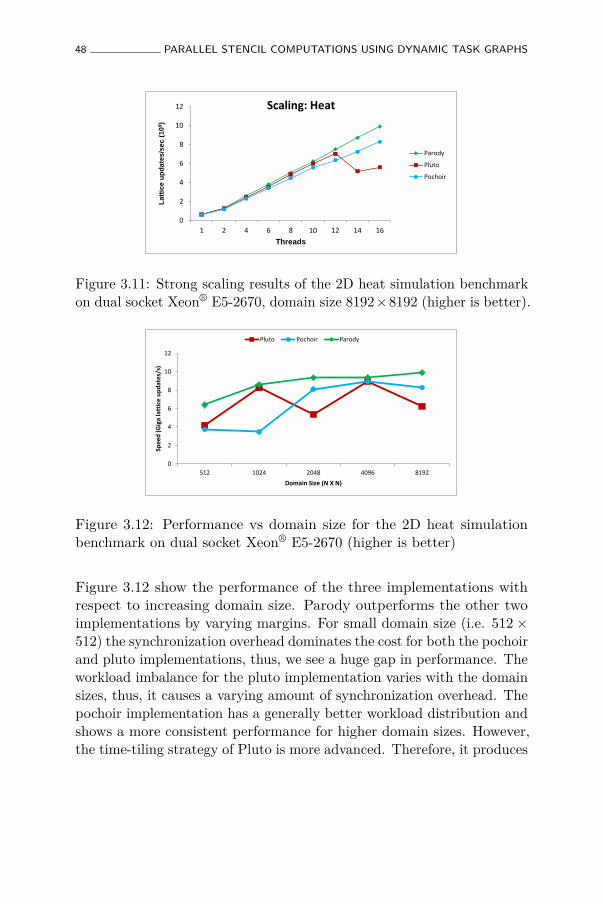
48 PARALLEL STENCIL COMPUTATIONS USING DYNAMIC TASK GRAPHS
0
2
4
6
8
10
12
1 2 4 6 8 10 12 14 16
Latt
ice u
pd
ate
s/s
ec (
10
9)
Threads
Scaling: Heat
Parody
Pluto
Pochoir
Figure 3.11: Strong scaling results of the 2D heat simulation benchmarkon dual socket Xeon® E5-2670, domain size 8192×8192 (higher is better).
0
2
4
6
8
10
12
512 1024 2048 4096 8192
Spe
ed
(G
iga
latt
ice
up
dat
es/
s)
Domain Size (N X N)
Pluto Pochoir Parody
Figure 3.12: Performance vs domain size for the 2D heat simulationbenchmark on dual socket Xeon® E5-2670 (higher is better)
Figure 3.12 show the performance of the three implementations withrespect to increasing domain size. Parody outperforms the other twoimplementations by varying margins. For small domain size (i.e. 512×512) the synchronization overhead dominates the cost for both the pochoirand pluto implementations, thus, we see a huge gap in performance. Theworkload imbalance for the pluto implementation varies with the domainsizes, thus, it causes a varying amount of synchronization overhead. Thepochoir implementation has a generally better workload distribution andshows a more consistent performance for higher domain sizes. However,the time-tiling strategy of Pluto is more advanced. Therefore, it produces
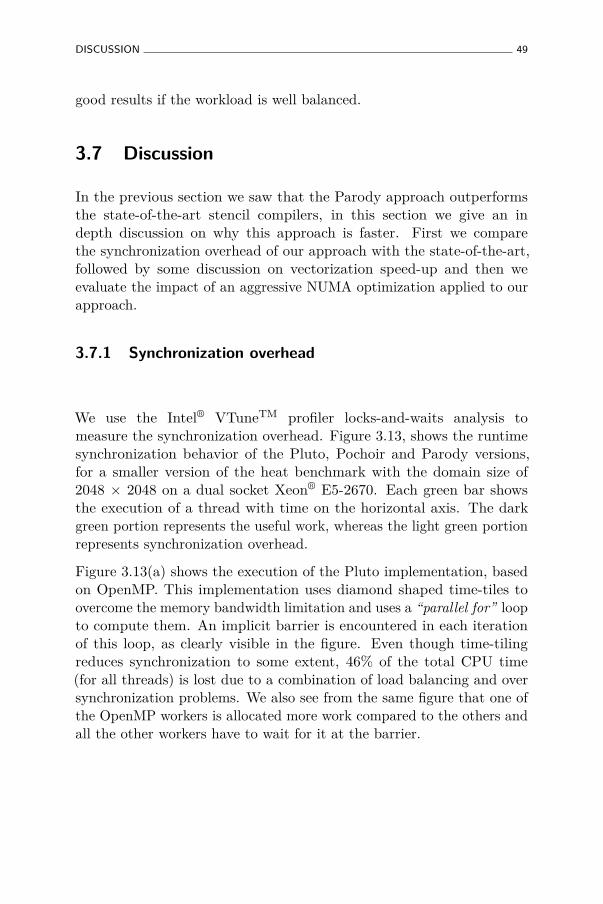
DISCUSSION 49
good results if the workload is well balanced.
3.7 Discussion
In the previous section we saw that the Parody approach outperformsthe state-of-the-art stencil compilers, in this section we give an indepth discussion on why this approach is faster. First we comparethe synchronization overhead of our approach with the state-of-the-art,followed by some discussion on vectorization speed-up and then weevaluate the impact of an aggressive NUMA optimization applied to ourapproach.
3.7.1 Synchronization overhead
We use the Intel® VTuneTM profiler locks-and-waits analysis tomeasure the synchronization overhead. Figure 3.13, shows the runtimesynchronization behavior of the Pluto, Pochoir and Parody versions,for a smaller version of the heat benchmark with the domain size of2048 × 2048 on a dual socket Xeon® E5-2670. Each green bar showsthe execution of a thread with time on the horizontal axis. The darkgreen portion represents the useful work, whereas the light green portionrepresents synchronization overhead.
Figure 3.13(a) shows the execution of the Pluto implementation, basedon OpenMP. This implementation uses diamond shaped time-tiles toovercome the memory bandwidth limitation and uses a “parallel for” loopto compute them. An implicit barrier is encountered in each iterationof this loop, as clearly visible in the figure. Even though time-tilingreduces synchronization to some extent, 46% of the total CPU time(for all threads) is lost due to a combination of load balancing and oversynchronization problems. We also see from the same figure that one ofthe OpenMP workers is allocated more work compared to the others andall the other workers have to wait for it at the barrier.
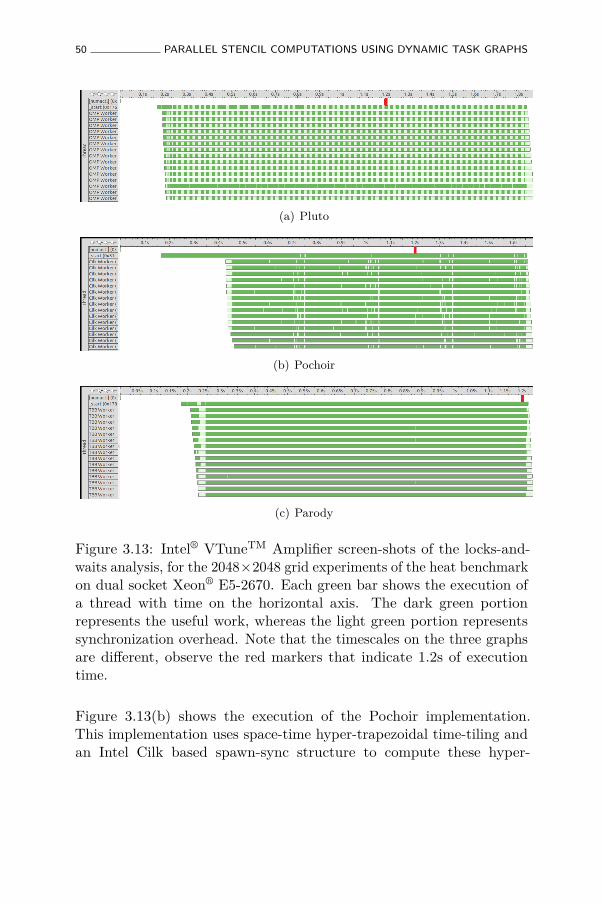
50 PARALLEL STENCIL COMPUTATIONS USING DYNAMIC TASK GRAPHS
(a) Pluto
(b) Pochoir
(c) Parody
Figure 3.13: Intel® VTuneTM Amplifier screen-shots of the locks-and-waits analysis, for the 2048×2048 grid experiments of the heat benchmarkon dual socket Xeon® E5-2670. Each green bar shows the execution ofa thread with time on the horizontal axis. The dark green portionrepresents the useful work, whereas the light green portion representssynchronization overhead. Note that the timescales on the three graphsare different, observe the red markers that indicate 1.2s of executiontime.
Figure 3.13(b) shows the execution of the Pochoir implementation.This implementation uses space-time hyper-trapezoidal time-tiling andan Intel Cilk based spawn-sync structure to compute these hyper-
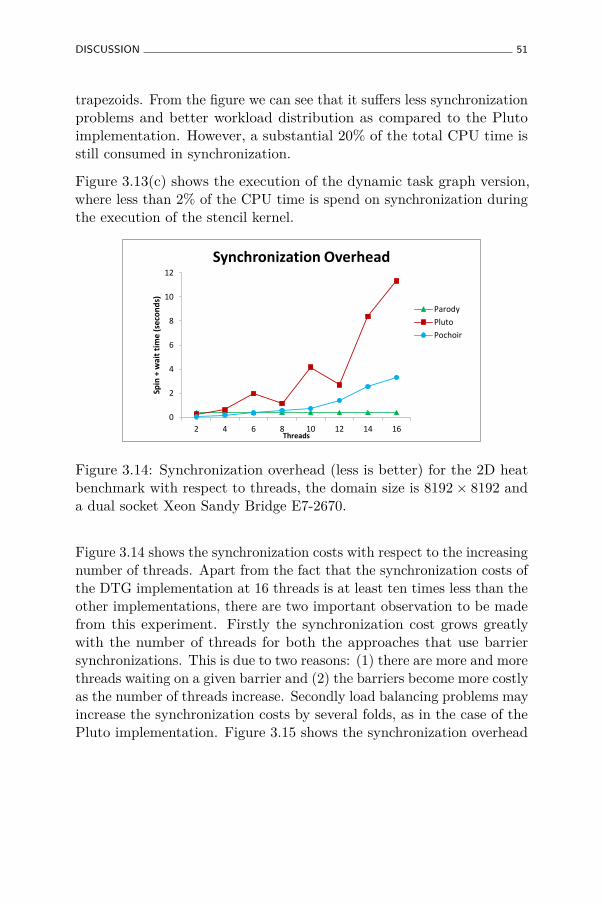
DISCUSSION 51
trapezoids. From the figure we can see that it suffers less synchronizationproblems and better workload distribution as compared to the Plutoimplementation. However, a substantial 20% of the total CPU time isstill consumed in synchronization.
Figure 3.13(c) shows the execution of the dynamic task graph version,where less than 2% of the CPU time is spend on synchronization duringthe execution of the stencil kernel.
0
2
4
6
8
10
12
2 4 6 8 10 12 14 16
Spin
+ w
ait
tim
e (
seco
nd
s)
Threads
Synchronization Overhead
Parody
Pluto
Pochoir
Figure 3.14: Synchronization overhead (less is better) for the 2D heatbenchmark with respect to threads, the domain size is 8192× 8192 anda dual socket Xeon Sandy Bridge E7-2670.
Figure 3.14 shows the synchronization costs with respect to the increasingnumber of threads. Apart from the fact that the synchronization costs ofthe DTG implementation at 16 threads is at least ten times less than theother implementations, there are two important observation to be madefrom this experiment. Firstly the synchronization cost grows greatlywith the number of threads for both the approaches that use barriersynchronizations. This is due to two reasons: (1) there are more and morethreads waiting on a given barrier and (2) the barriers become more costlyas the number of threads increase. Secondly load balancing problems mayincrease the synchronization costs by several folds, as in the case of thePluto implementation. Figure 3.15 shows the synchronization overhead
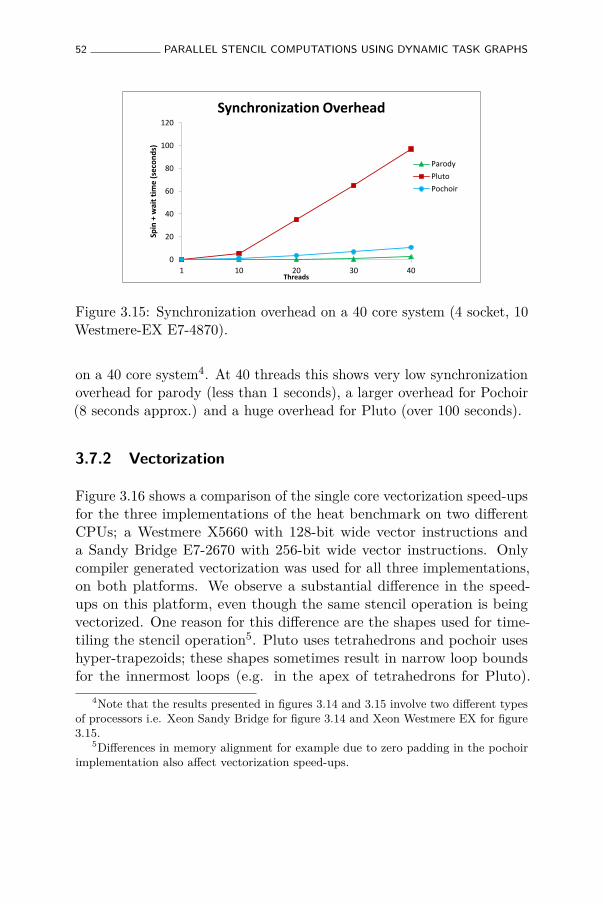
52 PARALLEL STENCIL COMPUTATIONS USING DYNAMIC TASK GRAPHS
0
20
40
60
80
100
120
1 10 20 30 40
Spin
+ w
ait
tim
e (
seco
nd
s)
Threads
Synchronization Overhead
Parody
Pluto
Pochoir
Figure 3.15: Synchronization overhead on a 40 core system (4 socket, 10Westmere-EX E7-4870).
on a 40 core system4. At 40 threads this shows very low synchronizationoverhead for parody (less than 1 seconds), a larger overhead for Pochoir(8 seconds approx.) and a huge overhead for Pluto (over 100 seconds).
3.7.2 Vectorization
Figure 3.16 shows a comparison of the single core vectorization speed-upsfor the three implementations of the heat benchmark on two differentCPUs; a Westmere X5660 with 128-bit wide vector instructions anda Sandy Bridge E7-2670 with 256-bit wide vector instructions. Onlycompiler generated vectorization was used for all three implementations,on both platforms. We observe a substantial difference in the speed-ups on this platform, even though the same stencil operation is beingvectorized. One reason for this difference are the shapes used for time-tiling the stencil operation5. Pluto uses tetrahedrons and pochoir useshyper-trapezoids; these shapes sometimes result in narrow loop boundsfor the innermost loops (e.g. in the apex of tetrahedrons for Pluto).
4Note that the results presented in figures 3.14 and 3.15 involve two different typesof processors i.e. Xeon Sandy Bridge for figure 3.14 and Xeon Westmere EX for figure3.15.
5Differences in memory alignment for example due to zero padding in the pochoirimplementation also affect vectorization speed-ups.
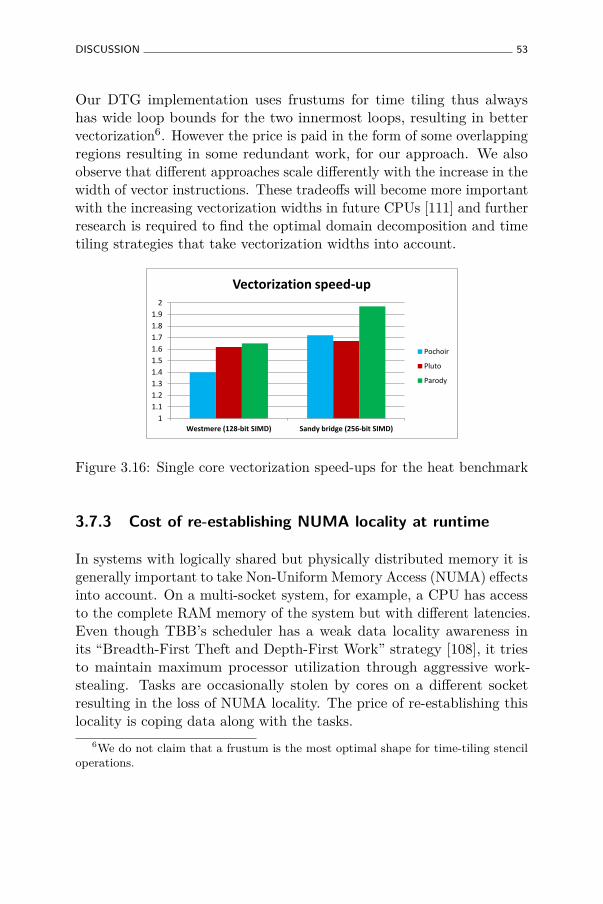
DISCUSSION 53
Our DTG implementation uses frustums for time tiling thus alwayshas wide loop bounds for the two innermost loops, resulting in bettervectorization6. However the price is paid in the form of some overlappingregions resulting in some redundant work, for our approach. We alsoobserve that different approaches scale differently with the increase in thewidth of vector instructions. These tradeoffs will become more importantwith the increasing vectorization widths in future CPUs [111] and furtherresearch is required to find the optimal domain decomposition and timetiling strategies that take vectorization widths into account.
1
1.1
1.2
1.3
1.4
1.5
1.6
1.7
1.8
1.9
2
Westmere (128-bit SIMD) Sandy bridge (256-bit SIMD)
Vectorization speed-up
Pochoir
Pluto
Parody
Figure 3.16: Single core vectorization speed-ups for the heat benchmark
3.7.3 Cost of re-establishing NUMA locality at runtime
In systems with logically shared but physically distributed memory it isgenerally important to take Non-Uniform Memory Access (NUMA) effectsinto account. On a multi-socket system, for example, a CPU has accessto the complete RAM memory of the system but with different latencies.Even though TBB’s scheduler has a weak data locality awareness inits “Breadth-First Theft and Depth-First Work” strategy [108], it triesto maintain maximum processor utilization through aggressive work-stealing. Tasks are occasionally stolen by cores on a different socketresulting in the loss of NUMA locality. The price of re-establishing thislocality is coping data along with the tasks.
6We do not claim that a frustum is the most optimal shape for time-tiling stenciloperations.
54 PARALLEL STENCIL COMPUTATIONS USING DYNAMIC TASK GRAPHS
In order to evaluate the feasibility of aggressively maintaining NUMAlocality at run time, through the life span of the application7, weimplemented a NUMA aware version of the heat benchmark using thelibnuma API. Every task communicates its NUMA domain to its directsuccessor8. When a successor finds its own NUMA domain different fromits predecessor it copies the data to its local memory, thus re-establishingNUMA locality.
For a domain size of 8192× 8192 the overhead of NUMA awareness is2.5% of the execution time. However, it did not yield any performancebenefit for this benchmark, because of two reasons: (1) the algorithm isnot bandwidth constrained due to time-tiling, (2) compiler based pre-fetching hides the latency of accessing the remote memory. Nonethelesswe expect this tradeoff to be significantly different for higher order stenciloperations, where memory bandwidth saturation problems are moresevere. Further investigations are required to evaluate the feasibility ofsuch aggressive runtime NUMA optimizations for higher order stenciloperations.
3.8 Related work
Stencil operations are a very frequently recurring design pattern, hencethey are very extensively studied as well. With the recent advent of multi-core processors many stencil compilers and auto-tuning frameworks havespurred. Most of these stencil compilers and auto-tuning frameworksfocus on increasing the arithmetic intensity of the kernel, hence reducingcache misses in order to bypass the memory bandwidth saturation andreduce synchronization. These tools usually require the stencil operationto be expressed in domain specific language (DSL) and generate theoptimized implementation in C, FORTRAN or CUDA etc.
The Pochoir stencil compiler [126] cuts the domain into space-time hyper-trapezoids using the concepts formalized by Frigo and Strumpen in [53].These zoids are then classified into groups, such that all zoids in one
7Note that initial NUMA-aware allocation is used in all cases.8A direct successor is a task that works on the same region but for subsequent
timesteps.
RELATED WORK 55
group may be solved in parallel, i.e. precedence constraints are onlybetween the groups and not within a group. The shapes of these zoidsallow calculation of multiple timesteps without synchronization becauseall the data required to calculate the next timesteps is either withinthe zoid or in a predecessor zoid. Hence, this domain decompositionimproves data locality and reduces synchronization overhead. Similarly[15] presents a stencil version of the Pluto compiler [19], that uses“diamond” (tetrahedron) shaped time-tiles for the domain decompositionof stencil operations. However, in contrast to our approach both thesestencil compilers use a “parallel for” loops to realize the parallelization,thus placing an implicit synchronization barrier between subsequenttime steps. Other approaches that time-tile across several timestepsinclude [38, 44, 63, 137]. In this chapter, we took Pochoir and Pluto as arepresentative of the state-of-the-art for comparison with our approach.We showed how both were outperformed because the synchronizationcosts become ever more expensive. In other words: the synchronizationcosts we eliminate were holding back the algorithmic improvementsadvocated by these papers.
In auto-tuning frameworks such as Patus, the user may also provide aparametrized parallelization strategy and an XML description of theplatform, along with the specification of the stencil expressed using adomain specific language. Some basic strategies (e.g. basic outer loopparallelization and cache blocking), along with XML descriptions of somecommon platforms (e.g. Intel x86_64 and NVIDIA Tesla) are alreadyavailable in the framework. The framework then generates (OpenMP [42]based) parallel code for the kernel and an auto-tuning script for exploringthe parameters for the strategy. This script executes the kernel repeatedlywith different parameters to find the best configuration. Unlike ourapproach that uses point-to-point synchronization Patus uses explicitOpenMP barriers between timesteps. Other frameworks in similar spiritinclude [74] and [131]. Our experiments clearly showed that this becomesvery costly as the number of threads increases.
Phasers [113] are point-to-point synchronization mechanisms for sharedmemory platforms. A thread/task can register on a set of Phasers andsynchronize with other threads/tasks using signal-wait mechanisms. Inthe Phasers approach tasks/threads in the wait stage are blocked until
56 PARALLEL STENCIL COMPUTATIONS USING DYNAMIC TASK GRAPHS
they receive signals from all their registered Phasers, whereas in ourapproach approach task assignment to worker threads is delayed forsynchronization, therefore, the CPUs are free to execute other tasks thatare ready for execution. A stencil implementation that uses Phasers forsynchronization instead of barriers is presented in [112]. Unfortunatelythe stencil algorithm used in their approach does not apply time-tiling,therefore, a fair head-to-head comparison with our approach is notpossible. A technique using a combination of low level locks and barriersis proposed in [118], however, unlike our approach or Phasers this is nota complete point-to-point synchronization; i.e. group synchronizationmechanism are still used.
A static task-graph implementation of a stencil operation is presented in[105]. Schedules are compiled off-line before the application starts. Atruntime the tasks are executed in predefined time-slots on the differentprocessors. When task graphs are scheduled statically no synchronizationis required at runtime. However, this approach is not able to cope withdynamism whether it is from the platform itself i.e. in the from of dynamicvoltage and frequency scaling or from other applications/processes sharingthe system.
Nabbit [4] is a library for expressing dynamic task graphs which canbe executed using Cilk. The nabbit interface does not allow garbagecollection of nodes at runtime. Therefore it is not possible to directly useit for stencil operations with large number of timesteps, as the systemruns out of memory quickly.
3.9 Conclusion
This chapter proposes to implement stencil computations as dynamic taskgraphs in order to minimize synchronization overhead. The approach wepropose avoids global barriers, synchronization is only point-to-point andbecause tasks are only created when they are ready to be executed thereis minimal spin-waiting i.e. non-blocking synchronization. We use afrustum shaped time tiling for improving data locality and thus reducingcache misses.
CONCLUSION 57
Our results show that approach scales better compared to two state-of-the-art stencil compilers Pochoir [126] and Pluto [15] for the twobenchmarks used in our experiments: (1) Conway’s game of life and (2)2D heat simulation. Detailed profiling shows that the synchronizationoverhead in our approach is at least 5 times less than Pochoir and 50times less than Pluto. Analyzing vectorization speed-ups shows thatour frustum shaped time tiling vectorized better than the two stencilcompilers and that this difference becomes more significant with theincreasing number of SIMD lines.
The next chapter studies improvements in the mapping and schedulingof embedded applications on MPSoCs.

Chapter 4
Mapping applications toMPSoCs
The previous chapter used dataflow models to optimize a kernel in thedomain of high performance computing. Another big driver for parallelprogramming is embedded software. Synchronous dataflow graphs [85]and it variants (see the taxonomy in figure 2.2.2) are often used torepresent embedded streaming applications. This chapter explores Paretooptimal mapping of such applications in the context of quasi-staticscheduling (see section 2.2.3). Two application use cases are used forevaluation; an image processing application and an H.264 video decoder.
4.1 Introduction
Nomadic devices such as smartphones and tablets have becomeomnipresent. We want to surf the web, watch videos and play games onthese devices anytime anywhere. In order to give the users a seamlessexperience these devices have to process large amounts of data in stricttiming deadlines, which drains a lot of power. Therefore, battery time(time between successive chargings) remains a big concern.
Modern nomadic devices are often based on heterogeneous MPSoCplatforms, with complex memory hierarchies and interconnects. Figure
59
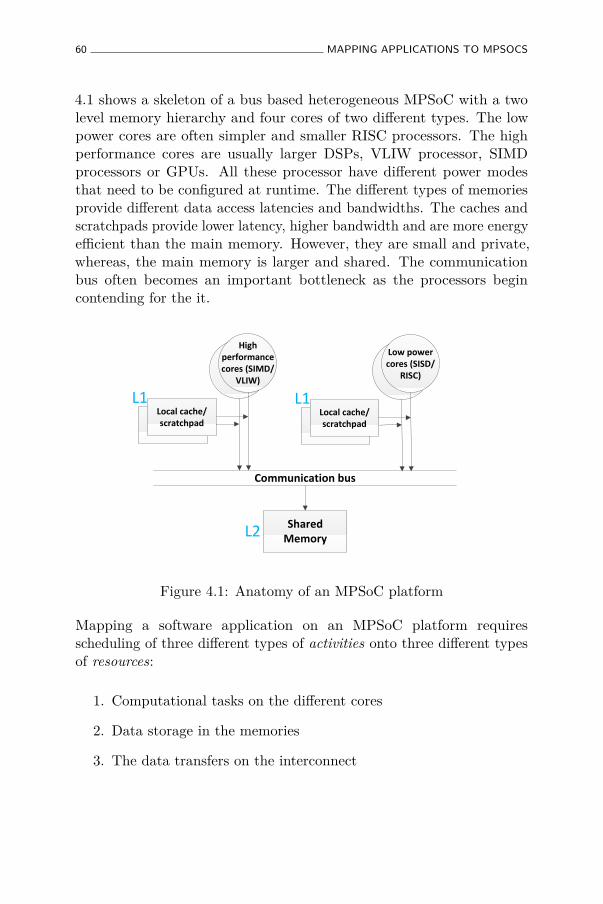
60 MAPPING APPLICATIONS TO MPSOCS
4.1 shows a skeleton of a bus based heterogeneous MPSoC with a twolevel memory hierarchy and four cores of two different types. The lowpower cores are often simpler and smaller RISC processors. The highperformance cores are usually larger DSPs, VLIW processor, SIMDprocessors or GPUs. All these processor have different power modesthat need to be configured at runtime. The different types of memoriesprovide different data access latencies and bandwidths. The caches andscratchpads provide lower latency, higher bandwidth and are more energyefficient than the main memory. However, they are small and private,whereas, the main memory is larger and shared. The communicationbus often becomes an important bottleneck as the processors begincontending for the it.
Shared Memory
Communication bus
TI
L1
High performance cores (SIMD/
VLIW)
Local cache/scratchpad
L1
L2
TI
L1
Low power cores (SISD/
RISC)
Local cache/scratchpad
L1
Figure 4.1: Anatomy of an MPSoC platform
Mapping a software application on an MPSoC platform requiresscheduling of three different types of activities onto three different typesof resources:
1. Computational tasks on the different cores
2. Data storage in the memories
3. The data transfers on the interconnect
INTRODUCTION 61
The increasing complexity of the hardware platforms makes it verydifficult for the software developers to do this mapping manually.Embedded applications have also become very dynamic, making itimpossible for compilers to statically make all the scheduling and resourcemanagement decisions, at design time. Embedded and real-time operatingsystems cannot manage this orchestration in a fine grained manner atruntime because of the prohibitive overhead of computing these resourcemanagement and scheduling decisions.
To reduce this overhead researchers have studied two-phased mappingtechniques [61, 117, 120] for configuring the hardware and schedulingthe software. Two-phase mapping techniques split the mapping intodesign-time and runtime phases. At design-time, Pareto-optimal mappingsolutions 1 are computed off-line for several possible runtime scenarios [61].At runtime, these precomputed schedules are dynamically activateddepending on the runtime situations. These approaches have shown to becapable of handling different types of dynamism with low overhead [61,117, 120]. This chapter focuses on the memory and communication-awaredesign-time phase of mapping applications to MPSoCs.
The problem of design-exploration of mapping solutions can be split intotwo parts: (1) Spatial assignment and (2) temporal scheduling. Spatialassignment decides where an activity takes place without specifyingwhen. For example, only deciding which processor a task executes onor which memory a data object is stored in, without specifying a time-slot. Temporal scheduling allocates time-slots for these activities on thespecified resources.
In this chapter we present a novel approach to the formulation of thememory and communication-aware mapping problem that allows anexploration of spatio-temporal schedules for computation, data storageand communication, in a tightly coupled fashion. Two aspects of thiscoupling are explored:
1A set of solutions such that every solution is better than all other solutions w.r.tat least one criterion
62 MAPPING APPLICATIONS TO MPSOCS
1. Horizontal coupling: is the coupling between different domains (i.e.memory, communication and processing)
2. Vertical coupling: is the coupling within the same domain (e.g.scratchpad allocation aware buffer dimensioning or task allocationaware selection of CPU power modes)
The next section describes these horizontal and vertical coupling aspectsof the mapping problem in detail.
Several memory and communication-aware design-time mapping explo-ration techniques have been proposed [24, 50, 51, 64, 89]. The techniquespresented in [64, 89] split the mapping problem into two sub-problems ofspatial assignment and temporal scheduling and solve them separately.This reduces the search space at the cost of the quality of the solution.The approach proposed in this chapter will instead focus on higherquality solutions (i.e. better energy efficiency or throughput of themapping solutions) without exorbitant computational complexity. Theapproach presented in [51] uses the ant colony optimization in a multi-stage implementation, but unlike our approach it only optimizes theexecution time of the application ignoring the energy consumption. Another approach [50], optimizes the energy consumption along with theexecution time of the application but defines the mapping only as aspatial assignment problem, without the temporal aspect of scheduling,which we take into account.
We validated our proposed technique by using it to find the energy-speed trade-offs for two benchmark applications: (1) a cavity detectorapplication [26] and (2) an H.264 decoder. The target MPSoC consistsof four Strong ARM 1100x processors and two TI-C64X+ processorsconnected via a shared bus (see figure 4.1). In our experiments, weobserved that tightly coupling mapping solutions are significantly betterwhen compared to decoupled exploration, for both benchmarks. ThePareto-optimal mapping solutions found by our exploration techniquecan be used by the runtime managers of the two-phased mappingtechniques [61, 117, 120].
The rest of the chapter is structured as follows. Section 4.2 describesthe horizontal and vertical coupling. Section 4.3 gives an overview
COUPLING EFFECTS IN MAPPING EXPLORATION 63
of the design-time co-exploration methodology. Section 4.4 explainsthe application and platform models used as inputs by our explorationtool. Section 4.5 explains the design exploration in detail. Section 4.6presents the results. Section 4.7 gives an overview of the related workand section 4.8 presents the conclusions.
4.2 Coupling effects in mapping exploration
Previous section explained the complexity of developing efficient softwarefor nomadic devices and their heterogeneous compute infrastructure. Thiscomplexity is due to the fact that when mapping software on hardwareboth memory and communication aspects need to be taken into account.Therefore we introduced the notions of horizontal and vertical coupling.
4.2.1 Horizontal coupling: Memory-aware task scheduling onprocessing elements
On platforms with multi-level memory hierarchies (e.g., L1 and L2 cachesor scratchpads), the execution time of a computational task depends notonly on the processor it is mapped onto and the corresponding powermode of the processor but also on the location of data in the memoryhierarchy (e.g. in L1 or main memories). When mapping software tasksonto hardware in an energy efficient way, both the timing deadlines ofthe application as well as the resource constraints of the hardware haveto be respected. If the mapping is split into different sub-problems andsolved independently, it leads to sub-optimal solutions. To illustrate theproblem, suppose that task mapping is done before memory exploration.This means that a decision has to be made what software task runson what hardware processing element (spatial assignment). Since thelocation of data is not known yet but tasks need to meet their timingdeadlines, the task-mapping exploration has to take one of two extremeassumptions:
64 MAPPING APPLICATIONS TO MPSOCS
1. All data read/writes are from/to the (slowest) main memory.
2. All input data is first brought into the (fastest) L1 memory beforestarting the computation and all output data is first produced inthe L1 memory before being written off to the main memory.
The first assumption is too conservative and would unnecessarily forcethe tasks to run on faster and energy hungry processors or a higher powermode in order to guarantee meeting the deadlines, whereas the deadlinecould also be met if the data was put in the faster L1 memory while stillrunning the task on the slower (energy efficient) processor or a lowerpower mode.
The second assumption is also undesirable because it creates unnecessarytraffic due to copy operations between different memories. Even the datathat is used only once is first copied to the L1 memory before being used.In order to efficiently utilize the small L1 memories, data objects thatare not alive simultaneously may need to use the same memory space.
Both assumptions illustrate the fundamental problem that doing taskallocation before data allocation leads to sub-optimal solutions. Whereas,the alternative solution of first exploring the mapping of data to memorybefore considering task mapping leads to similar problems.
4.2.2 Vertical coupling: Scratchpad aware dimensioning ofbuffer sizes
In [14], the authors show that scratchpad memories (SPM) consumeon average 40% less energy and 46% less area-time2 when comparedto caches of the same capacity. Moreover, they provide much bettertiming predictability than caches. Therefore, SPMs are included in manyembedded platforms such as ARM 10E, IBM Cell BE, GeForce GTXand Texas Instruments TMS370CX7X. Unlike caches that are managedby hardware and that select their contents on the principle of spatio-temporal locality, in SPM based systems the software is responsible for
2The product of chip area occupied by a memory and the memory access latency,used as a metric to evaluate memory designs
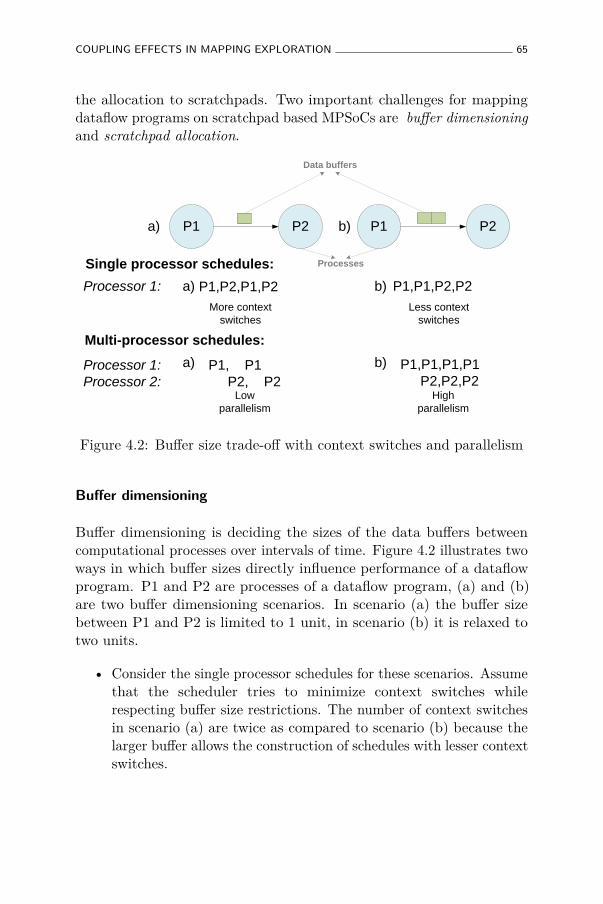
COUPLING EFFECTS IN MAPPING EXPLORATION 65
the allocation to scratchpads. Two important challenges for mappingdataflow programs on scratchpad based MPSoCs are buffer dimensioningand scratchpad allocation.
P1 P2 P1 P2a) b)
P1,P2,P1,P2 P1,P1,P2,P2 Processor 1:
P1, P1P2, P2
P1,P1,P1,P1P2,P2,P2
Processor 1: Processor 2:
More context switches
Less context switches
Low parallelism
High parallelism
Single processor schedules:
Multi-processor schedules:
a)
a)
b)
b)
Data buffers
Processes
Figure 4.2: Buffer size trade-off with context switches and parallelism
Buffer dimensioning
Buffer dimensioning is deciding the sizes of the data buffers betweencomputational processes over intervals of time. Figure 4.2 illustrates twoways in which buffer sizes directly influence performance of a dataflowprogram. P1 and P2 are processes of a dataflow program, (a) and (b)are two buffer dimensioning scenarios. In scenario (a) the buffer sizebetween P1 and P2 is limited to 1 unit, in scenario (b) it is relaxed totwo units.
• Consider the single processor schedules for these scenarios. Assumethat the scheduler tries to minimize context switches whilerespecting buffer size restrictions. The number of context switchesin scenario (a) are twice as compared to scenario (b) because thelarger buffer allows the construction of schedules with lesser contextswitches.
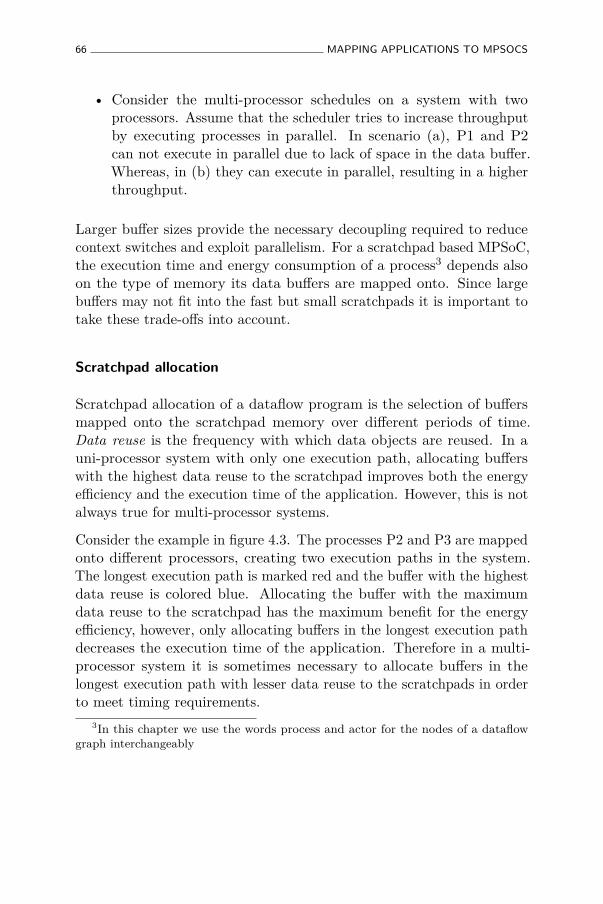
66 MAPPING APPLICATIONS TO MPSOCS
• Consider the multi-processor schedules on a system with twoprocessors. Assume that the scheduler tries to increase throughputby executing processes in parallel. In scenario (a), P1 and P2can not execute in parallel due to lack of space in the data buffer.Whereas, in (b) they can execute in parallel, resulting in a higherthroughput.
Larger buffer sizes provide the necessary decoupling required to reducecontext switches and exploit parallelism. For a scratchpad based MPSoC,the execution time and energy consumption of a process3 depends alsoon the type of memory its data buffers are mapped onto. Since largebuffers may not fit into the fast but small scratchpads it is important totake these trade-offs into account.
Scratchpad allocation
Scratchpad allocation of a dataflow program is the selection of buffersmapped onto the scratchpad memory over different periods of time.Data reuse is the frequency with which data objects are reused. In auni-processor system with only one execution path, allocating bufferswith the highest data reuse to the scratchpad improves both the energyefficiency and the execution time of the application. However, this is notalways true for multi-processor systems.
Consider the example in figure 4.3. The processes P2 and P3 are mappedonto different processors, creating two execution paths in the system.The longest execution path is marked red and the buffer with the highestdata reuse is colored blue. Allocating the buffer with the maximumdata reuse to the scratchpad has the maximum benefit for the energyefficiency, however, only allocating buffers in the longest execution pathdecreases the execution time of the application. Therefore in a multi-processor system it is sometimes necessary to allocate buffers in thelongest execution path with lesser data reuse to the scratchpads in orderto meet timing requirements.
3In this chapter we use the words process and actor for the nodes of a dataflowgraph interchangeably
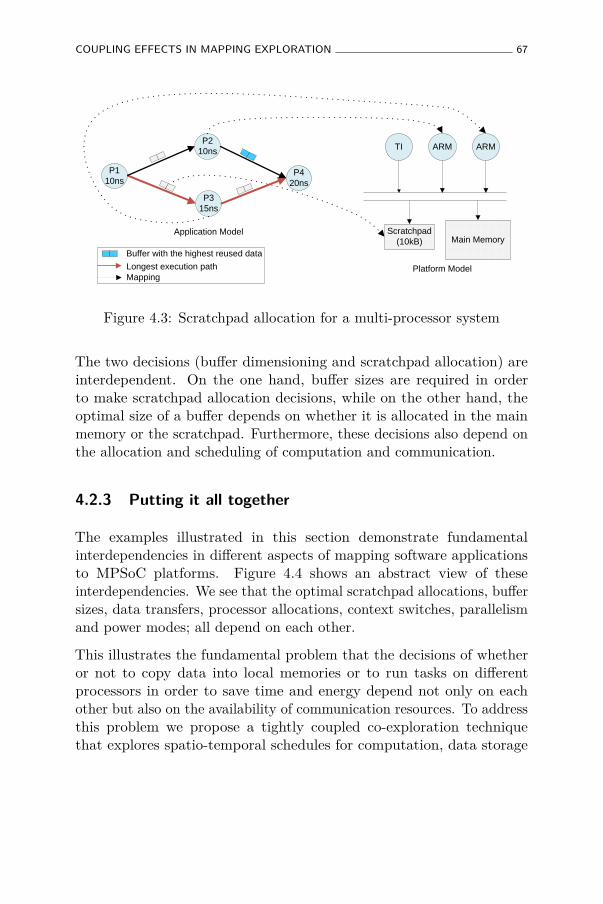
COUPLING EFFECTS IN MAPPING EXPLORATION 67
TI
Scratchpad(10kB)
ARM
Platform Model
Application ModelMain Memory
ARMP2
10ns
P3 15ns
P4 20ns
P1 10ns
Buffer with the highest reused data
Longest execution pathMapping
Figure 4.3: Scratchpad allocation for a multi-processor system
The two decisions (buffer dimensioning and scratchpad allocation) areinterdependent. On the one hand, buffer sizes are required in orderto make scratchpad allocation decisions, while on the other hand, theoptimal size of a buffer depends on whether it is allocated in the mainmemory or the scratchpad. Furthermore, these decisions also depend onthe allocation and scheduling of computation and communication.
4.2.3 Putting it all together
The examples illustrated in this section demonstrate fundamentalinterdependencies in different aspects of mapping software applicationsto MPSoC platforms. Figure 4.4 shows an abstract view of theseinterdependencies. We see that the optimal scratchpad allocations, buffersizes, data transfers, processor allocations, context switches, parallelismand power modes; all depend on each other.
This illustrates the fundamental problem that the decisions of whetheror not to copy data into local memories or to run tasks on differentprocessors in order to save time and energy depend not only on eachother but also on the availability of communication resources. To addressthis problem we propose a tightly coupled co-exploration techniquethat explores spatio-temporal schedules for computation, data storage
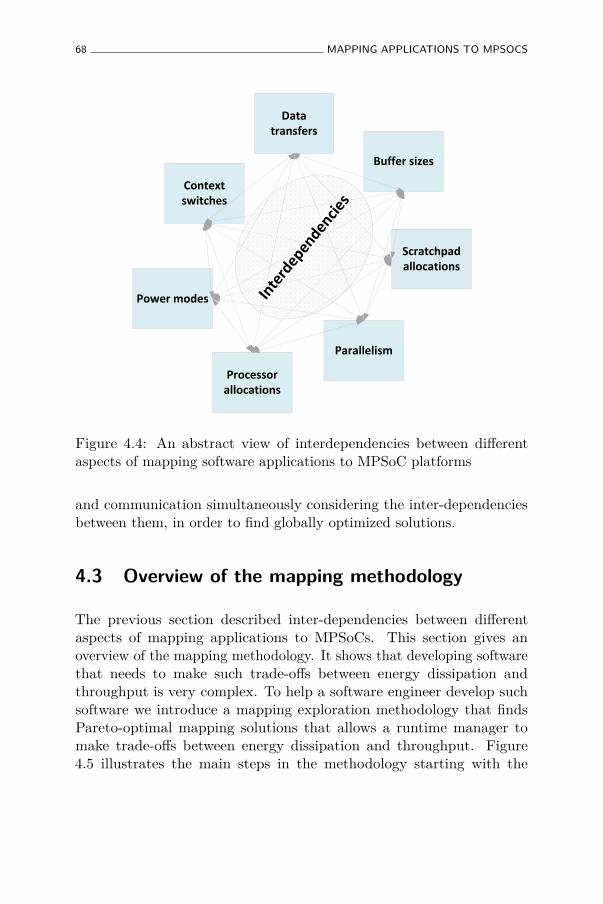
68 MAPPING APPLICATIONS TO MPSOCS
Context switches
Buffer sizes
Power modes
Scratchpad allocations
Processor allocations
Parallelism
Data transfers
Figure 4.4: An abstract view of interdependencies between differentaspects of mapping software applications to MPSoC platforms
and communication simultaneously considering the inter-dependenciesbetween them, in order to find globally optimized solutions.
4.3 Overview of the mapping methodology
The previous section described inter-dependencies between differentaspects of mapping applications to MPSoCs. This section gives anoverview of the mapping methodology. It shows that developing softwarethat needs to make such trade-offs between energy dissipation andthroughput is very complex. To help a software engineer develop suchsoftware we introduce a mapping exploration methodology that findsPareto-optimal mapping solutions that allows a runtime manager tomake trade-offs between energy dissipation and throughput. Figure4.5 illustrates the main steps in the methodology starting with the
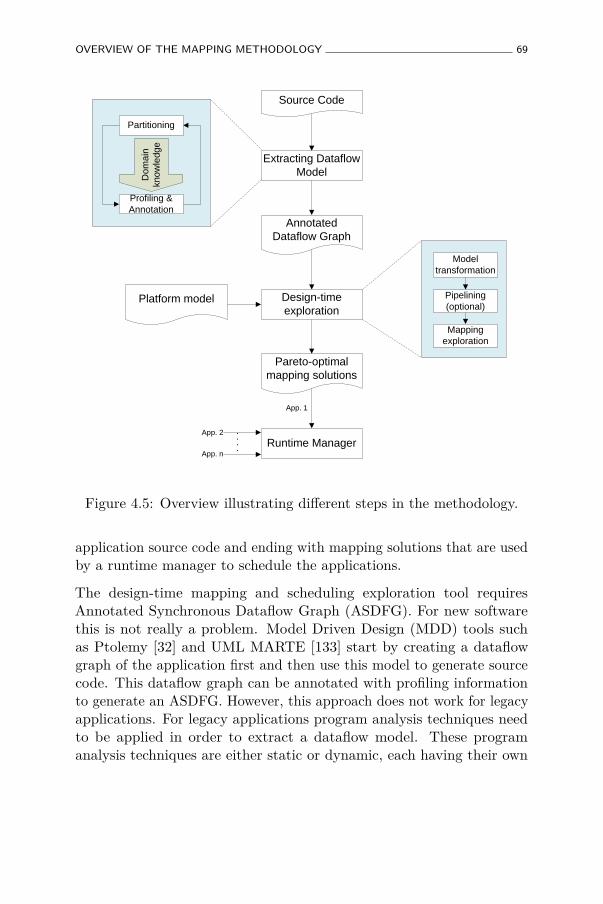
OVERVIEW OF THE MAPPING METHODOLOGY 69
App. 1
Source Code
Extracting Dataflow Model
Design-time exploration
Runtime ManagerApp. 2
App. n
Partitioning
Profiling & Annotation
Dom
ain
kno
wle
dge
Annotated Dataflow Graph
Pareto-optimal mapping solutions
Model transformation
Pipelining (optional)
Mapping exploration
Platform model
Figure 4.5: Overview illustrating different steps in the methodology.
application source code and ending with mapping solutions that are usedby a runtime manager to schedule the applications.
The design-time mapping and scheduling exploration tool requiresAnnotated Synchronous Dataflow Graph (ASDFG). For new softwarethis is not really a problem. Model Driven Design (MDD) tools suchas Ptolemy [32] and UML MARTE [133] start by creating a dataflowgraph of the application first and then use this model to generate sourcecode. This dataflow graph can be annotated with profiling informationto generate an ASDFG. However, this approach does not work for legacyapplications. For legacy applications program analysis techniques needto be applied in order to extract a dataflow model. These programanalysis techniques are either static or dynamic, each having their own
70 MAPPING APPLICATIONS TO MPSOCS
advantages and disadvantages.
• Static program analysis techniques for extracting dataflow graphsemploy source code analysis tools such as, PN [132] and Pluto [19].These tools are usually based on polyhedral models, that provideabstraction to reason about transformations on loop nests bymodeling iterations of different statements and the dependenciesbetween them in the form of polyhedrons. However, the downsideof these approaches is that they do not support non-affine accessesor pointer arithmetic. Hence, major parts of the application oftenneed to be re-written before the tools may be applied. Other toolsthat facilitate this re-writing effort have also been developed, e.g.CleanC [93] that point out the parts of the code that have to bechanged, without doing the actual rewriting.
• Dynamic program analysis techniques for extracting dataflowgraphs employ communication profiling tools such as, Pin-Comm [67]. These tools measure data communication betweendifferent parts of the application. An initial partitioning of theapplication is taken as a starting point for this technique. Thisinitial partitioning is then iteratively refined through cycles ofprofiling and re-partitioning. The major drawback of this approachis the strong requirement of domain knowledge in order to guidethe partitioning and re-partitioning.
Using the ASDFG the design time exploration tool explores the schedulesof tasks over multiple processors, data buffers in different types ofmemories and data transfers over the communication bus. The next stepis model transformation. In order to simplify the scheduling, we limitthe concurrency of the ASDFG by unfolding it into a Directed AcyclicTask graph (DAG), as shown in figure 4.6. This DAG is then used forexploring the required schedules taking into account the horizontal andvertical dependencies.
The scheduling exploration is realized with IBM ILOG [78] wherethe mapping is modeled as a constraint based scheduling problem inOptimization Programming Language (OPL). The execution semanticsof the DAG, along with the platform resources (processing, memory) are
PLATFORM AND APPLICATION MODELS 71
modeled as constraints. The solver is then asked to find a minimumenergy schedule for a given deadline. A set of schedules that give a trade-off between energy and execution time is found by repeating the procedurefor the different deadlines. The run-time manager [143] uses these setsof Pareto-optimal schedules for scheduling the application at run-time.The run-time manager takes the states of all the applications deployedon the platform into account while selecting a particular configuration.
4.4 Platform and Application Models
This section describes the models for the application and the platformthat are used as an input for the design-time exploration tool.
4.4.1 Platform Model
Most of the information about the platform required is extracted throughdetailed profiling of the application on the platform. A platformis described as a tuple (Processors, Memories), where Processorsand Memories represent the sets of processors and memories in theplatform. A processor is defined as a tuple (ProcessorID, CtxSwthTime,CtxSwthEnergy), where ProcessorID is a unique number for everyprocessor, CtxSwthTime and CtxSwthEnergy are the time and energyconsumed during a context switch. A context switch includes the loadingand the initialization of the actor code before it can start processingdata. A memory is defined as a tuple (MemID, Size), where MemID is aunique identifier for every memory and Size is the size of the memory.The energy values and execution time of the context switch include thosespent in the memories and interconnect along with those of the processor.
4.4.2 Annotated Synchronous Dataflow Graph
In the rest of this chapter we use Annotated Synchronous DataflowGraph (ASDFG) as an abstraction for the application. An AnnotatedSynchronous Dataflow Graph (ASDFG) is a Synchronous Dataflow Graph
72 MAPPING APPLICATIONS TO MPSOCS
annotated with profiling information. The ASDFG is described as atuple (A,C), where A is the set of Actors and C is the set of Channels.
Actors
An Actor is assumed to be a deterministic piece of code. In each executioninstance it consumes a fixed amount of data from each of its input channelsand produces a fixed amount of data on its outputs. The execution timeand energy consumption of the actor depends only on the type of processorit is executed on and the memories where its input/output is mappedonto. In case when these properties also depend on the input data, worstcase assumptions are taken. The actors themselves are stateless. Anyrequired state is explicitly represented as a self loop channel. Actors aredescribed as a tuple (ActorID, Ports, Modes), where ActorID is a uniquenumber for every actor. Ports is the set of all input and output ports ofthe actor. Modes is the set of all possible execution configurations for theactor, i.e. one configuration for each possible combination of processorsand memories.
Modes
A mode is a configuration in which an actor can execute. Considerthe application and the platform shown in figure 4.3; the actor P2can be executed on either of the two processors. It has two portseach of which can be mapped to read/write the data either from/tothe main memory or the scratchpad. Therefore, the actor P2 has eightmodes. A mode describes the execution configuration as a tuple (ModeID,ProcessorID, PortMemIDs, ExecTime, Energy), where ModeID is aunique number for every mode. ProcessorID identifies the processor usedin this configuration. PortMemIDs is the set of MemID that identifiesthe memories used for each port, i.e. one MemID for each port. ExecTimeand Energy are the execution time and energy consumed if the actor isexecuted in the given mode. These energy and execution time values areobtained through profiling and include the time and energy spent in theprocessors, memories and the interconnect.
PLATFORM AND APPLICATION MODELS 73
Channels
A channel is defined as (ChID, Source, Sink, InRate, OutRate), whereChID is a unique identifier for each channel. Source and Sinks areActorIDs of the source and sink actors connected to the channel. InRateand OutRate are the amounts of data produced or consumed by thesource and sink actors respectively, each time they execute.
4.4.3 Model transformation to a task graph
A Synchronous Dataflow Graph is an auto-concurrent model ofcomputation where parallelism is implicit. In order to derive an optimalschedule on a multiprocessor, all possible combinations of the differentinstances of actors need to be considered which is often not possible.A common approach is to first construct a Directed Acyclic Graph(DAG) where parallelism is explicit [102]. Figure 4.6 illustrates the modeltransformation of a synthetic SDFG. In order to construct a DAG froman SDFG, a periodically admissible sequential schedule (PASS) needsto be computed first. To compute a PASS balance equations for eachchannel are formulated and an integral vector is found that solves thesystem of equations. The PASS is then unfolded by an ‘unroll factor’and dependencies are added between all the different instances of theactors [72]. The ‘unroll factor’ depends on the target platform and canbe specified by the developer.
A DAG is defined as (T,E) where, T is a set of Tasks and E is a set ofEdges.
Tasks
Tasks are instances of SDFG actors. Therefore they have all of the sameproperties and modes as the SDFG actor they belong to. It should benoted that if the tasks belonging to the same actor are executed oneafter another on the same processor, there is no context switch becausethe same actor is fired multiple times. Tasks are defined as (TaskID,ActorID, Ports, Modes).
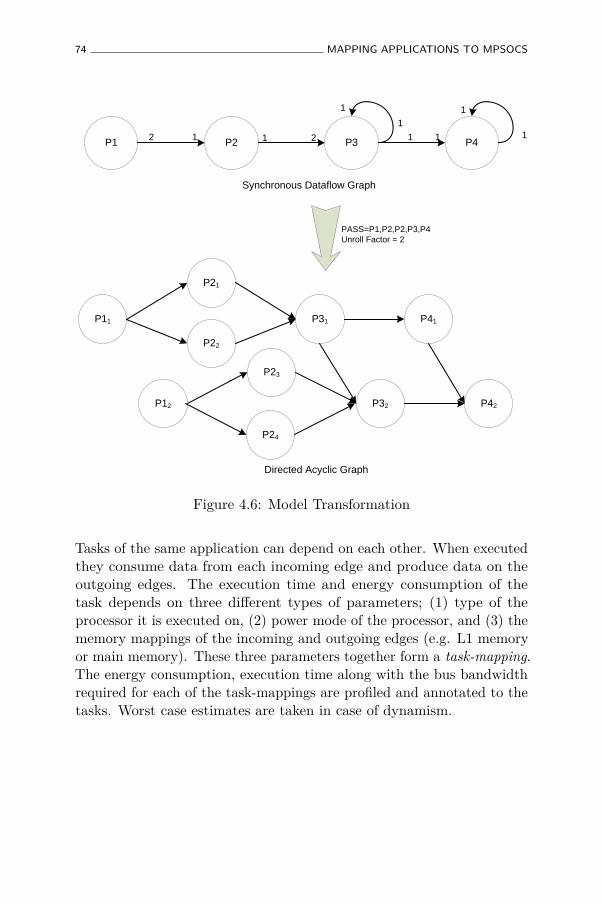
74 MAPPING APPLICATIONS TO MPSOCS
P11
P21
P31 P41
P12
P23
P32 P42
Directed Acyclic Graph
P13 P23 P33 P43
P22
P24
PASS=P1,P2,P2,P3,P4Unroll Factor = 2
P1 P2 P3 P4
Synchronous Dataflow Graph
2 1 1 2 1 1
1
11
1
Figure 4.6: Model Transformation
Tasks of the same application can depend on each other. When executedthey consume data from each incoming edge and produce data on theoutgoing edges. The execution time and energy consumption of thetask depends on three different types of parameters; (1) type of theprocessor it is executed on, (2) power mode of the processor, and (3) thememory mappings of the incoming and outgoing edges (e.g. L1 memoryor main memory). These three parameters together form a task-mapping.The energy consumption, execution time along with the bus bandwidthrequired for each of the task-mappings are profiled and annotated to thetasks. Worst case estimates are taken in case of dynamism.
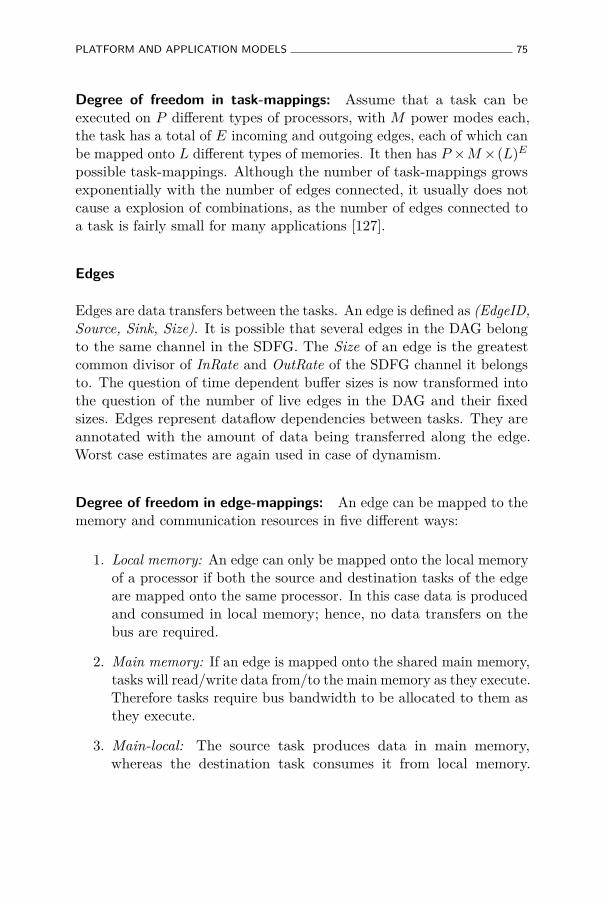
PLATFORM AND APPLICATION MODELS 75
Degree of freedom in task-mappings: Assume that a task can beexecuted on P different types of processors, with M power modes each,the task has a total of E incoming and outgoing edges, each of which canbe mapped onto L different types of memories. It then has P ×M× (L)E
possible task-mappings. Although the number of task-mappings growsexponentially with the number of edges connected, it usually does notcause a explosion of combinations, as the number of edges connected toa task is fairly small for many applications [127].
Edges
Edges are data transfers between the tasks. An edge is defined as (EdgeID,Source, Sink, Size). It is possible that several edges in the DAG belongto the same channel in the SDFG. The Size of an edge is the greatestcommon divisor of InRate and OutRate of the SDFG channel it belongsto. The question of time dependent buffer sizes is now transformed intothe question of the number of live edges in the DAG and their fixedsizes. Edges represent dataflow dependencies between tasks. They areannotated with the amount of data being transferred along the edge.Worst case estimates are again used in case of dynamism.
Degree of freedom in edge-mappings: An edge can be mapped to thememory and communication resources in five different ways:
1. Local memory: An edge can only be mapped onto the local memoryof a processor if both the source and destination tasks of the edgeare mapped onto the same processor. In this case data is producedand consumed in local memory; hence, no data transfers on thebus are required.
2. Main memory: If an edge is mapped onto the shared main memory,tasks will read/write data from/to the main memory as they execute.Therefore tasks require bus bandwidth to be allocated to them asthey execute.
3. Main-local: The source task produces data in main memory,whereas the destination task consumes it from local memory.
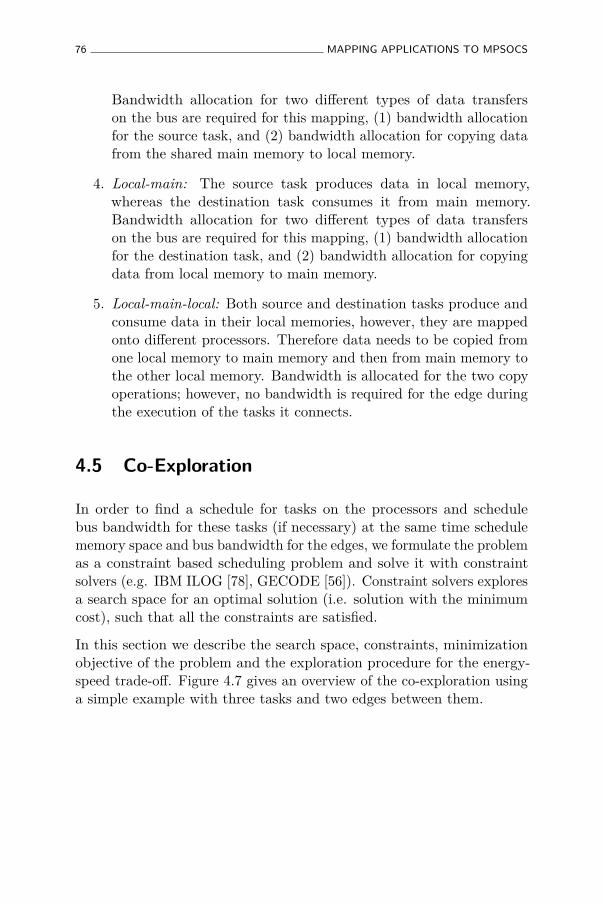
76 MAPPING APPLICATIONS TO MPSOCS
Bandwidth allocation for two different types of data transferson the bus are required for this mapping, (1) bandwidth allocationfor the source task, and (2) bandwidth allocation for copying datafrom the shared main memory to local memory.
4. Local-main: The source task produces data in local memory,whereas the destination task consumes it from main memory.Bandwidth allocation for two different types of data transferson the bus are required for this mapping, (1) bandwidth allocationfor the destination task, and (2) bandwidth allocation for copyingdata from local memory to main memory.
5. Local-main-local: Both source and destination tasks produce andconsume data in their local memories, however, they are mappedonto different processors. Therefore data needs to be copied fromone local memory to main memory and then from main memory tothe other local memory. Bandwidth is allocated for the two copyoperations; however, no bandwidth is required for the edge duringthe execution of the tasks it connects.
4.5 Co-Exploration
In order to find a schedule for tasks on the processors and schedulebus bandwidth for these tasks (if necessary) at the same time schedulememory space and bus bandwidth for the edges, we formulate the problemas a constraint based scheduling problem and solve it with constraintsolvers (e.g. IBM ILOG [78], GECODE [56]). Constraint solvers exploresa search space for an optimal solution (i.e. solution with the minimumcost), such that all the constraints are satisfied.
In this section we describe the search space, constraints, minimizationobjective of the problem and the exploration procedure for the energy-speed trade-off. Figure 4.7 gives an overview of the co-exploration usinga simple example with three tasks and two edges between them.
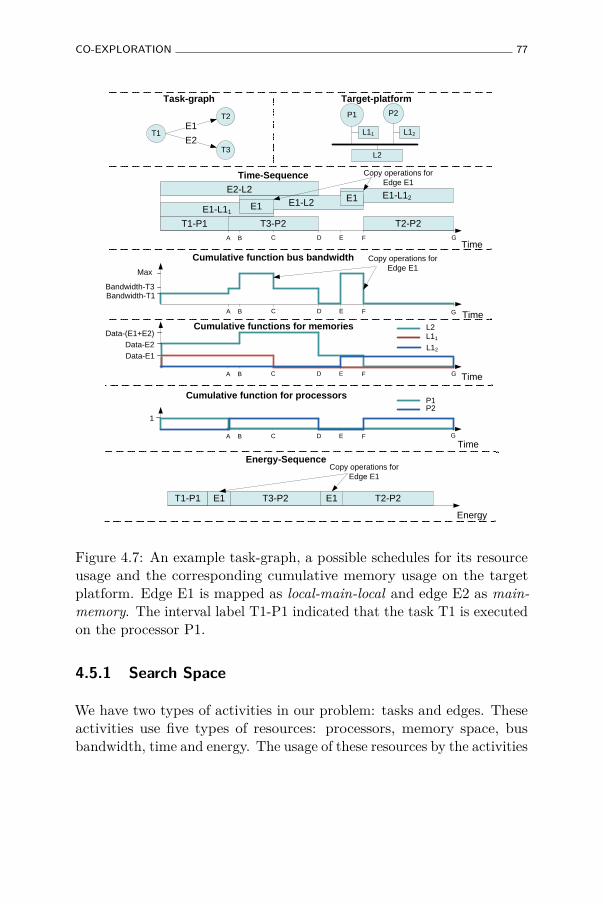
CO-EXPLORATION 77
A B C D E F G
T1-P1 T2-P2
Time
E1-L11
E1-L12
T1
T3
T2E1
E2
Task-graph
T3-P2
E1-L2E1
E2-L2
Time-Sequence
Cumulative functions for memoriesData-(E1+E2)
Data-E2
Data-E1
Time
A B C D E F G
Cumulative function bus bandwidth
Max
Copy operations for Edge E1
Time
Bandwidth-T1
E1
Bandwidth-T3
A B C D E F G
Energy-Sequence
T1-P1 T2-P2T3-P2E1 E1
Copy operations for Edge E1
Energy
Target-platform
P1 P2
L11
L2
L12
Copy operations for Edge E1
A B C D E F
1
Cumulative function for processors
G
Time
L2L11
L12
P1P2
Figure 4.7: An example task-graph, a possible schedules for its resourceusage and the corresponding cumulative memory usage on the targetplatform. Edge E1 is mapped as local-main-local and edge E2 as main-memory. The interval label T1-P1 indicated that the task T1 is executedon the processor P1.
4.5.1 Search Space
We have two types of activities in our problem: tasks and edges. Theseactivities use five types of resources: processors, memory space, busbandwidth, time and energy. The usage of these resources by the activities
78 MAPPING APPLICATIONS TO MPSOCS
form the schedules that define the solution.
The resources in our system are classified into two types; Renewable andNonrenewable. Renewable resources are resources that can be returnedto the system once a task is finished, such as processors and memories.The nonrenewable resources are permanently consumed, such as energyand time. Activities are modeled with the variables of type Intervals,whereas the usage of nonrenewable resources as Sequences of Intervals andrenewable resources are represented as Cumulative functions of intervalsover time.
Intervals
We use interval variables to model the consumption of non-renewableresources (energy and time) for a possible mapping of an activity. AnInterval variable a has a start s(a) and an end e(a) when it is present;these variables can also be declared as ‘optional’ in which case they canalso be absent ⊥ i.e. they don’t have a start or end. The domain of a isdom(a):
dom(a) = {⊥} ∪ {[s(a), e(a))|s(a), e(a) ∈ Z, s(a) ≤ e(a)}
The size of interval a is IntervalSize(a):
IntervalSize(a) = e(a)− s(a)
.
Table 4.1 lists selected interval variables used in the model. Tasks arerepresented by two intervals, a time-interval and an energy-interval. Thesize of the time-interval equals the execution time of the task, includingthe time spent in memory accesses, for a particular possible mapping ofthe task. Similarly the size of the energy-interval represents the totalenergy consumed by the task. these are not optional intervals. Thereforeeach task must be allocated at least one time slot. The size of thisinterval is not fixed and depends on the selected mode. A task moderepresents a particular mapping of a task i.e. the processor it is executedupon and memories it reads/writes its data. Every task mode has twointerval variables associated with it, these are optional intervals and areabsent if the mode is not selected.
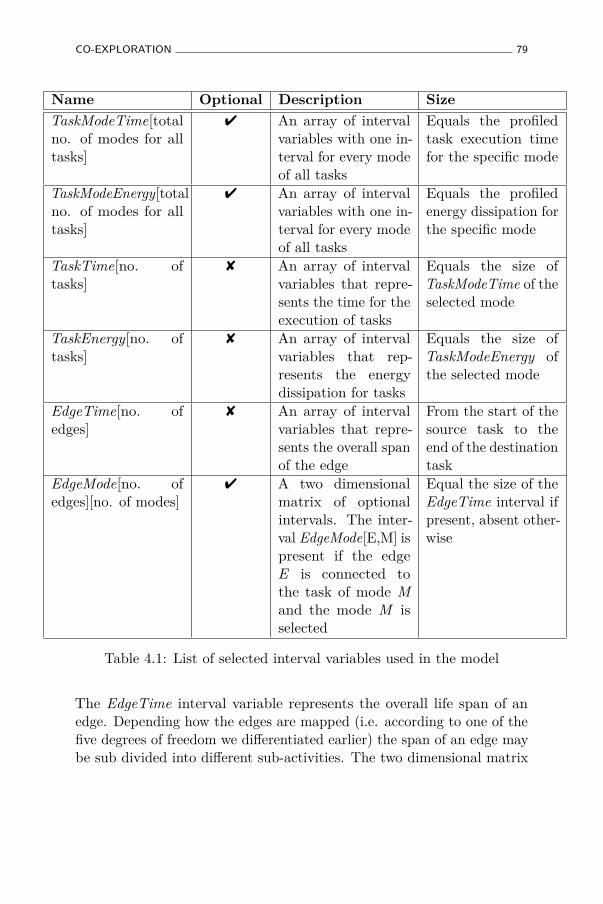
CO-EXPLORATION 79
Name Optional Description SizeTaskModeTime[totalno. of modes for alltasks]
4 An array of intervalvariables with one in-terval for every modeof all tasks
Equals the profiledtask execution timefor the specific mode
TaskModeEnergy[totalno. of modes for alltasks]
4 An array of intervalvariables with one in-terval for every modeof all tasks
Equals the profiledenergy dissipation forthe specific mode
TaskTime[no. oftasks]
8 An array of intervalvariables that repre-sents the time for theexecution of tasks
Equals the size ofTaskModeTime of theselected mode
TaskEnergy[no. oftasks]
8 An array of intervalvariables that rep-resents the energydissipation for tasks
Equals the size ofTaskModeEnergy ofthe selected mode
EdgeTime[no. ofedges]
8 An array of intervalvariables that repre-sents the overall spanof the edge
From the start of thesource task to theend of the destinationtask
EdgeMode[no. ofedges][no. of modes]
4 A two dimensionalmatrix of optionalintervals. The inter-val EdgeMode[E,M] ispresent if the edgeE is connected tothe task of mode Mand the mode M isselected
Equal the size of theEdgeTime interval ifpresent, absent other-wise
Table 4.1: List of selected interval variables used in the model
The EdgeTime interval variable represents the overall life span of anedge. Depending how the edges are mapped (i.e. according to one of thefive degrees of freedom we differentiated earlier) the span of an edge maybe sub divided into different sub-activities. The two dimensional matrix
80 MAPPING APPLICATIONS TO MPSOCS
EdgeMode models the modes of the edges. Figure 4.7 shows the edge E1mapped as a local-main-local edge and comprises of the following fivesub-activities:
1. Initial storage in a L11
2. A copy operation to the L2
3. Intermediate storage in L2
4. A copy operation to the L12
5. Final storage in the L12
Other types of edge mapping only require a subset of these five sub-activities.
Sequences
A sequence is a total ordered set of interval variables. These intervalvariables can also have types assigned to them. An additional constraintof noOverlap on sequences can force all the intervals in a sequence to benon-overlapping. Optionally the intervals in a sequence can have Types.These types can be used to impose a minimum transition distance betweenthe intervals of a sequence in the presence of a noOverlap constraint.This translates into
noOverlap(π,M)⇔ ∀a, b ∈ A,
((π(b) = π(a) + 1)⇒ (e(a) +M(T (π, a), T (π, b)) ≤ s(b)))
where A is a set of intervals, π is a sequence in A with types T and M isa matrix with the minimum transition distances between the differenttypes of intervals.
ProcessorTime is an array of non-overlapping sequences, one for everyprocessor. The domain of these sequences is the array of time intervalsof task modes TaskModeTime, for all modes that use the particularprocessor. In the sequence every TaskModeTime interval has a Type
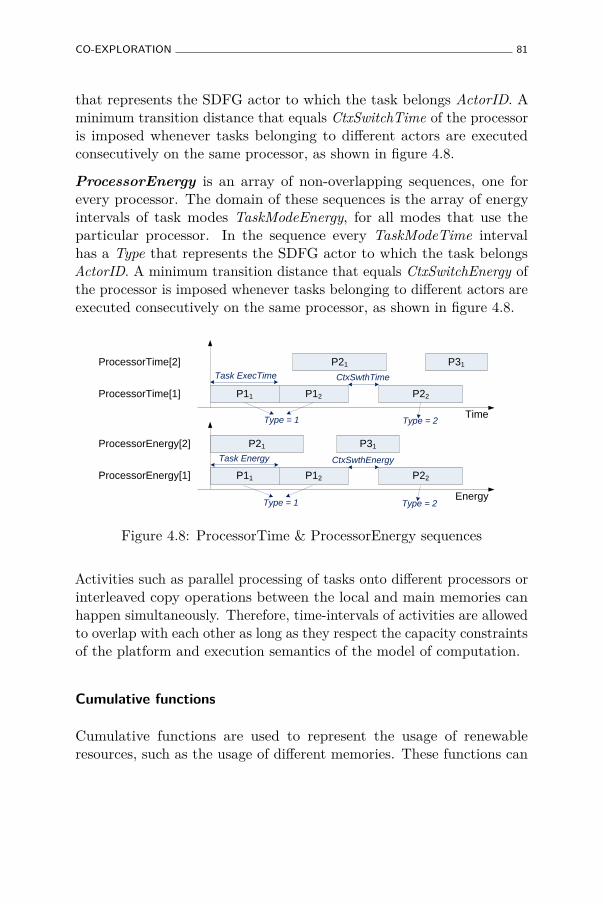
CO-EXPLORATION 81
that represents the SDFG actor to which the task belongs ActorID. Aminimum transition distance that equals CtxSwitchTime of the processoris imposed whenever tasks belonging to different actors are executedconsecutively on the same processor, as shown in figure 4.8.
ProcessorEnergy is an array of non-overlapping sequences, one forevery processor. The domain of these sequences is the array of energyintervals of task modes TaskModeEnergy, for all modes that use theparticular processor. In the sequence every TaskModeTime intervalhas a Type that represents the SDFG actor to which the task belongsActorID. A minimum transition distance that equals CtxSwitchEnergy ofthe processor is imposed whenever tasks belonging to different actors areexecuted consecutively on the same processor, as shown in figure 4.8.
P11 P12 P22
P21 P31
ProcessorEnergy[1]
ProcessorEnergy[2]
P11 P12 P22
P21 P31
ProcessorTime[1]
ProcessorTime[2]
Energy
Task ExecTime CtxSwthTime
Time
CtxSwthEnergyTask Energy
Type = 1 Type = 2
Type = 1 Type = 2
Figure 4.8: ProcessorTime & ProcessorEnergy sequences
Activities such as parallel processing of tasks onto different processors orinterleaved copy operations between the local and main memories canhappen simultaneously. Therefore, time-intervals of activities are allowedto overlap with each other as long as they respect the capacity constraintsof the platform and execution semantics of the model of computation.
Cumulative functions
Cumulative functions are used to represent the usage of renewableresources, such as the usage of different memories. These functions can
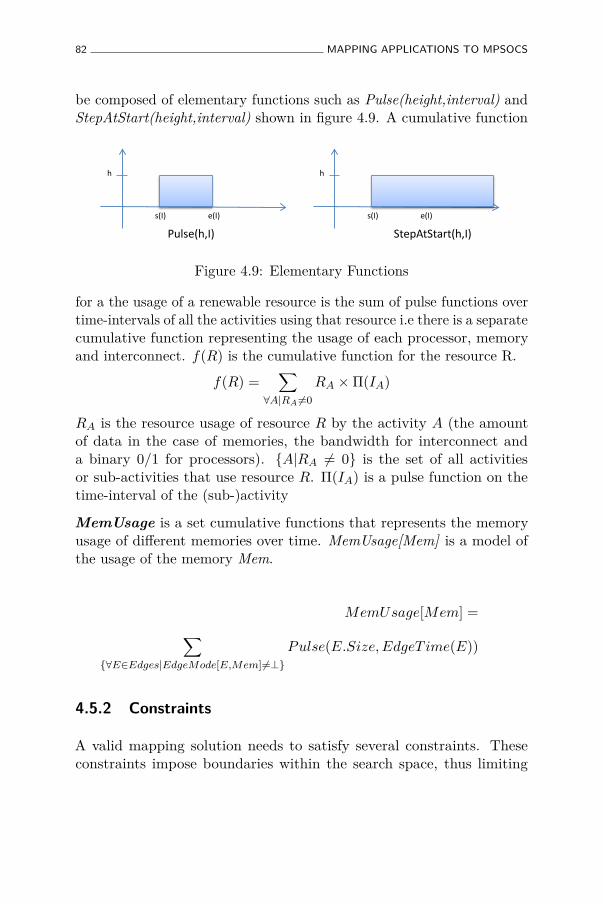
82 MAPPING APPLICATIONS TO MPSOCS
be composed of elementary functions such as Pulse(height,interval) andStepAtStart(height,interval) shown in figure 4.9. A cumulative function
s(I) e(I)
h
Pulse(h,I)
s(I) e(I)
h
StepAtStart(h,I)
s(I) e(I)
h
StepAtEnd(h,I)
Figure 4.9: Elementary Functions
for a the usage of a renewable resource is the sum of pulse functions overtime-intervals of all the activities using that resource i.e there is a separatecumulative function representing the usage of each processor, memoryand interconnect. f(R) is the cumulative function for the resource R.
f(R) =∑
∀A|RA 6=0RA ×Π(IA)
RA is the resource usage of resource R by the activity A (the amountof data in the case of memories, the bandwidth for interconnect anda binary 0/1 for processors). {A|RA 6= 0} is the set of all activitiesor sub-activities that use resource R. Π(IA) is a pulse function on thetime-interval of the (sub-)activity
MemUsage is a set cumulative functions that represents the memoryusage of different memories over time. MemUsage[Mem] is a model ofthe usage of the memory Mem.
MemUsage[Mem] =∑{∀E∈Edges|EdgeMode[E,Mem] 6=⊥}
Pulse(E.Size, EdgeT ime(E))
4.5.2 Constraints
A valid mapping solution needs to satisfy several constraints. Theseconstraints impose boundaries within the search space, thus limiting
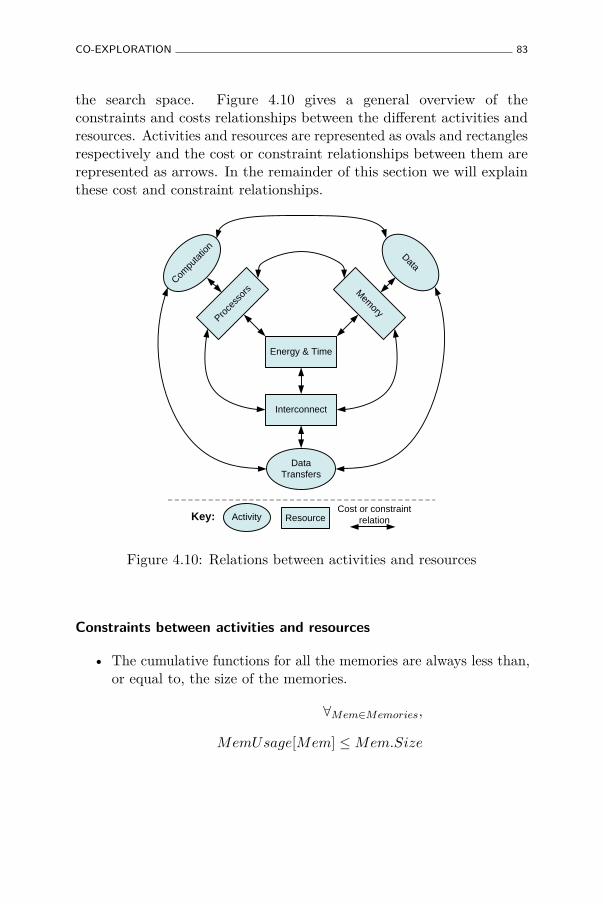
CO-EXPLORATION 83
the search space. Figure 4.10 gives a general overview of theconstraints and costs relationships between the different activities andresources. Activities and resources are represented as ovals and rectanglesrespectively and the cost or constraint relationships between them arerepresented as arrows. In the remainder of this section we will explainthese cost and constraint relationships.
Interconnect
Energy & Time
Proce
ssor
s Mem
ory
Compu
tatio
n
Data Transfers
Data
Activity ResourceCost or constraint
relationKey:
Figure 4.10: Relations between activities and resources
Constraints between activities and resources
• The cumulative functions for all the memories are always less than,or equal to, the size of the memories.
∀Mem∈Memories,
MemUsage[Mem] ≤Mem.Size
84 MAPPING APPLICATIONS TO MPSOCS
Similarly, the cumulative function for the interconnect is always lessthan, or equal to, the arbitrated net bandwidth4 and the cumulativefunctions for all the processors are always less than, or equal to,one.
• One and only one TaskModeTime interval is present for every taskin a valid schedule, and the TaskTime interval starts and ends withthe selected TaskModeTime interval. This behavior is capturedby the alternative constraint in OPL. An alternative(a, {b1, .., bn})constraint implies that, if the interval a is present then exactlyone of {b1, .., bn} is present. And that, a starts and ends with thechosen interval.
• If a task mode M is chosen the interval TaskModeT ime[M ]is present, the corresponding interval TaskModeEnergy[M ]also has to be present and the sequences ProcessorTime andProcessorEnergy should have the same order:
∀M∈Modes,
presenceOf(TaskModeT ime[M ])⇒
presenceOf(TaskModeEnergy[M ]).
∀M∈Modes,K∈Modes|M.P rocessorID=K.P rocessorID,
s(TaskModeT ime[M ]) ≤ s(TaskModeT ime[K])⇒
s(TaskModeEnergy[M ]) ≤ s(TaskModeEnergy[K]).
Constraints between activities and activities
The execution semantics of the model of computation form the constraintsbetween the different activities:
• Each task executes once and only once.4The arbitrated net bandwidth is usually the physical bandwidth, depending on
the arbitration policy and its latency and fairness guarantees.
CO-EXPLORATION 85
• The edges enforce precedence constraints between the tasks andthe life time of an edge starts at the end of its source task and endsat the end of its sink task:
∀E∈Edges,
s(TaskT ime[E.Sink]) ≥ e(TaskT ime[E.Source]),
s(EdgeT ime[E]) = e(TaskT ime[E.Source]),
e(EdgeT ime[E]) = e(TaskT ime[E.Sink]).
Similarly, the time intervals of memory storage sub-activities startwith the starts of its source task or copy operation and ends withits destination task or copy operation, as shown in figure 4.7.
• The interval EdgeMode[E,M ] is present if the edge E is connectedto the task of mode M and the mode M is selected:
∀E∈Edges,M∈Modes,
presenceOf(TaskModeT ime[M ])⇒
s(EdgeMode[E,M ]) = s(EdgeT ime[E]),
e(EdgeMode[E,M ]) = e(EdgeT ime[E]),
¬presenceOf(TaskModeT ime[M ])⇒
¬presenceOf(EdgeMode[E,M ]).
Constraints between resources and resources
The platform model constitutes the constraints between resources. Theseconstrains express the architecture of the platform; i.e which processorscan use which memories and which communication requires the sharedbus, as shown in figure 4.1.
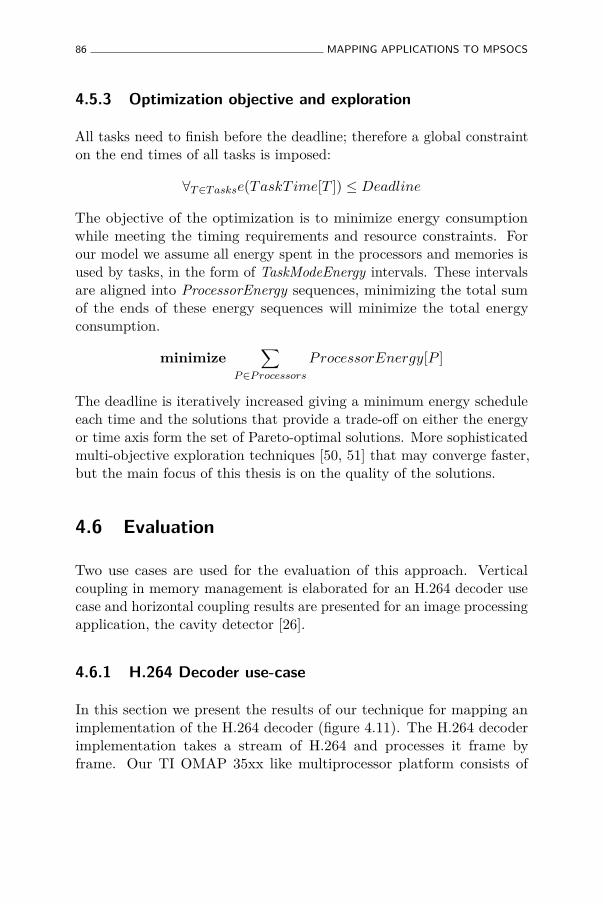
86 MAPPING APPLICATIONS TO MPSOCS
4.5.3 Optimization objective and exploration
All tasks need to finish before the deadline; therefore a global constrainton the end times of all tasks is imposed:
∀T ∈T askse(TaskT ime[T ]) ≤ Deadline
The objective of the optimization is to minimize energy consumptionwhile meeting the timing requirements and resource constraints. Forour model we assume all energy spent in the processors and memories isused by tasks, in the form of TaskModeEnergy intervals. These intervalsare aligned into ProcessorEnergy sequences, minimizing the total sumof the ends of these energy sequences will minimize the total energyconsumption.
minimize∑
P ∈P rocessors
ProcessorEnergy[P ]
The deadline is iteratively increased giving a minimum energy scheduleeach time and the solutions that provide a trade-off on either the energyor time axis form the set of Pareto-optimal solutions. More sophisticatedmulti-objective exploration techniques [50, 51] that may converge faster,but the main focus of this thesis is on the quality of the solutions.
4.6 Evaluation
Two use cases are used for the evaluation of this approach. Verticalcoupling in memory management is elaborated for an H.264 decoder usecase and horizontal coupling results are presented for an image processingapplication, the cavity detector [26].
4.6.1 H.264 Decoder use-case
In this section we present the results of our technique for mapping animplementation of the H.264 decoder (figure 4.11). The H.264 decoderimplementation takes a stream of H.264 and processes it frame byframe. Our TI OMAP 35xx like multiprocessor platform consists of
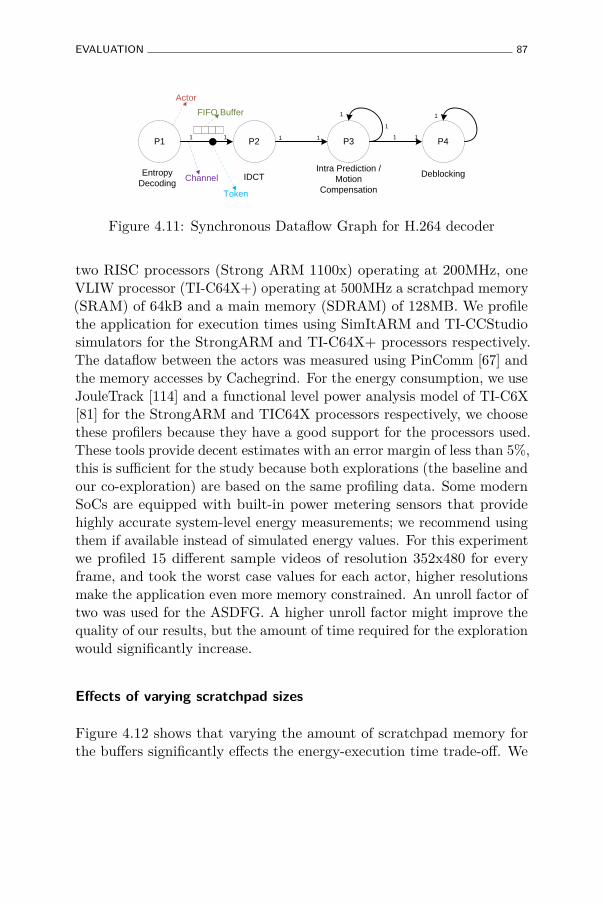
EVALUATION 87
P1 P2 P3 P41 1 1 1 1 1
1
1
1
Entropy Decoding
IDCTIntra Prediction /
Motion Compensation
Deblocking
Actor
FIFO Buffer
Channel
Token
Figure 4.11: Synchronous Dataflow Graph for H.264 decoder
two RISC processors (Strong ARM 1100x) operating at 200MHz, oneVLIW processor (TI-C64X+) operating at 500MHz a scratchpad memory(SRAM) of 64kB and a main memory (SDRAM) of 128MB. We profilethe application for execution times using SimItARM and TI-CCStudiosimulators for the StrongARM and TI-C64X+ processors respectively.The dataflow between the actors was measured using PinComm [67] andthe memory accesses by Cachegrind. For the energy consumption, we useJouleTrack [114] and a functional level power analysis model of TI-C6X[81] for the StrongARM and TIC64X processors respectively, we choosethese profilers because they have a good support for the processors used.These tools provide decent estimates with an error margin of less than 5%,this is sufficient for the study because both explorations (the baseline andour co-exploration) are based on the same profiling data. Some modernSoCs are equipped with built-in power metering sensors that providehighly accurate system-level energy measurements; we recommend usingthem if available instead of simulated energy values. For this experimentwe profiled 15 different sample videos of resolution 352x480 for everyframe, and took the worst case values for each actor, higher resolutionsmake the application even more memory constrained. An unroll factor oftwo was used for the ASDFG. A higher unroll factor might improve thequality of our results, but the amount of time required for the explorationwould significantly increase.
Effects of varying scratchpad sizes
Figure 4.12 shows that varying the amount of scratchpad memory forthe buffers significantly effects the energy-execution time trade-off. We
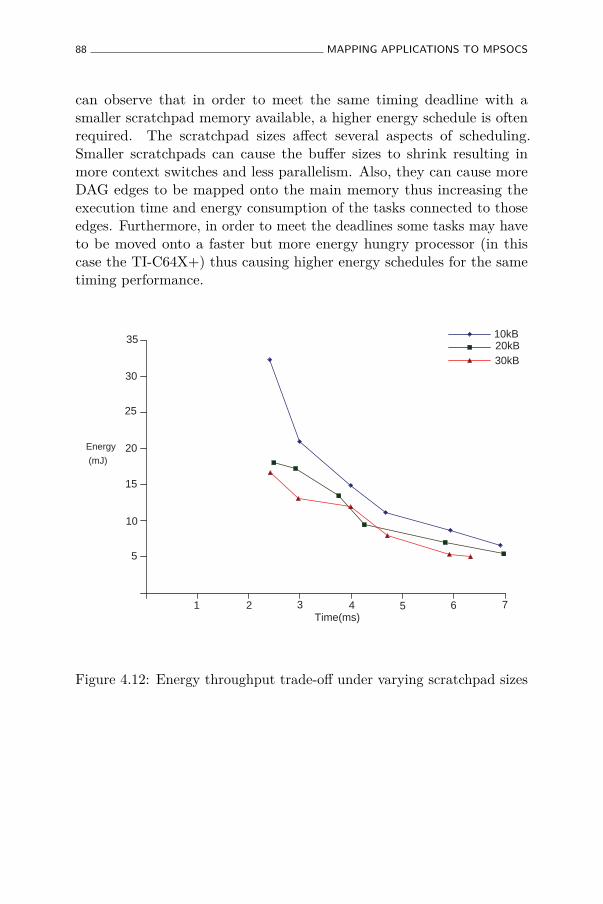
88 MAPPING APPLICATIONS TO MPSOCS
can observe that in order to meet the same timing deadline with asmaller scratchpad memory available, a higher energy schedule is oftenrequired. The scratchpad sizes affect several aspects of scheduling.Smaller scratchpads can cause the buffer sizes to shrink resulting inmore context switches and less parallelism. Also, they can cause moreDAG edges to be mapped onto the main memory thus increasing theexecution time and energy consumption of the tasks connected to thoseedges. Furthermore, in order to meet the deadlines some tasks may haveto be moved onto a faster but more energy hungry processor (in thiscase the TI-C64X+) thus causing higher energy schedules for the sametiming performance.
10kB20kB30kB
1 2 3 4 5 6 7Time(ms)
10
5
15
20
25
30
35
Energy(mJ)
Figure 4.12: Energy throughput trade-off under varying scratchpad sizes
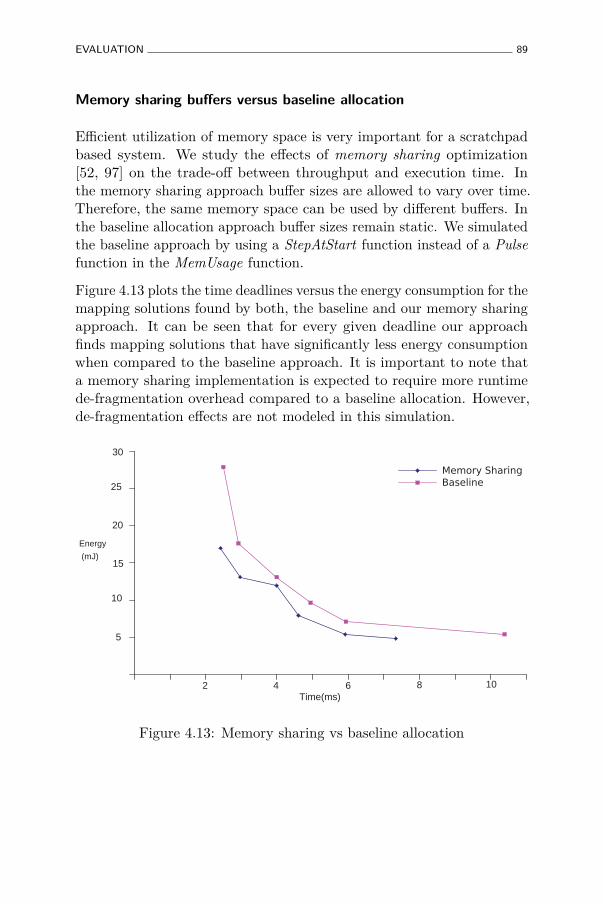
EVALUATION 89
Memory sharing buffers versus baseline allocation
Efficient utilization of memory space is very important for a scratchpadbased system. We study the effects of memory sharing optimization[52, 97] on the trade-off between throughput and execution time. Inthe memory sharing approach buffer sizes are allowed to vary over time.Therefore, the same memory space can be used by different buffers. Inthe baseline allocation approach buffer sizes remain static. We simulatedthe baseline approach by using a StepAtStart function instead of a Pulsefunction in the MemUsage function.
Figure 4.13 plots the time deadlines versus the energy consumption for themapping solutions found by both, the baseline and our memory sharingapproach. It can be seen that for every given deadline our approachfinds mapping solutions that have significantly less energy consumptionwhen compared to the baseline approach. It is important to note thata memory sharing implementation is expected to require more runtimede-fragmentation overhead compared to a baseline allocation. However,de-fragmentation effects are not modeled in this simulation.
4 6 82Time(ms)
10
15
10
5
Energy(mJ)
20
25
30
Figure 4.13: Memory sharing vs baseline allocation
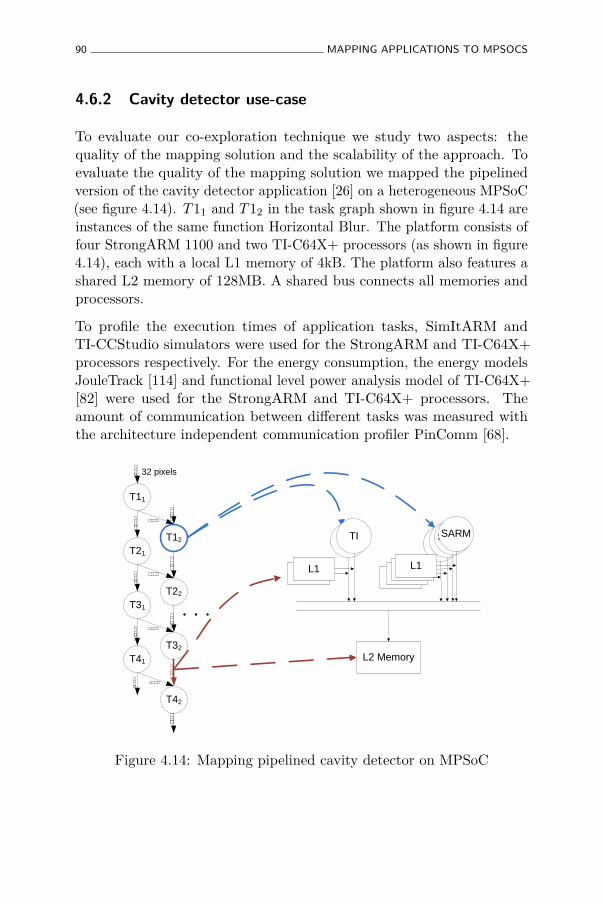
90 MAPPING APPLICATIONS TO MPSOCS
4.6.2 Cavity detector use-case
To evaluate our co-exploration technique we study two aspects: thequality of the mapping solution and the scalability of the approach. Toevaluate the quality of the mapping solution we mapped the pipelinedversion of the cavity detector application [26] on a heterogeneous MPSoC(see figure 4.14). T11 and T12 in the task graph shown in figure 4.14 areinstances of the same function Horizontal Blur. The platform consists offour StrongARM 1100 and two TI-C64X+ processors (as shown in figure4.14), each with a local L1 memory of 4kB. The platform also features ashared L2 memory of 128MB. A shared bus connects all memories andprocessors.
To profile the execution times of application tasks, SimItARM andTI-CCStudio simulators were used for the StrongARM and TI-C64X+processors respectively. For the energy consumption, the energy modelsJouleTrack [114] and functional level power analysis model of TI-C64X+[82] were used for the StrongARM and TI-C64X+ processors. Theamount of communication between different tasks was measured withthe architecture independent communication profiler PinComm [68].
L2 Memory
TI
L1
TI
L1
TI
L1
TI
L1
SARM
L1
T41
T31
T21
T11
T42
T32
T22
T12SARM
L1
32 pixels
Figure 4.14: Mapping pipelined cavity detector on MPSoC
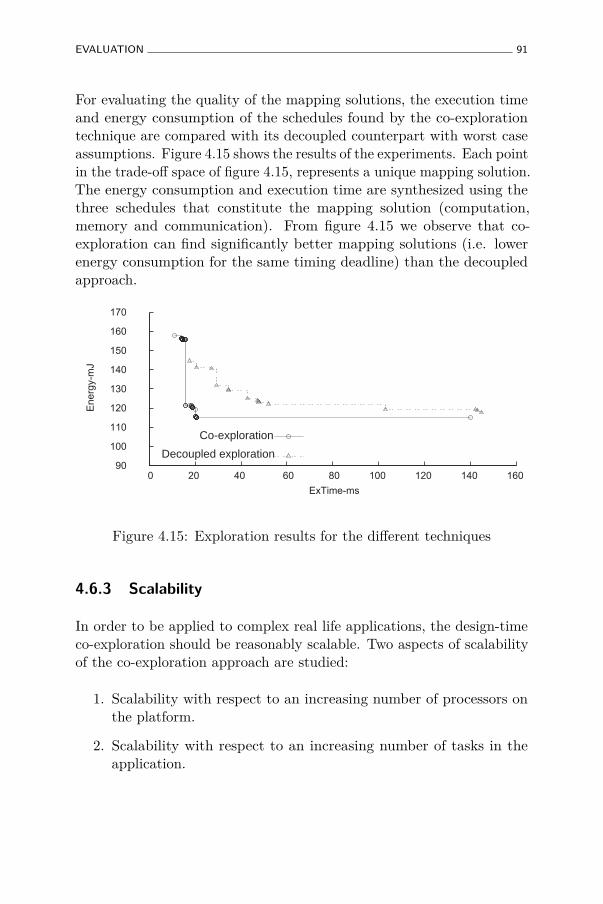
EVALUATION 91
For evaluating the quality of the mapping solutions, the execution timeand energy consumption of the schedules found by the co-explorationtechnique are compared with its decoupled counterpart with worst caseassumptions. Figure 4.15 shows the results of the experiments. Each pointin the trade-off space of figure 4.15, represents a unique mapping solution.The energy consumption and execution time are synthesized using thethree schedules that constitute the mapping solution (computation,memory and communication). From figure 4.15 we observe that co-exploration can find significantly better mapping solutions (i.e. lowerenergy consumption for the same timing deadline) than the decoupledapproach.
Co-explorationDecoupled exploration
Figure 4.15: Exploration results for the different techniques
4.6.3 Scalability
In order to be applied to complex real life applications, the design-timeco-exploration should be reasonably scalable. Two aspects of scalabilityof the co-exploration approach are studied:
1. Scalability with respect to an increasing number of processors onthe platform.
2. Scalability with respect to an increasing number of tasks in theapplication.
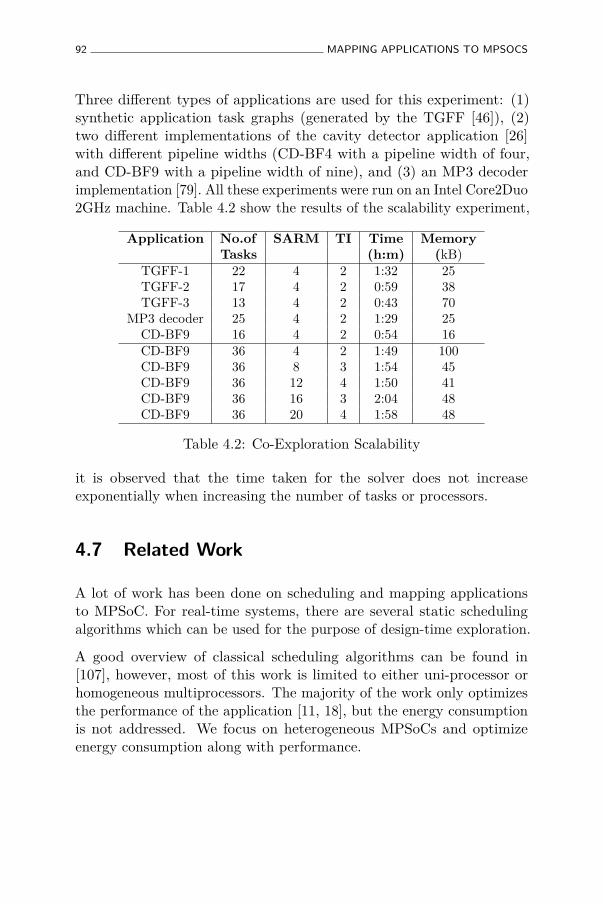
92 MAPPING APPLICATIONS TO MPSOCS
Three different types of applications are used for this experiment: (1)synthetic application task graphs (generated by the TGFF [46]), (2)two different implementations of the cavity detector application [26]with different pipeline widths (CD-BF4 with a pipeline width of four,and CD-BF9 with a pipeline width of nine), and (3) an MP3 decoderimplementation [79]. All these experiments were run on an Intel Core2Duo2GHz machine. Table 4.2 show the results of the scalability experiment,
Application No.of SARM TI Time MemoryTasks (h:m) (kB)
TGFF-1 22 4 2 1:32 25TGFF-2 17 4 2 0:59 38TGFF-3 13 4 2 0:43 70
MP3 decoder 25 4 2 1:29 25CD-BF9 16 4 2 0:54 16CD-BF9 36 4 2 1:49 100CD-BF9 36 8 3 1:54 45CD-BF9 36 12 4 1:50 41CD-BF9 36 16 3 2:04 48CD-BF9 36 20 4 1:58 48
Table 4.2: Co-Exploration Scalability
it is observed that the time taken for the solver does not increaseexponentially when increasing the number of tasks or processors.
4.7 Related Work
A lot of work has been done on scheduling and mapping applicationsto MPSoC. For real-time systems, there are several static schedulingalgorithms which can be used for the purpose of design-time exploration.
A good overview of classical scheduling algorithms can be found in[107], however, most of this work is limited to either uni-processor orhomogeneous multiprocessors. The majority of the work only optimizesthe performance of the application [11, 18], but the energy consumptionis not addressed. We focus on heterogeneous MPSoCs and optimizeenergy consumption along with performance.
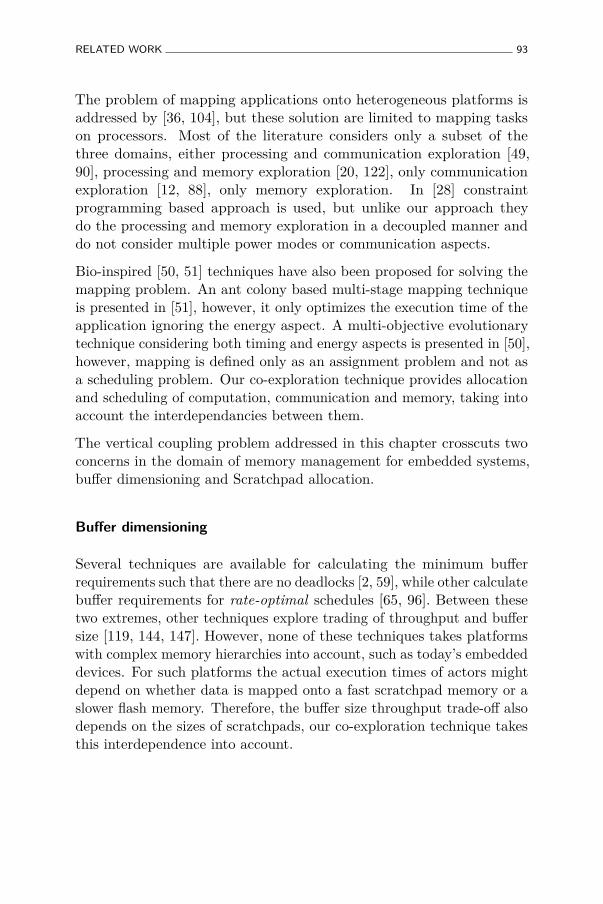
RELATED WORK 93
The problem of mapping applications onto heterogeneous platforms isaddressed by [36, 104], but these solution are limited to mapping taskson processors. Most of the literature considers only a subset of thethree domains, either processing and communication exploration [49,90], processing and memory exploration [20, 122], only communicationexploration [12, 88], only memory exploration. In [28] constraintprogramming based approach is used, but unlike our approach theydo the processing and memory exploration in a decoupled manner anddo not consider multiple power modes or communication aspects.
Bio-inspired [50, 51] techniques have also been proposed for solving themapping problem. An ant colony based multi-stage mapping techniqueis presented in [51], however, it only optimizes the execution time of theapplication ignoring the energy aspect. A multi-objective evolutionarytechnique considering both timing and energy aspects is presented in [50],however, mapping is defined only as an assignment problem and not asa scheduling problem. Our co-exploration technique provides allocationand scheduling of computation, communication and memory, taking intoaccount the interdependancies between them.
The vertical coupling problem addressed in this chapter crosscuts twoconcerns in the domain of memory management for embedded systems,buffer dimensioning and Scratchpad allocation.
Buffer dimensioning
Several techniques are available for calculating the minimum bufferrequirements such that there are no deadlocks [2, 59], while other calculatebuffer requirements for rate-optimal schedules [65, 96]. Between thesetwo extremes, other techniques explore trading of throughput and buffersize [119, 144, 147]. However, none of these techniques takes platformswith complex memory hierarchies into account, such as today’s embeddeddevices. For such platforms the actual execution times of actors mightdepend on whether data is mapped onto a fast scratchpad memory or aslower flash memory. Therefore, the buffer size throughput trade-off alsodepends on the sizes of scratchpads, our co-exploration technique takesthis interdependence into account.
94 MAPPING APPLICATIONS TO MPSOCS
The concept of letting buffers share the same memory space has beenstudied in [97] on a coarse grain level, where buffers with non-overlayinglifetimes can share the same memory space. In [52] on a fine grain levelwhere even buffers with overlapping lifetimes are allowed to share the samememory space. These techniques have been shown to significantly reducethe overall memory requirements of streaming applications. However,our goal is to provide users with better energy efficiency and quality ofservice. Therefore we study the impact of such an optimization on thetrade-off between execution time and energy.
Scratchpad allocation techniques
The problem of content selection for scratchpads has been extensivelystudied for C-like application models. [6] presents a survey of scratchpadallocation techniques. Most of these techniques suffer from the lack ofinformation about the program structure [16] and are sometimes notapplicable to applications with non-affine accesses, pointers, passing byreference, dynamic assignments etc. Therefore the source code usuallyneeds to be ‘cleaned’ before these techniques could be applied [93]. Incontrast to all these approaches we propose a scratchpad allocationtechnique at the level of dataflow graphs.
The literature on scratchpad allocation for dataflow graphs is quitelimited [16, 17, 35]. In [35] a scratchpad aware scheduling technique ispresented that maps both code and data segments of an applicationdescribed as a dataflow diagram. The trade-off between context switchesand buffer sizes is modeled but unlike our approach parallelism aspectsand energy costs are not considered. The methodologies presented in[17] and [16], dynamically allocate code and data of a HetrochronousDataflow Graphs (HGFGs) to scratchpads in a Harvard architecture,however, in contrast to our approach they do not explore the buffer sizes.
4.8 Conclusion
This chapter presents a design-time co-exploration technique thatschedules tasks on processors, data objects on the memories and data

CONCLUSION 95
transfers on the interconnect. The inter-dependencies between thethree different types of schedules are modeled and accounted for, bufferdimensioning is scratchpad-aware and trade-offs with context switchesand parallelism are explored. Vertical and horizontal decoupling arestudied with the help of two use cases.
Validation on an image processing application (cavity detector) showsthat the tightly coupled co-exploration technique that takes all theinterdependancies into account is able to find mapping solutions thatare significantly more energy efficient and/or faster when compared todecoupled exploration techniques. Whereas, our results for the H.264decoder show that awareness of scratchpad sizes significantly affect thetrade-off between energy and execution time and that letting buffersshare the same memory space allows significantly better mappings onthe energy-time trade-off for a scratchpad based system.
The next chapter applies dataflow based modeling and optimizationtechniques for the deployment and scheduling of applications in ubiquitousenvironments.

Chapter 5
Deployment andconfiguration of ubiquitouscomputing applications
The previous chapter discussed techniques for mapping real-timeapplications on parallel multi-core platforms. In this chapter we tailorthe methodology for the domain of ubiquitous computing and use it forthe deployment and configuration of component based applications ondistributed systems1. Two use cases are presented in this chapter. Thefirst use case explores the trade-offs for energy efficient deployment ofartifacts in a wireless sensor network based (WSN) on the Componentand Policy Infrastructure (CaPI) [91]. The second use case exploresthe deployment and configuration tradeoffs for a component basedapplication: fitness monitoring and fall detection.
5.1 Introduction
Ubiquitous computing is a concept, where the presence of computingis everywhere and anywhere. From wearable mobile objects such as
1Parallel systems have a logically shared memory; whereas, distributed systemshave logically (and often physically) distributed memories.
97
98 DEPLOYMENT AND CONFIGURATION OF UBIQUITOUS COMPUTINGAPPLICATIONS
smart watches and smart shoes to fitted installations such as smartwindows and smart doors, computing is ubiquitous and deeply embedded.Systems that run these ubiquitous computing applications are often highlydistributed and very heterogeneous. Computing devices in such systems,vary from minute energy harvesting sensors and actuators with limitedcomputation and communication capabilities over nomadic devises withmoderate computation and communication abilities yet limited energy tostationary servers and infrastructures with adequate resources. Moreover,ubiquitous computing applications are often open-ended and dynamicallyinteract with the environment or user. Furthermore, there are multipleoften-conflicting optimization objectives that make deployment andconfiguration of these applications a challenging task, e.g., maximizingquality of service and battery life.
Sawyer et al. [109] present a constraint programming based approach forconfiguring wireless sensor networks (WSNs). Functional and quality-of-service requirements are modeled as a set of goals and the dependenciesbetween them. Different configurations (i.e. hardware and software) mayoperationalize the same goals in different ways and a constraint solver isused to find the optimal configuration. In contrast, we use a dataflow-centric approach. By extracting a dataflow model of the application andmapping it onto an abstract model of the physical system we find theoptimal2 solutions for the deployment of the application and configurationof the hardware.
In order to evaluate our approach two use cases are used. The firstuse case explores the energy efficient deployment of software artifactsin a wireless sensor network, for four different representative scenarios.The second use case explores deployment and configuration trade-offsbetween the quality of service (error rate) and the CPU load for a fitnessmonitoring and fall detection application.
The remainder of the chapter is structured as follows. Section 5.2 presentstwo application use cases used for evaluating our approach. Section 5.3gives an overview of the methodology. Section 5.4 discusses the results.Section 5.5 presents the conclusions.
2For a certain level of abstraction.
USE CASES 99
5.2 Use cases
The first use case explores the tradeoffs for energy efficient deployment ofartifacts in a wireless sensor network, based on the Component and PolicyInfrastructure (CaPI) [91]. The second use case deals with monitoring ofuser’s general well-being and detection of alarming situations. The firstuse case demonstrates the applicability of our approach in distributedand heterogeneous systems. The second use case applies the methodologyfor optimizing a highly dynamic soft real-time application.
5.2.1 Energy-aware application deployment for a CaPI basedWSNs
CaPI [91] is a Component and Policy based Infrastructure for WirelessSensor Networks (WSNs). AWSN is a network of autonomous distributedsensors called “nodes” that monitor physical or environmental conditionssuch as temperature, pressure, light etc. The nodes are typically equippedwith one or more sensors, a micro-controller and a radio frequencytransceiver, and are usually powered by a small battery. Nodes usuallyrun distributed software applications, communicating and collaboratingwith each other. CaPI provides two contemporary approaches forimplementing software functionality on WSNs, components and policies.Components are software binaries with standardized interfaces thatexecute directly on the processor or a virtual machine. Policies aresoftware scripts executed by a policy engine. The deployment andreconfiguration costs for components are higher than policies; however,they are generally more energy efficient.
Motes are nodes that gather data from fellow nodes in their vicinityand send it to a base station for further processing or storage. Motesare often better provisioned in terms of energy budget, computationalpower and/or transmission range. For a large wireless sensor networkthat consists of different types of sensors acting as motes or nodes, wheresoftware artifacts may be deployed as components or policies, the decisionof which artifact to deploy and where can be complex. We use a dataflowinspired modeling and exploration techniques for finding the optimaldeployment configuration.
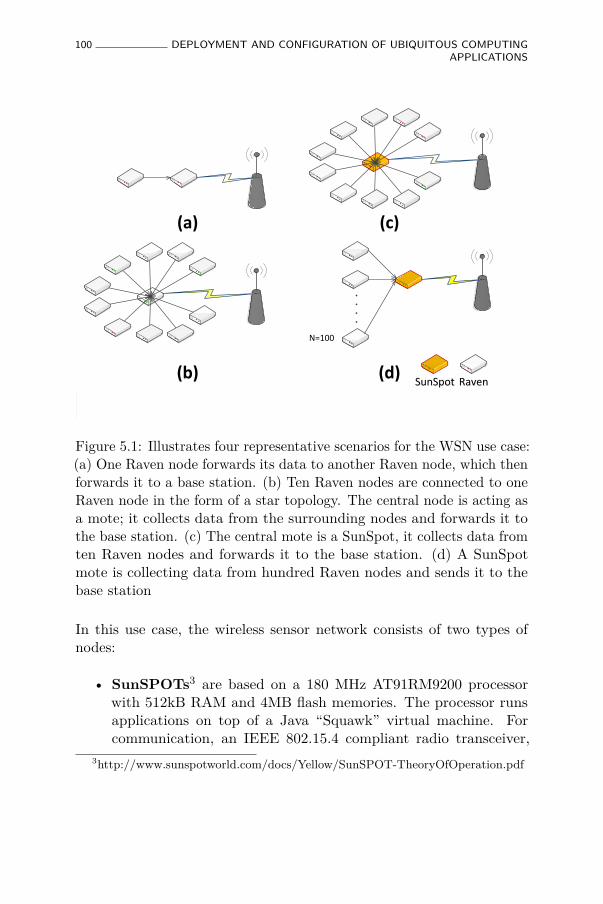
100 DEPLOYMENT AND CONFIGURATION OF UBIQUITOUS COMPUTINGAPPLICATIONS
N=100
SunSpot Raven
Figure 5.1: Illustrates four representative scenarios for the WSN use case:(a) One Raven node forwards its data to another Raven node, which thenforwards it to a base station. (b) Ten Raven nodes are connected to oneRaven node in the form of a star topology. The central node is acting asa mote; it collects data from the surrounding nodes and forwards it tothe base station. (c) The central mote is a SunSpot, it collects data fromten Raven nodes and forwards it to the base station. (d) A SunSpotmote is collecting data from hundred Raven nodes and sends it to thebase station
In this use case, the wireless sensor network consists of two types ofnodes:
• SunSPOTs3 are based on a 180 MHz AT91RM9200 processorwith 512kB RAM and 4MB flash memories. The processor runsapplications on top of a Java “Squawk” virtual machine. Forcommunication, an IEEE 802.15.4 compliant radio transceiver,
3http://www.sunspotworld.com/docs/Yellow/SunSPOT-TheoryOfOperation.pdf
USE CASES 101
CC2420 from Texas Instruments is integrated. The radio consumes61.2 mW (approx.) of power when switched on.
• Ravens are based on an Atmel 8-bit AVR RISC microcontrollerrunning at 16MHz, with 128kB ISP flash memory and 16kB SRAM.An IEEE 802.15.4 compliant radio transceiver (AT86RF230) isembedded within the node. The processor requires 24 mW of powerat 16 MHz and the radio again consumes 61.2 mW (approx) of powerwhen switched on. Raven nodes are smaller, cheaper and requireless power; whereas, the SunSPOTs have more computational powerand memory.
In order to validate the applicability of our approach, we selected fourrepresentative scenarios, shown in figure 5.1. In the first scenario (a),one Raven node forwards its data to another Raven node, which thenforwards it to a base station. In the second scenario (b), ten Raven nodesare connected to one Raven node in the form of a star topology. Thecentral node is acting as a mote; it collects data from the surroundingnodes and forwards it to the base station. In the third scenario (c), thecentral mote is a SunSpot, it collects data from ten Raven nodes andforwards it to the base station. In the fourth scenario (d), a SunSpotmote collects data from hundred Raven nodes and forwards it to thebase station. We explore the possibilities of deploying software artifacts(components or policies) for processing sensor data in the WSN. Theartifact can be deployed either at a source node or at an intermediatenode that forwards the data to the base station. The results of thisexploration are provided in section 5.4.1.
5.2.2 Fitness monitoring and fall detection
Physical wellness and health are highly inter-linked. Mobility is seen asan essential decisive factor to maintain an altogether independent living.A detailed account of assisted living technologies and functions have beenoutlined by Sun et al. [123]. Ensuring the safety and security of the userwith the help of alarms, monitoring the health and well-being of the user,and the use of interactive and virtual services to help support the userare just few of them. Hence, in this use case, the mobility of the user is

102 DEPLOYMENT AND CONFIGURATION OF UBIQUITOUS COMPUTINGAPPLICATIONS
being monitored by inferring the physical activity of the user (standing,walking, number of steps taken, etc.). The system detects a fall in asmart way by not only relying on data provided by accelerometers, butalso by incorporating knowledge about the location of the fall to inferthe likelihood of the fall (for example, to reduce false positives due todropping yourself in a chair) and to notify the caregiver in case of anemergency.
Low-pass filter Magnitude filter Peak detector Step detectorAccelerometer
High-pass filterSignal
magnitude area
Fall detector
Magnitude filter
Fast Fourier
transform
Feature classification
GPS, GSM, WiFi
Geo-locakization
Semanticspatial
reasoner
Smart fall detector
Figure 5.2: UML 2.0 component diagram for the fitness monitoring andfall detection application
Building blocks of the fitness monitoring and fall detection application
Figure 5.2 provides an overview of the composition of the componentsfor the first use case. We will describe each of these components below.
• Accelerometer: This component produces a continuous stream ofacceleration data by sampling a tri-axial accelerometer at a certainsampling rate.
• Low-pass filter: For mobility tracking, e.g. walking or running,we are mainly interested in acceleration peaks that arrive at afrequency of maximum 5Hz (i.e. max 5 steps per second). Therefore,a ’moving average’ component is used as a simple low-pass filter toremove high-frequency noise.
USE CASES 103
• Magnitude filter: Often, we do not know how the accelerometeris oriented at the offset of the motion activity. Furthermore,the orientation of the sensor may change while moving around.Therefore, the signal analysis is done on the overall magnitude ofthe acceleration signal.
• Peak filter: A single step is characterized by a pattern of severalmaxima and minima in the time domain of the acceleration signal.This component extracts these features in the signal for furtheranalysis.
• Step detector: Identifies the peaks for every step in order tocorrectly count the number of steps and to differentiate betweenstanding still, walking and running (i.e. the peak rate).
• High-pass filter: For fall detection, we are interested in suddenand high-frequency changes of the acceleration signal, both inamplitude and orientation. This component implements a high-pass Finite Impulse Response (FIR) filter to extract these features.
• Fall detector: Analyzes the signal magnitude area (SMA) of thehigh-frequency part of the acceleration signal, and identifies a fallif this feature passes a certain threshold.
• Fast Fourier Transformation: Takes a time domain signal andconverts it into a frequency domain signal. It is used for featureextraction on the magnitude signal and provides input for activitytraining and classification.
• Feature classification: Whereas the previous components mainlycondition and extract useful features from the accelerometer data,this component builds decision models through training (leveragingthe Weka machine learning library) in order to classify the activityof the user.
• Geo-localization unit: This component uses a variety ofalgorithms and filters to compute in-door localization, based onsignal strength and time of arrival from a range of nodes, in orderto localize the users and associated objects in real-time.
104 DEPLOYMENT AND CONFIGURATION OF UBIQUITOUS COMPUTINGAPPLICATIONS
• Semantic spatial reasoner: A parliament based semanticreasoner is used to map the geo-location information fromthe previous component to meaningful semantic descriptions(e.g., kitchen, couch in the living room, etc) that are betterunderstandable for the end users.
• Smart fall detector: A component that co-relates the falls andthe semantic location of the user. It is a probabilistic model thatcalculates the risk and analyzes the emergency situation to notifythe caregiver.
This system utilizes the built-in tri-axial accelerometer to do opportunisticsensing. Although the energy efficiency of the accelerometers hasincreased over the years, continuous sensing at high frequencies andon-board processing of these data streams have proven to drain thebattery of mobile devices rapidly [87]. Hence, a major challenge withsensing is to determine the optimal sampling frequency and extracting thesuitable features depending on the other available context information.Despite using opportunistic sensing, precise labeling of the training datais a significant challenge, as most of the models require extensive trainingdata for good classification accuracy. This problem worsens as the scaleof this system increases. Therefore, the primary motivation is to build ascalable activity recognition system for mobile devices with intelligenthybrid sensing, inference and learning that can leverage the resource richenvironment of the cloud.
5.3 Overview of the deployment and configurationmethodology
It is impossible to determine in advance where each software componentwill run due to the dynamic interaction of these devices with theenvironment and the user. The variety of parameters associatedwith the several possible configurations under varying workload andresource availability makes it almost impossible to manually fine-tune thecomponents for best overall system performance, necessitating automateddeployment, configuration and adaptation. Furthermore, performing a
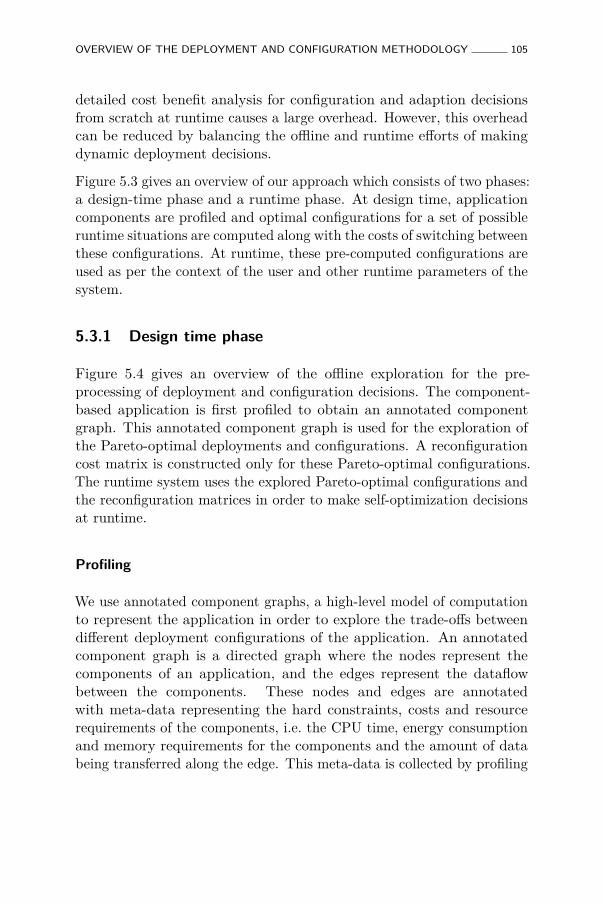
OVERVIEW OF THE DEPLOYMENT AND CONFIGURATION METHODOLOGY 105
detailed cost benefit analysis for configuration and adaption decisionsfrom scratch at runtime causes a large overhead. However, this overheadcan be reduced by balancing the offline and runtime efforts of makingdynamic deployment decisions.
Figure 5.3 gives an overview of our approach which consists of two phases:a design-time phase and a runtime phase. At design time, applicationcomponents are profiled and optimal configurations for a set of possibleruntime situations are computed along with the costs of switching betweenthese configurations. At runtime, these pre-computed configurations areused as per the context of the user and other runtime parameters of thesystem.
5.3.1 Design time phase
Figure 5.4 gives an overview of the offline exploration for the pre-processing of deployment and configuration decisions. The component-based application is first profiled to obtain an annotated componentgraph. This annotated component graph is used for the exploration ofthe Pareto-optimal deployments and configurations. A reconfigurationcost matrix is constructed only for these Pareto-optimal configurations.The runtime system uses the explored Pareto-optimal configurations andthe reconfiguration matrices in order to make self-optimization decisionsat runtime.
Profiling
We use annotated component graphs, a high-level model of computationto represent the application in order to explore the trade-offs betweendifferent deployment configurations of the application. An annotatedcomponent graph is a directed graph where the nodes represent thecomponents of an application, and the edges represent the dataflowbetween the components. These nodes and edges are annotatedwith meta-data representing the hard constraints, costs and resourcerequirements of the components, i.e. the CPU time, energy consumptionand memory requirements for the components and the amount of databeing transferred along the edge. This meta-data is collected by profiling
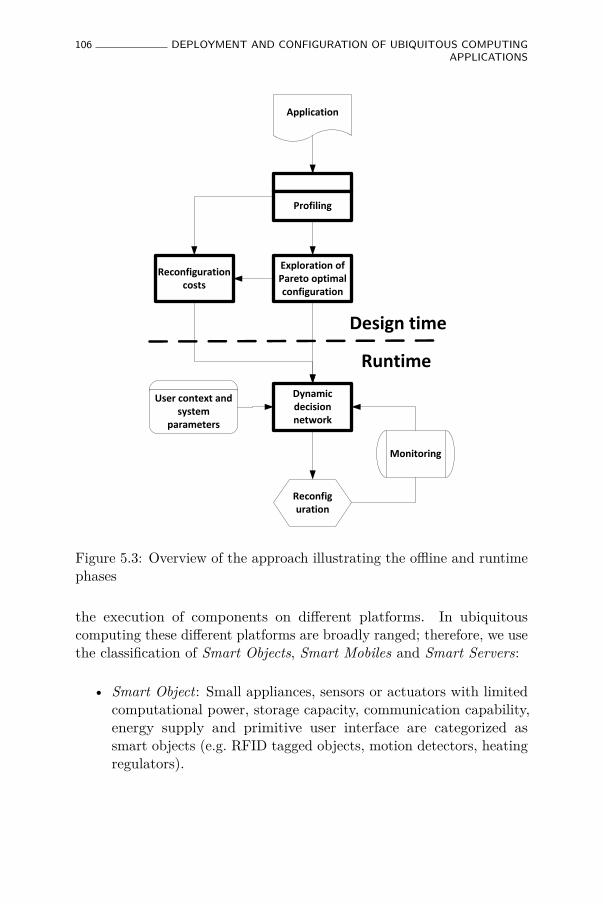
106 DEPLOYMENT AND CONFIGURATION OF UBIQUITOUS COMPUTINGAPPLICATIONS
Application
Profiling
Exploration of Pareto optimal configuration
Dynamic decision network
Reconfiguration
Monitoring
User context and system
parameters
Design time
Runtime
Reconfiguration costs
Figure 5.3: Overview of the approach illustrating the offline and runtimephases
the execution of components on different platforms. In ubiquitouscomputing these different platforms are broadly ranged; therefore, we usethe classification of Smart Objects, Smart Mobiles and Smart Servers:
• Smart Object: Small appliances, sensors or actuators with limitedcomputational power, storage capacity, communication capability,energy supply and primitive user interface are categorized assmart objects (e.g. RFID tagged objects, motion detectors, heatingregulators).
OVERVIEW OF THE DEPLOYMENT AND CONFIGURATION METHODOLOGY 107
• Smart Mobile: Devices with multi-modal user interfaces to enableuser mobility through remote services are categorized as smartmobiles (e.g. smart phones, smart TVs). They usually have betterresource provisions than smart objects.
• Smart Server : The aggregation and complex analysis of data fromsmart objects and smart mobiles are realized as services on smartservers (e.g. a local server or remote cloud computing set-up).
In order to generate an annotated component graph for this application,following steps are carried out:
1. Use the component model of the application and identify thedataflow (similar to the one shown in Figure 5.2) between them.The dataflow graph acts as a skeleton for the annotated componentgraph.
2. Instrument the communication interfaces of components to measurethe amount of data transferred between them.
3. Run every component of the application on all the differentplatforms possible, profiling its execution time, energy consumptionand data transferred between components, each time.
4. Calculate the memory requirements of every component bymonitoring the changes in stack and heap sizes, as components areadded and removed from the platform.
5. Repeat step 3 and 4 over a range of component configurations (e.g. adifferent sampling rate) and/or simulated inputs (e.g. accelerometertraces of different activities and individuals).
The hard constraints for the second use case are that the accelerometerand the GPS can only execute on devices with such sensors. Somecomponents have configuration options that affect their resource costsand requirements. For example, lowering the accelerometer sampling ratefrom 50Hz to 15Hz decreases the CPU time, communication and energyconsumption of the activity recognition components, but increases the
108 DEPLOYMENT AND CONFIGURATION OF UBIQUITOUS COMPUTINGAPPLICATIONS
recognition error rate. For such components we annotate the componentgraph with meta-data for a discretized range of parameter options, i.e. theCPU time and energy consumption values for the supported samplingrates. Adding all this meta-data to the dataflow graph generates theannotated component graph of the application and we use it as anintermediate model for exploring Pareto-optimal deployment trade-offsat design time.
Pareto exploration
We model the problem of deploying an application to a heterogeneousnetwork of (re)configurable nodes as a constraint-based optimizationproblem and use a CPLEX based solver to explore the Pareto-optimalset of solutions. In a Pareto-optimal set of solutions, every solution isbetter than all other solutions according to at least one functional ornon-functional criterion.
Eliminating deployment and configuration options that are not Pareto-optimal reduces the search space for the runtime reconfiguration decision,from all possible configurations to only the set of Pareto-optimalconfigurations. For example, consider the use case in section 3 whichconsists of 13 components, 11 of these components may be deployed onthree different platforms. Deploying more components on the SmartObjects and Smarts Mobiles stresses these devices in terms of memory,computational power and battery consumption, whereas, deploying morecomponents on the Smart Server adds to the communication costs.Moreover, some of the components have different operational modes(e.g. the sampling frequency for the accelerometer component) withdifferent costs. All of these permutations when combined form a largesolution space and exploring it at runtime would incur a huge overhead.Therefore, at design time a set of Pareto-optimal configurations arecomputed (in order to reduce the solution space of the runtime phase).
In order to explore multi-dimensional Pareto-optimal surfaces, theproblem is modeled using parameterizable constraints. These parametersare then iteratively varied over a discretized range, invoking the solvereach time to find a point on a Pareto surface. For example, an energyconsumption versus Quality of Service Pareto curve is explored for the
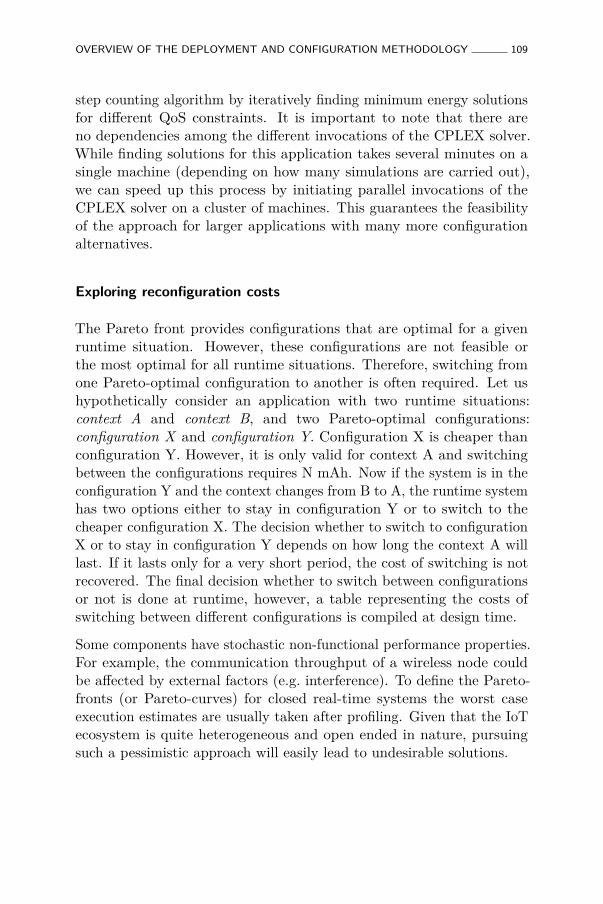
OVERVIEW OF THE DEPLOYMENT AND CONFIGURATION METHODOLOGY 109
step counting algorithm by iteratively finding minimum energy solutionsfor different QoS constraints. It is important to note that there areno dependencies among the different invocations of the CPLEX solver.While finding solutions for this application takes several minutes on asingle machine (depending on how many simulations are carried out),we can speed up this process by initiating parallel invocations of theCPLEX solver on a cluster of machines. This guarantees the feasibilityof the approach for larger applications with many more configurationalternatives.
Exploring reconfiguration costs
The Pareto front provides configurations that are optimal for a givenruntime situation. However, these configurations are not feasible orthe most optimal for all runtime situations. Therefore, switching fromone Pareto-optimal configuration to another is often required. Let ushypothetically consider an application with two runtime situations:context A and context B, and two Pareto-optimal configurations:configuration X and configuration Y. Configuration X is cheaper thanconfiguration Y. However, it is only valid for context A and switchingbetween the configurations requires N mAh. Now if the system is in theconfiguration Y and the context changes from B to A, the runtime systemhas two options either to stay in configuration Y or to switch to thecheaper configuration X. The decision whether to switch to configurationX or to stay in configuration Y depends on how long the context A willlast. If it lasts only for a very short period, the cost of switching is notrecovered. The final decision whether to switch between configurationsor not is done at runtime, however, a table representing the costs ofswitching between different configurations is compiled at design time.
Some components have stochastic non-functional performance properties.For example, the communication throughput of a wireless node couldbe affected by external factors (e.g. interference). To define the Pareto-fronts (or Pareto-curves) for closed real-time systems the worst caseexecution estimates are usually taken after profiling. Given that the IoTecosystem is quite heterogeneous and open ended in nature, pursuingsuch a pessimistic approach will easily lead to undesirable solutions.
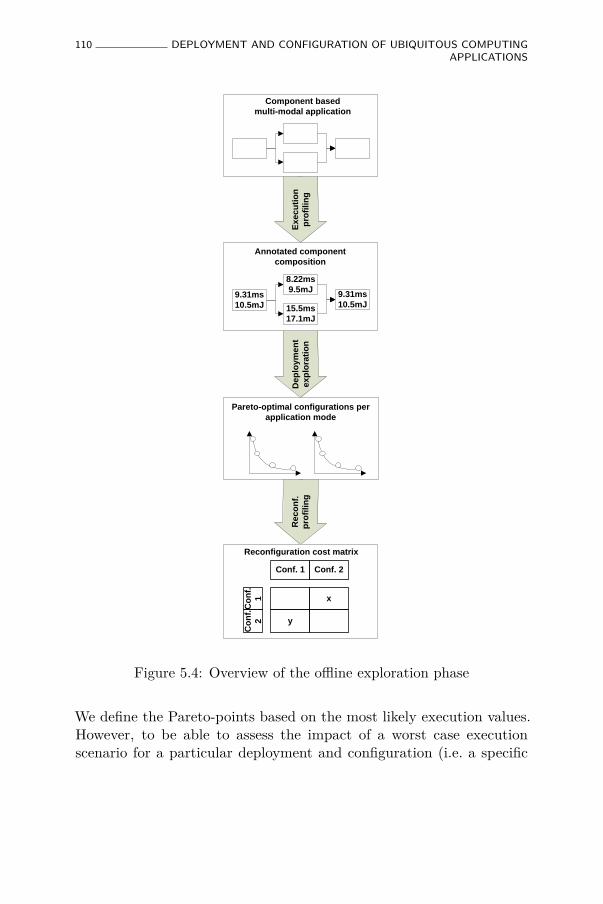
110 DEPLOYMENT AND CONFIGURATION OF UBIQUITOUS COMPUTINGAPPLICATIONS
Ex
ec
uti
on
pro
filin
gD
ep
loy
me
nt
ex
plo
rati
on
Re
co
nf.
p
rofi
lin
g
Component based
multi-modal application
Co
nf.
1
Conf. 1
Co
nf.
2
Conf. 2
y
x
Reconfiguration cost matrix
Annotated component
composition
9.31ms
10.5mJ
8.22ms
9.5mJ
15.5ms
17.1mJ
9.31ms
10.5mJ
Pareto-optimal configurations per
application mode
Figure 5.4: Overview of the offline exploration phase
We define the Pareto-points based on the most likely execution values.However, to be able to assess the impact of a worst case executionscenario for a particular deployment and configuration (i.e. a specific
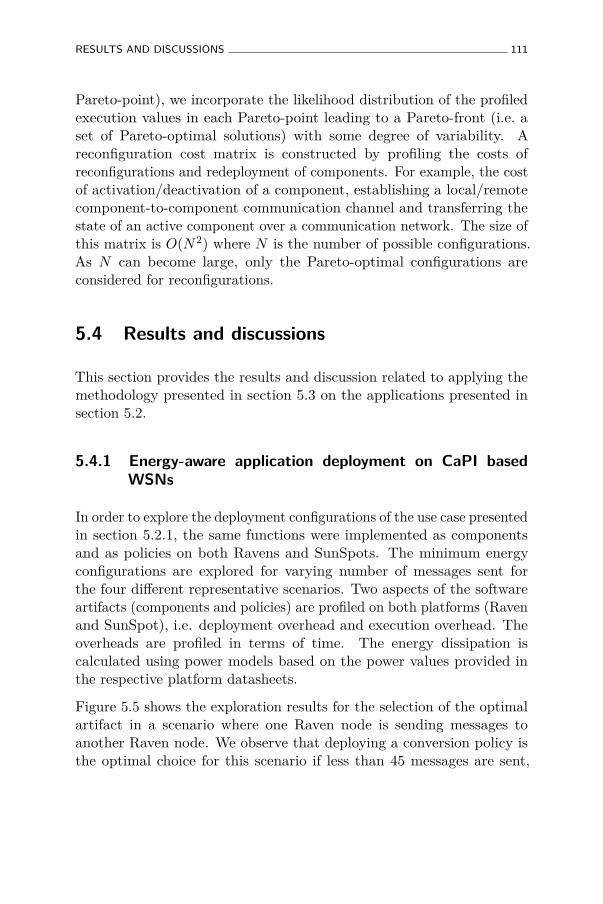
RESULTS AND DISCUSSIONS 111
Pareto-point), we incorporate the likelihood distribution of the profiledexecution values in each Pareto-point leading to a Pareto-front (i.e. aset of Pareto-optimal solutions) with some degree of variability. Areconfiguration cost matrix is constructed by profiling the costs ofreconfigurations and redeployment of components. For example, the costof activation/deactivation of a component, establishing a local/remotecomponent-to-component communication channel and transferring thestate of an active component over a communication network. The size ofthis matrix is O(N2) where N is the number of possible configurations.As N can become large, only the Pareto-optimal configurations areconsidered for reconfigurations.
5.4 Results and discussions
This section provides the results and discussion related to applying themethodology presented in section 5.3 on the applications presented insection 5.2.
5.4.1 Energy-aware application deployment on CaPI basedWSNs
In order to explore the deployment configurations of the use case presentedin section 5.2.1, the same functions were implemented as componentsand as policies on both Ravens and SunSpots. The minimum energyconfigurations are explored for varying number of messages sent forthe four different representative scenarios. Two aspects of the softwareartifacts (components and policies) are profiled on both platforms (Ravenand SunSpot), i.e. deployment overhead and execution overhead. Theoverheads are profiled in terms of time. The energy dissipation iscalculated using power models based on the power values provided inthe respective platform datasheets.
Figure 5.5 shows the exploration results for the selection of the optimalartifact in a scenario where one Raven node is sending messages toanother Raven node. We observe that deploying a conversion policy isthe optimal choice for this scenario if less than 45 messages are sent,
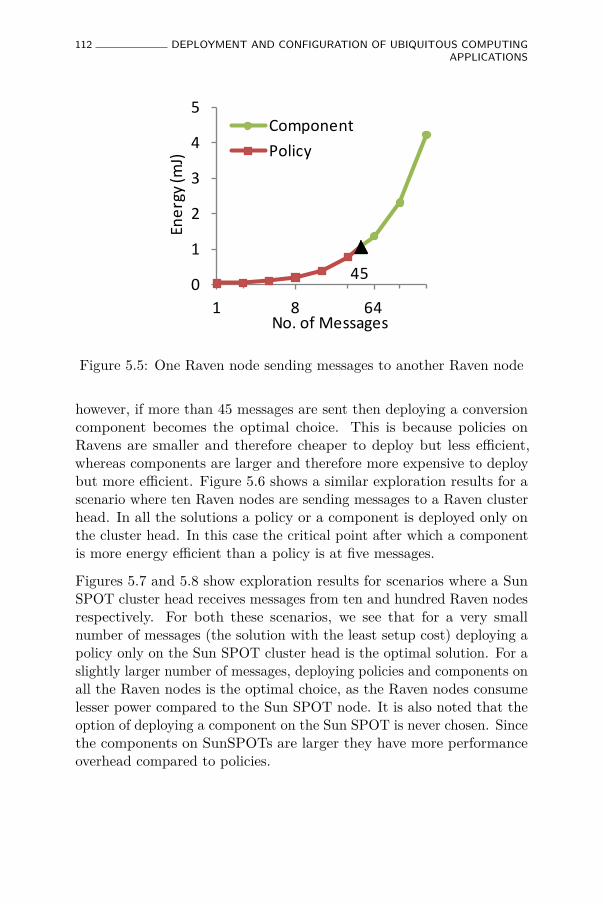
112 DEPLOYMENT AND CONFIGURATION OF UBIQUITOUS COMPUTINGAPPLICATIONS
45 0
1
2
3
4
5
1 8 64
Ener
gy (m
J)
No. of Messages
Component Policy
Figure 5.5: One Raven node sending messages to another Raven node
however, if more than 45 messages are sent then deploying a conversioncomponent becomes the optimal choice. This is because policies onRavens are smaller and therefore cheaper to deploy but less efficient,whereas components are larger and therefore more expensive to deploybut more efficient. Figure 5.6 shows a similar exploration results for ascenario where ten Raven nodes are sending messages to a Raven clusterhead. In all the solutions a policy or a component is deployed only onthe cluster head. In this case the critical point after which a componentis more energy efficient than a policy is at five messages.
Figures 5.7 and 5.8 show exploration results for scenarios where a SunSPOT cluster head receives messages from ten and hundred Raven nodesrespectively. For both these scenarios, we see that for a very smallnumber of messages (the solution with the least setup cost) deploying apolicy only on the Sun SPOT cluster head is the optimal solution. For aslightly larger number of messages, deploying policies and components onall the Raven nodes is the optimal choice, as the Raven nodes consumelesser power compared to the Sun SPOT node. It is also noted that theoption of deploying a component on the Sun SPOT is never chosen. Sincethe components on SunSPOTs are larger they have more performanceoverhead compared to policies.
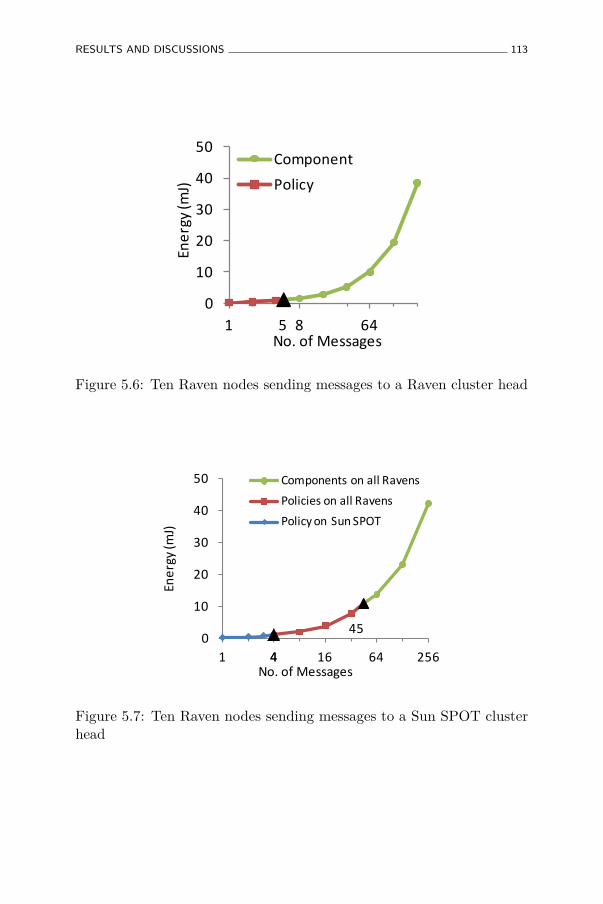
RESULTS AND DISCUSSIONS 113
5 0
10
20
30
40
50
1 8 64
Ener
gy (m
J)
No. of Messages
Component Policy
Figure 5.6: Ten Raven nodes sending messages to a Raven cluster head
45
4 0
10
20
30
40
50
1 4 16 64 256
Ener
gy (m
J)
No. of Messages
Components on all Ravens Policies on all Ravens Policy on Sun SPOT
Figure 5.7: Ten Raven nodes sending messages to a Sun SPOT clusterhead

114 DEPLOYMENT AND CONFIGURATION OF UBIQUITOUS COMPUTINGAPPLICATIONS
45
5 0
50 100 150 200 250 300 350 400 450
1 4 16 64 256
Ener
gy (m
J)
No. of Messages
Components on all Ravens
Policies on all Ravens
Policy on Sun SPOT
Figure 5.8: Hundred Raven nodes sending messages to a Sun Spot clusterhead
5.4.2 Deployment trade-offs of fitness monitoring and falldetection application
This section presents results of our second use case. First, profiling resultsof some components are presented in table 5.1 and then two importantaspects of this use case are discussed; the exploration of functional andnon-functional trade-offs and second the variability of non-functionalproperties.
Profiling
The profiling results of the step counting application on the SunSPOTsensor are shown in Table 5.1. Note that for the Accelerometer, Low-passfilter andMagnitude filter components, there is little to no communicationvariability because the amount of data output is fixed and depends onthe sampling rate of the accelerometer. We were not able to test all thecomponents on the Raven sensor, but those that were ported executedapproximately 50 times slower compared to the SunSPOT.
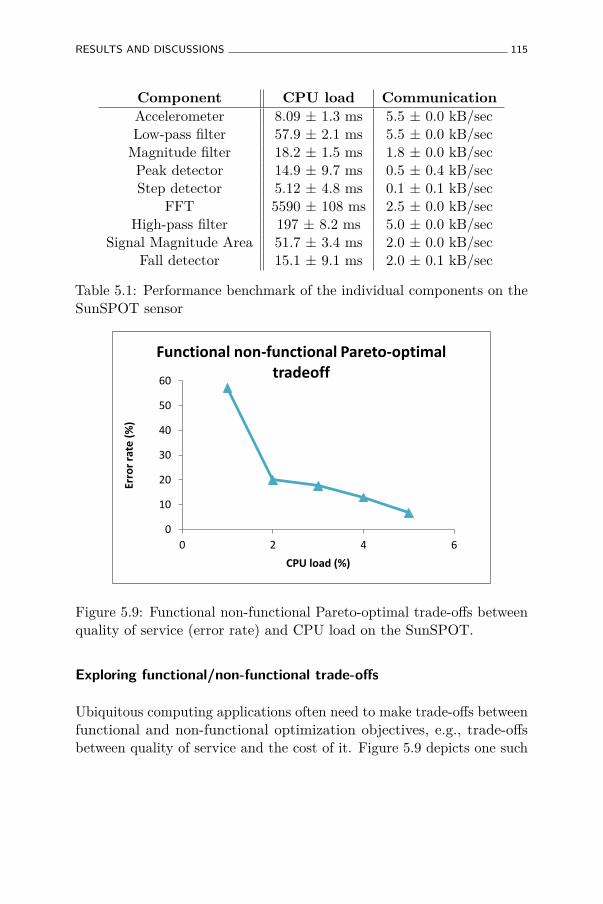
RESULTS AND DISCUSSIONS 115
Component CPU load CommunicationAccelerometer 8.09 ± 1.3 ms 5.5 ± 0.0 kB/secLow-pass filter 57.9 ± 2.1 ms 5.5 ± 0.0 kB/secMagnitude filter 18.2 ± 1.5 ms 1.8 ± 0.0 kB/secPeak detector 14.9 ± 9.7 ms 0.5 ± 0.4 kB/secStep detector 5.12 ± 4.8 ms 0.1 ± 0.1 kB/sec
FFT 5590 ± 108 ms 2.5 ± 0.0 kB/secHigh-pass filter 197 ± 8.2 ms 5.0 ± 0.0 kB/sec
Signal Magnitude Area 51.7 ± 3.4 ms 2.0 ± 0.0 kB/secFall detector 15.1 ± 9.1 ms 2.0 ± 0.1 kB/sec
Table 5.1: Performance benchmark of the individual components on theSunSPOT sensor
0
10
20
30
40
50
60
0 2 4 6
Erro
r ra
te (
%)
CPU load (%)
Functional non-functional Pareto-optimal tradeoff
Figure 5.9: Functional non-functional Pareto-optimal trade-offs betweenquality of service (error rate) and CPU load on the SunSPOT.
Exploring functional/non-functional trade-offs
Ubiquitous computing applications often need to make trade-offs betweenfunctional and non-functional optimization objectives, e.g., trade-offsbetween quality of service and the cost of it. Figure 5.9 depicts one such
116 DEPLOYMENT AND CONFIGURATION OF UBIQUITOUS COMPUTINGAPPLICATIONS
trade-off for step counting. The error rate provides a measure for thequality of service and the CPU load represents its cost. This trade-offdepends on the sampling frequency of the accelerometer component.Higher sampling frequency results in a smaller error rate but at thecost of increased CPU load. For 24/7 mobility monitoring it is notdesirable to have a static sampling frequency, for example, the samplingfrequency may be lowered in order to save energy if the user is sleepingand increased if he/she is walking or running. Dynamic decision networks[98] can use this exploration data to adjust the sampling frequency atruntime.
Outlook on managing variability
In the second use case we observe two types of dynamism:
1. The first form of dynamism is reactive, i.e. changing executionmodes or parameters of the application in reaction to changes in thecontext; e.g., changing the sampling frequency of the accelerometerin different scenarios (sleeping, walking, running etc.). This formof dynamism is manageable with scenario-based or context-awaremethodologies.
2. The second form of dynamism is low level, i.e. the variabilitywithin a scenario. For example, the computational load of theStep Detector component (see Figure 5.2) is different for differentusers because people have different walking patterns. This form ofdynamism is not manageable with scenario-based or context-awaremethodologies at design time.
By learning user specific patterns it is possible to predict a part of thisvariability, hence optimizing deployment and configuration. Therefore, wepropose using a fuzzy Pareto space for such applications. A fuzzy Paretocurve takes into account the variability of non-functional properties ofdifferent components when exploring the deployment configurations. Anintelligent runtime system learns user patterns and uses them to finetune and further optimize the configurations at runtime [106].
RESULTS AND DISCUSSIONS 117
Figure 5.10 illustrates a fuzzy Pareto space of the trade-off between CPUload and network communication for different deployment configurations.Given the fact that the deployment of the Accelerometer componentis fixed, we have 16 different deployment options for the 4 remainingcomponents. Figure 5.10 shows the five Pareto-optimal ones, the averagetrade-off point is marked by the red dots and the variability is shownas circles around these red dots. Note that we assume perfect normaldistributions here, in real-life the variability is likely to be skewed in oneor more directions.
• D1: Minimal computation on the sensor by having the Accelerom-eter component on the sensor and the 4 remaining sensor dataprocessing components deployed on the server.
• D2: The Accelerometer and Low-pass filter components deployedon the sensor and the other components on the server.
• D3: The Accelerometer, Low-pass filter and Magnitude filtercomponents deployed on the sensor and the other componentson the server.
• D4: All components except the Step Detector component deployedon the sensor.
• D5: Highest CPU load on the sensor by having all the componentsdeployed on the sensor and no communication cost between thesensor and the server.
Note that each deployment Dx represents the joint resource consumptionand variability of the components deployed on the sensor. Examplesof non-Pareto-optimal solutions include a.o. a deployment with theLow-Pass Filter and Peak Detector components on the server and theAccelerometer, Magnitude Filter and Step Detector components on thesensor. This mixed deployment causes a high communication cost.
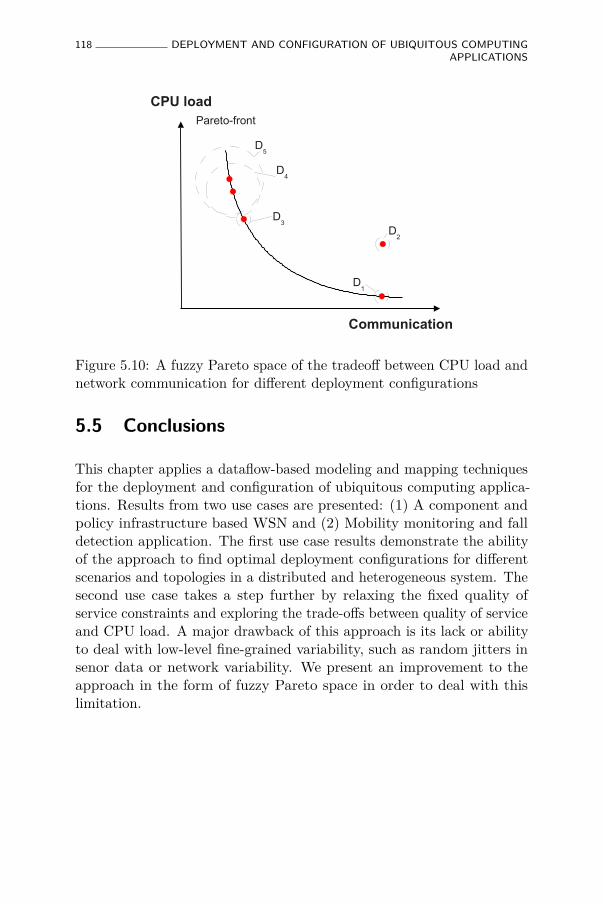
118 DEPLOYMENT AND CONFIGURATION OF UBIQUITOUS COMPUTINGAPPLICATIONS
Pareto-front
CPU load
Communication
D1
D2
D5
D3
D4
Figure 5.10: A fuzzy Pareto space of the tradeoff between CPU load andnetwork communication for different deployment configurations
5.5 Conclusions
This chapter applies a dataflow-based modeling and mapping techniquesfor the deployment and configuration of ubiquitous computing applica-tions. Results from two use cases are presented: (1) A component andpolicy infrastructure based WSN and (2) Mobility monitoring and falldetection application. The first use case results demonstrate the abilityof the approach to find optimal deployment configurations for differentscenarios and topologies in a distributed and heterogeneous system. Thesecond use case takes a step further by relaxing the fixed quality ofservice constraints and exploring the trade-offs between quality of serviceand CPU load. A major drawback of this approach is its lack or abilityto deal with low-level fine-grained variability, such as random jitters insenor data or network variability. We present an improvement to theapproach in the form of fuzzy Pareto space in order to deal with thislimitation.
Chapter 6
Conclusion and future work
This chapter concludes the research presented in the thesis and proposesdirections for future research. Section 6.1 summarizes the contributionsof the thesis. Section 6.2 highlights some important lessons learned fromthe research. Section 6.3 presents some critical reflections and section6.4 proposes directions for future work.
6.1 Recapitulating the contributions
In this thesis we present dataflow-inspired techniques for the developmentand execution of parallel and distributed programs. We apply thesetechniques in real world use cases and validate them. This sectionsummarizes the major contributions of the dissertation.
Contribution 1: Parallel stencil operation using dynamic task graphs
The first contribution of this thesis is the modeling and programmingof a kernel commonly used in high performance computing applications,using a dataflow centric approach. Chapter 3 presents an implementationof parallel stencil operations using dynamic task graphs. Two benchmarkapplications are used for the evaluation of the approach and the resultsare compared to the state-of-the-art stencil compilers Pluto [15] and
119
120 CONCLUSION AND FUTURE WORK
Pochoir [126]. Avoiding global barriers and using point-to-point non-blocking synchronization mechanisms results in a reduction in spin-waiting times of the processors. Reduction in total synchronizationoverhead by factors of fifty and five compared to Pluto and Pochoirrespectively, are recorded on a forty-core machine. Furthermore, theresults show that the dynamic task graph based implementation scalesbetter than the state-of-the-art.
Contribution 2: Design-time exploration of Pareto optimal mappingsfor embedded applications
The second contribution is the improvement of scheduling and memorymanagement of data programs. Chapter 4 presents a design-timeco-exploration technique that schedules tasks on processors, dataobjects on the memories and data transfers on the interconnect. Theinter-dependencies between the three different types of schedules areincorporated in the exploration models. Two use cases are utilized tostudy the effects of horizontal and vertical coupling. Horizontal couplingis realized by modeling the inter-dependencies between different aspectsof mapping i.e. memory, communication and computation. Verticalcoupling is realized by modeling inter-dependencies within a domain, e.g.,the inter-dependencies between buffer sizes and scratchpad allocations.Our results for the two real-life application use-cases show significant (atleast 20%) improvement with horizontal or vertical coupling.
Contribution 3: Dataflow centric component deployment for ubiqui-tous computing applications
The third contribution is applying a dataflow based methodology forthe deployment and configuration of component based applications inubiquitous environments. Exploration results for two use cases arepresented: (1) Component and policy infrastructure based WSN and (2)mobility monitoring and fall detection application. The first use casedemonstrates the ability of the approach to find optimal deploymentconfigurations for different scenarios and topologies in a distributed andheterogeneous system. The second use case explores the functional/non-
IMPORTANT LESSONS LEARNED 121
functional tradeoff between quality-of-service and CPU load for differentdeployment configurations.
6.2 Important lessons learned
This section summarizes some important lessons learned during thecourse of the research for this dissertation.
Dataflow models as enablers for efficient parallel programming
The benchmarks and use-cases studied in this thesis show that dataflowbased programming models and languages provide efficient solutions forprogramming, memory management, scheduling and synchronization ofparallel programs. This success is attributed to some basic properties ofthe model of computation:
• Implicit parallelism: Programmers only specify the functionality ofthe application and are not required to explicitly specify parallelism.Parallelism is an intrinsic property of the programming model.
• Locality of effects allow a race condition free execution of dataflowgraphs, regardless of the choice of the scheduling policy.
• Schedulability and memory buffer size analysis at design timesimplifies execution of dataflow models.
• Data-driven coordination of execution: The coordination betweenconcurrent parts of a program is through the flow of data andthe programmer is not burdened with the specification of explicitsynchronization mechanisms.
Essentiality of domain knowledge for optimization
We observe that domain knowledge is essential in order to exploit availableoptimization opportunities using dataflow models. Two examples fromcontributions 1 & 2 are discussed below:
122 CONCLUSION AND FUTURE WORK
• Dynamic task graphs are used to program stencil operations, hencethe synchronization overhead is reduced. However, only reducingthe synchronization overhead of stencil operation does not result ina very significant speed up because the algorithm is bottle-neckedby memory bandwidth. Domain knowledge is required to identifyand address this bottleneck, i.e. through time-tiling. A significantspeed-up by using dynamic task graphs is only observed once thememory bandwidth bottleneck is removed.
• We use a dataflow model for mapping a legacy H.264 decoderapplication on an MPSoC. However, deep understanding of theapplication domain is required in order to partition the applicationand derive a dataflow model. The quality of the mapping solutionsdepends on the partitioning of the application; a badly partitionedapplication cannot be efficiently mapped. Domain knowledge isthus essential for the efficient mapping of the application.
Conservative use of worst-case estimates
For highly dynamic applications, the variability of non-functionalproperties is sometimes too high for a given deployment configuration,prohibiting worst-case estimates. For example, in the mobility andfitness monitoring application use case in chapter 5, the variability ofsome components is up to ±80% from the average for the communication(in kB/s) and ±94% from the average for computation (ms of CPU time).Therefore, for non-safety critical soft-real time applications, we proposea fuzzy Pareto curve based methodology instead of worst-case estimates.
6.3 Critical reflections
One of the main goals of this thesis is to strengthen the case for dataflowmodels as generic solutions for parallel and distributed computing. A lotmore is required to fully achieve this goal. Not only the methodologiesmust be applied in a number of other sub-domains of parallel anddistributed computing but also more use cases in each of these sub
CRITICAL REFLECTIONS 123
domains (i.e. high performance computing, embedded systems andubiquitous systems) must be evaluated.
According to the execution semantics of pure dataflow models, processesor tasks go through explicit read-execute-write sequences. On aVon Neumann computer, strict adherence to these semantics createsunnecessary traffic, especially on a shared memory computer. Wecircumvent this problem by letting processors communicate with eachother by passing address pointers, if the data is located in a physicallyshared memory. As a result, our implementations do not strictly complywith execution semantics of pure dataflow models.
The following sub-sections provide some critical reflections structuredaccording to the contributions.
6.3.1 Parallel stencil operations using dynamic task graphs
Dimensions and order of stencil operations
Chapter 3 presents results for two benchmarks based on two-dimensional5pt. and 9pt. stencil operations. However, many high-performancecomputing applications use higher order stencil operations possibly withmore dimensions. These applications may have different performancebottlenecks, e.g., a tri-cubic interpolation has a FLOPS/byte ratio of7.95 and the bottleneck is computation rather than memory bandwidthor latency. Even though using dynamic task graphs would reduce thesynchronization overhead for these stencil operations as well, a significantperformance improvement might not be achieved unless other bottlenecksare removed.
Static and regular grids
The benchmarks used for stencil operations in chapter 3 have regular andstatic grids. However, some high-performance computing applicationsuse stencil operations on grids with irregular resolutions, e.g., higherresolutions in regions of specific interest. Other applications adapt theresolution of different regions at runtime. Some techniques presented in
124 CONCLUSION AND FUTURE WORK
chapter 3 (e.g. time-tiling and memory de-allocation scheme) are notdirectly applicable in these situations.
Distribution across multiple nodes
HPC applications often execute while distributed over networks ofmultiple nodes. The tradeoffs of this distribution (e.g. ratio ofcomputational power versus interconnect bandwidth) are very different.Our technique improves the deployment and execution of stenciloperations on parallel processors within a single node. Even thougha similar technique may be used for deployment of the application acrossmultiple nodes, it is not been experimentally evaluated.
6.3.2 Design-time exploration of Pareto optimal mappings forembedded applications
Increase in the computational complexity
Chapter 4 presents tightly coupled mapping of embedded applicationson MPSoC. However, tightly coupled mapping requires that the inter-dependencies between computation, communication and memory areincorporated in the exploration models. A side effect of includingthese inter-dependencies in the exploration models is an increase in thecomputational complexity, thus a decrease in the speed of exploration.
Evaluation of the runtime manager
A runtime manager is required to orchestrate, processing, data andcommunication on the MPSoC. The overall performance of the systemdepends on the quality of the mapping solutions and the overhead ofthe runtime manager. In this thesis, only the quality of the mappingsolutions is evaluated and the overhead of the runtime manager is notevaluated.
FUTURE WORK 125
6.3.3 Dataflow centric component deployment for ubiquitouscomputing applications
Closed world assumptions
The methodology presented in chapter 5 relies on closed worldassumptions. Most real-life ubiquitous computing systems are open-ended, i.e., devices join and exit the system on the fly. Even though it istheoretically possible to model this behavior with scenarios, it causes anexplosion in the number of scenarios that have to be explored. Therefore,more proactive and dynamic runtime solutions may be required to dealwith these situations.
6.4 Future work
This section discusses directions for future research.
6.4.1 Dynamic task graph based stencil operations for appli-cations with adaptive mesh refinement
Adaptive mesh refinement (AMR) is employed in a number of scientificand engineering applications that use stencil operations. In adaptive meshrefinement [21] the resolution of different areas of the grid may change atruntime. This complicates domain partitioning and workload distributionfor parallelized implementations. Furthermore, usual optimizationtechniques (e.g. time-tiling) for stencil operations are not directlyapplicable and further research is required to apply them. Although itis a non-trivial extension, the ability of dynamic task graphs to expressdynamism makes them suitable for programming AMR based applications.Therefore, it is promising to investigate the applicability of dynamic taskgraphs for AMR applications.

126 CONCLUSION AND FUTURE WORK
6.4.2 Mapping embedded real-time applications on network-on-chips
Network-on-Chip (NoC) is an evolution of the multi-core system on chip.In a NoC, modules such as processors, memories and other specializedblocks exchange data using a ‘network’ sub-system. The network sub-systems usually consist of numerous point-to-point data links and switches(router). Unlike a simple bus-based system, the communication overthis network is usually multi-hop. By including network communicationmodels in the co-exploration technique presented in chapter 4, it ispossible to extend it for mapping applications to Networks-on-Chips.
Glossary and acronyms
Base stationa fixed communications infrastructure that is part of a wirelessnetwork. It relays information to and from wireless nodes enablingthem to work within a local area .
Component based applicationSoftware applications developed by composing software modules(components) that package together related functions and havedefined interfaces.
Constraint based schedulingA technique where scheduling is defined as an optimization problemsuch that a set of constraints have to be satisfied.
CoreRefers to a single processor typically in multi-processor system.
DeploymentDistribution of artifacts in a distributed systems.
DiscretizationThe process of transferring continuous models and equations intodiscrete counterparts.
Distributed systema software system in which components located on networkedcomputers communicate and coordinate their actions by passingmessages .
127
128 Glossary
DomainThe set of input or argument values for which the function isdefined.
DSPDigital signal processor.
Energy harvestingA process by which energy is derived from the environment.
GPUGraphics processing unit.
H.264A video compression format.
Heterogeneous coresCPU cores with different characteristics, e.g., having differentarchitecture, frequency, computational power or energy efficiency.
Hyper-trapezoidA trapezoid extended in the time domain.
InterconnectCommunication infrastructure for example network or bus.
MappingProcess of deployment and scheduling software applications onhardware platforms.
Memory hierarchyA hierarchically organized memory sub-system, usually with smallerand faster memories close to the processors.
MicrocontrollerA small computer on a single integrated circuit containinga processor core, memory, and programmable input/outputperipherals .
Glossary 129
MPSoCMulti-processor system on chip.
NomadicPertaining to the characteristic of nomads, e.g. mobility.
Non-affineA function that can not be expressed in the form of f(~x) = A~x+B.
Open-endedNot restrained by definite limits, restrictions, or structure.
Pareto optimal solutionsA set of solutions such that every solution in the set is better fromall other solutions with respect to at least one criterion.
Power modeA mode of operation with specific electrical characteristics, typicallymodes that deliver higher performance require more input power.
Real-time systemsSystems that must guarantee response within strict time constraints(deadlines).
ReconfigurationTo change the arrangement of components or elements in aparticular form, figure, or combination.
RFIDRadio-frequency identification (RFID) is the wireless non-contactuse of radio-frequency electromagnetic fields to transfer data, forthe purposes of automatically identifying and tracking tags attachedto objects.
RISCReduced instructions set computing.
ScratchpadSoftware managed small and fast memory, similar to a cache in

130 Glossary
latency and bandwidth but without a dedicated hardware cachecontroller.
SIMDSingle instruction multiple data.
Spatio-temporal scheduleA plan of when and where (time and space) certain activities willtake place.
Spin-waitingA technique in which a process repeatedly checks to see if a conditionis true, e.g., if lock is available or not.
Stochastichaving a random probability distribution or pattern that may beanalyzed statistically but may not be predicted precisely.
Streaming applicationsApplications that stream data from a server; e.g, audio/videostreaming.
ThroughputA measure of the flow of data, e.g. through a network of nodes ora pipeline of processes.
TimestepA small increment in time for example when simulating a physicalphenomonon.
TrapezoidA convex quadrilateral with at least one pair of parallel sides.
Ubiquitous computing (ubicomp)an advanced computing concept where computing is made to appeareverywhere and anywhere .
Virtual machineA software-based emulation of a computer, that executes programslike a physical machine but limited to the resources and abstractionsprovided by the virtual machine.

Glossary 131
VLIWVery long instruction word.
Wireless sensor network (WSN)A spatially distributed network of autonomous sensors; forexample to monitor physical or environmental conditions, suchas temperature, sound, pressure, etc. and to cooperatively passtheir data through the network to a main location.

Bibliography
[1] R. K. Abbott and H. Garcia-Molina. “Scheduling Real-timeTransactions: A Performance Evaluation”. In: ACM Trans.Database Syst. 17.3 (Sept. 1992), pp. 513–560. issn: 0362-5915.doi: 10.1145/132271.132276. url: http://doi.acm.org/10.1145/132271.132276.
[2] M. Ade, R. Lauwereins, and J. Peperstraete. “Data MemoryMinimisation For Synchronous Data Flow Graphs Emulated OnDSP-FPGA Targets”. In: Design Automation Conference, 1997.Proceedings of the 34th. 1997, pp. 64 –69. doi: 10.1109/DAC.1997.597118.
[3] G. A. Agha. “Actors: A Model of Concurrent Computationin Distributed Systems (Parallel Processing, Semantics, Open,Programming Languages, Artificial Intelligence)”. AAI8520855.PhD thesis. Ann Arbor, MI, USA, 1985.
[4] K. Agrawal, C. Leiserson, and J. Sukha. “Executing task graphsusing work-stealing”. In: Parallel Distributed Processing (IPDPS),2010 IEEE International Symposium on. 2010, pp. 1 –12. doi:10.1109/IPDPS.2010.5470403.
[5] F. Angiolini, L. Benini, and A. Caprara. “An efficient profile-basedalgorithm for scratchpad memory partitioning”. In: Computer-Aided Design of Integrated Circuits and Systems, IEEE Trans-actions on 24.11 (2005), pp. 1660–1676. issn: 0278-0070. doi:10.1109/TCAD.2005.852299.
[6] M. Idrissi Aouad and O. Zendra. “A Survey of Scratch-PadMemory Management Techniques for low-power and -energy”.
133
134 BIBLIOGRAPHY
In: 2nd ECOOP Workshop on Implementation, Compilation, Op-timization of Object-Oriented Languages, Programs and Systems(ICOOOLPS’2007). ECOOP. Berlin Allemagne, 2007, pp. 31–38.
[7] J. Armstrong, R. Virding, C. Wikström, and M. Williams.Concurrent Programming in ERLANG. Prentice Hall, 1996.
[8] C. Augonnet, S. Thibault, R. Namyst, and P.-A. Wacrenier.“StarPU: a unified platform for task scheduling on heterogeneousmulticore architectures”. In: Concurrency and Computation:Practice and Experience 23.2 (2011), pp. 187–198. issn: 1532-0634. doi: 10.1002/cpe.1631. url: http://dx.doi.org/10.1002/cpe.1631.
[9] O. Avissar, R. Barua, and D. Stewart. “An Optimal MemoryAllocation Scheme for Scratch-pad-based Embedded Systems”.In: ACM Trans. Embed. Comput. Syst. 1.1 (Nov. 2002), pp. 6–26.issn: 1539-9087. doi: 10 . 1145 / 581888 . 581891. url: http ://doi.acm.org/10.1145/581888.581891.
[10] E. Ayguade, N. Copty, A. Duran, J. Hoeflinger, Y. Lin, F.Massaioli, X. Teruel, P. Unnikrishnan, and G. Zhang. “The Designof OpenMP Tasks”. In: Parallel and Distributed Systems, IEEETransactions on 20.3 (2009), pp. 404–418. issn: 1045-9219. doi:10.1109/TPDS.2008.105.
[11] T. P. Baker. “An Analysis of EDF Schedulability on a Multiproces-sor”. In: IEEE Transactions on Parallel and Distributed Systems(2005). issn: 1045-9219. doi: 10.1109/TPDS.2005.88. url: http://doi.ieeecomputersociety.org/10.1109/TPDS.2005.88.
[12] N. Bambha and S. Bhattacharyya. “Communication strategies forshared-bus embedded multiprocessors”. In: 2005.
[13] R. Banakar, S. Steinke, B. Lee, M. Balakrishnan, and P. Marwedel.“Scratchpad memory: a design alternative for cache on-chipmemory in embedded systems”. In: Estes Park, Colorado, USA,2002, pp. 73–77.
[14] R. Banakar, S. Steinke, B.-S. Lee, M. Balakrishnan, and P.Marwedel. “Scratchpad memory: design alternative for cache on-chip memory in embedded systems”. In: Proceedings of the tenthinternational symposium on Hardware/software codesign. CODES
BIBLIOGRAPHY 135
’02. Estes Park, Colorado: ACM, 2002, pp. 73–78. isbn: 1-58113-542-4. doi: http://doi.acm.org/10.1145/774789.774805.url: http://doi.acm.org/10.1145/774789.774805.
[15] V. Bandishti, I. Pananilath, and U. Bondhugula. “Tiling stencilcomputations to maximize parallelism”. In: Proceedings ofthe International Conference on High Performance Computing,Networking, Storage and Analysis. SC ’12. Salt Lake City, Utah:IEEE Computer Society Press, 2012, 40:1–40:11. isbn: 978-1-4673-0804-5.
[16] S. Bandyopadhyay. “Automated Memory Allocation of Actor Codeand Data Buffer in Heterochronous DataflowModels to ScratchpadMemory”. MA thesis. EECS Department, University of California,Berkeley, 2006. url: http://www.eecs.berkeley.edu/Pubs/TechRpts/2006/EECS-2006-105.html.
[17] S. Bandyopadhyay, T. H. Feng, H. D. Patel, and E. A. Lee.A Scratchpad Memory Allocation Scheme for Dataflow Models.Tech. rep. UCB/EECS-2008-104. EECS Department, Universityof California, Berkeley, 2008. url: http://www.eecs.berkeley.edu/Pubs/TechRpts/2008/EECS-2008-104.html.
[18] S. K. Baruah. “Scheduling periodic tasks on uniform multiproces-sors”. In: Inf. Process. Lett. (2001).
[19] M. M. Baskaran, U. Bondhugula, S. Krishnamoorthy, J. Ramanu-jam, A. Rountev, and P. Sadayappan. “A compiler frameworkfor optimization of affine loop nests for gpgpus”. In: Proceedingsof the 22nd annual international conference on Supercomputing.ICS ’08. Island of Kos, Greece: ACM, 2008, pp. 225–234. isbn:978-1-60558-158-3. doi: 10.1145/1375527.1375562. url: http://doi.acm.org/10.1145/1375527.1375562.
[20] L. Bathen, N. Dutt, and S. Pasricha. “A framework for memory-aware multimedia application mapping on chip-multiprocessors”.In: ESTImedia 2008. 2008.
[21] M. J. Berger and J. Oliger. “Adaptive mesh refinement forhyperbolic partial differential equations”. In: Journal of Com-putational Physics 53.3 (1984), pp. 484 –512. issn: 0021-9991. doi:10.1016/0021-9991(84)90073-1.
136 BIBLIOGRAPHY
[22] B. Bhattacharya and S. Bhattacharyya. “Quasi-static scheduling ofreconfigurable dataflow graphs for DSP systems”. In: Rapid SystemPrototyping, 2000. RSP 2000. Proceedings. 11th InternationalWorkshop on. 2000, pp. 84–89. doi: 10.1109/IWRSP.2000.855200.
[23] S. S. Bhattacharyya, G. Brebner, J. W. Janneck, J. Eker, C. vonPlaten, M. Mattavelli, and M. Raulet. “OpenDF: a dataflow toolsetfor reconfigurable hardware and multicore systems”. In: SIGARCHComput. Archit. News 36 (5 2009), pp. 29–35. issn: 0163-5964.doi: http://doi.acm.org/10.1145/1556444.1556449. url:http://doi.acm.org/10.1145/1556444.1556449.
[24] Z. Bhatti, D. Preuveneers, Y. Berbers, N. Miniskar, and R. Wuyts.“SAMOSA: Scratchpad aware mapping of streaming applications”.In: System on Chip (SoC), 2011 International Symposium on.2011, pp. 48 –55. doi: 10.1109/ISSOC.2011.6089687.
[25] G. Bilsen, M. Engels, R. Lauwereins, and J. Peperstraete. “Cycle-static dataflow”. In: Signal Processing, IEEE Transactions on 44.2(1996), pp. 397–408. issn: 1053-587X. doi: 10.1109/78.485935.
[26] M. Bister, Y. Taeymans, and J. Cornelis. “Automatic segmentationof cardiac MR images”. In: Computers in cardiology (1989),pp. 215–218.
[27] R. D. Blumofe, C. F. Joerg, B. C. Kuszmaul, C. E. Leiserson,K. H. Randall, and Y. Zhou. “Cilk: an efficient multithreadedruntime system”. In: Proceedings of the fifth ACM SIGPLANsymposium on Principles and practice of parallel programming.PPOPP ’95. Santa Barbara, California, United States: ACM, 1995,pp. 207–216. isbn: 0-89791-700-6. doi: 10.1145/209936.209958.
[28] A. Bonfietti, L. Benini, M. Lombardi, and M. Milano. “An efficientand complete approach for throughput-maximal SDF allocationand scheduling on multi-core platforms”. In: DATE ’10.
[29] S. Borkar. “Design challenges of technology scaling”. In: Micro,IEEE 19.4 (1999), pp. 23–29. issn: 0272-1732. doi: 10.1109/40.782564.
BIBLIOGRAPHY 137
[30] S. Borkar and A. A. Chien. “The Future of Microprocessors”. In:Commun. ACM 54.5 (May 2011), pp. 67–77. issn: 0001-0782. doi:10.1145/1941487.1941507. url: http://doi.acm.org/10.1145/1941487.1941507.
[31] I. Buck, T. Foley, D. Horn, J. Sugerman, K. Fatahalian, M.Houston, and P. Hanrahan. “Brook for GPUs: stream computingon graphics hardware”. In: SIGGRAPH ’04: ACM SIGGRAPH2004 Papers. Los Angeles, California: ACM, 2004, pp. 777–786.doi: http://doi.acm.org/10.1145/1186562.1015800.
[32] J. Buck, S. Ha, E. A. Lee, and D. G. Messerschmitt. “Readings inhardware/software co-design”. In: ed. by G. De Micheli, R. Ernst,and W. Wolf. Norwell, MA, USA: Kluwer Academic Publishers,2002. Chap. Ptolemy: a framework for simulating and prototypingheterogeneous systems, pp. 527–543. isbn: 1-55860-702-1. url:http://dl.acm.org/citation.cfm?id=567003.567050.
[33] D. R. Butenhof. Programming with POSIX threads. Addison-Wesley Professional, 1997.
[34] W. Che and K. S. Chatha. “Scheduling of Synchronous Data FlowModels Onto Scratchpad Memory-based Embedded Processors”.In: ACM Trans. Embed. Comput. Syst. 13.1s (Dec. 2013), 30:1–30:25. issn: 1539-9087. doi: 10.1145/2536747.2536752. url:http://doi.acm.org/10.1145/2536747.2536752.
[35] W. Che and K. Chatha. “Scheduling of synchronous data flowmodels on scratchpad memory based embedded processors”. In:Computer-Aided Design (ICCAD), 2010 IEEE/ACM Interna-tional Conference on. 2010, pp. 205 –212. doi: 10.1109/ICCAD.2010.5654150.
[36] J.-J. Chen and C.-S. Shih. “Energy-efficient Real-time TaskScheduling in Multiprocessor DVS Systems”. In: ASP-DAC.Yokohama, Japan, 2007, pp. 342–349. doi: 10.1109/ASPDAC.2007.358009. url: http://dx.doi.org/10.1109/ASPDAC.2007.358009.
[37] M. Christen, O. Schenk, and H. Burkhart. “PATUS: A CodeGeneration and Autotuning Framework for Parallel IterativeStencil Computations on Modern Microarchitectures”. In: Parallel
138 BIBLIOGRAPHY
Distributed Processing Symposium (IPDPS), 2011 IEEE Interna-tional. 2011, pp. 676 –687. doi: 10.1109/IPDPS.2011.70.
[38] M. Christen, O. Schenk, E. Neufeld, P. Messmer, and H. Burkhart.“Parallel data-locality aware stencil computations on modernmicro-architectures”. In: Parallel Distributed Processing, 2009.IPDPS 2009. IEEE International Symposium on. 2009, pp. 1 –10.doi: 10.1109/IPDPS.2009.5161031.
[39] P Colella, D. Graves, T. Ligocki, D. Martin, D Modiano, D.Serafini, and B Van Straalen. Chombo Software Package for AMRApplications-Design Document. Tech. rep. Lawrence BerkeleyNational Laboratory, 2000.
[40] F. Commoner, A. Holt, S. Even, and A. Pnueli. “Marked directedgraphs”. In: Journal of Computer and System Sciences 5.5 (1971),pp. 511 –523. issn: 0022-0000. doi: http://dx.doi.org/10.1016/S0022-0000(71)80013-2. url: http://www.sciencedirect.com/science/article/pii/S0022000071800132.
[41] R. Courtland. “Intel strikes back [News]”. In: Spectrum, IEEE50.8 (2013), pp. –. issn: 0018-9235. doi: 10.1109/MSPEC.2013.6565547.
[42] L. Dagum and R. Menon. “OpenMP: An Industry-Standard APIfor Shared-Memory Programming”. In: Computing in Science andEngineering 5 (1998), pp. 46–55. issn: 1070-9924. doi: 10.1109/99.660313.
[43] A. Darte, Y. Robert, and F. Vivien. Scheduling and AutomaticParallelizationScheduling and Automatic Parallelization. 1st ed.Birkhäuser Boston, Mar. 2000. isbn: 0817641491.
[44] K. Datta, S. Kamil, S. Williams, L. Oliker, J. Shalf, and K. Yelick.“Optimization and Performance Modeling of Stencil Computationson Modern Microprocessors”. In: SIAM Rev. 51.1 (Feb. 2009),pp. 129–159. issn: 0036-1445. doi: 10.1137/070693199.
[45] K. Datta, M. Murphy, V. Volkov, S. Williams, J. Carter,L. Oliker, D. Patterson, J. Shalf, and K. Yelick. “Stencilcomputation optimization and auto-tuning on state-of-the-artmulticore architectures”. In: Proceedings of the 2008 ACM/IEEE
BIBLIOGRAPHY 139
conference on Supercomputing. SC ’08. Austin, Texas: IEEE Press,2008, 4:1–4:12. isbn: 978-1-4244-2835-9.
[46] R. P. Dick. “TGFF: task graphs for free”. In: CODES/CASHE’98. Seattle, Washington, United States, 1998. isbn: 0-8186-8442-9.
[47] A. Dominguez, S. Udayakumaran, and R. Barua. “Heap DataAllocation to Scratch-pad Memory in Embedded Systems”. In: J.Embedded Comput. 1.4 (Dec. 2005), pp. 521–540. issn: 1740-4460.url: http://dl.acm.org/citation.cfm?id=1233791.1233799.
[48] J. Eker and J. Janneck. Caltrop—Language report. TechnicalMemorandum. http://www.gigascale.org/caltrop. University ofCalifornia at Berkeley California, USA: Electronics Research Lab,Department of Electrical Engineering and Computer Sciences,2002.
[49] P. Eles, A. Doboli, P. Pop, and Z. Peng. “Scheduling with busaccess optimization for distributed embedded systems”. In: IEEETransactions on VLSI (2000).
[50] C. Erbas, S. Cerav-Erbas, and A. Pimentel. “Multiobjectiveoptimization and evolutionary algorithms for the applicationmapping problem in multiprocessor system-on-chip design”. In:Evolutionary Computation, IEEE Transactions on 10.3 (2006),pp. 358 –374. issn: 1089-778X. doi: 10.1109/TEVC.2005.860766.
[51] F. Ferrandi, P. L. Lanzi, C. Pilato, D. Sciuto, and A. Tumeo.“Ant colony heuristic for mapping and scheduling tasks andcommunications on heterogeneous embedded systems”. In: Trans.Comp.-Aided Des. Integ. Cir. Sys. 29 (6 2010), pp. 911–924. issn:0278-0070. doi: http://dx.doi.org/10.1109/TCAD.2010.2048354. url: http://dx.doi.org/10.1109/TCAD.2010.2048354.
[52] M. H. Foroozannejad, M. Hashemi, T. L. Hodges, and S. Ghiasi.“Look into details: the benefits of fine-grain streaming bufferanalysis”. In: Proceedings of the ACM SIGPLAN/SIGBED 2010conference on Languages, compilers, and tools for embeddedsystems. LCTES ’10. Stockholm, Sweden: ACM, 2010, pp. 27–36.isbn: 978-1-60558-953-4. doi: http://doi.acm.org/10.1145/1755888.1755894. url: http://doi.acm.org/10.1145/1755888.1755894.
140 BIBLIOGRAPHY
[53] M. Frigo and V. Strumpen. “Cache oblivious stencil computations”.In: Proceedings of the 19th annual international conference onSupercomputing. ICS ’05. Cambridge, Massachusetts: ACM, 2005,pp. 361–366. isbn: 1-59593-167-8. doi: 10.1145/1088149.1088197.
[54] G. Gao, R. Govindarajan, and P. Panangaden. “Well-behaveddataflow programs for DSP computation”. In: Acoustics, Speech,and Signal Processing, 1992. ICASSP-92., 1992 IEEE Inter-national Conference on. Vol. 5. 1992, 561–564 vol.5. doi:10.1109/ICASSP.1992.226558.
[55] M. Gardner. “Mathematical games: The fantastic combinations ofJohn Conway’s new solitaire game “life””. In: Scientific American223.4 (1970), pp. 120–123.
[56] Gecode: Generic constraint development environment. url: http://www.gecode.org.
[57] M. Geilen, T. Basten, and S. Stuijk. “Minimising buffer require-ments of synchronous dataflow graphs with model checking”. In:Design Automation Conference, 2005. Proceedings. 42nd. 2005,pp. 819 –824. doi: 10.1109/DAC.2005.193928.
[58] M. Geilen and T. Basten. “Requirements on the Execution ofKahn Process Networks”. English. In: Programming Languagesand Systems. Ed. by P. Degano. Vol. 2618. Lecture Notes inComputer Science. Springer Berlin Heidelberg, 2003, pp. 319–334.isbn: 978-3-540-00886-6. doi: 10.1007/3-540-36575-3_22. url:http://dx.doi.org/10.1007/3-540-36575-3_22.
[59] M. Geilen, T. Basten, and S. Stuijk. “Minimising buffer require-ments of synchronous dataflow graphs with model checking”. In:Proceedings of the 42nd annual Design Automation Conference.DAC ’05. Anaheim, California, USA: ACM, 2005, pp. 819–824.isbn: 1-59593-058-2. doi: http://doi.acm.org/10.1145/1065579.1065796. url: http://doi.acm.org/10.1145/1065579.1065796.
[60] P. Gelsinger. “Microprocessors for the new millennium: Chal-lenges, opportunities, and new frontiers”. In: Solid-State CircuitsConference, 2001. Digest of Technical Papers. ISSCC. 2001 IEEE
BIBLIOGRAPHY 141
International. 2001, pp. 22–25. doi: 10.1109/ISSCC.2001.912412.
[61] S. V. Gheorghita and F. Catthoor. “System-scenario-based designof dynamic embedded systems”. In: ACM Trans. Des. Autom.Electron. Syst. 14.1 (2009).
[62] S. V. Gheorghita, M. Palkovic, J. Hamers, A. Vandecappelle, S.Mamagkakis, T. Basten, L. Eeckhout, H. Corporaal, F. Catthoor,F. Vandeputte, and K. D. Bosschere. “System-scenario-baseddesign of dynamic embedded systems”. In: ACM Trans. Des.Autom. Electron. Syst. 14 (1 2009), 3:1–3:45. issn: 1084-4309.doi: http://doi.acm.org/10.1145/1455229.1455232. url:http://doi.acm.org/10.1145/1455229.1455232.
[63] P. Ghysels, P. Kłosiewicz, and W. Vanroose. “Improving thearithmetic intensity of multigrid with the help of polynomialsmoothers”. In: Numerical Linear Algebra with Applications 19.2(2012), pp. 253–267. issn: 1099-1506. doi: 10.1002/nla.1808.
[64] J. Gladigau, A. Gerstlauer, C. Haubelt, M. StreubuÌ^ andhr,and J. Teich. “A system-level synthesis approach from formalapplication models to generic bus-based MPSoCs”. In: EmbeddedComputer Systems (SAMOS), 2010 International Conference on.2010, pp. 118 –125. doi: 10.1109/ICSAMOS.2010.5642076.
[65] R. Govindarajan, G. R. Gao, and P. Desai. “Minimizing BufferRequirements under Rate-Optimal Schedule in Regular DataflowNetworks”. In: J. VLSI Signal Process. Syst. 31 (3 2002), pp. 207–229. issn: 0922-5773. doi: 10 . 1023 / A : 1015452903532. url:http://portal.acm.org/citation.cfm?id=598549.598651.
[66] A. Heinecke and M. Bader. “Parallel Matrix Multiplication Basedon Space-filling Curves on Shared Memory Multicore Platforms”.In: Proceedings of the 2008 Workshop on Memory Access on FutureProcessors: A Solved Problem? MAW ’08. Ischia, Italy: ACM, 2008,pp. 385–392. isbn: 978-1-60558-091-3. doi: 10.1145/1366219.1366223. url: http://doi.acm.org/10.1145/1366219.1366223.
[67] W. Heirman, D. Stroobandt, N. Miniskar, R. Wuyts, and F.Catthoor. “PinComm: Characterizing Intra-application Commu-nication for the Many-Core Era”. In: Parallel and Distributed
142 BIBLIOGRAPHY
Systems (ICPADS), 2010 IEEE 16th International Conference on.2010, pp. 500 –507. doi: 10.1109/ICPADS.2010.56.
[68] W. Heirman, D. Stroobandt, N. Miniskar, R. Wuyts, and F.Catthoor. “PinComm: Characterizing Intra-application Commu-nication for the Many-Core Era”. In: Parallel and DistributedSystems (ICPADS), 2010 IEEE 16th International Conference on.2010, pp. 500 –507. doi: 10.1109/ICPADS.2010.56.
[69] T. C. Hu. “Parallel Sequencing and Assembly Line Problems”.English. In: Operations Research 9.6 (1961), pp. 841–848. issn:0030364X. url: http://www.jstor.org/stable/167050.
[70] Intel Corporation. Threading Building Blocks Reference Manual[online]. url: http://threadingbuildingblocks.org/documentation.
[71] J. R. Jackson. Scheduling a production line to minimize maximumtardiness. Tech. rep. DTIC Document, 1955.
[72] A. Jantsch. Modeling Embedded Systems and SoC’s: Concurrencyand Time in Models of Computation (Systems on Silicon). 1st ed.Morgan Kaufmann, June 2003. isbn: 1558609253.
[73] T. Johnson, T. A. Davis, and S. M. Hadfield. “A concurrentdynamic task graph”. In: Parallel Computing 22.2 (1996), pp. 327–333. issn: 0167-8191. doi: 10.1016/0167-8191(95)00061-5.
[74] S. Kamil, C. Chan, L. Oliker, J. Shalf, and S. Williams. “An auto-tuning framework for parallel multicore stencil computations”. In:Parallel Distributed Processing (IPDPS), 2010 IEEE InternationalSymposium on. 2010, pp. 1 –12. doi: 10.1109/IPDPS.2010.5470421.
[75] M. Kandemir, J. Ramanujam, M. Irwin, N. Vijaykrishnan, I.Kadayif, and A. Parikh. “Dynamic management of scratch-pad memory space”. In: Design Automation Conference, 2001.Proceedings. 2001, pp. 690–695. doi: 10.1109/DAC.2001.156226.
[76] K. Kennedy and J. R. Allen. Optimizing Compilers for ModernArchitectures: A Dependence-based Approach. San Francisco, CA,USA: Morgan Kaufmann Publishers Inc., 2002. isbn: 1-55860-286-0.
BIBLIOGRAPHY 143
[77] W. Kim and M. Voss. “Multicore Desktop Programming withIntel Threading Building Blocks”. In: Software, IEEE 28.1 (2011),pp. 23 –31. issn: 0740-7459. doi: 10.1109/MS.2011.12.
[78] P. Laborie. “IBM ILOG CP Optimizer for Detailed SchedulingIllustrated on Three Problems”. In: Integration of AI andOR Techniques in Constraint Programming for CombinatorialOptimization Problems. Ed. by W.-J. van Hoeve and J. Hooker.Vol. 5547. Lecture Notes in Computer Science. Springer Berlin /Heidelberg, 2009, pp. 148–162. url: http://dx.doi.org/10.1007/978-3-642-01929.
[79] K. Lagerstrom. “Design and implementation of an MP3 decoder- M.Sc Thesis”. PhD thesis. Chalmers University of Technology,Sweden, 2001.
[80] J. Laudon and D. Lenoski. “The SGI Origin: a ccNUMA highlyscalable server”. In: SIGARCH Comput. Archit. News 25.2 (May1997), pp. 241–251. issn: 0163-5964. doi: 10.1145/384286.264206. url: http://doi.acm.org/10.1145/384286.264206.
[81] J. Laurent, N. Julien, E. Senn, and E. Martin. “Functional LevelPower Analysis: An Efficient Approach for Modeling the PowerConsumption of Complex Processors”. In: Proceedings of theconference on Design, automation and test in Europe - Volume1. DATE ’04. Washington, DC, USA: IEEE Computer Society,2004, pp. 10666–. isbn: 0-7695-2085-5. url: http://portal.acm.org/citation.cfm?id=968878.968987.
[82] J. Laurent, N. Julien, E. Senn, and E. Martin. “Functional LevelPower Analysis: An Efficient Approach for Modeling the PowerConsumption of Complex Processors”. In: Design, Automationand Test in Europe Conference and Exhibition 1 (2004), p. 10666.issn: 1530-1591. doi: http://doi.ieeecomputersociety.org/10.1109/DATE.2004.1268921.
[83] E. A. Lee and D. G. Messerschmitt. “Synchronous data flow”.In: Proceedings of the IEEE 75.9 (1987), pp. 1235 –1245. issn:0018-9219. doi: 10.1109/PROC.1987.13876.
[84] E. A. Lee. “The Problem with Threads”. In: Computer 39 (2006),pp. 33–42. issn: 0018-9162. doi: http://doi.ieeecomputersociety.org/10.1109/MC.2006.180.
144 BIBLIOGRAPHY
[85] E. A. Lee and D. G. Messerschmitt. “Static scheduling ofsynchronous data flow programs for digital signal processing”.In: IEEE Trans. Comput. 36 (1 1987), pp. 24–35. issn: 0018-9340.doi: http://dx.doi.org/10.1109/TC.1987.5009446. url:http://dx.doi.org/10.1109/TC.1987.5009446.
[86] C. L. Liu and J. W. Layland. “Scheduling Algorithms forMultiprogramming in a Hard-Real-Time Environment”. In:J. ACM 20.1 (Jan. 1973), pp. 46–61. issn: 0004-5411. doi:10.1145/321738.321743. url: http://doi.acm.org/10.1145/321738.321743.
[87] H. Lu, J. Yang, Z. Liu, N. D. Lane, T. Choudhury, and A. T.Campbell. “The Jigsaw continuous sensing engine for mobilephone applications”. In: Proceedings of the 8th ACM Conferenceon Embedded Networked Sensor Systems. SenSys ’10. Zürich,Switzerland: ACM, 2010, pp. 71–84. isbn: 978-1-4503-0344-6. doi:10.1145/1869983.1869992.
[88] D. Ludovici, A. Strano, G. N. Gaydadjiev, L. Benini, and D.Bertozzi. “Design space exploration of a mesochronous link forcost-effective and flexible GALS NOCs”. In: DATE. 2010.
[89] M. Lukasiewycz, M. Streubühr, M. Glaß, C. Haubelt, andJ. Teich. “Combined system synthesis and communicationarchitecture exploration for MPSoCs”. In: Proceedings of theConference on Design, Automation and Test in Europe. DATE’09. Nice, France: European Design and Automation Associa-tion, 2009, pp. 472–477. isbn: 978-3-9810801-5-5. url: http ://dl.acm.org/citation.cfm?id=1874620.1874737.
[90] J. Luo and N. Jha. “Power-Efficient Scheduling for HeterogeneousDistributed Real-Time Embedded Systems”. In: CAD of IntegratedCircuits and Systems, IEEE (2007).
[91] N. Matthys, C. Huygens, D. Hughes, S. Michiels, and W.Joosen. “A component and policy-based approach for efficientsensor network reconfiguration”. In: Proceedings of the 13thIEEE International Symposium on Policies for DistributedSystems and Networks. IEEE, 2012, pp. 53–60. url: https ://lirias.kuleuven.be/handle/123456789/350799.

BIBLIOGRAPHY 145
[92] S. A. McKee. “Reflections on the Memory Wall”. In: Proceedings ofthe 1st Conference on Computing Frontiers. CF ’04. Ischia, Italy:ACM, 2004, pp. 162–. isbn: 1-58113-741-9. doi: 10.1145/977091.977115. url: http://doi.acm.org/10.1145/977091.977115.
[93] J.-Y. Mignolet and R. Wuyts. “Embedded Multiprocessor Systems-on-Chip Programming”. In: Software, IEEE 26.3 (2009), pp. 34–41. issn: 0740-7459. doi: 10.1109/MS.2009.64.
[94] G. Moore. “Cramming More Components Onto IntegratedCircuits”. In: Proceedings of the IEEE 86.1 (1998), pp. 82–85.issn: 0018-9219. doi: 10.1109/JPROC.1998.658762.
[95] O. Moreira, T. Basten, M. Geilen, and S. Stuijk. “Buffer Sizingfor Rate-Optimal Single-Rate Data-Flow Scheduling Revisited”.In: Computers, IEEE Transactions on 59.2 (2010), pp. 188 –201.issn: 0018-9340. doi: 10.1109/TC.2009.155.
[96] O. Moreira, T. Basten, M. Geilen, and S. Stuijk. “Buffer Sizingfor Rate-Optimal Single-Rate Data-Flow Scheduling Revisited”.In: Computers, IEEE Transactions on 59.2 (2010), pp. 188 –201.issn: 0018-9340. doi: 10.1109/TC.2009.155.
[97] P. Murthy and S. Bhattacharyya. “Shared buffer implementationsof signal processing systems using lifetime analysis techniques”.In: Computer-Aided Design of Integrated Circuits and Systems,IEEE Transactions on 20.2 (2001), pp. 177 –198. issn: 0278-0070.doi: 10.1109/43.908427.
[98] N. Z. Naqvi, D. Preuveneers, W. Meert, and Y. Berbers. “TheRight Thing to Do: Automating Support for Assisted Livingwith Dynamic Decision Networks”. In: Ubiquitous Intelligence andComputing, 2013 IEEE 10th International Conference on and 10thInternational Conference on Autonomic and Trusted Computing(UIC/ATC). 2013, pp. 262–269. doi: 10.1109/UIC-ATC.2013.65.
[99] R. H. B. Netzer and B. P. Miller. “What are race conditions?: Someissues and formalizations”. In: ACM Lett. Program. Lang. Syst. 1.1(Mar. 1992), pp. 74–88. issn: 1057-4514. doi: 10.1145/130616.130623. url: http://doi.acm.org/10.1145/130616.130623.
146 BIBLIOGRAPHY
[100] J. Parkhurst, J. Darringer, and B. Grundmann. “From Single Coreto Multi-core: Preparing for a New Exponential”. In: Proceedings ofthe 2006 IEEE/ACM International Conference on Computer-aidedDesign. ICCAD ’06. San Jose, California: ACM, 2006, pp. 67–72.isbn: 1-59593-389-1. doi: 10.1145/1233501.1233516. url: http://doi.acm.org/10.1145/1233501.1233516.
[101] J. Perez, R. Badia, and J. Labarta. “A dependency-aware task-based programming environment for multi-core architectures”.In: Cluster Computing, 2008 IEEE International Conference on.2008, pp. 142–151. doi: 10.1109/CLUSTR.2008.4663765.
[102] J. Pino and E. Lee. “Hierarchical static scheduling of dataflowgraphs onto multiple processors”. In: Acoustics, Speech, and SignalProcessing, IEEE International Conference on 4 (1995), pp. 2643–2646. doi: http://doi.ieeecomputersociety.org/10.1109/ICASSP.1995.480104.
[103] F. J. Pollack. “New Microarchitecture Challenges in the ComingGenerations of CMOS Process Technologies (Keynote Ad-dress)(Abstract Only)”. In: Proceedings of the 32Nd AnnualACM/IEEE International Symposium on Microarchitecture. MI-CRO 32. Haifa, Israel: IEEE Computer Society, 1999, pp. 2–. isbn:0-7695-0437-X. url: http://dl.acm.org/citation.cfm?id=320080.320082.
[104] V. K. Prasanna. “Power-Aware Resource Allocation for Indepen-dent Tasks in Heterogeneous Real-Time Systems”. In: ICPADS.2002.
[105] A. Radulescu and A. van Gemund. “Fast and effective task schedul-ing in heterogeneous systems”. In: Heterogeneous ComputingWorkshop, 2000. (HCW 2000) Proceedings. 9th. 2000, pp. 229–238. doi: 10.1109/HCW.2000.843747.
[106] A. Ramakrishnan, S. N. Z. Naqvi, Z. W. Bhatti, D. Preuveneers,and Y. Berbers. “Learning deployment trade-offs for self-optimization of Internet of Things applications”. In: Pro-ceedings of the 10th International Conference on AutonomicComputing, ICAC 2013. ACM, 2013, pp. 213–224. url: https://lirias.kuleuven.be/handle/123456789/411273.
BIBLIOGRAPHY 147
[107] K. Ramamritham, G. Fohler, and J. M. Adan. “Issues in the staticallocation and scheduling of complex periodic tasks”. In: IEEEComputer Society, 1993.
[108] J. Reinders. Intel threading building blocks. First. Sebastopol, CA,USA: O’Reilly & Associates, Inc., 2007. isbn: 9780596514808.
[109] P. Sawyer, R. Mazo, D. Diaz, C. Salinesi, and D. Hughes.“Using Constraint Programming to Manage Configurations inSelf-Adaptive Systems”. In: Computer 45.10 (2012), pp. 56–63.issn: 0018-9162. doi: http://doi.ieeecomputersociety.org/10.1109/MC.2012.286.
[110] R. Schreiber and D. C. Cronquist. “Near-optimal allocation oflocal memory arrays”. In: HP tenchnical report. 2004.
[111] J. Shalf, S. Dosanjh, and J. Morrison. “Exascale ComputingTechnology Challenges”. In: High Performance Computing forComputational Science – VECPAR 2010. Ed. by J. Palma, M.Daydé, O. Marques, and J. Lopes. Vol. 6449. Lecture Notes inComputer Science. Springer Berlin Heidelberg, 2011, pp. 1–25.isbn: 978-3-642-19327-9. doi: 10.1007/978-3-642-19328-6_1.url: http://dx.doi.org/10.1007/978-3-642-19328-6_1.
[112] J. Shirako, K. Sharma, and V. Sarkar. “Unifying Barrier andPoint-to-Point Synchronization in OpenMP with Phasers”. In:OpenMP in the Petascale Era. Ed. by B. M. Chapman, W. D.Gropp, K. Kumaran, and M. S. Müller. Vol. 6665. Lecture Notes inComputer Science. Springer Berlin Heidelberg, 2011, pp. 122–137.isbn: 978-3-642-21486-8. doi: 10.1007/978-3-642-21487-5.
[113] J. Shirako, D. M. Peixotto, V. Sarkar, and W. N. Scherer. “Phasers:a unified deadlock-free construct for collective and point-to-pointsynchronization”. In: Proceedings of the 22nd annual internationalconference on Supercomputing. ICS ’08. Island of Kos, Greece:ACM, 2008, pp. 277–288. isbn: 978-1-60558-158-3. doi: 10.1145/1375527.1375568.
[114] A. Sinha and A. Chandrakasan. “JouleTrack-a Web based toolfor software energy profiling”. In: Design Automation Conference,2001. Proceedings. 2001, pp. 220 –225. doi: 10.1109/DAC.2001.156139.
148 BIBLIOGRAPHY
[115] J. Sjödin and C. von Platen. “Storage Allocation for EmbeddedProcessors”. In: Proceedings of the 2001 International Conferenceon Compilers, Architecture, and Synthesis for Embedded Systems.CASES ’01. Atlanta, Georgia, USA: ACM, 2001, pp. 15–23. isbn:1-58113-399-5. doi: 10.1145/502217.502221. url: http://doi.acm.org/10.1145/502217.502221.
[116] J. Skeppstedt and P. Stenström. “Using Dataflow AnalysisTechniques to Reduce Ownership Overhead in Cache CoherenceProtocols”. In: ACM Trans. Program. Lang. Syst. 18.6 (Nov. 1996),pp. 659–682. issn: 0164-0925. doi: 10.1145/236114.236116. url:http://doi.acm.org/10.1145/236114.236116.
[117] P. van Stralen and A. Pimentel. “Scenario-based design spaceexploration of MPSoCs”. In: Computer Design (ICCD), 2010IEEE International Conference on. 2010, pp. 305 –312. doi: 10.1109/ICCD.2010.5647727.
[118] R. Strzodka, M. Shaheen, D. Pajak, and H. P Seidel. “CacheAccurate Time Skewing in Iterative Stencil Computations”. In:Parallel Processing (ICPP), 2011 International Conference on.2011, pp. 571–581. doi: 10.1109/ICPP.2011.47.
[119] S. Stuijk, M. Geilen, and T. Basten. “Throughput-BufferingTrade-Off Exploration for Cyclo-Static and Synchronous DataflowGraphs”. In: Computers, IEEE Transactions on 57.10 (2008),pp. 1331 –1345. issn: 0018-9340. doi: 10.1109/TC.2008.58.
[120] S. Stuijk, M. Geilen, B. Theelen, and T. Basten. “Scenario-awaredataflow: Modeling, analysis and implementation of dynamicapplications”. In: Embedded Computer Systems (SAMOS), 2011International Conference on. 2011, pp. 404 –411. doi: 10.1109/SAMOS.2011.6045491.
[121] S. Stuijk, M. Geilen, and T. Basten. “Exploring Trade-offs inBuffer Requirements and Throughput Constraints for SynchronousDataflow Graphs”. In: Proceedings of the 43rd Annual DesignAutomation Conference. DAC ’06. San Francisco, CA, USA: ACM,2006, pp. 899–904. isbn: 1-59593-381-6. doi: 10.1145/1146909.1147138. url: http://doi.acm.org/10.1145/1146909.1147138.
BIBLIOGRAPHY 149
[122] V. Suhendra, C. Raghavan, and T. Mitra. “Integrated scratchpadmemory optimization and task scheduling for MPSoC architec-tures”. In: CASES ’06.
[123] H. Sun, V. D. Florio, N. Gui, and C. Blondia. “Promises andChallenges of Ambient Assisted Living Systems”. In: Proceedingsof the 2009 Sixth International Conference on InformationTechnology: New Generations. ITNG ’09. Washington, DC, USA:IEEE Computer Society, 2009, pp. 1201–1207. isbn: 978-0-7695-3596-8. doi: 10 . 1109 / ITNG . 2009 . 169. url: http ://dx.doi.org/10.1109/ITNG.2009.169.
[124] H. Sutter. “The free lunch is over: A fundamental turn towardconcurrency in software”. In: Dr. Dobb’s Journal 30.3 (2005),pp. 202–210.
[125] H. Sutter and J. Larus. “Software and the Concurrency Revolu-tion”. In: Queue 3.7 (Sept. 2005), pp. 54–62. issn: 1542-7730. doi:10.1145/1095408.1095421. url: http://doi.acm.org/10.1145/1095408.1095421.
[126] Y. Tang, R. A. Chowdhury, B. C. Kuszmaul, C.-K. Luk, andC. E. Leiserson. “The pochoir stencil compiler”. In: Proceedingsof the 23rd ACM symposium on Parallelism in algorithms andarchitectures. SPAA ’11. San Jose, California, USA: ACM, 2011,pp. 117–128. isbn: 978-1-4503-0743-7. doi: 10.1145/1989493.1989508.
[127] W. Thies and S. Amarasinghe. “An empirical characterization ofstream programs and its implications for language and compilerdesign”. In: Proceedings of the 19th international conferenceon Parallel architectures and compilation techniques. PACT’10. Vienna, Austria: ACM, 2010, pp. 365–376. isbn: 978-1-4503-0178-7. doi: 10 . 1145 / 1854273 . 1854319. url: http ://doi.acm.org/10.1145/1854273.1854319.
[128] W. Thies, M. Karczmarek, and S. Amarasinghe. “StreamIt: ALanguage for Streaming Applications”. In: Compiler Construction.Ed. by R. Horspool. Vol. 2304. Lecture Notes in Computer Science.Springer Berlin / Heidelberg, 2002, pp. 49–84.
150 BIBLIOGRAPHY
[129] J. Torrellas, M. Lam, and J. L. Hennessy. “False sharing andspatial locality in multiprocessor caches”. In: Computers, IEEETransactions on 43.6 (1994), pp. 651–663. issn: 0018-9340. doi:10.1109/12.286299.
[130] S. Udayakumaran and R. Barua. “An Integrated Scratch-padAllocator for Affine and Non-affine Code”. In: Proceedings ofthe Conference on Design, Automation and Test in Europe:Proceedings. DATE ’06. Munich, Germany: European Design andAutomation Association, 2006, pp. 925–930. isbn: 3-9810801-0-6.url: http://dl.acm.org/citation.cfm?id=1131481.1131740.
[131] D. Unat, X. Cai, and S. B. Baden. “Mint: realizing CUDAperformance in 3D stencil methods with annotated C”. In:Proceedings of the international conference on Supercomputing.ICS ’11. Tucson, Arizona, USA: ACM, 2011, pp. 214–224. isbn:978-1-4503-0102-2. doi: 10.1145/1995896.1995932.
[132] S. Verdoolaege, H. Nikolov, and T. Stefanov. “pn: a tool forimproved derivation of process networks”. In: EURASIP J.Embedded Syst. 2007.1 (Jan. 2007), pp. 19–19. issn: 1687-3955.doi: 10.1155/2007/75947. url: http://dx.doi.org/10.1155/2007/75947.
[133] J. Vidal, F. de Lamotte, G. Gogniat, P. Soulard, and J.-P. Diguet.“A co-design approach for embedded system modeling and codegeneration with UML and MARTE”. In: Design, AutomationTest in Europe Conference Exhibition, 2009. DATE ’09. 2009,pp. 226–231. doi: 10.1109/DATE.2009.5090662.
[134] M. A. Viredaz and D. A. Wallach. “Power evaluation of a handheldcomputer”. In: Micro, IEEE 23.1 (2003), pp. 66 –74. issn: 0272-1732. doi: 10.1109/MM.2003.1179900.
[135] M. Voss. The Intel Threading Building Blocks flow graph is nowfully supported [online]. url: http://software.intel.com/en-us/blogs/2011/09/08/the-intel-threading-building-blocks-flow-graph-is-now-fully-supported.
BIBLIOGRAPHY 151
[136] P. Wauters, M. Engels, R. Lauwereins, and J. Peperstraete. “Cyclo-dynamic dataflow”. In: Parallel and Distributed Processing, 1996.PDP ’96. Proceedings of the Fourth Euromicro Workshop on. 1996,pp. 319–326. doi: 10.1109/EMPDP.1996.500603.
[137] G. Wellein, G. Hager, T. Zeiser, M. Wittmann, and H. Fehske.“Efficient Temporal Blocking for Stencil Computations byMulticore-Aware Wavefront Parallelization”. In: Computer Soft-ware and Applications Conference, 2009. COMPSAC ’09. 33rdAnnual IEEE International. Vol. 1. 2009, pp. 579 –586. doi:10.1109/COMPSAC.2009.82.
[138] M. Wiggers, M. Bekooij, P. Jansen, and G. Smit. “Efficient Com-putation of Buffer Capacities for Multi-rate Real-time Systemswith Back-pressure”. In: Proceedings of the 4th InternationalConference on Hardware/Software Codesign and System Synthesis.CODES+ISSS ’06. Seoul, Korea: ACM, 2006, pp. 10–15. isbn:1-59593-370-0. doi: 10 . 1145 / 1176254 . 1176260. url: http ://doi.acm.org/10.1145/1176254.1176260.
[139] M. Wiggers, M. Bekooij, and G. Smit. “Buffer CapacityComputation for Throughput Constrained Streaming Applicationswith Data-Dependent Inter-Task Communication”. In: 2008,pp. 183 –194. doi: 10.1109/RTAS.2008.10.
[140] S. Williams, A. Waterman, and D. Patterson. “Roofline: aninsightful visual performance model for multicore architectures”.In: Commun. ACM 52.4 (Apr. 2009), pp. 65–76. issn: 0001-0782.doi: 10.1145/1498765.1498785. url: http://doi.acm.org/10.1145/1498765.1498785.
[141] M. E. Wolf and M. S. Lam. “A Data Locality OptimizingAlgorithm”. In: Proceedings of the ACM SIGPLAN 1991 Con-ference on Programming Language Design and Implementation.PLDI ’91. Toronto, Ontario, Canada: ACM, 1991, pp. 30–44.isbn: 0-89791-428-7. doi: 10.1145/113445.113449. url: http://doi.acm.org/10.1145/113445.113449.
[142] C. Wong, F. Thoen, F. Catthoor, and D. Verkest. “System DesignAutomation”. In: VDI-Verlag, 2001. Chap. Static Task Schedulingfor Real-Time Embedded Systems, pp. 35–44.
152 BIBLIOGRAPHY
[143] P. Yang, P. Marchal, C. Wong, S. Himpe, F. Catthoor, P.David, J. Vounckx, and R. Lauwereins. “Managing DynamicConcurrent Tasks in Embedded Real-time Multimedia Systems”.In: Proceedings of the 15th International Symposium on SystemSynthesis. ISSS ’02. Kyoto, Japan: ACM, 2002, pp. 112–119.isbn: 1-58113-576-9. doi: 10.1145/581199.581226. url: http://doi.acm.org/10.1145/581199.581226.
[144] Y. Yang, M. Geilen, T. Basten, S. Stuijk, and H. Corpo-raal. “Exploring trade-offs between performance and resourcerequirements for synchronous dataflow graphs”. In: EmbeddedSystems for Real-Time Multimedia, 2009. ESTIMedia 2009.IEEE/ACM/IFIP 7th Workshop on. 2009, pp. 96 –105. doi:10.1109/ESTMED.2009.5336821.
[145] A. YarKhan, J. Kurzak, and J. Dongarra. QUARK Users’Guide: QUeueing And Runtime for Kernels. Tech. rep. InnovativeComputing Laboratory, University of Tennessee, 2011.
[146] K. Yelick, D. Bonachea, W.-Y. Chen, P. Colella, K. Datta, J.Duell, S. L. Graham, P. Hargrove, P. Hilfinger, P. Husbands,C. Iancu, A. Kamil, R. Nishtala, J. Su, M. Welcome, and T.Wen. “Productivity and performance using partitioned globaladdress space languages”. In: Proceedings of the 2007 internationalworkshop on Parallel symbolic computation. PASCO ’07. London,Ontario, Canada: ACM, 2007, pp. 24–32. isbn: 978-1-59593-741-4.doi: 10.1145/1278177.1278183. url: http://doi.acm.org/10.1145/1278177.1278183.
[147] E. Zitzler, J. Teich, and S. S. Bhattacharyya. “Evolutionaryalgorithms for the synthesis of embedded software”. In: IEEETrans. Very Large Scale Integr. Syst. 8 (4 2000), pp. 452–456.issn: 1063-8210. doi: 10 . 1109 / 92 . 863627. url: http ://portal.acm.org/citation.cfm?id=349683.358382.


FACULTY OF ENGINEERING SCIENCEDEPARTMENT OF COMPUTER SCIENCE
IMINDS-DISTRINETCelestijnenlaan 200A box 2402
B-3001 [email protected]