damage detection of fiber-reinforced polymer honeycomb sandwich beams
TRANSCRIPT
Composite Structures 67 (2005) 365–373
www.elsevier.com/locate/compstruct
Damage detection of fiber-reinforced polymer honeycombsandwich beams
Wahyu Lestari, Pizhong Qiao *
Department of Civil Engineering, Auburn Science and Engineering Center, The University of Akron, 244 Sumner Street, Akron, OH 44325-3905, USA
Available online 26 February 2004
Abstract
In a framework of developing a structural health monitoring for civil infrastructure, the damage identification procedure based
on dynamic response for fiber reinforced polymer (FRP) sandwich composites is evaluated. In this paper, an experimental damage
identification procedure based on structural dynamic responses and using smart sensors is conducted. Damage identification is
estimated from comparison of dynamic responses of healthy and damaged FRP sandwich beams. Correspondingly, based on the
relationship between the changes of mechanical properties and the related changes of dynamic responses (i.e., the curvature mode
shapes in this study), damage magnitude is quantified. The composite sandwich beams are made of E-glass fiber and polyester resin,
and the core consists of the corrugated cells in a sinusoidal configuration. Artificial damage is created between the interface of core
and faceplate and also in the core of sandwich beam to simulate core–faceplate debonding and core crushing, respectively. Using
piezoelectric smart sensors, dynamic responses data is collected and dynamic characteristics of the sandwich structure are extracted,
from which the location and magnitude of the damage are evaluated. As demonstrated in this study, the present dynamic response-
based procedure using smart sensors can be effectively used to assess damage and monitor structural health of FRP honeycomb
sandwich structures.
� 2004 Elsevier Ltd. All rights reserved.
Keywords: FRP honeycomb sandwich; Sinusoidal core; Damage identification; Structural health monitoring; Piezoelectric sensors; Dynamic
response; Curvature mode shape
1. Introduction
Sandwich structures are commonly used in the aero-
space and automobile structures, since they offer greatenergy absorption and increase the inertia without sig-
nificant weight penalties. Recent growing interest in fiber
reinforced polymer (FRP) composite materials for civil
infrastructure provides a unique opportunity for deve-
lopment and implementation of sandwich structures, as
both rehabilitation and new constructions. FRP com-
posite honeycomb sandwich structures have shown effi-
cient and economic applications in highway bridges, andthey provide high mechanical performance [1]. Al-
though, the primary layout of the sandwich structure is
the same, which consists of faceplates and core, the sizes
of honeycomb sandwich in civil infrastructure are much
thicker and larger than the one regularly used in the
*Corresponding author. Tel.: +1-330-972-5226; fax: +1-330-972-
6020.
E-mail address: [email protected] (P. Qiao).
0263-8223/$ - see front matter � 2004 Elsevier Ltd. All rights reserved.
doi:10.1016/j.compstruct.2004.01.023
aerospace and automobile structures. As with most
sandwich structures, the FRP sandwich for civil infra-
structure has a relatively lightweight core in the form of
corrugated or closed-cell geometry encased between twofaceplates. The concept of lightweight and heavy duty
applications of FRP honeycomb sandwich panels in
highway bridge decks with sinusoidal core configuration
was introduced by Plunkett [1]. Some feasibility studies
on FRP sandwich panels show that the panels efficiently
provided high mechanical performance for minimum
weight. A study on testing and field installation was
successfully accomplished [2]. Study on design modelingand optimization of FRP sandwich panels with sinu-
soidal honeycomb core were conducted by Davalos et al.
[3]. Analytical estimation of core transverse shear stiff-
ness with general configuration was studied by Xu et al.
[4]. Due to the skin effect on core properties, modeling
and analysis of sandwich structures are usually compli-
cated. The skin effect on effective properties of sandwich
plates using homogenization technique was studied byXu and Qiao [5].
366 W. Lestari, P. Qiao / Composite Structures 67 (2005) 365–373
The enclosure of core design in sandwich structures
also raises some other concerns as it restricts the access
to the core for measuring or inspection purposes, and
thus increases the difficulty to measure and monitor thestructural conditions during a period in service. Dam-
ages in sandwich structures, such as delamination within
faceplates, core–faceplate debonding, and/or core
crushing failure, can initiate tremendous property and
function degradation, which may lead to some cata-
strophic failure. The inspection method based on dy-
namic response with capability of monitoring large area
offers more effective procedure than the traditionalexisting inspection methods [6], which in many cases are
based on visual inspection techniques, especially when
the damages are not surface type. Damage in a structure
can cause changes in its dynamic response. Hence, once
the relationships between the damage and the response
changes are established, the information on the condi-
tion of structure can be extracted and estimated.
Application of piezoelectric smart sensors with flexibilityto be easily bonded to the structures makes the imple-
mentation of the damage assessments less troublesome
and more efficient.
The simplicity of structural health monitoring tech-
niques based on dynamic response has created many
interests for several years. Changes in natural frequency
and mode shapes are the most common parameters used
in identification of damage. Various methods of damagedetection that used natural frequency information were
reported by Salawu [7]. Although, the natural frequency
changes can be used to indicate the presence of damage,
in most cases the frequency alone is insufficient to un-
iquely identify the damage. Some applications on
vibration-based health monitoring of delaminated
composite structures using various parameters were re-
viewed by Zou et al. [8]. Although a damping changecan be a better indicator, the structural damping is a
complex phenomenon that is difficult to model and
quantitatively identify through experimental measure-
ments.
Interesting phenomenon on the changes in the cur-
vature mode shapes was demonstrated by Pandey, et al.
[9]. The curvature mode shapes are very sensitive to
damage, and the effect is highly localized in the region ofthe damage. Hence, the changes in the curvature mode
shapes can be applied effectively to detect damage
location in structures. Salawu and Williams [10] com-
pared the performance of both curvature and displace-
ment mode shapes for locating damage, which
confirmed this phenomenon as well. The curvature
mode shape information was used by Pabst and
Hagedorn [11] in combination with data of frequencychanges. Comparison of the measurement of cracked
beam data with mathematical model for undamaged
beam illustrated the effectiveness of the method. Simi-
larly, Luo and Hanagud [12] used the information in the
form of an integral equation relationship to identify the
location and severity of damage. Stubb and Kim [13]
used the damage index of curvature modes as an indi-
cation of damage. The curvature mode shape in theform of frequency domain information was used by
Keilers and Chang [14]; while Sampaio et al. [15] and
Schultz et al. [16] used the transfer function information.
These frequency response function (FRF) curvature
methods performed well in detecting and locating the
damage, especially for large magnitude of damage.
Lestari and Hanagud [17] introduced a method of
damage detection that used only a few low-order modesand with consideration of using mathematical relation-
ship to simultaneously detect the damage magnitude.
However, the applications of the dynamic response-
based monitoring technique to civil infrastructure are
still few, especially to civil engineering structures made
of FRP composites. Several studies on health monitor-
ing of civil infrastructure using vibration response for
bridges were reported. Detection of real damage sce-nario on a bridge was studied by Wahab and Roeck [18]
utilizing modal curvature. The modal curvature was
calculated by using the central difference approximation
of the modal displacement. The average modal curva-
ture difference was used to identify the location of
damage. The results showed that in general the lower
mode estimations were more accurate than the higher
mode ones. Using the direct stiffness calculation fromthe measured displacement mode shapes, Maeck et al.
[19] demonstrated that the cracks on a concrete bridge
could be detected as long as they remained open.
However, when the settlement that opened the cracks
was removed, the cracks were hardly identified. Com-
parative study of dynamic response-based damage
detection on a bridge was reported by Farrar and
Jauregui [20], and the sensitivity and accuracy of eachmethod were discussed. They suggested that more tests
on actual structures were needed, before the damage
detection algorithm could be applied with sufficient
confidence to warrant the field deployment of remote
monitoring systems.
In this paper, the damage assessment procedure for
full-size FRP honeycomb sandwich structures in high-
way bridge applications based on dynamic responsesand using piezoelectric smart sensors is presented. The
technique is developed based on the relationship of
curvature mode shapes of both healthy and damaged
structures. This study is a further development of pre-
vious works [21], which primarily dealt with damage
detection of small coupon scale composite laminated
beams. A brief description of the damage identification
method using the curvature mode shapes is first pre-sented, followed by the experimental testing of healthy
and damaged composite sandwich beams. Damage
assessment is applied to FRP sandwich beams with two
different artificial damages, i.e., debonding of a faceplate
W. Lestari, P. Qiao / Composite Structures 67 (2005) 365–373 367
from core and crushing failure of the core. Dynamic
responses of the damaged beams are provided, as well as
the prediction of damage information.
2. Damage detection based on curvature mode shapes
2.1. Governing equations
Relationship of the curvature mode shapes to the
bending stiffness of the beam at any point of a beam
structure can be expressed as
w00 ¼ M=EI ð1Þ
where w is the transverse displacement of the beam; w00 is
the curvature at a section;M is the bending moment; E is
the modulus of elasticity; I is the second moment of the
cross-sectional area; and EI is the beam bending stiff-ness. When the damage is introduced in a structure, the
stiffness at the location of the damage will be reduced
while at the same time the magnitude of the curvature
modes increases. Motivated by this relationship, the
damage detection that utilized changes in curvature
modes was developed [21]. In this paper, the mathe-
matical relationships, which relate the damage infor-
mation, natural frequency changes, and the modes ofthe healthy and damaged structures, are briefly re-
viewed. Only the stiffness loss due to the damage is
considered, which varies with the damage size in the
structure.
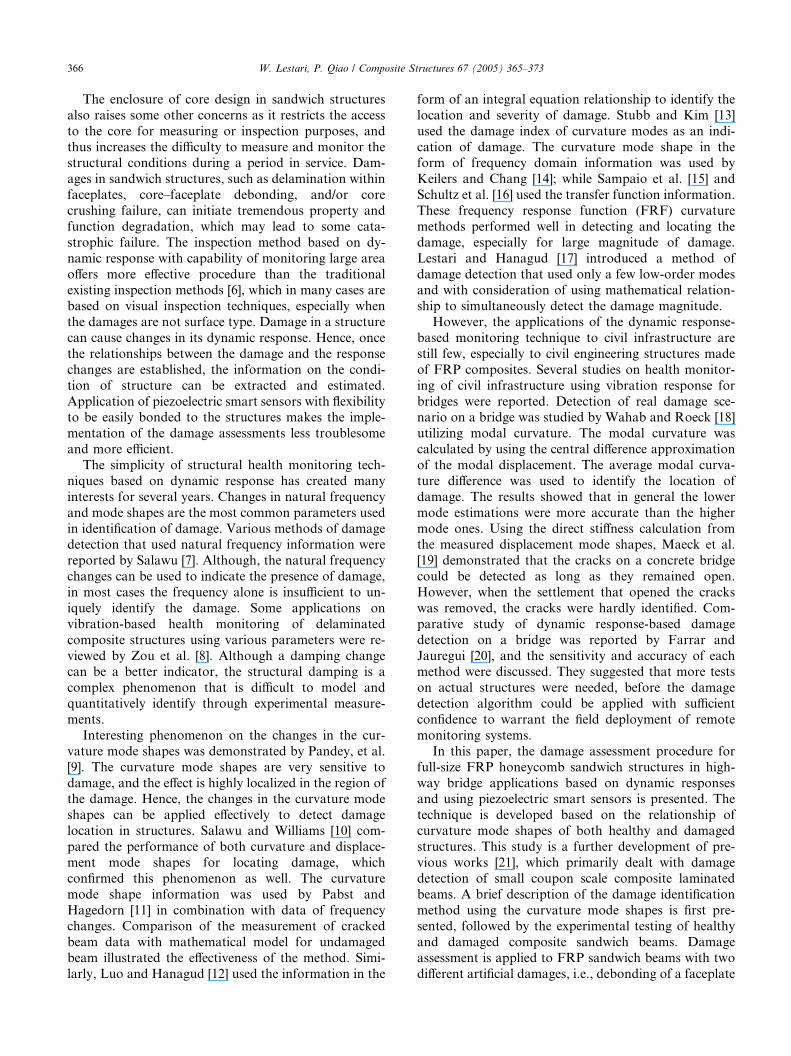
Assuming e is the stiffness loss ratio at the location of
damage (Fig. 1), the effect of damage on the stiffness
distribution of the beam can be expressed in the fol-
lowing equation
EIdðxÞ ¼ EI0f1� e½Hðx� x1Þ �Hðx� x2Þ�g ð2Þ
where H is a Heaviside step function; x1 and x2 are the
beginning and end of damage area, respectively; and EI0and EId are the bending stiffness of healthy (undamaged)and damaged beams, respectively.
The governing equation for the defective beam based
on Euler–Bernoulli beam theory and using the trans-
verse displacement function of wðx; tÞ ¼ ~/ðxÞejffiffik
pt can be
written as
x damagez
x1
x2 h
x
Fig. 1. Detailed damage region.
d2
dx2EIdðxÞ
d2
dx2~/iðxÞ
h i� �� ~kim ~/iðxÞ
h i¼ 0 ð3Þ
where m is the mass of structure, ~/i is the eigen func-
tions, and ~ki is the eigenvalues of the damaged structure.
Considering the stiffness loss parameter (e) is small, and
by using perturbations from the intact state of the beam,
the eigensolutions of the structure with the defect can be
expressed in the following form
~ki ¼ k0i � ek1i � e2k2i~/i ¼ /0
i � e/1i � e2/2
i
ð4Þ
Substituting Eqs. (2) and (4) into Eq. (3), retaining
only the terms up to e1-order and collecting the coeffi-cients for e0 and e1, the governing equations of the
damaged structure can be written as follows
e0 : EI0d4
dx4/0
i ðxÞ� �
� k0i m/0i ðxÞ ¼ 0 ð5aÞ
e1 : EI0d4
dx4/1
1ðxÞ� �
� k0i m/1i ðxÞ
¼ EI0d2
dx2e½Hðx
�� x1Þ �Hðx� x2Þ�
d2
dx2/0
i ðxÞ� ��
� k1i m/0i ðxÞ ð5bÞ
The governing equation of the zeroth order repre-
sents the ordinary differential equation for the undam-
aged structure. In this case, the stiffness and mass
distribution are constants, namely EI0 and m, with the
eigensolutions k0i and /0i . The first order perturbation
represents the governing equation of the damaged
structure. After applying the proper boundary condi-tions and assuming the homogeneous solution for the
damaged structure as the combination of the solution of
the undamaged problem, with some mathematical
manipulation, the eigensolution for the damage problem
can be obtained as
~ki ¼ k0i � ek0i /0i;xðx1Þ
Z L
0
hx�
� x1i/0j dx
� /0i;xðx2Þ
Z L
0
hx� x2i/0j dxþ /0
i ðx1ÞZ L
0
Hðx
� x1Þ/0j dx� /0
i ðx2ÞZ L
0
Hðx� x2Þ/0j dx
�Z L
0
½Hðx� x1Þ �Hðx� x2Þ�/0i/
0j dx
þ #ðe2Þ ð6Þ
where cL
�4 ¼ k0i m0
EI0,
~/i ¼ /0i � e
Xn
j¼1
bij/0j
(þ /0
i;xðx1Þhx� x1i/0i;xðx2Þhx
� x2i þ /0i ðx1ÞHðx� x1Þ � /0
i ðx2ÞHðx� x2Þ
� ½Hðx� x1Þ �Hðx� x2Þ�/0i
)þ #ðe2Þ ð7Þ
368 W. Lestari, P. Qiao / Composite Structures 67 (2005) 365–373
with
bij ¼1
k0j � k0i
� /0i;xðx1Þ
Z L
0
hx�
� x1i/0j dx
� /0i;xðx2Þ
Z L
0
hx� x2i/0j dxþ /0
i ðx1ÞZ L
0
Hðx
� x1Þ/0j dx� /0
i ðx2ÞZ L
0
Hðx� x2Þ/0j dx
�Z L
0
½Hðx� x1Þ �Hðx� x2Þ�/0i/
0j dx
ð8Þ
Taking the second derivative of the expression in Eq.
(6), one can clearly observe that the changes or discon-tinuity of the curvature modes due to damage are rep-
resented by Heaviside step function, at the location of
the damage, between x1 and x2.
2.2. Damage identification
Using Eq. (1), one can deduce that the absolute dif-
ferences between the curvature modes of the intact and
damaged structures are the highest in the region of the
damage and negligibly small outside this region. Based
on such differences, the characteristic damage in the
structure can be located. For any arbitrary location x,the absolute curvature difference between the healthy
and damaged structures for each mode can be repre-
sented as follows:
D/00i;j ¼ /00
h
n oi;j
���� � /00d
n oi;j
���� ð9aÞ
where /00i or /i;xx is the ith curvature mode shapes; h and
d denote healthy and damaged, respectively; and i and jdenote the measurement location and the mode number,
respectively. At a certain location where the damage
presents, for example at x ¼ xd, the value of D/i;xxðxdÞ issignificantly higher than the values at other locations. In
some cases, single mode identification is insufficient to
locate the damage, such as for multiple damage case or
location of damage in the proximity of a nodal point.The average of several curvature differences offers
excellent alternative and is defined as follows
Di ¼1
N
XNj
D/00i;j ð9bÞ
which Di, is the summation of damage differences fromeach mode being evaluated, noted as the curvature
damage factor (CDF) [18]; D/00i;j is the curvature differ-
ence defined in Eq. (9a) and N is the number of curva-
ture modes considered in the evaluation.
As a comparison and validation, the damage index
method is evaluated as well, where the indices and the
summation are defined as follows
bi;j ¼/00
d
n o2
i;jþPimax
i¼1 /00d
n o2
i;j
� �Pimax
i¼1 /00d
n o2
i;j
/00h
� �2
i;jþPimax
i¼1 /00d
� �2
i;j
� Pimax
i¼1 /00d
� �2
i;j
ð10aÞ
eD i ¼Xj
bi;j ð10bÞ
where eDi is herein noted as the damage index.
Once the damage is identified at station xd, the
magnitude of the damage at this location can be defined
by using the damage magnitude difference of the modes,
D/i;xxðxdÞ, between the intact structure and the one with
damage. This damage magnitude or stiffness loss (e) canbe calculated using the relationship of the frequencies inEq. (6) or the relationship of the curvature modes in Eq.
(7). As the frequency measurements at low frequency are
sensitive to interferences, hence the damage magnitude
estimation is calculated based on the mode shape rela-
tionship. Provided the location xd is known, the damage
magnitude in the form of stiffness loss can be defined as
follows
e ¼/i;xx � /di;xxPn
k¼1
Gj
k0i �k0j
d2
dx2 /0j � ½Hðx� x1Þ �Hðx� x2Þ� d2
dx2 /0i ðxÞ
ð11Þ
with
Gj ¼ /0i;xðx1Þ
Z L
0
hx� x1i/0j dx� /0
i;xðx2ÞZ L
0
hx� x2i/0j dx
þ /0i ðx1Þ
Z L
0
Hðx� x1Þ/0j dx� /0
i ðx2ÞZ L
0
Hðx
� x2Þ/0j dx�
Z L
0
½Hðx� x1Þ �Hðx� x2Þ�/0i/
0j dx
where /i;xx and /di;xx are the measured curvature modes
of the healthy and damaged beams at the ith mode,respectively.
3. Experimental procedure and results on a
cantilevered beam
3.1. Sandwich specimens
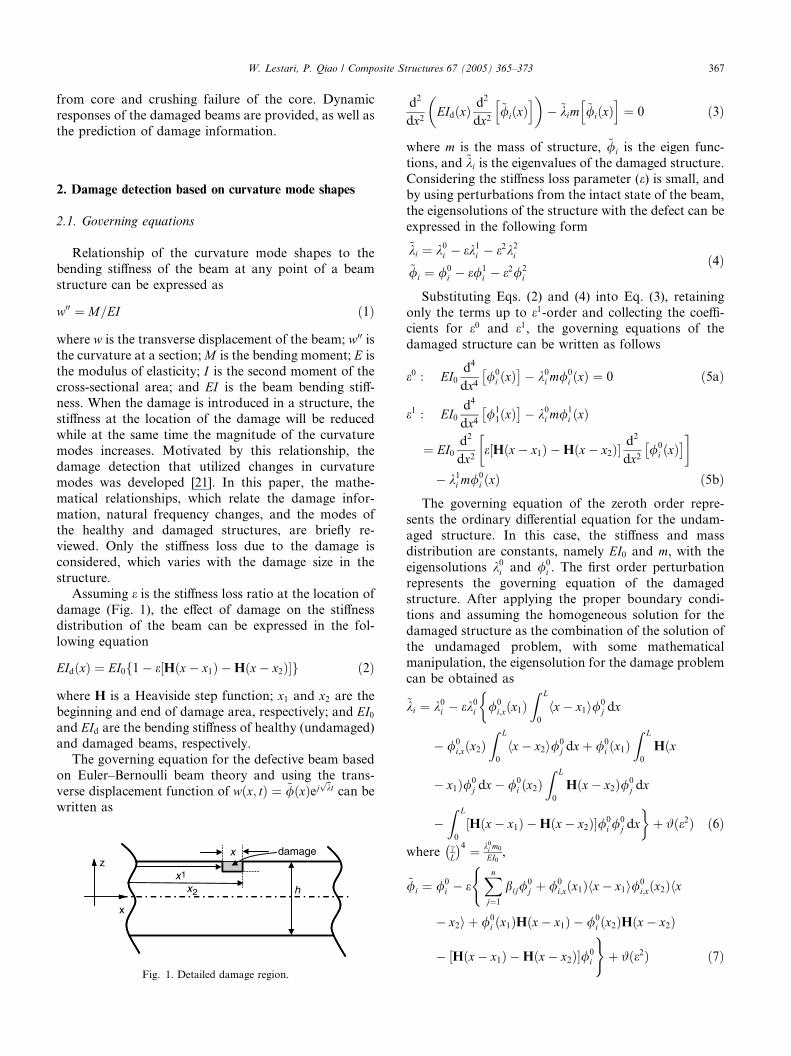
The sandwich panel investigated in this study was
manufactured by Kansas Structural Composites, Inc.
(KSCI, Russell, Kansas). The sandwich panel consists oftwo faces FRP laminates, which are co-cured with the
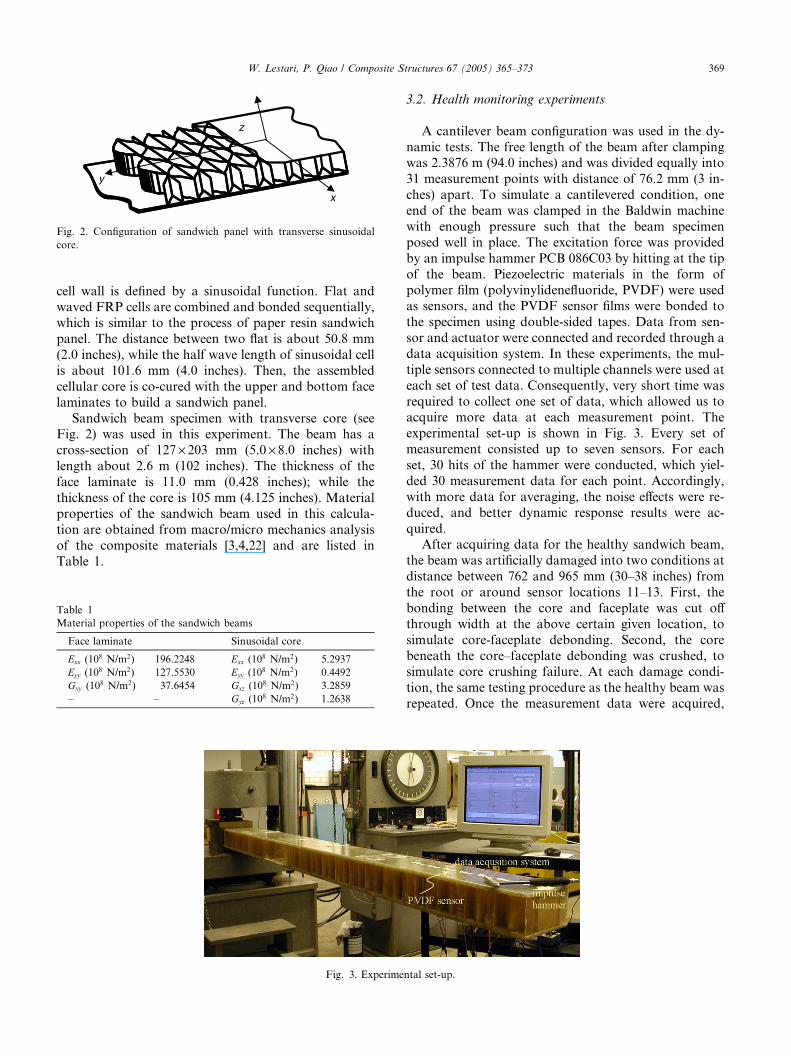
core. The configuration of the sandwich beam is shown
in Fig. 2. The core geometry composes of closed hon-
eycomb type FRP cells. The waved flutes or core ele-
ments are produced by forming the FRP sheets to a
corrugated mold. Unlike the traditional honeycomb
sandwich structures, the shape of the FRP corrugated
z
y
x
Fig. 2. Configuration of sandwich panel with transverse sinusoidal
core.
W. Lestari, P. Qiao / Composite Structures 67 (2005) 365–373 369
cell wall is defined by a sinusoidal function. Flat andwaved FRP cells are combined and bonded sequentially,
which is similar to the process of paper resin sandwich
panel. The distance between two flat is about 50.8 mm
(2.0 inches), while the half wave length of sinusoidal cell
is about 101.6 mm (4.0 inches). Then, the assembled
cellular core is co-cured with the upper and bottom face
laminates to build a sandwich panel.
Sandwich beam specimen with transverse core (seeFig. 2) was used in this experiment. The beam has a
cross-section of 127 · 203 mm (5.0 · 8.0 inches) with
length about 2.6 m (102 inches). The thickness of the
face laminate is 11.0 mm (0.428 inches); while the
thickness of the core is 105 mm (4.125 inches). Material
properties of the sandwich beam used in this calcula-
tion are obtained from macro/micro mechanics analysis
of the composite materials [3,4,22] and are listed inTable 1.
Table 1
Material properties of the sandwich beams
Face laminate Sinusoidal core
Exx (108 N/m2) 196.2248 Exx (10
8 N/m2) 5.2937
Eyy (108 N/m2) 127.5530 Eyy (10
8 N/m2) 0.4492
Gxy (108 N/m2) 37.6454 Gxz (10
8 N/m2) 3.2859
– – Gyz (108 N/m2) 1.2638
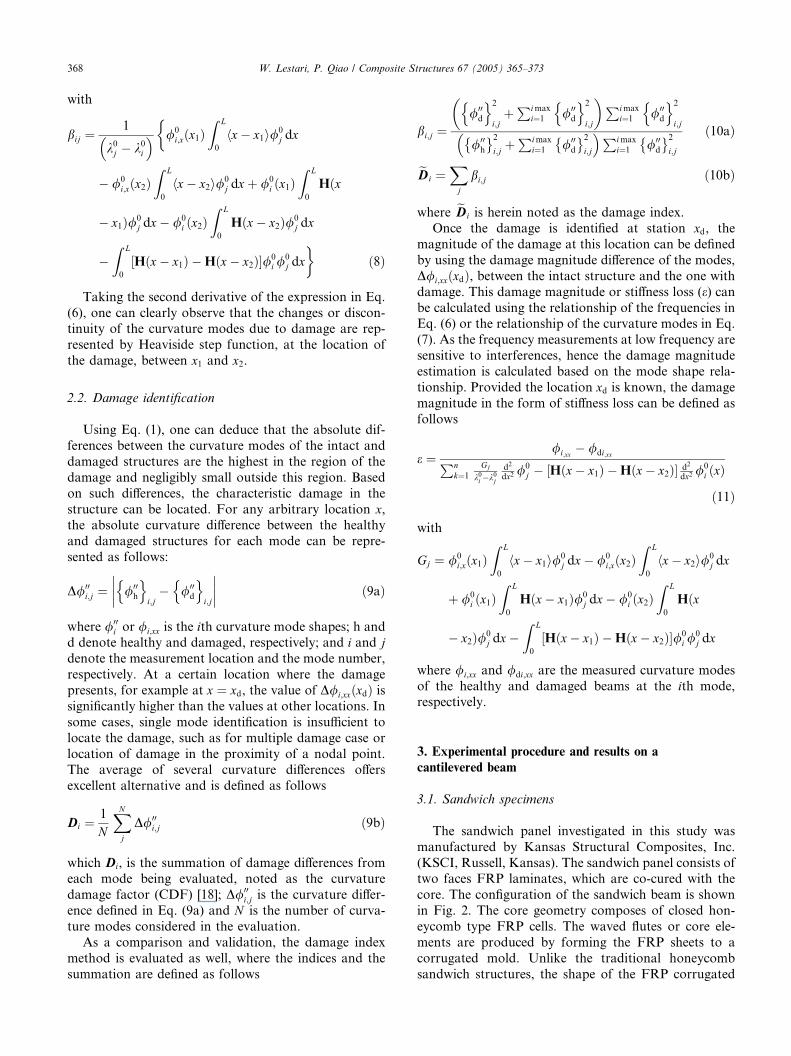
Fig. 3. Experime
3.2. Health monitoring experiments
A cantilever beam configuration was used in the dy-
namic tests. The free length of the beam after clampingwas 2.3876 m (94.0 inches) and was divided equally into
31 measurement points with distance of 76.2 mm (3 in-
ches) apart. To simulate a cantilevered condition, one
end of the beam was clamped in the Baldwin machine
with enough pressure such that the beam specimen
posed well in place. The excitation force was provided
by an impulse hammer PCB 086C03 by hitting at the tip
of the beam. Piezoelectric materials in the form ofpolymer film (polyvinylidenefluoride, PVDF) were used
as sensors, and the PVDF sensor films were bonded to
the specimen using double-sided tapes. Data from sen-
sor and actuator were connected and recorded through a
data acquisition system. In these experiments, the mul-
tiple sensors connected to multiple channels were used at
each set of test data. Consequently, very short time was
required to collect one set of data, which allowed us toacquire more data at each measurement point. The
experimental set-up is shown in Fig. 3. Every set of
measurement consisted up to seven sensors. For each
set, 30 hits of the hammer were conducted, which yiel-
ded 30 measurement data for each point. Accordingly,
with more data for averaging, the noise effects were re-
duced, and better dynamic response results were ac-
quired.After acquiring data for the healthy sandwich beam,
the beam was artificially damaged into two conditions at
distance between 762 and 965 mm (30–38 inches) from
the root or around sensor locations 11–13. First, the
bonding between the core and faceplate was cut off
through width at the above certain given location, to
simulate core-faceplate debonding. Second, the core
beneath the core–faceplate debonding was crushed, tosimulate core crushing failure. At each damage condi-
tion, the same testing procedure as the healthy beam was
repeated. Once the measurement data were acquired,
ntal set-up.
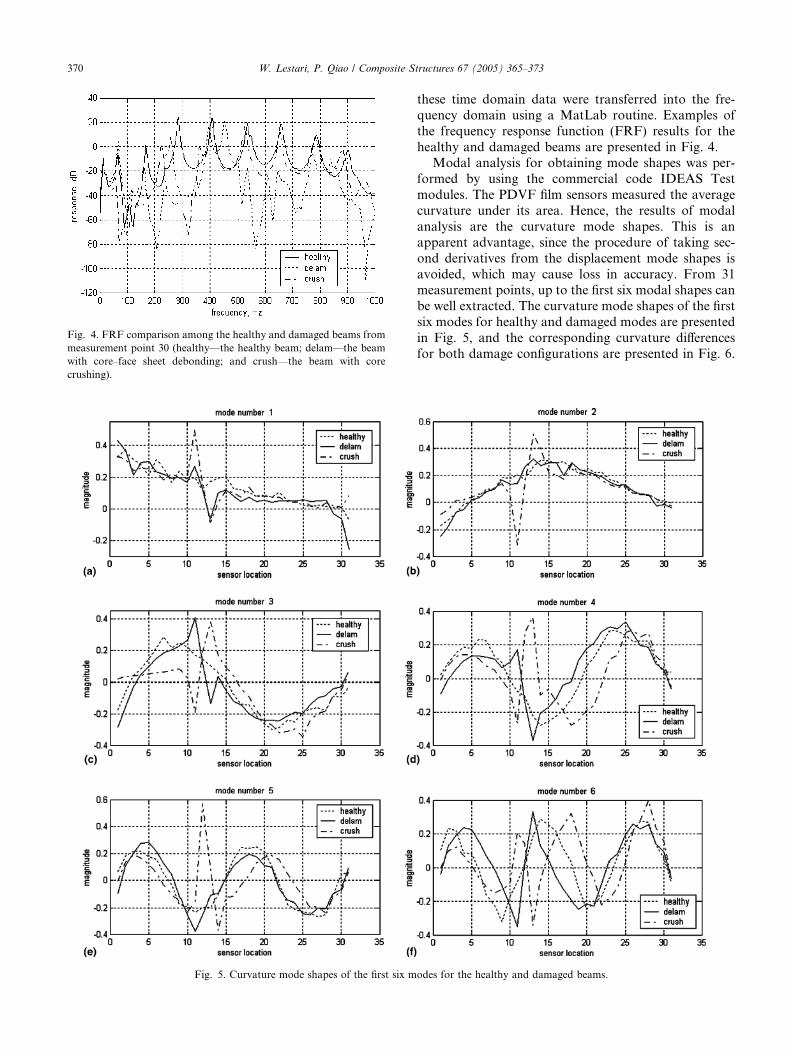
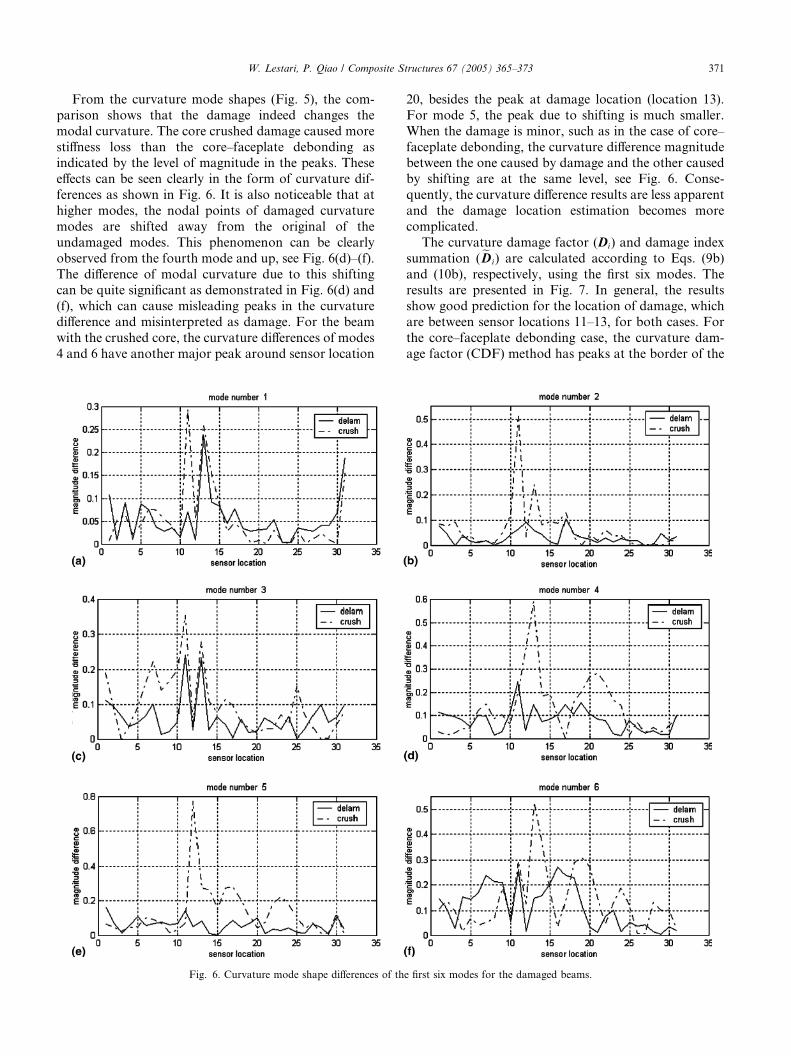
Fig. 4. FRF comparison among the healthy and damaged beams from
measurement point 30 (healthy––the healthy beam; delam––the beam
with core–face sheet debonding; and crush––the beam with core
crushing).
Fig. 5. Curvature mode shapes of the first six m
370 W. Lestari, P. Qiao / Composite Structures 67 (2005) 365–373
these time domain data were transferred into the fre-
quency domain using a MatLab routine. Examples of
the frequency response function (FRF) results for the
healthy and damaged beams are presented in Fig. 4.Modal analysis for obtaining mode shapes was per-
formed by using the commercial code IDEAS Test
modules. The PDVF film sensors measured the average
curvature under its area. Hence, the results of modal
analysis are the curvature mode shapes. This is an
apparent advantage, since the procedure of taking sec-
ond derivatives from the displacement mode shapes is
avoided, which may cause loss in accuracy. From 31measurement points, up to the first six modal shapes can
be well extracted. The curvature mode shapes of the first
six modes for healthy and damaged modes are presented
in Fig. 5, and the corresponding curvature differences
for both damage configurations are presented in Fig. 6.
odes for the healthy and damaged beams.
W. Lestari, P. Qiao / Composite Structures 67 (2005) 365–373 371
From the curvature mode shapes (Fig. 5), the com-
parison shows that the damage indeed changes the
modal curvature. The core crushed damage caused more
stiffness loss than the core–faceplate debonding asindicated by the level of magnitude in the peaks. These
effects can be seen clearly in the form of curvature dif-
ferences as shown in Fig. 6. It is also noticeable that at
higher modes, the nodal points of damaged curvature
modes are shifted away from the original of the
undamaged modes. This phenomenon can be clearly
observed from the fourth mode and up, see Fig. 6(d)–(f).
The difference of modal curvature due to this shiftingcan be quite significant as demonstrated in Fig. 6(d) and
(f), which can cause misleading peaks in the curvature
difference and misinterpreted as damage. For the beam
with the crushed core, the curvature differences of modes
4 and 6 have another major peak around sensor location
Fig. 6. Curvature mode shape differences of th
20, besides the peak at damage location (location 13).
For mode 5, the peak due to shifting is much smaller.
When the damage is minor, such as in the case of core–
faceplate debonding, the curvature difference magnitudebetween the one caused by damage and the other caused
by shifting are at the same level, see Fig. 6. Conse-
quently, the curvature difference results are less apparent
and the damage location estimation becomes more
complicated.
The curvature damage factor (Di) and damage index
summation (eDi) are calculated according to Eqs. (9b)
and (10b), respectively, using the first six modes. Theresults are presented in Fig. 7. In general, the results
show good prediction for the location of damage, which
are between sensor locations 11–13, for both cases. For
the core–faceplate debonding case, the curvature dam-
age factor (CDF) method has peaks at the border of the
e first six modes for the damaged beams.
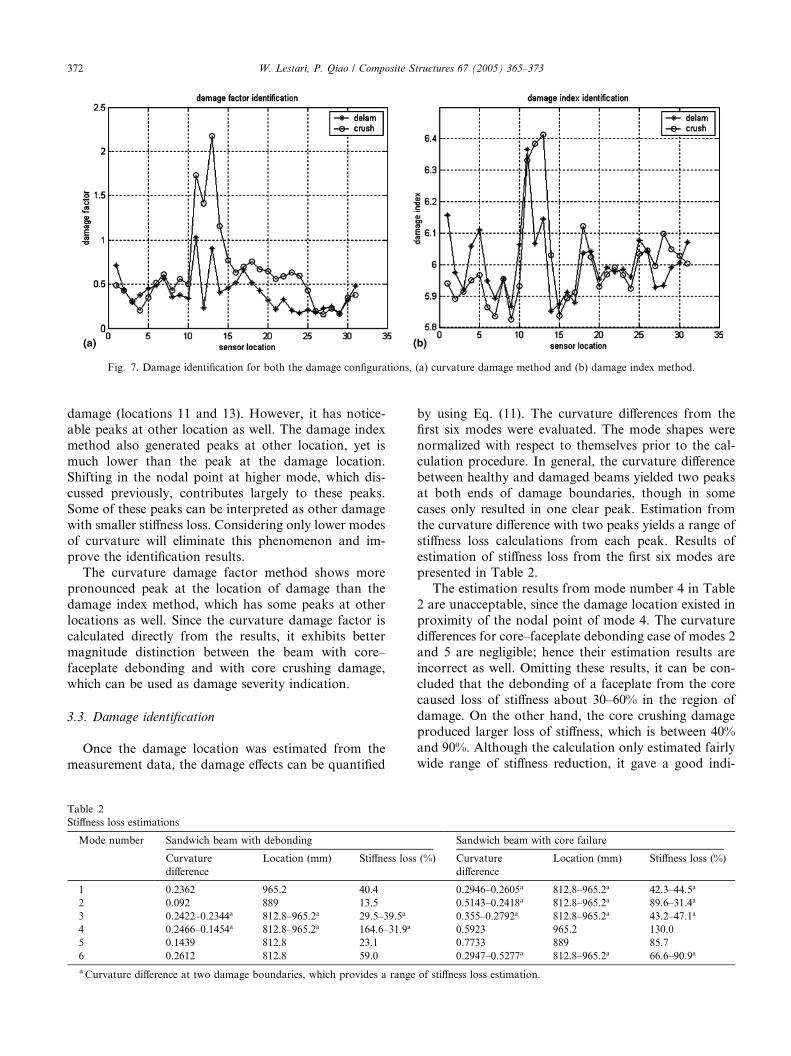
Fig. 7. Damage identification for both the damage configurations, (a) curvature damage method and (b) damage index method.
372 W. Lestari, P. Qiao / Composite Structures 67 (2005) 365–373
damage (locations 11 and 13). However, it has notice-able peaks at other location as well. The damage index
method also generated peaks at other location, yet is
much lower than the peak at the damage location.
Shifting in the nodal point at higher mode, which dis-
cussed previously, contributes largely to these peaks.
Some of these peaks can be interpreted as other damage
with smaller stiffness loss. Considering only lower modes
of curvature will eliminate this phenomenon and im-prove the identification results.
The curvature damage factor method shows more
pronounced peak at the location of damage than the
damage index method, which has some peaks at other
locations as well. Since the curvature damage factor is
calculated directly from the results, it exhibits better
magnitude distinction between the beam with core–
faceplate debonding and with core crushing damage,which can be used as damage severity indication.
3.3. Damage identification
Once the damage location was estimated from the
measurement data, the damage effects can be quantified
Table 2
Stiffness loss estimations
Mode number Sandwich beam with debonding
Curvature
difference
Location (mm) Stiffness loss
1 0.2362 965.2 40.4
2 0.092 889 13.5
3 0.2422–0.2344a 812.8–965.2a 29.5–39.5a
4 0.2466–0.1454a 812.8–965.2a 164.6–31.9a
5 0.1439 812.8 23.1
6 0.2612 812.8 59.0
aCurvature difference at two damage boundaries, which provides a range
by using Eq. (11). The curvature differences from thefirst six modes were evaluated. The mode shapes were
normalized with respect to themselves prior to the cal-
culation procedure. In general, the curvature difference
between healthy and damaged beams yielded two peaks
at both ends of damage boundaries, though in some
cases only resulted in one clear peak. Estimation from
the curvature difference with two peaks yields a range of
stiffness loss calculations from each peak. Results ofestimation of stiffness loss from the first six modes are
presented in Table 2.
The estimation results from mode number 4 in Table
2 are unacceptable, since the damage location existed in
proximity of the nodal point of mode 4. The curvature
differences for core–faceplate debonding case of modes 2
and 5 are negligible; hence their estimation results are
incorrect as well. Omitting these results, it can be con-cluded that the debonding of a faceplate from the core
caused loss of stiffness about 30–60% in the region of
damage. On the other hand, the core crushing damage
produced larger loss of stiffness, which is between 40%
and 90%. Although the calculation only estimated fairly
wide range of stiffness reduction, it gave a good indi-
Sandwich beam with core failure
(%) Curvature
difference
Location (mm) Stiffness loss (%)
0.2946–0.2605a 812.8–965.2a 42.3–44.5a
0.5143–0.2418a 812.8–965.2a 89.6–31.4a
0.355–0.2792a 812.8–965.2a 43.2–47.1a
0.5923 965.2 130.0
0.7733 889 85.7
0.2947–0.5277a 812.8–965.2a 66.6–90.9a
of stiffness loss estimation.
W. Lestari, P. Qiao / Composite Structures 67 (2005) 365–373 373
cation of damage magnitudes due to two different
damages. Results from the high modes might not as
reliable as the lower ones, since the nodal point shifting
affected damage magnitude. The assumption in theanalytical relationship used for estimation calculation,
which did not take into account the shifting of nodal
points, added discrepancy of the results at high mode as
well. Nonetheless, this method, which provides the
quantitative estimation based on the curvature differ-
ence, indicates the local effect of damage, instead of the
global effect of damage generally offered by the fre-
quency-based method.
4. Conclusions
In this study, a damage detection and structural
health monitoring procedure based on curvature mode
shapes and using piezoelectric smart sensors is devel-oped. It indicated that the proposed technique can be
effectively and appropriately applied to full scale com-
posite structures (e.g., large FRP honeycomb sandwich
structures) suitable for civil infrastructure. The locations
of the damage for both damage configurations (i.e., the
core–faceplate debonding and core crushing, respec-
tively) were identified properly using the curvature
damage factor and damage index method, while themagnitude of the damage was evaluated through the
stiffness loss. The damage detection technique proposed
in this study can be implemented in inherent damage
identification and health monitoring of large civil com-
posite structures.
Although the implementation of the method is quite
simple, a great care needs to be taken while generating
experimental data. Number of measurement points willdefine the maximum number of mode shapes generated.
The larger number of measurement points is, the more
mode shapes can be generated. However, using the
lower curvature modes yields better results than using
the higher modes, as at higher modes the nodal curva-
ture points of damaged modes shifting from the original
position of undamaged modes. In addition, this curva-
ture mode-based method offers information on localeffects of damage. Piezoelectric smart sensors provide
direct extraction of the modal curvature conveniently,
without estimation calculation using central difference
method as for the modal displacement measurement.
Acknowledgements
The test samples were provided by the KSCI, and we
thank Dr. Jerry Plunkett of KSCI and Prof. Julio F.
Davalos of West Virginia University for their technical
contribution and support. Partial financial support for
this study is received from the National Science Foun-
dation––Partnerships for Innovation program (EHR-
0090472) and the Ohio Aerospace Institute––Collabo-
rative Core Research Program (OAI-CCRP#2002-04).
References
[1] Plunkett JD. Fiber-reinforcement polymer honeycomb short span
bridge for rapid installation. IDEA Project Report, Washington,
DC, 1997.
[2] Keller T. Recent all-composite and hybrid fibre-reinforced poly-
mer bridges and building. Prog Struct Eng Mater 2001;3:132–40.
[3] Davalos JF, Qiao P, Xu XF, Robinson J, Barth KE. Modeling
and characterization of fiber-reinforcement plastic honeycomb
sandwich panels for highway bridge applications. Compos Struct
2001;52(3–4):441–52.
[4] Xu XF, Qiao P, Davalos JF. Transverse shear stiffness of
composite honeycomb core with general configuration. J Eng
Mech 2001;127(11):1144–51.
[5] Xu XF, Qiao P. Homogenized elastic properties of honeycomb
sandwich with skin effect. Int J Solids Struct 2002;39(8):2153–88.
[6] Schwartz MM. Composite materials––properties, nondestructive test-
ing, and repair. Upper Saddle River, NJ: Prentice Hall PTR; 1997.
[7] Salawu OS. Detection of structural damage through changes in
frequency: a review. Eng Struct 1996;19(9):718–23.
[8] Zou Y, Tong L, Steven GP. Vibration-based model-dependent
damage (delamination) identification and health monitoring for
composites structures––a review. J Sound Vib 2000;230(2):357–78.
[9] Pandey AK, Biswas M, Samman MM. Damage detection from
changes in curvature mode shapes. J Sound Vib 1991;145(2):321–32.
[10] Salawu OS, Williams C. Damage location using vibration mode
shapes. International Modal Analysis Conference, vol. 1, 1994.
p. 933–9.
[11] Pabst U, Hegedorn P. On the identification of localized losses of
stiffness in structures. ASME, DE 1993;59:99–104.
[12] Luo H, Hanagud S. An integral equation for changes with
structural dynamics characteristics of damaged structures. Int J
Solid Struct 1997;34(35–36):4557–79.
[13] Stubbs C, Kim JT. Damage localization without baseline modal
parameter. AIAA J 1996;34(8):1644–9.
[14] Keilers Jr CH, Chang FK. Identifying delamination in composite
beams using built-in piezoelectrics: part I-experiments and anal-
ysis. J Intell Mater Syst Struct 1995;6:649–63.
[15] Sampaio RPC, Maia NMM, Silva JMM. Damage detection using
the frequency-response-function curvature method. J Sound Vib
1999;226(5):1029–42.
[16] Schulz MJ, Pai PF, Inman DJ. Health monitoring and active
control of composite structures using piezoceramic patches.
Composites Part B: Eng 1999;30(7):713–25.
[17] Lestari W, Hanagud S. Detection of an edge notch defect by using
a single mode based methods. In: Proceedings of 3rd International
Workshop on SHM 2001. p. 1343–55.
[18] Abdel Wahab MM, De Roeck G. Damage detection in bridges
using modal curvatures: application to a real damage scenario.
J Sound Vib 1999;226(2):217–35.
[19] Maeck J, Peeters B, De Roeck G. Damage identification on the
Z24 bridge using vibration monitoring. Smart Mater Struct
2001;10(3):512–7.
[20] Farrar CR, Jauregui DA. Comparative study of damage identi-
fication algorithms applied to a bridge: I. Experiment. Smart
Mater Struct 1998;7(5):704–19.
[21] Lestari W. Damage in composite structures: detection technique,
dynamic response and residual strength, Ph.D. thesis, Georgia
Institute of Technology, Atlanta, GA, 2001.
[22] Qiao P, Wang J. On the mechanics of composite sinusoidal
honeycomb cores. J Aerospace Eng, ASCE, in press.