dahan-shoval-sturm - re-14 - comparing the impact of oo-dfd and use case methods
TRANSCRIPT

ORIGINAL ARTICLE
Comparing the impact of the OO-DFD and the Use Case methodsfor modeling functional requirements on comprehensionand quality of models: a controlled experiment
Michal Dahan • Peretz Shoval • Arnon Sturm
Received: 2 April 2011 / Accepted: 4 May 2012 / Published online: 31 May 2012
� Springer-Verlag London Limited 2012
Abstract Users’ requirements of an information system
are modeled in the analysis phase of the development
process. The requirements can be modeled with various
modeling methods. In this study, we compare two alter-
native methods for modeling the functional requirements:
one is the UML Use Case (UC) model; the other is OO-
DFD transaction (Object-Oriented DFD is a variant of DFD
that includes data classes rather than ‘‘traditional’’ data
stores). Each of these modeling methods consists of dia-
grams accompanied with narrative, semi-structured
descriptions explaining their details. We conducted a
controlled experiment that compared the comprehension of
the two models (i.e., the diagrams and their descriptions) of
a certain system and the quality of models created for a
certain system with each of the two modeling methods. The
main results of the experiment are that models created with
the UC method are of better quality than models created
with the OO-DFD transaction method because the former
are simpler and less detailed; creating highly detailed
models are error prone. Interestingly, in spite of the dif-
ference in the level of detail and structure, the experiment
reveals no significant difference in comprehension of
models of the two methods. The results call for improve-
ment of the modeling methods in a way that considers the
advantages of each of them, and thus we propose an
improved method sketch that we call Enhanced Use Case,
which will be evaluated in future work.
Keywords Functional analysis � IS development �Modeling methods � User requirements � Use Case � UML �FOOM � OO-DFD
1 Introduction
Elicitation and modeling the users’ requirements from an
information system is a very important task, for which
many methods were introduced over the years. A few
examples are discussed below.
i* [37] is a framework that attempts to deal with activities
that precede the formulation of the initial requirements.
These ‘‘early phase’’ requirements engineering activities
include those that consider how the intended system would
meet organizational goals, why the system is needed, what
alternatives might exist, what the implications of the alter-
natives are for various stakeholders, and how the stake-
holders’ interests and concerns might be addressed. The
emphasis in i* is on understanding the ‘‘whys’’ that underlie
system requirements, rather than on the precise and detailed
specification of ‘‘what’’ the system should do, which is
modeled with other modeling methods.
Business Process Modeling Notation (BPMN) [35]
provides a notation that is readily understandable by all
business users, from business analysts who create the initial
drafts of the processes, to technical developers who are
responsible for implementing the technology that will
perform those processes, and finally, to the business people
who will manage and monitor those processes. BPMN
defines a Business Process Diagram (BPD), which is based
on a flowcharting technique tailored for creating graphical
M. Dahan � P. Shoval (&) � A. Sturm
Department of Information Systems Engineering,
Ben-Gurion University, 84105 Beer-Sheva, Israel
e-mail: [email protected]
M. Dahan
e-mail: [email protected]
A. Sturm
e-mail: [email protected]
123
Requirements Eng (2014) 19:27–43
DOI 10.1007/s00766-012-0155-2

models of business process operations. Business process
modeling is used to communicate a wide variety of infor-
mation to different audiences and provides much more
information on the business process than just modeling the
functional requirements of the users from the system.
The early systems analysis and design methodologies,
which emerged in the late 1970s, utilized Data Flow Dia-
grams (DFD) as their main modeling technique. Most
notable examples for such methodologies are DeMarco
[10] and Gane and Sarson [12]. One of the biggest prob-
lems with the ‘‘traditional’’ methodologies was in the
transition from the analysis phase to the design phase,
which was not smooth and caused many problems. Spe-
cifically, it was not easy to convert the DFDs, products of
the analysis phase, to Structure Charts, which were then a
common method for designing the application programs. In
order to deal with this and other problems, Shoval [30]
developed the ADISSA methodology, which enables a
smooth transition from the analysis phase and its DFDs to
the design phase. This was done by defining the concept of
DFD transactions. A DFD transaction is an independent
process performed by the information system to support a
user’s task. According to ADISSA, all transactions of a
system are derived from the DFDs: each transaction con-
sists of one or more elementary functions that are chained
by data flows, and of external entities and data stores that
are too connected with data flows to these functions. The
process logic of each transaction is defined and described
using pseudo-code. Later on in the design phase, the
transaction descriptions are more detailed and other com-
ponents of the system are designed, notably the application
programs, the user interface (menus trees), the input and
output screens and reports, and the relational database
schema.
With the emergence of Object-Oriented (OO) develop-
ment methodologies, Shoval enhanced ADISSA and created
FOOM—Functional and Object-Oriented Methodology,
which combines the functional and OO approaches [31, 32].
According to FOOM, two main models are created in the
analysis phase: a conceptual data model and a functional
model. The conceptual data model is an initial class diagram
that consists of the data classes, attributes, and various
relationships between classes (but with no methods yet). The
functional model consists of OO-DFDs, which are similar to
the traditional DFDs, but instead of data stores, they include
data classes, which are taken from the initial class diagram.
As in ADISSA, the OO-DFDs are then decomposed into
transaction diagrams, and then their process logic is descri-
bed. Later on, the transaction descriptions are decomposed
into class methods, which are attached to proper classes in
the class diagram.
In the early 1990s, many OO analysis and design meth-
odologies emerged, replacing the traditional, functional-
oriented methodologies. Some of the famous ones were
OOA/OOD [7], OMT [29], and Booch method [4]. Rumb-
augh’s and Booch’s methodologies became very popular,
and in 1995, they joined forces and created the Unified
Method (UM). Later on, Jacobson joined the two with his
comprehensive method ObjectOry [17], thus creating the
Unified Modeling Language (UML) [5]. Since the mid
1990s, UML became a ‘‘de facto standard’’ for modeling
systems based on the OO approach. UML consists of over 15
types of diagrammatic modeling methods. One of the most
popular of them, which is used for modeling the users’
functional requirements, is the Use Case (UC) model.
In this study, we compare the UC model of UML and
the OO-DFD transaction diagrams of FOOM. The two
models have many things in common. In essence, a UC and
a transaction have the same objective: to define and
describe an independent task performed by the system to
support a user. The similarity between the two modeling
methods was also noted by Ramsin and Paige [27] who
compared various object-oriented development methodol-
ogies. Yet, the two methods differ in the variety of com-
ponents included in the respective diagrams, and in the
structure of the description accompanying the diagrams (as
will be elaborated later on). The main objective of this
study is to compare between these alternative functional
requirements modeling methods and to find out and ana-
lyze the strengths and weaknesses of each.
The importance of comparing alternative modeling
methods stems also from the evolution of the model-driven
development approach, which claims that models (rather
than the code) serve as the system’s backbone. Accord-
ingly, it is important to compare and analyze the differ-
ences between ‘‘competing’’ modeling methods. Modeling
methods can be similar or different from various perspec-
tives; in this study we compare between the two modeling
methods mainly from the point of view of understanding
models and creating correct models. Such comparisons are
important not only from an ‘‘academic’’ viewpoint but also
from the pragmatic one, because it might guide analysts/
designers regarding which modeling method to adopt and
use. Furthermore, due to insights gained regarding the
strengths and weaknesses of the two modeling methods, we
are able to propose how to improve each of them and also
to propose a hybrid modeling method that combines the
strong parts of each of them.
The rest of this paper is structured as follows: Sect. 2
provides a background on the two modeling methods and
surveys related studies on empirical evaluations of mod-
eling methods, specifically on comparisons between the
DFD and UC methods. Section 3 describes the planning of
the controlled experiment, and Sect. 4 presents the results.
Section 5 discusses the evaluation of the results, presents a
new proposal for a combined modeling method, and
28 Requirements Eng (2014) 19:27–43
123
discusses threats to the validity of the experiment. Finally,
in Sect. 6, we discuss the experiment conclusions and set
the plans for future research.
2 Background
2.1 Two functional modeling methods: OO-DFD
and Use Case
2.1.1 OO-DFD
An OO-DFD, according to FOOM, is a DFD adapted to the
OO world: instead of data stores, it includes data classes—
classes that are already defined in the initial class diagram
of the application, which is created prior to that. Then,
using certain rules, the OO-DFDs are decomposed into
transaction diagrams. Each transaction consists of one or
more elementary functions that are chained by data flows,
and of the external entities and data classes that are too
connected with data flows to those functions. After this
decomposition, the process logic of each transaction is
defined and described. At first, a top-level (i.e., general)
description is created. Later on, the transaction description
is more detailed, taking into consideration the inputs and
outputs/reports involved in each transaction; and the
reading and writing of data from/to the data classes. In a
later stage, each transaction description is decomposed into
methods that are attached to proper classes. But this paper
deals only with the functional modeling aspect of this
methodology, as expressed by transaction diagrams and
their top-level descriptions.
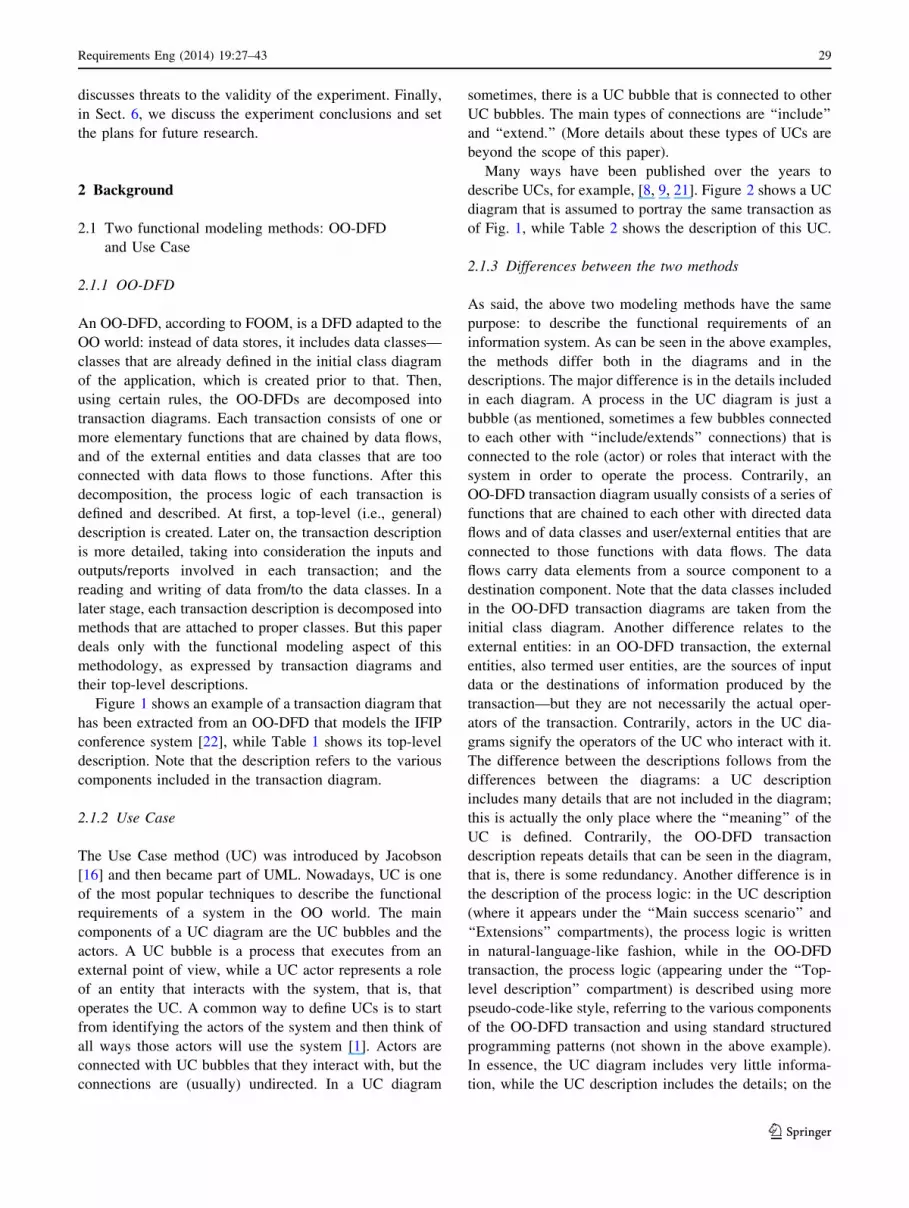
Figure 1 shows an example of a transaction diagram that
has been extracted from an OO-DFD that models the IFIP
conference system [22], while Table 1 shows its top-level
description. Note that the description refers to the various
components included in the transaction diagram.
2.1.2 Use Case
The Use Case method (UC) was introduced by Jacobson
[16] and then became part of UML. Nowadays, UC is one
of the most popular techniques to describe the functional
requirements of a system in the OO world. The main
components of a UC diagram are the UC bubbles and the
actors. A UC bubble is a process that executes from an
external point of view, while a UC actor represents a role
of an entity that interacts with the system, that is, that
operates the UC. A common way to define UCs is to start
from identifying the actors of the system and then think of
all ways those actors will use the system [1]. Actors are
connected with UC bubbles that they interact with, but the
connections are (usually) undirected. In a UC diagram
sometimes, there is a UC bubble that is connected to other
UC bubbles. The main types of connections are ‘‘include’’
and ‘‘extend.’’ (More details about these types of UCs are
beyond the scope of this paper).
Many ways have been published over the years to
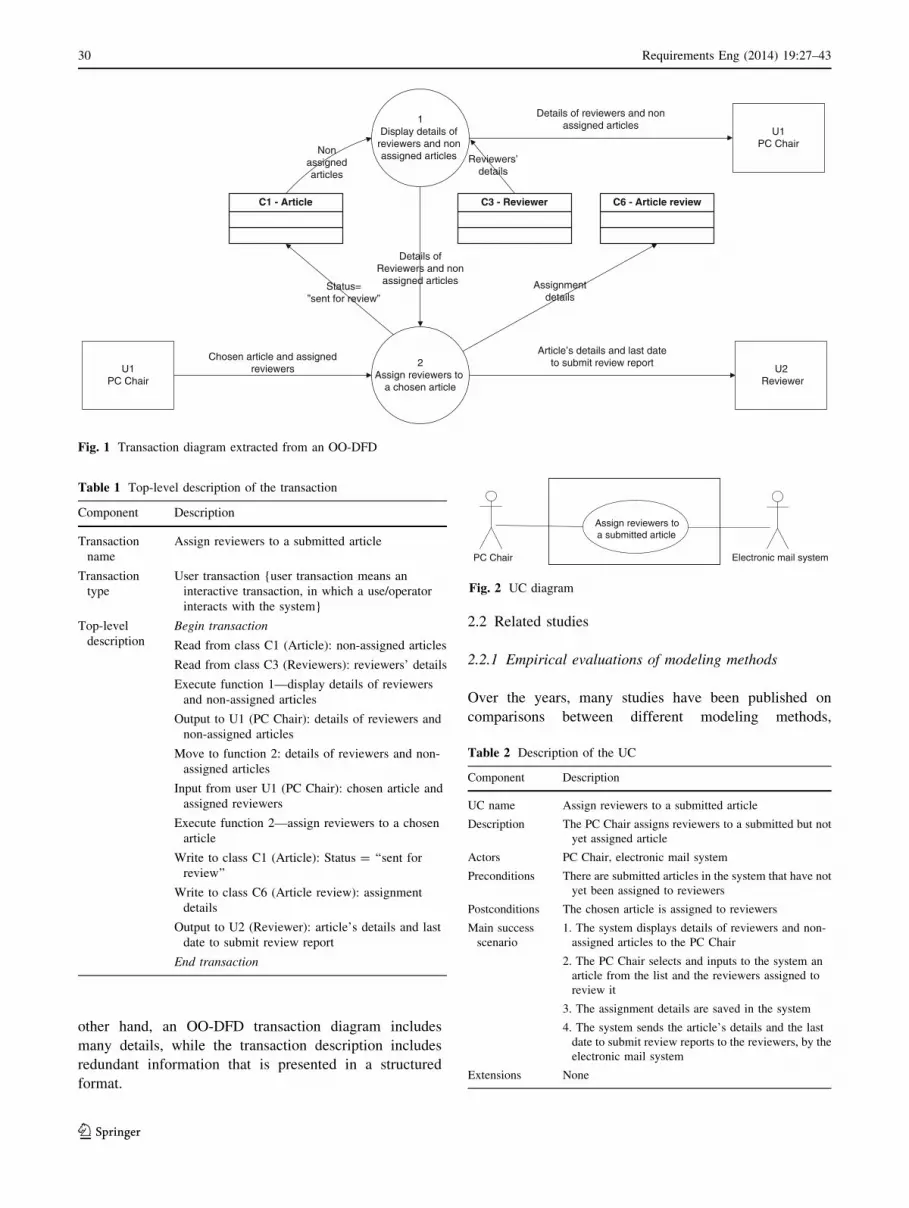
describe UCs, for example, [8, 9, 21]. Figure 2 shows a UC
diagram that is assumed to portray the same transaction as
of Fig. 1, while Table 2 shows the description of this UC.
2.1.3 Differences between the two methods
As said, the above two modeling methods have the same
purpose: to describe the functional requirements of an
information system. As can be seen in the above examples,
the methods differ both in the diagrams and in the
descriptions. The major difference is in the details included
in each diagram. A process in the UC diagram is just a
bubble (as mentioned, sometimes a few bubbles connected
to each other with ‘‘include/extends’’ connections) that is
connected to the role (actor) or roles that interact with the
system in order to operate the process. Contrarily, an
OO-DFD transaction diagram usually consists of a series of
functions that are chained to each other with directed data
flows and of data classes and user/external entities that are
connected to those functions with data flows. The data
flows carry data elements from a source component to a
destination component. Note that the data classes included
in the OO-DFD transaction diagrams are taken from the
initial class diagram. Another difference relates to the
external entities: in an OO-DFD transaction, the external
entities, also termed user entities, are the sources of input
data or the destinations of information produced by the
transaction—but they are not necessarily the actual oper-
ators of the transaction. Contrarily, actors in the UC dia-
grams signify the operators of the UC who interact with it.
The difference between the descriptions follows from the
differences between the diagrams: a UC description
includes many details that are not included in the diagram;
this is actually the only place where the ‘‘meaning’’ of the
UC is defined. Contrarily, the OO-DFD transaction
description repeats details that can be seen in the diagram,
that is, there is some redundancy. Another difference is in
the description of the process logic: in the UC description
(where it appears under the ‘‘Main success scenario’’ and
‘‘Extensions’’ compartments), the process logic is written
in natural-language-like fashion, while in the OO-DFD
transaction, the process logic (appearing under the ‘‘Top-
level description’’ compartment) is described using more
pseudo-code-like style, referring to the various components
of the OO-DFD transaction and using standard structured
programming patterns (not shown in the above example).
In essence, the UC diagram includes very little informa-
tion, while the UC description includes the details; on the
Requirements Eng (2014) 19:27–43 29
123
other hand, an OO-DFD transaction diagram includes
many details, while the transaction description includes
redundant information that is presented in a structured
format.
2.2 Related studies
2.2.1 Empirical evaluations of modeling methods
Over the years, many studies have been published on
comparisons between different modeling methods,
1Display details of
reviewers and nonassigned articles
U1PC Chair
Details of reviewers and non assigned articles
Chosen article and assigned reviewers
Status=”sent for review”
U2Reviewer
Article’s details and last date to submit review report
Non assigned articles
Reviewers’details
Details of Reviewers and non
assigned articles
U1PC Chair
Assignment details
C1 - Article
2Assign reviewers to
a chosen article
C3 - Reviewer C6 - Article review
Fig. 1 Transaction diagram extracted from an OO-DFD
Table 1 Top-level description of the transaction
Component Description
Transaction
name
Assign reviewers to a submitted article
Transaction
type
User transaction {user transaction means an
interactive transaction, in which a use/operator
interacts with the system}
Top-level
description
Begin transaction
Read from class C1 (Article): non-assigned articles
Read from class C3 (Reviewers): reviewers’ details
Execute function 1—display details of reviewers
and non-assigned articles
Output to U1 (PC Chair): details of reviewers and
non-assigned articles
Move to function 2: details of reviewers and non-
assigned articles
Input from user U1 (PC Chair): chosen article and
assigned reviewers
Execute function 2—assign reviewers to a chosen
article
Write to class C1 (Article): Status = ‘‘sent for
review’’
Write to class C6 (Article review): assignment
details
Output to U2 (Reviewer): article’s details and last
date to submit review report
End transaction
Assign reviewers toa submitted article
PC Chair Electronic mail system
Fig. 2 UC diagram
Table 2 Description of the UC
Component Description
UC name Assign reviewers to a submitted article
Description The PC Chair assigns reviewers to a submitted but not
yet assigned article
Actors PC Chair, electronic mail system
Preconditions There are submitted articles in the system that have not
yet been assigned to reviewers
Postconditions The chosen article is assigned to reviewers
Main success
scenario
1. The system displays details of reviewers and non-
assigned articles to the PC Chair
2. The PC Chair selects and inputs to the system an
article from the list and the reviewers assigned to
review it
3. The assignment details are saved in the system
4. The system sends the article’s details and the last
date to submit review reports to the reviewers, by the
electronic mail system
Extensions None
30 Requirements Eng (2014) 19:27–43
123

including comparisons between different methods and
frameworks for modeling users’ requirements.
Bass et al. [3] evaluated five methods for elicitation and
expression of requirements with respect to their ability to
capture architecturally significant requirements. The eval-
uated methods included: natural language, use case, quality
attribute workshop (QAW), global analysis, and O’Brien’s
approach. The main conclusions were that QAW is the
most expressive method for specifying unambiguous
requirements, and that O’Brien’s approach is the only
method that addresses business goals explicitly. The other
methods rely on the stakeholders to translate business and
mission goals into requirements.
Hadar et al. [14] present an empirical study that com-
pares Use Case and Tropos, a goal-oriented approach. The
authors’ objective was to evaluate different levels of
comprehension of requirements models expressed in both
methods, as well as to estimate the time required to per-
form simple analysis tasks. Preliminary results show that
Tropos models seem to be more comprehensible to novice
requirements analysts, although more time consuming than
Use Case models.
Topi and Ramesh [34] surveyed many studies pub-
lished between 1978 and 2001 that employed laboratory
experiments to evaluate the usability of data models/
methods. They found out that the most frequent inde-
pendent variable in those studies was the data model; the
next category of independent variables consists of user
characteristics, for example, experience, education, and
intellectual ability; other independent variables are task
characteristics, for example, comprehension and task
complexity. The dependent variables are mostly model
correctness, time used to create the model, declarative
knowledge (understanding of the notation), and attitude.
In most cases, the correctness of a model has been
measured according to the degree to which it corresponds
to a predefined solution. Attitude includes mainly pref-
erence to use a certain model and perceived ease of use.
There are studies that take an analyst/designer/modeler
perspective; these are mainly concerned with measuring
performance—usually model correctness. Other studies
that take a user perspective are mainly concerned with
measuring comprehensibility of models and preference of
models by users. For example, Peleg and Dori [26]
compared two methodologies: OPM/T, a variant of OPM
for real-time systems, and OMT/T, a similar variant of
OMT. The study included comparison of both data
modeling and process specifications from the points of
view of comprehension and quality. The authors found
that in more cases, OPM specifications were more com-
prehensible than OMT specifications. The authors also
found that OPM analysts produced significantly better
diagrams than OMT analysts. Kabeli and Shoval [19]
compared OPM and FOOM in two controlled experiments
from the point of view of users and analysts. Their main
results were that FOOM analysis specifications are more
comprehensible to users than those based on OPM,
whereas in terms of the data model, there is no significant
difference. From the analysts’ point of view, they com-
pared quality, that is, correctness of specifications. The
main results of these experiments were that analysts
create more correct specifications with FOOM method-
ology than with OPM.
2.2.2 Empirical comparisons of DFD and UC modeling
methods
As we have seen, many studies have evaluated and com-
pared different modeling methods that may be used for the
same purpose. Therefore, it is only natural to compare
the DFD with the UC modeling methods, since they have
the same purpose: to define the users’ functional require-
ments. In this section, we review studies that have com-
pared between these two methods.
Millet and Nelson [23] compared DFDs and UCs using
questionnaires. During 2003–2006, the course of system
analysis was offered 12 times, each time to different stu-
dents but all times by the same lecturers. In each semester,
the course was given to two different groups in parallel,
and the researches split the students into two groups: stu-
dents in one group had to perform a DFD task and then a
UC task, and students in the other group had to perform a
UC task and then a DFD task. All tasks included only
diagrams, without descriptions. The first task of the first
group was to analyze with several DFD’s a simple ‘‘work
order’’ system including only 3 processes and 3 external
entities, while using a certain CASE tool; the participants
had 2 days to complete this task. Afterward, the partici-
pants learned the UC method and were given the second
task—to analyze the same system with UCs using another
CASE tool; the participant had 2 days to complete this
task. For the second group, the order of learning and tasks
was the opposite. After completing the two tasks, each
participant was asked to answer a questionnaire with five
claims on each of the methods, using a 1–7 point scale. For
example, one claim was: ‘‘This methodology is easy to
understand.’’ The results showed that the participants found
the DFD method better in its effect on helping systems
analysts communicate requirements to programmers, but
they did not find differences between the methods in all
other claims.
This research has several drawbacks. One is the use of a
questionnaire only, that is, the results are based solely on
the participants’ opinions regarding the five claims.
Requirements Eng (2014) 19:27–43 31
123

Although the tasks of the participants were to analyze
(though very small) systems, the correctness or quality of
their solutions were neither examined nor compared.
Another problem is that the students had to use two dif-
ferent CASE tools; there is a possibility that the learning
process and usability of these tools had some impact on the
students’ opinions about the modeling methods. Note also
that the students had 2 days to complete each task; it means
that there was not enough control on the process of solving
the tasks by the students. Finally, this experiment dealt
only with comprehension of diagrams.
Jeyayaj and Sauter [18] too compared between the DFD
and the UC modeling methods. In their experiment, the
participants were 4 classes of business administration stu-
dents, who did not learn the examined methods, and 5
classes of MIS students, who did learn and practiced with
the examined methods. The business administration stu-
dents were considered novice users, while the MIS students
were considered experienced users. The differences
between the methods were examined from the point of
view of comprehension of diagrams. A student registration
system was modeled into a DFD diagram and a UC dia-
gram. (Each diagram included several DFDs/UCs, but there
is no mention of their descriptions). Each participant was
asked to explain in free text what he/she understands from
each diagram. The participants were given a week to
complete the first task and then another week to complete
the second task. The participants (of either type) were split
into two groups, one receiving the DFD task prior to the
UC task and the other receiving the UC task prior to the
DFD task. The overall conclusion of this research was that
for experienced users, the DFD method provides a better
tool to describe functional requirements, while for the
novice users, no difference was found between the
methods.
This research too has several drawbacks. First, the par-
ticipants were asked to provide free-text explanations of
what is seen in the given diagrams, which was then coded
into some numbers; this is not a precise way to measure
comprehension. Secondly, the students had a week to
complete each task, so here too there was not enough
control on the process. Third, this experiment too dealt
only with comprehension of diagrams.
In summary, the above studies on the comparison
between DFDs and UCs suffer from many limitations. In
particular, they deal only with comprehension of dia-
grams. In our research, we compare the two alternative
modeling methods from the points of view of both
comprehension and quality of model created by analysts.
In our comparison, we use OO-DFDs, which include data
classes rather than data stores in traditional DFDs; this
enables us to compare two methods that may be used
equivalently for defining functional requirements in an
object-oriented development process. Note that we do not
compare UCs with OO-DFDs, but rather with the trans-
actions that are derivable from them, because actually it is
the transactions that are equivalent to UCs, while DFDs
have other components and characteristics that do not
exist in UCs (for example, DFDs express hierarchical
decomposition of functionality, which has no equivalent
in UCs). In the next sections, we describe the experiment
planning and analyze the results, following the guidelines
for reporting experimental research as specified by
Wohlin et al. [36].
3 Experiment planning
3.1 Goals
As said, our objective is to compare the two alternative
functional modeling methods: UCs and their descriptions
versus OO-DFD transaction and their descriptions. The
comparison between the methods is performed based on six
goals:
G1: Comprehension of models—we ask whether there is
a difference in the understanding of the models (i.e.,
diagrams and descriptions) by users.
G2: Quality of created models—we ask whether there is
a difference in the quality of models created by
modelers.
G3: Time taken to understand—we ask whether there is
a difference in the time it takes to understand given
models.
G4: Time taken to model—we ask whether there is a
difference in the time it takes to create models.
G5: Perceived comprehension of modeling methods—
we ask whether there is a difference in the comprehen-
sion of the modeling methods as perceived by users.
G6: Perceived quality of modeling methods—we ask
whether there is a difference in the quality of the
modeling methods as perceived by modelers.
We compared the two methods in a controlled experi-
ment in quasi-laboratory setting, where we address the
above goals. The experiment involved two tasks: the first
task was of understanding diagrams and descriptions rep-
resenting the functional requirements of a certain system;
the second task was of creating diagrams and descriptions
from a requirements document of a certain (other) system.
The participants were divided into two homogeneous
groups; each participant in each group had to perform the
two tasks using one of the two methods: the first task was
of understanding given models, and the second, of creating
models. Thus, we designed an experiment of one factor
with two treatments.
32 Requirements Eng (2014) 19:27–43
123
3.2 Hypotheses and the research models
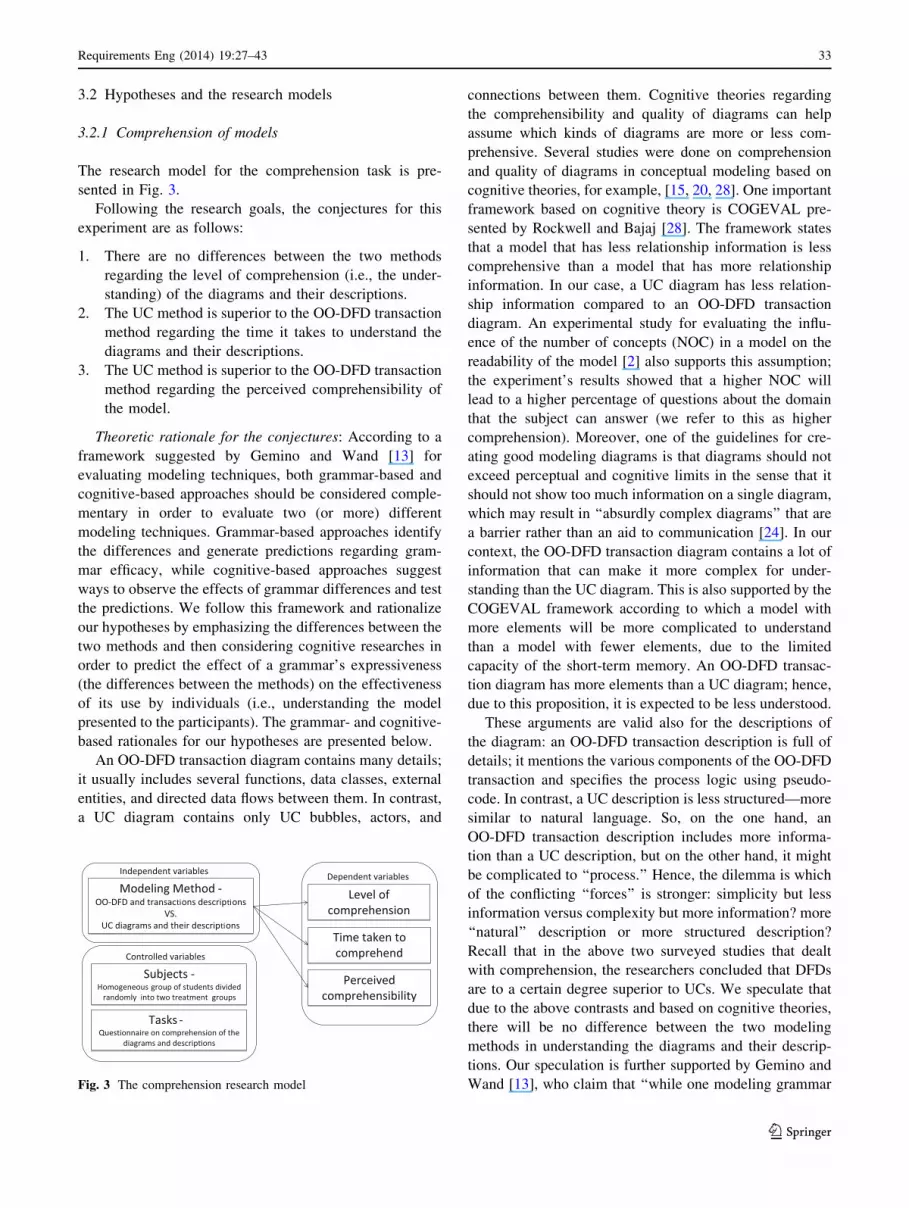
3.2.1 Comprehension of models
The research model for the comprehension task is pre-
sented in Fig. 3.
Following the research goals, the conjectures for this
experiment are as follows:
1. There are no differences between the two methods
regarding the level of comprehension (i.e., the under-
standing) of the diagrams and their descriptions.
2. The UC method is superior to the OO-DFD transaction
method regarding the time it takes to understand the
diagrams and their descriptions.
3. The UC method is superior to the OO-DFD transaction
method regarding the perceived comprehensibility of
the model.
Theoretic rationale for the conjectures: According to a
framework suggested by Gemino and Wand [13] for
evaluating modeling techniques, both grammar-based and
cognitive-based approaches should be considered comple-
mentary in order to evaluate two (or more) different
modeling techniques. Grammar-based approaches identify
the differences and generate predictions regarding gram-
mar efficacy, while cognitive-based approaches suggest
ways to observe the effects of grammar differences and test
the predictions. We follow this framework and rationalize
our hypotheses by emphasizing the differences between the
two methods and then considering cognitive researches in
order to predict the effect of a grammar’s expressiveness
(the differences between the methods) on the effectiveness
of its use by individuals (i.e., understanding the model
presented to the participants). The grammar- and cognitive-
based rationales for our hypotheses are presented below.
An OO-DFD transaction diagram contains many details;
it usually includes several functions, data classes, external
entities, and directed data flows between them. In contrast,
a UC diagram contains only UC bubbles, actors, and
connections between them. Cognitive theories regarding
the comprehensibility and quality of diagrams can help
assume which kinds of diagrams are more or less com-
prehensive. Several studies were done on comprehension
and quality of diagrams in conceptual modeling based on
cognitive theories, for example, [15, 20, 28]. One important
framework based on cognitive theory is COGEVAL pre-
sented by Rockwell and Bajaj [28]. The framework states
that a model that has less relationship information is less
comprehensive than a model that has more relationship
information. In our case, a UC diagram has less relation-
ship information compared to an OO-DFD transaction
diagram. An experimental study for evaluating the influ-
ence of the number of concepts (NOC) in a model on the
readability of the model [2] also supports this assumption;
the experiment’s results showed that a higher NOC will
lead to a higher percentage of questions about the domain
that the subject can answer (we refer to this as higher
comprehension). Moreover, one of the guidelines for cre-
ating good modeling diagrams is that diagrams should not
exceed perceptual and cognitive limits in the sense that it
should not show too much information on a single diagram,
which may result in ‘‘absurdly complex diagrams’’ that are
a barrier rather than an aid to communication [24]. In our
context, the OO-DFD transaction diagram contains a lot of
information that can make it more complex for under-
standing than the UC diagram. This is also supported by the
COGEVAL framework according to which a model with
more elements will be more complicated to understand
than a model with fewer elements, due to the limited
capacity of the short-term memory. An OO-DFD transac-
tion diagram has more elements than a UC diagram; hence,
due to this proposition, it is expected to be less understood.
These arguments are valid also for the descriptions of
the diagram: an OO-DFD transaction description is full of
details; it mentions the various components of the OO-DFD
transaction and specifies the process logic using pseudo-
code. In contrast, a UC description is less structured—more
similar to natural language. So, on the one hand, an
OO-DFD transaction description includes more informa-
tion than a UC description, but on the other hand, it might
be complicated to ‘‘process.’’ Hence, the dilemma is which
of the conflicting ‘‘forces’’ is stronger: simplicity but less
information versus complexity but more information? more
‘‘natural’’ description or more structured description?
Recall that in the above two surveyed studies that dealt
with comprehension, the researchers concluded that DFDs
are to a certain degree superior to UCs. We speculate that
due to the above contrasts and based on cognitive theories,
there will be no difference between the two modeling
methods in understanding the diagrams and their descrip-
tions. Our speculation is further supported by Gemino and
Wand [13], who claim that ‘‘while one modeling grammarFig. 3 The comprehension research model
Requirements Eng (2014) 19:27–43 33
123

may be highly expressive and hence superior in a grammar-
based evaluation (in our case, OO-DFD transactions are
grammatically superior to use cases), a representation
created with that grammar might be overly complicated,
leading to difficulties in developing domain understanding
by the person viewing the model.’’
As for the time it might take to understand the models,
we believe that due to the simplicity of the UC diagram and
the more natural language used in the description, it will
take less time to understand UC models. Bajaj [2] also
shows that a higher NOC will lead to more time to answer
questions regarding schemas. This finding supports our
speculation that it will take less time to answer compre-
hension questions in the UC model. For the same reasons,
we speculate that users will perceive the UC method as
better than the alternative.
To examine the various conjectures, we formulate the
hypotheses as appears in Table 3.
3.2.2 Creation of models
The research model for the model creation task is presented
in Fig. 4.
Following the research goals, the conjectures for this
experiment are as follows:
1. The UC method is superior to the OO-DFD transaction
method regarding the quality of the diagrams and
descriptions created by analysts.
2. The UC method is superior to the OO-DFD transaction
method regarding the time it takes to create the
diagrams and descriptions.
3. The UC method is superior to the OO-DFD transaction
method regarding the perceived quality of the created
model.
Theoretic rationale for the conjectures: Based on the
grammatical differences between the two methods and on the
cognitive theories mentioned above, the COGEVAL
framework states that when a model requires a greater
number of simultaneous items to create the diagram, the
diagram is of less quality than a diagram of a model that
requires fewer numbers of items. An OO-DFD transaction
diagram includes more types of components compared to a
UC diagram, and so does the OO-DFD transaction descrip-
tion compared to a UC description. Moreover, a UC
description is simpler to create because it is mostly in natural
language, less detailed and less structured, while an
OO-DFD transaction description includes all the details/
components of the respective diagram, and the process logic
is expressed in pseudo-code. This implies that with UCs,
there are fewer ‘‘chances’’ to commit errors while writing the
descriptions. Hence, we speculate that the diagrams and
descriptions created with the UC method will be of better
quality than the alternative. Our speculation is also supported
by Bajaj [2], who claimed that increasing the number of
concepts (NOC) in a model makes it harder to create model
schemas from an analyst point of view. Hence, OO-DFD
transaction diagrams and description, which have more
concepts than UC diagrams and descriptions, will be harder
to create and thus will have more errors. For the same reason,
we assume that it will take less time to create UC models and
that analysts will perceive the UC method as better for
defining user requirements.
To examine the various conjectures, we formulate the
hypotheses as appears in Table 4.
3.3 The independent variables
The independent variable is the modeling method: UC or
OO-DFD transaction.
3.4 The dependent variables
a. In the comprehension experiment, the dependent
variables are as follows:
1. Comprehension of diagrams and their descriptions.
This variable is measured by a comprehension
Table 3 The comprehension hypotheses
Aspect H0 H1
Comprehension of models H01: Comp (UC) = Comp (DFD) H11: Comp (UC) = Comp (DFD)
Time taken to understand models H03: TComp (UC) = TComp (DFD) H13: TComp (UC) = TComp (DFD)
Perceived comprehension of modeling methods H05: PComp (UC) = PComp (DFD) H15: PComp (UC) = PComp (DFD)
Fig. 4 The quality of model creation research model
34 Requirements Eng (2014) 19:27–43
123

questionnaire consisting of true/false/can’t tell state-
ments about information included in the diagrams and
their descriptions. The same questions were used to
measure the comprehension of the two models.
2. Time taken to comprehend. This variable is measured
by the time (in minutes) taken by participants to
complete the comprehension task.
3. Perceived comprehensibility of models, that is, the
participants’ opinion regarding the ease of understand-
ing the diagrams and descriptions. This variable is
measured using a 7-point scale.
b. In the modeling experiment, the dependent variables
are as follows:
1. Quality of the diagrams and their descriptions. The
participants create models based on a requirements
document of a certain (other) system. The quality of a
created model is the degree to which the diagrams and
descriptions describe correctly and accurately the
requirements of the system. Quality is determined by
graders who were assisted with an expert solution.
2. Time taken to create models. This variable is measured
by the time (in minutes) taken by participants to
complete the model creation task.
3. Perceived quality of modeling methods, that is, the
participants’ opinion regarding how good is the
modeling method for requirements specification. This
variable too is measured using a 7-point scale.
3.5 The controlled variables
The controlled variables in the two experiments are the
participants and the tasks. The participants are a homogenous
group of third-year students of software engineering who
studied the same courses. They were split randomly into the
two treatment groups, where members in each group used
only one of the two modeling methods. This way we avoided
possible biases that might have affected this variable (e.g.,
age, sex, and experience). Note that this kind of assignment
of participants to treatment groups is often used in experi-
mental evaluation of modeling techniques.
The control over the tasks variable is achieved by giving
the participants in the two groups the same tasks; only the
modeling methods they used were different: in the com-
prehension task, all participants had to answer exactly the
same questionnaire while given different diagrams and
descriptions of a certain information system; in the model
creation task, all participants received the same require-
ments document of a certain (other) system and had to
create the models using one of the two modeling methods
(the same method that they used in the comprehension
task).
3.5.1 The subjects
Fifty-three students participated in the experiment that took
the form of a ‘‘bonus test’’ at the end of the semester, in
which they have studied the two modeling methods in two
mandatory courses that were given in parallel: in the
‘‘Information Systems Analysis & Design’’ course, they
studied OO-DFDs and transactions as part of the FOOM
methodology; in the ‘‘Object-Oriented Analysis & Design’’
course, they studied the UC method as part of UML. Each
method was taught by an experienced lecturer.
Before the experiment began, the subjects were ran-
domly divided into two treatment groups as shown in
Table 5. In these kinds of empirical experiments, there are
many factors that may influence the results, such as the
personal characteristics of the subjects and their experi-
ence. As in most experiments of this form, neutralizing
such factors is done by randomization. Note also that third-
year students have almost no experience, so this variable
could have no effect in this study.
As said, subjects in each group were assigned to work
with one modeling method: subjects in group G1 per-
formed the two tasks using the OO-DFD transaction
method, while subjects in group G2 performed the two
tasks using the UC method. The subjects were motivated
by adding bonus points to their final grades in the course in
which they studied the method that they were assigned to in
the experiment. The number of bonus points given to each
student was determined according to his/her performance
in the two tasks. (The procedure was approved by the
Ethics committee).
Table 4 The model creation hypotheses
Aspect H0 H1
Quality of models H02: Create (UC) = Create (DFD) H12: Create (UC) = Create (DFD)
Time taken to create the models H04: TCreate (UC) = TCreate (DFD) H14: TCreate (UC) = TCreate (DFD)
Perceived quality of models H06: PCreate (UC) = PCreate (DFD) H16: PCreate (UC) = PCreate (DFD)
Table 5 Assignment of subject into treatment groups
Group Size Task 1: comprehension of
models
Task 2: model
creation
G1 28 OO-DFD transaction diagrams and descriptions
G2 25 Use Case diagrams and descriptions
Requirements Eng (2014) 19:27–43 35
123
3.5.2 The tasks
In the first task—comprehension of models—each subject
received diagrams and their respective descriptions of an
information system, according to his/her group. The system
for this task was Greeting Cards Ordering (similar to the
one used in Dori and Goodman [11] and in Kabeli and
Shoval [19]). The domain of this system was not familiar to
the students (unlike, for example, a university management
system would), and thus, there is no concern that the par-
ticipants will answer the questions due to background
knowledge of the domain [6]. This guideline is also men-
tioned in Parsons and Cole: ‘‘subject matter experts should
not be used, it is critical that participants can answer
questions by using only the script, rather than by using
background knowledge’’ [25]. For the OO-DFD transaction
method, we created a flat OO-DFD of the system consisting
of 5 transactions, along with a description of each trans-
action. Similarly, we created an equivalent UC model that
included respective UC diagram and descriptions. The
diagram and descriptions were examined by experts of the
two methods to verify that they are correct and in accord
with the respective method.1
Along with the diagrams and descriptions, each partic-
ipant received a questionnaire consisting of 22 questions.
The same questionnaire was given to all subjects in the two
groups. The questions were actually statements dealing
with facts appearing in the diagrams and their descriptions.
For each statement, each subject had to mark whether it is
‘‘true,’’ ‘‘false,’’ or ‘‘can’t tell.’’ As already said, the
methods are not ‘‘information equivalent’’ [6, 33]. For
example, data classes appear in transactions, but not in
UCs. Parsons and Cole claim: ‘‘…if one form provides
enough information to answer selected questions correctly
while a second form does not, it would not be surprising to
find that participants receiving the first form outperform
those receiving the second form on those questions’’ [25].
We agree with this claim and overcame the problem by
asking questions that do not refer to components not
appearing in the two models. For example, instead of
referring to a certain data class used to store or retrieve
data, as might appear in a transaction only, we just refer to
information items. Table 6 presents a few examples of
statements included in the questionnaire.
Once completed the questionnaire, each subject was
given a post-test questionnaire where he/she was asked to
express his/her opinion about the comprehensibility of the
model (diagrams and descriptions) he/she used. This
questionnaire consisted of two parts: (a) a 1–7 ordinal scale
question, where 1 means ‘‘the model is very difficult to
understand’’ and 7 means ‘‘the model is very easy to
understand’’; (b) an open-ended question, where the subject
was asked to write comments about the comprehensibility
of the modeling method he/she worked with.
In the second task of the experiment—model creation—
each subject received a narrative requirements document of
an information system. The task was to create diagrams
(OO-DFD transaction or UCs) and respective descriptions.
(Recall that each subject continued to work with the same
modeling method as in the first task so that he/she is not
confused with a different method). The requirements doc-
ument was part of the IFIP Conference System (used also
in [19, 22]). Prior to the experiment, two detailed solutions,
one for each method, were created by experts of each
method. These solutions were used after the experiment by
the graders who graded the models that were created by the
subjects.
Along with the requirements document, each subject
received an instructions form that included explanations
about what he/she is expected to do, and an example of a
diagram (a transaction or a UC) and a respective descrip-
tion. The example was provided in order to help the par-
ticipants remember the notations and structures used in the
modeling method.
Once completed this task, each participant was given
another post-test questionnaire, where he/she was asked to
express his/her opinion about how good is the method to
create a functional model of a system. Here too we used a
1–7 ordinal scale question (1—‘‘very bad,’’ 7—‘‘very
good’’) and an open question to write comments about the
method.
It has to be noted that a few weeks prior to the actual
experiment, we have conducted a pilot test with 4 senior
students who studied and practiced with the two methods.
The pilot test helped us to verify the correctness of the
tasks and the clarity of the questions, and to assess the time
needed to complete the two tasks. Based on that, we have
decided to allocate a total of 3 h for the two tasks. We told
the subjects in advance that they have 3 h to complete the
Table 6 Examples of statements in the questionnaire
When a client’s order is updated, first the updated order details are
inserted and then the card details are read
The client does not need to approve the chosen design details
before ordering the desired amount
A message is sent to the client if his order is not updated according
to his request
When a client wants to choose a card from the existing variety, the
system will display to the client all the cards existing in the
collection
1 In the Comprehension task we face a potential bias since the
researchers created the models. This problem is well known since in
many other experimental studies the researchers create the modeling
tasks. Our work was done honestly and we created the ‘‘best’’ possible
models with each of the methods, with no bias (as can be proved by
the results of the comprehension task in next sections).
36 Requirements Eng (2014) 19:27–43
123

two tasks, but we advised them to dedicate about an hour to
the first task (comprehension) and the rest, to the second
task (model creation).
3.6 The analysis procedure: grading the solutions
The grades of the solutions of the two tasks were deter-
mined as follows:
• Comprehension task: The comprehension task included
a questionnaire containing 22 statements having one
correct answer each (True or False). For each solution,
the number of correct answers was counted.
• Model creation task: Grading the solutions of this task
was more complicated, because for a given require-
ments document, many correct solutions (i.e., func-
tional models) are possible. This requires deep
examination of the model created by each subject.
Each solution, within each of the two groups, was
evaluated and graded by two experienced graders.2 The
two graders worked and graded each solution sepa-
rately (using separate copies of the solution sheets). To
assist the graders, we prepared ‘‘expert solutions’’ of
the tasks (prior to the experiment). Since there might be
other correct solutions, as discussed in Sect. 3.5, the
graders were instructed to use the expert solutions as
guidelines only and to grade each solution compared to
the requirements document. At the beginning of their
grading work, the two graders of each treatment group
worked together on a few solutions in order to
synchronize their work; then they continued working
separately. This way, each solution received two
independent grades. We checked the correlation
between the two grades using Pearson correlation
statistic, which is a mean to measure correlation among
graders when the grades are in an ordered scale.3 The
results showed high correlations: for the graders of the
OO-DFD transaction, the Pearson correlation coeffi-
cient was 0.81; for the UCs, it was 0.76. Therefore, we
could average the two grades and declare it as the
quality grade of each solution.
4 Analysis
Prior to testing the differences between the results using
parametric t tests, some assumptions had to be validated. The
t test assumptions are that: (a) the samples are independent;
(b) the samples distribution is normal; (c) the homoscedas-
ticity assumption is valid. The independency assumption is
validated due to taking the observations from an independent
sample: the participants were split randomly into two groups,
thus creating independent samples. The normal distribution
assumption was examined using Kolmogorov–Smirnov test
for each of the groups on each dependent variable (i.e.,
comprehension, comprehension time, comprehension pref-
erence, quality of model, modeling time, modeling prefer-
ence). We found out that all groups were normally
distributed, except for two variables: perceived compre-
hensibility (p value \ 0.05) and perceived quality for the
OO-DFD transaction group, which has a week normal dis-
tribution (p value = 0.07). Therefore, we conclude that
t tests are suitable for all variables except these two. For
these, we used the Wilcoxon test, which is suitable when one
of the assumptions of the parametric test does not hold. The
homoscedasticity assumption is validated each time a t test is
executed by the Levene test. When the assumption is not
fulfilled, another version of t test that does not assume the
homoscedasticity has to be performed.
4.1 Results of the comprehension experiment
Table 7 summarizes the results of the comprehension
experiment. It shows that there was no significant differ-
ence in comprehension, but it took less time to comprehend
the UC model, while users perceived that the OO-DFD
model is easier to comprehend. Following the results, we
accept H01 and reject H03 and H05.
2 Because of the criticality of this grading, we decided to use two
experienced graders for each solution. They were graduate students of
Information Systems Engineering who served as TAs of the two
involved courses (IS Analysis & Design, and OO Analysis & Design).3 We cannot use Kappa’s coefficient since it is suitable only for
qualitative/categorical items; grades on a 0–100 scale are not
categorical.
Table 7 The comprehension results
OO-DFD
transactions
UC Statistical analysis results
(a = 0.05)
Conclusion
Comprehension grade 70.71 % 70.68 % p = 0.98 (t test) No difference in comprehension
Time to complete comprehension
task
43 min 35 min p = 0.008 (t test) Difference in favor of UC
method
Perceived comprehensibility
of models
5.18 4.28 p = 0.023 (Wilcoxon) Difference in favor of OO-DFD
transaction method
Requirements Eng (2014) 19:27–43 37
123

4.2 Results of the model creation experiment
As said, prior to the analysis of the model creation results,
we computed the Pearson correlation between the pairs of
grades given by the two grades; we found them highly
correlated (p value \ 0.05), thus we could average the two
grades of each participant. Table 8 presents the results of
this experiment. As can be seen, there was a significant
difference in the quality of the created models in favor of
the UC method, but there was no significant difference in
the time taken to create the models, and no difference in the
users’ perceptions about how good are the models for
modeling requirements. Following the results, we reject
H02 and accept H04 and H06.
We wanted to explore in more details the reasons for the
difference in quality of the created models. For this, we
classified the possible types of errors in the diagrams and
descriptions into five categories:
A—missing or redundant function/transaction/UC
B—missing or wrong name of function/UC in diagram
or description
C—missing, redundant, or wrong external entity/actor in
diagram or description
D—missing, redundant, or wrong direction data flow/
connection
E—wrong logical description of transaction/UC
We counted the number of errors made by each partic-
ipant in each of the above categories. Then we tested the
differences in the number of errors within each of the
categories, using t tests. The results are summarized in
Table 9. As can be seen, in categories A and B, there were
no significant differences between the two methods, while
in categories C and D, there were significant differences in
favor of the UC method. These results are reasonable
because in OO-DFD transaction, there are more external
entities and data flows compared to actors and connections
in UCs; hence, there are more chances to make errors when
using the OO-DFD transaction method, making the UC
method superior in those categories. Contrarily, in category
E, there was a significant difference in favor of the OO-
DFD transaction method, possibly because the logical
descriptions of the transactions are more structured com-
pared to the informal descriptions of UCs.
5 Discussion
5.1 Evaluation of results and implications
5.1.1 Analysis of the comprehension results
(A) Comprehension of models. The results showed no
significant difference between the comprehensibility of the
two methods. This result is in accord with our speculations
prior to the experiment due to the contrary considerations
and the support of cognitive theories. On one hand, detailed
diagrams and descriptions, as in OO-DFD transaction
versus UC diagrams and descriptions, may provide for
understandability, but on the other hand, too many details
might cause confusion. As described in the hypotheses
section, the COGEVAL framework proposes cognitive
principles that on the one hand support the assumption that
transaction diagrams are easier to understand than UC
Table 8 The quality of modeling results
OO-DFD
transactions
UC Statistical analysis
results (a = 0.05)
Conclusion
Model creation grade 73.87 % 87.52 % p = 0.001 (t test) Difference in favor of UC method
Time to complete model creation task 112 min 108 min p = 0.53 (t test) No difference in time
Perceived quality of modeling method 4.04 3.92 p = 0.96 (Wilcoxon) No difference in perceived quality
Table 9 Results per categories
Category Average no of errors
in OO-DFD transactions
Average no
of errors in UCs
Statistical analysis
results (a = 0.05)
Conclusion
A 1.46 1.71 p = 0.56 No significant difference
B 0.15 0.19 p = 0.81 No significant difference
C 2.38 1.05 p = 0.001 Significant difference in favor of UC method
D 3.58 0.43 p = 0 Significant difference in favor of UC method
E 1.35 2.76 p = 0.014 Significant difference in favor of OO-DFD
transaction method
38 Requirements Eng (2014) 19:27–43
123
diagrams (more relationship information makes more
comprehensive model), while on the other hand, they
support the opposite assumption that transaction diagrams
are less understood (more elements in a model makes it less
comprehensible).
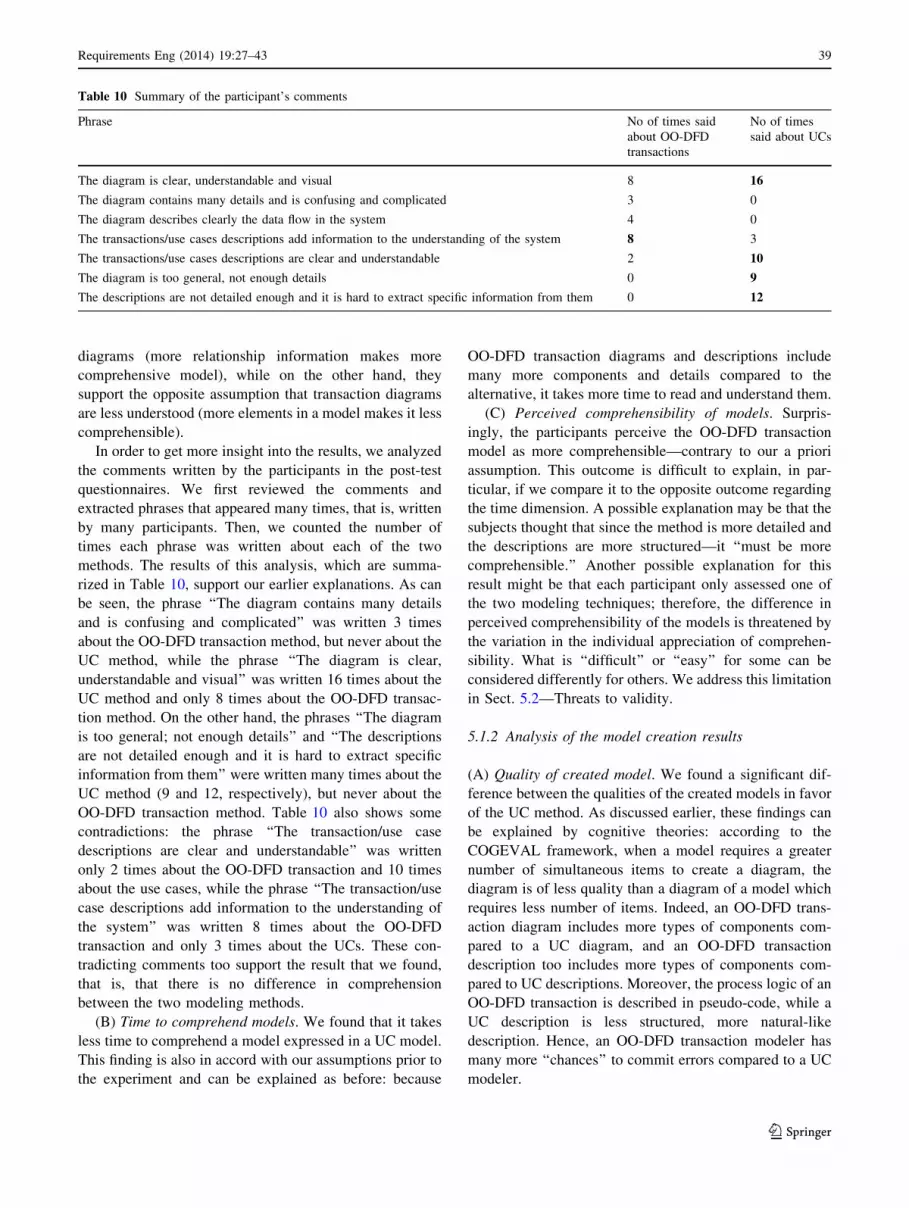
In order to get more insight into the results, we analyzed
the comments written by the participants in the post-test
questionnaires. We first reviewed the comments and
extracted phrases that appeared many times, that is, written
by many participants. Then, we counted the number of
times each phrase was written about each of the two
methods. The results of this analysis, which are summa-
rized in Table 10, support our earlier explanations. As can
be seen, the phrase ‘‘The diagram contains many details
and is confusing and complicated’’ was written 3 times
about the OO-DFD transaction method, but never about the
UC method, while the phrase ‘‘The diagram is clear,
understandable and visual’’ was written 16 times about the
UC method and only 8 times about the OO-DFD transac-
tion method. On the other hand, the phrases ‘‘The diagram
is too general; not enough details’’ and ‘‘The descriptions
are not detailed enough and it is hard to extract specific
information from them’’ were written many times about the
UC method (9 and 12, respectively), but never about the
OO-DFD transaction method. Table 10 also shows some
contradictions: the phrase ‘‘The transaction/use case
descriptions are clear and understandable’’ was written
only 2 times about the OO-DFD transaction and 10 times
about the use cases, while the phrase ‘‘The transaction/use
case descriptions add information to the understanding of
the system’’ was written 8 times about the OO-DFD
transaction and only 3 times about the UCs. These con-
tradicting comments too support the result that we found,
that is, that there is no difference in comprehension
between the two modeling methods.
(B) Time to comprehend models. We found that it takes
less time to comprehend a model expressed in a UC model.
This finding is also in accord with our assumptions prior to
the experiment and can be explained as before: because
OO-DFD transaction diagrams and descriptions include
many more components and details compared to the
alternative, it takes more time to read and understand them.
(C) Perceived comprehensibility of models. Surpris-
ingly, the participants perceive the OO-DFD transaction
model as more comprehensible—contrary to our a priori
assumption. This outcome is difficult to explain, in par-
ticular, if we compare it to the opposite outcome regarding
the time dimension. A possible explanation may be that the
subjects thought that since the method is more detailed and
the descriptions are more structured—it ‘‘must be more
comprehensible.’’ Another possible explanation for this
result might be that each participant only assessed one of
the two modeling techniques; therefore, the difference in
perceived comprehensibility of the models is threatened by
the variation in the individual appreciation of comprehen-
sibility. What is ‘‘difficult’’ or ‘‘easy’’ for some can be
considered differently for others. We address this limitation
in Sect. 5.2—Threats to validity.
5.1.2 Analysis of the model creation results
(A) Quality of created model. We found a significant dif-
ference between the qualities of the created models in favor
of the UC method. As discussed earlier, these findings can
be explained by cognitive theories: according to the
COGEVAL framework, when a model requires a greater
number of simultaneous items to create a diagram, the
diagram is of less quality than a diagram of a model which
requires less number of items. Indeed, an OO-DFD trans-
action diagram includes more types of components com-
pared to a UC diagram, and an OO-DFD transaction
description too includes more types of components com-
pared to UC descriptions. Moreover, the process logic of an
OO-DFD transaction is described in pseudo-code, while a
UC description is less structured, more natural-like
description. Hence, an OO-DFD transaction modeler has
many more ‘‘chances’’ to commit errors compared to a UC
modeler.
Table 10 Summary of the participant’s comments
Phrase No of times said
about OO-DFD
transactions
No of times
said about UCs
The diagram is clear, understandable and visual 8 16
The diagram contains many details and is confusing and complicated 3 0
The diagram describes clearly the data flow in the system 4 0
The transactions/use cases descriptions add information to the understanding of the system 8 3
The transactions/use cases descriptions are clear and understandable 2 10
The diagram is too general, not enough details 0 9
The descriptions are not detailed enough and it is hard to extract specific information from them 0 12
Requirements Eng (2014) 19:27–43 39
123

But note that we found significant differences in certain
types of categories of the models: in category C (missing,
redundant, or wrong external entity or actor in diagram or
description) and in category D (missing, redundant, or
wrong direction of data flow/connection), we found
advantage to the UC method; this is reasonable as already
explained, because the OO-DFD transaction method
requires to define external entities, data classes, and data
flows, which are not required in the UC model. Contrarily,
in category E (wrong logical descriptions of transaction/
UC), we found an advantage to the OO-DFD transaction
method. The reason for this result is that the OO-DFD
transaction description is more structured, thus causing
fewer mistakes.
(B) Time to create models. Contrary to our a priori
assumptions, we found no significant differences in time
to create the models. This result is somewhat surprising
because it is expected that a more demanding task
(transactions) would take more time. A possible expla-
nation for this indifference is that the participants, who
were allocated the same amount of time to work on the
two tasks, were advised to use the first hour for the
comprehension task, and therefore, they have reserved
about the same amount of the remaining time to work on
the model creation task.
(C) Perceived quality of modeling methods. We found
no significant differences in the perceived quality of the
two modeling methods. This result is somewhat inconsis-
tent with the equivalent outcome regarding perceived
comprehensibility of the models, where we found a sig-
nificant difference. This result can be explained by the
contradiction in the participants’ opinions, as shown in
Table 10. On one hand, many subjects thought that the
OO-DFD transaction method is too detailed and confusing,
while on the other hand, many others thought the UC
method is too general and not detailed enough. As
described in the ‘‘perceived comprehensibility of models’’
section, we can also explain this inconsistent result due to
the different individual appreciation of comprehensibility
by the subjects, since in our experiment settings, each
subject used and assessed only one of the two modeling
techniques. Section 5.2 further relates to this issue.
5.1.3 An improved method for modeling functional
requirements
We have seen that there are differences between the two
methods, and each has some advantages and disadvantages.
Our observations led us to conclude that each of the
methods can be improved by considering the advantages of
the other. The OO-DFD method can be improved by sim-
plifying the redundant, overly detailed, and structured
description of transactions, but retaining the structured
description of the process logic of the transaction. The UC
method can be improved by adding these missing compo-
nents to the UC diagram and referring to them in the UC
description.
In the following, we briefly describe an enhanced UC
method that we term EUC—Enhanced Use Case, which
combines the advantages of the two:
A. A EUC diagram will include components that exist in
an OO-DFD transaction diagram, that is, one or more
functions, external entities signifying sources of input
data and destinations of output, data classes from
where the functions can retrieve data or where they
can store data, and directed data flows between the
respective components. Proponents of existing UC-
driven methodologies may ask: Where can the data
classes come from at this stage? Two answers are
possible: (a) if we also adopt the FOOM approach,
prior to creating the EUCs, we create an initial class
diagram and use these classes in the respective EUC
diagrams; (b) even if we do not adopt the FOOM
approach, while creating a EUC diagram, we may
expect the modeler to define not only the functions of
the EUC but also the required data classes, as well as
the external entities.
B. There is no need to include the ‘‘traditional’’ actors in
the EUC diagram; we can list them in the description
of the EUC, where we also define other things that are
not part of the diagram (e.g., pre- and post-conditions).
Another reason for this change is that a EUC may
sometimes be operated by many different types of
operators, each having different access privileges;
there is simply not enough room to include such
details in the diagram.
C. There is no need to include the special types of ‘‘uses’’
and ‘‘includes’’ UCs in the EUC diagram. Instead of
them, we may have just chained functions; a data flow
from one function to another means that the first
triggers the latter and may pass some data/parameters
to it.
D. The description of the EUC will have to distinguish
between the external entities that are source of input
or destination of output, and the operators of the use
case at runtime. But contrary to the current too-
structured description of a transaction, we adopt a less
structured, more natural-language-like description, as
in ‘‘traditional’’ UC descriptions.
We complete this sketch of the enhanced method by
showing a possible description of a EUC. We assume that
the EUC is the same as the transaction diagram in Fig. 1;
Table 11 shows its description.
40 Requirements Eng (2014) 19:27–43
123

5.2 Threats to validity
As any quasi-laboratory experiment, this one too has lim-
itations and threats to validity of the results. We distinguish
between four types of threats: conclusion, internal, con-
struct, and external validity.
Conclusion validity: Conclusion validity refers to
whether the conclusions reached in a study are correct.
For controlled experiments, conclusion validity is directly
related to the application of statistical tests to the data. If
the statistical tests are not applied correctly, this is a
threat to the conclusion validity. In the presented exper-
iment, we believe that all statistical tests were applied
correctly. Yet, the reliability of measure of quality of
models might introduce some threats to validity; to
address this concern, each solution was graded by two
independent graders.
Internal validity: Internal validity refers to the extent to
which the independent variable(s) were actually responsi-
ble for the effects seen to the dependent variable. A pos-
sible threat to the internal validity may be that unknown
factors may have had an influence on the results and
therefore put limitations on the internal validity of the
study. This possible threat, which exists in all experiments
of this kind, was minimized by the random assignment of
the subjects into the two treatment groups.
Construct validity: Construct validity is the degree to
which the independent and dependent variables accurately
measure the concepts they are supposed to measure.
Threats to construct validity have been identified in both
experimental tasks:
(a) In the comprehension task, a threat to validity is the
measure of understandability. To deal with this threat, we
used a questionnaire consisting of 22 statements, thus
addressing many facts appearing in the presented models.
Of course, counting and summing the number of correct
answers is not a perfect measure, because it gives an equal
weight to all statements. In spite of this weakness, we argue
that the measure of understandability we used is reasonable
and follows the ‘‘best practice’’ in other comparative
experiments of comprehension.
(b) Another threat to construct validity in the model
creation task is that each subject was given a requirements
document of a certain case study (part of the IFIP Con-
ference system). This does not represent a realistic situa-
tion: in reality, analysts usually elicit requirements from
real users in an interactive and iterative process. We
skipped this important aspect and gave the subjects a
‘‘ready’’ requirements document. So, it can be argued that
we mainly measured how well analysts convert predefined
textual requirements into diagrammatic specifications. We
cannot be sure that the same results would be obtained had
the subjects been working in a more realistic environment.
But on the other hand, we have no reason to assume that
this would have affected differently the results.
(c) In both comprehension and modeling tasks, a major
threat to validity relies on the fact that each participant was
asked to assess only one of the modeling methods on a 1–7
ordinal scale. Each individual appreciation of the level of
comprehensibility and the level of the modeling method’s
compatibility to describe functional requirements is differ-
ent. What seems to be ‘‘difficult’’ for some may seem to be
‘‘easy’’ for others. Similarly, a method that seems to be
‘‘extremely compatible’’ to some may seem to be ‘‘not at all
compatible’’ to others. The ideal way would have been to
choose a ‘‘within-subject’’ experiment setting, in which each
subject would have experimented with the two modeling
methods. In that case, we could have asked directly questions
such as: ‘‘Which of the two methods do you understand
better?’’ or ‘‘Which method do you think is more suitable to
Table 11 The EUC description
Component Description
EUC name Assign reviewers to a submitted article
Operators PC Chair, electronic mail system
Preconditions There are submitted articles in the system that have not yet been assigned to reviewers
Postconditions The chosen article is assigned to reviewers
Main success scenario 1. The system reads the details of reviewers from class ‘‘Reviewer’’ and non-assigned articles from class
‘‘Article’’ and displays them to the PC Chair
2. The PC Chair selects and inputs to the system an article from the list and the reviewers assigned to
review it
3. The assignment details are saved in class ‘‘Article review’’
4. The system sends the article’s details and the last date to submit review reports to the reviewers, by the
electronic mail system
Extensions None
Requirements Eng (2014) 19:27–43 41
123

define functional requirements?’’ But this would have caused
other problems. One is a problem of practicality: we would
need many more participants because each participant would
have had to perform the two tasks using one method and then
perform two different tasks using the other method. So we
either need many more (homogeneous) participants or have
each participant perform all those tasks, which would take a
double amount of time (6 h at least instead of 3 h in our
experiment)—this is not so realistic in an exam setting,
besides the problem of getting tired. Another problem with
such an experiment is that we have to make sure that the
different tasks given to each subject are similar in compre-
hensibility, complexity, etc.—problems that are not easy to
solve. Another problem with a ‘‘within-subject’’ form of
experiment is the possible bias due to the order effect (since
each subject has to perform each task using a different
method); to overcome this problem, we might need to double
the number of treatment groups. (For example, subjects in
one group would perform one task using OO-DFD first and
then another task using the UC method, while subjects in
another group would perform the same tasks in the opposite
order). Due to these practical reasons, we chose the
‘‘between-subject’’ setting, and are aware of its limitations,
which may explain the inconsistent and surprising results
regarding the perceived comprehensibility and quality.
External validity: External validity is the degree to
which the results of the experiment can be generalized to
the population under study and other research settings. The
following possible threats have been identified:
(a) The case studies used in the experiments are rela-
tively small and may not be representative in terms of size
and complexity. But this limitation is true for almost all
controlled experiments conducted in the areas of software
engineering and method evaluation.
(b) The subjects who participated in the experiment
were students. In the comprehension task, they played the
role of users who read and evaluate analysis specifications,
but actually they were not real users who evaluate speci-
fications of real systems developed for them. However, we
have no reason to assume that the use of students as sur-
rogates of real users caused any bias of the comparative
results. Similarly, in the model creation task, we used the
same students who played the role of analysts, but they
were not real, experienced analysts of real requirements.
But again, in spite of this limitation, we have no reason to
assume that real analysts would perform differently with
the two modeling methods. Recall that our subjects were
senior software engineering students who were trained to
become systems analysts. Moreover, each subject learned
his/her method from an expert in that method. We note
again that in almost all experimental research in the area,
the subjects were students (as it is not feasible to conduct
such experiment in the real world).
6 Conclusions and future work
We compared two alternative methods for modeling the
functional requirements of an information system: OO-
DFD transaction diagrams and descriptions versus UC
diagrams and descriptions. In a controlled experiment, we
examined the differences between the two methods with
respect to comprehension, quality, time, and perceived
comprehensibility and quality of the modeling methods.
The main result of the comparative experiment is that the
quality of the models created with the UC method is sig-
nificantly better than the quality of models created with the
OO-DFD transaction method. But this result is mainly
because UCs do not include components that are included
in OO-DFD transaction, and therefore, UC analysts can
avoid creating errors that cannot be avoided by OO-DFD
transaction analysts. We also concluded that the OO-DFD
transactions are overly detailed, while the UC diagrams are
too general and not detailed enough. This led us to propose
an improved method to define and describe the functional
requirements that is a hybrid of the two.
But note that the ECU method has not yet been tested
empirically. In the future, we plan to evaluate the enhanced
method compared to the original methods. In that research,
we plan to repeat the experiments using tasks of different
size and complexity.
References
1. Arlow J, Neustadt I (2001) UML and the unified process: prac-
tical object oriented analysis & design. Addison Wesley, Reading
2. Bajaj A (2004) The effect of the number of concepts on the
readability of schemas: an empirical study with data models.
Working Paper, University of Tulsa, OK, USA
3. Bass L, Bergey J, Clements P, Merson P, Ozkaya I, Sangwan R
(2006). A comparison of requirements specification methods
from a software architecture perspective. Technical report, Soft-
ware Engineering Institute, Carnegie Mellon
4. Booch G (1991) Object-oriented design with applications. Ben-
jamin/Cummings, Menlo Park, CA
5. Booch G, Rumbaugh J, Jacobson I (1996) The unified modeling
language for object-oriented development. Rational Software
Corporation
6. Burton-Jones A, Weber R, Wand Y (2009) Guidelines for
empirical evaluations of conceptual modeling grammars. J Assoc
Inf Syst 10:495–532
7. Coad P, Yourdon E (1991). Object oriented analysis, 2nd edn.
Prentice Hall, Englewood Cliffs, NJ
8. Cockburn A (2001) Writing effective use cases. Addison-Wesley,
Boston
9. Cox K, Phalp K, Shepperd M (2001) Comparing use case writing
guidelines. In: Proceedings of the 7th international workshop on
requirements engineering: foundation for software quality,
pp 101–112
10. DeMarco (1978) Structured Analysis and System Specification.
Yourdon Press, New York
11. Dori D, Goodman M (1996) From object-process analysis to
object-process design. Ann Softw Eng 2:25–50
42 Requirements Eng (2014) 19:27–43
123

12. Gane C, Sarson T (1979) Structured system analysis: tools and
techniques. Prentice Hall, Englewood Cliffs, NJ
13. Gemino A, Wand Y (2003) Evaluating modeling techniques
based on models of learning. Commun ACM 46:79–84
14. Hadar I, Kuflik T, Perini A, Reinhartz-Berger I, Ricca F, Susi A
(2010) An empirical study of requirements model understanding:
use case vs. tropos models. SAC’10 March, Sierre, Switzerland,
pp 22–26
15. Hahn J, Kim J (1999) Why are some diagrams easier to work
with? Effects of diagrammatic representation on the cognitive
integration process of systems analysis and design. ACM Trans
Comput Hum Interact 6(3):181–213
16. Jacobson I (1987) Object oriented development in an industrial
environment. In: Proceeding of the object-oriented programming
systems, languages and applications, pp 183–191
17. Jacobson I (1992) Object oriented software engineering: a use
case driven approach. Addison-Wesley Professional, Reading
18. Jeyayaj A, Sauter VL (2007) An empirical investigation of the
effectiveness of system modeling and verification tools. Commun
ACM 50(6):63–76
19. Kabeli J, Shoval P (2005) Comprehension and quality of analysis
specifications—a comparison of FOOM and OPM methodolo-
gies. Inf Softw Technol 47(4):271–290
20. Kim J, Hahn J, Hahn H (2000) How do we understand system
with (so) many diagrams? Cognitive integration processes in
diagrammatic reasoning. Inf Syst Res 11(3):284–303
21. Larman C (2002) Applying UML and patterns: an introduction to
object-oriented analysis and design, and the unified process, 2nd
edn. Prentice Hall, Englewood Cliffs, NJ
22. Mathiassen L, Munk-Madsen A, Nielsen P, Stage J (2000) Object
oriented analysis and design. Marko Publishing, Alborg
23. Millet I, Nelson R (2007) Data flow diagram vs. use cases—
student perceptions. Internatl J Inf Commun Technol Educ
3(1):70–78
24. Moody D (2006) What makes a good diagram? Improving the
cognitive effectiveness of diagrams in is development. In: Pro-
ceedings of the 15th international conference in information
systems development (ISD)
25. Parsons J, Cole L (2005) What do the pictures mean? Guidelines
for experimental evaluation of representation fidelity in dia-
grammatical conceptual modeling techniques. Data Knowl Eng
55:327–342
26. Peleg M, Dori D (2000) The model multiplicity problem:
experimenting with real-time specification methods. IEEE Trans
Softw Eng 6:1–18
27. Ramsin R, Paige R (2008) Process-centered review of object
oriented software development methodologies. ACM Comput
Surv 40(1):3–89
28. Rockwell S, Bajaj A (2005) COGEVAL: applying cognitive
theories to evaluate conceptual models. Adv Top Database Res
4:255–282
29. Rumbaugh J, Blaha M, Premerlani W, Eddy F, Lorensen W
(1991) Object-oriented modeling and design. Prentice-Hall,
Englewood Cliffs, NJ
30. Shoval P (1988) ADISSA: architectural design of information
systems based on structured analysis. Inf Syst 13(2):193–210
31. Shoval P (2007) Functional and object-oriented analysis and
design: an integrated methodology. Idea (IGI) Publishers, Hershey
32. Shoval P, Kabeli J (2001) FOOM: functional- and object-oriented
analysis & design of information systems—an integrated meth-
odology. J Database Manag 12(1):15–25
33. Siau K (2004) Informational and computational equivalence in
comparing information modeling methods. J Database Manag
15:73–86
34. Topi H, Ramesh V (2002) Human factors research on data
modeling: a review of prior research, an extended framework and
future research directions. J Database Manag 13(2):3–19
35. White SA (2004) Introduction to BPMN, IBM Corporation,
business process trends
36. Wohlin C, Runeson P, Host M, Ohlsson MC, Regnell B, Wesslen
A (2000) Experimentation in software engineering: an introduc-
tion. Kluwer, Boston
37. Yu E (1997) Towards modeling and reasoning support for early-
phase requirements engineering. In: 3rd IEEE international sym-
posium on requirements engineering, Annapolis, USA, pp 226–235
Requirements Eng (2014) 19:27–43 43
123