crop discrimination in northern china with double cropping systems using fourier analysis of...
TRANSCRIPT
+ Models
JAG-189; No of Pages 10
Crop discrimination in Northern China with double cropping
systems using Fourier analysis of time-series MODIS data
Zhang Mingwei a,*, Zhou Qingbo b, Chen Zhongxin b,1, Liu Jia b,Zhou Yong c, Cai Chongfa d
a National Satellite Meteorological Center, China Meteorology Administration, No. 46 Zhongguancun South Avenue,
Beijing 100081, Chinab Institute of Natural Resources & Regional Planning, The Chinese Academy of Agricultural Sciences,
No. 12 Zhongguancun South Avenue, Beijing 100081, Chinac Huazhong Normal University, No. 152 Luoyu Road, Wuhan, Hubei 430079, China
d Huazhong Agricultural University, Wuhan, Hubei 430070, China
Received 28 June 2006; accepted 14 November 2007
Abstract
Crop identification is the basis of crop monitoring using remote sensing. Remote sensing the extent and distribution of individual
crop types has proven useful to a wide range of users, including policy-makers, farmers, and scientists. Northern China is not merely
the political, economic, and cultural centre of China, but also an important base for grain production. Its main grains are wheat,
maize, and cotton. By employing the Fourier analysis method, we studied crop planting patterns in the Northern China plain. Then,
using time-series EOS-MODIS NDVI data, we extracted the key parameters to discriminate crop types. The results showed that the
estimated area and the statistics were correlated well at the county-level. Furthermore, there was little difference between the crop
area estimated by the MODIS data and the statistics at province-level. Our study shows that the method we designed is promising for
use in regional spatial scale crop mapping in Northern China using the MODIS NDVI time-series.
# 2007 Elsevier B.V. All rights reserved.
Keywords: MODIS; NDVI; Crop discrimination; Fourier transform
www.elsevier.com/locate/jag
International Journal of Applied Earth Observation
and Geoinformation xxx (2008) xxx–xxx
1. Introduction
Crop identification is the basis for crop monitoring
using remote sensing and is critical to many applications.
For example, crop acreage is essential information
necessary for land management and trade decisions.
* Corresponding author. Tel.: +86 10 6840 6707;
fax: +86 10 6217 5936.
E-mail addresses: [email protected] (Z. Mingwei),
[email protected] (Z. Qingbo), [email protected]
(C. Zhongxin).1 Tel.: +86 10 6891 9615x168/6891 8684;
fax: +8610 6891 9615x150.
0303-2434/$ – see front matter # 2007 Elsevier B.V. All rights reserved.
doi:10.1016/j.jag.2007.11.002
Please cite this article in press as: Mingwei, Z., et al., Crop discrimi
Fourier analysis of time-series MODIS data, Int. J. Appl. Earth O
Identification and mapping of crop types using coarse-
resolution satellite imagery is an important step to assure
accurate retrieval of crop specific parameters (Dorais-
wamy et al., 2005). Crop discrimination using low-
resolution satellite imagery is a critical component of
mesoscale storm prediction (Gutman and Ignatov, 1998)
and hydrologic models (Yin, 1997).
Vegetation types can be characterized using their
seasonal (or phonological) variations in the NDVI time-
series (Townshend et al., 1991). During the last decade, a
number of different methods have been developed to
discriminate crop types using data from the normalized
difference vegetation index (NDVI) and from the
Advanced Very High-Resolution Radiometer (AVHRR).
nation in Northern China with double cropping systems using
bserv. Geoinform. (2007), doi:10.1016/j.jag.2007.11.002
Z. Mingwei et al. / International Journal of Applied Earth Observation and Geoinformation xxx (2008) xxx–xxx2
+ Models
JAG-189; No of Pages 10
These methods employ a variety of different approaches
including temporal profiles of crop phenology mani-
fested in the normalized difference vegetation index
(Defries et al., 1995; Reed et al., 1994), classification of
multi-temporal data (Brown et al., 1993; Loveland et al.,
1995), the Principal Component Analysis (Townshend
et al., 1987; Tucher et al., 1985), and time-series analysis
of a temporal NDVI profile as a standardized principal
component analysis (Eastman and Fulk, 1993).
Fourier analysis provides a new representation of the
time-series of images, which allows analysis of the
vegetation phenology using only the amplitude and
phase of the most important periodic components. The
approach by Menenti et al. (1993) provides a measure of
the ‘quality’ of vegetation zones in dynamic terms using
the FFT: the amplitude and phase values at different
frequencies are a measure of the response of vegetation
to different periodic climate processes. Images of
amplitude and phase values were used as attributes to
map vegetation–soil–climate units in Southern Africa
(Azzali and Menenti, 2000). Amplitude and phase angle
images were correlated with crop type information
(Jakubauskas et al., 2001). Jakubauskas et al. (2002)
used amplitude and phase angle images to discriminate
crops. Finally, Verhoef (Roerink and Menenti, 2000)
developed the algorithm Harmonic Analysis of Time-
Series (HANTS) to deal with time-series of irregularly
spaced observations and to identify and remove cloud
contaminated observations. HANTS has to be steered
by five control parameters. There are no objective rules
to determine the magnitude of these control parameters.
The radiometric and geometric properties of the
Moderate Resolution Imaging Spectroradiometer
(MODIS), in combination with improved atmospheric
correction and cloud screening provided by MODIS
science team activities, provide a substantially
improved basis for studies of this nature (Zhang
et al., 2003). The MODIS sensor has 36 spectral
bands, seven of which are designed for the study of
vegetation and land surfaces: blue (459–479 nm),
green (545–565 nm), red (620–670 nm), near infrared
(NIR1: 841–875 nm, NIR2: 1230–1250 nm), and
shortwave infrared (SWIR1: 1628–1652 nm, SWIR2:
2105–2155 nm). Daily global imagery is provided at
spatial resolutions of 250 m (red and NIR1) and 500 m
(blue, green, NIR2, SWIR1, SWIR2). The MODIS
Land Science Team provides a suite of standard
MODIS data products to users, including the 8-day
composite MODIS Surface Reflectance Product
(MOD09A1). Among a suite of standard MODIS
data products available to users, we used the 8-day
composite MODIS Surface Reflectance Product
Please cite this article in press as: Mingwei, Z., et al., Crop discrimi
Fourier analysis of time-series MODIS data, Int. J. Appl. Earth O
(MOD09A1). Each 8-day composite includes esti-
mates of surface spectral reflectance of the seven
spectral bands at 500-m spatial resolution. Compared
to other MODIS data products, the 8-day composite
MODIS Surface Reflectance Product (MOD09Q1) has
three advantages for crop analyses: (a) finer spatial
resolution (500 m versus 1 km in Vegetation Indices
16-Day L3 Global 1 km (MOD13A2)), (b) slightly
shorter temporal resolution (8-day versus 16-day in
Vegetation Indices 16-Day L3 Global 250 m
(MOD13Q1)), (c) more bands (7-band versus 2-band
in Surface Reflectance 8-Day L3 Global 250 m
(MOD09Q1)).
Several studies on crop discrimination using NDVI
time-series refer mostly to areas in North America,
Europe and elsewhere, few reports discuss double
cropping systems in northern China. The objective of
this study is to estimate crop acreage in the northern
China plain with double cropping systems using 500 m,
8-day composite MODIS NDVI. In this paper, the Fast
Fourier Transform (FFT) is employed to extract phase
and amplitude images from MODIS-NDVI time-series
data. The phase and amplitude images are used to
discriminate crop types.
2. Study area
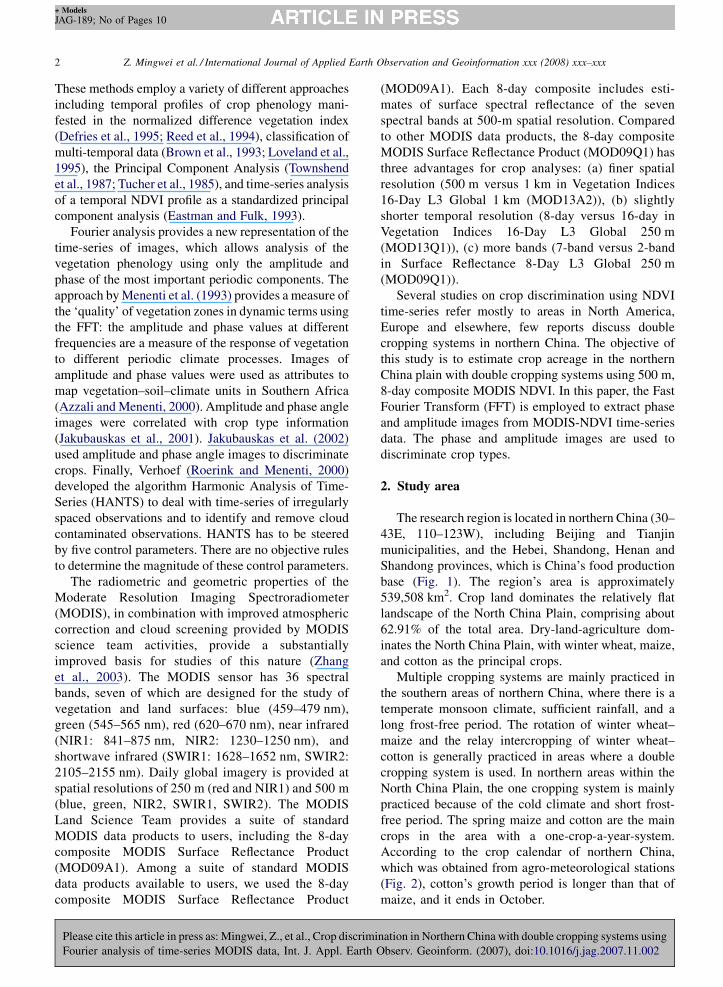
The research region is located in northern China (30–
43E, 110–123W), including Beijing and Tianjin
municipalities, and the Hebei, Shandong, Henan and
Shandong provinces, which is China’s food production
base (Fig. 1). The region’s area is approximately
539,508 km2. Crop land dominates the relatively flat
landscape of the North China Plain, comprising about
62.91% of the total area. Dry-land-agriculture dom-
inates the North China Plain, with winter wheat, maize,
and cotton as the principal crops.
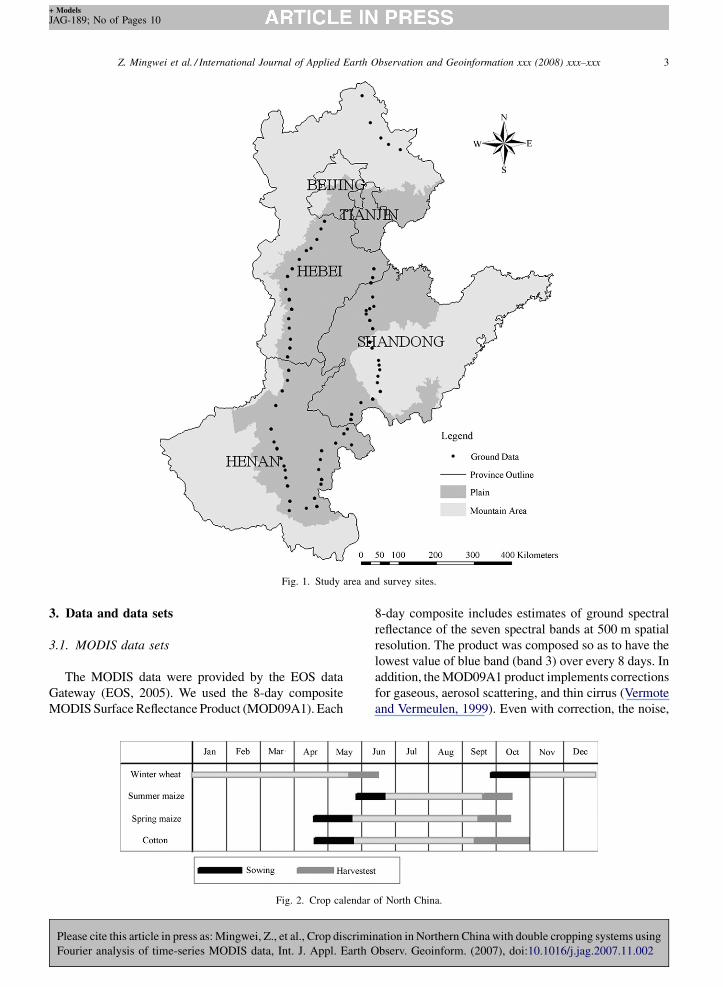
Multiple cropping systems are mainly practiced in
the southern areas of northern China, where there is a
temperate monsoon climate, sufficient rainfall, and a
long frost-free period. The rotation of winter wheat–
maize and the relay intercropping of winter wheat–
cotton is generally practiced in areas where a double
cropping system is used. In northern areas within the
North China Plain, the one cropping system is mainly
practiced because of the cold climate and short frost-
free period. The spring maize and cotton are the main
crops in the area with a one-crop-a-year-system.
According to the crop calendar of northern China,
which was obtained from agro-meteorological stations
(Fig. 2), cotton’s growth period is longer than that of
maize, and it ends in October.
nation in Northern China with double cropping systems using
bserv. Geoinform. (2007), doi:10.1016/j.jag.2007.11.002
Z. Mingwei et al. / International Journal of Applied Earth Observation and Geoinformation xxx (2008) xxx–xxx 3
+ Models
JAG-189; No of Pages 10
Fig. 1. Study area and survey sites.
3. Data and data sets
3.1. MODIS data sets
The MODIS data were provided by the EOS data
Gateway (EOS, 2005). We used the 8-day composite
MODIS Surface Reflectance Product (MOD09A1). Each
Please cite this article in press as: Mingwei, Z., et al., Crop discrimi
Fourier analysis of time-series MODIS data, Int. J. Appl. Earth O
Fig. 2. Crop calendar
8-day composite includes estimates of ground spectral
reflectance of the seven spectral bands at 500 m spatial
resolution. The product was composed so as to have the
lowest value of blue band (band 3) over every 8 days. In
addition, the MOD09A1 product implements corrections
for gaseous, aerosol scattering, and thin cirrus (Vermote
and Vermeulen, 1999). Even with correction, the noise,
nation in Northern China with double cropping systems using
bserv. Geoinform. (2007), doi:10.1016/j.jag.2007.11.002
of North China.
Z. Mingwei et al. / International Journal of Applied Earth Observation and Geoinformation xxx (2008) xxx–xxx4
+ Models
JAG-189; No of Pages 10
caused by the bidirectional reflectance distribution
function (BRDF) composites, still remained. It was
necessary to reduce the remaining noise for further
analysis. In this study, we downloaded MOD09A1 data
for 2004 (forty-six 8-day composites) from the USGS
EROS Data Centre (http://www.edc.usgs.gov).
3.2. Vegetation index
NDVI is an index that shows the absorptive and
reflective characteristics of vegetation in the red and
near infrared portions of the electromagnetic spectrum.
Therefore, changes in the NDVI time-series indicate
changes in vegetation conditions proportional to the
absorption of photosynthetically active radiation (Sell-
ers, 1985). Therefore, we used NDVI in our method. For
each 8-day composite, we calculated NDVI, using
surface reflectance values from the red, NIR (814–
875 nm) bands (Eq. (1)):
NDVI ¼ rNIR � rred
rNIR þ rred
(1)
3.3. Validation data set
In order to assess the crop map, we gathered national
agricultural statistical data to compare with the satellite-
derived crop area estimates. The statistical crop data
area at county and province-level were obtained from
the Chinese Ministry of Agriculture database.
Trimble GeoXH hand-held GPS receivers were used
for the ground survey in 2005, and a set of 69 field
boundaries were sampled (Fig. 1). There was only one
type of crop in each field. Every field was about 1 km2.
The field polygons were spatially referenced to the
satellite data set. These polygons were used to label
unsupervised clusters in the land cover classification.
3.4. Pre-processing
Even though the available NDVI data sets were
corrected for gaseous and aerosol scatting, the thick
clouds still remained as noise (Los et al., 1994). To
remove data affected by thick clouds, we extracted the
information on clouds and generated masks of cloud
cover for all time periods of each MODIS tile using the
quality control flags in the MODIS file. Those pixels,
labelled as clouds, were removed. For those pixels that
were not labelled as clouds in the cloud quality flag, an
additional restriction was then applied. The pixels with
a blue reflectance of �0.2 were removed as abnormal
data (Xiao et al., 2005).
Please cite this article in press as: Mingwei, Z., et al., Crop discrimi
Fourier analysis of time-series MODIS data, Int. J. Appl. Earth O
Geometric, radiometric and atmospheric corrections
had been made to the MODIS data used here. Data was
re-sampled systematically to a uniform spatial resolu-
tion (500 m), and then were re-projected from the
sinusoidal (SIN) projection to the standard UTM
projection.
To use the FFT, observations must be relatively error
(cloud) free and equidistant in time. The algorithms of
masking clouds always result in an image with data
gaps. It is necessary to reconstruct a cloud free profile of
NDVI for further performance. In this work, the
Savitzky–Golay filter is used to smooth out noise in
NDVI time-series. Compared to other methods, the
method based on Savitzky–Golay filter takes advantage
of ancillary data in the form of cloud flags and can
reconstruct high-quality NDVI time-series by setting
only two parameters (Chen et al., 2004). In addition, it is
a very simple theory and easy to implement. The
parameters in the Savitzky–Golay filter must be
determined according to the NDVI observations when
the filter is applied to NDVI time-series smoothing. The
first parameter is m, the half-width of the smoothing
window. The second parameter is an integer (d)
specifying the degree of the smoothing polynomial.
The (m, d) combination of (7, 3) was determined for
Savitzky–Golay filter in long-term change trend fitting
process. The (m, d) combination of (4, 6) was
determined in the fitting iteration process.
3.5. Fourier transformation
Crops exhibit distinctive seasonal patterns. The
NDVI series data can be used to dynamically reflect
crop growth and track crop phenological metrics
change, because of the positive correlation between
NDVI and LAI. Amplitude and phase angle images,
derived from Fourier analysis of the time-series NDVI
data, were correlated with information on crop type
(Jakubauskas et al., 2001).
The function f(t) is transformed in the discrete
Fourier transform as follows:
FðkÞ ¼ 1
N
XN�1
t¼0
f ðtÞexp
�� 2pikt
N
�; (2)
where k = 0, 1, 2, . . . N � 1, and N is the total number of
input data.
In this work, we used Fourier transform subroutines
implemented by the Interactive Data Language (IDL:
Research Systems Inc., Boulder, USA).
The FFT was applied to the NDVI data sets on a per
pixel basis for the entire study area. The real and
nation in Northern China with double cropping systems using
bserv. Geoinform. (2007), doi:10.1016/j.jag.2007.11.002
Z. Mingwei et al. / International Journal of Applied Earth Observation and Geoinformation xxx (2008) xxx–xxx 5
+ Models
JAG-189; No of Pages 10
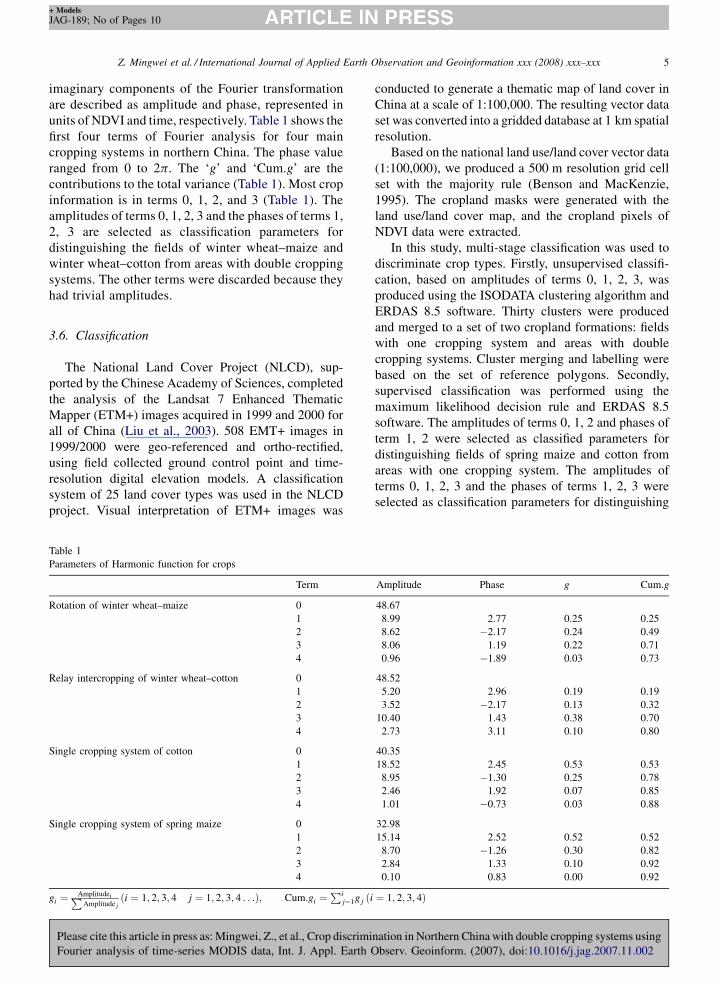
imaginary components of the Fourier transformation
are described as amplitude and phase, represented in
units of NDVI and time, respectively. Table 1 shows the
first four terms of Fourier analysis for four main
cropping systems in northern China. The phase value
ranged from 0 to 2p. The ‘g’ and ‘Cum.g’ are the
contributions to the total variance (Table 1). Most crop
information is in terms 0, 1, 2, and 3 (Table 1). The
amplitudes of terms 0, 1, 2, 3 and the phases of terms 1,
2, 3 are selected as classification parameters for
distinguishing the fields of winter wheat–maize and
winter wheat–cotton from areas with double cropping
systems. The other terms were discarded because they
had trivial amplitudes.
3.6. Classification
The National Land Cover Project (NLCD), sup-
ported by the Chinese Academy of Sciences, completed
the analysis of the Landsat 7 Enhanced Thematic
Mapper (ETM+) images acquired in 1999 and 2000 for
all of China (Liu et al., 2003). 508 EMT+ images in
1999/2000 were geo-referenced and ortho-rectified,
using field collected ground control point and time-
resolution digital elevation models. A classification
system of 25 land cover types was used in the NLCD
project. Visual interpretation of ETM+ images was
Please cite this article in press as: Mingwei, Z., et al., Crop discrimi
Fourier analysis of time-series MODIS data, Int. J. Appl. Earth O
Table 1
Parameters of Harmonic function for crops
Term
Rotation of winter wheat–maize 0
1
2
3
4
Relay intercropping of winter wheat–cotton 0
1
2
3
4
Single cropping system of cotton 0
1
2
3
4
Single cropping system of spring maize 0
1
2
3
4
gi ¼ AmplitudeiPAmplitude j
ði ¼ 1; 2; 3; 4 j ¼ 1; 2; 3; 4 . . .Þ; Cum:gi ¼Pi
j¼1g j ði
conducted to generate a thematic map of land cover in
China at a scale of 1:100,000. The resulting vector data
set was converted into a gridded database at 1 km spatial
resolution.
Based on the national land use/land cover vector data
(1:100,000), we produced a 500 m resolution grid cell
set with the majority rule (Benson and MacKenzie,
1995). The cropland masks were generated with the
land use/land cover map, and the cropland pixels of
NDVI data were extracted.
In this study, multi-stage classification was used to
discriminate crop types. Firstly, unsupervised classifi-
cation, based on amplitudes of terms 0, 1, 2, 3, was
produced using the ISODATA clustering algorithm and
ERDAS 8.5 software. Thirty clusters were produced
and merged to a set of two cropland formations: fields
with one cropping system and areas with double
cropping systems. Cluster merging and labelling were
based on the set of reference polygons. Secondly,
supervised classification was performed using the
maximum likelihood decision rule and ERDAS 8.5
software. The amplitudes of terms 0, 1, 2 and phases of
term 1, 2 were selected as classified parameters for
distinguishing fields of spring maize and cotton from
areas with one cropping system. The amplitudes of
terms 0, 1, 2, 3 and the phases of terms 1, 2, 3 were
selected as classification parameters for distinguishing
nation in Northern China with double cropping systems using
bserv. Geoinform. (2007), doi:10.1016/j.jag.2007.11.002
Amplitude Phase g Cum.g
48.67
8.99 2.77 0.25 0.25
8.62 �2.17 0.24 0.49
8.06 1.19 0.22 0.71
0.96 �1.89 0.03 0.73
48.52
5.20 2.96 0.19 0.19
3.52 �2.17 0.13 0.32
10.40 1.43 0.38 0.70
2.73 3.11 0.10 0.80
40.35
18.52 2.45 0.53 0.53
8.95 �1.30 0.25 0.78
2.46 1.92 0.07 0.85
1.01 �0.73 0.03 0.88
32.98
15.14 2.52 0.52 0.52
8.70 �1.26 0.30 0.82
2.84 1.33 0.10 0.92
0.10 0.83 0.00 0.92
¼ 1; 2; 3; 4Þ
Z. Mingwei et al. / International Journal of Applied Earth Observation and Geoinformation xxx (2008) xxx–xxx6
+ Models
JAG-189; No of Pages 10
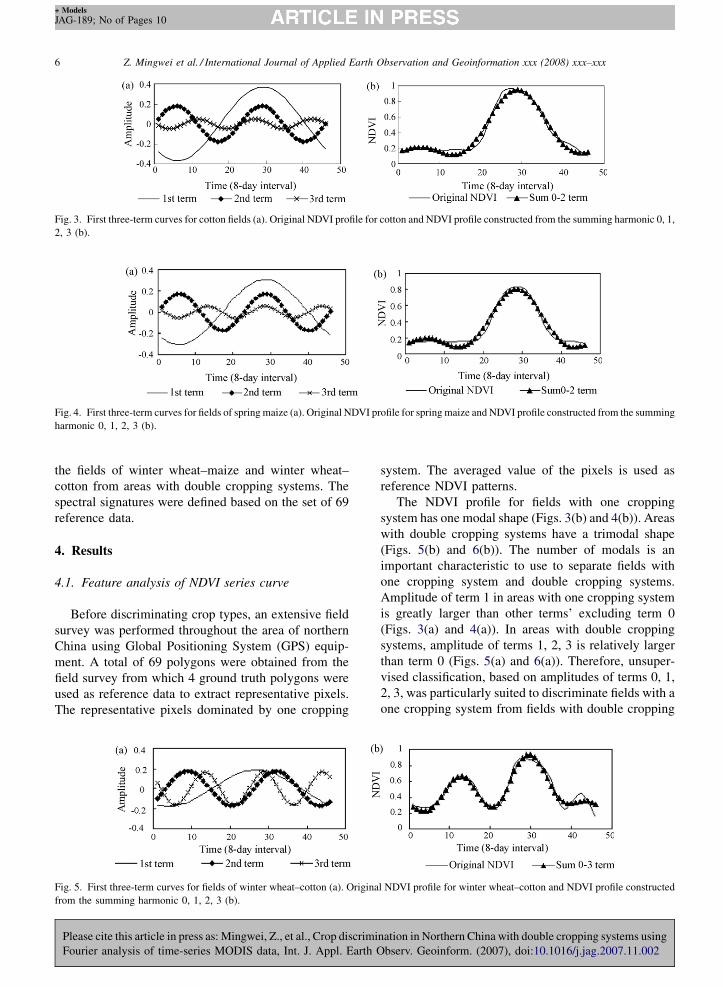
Fig. 3. First three-term curves for cotton fields (a). Original NDVI profile for cotton and NDVI profile constructed from the summing harmonic 0, 1,
2, 3 (b).
Fig. 4. First three-term curves for fields of spring maize (a). Original NDVI profile for spring maize and NDVI profile constructed from the summing
harmonic 0, 1, 2, 3 (b).
the fields of winter wheat–maize and winter wheat–
cotton from areas with double cropping systems. The
spectral signatures were defined based on the set of 69
reference data.
4. Results
4.1. Feature analysis of NDVI series curve
Before discriminating crop types, an extensive field
survey was performed throughout the area of northern
China using Global Positioning System (GPS) equip-
ment. A total of 69 polygons were obtained from the
field survey from which 4 ground truth polygons were
used as reference data to extract representative pixels.
The representative pixels dominated by one cropping
Please cite this article in press as: Mingwei, Z., et al., Crop discrimi
Fourier analysis of time-series MODIS data, Int. J. Appl. Earth O
Fig. 5. First three-term curves for fields of winter wheat–cotton (a). Origina
from the summing harmonic 0, 1, 2, 3 (b).
system. The averaged value of the pixels is used as
reference NDVI patterns.
The NDVI profile for fields with one cropping
system has one modal shape (Figs. 3(b) and 4(b)). Areas
with double cropping systems have a trimodal shape
(Figs. 5(b) and 6(b)). The number of modals is an
important characteristic to use to separate fields with
one cropping system and double cropping systems.
Amplitude of term 1 in areas with one cropping system
is greatly larger than other terms’ excluding term 0
(Figs. 3(a) and 4(a)). In areas with double cropping
systems, amplitude of terms 1, 2, 3 is relatively larger
than term 0 (Figs. 5(a) and 6(a)). Therefore, unsuper-
vised classification, based on amplitudes of terms 0, 1,
2, 3, was particularly suited to discriminate fields with a
one cropping system from fields with double cropping
nation in Northern China with double cropping systems using
bserv. Geoinform. (2007), doi:10.1016/j.jag.2007.11.002
l NDVI profile for winter wheat–cotton and NDVI profile constructed
Z. Mingwei et al. / International Journal of Applied Earth Observation and Geoinformation xxx (2008) xxx–xxx 7
+ Models
JAG-189; No of Pages 10
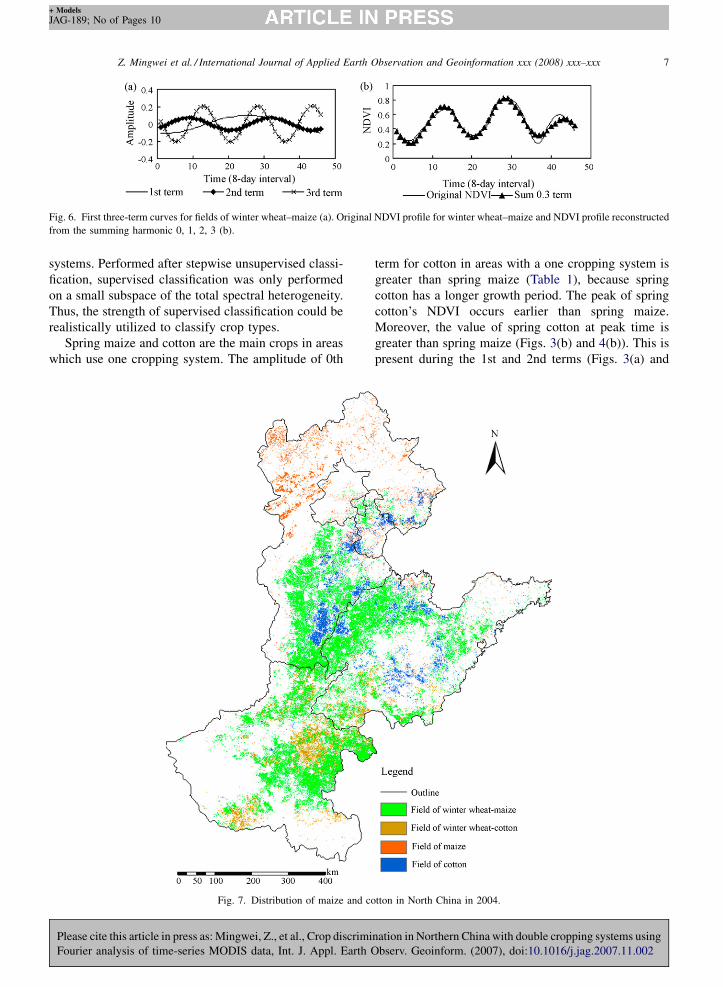
Fig. 6. First three-term curves for fields of winter wheat–maize (a). Original NDVI profile for winter wheat–maize and NDVI profile reconstructed
from the summing harmonic 0, 1, 2, 3 (b).
systems. Performed after stepwise unsupervised classi-
fication, supervised classification was only performed
on a small subspace of the total spectral heterogeneity.
Thus, the strength of supervised classification could be
realistically utilized to classify crop types.
Spring maize and cotton are the main crops in areas
which use one cropping system. The amplitude of 0th
Please cite this article in press as: Mingwei, Z., et al., Crop discrimi
Fourier analysis of time-series MODIS data, Int. J. Appl. Earth O
Fig. 7. Distribution of maize and co
term for cotton in areas with a one cropping system is
greater than spring maize (Table 1), because spring
cotton has a longer growth period. The peak of spring
cotton’s NDVI occurs earlier than spring maize.
Moreover, the value of spring cotton at peak time is
greater than spring maize (Figs. 3(b) and 4(b)). This is
present during the 1st and 2nd terms (Figs. 3(a) and
nation in Northern China with double cropping systems using
bserv. Geoinform. (2007), doi:10.1016/j.jag.2007.11.002
tton in North China in 2004.
Z. Mingwei et al. / International Journal of Applied Earth Observation and Geoinformation xxx (2008) xxx–xxx8
+ Models
JAG-189; No of Pages 10
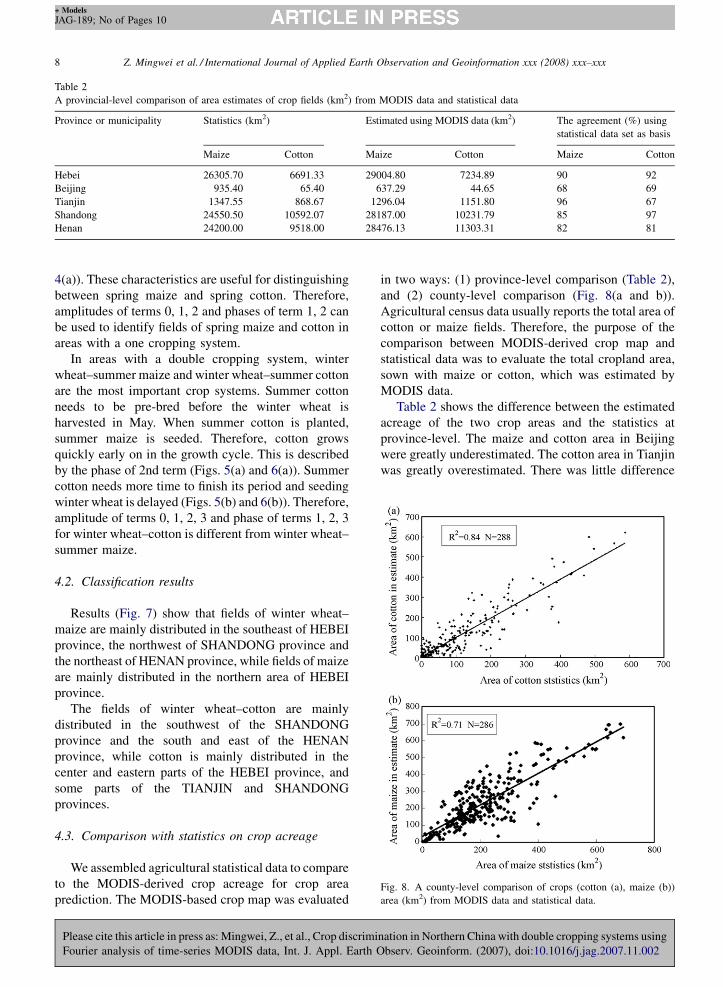
Table 2
A provincial-level comparison of area estimates of crop fields (km2) from MODIS data and statistical data
Province or municipality Statistics (km2) Estimated using MODIS data (km2) The agreement (%) using
statistical data set as basis
Maize Cotton Maize Cotton Maize Cotton
Hebei 26305.70 6691.33 29004.80 7234.89 90 92
Beijing 935.40 65.40 637.29 44.65 68 69
Tianjin 1347.55 868.67 1296.04 1151.80 96 67
Shandong 24550.50 10592.07 28187.00 10231.79 85 97
Henan 24200.00 9518.00 28476.13 11303.31 82 81
Fig. 8. A county-level comparison of crops (cotton (a), maize (b))
area (km2) from MODIS data and statistical data.
4(a)). These characteristics are useful for distinguishing
between spring maize and spring cotton. Therefore,
amplitudes of terms 0, 1, 2 and phases of term 1, 2 can
be used to identify fields of spring maize and cotton in
areas with a one cropping system.
In areas with a double cropping system, winter
wheat–summer maize and winter wheat–summer cotton
are the most important crop systems. Summer cotton
needs to be pre-bred before the winter wheat is
harvested in May. When summer cotton is planted,
summer maize is seeded. Therefore, cotton grows
quickly early on in the growth cycle. This is described
by the phase of 2nd term (Figs. 5(a) and 6(a)). Summer
cotton needs more time to finish its period and seeding
winter wheat is delayed (Figs. 5(b) and 6(b)). Therefore,
amplitude of terms 0, 1, 2, 3 and phase of terms 1, 2, 3
for winter wheat–cotton is different from winter wheat–
summer maize.
4.2. Classification results
Results (Fig. 7) show that fields of winter wheat–
maize are mainly distributed in the southeast of HEBEI
province, the northwest of SHANDONG province and
the northeast of HENAN province, while fields of maize
are mainly distributed in the northern area of HEBEI
province.
The fields of winter wheat–cotton are mainly
distributed in the southwest of the SHANDONG
province and the south and east of the HENAN
province, while cotton is mainly distributed in the
center and eastern parts of the HEBEI province, and
some parts of the TIANJIN and SHANDONG
provinces.
4.3. Comparison with statistics on crop acreage
We assembled agricultural statistical data to compare
to the MODIS-derived crop acreage for crop area
prediction. The MODIS-based crop map was evaluated
Please cite this article in press as: Mingwei, Z., et al., Crop discrimi
Fourier analysis of time-series MODIS data, Int. J. Appl. Earth O
in two ways: (1) province-level comparison (Table 2),
and (2) county-level comparison (Fig. 8(a and b)).
Agricultural census data usually reports the total area of
cotton or maize fields. Therefore, the purpose of the
comparison between MODIS-derived crop map and
statistical data was to evaluate the total cropland area,
sown with maize or cotton, which was estimated by
MODIS data.
Table 2 shows the difference between the estimated
acreage of the two crop areas and the statistics at
province-level. The maize and cotton area in Beijing
were greatly underestimated. The cotton area in Tianjin
was greatly overestimated. There was little difference
nation in Northern China with double cropping systems using
bserv. Geoinform. (2007), doi:10.1016/j.jag.2007.11.002
Z. Mingwei et al. / International Journal of Applied Earth Observation and Geoinformation xxx (2008) xxx–xxx 9
+ Models
JAG-189; No of Pages 10
between the MODIS-derived area and the statistics of
the two crops in the three provinces.
At county-level, the estimated cotton area and
statistical data were well correlated (R2 = 0.84,
RMSE = 48.11 km2) (Fig. 8a). The correlation in maize
areas from the MODIS data and the statistical data was
positive (R2 = 0.71, RMSE = 82.00 km2) (Fig. 8b).
5. Discussion and conclusions
In this study, we applied the FFTanalysis of MODIS-
derived vegetation indices to an area with a double
cropping system and discriminated maize and cotton
fields at regional spatial scales. The estimated crop
(cotton and maize) areas by MODIS data were well
correlated with statistical data at county-level. The crop
map overestimated or underestimated areas of cotton
and maize due to the fragmentation and sub-pixel
proportion of cotton or maize fields at county-level. If
finer spatial resolution data could be used, further
improvements to crop identification could be achieved.
At the province-level, MODIS-derived crop (cotton,
maize) areas corresponded with statistical data,
excluding Beijing and Tianjin. The maize and cotton
areas in Beijing were greatly underestimated. The
cotton area in Tianjin was greatly overestimated. The
small fields and various types of planting structure
maybe the reason that it is difficult to estimate Beijing
and Tianjin’s crop areas. Our study shows that the
method, using MODIS NDVI time-series, is promising
for crop mapping in northern China with double
cropping systems. Finally, a FFT analysis of the NDVI
profile needs a full cycle of data.
Acknowledgments
This research was supported by the program
‘‘Regional crop growth monitoring and simulation
based on multi-sensor information and assimilation of
remote sensing data into crop growth model’’ from the
National High Technology Research and Development
Program of China (863 Program No. 2006AA12Z103)
and by the Program ‘‘Research on data fusion and its
criterion for agricultural resources spatial information’’
from National Key Technologies R&D Program of
China (No. 2006BAD10A06) and by the Asia ITC
project ‘‘HUABEI-CGMS: Crop Growth Monitoring
and Yield Forecasting in the North China plain
(Huabei)’’ from the European Union. We are also
grateful to Reviewers and editor for their comments and
suggestions, which have greatly help us to improve the
original version of the manuscript.
Please cite this article in press as: Mingwei, Z., et al., Crop discrimi
Fourier analysis of time-series MODIS data, Int. J. Appl. Earth O
References
Azzali, S., Menenti, M., 2000. Mapping vegetation–soil–climate
complexes in southern Africa using temporal Fourier analysis
of NOAA-AVHRR NDVI data. Int. J. Remote Sens. 21, 973–996.
Brown, J.F., Loveland, T.R., Merchant, J.W., Reed, B.C., Ohlen, D.O.,
1993. Using multi-source data in global land cover characteriza-
tion: concepts, requirements and methods. Photogramm. Eng.
Remote Sens. 59, 977–987.
Chen, j., Jonsson, P., Tamura, M., Gu, Z., Matsushita, B., Eklundh, L.,
2004. A simple method for reconstructing a high-quality NDVI
time-series data set based on the Savitzky–Golay filter. Remote
Sens. Environ. 91, 332–344.
Defries, R., Hansen, M., Townshend, J., 1995. Global discrimination
of land cover types from metrics derived from AVHRR Pathfinder
data. Remote Sens. Environ. 54, 209–222.
Doraiswamy, P.C., Sinclair, T.R., Hollinger, S., Akhmedov, B., Stern,
A., Prueger, J., 2005. Application of MODIS derived parameters
for regional crop yield assessment. Remote Sens. Environ. 97,
192–202.
Eastman, J.R., Fulk, M.A., 1993. Long sequence time series evalua-
tion using standardized principal component. Photogramm. Eng.
Remote Sens. 59, 1307–1312.
Gutman, G., Ignatov, A., 1998. Derivation of green vegetation fraction
from NOAA-AVHRR for use in numerical weather prediction
models. Int. J. Remote Sens. 19, 1533–1543.
Jakubauskas, M.E., Legates, D.R., Kastens, J.H., 2001. Harmonic
analysis of time-series AVHRR NDVI data. Photogramm. Eng.
Remote Sens. 67, 461–470.
Jakubauskas, M.E., Legates, D.R., Kastens, J.H., 2002. Crop identi-
fication using harmonic analysis of time-series AVHRR NDVI
data. Comput. Electron. Agric. 37, 127–139.
Liu, J., Liu, M., Zhang, D., Deng, X., 2003. Study on spatial patterns
of land use change in China during 1995–2000. Sci. China 46,
373–384.
Los, S.O., Justice, C.O., Tucker, C.J., 1994. A global 1 by 1 degree
NDVI data set for climate studies derived from the GIMMS
continental NDVI data. Int. J. Remote Sens. 15, 3493–3518.
Loveland, T.R., Merchant, J.W., Brown, J.F., Ohlen, D.O., Reed, B.C.,
Olson, P., Hutchinson, J., 1995. Seasonal land-cover regions of the
United States. Ann. Assoc. Am. Geographers 85, 339–355.
Menenti, M., Azzali, S., Verhoef, W., Van Swol, R., 1993. Mapping
agroecological zones and time lag in vegetation growth by means
of Fourier analysis of time series of NDVI images. Adv. Space
Res. 13, 233–237.
Reed, B.C., Brown, J.F., VanderZee, D., Loveland, T.R., James, M.W.,
Ohlen, D.O., 1994. Measuring phenological variability from
satellite imagery. J. Veg. Sci. 5, 703–714.
Roerink, G.J., Menenti, M., 2000. Reconstructing cloudfree NDVI
composites using Fourier analysis of time series. Int. J. Remote
Sens. 21, 1911–1917.
Sellers, P.J., 1985. Canopy reflectance photosynthesis and transpira-
tion. Int. J. Remote Sens. 6, 1335–1372.
Townshend, J.R., Justice, C.O., Kalb, V.T., 1987. Characterization and
classification of South American land cover types using satellite
data. Int. J. Remote Sens. 8, 1189–1207.
Townshend, J., Justice, C., Li, W., Gurney, C., McManus, J., 1991.
Global land cover classification by remote sensing: present cap-
abilities and future possibilities. Remote Sens. Environ. 35, 243–
255.
Tucher, C.T., Townshend, J.R., Goff, T.E., 1985. African land cover
classification using satellite data. Science 227, 369–375.
nation in Northern China with double cropping systems using
bserv. Geoinform. (2007), doi:10.1016/j.jag.2007.11.002
Z. Mingwei et al. / International Journal of Applied Earth Observation and Geoinformation xxx (2008) xxx–xxx10
+ Models
JAG-189; No of Pages 10
Vermote, E.F., Vermeulen, A. (1999). MODIS Algorithm Technical
Background Document, Atmospheric correction algorithm: Spec-
tral reflectances (MOD09). NASA contract NAS5-96062.
Xiao, X., Boles, S., Liu, J., Zhuang, D., Frolking, S., LI, C., Salas, W.,
Moore III, B., 2005. Mapping paddy rice agriculture in southern
China using multi-temporal MODIS images. Remote Sens.
Environ. 95, 480–492.
Please cite this article in press as: Mingwei, Z., et al., Crop discrimi
Fourier analysis of time-series MODIS data, Int. J. Appl. Earth O
Yin, Z.W.T.H.L., 1997. Obtaining spatial and temporal vegetation
data from Landsat MSS and AVHRR/NOAA satellite images
for a hydrologic model. Photogramm. Eng. Remote Sens. 63,
69–77.
Zhang, X., Friedl, M.A., Schaaf, C.B., Strahler, A.H., Hodges, J.C.F.,
Gao, F., Reed, B.C., Huete, A., 2003. Monitoring vegetation
phenology using MODIS. Remote Sens. Environ. 84, 471–475.
nation in Northern China with double cropping systems using
bserv. Geoinform. (2007), doi:10.1016/j.jag.2007.11.002