cover sheet - gt capital holdings inc
TRANSCRIPT
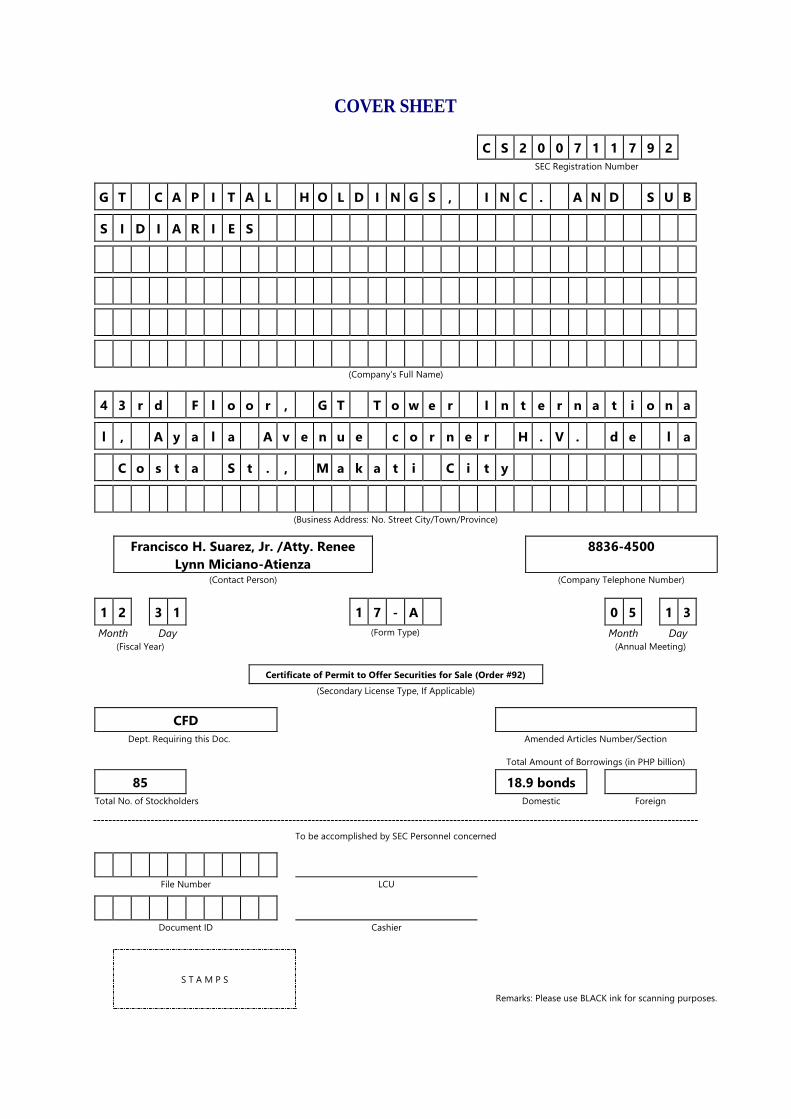
COVER SHEET
C S 2 0 0 7 1 1 7 9 2
SEC Registration Number
G T C A P I T A L H O L D I N G S , I N C . A N D S U B
S I D I A R I E S
(Company’s Full Name)
4 3 r d F l o o r , G T T o w e r I n t e r n a t i o n a
l , A y a l a A v e n u e c o r n e r H . V . d e l a
C o s t a S t . , M a k a t i C i t y
(Business Address: No. Street City/Town/Province)
Francisco H. Suarez, Jr. /Atty. Renee
Lynn Miciano-Atienza
8836-4500
(Contact Person) (Company Telephone Number)
1 2 3 1 1 7 - A 0 5 1 3
Month Day (Form Type) Month Day
(Fiscal Year) (Annual Meeting)
Certificate of Permit to Offer Securities for Sale (Order #92)
(Secondary License Type, If Applicable)
CFD
Dept. Requiring this Doc. Amended Articles Number/Section
Total Amount of Borrowings (in PHP billion)
85 18.9 bonds
Total No. of Stockholders Domestic Foreign
To be accomplished by SEC Personnel concerned
File Number LCU
Document ID Cashier
S T A M P S
Remarks: Please use BLACK ink for scanning purposes.
2
SEC Number CS200711792
File Number ___________
GT CAPITAL HOLDINGS, INC.
(Company’s Full Name)
43rd Floor, GT Tower International, Ayala Avenue cor H.V. Dela Costa St, Makati City
(Company’s Address)
8836-4500
(Telephone Number)
December 31
(Fiscal year ending)
17-A
(Form Type)
(Amendment Designation, if applicable)
December 31, 2019
(Period Ended Date)
None
(Secondary License Type and File Number)
3
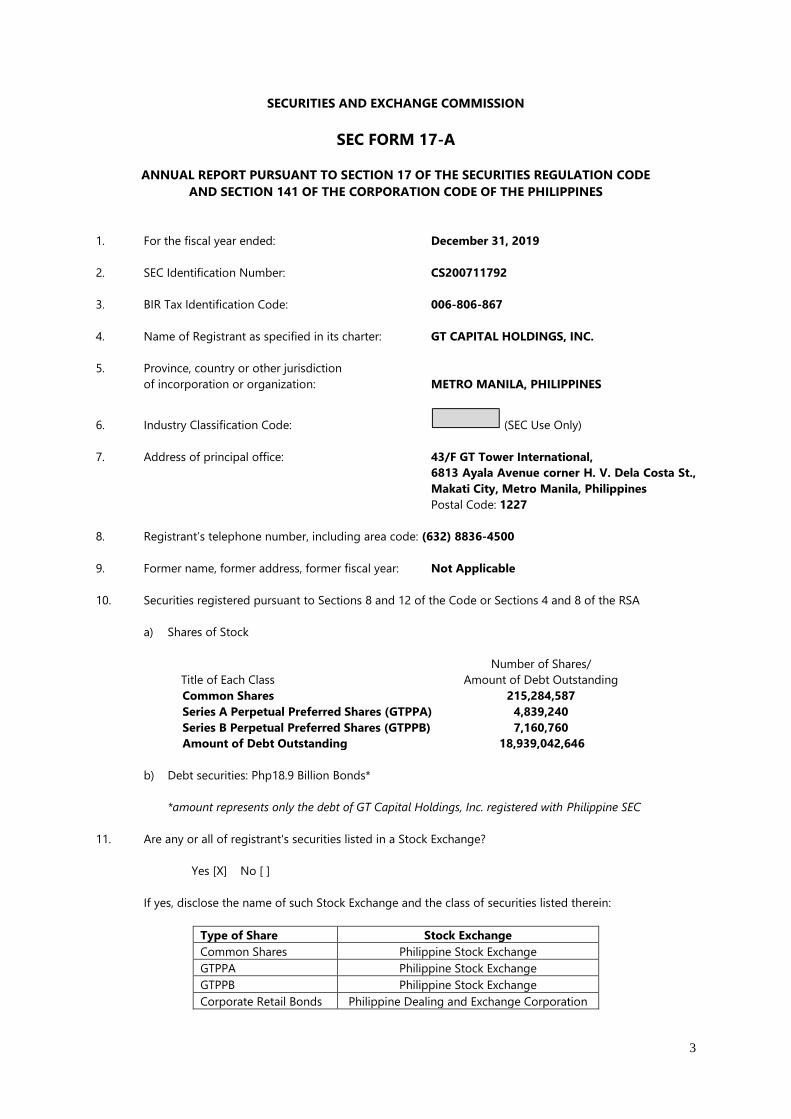
SECURITIES AND EXCHANGE COMMISSION
SEC FORM 17-A
ANNUAL REPORT PURSUANT TO SECTION 17 OF THE SECURITIES REGULATION CODE
AND SECTION 141 OF THE CORPORATION CODE OF THE PHILIPPINES
1. For the fiscal year ended: December 31, 2019
2. SEC Identification Number: CS200711792
3. BIR Tax Identification Code: 006-806-867
4. Name of Registrant as specified in its charter: GT CAPITAL HOLDINGS, INC.
5. Province, country or other jurisdiction
of incorporation or organization: METRO MANILA, PHILIPPINES
6. Industry Classification Code: (SEC Use Only)
7. Address of principal office: 43/F GT Tower International,
6813 Ayala Avenue corner H. V. Dela Costa St.,
Makati City, Metro Manila, Philippines
Postal Code: 1227
8. Registrant’s telephone number, including area code: (632) 8836-4500
9. Former name, former address, former fiscal year: Not Applicable
10. Securities registered pursuant to Sections 8 and 12 of the Code or Sections 4 and 8 of the RSA
a) Shares of Stock
Title of Each Class
Number of Shares/
Amount of Debt Outstanding
Common Shares 215,284,587
Series A Perpetual Preferred Shares (GTPPA) 4,839,240
Series B Perpetual Preferred Shares (GTPPB) 7,160,760
Amount of Debt Outstanding 18,939,042,646
b) Debt securities: Php18.9 Billion Bonds*
*amount represents only the debt of GT Capital Holdings, Inc. registered with Philippine SEC
11. Are any or all of registrant's securities listed in a Stock Exchange?
Yes [X] No [ ]
If yes, disclose the name of such Stock Exchange and the class of securities listed therein:
Type of Share Stock Exchange
Common Shares Philippine Stock Exchange
GTPPA Philippine Stock Exchange
GTPPB Philippine Stock Exchange
Corporate Retail Bonds Philippine Dealing and Exchange Corporation
4
12. Check whether the issuer:
(a) has filed all reports required to be filed by Section 17 of the SRC and SRC Rule 17.1 thereunder or
Section 11 of the RSA and RSA Rule 11(a)-1 thereunder, and Sections 26 and 141 of the Corporation
Code of the Philippines during the preceding twelve (12) months (or for such shorter period that the
registrant was required to file such reports);
Yes [X] No [ ]
(b) has been subject to such filing requirements for the past ninety (90) days.
Yes [X] No [ ]
13. Aggregate market value of voting stock held by non-affiliates: Php38.4 billion (based on closing price
of Php407.00 as of March 31, 2020 and 94,378,281 outstanding common shares held by public as of
December 31, 2019); Php17.4 million (based on offer price of Php0.10 per share as of April 13, 2015
and 174,300,000 voting preferred shares as of December 31, 2019)
APPLICABLE ONLY TO ISSUERS INVOLVED IN
INSOLVENCY/SUSPENSION OF PAYMENTS PROCEEDINGS
DURING THE PRECEDING FIVE YEARS:
14. Check whether the issuer has filed all documents and reports required to be filed by Section 17 of the
Code subsequent to the distribution of securities under a plan confirmed by a court or the Commission.
Not Applicable
Yes [ ] No [ ]
DOCUMENTS INCORPORATED BY REFERENCE
15. Briefly describe documents incorporated by reference and identify the part of SEC Form 17-A into which
the document is incorporated:
(a) 2019 Audited Consolidated Financial Statements of GT Capital Holdings, Inc. and Subsidiaries
(incorporated as reference for items 1,7, and 8 of SEC Form 17-A)
(b) 2019 Audited Consolidated Financial Statements of Metropolitan Bank and Trust Company
(incorporated as reference for item 1 of SEC Form 17-A)
5
TABLE OF CONTENTS
PART I BUSINESS AND GENERAL INFORMATION
Item 1. Business ………………………………………………………………………………………………………………………………… 6
Item 2. Properties ……………………………………………………………………………………………………………………………… 82
Item 3. Legal Proceedings ………………………………………………………………………………………………………………… 86
Item 4. Submission of Matter to a Vote of Securities Holder …………………………………………………………… 87
PART II. OPERATIONAL AND FINANCIAL INFORMATION
Item 5. Market for Issuer’s Common Equity and Related Stockholder Matters ………………………………… 88
Item 6. Market of Issuer's Securities Other Than Common Equity …………………………………………………… 90
Item 7. Management’s Discussion and Analysis or Plan of Operation ……………………………………………… 92
Item 8. Financial Statements ……………………………………………………………………………………………………………… 121
Item 9. Changes in and Disagreements with Accountants on Accounting and Financial Disclosure … 121
PART III. CONTROL AND COMPENSATION INFORMATION
Item 10. Directors and Executive Officers of the Issuer ……………………………………………………………………… 123
Item 11. Executive Compensation ……………………………………………………………………………………………………… 136
Item 12. Security Ownership of Certain Beneficial Owners and Management…………………………………… 137
Item 13. Certain Relationships and Related Transactions…………………………………………………………………… 139
PART IV. EXHIBITS AND SCHEDULES
IItem 14. Exhibits and Reports on SEC Form 17-C …………………………………………………………………………… 141
SIGNATURES …………………………………………………………………………………………………………………………………………………… 144
ANNEX A INDEX TO FINANCIAL STATEMENTS AND SUPPLEMENTARY SCHEDULES
ANNEX B SUSTAINABILITY REPORTING TEMPLATE
6
PART I.
BUSINESS AND GENERAL INFORMATION
Item 1. Business
GT Capital Holdings, Inc. (GT Capital or the Company or the Parent Company or the Group) was incorporated in
the Republic of the Philippines on July 26, 2007. The Company’s registered office address and principal place of
business is at 43/F GT Tower International, 6813 Ayala Avenue corner H. V. Dela Costa St., Makati City, Metro
Manila, Philippines. GT Capital is a listed company, of which 56.16% is owned by Grand Titan Capital Holdings,
Inc. (Grand Titan) and the directors and senior officers of GT Capital, while the balance of 43.84% is publicly
owned as of December 31, 2019.
GT Capital is a major Philippine conglomerate with interests in market-leading businesses across banking,
automotive assembly, importation, distribution and financing, property development, life and non-life insurance,
and infrastructure and utilities. GT Capital is the primary vehicle for the holding and management of the
diversified business interests of the Ty family in the Philippines. GT Capital’s business management, investment
decisions and future business development are and will be firmly rooted in its corporate values of integrity,
competence, respect, entrepreneurial spirit and commitment to value creation.
GT Capital’s portfolio of businesses is well-positioned to benefit from broad-based growth in the Philippine
economy and domestic consumption in particular. The portfolio as of December 31, 2019 comprises directly-held
interests in the following GT Capital component companies:
• Automotive assembly, importation, distribution, dealership and financing – GT Capital primarily
conducts its automotive business through its 51.0% interest in Toyota Motor Philippines Corporation (TMP).
TMP is engaged in the assembly, importation, and wholesale distribution of Toyota motor vehicles in the
Philippines, and is also engaged in the sale of motor vehicle parts and accessories both within the Philippines
and abroad through exports. TMP is also engaged in the distribution of Lexus brand motor vehicles in the
Philippines. In addition, TMP owns Toyota Makati with one (1) branch – Toyota Bicutan; Toyota San Fernando
in Pampanga with two (2) branches – in Plaridel, Bulacan and Hacienda Luisita, Tarlac City; Toyota Santa Rosa
in Laguna; and Lexus Manila, situated in Bonifacio Global City, Taguig.
GT Capital conducts its automotive dealership business through its 58.10% interest in Toyota Manila Bay
Corporation (TMBC). TMBC exclusively distributes Toyota motor vehicles in the Luzon island, primarily
servicing the market in Metro Manila. They also offer original Toyota brand motor vehicle parts and
accessories, and provide after-sales services to Toyota vehicles.
GT Capital provides financing for the acquisition of Toyota motor vehicles through its 40.00% interest in
Toyota Financial Services Philippines Corporation (TFSPH). TFSPH offers retail loans and finance lease to its
individual and corporate clients for the acquisition of brand-new and/or certified pre-owned Toyota vehicles.
In February 2019, TFSPH started to offer operating lease product to corporate clients.
On June 13, 2016, SEC approved the incorporation of GT Capital Auto Dealership Holdings, Inc. (GTCAD).
GTCAD is a holding entity primarily for future auto dealerships of the Company. On July 14, 2016, SEC
approved the incorporation of Toyota Subic, Inc. (TSB), a joint venture between GTCAD and JBT Global
Holdings Inc. (JBT Global), with GTCAD owning 55% and JBT Global owning 45% of TSB's issued and
outstanding capital stock. TSB commenced commercial operations on November 8, 2018.
• Banking – GT Capital conducts banking services through its 36.65% interest in Metropolitan Bank & Trust
company (“MBT” or “Metrobank”). MBT is a universal bank that provides, through itself and other members
of the MBT Group, a full range of banking and other financial products and services including corporate,
commercial and consumer banking products and services as well as credit card, investment banking and trust
services. Metrobank has been listed on the Philippine Stock Exchange since 1981. As of December 31, 2019,
7
the MBT Group had a total of 957 branches in the Philippines, of which 707 were operated by MBT and 250
were operated by Philippine Savings Bank (“PSBank”); and over 2,300 automated teller machines (“ATMs”).
• Property development – GT Capital engages in property development business through its wholly-owned
subsidiary, Federal Land, Inc. (“Federal Land”). Federal Land primarily focuses on the development of high-
rise, vertical residential condominium projects, as well as on master-planned communities that offer
residential, retail, office and commercial space. It caters mainly to the upper mid-end market segment with
projects in key, strategic urban communities.
• Life and Non-Life Insurance – GT Capital conducts its life and non-life insurance business through its 25.3%
interest in Philippine AXA Life Insurance Corporation (AXA Philippines), which offers personal and group
insurance products in the country, including investment-linked insurance products. AXA Philippines also
fully-owns Charter Ping An Insurance Corporation (Charter Ping An or CPAIC) which offers non-life insurance
products in the Philippines that includes fire/property, marine, motor car, personal accident, other casualty,
and engineering insurance, among others. AXA Philippines distributes its products through a multi-channel
distribution network comprised of agents, bancassurance (through MBT and PSBank branches), and
corporate solutions.
• Infrastructure and Utilities – GT Capital, through its 15.55% stake in Metro Pacific Investments Corporation
(MPIC), the Philippines’ largest infrastructure conglomerate, has exposure in high-growth infrastructure
businesses such as toll roads, water, power, railways, healthcare, and logistics. Among MPIC’s portfolio is
Manila Electric Company (MERALCO), the country’s largest power distribution utility; Global Business Power
Corporation (GBPC), one of the largest power generation companies in the Visayas Region; Maynilad Water
Services, Inc., which manages Metro Manila’s widest water distribution network; and Metro Pacific Tollways
Corporation, operator of the country’s largest toll road network.
• Motorcycle Financing – GT Capital, through its 20.0% stake in Sumisho Motor Finance Corporation (SMFC),
which offers end-user financing for Japanese motorcycle brands.
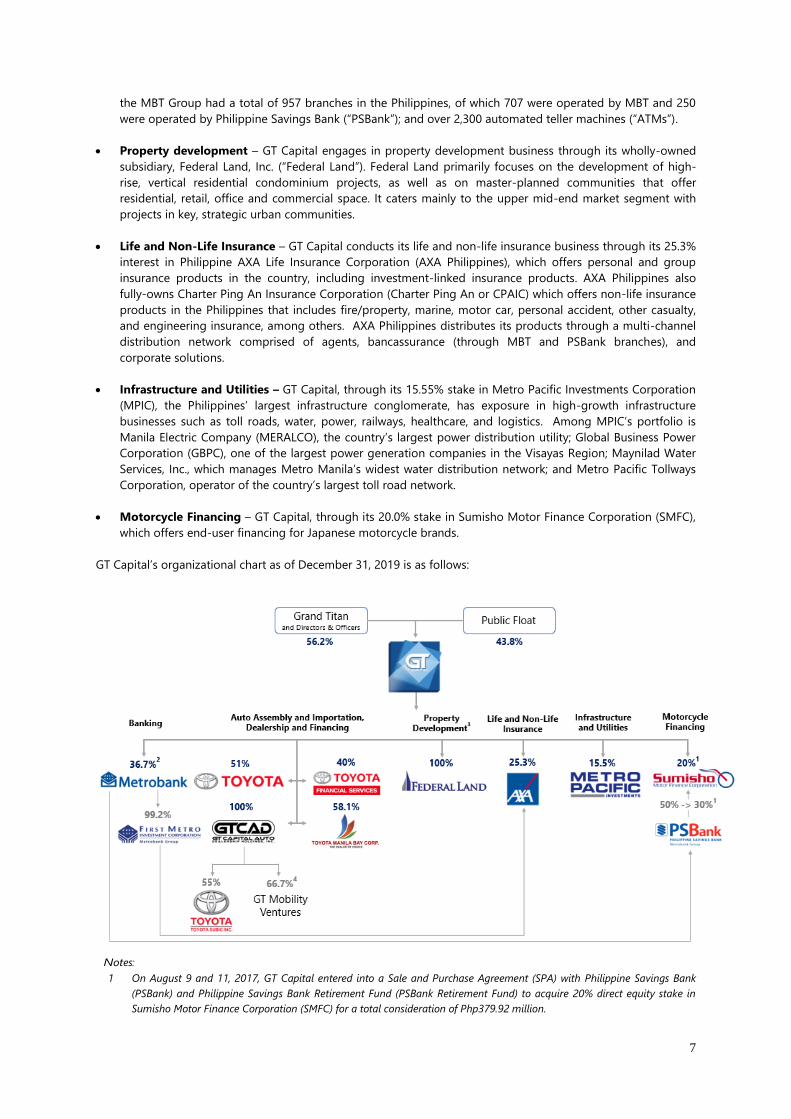
GT Capital’s organizational chart as of December 31, 2019 is as follows:
Notes:
1 On August 9 and 11, 2017, GT Capital entered into a Sale and Purchase Agreement (SPA) with Philippine Savings Bank
(PSBank) and Philippine Savings Bank Retirement Fund (PSBank Retirement Fund) to acquire 20% direct equity stake in
Sumisho Motor Finance Corporation (SMFC) for a total consideration of Php379.92 million.
8
2 On various dates in 2019, the Parent Company acquired an aggregate of 12.26 million common shares of Metrobank for a
total consideration of Php836.53 million. This increased GT Capital’s ownership interest in Metrobank from 36.36% to
36.65%.
3 On May 10, 2019 the Parent Company and PCFI executed a Redemption Agreement for the redemption, cancellation and
retirement of the 64,530,712 Series A Redeemable Voting Preferred Shares with a par value of Php10.00 per share of PCFI,
representing 51% interest of the Parent Company in PCFI. The Parent Company and PCFI have agreed to the redemption
price of Php20.00 billion through the assignment, transfer and conveyance of the selected assets owned and/or beneficially
owned by PCFI to the Parent Company.
On July 4, 2019, Philippine Competition Commission approved the Redemption Agreement of the Parent Company and
PCFI. Accordingly, the financial statements of PCFI were deconsolidated from the consolidated financial statements of the
Group as of that date.
4 In February 2019, the Parent Company remitted Php100.00 million to GTCAD to fund the latter’s investment in a used car
auction business in March 2019. GTCAD, through GTMV, a joint venture between the Company and Mitsui, formed JBA
Philippines with auction house operator Japan Bike Auction Co., Ltd. (“JBA”). 60% of JBA Philippines is controlled by GTMV
while 40% is owned by JBA.
On September 9, 2019, the SEC approved GTMV’s increase in authorized capital stock, from 1,000,000 shares with par
value of Php1.00 per share to 600,000,000 shares with par value of Php1.00 per share. GTCAD and Mitsui & Co. Ltd.
(Mitsui) have subscribed to the increase in the authorized capital stock of GTMV and has paid for such subscription
amounting to Php99.75 million and Php50.00 million, respectively. This resulted to a change in GTCAD’s direct holdings in
GTMV from 100% to 66.67%.
Competition
Many of GT Capital’s activities are carried on in highly competitive industries. Given the diversity of GT Capital’s
businesses, GT Capital companies compete based on product, service and geographic area. While GT Capital is
one of the largest conglomerates in the Philippines, the GT Capital companies compete against several
companies in various sectors, some of which possess competitive manufacturing, financial, research and
development and market resources.
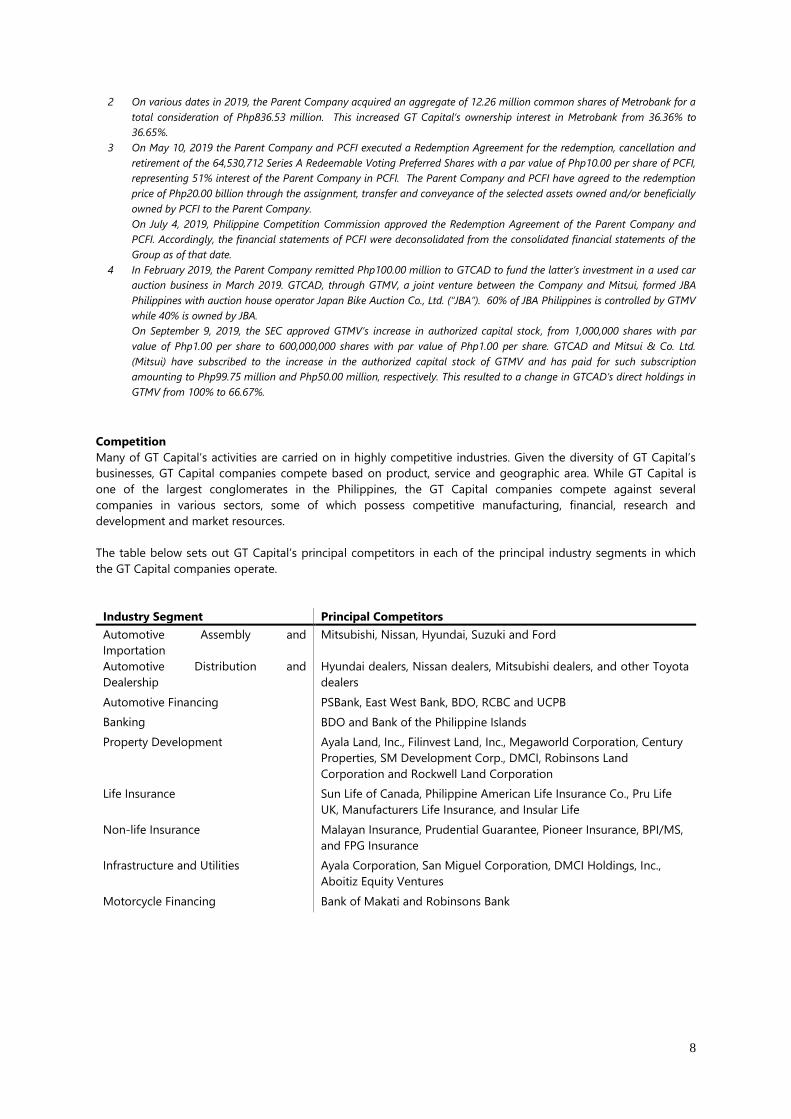
The table below sets out GT Capital’s principal competitors in each of the principal industry segments in which
the GT Capital companies operate.
Industry Segment Principal Competitors
Automotive Assembly and
Importation
Mitsubishi, Nissan, Hyundai, Suzuki and Ford
Automotive Distribution and
Dealership
Hyundai dealers, Nissan dealers, Mitsubishi dealers, and other Toyota
dealers
Automotive Financing PSBank, East West Bank, BDO, RCBC and UCPB
Banking BDO and Bank of the Philippine Islands
Property Development
Ayala Land, Inc., Filinvest Land, Inc., Megaworld Corporation, Century
Properties, SM Development Corp., DMCI, Robinsons Land
Corporation and Rockwell Land Corporation
Life Insurance Sun Life of Canada, Philippine American Life Insurance Co., Pru Life
UK, Manufacturers Life Insurance, and Insular Life
Non-life Insurance Malayan Insurance, Prudential Guarantee, Pioneer Insurance, BPI/MS,
and FPG Insurance
Infrastructure and Utilities Ayala Corporation, San Miguel Corporation, DMCI Holdings, Inc.,
Aboitiz Equity Ventures
Motorcycle Financing Bank of Makati and Robinsons Bank
9
Transaction with Related Parties
Parties are considered to be related if one party has the ability, directly, or indirectly, to control the other party or
exercise significant influence over the other party in making financial and operating decisions and the parties are
subject to common control or common significant influence. Related parties may be individuals or corporate
entities. These related parties include subsidiaries, associates, joint venture, key management personnel,
stockholders and other related parties which include affiliates. Related party transactions are conducted fairly and
on an arms’ length basis and are discussed in the accompanying financial statements of the Company.
Developmental and Other Activities
As a holding company, GT Capital has no material patent, trademark, or intellectual property right to its products.
The Company’s operating companies, however, may have these material intellectual property rights, but the dates
and terms of their expiration or renewal are not perceived to have a material adverse effect on the Company. The
Company complies with all existing government regulations and environmental laws, the costs of which are not
material. GT Capital has no material development activities.
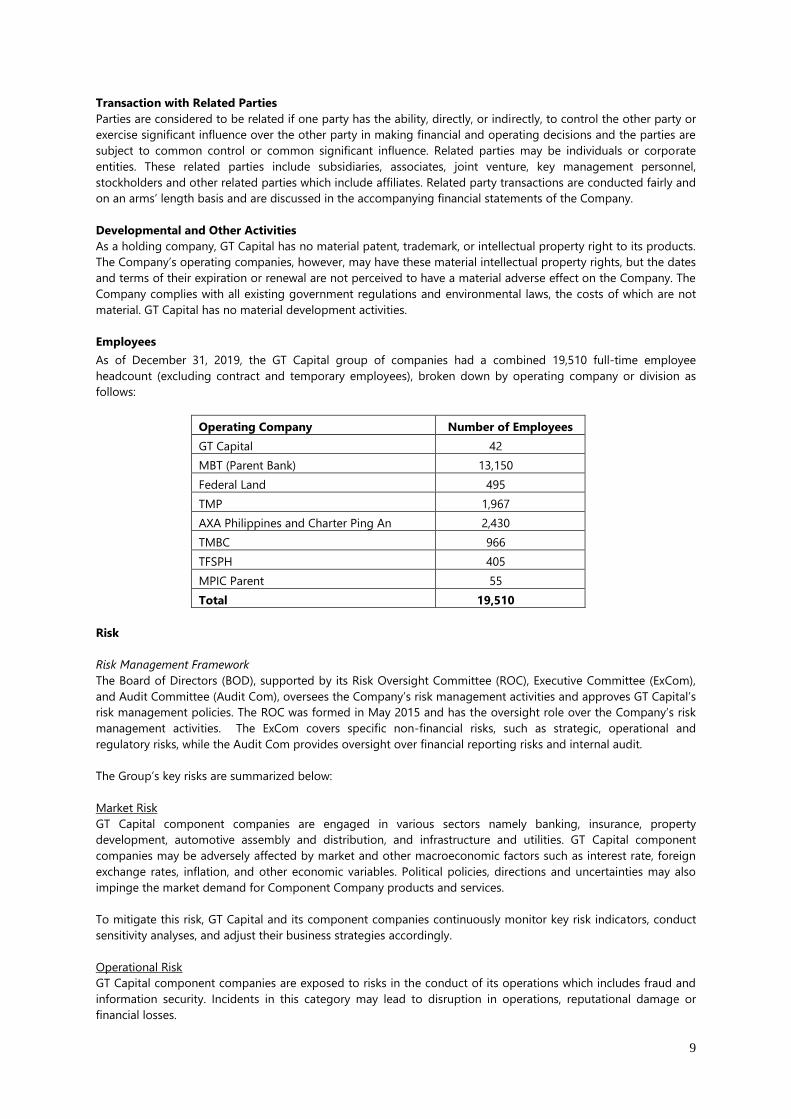
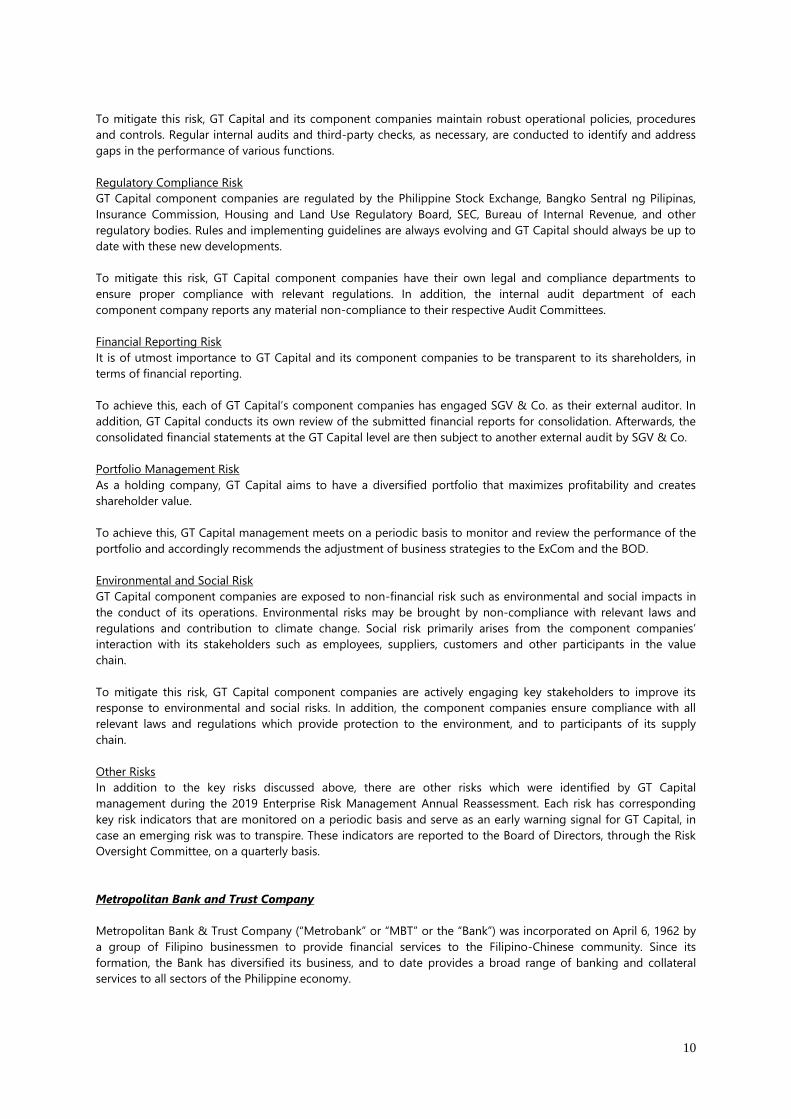
Employees
As of December 31, 2019, the GT Capital group of companies had a combined 19,510 full-time employee
headcount (excluding contract and temporary employees), broken down by operating company or division as
follows:
Operating Company Number of Employees
GT Capital 42
MBT (Parent Bank) 13,150
Federal Land 495
TMP 1,967
AXA Philippines and Charter Ping An 2,430
TMBC 966
TFSPH 405
MPIC Parent 55
Total 19,510
Risk
Risk Management Framework
The Board of Directors (BOD), supported by its Risk Oversight Committee (ROC), Executive Committee (ExCom),
and Audit Committee (Audit Com), oversees the Company’s risk management activities and approves GT Capital’s
risk management policies. The ROC was formed in May 2015 and has the oversight role over the Company’s risk
management activities. The ExCom covers specific non-financial risks, such as strategic, operational and
regulatory risks, while the Audit Com provides oversight over financial reporting risks and internal audit.
The Group’s key risks are summarized below:
Market Risk
GT Capital component companies are engaged in various sectors namely banking, insurance, property
development, automotive assembly and distribution, and infrastructure and utilities. GT Capital component
companies may be adversely affected by market and other macroeconomic factors such as interest rate, foreign
exchange rates, inflation, and other economic variables. Political policies, directions and uncertainties may also
impinge the market demand for Component Company products and services.
To mitigate this risk, GT Capital and its component companies continuously monitor key risk indicators, conduct
sensitivity analyses, and adjust their business strategies accordingly.
Operational Risk
GT Capital component companies are exposed to risks in the conduct of its operations which includes fraud and
information security. Incidents in this category may lead to disruption in operations, reputational damage or
financial losses.
10
To mitigate this risk, GT Capital and its component companies maintain robust operational policies, procedures
and controls. Regular internal audits and third-party checks, as necessary, are conducted to identify and address
gaps in the performance of various functions.
Regulatory Compliance Risk
GT Capital component companies are regulated by the Philippine Stock Exchange, Bangko Sentral ng Pilipinas,
Insurance Commission, Housing and Land Use Regulatory Board, SEC, Bureau of Internal Revenue, and other
regulatory bodies. Rules and implementing guidelines are always evolving and GT Capital should always be up to
date with these new developments.
To mitigate this risk, GT Capital component companies have their own legal and compliance departments to
ensure proper compliance with relevant regulations. In addition, the internal audit department of each
component company reports any material non-compliance to their respective Audit Committees.
Financial Reporting Risk
It is of utmost importance to GT Capital and its component companies to be transparent to its shareholders, in
terms of financial reporting.
To achieve this, each of GT Capital’s component companies has engaged SGV & Co. as their external auditor. In
addition, GT Capital conducts its own review of the submitted financial reports for consolidation. Afterwards, the
consolidated financial statements at the GT Capital level are then subject to another external audit by SGV & Co.
Portfolio Management Risk
As a holding company, GT Capital aims to have a diversified portfolio that maximizes profitability and creates
shareholder value.
To achieve this, GT Capital management meets on a periodic basis to monitor and review the performance of the
portfolio and accordingly recommends the adjustment of business strategies to the ExCom and the BOD.
Environmental and Social Risk
GT Capital component companies are exposed to non-financial risk such as environmental and social impacts in
the conduct of its operations. Environmental risks may be brought by non-compliance with relevant laws and
regulations and contribution to climate change. Social risk primarily arises from the component companies’
interaction with its stakeholders such as employees, suppliers, customers and other participants in the value
chain.
To mitigate this risk, GT Capital component companies are actively engaging key stakeholders to improve its
response to environmental and social risks. In addition, the component companies ensure compliance with all
relevant laws and regulations which provide protection to the environment, and to participants of its supply
chain.
Other Risks
In addition to the key risks discussed above, there are other risks which were identified by GT Capital
management during the 2019 Enterprise Risk Management Annual Reassessment. Each risk has corresponding
key risk indicators that are monitored on a periodic basis and serve as an early warning signal for GT Capital, in
case an emerging risk was to transpire. These indicators are reported to the Board of Directors, through the Risk
Oversight Committee, on a quarterly basis.
Metropolitan Bank and Trust Company
Metropolitan Bank & Trust Company (“Metrobank” or “MBT” or the “Bank”) was incorporated on April 6, 1962 by
a group of Filipino businessmen to provide financial services to the Filipino-Chinese community. Since its
formation, the Bank has diversified its business, and to date provides a broad range of banking and collateral
services to all sectors of the Philippine economy.
11
MBT’s organizational milestones include the following:
• MBT opened its first office in Binondo, Manila on September 5, 1962.
• In 1975, MBT rolled out its first international branch in Taipei, followed by offices in New York, Guam,
Hong Kong, and Tokyo towards the early 1980s.
• The Philippine Central Bank authorized Metrobank to operate its Foreign Currency Deposit Unit (“FCDU”)
on April 15, 1977.
• On February 26, 1981, Metrobank’s common shares were listed on the Makati Stock Exchange Inc. and
the Manila Stock Exchange, (which unified and now The Philippine Stock Exchange, Inc. or PSE) with the
trading symbol “MBT”.
• On August 21, 1981, Metrobank became one of the first to be granted a universal banking license by the
Philippine Central Bank, now Bangko Sentral ng Pilipinas (“BSP”). This license allowed the Bank to engage
in “non-allied undertakings”, which include automobile manufacturing, travel services and real estate, as
well as finance-related businesses such as insurance, savings and retail banking, credit card services and
leasing.
Services/Customers/Clients
Metrobank offers a complete range of commercial and investment banking services. MBT’s customer base covers
a cross section of the top Philippine corporate market. MBT has always been particularly strong in the middle
market corporate sector, a significant proportion of which consists of Filipino-Chinese business.
MBT’s principal business activities involve deposit-taking and lending, trade finance, remittances, treasury,
investment banking and thrift banking. MBT is also a major participant in the Philippine foreign exchange market.
It is accredited as a Government Securities Eligible Dealer (“GSED”) and has played an active role in the
development of the domestic capital markets.
MBT provides investment banking services through First Metro Investment Corporation (“FMIC”) and retail
banking through MBT and its subsidiaries PSBank and Metrobank Card Corporation (“MCC”).
Contribution to Sales/Revenues
The net interest income derived from lending, investment and borrowing activities represents 72.0%, 74.3% and
72.9% of the MBT Group’s revenue net of interest and finance charges in 2019, 2018 and 2017, respectively. Other
operating income (consisting of service charges, fees and commissions; net trading and securities gains; net
foreign exchange gain; gain on sale of investments in an associates; gain on sale of non-current asset held for
sale; leasing income; profit from assets sold; income from trust operations; dividend income; and miscellaneous
income) and share in net income of associates and a joint venture account for 28.0%, 25.7% and 27.1% of the
MBT Group’s revenue net of interest and finance charges in 2019, 2018 and 2017, respectively.
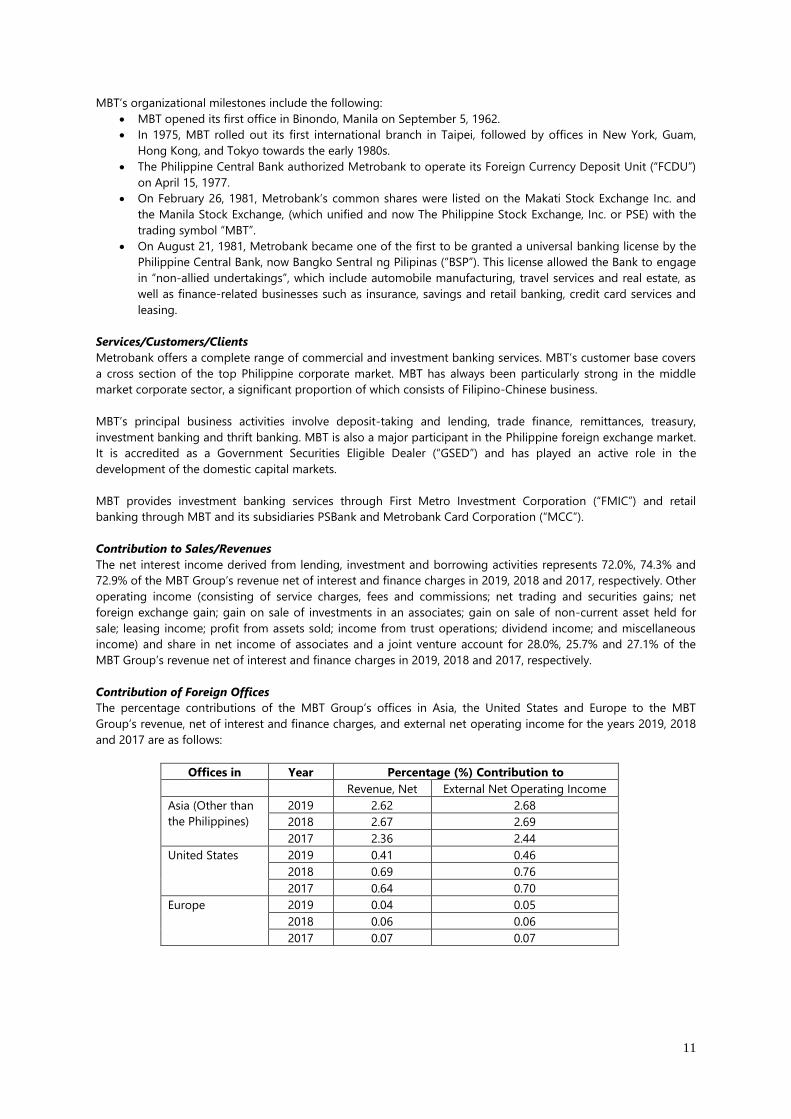
Contribution of Foreign Offices
The percentage contributions of the MBT Group’s offices in Asia, the United States and Europe to the MBT
Group’s revenue, net of interest and finance charges, and external net operating income for the years 2019, 2018
and 2017 are as follows:
Offices in Year Percentage (%) Contribution to
Revenue, Net External Net Operating Income
Asia (Other than
the Philippines)
2019 2.62 2.68
2018 2.67 2.69
2017 2.36 2.44
United States 2019 0.41 0.46
2018 0.69 0.76
2017 0.64 0.70
Europe 2019 0.04 0.05
2018 0.06 0.06
2017 0.07 0.07
12
Distribution Methods of Products and Services
To remain strongly positioned and retain its leadership, Metrobank continued to upgrade and expand its
distribution channels:
1. Branches
Metrobank ended 2019 with 957 branches as compared to 957 in 2018. The Bank believes that it has reached its
optimal state in terms of its branch network and is confident that it has the size and scale to pursue its growth
plans.
2. Remittance Centers
To further expand the remittance business of MBT and its presence in the international market, remittance
alliances were established between MBT and several well-established businesses in the country.
2019 - New International Remittance Tie-Ups
a. DolEx Dollar Express Inc.
b. Harbour and Hills Financial Services Limited
c. Jalandoni Money Changer & Remittances
d. Prime Exchange Limited
e. U Remit International Corporation
f. EMZ Limited
2019 - New Local Remittance Tie-Ups
a. CashPinas Remittance Corporation
b. Unilink Express Payments Phils. Inc.
3. ATMs
All of Metrobank’s 2,300+ ATMs are full-featured and allow a wide array of financial and non-financial
transactions for its clients and those of Bancnet member banks. Apart from being the first bank to secure EMV-
chip (Euro MasterCard VISA) certification in the Philippines, it has deployed over 170 Cash Accept Machines to
allow clients to make real-time cash deposits to their accounts. Metrobank has installed security device in
machines, thus providing more secure and convenient solutions to meet its clients’ banking needs.
4. Metrophone
Metrophone is the Bank’s Interactive Voice Response System (“IVRS”) banking platform, and one of the first
electronic banking channels made available to Metrobank customers.
5. Mobile Banking
Metrobank Mobile Banking is an electronic banking channel that enables customers to perform various financial
transactions via Apple iOS and Android mobile banking devices. Enrollment is done online, making banking
transactions within a customer’s reach anytime, anywhere.
6. Metrobankdirect
Metrobankdirect is MBT’s internet browser-based banking platform that allows its clients to access their accounts
and make financial transactions at their own personal convenience. With more features to enhance a user’s
experience, such as online enrollment, Metrobankdirect Personal now makes internet banking a truly online
experience for its clients.
7. Metrobankdirect Corporate is an integrated platform that provides companies with online and real-time
access to their accounts. It also helps them manage their business needs through efficient, flexible and secured
designs of the best cash management solutions.
8. MBOS (Metrobank Business Online Solution) is a web-based application that will replace MetrobankDirect.
Similar to MetrobankDirect, MBOS provides real-time access to client account statement and transaction history.
Corporate clients enrolled in the facility can likewise initiate transactions at their own convenience. A fully
integrated platform that supports latest technology that the market needed. MBOS embodied new functionalities
for Cash and Trade solution for corporate clients.
13
9. E-Government Facilities
• Taxdirect is a web-based payment facility of Metrobank that allows both retail and corporate clients to
pay their dues on tax returns filed through the Bureau of Internal Revenue’s (“BIR”) Electronic Filing and
Payment System (“EFPS”) website.
• Bancnet’s eGov Payment facility is a highly convenient online service that allows clients to electronically
remit their monthly Social Security System (SSS), Philippine Health Insurance Corporation (Philhealth)
and Pag-ibig Fund (PAG-IBIG) contributions and loan payments.
Innovations and Promotions
In 2019, Metrobank continued to introduce campaigns and promotions to address the market’s needs.
• Metrobank launched its Meaningful Banking campaign with an aim to elevate its promise of “You’re in Good
Hands,” featuring its new Metrobank signature frame that serves as a visual focal point highlighting its
customers’ meaningful stories. In relation to the campaign, the Bank unveiled the site
https://meaningfulbanking.metrobank.com.ph/ and commenced Financial Education initiatives: Earnest, a
website that contains bite-sized lesson cards and easy-to-read articles where clients can learn while on the
go; and Moneybasics, a collection of simple and creative tips for clients to build up a habit of saving. At the
center of MoneyBasics was #The30DayMetrobankChallenge which aims clients to build a foundation of
financial stability by learning to manage debts, track expenses, and build an emergency fund.
• Metrobank partnered with AXA Philippines to offer a free one-year PHP 100,000-coverage AXA Personal
Accident Insurance for accidental death or permanent disability from the moment a client opens a new
deposit account at any Metrobank branch during the promotion period.
• PSBank upgraded its website and the PSBank Mobile App which now offers new digital solutions such as
Mobile Check Deposit and PaSend features. PSBank Mobile Check Deposit facility allows users to deposit
eligible local peso checks by just simply taking a photo of these via the App. PSBank PaSend enables PSBank
depositors to conveniently send instant cash 24/7 to relatives and friends via the App, even to those without
existing deposit accounts.The transferred funds can be withdrawn by the intended recipient from any PSBank
or Metrobank ATM. PSBank also launched a new series of commercials in PSBank’s social media channels and
different TV channels. These garnered 1 million views in PSBank’s FB page in just 3 days. PSBank also
deployed its first Cash Deposit Machine (CDM) in its Pasig-Mutya branch which allows customers to deposit
cash 24/7 to a PSBank account with or without an ATM card.
• Metrobank Card Corporation (MCC) continued to offer premium deals and various treats through its partner
merchants. In September 2019, MCC introduced Metrobank Interactive Assist (MIA), a new Chatbot on
Facebook Messenger that allows users to easily apply for a credit card through that platform. In October
2019, MCC launched three new credit cards - Metrobank Vantage Card, Metrobank Titanium Mastercard, and
Metrobank Rewards Plus Visa. Select Metrobank credit cards will soon be upgraded to these new cards. In
addition, MCC partnered with MEGA magazine for special feature covers and articles of select personalities
for MCC’s new products, which are published on Mega Magazine’s digital and print platforms. MCC
established new partnerships with New City Commercial Center (NCCC) and Ardeur World Marketing
Corporation (Ardeur) to produce the NCCC Mastercard and Ardeur Bonus Card.
• AXA Philippines introduced new products and services including Seamless Automated Mobile (SAM)
underwriter which automates all application forms; Smart Traveller with a wide range of benefits including
24-hour travel assistance, personal accident coverage up to PHP5 million, medical coverage, protection of
personal belongings, and refunds for travel inconveniences; and Car Insurance Online – a comprehensive and
customizable car insurance product with 24/7 emergency roadside assistance, online filing of claims, and
even round-the-clock access to doctor consultation in case of medical emergencies. AXA also launched
several marketing campaigns like the Take Charge Campaign, Know You Can featuring Serena Williams, SM
Shop & Fly Promo, NBA 3X | Plan & Play, and Teacher’s Month Social Media Promo; and forged partnerships
with various organizations like the University Athletic Association of the Philippines (UAAP), Asian Institute of
Management (AIM), Lockheed Group-Medocare Health Systems, Inc., Metrobank Card Corporation (MCC),
and GCash Insure.
• In 2019, First Metro Asset Management Inc. (FAMI) launched the First Metro Save & Learn F.O.C.C.U.S.
(SALFOCCUS) Dynamic Fund which aims to provide cooperative members satisfactory returns on their assets
14
through active fund management. Additionally, FAMI created a number of promotions including the National
Teacher’s Month promo, Invest and Ride promo, Father’s Day promo, Make Your Mama Proud promo; and
tied up with a number of establishments including Grab Philippines, ECPay, and GCash. Moreover, FAMI
joined the worldwide celebration of Women’s Month and hosted Smart Women Invest, a financial and
investment literacy workshop intended to motivate and empower women through the discussion of financial
intelligence to help Filipinas transform from savers to investors. To deepen the relationship with clients and
maximize the use of technology, FAMI introduced Chatbot and FAMI LIVE! as avenues to address clients’
queries, financial dilemmas, or those seeking basic financial advice—straight from FAMI’s experts.
• In collaboration with its FundsMart partners, First Metro Securities Brokerage Corporation (FMSBC)
conducted a number of marketing campaigns such as the 2019 FundsMart Summer Promo, FundsMart First
Timer's Php 500 Cashback Promo - Dollar Funds Style, and FundsMart first timer’s Php 500 cashback promo.
FMSBC also conducted a series of webinars and actual seminars in major cities all over the country, and even
in Singapore and Kuala Lumpur.
Competition
MBT faces competition from both domestic and foreign banks. The number of foreign banks operating in the
country has increased in recent years, in part as a result of the liberalization of the banking industry by the
Government in 1994 and again in 2014.
As of December 31, 2019, the Philippine universal/commercial banking sector consisted of 46 banks, including 25
foreign bank entities. In terms of classification, there are 21 universal banks and 25 commercial banks. Of the 21
universal banks, 12 are private domestic banks, three are government banks and six are branches of foreign
banks. Of the 25 commercial banks, five are private domestic banks, two are subsidiaries of foreign banks and 18
are branches of foreign banks. The ten largest universal/commercial banks in the country accounted for over 80%
of total assets, loans and total deposits of the universal/commercial banking system based on published
statements of condition as of September 30, 2019.
Products and services offered by the larger commercial banks are fairly similar, and banks have used competitive
pricing to attract clients. Customer coverage, accessibility and customer experience also act as other key
differentiating factors. The smaller domestic banks and foreign banks, on the other hand usually operate in
smaller niche markets.
The BSP has been encouraging consolidation among banks in order to strengthen the Philippine banking system.
Mergers and consolidations may result in greater competition as it strengthens the financial capabilities of a
smaller group of “top tier” banks. In December 2016, the BSP issued a memorandum providing regulatory
incentives for mergers, consolidations and acquisition of majority or all outstanding shares of stock of a bank or
quasi bank.
Transactions with and/or Dependence on Related Parties
Transactions with related parties and with certain directors, officers, stockholders and related interests (DOSRI)
are discussed in Note 31 of the audited financial statements of Metrobank as presented in the accompanying
Index to Exhibits.
Patents, Trademarks, Copyrights, Licenses, Franchises, Concessions, and Royalty Agreements Held
MBT’s major products and service lines are sold through Metrobank trade names or trademarks, among others:
1. For ATMs: Metrobank Debit Card and Metrobank Prepaid Card
2. For credit cards: Metrobank Rewards Plus Visa; Metrobank Titanium Mastercard; Metrobank Vantage
Mastercard/Visa; Metrobank Femme Visa/Femme Signature Visa; Metrobank Travel Platinum Visa; Metrobank
Peso Platinum Mastercard; Metrobank World Mastercard; Metrobank Dollar Mastercard; Metrobank ON
Internet Mastercard; Metrobank M Free Mastercard; Metrobank M Lite Mastercard; Metrobank Corporate
Card; Toyota Mastercard; PSBank Credit Mastercard; and The Bistro Group Visa. Features: Cash2Go; Balance
Transfer; Bills2Pay; M Here (Shopping Perks & Privileges); My Swipe My Treat; and Rewards. Prepaid Card:
YAZZ Reloadable Prepaid Visa; Victory Liner Premiere Prepaid Visa; NWorld Cash Card; Pisopay.com Prepaid
Visa; AXA Prepaid Visa; Ardeur Bonus Card; and JAC Liner My Ride Card.
3. For phone banking: Metrophone Banking
4. For internet banking: MetrobankDirect and MBOS
15
5. For mobile banking: Metrobank Mobile Banking
6. For remittance services: Metrobank Superbilis Padala, World Cash Card, MetroRemit, PayStation,
CollectAnywhere, PayAnywhere and Payroll Plus
7. For consumer lending: MetroHome and MetroCar
8. For special current account: MetroChecking Extra; MetroAccount One
9. For special savings account for kids below 18 years old.: Fun Savers Club (FSC) Regular and Spark Savings
Account
10. For Trust products: Metro Money Market Fund; Metro Short Term Fund; Metro Max-3 Bond Fund; Metro
Max-5 Bond Fund; Metro Corporate Bond Fund; Metro Balanced Fund; Metro Unit Paying Fund; Metro Equity
Fund; Metro Philippine Equity Index Tracker Fund; Metro High Dividend Yield Fund; Metro$ Money Market
Fund; Metro$ Short Term Fund; Metro$ Max-3 Bond Fund; Metro$ Max-5 Bond Fund; Metro$ Asian
Investment Grade Bond Fund; Metro World Equity Feeder Fund; Metro$ Eurozone Equity Feeder Fund;
Metro$ US Equity Feeder Fund; Metro$ Japan Equity Feeder Fund; Metro$ US Investment Grade Corporate
Bond Feeder Fund; Metro Aspire Bond Feeder Fund; Metro Aspire Balanced Feeder Fund and Metro Aspire
Equity Feeder Fund.
Corporate licenses include the following:
1. For Metrobank: expanded commercial banking license, FCDU license, license for trust operations, type 2
limited dealer authority, government securities eligible dealer (GSED) with broker-dealer of securities
functions
2. For PSBank: thrift banking license, FCDU license, license for trust operations, GSED (non-market maker) as
dealer-broker, type 3 limited user authority and quasi-banking license
3. For FMIC: investment house, investment company adviser (ICA) and quasi banking
4. For ORIX Metro: financing company and quasi-banking license
5. For MBCL: business license to expire on January 13, 2040
All MBT’s trademark registrations are valid for 10 years. MBT closely monitors the renewal dates of registrations
to protect and secure its rights to these trademarks. Corporate licenses issued by different regulatory bodies have
no specific expiration dates except for the GSED licenses of Metrobank and PSBank which is renewable annually
every November.
Government Approval of Principal Products or Services
The MBT Group regularly obtains approvals and permits from regulatory bodies and agencies, as applicable, prior
to the offering of its products and services to the public.
Effect of Existing or Probable Government Regulations
Regulatory Qualifying Capital
Under existing BSP regulations, the determination of the compliance with regulatory requirements and ratios is
based on the amount of the “unimpaired capital” (regulatory net worth) as reported to the BSP, which is
determined on the basis of regulatory accounting policies that differ from PFRS in some respects.
The MBT Group complied with BSP Circular No. 781, Basel III Implementing Guidelines on Minimum Capital
Requirements, which provides the implementing guidelines on the revised risk-based capital adequacy framework
particularly on the minimum capital and disclosure requirements for universal banks and commercial banks, as
well as their subsidiary banks and quasi-banks, in accordance with the Basel III standards. The Circular sets out a
minimum Common Equity Tier 1 (CET1) ratio of 6.00% and Tier 1 capital ratio of 7.50%; capital conservation
buffer of 2.50% comprised of CET1 capital and Total Capital Adequacy Ratio (CAR) of 10.00%. These ratios shall
be maintained at all times. Further, BSP Circular No. 856 covers the implementing guidelines on the framework
for dealing with domestic systemically important banks (DSIBs) in accordance with the Basel III standards. Banks
identified as DSIBs shall be required to have higher loss absorbency, on top of the minimum CET1 capital and
capital conservation buffer. Compliance with this requirement was phased-in starting January 1, 2017, with full
compliance on January 1, 2019.
16
Qualifying capital and risk-weighted assets (RWA) are computed based on BSP regulations. The MBT Group and
its individually regulated operations have complied with all externally imposed capital requirements throughout
the year.
The Internal Capital Adequacy Assessment Process (ICAAP) supplements the BSP’s risk-based capital adequacy
framework. In compliance with this, the MBT Group has adopted and developed its ICAAP framework to ensure
that appropriate level and quality of capital are maintained. Under this framework, the assessment of risks
extends beyond the Pillar 1 set of credit, market and operational risks and onto other risks deemed material by
the MBT Group. The level and structure of capital are assessed and determined in light of the Group’s business
environment, plans, performance, risks and budget as well as regulatory edicts.
Basel III Leverage Ratio (BLR)
BSP Circular Nos. 881 and 990 cover the implementing guidelines on the BLR framework designed to act as a
supplementary measure to the risk-based capital requirements and shall not be less than 5.00%. The monitoring
period has been set every quarter starting December 31, 2014 and extended until June 30, 2018. Effective July 1,
2018, the monitoring of the leverage ratio was implemented as a Pillar I minimum requirement.
Liquidity Coverage Ratio (LCR)
BSP Circular No. 905 provides the implementing guidelines on LCR and disclosure standards that are consistent
with the Basel III framework. The LCR is the ratio of high-quality liquid assets to total net cash outflows which
should not be lower than 100.00%. Compliance with the LCR minimum requirement commenced on January 1,
2018 with the prescribed minimum ratio of 90.00% for 2018 and 100.00% effective January 1, 2019.
Net Stable Funding Ratio (NSFR)
BSP Circular No.1007 covers the implementing guidelines on the adoption of the Basel III Framework on Liquidity
Standards – NSFR. The NSFR is aimed to promote long-term resilience against liquidity risk by requiring banks to
maintain a stable funding profile in relation to the composition of its assets and off-balance sheet activities. It
complements the LCR, which promotes short term resilience of a bank's liquidity profile. Banks shall maintain an
NSFR of at least 100 percent (100%) at all times. The implementation of the minimum NSFR shall be phased in to
help ensure that covered banks can meet the standard through reasonable measures without disrupting credit
extension and financial market activities. An observation period was set from July 1 to December 31, 2018.
Effective, January 1, 2019, banks shall comply with the prescribed minimum ratio of 100%.
The details of CAR, BLR, LCR and NSFR of the Group and the Bank, as reported to the BSP, are discussed in Note 4
of Metrobank’s Audited Financial Statements as presented in Exhibit 6.
Applicable Tax Regulations
Under Philippine tax laws, the RBU of the Parent Company and its domestic subsidiaries are subject to percentage
and other taxes (presented as ‘Taxes and licenses’ in the statement of income) as well as income taxes.
Percentage and other taxes paid consist principally of gross receipts tax (GRT) and documentary stamp tax (DST).
Income taxes include 30.00% regular corporate income tax (RCIT) and 20.00% final taxes paid, which is a final
withholding tax on gross interest income from government securities and other deposit substitutes. Interest
allowed as a deductible expense is reduced by an amount equivalent to 33.00% of interest income subjected to
final tax.
Current tax regulations also provide for the ceiling on the amount of EAR expense (Note 25) that can be claimed
as a deduction against taxable income. Under the regulation, EAR expense allowed as a deductible expense for a
service company like the Parent Company and some of its subsidiaries is limited to the actual EAR paid or
incurred but not to exceed 1.00% of net revenue. The regulations also provide for MCIT of 2.00% on modified
gross income and allow a NOLCO. The MCIT and NOLCO may be applied against the Group’s income tax liability
and taxable income, respectively, over a three-year period from the year of inception.
FCDU offshore income (income from non-residents) is tax-exempt while gross onshore income (income from
residents) is subject to 10.00% income tax. In addition, interest income on deposit placements with other FCDUs
17
and offshore banking units (OBUs) is taxed at 15.00%. Income derived by the FCDU from foreign currency
denominated transactions with non-residents, OBUs, local commercial banks including branches of foreign banks
is tax-exempt while interest income on foreign currency loans from residents other than OBUs or other
depository banks under the expanded system is subject to 10.00% income tax.
The applicable taxes and tax rates for the foreign branches of the Bank are discussed in Note 28 of the Audited
Financial Statements as presented in Exhibit 6.
Research and Development Costs
For the last three fiscal years, MBT has not incurred any expenses for research and development.
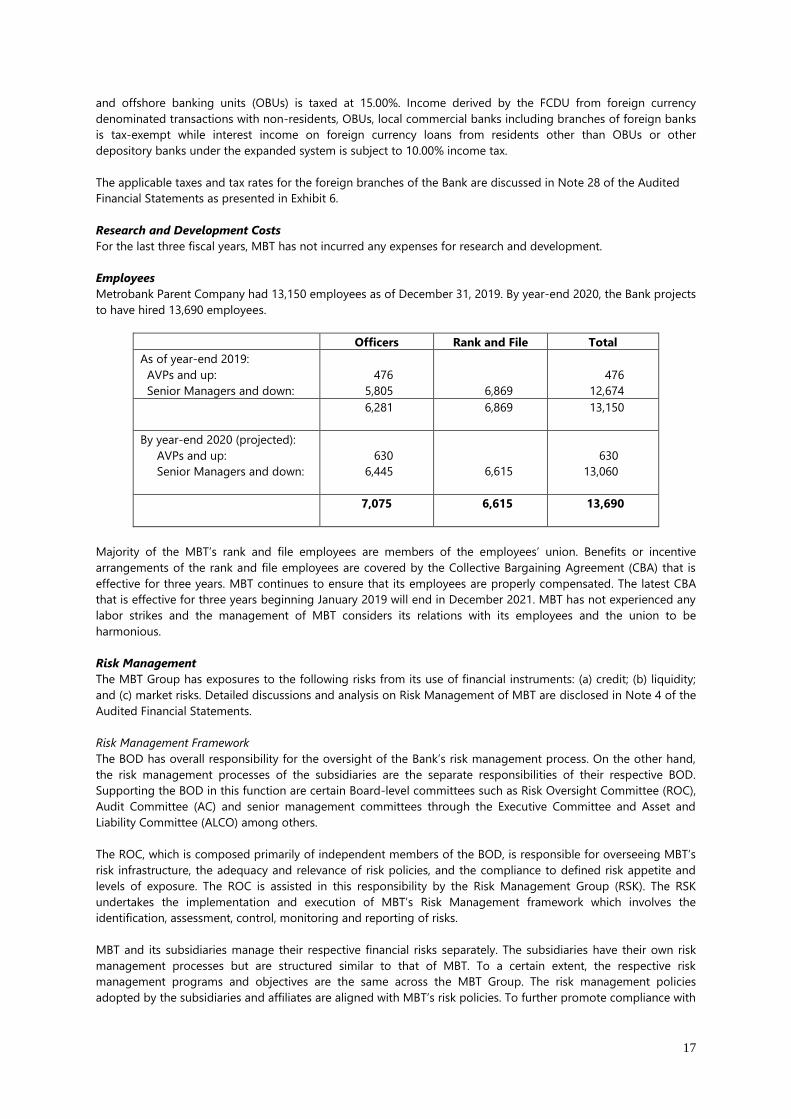
Employees
Metrobank Parent Company had 13,150 employees as of December 31, 2019. By year-end 2020, the Bank projects
to have hired 13,690 employees.
Officers Rank and File Total
As of year-end 2019:
AVPs and up:
Senior Managers and down:
476
5,805
6,869
476
12,674
6,281 6,869 13,150
By year-end 2020 (projected):
AVPs and up:
Senior Managers and down:
630
6,445
6,615
630
13,060
7,075 6,615 13,690
Majority of the MBT’s rank and file employees are members of the employees’ union. Benefits or incentive
arrangements of the rank and file employees are covered by the Collective Bargaining Agreement (CBA) that is
effective for three years. MBT continues to ensure that its employees are properly compensated. The latest CBA
that is effective for three years beginning January 2019 will end in December 2021. MBT has not experienced any
labor strikes and the management of MBT considers its relations with its employees and the union to be
harmonious.
Risk Management
The MBT Group has exposures to the following risks from its use of financial instruments: (a) credit; (b) liquidity;
and (c) market risks. Detailed discussions and analysis on Risk Management of MBT are disclosed in Note 4 of the
Audited Financial Statements.
Risk Management Framework
The BOD has overall responsibility for the oversight of the Bank’s risk management process. On the other hand,
the risk management processes of the subsidiaries are the separate responsibilities of their respective BOD.
Supporting the BOD in this function are certain Board-level committees such as Risk Oversight Committee (ROC),
Audit Committee (AC) and senior management committees through the Executive Committee and Asset and
Liability Committee (ALCO) among others.
The ROC, which is composed primarily of independent members of the BOD, is responsible for overseeing MBT’s
risk infrastructure, the adequacy and relevance of risk policies, and the compliance to defined risk appetite and
levels of exposure. The ROC is assisted in this responsibility by the Risk Management Group (RSK). The RSK
undertakes the implementation and execution of MBT’s Risk Management framework which involves the
identification, assessment, control, monitoring and reporting of risks.
MBT and its subsidiaries manage their respective financial risks separately. The subsidiaries have their own risk
management processes but are structured similar to that of MBT. To a certain extent, the respective risk
management programs and objectives are the same across the MBT Group. The risk management policies
adopted by the subsidiaries and affiliates are aligned with MBT’s risk policies. To further promote compliance with
18
PFRS and Basel III, MBT created a Risk Management Coordinating Council (RMCC) composed of risk officers of
MBT and its financial institution subsidiaries.
Credit Risk
Credit risk is the risk of financial loss to the MBT Group if a counterparty to a financial instrument fails to meet its
contractual obligations. The MBT Group manages and controls credit risk by setting limits on the amount of risk it
is willing to accept for individual counterparties, related groups of borrowers, market segments, and industry
concentrations, and by monitoring exposures in relation to such limits, among others. The same is true for
treasury-related activities. Each business unit is responsible for the quality of its credit portfolio and for
monitoring and controlling all credit risks in its portfolio. Regular reviews and audits of business units and credit
processes are undertaken by the RSK and Internal Audit Group, respectively.
Liquidity Risk
Liquidity risk is the current and prospective risk to earnings or capital arising from the inability to meet
obligations when they come due. This may be caused by the inability to liquidate assets or to obtain funding to
meet liquidity needs. The MBT Group manages its liquidity risk by holding adequate stock of high quality liquid
assets, analyzing net funding requirements over time, diversifying funding sources and contingency planning. To
measure the prospective liquidity needs, the MBT Group uses Maximum Cumulative Outflow (MCO), a liquidity
gap tool to project short-term as well as long-term cash flow expectations on a business-as-usual condition. The
MCO is generated by distributing the cash flows of the MBT Group’s assets, liabilities and off-balance sheet items
to time bands based on cash flow expectations such as contractual maturity, nature of the account, behavioral
patterns, projections on business strategies, and/or optionality of certain products. The incorporation of
behavioral cash flow assumptions and business projections or targets results in a dynamic gap report which
realistically captures the behavior of the products and creates a forward-looking cash flow projection.
Cash flow from assets are considered as cash inflows, while cash flows from liabilities are considered cash
outflows. The net cash flows are determined for each given time period. If the inflows exceed the outflows, the
MBT Group is said to have a positive liquidity gap or excess funds for the given time bucket. Conversely, if the
outflows exceed the inflows, the MBT Group is said to have a negative liquidity gap or funding need for the given
time bucket.
The MCO is monitored regularly to ensure that it remains within the set limits. The Bank generates and monitors
daily its MCO, while the subsidiaries generate the report at least monthly. The liquidity profile of the MBT Group
is reported monthly to the Bank’s ALCO and ROC. To supplement the business-as-usual scenario parameters
reflected in the MCO report, the MBT Group also conducts liquidity stress testing to determine the impact of
extreme factors, scenarios and/or events to the MBT Group’s liquidity profile. Liquidity stress testing is performed
quarterly on a per firm basis, and at least annually on the Bank’s group-wide level.
Market Risk
Market risk is the possibility of loss to future earnings, fair values or future cash flows that may result from
changes in the price of a financial instrument. The value of a financial instrument may change as a result of
changes in interest rates, foreign exchange rates, and other market factors. Market risk originates from holdings
in foreign currencies, debt securities and derivatives transactions. Depending on the business model for the
product, i.e., whether they belong to the trading book or banking book, the MBT Group applies different tools
and processes to manage market risk exposures. Risk limits, approved by the BOD, are enforced to monitor and
control this risk. RSK, as an independent body under the ROC, performs daily market risk analyses to ensure
compliance to policies and limits, while Treasury Group manages the asset/liability risks arising from both
banking book and trading operations in financial markets. The ALCO, chaired by the President, manages market
risks within the parameters approved by the BOD.
As part of group supervision, MBT regularly coordinates with subsidiaries to monitor their compliance to their
respective risk tolerances and to ensure alignment of risk management practices. Each subsidiary has its own risk
management unit responsible for monitoring its market risk exposures. MBT, however, requires regular
submission of market risk profiles which are presented to ALCO and ROC in both individual and consolidated
forms to provide senior management and ROC a holistic perspective, and ensure alignment of strategies and risk
appetite across the Group.
19
Market Risk - Trading Book
In measuring the potential loss in its trading portfolio, MBT uses VaR. VaR is an estimate of the potential decline
in the value of a portfolio, under normal market conditions, for a given “confidence level” over a specified holding
period. MBT measures and monitors the Trading Book VaR daily, and this value is compared against the set VaR
limit. Meanwhile, the MBT Group VaR is monitored and reported monthly. The limitations of the VaR
methodology are recognized by supplementing VaR limits with other position and sensitivity limit structures and
by doing stress testing analysis. These processes address potential product concentration risks, monitor portfolio
vulnerability and give the management an early advice if an actual loss goes beyond what is deemed to be
tolerable to the bank, even before the VaR limit is hit.
Stress testing is performed by MBT on a quarterly basis and the results are reported to the ALCO and,
subsequently, to the ROC and BOD. On the Bank’s group-wide perspective, stress testing is done, at least,
annually. The results are reported by MBT’s Risk Management Group to the BOD through ROC.
Market Risk - Banking Book
The MBT Group has in place their own risk management system and processes to quantify and manage market
risks in the banking book. To the extent applicable, these are generally aligned with MBT’s framework/tools.
Interest rate risk
The MBT Group assesses interest rate risk in the banking book using measurement tools such as Interest Rate
Repricing Gap, Earnings-at-Risk (EaR), Delta Economic Value of Equity (ΔEVE), and Sensitivity Analysis. Interest
Rate Repricing Gap is a tool that distributes rate-sensitive assets and liabilities into predefined tenor buckets
according to time remaining to their maturity (if fixed rate) or repricing (if floating rate). Items lacking definitive
repricing schedule (e.g., current and savings account) and items with actual maturities that could vary from
contractual maturities (e.g., securities with embedded options) are assigned to repricing tenor buckets based on
analysis of historical patterns, past experience and/or expert judgment.
MBT Group calculates EaR using Historical Simulations (HS) approach, with one-year horizon and using five years
data. EaR is then derived as the 99th percentile biggest drop in net interest income.
Foreign Currency Risk
Foreign exchange risk is the probability of loss to earnings or capital arising from changes in foreign exchange
rates. Foreign currency liabilities generally consist of foreign currency deposits in MBT Group’s FCDU account.
Foreign currency deposits are generally used to fund MBT Group’s foreign currency-denominated loan and
investment portfolio in the FCDU. Banks are required by the BSP to match the foreign currency liabilities with the
foreign currency assets held in FCDUs. Outside the FCDU, MBT Group has additional foreign currency assets and
liabilities in its foreign branch network. The MBT Group’s policy is to maintain foreign currency exposure within
acceptable limits and within existing regulatory guidelines.
Federal Land, Inc.
Federal Land was incorporated on May 28, 1997, primarily to acquire, develop and sell properties of every kind
and description including but not limited to real estate and bonds, debentures, promissory notes, shares of
capital stock, or other securities or obligations. On the other hand, the main principal activities of the Federal
Land Group (i.e. Federal Land and its subsidiaries) are to acquire, develop, lease and sell properties of every kind
and description and to act as a marketing agent for and in behalf of any real estate development company or
companies. The Federal Land Group is also engaged in the business of trading of goods such as petroleum, non-
fuel products on wholesale or retail basis, maintains a petroleum service station and engaged in the food and
restaurant service.
Federal Land’s registered office is at 20th Floor, GT Tower International, Ayala Ave. cor. H.V. Dela Costa Street,
Makati City. Federal Land is a wholly-owned subsidiary of GT Capital.
Products and Services/Customers/Clients
Federal Land’s primary products and services are residential sales and commercial and office leasing. Below is a
listing of types of Federal Land’s projects.
20
Property Development Projects
Federal Land has a diverse portfolio of property development projects that focus on master-planned communities
and residential developments. Many of Federal Land’s residential development projects are components of
Federal Land’s master-planned communities. However, Federal Land also develops stand-alone residential
projects. Residential properties are developed and sold while commercial and retail properties are generally
developed and leased to generate recurring income. Prior to its formation, the Ty family property companies were
historically focused on developing stand-alone residential condominiums and commercial properties.
Master-planned Community Developments
Federal Land and its affiliates own substantial tracts of land in prime areas in Metro Manila and its periphery.
Federal Land develops these properties into fully master-planned communities consisting of residential
condominium towers, supporting amenities and complementing commercial, retail and institutional
establishments. Federal Land believes that by creating a core mix of residential and commercial properties, it can
create self-sustaining communities that are attractive places in which to live, work, and enjoy recreational
activities.
Residential Developments
Federal Land has historically focused on the development of upper-middle and high-end market residential
condominiums. Taking into consideration factors such as location, competitive landscape and target market in the
areas where a project will be located, Federal Land’s current and future planned residential projects focus on
three types of residential developments: township condominium, stand-alone condominium, and house and lot
subdivision.
Commercial Developments
Federal Land has a portfolio of commercial buildings and properties that include office properties and retail
centers that Federal Land leases to various tenants. In most cases, Federal Land is also the property manager for
these projects. The leases and management fees are sources of recurring income that enhance the company’s
revenues and strengthens its cash flows. Federal Land will continue to contribute to its sources of recurring
income by identifying and developing properties that are apt for such uses in areas where demand for leasing
spaces are identified.
Retail Buildings
Federal Land is currently developing retail centers in Pasay City, Marikina City, and Taguig City. These centers are
in addition to the existing “Blue Bay Walk,” an outdoor shopping center located at Metro Park in Pasay City that
was opened in 2014.
Aside from the retail centers, Federal Land owns and operates various retail spaces located at the podium /
ground floor spaces of the various residential towers. An enclosed mall called Met Live that is also located in
Metro Park, was opened in 2019.
Contribution to Sales/Revenues
Please refer to Part II Item 7 – Management Discussion and Analysis (MD&A) on Property Development.
Competition
The Philippine real estate development industry is highly competitive. With respect to township developments in
Metro Manila and high-rise condominiums, Federal Land’s major competitors are Ayala Land, Inc., Filinvest Land,
Inc., Megaworld Corporation, Century Properties, SM Development Corp., DMCI, Robinsons Land Corporation and
Rockwell Land Corporation. Federal Land believes that it is a strong competitor in the mid to high-end market
due to the quality of its products and the materials used in construction and finishing. Federal Land also believes
that its association with the GT Capital group allows it to reach a wider network of potential customers, including
the lucrative overseas-based investor market.
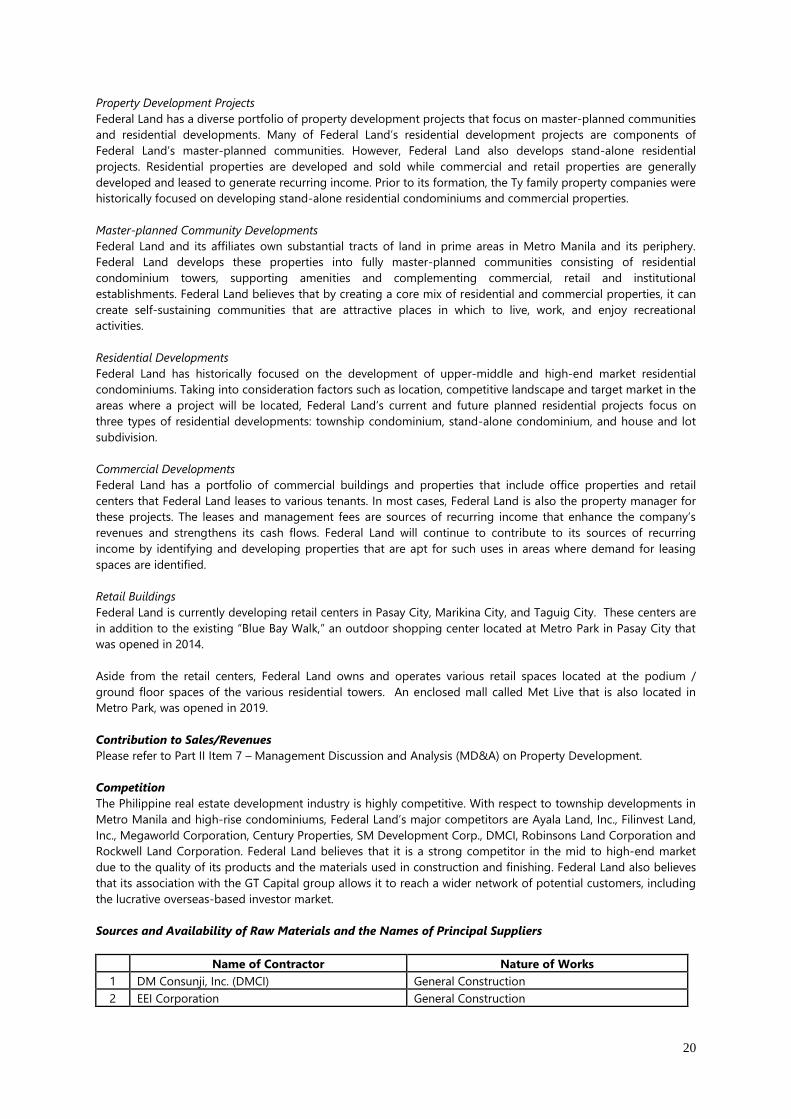
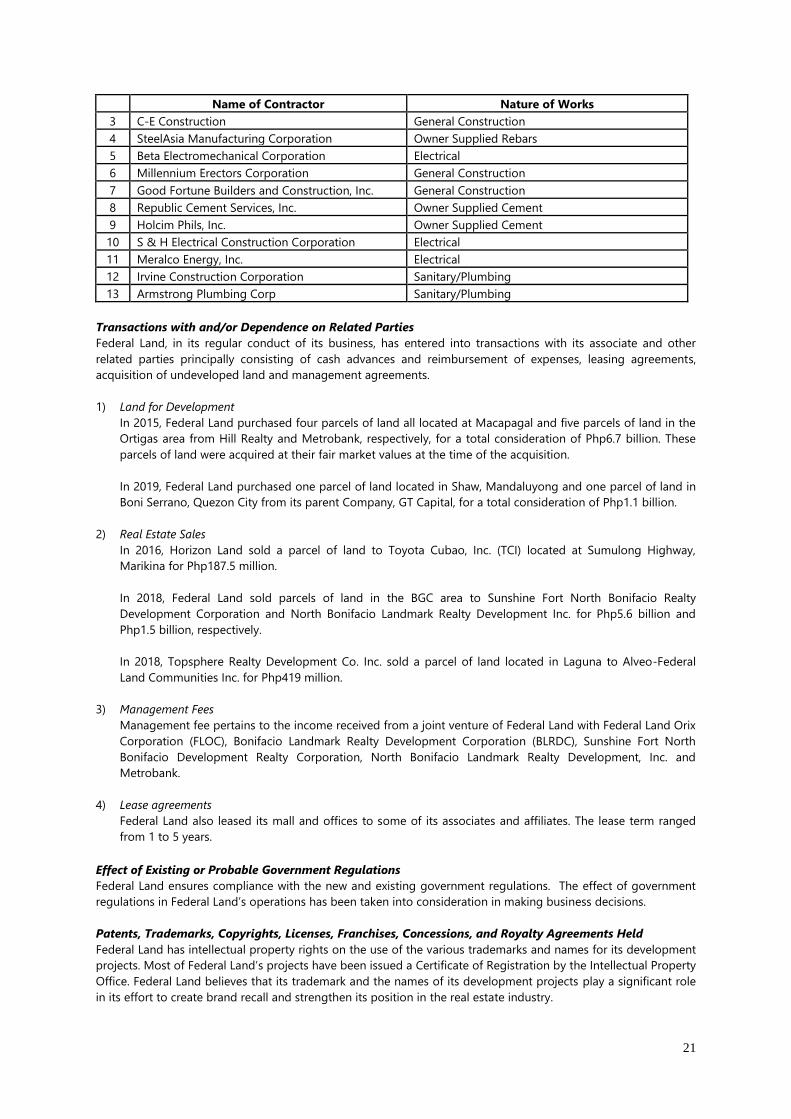
Sources and Availability of Raw Materials and the Names of Principal Suppliers
Name of Contractor Nature of Works
1 DM Consunji, Inc. (DMCI) General Construction
2 EEI Corporation General Construction
21
Name of Contractor Nature of Works
3 C-E Construction General Construction
4 SteelAsia Manufacturing Corporation Owner Supplied Rebars
5 Beta Electromechanical Corporation Electrical
6 Millennium Erectors Corporation General Construction
7 Good Fortune Builders and Construction, Inc. General Construction
8 Republic Cement Services, Inc. Owner Supplied Cement
9 Holcim Phils, Inc. Owner Supplied Cement
10 S & H Electrical Construction Corporation Electrical
11 Meralco Energy, Inc. Electrical
12 Irvine Construction Corporation Sanitary/Plumbing
13 Armstrong Plumbing Corp Sanitary/Plumbing
Transactions with and/or Dependence on Related Parties
Federal Land, in its regular conduct of its business, has entered into transactions with its associate and other
related parties principally consisting of cash advances and reimbursement of expenses, leasing agreements,
acquisition of undeveloped land and management agreements.
1) Land for Development
In 2015, Federal Land purchased four parcels of land all located at Macapagal and five parcels of land in the
Ortigas area from Hill Realty and Metrobank, respectively, for a total consideration of Php6.7 billion. These
parcels of land were acquired at their fair market values at the time of the acquisition.
In 2019, Federal Land purchased one parcel of land located in Shaw, Mandaluyong and one parcel of land in
Boni Serrano, Quezon City from its parent Company, GT Capital, for a total consideration of Php1.1 billion.
2) Real Estate Sales
In 2016, Horizon Land sold a parcel of land to Toyota Cubao, Inc. (TCI) located at Sumulong Highway,
Marikina for Php187.5 million.
In 2018, Federal Land sold parcels of land in the BGC area to Sunshine Fort North Bonifacio Realty
Development Corporation and North Bonifacio Landmark Realty Development Inc. for Php5.6 billion and
Php1.5 billion, respectively.
In 2018, Topsphere Realty Development Co. Inc. sold a parcel of land located in Laguna to Alveo-Federal
Land Communities Inc. for Php419 million.
3) Management Fees
Management fee pertains to the income received from a joint venture of Federal Land with Federal Land Orix
Corporation (FLOC), Bonifacio Landmark Realty Development Corporation (BLRDC), Sunshine Fort North
Bonifacio Development Realty Corporation, North Bonifacio Landmark Realty Development, Inc. and
Metrobank.
4) Lease agreements
Federal Land also leased its mall and offices to some of its associates and affiliates. The lease term ranged
from 1 to 5 years.
Effect of Existing or Probable Government Regulations
Federal Land ensures compliance with the new and existing government regulations. The effect of government
regulations in Federal Land’s operations has been taken into consideration in making business decisions.
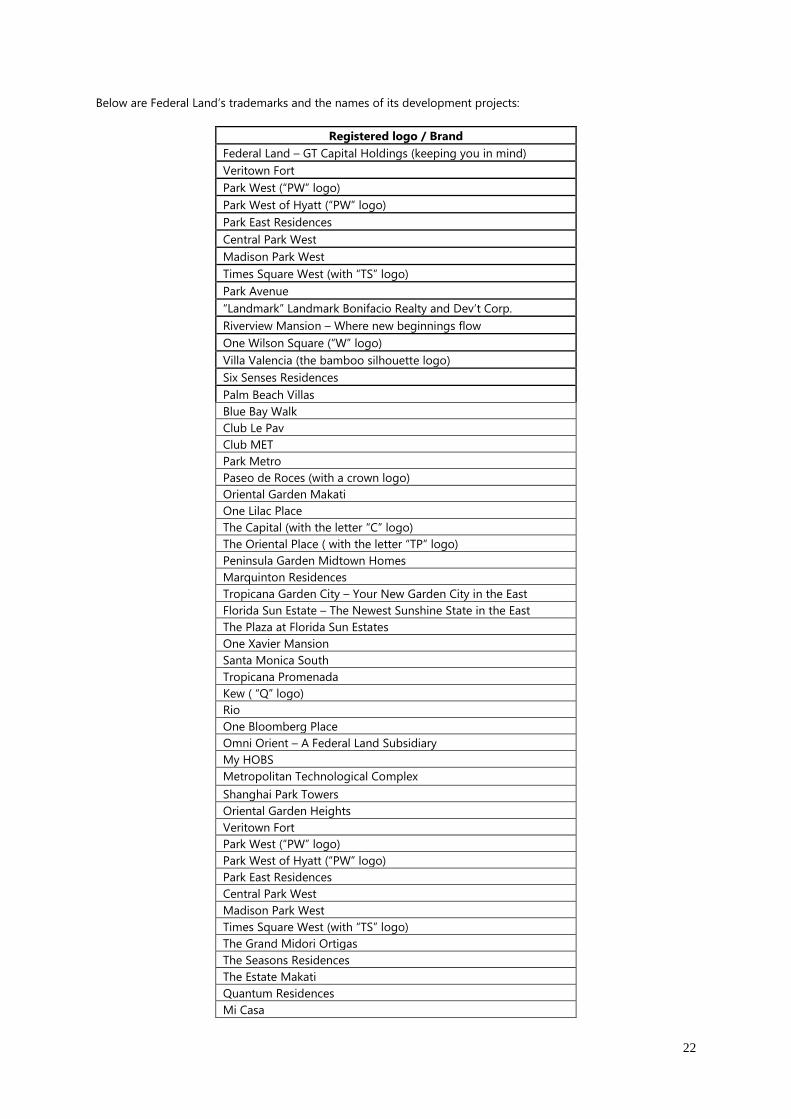
Patents, Trademarks, Copyrights, Licenses, Franchises, Concessions, and Royalty Agreements Held
Federal Land has intellectual property rights on the use of the various trademarks and names for its development
projects. Most of Federal Land’s projects have been issued a Certificate of Registration by the Intellectual Property
Office. Federal Land believes that its trademark and the names of its development projects play a significant role
in its effort to create brand recall and strengthen its position in the real estate industry.
22
Below are Federal Land’s trademarks and the names of its development projects:
Registered logo / Brand
Federal Land – GT Capital Holdings (keeping you in mind)
Veritown Fort
Park West (“PW” logo)
Park West of Hyatt (“PW” logo)
Park East Residences
Central Park West
Madison Park West
Times Square West (with “TS” logo)
Park Avenue
“Landmark” Landmark Bonifacio Realty and Dev’t Corp.
Riverview Mansion – Where new beginnings flow
One Wilson Square (“W” logo)
Villa Valencia (the bamboo silhouette logo)
Six Senses Residences
Palm Beach Villas
Blue Bay Walk
Club Le Pav
Club MET
Park Metro
Paseo de Roces (with a crown logo)
Oriental Garden Makati
One Lilac Place
The Capital (with the letter “C” logo)
The Oriental Place ( with the letter “TP” logo)
Peninsula Garden Midtown Homes
Marquinton Residences
Tropicana Garden City – Your New Garden City in the East
Florida Sun Estate – The Newest Sunshine State in the East
The Plaza at Florida Sun Estates
One Xavier Mansion
Santa Monica South
Tropicana Promenada
Kew ( “Q” logo)
Rio
One Bloomberg Place
Omni Orient – A Federal Land Subsidiary
My HOBS
Metropolitan Technological Complex
Shanghai Park Towers
Oriental Garden Heights
Veritown Fort
Park West (“PW” logo)
Park West of Hyatt (“PW” logo)
Park East Residences
Central Park West
Madison Park West
Times Square West (with “TS” logo)
The Grand Midori Ortigas
The Seasons Residences
The Estate Makati
Quantum Residences
Mi Casa
23
Federal Land has pending applications for intellectual property rights relating to its various development and
projects. Several applications have already been processed but await the release of the certificate of registration
from the Philippine Intellectual Property Office.
Government Approval of Principal Products or Services
As part of the normal course of its business, Federal Land has secured various government approvals such as
Board of Investments (BOI) registrations, development permits and licenses to sell, among others.
Research and Development Costs
Federal Land’s research and development activities focus on construction materials, engineering, sales and
marketing. Federal Land does not consider the expense for such research and development activities to be
material.
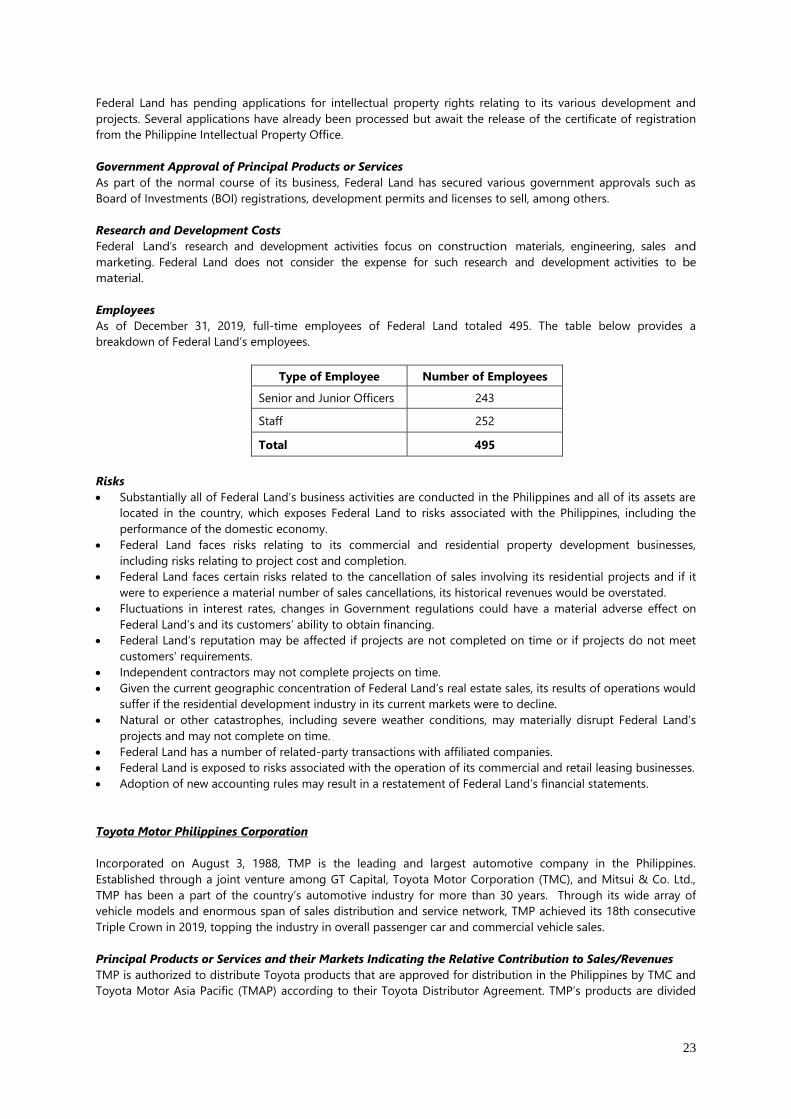
Employees
As of December 31, 2019, full-time employees of Federal Land totaled 495. The table below provides a
breakdown of Federal Land’s employees.
Type of Employee Number of Employees
Senior and Junior Officers 243
Staff 252
Total 495
Risks
• Substantially all of Federal Land’s business activities are conducted in the Philippines and all of its assets are
located in the country, which exposes Federal Land to risks associated with the Philippines, including the
performance of the domestic economy.
• Federal Land faces risks relating to its commercial and residential property development businesses,
including risks relating to project cost and completion.
• Federal Land faces certain risks related to the cancellation of sales involving its residential projects and if it
were to experience a material number of sales cancellations, its historical revenues would be overstated.
• Fluctuations in interest rates, changes in Government regulations could have a material adverse effect on
Federal Land’s and its customers’ ability to obtain financing.
• Federal Land’s reputation may be affected if projects are not completed on time or if projects do not meet
customers’ requirements.
• Independent contractors may not complete projects on time.
• Given the current geographic concentration of Federal Land’s real estate sales, its results of operations would
suffer if the residential development industry in its current markets were to decline.
• Natural or other catastrophes, including severe weather conditions, may materially disrupt Federal Land’s
projects and may not complete on time.
• Federal Land has a number of related-party transactions with affiliated companies.
• Federal Land is exposed to risks associated with the operation of its commercial and retail leasing businesses.
• Adoption of new accounting rules may result in a restatement of Federal Land’s financial statements.
Toyota Motor Philippines Corporation
Incorporated on August 3, 1988, TMP is the leading and largest automotive company in the Philippines.
Established through a joint venture among GT Capital, Toyota Motor Corporation (TMC), and Mitsui & Co. Ltd.,
TMP has been a part of the country’s automotive industry for more than 30 years. Through its wide array of
vehicle models and enormous span of sales distribution and service network, TMP achieved its 18th consecutive
Triple Crown in 2019, topping the industry in overall passenger car and commercial vehicle sales.
Principal Products or Services and their Markets Indicating the Relative Contribution to Sales/Revenues
TMP is authorized to distribute Toyota products that are approved for distribution in the Philippines by TMC and
Toyota Motor Asia Pacific (TMAP) according to their Toyota Distributor Agreement. TMP’s products are divided
24
into three categories: (1) vehicle sales, (2) local sales of service parts and (3) export sales of original equipment
manufacturer (OEM) parts and service parts.
Vehicle Sales
Vehicle sales are divided into locally-manufactured vehicles using both imported and locally-manufactured parts
and components, as well as Completely Built Units (CBU) vehicles, which are wholly imported. TMP sells two
models of locally-assembled vehicles, or Completely Knocked Down (CKD) units, the passenger car Vios and the
commercial vehicle Innova. All other vehicle models sold by TMP are imported CBU vehicles. In addition to the
sub-compact-sized Vios, the other Toyota passenger car models sold in the Philippines are the low-cost Wigo,
hatchback Yaris and Prius C, compact-sized Prius, and Corolla, the mid-sized Camry and the sport/specialty 86
and Supra.. The Lexus passenger car line-up includes the CT 200H, IS 350, ES 350, GS 350, GS 450H, GS F, RC 350,
RC F, LC 500, LS 500, and LS 500H.
Aside from the Innova, TMP’s commercial vehicles include pick-ups, SUVs, multi-purpose vehicles, vans and
minibuses such as Hilux, RAV4, Rush, Fortuner, LC200, Prado, FJ Cruiser, Avanza, Hiace, Alphard, and Coaster.
Lexus sells the NX 300T, NX 300H, RX 350, RX 450H, GX 460, LX 570, and UX 200.
Local Sales of Service Parts
TMP offers a wide range of after-sales parts consisting of service parts, oils and chemicals and accessories. A
substantial portion of the service parts that TMP sells locally are sourced from TMC and Toyota Daihatsu
Engineering & Manufacturing (TDEM), with the remaining portion manufactured by both TMP and local suppliers.
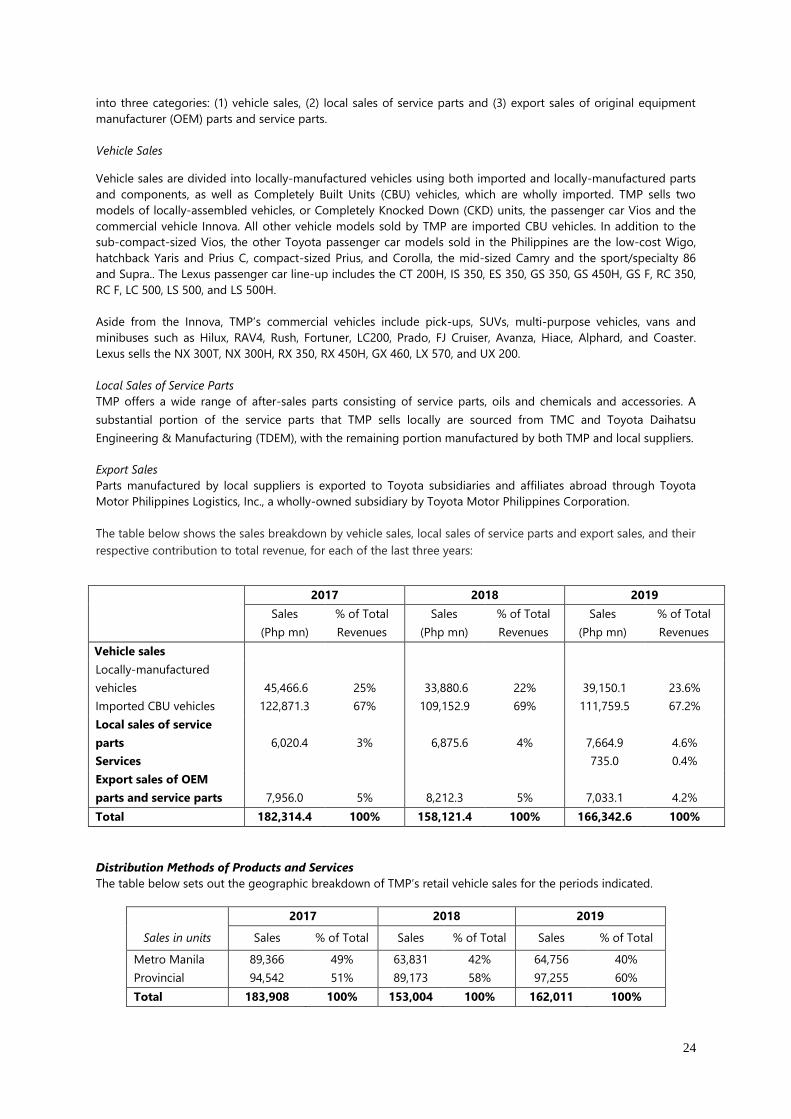
Export Sales
Parts manufactured by local suppliers is exported to Toyota subsidiaries and affiliates abroad through Toyota
Motor Philippines Logistics, Inc., a wholly-owned subsidiary by Toyota Motor Philippines Corporation.
The table below shows the sales breakdown by vehicle sales, local sales of service parts and export sales, and their
respective contribution to total revenue, for each of the last three years:
2017 2018 2019
Sales
(Php mn)
% of Total
Revenues
Sales
(Php mn)
% of Total
Revenues
Sales
(Php mn)
% of Total
Revenues
Vehicle sales
Locally-manufactured
vehicles 45,466.6 25% 33,880.6 22% 39,150.1 23.6%
Imported CBU vehicles 122,871.3 67% 109,152.9 69% 111,759.5 67.2%
Local sales of service
parts 6,020.4 3% 6,875.6 4% 7,664.9 4.6%
Services 735.0 0.4%
Export sales of OEM
parts and service parts 7,956.0 5% 8,212.3 5% 7,033.1 4.2%
Total 182,314.4 100% 158,121.4 100% 166,342.6 100%
Distribution Methods of Products and Services
The table below sets out the geographic breakdown of TMP’s retail vehicle sales for the periods indicated.
2017 2018 2019
Sales in units Sales % of Total Sales % of Total Sales % of Total
Metro Manila 89,366 49% 63,831 42% 64,756 40%
Provincial 94,542 51% 89,173 58% 97,255 60%
Total 183,908 100% 153,004 100% 162,011 100%
25
As of December 31, 2019, the Toyota and Lexus dealer network in the Philippines consisted of 71 dealers, of
which 19 dealers are in Metro Manila. TMP owns direct interests in four dealerships: 100% of Toyota Makati, Inc.,
55% of Toyota San Fernando Pampanga, Inc., 100% of Toyota Santa Rosa, Inc., and 75% of Lexus Manila, Inc.
Approximately 40% of TMP’s sales in 2019 were in Metro Manila while 60% of total sales were made outside of
Metro Manila. GT Capital has a 58.05% interest in Toyota Manila Bay Corporation dealership, while the remaining
dealerships are independent companies who have entered into dealership agreements with TMP. TMP enters into
dealership agreements based on criteria set out in the Toyota Distributor Agreement. TMP provides each Toyota
dealer with periodic performance reviews, training and education. In addition, TMP sets individual sales and
operational targets for each dealership.
Competition
Industry Trends
Automotive sales in the Philippines can be classified either as sales of locally-assembled or CKD vehicles or
imported CBU vehicles. The overall market growth has been reflected in positive absolute trends for both
segments, but over the past five years, imported CBU vehicles have captured an increasingly larger share of the
market. CBU market share was 75.7% in 2019 as compared to 56.0% in 2010 according to Chamber of Automotive
Manufacturers in the Philippines, Inc. (CAMPI) and Association of Vehicle Importers and Distributors (AVID). This
trend is attributable to increasing number of imported models available versus locally-produced models, which is
expected to continue with further tariff reduction in imported CBU vehicles under upcoming and current Free
Trade Agreements (FTAs) and Economic Partnership Agreements (EPAs) such as the Philippines-US FTA, Japan-
Philippines Economic Partnership Agreement, and ASEAN-Korea FTA.
New vehicles have recently accounted for an increasingly larger share of the Philippine automotive market. Rising
income levels and changing consumption preferences have contributed to this shift. The regulation is also
considered to have supported the trend over recent years, such as the stricter implementation of the prohibition
on importation of second-hand vehicles.
Part of industry/geographic area in which the business competes
Please see Distribution Methods of the Products or Services.
Principal methods of competition (price, service, warranty or product performance)
Competition has a direct effect on selling price of vehicles. In general, vehicle price setting is based on
specification differences. However, upward or downward price adjustments may be made to respond to
competitors’ pricing strategy and the target market’s purchasing behavior. It may sometimes be necessary to
maintain the current prices of some vehicle models despite increasing costs in order to narrow the gap with
competitors or maintain market share. In an effort to mitigate the effects of competitive pricing, TMP pushes
high-profit models or variants and introduces limited or special edition models.
For after-sales services, the main competitors of Toyota are the three-star garages like Motech, Rapide,
Yokohama Service Centers, Goodyear Servitek, gasoline stations and to some extent, emerging mobile garage
such as MyCasaPh. These workshops offer services that are, on the average, 20% to 40% lower than Toyota rates
primarily due to the use of non-genuine parts and lower overhead expense.
Compared to other brands, Toyota labor rate per hour is still one of the lowest at Php450/hour for Periodic
Maintenance and Php500/hour for General Job (GJ). These rates are at least 20% lower than the service centers
of other brands. In terms of service parts, average prices of Toyota Genuine Parts are 6% lower than Genuine
Parts of other makes based on 2019 parts price review.
Principal Competitors (including relative size and financial and market strengths of competitors)
TMP’s major competitors in the Philippines are Mitsubishi, Nissan, Hyundai, Suzuki, and Ford. Based on industry
data compiled by CAMPI and AVID, the top six automotive companies in the Philippines accounted for 85.3% of
total vehicles sold in 2019. Toyota has been the top selling brand measured by units sold in the Philippines for
passenger and commercial vehicles since 2002, with a 39.5% market share in 2019, which is 23.5 percentage
points higher than its closest competitor, Mitsubishi with 16.0%. Nissan and Hyundai had market shares of 10.4%
and 8.2% in 2019, respectively. Aside from Toyota, other multinational automotive companies also have
manufacturing and assembly plants in the Philippines, such as Mitsubishi, Isuzu, and Honda. Ford closed its
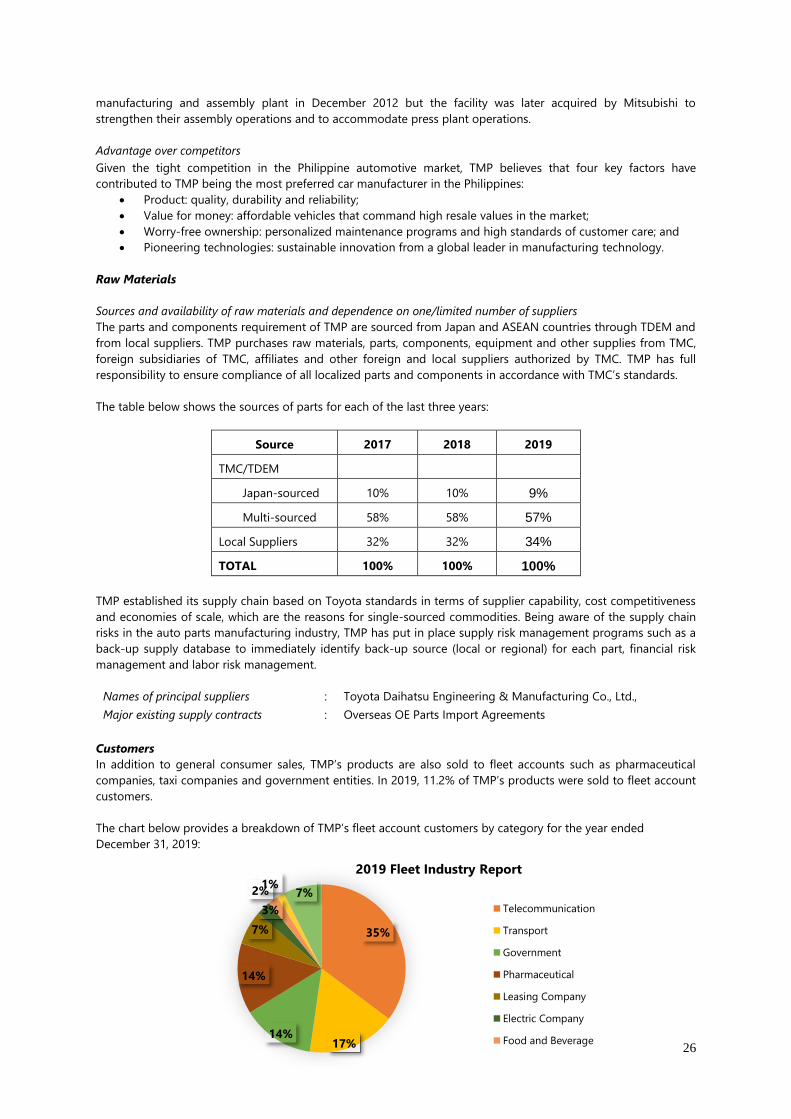
26
manufacturing and assembly plant in December 2012 but the facility was later acquired by Mitsubishi to
strengthen their assembly operations and to accommodate press plant operations.
Advantage over competitors
Given the tight competition in the Philippine automotive market, TMP believes that four key factors have
contributed to TMP being the most preferred car manufacturer in the Philippines:
• Product: quality, durability and reliability;
• Value for money: affordable vehicles that command high resale values in the market;
• Worry-free ownership: personalized maintenance programs and high standards of customer care; and
• Pioneering technologies: sustainable innovation from a global leader in manufacturing technology.
Raw Materials
Sources and availability of raw materials and dependence on one/limited number of suppliers
The parts and components requirement of TMP are sourced from Japan and ASEAN countries through TDEM and
from local suppliers. TMP purchases raw materials, parts, components, equipment and other supplies from TMC,
foreign subsidiaries of TMC, affiliates and other foreign and local suppliers authorized by TMC. TMP has full
responsibility to ensure compliance of all localized parts and components in accordance with TMC’s standards.
The table below shows the sources of parts for each of the last three years:
Source 2017 2018 2019
TMC/TDEM
Japan-sourced 10% 10% 9%
Multi-sourced 58% 58% 57%
Local Suppliers 32% 32% 34%
TOTAL 100% 100% 100%
TMP established its supply chain based on Toyota standards in terms of supplier capability, cost competitiveness
and economies of scale, which are the reasons for single-sourced commodities. Being aware of the supply chain
risks in the auto parts manufacturing industry, TMP has put in place supply risk management programs such as a
back-up supply database to immediately identify back-up source (local or regional) for each part, financial risk
management and labor risk management.
Names of principal suppliers : Toyota Daihatsu Engineering & Manufacturing Co., Ltd.,
Major existing supply contracts : Overseas OE Parts Import Agreements
Customers
In addition to general consumer sales, TMP’s products are also sold to fleet accounts such as pharmaceutical
companies, taxi companies and government entities. In 2019, 11.2% of TMP’s products were sold to fleet account
customers.
The chart below provides a breakdown of TMP’s fleet account customers by category for the year ended
December 31, 2019:
35%
17%14%
14%
7%
3%
2%1%
7%
2019 Fleet Industry Report
Telecommunication
Transport
Government
Pharmaceutical
Leasing Company
Electric Company
Food and Beverage
27
Major existing sales contracts
Not applicable
Transactions with and/or Dependence on Related Parties
As a member of the GT Capital Group, TMP continues to benefit from this affiliation in several ways. GT Capital
has a 40% interest in TFSPH, which is a joint venture between GT Capital and Toyota Financial Services
Corporation of Japan. TFSPH provides financing to both the general public and Toyota dealerships for the
purchase of cars and the acquisition of vehicle inventories, respectively. While TMP does not have any ownership
interest in TFSPH, TFSPH’s financing promotions for retail and wholesale customers help to support sales of TMP’s
products. MBT’s credit card subsidiary, MCC, and TMP have also developed a Toyota Mastercard, a loyalty and
credit card in one, where rewards earned on purchases made with the Toyota Mastercard can be used to
purchase items at any Toyota dealership. In addition, certain GT Capital companies maintain fleet accounts for the
purchase of Toyota cars for their business operations. In terms of management, TMP is also able to draw upon
the significant managerial experience of the GT Capital companies to complement its own managerial resources.
Principal Terms and Expiration Dates of All Patents, Trademarks, Copyrights, Licenses, Franchises,
Concessions and Royalty Agreements Held
TMP acquired the rights to use the “Toyota” and “Lexus” brand names through the Toyota Distributor Agreement
and Lexus Distributor Agreement, respectively, with TMC and Toyota Motor Asia Pacific (TMAP).
These distributor agreements, which are renewable every 3 years, will be renewed for another 3 years upon its
expiration on November 30, 2021. According to the distributor agreements: (i) TMC and TMAP have agreed to
grant TMP an exclusive distributorship of Toyota and Lexus products in the Philippines, thereby supplying TMP
with Toyota and Lexus vehicles, parts and accessories, non-exclusive rights to use Toyota and Lexus trademarks
and service marks, including the use of such trademarks by local Toyota and Lexus dealerships, solely in
connection with the distribution, sale and service of Toyota and Lexus products; and (ii) TMP has agreed to
continuously purchase Toyota and Lexus products from TMC, TMAP, and/or other such suppliers designated by
TMC, and to obtain any governmental approvals or certifications necessary for the import, sales, service, use,
registration, and/or homologation of Toyota and Lexus products in the Philippines.
TMP has also entered into a Technical Assistance Agreement with TMC, whereby TMP is licensed to manufacture
Toyota vehicles and parts of proper and specified quality and obtain technical assistance from TMC. This
agreement will expire on April 30, 2024, subject to renewal. Under this agreement, TMP pays TMC royalties on all
licensed products and such amount shall be fixed in accordance with the agreement.
Government Approval of Principal Products or Services
TMP regularly obtains approvals, certifications and permits from regulatory bodies and agencies, as applicable,
prior to the offering of its products and services to the public.
Effect of Existing or Probable Governmental Regulations on the Business
The Philippine automotive industry is subject to various laws and government regulations. These include: (a)
standards and technical regulations that affect vehicle performance such as safety, environment and energy
standards; and (b) regulations governing environmental performance of manufacturing companies. The
Government also imposes tariffs, taxes and other levies. TMP has incurred, and expects to incur in the future,
significant costs in complying with these regulations.
28
Employees
The following table provides a breakdown of TMP’s employees as of December 31, 2019.
2019
Regular 1,967
Senior Officers 105
Junior Officers 542
Rank and File 1,320
Temporary 1,728
Trainees 228
Outsourced Services 1,472
TMP Exclusive Services 28
Total 3,695
Note:
Senior Officers include all Assistant Vice Presidents and up.
Junior Officers include all Supervisors up to Section Managers.
Rank and File are all other Team Members
Expiration dates of Collective Bargaining Agreements (CBA)
TMP has two certified and recognized labor unions, one for rank-and-file employees known as Toyota Motor
Philippines Corporation Labor Organization (TMPCLO) and one for supervisory employees known as Toyota
Motor Philippines Corporation Supervisory Union (TMPCSU).
The 3-year Collective Bargaining Agreement (CBA) on economic provisions for both TMPCLO and TMPCSU which
expired in June 2019 was renewed for the next two years from July 2019 to June 2021. The five-year CBA for both
political and economic provisions with the two unions shall be renewed in July 2021.
Supplemental benefits or incentive arrangements
TMP applies a progressive benefit structure with a set of base benefits applicable to all employees and a
supplementary, variable scheme where individual employees choose from a menu of benefits appropriate to their
individual needs/situational preferences, subject to level of entitlement. TMP has also funded a non-contributory
defined benefit retirement plan covering all of its regular employees. The plan is administered by trustees. The
benefits are based on the years of service and percentage of final basic salary. TMP’s normal retirement age is 55
years. Early retirement is allowed at 50 years of age.
Major Risks
The Philippine automotive industry is highly volatile.
The Philippine automotive market has been subject to considerable volatility in demand and TMP’s business is
highly sensitive to sales volume. Demand for vehicles depends to a large extent on general, social, political and
economic conditions in the Philippines. Demand may also be affected by factors directly impacting vehicle prices
or the cost of purchasing and operating vehicles such as sales and financing incentives, prices of raw materials
and parts and components, and the cost of fuel, exchange rates and governmental regulations (including tariffs,
import regulations and other taxes). Volatility in demand may lead to lower vehicle unit sales and increased
inventory, which may result in higher selling expenses per vehicle and could materially and adversely affect TMP’s
business, financial condition and results of operations.
The Philippine automotive market is highly competitive.
The Philippine automotive market is highly competitive. TMP faces strong competition from vehicle
manufacturers and importers in the Philippines. TMP’s competitors also have relationships with joint venture
partners and recognized international auto brands. Factors affecting competition include product quality and
features, innovation and development time, production capacity, pricing, reliability, safety, fuel economy,
customer service and financing terms. Increased competition may lead to lower vehicle unit sales and increased
inventory, which may result in higher selling expenses and may adversely affect TMP’s financial condition and
results of operations. Further, under the ASEAN-Korea free trade agreement, tariffs on vehicles from Korea were
reduced to 15% from 20% in 2012 and was further reduced to 5% beginning January 2016 leading to greater
competition from Korean brands. Competition has a direct effect on selling prices of vehicles. In general, vehicle
price setting is based on specification differences. However, upward or downward price adjustments may be
29
made to respond to competitors’ pricing strategy and the target market’s purchasing behavior. TMP’s ability to
maintain its competitiveness will be fundamental to its future success in existing and new markets and its market
share. In addition, under the terms of the Toyota Distributor Agreement with TMC and TDEM, TMP is required to
meet certain business targets including, among others, annual sales plan and market share. Should TMP fail to
meet its expected business targets, its right to distribute Toyota brands in the Philippines may be terminated.
There can be no assurance that TMP will be able to compete successfully in the future, which could materially and
adversely affect TMP’s business, financial condition and results of operations.
The Philippine automotive industry is subject to various governmental regulations.
The Philippine automotive industry is subject to various laws and government regulations. These include: (a)
standards and technical regulations that affect vehicle performance such as safety, environment and energy
standards; and (b) regulations governing environmental performance of manufacturing companies. The
Government also imposes tariffs, taxes and other levies. TMP has incurred, and expects to incur in the future,
significant costs in complying with these regulations. New legislation or changes in existing legislation may also
subject TMP to additional costs in the future and could materially and adversely affect TMP’s business, financial
condition and results of operations.
TMP’s success depends on its ability to continue offering innovative, new, price-competitive products and services
that meet and satisfy customer demand on a timely basis.
Meeting and satisfying customer demand with attractive new vehicles and reducing product development time
are critical elements to the success of automotive manufacturers. The timely introduction of new vehicle models
at competitive prices and meeting rapidly changing customer preferences and demands are fundamental to
TMP’s success. There is no assurance that TMP may adequately perceive and identify changing customer
preferences and demands with respect to quality, styling, reliability, safety and other features in a timely manner.
Even if TMP succeeds in perceiving and identifying customer preferences and demands, there is no assurance that
TMP will be capable of manufacturing and introducing new, price-competitive products in a timely manner with
its available technology, intellectual property, sources of raw materials and parts and components, and
production capacity. Further, there is no assurance that TMP will be able to implement capital expenditures at the
level and periods planned by management. TMP’s inability to develop and offer products that meet customer
demand in a timely manner could result in a lower market share and reduced sales volumes and margins, and
could materially and adversely affect TMP’s business, financial condition and results of operations.
TMP’s success depends on its ability to market and distribute effectively, and to maintain its brand image.
TMP’s success in the sale of vehicles depends on its ability to market and effectively distribute based on
distribution networks and sales techniques tailored to the needs of its customers, as well as its ability to maintain
and further cultivate the Toyota brand image. There is no assurance that TMP will be able to develop sales
techniques and distribution networks that effectively adapt to customer preferences or changes in the regulatory
environment in the Philippines. Nor is there assurance that TMP will be able to cultivate and protect the Toyota
brand image. Toyota’s inability to maintain well-developed sales techniques and distribution networks or a
positive brand image may result in decreased sales and market share and could materially and adversely affect
TMP’s business, financial condition and results of operations.
TMP’s ongoing success depends on the non-termination and repeated renewal of distributor agreements with TMC
and TMAP.
TMP acquired the rights to use the “Toyota” and “Lexus” brand names through the Toyota Distributor Agreement
and the Lexus Distributor Agreement, respectively, with TMC and TMAP. These distributor agreements were last
renewed on December 1, 2018 with an expiration date of November 30, 2021. According to the distributor
agreements: (i) TMC and TMAP have agreed to grant TMP an exclusive distributorship of Toyota and Lexus
products in the Philippines, thereby supplying TMP with Toyota and Lexus vehicles, parts and accessories, non-
exclusive rights to use Toyota and Lexus trademarks and service marks, including the use of such trademarks by
local Toyota and Lexus dealerships, solely in connection with the distribution, sale and service of Toyota and
Lexus products; and (ii) TMP has agreed to continuously purchase Toyota and Lexus products from TMC, TMAP,
and/or other such suppliers designated by TMC, and to obtain any governmental approvals or certifications
necessary for the import, sales, service, use, registration, and/or homologation of Toyota and Lexus products in
the Philippines.
30
The distributor agreements can be terminated at the option of TMC upon the occurrence of various events which
include:
• breach of any material provision of the distributor agreement by TMP;
• discontinuation of a material part of the business activities of TMP as a Toyota or Lexus authorized
distributor;
• issuance of an order by any relevant government authority for TMP to discontinue, or the cancellation or
withdrawal of any license or permission to operate, a material part of TMP’s business activities as a
Toyota or Lexus authorized distributor;
• the election by TMC to terminate the agreement, after consultation with TMAP, in the event that: (a)
TMP fails in any material respect to achieve any of the business targets; and (b) TMP fails to make
significant progress in achieving such business targets within six months after TMAP has given guidance
or advice to TMP to improve its performance; and (c) TMAP deems that there is no justifiable reason for
such failure;
• the election by TMC to terminate a distributor agreement in the event that:
(a) TMP has implemented, without prior notification to TMC and TMAP, any of the following
significant changes in its organization: (i) merger or acquisition of any company or
organization; (ii) assignment or disposition of all or a substantial portion of its assets or
business to any third party; (iii) change of its executives or high-ranked employees, such as
department/division general managers and above; (iv) relocation, expansion, reduction, or
closing down of its head offices or other important facilities; (v) change of its main shareholders
or any person or entity which has substantial control over TMP as well as listing all or a part of
its shares on any stock exchange; and (vi) any other significant change in its business or
organization; or
(b) failure by TMP to satisfy the request of TMC and/or TMAP for TMP to suspend such significant
changes or to modify the contemplated organization scheme such as to prevent or reduce
possible impairment of TMC and/or TMAP’s interests or TMP’s performance or the ability to
perform as a Toyota or Lexus authorized distributor.
If either of the Toyota Distributor Agreement or Lexus Distributor Agreement were to be terminated, TMP shall be
required to: (i) immediately and fully settle all of its outstanding liabilities to the other parties in relation to the
relevant agreement; (ii) immediately terminate all dealership agreements and any other contracts concluded
between TMP and any third party in relation to the relevant agreement; (iii) collect and remove all data, facility
signs, signboards, posters, advertising or technical materials and printed matters related to Toyota or Lexus
products, software for the sale and service of Toyota or Lexus products, and all tools and implements designed
for servicing Toyota or Lexus products located in the facilities of TMP and/or the dealers, and deliver at its own
cost and expense to TMC and/or TMAP or dispose of a part or a whole of them in accordance with the
instructions of TMC and/or TMAP; (iv) remove from its facilities and cease using the name of TMC and any of the
trademarks, service marks, and any mark confusingly similar thereto, cancel the relevant registrations thereof, and
cause all dealers to do the same; (v) refrain from conducting itself and cause each dealer to refrain from
conducting itself in such manner as would lead a third party to believe that TMP or any dealer is still an
authorized distributor or dealer of Toyota or Lexus brand products in the Philippines; (vi) in the event that TMP
fails to comply with the above obligations, TMP shall allow TMC and TMAP to enter its premises at any time for
the removal and disposal of all items bearing Toyota or Lexus trademarks and any marks confusingly similar
thereto, as well as all items that should have been delivered to TMC and/or TMAP or disposed of by TMP, wherein
TMP shall reimburse TMC and TMAP for all expenses incurred in exercising such right if so requested by TMC and
TMAP; (vii) allow TMC and TMAP to repurchase Toyota or Lexus products which are new, unused, undamaged,
and in good and saleable condition or dispose of such products in accordance with instructions of TMC and/or
TMAP in the event that the products are not repurchased.
Further, any decreases in product quality, negative allegations or negative events associated to the Toyota group
of companies outside of the Philippines could tarnish the image of the brands and may cause consumers to
choose other vehicles. Further, there can be no assurance that these brand names will not be adversely affected in
the future by events such as actions that are beyond TMP’s control and which could materially and adversely
affect TMP’s business, financial condition and results of operations.
31
A third party could inappropriately use the trademark and trade name “Toyota” or any of the trademarks and trade
names that TMP uses.
TMP has a license to use the “Toyota” name and logo in the Philippines. There is no assurance that the steps
taken by TMP or TMC will prevent misappropriation or infringement of the intellectual property rights of TMC. In
addition, policing unauthorized use of intellectual property rights is difficult and sometimes practically infeasible.
The Philippine automotive industry has experienced unauthorized copies of vehicles and auto parts from time to
time. Such misappropriation or infringement could materially and adversely affect TMP’s business, financial
condition and results of operations.
Product recalls could materially adversely affect TMP’s reputation and financial condition.
TMP may recall its products to address performance, compliance, or safety-related issues. While no recalls on
TMP manufactured automobiles have occurred in the past, there can be no assurance that such recalls will not
occur in the future. The costs TMP would incur in connection with such recalls typically include the cost of the
part being replaced and labor to remove and replace the defective part. If the defective part or vehicle is the fault
of TMP, it will be responsible for such costs. Otherwise, costs are claimed from TDEM. In addition, if not handled
properly by TMP, TDEM and TMC, product recalls can harm TMP’s reputation and cause it to lose customers,
particularly if those recalls cause consumers to question the safety or reliability of TMP’s products. Any costs
incurred or lost sales caused by future product recalls could materially and adversely affect TMP’s business,
financial condition and results of operations. Conversely, not issuing a recall or not issuing a recall on a timely
basis can harm TMP’s reputation and cause it to lose customers.
Dealer misconduct is difficult to detect and could harm TMP’s reputation or lead to litigation costs.
TMP sells its vehicles to a dealer network consisting primarily of third-party dealers over which it has limited
direct supervision. Dealer misconduct could result in negative publicity for TMP and the other dealers in the
network and result in reputational or financial harm to TMP and the other dealers. Misconduct could include:
• engaging in misrepresentation or fraudulent activities and statements when marketing or selling
vehicles, parts or services to customers;
• hiding unauthorized or unsuccessful activities, resulting in unknown and unmanaged risks or losses; or
• not complying with laws or TMP’s control policies or procedures.
TMP cannot always deter or detect dealer misconduct, and the precautions it takes to detect and prevent these
activities may not be effective in all cases. There can be no assurance that agent or employee misconduct will not
materially and adversely affect TMP’s business, financial condition and results of operations.
TMP may be unable to maintain its current distributor network or attract new distributors.
TMP is heavily dependent on its distribution network. The success of TMP’s business depends on maintaining
good relations with existing distributors as well as attracting new ones. Although TMP believes it has good
relations with its existing distributors, there can be no assurance that its distributors will continue to do business
with TMP or that TMP will be able to attract new quality distributors. If TMP does not succeed in maintaining its
current distribution network or in attracting new distributors to support future growth, TMP’s market share may
decline and could materially and adversely affect TMP’s business, financial condition and results of operations.
The continued competitiveness of TMP may be adversely affected if it fails to successfully reduce its costs.
TMP believes that competition has led to, and will likely continue to lead to, an increase in selling expenses. At
the same time, prices of raw materials, including steel, as well as energy costs, are increasing due to high demand.
Therefore, despite relatively high levels of consumer demand for vehicles in the Philippines, it has become
necessary for automotive manufacturers in the Philippines to reduce costs in order to remain competitive. TMP
has taken various measures to reduce costs in connection with its operations. However, the effectiveness of such
measures is not assured. If TMP is unable to reduce overall costs, its competitive position may suffer, which in
turn could materially and adversely affect TMP’s business, financial condition and results of operations. TMP’s
ability to maintain its competitiveness will be fundamental to its future success in existing and new markets. There
can be no assurance that TMP will be able to compete successfully in the future.
Unfavorable foreign currency rate fluctuations would have an adverse impact upon TMP’s financial condition and
results of operations.
TMP imports CBU vehicles, parts, and raw materials. The costs of such imported items are mainly denominated in
U.S. dollars and Japanese Yen. Depreciation of the Philippine peso could adversely affect TMP’s financial condition
and results of operations.
32
TMP is subject to a number of risks associated with its supply chain.
Any interruption in the supply of raw materials, parts and components from any key suppliers could materially
and adversely affect TMP’s business, results of operations and financial condition. TMP obtains a significant
proportion of its raw materials from a limited number of suppliers in the Philippines and abroad. In addition,
inexpensively re-sourced from another supplier due to long lead times and new contractual commitments may be
required by another supplier in order to provide the components or materials.
In 2011, TMP’s supply chain was impacted by the earthquake and tsunami that struck Japan in March 2011 as well
as the floods in Thailand which occurred during the second half of 2011. Both events impacted TMP’s ability to
source parts and imported vehicle units, thereby reducing TMP’s production and sales figures for 2011. TMP also
experienced an increase in costs for its supplies as a result of these two natural disasters. While TMP believes
production and sales forecasts have since returned to normal following these events and countermeasures were
done to improve TMP’s and its suppliers’ risk management plan, there can be no assurance that similar supply
chain disruptions will not occur in the future. Any future supply chain disruptions caused by natural disasters and
other incidents could have a material adverse impact on TMP’s business, financial condition and results of
operations. Increases in prices for raw materials that TMP and its suppliers use in manufacturing their products or
parts and components, such as steel and plastic parts, may lead to higher production costs for parts and
components. This could, in turn, negatively impact TMP’s future profitability because TMP may not be able to
pass all those costs on to its customers or require its suppliers to absorb such costs. As a response to the
increasing competition in the market, TMP conducts extensive programs to continuously improve local parts
suppliers’ overall competitiveness in terms of safety, quality, delivery, and cost.
The manufacturing activities and operations of TMP could be adversely affected if it fails to obtain raw materials
and CKD parts in a timely fashion or at a reasonable price.
Raw materials and CKD parts used by TMP are, and will continue to be, sourced from suppliers located in the
Philippines, Japan and other ASEAN countries, including TMC and TDEM. If TMP’s suppliers fail to meet their
commitments or to enter into agreements with TMP on commercially reasonable terms, and TMP is unable to
locate alternative suppliers in a timely fashion, the manufacturing activities and operations of TMP could be
materially adversely affected. This may be the case where TMP is dependent on a sole supplier or a limited
number of suppliers for a critical input, and it may find it difficult to replace such supplier in a timely manner and
at a reasonable market price.
TMP relies heavily on the technology and processes of TMC which TMP uses under its Toyota Technical Assistance
Agreement with TMC.
TMP has acquired the right to use TMP’s Toyota Production System (“TPS”), which is based on just-in-time
production and quality control processes and feedback mechanisms. Under the Technical Assistance Agreement,
which was last renewed on May 1, 2019 and is valid until April 30, 2024, TMP may request assistance for technical
know-how on manufacturing, engineering and other know-how and information relating to licensed products.
TMC is paid royalties based on the value added by TMP in the manufacture of each vehicle or part. If the
Technical Assistance Agreement were to expire, or if TMP or TMC were to terminate the agreement, TMP would
no longer be permitted to use TMC’s processes or produce the licensed vehicles or parts, which would materially
and adversely affect TMP’s business, financial condition and results of operations.
TMP’s success depends on its ability to attract and retain senior management and key technical personnel.
TMP relies on experienced, capable and talented senior managers and highly-skilled technical personnel to
operate its business. TMP expects increased competition for such employees not only from other automotive
companies but also from other industries in the Philippines and abroad. TMP’s business, results of operations and
financial condition could be adversely affected if such experienced and talented senior managers and skilled
technical personnel are not retained by TMP.
Philippine AXA Life Insurance Corporation
GT Capital has interests in the life insurance business through its 25.3% ownership of shares in AXA Philippines,
the second largest insurance company in the Philippines in terms of total net insurance premium amounting to
P26.2 billion in 2019. AXA Philippines is a joint venture between the AXA Group, one of the world’s largest
insurance groups, and the MBT Group, one of the Philippines’ largest financial conglomerates. To complement its
life insurance business, AXA Philippines announced in April 2016 the completion of the acquisition of 100%
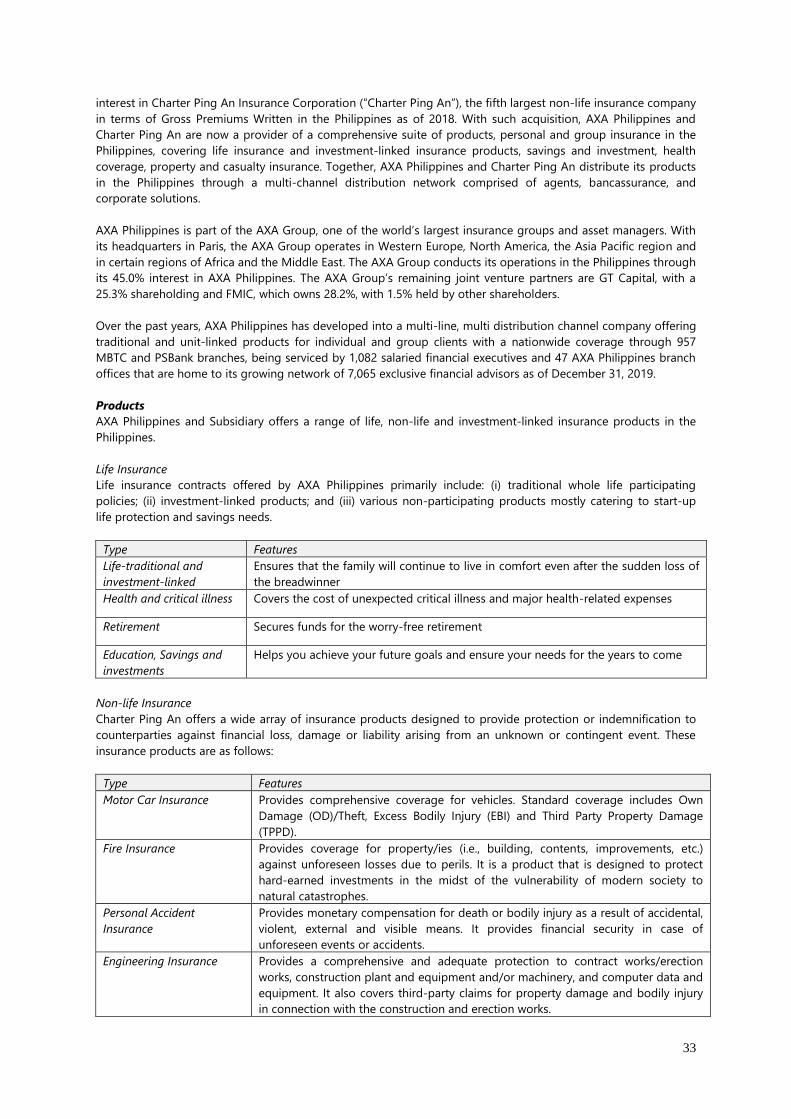
33
interest in Charter Ping An Insurance Corporation (“Charter Ping An”), the fifth largest non-life insurance company
in terms of Gross Premiums Written in the Philippines as of 2018. With such acquisition, AXA Philippines and
Charter Ping An are now a provider of a comprehensive suite of products, personal and group insurance in the
Philippines, covering life insurance and investment-linked insurance products, savings and investment, health
coverage, property and casualty insurance. Together, AXA Philippines and Charter Ping An distribute its products
in the Philippines through a multi-channel distribution network comprised of agents, bancassurance, and
corporate solutions.
AXA Philippines is part of the AXA Group, one of the world’s largest insurance groups and asset managers. With
its headquarters in Paris, the AXA Group operates in Western Europe, North America, the Asia Pacific region and
in certain regions of Africa and the Middle East. The AXA Group conducts its operations in the Philippines through
its 45.0% interest in AXA Philippines. The AXA Group’s remaining joint venture partners are GT Capital, with a
25.3% shareholding and FMIC, which owns 28.2%, with 1.5% held by other shareholders.
Over the past years, AXA Philippines has developed into a multi-line, multi distribution channel company offering
traditional and unit-linked products for individual and group clients with a nationwide coverage through 957
MBTC and PSBank branches, being serviced by 1,082 salaried financial executives and 47 AXA Philippines branch
offices that are home to its growing network of 7,065 exclusive financial advisors as of December 31, 2019.
Products
AXA Philippines and Subsidiary offers a range of life, non-life and investment-linked insurance products in the
Philippines.
Life Insurance
Life insurance contracts offered by AXA Philippines primarily include: (i) traditional whole life participating
policies; (ii) investment-linked products; and (iii) various non-participating products mostly catering to start-up
life protection and savings needs.
Type Features
Life-traditional and
investment-linked
Ensures that the family will continue to live in comfort even after the sudden loss of
the breadwinner
Health and critical illness Covers the cost of unexpected critical illness and major health-related expenses
Retirement Secures funds for the worry-free retirement
Education, Savings and
investments
Helps you achieve your future goals and ensure your needs for the years to come
Non-life Insurance
Charter Ping An offers a wide array of insurance products designed to provide protection or indemnification to
counterparties against financial loss, damage or liability arising from an unknown or contingent event. These
insurance products are as follows:
Type Features
Motor Car Insurance Provides comprehensive coverage for vehicles. Standard coverage includes Own
Damage (OD)/Theft, Excess Bodily Injury (EBI) and Third Party Property Damage
(TPPD).
Fire Insurance
Provides coverage for property/ies (i.e., building, contents, improvements, etc.)
against unforeseen losses due to perils. It is a product that is designed to protect
hard-earned investments in the midst of the vulnerability of modern society to
natural catastrophes.
Personal Accident
Insurance
Provides monetary compensation for death or bodily injury as a result of accidental,
violent, external and visible means. It provides financial security in case of
unforeseen events or accidents.
Engineering Insurance
Provides a comprehensive and adequate protection to contract works/erection
works, construction plant and equipment and/or machinery, and computer data and
equipment. It also covers third-party claims for property damage and bodily injury
in connection with the construction and erection works.
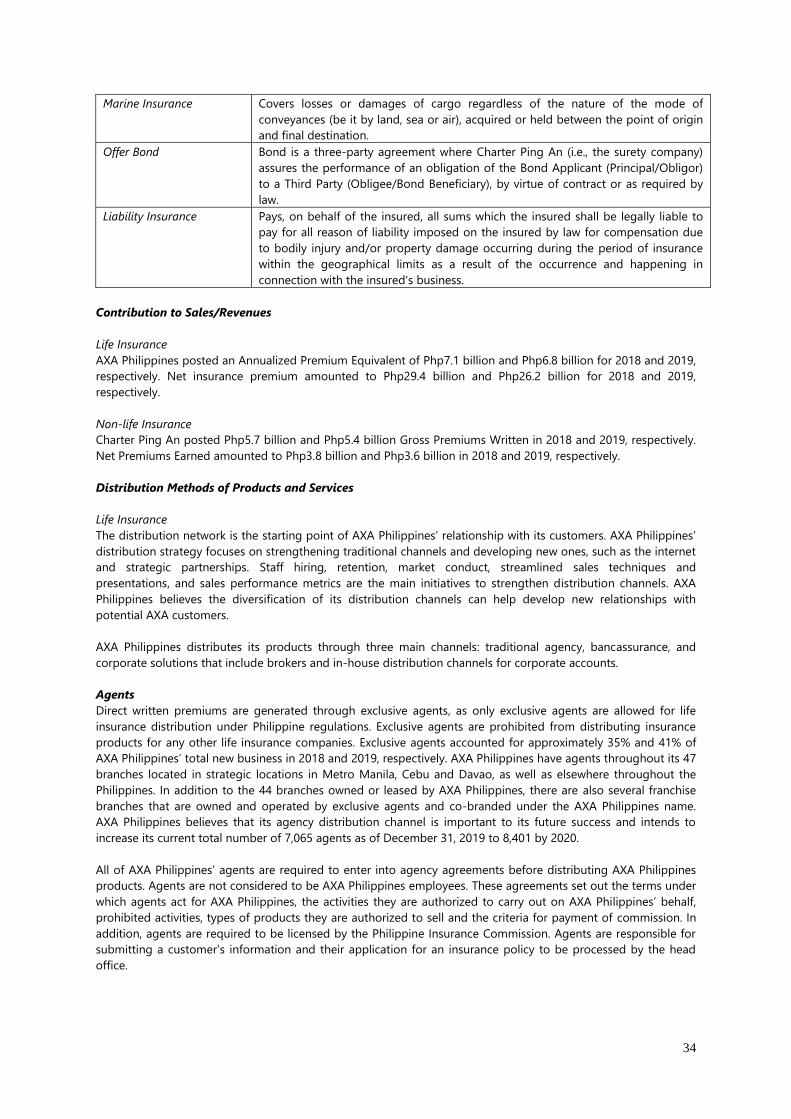
34
Marine Insurance
Covers losses or damages of cargo regardless of the nature of the mode of
conveyances (be it by land, sea or air), acquired or held between the point of origin
and final destination.
Offer Bond
Bond is a three-party agreement where Charter Ping An (i.e., the surety company)
assures the performance of an obligation of the Bond Applicant (Principal/Obligor)
to a Third Party (Obligee/Bond Beneficiary), by virtue of contract or as required by
law.
Liability Insurance
Pays, on behalf of the insured, all sums which the insured shall be legally liable to
pay for all reason of liability imposed on the insured by law for compensation due
to bodily injury and/or property damage occurring during the period of insurance
within the geographical limits as a result of the occurrence and happening in
connection with the insured's business.
Contribution to Sales/Revenues
Life Insurance
AXA Philippines posted an Annualized Premium Equivalent of Php7.1 billion and Php6.8 billion for 2018 and 2019,
respectively. Net insurance premium amounted to Php29.4 billion and Php26.2 billion for 2018 and 2019,
respectively.
Non-life Insurance
Charter Ping An posted Php5.7 billion and Php5.4 billion Gross Premiums Written in 2018 and 2019, respectively.
Net Premiums Earned amounted to Php3.8 billion and Php3.6 billion in 2018 and 2019, respectively.
Distribution Methods of Products and Services
Life Insurance
The distribution network is the starting point of AXA Philippines’ relationship with its customers. AXA Philippines’
distribution strategy focuses on strengthening traditional channels and developing new ones, such as the internet
and strategic partnerships. Staff hiring, retention, market conduct, streamlined sales techniques and
presentations, and sales performance metrics are the main initiatives to strengthen distribution channels. AXA
Philippines believes the diversification of its distribution channels can help develop new relationships with
potential AXA customers.
AXA Philippines distributes its products through three main channels: traditional agency, bancassurance, and
corporate solutions that include brokers and in-house distribution channels for corporate accounts.
Agents
Direct written premiums are generated through exclusive agents, as only exclusive agents are allowed for life
insurance distribution under Philippine regulations. Exclusive agents are prohibited from distributing insurance
products for any other life insurance companies. Exclusive agents accounted for approximately 35% and 41% of
AXA Philippines’ total new business in 2018 and 2019, respectively. AXA Philippines have agents throughout its 47
branches located in strategic locations in Metro Manila, Cebu and Davao, as well as elsewhere throughout the
Philippines. In addition to the 44 branches owned or leased by AXA Philippines, there are also several franchise
branches that are owned and operated by exclusive agents and co-branded under the AXA Philippines name.
AXA Philippines believes that its agency distribution channel is important to its future success and intends to
increase its current total number of 7,065 agents as of December 31, 2019 to 8,401 by 2020.
All of AXA Philippines’ agents are required to enter into agency agreements before distributing AXA Philippines
products. Agents are not considered to be AXA Philippines employees. These agreements set out the terms under
which agents act for AXA Philippines, the activities they are authorized to carry out on AXA Philippines’ behalf,
prohibited activities, types of products they are authorized to sell and the criteria for payment of commission. In
addition, agents are required to be licensed by the Philippine Insurance Commission. Agents are responsible for
submitting a customer’s information and their application for an insurance policy to be processed by the head
office.
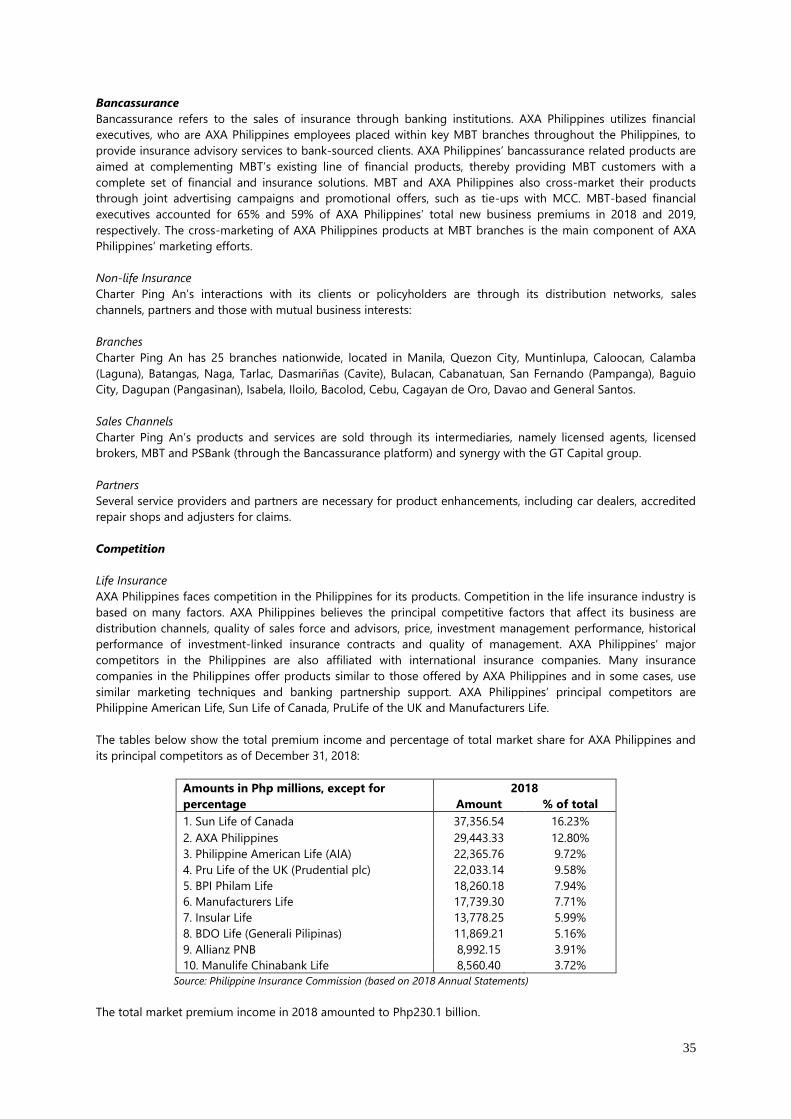
35
Bancassurance
Bancassurance refers to the sales of insurance through banking institutions. AXA Philippines utilizes financial
executives, who are AXA Philippines employees placed within key MBT branches throughout the Philippines, to
provide insurance advisory services to bank-sourced clients. AXA Philippines’ bancassurance related products are
aimed at complementing MBT’s existing line of financial products, thereby providing MBT customers with a
complete set of financial and insurance solutions. MBT and AXA Philippines also cross-market their products
through joint advertising campaigns and promotional offers, such as tie-ups with MCC. MBT-based financial
executives accounted for 65% and 59% of AXA Philippines’ total new business premiums in 2018 and 2019,
respectively. The cross-marketing of AXA Philippines products at MBT branches is the main component of AXA
Philippines’ marketing efforts.
Non-life Insurance
Charter Ping An’s interactions with its clients or policyholders are through its distribution networks, sales
channels, partners and those with mutual business interests:
Branches
Charter Ping An has 25 branches nationwide, located in Manila, Quezon City, Muntinlupa, Caloocan, Calamba
(Laguna), Batangas, Naga, Tarlac, Dasmariñas (Cavite), Bulacan, Cabanatuan, San Fernando (Pampanga), Baguio
City, Dagupan (Pangasinan), Isabela, Iloilo, Bacolod, Cebu, Cagayan de Oro, Davao and General Santos.
Sales Channels
Charter Ping An’s products and services are sold through its intermediaries, namely licensed agents, licensed
brokers, MBT and PSBank (through the Bancassurance platform) and synergy with the GT Capital group.
Partners
Several service providers and partners are necessary for product enhancements, including car dealers, accredited
repair shops and adjusters for claims.
Competition
Life Insurance
AXA Philippines faces competition in the Philippines for its products. Competition in the life insurance industry is
based on many factors. AXA Philippines believes the principal competitive factors that affect its business are
distribution channels, quality of sales force and advisors, price, investment management performance, historical
performance of investment-linked insurance contracts and quality of management. AXA Philippines’ major
competitors in the Philippines are also affiliated with international insurance companies. Many insurance
companies in the Philippines offer products similar to those offered by AXA Philippines and in some cases, use
similar marketing techniques and banking partnership support. AXA Philippines’ principal competitors are
Philippine American Life, Sun Life of Canada, PruLife of the UK and Manufacturers Life.
The tables below show the total premium income and percentage of total market share for AXA Philippines and
its principal competitors as of December 31, 2018:
Amounts in Php millions, except for
percentage
2018
Amount % of total
1. Sun Life of Canada 37,356.54 16.23%
2. AXA Philippines 29,443.33 12.80%
3. Philippine American Life (AIA) 22,365.76 9.72%
4. Pru Life of the UK (Prudential plc) 22,033.14 9.58%
5. BPI Philam Life 18,260.18 7.94%
6. Manufacturers Life 17,739.30 7.71%
7. Insular Life 13,778.25 5.99%
8. BDO Life (Generali Pilipinas) 11,869.21 5.16%
9. Allianz PNB 8,992.15 3.91%
10. Manulife Chinabank Life 8,560.40 3.72%
Source: Philippine Insurance Commission (based on 2018 Annual Statements)
The total market premium income in 2018 amounted to Php230.1 billion.
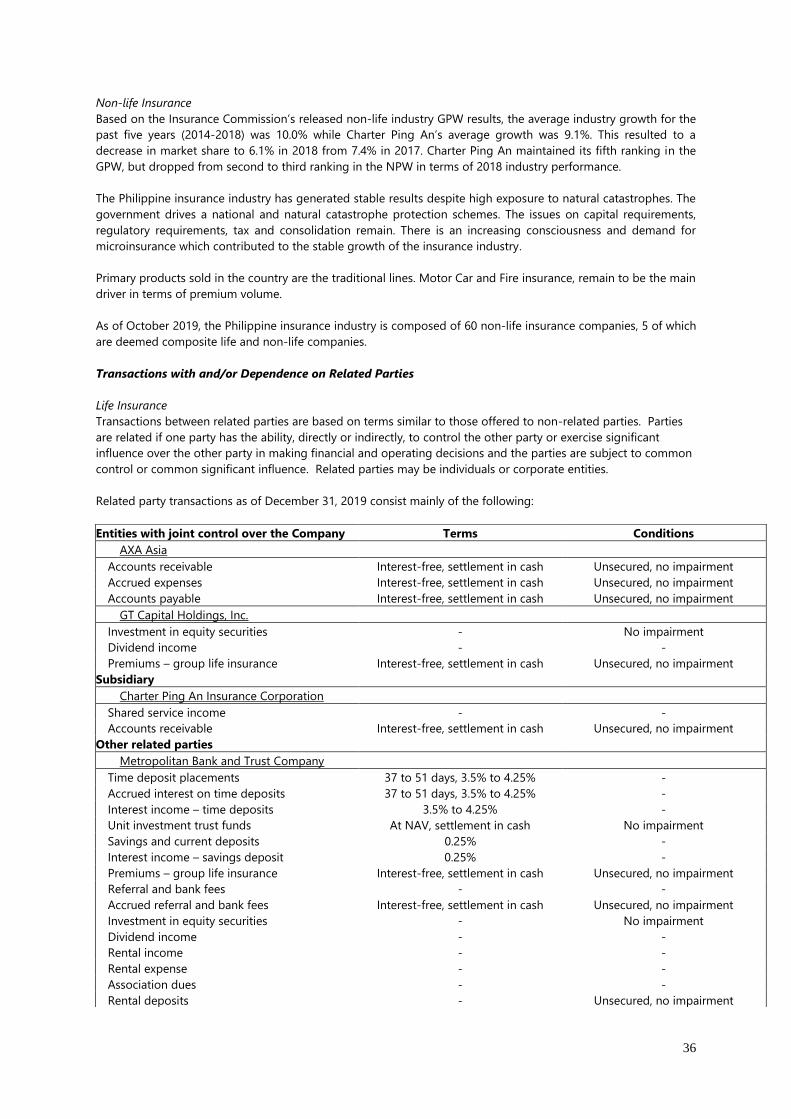
36
Non-life Insurance
Based on the Insurance Commission’s released non-life industry GPW results, the average industry growth for the
past five years (2014-2018) was 10.0% while Charter Ping An’s average growth was 9.1%. This resulted to a
decrease in market share to 6.1% in 2018 from 7.4% in 2017. Charter Ping An maintained its fifth ranking in the
GPW, but dropped from second to third ranking in the NPW in terms of 2018 industry performance.
The Philippine insurance industry has generated stable results despite high exposure to natural catastrophes. The
government drives a national and natural catastrophe protection schemes. The issues on capital requirements,
regulatory requirements, tax and consolidation remain. There is an increasing consciousness and demand for
microinsurance which contributed to the stable growth of the insurance industry.
Primary products sold in the country are the traditional lines. Motor Car and Fire insurance, remain to be the main
driver in terms of premium volume.
As of October 2019, the Philippine insurance industry is composed of 60 non-life insurance companies, 5 of which
are deemed composite life and non-life companies.
Transactions with and/or Dependence on Related Parties
Life Insurance
Transactions between related parties are based on terms similar to those offered to non-related parties. Parties
are related if one party has the ability, directly or indirectly, to control the other party or exercise significant
influence over the other party in making financial and operating decisions and the parties are subject to common
control or common significant influence. Related parties may be individuals or corporate entities.
Related party transactions as of December 31, 2019 consist mainly of the following:
Entities with joint control over the Company Terms Conditions
AXA Asia
Accounts receivable Interest-free, settlement in cash Unsecured, no impairment
Accrued expenses Interest-free, settlement in cash Unsecured, no impairment
Accounts payable Interest-free, settlement in cash Unsecured, no impairment
GT Capital Holdings, Inc.
Investment in equity securities - No impairment
Dividend income - -
Premiums – group life insurance Interest-free, settlement in cash Unsecured, no impairment
Subsidiary
Charter Ping An Insurance Corporation
Shared service income - -
Accounts receivable Interest-free, settlement in cash Unsecured, no impairment
Other related parties
Metropolitan Bank and Trust Company
Time deposit placements 37 to 51 days, 3.5% to 4.25% -
Accrued interest on time deposits 37 to 51 days, 3.5% to 4.25% -
Interest income – time deposits 3.5% to 4.25% -
Unit investment trust funds At NAV, settlement in cash No impairment
Savings and current deposits 0.25% -
Interest income – savings deposit 0.25% -
Premiums – group life insurance Interest-free, settlement in cash Unsecured, no impairment
Referral and bank fees - -
Accrued referral and bank fees Interest-free, settlement in cash Unsecured, no impairment
Investment in equity securities - No impairment
Dividend income - -
Rental income - -
Rental expense - -
Association dues - -
Rental deposits - Unsecured, no impairment
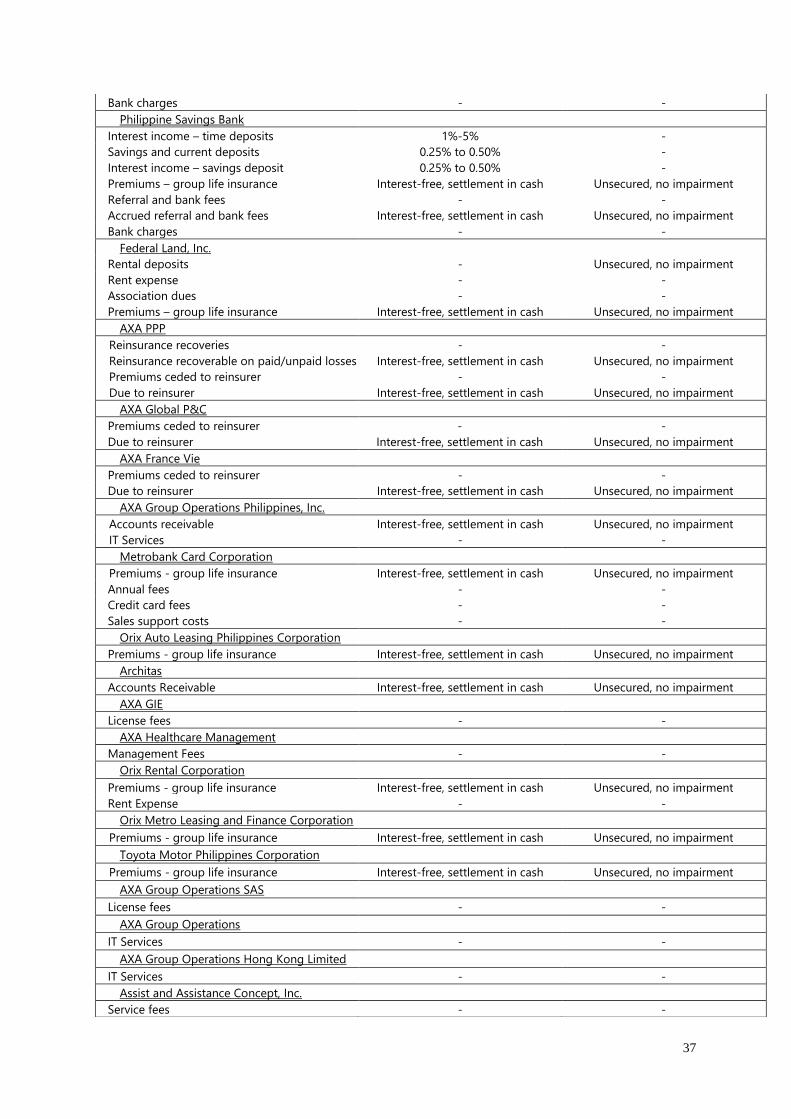
37
Bank charges - -
Philippine Savings Bank
Interest income – time deposits 1%-5% -
Savings and current deposits 0.25% to 0.50% -
Interest income – savings deposit 0.25% to 0.50% -
Premiums – group life insurance Interest-free, settlement in cash Unsecured, no impairment
Referral and bank fees - -
Accrued referral and bank fees Interest-free, settlement in cash Unsecured, no impairment
Bank charges - -
Federal Land, Inc.
Rental deposits - Unsecured, no impairment
Rent expense - -
Association dues - -
Premiums – group life insurance Interest-free, settlement in cash Unsecured, no impairment
AXA PPP
Reinsurance recoveries - -
Reinsurance recoverable on paid/unpaid losses Interest-free, settlement in cash Unsecured, no impairment
Premiums ceded to reinsurer - -
Due to reinsurer Interest-free, settlement in cash Unsecured, no impairment
AXA Global P&C
Premiums ceded to reinsurer - -
Due to reinsurer Interest-free, settlement in cash Unsecured, no impairment
AXA France Vie
Premiums ceded to reinsurer - -
Due to reinsurer Interest-free, settlement in cash Unsecured, no impairment
AXA Group Operations Philippines, Inc.
Accounts receivable Interest-free, settlement in cash Unsecured, no impairment
IT Services - -
Metrobank Card Corporation
Premiums - group life insurance Interest-free, settlement in cash Unsecured, no impairment
Annual fees - -
Credit card fees - -
Sales support costs - -
Orix Auto Leasing Philippines Corporation
Premiums - group life insurance Interest-free, settlement in cash Unsecured, no impairment
Architas
Accounts Receivable Interest-free, settlement in cash Unsecured, no impairment
AXA GIE
License fees - -
AXA Healthcare Management
Management Fees - -
Orix Rental Corporation
Premiums - group life insurance Interest-free, settlement in cash Unsecured, no impairment
Rent Expense - -
Orix Metro Leasing and Finance Corporation
Premiums - group life insurance Interest-free, settlement in cash Unsecured, no impairment
Toyota Motor Philippines Corporation
Premiums - group life insurance Interest-free, settlement in cash Unsecured, no impairment
AXA Group Operations SAS
License fees - -
AXA Group Operations
IT Services - -
AXA Group Operations Hong Kong Limited
IT Services - -
Assist and Assistance Concept, Inc.
Service fees - -
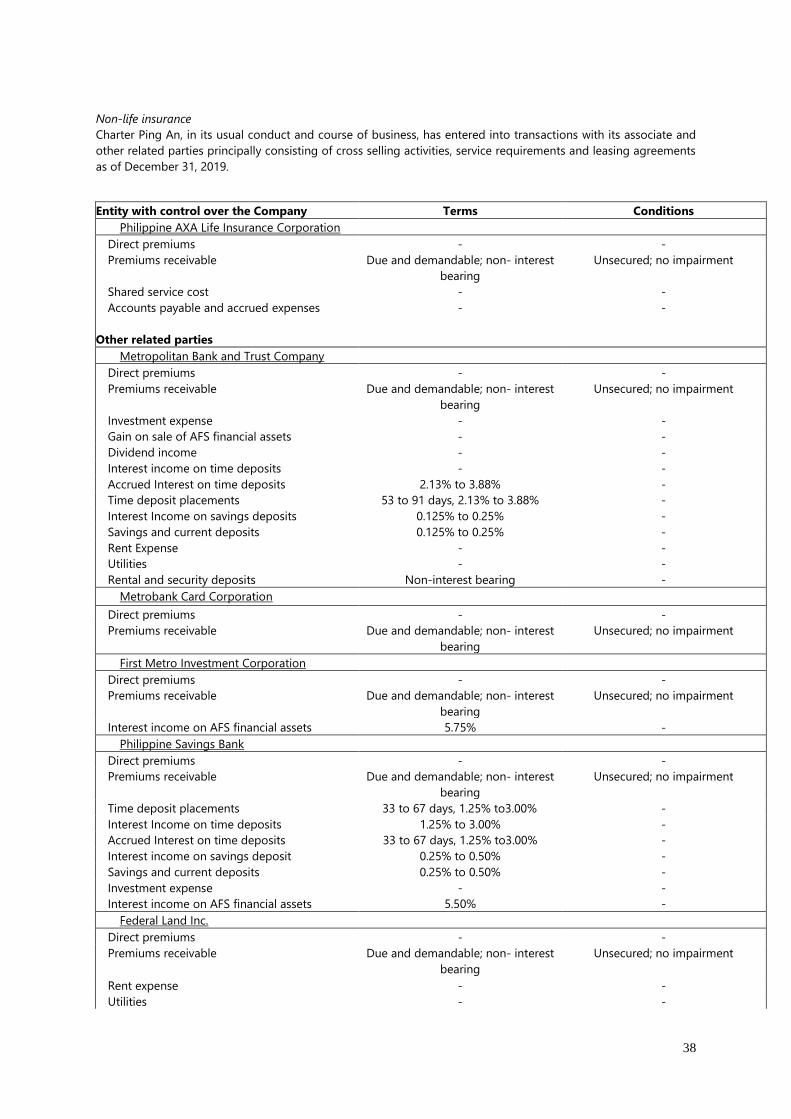
38
Non-life insurance
Charter Ping An, in its usual conduct and course of business, has entered into transactions with its associate and
other related parties principally consisting of cross selling activities, service requirements and leasing agreements
as of December 31, 2019.
Entity with control over the Company Terms Conditions
Philippine AXA Life Insurance Corporation
Direct premiums - -
Premiums receivable Due and demandable; non- interest
bearing
Unsecured; no impairment
Shared service cost - -
Accounts payable and accrued expenses - -
Other related parties
Metropolitan Bank and Trust Company
Direct premiums - -
Premiums receivable Due and demandable; non- interest
bearing
Unsecured; no impairment
Investment expense - -
Gain on sale of AFS financial assets - -
Dividend income - -
Interest income on time deposits - -
Accrued Interest on time deposits 2.13% to 3.88% -
Time deposit placements 53 to 91 days, 2.13% to 3.88% -
Interest Income on savings deposits 0.125% to 0.25% -
Savings and current deposits 0.125% to 0.25% -
Rent Expense - -
Utilities - -
Rental and security deposits Non-interest bearing -
Metrobank Card Corporation
Direct premiums - -
Premiums receivable Due and demandable; non- interest
bearing
Unsecured; no impairment
First Metro Investment Corporation
Direct premiums - -
Premiums receivable Due and demandable; non- interest
bearing
Unsecured; no impairment
Interest income on AFS financial assets 5.75% -
Philippine Savings Bank
Direct premiums - -
Premiums receivable Due and demandable; non- interest
bearing
Unsecured; no impairment
Time deposit placements 33 to 67 days, 1.25% to3.00% -
Interest Income on time deposits 1.25% to 3.00% -
Accrued Interest on time deposits 33 to 67 days, 1.25% to3.00% -
Interest income on savings deposit 0.25% to 0.50% -
Savings and current deposits 0.25% to 0.50% -
Investment expense - -
Interest income on AFS financial assets 5.50% -
Federal Land Inc.
Direct premiums - -
Premiums receivable Due and demandable; non- interest
bearing
Unsecured; no impairment
Rent expense - -
Utilities - -
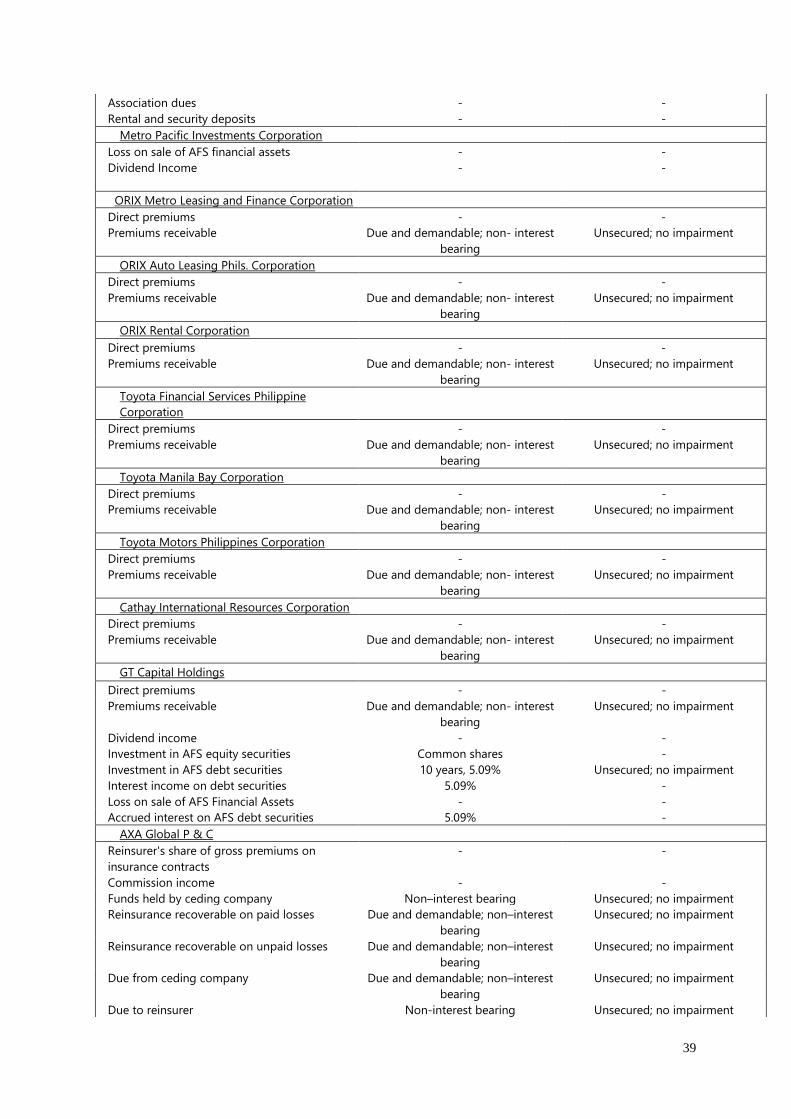
39
Association dues - -
Rental and security deposits - -
Metro Pacific Investments Corporation
Loss on sale of AFS financial assets - -
Dividend Income - -
ORIX Metro Leasing and Finance Corporation
Direct premiums - -
Premiums receivable Due and demandable; non- interest
bearing
Unsecured; no impairment
ORIX Auto Leasing Phils. Corporation
Direct premiums - -
Premiums receivable Due and demandable; non- interest
bearing
Unsecured; no impairment
ORIX Rental Corporation
Direct premiums - -
Premiums receivable Due and demandable; non- interest
bearing
Unsecured; no impairment
Toyota Financial Services Philippine
Corporation
Direct premiums - -
Premiums receivable Due and demandable; non- interest
bearing
Unsecured; no impairment
Toyota Manila Bay Corporation
Direct premiums - -
Premiums receivable Due and demandable; non- interest
bearing
Unsecured; no impairment
Toyota Motors Philippines Corporation
Direct premiums - -
Premiums receivable Due and demandable; non- interest
bearing
Unsecured; no impairment
Cathay International Resources Corporation
Direct premiums - -
Premiums receivable Due and demandable; non- interest
bearing
Unsecured; no impairment
GT Capital Holdings
Direct premiums - -
Premiums receivable Due and demandable; non- interest
bearing
Unsecured; no impairment
Dividend income - -
Investment in AFS equity securities Common shares -
Investment in AFS debt securities 10 years, 5.09% Unsecured; no impairment
Interest income on debt securities 5.09% -
Loss on sale of AFS Financial Assets - -
Accrued interest on AFS debt securities 5.09% -
AXA Global P & C
Reinsurer's share of gross premiums on
insurance contracts
- -
Commission income - -
Funds held by ceding company Non–interest bearing Unsecured; no impairment
Reinsurance recoverable on paid losses Due and demandable; non–interest
bearing
Unsecured; no impairment
Reinsurance recoverable on unpaid losses Due and demandable; non–interest
bearing
Unsecured; no impairment
Due from ceding company Due and demandable; non–interest
bearing
Unsecured; no impairment
Due to reinsurer Non-interest bearing Unsecured; no impairment
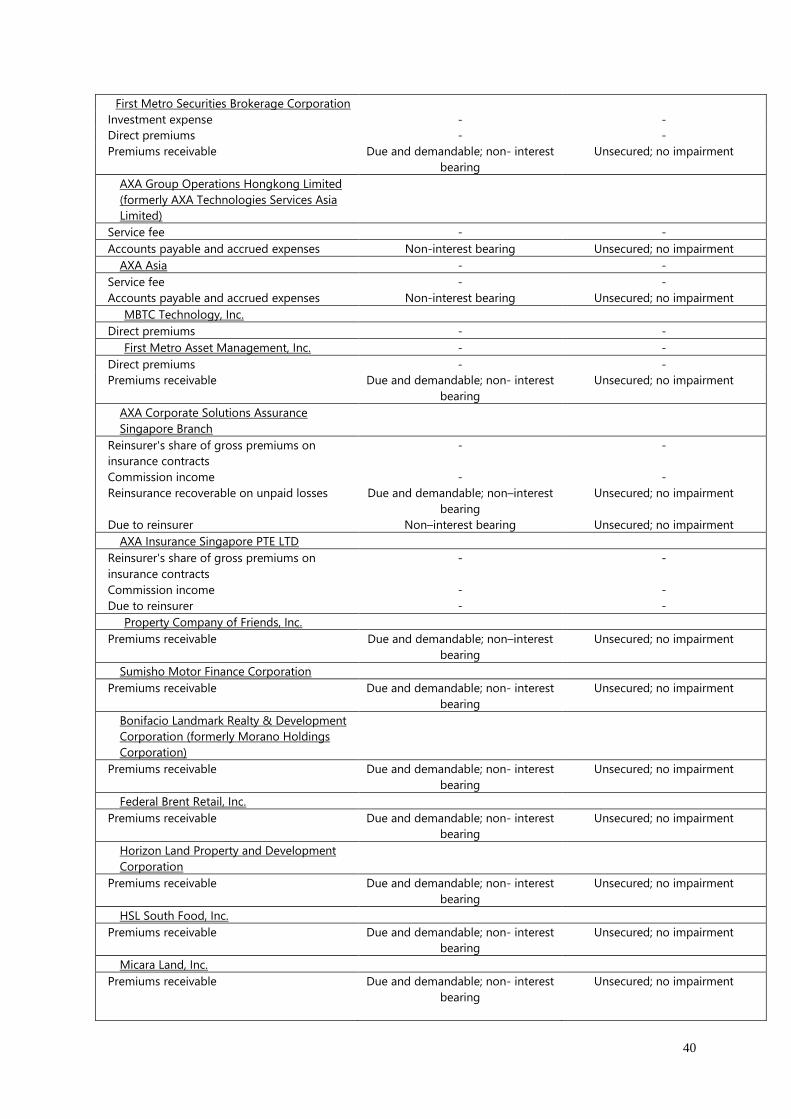
40
First Metro Securities Brokerage Corporation
Investment expense - -
Direct premiums - -
Premiums receivable Due and demandable; non- interest
bearing
Unsecured; no impairment
AXA Group Operations Hongkong Limited
(formerly AXA Technologies Services Asia
Limited)
Service fee - -
Accounts payable and accrued expenses Non-interest bearing Unsecured; no impairment
AXA Asia - -
Service fee - -
Accounts payable and accrued expenses Non-interest bearing Unsecured; no impairment
MBTC Technology, Inc.
Direct premiums - -
First Metro Asset Management, Inc. - -
Direct premiums - -
Premiums receivable Due and demandable; non- interest
bearing
Unsecured; no impairment
AXA Corporate Solutions Assurance
Singapore Branch
Reinsurer's share of gross premiums on
insurance contracts
- -
Commission income - -
Reinsurance recoverable on unpaid losses Due and demandable; non–interest
bearing
Unsecured; no impairment
Due to reinsurer Non–interest bearing Unsecured; no impairment
AXA Insurance Singapore PTE LTD
Reinsurer's share of gross premiums on
insurance contracts
- -
Commission income - -
Due to reinsurer - -
Property Company of Friends, Inc.
Premiums receivable Due and demandable; non–interest
bearing
Unsecured; no impairment
Sumisho Motor Finance Corporation
Premiums receivable Due and demandable; non- interest
bearing
Unsecured; no impairment
Bonifacio Landmark Realty & Development
Corporation (formerly Morano Holdings
Corporation)
Premiums receivable Due and demandable; non- interest
bearing
Unsecured; no impairment
Federal Brent Retail, Inc.
Premiums receivable Due and demandable; non- interest
bearing
Unsecured; no impairment
Horizon Land Property and Development
Corporation
Premiums receivable Due and demandable; non- interest
bearing
Unsecured; no impairment
HSL South Food, Inc.
Premiums receivable Due and demandable; non- interest
bearing
Unsecured; no impairment
Micara Land, Inc.
Premiums receivable Due and demandable; non- interest
bearing
Unsecured; no impairment
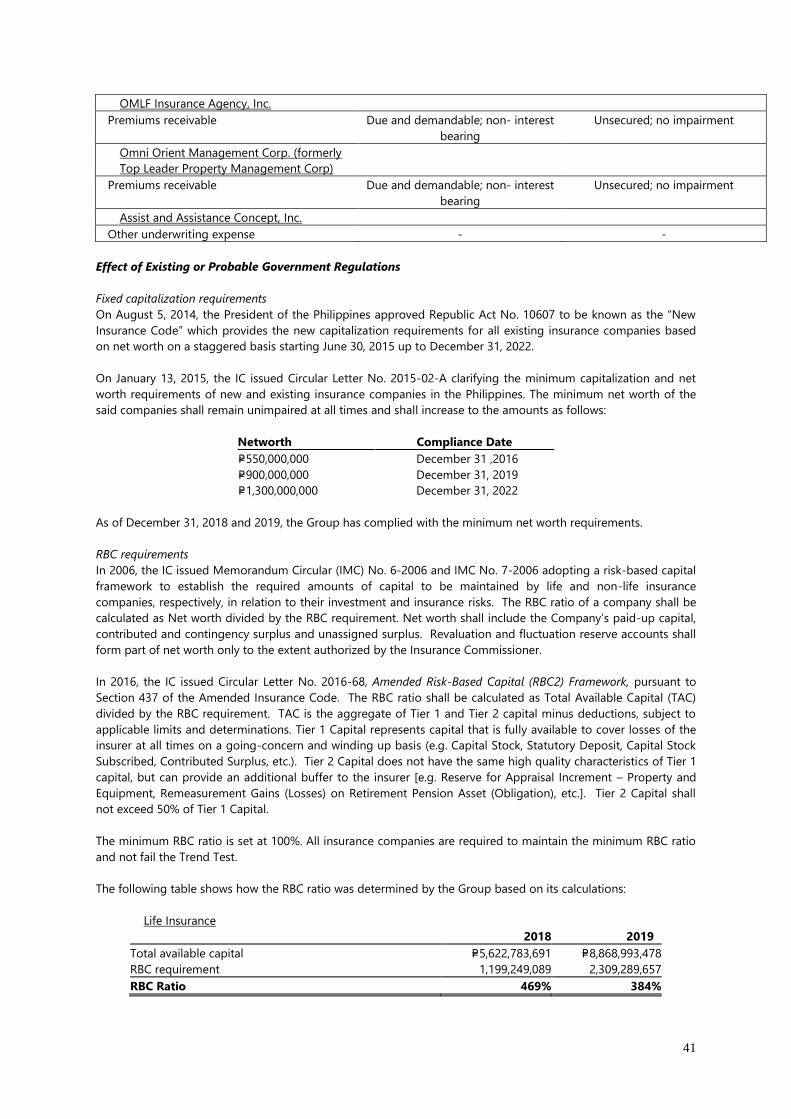
41
Effect of Existing or Probable Government Regulations
Fixed capitalization requirements
On August 5, 2014, the President of the Philippines approved Republic Act No. 10607 to be known as the “New
Insurance Code” which provides the new capitalization requirements for all existing insurance companies based
on net worth on a staggered basis starting June 30, 2015 up to December 31, 2022.
On January 13, 2015, the IC issued Circular Letter No. 2015-02-A clarifying the minimum capitalization and net
worth requirements of new and existing insurance companies in the Philippines. The minimum net worth of the
said companies shall remain unimpaired at all times and shall increase to the amounts as follows:
Networth Compliance Date
P=550,000,000 December 31 ,2016
P=900,000,000 December 31, 2019
P=1,300,000,000 December 31, 2022
As of December 31, 2018 and 2019, the Group has complied with the minimum net worth requirements.
RBC requirements
In 2006, the IC issued Memorandum Circular (IMC) No. 6-2006 and IMC No. 7-2006 adopting a risk-based capital
framework to establish the required amounts of capital to be maintained by life and non-life insurance
companies, respectively, in relation to their investment and insurance risks. The RBC ratio of a company shall be
calculated as Net worth divided by the RBC requirement. Net worth shall include the Company’s paid-up capital,
contributed and contingency surplus and unassigned surplus. Revaluation and fluctuation reserve accounts shall
form part of net worth only to the extent authorized by the Insurance Commissioner.
In 2016, the IC issued Circular Letter No. 2016-68, Amended Risk-Based Capital (RBC2) Framework, pursuant to
Section 437 of the Amended Insurance Code. The RBC ratio shall be calculated as Total Available Capital (TAC)
divided by the RBC requirement. TAC is the aggregate of Tier 1 and Tier 2 capital minus deductions, subject to
applicable limits and determinations. Tier 1 Capital represents capital that is fully available to cover losses of the
insurer at all times on a going-concern and winding up basis (e.g. Capital Stock, Statutory Deposit, Capital Stock
Subscribed, Contributed Surplus, etc.). Tier 2 Capital does not have the same high quality characteristics of Tier 1
capital, but can provide an additional buffer to the insurer [e.g. Reserve for Appraisal Increment – Property and
Equipment, Remeasurement Gains (Losses) on Retirement Pension Asset (Obligation), etc.]. Tier 2 Capital shall
not exceed 50% of Tier 1 Capital.
The minimum RBC ratio is set at 100%. All insurance companies are required to maintain the minimum RBC ratio
and not fail the Trend Test.
The following table shows how the RBC ratio was determined by the Group based on its calculations:
Life Insurance
2018 2019
Total available capital P=5,622,783,691 P=8,868,993,478
RBC requirement 1,199,249,089 2,309,289,657
RBC Ratio 469% 384%
OMLF Insurance Agency, Inc.
Premiums receivable Due and demandable; non- interest
bearing
Unsecured; no impairment
Omni Orient Management Corp. (formerly
Top Leader Property Management Corp)
Premiums receivable Due and demandable; non- interest
bearing
Unsecured; no impairment
Assist and Assistance Concept, Inc.
Other underwriting expense - -
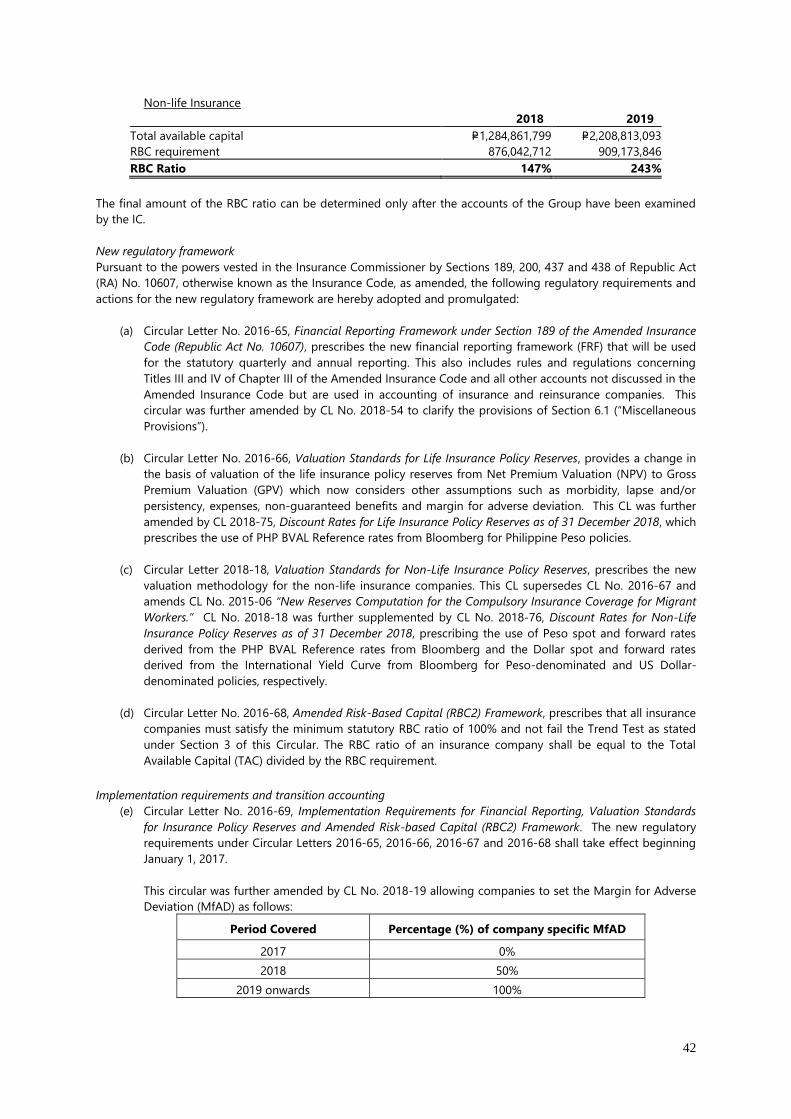
42
Non-life Insurance
2018 2019
Total available capital P=1,284,861,799 P=2,208,813,093
RBC requirement 876,042,712 909,173,846
RBC Ratio 147% 243%
The final amount of the RBC ratio can be determined only after the accounts of the Group have been examined
by the IC.
New regulatory framework
Pursuant to the powers vested in the Insurance Commissioner by Sections 189, 200, 437 and 438 of Republic Act
(RA) No. 10607, otherwise known as the Insurance Code, as amended, the following regulatory requirements and
actions for the new regulatory framework are hereby adopted and promulgated:
(a) Circular Letter No. 2016-65, Financial Reporting Framework under Section 189 of the Amended Insurance
Code (Republic Act No. 10607), prescribes the new financial reporting framework (FRF) that will be used
for the statutory quarterly and annual reporting. This also includes rules and regulations concerning
Titles III and IV of Chapter III of the Amended Insurance Code and all other accounts not discussed in the
Amended Insurance Code but are used in accounting of insurance and reinsurance companies. This
circular was further amended by CL No. 2018-54 to clarify the provisions of Section 6.1 (“Miscellaneous
Provisions”).
(b) Circular Letter No. 2016-66, Valuation Standards for Life Insurance Policy Reserves, provides a change in
the basis of valuation of the life insurance policy reserves from Net Premium Valuation (NPV) to Gross
Premium Valuation (GPV) which now considers other assumptions such as morbidity, lapse and/or
persistency, expenses, non-guaranteed benefits and margin for adverse deviation. This CL was further
amended by CL 2018-75, Discount Rates for Life Insurance Policy Reserves as of 31 December 2018, which
prescribes the use of PHP BVAL Reference rates from Bloomberg for Philippine Peso policies.
(c) Circular Letter 2018-18, Valuation Standards for Non-Life Insurance Policy Reserves, prescribes the new
valuation methodology for the non-life insurance companies. This CL supersedes CL No. 2016-67 and
amends CL No. 2015-06 “New Reserves Computation for the Compulsory Insurance Coverage for Migrant
Workers.” CL No. 2018-18 was further supplemented by CL No. 2018-76, Discount Rates for Non-Life
Insurance Policy Reserves as of 31 December 2018, prescribing the use of Peso spot and forward rates
derived from the PHP BVAL Reference rates from Bloomberg and the Dollar spot and forward rates
derived from the International Yield Curve from Bloomberg for Peso-denominated and US Dollar-
denominated policies, respectively.
(d) Circular Letter No. 2016-68, Amended Risk-Based Capital (RBC2) Framework, prescribes that all insurance
companies must satisfy the minimum statutory RBC ratio of 100% and not fail the Trend Test as stated
under Section 3 of this Circular. The RBC ratio of an insurance company shall be equal to the Total
Available Capital (TAC) divided by the RBC requirement.
Implementation requirements and transition accounting
(e) Circular Letter No. 2016-69, Implementation Requirements for Financial Reporting, Valuation Standards
for Insurance Policy Reserves and Amended Risk-based Capital (RBC2) Framework. The new regulatory
requirements under Circular Letters 2016-65, 2016-66, 2016-67 and 2016-68 shall take effect beginning
January 1, 2017.
This circular was further amended by CL No. 2018-19 allowing companies to set the Margin for Adverse
Deviation (MfAD) as follows:
Period Covered Percentage (%) of company specific MfAD
2017 0%
2018 50%
2019 onwards 100%
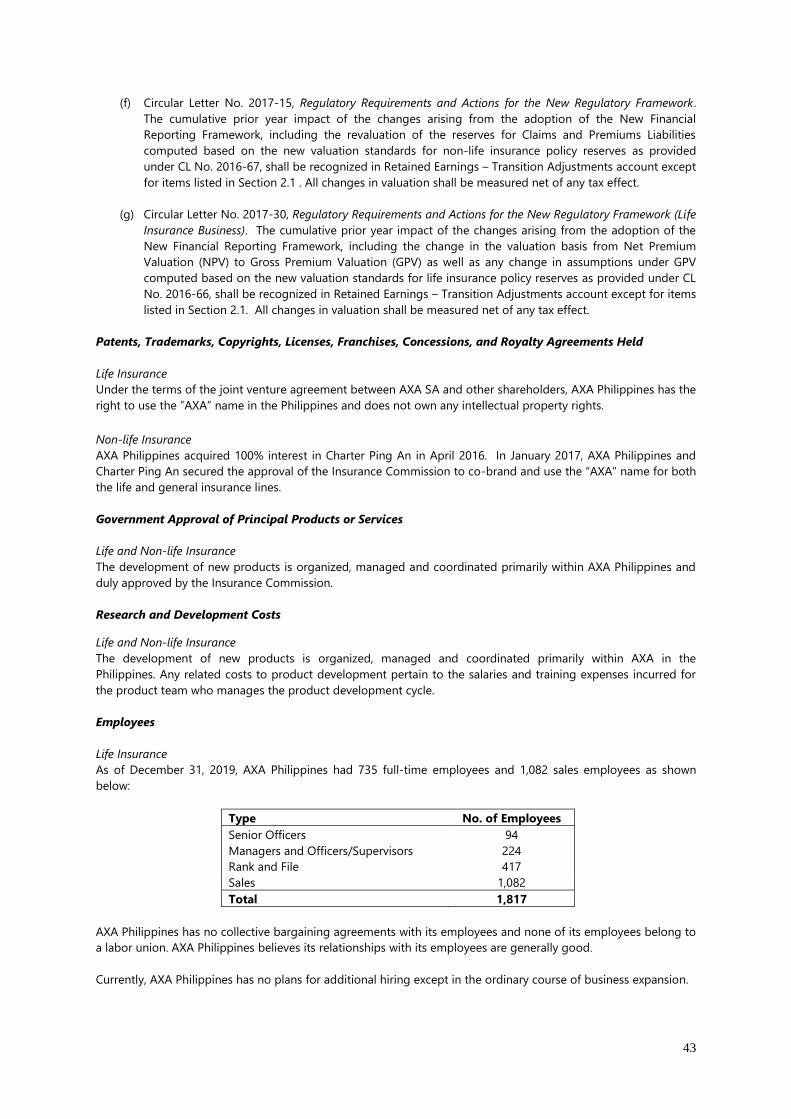
43
(f) Circular Letter No. 2017-15, Regulatory Requirements and Actions for the New Regulatory Framework.
The cumulative prior year impact of the changes arising from the adoption of the New Financial
Reporting Framework, including the revaluation of the reserves for Claims and Premiums Liabilities
computed based on the new valuation standards for non-life insurance policy reserves as provided
under CL No. 2016-67, shall be recognized in Retained Earnings – Transition Adjustments account except
for items listed in Section 2.1 . All changes in valuation shall be measured net of any tax effect.
(g) Circular Letter No. 2017-30, Regulatory Requirements and Actions for the New Regulatory Framework (Life
Insurance Business). The cumulative prior year impact of the changes arising from the adoption of the
New Financial Reporting Framework, including the change in the valuation basis from Net Premium
Valuation (NPV) to Gross Premium Valuation (GPV) as well as any change in assumptions under GPV
computed based on the new valuation standards for life insurance policy reserves as provided under CL
No. 2016-66, shall be recognized in Retained Earnings – Transition Adjustments account except for items
listed in Section 2.1. All changes in valuation shall be measured net of any tax effect.
Patents, Trademarks, Copyrights, Licenses, Franchises, Concessions, and Royalty Agreements Held
Life Insurance
Under the terms of the joint venture agreement between AXA SA and other shareholders, AXA Philippines has the
right to use the ”AXA” name in the Philippines and does not own any intellectual property rights.
Non-life Insurance
AXA Philippines acquired 100% interest in Charter Ping An in April 2016. In January 2017, AXA Philippines and
Charter Ping An secured the approval of the Insurance Commission to co-brand and use the “AXA” name for both
the life and general insurance lines.
Government Approval of Principal Products or Services
Life and Non-life Insurance
The development of new products is organized, managed and coordinated primarily within AXA Philippines and
duly approved by the Insurance Commission.
Research and Development Costs
Life and Non-life Insurance
The development of new products is organized, managed and coordinated primarily within AXA in the
Philippines. Any related costs to product development pertain to the salaries and training expenses incurred for
the product team who manages the product development cycle.
Employees
Life Insurance
As of December 31, 2019, AXA Philippines had 735 full-time employees and 1,082 sales employees as shown
below:
Type No. of Employees
Senior Officers 94
Managers and Officers/Supervisors 224
Rank and File 417
Sales 1,082
Total 1,817
AXA Philippines has no collective bargaining agreements with its employees and none of its employees belong to
a labor union. AXA Philippines believes its relationships with its employees are generally good.
Currently, AXA Philippines has no plans for additional hiring except in the ordinary course of business expansion.
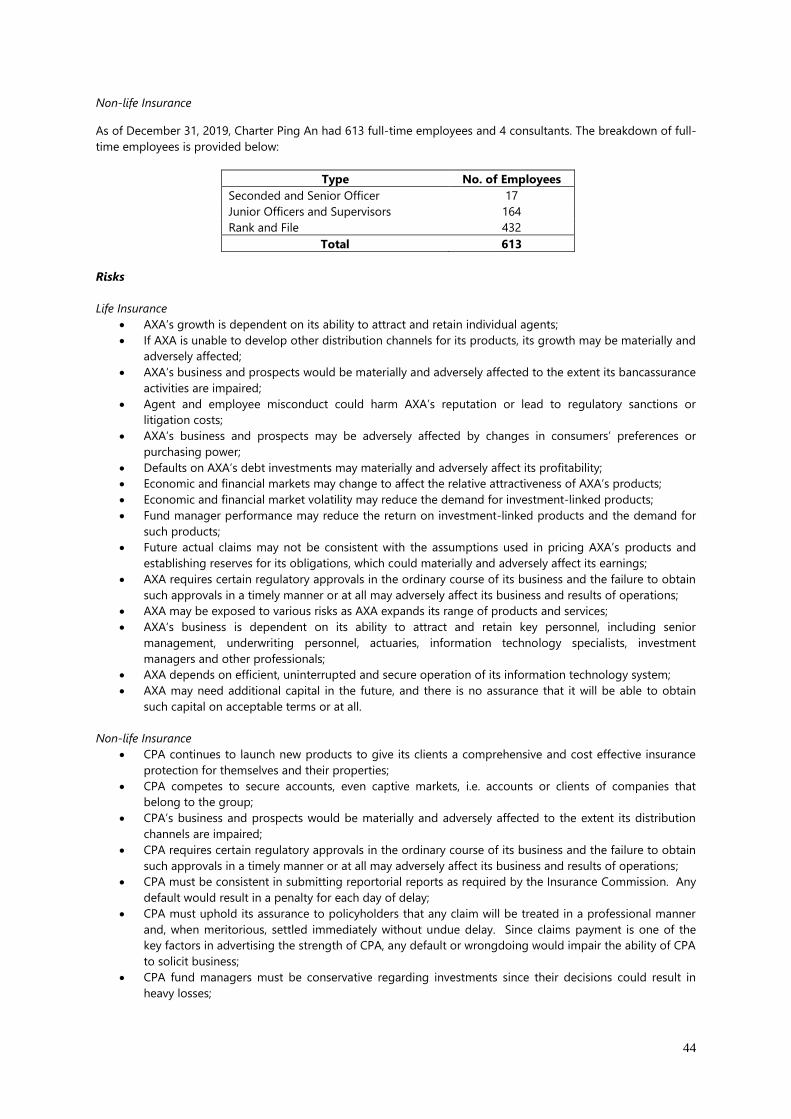
44
Non-life Insurance
As of December 31, 2019, Charter Ping An had 613 full-time employees and 4 consultants. The breakdown of full-
time employees is provided below:
Type No. of Employees
Seconded and Senior Officer 17
Junior Officers and Supervisors 164
Rank and File 432
Total 613
Risks
Life Insurance
• AXA’s growth is dependent on its ability to attract and retain individual agents;
• If AXA is unable to develop other distribution channels for its products, its growth may be materially and
adversely affected;
• AXA’s business and prospects would be materially and adversely affected to the extent its bancassurance
activities are impaired;
• Agent and employee misconduct could harm AXA’s reputation or lead to regulatory sanctions or
litigation costs;
• AXA’s business and prospects may be adversely affected by changes in consumers’ preferences or
purchasing power;
• Defaults on AXA’s debt investments may materially and adversely affect its profitability;
• Economic and financial markets may change to affect the relative attractiveness of AXA’s products;
• Economic and financial market volatility may reduce the demand for investment-linked products;
• Fund manager performance may reduce the return on investment-linked products and the demand for
such products;
• Future actual claims may not be consistent with the assumptions used in pricing AXA’s products and
establishing reserves for its obligations, which could materially and adversely affect its earnings;
• AXA requires certain regulatory approvals in the ordinary course of its business and the failure to obtain
such approvals in a timely manner or at all may adversely affect its business and results of operations;
• AXA may be exposed to various risks as AXA expands its range of products and services;
• AXA’s business is dependent on its ability to attract and retain key personnel, including senior
management, underwriting personnel, actuaries, information technology specialists, investment
managers and other professionals;
• AXA depends on efficient, uninterrupted and secure operation of its information technology system;
• AXA may need additional capital in the future, and there is no assurance that it will be able to obtain
such capital on acceptable terms or at all.
Non-life Insurance
• CPA continues to launch new products to give its clients a comprehensive and cost effective insurance
protection for themselves and their properties;
• CPA competes to secure accounts, even captive markets, i.e. accounts or clients of companies that
belong to the group;
• CPA’s business and prospects would be materially and adversely affected to the extent its distribution
channels are impaired;
• CPA requires certain regulatory approvals in the ordinary course of its business and the failure to obtain
such approvals in a timely manner or at all may adversely affect its business and results of operations;
• CPA must be consistent in submitting reportorial reports as required by the Insurance Commission. Any
default would result in a penalty for each day of delay;
• CPA must uphold its assurance to policyholders that any claim will be treated in a professional manner
and, when meritorious, settled immediately without undue delay. Since claims payment is one of the
key factors in advertising the strength of CPA, any default or wrongdoing would impair the ability of CPA
to solicit business;
• CPA fund managers must be conservative regarding investments since their decisions could result in
heavy losses;
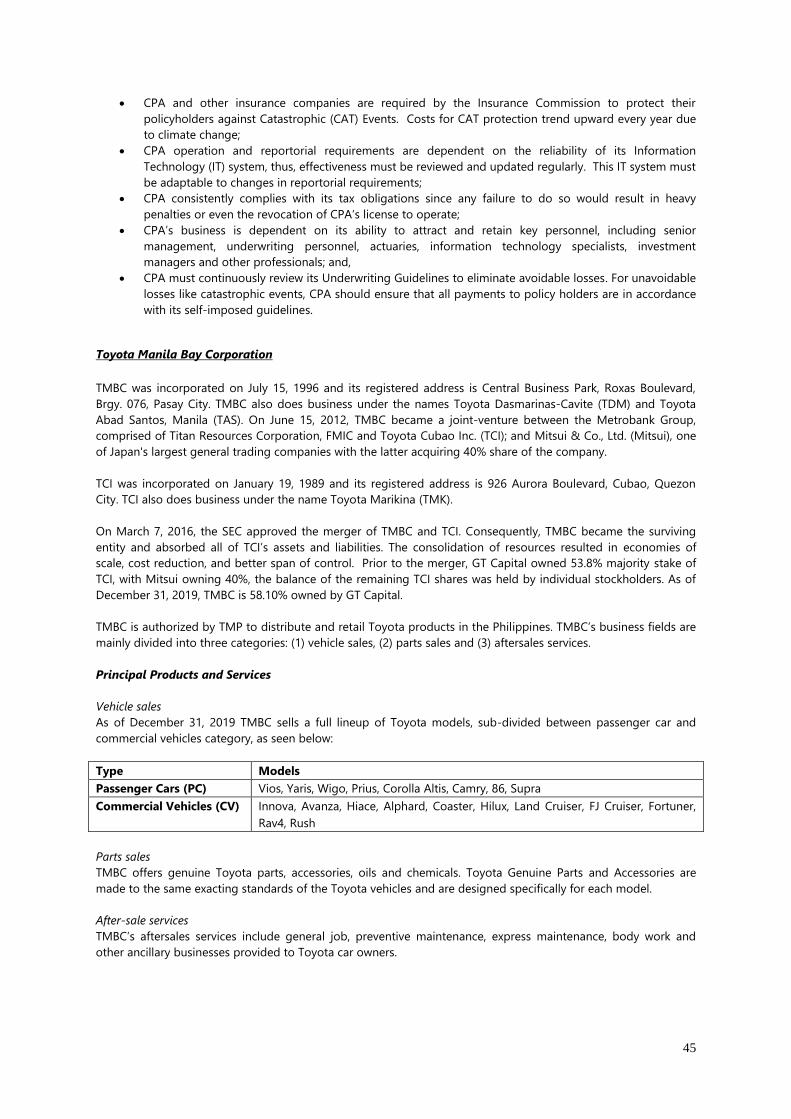
45
• CPA and other insurance companies are required by the Insurance Commission to protect their
policyholders against Catastrophic (CAT) Events. Costs for CAT protection trend upward every year due
to climate change;
• CPA operation and reportorial requirements are dependent on the reliability of its Information
Technology (IT) system, thus, effectiveness must be reviewed and updated regularly. This IT system must
be adaptable to changes in reportorial requirements;
• CPA consistently complies with its tax obligations since any failure to do so would result in heavy
penalties or even the revocation of CPA’s license to operate;
• CPA’s business is dependent on its ability to attract and retain key personnel, including senior
management, underwriting personnel, actuaries, information technology specialists, investment
managers and other professionals; and,
• CPA must continuously review its Underwriting Guidelines to eliminate avoidable losses. For unavoidable
losses like catastrophic events, CPA should ensure that all payments to policy holders are in accordance
with its self-imposed guidelines.
Toyota Manila Bay Corporation
TMBC was incorporated on July 15, 1996 and its registered address is Central Business Park, Roxas Boulevard,
Brgy. 076, Pasay City. TMBC also does business under the names Toyota Dasmarinas-Cavite (TDM) and Toyota
Abad Santos, Manila (TAS). On June 15, 2012, TMBC became a joint-venture between the Metrobank Group,
comprised of Titan Resources Corporation, FMIC and Toyota Cubao Inc. (TCI); and Mitsui & Co., Ltd. (Mitsui), one
of Japan's largest general trading companies with the latter acquiring 40% share of the company.
TCI was incorporated on January 19, 1989 and its registered address is 926 Aurora Boulevard, Cubao, Quezon
City. TCI also does business under the name Toyota Marikina (TMK).
On March 7, 2016, the SEC approved the merger of TMBC and TCI. Consequently, TMBC became the surviving
entity and absorbed all of TCI’s assets and liabilities. The consolidation of resources resulted in economies of
scale, cost reduction, and better span of control. Prior to the merger, GT Capital owned 53.8% majority stake of
TCI, with Mitsui owning 40%, the balance of the remaining TCI shares was held by individual stockholders. As of
December 31, 2019, TMBC is 58.10% owned by GT Capital.
TMBC is authorized by TMP to distribute and retail Toyota products in the Philippines. TMBC’s business fields are
mainly divided into three categories: (1) vehicle sales, (2) parts sales and (3) aftersales services.
Principal Products and Services
Vehicle sales
As of December 31, 2019 TMBC sells a full lineup of Toyota models, sub-divided between passenger car and
commercial vehicles category, as seen below:
Type Models
Passenger Cars (PC) Vios, Yaris, Wigo, Prius, Corolla Altis, Camry, 86, Supra
Commercial Vehicles (CV) Innova, Avanza, Hiace, Alphard, Coaster, Hilux, Land Cruiser, FJ Cruiser, Fortuner,
Rav4, Rush
Parts sales
TMBC offers genuine Toyota parts, accessories, oils and chemicals. Toyota Genuine Parts and Accessories are
made to the same exacting standards of the Toyota vehicles and are designed specifically for each model.
After-sale services
TMBC’s aftersales services include general job, preventive maintenance, express maintenance, body work and
other ancillary businesses provided to Toyota car owners.
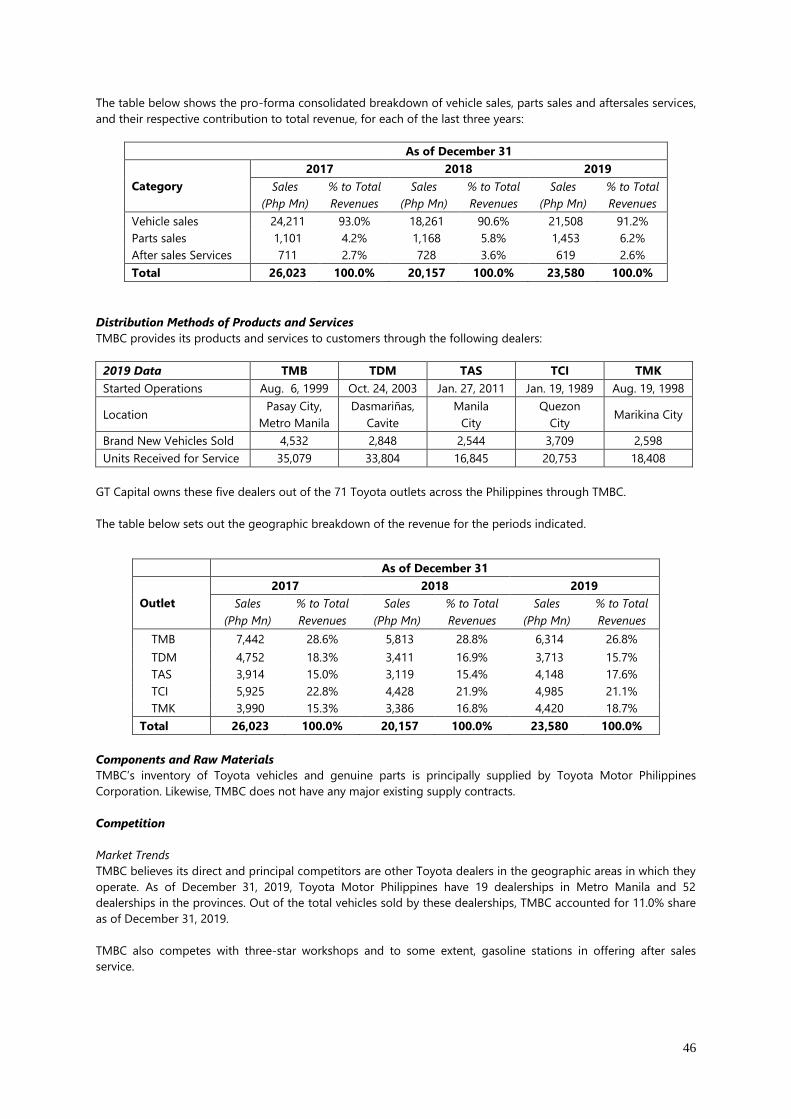
46
The table below shows the pro-forma consolidated breakdown of vehicle sales, parts sales and aftersales services,
and their respective contribution to total revenue, for each of the last three years:
As of December 31
Category
2017 2018 2019
Sales
(Php Mn)
% to Total
Revenues
Sales
(Php Mn)
% to Total
Revenues
Sales
(Php Mn)
% to Total
Revenues
Vehicle sales 24,211 93.0% 18,261 90.6% 21,508 91.2%
Parts sales 1,101 4.2% 1,168 5.8% 1,453 6.2%
After sales Services 711 2.7% 728 3.6% 619 2.6%
Total 26,023 100.0% 20,157 100.0% 23,580 100.0%
Distribution Methods of Products and Services
TMBC provides its products and services to customers through the following dealers:
2019 Data TMB TDM TAS TCI TMK
Started Operations Aug. 6, 1999 Oct. 24, 2003 Jan. 27, 2011 Jan. 19, 1989 Aug. 19, 1998
Location Pasay City,
Metro Manila
Dasmariñas,
Cavite
Manila
City
Quezon
City Marikina City
Brand New Vehicles Sold 4,532 2,848 2,544 3,709 2,598
Units Received for Service 35,079 33,804 16,845 20,753 18,408
GT Capital owns these five dealers out of the 71 Toyota outlets across the Philippines through TMBC.
The table below sets out the geographic breakdown of the revenue for the periods indicated.
As of December 31
Outlet
2017 2018 2019
Sales
(Php Mn)
% to Total
Revenues
Sales
(Php Mn)
% to Total
Revenues
Sales
(Php Mn)
% to Total
Revenues
TMB 7,442 28.6% 5,813 28.8% 6,314 26.8%
TDM 4,752 18.3% 3,411 16.9% 3,713 15.7%
TAS 3,914 15.0% 3,119 15.4% 4,148 17.6%
TCI 5,925 22.8% 4,428 21.9% 4,985 21.1%
TMK 3,990 15.3% 3,386 16.8% 4,420 18.7%
Total 26,023 100.0% 20,157 100.0% 23,580 100.0%
Components and Raw Materials
TMBC’s inventory of Toyota vehicles and genuine parts is principally supplied by Toyota Motor Philippines
Corporation. Likewise, TMBC does not have any major existing supply contracts.
Competition
Market Trends
TMBC believes its direct and principal competitors are other Toyota dealers in the geographic areas in which they
operate. As of December 31, 2019, Toyota Motor Philippines have 19 dealerships in Metro Manila and 52
dealerships in the provinces. Out of the total vehicles sold by these dealerships, TMBC accounted for 11.0% share
as of December 31, 2019.
TMBC also competes with three-star workshops and to some extent, gasoline stations in offering after sales
service.
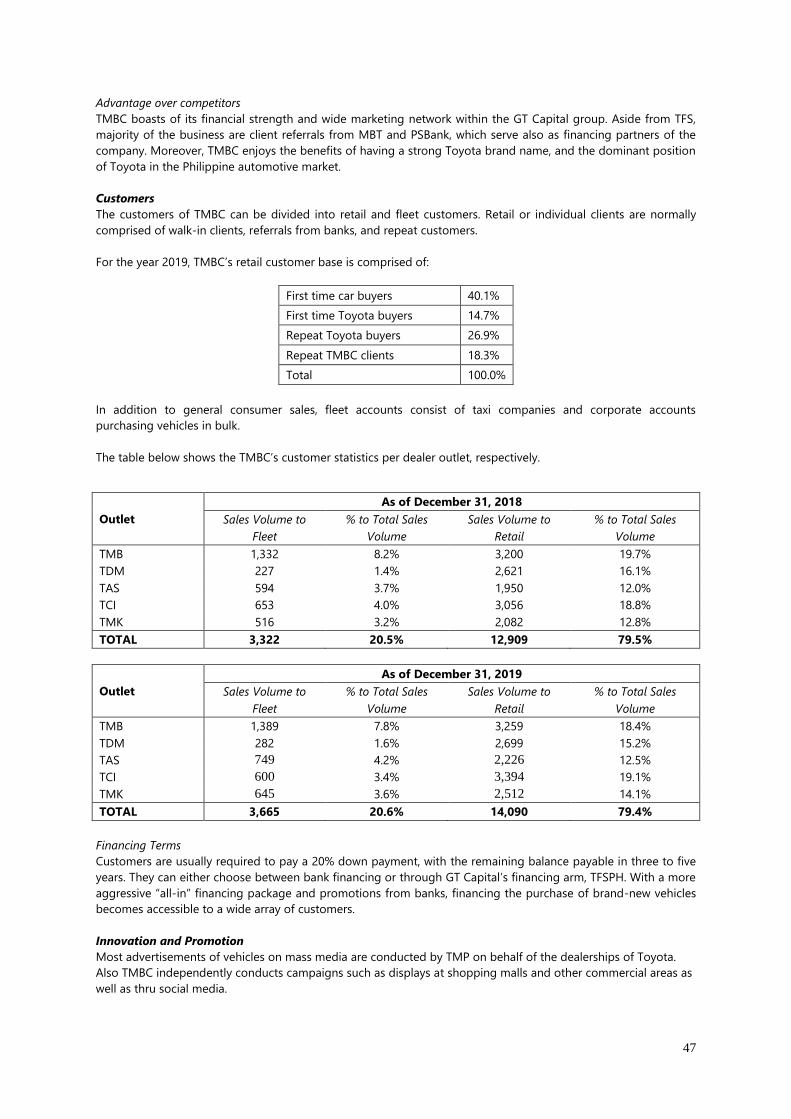
47
Advantage over competitors
TMBC boasts of its financial strength and wide marketing network within the GT Capital group. Aside from TFS,
majority of the business are client referrals from MBT and PSBank, which serve also as financing partners of the
company. Moreover, TMBC enjoys the benefits of having a strong Toyota brand name, and the dominant position
of Toyota in the Philippine automotive market.
Customers
The customers of TMBC can be divided into retail and fleet customers. Retail or individual clients are normally
comprised of walk-in clients, referrals from banks, and repeat customers.
For the year 2019, TMBC’s retail customer base is comprised of:
First time car buyers 40.1%
First time Toyota buyers 14.7%
Repeat Toyota buyers 26.9%
Repeat TMBC clients 18.3%
Total 100.0%
In addition to general consumer sales, fleet accounts consist of taxi companies and corporate accounts
purchasing vehicles in bulk.
The table below shows the TMBC’s customer statistics per dealer outlet, respectively.
Outlet
As of December 31, 2018
Sales Volume to
Fleet
% to Total Sales
Volume
Sales Volume to
Retail
% to Total Sales
Volume
TMB 1,332 8.2% 3,200 19.7%
TDM 227 1.4% 2,621 16.1%
TAS 594 3.7% 1,950 12.0%
TCI 653 4.0% 3,056 18.8%
TMK 516 3.2% 2,082 12.8%
TOTAL 3,322 20.5% 12,909 79.5%
Outlet
As of December 31, 2019
Sales Volume to
Fleet
% to Total Sales
Volume
Sales Volume to
Retail
% to Total Sales
Volume
TMB 1,389 7.8% 3,259 18.4%
TDM 282 1.6% 2,699 15.2%
TAS 749 4.2% 2,226 12.5%
TCI 600 3.4% 3,394 19.1%
TMK 645 3.6% 2,512 14.1%
TOTAL 3,665 20.6% 14,090 79.4%
Financing Terms
Customers are usually required to pay a 20% down payment, with the remaining balance payable in three to five
years. They can either choose between bank financing or through GT Capital’s financing arm, TFSPH. With a more
aggressive “all-in” financing package and promotions from banks, financing the purchase of brand-new vehicles
becomes accessible to a wide array of customers.
Innovation and Promotion
Most advertisements of vehicles on mass media are conducted by TMP on behalf of the dealerships of Toyota.
Also TMBC independently conducts campaigns such as displays at shopping malls and other commercial areas as
well as thru social media.
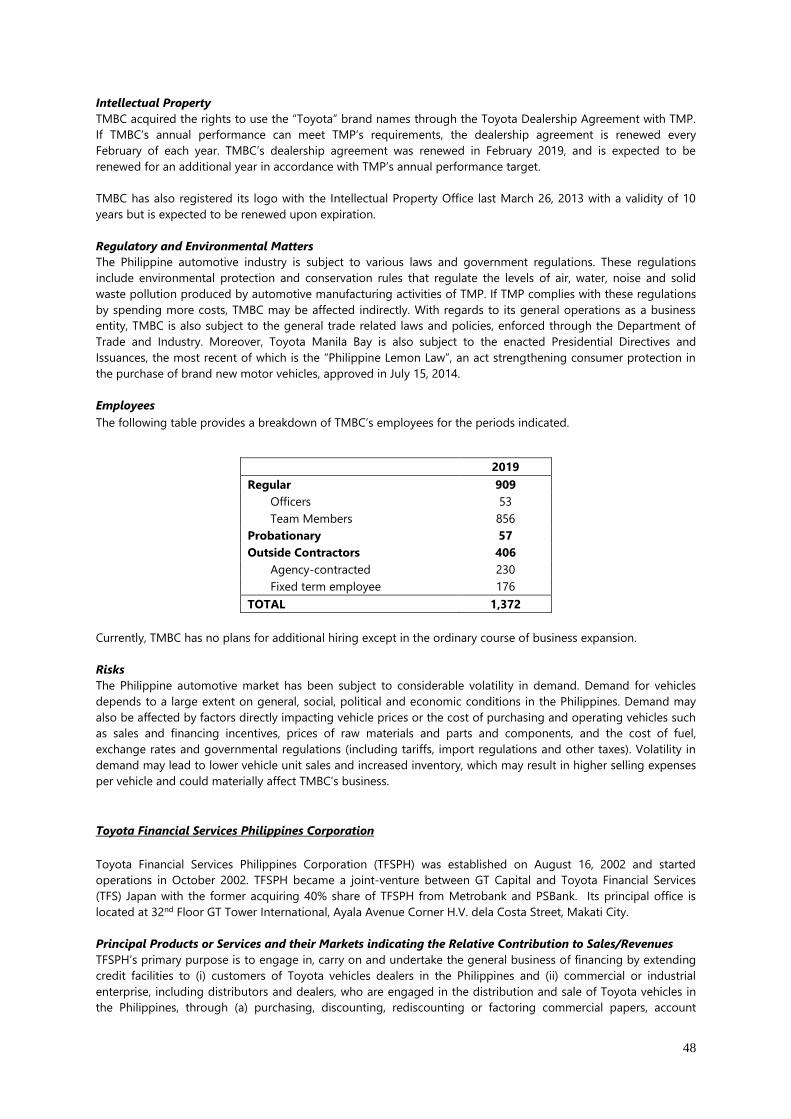
48
Intellectual Property
TMBC acquired the rights to use the “Toyota” brand names through the Toyota Dealership Agreement with TMP.
If TMBC’s annual performance can meet TMP’s requirements, the dealership agreement is renewed every
February of each year. TMBC’s dealership agreement was renewed in February 2019, and is expected to be
renewed for an additional year in accordance with TMP’s annual performance target.
TMBC has also registered its logo with the Intellectual Property Office last March 26, 2013 with a validity of 10
years but is expected to be renewed upon expiration.
Regulatory and Environmental Matters
The Philippine automotive industry is subject to various laws and government regulations. These regulations
include environmental protection and conservation rules that regulate the levels of air, water, noise and solid
waste pollution produced by automotive manufacturing activities of TMP. If TMP complies with these regulations
by spending more costs, TMBC may be affected indirectly. With regards to its general operations as a business
entity, TMBC is also subject to the general trade related laws and policies, enforced through the Department of
Trade and Industry. Moreover, Toyota Manila Bay is also subject to the enacted Presidential Directives and
Issuances, the most recent of which is the “Philippine Lemon Law”, an act strengthening consumer protection in
the purchase of brand new motor vehicles, approved in July 15, 2014.
Employees
The following table provides a breakdown of TMBC’s employees for the periods indicated.
2019
Regular 909
Officers 53
Team Members 856
Probationary 57
Outside Contractors 406
Agency-contracted 230
Fixed term employee 176
TOTAL 1,372
Currently, TMBC has no plans for additional hiring except in the ordinary course of business expansion.
Risks
The Philippine automotive market has been subject to considerable volatility in demand. Demand for vehicles
depends to a large extent on general, social, political and economic conditions in the Philippines. Demand may
also be affected by factors directly impacting vehicle prices or the cost of purchasing and operating vehicles such
as sales and financing incentives, prices of raw materials and parts and components, and the cost of fuel,
exchange rates and governmental regulations (including tariffs, import regulations and other taxes). Volatility in
demand may lead to lower vehicle unit sales and increased inventory, which may result in higher selling expenses
per vehicle and could materially affect TMBC’s business.
Toyota Financial Services Philippines Corporation
Toyota Financial Services Philippines Corporation (TFSPH) was established on August 16, 2002 and started
operations in October 2002. TFSPH became a joint-venture between GT Capital and Toyota Financial Services
(TFS) Japan with the former acquiring 40% share of TFSPH from Metrobank and PSBank. Its principal office is
located at 32nd Floor GT Tower International, Ayala Avenue Corner H.V. dela Costa Street, Makati City.
Principal Products or Services and their Markets indicating the Relative Contribution to Sales/Revenues
TFSPH’s primary purpose is to engage in, carry on and undertake the general business of financing by extending
credit facilities to (i) customers of Toyota vehicles dealers in the Philippines and (ii) commercial or industrial
enterprise, including distributors and dealers, who are engaged in the distribution and sale of Toyota vehicles in
the Philippines, through (a) purchasing, discounting, rediscounting or factoring commercial papers, account
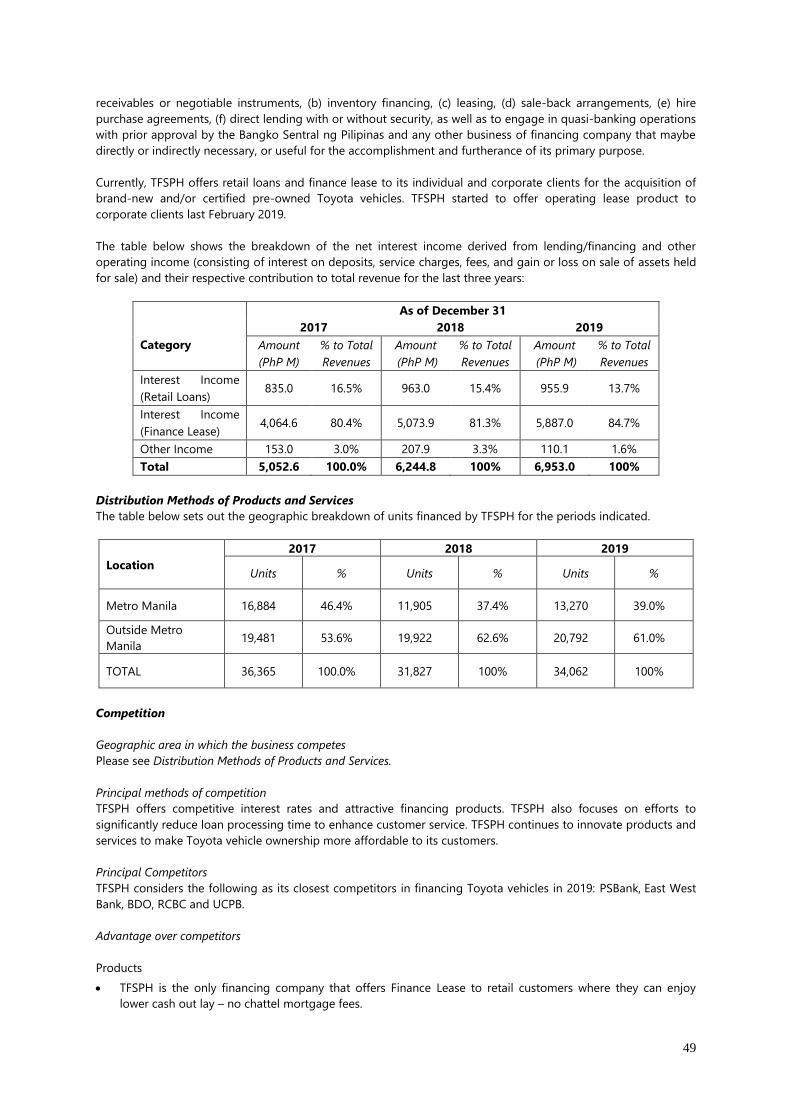
49
receivables or negotiable instruments, (b) inventory financing, (c) leasing, (d) sale-back arrangements, (e) hire
purchase agreements, (f) direct lending with or without security, as well as to engage in quasi-banking operations
with prior approval by the Bangko Sentral ng Pilipinas and any other business of financing company that maybe
directly or indirectly necessary, or useful for the accomplishment and furtherance of its primary purpose.
Currently, TFSPH offers retail loans and finance lease to its individual and corporate clients for the acquisition of
brand-new and/or certified pre-owned Toyota vehicles. TFSPH started to offer operating lease product to
corporate clients last February 2019.
The table below shows the breakdown of the net interest income derived from lending/financing and other
operating income (consisting of interest on deposits, service charges, fees, and gain or loss on sale of assets held
for sale) and their respective contribution to total revenue for the last three years:
As of December 31
Category
2017 2018 2019
Amount
(PhP M)
% to Total
Revenues
Amount
(PhP M)
% to Total
Revenues
Amount
(PhP M)
% to Total
Revenues
Interest Income
(Retail Loans) 835.0 16.5% 963.0 15.4% 955.9 13.7%
Interest Income
(Finance Lease) 4,064.6 80.4% 5,073.9 81.3% 5,887.0 84.7%
Other Income 153.0 3.0% 207.9 3.3% 110.1 1.6%
Total 5,052.6 100.0% 6,244.8 100% 6,953.0 100%
Distribution Methods of Products and Services
The table below sets out the geographic breakdown of units financed by TFSPH for the periods indicated.
Location
2017 2018 2019
Units % Units % Units %
Metro Manila 16,884 46.4% 11,905 37.4% 13,270 39.0%
Outside Metro
Manila 19,481 53.6% 19,922 62.6% 20,792 61.0%
TOTAL 36,365 100.0% 31,827 100% 34,062 100%
Competition
Geographic area in which the business competes
Please see Distribution Methods of Products and Services.
Principal methods of competition
TFSPH offers competitive interest rates and attractive financing products. TFSPH also focuses on efforts to
significantly reduce loan processing time to enhance customer service. TFSPH continues to innovate products and
services to make Toyota vehicle ownership more affordable to its customers.
Principal Competitors
TFSPH considers the following as its closest competitors in financing Toyota vehicles in 2019: PSBank, East West
Bank, BDO, RCBC and UCPB.
Advantage over competitors
Products
• TFSPH is the only financing company that offers Finance Lease to retail customers where they can enjoy
lower cash out lay – no chattel mortgage fees.
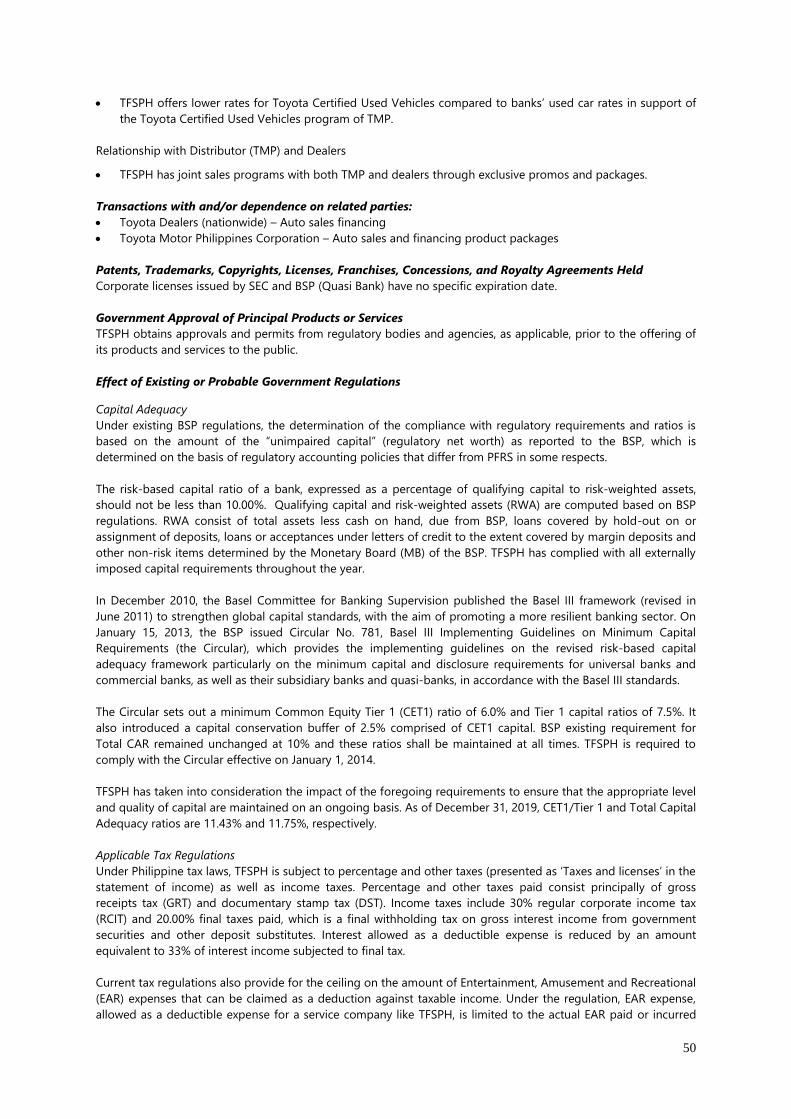
50
• TFSPH offers lower rates for Toyota Certified Used Vehicles compared to banks’ used car rates in support of
the Toyota Certified Used Vehicles program of TMP.
Relationship with Distributor (TMP) and Dealers
• TFSPH has joint sales programs with both TMP and dealers through exclusive promos and packages.
Transactions with and/or dependence on related parties:
• Toyota Dealers (nationwide) – Auto sales financing
• Toyota Motor Philippines Corporation – Auto sales and financing product packages
Patents, Trademarks, Copyrights, Licenses, Franchises, Concessions, and Royalty Agreements Held
Corporate licenses issued by SEC and BSP (Quasi Bank) have no specific expiration date.
Government Approval of Principal Products or Services
TFSPH obtains approvals and permits from regulatory bodies and agencies, as applicable, prior to the offering of
its products and services to the public.
Effect of Existing or Probable Government Regulations
Capital Adequacy
Under existing BSP regulations, the determination of the compliance with regulatory requirements and ratios is
based on the amount of the “unimpaired capital” (regulatory net worth) as reported to the BSP, which is
determined on the basis of regulatory accounting policies that differ from PFRS in some respects.
The risk-based capital ratio of a bank, expressed as a percentage of qualifying capital to risk-weighted assets,
should not be less than 10.00%. Qualifying capital and risk-weighted assets (RWA) are computed based on BSP
regulations. RWA consist of total assets less cash on hand, due from BSP, loans covered by hold-out on or
assignment of deposits, loans or acceptances under letters of credit to the extent covered by margin deposits and
other non-risk items determined by the Monetary Board (MB) of the BSP. TFSPH has complied with all externally
imposed capital requirements throughout the year.
In December 2010, the Basel Committee for Banking Supervision published the Basel III framework (revised in
June 2011) to strengthen global capital standards, with the aim of promoting a more resilient banking sector. On
January 15, 2013, the BSP issued Circular No. 781, Basel III Implementing Guidelines on Minimum Capital
Requirements (the Circular), which provides the implementing guidelines on the revised risk-based capital
adequacy framework particularly on the minimum capital and disclosure requirements for universal banks and
commercial banks, as well as their subsidiary banks and quasi-banks, in accordance with the Basel III standards.
The Circular sets out a minimum Common Equity Tier 1 (CET1) ratio of 6.0% and Tier 1 capital ratios of 7.5%. It
also introduced a capital conservation buffer of 2.5% comprised of CET1 capital. BSP existing requirement for
Total CAR remained unchanged at 10% and these ratios shall be maintained at all times. TFSPH is required to
comply with the Circular effective on January 1, 2014.
TFSPH has taken into consideration the impact of the foregoing requirements to ensure that the appropriate level
and quality of capital are maintained on an ongoing basis. As of December 31, 2019, CET1/Tier 1 and Total Capital
Adequacy ratios are 11.43% and 11.75%, respectively.
Applicable Tax Regulations
Under Philippine tax laws, TFSPH is subject to percentage and other taxes (presented as ‘Taxes and licenses’ in the
statement of income) as well as income taxes. Percentage and other taxes paid consist principally of gross
receipts tax (GRT) and documentary stamp tax (DST). Income taxes include 30% regular corporate income tax
(RCIT) and 20.00% final taxes paid, which is a final withholding tax on gross interest income from government
securities and other deposit substitutes. Interest allowed as a deductible expense is reduced by an amount
equivalent to 33% of interest income subjected to final tax.
Current tax regulations also provide for the ceiling on the amount of Entertainment, Amusement and Recreational
(EAR) expenses that can be claimed as a deduction against taxable income. Under the regulation, EAR expense,
allowed as a deductible expense for a service company like TFSPH, is limited to the actual EAR paid or incurred
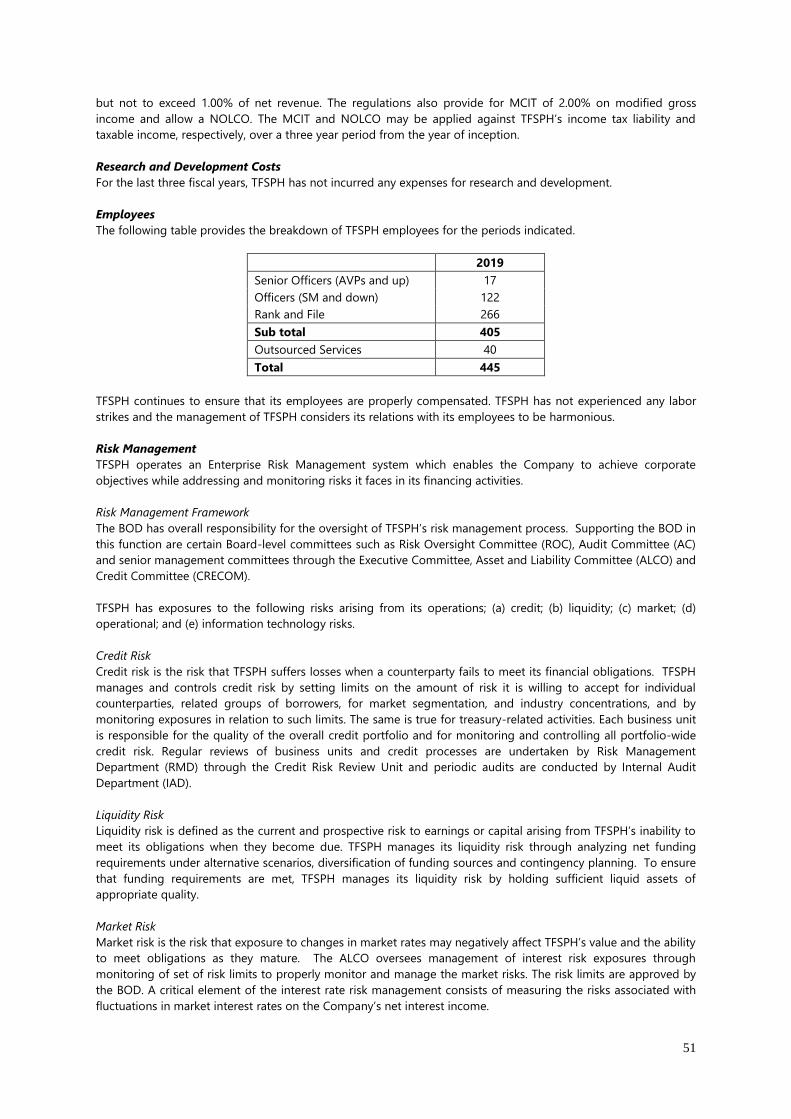
51
but not to exceed 1.00% of net revenue. The regulations also provide for MCIT of 2.00% on modified gross
income and allow a NOLCO. The MCIT and NOLCO may be applied against TFSPH’s income tax liability and
taxable income, respectively, over a three year period from the year of inception.
Research and Development Costs
For the last three fiscal years, TFSPH has not incurred any expenses for research and development.
Employees
The following table provides the breakdown of TFSPH employees for the periods indicated.
2019
Senior Officers (AVPs and up) 17
Officers (SM and down) 122
Rank and File 266
Sub total 405
Outsourced Services 40
Total 445
TFSPH continues to ensure that its employees are properly compensated. TFSPH has not experienced any labor
strikes and the management of TFSPH considers its relations with its employees to be harmonious.
Risk Management
TFSPH operates an Enterprise Risk Management system which enables the Company to achieve corporate
objectives while addressing and monitoring risks it faces in its financing activities.
Risk Management Framework
The BOD has overall responsibility for the oversight of TFSPH’s risk management process. Supporting the BOD in
this function are certain Board-level committees such as Risk Oversight Committee (ROC), Audit Committee (AC)
and senior management committees through the Executive Committee, Asset and Liability Committee (ALCO) and
Credit Committee (CRECOM).
TFSPH has exposures to the following risks arising from its operations; (a) credit; (b) liquidity; (c) market; (d)
operational; and (e) information technology risks.
Credit Risk
Credit risk is the risk that TFSPH suffers losses when a counterparty fails to meet its financial obligations. TFSPH
manages and controls credit risk by setting limits on the amount of risk it is willing to accept for individual
counterparties, related groups of borrowers, for market segmentation, and industry concentrations, and by
monitoring exposures in relation to such limits. The same is true for treasury-related activities. Each business unit
is responsible for the quality of the overall credit portfolio and for monitoring and controlling all portfolio-wide
credit risk. Regular reviews of business units and credit processes are undertaken by Risk Management
Department (RMD) through the Credit Risk Review Unit and periodic audits are conducted by Internal Audit
Department (IAD).
Liquidity Risk
Liquidity risk is defined as the current and prospective risk to earnings or capital arising from TFSPH’s inability to
meet its obligations when they become due. TFSPH manages its liquidity risk through analyzing net funding
requirements under alternative scenarios, diversification of funding sources and contingency planning. To ensure
that funding requirements are met, TFSPH manages its liquidity risk by holding sufficient liquid assets of
appropriate quality.
Market Risk
Market risk is the risk that exposure to changes in market rates may negatively affect TFSPH’s value and the ability
to meet obligations as they mature. The ALCO oversees management of interest risk exposures through
monitoring of set of risk limits to properly monitor and manage the market risks. The risk limits are approved by
the BOD. A critical element of the interest rate risk management consists of measuring the risks associated with
fluctuations in market interest rates on the Company’s net interest income.
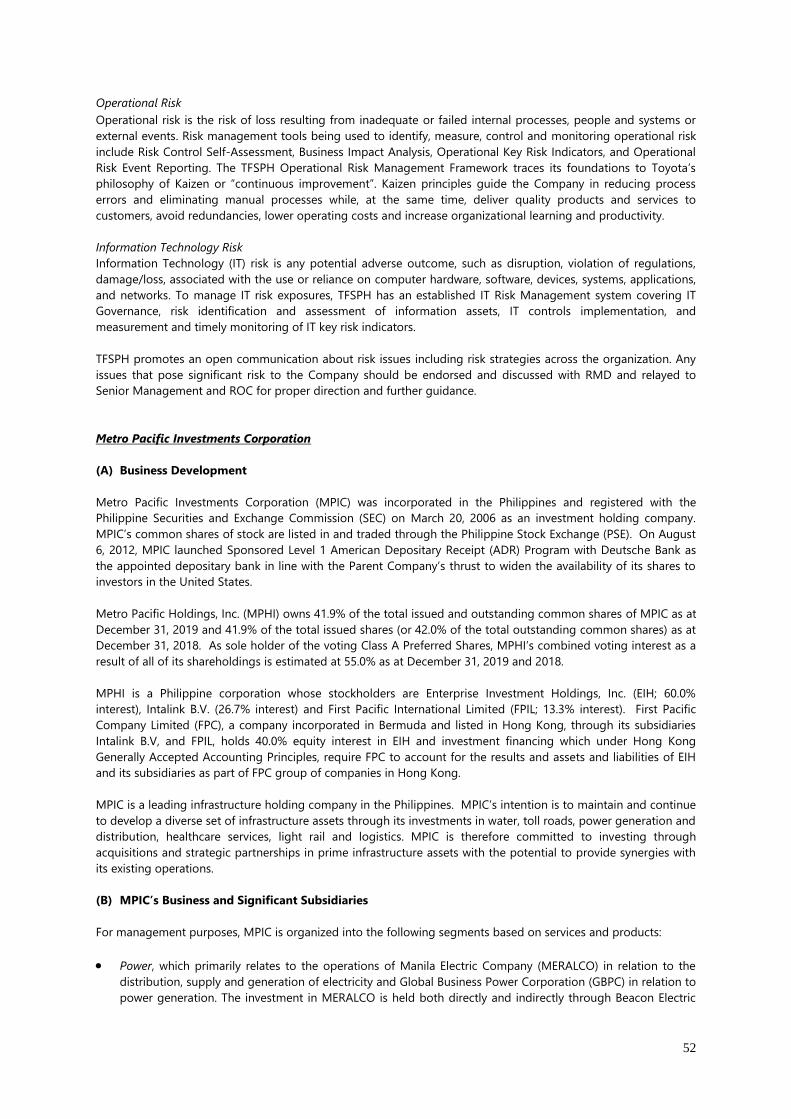
52
Operational Risk
Operational risk is the risk of loss resulting from inadequate or failed internal processes, people and systems or
external events. Risk management tools being used to identify, measure, control and monitoring operational risk
include Risk Control Self-Assessment, Business Impact Analysis, Operational Key Risk Indicators, and Operational
Risk Event Reporting. The TFSPH Operational Risk Management Framework traces its foundations to Toyota’s
philosophy of Kaizen or “continuous improvement”. Kaizen principles guide the Company in reducing process
errors and eliminating manual processes while, at the same time, deliver quality products and services to
customers, avoid redundancies, lower operating costs and increase organizational learning and productivity.
Information Technology Risk
Information Technology (IT) risk is any potential adverse outcome, such as disruption, violation of regulations,
damage/loss, associated with the use or reliance on computer hardware, software, devices, systems, applications,
and networks. To manage IT risk exposures, TFSPH has an established IT Risk Management system covering IT
Governance, risk identification and assessment of information assets, IT controls implementation, and
measurement and timely monitoring of IT key risk indicators.
TFSPH promotes an open communication about risk issues including risk strategies across the organization. Any
issues that pose significant risk to the Company should be endorsed and discussed with RMD and relayed to
Senior Management and ROC for proper direction and further guidance.
Metro Pacific Investments Corporation
(A) Business Development
Metro Pacific Investments Corporation (MPIC) was incorporated in the Philippines and registered with the
Philippine Securities and Exchange Commission (SEC) on March 20, 2006 as an investment holding company.
MPIC’s common shares of stock are listed in and traded through the Philippine Stock Exchange (PSE). On August
6, 2012, MPIC launched Sponsored Level 1 American Depositary Receipt (ADR) Program with Deutsche Bank as
the appointed depositary bank in line with the Parent Company’s thrust to widen the availability of its shares to
investors in the United States.
Metro Pacific Holdings, Inc. (MPHI) owns 41.9% of the total issued and outstanding common shares of MPIC as at
December 31, 2019 and 41.9% of the total issued shares (or 42.0% of the total outstanding common shares) as at
December 31, 2018. As sole holder of the voting Class A Preferred Shares, MPHI’s combined voting interest as a
result of all of its shareholdings is estimated at 55.0% as at December 31, 2019 and 2018.
MPHI is a Philippine corporation whose stockholders are Enterprise Investment Holdings, Inc. (EIH; 60.0%
interest), Intalink B.V. (26.7% interest) and First Pacific International Limited (FPIL; 13.3% interest). First Pacific
Company Limited (FPC), a company incorporated in Bermuda and listed in Hong Kong, through its subsidiaries
Intalink B.V, and FPIL, holds 40.0% equity interest in EIH and investment financing which under Hong Kong
Generally Accepted Accounting Principles, require FPC to account for the results and assets and liabilities of EIH
and its subsidiaries as part of FPC group of companies in Hong Kong.
MPIC is a leading infrastructure holding company in the Philippines. MPIC’s intention is to maintain and continue
to develop a diverse set of infrastructure assets through its investments in water, toll roads, power generation and
distribution, healthcare services, light rail and logistics. MPIC is therefore committed to investing through
acquisitions and strategic partnerships in prime infrastructure assets with the potential to provide synergies with
its existing operations.
(B) MPIC’s Business and Significant Subsidiaries
For management purposes, MPIC is organized into the following segments based on services and products:
• Power, which primarily relates to the operations of Manila Electric Company (MERALCO) in relation to the
distribution, supply and generation of electricity and Global Business Power Corporation (GBPC) in relation to
power generation. The investment in MERALCO is held both directly and indirectly through Beacon Electric
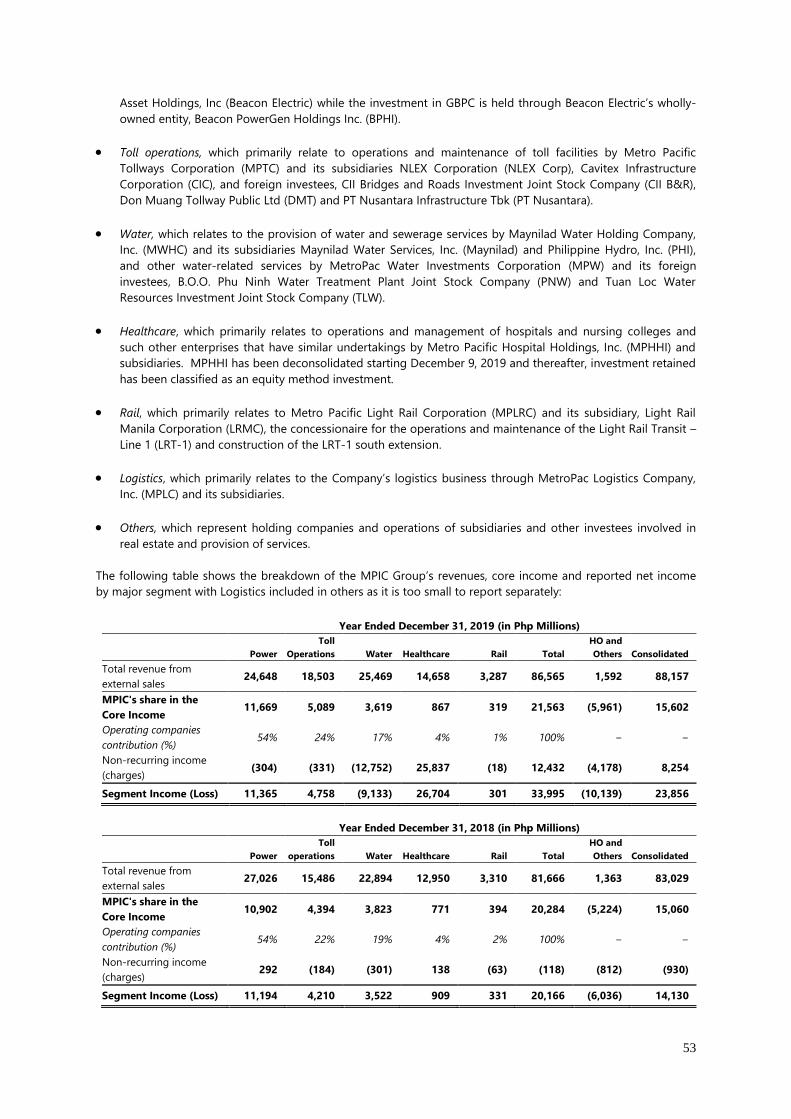
53
Asset Holdings, Inc (Beacon Electric) while the investment in GBPC is held through Beacon Electric’s wholly-
owned entity, Beacon PowerGen Holdings Inc. (BPHI).
• Toll operations, which primarily relate to operations and maintenance of toll facilities by Metro Pacific
Tollways Corporation (MPTC) and its subsidiaries NLEX Corporation (NLEX Corp), Cavitex Infrastructure
Corporation (CIC), and foreign investees, CII Bridges and Roads Investment Joint Stock Company (CII B&R),
Don Muang Tollway Public Ltd (DMT) and PT Nusantara Infrastructure Tbk (PT Nusantara).
• Water, which relates to the provision of water and sewerage services by Maynilad Water Holding Company,
Inc. (MWHC) and its subsidiaries Maynilad Water Services, Inc. (Maynilad) and Philippine Hydro, Inc. (PHI),
and other water-related services by MetroPac Water Investments Corporation (MPW) and its foreign
investees, B.O.O. Phu Ninh Water Treatment Plant Joint Stock Company (PNW) and Tuan Loc Water
Resources Investment Joint Stock Company (TLW).
• Healthcare, which primarily relates to operations and management of hospitals and nursing colleges and
such other enterprises that have similar undertakings by Metro Pacific Hospital Holdings, Inc. (MPHHI) and
subsidiaries. MPHHI has been deconsolidated starting December 9, 2019 and thereafter, investment retained
has been classified as an equity method investment.
• Rail, which primarily relates to Metro Pacific Light Rail Corporation (MPLRC) and its subsidiary, Light Rail
Manila Corporation (LRMC), the concessionaire for the operations and maintenance of the Light Rail Transit –
Line 1 (LRT-1) and construction of the LRT-1 south extension.
• Logistics, which primarily relates to the Company’s logistics business through MetroPac Logistics Company,
Inc. (MPLC) and its subsidiaries.
• Others, which represent holding companies and operations of subsidiaries and other investees involved in
real estate and provision of services.
The following table shows the breakdown of the MPIC Group’s revenues, core income and reported net income
by major segment with Logistics included in others as it is too small to report separately:
Year Ended December 31, 2019 (in Php Millions)
Power
Toll
Operations Water Healthcare Rail Total
HO and
Others Consolidated
Total revenue from
external sales 24,648 18,503 25,469 14,658 3,287 86,565 1,592 88,157
MPIC's share in the
Core Income 11,669 5,089 3,619 867 319 21,563 (5,961) 15,602
Operating companies
contribution (%) 54% 24% 17% 4% 1% 100% − −
Non-recurring income
(charges) (304) (331) (12,752) 25,837 (18) 12,432 (4,178) 8,254
Segment Income (Loss) 11,365 4,758 (9,133) 26,704 301 33,995 (10,139) 23,856
Year Ended December 31, 2018 (in Php Millions)
Power
Toll
operations Water Healthcare Rail Total
HO and
Others Consolidated
Total revenue from
external sales 27,026 15,486 22,894 12,950 3,310 81,666 1,363 83,029
MPIC's share in the
Core Income 10,902 4,394 3,823 771 394 20,284 (5,224) 15,060
Operating companies
contribution (%) 54% 22% 19% 4% 2% 100% − −
Non-recurring income
(charges) 292 (184) (301) 138 (63) (118) (812) (930)
Segment Income (Loss) 11,194 4,210 3,522 909 331 20,166 (6,036) 14,130
54
While the Company’s geographic focus is still predominantly the Philippines, MPIC has started increasing its
presence in Southeast Asia with its investments in Indonesia (PT Nusantara), Thailand (DMT) and Vietnam (CII
B&R, Tuan Loc Water Resources Investment Joint Stock Company and BOO Phu Ninh Water Treatment Plant Joint
Stock Company).
Except as stated in the succeeding paragraphs and in the discussion for each of MPIC’s significant subsidiaries,
there has been no other business development such as bankruptcy, receivership or similar proceeding not in the
ordinary course of business that affected MPIC for the past three years.
(B.1a) Power - MERALCO
Business Development
Investment in MERALCO is held directly by MPIC at 10.5% and held indirectly through Beacon Electric at an
effective interest of 35.0% as at December 31, 2019 and 2018, respectively.
MERALCO is the Philippines’ largest electric power distribution company, with franchise area covering 9,685
square kilometers. It provides power to more than 6.8 million customers in 36 cities and 75 municipalities
including the whole of Metro Manila, provinces of Rizal, Cavite, and Bulacan, and parts of Pampanga, Batangas,
Laguna and Quezon. Business establishments in the franchise area account for about 50% of the country’s Gross
Domestic Product.
Through Clark Electric Distribution Corporation (Clark Electric), a 65%-owned subsidiary, MERALCO holds the
power distribution franchise of Clark Special Economic Zone in Clark, Pampanga. Clark Electric’s franchise area
covers 320 square kilometers and 2,518 customers as at December 31, 2019.
MERALCO is organized into two major operating segments, namely, power (distribution, generation and retail
electricity supply) and other services.
Electricity distribution
This is principally electricity distribution and supply of power on a pass-through basis covering all captive
customers in the MERALCO and the Clark Electric franchise areas in Luzon. Electricity distribution within the
MERALCO franchise area accounts for approximately 55% of the power requirements of the country.
Power generation
MERALCO PowerGen Corporation (MGen), the power generation arm of MERALCO, has a 14% equity interest in
Global Business Power Corporation (GBPC). GBPC owns a total of 854 MegaWatt (MW) (gross) of coal and diesel-
fired power plants.
MGen owns an effective 28% equity in PacificLight Power Pte Ltd. (PacificLight Power) in Jurong Island, Singapore.
PacificLight Power owns and operates a 2 x 400 MW combined cycle turbine power plant mainly fueled by
liquefied natural gas (“LNG”).
MGen, through San Buenaventura Power Limited (SBPL), a 51% owned joint venture entity, constructed and owns
a 455 MW (net) supercritical coal-fired power plant in Mauban, Quezon. The Power Supply Agreement (PSA) with
MERALCO was approved by the Energy Regulatory Commission (ERC) on May 19, 2015. The power plant began
commercial operations on September 26, 2019.
MGen is developing a 2 x 600 MW (net) coal-fired power plant in Atimonan, Quezon through its wholly-owned
subsidiary, Atimonan One Energy, Inc. (A1E). It will be the first ultra-supercritical coal-fired facility to be built in
the country. A1E shall participate in a Competitive Selection Process (CSP) to be conducted by MERALCO for a
1,200 MW greenfield power plant capacity. In the meantime, advance site preparation and early engineering are
being done in order to meet the targeted operations date.
A1E is classified as a Committed Project of National Significance by the Department of Energy (DOE) and has the
requisite Department of Environment and Natural Resources (DENR) approvals and permits. It is also recognized
by the Board of Investments (“BOI”) as a registered Pioneer Project.
55
MGen Renewable Energy, Inc. (MGreen), a wholly owned subsidiary of MGen was incorporated and registered
with the SEC on June 6, 2019 to engage in the development of renewable projects.
On December 5, 2019, MGen acquired 70% of Nortesol III Inc. (“NorteSol”), a company incorporated in the
Philippines and engaged in the development, construction and operation of power plant and related facilities
using renewable energy system and hybrid energy system. Nortesol is currently developing a 110 MW dc/90
MWac floating facility in Laguna de Bay and waiting for the Laguna Lake Development Authority leasing policy.
RES covers the sourcing and supply of electricity to qualified contestable customers. MERALCO and Clark Electric
serve as local retail electricity suppliers within their franchise area under a separate business unit, MPower and
Cogent Energy, respectively. Under Retail Competition and Open Access (RCOA), qualified contestable customers
who opt to switch to contestability and elect to be among contestable customers may source their electricity
supply from any retail electricity suppliers, including MPower and Cogent Energy.
Other Services
The other services segment is involved principally in electricity-related services, such as; electro-mechanical
engineering, construction, consulting and related manpower services, e-transaction and bills collection, telecoms
services, rail-related operations and maintenance services, insurance and re-insurance, e-business development,
power distribution management, energy systems management and harnessing renewable energy.
Patents, Trademarks, Licenses, Franchises, Concessions or Labor Contract
MERALCO holds a congressional franchise under Republic Act (RA) No. 9209 effective June 28, 2003. RA No. 9209
grants MERALCO a 25-year franchise valid through June 28, 2028 to construct, operate, and maintain the electric
distribution system in the cities and municipalities of Bulacan, Cavite, Metro Manila, and Rizal and certain cities,
municipalities, and barangays in the provinces of Batangas, Laguna, Pampanga, and Quezon. On October 20,
2008, the ERC, granted MERALCO a consolidated Certificate of Public Convenience and Necessity for the
operation of electric service within its franchise coverage, effective until the expiration of MERALCO’s
congressional franchise. MERALCO’s participation in Retail Electricity Supply (RES) is through its local RES unit,
MPower. In 2017, the ERC granted MERALCO’s wholly owned subsidiary, Vantage Energy Solutions and
Management, Inc. (Vantage), Solvre, Inc., a wholly owned subsidiary of MGen, and MeridianX Inc., a wholly owned
subsidiary of Comstech Integration Alliance, Inc., distinct RES licenses to operate as retail electricity suppliers in
Luzon and Visayas.
Principal Products or Services
MERALCO’s and Clark Electric’s markets are categorized into four sectors and the consolidated relative
contributions to sales of each are as follows:
Contribution in terms of Sales Volume
2019 2018
Commercial 39.43% 39.41%
Residential 31.13% 30.59%
Industrial 29.14% 29.69%
Streetlights 0.30% 0.31%
Total 100.00% 100.00%
Dependence on Licenses and Government Approval
MERALCO was among the first entrants to the Performance-Based Regulation (PBR). Rate-setting under PBR is
governed by the Rules for Setting Distribution Wheeling Rates (RDWR). The PBR scheme sets tariffs based on the
regulated asset base of the Distribution Utility (DU), and the required operating and capital expenditures to meet
operational performance and service level requirements responsive to the need for adequate, reliable and quality
power, efficient service, growth of all customer classes in the in the franchise area as approved by the ERC. PBR
also employs a mechanism that penalizes or rewards a DU depending on its network and service performance.
Rate filings and setting are done every regulatory period (RP) where one RP consists of four regulatory years. A
regulatory year (RY) begins on July 1 and ends on June 30 of the following year.
56
Application for Recoveries
MERALCO also files with the ERC its applications for recoveries of advances for pass-through costs. These
advances consist mainly of unrecovered or differential generation and transmission charges technically referred to
as under-recoveries, which are recoverable from the customers, as allowed by law.
Customers
MERALCO’s customers are mass-based such that the loss of a few customers would not have a material adverse
effect on MPIC and its subsidiaries taken as a whole. There is also no single customer that accounts for twenty
percent (20%) or more of the segment’s sales.
Competition
Distribution of electricity at its usable voltage to end-consumers is performed by investor-owned electric utilities,
notably MERALCO and Clark Electric, a few local government-owned utilities and numerous electric cooperatives
which sell to households as well as commercial and industrial enterprises located within their franchise areas at
retail rates regulated by the ERC. Given that distributors are assigned franchise areas, as well as the significant
investment involved in the setting-up of a distribution network, MERALCO and Clark Electric have no significant
competition in their franchise areas.
At 78 months since the start of RCOA, a good number of contestable customers have so far decided to wait for
mandatory contestability and have therefore remained as captive customers, which continue to be served by the
DU. In terms of demand, however, almost half of the estimated contestable customer demand has opted to
switch into the competitive market. This comprises mostly large customers with high load factors, who were able
to obtain competitively priced energy from competing retail electricity suppliers. Of the 1,088 qualified and
registered contestable customers, 440 or 42% in terms of number of accounts have opted to be served by
MPower, the MERALCO RES unit. MPower, with a group of highly competent engineers and commercial
executives with broad experience in the power industry, including load profiling and forecasting, energy
operations and management, and its customer-centric product and price offerings, among others, has created
significant value for its customers through its service offerings and reliable supply portfolio.
Distribution
MERALCO and Clark Electric have distribution facilities comprising of land, various buildings and improvements,
as well as property and equipment such as substation equipment, towers, poles, underground conduit and
conductors and overhead conductors and devices.
Source and availability of raw materials
MERALCO and Clark Electric do not operate their own generation capacity. Both purchase all of the power they
distribute from the power generators under PSA and Power Purchase Agreements or through the Wholesale
Electricity Sport Market (WESM). WESM is a venue where suppliers and buyers trade electricity as a commodity.
(B.1b) Power - GBPC
Business Development/ Products and Services
GBPC is an independent power producer with operations in the Visayas, Mindoro and Mindanao. Its generation
facilities provide power to fast-growing, dynamic regions, ramping up economic growth and transforming
communities.
The largest clean coal-fired power plants located in Iloilo City, with a combined capacity of 314 MW, are operated
by Panay Energy Development Corporation (PEDC), in which GBP holds an 89.3% beneficial interest. PEDC has
operated a 164 MW clean coal-fired power plant to serve the energy requirement of Panay and the rest of the
Visayas region since 2011. A new 150 MW coal-fired circulating fluidized bed (CFB) plant in Panay began
commercial operations during the first quarter of 2017. Upon completion of rectification works, the plant was
accepted on May 31, 2018.
The second largest power generation facility is the 246 MW clean coal-fired power plant in Toledo City, Cebu,
which is operated by Cebu Energy Development Corporation (CEDC). CEDC is a joint venture between Abovant
Holdings, Inc. and Global Formosa Power Holdings, Inc. (GFPHI) with GFPHI having 56.0% beneficial interest.
57
GBPC, having 93.2% ownership stake in GFPHI, effectively has 52.2% interest in CEDC. This facility is the first
commercial clean coal power plant in the Philippines.
Both the PEDC and CEDC plants utilize circulating fluidized bed boiler technology that produces very low levels of
sulfur dioxide and nitrogen oxide and captures most solid emissions.
GBPC’s other power generation facilities consist of a 60 MW coal facility, an 82 MW coal facility and a 40 MW fuel
oil facility operated by Toledo Power Co. (TPC); a 72 MW fuel oil facility, a 20 MW fuel oil facility, a 7.5 MW fuel oil
facility and a 5 MW fuel oil facility operated by Panay Power Corporation (PPC); and a 7.5 MW fuel oil facility
operated by GBH Power Resources Inc. (GPRI).
In 2017, GBPC expanded to Mindanao, gaining a foothold in the island through a 50% equity in Alsons Thermal
Energy Corporation (ATEC), the holding company of Alsons Consolidated Resources, Inc.’s (ACR) baseload coal-
fired power plants. ATEC owns 75% stake in Sarangani Energy Corporation, which operates a 2x118.5 MW
baseload coal-fired plant in Maasim, Sarangani Province, with the second unit declaring commercial operations
on October 10, 2019. ATEC also holds 100% equity in San Ramon Power, Inc. (SRPI) which is developing a
baseload coal-fired plant in Zamboanga City with a gross capacity of 120 MW.
Distribution Methods of Products and Services
GBPC, through its power generation companies, sells electricity through its bilateral power supply agreements or
the Wholesale Electricity Spot Market (WESM).
GBPC enters into bilateral off-take arrangements through Electric Power Purchase Agreements (EPPA) between its
generation subsidiaries and the power-off-takers such as DUs, electric cooperatives and other industrial off-
takers. An EPPA provides for a specific amount of capacity to be allocated to each customer, with provisions that
allow for the periodic revision of the amounts in the agreement.
GBPC, through its Global Energy Supply Corporation (GESC), a retail electricity supplier accredited by the ERC,
provides power to big-load customers also known as “Contestable Customers”. This was made possible through
the execution of Retail Supply Contracts.
GBPC also enters into Ancillary Service Procurement Agreements (ASPA) with the National Grid Corporation of
the Philippines (NGCP) to help maintain a reliable electric grid system.
New Products and Services
As a committed partner to nation building, the company explores expansion projects that support the
development of high growth and emerging markets.
SEC’s second 118.5 MW coal-fired plant commenced commercial operations on October 10, 2019. With this, SEC
currently serves more than six million people from ten provinces and twelve cities in Mindanao, covered by the
franchise areas of its contracted distribution utilities.
Competition
GBPC’s power generation facilities are subject to competition from existing and future power generation plants
that supply electricity to the Visayas grid. GBPC believes that its experience in designing, building and operating
power plant projects in Visayas and Mindoro is stronger than any of its competitors in the region.
The key competitor in the region is the Unified Leyte Geothermal Power Plants, which were operated by the
Philippine Government through National Power Corporation (NPC). These power plants are now privatized. The
Leyte plants service both the Luzon and Visayas grids. Geothermal power plants are significant competitors
because they can produce power at a relatively lower cost than fossil-fuel and coal-based producers. Specific to
GBPC’s facilities in Iloilo, Palm Concepcion Power Corporation’s 135 MW coal-fired power plant remains to be its
biggest competitor.
GBPC will face competition in both the development of new power generation facilities and the acquisition of
existing power plants, as well as the financing for these activities. Factors such as the performance of the
Philippine economy and the possibility of a shortfall in the Philippines’ energy supply have attracted many
potential competitors, including multinational development groups and equipment suppliers, to explore
58
opportunities in the development of electric power generation projects in the Philippines. Accordingly,
competition for and from new non-renewable and renewable power projects have increased in line with the
expected long-term economic growth of the Philippines. For instance, in Toledo City, Cebu, Therma Visayas Inc.
started operating the first 170 MW coal-fired power plant in the first half of the year, with the second one
undergoing testing and commissioning. As for GBPC, the Company is looking at several projects to expand its
energy portfolio through investments in renewable technologies.
Sources and Availability of Raw Materials and the Names of Principal Suppliers
GBPC has local and imported long-term Coal Supply Agreements with selected suppliers. GBPC gets majority of
local coal supplies from Semirara Mining, while imported coal come from international partners from Indonesia
and Russia.
Coal prices under the agreements are indexed to Global Newcastle Coal prices and are adjusted if the guaranteed
coal qualities are not met but within the rejection limits. These coal qualities include calorific value, moisture,
sulphur, ash and volatile matter. Coal procurement is being handled by GBPC’s Supply Chain Management
Group, particularly, the Coal Trading Team in coordination with the Fuel Management Department.
Major Customers
A summary of power off-taker customers having EPPAs with the generation subsidiaries as of December 31, 2019
is as follows:
Cebu Energy Development Corporation (CEDC)
▪ Visayan Electric Company, Inc. (VECO)
▪ Philippine Economic Zone Authority - Mactan Economic Zone I (PEZA-MEZ 1)
▪ Mactan Electric Company (MECO)
▪ Bohol I Electric Cooperative, Inc. (BOHECO 1)
▪ CEBU I Electric Cooperative, Inc. (CEBECO 1)
▪ CEBU II Electric Cooperative, Inc. (CEBECO 2)
▪ Balamban Enerzone Corporation (BEZ)
▪ National Grid Corporation of the Philippines (NGCP)
▪ Global Energy Supply Corp. (GESC) - Contestable Customers
Panay Energy Development Corporation (PEDC)
▪ Panay Electric Company, Inc. (PECO)
▪ Aklan Electric Cooperative, Inc. (AKELCO)
▪ Capiz Electric Cooperative, Inc. (CAPELCO)
▪ Antique Electric Cooperative, Inc. (ANTECO)
▪ Iloilo I Electric Cooperative, Inc. (ILECO 1)
▪ Iloilo II Electric Cooperative, Inc. (ILECO 2)
▪ Iloilo III Electric Cooperative, Inc. (ILECO 3)
▪ Iloilo Provincial Capitol
▪ Guimaras Electric Cooperative, Inc. (GUIMELCO)
▪ National Grid Corporation of the Philippines (NGCP)
▪ Manila Electric Company (MERALCO)
▪ Global Energy Supply Corp. (GESC) - Contestable Customers
Toledo Power Co. (TPC)
▪ Carmen Copper Corporation (Carmen Copper)
▪ CEBU III Electric Cooperative, Inc. (CEBECO 3)
▪ Philippine Mining Service Corp. (PMSC) – Bohol Facility
▪ Global Energy Supply Corp. (GESC) - Contestable Customers
▪ National Grid Corporation of the Philippines (NGCP)
Panay Power Corporation (PPC)
▪ Panay Electric Company (PECO)
▪ Iloilo I Electric Cooperative, Inc. (ILECO 1)
▪ Aklan Electric Cooperative (AKELCO )
▪ Negros Occidental Electric Cooperative, Inc. (NOCECO)
59
▪ National Grid Corporation of the Philippines (NGCP)
GBH Power Resources Inc. (GPRI)
▪ Oriental Mindoro Electric Cooperative, Inc. (ORMECO)
Effect of Existing or Probable Government Regulations on the Business
The following regulations may have significant impact on GBPC’s business operations:
Wholesale Electricity Spot Market (WESM)
The WESM provides a venue through which independent power producers may sell power, and at the same time,
distributors and wholesale consumers can purchase electricity where no bilateral contract exists between the two.
In June 2002, the Department of Energy (DOE), in cooperation with electric power industry participants,
promulgated detailed rules for the WESM thereby allowing the creation of the Philippine Electricity Market
Corporation (which will operate the market) and providing a framework for the establishment of the WESM.
These rules set the guidelines and standards for participation in the market, reflecting accepted economic
principles and providing a level playing field for all electric power industry participants, and procedures for
establishing the merit order dispatch for each trading period. The WESM began market operations in 2006 for
Luzon and 2010 for Visayas. GBPC’s subsidiaries, PEDC, CEDC, PPC and TPC, have been registered participants of
the WESM since 2011. On June 26, 2017, PEMC commenced trial operations of WESM in Mindanao and is
targeted to be fully-operational by first semester of 2020.
Below are various circulars, issuances and proposed amendments affecting WESM members:
• Shorter Trading and Dispatch Interval. To further enhance the design and operation of WESM, DOE Circular
No. 2015-10-001 series of 2015 called for a number of changes which included a shorter trading and
dispatch interval from one (1) hour to five (5) minutes.
• Price Determination Methodology. Substituting Philippine Electricity Market Corporation (PEMC) as Applicant,
the Independent Electricity Market Operator of the Philippines, Inc. (IEMOP), also filed an Application on 16
May 2017 for the approval of the Price Determination Methodology for the WESM under ERC Case No. 2017-
042 RC. Some enhancements in the proposed rule are the shortening of scheduling and pricing intervals
from one hour to five minutes and ex ante only pricing, automatic pricing re-run, and preferential scheduling
in the event that dispatch targets need to be restricted.
• Ancillary Services – Causers Pay Mechanism. DOE has drafted a Policy for the Effective Utilization of Ancillary
Services in the Grid through Causer Pays Mechanism which has yet to be formalized in a memorandum
circular. The proposed policy seeks to recover equitably the cost from the WESM member that requires or
caused to require the use of Ancillary Services. The National Grid Corporation of the Philippines (NGCP), for
its part, filed a Petition for the Approval of Amended Ancillary Services – Cost Recovery Mechanism (AS-CRM)
on September 14, 2018. The amendment aims to reflect the new provision on Ancillary Services under the
2016 Philippine Grid Code and for AS-CRM to be consistent with the Open Access Transmission Service
(OATS) Rules.
• Renewable Energy Market (REM) Rules. On 4 December 2019, the DOE issued Department Circular No.
DC2019-12-0016 entitled Promulgating the Renewable Energy Market Rules (the “REM Rules”). The REM Rules
establish the basic rules, requirements and procedures that govern the operation of the Renewable Energy
Market (REM), which is a market for the trading of Renewable Energy Certificates (RECs). The REM is intended
as a venue for mandated participants to comply with the Renewable Portfolio Standards (RPS) requirements.
Among the mandated participants are: DUs for their captive customers, Suppliers of electricity for the
Contestable Market, generating companies to the extent of their actual supply to directly connected
customers, RE generation companies registered with the WESM, net metering for RE participants and Green
Energy Option Program (GEOP) participants.
• Ancillary Services Rules. On 4 December 2019, the DOE issued Department Circular No. DC2019-12-008
entitled Adopting a General Framework Governing the Provision and Utilization of Ancillary Services in the Grid
(the “AS Rules”). The AS Rules prescribe the required levels of AS per trading interval per grid. It provides
the mandatory AS capability testing of all generating facilities.
60
The AS Rules prescribes the manner of procurement of AS prior to and after the commercial operation of the
WESM Reserve Market. Essentially, prior to such operation: Regulating, Contingency, Dispatchable Reserves,
Reactive Power Support AS and Black Start AS shall be procured through firm contracts only. Upon
commercial operation of the WESM Reserve Market, the System Operator shall procure Regulating,
Contingency and Dispatchable Reserves through firm contracting and the Reserve Market. Reactive Power
Support AS and Black Start AS shall be procured through firm contracts only.
The AS Rules sets 26 March 2020 as the deadline for the co-optimization of the energy and reserves in the
WESM, but subject to certain criteria. The existing cost-recovery mechanism for AS shall continue until a new
mechanism is adopted by the DOE and/or the ERC.
The AS Rules provides that the Systems Operator is shall re-negotiate, as necessary, its existing contracts with
AS providers in accordance with the AS Rules.
Retail Competition and Open Access
The EPIRA likewise provides for a system of open access on transmission and distribution wires, under which the
National Grid Corporation of the Philippines (NGCP) is the transmission operator, and the DUs may not refuse the
use of their wires for the delivery of electricity by qualified persons, subject to the payment of transmission or
distribution wheeling charges. Commercial operations of the retail competition and open access commenced on
June 26, 2013.
The ERC issued ERC Resolution No. 10, series of 2016 on May 12, 2016 which contained the Revised Rules on
Contestability. Under said rules, the Threshold Reduction Date was set to June 26, 2016, where end-users with
demand of at least 750kW shall be allowed to contract with any Retail Electricity Supplier (RES). On the other
hand, for end-users with demand of at least 1MW, mandatory contestability was set to December 26, 2016. Lastly,
the lowering of the threshold to cover end-users with demand of at least 500kW was set on June 26, 2018.
However, the date for mandatory contestability for end-users with demand of at least 1MW was later moved to
February 26, 2017 through ERC Resolution No. 28, series of 2016, issued on November 15, 2016, due to various
issues on implementation of mandatory contestability.
The implementation of mandatory contestability has further been suspended by the issuance of a Temporary
Restraining Order (TRO) on February 21, 2017 by the Supreme Court (SC). Acting on a petition filed by the
Philippine Chamber of Commerce and Industry (PCCI), San Beda College Alabang, Inc., Ateneo de Manila
University, and the Riverbanks Development Corp., the SC ruled that there was no legal basis for the mandatory
migration being ordered under RCOA, and that EPIRA only provides for voluntary migration of end-users to the
contestable market.
In response, the ERC has filed a motion seeking to lift the TRO and clarify the scope of the SC’s ruling. Particularly,
the ERC asked if it can lower the threshold to 750 kW for contestable customers, and if it can still issue new RES
licenses to qualified energy industry players. To date, no further resolutions have been issued by the SC.
Notwithstanding above pending case before the SC, the DOE issued Department Circular 2017-12-0013 on
November 29, 2017 which provides policy on RCOA that allows voluntary participation of Contestable Customers
(CCs) with lower threshold. CCs with monthly average peak demand of 750 kW and above allows participation in
the retail market on a voluntary basis upon the effectivity of the circular, with 500 kW to 749 kW monthly average
peak demand effective June 26, 2018 and with no less than 500 kW monthly average peak demand effective
December 26, 2018 or an earlier date set by the ERC.
GBPC, through its wholly-owned subsidiary GESC, is able to participate in the retail competition open access
initiative to directly supply electricity to end users, including major industrial customers. As of December 31, 2019,
GESC has a contracted capacity of 85 MW.
Tax Reform for Acceleration and Inclusion Act (TRAIN)
The first package of the government’s tax reform package - the Tax Reform for Acceleration and Inclusion Act
(TRAIN) - was signed into law by President Rodrigo R. Duterte last December 19, 2017.
The TRAIN Law, or Republic Act No. 10963, introduces sweeping tax reforms, including the restructuring of excise
tax base on mineral products, particularly coal. The tax reform increased the excise tax of coal from P=10 to P=50
61
per metric ton effective January 1, 2018; P=100 effective January 1, 2019; and P=150 effective January 1, 2020.
Likewise, 12-percent value added tax (VAT) will be added on the NGCP’s wheeling charge.
The House of Representatives, under the 18th Congress of the Philippines, approved on third and final reading
House Bill No. 4157 or the Corporate Income Tax and Incentive Rationalization Act (“CITIRA”) last September 13,
2019, and transmitted the bill to the Senate on September 16, 2019. CITIRA is the second package of the TRAIN
law. This bill proposes to gradually lower the corporate income tax rate and rationalize corporate tax incentives.
Proposed Comprehensive Income Tax and Incentives Rationalization Act (CITIRA)
Congress is tacking various bills on the CITIRA. Among the notable provisions of the proposed CITIRA Bill are as
follows:
• Income Tax Holiday (ITH): for existing registered enterprises, the ITH shall be the remaining ITH grant or 5
years ITH, whichever is shorter. For newly-registered enterprises, ITH shall be 3 years (for National Capital
Region (NCR)), 4 years for provinces near NCR, and 6 years for other locations.
• Reduced Income Tax Rate After ITH: for existing registered enterprises, 5% tax on gross income in lieu of all
taxes (after expiration of ITH) with time limit ranging from 2-5 years. For newly-registered enterprises,
reduced income tax rate of 18% (from 2020) and gradually reducing to 13% (by 2030) with time limit ranging
from 2-5 years.
• Income Tax on Domestic Corporation: 29% starting 1 January 2020 and reducing gradually to 20% by 2029.
The CITIRA Bill is pending review and deliberation of the Senate Committee on Ways and Means.
Renewable Energy Act of 2008
The Renewable Energy Act of 2008 (RE Law) is a landmark legislation and is considered the most comprehensive
renewable energy law in Southeast Asia. The RE Law was signed by then President Gloria M. Arroyo on December
16, 2008 and took effect on January 30, 2009.
One of the main objectives of the RE Law is to accelerate the exploration and development of renewable energy
resources such as, but not limited to, biomass, solar, wind, hydro, geothermal and ocean energy sources,
including hybrid systems, to achieve synergy self-reliance, through the adoption of sustainable energy
development strategies to reduce the country’s dependence on fossil fuels and thereby minimize the country’s
exposure to price fluctuations in the international markets, the effects of which spiral down to almost all sectors
of the economy.
The RE Law also offers key fiscal and non-fiscal incentives to developers of renewable energy facilities, including
hybrid systems, subject to certification from DOE and in consultation with the Board of Investments (BOI). All
fiscal incentives apply to all RE capacities upon the RE Law becoming effective. Key incentives are as follows:
▪ income tax holiday for the first seven years of operation;
▪ duty-free importations of RE machinery, equipment and materials, effective within ten years upon issuance of
certification, provided that the said machinery, equipment and materials are directly, exclusively and actually
used in the RE facilities;
▪ special realty property tax rates on equipment and machinery not exceeding 1.5% of the net book value;
▪ net operating loss carry-over for a period of seven years;
▪ corporate income tax rates of 10% after the income tax holiday;
▪ accelerated depreciation for the purposes of computing taxable income;
▪ zero percent value-added tax on the sale of fuel or power generated from emerging energy sources and
purchases of local supply of goods, properties and services of renewable energy facilities;
▪ cash incentives for renewable energy developers for missionary electrification;
▪ tax exemption, applicable to both value-added tax and corporate income tax, on carbon emission credits;
and
▪ tax credits on domestic purchases of capital equipment and services.
The non-fiscal incentives or market mechanism include the Renewable Portfolio Standard (RPS), which sets a
minimum percentage of generation from eligible renewable energy resources; the Feed-in Tariff System, which
62
authorizes a fixed tariff for electricity produced from emerging renewable energy resources; the Renewable
Energy Market (REM), which will operate in the WESM to facilitate compliance with the Renewable Portfolio
Standard; and the Green Energy Option, which allows end-users to contract their energy requirements directly
from renewable energy facilities. On December 22, 2017, DOE issued Department Circular No. DC2017-12-0015
“Promulgating the Rules and Guidelines Governing the Establishment of the RPS for On-Grid Areas” and on
August 24, 2018, DOE issued Department Circular No. DC2018-08-0024 “Promulgating the Rules and Guidelines
Governing the Establishment of the RPS for Off-Grid Areas.” On July 18, 2018, DOE issued Department Circular
No. DC2018-07-0019 “Promulgating the Rules and Guidelines Governing the Establishment of the Green Energy
Option Program.”
GBPC is exploring opportunities in renewable energy facilities, such as hydro, biomass and solar facilities, to
complement its existing portfolio and bring down its average cost of generation.
Licenses
Under the EPIRA, no person or entity may engage in the generation of electricity unless such person or entity has
complied with the standards, requirements and other terms and conditions set by the ERC and has received a
Certificate of Compliance (COC) from the ERC to operate facilities used in the generation of electricity. Pending
issuance of the COC, the ERC may issue a Provisional Authority to Operate (PAO) to enable the entity to operate
its generation facility.
The power generation companies of GBPC possess the required COCs.
Government Approval Process
As set forth in the EPIRA, power generation is not considered a public utility operation. Thus, an entity engaged or
intending to engage in the generation of electricity is not required to secure a franchise. However, no person or
entity may engage in the generation of electricity unless such person or entity has complied with the standards,
requirements and other terms and conditions set by the ERC and has received a COC from the ERC to operate
facilities used in the generation of electricity. A COC is valid for a period of five years from the date of issuance.
In addition to the COC requirement, a generation company must comply with technical, financial and
environmental standards. A generation company must ensure that its facilities connected to the grid meet the
technical design and operational criteria of the Grid Code and Distribution Code promulgated by the ERC. In this
connection, the ERC has issued “Guidelines for the Financial Standards of Generation Companies,” which sets the
minimum financial capability standards for generation companies. Under the guidelines, a generation company is
required to meet a minimum annual interest cover ratio or debt service coverage ratio of 1.5x throughout the
period covered by its COC. For COC applications and renewals, the guidelines require the submission to the ERC
of, among other things, comparative audited financial statements, a schedule of liabilities, and a five-year
financial plan. For the duration of the COC, the guidelines also require a generation company to submit audited
financial statements and forecast financial statements to the ERC for the next two financial years, as well as other
documents. The failure by a generation company to submit the requirements prescribed by the guidelines may be
grounds for the imposition of fines and penalties.
Upon the introduction of retail competition and open access, the rates charged by a generation company will no
longer be regulated by the ERC, except rates for Captive Markets (which are determined by the ERC). In addition,
since the establishment of the WESM, generation companies are required to comply with the membership criteria
and appropriate dispatch scheduling as prescribed under the WESM Rules.
In the course of developing a power plant, permits, approvals and consents (including environmental licenses)
must be obtained from relevant national, provincial and local government authorities relating to site acquisition,
construction and operation.
Energy Investment Coordination Committee
In June 2017, President Rodrigo R. Duterte signed Executive Order (EO) No. 30 creating the Energy Investment
Coordinating Council (EICC) which aims to streamline the regulatory procedures affecting energy projects of
national significance. The EICC is an inter-agency group to be chaired by a representative from the DOE.
A salient provision of EO 30 is that it classifies energy projects with capital investment of at least P=3.5 billion as
Energy Projects of National Significance (EPNS), and government agencies are required to act upon such
63
applications within a 30-day period. Other criteria for energy projects to be classified as EPNS include significant
contribution to the country’s developments, significant potential contribution to the country’s balance of
payments, significant impact on the environment, complex technical processes and engineering designs, and
significant infrastructure requirements.
Energy Virtual One Stop Shop
On 8 March 2019, Congress enacted RA No. 11234 or the Energy Virtual One-Stop Shop (EVOSS) essentially
mandating the creation of an online system that allows the coordinated submission and processing of all
applications for permits and/or certifications for new power generation, transmission and distribution projects. It
provides for a specific timeframe for each agency to issue an action (either a decision approving or rejecting an
application. Compliance with the timeframe is mandatory and punishable by administrative penalties. Failure to
act is generally deemed an approval of the application. Among other agencies, the following departments and
their attached agencies are mandated to act within the following specific timeframes:
• DOE and its attached agencies - 60 calendar days.
• ERC - 270 calendar days
• Department of Agrarian Reform (DAR) and its attached agencies - 75 calendar days.
• Department of Environment and Natural Resources (DENR) and its attached agencies - 120 calendar days.
• National Water Resources Board (NWRB) - 60 calendar days.
The prescribed timeframe shall be the total number of days for the mother agency and its attached agencies, at
both national and local levels, and GOCCs as a whole to release actions on the applications. The time frame shall
be counted from the complete submission of documentary requirements.
Costs and Effects of Compliance with Environmental Laws
The operations of GBPC’s power generation facilities are subject to a broad range of environmental laws and
regulations. These laws and regulations impose controls on air and water discharges, the storage, handling,
discharge and disposal of fuel, chemicals and wastes, and other aspects of the operations. GBPC has incurred
operating costs and capital expenditures and will continue to do so to comply with these environmental laws and
regulations.
GBPC has undertaken carbon sink projects and has allocated funds for Energy Regulation No. 1-94 to finance
reforestation, watershed management, as well as health and environment enhancement projects. GBPC also
actively seeks ISO accreditations, and all power generation facilities are certified under ISO 14001:2015
(Environmental Management System).
Environmental Laws
GBPC’s power generation operations follow laws, regulations and policies that concern environmental protection
and sustainability. Each plant consistently submits periodic Self-Monitoring Report (SMR), Compliance
Monitoring Report (CMR) and Compliance Monitoring and Validation Reports (CMVR) to the Environmental
Management Bureau Central and Regional Offices to ensure that its operations, which include but are not limited
to water discharges and air emissions, comply with the requirements of R.A.9275 Clean Water Act and R.A. 8749
Clean Air Act. These monitoring reports are performed in the presence of Multi-Partite Monitoring Team (MMT).
The MMT is composed of representatives from various government and non-government institutions who are
tasked to conduct regular monitoring of potential sources of pollution and help recommend solutions.
On October 8, 2018, the DENR-EMB Office of the Regional Director of Region VI issued interim guidelines in
handling, storage, transport, and offsite utilization of coal combustion residual. Currently, PEDC under the
jurisdiction of DENR Region VI has faithfully complied with the requirements mentioned in the guidelines.
(B.1c) Others – Energy-from-Waste
Dependence on Licenses and Government Approval
With no comparable proposals to challenge the Quezon City Solid Waste Management Facility Project, the MPIC-
led consortium with Covanta Energy, LLC and Macquarie Group, Ltd. is waiting for the issuance of the Notice of
Award from the Quezon City Government as of February 26, 2020. The waste treatment facility will convert up to
3,000 metric tons a day of municipal waste into 36 MW (net) of electricity.
64
Status of any publicly announced product or services
In November 2018, MPIC through its wholly owned subsidiary Metpower Venture Partners Holdings, Inc. signed
agreements with Dole Philippines Inc. (Dole) to design, construct and operate integrated waste-to-energy (WTE)
facilities specifically for Dole. This project uses the derived biogas from the anaerobic digestion of fruit waste to
supply a portion of the diesel and power requirements of Dole’s canneries located in South Cotabato. The biogas
facilities, with construction completion expected within 2020, will have a capacity of 5.7 MW of clean energy for
Dole and reduce its CO2 emission by 100,000 tons per year.
This project was granted a 50% CAPEX subsidy by the Japanese Ministry of Environment under the Joint Credit
Mechanism Program.
(B.2) Toll Operations
Business Development
The Company holds its toll road assets through MPTC.
As at December 31, 2019, MPTC’s subsidiaries holds the following concession rights:
▪ Through its 75.1% effective interest in NLEX Corp:
o Construction, operation and maintenance of the North Luzon Expressway (NLEX)
o Management, operation and maintenance of the Subic-Clark-Tarlac Expressway (SCTEX).
o Construction, operation and maintenance of the NLEX-South Luzon Expressway Connector Road
(Connector Road).
▪ Through CIC, which holds the concession rights for the operation and maintenance of the Manila-Cavite Toll
Expressway (CAVITEX).
▪ Through its wholly owned subsidiary, MPCALA Holdings, Inc. (MPCALA), which was granted the concession to
design, finance, construct, operate and maintain the 47-km Cavite Laguna Expressway (CALAX).
▪ Through its wholly owned subsidiary, Cebu Cordova Link Expressway Corporation (CCLEC), which holds the
concession rights for the construction, the operation and maintenance of the Cebu-Cordova Link Expressway
(CCLEX).
MPTC also has the following foreign investments:
▪ 29.4% stake in DMT. DMT is a major toll road operator in Bangkok, Thailand. The concession for DMT runs
until 2034 for the operation of a 21.9-kilometer six-lane elevated toll road from central Bangkok to Don
Muang International Airport and further to the National Monument, north of Bangkok, Thailand.
▪ 44.9% effective interest in CII B&R. CII B&R has various road and bridge projects in and around Ho Chi Minh
City and its current portfolio includes 105.0 kilometers of roads operating at approximately 41,000 vehicles
per day and roads under pre-construction or on-going construction covering a total of 40.1 kilometers.
MPTC acquired CII B&R in 2015 through an equity investment and financing transaction with Ho Chi Minh
City Infrastructure Investment Joint Stock Co. (CII) of Vietnam that effectively provided MPTC a 44.9%
minority equity interest in CII B&R.
▪ 76.3% effective interest in PT Nusantara. PT Nusantara is a leading infrastructure company in Indonesia.
Nusantara’s areas of operations comprise of toll roads, ports, water and energy which serve over 103 million
customers, 550,000 households, 266 factories and 210 vessels.
▪ PT Nusantara’s concession assets comprise of toll roads, water concession rights and power supply. Toll road
concession rights cover the following toll road sections: (a) Tallo-Hasanuddin Airport; (b) Soekarno Hatta
Harbor – Pettarani; (c) Pondok Ranji and Pondok Aren. The water concession rights pertain to right to treat
and distribute clean water in the Serang District, Banten and Province of North Sumatera in Indonesia. The
power supply services pertain to the biomass powerplant located in Jalan Raya Wajok Hulu, West Kalimantan.
Patents, Trademarks, Licenses, Franchises, Concessions or Labor Contract
The toll segment’s concession comprises of the rights, interests and privileges to finance, design, construct,
operate and maintain toll roads, toll facilities and other facilities generating toll-related and non-toll related
income.
65
NLEX Corp holds the concession for the largest toll road in the Philippines, the NLEX Project. The NLEX currently
spans approximately 103.4 kilometers and services an average of 290,000 vehicles per day. The NLEX is the main
infrastructure backbone that connects Metro Manila to 15 million people in Central and Northern Luzon. NLEX
Corp has been in commercial operations since February 2005 and has since established the NLEX brand as the
standard for toll road operations and management excellence in the Philippines. In February 2019, NLEX Harbor
Link Segment 10, a segment of NLEX, opened to the public. C3-R10 Section of NLEX Harbor Link Segment 10 had
its partial opening in February 2020.
On February 9, 2015, NLEX Corp received the Notice of Award from the Bases Conversion and Development
Authority (BCDA) for the management, operation and maintenance of the 94-kilometer SCTEX. On February 26,
2015, NLEX Corp and BCDA entered into a Business Agreement involving the assignment of BCDA’s rights and
obligations relating to the management, operation and maintenance of SCTEX as provided in the SCTEX
concession (Toll Operation Agreement or “TOA”). The assignment includes the exclusive right to use the SCTEX
toll road facilities and the right to collect toll until October 30, 2043. The management, operation and
maintenance of the SCTEX was officially turned over to NLEX Corp on October 27, 2015.
NLEX Corp also holds the concession right for the Connector Road. The Connector Road is a four (4) lane toll
expressway structure with a length of eight (8) kilometers all passing through and above the right of way of the
Philippine National Railways (PNR) starting NLEX Segment 10 in C3 Road Caloocan City and seamlessly
connecting to SLEX through Metro Manila Skyway Stage 3 Project. The concession period shall commence on the
commencement date and shall end on its thirty-seventh (37th) anniversary, unless otherwise extended or
terminated in accordance with the Concession Agreement. The Connector Project is expected to be completed
by 2021.
CIC holds the concession for the operation and maintenance of the CAVITEX. The first phase of the CAVITEX is a
14-km long toll road built in two segments running from Airport Road to Cavite. The concession period extends
to 2033 for the originally built road and to 2046 for a subsequent extension. The second phase of the CAVITEX
(C5 South Link Expressway), which will connect the C5 road in Taguig to one of the segments in the CAVITEX, had
commenced construction in June 2017 and is expected to be fully completed by 2022. Segment 3A-1, a segment
of the C5 South Link, commenced operations in July 2019.
MPCALA was granted the concession to design, finance, construct, operate and maintain the CALAX. On July 10,
2015, MPCALA signed the Concession Agreement for the CALAX with the DPWH. Under the Concession
Agreement, MPCALA is granted the concession to design, finance, construct, operate and maintain the CALAX,
including the right to collect toll fees, over a 35-year concession period. The CALAX is a closed-system tolled
expressway connecting the CAVITEX and the SLEX. Construction is ongoing with expected full completion by
2022. Sub-sections 6 to 8, a segment of CALAX, commenced operations in October 2019. Notice to start
collection for the said sub-sections was received in February 2020.
CCLEC is granted the concession to design, finance, construct, operate and maintain the CCLEX, including the
right to collect toll fees over a 35-year concession period. CCLEX, consists of the main alignment starting from
the Cebu South Coastal Road and ending at the Mactan Circumferential Road, inclusive of interchange ramps
aligning the Guadalupe River, the main span bridge, approaches, viaducts, causeways, low-height bridges, at-
grade road, toll plazas and toll operations center. Construction of the project is ongoing and is estimated to be
completed by 2021.
PT Nusantara, through its subsidiaries, holds investments in toll road operators PT Bintaro Serpong Damai (BSD),
PT Jalan Tol Seksi Empat (JTSE), and PT Bosowa Marga Nusantara (BMN), in water and waste management service
providers, PT Sarana Catur Tirta Kelola (SCTK) and PT Dain Celicani Cemerlang (DCC) and in power supply
providers, PT Rezeki Perkasa Sejahtera Lestari (RPSL).
BSD entered into a Toll Road Operational Authority Agreement with Jasa Marga for the development and
operations of Pondok Aren - Serpong toll road lane for a period of twenty-eight (28) years, including construction
period. The toll road has been in operations since 1999. Pondok Aren - Serpong toll road lane is a 7-km toll road
that connects Serpong and Pondok Aren, South Tangerang, Indonesia .
JTSE entered into a Toll Road Concessionaire Agreement with the Department of Public Works of the Republic of
Indonesia (DPU) for the right to develop, operate and maintain Makassar Section IV Toll Road for a period of
66
thirty-five (35) years, including construction period. The toll road has been in operations since 2008. Makassar
Section IV toll road is a 12-km toll road that connects Tallo Bridge to the Mandai Makassar intersection, providing
access to Sultan Hasanuddin International Airport as well as the national road to Maros, Indonesia.
BMN entered into a joint operation agreement with PT Jasa Marga (Persero) Tbk (Jasa Marga), a third-party toll
road operator in Indonesia, for the operations of Ujung Pandang toll road. BMN will operate the said toll road for
thirty (30) years and after which, the toll roads, including all the facilities in the area, will be handed over to Jasa
Marga. The toll road has been in operations since 1998. In October 2017, BMN was granted by the Ministry of
Public Works Republic Indonesia the extension of the concession period for the Ujung Pandang toll road to 2043.
Ujung Pandang toll road is a 6- km toll road connects Soekarno-Hatta port in Makassar and A.P. Pettarani road
(Urip Sumoharjo flyover). Pettarani toll road, which is an extension of the Ujung Pandang toll road, is a 4-km toll
road that will connect Soekarno-Hatta Port (Makassar) and Sultan Hasanuddin Airport to Makassar’s business
district and city center. Construction of the Pettarani toll road is still ongoing and is expected to be completed by
2020.
SCTK is a water treatment plant and water distribution company which operates in Desa Cijeruk, East Serang
Regency, Banten, Indonesia and accommodates industrial, commercial and household needs of clean water at
total capacity of 375 liters per second. Its water treatment plant sources its raw water from Ciujung River, East
Serang, Banten which is serving over 140 factories in various industrial estates.
DCC is a holder of a 20-year water treatment concession in Medan Industrial Estate or Kawasan Industri Medan
(KIM), North Sumatera. The plant is servicing potential demand up to 250 liter per second clean water supply and
sources its raw water from the Deli River to supply clean water to 153 factories in KIM Industrial Estate.
RPSL is an independent power producer for Siantan Biomass Powerplant in Mempawah, West Kalimantan with a
capacity of 15MW. It is contracted to supply 8MW to the State Electricity Company (PLN) and is the first Biomass
Power Plant in West Kalimantan.
Dependence on Licenses and Government Approval
Necessary government approvals in relation to the operation of the toll roads have been secured and
documented in the related concession agreements. The concession agreements establish a toll rate formula and
adjustment procedure for setting the appropriate toll rate.
Effect of Existing or Probable Governmental Regulations on the Business
There are no anticipated changes to government regulations that will significantly affect the toll business of the
Group.
However, the main variable affecting the extent or likelihood of earnings growth at MPTC is the ability of the
subsidiaries to secure the tariff adjustments they are owed under the regulatory frameworks that govern their
concessions. NLEX Corp and CIC derive substantially all of their revenues from toll collections from the users of
the toll roads.
On March 6, 2019, NLEX Corp received the TRB’s order to publish the adjusted toll rates for the NLEX System (the
“Order”). The Order contains the adjusted authorized final period adjustments for the whole NLEX system due in
2013 (2012 Petition) and 2015 (2014 Petition) constituting 50% of the approved adjustment (with the remaining
adjustments to be implemented in subsequent years), and the provisional add-on toll rate for the NLEX open
system due to the opening of the NLEX Harbor Link Project. The TRB issued the Notice to Collect on March 20,
2019. NLEX Corp implemented the toll rate adjustments effective March 21, 2019.
On June 14, 2019, NLEX Corp. implemented the Petition for Periodic Toll Rate Adjustment effective 2012 in the
SCTEX. Apart from this Petition, all the remaining toll rate adjustments for SCTEX remain pending with the TRB.
In October 2019, the TRB approved the add-on toll rate for Phase 1 of the R-1 Enhancement Project on Segment
1 (R-1 Expressway) of the CAVITEX. The new toll increase was implemented on October 24, 2019. The additional
toll rates shall be added on to the toll rates authorized as of 2009. These add-on toll rates are intended to cover
the enhancement of the R-1 Expressway, which include the widening of R-1 Expressway with an addition of one
(1) lane in both directions, converting the carriageways from 2x3 lanes to 2x4 lanes, or a total of 5.20 kms. along
each direction, as well as the construction of the Marina Bay flyover and left-turning lanes.
67
In October 2019, the TRB has approved the initial toll for the first 2.2 kilometers of the Segment 3A-1 toll rate
adjustments which were due since January 1, 2012 for both R1 and R1-Extension is portion of the C-5 Link
Expressway, which forms part of the Manila-Cavite Toll Expressway Project (MCTEP). The initial toll was
implemented on October 24, 2019.
In November 2019, JTSE implemented its new effective toll rates based on the Decree of Minister of Public Works
No. 1076/KPTS/M/2019.
In February 2020, the TRB issued the Toll Operation Permit (TOP) for the CALAX Sub-sections 6 to 8. TRB issued
the Notice to Start Collection effective February 11, 2020.
Customers
The toll road business of the Company enjoys sole concession as provided for in the concession agreements.
Moreover, this segment is mass-based such that the loss of a few customers would not have a material adverse
effect on MPIC and its subsidiaries taken as a whole. There is also no single customer that accounts for twenty
percent (20%) or more of the segment’s sales.
Sales contributed by foreign sales
Revenue contribution from PT Nusantara amounted to P=2.2 billion in 2019.
For the year ended December 31, 2019, net foreign contribution from investments in CII B&R, DMT, JLB (a
material associate of PT Nusantara)through share in equity in net earnings, contributed approximately P=584
million to MPIC’s consolidated income before tax.
Distribution
Tollroad revenues are from manual toll fee payment, electronic toll collection and badges/cards for buses, trucks
and jeepneys.
Competition
While the tollroad companies were granted sole right to operate and maintain toll roads under their respective
concession agreements, alternative routes and roads are the toll roads’ competitors:
▪ NLEX. A viable alternative road to North Luzon is the MacArthur Highway, a road extending from Manila to
Pangasinan that passes through small towns. The NLEX has historically served as the main artery between
Metro Manila and Central and Northern Luzon and as such, it has a long and stable track record of traffic
volume. Further, the NLEX has a stable service area, which is characterized by the lack of comparable
competing traffic routes and the resilience of the user profile.
▪ CAVITEX. The free alternative routes to the R1 Expressway and R1 Extension are Quirino Avenue, Aguinaldo
Highway, Tirona Highway and Evangelista Road. While these roads are complementary to the R1 Expressway
and R1 Extension, they do not offer the same direct and contiguous route from northern Cavite to Metro
Manila and vice-versa. The alternative roads have limited capacity and narrow lanes and are controlled by
traffic lights and stop signs which are heavily congested at peak times.
▪ PT Nusantara’s competitors are mostly within Indonesia’s toll road networks or free alternative roads. BSD
belongs to a wide toll road network in the Jakarta metropolitan area, hence, there are various alternative toll
roads but serving different routes. However, competition with these other toll roads within the network is
present for customers coming from West of the metropolitan area to Central Jakarta and vice versa. For
Nusantara’s toll roads located in Makassar, there are free alternative roads to BMN and JTSE but have limited
capacity and are heavily congested during peak times. There are no other toll roads in Makassar.
Traffic volumes on the tollroads are likewise affected by competition from alternative modes of transportation
and there can be no assurance that existing modes of transport will not significantly improve their services.
The Company continues to promote traffic growth on these tollroads by providing more entry and exit points
along the expressway. Likewise, the Company continues to boost the value proposition of its tollroads by
implementing measures to enhance customer satisfaction, safety, and convenience. While there is insignificant
68
threat posed by competing toll roads in the Philippines covered by NLEX Corp and CIC’s concessions, there is
competition elsewhere from Ayala Corporation, which was awarded the contract to build the Daang Hari-SLEX
Link, and San Miguel Corporation, which invested in the controlling shareholders of Metro Manila Skyway, South
Luzon Expressway, Tarlac-Pangasinan-La Union Expressway and NAIA Expressway.
Source and availability of raw materials
CIC’s main supply contract consists of the O&M Agreement PEA Tollway Corporation (“PEATC”) for the operations
and maintenance of CAVITEX.
On October 1, 2016, CIC and Metro Pacific Tollways Management Services Inc. (MPTMSI, a wholly-owned
subsidiary of MPTC) entered into a Toll Collection Services Agreement to facilitate the toll collection function of
CIC. PEATC and MPTMSI provide CIC with the following operations and maintenance services:
▪ Collection of toll fees from motorists at toll plazas, both in cash and electronic form;
▪ Routine maintenance and repairs of the road and equipment; and
▪ Management of CAVITEX in order to, among other things, improve traffic flows, maintain road safety, and
enhance the facilities and services along CAVITEX.
Transactions with related parties
See details and other related party transactions disclosed under Note 19, Related Party Transactions to the 2019
Audited Consolidated Financial Statements.
Costs and effects of compliance with environmental laws
Prior to the commencement of construction activities, the grantee must obtain an ECC from the DENR. An ECC
typically requires the grantee to submit its proposed policies for, among others, (1) relocation and compensation
of individuals and families who are affected by the toll road project, (2) mitigation of the effects of the toll road
project on the natural environment, (3) environmental monitoring, and (4) public information and education
regarding the toll road project. In addition, the ECC typically requires the grantee to submit a quarterly report of
its environmental monitoring activities.
NLEX Corp and CIC have dedicated teams that regularly monitor compliance with its ECCs and ensure
measurement of significant environmental metrics for purposes of compliance with the reporting requirements
under its loan agreements. Quarterly air quality sampling is conducted to measure the level of pollutants and
harmful particulates along the toll roads. A solid and hazardous waste management system is also in place to
ensure proper waste disposal and compliance with the Ecological Solid Waste Management Act of 2001 and Toxic
Substances and Hazardous Wastes Control Act of 1990. All required areas for reclamation and re-vegetation are
regularly monitored and maintained to prevent soil erosion and scouring along river banks and slope areas.
PT Nusantara ensures that all projects are reviewed and evaluated against the following social and environment
requirements of relevant and applicable Indonesian laws on environment, health, safety and social issues. They
committed to follow a Social and Environmental Management System (SEMS) that details the policy, operating
procedures, institutional arrangements and workflow to identify social and environmental risks that may arise
from the projects it is involved in, and therefore ensure the avoidance, minimization or mitigation of those risks
during the entire cycle from project inception, through appraisal, tendering, award, construction, maintenance
and decommissioning.
Status of any publicly announced product or services
Certain toll projects are either under pre-construction or on-going construction.
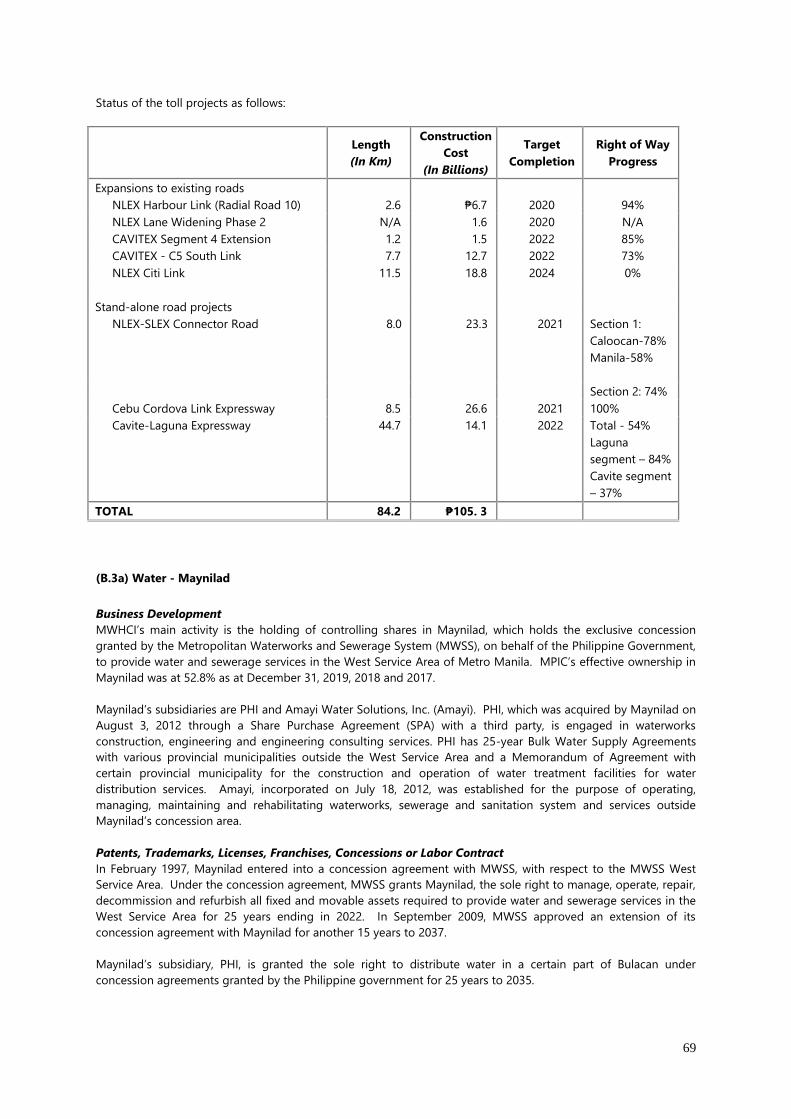
69
Status of the toll projects as follows:
Length
(In Km)
Construction
Cost
(In Billions)
Target
Completion
Right of Way
Progress
Expansions to existing roads
NLEX Harbour Link (Radial Road 10) 2.6 ₱6.7 2020 94%
NLEX Lane Widening Phase 2 N/A 1.6 2020 N/A
CAVITEX Segment 4 Extension 1.2 1.5 2022 85%
CAVITEX - C5 South Link 7.7 12.7 2022 73%
NLEX Citi Link 11.5 18.8 2024 0%
Stand-alone road projects
NLEX-SLEX Connector Road 8.0 23.3 2021 Section 1:
Caloocan-78%
Manila-58%
Section 2: 74%
Cebu Cordova Link Expressway 8.5 26.6 2021 100%
Cavite-Laguna Expressway 44.7 14.1 2022 Total - 54%
Laguna
segment – 84%
Cavite segment
– 37%
TOTAL 84.2 ₱105. 3
(B.3a) Water - Maynilad
Business Development
MWHCI’s main activity is the holding of controlling shares in Maynilad, which holds the exclusive concession
granted by the Metropolitan Waterworks and Sewerage System (MWSS), on behalf of the Philippine Government,
to provide water and sewerage services in the West Service Area of Metro Manila. MPIC’s effective ownership in
Maynilad was at 52.8% as at December 31, 2019, 2018 and 2017.
Maynilad’s subsidiaries are PHI and Amayi Water Solutions, Inc. (Amayi). PHI, which was acquired by Maynilad on
August 3, 2012 through a Share Purchase Agreement (SPA) with a third party, is engaged in waterworks
construction, engineering and engineering consulting services. PHI has 25-year Bulk Water Supply Agreements
with various provincial municipalities outside the West Service Area and a Memorandum of Agreement with
certain provincial municipality for the construction and operation of water treatment facilities for water
distribution services. Amayi, incorporated on July 18, 2012, was established for the purpose of operating,
managing, maintaining and rehabilitating waterworks, sewerage and sanitation system and services outside
Maynilad’s concession area.
Patents, Trademarks, Licenses, Franchises, Concessions or Labor Contract
In February 1997, Maynilad entered into a concession agreement with MWSS, with respect to the MWSS West
Service Area. Under the concession agreement, MWSS grants Maynilad, the sole right to manage, operate, repair,
decommission and refurbish all fixed and movable assets required to provide water and sewerage services in the
West Service Area for 25 years ending in 2022. In September 2009, MWSS approved an extension of its
concession agreement with Maynilad for another 15 years to 2037.
Maynilad’s subsidiary, PHI, is granted the sole right to distribute water in a certain part of Bulacan under
concession agreements granted by the Philippine government for 25 years to 2035.
70
On February 19, 2019, Amayi Water Solutions, Inc., a wholly owned subsidiary of Maynilad, entered into a
concession agreement with the Municipality of Boac, Marinduque. The concession agreement shall be effective
for a period of 25 years beginning on the commencement date.
Dependence on Licenses and Government Approval
Necessary government approvals in relation to the operation of the water business have been secured and
documented in the related concession agreements.
Under Maynilad’s concession agreement with the Philippine Government, Maynilad is entitled to tariff rate
adjustments based on movements in the Philippine consumer price index, foreign exchange currency differentials,
and following a rate rebasing process conducted every five years (Rate Rebasing) and certain extraordinary
events. Any rate adjustment requires approval by MWSS and the Regulatory Office (RO). Any tariff adjustments
that are not granted, in a timely manner, in full or at all, could have a material adverse effect on the Maynilad’s
results of operations and financial condition as well as MPIC. However, the Republic of the Philippines has
provided Maynilad with a “make whole” guarantee in respect of any interference by any government agency in
the setting of the tariff.
On December 11, 2019, Maynilad received a letter from the MWSS informing Maynilad that the MWSS Board of
Trustees, in a special meeting held on December 5, 2019, passed a resolution revoking the resolution that
approved the extension of Maynilad’s Concession Agreement from its original expiry of 2022 to 2037 (the
“Subject Resolution”).
The MWSS Board of Trustees likewise revoked a similar resolution that extended the term of the Concession
Agreement of the other concessionaire.
Subsequently, however, when Maynilad formally asked the MWSS and the Regulatory Office what the effect of
the Subject Resolution is, the Regulatory Office, in a letter to Maynilad dated December 23, 2020, stated that “as
of to date, the 25-year Concession Agreement (CA) that covers the years 1997 to 2022 and the Memorandum of
Agreement (MOA) that provides for the 15-year extension of the concession period from year 2022 to 2037 have
not yet been cancelled.”
On December 9, 2019, Maynilad received a letter from MWSS informing the former that the latter was directed to
perform a review of the Concession Agreement. The amendments to the provisions of the Concession
Agreement may affect, among others, future tariff increases and service commitments, and the concession period.
Any future amendments to the provisions of the Concession Agreement will be reflected in the financial
statements as these are determined. As of February 26, 2020, Maynilad is awaiting the draft of the amendments
to its Concession Agreement.
Effect of Existing or Probable Governmental Regulations on the Business
The matter of the Maynilad tariff implementation remains unresolved as does the related claim on the Republic of
the Philippines.
On December 29, 2014, Maynilad’s water tariff under the rate rebasing for the period from 2013 to 2017 (the
“Rebasing Period”) received a favourable award in arbitration proceedings in the Philippines. However, the MWSS
has not implemented the awarded tariff increase.
Maynilad subsequently proceeded to arbitration in Singapore and the final hearing was completed in December
2016. On July 24, 2017, the three-person Arbitral Tribunal (the “Tribunal”) unanimously upheld the validity of
Maynilad’s claim against the undertaking letter issued by the Republic, through the Department of Finance, to
compensate Maynilad for the delayed implementation of its relevant tariffs for the Rebasing Period.
The Tribunal ordered the Republic to reimburse Maynilad ₱3.4 billion (subsequently adjusted to ₱3.2 billion) for
losses from March 11, 2015 to August 31, 2016, without prejudice to any rights that Maynilad may have to seek
recourse against the MWSS for losses incurred from January 1, 2013 to March 10, 2015. Further, the Tribunal ruled
that Maynilad is entitled to recover from the Republic its losses from September 1, 2016. On February 9, 2018, the
Republic filed an application with the High Court of Singapore to set aside the arbitration award issued on July
24, 2017 and seeks to have a sealed hearing rather than an open court process.
71
On September 4, 2018, the High Court of Singapore dismissed the Republic’s application to set aside the Second
Award and awarded S$40,000.00 in favor of Maynilad by way of costs. The Republic did not appeal the decision to
the Singapore Court of Appeal within the prescribed 30-day period, hence, the dismissal of the Republic’s
application became final on October 4, 2018.
As at December 31, 2018, Maynilad has an outstanding claim against the Republic of the Philippines (ROP),
through the Department of Finance (DOF), in relation to the decision of the Arbitral Tribunal to compensate
Maynilad for the delayed implementation of its relevant tariffs for the rebasing period 2013 to 2017 in the
amount of P=3.18 billion and cost of litigation of litigation amounting to S$40,000.
Total claim from the DOF at ₱6.7 billion comprising of the ₱3.18 billion fixed award and the remaining as variable
award still to be resolved. As at December 31, 2017, Maynilad’s total cumulative revenue losses due to the delayed
implementation of the arbitration awards are estimated at P=11.4 billion.
On September 13, 2018, the MWSS issued Resolution No. 2018-136-RO adopting RO Resolution No. 2018-09-CA
dated September 7, 2018 granting Maynilad a partial rate adjustment of P=5.73/cu.m. for the Fifth Rate Rebasing
Period (2018 to 2022), to be implemented on an uneven staggered basis of (i) P=0.90/cu.m. effective October 1,
2018; (ii) P=1.95/cu.m. effective January 1, 2020, (iii) P=1.95/cu.m. effective January 1, 2021, and (iv) P=0.93/cu.m.
effective January 1, 2022. The approved rate adjustment still does not include the corporate income tax (“CIT”)
component to which Maynilad is entitled by virtue of the First Award. In their Resolutions, the MWSS and RO
stated that the inclusion of the CIT in Maynilad’s tariff is subject to the SC’s resolution of MWSS’s Petition for
Review.
To preserve its right to the CIT which has already been adjudged in its favor in the First Award, and pursuant to
Article 12 of the Concession Agreement, Maynilad, on October 12, 2018, filed a Dispute Notice, signaling the start
of another arbitration. However, on November 9, 2018, MWSS and Maynilad filed a joint application with the
Appeals Panel to suspend proceedings to give the parties time to try to settle their differences amicably.
On February 11, 2019, Maynilad wrote the DOF about the amount of its updated claim for compensation by the
ROP, which is P=6.7 billion with a request that the DOF order the MWSS and the MWSS-Regulatory Office to meet
with Maynilad to agree and discuss a proposed settlement of the updated claim.
The rate adjustment for January 1, 2020 was not implemented. On January 2, 2020, Maynilad executed the
Release From and Waiver of Claim on Arbitral Award (“Waiver”) in favor of the ROP. In its Waiver, Maynilad
waived its claim against the ROP for P=6.7 billion which represents Maynilad’s foregone revenues for the period
March 11, 2015 to December 31, 2017. Maynilad emphasized that the Waiver does not constitute an admission
of any unlawful act or liability of any kind on the part of Maynilad and the ROP, and may not be used as evidence
in any legal proceeding except to enforce or challenge its terms.
Customers
The water business of the Company, through Maynilad enjoys a sole concession of Metro Manila’s West Service
Area. This segment is mass-based such that the loss of a few customers would not have a material adverse effect
on MPIC and its subsidiaries taken as a whole. There is also no single customer that accounts for twenty percent
(20%) or more of the segment’s sales.
Distribution
Water is distributed through Maynilad’s network of pipelines, pumping stations and mini-boosters. As at
December 31, 2019, Maynilad's network consisted of around 7,713 kms of total pipeline.
Competition
Maynilad has no direct competition given that it has right to provide water and sewerage services to the West
Service Area under its concession agreement with the Philippine Government.
Under Maynilad’s Concession Agreement, MWSS grants Maynilad (as contractor to perform certain functions and
as agent for the exercise of certain rights and powers under the Charter), the sole right to manage, operate,
repair, decommission and refurbish all fixed and movable assets required (except certain retained assets of
MWSS) to provide water and sewerage services in the West Service Area up to 2037.
72
Source and availability of raw materials
Under Maynilad’s Concession Agreement, MWSS supplies raw water to Maynilad’s distribution system and is
required to supply a minimum quantity of raw water. Maynilad currently receives substantially all of its water
from MWSS.
Maynilad has some supply side risk in that: (i) it secures most of its supply from a single source – the Angat dam;
and (ii) this water source is shared by another water concessionaire, a hydroelectric plant, and the needs of
farmers for irrigation. A water usage protocol is in place to ensure all users receive water as expected within the
constraints of available supply. Following significant water supply disruption in late 2009 arising indirectly from
typhoons, the business entered 2010 with less water supply available than allowed for in its concession. Maynilad
has worked to moderate its reliance on Angat by developing the Putatan Water Treatment Plant while continuing
to reduce leakage and theft rates.
Transactions with related parties
Maynilad, entered into certain construction contracts with D.M. Consunji, Inc., a subsidiary company of DMCI
Holdings, Inc. (DMCI, a non-controlling shareholder in MWHCI), in relation to the provision of engineering,
procurement and construction services to Maynilad.
Costs and effects of compliance with environmental laws
Maynilad’s wastewater facilities are required to be maintained in compliance with environmental standards set
primarily by the Department of Environment and Natural Resources (DENR) regarding effluent quality. All projects
are assessed for their environmental impacts, and, where applicable, must obtain an Environmental Compliance
Certificate from the DENR prior to construction or expansion. Subsequent to construction, effluents from
facilities, such as sewage and septage treatment plants, are routinely sampled and tested against DENR standards
using international quality sampling and testing procedures.
Maynilad has made efforts to meet and exceed all statutory and regulatory standards. Maynilad’s regular
maintenance procedures involve regular disinfection of service reservoirs and mains and replacement of corroded
pipes. Maynilad believes all wastewater treatment processes and effluents meet the current standards of the
DENR.
Maynilad’s Dagat-Dagatan Sewage and Septage Treatment Plant in Caloocan is the first facility of its kind in the
Asia-Pacific Region to attain triple international standard accreditations on Quality Management (ISO 9001:2008)
and Environmental Management (ISO 14001:2004) in January 2007, and Occupational Safety and Health
Management (OHSAS 18001:2007).
(B.3b) Water - MPW
Business Development
MPIC’s wholly-owned subsidiary, MPW is pursuing water infrastructure projects and other water-related
investments across the Philippines.
As at December 31, 2019, MPW’s subsidiaries hold the following concession rights:
▪ Through 95% in Cagayan De Oro Bulk Water Inc. (COBI) through its wholly-owned subsidiary, MetroPac
Cagayan De Oro Holdings, Inc. (MCOH). COBI holds a 30-year 100 million liters per day (MLD) Bulk Water
Supply Project (CDO Project). Operations commenced effective December 31, 2017.
▪ Through 80% in Metro Iloilo Bulk Water Supply Corporation (MIBWSC). MIBWSC holds a 25-year 170 million
liters per day (MLD) Bulk Water Supply Project (Metro Iloilo Project). On July 5, 2016, MIBWSC officially took
over water production operations from the MIWD.
▪ Through 80% in Metro Pacific Iloilo Water Inc. (MPIWI). MPIWI, a joint venture between MPW and Metro
Iloilo Water District (MIWD), holds a 25-year concession to rehabilitate, operate, maintain and expand
MIWD’s existing water distribution system and construct wastewater facilities in Iloilo City. MPIWI
commenced operations in July 2019.
73
▪ Through 80% in Metro Pacific Dumaguete Water Services Inc. (MPDW). MPDW holds a 25-year concession to
rehabilitate, operate, maintain and expand Dumaguete City Water District’s (DCWD) existing water
distribution system and develop wastewater facilities in Dumaguete City. As at February 26, 2020, the
conditions precedent for the declaration of commencement date has not yet been achieved.
▪ Through 52.5% in B.O.O Phu Ninh Water Treatment Plant Joint Stock Company (PNW). Pursuant to a 50-year
BOO contract with the Chu Lai Open Economic Zone Authority, PNW is licensed to develop a water supply
system that will meet clean water demand in the Chu Lai Open Economic Zone, and urban areas, industrial
zones and adjacent rural areas in Quang Nam province. PNW has substantially completed the construction
and commissioning of a water treatment plant with capacity of 25 MLD and has potential to increase its
capacity to 300 MLD.
MPW also has interest in the following entities:
▪ Effective interest of 27% in Laguna Water District Aquatech Resources Corp. (LARC) through its direct ownership
of 30% in EquiPacific HoldCo Inc. (EquiPacific). LARC implements the Joint Venture Project (JV Project) for the
financing, rehabilitation, improvement, expansion, operation and maintenance of the Water Supply System of
the Joint Venture Area covering the municipalities of Los Banos, Bay, Calauan and Victoria of the Province of
Laguna. LARC commenced the operation and management of the distribution network of the Laguna Water
District (LWD) on January 1, 2016.
▪ Effective economic interest of 27% in Cebu Manila Water Development, Inc. (CMWD) through its direct
ownership of 39% in Manila Water Consortium Inc. (MWCI). CMWD holds a 20-year Water Purchase
Agreement (WPA) for the supply of 18 MLD for the first year and 35 MLD of water for the 2nd to 20th year to
Metropolitan Cebu Water District (MCWD).
▪ Effective interest of 49% in Tuan Loc Water Resources Investment Joint Stock Company (TLW) through its
wholly-owned subsidiary, Metro Pacific TL Water International Limited. TLW is one of the largest water
companies in Vietnam, with 310 MLD of installed capacity. TLW’s main project assets are the: (1) Song Lam
Raw Water Plant, (2) Ho Cau Moi Water Treatment Plant, and (3) Nhon Trach 6A Sewage Treatment Plant.
MPW also has a 65% ownership in ESTII. ESTII is engaged in the business of designing, supplying, constructing,
installing, and operating and maintaining wastewater and sewage treatment plant facilities. The transaction
allows MPIC, through MPW, to diversify its water sector investment holdings and invest in the high growth
wastewater Engineering, Procurement and Construction (EPC) and Operation & Maintenance (O&M) markets.
Patents, Trademarks, Licenses, Franchises, Concessions or Labor Contract
See discussion above and disclosures in Note 29, Significant Contracts, Agreements and Commitments -
Concession Arrangements to MPIC’s 2019 Audited Consolidated Financial Statements.
MPW’s subsidiary, ESTII owns certain patents and utility models relating to water/wastewater treatment, the use
of which are governed by an exclusive and perpetual license.
Dependence on Licenses and Government Approval
Various government agencies and regulatory bodies require the possession of certain licenses and permits with
respect to water extraction, treatment and distribution. The Company maintains compliance with the
requirements and conditions for obtaining and maintaining such licenses and permits.
The guidelines implemented by the National Water Resources Board (NWRB) and/or the Local Water Utilities
Administration (LWUA) regulate the water tariffs that may be charged by water distribution companies to
customers. The Company maintains adequate operational and financial documentations, conducts robust studies
and implementation plans, and maintains regular dialogue with local government and regulatory authorities to
ensure compliance with the requirements and conditions needed for the approval of proposed water tariff
adjustments.
74
Customers
MPW’s investees were granted sole right to supply and/or distribute water to districts/areas as per their
respective joint venture agreements with the local water districts (see “Patents, Trademarks, Licenses, Franchises,
Concessions or Labor Contract”).
For the year ended December 31, 2019, revenues from these customers do not represent a significant percentage
of MPIC’s consolidated water revenues.
Sales contributed by foreign sales
Revenue contribution from the water concession operated by PNW amounted to P=5million from the date of
business combination, September 5, 2019.
Foreign contribution from investments in PNW (prior to date of business combination) and TLW under share in
equity in net earnings is disclosed in Note 10, Investments and Advances to MPIC’s 2019 Audited Consolidated
Financial Statements.
Distribution
MPW, through its subsidiaries and associates, delivers treated water to customers through a system of
transmission and distribution pipelines, reservoirs and pumping stations
Competition
The water supply agreements that are in place, and the significant cost of putting up competing water production
and distribution facilities in the same service area generally restrict other private water operators’ from supplying
to customers currently being served by MPW through its subsidiaries and associates.
Source and availability of raw materials
Sources of water requirements as follows:
Company Water Source
Domestic:
MIBWSC Maasin Dam
LARC 90% from groundwater, and 10% from a bulk water
supplier
Vietnam:
Song Lam Raw Water Plant Lam River
Ho Cau Moi Water Treatment Plant Cau Moi Lake
PNW Water Treatment Plant Phu Ninh Lake
MIBWSC currently sources a significant portion of its raw water requirement from the Maasin Dam and treats
close to around eighty percent (80%) of its water requirement through the Sta. Barbara water treatment plant.
Other sources of water by MIBWSC are groundwater and bulk water suppliers. MIBWSC is undertaking
preparatory activities for the development of additional water sources and the construction of new water
treatment facilities for the expansion phases.
MPIWI sources all its potable water requirements from the Metro Iloilo Water District.
MPDW shall source all its water requirements from groundwater.
Transactions with related parties
ESTII, a subsidiary of MPW, entered into contracts with Maynilad for the construction of wastewater treatment
plants. MIBWSC also has a technical services agreement with Maynilad for the provision of technical and
specialized services relating to maintenance, operation, expansion, rehabilitation of facilities, and other related
works and also entered into a management services agreement with MPW for the provision of accounting,
treasury, branding, corporate governance, information technology and other management services. Transaction
with Maynilad are eliminated in the process of consolidation.
75
Costs and effects of compliance with environmental laws
All projects are assessed for their environmental impacts, and, where applicable, must obtain an Environmental
Compliance Certificate from the DENR prior to construction or expansion.
Status of any publicly announced products and services
MPDW has not commenced operations yet pending fulfillment of conditions precedent to the signing of the Joint
Venture Agreement.
(B.4) Healthcare
Business Development
MPIC’s Hospital group comprises of full-service hospitals and a mall-based diagnostic and surgical center and is
the largest private provider of premier hospital services in the Philippines. It delivers medical services including
diagnostic, therapeutic and preventive medicine services in all three major island groupings in the country.
MPHHI completed the following acquisitions in 2019, 2018 and 2017:
▪ On December 11, 2019, MPHHI completed its acquisition of a 77.1% interest in Santos Clinic Incorporated
(SCI), owner and operator of Manuel J Santos Hospital (MJSH) a 100-bed Level 2 hospital in Butuan, Mindanao.
Total consideration paid amounted to P=373 million.
▪ From August to October 2018, MPHHI purchased 132,975 shares of DDH for aggregate consideration of P=669
million which increased its ownership from 35.16% to 49.91%.
▪ On October 5, 2017, MPHHI completed the acquisition of a 54% stake in St. Elizabeth Hospital, Inc. (SEHI), a
248-bed tertiary level hospital located in General Santos City on December 8, 2017, MPHHI made an
additional cash infusion in SEHI through subscription of primary shares that increased its interest in SEHI to
80%. The cash infusion from MPHHI was intended for expansion and improvement of facilities and for the
purchase additional medical equipment.
▪ On January 31, 2017, MPHHI infused approximately P=133.5 million of cash into Delgado Clinic Inc. (DCI),
owner and operator of the Dr. Jesus C. Delgado Memorial Hospital (JDMH) via a subscription to preferred
shares representing approximately 65% of the total expanded capital stock of DCI. The cash infusion from
MPHHI is intended for the upgrade of equipment and facilities.
On October 14, 2019, MPIC, together with MPHHI, entered into a series of transactions for the investment
and entry of global investment firm KKR & Co..
Customers
As at December 31, 2019, MPHHI had interest in fourteen (15) hospitals with approximately 3,100 beds
throughout the country:
▪ Eight (8) in Metro Manila: Makati Medical Center (MMC), Cardinal Santos Medical Center (CSMC), Our Lady of
Lourdes Hospital (OLLH), Asian Hospital (AHI), De Los Santos Medical Center (DLSMC), Manila Doctors
Hospital (MDH), MVMC and JDMH; and
▪ Seven (7) in other parts of the country: Davao Doctors Hospital (DDH), Riverside Medical Center (RMCI) in
Bacolod, Central Luzon Doctors Hospital (CLDH) in Tarlac, West Metro Medical Center (WMMC) in
Zamboanga, Sacred Heart Hospital of Malolos Inc. (SHHM) in Bulacan, SEHI in General Santos City and MJSH
in Butuan.
In addition, MPHHI has also invested in mall-based primary care clinics in MegaClinic in SM Megamall and
TopHealth in SM San Lazaro, and opened Metro Sanitas in Met Live Pasay; newly-built cancer centers in joint
venture with Lipa Medix in Batangas and with our own hospitals, CLDH in Tarlac and RMCI in Bacolod; and has
indirect ownership in two healthcare colleges, Davao Doctors College in Davao and Riverside College Inc. in
Bacolod.
76
This segment is mass-based such that the loss of a few customers would not have a material adverse effect on
MPIC and its subsidiaries taken as a whole. There is also no single customer that accounts for twenty percent
(20%) or more of the segment’s sales.
Dependence on Licenses and Government Approval
The Department of Health (DOH) through the Health Facilities and Services Regulatory Bureau (HFSRB) exercises
the regulatory functions over hospitals. The HFRSB’s functions included standards setting for regulation of health
facilities and services; and issuances of (i) permit to construct (PTC), (ii) license to operate (LTO), (iii) clearance to
operate (CTO), (iv) Health Maintenance Organizations (HMOs), and (v) certificate of accreditation (COA).
Hospitals are required to obtain the following permits or licenses from the HFSRB: (1) prior to the construction of
the hospital, the operators must have its plans approved and acquire a Permit to Construct; and (2) prior to its
operation, it must be registered and the operators must obtain a License to Operate. The Permit to Construct is
required for the construction of a new hospital, substantial alteration, expansion or renovation of an existing
hospital, a change in its classification, or an increase in bed capacity. It is a prerequisite for a license to operate.
The license to operate is required for the operation of a hospital. It is secured after the construction and
completion of the hospital. In order for a hospital to be registered and issued a license, it must comply with the
minimum standards as well as other rules and regulations prescribed by the HFSRB. The license to operate a
hospital shall be automatically renewed every year upon the submission of certain requirements.
Under Presidential Decree No. 1586, ‘‘Environmental Impact Statement (EIS) System’’ (PD 1586), hospitals are
required to secure an Environmental Compliance Certificate (ECC) prior to the construction and operation of new
hospital buildings or expansion of existing hospitals as well as or the installation and operation of health care
waste treatment systems like pyrolosis, autoclave, microwave, landfills, and other similar treatment technology.
The Company’s hospitals are fully compliant with these regulations and have secured necessary ECCs and licenses
to operate.
Competition
Major competitors in the healthcare business include other tertiary hospitals. However, increasing health
awareness creates unsatisfied demand in the industry.
MPHHI uses its skill as a corporate manager to enhance operating efficiency and streamline the business models
of its hospitals. Additionally, MPHHI continues to realize economies of scale through group purchasing and the
sharing of technical and human resources.
Transactions with related parties
Colinas Healthcare, Inc. (CHI) (a wholly-owned subsidiary of Colinas Verdes Hospital Managers Corporation)
operates and manages the MERALCO Corporate Wellness Center (Wellness Center), an outpatient diagnostic and
consultation center for its employees and their dependents.
Effect of Existing or Probable Government Regulations on the Business
Republic Act No. 11223 or the Universal Health Care Law, approved on February 20, 2019 automatically enrolls all
Filipino citizens in PhilHealth and prescribes complementary reforms in the health system. Under the act,
contributors of PhilHealth are divided into direct and indirect. Direct contributors refer to those who have the
capacity to pay premiums, are gainfully employed and are bound by an employer-employee relationship, or are
self-earning, professional practitioners, migrant workers, including their qualified dependents, and lifetime
members. Indirect contributors, on the other hand, refer to all others not included as direct contributors, as well
as their qualified dependents, whose premium shall be subsidized by the national government including those
who are subsidized as a result of special laws. The act also mandates that in availing any of the health services
provided in the National Health Program, providers shall not require from the member a PhilHealth Identification
Card.
The Universal Health Care Law further mandates for private hospitals to operate not less than 10% of their bed
capacity as basic or ward accommodation. Basic ward or accommodation, under the law, refers to the provision of
regular meal, bed in shared room, fan ventilation, and shared toilet and bath. The law also requires hospitals to
submit a report on the allotment or percentage of their bed capacity to basic or ward accommodation to DOH.
77
Under the draft of the implementing rules and regulations, existing hospitals will be given until the end of 2022 to
fully comply with the required bed capacity.
The Universal Health Care Law also requires health service providers and insurers to maintain a health information
system consisting of enterprise resource planning, human resource information, electronic health records, and an
electronic prescription log consistent with DOH standards, which shall be electronically uploaded on a regular
basis through interoperable systems This health information system shall be developed and funded by the DOH
and PhilHealth. Accordingly, patient privacy and confidentiality shall at all times be upheld, in accordance with the
Data Privacy Act.
The Hospital Group is currently evaluating the impact and shall enforce the implementation and compliance of
entities covered by RA 11223.
As of February 26, 2020, the DOH and PhilHealth have yet to issue the implementing rules and regulations of the
Universal Health Care Law.
(B.5) Rail
Business Development
MPIC operates its rail business through its wholly-owned subsidiary, MPLRC. MPLRC’s main activity is the holding
of shares both at Light Rail Manila Holdings Inc. (LRMH) as well as LRMC. LRMC holds the exclusive concession
granted by the Department of Transportation (DOTr) and Light Rail Transit Authority (LRTA), on behalf of the
Philippine Government to operate and maintain the existing LRT Line 1, as well as to extend the south line from
Baclaran to Niog, Cavite. LRMH holds shares in LRMC. MPLRC’s effective stake at LRMC (directly and through
LRMH) as at December 31, 2019 and 2018 was 55%.
Patents, Trademarks, Licenses, Franchises, Concessions or Labor Contract
On October 2, 2014, LRMC entered into a concession agreement with DOTr and LRTA. Under the concession
agreement, DOTr and LRTA granted LRMC the exclusive right to operate and maintain the existing LRT-1 and
construct an 11.7-kilometer extension from the present end-point at Baclaran to the Niog area in Bacoor, Cavite.
LRMC was formally awarded the project by the DOTr and LRTA following the submission of a lone bid with a
premium of P=9.35 billion. The concession period is for 32 years from takeover date and ends in 2047.
DOTr granted an Operating Franchise to LRMC on September 11, 2015. LRMC took over the operations and
maintenance of LRT-1 the next day, September 12, 2015.
Dependence on Licenses and Government Approval
Necessary government approvals in relation to the operation of the rail business and the related non-rail
revenues have been secured and documented in the related concession agreement.
On July 30, 2014, the Supreme Court issued a temporary restraining order on the commencement of the
construction of common station at the vicinity of the existing MRT-3 North Avenue Station along EDSA. Although
the common station is a deliverable of the Philippine Government, LRMC’s business is materially impacted by any
potential delays because ridership is expected to increase materially with the completion of common station.
Under the concession agreement, the Philippine Government is obligated to hand over the common station to
LRMC by April 1, 2019 or 54 months after the signing date. The NTP for the construction of the common station
was issued by the Government in 2019 and the expected completion date is now 2021. This is 2 years behind the
original deadline stated in the Concession Agreement.
LRMC is entitled to be compensated by the Grantors for the failure of meeting certain conditions and
mechanisms set in the concession agreement, including existing system requirement (ESR) costs, structural defect
restoration (SDR) costs, LRV shortfall, and Grantor’s compensation payment. All these claims are be recovered
through the “Balancing Payments” mechanism and are still undergoing discussion as at December 31, 2019.
LRMC also depends on the Philippine Government approvals for the acceptance and the funding of any potential
liquidated damages resulting from unfulfilled obligations.
78
Effect of Existing or Probable Governmental Regulations on the Business
The main variable affecting the extent or likelihood of earnings growth at MPIC is the ability of LRMC to secure
the fare adjustments and ability to collect the liquidated damages under the concession agreement that governs
LRMC’s concession.
The concession agreement establishes an initial fare rate and an adjustment formula for setting the appropriate
fares. The fare adjustment is scheduled every two calendar years beginning in
August 1, 2016 with a starting initial fare supposedly implemented on August 1, 2014. If the fares approved by
the government is lower than the fares stipulated in the concession agreement, the Philippine Government is
obligated to pay the difference and keep LRMC whole.
As at December 31, 2019, LRMC continues to await approval by the Philippine Government of the full initial fares
as stipulated in the concession agreement.
Republic Act No. 11314, Student Fare Discount Act, which was signed on April 17, 2019, grants students who ride
LRT-1 an entitlement of 20% fare discount. As a noticeable percentage of LRT-1 riders are students, the law
would have some negative effect on revenues. This would be slightly offset by tax benefits under the law. Subject
to the provisions under section 29.3 of the Concession Agreement, this may be characterized as a “Material
Adverse Government Action (Change in Law)” for which LRMC would be entitled to compensation.
Customers
The rail business of LRMC enjoys a sole concession of the LRT-1. This segment is mass-based such that the loss of
a few customers would not have a material adverse effect on MPIC. There is also no single customer that
accounts for twenty percent (20%) or more of the segment’s sales.
Distribution
Rail farebox revenues are from manual fare payment through single journey tickets and usage of pre-paid credits
on stored value cards. Non-farebox revenues are primarily from direct payments by tenants and advertising
partner.
Competition
While LRMC was granted the sole right to operate and maintain LRT-1, customers have non-rail alternatives such
as buses and jeepneys.
Source and availability of raw materials
LRMC purchases spare parts from various suppliers, including foreign suppliers from Germany and Japan, for the
rehabilitation of the existing LRVs.
Transactions with related parties
In 2014, AF Payments Inc. (AFPI), in which MPIC has a stake of 20%, was granted the rights and obligations to
design, finance, construct, operate, and maintain the Automated Fare Collection System Project (AFCS Project) for
LRT-1, LRT-2, and Metro Railway Transport 3 (MRT-3). The AFCS Project, which was founded under the Build-
Operate-Transfer Law, accommodates a contactless smartcard technology for stored value and single journey
ridership. When AFPI bid for the AFCS Project, AFPI won the bid because it will not be charging public transport
offices fees for the use of its system. As such, LRMC is not paying AFPI for the use of its system.
In 2017, LRTA and MERALCO entered into a memorandum of agreement for the relocation of electrical sub-
transmission and distribution facilities which will be affected by the construction works of the Cavite Extension.
LRTA shall pay MERALCO all costs and expenses to be incurred for the relocation of its facilities (relocation
charge). The agreement requires LRTA to enter into an Escrow Agreement to facilitate its payment of relocation
charges. MERALCO may suspend the implementation of the relocation activities should LRTA fail to settle such
charges. Since LRTA will only pay upon completion of the activities and MERALCO wants to receive advance
payment for the costs to be incurred, LRMC has entered into a memorandum of agreement with MERALCO to
pay in advance such charges to enable execution of the relocation activities. MERALCO shall reimburse LRMC of
the relocation charges upon receipt from the Escrow Agent or LRTA.
Other transactions with related parties (Meralco, Maynilad, PLDT, Smart and others) were made in the ordinary
course of business and are for daily operation and general administration.
79
Costs and effects of compliance with environmental laws
LRMC’s facilities are required to be maintained in compliance with the environmental standards set primarily by
the DENR. ECC have been issued previously to LRTA, namely ECC 0801004-7110 issued 2008, and ECC-O-8507-
078-208 issued 1987 for the existing LRT-1 rail system.
For the commencement of the construction of the Cavite extension, LRTA has already obtained an ECC from the
DENR under reference no. ECC-CO-1305-0018 issued in 2013. The ECC requires the proponent to abide by the
following conditions: (1) Implementation of a Solid Waste Management Program, (2) Implementation of a dust
control system at the construction site, (3) Construction and Installation of drainage structures, (4)
Implementation of a social development program including priority employment for local residents within the
direct impact areas, (5) Conduct and submit a Traffic Impact Assessment and a Traffic Management Program, (6)
Submit evidence of compliance to all pertinent environmental regulations, (7) Set up an Environmental Guarantee
Fund (EGF), a Multipartite Monitoring Team (MMT) and an Environmental Monitoring Fund (EMF), (8) Establish an
Environmental unit, and (9) Submit a joint undertaking between Grantor and Concessionaire. Regulations require
the grantee to submit a quarterly report of its environmental monitoring activities and a semi-annual report of its
compliance to the above stated ECC.
LRMC has a dedicated environmental team that regularly monitors compliance not only with its ECCs but also
with the International Finance Corporation (IFC) Performance Standards as stipulated in its Concessionaire’s
Agreement. LRMC has established its Environmental and Social Management System that ensures measurement
of significant environmental and social metrics for purposes of compliance with the reporting requirements. In
addition, the presence of the MMT, established in January 2016, validates all the environmental activities and
measurements of LRMC. LRMC has monthly Lenders Technical Advisers (LTA) audits conducted by ARUP and
commissioned TUV Rheinland to conduct independent environmental monitoring and compliance audits for the
LRT-1 Cavite Extension Project. LRMC achieved ISO 14001 certification in July 2017.
Status of any publicly announced products and services
In 2019, LRMC expanded LRT-1 EDSA Station through a property lease with Mayson Realty Corporation to
accommodate the growing circulation of commuters in the said station. LRMC also launched ikotMNL (ikot
Manila) mobile application in 4th quarter of 2019, a further development in the tourism program started in 2018
together with DOTr and accredited partners to promote the use of LRT-1 as the main mode of transportation in
rediscovering Manila.
Several units of e-loading stations for Beep Cards were deployed in 2019. Moreover, LRMC entered into lease
agreements with various merchants to expand its commercial business.
(B.6) Logistics
Business Development
MPIC through MMI provides services in warehousing, trucking, freight forwarding and e-commerce fulfillment.
MMI completed the following acquisitions in 2019, 2018 and 2017:
▪ On various dates in 2018, MMI signed agreements for the purchase of land that were intended for the
development and management of distribution centers.
▪ On April 4, 2017, Premier, a subsidiary of MMI, completed the purchase of the businesses and assets,
including key customer contracts of Ace Logistics Inc. (Ace) for an aggregate purchase price of P=280.0
million. Ace is engaged in the business of logistics, including warehousing, courier express and parcel
delivery, e-commerce delivery, trucking, freight forwarding, customs brokerage and domestic shipping. Ace
also has a strong presence in pre-delivery inspection in the automotive industry, which Premier intends to
expand. The assets and business that was acquired in the transaction was intended for the expansion of
MPIC’s logistics business.
80
▪ In February 2020, MMI entered into a Long-Term Lease Agreement for a 25-year lease of a 52,750 square
meter property located along the Sta. Rosa-Tagaytay Road in Sta. Rosa City, Laguna. MMI intends to build a
dry goods and refrigerated warehouse facility on the site which is targeted to be operational by 2021.
Dependence on Licenses and Government Approval
The Group relies on government permits to be able to operate its warehouses, trucks and freight forwarding
services.
Civil Aeronautics Board
MMI and PLI have obtained a Civil Aeronautics Board certification to engage in business of International and
Domestic Freight Forwarding.
Domestic Freight Forward License (Department of Trade and Industries)
The Group is currently obtaining its domestic freight forward license to operate pick-up and delivery transactions
in the Philippines. The group is still completing requirements of the agency.
Courier License (General Authority – Department of Information and Communications Technology)
The Group is currently obtaining its license to operate private express and/or messenger delivery services. The
group is still completing requirements of the agency.
Land Transportation Franchising Regulatory Board (LTFRB)
The Group utilizes trucks to deliver customer’s products from MMI’s warehouses to agreed delivery locations.
These delivery trucks are required to be registered with the Land Transportation Franchising and Regulatory
Board (LTFRB). MMI has obtained provisional approval from LTFRB to operate its trucks. MMI is expecting to
receive all the relevant franchises from LTFRB as all documents requirement and audit/inspection has complied
for.
Dependence on a Single Customer
The logistics primary customers are top local manufacturers of fast-moving consumer goods. No single customer
accounts for 20% or more of the Company’s revenues.
Source of Raw Materials
Sources of its cost of services are from realtors for leasing of warehouses and purchase of land for Mega DC
Projects; manpower, warehouse and trucking service providers; transportation equipment vendors for trucks to
complement temporary lacking manpower, warehouse and trucking services; material handling vendors such as
forklifts and racks.
Competition
The logistics competes against multiple service providers, mostly global companies and locally established
logistics companies varying in sizes. These companies include Fast Logistics, DHL, DB Schenker, Royal Cargo and
Li & Fung and 2GO Supply Chain and Freight Forwarding.
Cost and effects of compliance with environmental laws
The group has been improving the old warehouses to comply with the fire and environmental laws of the local
government unit or country. For 2020, the Group is expected to invest on fire detection and alarm system.
All new warehouses will be built following international, national and local requirements.
Transactions with related parties
The logistics group acts together when servicing a client. For instance, the trucking group serves the
transportation needs of the customers of PLI and MMI.
(B.7) Others
On July 18, 2012, the stockholders and BOD of Neo Oracle Holdings Inc. (NOHI) resolved to amend its Articles of
Incorporation to reflect (1) the change in name from Metro Pacific Corporation to Neo Oracle Holdings, Inc.; (2)
shortened corporate life until December 31, 2013; and (3) reduce its BOD members from 11 to 5. Hence, NOHI is
81
deemed dissolved as at December 31, 2013 and can no longer conduct business except with respect to
transactions in furtherance of its liquidation. With the shortening of the corporate life, NOHI is not currently active
but holds investments in lands and properties. NOHI continues to implement measures geared towards
generating liquidity to meet maturing obligations which include settlement of the remaining third-party debts via
debt-for-asset swap arrangements, negotiation for discounts on principal and waiver of interests and penalties.
On February 19, 2020, MPIC announced the signing of a ₱1.6 billion investment agreement with Dusit to develop
and manage jointly hospitality and residential properties in the Philippines. The investment agreement is subject
to certain specific performance conditions precedent, including the approval of the Philippine Competition
Commission
(C) MPIC Parent Company’s present employees
As at December 31, 2019, the Parent Company has a total headcount of 55 employees (Administrative: 41, Rank
and File: 14), who are neither unionized nor covered by special incentive arrangements. The Parent Company
expects to increase its headcount in the next twelve months to 59.
(D) MPIC Parent Company’s major risks
As an investment and management company, MPIC undertakes risk management both within the holding
company and within the operating companies:
(D.1) On entering new investments
Prior to making a new investment, any business to be acquired is subject to an extensive due diligence including
financial, operational, regulatory, environmental and risk assessment as well as dispute resolution mechanisms.
Risks to investment returns are then calibrated and specific measures to manage these risks are determined. The
Company is highly selective in the investment opportunities it examines. Due diligence is conducted on a phased
basis to minimize costs of evaluating opportunities that may ultimately not be pursued.
MPIC’s investments involve to varying degrees, a partnership approach with MPIC co-investing with partners that
provide operational and technological input, thereby mitigating risks associated with new business areas.
Financing for new investments is through a combination of debt and/or equity by reference to the underlying
strength of the cash flow of the target business and the overall financing position of MPIC itself.
MPIC’s geographic focus is predominantly the Philippines but with some additional assets in Indonesia, Thailand,
and Vietnam. MPIC is mitigating its foreign investment risk through partnerships with reputable and influential
local firms in these countries and engaging strong and reputable advisers.
(D.2) On ongoing Management of the Financial Stability of the Holding Company
MPIC does not guarantee the borrowings of its investee companies and there are no cross-default provisions
from one investee operating company to another. Financial stability of the holding company, including its
dividend commitment to shareholders, is managed by reference to the ability of the investee companies to remit
dividends to MPIC to cover operating costs and service borrowings. MPIC avoids currency and investment cycle
mismatches by borrowing mostly in Pesos using primarily long-term instruments with fixed rates.
MPIC sets the level of debt on the Parent Company’s balance sheet so as to withstand variability of dividend
receipts from its operating companies associated with regulatory and other risks.
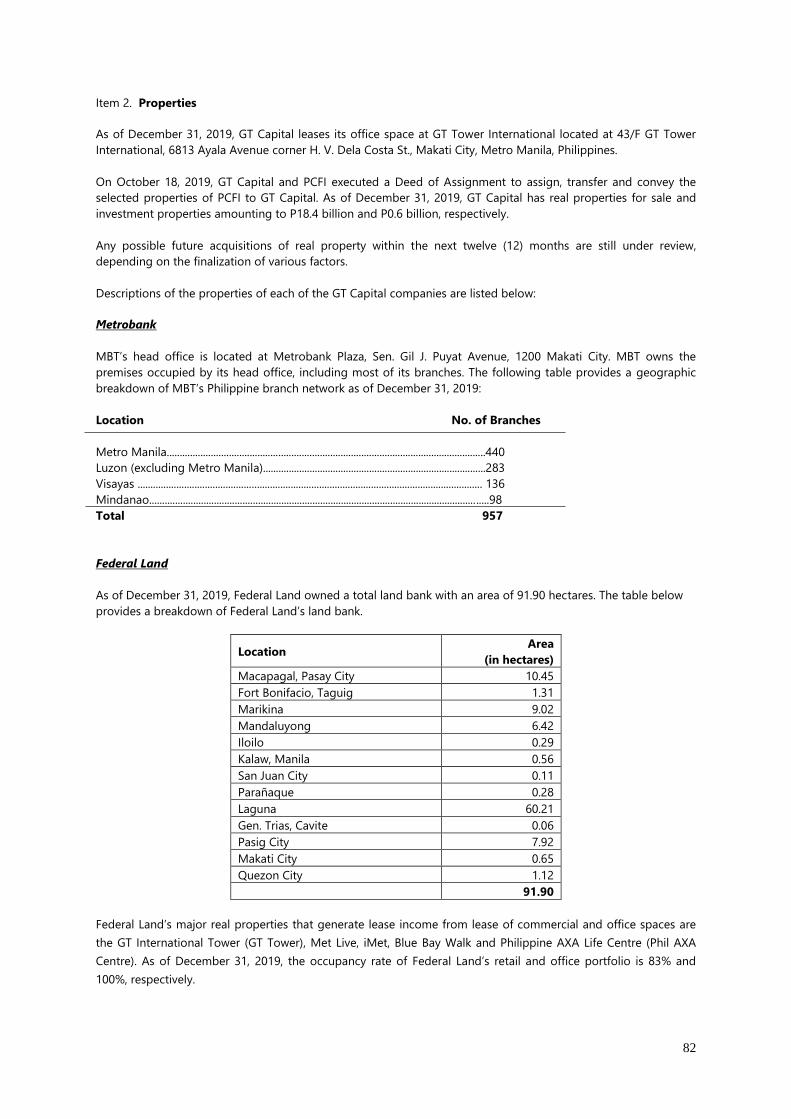
82
Item 2. Properties
As of December 31, 2019, GT Capital leases its office space at GT Tower International located at 43/F GT Tower
International, 6813 Ayala Avenue corner H. V. Dela Costa St., Makati City, Metro Manila, Philippines.
On October 18, 2019, GT Capital and PCFI executed a Deed of Assignment to assign, transfer and convey the
selected properties of PCFI to GT Capital. As of December 31, 2019, GT Capital has real properties for sale and
investment properties amounting to P18.4 billion and P0.6 billion, respectively.
Any possible future acquisitions of real property within the next twelve (12) months are still under review,
depending on the finalization of various factors.
Descriptions of the properties of each of the GT Capital companies are listed below:
Metrobank
MBT’s head office is located at Metrobank Plaza, Sen. Gil J. Puyat Avenue, 1200 Makati City. MBT owns the
premises occupied by its head office, including most of its branches. The following table provides a geographic
breakdown of MBT’s Philippine branch network as of December 31, 2019:
Location No. of Branches
Metro Manila...........................................................................................................................440
Luzon (excluding Metro Manila)......................................................................................283
Visayas ..................................................................................................................................... 136
Mindanao...................................................................................................................................98
Total 957
Federal Land
As of December 31, 2019, Federal Land owned a total land bank with an area of 91.90 hectares. The table below
provides a breakdown of Federal Land’s land bank.
Location Area
(in hectares)
Macapagal, Pasay City 10.45
Fort Bonifacio, Taguig 1.31
Marikina 9.02
Mandaluyong 6.42
Iloilo 0.29
Kalaw, Manila 0.56
San Juan City 0.11
Parañaque 0.28
Laguna 60.21
Gen. Trias, Cavite 0.06
Pasig City 7.92
Makati City 0.65
Quezon City 1.12
91.90
Federal Land’s major real properties that generate lease income from lease of commercial and office spaces are
the GT International Tower (GT Tower), Met Live, iMet, Blue Bay Walk and Philippine AXA Life Centre (Phil AXA
Centre). As of December 31, 2019, the occupancy rate of Federal Land’s retail and office portfolio is 83% and
100%, respectively.

83
GT Tower has 47 floors, and 536 parking slots, with an aggregate area of 46,458 square meters. One floor is used
as Federal Land’s principal headquarters, measuring 1,168 square meters.
The Met Live offers retails spaces and office floors in the integrated-community of Metro Park in Bay Area, Pasay
City. It has a leasable area totaling of 39,257 square meters.
iMet is a 4-tower BPO complex located at the Bay Area in Pasay City. It has a floor plate of 2,029 square meters
per office floor, making up a total of approximately 21,000 square meters. There are retail spaces at the ground
level.
Bluebay Walk has a total area of 14,765 square meters which is being leased out to various tenants. Rent is paid
on a fixed per square meter basis and/or variable rent based on a certain percentage of sales of the retail tenant.
Lease contracts provide for a pre-agreed annual increase over the term of the lease.
The office property at Phil AXA Centre measures 7,829 square meters of floor area, comprising 25 units. The units
are owned by Horizon Land, a wholly-owned subsidiary of Federal Land.
Mitsukoshi Mall is the retail component of the joint venture among Federal Land, Normura Real Estate, and
Mitsukoshi Isetan. It sits on the retail podium of the 4-tower Seasons Residences. The mall is slated to open in
2021, and will house largely Japanese world-class establishments, with the renowned Mitsukoshi supermarket and
beauty sections as anchor, and junior anchor tenants.
Toyota Motor Philippines
TMP is the owner/developer of the Toyota Special Economic Zone (TSEZ) in Santa Rosa City, Laguna, Philippines.
Its principal office and manufacturing facilities are located within TSEZ. TMP also leases office space at GT Tower
International, Ayala Avenue corner H.V. dela Costa St., Makati City, Philippines.
TMP also owns the land along the South Luzon Expressway in Bicutan, Parañaque City, Philippines, where its head
office was previously located. A portion of the property is currently leased to Toyota Bicutan, Parañaque, a branch
of Toyota Makati, Inc., which is a wholly-owned subsidiary of TMP.
Philippine AXA Life Insurance Corporation and Subsidiary
AXA Philippines
AXA Philippines’ head office is currently under lease at the 29th, 30th, 33rd, 34th and 35th floor of GT Tower
International. AXA continues to own the premises occupied by its customer relation and training offices at the
ground floor of the Phil AXA Centre in Makati.
AXA owns certain investment properties including office space, condominium units and parking slots at the
Skyland Plaza in Makati.
Charter Ping An
Charter Ping An’s head office is located at 29th floor of GT Tower International, Ayala cor H.V. Dela Costa St.
Makati City. It owns the premises except for a portion of the Executive Office located at the ground floor which it
leases from FMIC and Skyland Plaza Condominium Corporation.
Charter Ping An has 25 branches nationwide: 7 in Metro Manila; 12 in Luzon; 3 in Visayas; and 3 in Mindanao. It
owns the premises where its Binondo office is located and the rest of the branches are leased either from
Metrobank or from other lessors. The term of the lease ranges from three to five years renewable under mutually-
acceptable terms and conditions.
Metro Pacific Investments Corporation
Power Segment. GBPC’s generation subsidiaries owned power generation facilities, buildings, land and other land
improvements and property and equipment for the operation of its power generation business. The power plant
complexes of the generation subsidiaries have been mortgaged and/or pledged as security for their long-term
debt.
84
Toll Operations Segment. NLEX Corp and CIC own their head office buildings in Balintawak, Caloocan City and
Paranaque City, respectively. Other equipment, which is relatively insignificant, consists of transportation
equipment and office equipment primarily located in their respective head offices. NLEX Corp and CIC do not
own the parcels of land over which the toll roads have been built as these are owned by the Republic of the
Philippines. In 2017 and 2016, NLEX Ventures Corporation (NVC), a wholly-owned subsidiary of NLEX Corp,
acquired parcels of land located in Valenzuela City. A parcel of land acquired in 2016 is presently the site of a
service facility under a lease agreement, while the other parcels of land are being developed as a property for
lease with business proponents.
Metro Pacific Tollways South Corporation (MPTSC), a wholly-owned subsidiary of MPTC, acquired a parcel of land
in Cavite to be developed into headquarters for concessions held in the south part of Luzon. Metro Pacific
Tollways Vizmin Corporation (MPTVC), a wholly-owned subsidiary of MPTC, also acquired a parcel of land in
Cordova, Cebu to be developed into headquarters for CCLEC.
PT Nusantara’s properties consist of land, building and building improvements. PT Nusantara and its subsidiaries,
PT Margautama Nusantara (MUN) and BSD, owns building units which serve as their office space in South Jakarta
and Banten, Indonesia. PT Inpola Meka Energi (IME), another indirectly owned subsidiary, owns a land which
serves as the site of construction of its hydro-power plant located in the Province of North Sumatera, Indonesia.
Other equipment consists of transportation equipment, machinery and office equipment primarily located in their
office and operation sites.
Water Segment. Maynilad is tasked to manage, operate, repair, decommission and refurbish certain specified
MWSS facilities in the West Service Area. The legal title to these assets remains with MWSS. The legal title to all
property, plant and equipment contributed to the existing MWSS system by Maynilad during the concession
period remains with Maynilad until the expiration date (or on early termination date) at which time, all rights,
titles and interest in such assets will automatically vest to MWSS.
Maynilad leases the office space and branches where service outlets are located, equipment and service vehicles,
renewable under certain terms and conditions to be agreed upon by the parties.
MPW, through its subsidiaries and associates, took over the operations of certain assets from the counterparty
water districts upon the commencement of the Projects. Legal title to such assets remains with these water
districts. The legal title to assets acquired and constructed during the term of the Projects accrues to the joint
venture companies until the expiration date (or the early termination date), after which all rights, titles and
interest in such assets automatically vest to these water districts.
MPW, through the share purchase transactions, has gained proportionate ownership over the assets in TLW and
PNW. Legal title to all existing assets remained in TLW and PNW after the purchase transaction.
Rail Segment. Under the LRT-1 concession agreement, the ownership of the existing LRT-1 system taken over by
LRMC remains with the Grantors (the LRTA and DOTr). This includes the existing depot, railway system, rolling
stock, stations and track. Moreover, the ownership of all items procured by the Grantors after LRMC’s takeover,
including any new LRVs, will remain with the Grantors. The ownership of the planned railway infrastructure
extension (south of the Baclaran station) and new signaling system will vest to the Grantors upon the final
commissioning and acceptance. LRMC does not own the parcels of land over which the railway system lies as
these are owned by the Grantors.
Logistics. MMI owned land in San Rafael, Bulacan and General Trias, Cavite with a total combined area of 421,000
sqm for developing into covered warehouses. MMI also owned a fleet of trucks and other equipment. In
December 2019, the BOD has approved the sale of the land purchased in San Rafael, Bulacan and General Trias,
Cavite. The proceeds will be used to fund the operating requirements of the Group.
Healthcare Segment. MPHHI is developing the Philippines’ first nationwide chain of leading hospitals to deliver
comprehensive in-patient and out-patient hospital services, including medical and surgical services, diagnostic,
therapeutic intensive care, research and training facilities in strategic locations in the Philippines:
• MMC is a multi-specialty tertiary medical centre situated in the central business district of Makati, Metro
Manila.

85
• AHI is a hospital located in Alabang, Muntinlupa in Southern Metro Manila.
• DLSMC is a mid-market teaching and training hospital in Quezon City, the largest city in Metro Manila.
• MDH, a tertiary hospital located in the City of Manila.
• MVMC is a prominent tertiary hospital along Sumulong Highway in Marikina City.
• JDMH is a tertiary general hospital is located in Kamuning Road, Quezon City
• SHHM is a level two hospital in Malolos, Bulacan.
• DDH is considered to be the largest and one of the best medical facilities offering modern diagnostic,
therapeutic and intensive care services in Southern Philippines.
• RMCI, also known as Dr. Pablo O. Torre Memorial Hospital, is the largest and a leading medical facility in
Bacolod in the island of Negros, Western Visayas.
• CLDH is the largest tertiary hospital in Tarlac.
• SEHI is the largest hospital in SOCCSKSARGEN region.
• WMMC is a secondary-level private hospital in Zamboanga City.
• MegaClinic, TopHealth and Metro Sanitas Metlive are mall-based diagnostic and ambulatory care
centers located in Metro Manila.
• Lipa Medix Cancer Center Corporation, Metro CLDH Cancer Center Corporation and Metro RMCI Cancer
Center Corporation are radiotherapy facilities located in Batangas, Tarlac and Bacolod, respectively.
Lease Arrangements. East Manila Hospital Managers Corp. (EMHMC) and CVHMC entered into lease agreements
with Servants of the Holy Spirit, Inc. and Roman Catholic Archbishop of Manila for the management and
operation of OLLH and CSMC, respectively. The lease of EMHMC and CVHMC are for a period of 20 years,
renewable for successive periods of 10 years upon the mutual consent of both parties. As consideration for the
lease agreement fixed and variable monthly rates are paid where the variable rate is based on the prior year’s net
revenues.
Toyota Manila Bay
The following table provides a breakdown of TMBC outlets’ properties as of December 31, 2019.
Outlet Leases or Owned Lot Area Remarks
TMB Owned
Leased
5, 000.0 sqm
3,000.0 sqm
Showroom, Service and Stockyard
Service Parking and Stockyard
TDM Owned 8,891.1 sqm
1,000.0 sqm
1,000.0 sqm
7,954.0 sqm
Stockyard and Service
Showroom and Service
Showroom and Service
Stockyard
TAS Leased
4,631.28 sqm
1,802.2 sqm
4,000.0 sqm
750.0sqm
Showroom and Service
Service and Stockyard
Stockyard
Stockyard Extension
TCI Owned
Leased
3,542.0 sqm
9,721.5 sqm
2,534.0 sqm
Showroom and Service
Service and Stockyard
Stockyard
TMK Owned
Leased
5,000.0 sqm
2,310.2 sqm
Showroom, Service and Stockyard
Stockyard
TFSPH
As of December 31, 2019, TFSPH leases its offices at the following locations:
Head Office:
▪ 32/F and 42/F GT Tower International, 6813 Ayala Avenue corner H. V. Dela Costa St., Makati City, Metro
Manila, Philippines.
Business Hubs:
▪ Cebu Business Center - Esperanza Building, AC Cortes Ave., Ibabao, Mandaue City
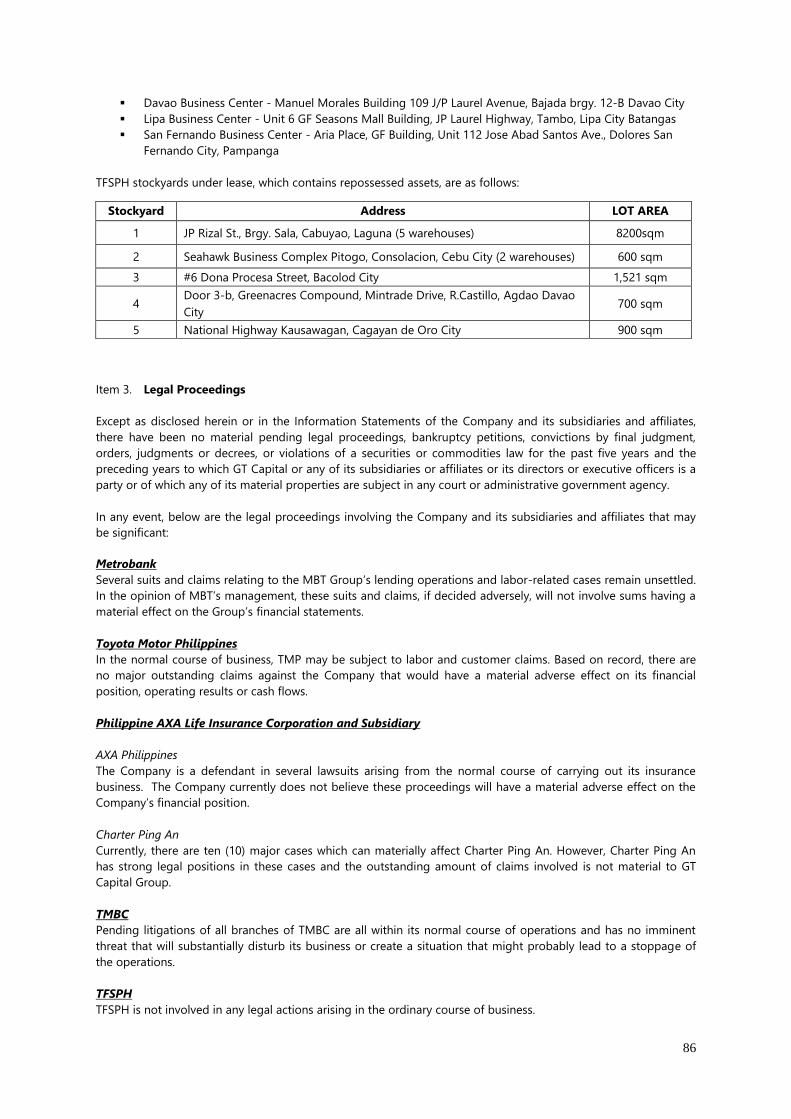
86
▪ Davao Business Center - Manuel Morales Building 109 J/P Laurel Avenue, Bajada brgy. 12-B Davao City
▪ Lipa Business Center - Unit 6 GF Seasons Mall Building, JP Laurel Highway, Tambo, Lipa City Batangas
▪ San Fernando Business Center - Aria Place, GF Building, Unit 112 Jose Abad Santos Ave., Dolores San
Fernando City, Pampanga
TFSPH stockyards under lease, which contains repossessed assets, are as follows:
Stockyard Address LOT AREA
1 JP Rizal St., Brgy. Sala, Cabuyao, Laguna (5 warehouses) 8200sqm
2 Seahawk Business Complex Pitogo, Consolacion, Cebu City (2 warehouses) 600 sqm
3 #6 Dona Procesa Street, Bacolod City 1,521 sqm
4 Door 3-b, Greenacres Compound, Mintrade Drive, R.Castillo, Agdao Davao
City 700 sqm
5 National Highway Kausawagan, Cagayan de Oro City 900 sqm
Item 3. Legal Proceedings
Except as disclosed herein or in the Information Statements of the Company and its subsidiaries and affiliates,
there have been no material pending legal proceedings, bankruptcy petitions, convictions by final judgment,
orders, judgments or decrees, or violations of a securities or commodities law for the past five years and the
preceding years to which GT Capital or any of its subsidiaries or affiliates or its directors or executive officers is a
party or of which any of its material properties are subject in any court or administrative government agency.
In any event, below are the legal proceedings involving the Company and its subsidiaries and affiliates that may
be significant:
Metrobank
Several suits and claims relating to the MBT Group’s lending operations and labor-related cases remain unsettled.
In the opinion of MBT’s management, these suits and claims, if decided adversely, will not involve sums having a
material effect on the Group’s financial statements.
Toyota Motor Philippines
In the normal course of business, TMP may be subject to labor and customer claims. Based on record, there are
no major outstanding claims against the Company that would have a material adverse effect on its financial
position, operating results or cash flows.
Philippine AXA Life Insurance Corporation and Subsidiary
AXA Philippines
The Company is a defendant in several lawsuits arising from the normal course of carrying out its insurance
business. The Company currently does not believe these proceedings will have a material adverse effect on the
Company’s financial position.
Charter Ping An
Currently, there are ten (10) major cases which can materially affect Charter Ping An. However, Charter Ping An
has strong legal positions in these cases and the outstanding amount of claims involved is not material to GT
Capital Group.
TMBC
Pending litigations of all branches of TMBC are all within its normal course of operations and has no imminent
threat that will substantially disturb its business or create a situation that might probably lead to a stoppage of
the operations.
TFSPH
TFSPH is not involved in any legal actions arising in the ordinary course of business.
87
Fed Land
Fed Land is not involved in any significant pending legal proceedings.
MPIC
MPIC is a party to various legal matters and claims arising in the ordinary course of business. These various legal
proceedings are properly disclosed in Note 30, Contingencies to MPIC’s 2019 Audited Consolidated Financial
Statements.
Item 4. Submission of Matters to a Vote of Security Holders
There were no matters submitted during the fourth quarter of the fiscal year to the vote of security holders,
through the solicitation of proxies or otherwise. The Annual Meeting of the Stockholders of GT Capital was held
on May 8, 2019, and the results thereof were submitted to the Securities and Exchange Commission in the
corresponding SEC Form 17-C and disclosed through the Philippine Stock Exchange and the Philippine Dealing
and Exchange Corporation.
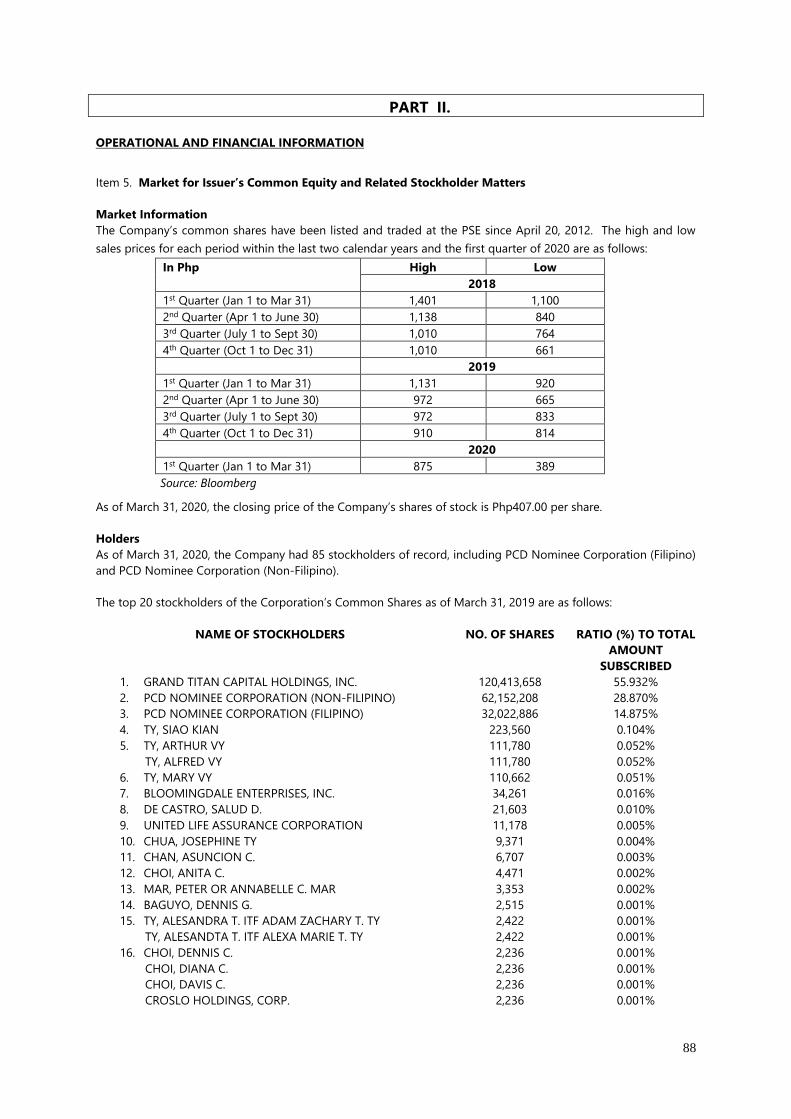
88
PART II.
OPERATIONAL AND FINANCIAL INFORMATION
Item 5. Market for Issuer’s Common Equity and Related Stockholder Matters
Market Information
The Company’s common shares have been listed and traded at the PSE since April 20, 2012. The high and low
sales prices for each period within the last two calendar years and the first quarter of 2020 are as follows:
In Php High Low
2018
1st Quarter (Jan 1 to Mar 31) 1,401 1,100
2nd Quarter (Apr 1 to June 30) 1,138 840
3rd Quarter (July 1 to Sept 30) 1,010 764
4th Quarter (Oct 1 to Dec 31) 1,010 661
2019
1st Quarter (Jan 1 to Mar 31) 1,131 920
2nd Quarter (Apr 1 to June 30) 972 665
3rd Quarter (July 1 to Sept 30) 972 833
4th Quarter (Oct 1 to Dec 31) 910 814
2020
1st Quarter (Jan 1 to Mar 31) 875 389
Source: Bloomberg
As of March 31, 2020, the closing price of the Company’s shares of stock is Php407.00 per share.
Holders
As of March 31, 2020, the Company had 85 stockholders of record, including PCD Nominee Corporation (Filipino)
and PCD Nominee Corporation (Non-Filipino).
The top 20 stockholders of the Corporation’s Common Shares as of March 31, 2019 are as follows:
NAME OF STOCKHOLDERS NO. OF SHARES RATIO (%) TO TOTAL
AMOUNT
SUBSCRIBED
1. GRAND TITAN CAPITAL HOLDINGS, INC. 120,413,658 55.932%
2. PCD NOMINEE CORPORATION (NON-FILIPINO) 62,152,208 28.870%
3. PCD NOMINEE CORPORATION (FILIPINO) 32,022,886 14.875%
4. TY, SIAO KIAN 223,560 0.104%
5. TY, ARTHUR VY 111,780 0.052%
TY, ALFRED VY 111,780 0.052%
6. TY, MARY VY 110,662 0.051%
7. BLOOMINGDALE ENTERPRISES, INC. 34,261 0.016%
8. DE CASTRO, SALUD D. 21,603 0.010%
9. UNITED LIFE ASSURANCE CORPORATION 11,178 0.005%
10. CHUA, JOSEPHINE TY 9,371 0.004%
11. CHAN, ASUNCION C. 6,707 0.003%
12. CHOI, ANITA C. 4,471 0.002%
13. MAR, PETER OR ANNABELLE C. MAR 3,353 0.002%
14. BAGUYO, DENNIS G. 2,515 0.001%
15. TY, ALESANDRA T. ITF ADAM ZACHARY T. TY 2,422 0.001%
TY, ALESANDTA T. ITF ALEXA MARIE T. TY 2,422 0.001%
16. CHOI, DENNIS C. 2,236 0.001%
CHOI, DIANA C. 2,236 0.001%
CHOI, DAVIS C. 2,236 0.001%
CROSLO HOLDINGS, CORP. 2,236 0.001%
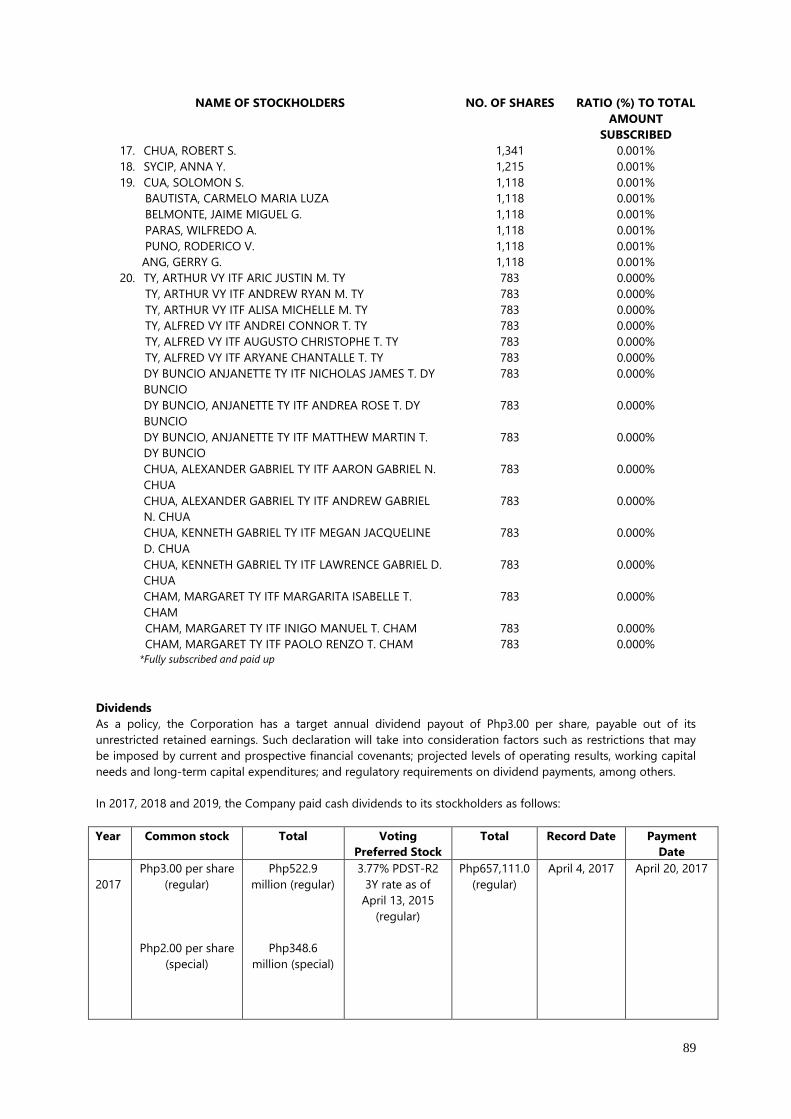
89
NAME OF STOCKHOLDERS NO. OF SHARES RATIO (%) TO TOTAL
AMOUNT
SUBSCRIBED
17. CHUA, ROBERT S. 1,341 0.001%
18. SYCIP, ANNA Y. 1,215 0.001%
19. CUA, SOLOMON S. 1,118 0.001%
BAUTISTA, CARMELO MARIA LUZA 1,118 0.001%
BELMONTE, JAIME MIGUEL G. 1,118 0.001%
PARAS, WILFREDO A. 1,118 0.001%
PUNO, RODERICO V. 1,118 0.001%
ANG, GERRY G. 1,118 0.001%
20. TY, ARTHUR VY ITF ARIC JUSTIN M. TY 783 0.000%
TY, ARTHUR VY ITF ANDREW RYAN M. TY 783 0.000%
TY, ARTHUR VY ITF ALISA MICHELLE M. TY 783 0.000%
TY, ALFRED VY ITF ANDREI CONNOR T. TY 783 0.000%
TY, ALFRED VY ITF AUGUSTO CHRISTOPHE T. TY 783 0.000%
TY, ALFRED VY ITF ARYANE CHANTALLE T. TY 783 0.000%
DY BUNCIO ANJANETTE TY ITF NICHOLAS JAMES T. DY
BUNCIO
783 0.000%
DY BUNCIO, ANJANETTE TY ITF ANDREA ROSE T. DY
BUNCIO
783 0.000%
DY BUNCIO, ANJANETTE TY ITF MATTHEW MARTIN T.
DY BUNCIO
783 0.000%
CHUA, ALEXANDER GABRIEL TY ITF AARON GABRIEL N.
CHUA
783 0.000%
CHUA, ALEXANDER GABRIEL TY ITF ANDREW GABRIEL
N. CHUA
783 0.000%
CHUA, KENNETH GABRIEL TY ITF MEGAN JACQUELINE
D. CHUA
783 0.000%
CHUA, KENNETH GABRIEL TY ITF LAWRENCE GABRIEL D.
CHUA
783 0.000%
CHAM, MARGARET TY ITF MARGARITA ISABELLE T.
CHAM
783 0.000%
CHAM, MARGARET TY ITF INIGO MANUEL T. CHAM 783 0.000%
CHAM, MARGARET TY ITF PAOLO RENZO T. CHAM 783 0.000%
*Fully subscribed and paid up
Dividends
As a policy, the Corporation has a target annual dividend payout of Php3.00 per share, payable out of its
unrestricted retained earnings. Such declaration will take into consideration factors such as restrictions that may
be imposed by current and prospective financial covenants; projected levels of operating results, working capital
needs and long-term capital expenditures; and regulatory requirements on dividend payments, among others.
In 2017, 2018 and 2019, the Company paid cash dividends to its stockholders as follows:
Year Common stock Total Voting
Preferred Stock
Total Record Date Payment
Date
2017
Php3.00 per share
(regular)
Php2.00 per share
(special)
Php522.9
million (regular)
Php348.6
million (special)
3.77% PDST-R2
3Y rate as of
April 13, 2015
(regular)
Php657,111.0
(regular)
April 4, 2017 April 20, 2017
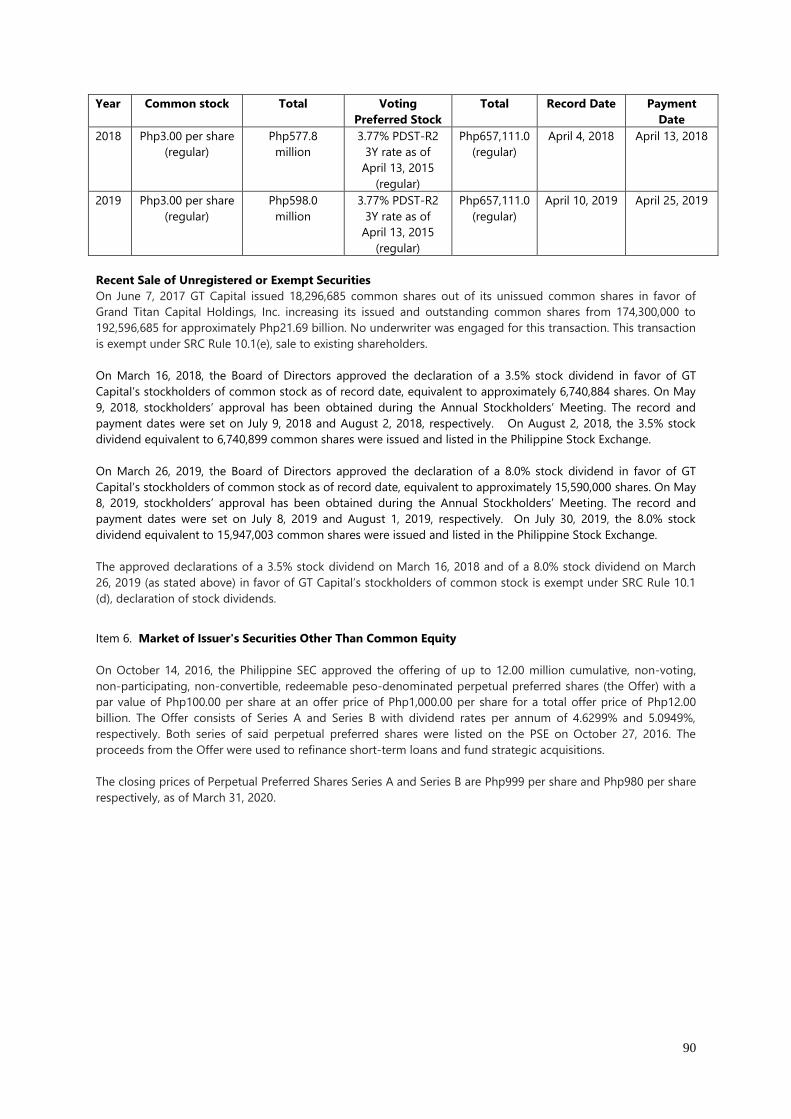
90
Year Common stock Total Voting
Preferred Stock
Total Record Date Payment
Date
2018 Php3.00 per share
(regular)
Php577.8
million
3.77% PDST-R2
3Y rate as of
April 13, 2015
(regular)
Php657,111.0
(regular)
April 4, 2018 April 13, 2018
2019 Php3.00 per share
(regular)
Php598.0
million
3.77% PDST-R2
3Y rate as of
April 13, 2015
(regular)
Php657,111.0
(regular)
April 10, 2019 April 25, 2019
Recent Sale of Unregistered or Exempt Securities
On June 7, 2017 GT Capital issued 18,296,685 common shares out of its unissued common shares in favor of
Grand Titan Capital Holdings, Inc. increasing its issued and outstanding common shares from 174,300,000 to
192,596,685 for approximately Php21.69 billion. No underwriter was engaged for this transaction. This transaction
is exempt under SRC Rule 10.1(e), sale to existing shareholders.
On March 16, 2018, the Board of Directors approved the declaration of a 3.5% stock dividend in favor of GT
Capital’s stockholders of common stock as of record date, equivalent to approximately 6,740,884 shares. On May
9, 2018, stockholders’ approval has been obtained during the Annual Stockholders’ Meeting. The record and
payment dates were set on July 9, 2018 and August 2, 2018, respectively. On August 2, 2018, the 3.5% stock
dividend equivalent to 6,740,899 common shares were issued and listed in the Philippine Stock Exchange.
On March 26, 2019, the Board of Directors approved the declaration of a 8.0% stock dividend in favor of GT
Capital’s stockholders of common stock as of record date, equivalent to approximately 15,590,000 shares. On May
8, 2019, stockholders’ approval has been obtained during the Annual Stockholders’ Meeting. The record and
payment dates were set on July 8, 2019 and August 1, 2019, respectively. On July 30, 2019, the 8.0% stock
dividend equivalent to 15,947,003 common shares were issued and listed in the Philippine Stock Exchange.
The approved declarations of a 3.5% stock dividend on March 16, 2018 and of a 8.0% stock dividend on March
26, 2019 (as stated above) in favor of GT Capital’s stockholders of common stock is exempt under SRC Rule 10.1
(d), declaration of stock dividends.
Item 6. Market of Issuer's Securities Other Than Common Equity
On October 14, 2016, the Philippine SEC approved the offering of up to 12.00 million cumulative, non-voting,
non-participating, non-convertible, redeemable peso-denominated perpetual preferred shares (the Offer) with a
par value of Php100.00 per share at an offer price of Php1,000.00 per share for a total offer price of Php12.00
billion. The Offer consists of Series A and Series B with dividend rates per annum of 4.6299% and 5.0949%,
respectively. Both series of said perpetual preferred shares were listed on the PSE on October 27, 2016. The
proceeds from the Offer were used to refinance short-term loans and fund strategic acquisitions.
The closing prices of Perpetual Preferred Shares Series A and Series B are Php999 per share and Php980 per share
respectively, as of March 31, 2020.
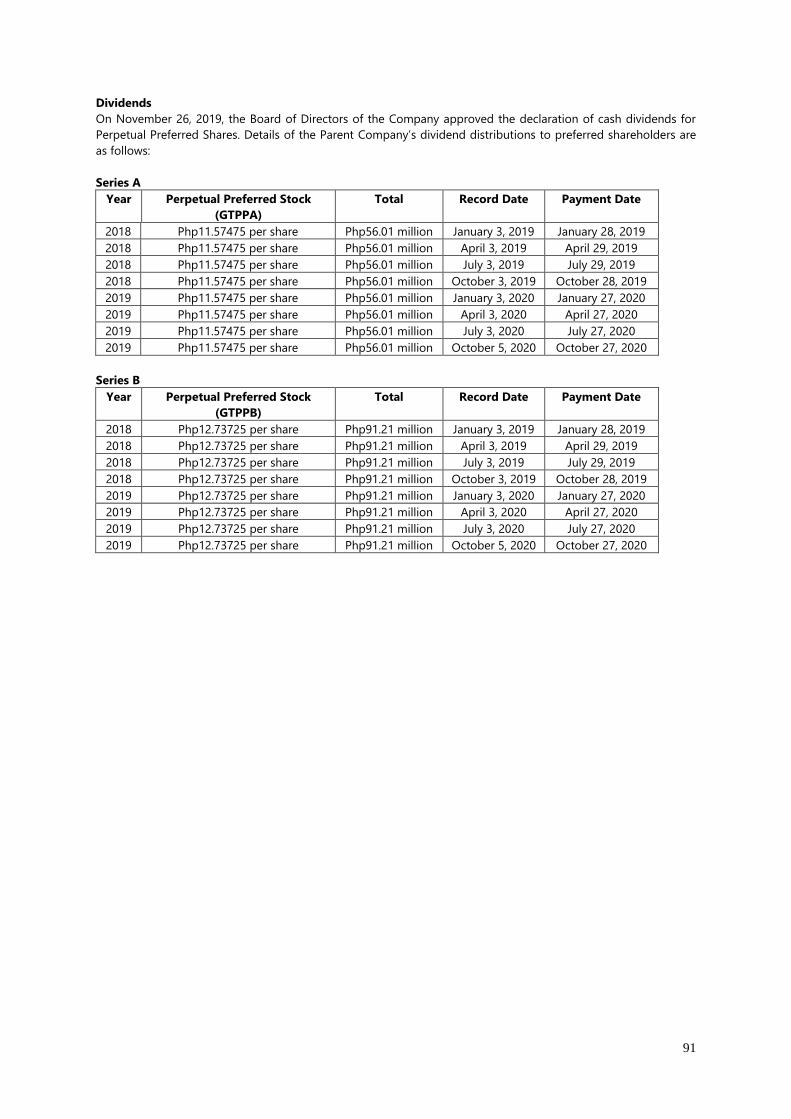
91
Dividends
On November 26, 2019, the Board of Directors of the Company approved the declaration of cash dividends for
Perpetual Preferred Shares. Details of the Parent Company’s dividend distributions to preferred shareholders are
as follows:
Series A
Year Perpetual Preferred Stock
(GTPPA)
Total Record Date Payment Date
2018 Php11.57475 per share Php56.01 million January 3, 2019 January 28, 2019
2018 Php11.57475 per share Php56.01 million April 3, 2019 April 29, 2019
2018 Php11.57475 per share Php56.01 million July 3, 2019 July 29, 2019
2018 Php11.57475 per share Php56.01 million October 3, 2019 October 28, 2019
2019 Php11.57475 per share Php56.01 million January 3, 2020 January 27, 2020
2019 Php11.57475 per share Php56.01 million April 3, 2020 April 27, 2020
2019 Php11.57475 per share Php56.01 million July 3, 2020 July 27, 2020
2019 Php11.57475 per share Php56.01 million October 5, 2020 October 27, 2020
Series B
Year Perpetual Preferred Stock
(GTPPB)
Total Record Date Payment Date
2018 Php12.73725 per share Php91.21 million January 3, 2019 January 28, 2019
2018 Php12.73725 per share Php91.21 million April 3, 2019 April 29, 2019
2018 Php12.73725 per share Php91.21 million July 3, 2019 July 29, 2019
2018 Php12.73725 per share Php91.21 million October 3, 2019 October 28, 2019
2019 Php12.73725 per share Php91.21 million January 3, 2020 January 27, 2020
2019 Php12.73725 per share Php91.21 million April 3, 2020 April 27, 2020
2019 Php12.73725 per share Php91.21 million July 3, 2020 July 27, 2020
2019 Php12.73725 per share Php91.21 million October 5, 2020 October 27, 2020
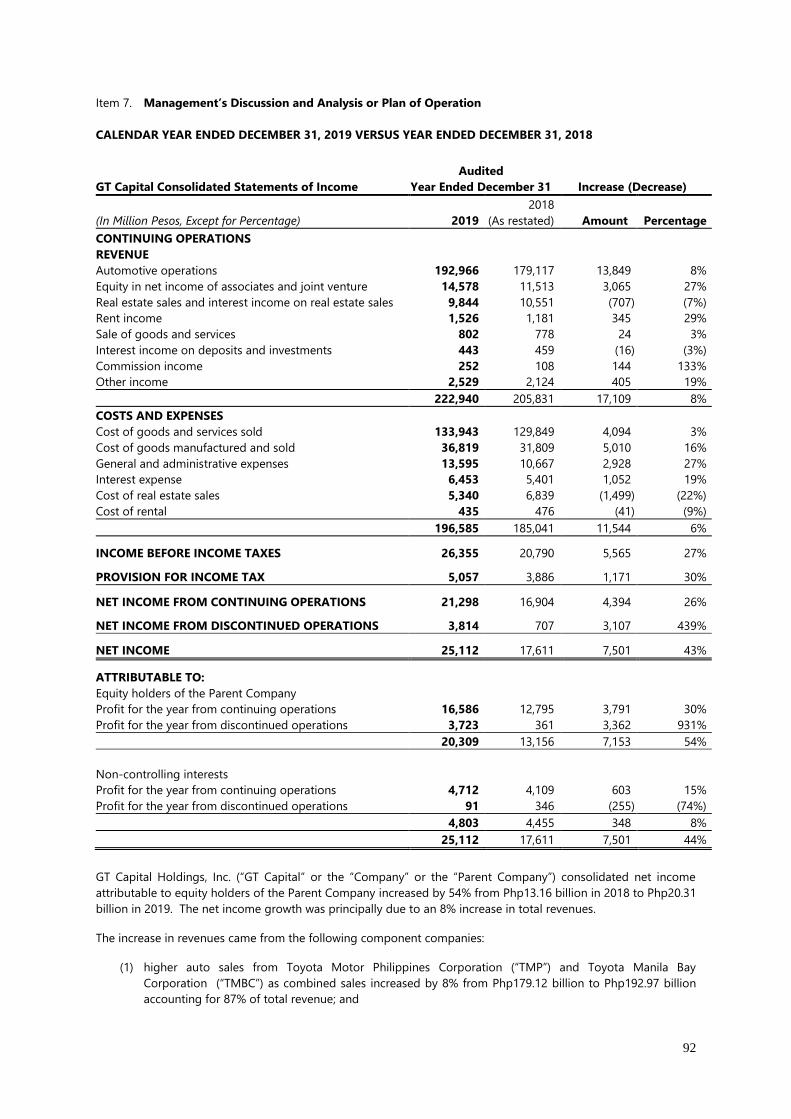
92
Item 7. Management’s Discussion and Analysis or Plan of Operation
CALENDAR YEAR ENDED DECEMBER 31, 2019 VERSUS YEAR ENDED DECEMBER 31, 2018
GT Capital Consolidated Statements of Income
Audited
Year Ended December 31 Increase (Decrease)
(In Million Pesos, Except for Percentage) 2019
2018
(As restated) Amount Percentage
CONTINUING OPERATIONS
REVENUE
Automotive operations 192,966 179,117 13,849 8%
Equity in net income of associates and joint venture 14,578 11,513 3,065 27%
Real estate sales and interest income on real estate sales 9,844 10,551 (707) (7%)
Rent income 1,526 1,181 345 29%
Sale of goods and services 802 778 24 3%
Interest income on deposits and investments 443 459 (16) (3%)
Commission income 252 108 144 133%
Other income 2,529 2,124 405 19%
222,940 205,831 17,109 8%
COSTS AND EXPENSES
Cost of goods and services sold 133,943 129,849 4,094 3%
Cost of goods manufactured and sold 36,819 31,809 5,010 16%
General and administrative expenses 13,595 10,667 2,928 27%
Interest expense 6,453 5,401 1,052 19%
Cost of real estate sales 5,340 6,839 (1,499) (22%)
Cost of rental 435 476 (41) (9%)
196,585 185,041 11,544 6%
INCOME BEFORE INCOME TAXES 26,355 20,790 5,565 27%
PROVISION FOR INCOME TAX 5,057 3,886 1,171 30%
NET INCOME FROM CONTINUING OPERATIONS 21,298 16,904 4,394 26%
NET INCOME FROM DISCONTINUED OPERATIONS 3,814 707 3,107 439%
NET INCOME 25,112 17,611 7,501 43%
ATTRIBUTABLE TO:
Equity holders of the Parent Company
Profit for the year from continuing operations 16,586 12,795 3,791 30%
Profit for the year from discontinued operations 3,723 361 3,362 931%
20,309 13,156 7,153 54%
Non-controlling interests
Profit for the year from continuing operations 4,712 4,109 603 15%
Profit for the year from discontinued operations 91 346 (255) (74%)
4,803 4,455 348 8%
25,112 17,611 7,501 44%
GT Capital Holdings, Inc. (“GT Capital” or the “Company” or the “Parent Company”) consolidated net income
attributable to equity holders of the Parent Company increased by 54% from Php13.16 billion in 2018 to Php20.31
billion in 2019. The net income growth was principally due to an 8% increase in total revenues.
The increase in revenues came from the following component companies:
(1) higher auto sales from Toyota Motor Philippines Corporation (“TMP”) and Toyota Manila Bay
Corporation (“TMBC”) as combined sales increased by 8% from Php179.12 billion to Php192.97 billion
accounting for 87% of total revenue; and
93
(2) higher equity in net income of associates and joint venture which grew by 27% from Php11.51 billion to
Php14.58 billion accounting for 7% of total revenues;
(3) The above increases are mitigated by a lower real estate sales and interest income on real estate sales
from Federal Land Inc. (Federal Land) which declined by 7% from Php10.55 billion to Php9.84 billion.
Core net income attributable to equity holders of the Parent Company reached Php15.78 billion in 2019 from
Php12.92 billion in 2018. Core net income for 2019 amounted to Php15.78 billion from a reported net income of
Php20.31 billion after deducting the Php3.58 billion total income from redemption of investment in Property
Company of Friends, Inc. (“PCFI”), and Php1.28 billion share in MPIC's non-recurring gain; and adding back the
Php0.33 billion amortization of fair value adjustments arising from business combinations. Core net income for
2018 amounted to Php12.92 billion from a reported net income of 13.16 billion, after deducting the Php0.32
billion non-recurring income, net of taxes-related to lot sales, non-recurring expenses, and share in MPIC's non-
recurring loss; and adding back the Php0.08 billion amortization of fair value adjustments arising from business
combinations.
The financial statements of Federal Land, TMP, TMBC and GT Capital Auto Dealership Holdings, Inc. (“GTCAD”) are
consolidated in the financial statements of the Company. The other component companies Metro Pacific
Investments Corporation (“MPIC”), Metropolitan Bank & Trust Company (“Metrobank” or “MBT’), Philippine AXA
Life Insurance Corporation (“AXA Philippines), Toyota Financial Services Philippines Corporation (“TFSPH”) and
Sumisho Motor Finance Corporation (“SMFC”) are accounted for through equity accounting.
Of the ten (10) component companies, Metrobank, MPIC, TMP, Federal Land, TMBC and SMFC posted growths in
their respective net income while TFSPH and AXA Philippines reported declines in their respective net income for
the year. GTCAD reported a lower net loss for the year as compared to the previous year.
Automotive operations comprising the sale of assembled and imported auto vehicles and spare parts grew by 8%
from Php179.12 billion to Php192.97 billion principally driven by the 5.0% increase in wholesales volume from
155,508 units to 163,493 units.
Equity in net income of associates and jointly-controlled entities increased by 27% from Php11.51 billion to
Php14.58 billion primarily due to increases in:
(1) net income of Metrobank which increased by 28% from Php22.00 billion to Php28.06 billion and the
impact of increased ownership from 36.36 to 36.65%;
(2) net income of MPIC which increased by 69% from Php14.13 billion to Php23.86 billion; and
(3) net income of SMFC which increased by 35% from Php0.26 billion to Php0.35 billion.
Real estate sales and interest income on real estate sales declined by 7% from Php10.55 billion to Php9.84 billion
due to lot sales in 2018 which are not present in the current year.
Rent income grew by 29% from Php1.18 billion to Php1.53 billion driven by the increase in the number of tenants
in iMET, Blue Bay Walk and MET Live, all located in Pasay City, Metro Manila.
Commission income increased by Php143.51 million from Php108.00 million to Php251.52 million due to an
increase in reservation sales from Grand Hyatt Residences 2 and The Seasons Residences of Federal Land, both
located in Fort BGC, Taguig City.
Other income grew by 19% from Php2.12 billion to Php2.53 billion with: (1) TMP contributing Php0.84 billion
consisting of gain on sale of fixed assets, and subscription and ancillary income from its dealer subsidiaries; (2)
Federal Land contributing Php0.74 billion comprising real estate forfeitures, management fees and other income;
(3) TMBC contributing Php0.46 billion consisting of ancillary income on finance and insurance commissions and
other income; and (4) GT Capital contributing Php0.45 billion comprising dividend income from TMC and gain on
FVTPL investments. The remaining balance of Php0.04 billion came from GTCAD.
Consolidated costs and expenses increased by 6% from Php185.04 billion to Php196.59 billion with the following
breakdown:
(1) Php156.07 billion from TMP comprising cost of goods manufactured, cost of goods and services sold,
general and administrative expenses and interest expenses;
94
(2) Php23.25 billion from TMBC consisting of cost of goods and services sold, general and administrative
expenses and interest expenses;
(3) Php10.73 billion from Federal Land consisting of cost of real estate sales, cost of goods sold, cost of
rental, general and administrative expenses and interest expenses;
(4) Php4.84 billion from GT Capital representing interest expenses and general and administrative
expenses; and
(5) Php1.70 billion from GTCAD comprising cost of goods sold, general and administrative expenses and
interest expenses.
Cost of goods manufactured and sold comprising cost of materials, labor and overhead incurred in the assembly
of vehicles from TMP increased by 16% from Php31.81 billion in 2018 to Php36.82 billion in 2019 due to a 20%
increase in sales volume of completely-knocked-down (CKD) units from 44,751 to 53,919 units.
General and administrative expenses grew by 27% from Php10.67 billion to Php13.60 billion. TMP accounted for
Php8.38 billion consisting of advertisements and promotional expenses, salaries and wages, taxes and licenses,
and delivery and handling expenses. Federal Land accounted for Php2.97 billion composed of salaries and wages,
commission expenses, taxes and licenses and repairs and maintenance expenses. TMBC contributed Php1.69
billion representing salaries and wages, commission expenses and taxes and licenses and advertising and
promotional expenses. GT Capital and GTCAD contributed Php0.41 billion and Php0.15, respectively, consisting of
salaries and wages, professional fees and administrative and management fees.
Interest expense increased from Php5.40 billion to Php6.45 billion with GT Capital, Federal Land, TMP, and TMBC
accounting for Php4.43 billion, Php1.32 billion, Php0.58 billion, and Php0.12 billion, respectively.
Cost of real estate sales declined by 22% from Php6.84 billion to Php5.34 billion arising from the sale of lots to
joint venture partners in Sunshine Fort and North Bonifacio Land Realty and Development, Inc. in 2018, both
located in Fort BGC, Taguig City.
Cost of rental declined by 9% from Php0.48 billion to Php0.44 billion due to a decline in operating expenses
incurred in the leasing business such as depreciation, repairs and maintenance and other overhead expenses.
Provision for income tax increased by 30% from Php3.89 billion to Php5.06 billion due to a higher level of taxable
income in 2019 vis-à-vis the previous year.
Net income attributable to non-controlling interest grew by 8% from Php4.46 billion to Php4.80 billion due to an
increase in net income of non-wholly owned subsidiaries.
Consolidated net income attributable to equity holders of the Parent Company increased by 54% from Php13.16
billion in 2018 to Php20.31 billion in 2019.
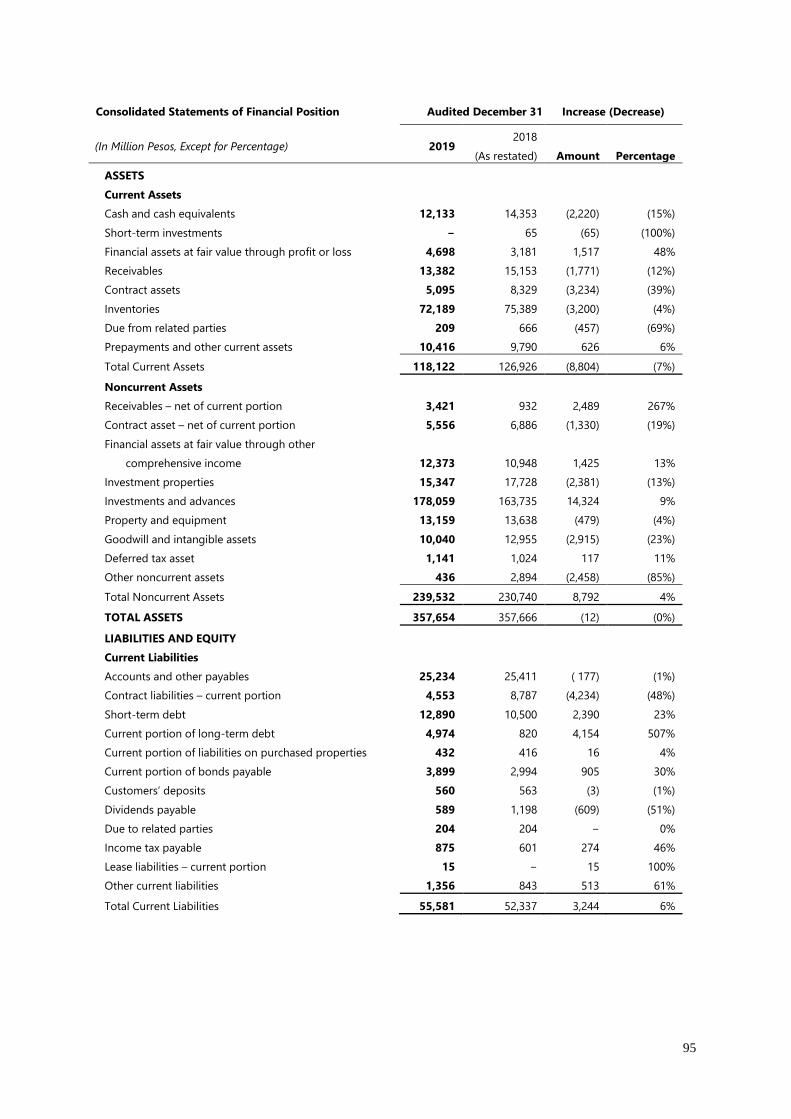
95
Consolidated Statements of Financial Position Audited December 31 Increase (Decrease)
(In Million Pesos, Except for Percentage) 2019 2018
(As restated) Amount Percentage
ASSETS
Current Assets
Cash and cash equivalents 12,133 14,353 (2,220) (15%)
Short-term investments − 65 (65) (100%)
Financial assets at fair value through profit or loss 4,698 3,181 1,517 48%
Receivables 13,382 15,153 (1,771) (12%)
Contract assets 5,095 8,329 (3,234) (39%)
Inventories 72,189 75,389 (3,200) (4%)
Due from related parties 209 666 (457) (69%)
Prepayments and other current assets 10,416 9,790 626 6%
Total Current Assets 118,122 126,926 (8,804) (7%)
Noncurrent Assets
Receivables – net of current portion 3,421 932 2,489 267%
Contract asset – net of current portion 5,556 6,886 (1,330) (19%)
Financial assets at fair value through other
comprehensive income 12,373 10,948 1,425 13%
Investment properties 15,347 17,728 (2,381) (13%)
Investments and advances 178,059 163,735 14,324 9%
Property and equipment 13,159 13,638 (479) (4%)
Goodwill and intangible assets 10,040 12,955 (2,915) (23%)
Deferred tax asset 1,141 1,024 117 11%
Other noncurrent assets 436 2,894 (2,458) (85%)
Total Noncurrent Assets 239,532 230,740 8,792 4%
TOTAL ASSETS 357,654 357,666 (12) (0%)
LIABILITIES AND EQUITY
Current Liabilities
Accounts and other payables 25,234 25,411 ( 177) (1%)
Contract liabilities – current portion 4,553 8,787 (4,234) (48%)
Short-term debt 12,890 10,500 2,390 23%
Current portion of long-term debt 4,974 820 4,154 507%
Current portion of liabilities on purchased properties 432 416 16 4%
Current portion of bonds payable 3,899 2,994 905 30%
Customers’ deposits 560 563 (3) (1%)
Dividends payable 589 1,198 (609) (51%)
Due to related parties 204 204 − 0%
Income tax payable 875 601 274 46%
Lease liabilities – current portion 15 − 15 100%
Other current liabilities 1,356 843 513 61%
Total Current Liabilities 55,581 52,337 3,244 6%
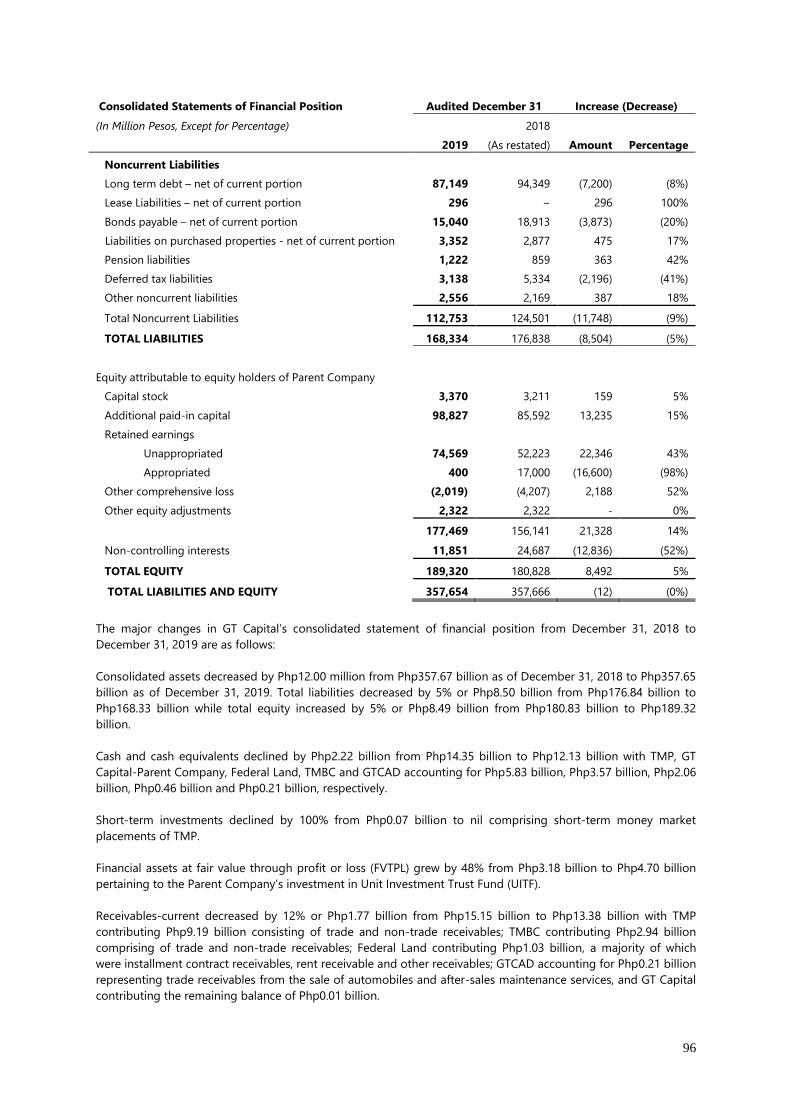
96
Consolidated Statements of Financial Position Audited December 31 Increase (Decrease)
(In Million Pesos, Except for Percentage)
2019
2018
(As restated) Amount Percentage
Noncurrent Liabilities
Long term debt – net of current portion 87,149 94,349 (7,200) (8%)
Lease Liabilities – net of current portion 296 − 296 100%
Bonds payable – net of current portion 15,040 18,913 (3,873) (20%)
Liabilities on purchased properties - net of current portion 3,352 2,877 475 17%
Pension liabilities 1,222 859 363 42%
Deferred tax liabilities 3,138 5,334 (2,196) (41%)
Other noncurrent liabilities 2,556 2,169 387 18%
Total Noncurrent Liabilities 112,753 124,501 (11,748) (9%)
TOTAL LIABILITIES 168,334 176,838 (8,504) (5%)
Equity attributable to equity holders of Parent Company
Capital stock 3,370 3,211 159 5%
Additional paid-in capital 98,827 85,592 13,235 15%
Retained earnings
Unappropriated 74,569 52,223 22,346 43%
Appropriated 400 17,000 (16,600) (98%)
Other comprehensive loss (2,019) (4,207) 2,188 52%
Other equity adjustments 2,322 2,322 - 0%
177,469 156,141 21,328 14%
Non-controlling interests 11,851 24,687 (12,836) (52%)
TOTAL EQUITY 189,320 180,828 8,492 5%
TOTAL LIABILITIES AND EQUITY 357,654 357,666 (12) (0%)
The major changes in GT Capital’s consolidated statement of financial position from December 31, 2018 to
December 31, 2019 are as follows:
Consolidated assets decreased by Php12.00 million from Php357.67 billion as of December 31, 2018 to Php357.65
billion as of December 31, 2019. Total liabilities decreased by 5% or Php8.50 billion from Php176.84 billion to
Php168.33 billion while total equity increased by 5% or Php8.49 billion from Php180.83 billion to Php189.32
billion.
Cash and cash equivalents declined by Php2.22 billion from Php14.35 billion to Php12.13 billion with TMP, GT
Capital-Parent Company, Federal Land, TMBC and GTCAD accounting for Php5.83 billion, Php3.57 billion, Php2.06
billion, Php0.46 billion and Php0.21 billion, respectively.
Short-term investments declined by 100% from Php0.07 billion to nil comprising short-term money market
placements of TMP.
Financial assets at fair value through profit or loss (FVTPL) grew by 48% from Php3.18 billion to Php4.70 billion
pertaining to the Parent Company’s investment in Unit Investment Trust Fund (UITF).
Receivables-current decreased by 12% or Php1.77 billion from Php15.15 billion to Php13.38 billion with TMP
contributing Php9.19 billion consisting of trade and non-trade receivables; TMBC contributing Php2.94 billion
comprising of trade and non-trade receivables; Federal Land contributing Php1.03 billion, a majority of which
were installment contract receivables, rent receivable and other receivables; GTCAD accounting for Php0.21 billion
representing trade receivables from the sale of automobiles and after-sales maintenance services, and GT Capital
contributing the remaining balance of Php0.01 billion.
97
Current portion of contract assets decreased by 39% from Php8.33 billion to Php5.10 billion due to the
deconsolidation of PCFI.
Due from related parties declined by Php0.46 billion from Php0.67 billion to Php0.21 billion mainly from Federal
Land’s related parties.
Prepayments and other current assets grew by 6% from Php9.79 billion to Php10.42 billion comprising of
advances to contractors and suppliers, input VAT, creditable withholding taxes, ad valorem taxes, prepaid
expenses and other current assets amounting to Php3.71 billion, Php3.52 billion, Php1.25 billion, Php 0.71 billion,
Php0.63 billion and Php0.60 billion.
Receivables - net of current portion increased by Php2.49 billion from Php0.93 billion to Php3.42 billion mainly
due to Federal Land’s booked real estate sales.
Contract assets - net of current portion decreased by 19% from Php6.89 billion to Php5.56 billion mainly
attributable to the deconsolidation of PCFI.
Financial assets at fair value through other comprehensive income grew by 13% from Php10.95 billion to
Php12.37 billion mainly due to the mark-to-market gains.
Investment properties declined by 13% from Php17.73 billion to Php15.35 billion due to the deconsolidation of
PCFI.
Investments in associates and jointly controlled entities increased by 9% from Php163.74 billion to Php178.06
billion primarily attributable to the following:
1) Php14.58 billion equity in net income which is further broken down into MBTC, (Php9.98); MPIC,
(Php3.63 billion); AXA, (Php0.60 billion); TFS, (Php0.30 billion); and other associates and joint ventures,
(Php0.07 billion other associates and joint ventures);
2) Php0.75 billion, equity in other comprehensive income of associates and joint ventures;
3) Php0.22 billion impact of intragroup eliminations;
4) Php0.89 billion additional investments during the year; and
Offset by Php2.12 billion dividends received.
Goodwill and intangible assets declined by 23% from Php12.96 billion to Php10.04 billion due to the
deconsolidation of PCFI.
Deferred tax asset increased by 11% from Php1.02 billion to Php1.14 billion with TMP, Federal Land, and TMBC
accounting for Php0.68 billion, Php0.39 billion, and Php0.07 billion, respectively.
Other non-current assets decreased by 85% from Php2.89 billion to Php0.44 billion comprising long-term
deposits, non-current input tax, non-current prepaid rent and other assets from Federal Land, (Php0.23 billion);
TMBC, (Php0.12 billion); TMP, (Php0.06 billion); GTCAD, (Php0.02 billion); and GT Capital, (Php0.01 billion).
Contract liabilities - current portion decreased by 48% from Php8.79 billion to Php4.55 billion mainly attributable
to the deconsolidation of PCFI.
Short-term debt increased by Php2.39 billion from Php10.50 billion to Php12.89 billion due to loan availments of
TMP, (Php23.46 billion); Federal Land, (Php7.57 billion); TMBC, (Php6.38 billion); and GTCAD (Php0.81 billion).
These were offset by loan payments by TMP, (Php23.99 billion); TMBC, (Php5.62 billion); Federal Land, (Php1.82
billion); GTCAD, (Php0.79 billion); and offset by the deconsolidation of PCFI (Php3.60 billion).
Current portion of long-term debt increased by Php4.15 billion from Php0.82 billion to Php4.97 billion mainly
attributable to the reclassification from noncurrent portion.
Current portion of bonds payable increased by Php0.91 from Php2.99 billion to Php3.90 billion due to a
reclassification from long term portion and settlement of Php2.99 billion last November 2019.
98
Dividends payable declined by 51% from Php1.20 billion to Php0.59 billion due to the deconsolidation of PCFI.
Dividends payable in 2018 includes PCFI’s dividends payable to minority shareholders.
Income tax payable grew by 46% from Php0.60 billion to Php0.88 billion due to an increase in taxable income.
Lease liabilities – current portion arose from the adoption of PFRS 16, Leases, the new accounting standard for
lease agreements which superseded the PAS 17.
Other current liabilities increased by Php0.51 billion from Php0.84 billion to Php1.36 billion attributable to the
higher VAT payable of TMP relative to increase in auto sales.
Long-term debt – net of current portion decreased by Php7.20 billion from Php94.35 billion to Php87.15 billion
mainly due to the deconsolidation of PCFI (Php6.53 billion), reclassification to current portion (Php4.93 billion)
and foreign exchange gain of Php0.39 billion. This is offset by Php4.58 billion loan availments.
Lease liabilities – net of current portion arose from the adoption of PFRS 16, Leases, the new accounting standard
for lease agreements, effective January 1, 2019.
Bonds payable – net of current portion decreased by Php3.87 billion due to its reclassification to current portion.
Pension liabilities increased by Php0.36 billion from Php0.86 billion to Php1.22 billion mainly due to increased
retirement benefit obligation of TMP and Federal Land.
Deferred tax liabilities declined by 41% from Php5.33 billion to Php3.14 billion mostly due to the deconsolidation
of PCFI.
Other noncurrent liabilities increased by 18% from Php2.17 billion to Php2.56 billion mostly due to higher
retention payable of Federal Land.
Capital stock grew by 5% from Php3.21 billion to Php3.37 billion due to the distribution of 8% stock dividends
(15,947,003 shares at Php10 par value per share).
Additional paid-in capital increased by 15% or Php13.24 billion due to the distribution of 8% stock dividends
(15,947,003 shares issued at Php840 per share).
Unappropriated retained earnings increased by Php22.35 billion from Php52.22 billion to Php74.57 billion mainly
due to the Php20.31 billion consolidated net income attributable to Parent Company earned during the year, the
Php16.60 billion reversal of appropriated retained earnings for the strategic investment in financial services, and
Php0.02 billion effect of deconsolidation of PCFI; offset by P13.40 billion stock dividends, and Php1.18 billion cash
dividends declared on common and voting preferred shares in March 2019.
Retained earnings - appropriated of Php16.60 billion was reversed and reclassified into unappropriated.
Other comprehensive loss improved by Php2.19 billion from a negative Php4.21 billion to a negative Php2.02
billion primarily due to the Php0.75 billion equity in OCI of associates and Php1.46 billion MTM gain on FVOCI
investments of Parent Company and subsidiaries; offset by Php0.02 billion effect of deconsolidation of PCFI.
Non-controlling interest (NCI) declined by 52% from Php24.69 billion to Php11.85 billion attributable to Php13.25
billion deconsolidated NCI on PCFI, Php4.26 billion NCI on dividends declared by subsidiaries and Php0.28 billion
NCI on other comprehensive loss. Mitigated by NCI on net income during the year amounting to Php4.80 billion
and Php0.15 billion NCI on acquisition of new subsidiaries (GTCAD-GTMV, GTMV-JBAP).
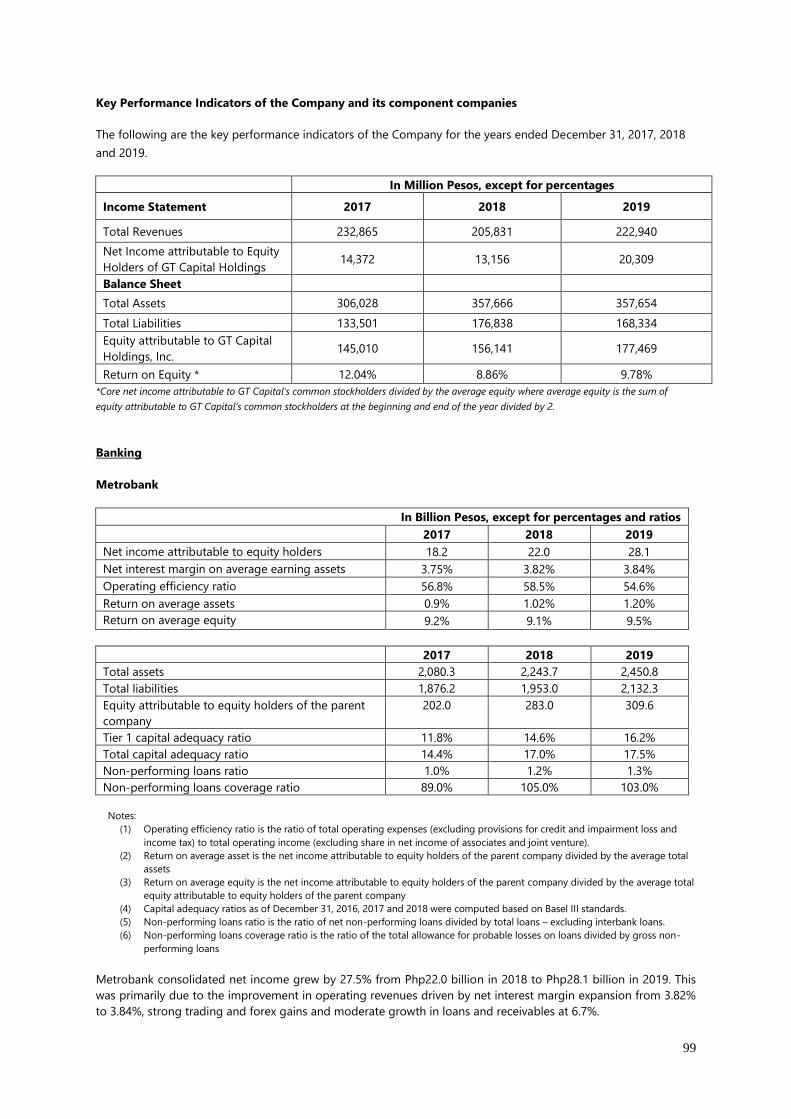
99
Key Performance Indicators of the Company and its component companies
The following are the key performance indicators of the Company for the years ended December 31, 2017, 2018
and 2019.
In Million Pesos, except for percentages
Income Statement 2017 2018 2019
Total Revenues 232,865 205,831 222,940
Net Income attributable to Equity
Holders of GT Capital Holdings 14,372 13,156 20,309
Balance Sheet
Total Assets 306,028 357,666 357,654
Total Liabilities 133,501 176,838 168,334
Equity attributable to GT Capital
Holdings, Inc. 145,010 156,141 177,469
Return on Equity * 12.04% 8.86% 9.78%
*Core net income attributable to GT Capital’s common stockholders divided by the average equity where average equity is the sum of
equity attributable to GT Capital’s common stockholders at the beginning and end of the year divided by 2.
Banking
Metrobank
In Billion Pesos, except for percentages and ratios
2017 2018 2019
Net income attributable to equity holders 18.2 22.0 28.1
Net interest margin on average earning assets 3.75% 3.82% 3.84%
Operating efficiency ratio 56.8% 58.5% 54.6%
Return on average assets 0.9% 1.02% 1.20%
Return on average equity 9.2% 9.1% 9.5%
2017 2018 2019
Total assets 2,080.3 2,243.7 2,450.8
Total liabilities 1,876.2 1,953.0 2,132.3
Equity attributable to equity holders of the parent
company
202.0 283.0 309.6
Tier 1 capital adequacy ratio 11.8% 14.6% 16.2%
Total capital adequacy ratio 14.4% 17.0% 17.5%
Non-performing loans ratio 1.0% 1.2% 1.3%
Non-performing loans coverage ratio 89.0% 105.0% 103.0%
Notes:
(1) Operating efficiency ratio is the ratio of total operating expenses (excluding provisions for credit and impairment loss and
income tax) to total operating income (excluding share in net income of associates and joint venture).
(2) Return on average asset is the net income attributable to equity holders of the parent company divided by the average total
assets
(3) Return on average equity is the net income attributable to equity holders of the parent company divided by the average total
equity attributable to equity holders of the parent company
(4) Capital adequacy ratios as of December 31, 2016, 2017 and 2018 were computed based on Basel III standards.
(5) Non-performing loans ratio is the ratio of net non-performing loans divided by total loans – excluding interbank loans.
(6) Non-performing loans coverage ratio is the ratio of the total allowance for probable losses on loans divided by gross non-
performing loans
Metrobank consolidated net income grew by 27.5% from Php22.0 billion in 2018 to Php28.1 billion in 2019. This
was primarily due to the improvement in operating revenues driven by net interest margin expansion from 3.82%
to 3.84%, strong trading and forex gains and moderate growth in loans and receivables at 6.7%.
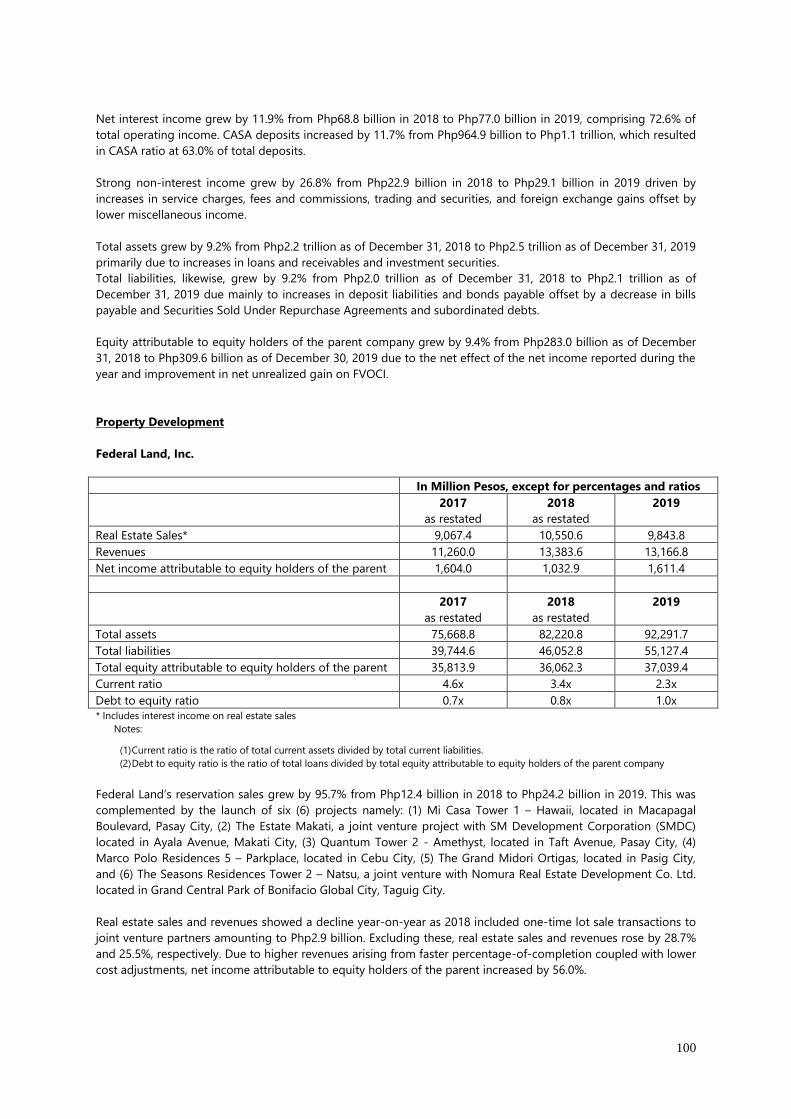
100
Net interest income grew by 11.9% from Php68.8 billion in 2018 to Php77.0 billion in 2019, comprising 72.6% of
total operating income. CASA deposits increased by 11.7% from Php964.9 billion to Php1.1 trillion, which resulted
in CASA ratio at 63.0% of total deposits.
Strong non-interest income grew by 26.8% from Php22.9 billion in 2018 to Php29.1 billion in 2019 driven by
increases in service charges, fees and commissions, trading and securities, and foreign exchange gains offset by
lower miscellaneous income.
Total assets grew by 9.2% from Php2.2 trillion as of December 31, 2018 to Php2.5 trillion as of December 31, 2019
primarily due to increases in loans and receivables and investment securities.
Total liabilities, likewise, grew by 9.2% from Php2.0 trillion as of December 31, 2018 to Php2.1 trillion as of
December 31, 2019 due mainly to increases in deposit liabilities and bonds payable offset by a decrease in bills
payable and Securities Sold Under Repurchase Agreements and subordinated debts.
Equity attributable to equity holders of the parent company grew by 9.4% from Php283.0 billion as of December
31, 2018 to Php309.6 billion as of December 30, 2019 due to the net effect of the net income reported during the
year and improvement in net unrealized gain on FVOCI.
Property Development
Federal Land, Inc.
In Million Pesos, except for percentages and ratios
2017
as restated
2018
as restated
2019
Real Estate Sales* 9,067.4 10,550.6 9,843.8
Revenues 11,260.0 13,383.6 13,166.8
Net income attributable to equity holders of the parent 1,604.0 1,032.9 1,611.4
2017
as restated
2018
as restated
2019
Total assets 75,668.8 82,220.8 92,291.7
Total liabilities 39,744.6 46,052.8 55,127.4
Total equity attributable to equity holders of the parent 35,813.9 36,062.3 37,039.4
Current ratio 4.6x 3.4x 2.3x
Debt to equity ratio 0.7x 0.8x 1.0x
* Includes interest income on real estate sales
Notes:
(1) Current ratio is the ratio of total current assets divided by total current liabilities.
(2) Debt to equity ratio is the ratio of total loans divided by total equity attributable to equity holders of the parent company
Federal Land’s reservation sales grew by 95.7% from Php12.4 billion in 2018 to Php24.2 billion in 2019. This was
complemented by the launch of six (6) projects namely: (1) Mi Casa Tower 1 – Hawaii, located in Macapagal
Boulevard, Pasay City, (2) The Estate Makati, a joint venture project with SM Development Corporation (SMDC)
located in Ayala Avenue, Makati City, (3) Quantum Tower 2 - Amethyst, located in Taft Avenue, Pasay City, (4)
Marco Polo Residences 5 – Parkplace, located in Cebu City, (5) The Grand Midori Ortigas, located in Pasig City,
and (6) The Seasons Residences Tower 2 – Natsu, a joint venture with Nomura Real Estate Development Co. Ltd.
located in Grand Central Park of Bonifacio Global City, Taguig City.
Real estate sales and revenues showed a decline year-on-year as 2018 included one-time lot sale transactions to
joint venture partners amounting to Php2.9 billion. Excluding these, real estate sales and revenues rose by 28.7%
and 25.5%, respectively. Due to higher revenues arising from faster percentage-of-completion coupled with lower
cost adjustments, net income attributable to equity holders of the parent increased by 56.0%.
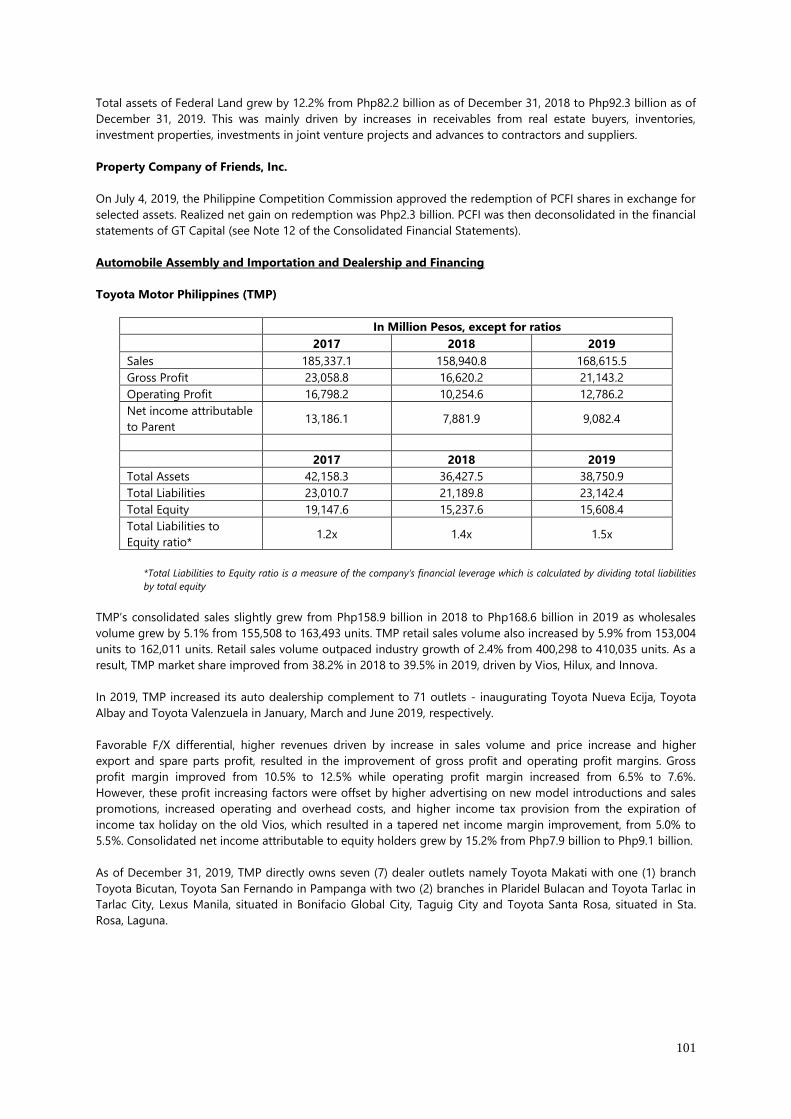
101
Total assets of Federal Land grew by 12.2% from Php82.2 billion as of December 31, 2018 to Php92.3 billion as of
December 31, 2019. This was mainly driven by increases in receivables from real estate buyers, inventories,
investment properties, investments in joint venture projects and advances to contractors and suppliers.
Property Company of Friends, Inc.
On July 4, 2019, the Philippine Competition Commission approved the redemption of PCFI shares in exchange for
selected assets. Realized net gain on redemption was Php2.3 billion. PCFI was then deconsolidated in the financial
statements of GT Capital (see Note 12 of the Consolidated Financial Statements).
Automobile Assembly and Importation and Dealership and Financing
Toyota Motor Philippines (TMP)
In Million Pesos, except for ratios
2017 2018 2019
Sales 185,337.1 158,940.8 168,615.5
Gross Profit 23,058.8 16,620.2 21,143.2
Operating Profit 16,798.2 10,254.6 12,786.2
Net income attributable
to Parent 13,186.1 7,881.9 9,082.4
2017 2018 2019
Total Assets 42,158.3 36,427.5 38,750.9
Total Liabilities 23,010.7 21,189.8 23,142.4
Total Equity 19,147.6 15,237.6 15,608.4
Total Liabilities to
Equity ratio* 1.2x 1.4x 1.5x
*Total Liabilities to Equity ratio is a measure of the company’s financial leverage which is calculated by dividing total liabilities
by total equity
TMP’s consolidated sales slightly grew from Php158.9 billion in 2018 to Php168.6 billion in 2019 as wholesales
volume grew by 5.1% from 155,508 to 163,493 units. TMP retail sales volume also increased by 5.9% from 153,004
units to 162,011 units. Retail sales volume outpaced industry growth of 2.4% from 400,298 to 410,035 units. As a
result, TMP market share improved from 38.2% in 2018 to 39.5% in 2019, driven by Vios, Hilux, and Innova.
In 2019, TMP increased its auto dealership complement to 71 outlets - inaugurating Toyota Nueva Ecija, Toyota
Albay and Toyota Valenzuela in January, March and June 2019, respectively.
Favorable F/X differential, higher revenues driven by increase in sales volume and price increase and higher
export and spare parts profit, resulted in the improvement of gross profit and operating profit margins. Gross
profit margin improved from 10.5% to 12.5% while operating profit margin increased from 6.5% to 7.6%.
However, these profit increasing factors were offset by higher advertising on new model introductions and sales
promotions, increased operating and overhead costs, and higher income tax provision from the expiration of
income tax holiday on the old Vios, which resulted in a tapered net income margin improvement, from 5.0% to
5.5%. Consolidated net income attributable to equity holders grew by 15.2% from Php7.9 billion to Php9.1 billion.
As of December 31, 2019, TMP directly owns seven (7) dealer outlets namely Toyota Makati with one (1) branch
Toyota Bicutan, Toyota San Fernando in Pampanga with two (2) branches in Plaridel Bulacan and Toyota Tarlac in
Tarlac City, Lexus Manila, situated in Bonifacio Global City, Taguig City and Toyota Santa Rosa, situated in Sta.
Rosa, Laguna.
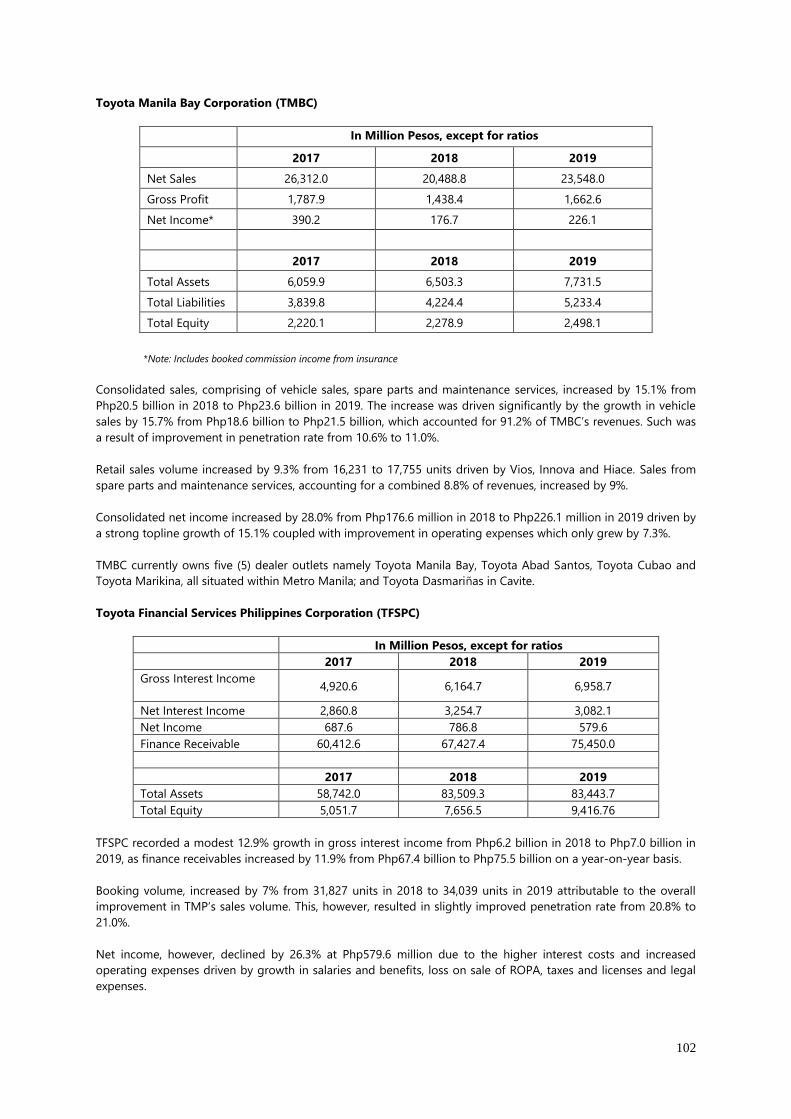
102
Toyota Manila Bay Corporation (TMBC)
In Million Pesos, except for ratios
2017 2018 2019
Net Sales 26,312.0 20,488.8 23,548.0
Gross Profit 1,787.9 1,438.4 1,662.6
Net Income* 390.2 176.7 226.1
2017 2018 2019
Total Assets 6,059.9 6,503.3 7,731.5
Total Liabilities 3,839.8 4,224.4 5,233.4
Total Equity 2,220.1 2,278.9 2,498.1
*Note: Includes booked commission income from insurance
Consolidated sales, comprising of vehicle sales, spare parts and maintenance services, increased by 15.1% from
Php20.5 billion in 2018 to Php23.6 billion in 2019. The increase was driven significantly by the growth in vehicle
sales by 15.7% from Php18.6 billion to Php21.5 billion, which accounted for 91.2% of TMBC’s revenues. Such was
a result of improvement in penetration rate from 10.6% to 11.0%.
Retail sales volume increased by 9.3% from 16,231 to 17,755 units driven by Vios, Innova and Hiace. Sales from
spare parts and maintenance services, accounting for a combined 8.8% of revenues, increased by 9%.
Consolidated net income increased by 28.0% from Php176.6 million in 2018 to Php226.1 million in 2019 driven by
a strong topline growth of 15.1% coupled with improvement in operating expenses which only grew by 7.3%.
TMBC currently owns five (5) dealer outlets namely Toyota Manila Bay, Toyota Abad Santos, Toyota Cubao and
Toyota Marikina, all situated within Metro Manila; and Toyota Dasmariñas in Cavite.
Toyota Financial Services Philippines Corporation (TFSPC)
In Million Pesos, except for ratios
2017 2018 2019
Gross Interest Income 4,920.6 6,164.7 6,958.7
Net Interest Income 2,860.8 3,254.7 3,082.1
Net Income 687.6 786.8 579.6
Finance Receivable 60,412.6 67,427.4 75,450.0
2017 2018 2019
Total Assets 58,742.0 83,509.3 83,443.7
Total Equity 5,051.7 7,656.5 9,416.76
TFSPC recorded a modest 12.9% growth in gross interest income from Php6.2 billion in 2018 to Php7.0 billion in
2019, as finance receivables increased by 11.9% from Php67.4 billion to Php75.5 billion on a year-on-year basis.
Booking volume, increased by 7% from 31,827 units in 2018 to 34,039 units in 2019 attributable to the overall
improvement in TMP’s sales volume. This, however, resulted in slightly improved penetration rate from 20.8% to
21.0%.
Net income, however, declined by 26.3% at Php579.6 million due to the higher interest costs and increased
operating expenses driven by growth in salaries and benefits, loss on sale of ROPA, taxes and licenses and legal
expenses.
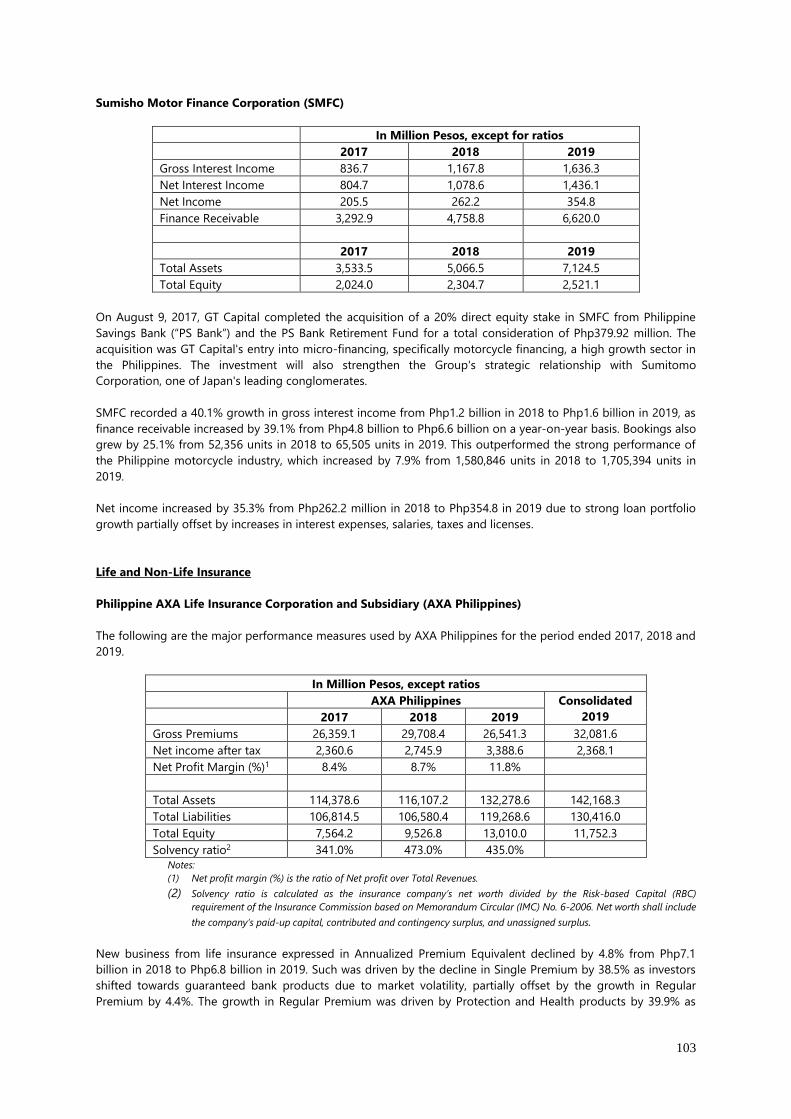
103
Sumisho Motor Finance Corporation (SMFC)
In Million Pesos, except for ratios
2017 2018 2019
Gross Interest Income 836.7 1,167.8 1,636.3
Net Interest Income 804.7 1,078.6 1,436.1
Net Income 205.5 262.2 354.8
Finance Receivable 3,292.9 4,758.8 6,620.0
2017 2018 2019
Total Assets 3,533.5 5,066.5 7,124.5
Total Equity 2,024.0 2,304.7 2,521.1
On August 9, 2017, GT Capital completed the acquisition of a 20% direct equity stake in SMFC from Philippine
Savings Bank (“PS Bank”) and the PS Bank Retirement Fund for a total consideration of Php379.92 million. The
acquisition was GT Capital's entry into micro-financing, specifically motorcycle financing, a high growth sector in
the Philippines. The investment will also strengthen the Group's strategic relationship with Sumitomo
Corporation, one of Japan's leading conglomerates.
SMFC recorded a 40.1% growth in gross interest income from Php1.2 billion in 2018 to Php1.6 billion in 2019, as
finance receivable increased by 39.1% from Php4.8 billion to Php6.6 billion on a year-on-year basis. Bookings also
grew by 25.1% from 52,356 units in 2018 to 65,505 units in 2019. This outperformed the strong performance of
the Philippine motorcycle industry, which increased by 7.9% from 1,580,846 units in 2018 to 1,705,394 units in
2019.
Net income increased by 35.3% from Php262.2 million in 2018 to Php354.8 in 2019 due to strong loan portfolio
growth partially offset by increases in interest expenses, salaries, taxes and licenses.
Life and Non-Life Insurance
Philippine AXA Life Insurance Corporation and Subsidiary (AXA Philippines)
The following are the major performance measures used by AXA Philippines for the period ended 2017, 2018 and
2019.
In Million Pesos, except ratios
AXA Philippines Consolidated
2019 2017 2018 2019
Gross Premiums 26,359.1 29,708.4 26,541.3 32,081.6
Net income after tax 2,360.6 2,745.9 3,388.6 2,368.1
Net Profit Margin (%)1 8.4% 8.7% 11.8%
Total Assets 114,378.6 116,107.2 132,278.6 142,168.3
Total Liabilities 106,814.5 106,580.4 119,268.6 130,416.0
Total Equity 7,564.2 9,526.8 13,010.0 11,752.3
Solvency ratio2 341.0% 473.0% 435.0%
Notes:
(1) Net profit margin (%) is the ratio of Net profit over Total Revenues.
(2) Solvency ratio is calculated as the insurance company’s net worth divided by the Risk-based Capital (RBC)
requirement of the Insurance Commission based on Memorandum Circular (IMC) No. 6-2006. Net worth shall include
the company’s paid-up capital, contributed and contingency surplus, and unassigned surplus.
New business from life insurance expressed in Annualized Premium Equivalent declined by 4.8% from Php7.1
billion in 2018 to Php6.8 billion in 2019. Such was driven by the decline in Single Premium by 38.5% as investors
shifted towards guaranteed bank products due to market volatility, partially offset by the growth in Regular
Premium by 4.4%. The growth in Regular Premium was driven by Protection and Health products by 39.9% as
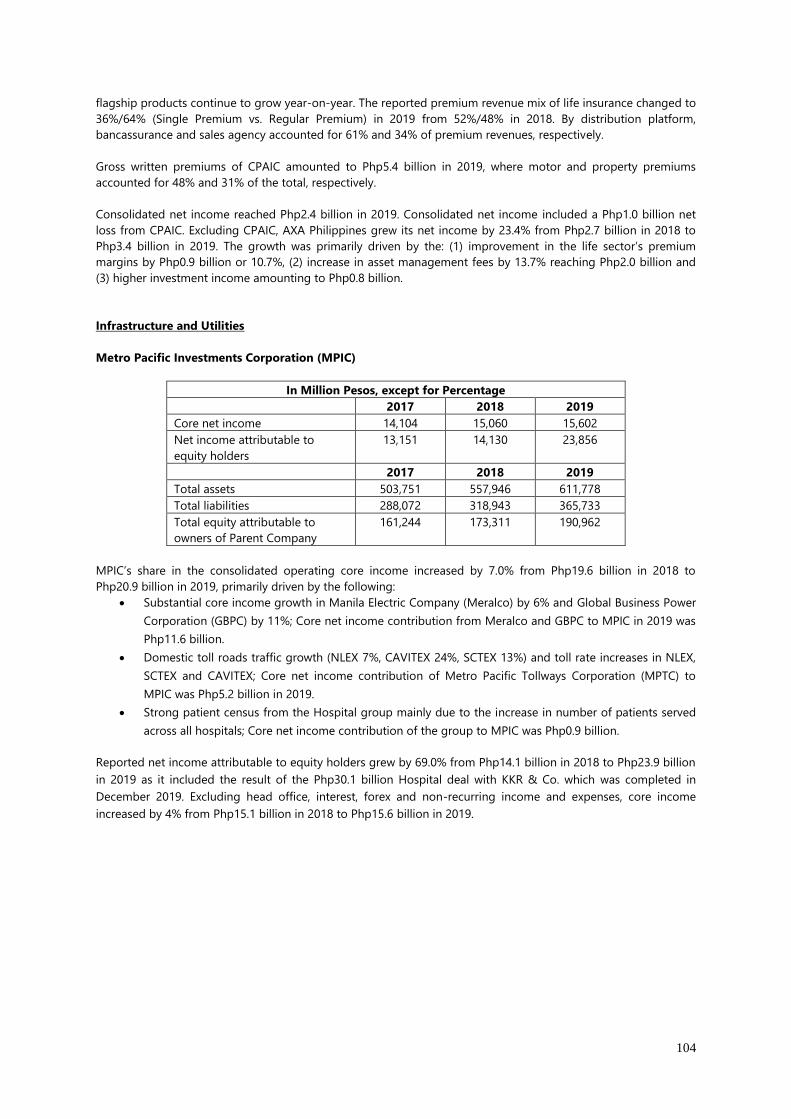
104
flagship products continue to grow year-on-year. The reported premium revenue mix of life insurance changed to
36%/64% (Single Premium vs. Regular Premium) in 2019 from 52%/48% in 2018. By distribution platform,
bancassurance and sales agency accounted for 61% and 34% of premium revenues, respectively.
Gross written premiums of CPAIC amounted to Php5.4 billion in 2019, where motor and property premiums
accounted for 48% and 31% of the total, respectively.
Consolidated net income reached Php2.4 billion in 2019. Consolidated net income included a Php1.0 billion net
loss from CPAIC. Excluding CPAIC, AXA Philippines grew its net income by 23.4% from Php2.7 billion in 2018 to
Php3.4 billion in 2019. The growth was primarily driven by the: (1) improvement in the life sector’s premium
margins by Php0.9 billion or 10.7%, (2) increase in asset management fees by 13.7% reaching Php2.0 billion and
(3) higher investment income amounting to Php0.8 billion.
Infrastructure and Utilities
Metro Pacific Investments Corporation (MPIC)
In Million Pesos, except for Percentage
2017 2018 2019
Core net income 14,104 15,060 15,602
Net income attributable to
equity holders
13,151 14,130 23,856
2017 2018 2019
Total assets 503,751 557,946 611,778
Total liabilities 288,072 318,943 365,733
Total equity attributable to
owners of Parent Company
161,244 173,311 190,962
MPIC’s share in the consolidated operating core income increased by 7.0% from Php19.6 billion in 2018 to
Php20.9 billion in 2019, primarily driven by the following:
• Substantial core income growth in Manila Electric Company (Meralco) by 6% and Global Business Power
Corporation (GBPC) by 11%; Core net income contribution from Meralco and GBPC to MPIC in 2019 was
Php11.6 billion.
• Domestic toll roads traffic growth (NLEX 7%, CAVITEX 24%, SCTEX 13%) and toll rate increases in NLEX,
SCTEX and CAVITEX; Core net income contribution of Metro Pacific Tollways Corporation (MPTC) to
MPIC was Php5.2 billion in 2019.
• Strong patient census from the Hospital group mainly due to the increase in number of patients served
across all hospitals; Core net income contribution of the group to MPIC was Php0.9 billion.
Reported net income attributable to equity holders grew by 69.0% from Php14.1 billion in 2018 to Php23.9 billion
in 2019 as it included the result of the Php30.1 billion Hospital deal with KKR & Co. which was completed in
December 2019. Excluding head office, interest, forex and non-recurring income and expenses, core income
increased by 4% from Php15.1 billion in 2018 to Php15.6 billion in 2019.
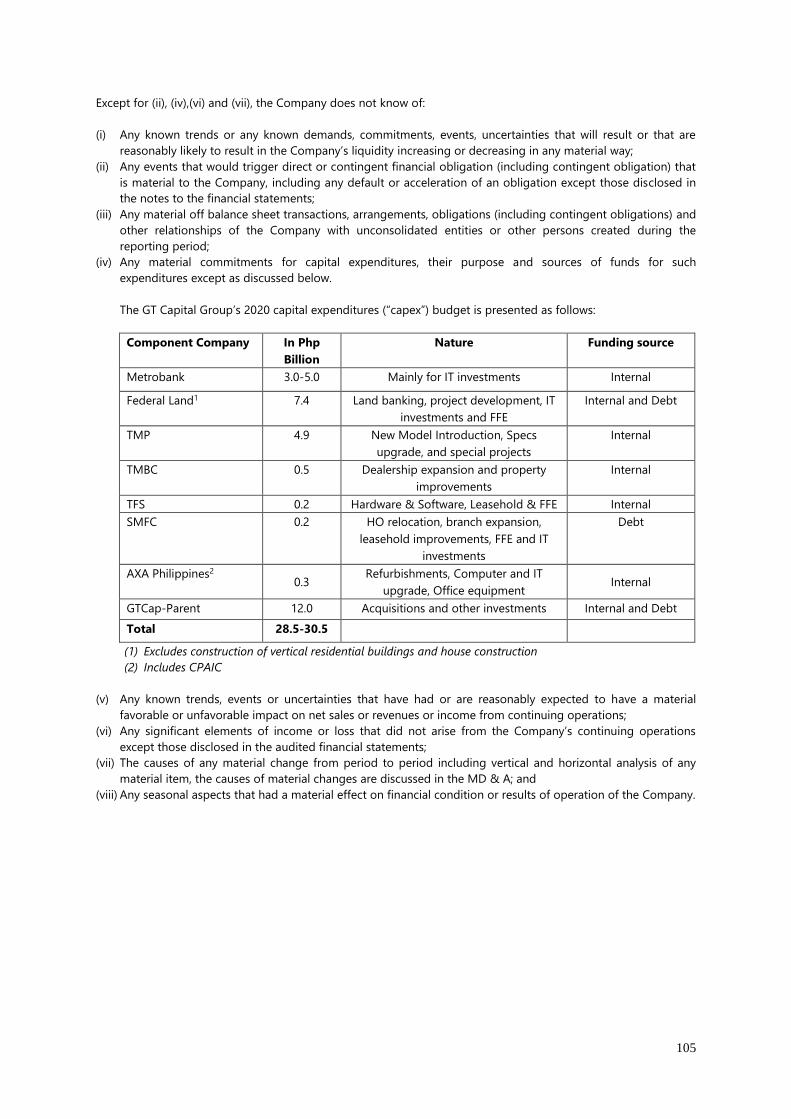
105
Except for (ii), (iv),(vi) and (vii), the Company does not know of:
(i) Any known trends or any known demands, commitments, events, uncertainties that will result or that are
reasonably likely to result in the Company’s liquidity increasing or decreasing in any material way;
(ii) Any events that would trigger direct or contingent financial obligation (including contingent obligation) that
is material to the Company, including any default or acceleration of an obligation except those disclosed in
the notes to the financial statements;
(iii) Any material off balance sheet transactions, arrangements, obligations (including contingent obligations) and
other relationships of the Company with unconsolidated entities or other persons created during the
reporting period;
(iv) Any material commitments for capital expenditures, their purpose and sources of funds for such
expenditures except as discussed below.
The GT Capital Group’s 2020 capital expenditures (“capex”) budget is presented as follows:
Component Company In Php
Billion
Nature Funding source
Metrobank 3.0-5.0 Mainly for IT investments Internal
Federal Land1 7.4 Land banking, project development, IT
investments and FFE
Internal and Debt
TMP 4.9 New Model Introduction, Specs
upgrade, and special projects
Internal
TMBC 0.5 Dealership expansion and property
improvements
Internal
TFS 0.2 Hardware & Software, Leasehold & FFE Internal
SMFC 0.2 HO relocation, branch expansion,
leasehold improvements, FFE and IT
investments
Debt
AXA Philippines2 0.3
Refurbishments, Computer and IT
upgrade, Office equipment Internal
GTCap-Parent 12.0 Acquisitions and other investments Internal and Debt
Total 28.5-30.5
(1) Excludes construction of vertical residential buildings and house construction
(2) Includes CPAIC
(v) Any known trends, events or uncertainties that have had or are reasonably expected to have a material
favorable or unfavorable impact on net sales or revenues or income from continuing operations;
(vi) Any significant elements of income or loss that did not arise from the Company’s continuing operations
except those disclosed in the audited financial statements;
(vii) The causes of any material change from period to period including vertical and horizontal analysis of any
material item, the causes of material changes are discussed in the MD & A; and
(viii) Any seasonal aspects that had a material effect on financial condition or results of operation of the Company.
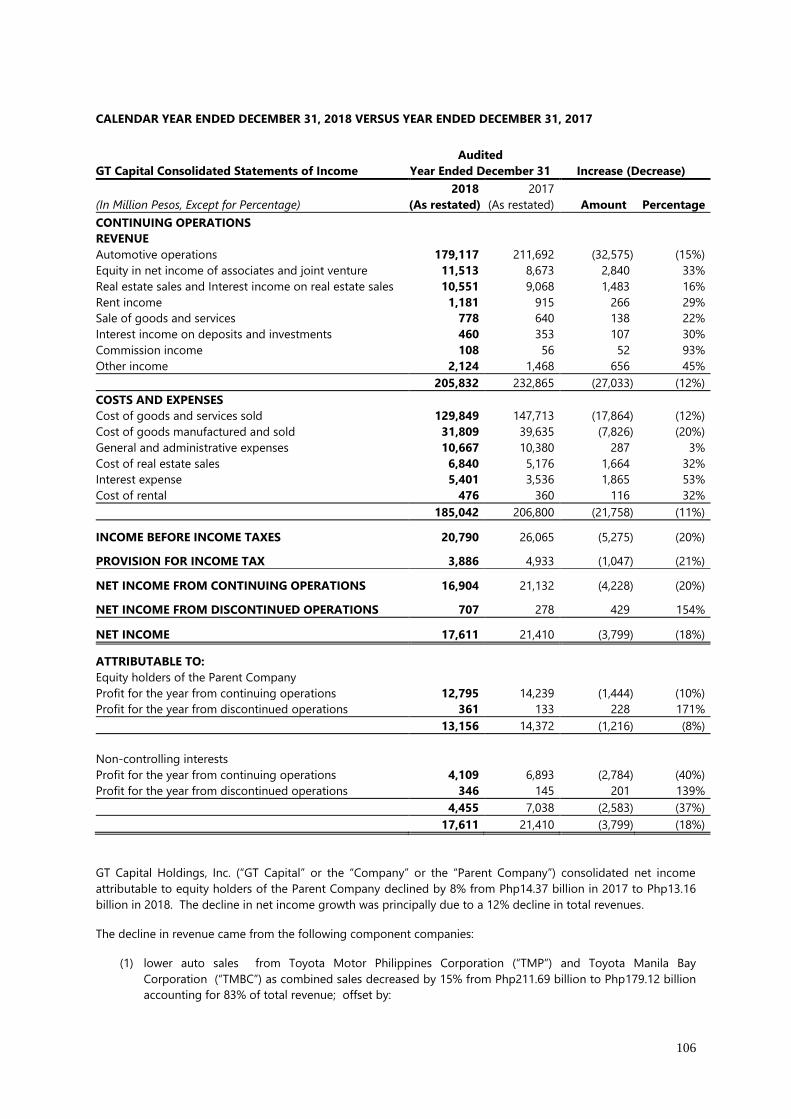
106
CALENDAR YEAR ENDED DECEMBER 31, 2018 VERSUS YEAR ENDED DECEMBER 31, 2017
GT Capital Consolidated Statements of Income
Audited
Year Ended December 31 Increase (Decrease)
(In Million Pesos, Except for Percentage)
2018
(As restated)
2017
(As restated) Amount Percentage
CONTINUING OPERATIONS
REVENUE
Automotive operations 179,117 211,692 (32,575) (15%)
Equity in net income of associates and joint venture 11,513 8,673 2,840 33%
Real estate sales and Interest income on real estate sales 10,551 9,068 1,483 16%
Rent income 1,181 915 266 29%
Sale of goods and services 778 640 138 22%
Interest income on deposits and investments 460 353 107 30%
Commission income 108 56 52 93%
Other income 2,124 1,468 656 45%
205,832 232,865 (27,033) (12%)
COSTS AND EXPENSES
Cost of goods and services sold 129,849 147,713 (17,864) (12%)
Cost of goods manufactured and sold 31,809 39,635 (7,826) (20%)
General and administrative expenses 10,667 10,380 287 3%
Cost of real estate sales 6,840 5,176 1,664 32%
Interest expense 5,401 3,536 1,865 53%
Cost of rental 476 360 116 32%
185,042 206,800 (21,758) (11%)
INCOME BEFORE INCOME TAXES 20,790 26,065 (5,275) (20%)
PROVISION FOR INCOME TAX 3,886 4,933 (1,047) (21%)
NET INCOME FROM CONTINUING OPERATIONS 16,904 21,132 (4,228) (20%)
NET INCOME FROM DISCONTINUED OPERATIONS 707 278 429 154%
NET INCOME 17,611 21,410 (3,799) (18%)
ATTRIBUTABLE TO:
Equity holders of the Parent Company
Profit for the year from continuing operations 12,795 14,239 (1,444) (10%)
Profit for the year from discontinued operations 361 133 228 171%
13,156 14,372 (1,216) (8%)
Non-controlling interests
Profit for the year from continuing operations 4,109 6,893 (2,784) (40%)
Profit for the year from discontinued operations 346 145 201 139%
4,455 7,038 (2,583) (37%)
17,611 21,410 (3,799) (18%)
GT Capital Holdings, Inc. (“GT Capital” or the “Company” or the “Parent Company”) consolidated net income
attributable to equity holders of the Parent Company declined by 8% from Php14.37 billion in 2017 to Php13.16
billion in 2018. The decline in net income growth was principally due to a 12% decline in total revenues.
The decline in revenue came from the following component companies:
(1) lower auto sales from Toyota Motor Philippines Corporation (“TMP”) and Toyota Manila Bay
Corporation (“TMBC”) as combined sales decreased by 15% from Php211.69 billion to Php179.12 billion
accounting for 83% of total revenue; offset by:
107
(2) higher real estate sales and interest income on real estate sales from Federal Land Inc. (Federal Land)
and Property Company of Friends, Inc. (“PCFI”) which grew by 16% from Php8.67 billion to Php11.51
billion; and
(3) higher equity in net income of associates and joint venture which grew by 33% from Php8.67 billion to
Php11.51 billion.
Core net income attributable to equity holders of the Parent Company reached Php12.92 billion in 2018 from
Php14.84 billion in 2017. Core net income for 2018 amounted to Php12.92 billion from a a reported net income of
13.16 billion, after deducting the Php0.32 billion non-recurring income, net of the taxes-related to lot sales, non-
recurring expenses, and share in MPIC's non-recurring loss; and adding back the Php0.08 billion amortization of
fair value adjustments arising from business combinations. Core net income for 2017 amounted to Php14.84
billion after deducting the Php0.17 non-recurring income from discontinued operations and adding back the
Php0.64 billion amortization of fair value adjustments arising from business combinations and non-recurring
expenses.
The financial statements of Federal Land, PCFI, TMP, TMBC and GT Capital Auto Dealership Holdings, Inc.
(“GTCAD”) are consolidated in the financial statements of the Company. The other component companies Metro
Pacific Investments Corporation (“MPIC”), Metropolitan Bank & Trust Company (“Metrobank” or “MBT’), Philippine
AXA Life Insurance Corporation (“AXA Philippines), Toyota Financial Services Philippines Corporation (“TFSPH”)
and Sumisho Motor Finance Corporation (“SMFC”) are accounted for through equity accounting.
Of the ten (10) component companies, Metrobank, PCFI, MPIC, TFSPH, AXA Philippines, and SMFC posted
growths in their respective net income. TMP, TMBC, and Federal Land, reported declines in their respective net
income for the year. GTCAD commenced commercial operations in November 2018.
Automotive operations comprising the sale of assembled and imported auto vehicles and spare parts declined by
15% from Php211.69 billion to Php179.12 billion principally driven by the 15% decrease in wholesales volume
from 183,209 units to 155,508 units.
Equity in net income of associates and jointly-controlled entities increased by 33% from Php8.67 billion to
Php11.51 billion primarily due to increases in:
(1) net income of Metrobank which increased by 21% from Php18.22 billion to Php22.01 billion given full
year impact of increased ownership from 26.47% to 36.09% effective May 1, 2017 and further increasing
to 36.36% effective April 1, 2018;
(2) net income of MPIC which increased by 7% from Php13.15 billion to Php14.13 billion;
(3) net income of AXA Philippines which increased by 25% from Php2.47 billion to Php3.08 billion; and
(4) net income of TFSPC which increased by 14% rom Php0.69 billion to Php0.79 billion.
Real estate sales and interest income on real estate sales rose by 16% from Php9.07 billion to Php10.55 billion.
Rent income, mainly from Federal Land’s GT Tower International office building and Blue Bay Walk, increased by
29% from Php0.92 billion to Php1.18 billion driven by rate escalation and higher occupancy for IMET.
Sale of goods and services, consisting of the sale of petroleum products on a wholesale and retail basis, in the
Blue Wave and Blue Baywalk malls and Roxas Boulevard situated in Pasay City and Marikina City, rose by 22%
from Php0.64 billion to Php0.78 billion due an increase in retail fuel prices and new franchises.
Interest income on deposits and investments grew by 30% from Php0.35 billion to Php0.46 billion due to higher
level of time deposit placements.
Commission income increased by Php0.05 billion from Php0.06 billion to Php0.11 billion due to an increase in
booked sales from Grand Hyatt Residences I.
Other income grew by 45% from Php1.47 billion to Php2.12 billion with: (1) Federal Land contributing Php0.87
billion comprising real estate forfeitures, management fees and other income; (2) TMP contributing Php0.61
billion consisting of gain on sale of fixed assets, and subscription and ancillary income from its dealer subsidiaries;
and (3) TMBC contributing Php0.44 billion consisting of ancillary income on finance and insurance commissions
and other income. The remaining balance of Php0.20 billion came from GT Capital’s dividend income from
investments in Toyota Motor Corporation (TMC) and gain on FVPTL investments.
108
Consolidated costs and expenses decreased by 11% from Php206.80 billion to Php185.04 billion with the
following breakdown:
(1) Php148.95 billion from TMP comprising cost of goods manufactured, cost of goods and services sold,
general and administrative expenses and interest expenses;
(2) Php20.37 billion from TMBC consisting of cost of goods and services sold, general and administrative
expenses and interest expenses;
(3) Php11.52 billion from Federal Land consisting of cost of real estate sales, cost of goods sold, cost of
rental, general and administrative expenses and interest expenses; and
(4) Php4.20 billion from GT Capital representing interest expenses and general and administrative
expenses.
Cost of goods and services sold decreased by 12% from Php147.71 billion to Php129.85 billion with TMP, TMBC
and GTCAD’s completely built-up units (CBU) and spare parts accounting for Php110.25 billion, Php18.73 billion
and Php0.20 billion, respectively. The balance of Php0.67 billion came from Federal Land’s petroleum service
station business.
Cost of goods manufactured and sold comprising cost of materials, labor and overhead incurred in the assembly
of vehicles from TMP declined by 20% from Php39.64 billion in 2017 to Php31.81 billion in 2018.
General and administrative expenses grew by 3% from Php10.38 billion to Php10.67 billion. TMP accounted for
Php6.49 billion consisting of salaries and wages, taxes and licenses, advertisements and promotional expenses,
and delivery and handling expenses. Federal Land accounted for Php2.37 billion composed of salaries and wages,
commission expenses, taxes and licenses and repairs and maintenance expenses; and TMBC contributed Php1.54
billion representing salaries and wages, commission expenses and taxes and licenses and advertising and
promotional expenses. GT Capital contributed Php0.24 billion consisting of salaries and wages, professional fees
and taxes and licenses. The remaining Php0.03 came from GTCAD which consists mainly of salaries and wages,
depreciation and amortization, and taxes and licenses.
Cost of real estate sales increased by 32% from Php5.18 billion to Php6.84 billion arising from the increase in real
estate sales.
Interest expense increased from Php3.54 billion to Php5.40 billion with GT Capital, Federal Land, TMP, and TMBC
accounting for Php3.95 billion, Php01.16 billion, Php0.19 billion, and Php0.10 billion, respectively.
Cost of rental grew by 32% from Php0.36 billion to Php0.48 billion due to an increase in operating expenses
incurred in the leasing business such as depreciation, utilities and other overhead expenses.
Provision for income tax declined by 21% from Php4.93 billion to Php3.89 billion due to lower taxable income.
Net income from discontinued operations grew reached Php0.71 billion from Php0.28 billion.
Net income attributable to non-controlling interest decreased by 37% from Php7.04 billion to Php4.46 billion due
decline in net income of non-wholly owned subsidiaries.
Consolidated net income attributable to equity holders of the Parent Company declined by 8% from Php14.37
billion in 2017 to Php13.16 billion in 2018.
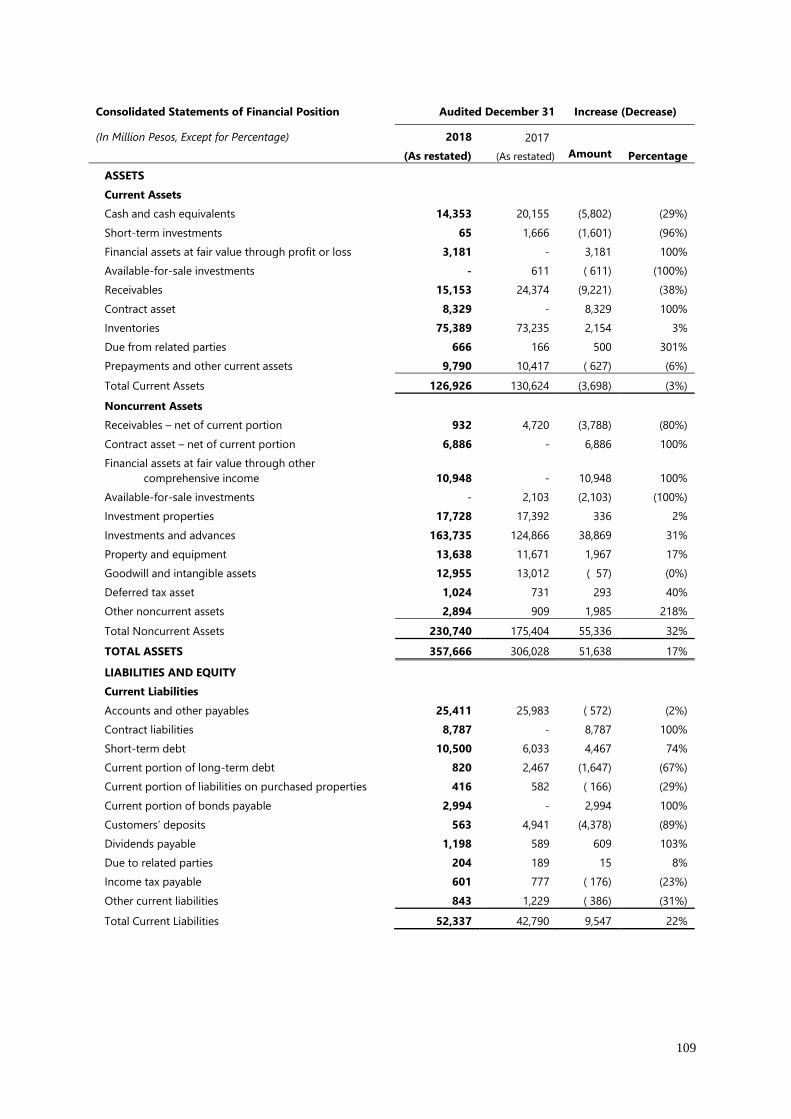
109
Consolidated Statements of Financial Position Audited December 31 Increase (Decrease)
(In Million Pesos, Except for Percentage) 2018
(As restated)
2017
(As restated) Amount Percentage
ASSETS
Current Assets
Cash and cash equivalents 14,353 20,155 (5,802) (29%)
Short-term investments 65 1,666 (1,601) (96%)
Financial assets at fair value through profit or loss 3,181 - 3,181 100%
Available-for-sale investments - 611 ( 611) (100%)
Receivables 15,153 24,374 (9,221) (38%)
Contract asset 8,329 - 8,329 100%
Inventories 75,389 73,235 2,154 3%
Due from related parties 666 166 500 301%
Prepayments and other current assets 9,790 10,417 ( 627) (6%)
Total Current Assets 126,926 130,624 (3,698) (3%)
Noncurrent Assets
Receivables – net of current portion 932 4,720 (3,788) (80%)
Contract asset – net of current portion 6,886 - 6,886 100%
Financial assets at fair value through other
comprehensive income 10,948 - 10,948 100%
Available-for-sale investments - 2,103 (2,103) (100%)
Investment properties 17,728 17,392 336 2%
Investments and advances 163,735 124,866 38,869 31%
Property and equipment 13,638 11,671 1,967 17%
Goodwill and intangible assets 12,955 13,012 ( 57) (0%)
Deferred tax asset 1,024 731 293 40%
Other noncurrent assets 2,894 909 1,985 218%
Total Noncurrent Assets 230,740 175,404 55,336 32%
TOTAL ASSETS 357,666 306,028 51,638 17%
LIABILITIES AND EQUITY
Current Liabilities
Accounts and other payables 25,411 25,983 ( 572) (2%)
Contract liabilities 8,787 - 8,787 100%
Short-term debt 10,500 6,033 4,467 74%
Current portion of long-term debt 820 2,467 (1,647) (67%)
Current portion of liabilities on purchased properties 416 582 ( 166) (29%)
Current portion of bonds payable 2,994 - 2,994 100%
Customers’ deposits 563 4,941 (4,378) (89%)
Dividends payable 1,198 589 609 103%
Due to related parties 204 189 15 8%
Income tax payable 601 777 ( 176) (23%)
Other current liabilities 843 1,229 ( 386) (31%)
Total Current Liabilities 52,337 42,790 9,547 22%
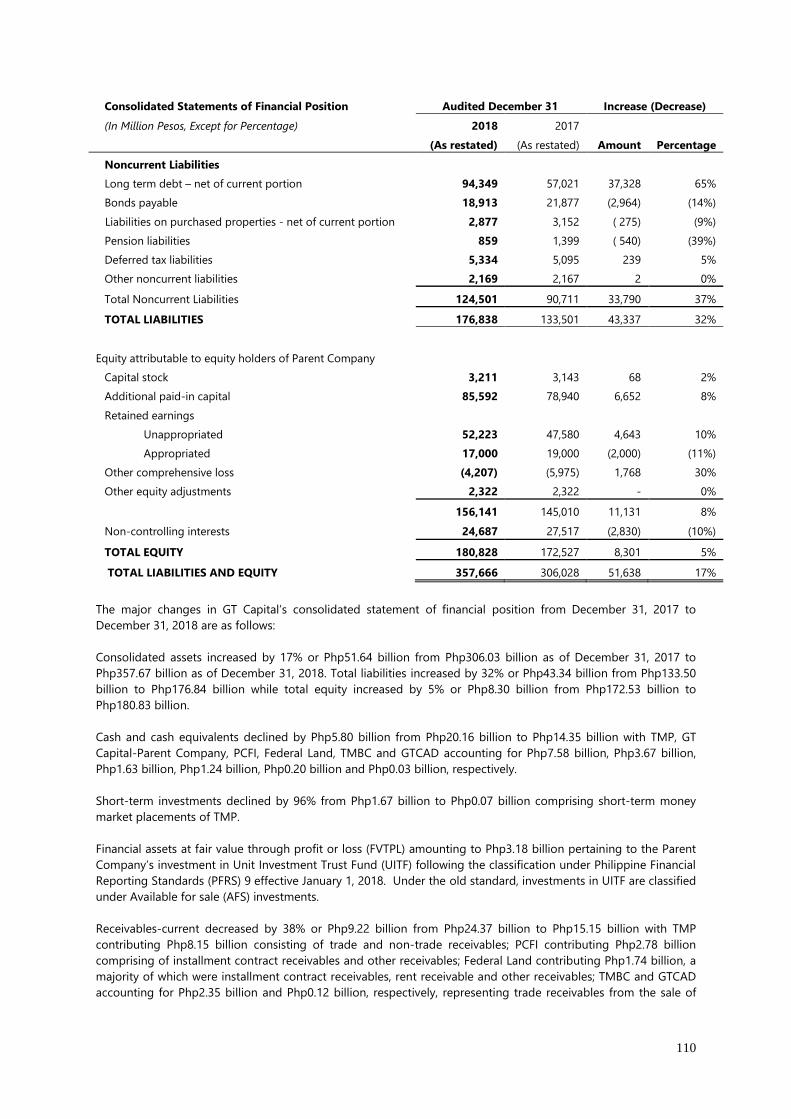
110
Consolidated Statements of Financial Position Audited December 31 Increase (Decrease)
(In Million Pesos, Except for Percentage) 2018
(As restated)
2017
(As restated) Amount Percentage
Noncurrent Liabilities
Long term debt – net of current portion 94,349 57,021 37,328 65%
Bonds payable 18,913 21,877 (2,964) (14%)
Liabilities on purchased properties - net of current portion 2,877 3,152 ( 275) (9%)
Pension liabilities 859 1,399 ( 540) (39%)
Deferred tax liabilities 5,334 5,095 239 5%
Other noncurrent liabilities 2,169 2,167 2 0%
Total Noncurrent Liabilities 124,501 90,711 33,790 37%
TOTAL LIABILITIES 176,838 133,501 43,337 32%
Equity attributable to equity holders of Parent Company
Capital stock 3,211 3,143 68 2%
Additional paid-in capital 85,592 78,940 6,652 8%
Retained earnings
Unappropriated 52,223 47,580 4,643 10%
Appropriated 17,000 19,000 (2,000) (11%)
Other comprehensive loss (4,207) (5,975) 1,768 30%
Other equity adjustments 2,322 2,322 - 0%
156,141 145,010 11,131 8%
Non-controlling interests 24,687 27,517 (2,830) (10%)
TOTAL EQUITY 180,828 172,527 8,301 5%
TOTAL LIABILITIES AND EQUITY 357,666 306,028 51,638 17%
The major changes in GT Capital’s consolidated statement of financial position from December 31, 2017 to
December 31, 2018 are as follows:
Consolidated assets increased by 17% or Php51.64 billion from Php306.03 billion as of December 31, 2017 to
Php357.67 billion as of December 31, 2018. Total liabilities increased by 32% or Php43.34 billion from Php133.50
billion to Php176.84 billion while total equity increased by 5% or Php8.30 billion from Php172.53 billion to
Php180.83 billion.
Cash and cash equivalents declined by Php5.80 billion from Php20.16 billion to Php14.35 billion with TMP, GT
Capital-Parent Company, PCFI, Federal Land, TMBC and GTCAD accounting for Php7.58 billion, Php3.67 billion,
Php1.63 billion, Php1.24 billion, Php0.20 billion and Php0.03 billion, respectively.
Short-term investments declined by 96% from Php1.67 billion to Php0.07 billion comprising short-term money
market placements of TMP.
Financial assets at fair value through profit or loss (FVTPL) amounting to Php3.18 billion pertaining to the Parent
Company’s investment in Unit Investment Trust Fund (UITF) following the classification under Philippine Financial
Reporting Standards (PFRS) 9 effective January 1, 2018. Under the old standard, investments in UITF are classified
under Available for sale (AFS) investments.
Receivables-current decreased by 38% or Php9.22 billion from Php24.37 billion to Php15.15 billion with TMP
contributing Php8.15 billion consisting of trade and non-trade receivables; PCFI contributing Php2.78 billion
comprising of installment contract receivables and other receivables; Federal Land contributing Php1.74 billion, a
majority of which were installment contract receivables, rent receivable and other receivables; TMBC and GTCAD
accounting for Php2.35 billion and Php0.12 billion, respectively, representing trade receivables from the sale of
111
automobiles and after-sales maintenance services, and GT Capital contributing the remaining balance of Php0.01
billion.
Contract assets-current amounting to Php8.33 billion are initially recognized for revenue earned from real estate
sales as receipt of consideration is conditional on successful completion of installation. Upon completion of
performance obligation and acceptance by the customer, the amounts recognized as contract assets are
reclassified to trade residential and office development receivables.
Inventories grew by 3% from Php74.87 billion to Php77.47 billion with Federal Land contributing Php38.58 billion
comprising land and improvements, condominium units for sale and inventory with construction-in-progress;
PCFI contributing Php29.66 billion comprising land and improvements, material inventory, ongoing construction
of house inventory and condominium units for sale; TMP contributing Php8.43 billion mostly finished goods; and
the balance of Php0.69 billion and Php0.11 billion coming from TMBC and GTCAD, respectively, representing
automobiles and spare parts.
Due from related-parties increased by Php0.50 billion from Php0.17 billion to Php0.67 billion mainly Federal
Land’s related-parties.
Prepayments and other current assets decreased by 6% from Php10.42 billion to Php9.79 billion comprising
advances to contractors and suppliers, prepaid expenses, deposit to land owners, input VAT, and creditable
withholding taxes from Federal Land, (Php4.85 billion); PCFI, (Php3.61 billion); TMP, (Php1.22 billion); TMBC,
(Php0.04 billion); and GT Capital, (Php0.07 billion).
Receivables - net of current portion decreased by Php3.79 billion from Php4.72 billion to Php0.93 billion mainly
due to reclassification to non-current contract asset following the provisions of PFRS 15.
Contract assets - net of current portion amounting to Php6.89 billion pertain to the non-current portion of the
excess of progress of work over the right to an amount of consideration that is unconditional.
Financial assets at fair value through other comprehensive income (FVOCI) amounted to Php10.95 billion mainly
the Parent Company’s acquisition of Toyota Motor Corporation common shares in the Tokyo Stock Exchange
following the reclassification under PFRS 9 effective January 1, 2018. Under the old standard, investments in
equity shares were classified under AFS investments.
Investments and advances increased by 31% from Php124.87 billion to Php163.74 billion primarily due to the
following:
1) Php29.63 billion additional and initial investments broken down as follows:
• Php22.45 billion additional investment in Metrobank arising from the latter’s stock rights
offering;
• Php4.33 billion additional investment in Sunshine Fort of Federal Land;
• Php1.58 billion initial investment in North Bonifacio Landmark Realty Development
Corporation (NBLRDI), net of Php0.11 billion advances in 2017 converted to equity in 2018
of Federal Land ;
• Php0.72 billion additional investment in TFSPC arising from its equity call;
• Php0.47 billion additional investment in ST 6747 of Federal Land; and
• Php0.08 billion initial investment in Magnificat and HSL South Food, Inc. of Federal Land.
2) Php11.51 billion share in net income of associates and joint ventures in 2018;
3) Php3.74 billion share in total comprehensive income arising from the adoption of PFRS 9 in January 1,
2018.
These were offset by the following:
1) Php2.44 billion share in other comprehensive loss of associates;
2) Php2.11 billion dividend income received from Metrobank, MPIC, AXA Philippines, and Crown Central;
and
3) Php1.48 billion impact of intra-group elimination.
Property and equipment grew by 17% from Php11.67 billion to Php13.64 billion mostly from the newly completed
building of TMP and TMBC (Marikina facility).
112
Deferred tax asset increased by 40% from Php0.73 billion to Php1.02 billion with TMP, Federal Land, TMBC and
PCFI accounting for Php0.45 billion, Php0.43 billion, Php0.08 billion and Php0.06 billion, respectively.
Other noncurrent assets increased by Php1.98 billion from Php0.91 billion to Php2.89 billion comprising long-
term deposits, non-current input tax, derivative asset, non-current prepaid rent and other assets from TMP,
(Php1.55 billion), PCFI, (Php0.82 billion); Federal Land, (Php0.43 billion); GTCAD, (Php0.06 billion); TMBC, (Php0.02
billion); and GT Capital, (Php0.01 billion).
Contract liabilities amounting to Php8.79 billion consist of collections from real estate customers which have not
reached the 10% threshold to qualify for revenue recognition and excess of collections over the recognized
receivables and contract assets based on percentage of completion.
Short-term debt increased by Php4.47 billion from Php6.03 billion to Php10.50 billion due to loan availments of
GT Capital, (Php10.75 billion); Federal Land, (Php9.20 billion); TMP, (Php2.42 billion); TMBC, (Php5.92 billion); PCFI,
(Php3.85 billion); and GTCAD (Php0.17 billion). These were offset by loan payments by GT Capital, (Php10.75
billion); Federal Land, (Php7.61 billion); TMBC, (Php5.65 billion); TMP, (Php2.33 billion); and PCFI, (Php1.50 billion).
Current portion of long-term debt declined by 67% from Php2.47 billion to Php0.82 billion primarily due to loan
payment by PCFI (Php3.51 billion) offset by reclassification from noncurrent portion of long-term debt (Php1.85
billion) and amortization of deferred financing cost and fair value adjustment (Php0.01 billion).
Current portion of liabilities on purchased properties decreased by 29% from Php0.58 billion to Php0.42 billion
due to a reclassification from non-current to current for the loan portion due within one year.
Current portion of bonds payable increased by Php2.99 billion due to reclassification from noncurrent portion of
bonds payable maturing in November 2019.
Customers’ deposits pertaining to reservation deposits and collections for accounts which do not qualify for
revenue recognition decreased by 89% from Php4.94 billion to Php0.56 billion.
Dividends payable increased by Php0.61 billion from Php0.59 billion to Php1.20 billion due to cash dividends
payable to noncontrolling shareholders of non-wholly owned subsidiaries.
Due to related parties increased by 8% from Php0.19 billion to Php0.20 billion primarily due to Federal Land’s
related parties.
Income tax payable decreased by 23% from Php0.78 billion to Php0.60 billion due to decrease in taxable income
in 2018 as compared to the taxable income in 2017.
Other current liabilities declined by Php0.39 billion from Php1.23 billion to Php0.84 billion primarily due to the
settlement of withholding taxes and output tax as of December 31, 2017 which were paid in the first quarter of
2018.
Long-term debt increased by Php37.33 billion from Php57.02 billion to Php94.35 billion primarily due to the: 1)
Php25 billion long-term loan availment by the Parent Company to fund its participation in the Metrobank stock
rights offering, net of Php0.19 billion documentary stamp tax of, 2) P11.05 billion long-term loan availment by
Parent Company denominated in foreign currency, net of Php0.09 billion transaction cost; 3) Php3.25 billion long
term loan availment by Federal Land, net of Php0.03 billion transaction cost; 4) Php0.19 billion translation loss of
foreign currency-denominated loans; and 5) Php0.07 billion amortization of deferred financing cost; offset by the
1) Php1.85 billion reclassification to current portion of long-term debt; and 2) the Php0.07 billion loan payments.
Non-current portion of bonds payable decreased by Php2.96 billion due to reclassification to current portion of
bonds payable maturing in November 2019.
Non-current portion of liabilities on purchased properties declined by Php0.27 billion from Php3.15 billion to
Php2.88 billion mainly due to reclassification to current portion.
113
Pension liabilities declined by 39% from Php1.40 billion to Php0.86 billion mainly due to increased funding in
2018.
Deferred tax liabilities grew by 5% from Php5.10 billion to Php5.33 billion due to an increase in taxable temporary
differences.
Capital stock increase of Php67.41 million pertain to the par value of the 6.74 million common shares
representing 3.5% stock dividends declared and issued by GT Capital in 2018.
Additional paid in capital increase of Php6.65 billion pertain to the excess over par value of the 3.5% stock
dividends declared and issued by GT Capital in 2018 at Php997.00 per share.
Unappropriated retained earnings increased by Php4.64 billion from Php47.58 billion to Php52.22 billion due to
the (1) Php13.16 billion net income attributable to equity holders of the Parent Company; and (2) Php19.00 billion
retained earnings reverted back to unappropriated retained earnings from appropriated retained earnings;
partially offset by the (1) Php1.16 billion cash dividends declared to shareholders of common and preferred stock;
(2) Php6.72 billion stock dividends; (3) Php17.00 billion appropriation of retained earnings for strategic
investment in financial services; (4) Php2.58 billion effect of the adoption of PFRS 9 and 15; and (5) and Php0.04
billion realized loss on sale of financial assets at FVOCI.
The Php17.00 billion appropriated retained earnings as of December 31, 2018 pertains to the appropriation of
retained earnings earmarked for strategic investments in property development in 2019.
Other comprehensive loss improved by Php1.77 billion from a negative Php5.98 billion to a negative Php4.21
billion primarily due to the (1) Php5.54 billion equity in other comprehensive income of associates arising from
adoption of PFRS 9; (2) Php0.07 bilion gain on remeasurement of cash flow hedge reserve; (3) Php0.13 billion gain
on remeasurement of pension liabilities; and (4) Php0.04 billion effect of adoption of PFRS 9; offset by (1) Php2.44
billion equity in other comprehensive loss of associates; and (2) Php1.57 billion mark-to-market loss on FVOCI
investments.
Non-controlling interest (NCI) declined by 10% from Php27.52 billion to Php24.69 billion due to the Php4.46
billion net income attributable to NCI, Php0.24 billion other comprehensive income attributable to NCI, Php0.04
billion share of NCI in capital call; offset by Php6.92 billion NCI share in dividends declared by majority-owned
subsidiaries and Php0.65 billion effect of adoption of PFRS 9 and 15.
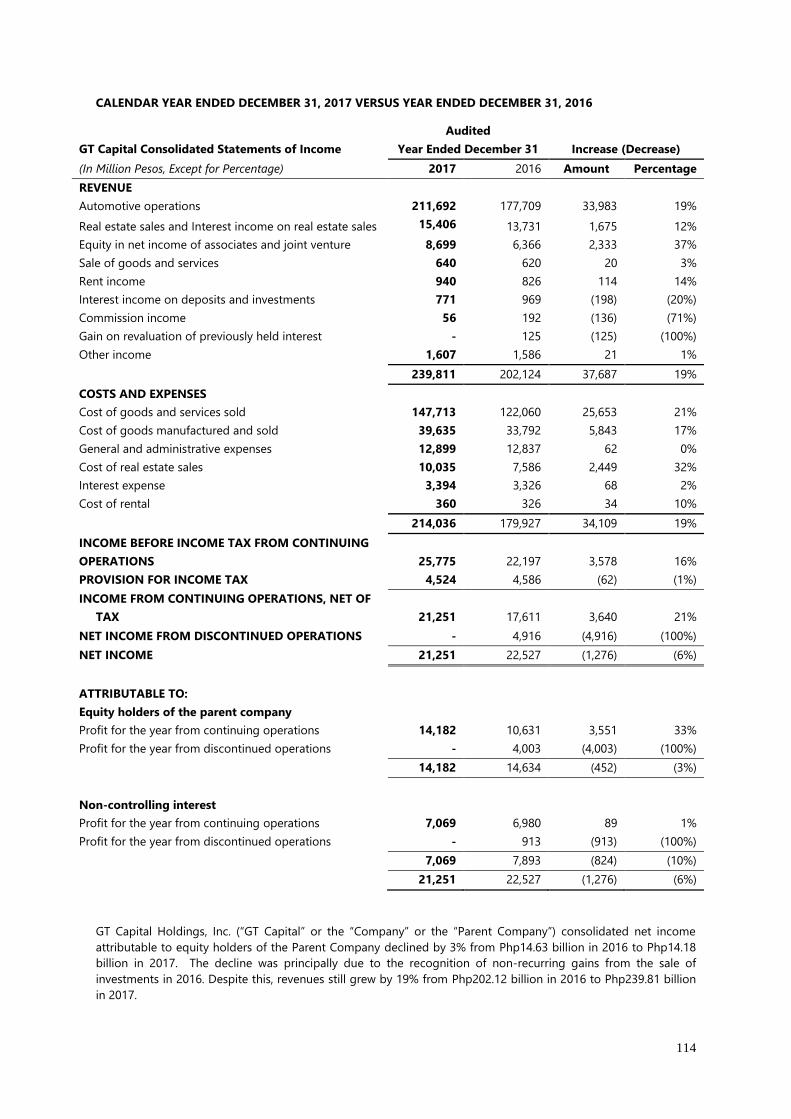
114
CALENDAR YEAR ENDED DECEMBER 31, 2017 VERSUS YEAR ENDED DECEMBER 31, 2016
GT Capital Consolidated Statements of Income
Audited
Year Ended December 31 Increase (Decrease)
(In Million Pesos, Except for Percentage) 2017 2016 Amount Percentage
REVENUE
Automotive operations 211,692 177,709 33,983 19%
Real estate sales and Interest income on real estate sales 15,406 13,731 1,675 12%
Equity in net income of associates and joint venture 8,699 6,366 2,333 37%
Sale of goods and services 640 620 20 3%
Rent income 940 826 114 14%
Interest income on deposits and investments 771 969 (198) (20%)
Commission income 56 192 (136) (71%)
Gain on revaluation of previously held interest - 125 (125) (100%)
Other income 1,607 1,586 21 1%
239,811 202,124 37,687 19%
COSTS AND EXPENSES
Cost of goods and services sold 147,713 122,060 25,653 21%
Cost of goods manufactured and sold 39,635 33,792 5,843 17%
General and administrative expenses 12,899 12,837 62 0%
Cost of real estate sales 10,035 7,586 2,449 32%
Interest expense 3,394 3,326 68 2%
Cost of rental 360 326 34 10%
214,036 179,927 34,109 19%
INCOME BEFORE INCOME TAX FROM CONTINUING
OPERATIONS 25,775 22,197 3,578 16%
PROVISION FOR INCOME TAX 4,524 4,586 (62) (1%)
INCOME FROM CONTINUING OPERATIONS, NET OF
TAX 21,251 17,611 3,640 21%
NET INCOME FROM DISCONTINUED OPERATIONS - 4,916 (4,916) (100%)
NET INCOME 21,251 22,527 (1,276) (6%)
ATTRIBUTABLE TO:
Equity holders of the parent company
Profit for the year from continuing operations 14,182 10,631 3,551 33%
Profit for the year from discontinued operations - 4,003 (4,003) (100%)
14,182 14,634 (452) (3%)
Non-controlling interest
Profit for the year from continuing operations 7,069 6,980 89 1%
Profit for the year from discontinued operations - 913 (913) (100%)
7,069 7,893 (824) (10%)
21,251 22,527 (1,276) (6%)
GT Capital Holdings, Inc. (“GT Capital” or the “Company” or the “Parent Company”) consolidated net income
attributable to equity holders of the Parent Company declined by 3% from Php14.63 billion in 2016 to Php14.18
billion in 2017. The decline was principally due to the recognition of non-recurring gains from the sale of
investments in 2016. Despite this, revenues still grew by 19% from Php202.12 billion in 2016 to Php239.81 billion
in 2017.
115
The revenue growth came from the following component companies:
(1) auto sales from Toyota Motor Philippines Corporation (“TMP”) and Toyota Manila Bay Corporation
(“TMBC”) as combined sales increased from Php177.71 billion to Php211.69 billion accounting for 88% of
total revenue;
(2) higher real estate sales and interest income on real estate sales from Federal Land Inc. (Fed Land) and
Property Company of Friends, Inc. (“PCFI”) which grew by 12% from Php13.73 billion to Php15.41 billion;
and
(3) higher equity in net income of associates and joint venture which grew by 37% from Php6.37 billion to
Php8.70 billion.
Core net income attributable to equity holders of the Parent Company improved by 29% from Php11.67 billion to
Php15.03 billion. Core net income for 2017 amounted to Php15.03 billion, after adding back the (1) Php0.70
billion amortization of fair value adjustments arising from various business combinations; and (2) Php0.15 billion
non-recurring gains. Core net income for 2016 amounted to Php11.67 billion, after excluding the Php3.20 billion
one-time gains from the sale of investments in shares of stock of Global Business Power Corporation (GBPC) and
Charter Ping An Insurance Corporation (“CPAIC”), among others, net of related taxes and expenses; and adding
back the (1) Php0.20 billion non-recurring reinsurance cost of CPAIC; and (2) Php0.04 billion amortization of fair
value adjustments arising from various business combinations.
The financial statements of Fed Land, PCFI, TMP, TMBC and GT Capital Auto Dealership Holdings, Inc. (“GTCAD”)
are consolidated in the financial statements of the Company. The other component companies Metro Pacific
Investments Corporation (“MPIC”), Metropolitan Bank & Trust Company (“Metrobank” or “MBT’), Philippine AXA
Life Insurance Corporation (“AXA Philippines), Toyota Financial Services Philippines Corporation (“TFSPH”) and
Sumisho Motor Finance Corporation (“SMFC”) are accounted for through equity accounting.
Of the ten (10) component companies, TMP, TMBC, Metrobank, MPIC, TFSPH, AXA Philippines, and SMFC posted
growths in their respective net income. Fed Land, and PCFI, reported declines in their respective net income for
the year. GTCAD has not commenced commercial operations.
Automotive operations comprising the sale of assembled and imported auto vehicles and spare parts grew by
19% from Php177.71 billion to Php211.69 billion principally driven by the 13% increase in wholesales volume
from 162,085 units to 183,209 units and continued expansion in the dealer outlets from 52 to 63.
Real estate sales and interest income on real estate sales rose by 12% from Php13.73 billion to Php15.41 billion.
Fed Land contributed approximately 59% of total sales, mostly from middle-market development projects. PCFI’s
low cost and economic housing projects contributed the remaining balance.
Equity in net income of associates and joint venture, increased by 37% from Php6.37 billion to Php8.70 billion due
to increases in: (1) net income of MPIC increasing by 15% from Php11.46 billion to Php13.15 billion which
contributed full year in 2017 as compared to seven (7) months in 2016; (2) net income of Metrobank increasing
by 1% from Php18.09 billion to Php18.22 billion with increased ownership from 26.47% to 36.09% effective May 1,
2017; and (3) net income of AXA Philippines more than doubled from Php1.13 billion to Php2.47 billion.
Rent income, mainly from Fed Land’s GT Tower International office building and Blue Bay Walk, increased by 14%
from Php0.83 billion to Php0.94 billion.
Interest income on deposits and investments declined by 20% from Php0.97 billion to Php0.77 billion due to a
decline in cash available for short-term placements by GT Capital and subsidiaries.
Commission income declined by Php0.14 billion from Php0.19 billion to Php0.05 billion due to a decline in
booked sales of Grand Hyatt Residences.
Gain on revaluation of previously-held interest in 2016 amounted to Php0.12 billion, representing one-time gains
arising from the re-measurement of GT Capital’s investment in TMBC, (Php0.07 billion); and Fed Land’s
investment in Federal Land Orix Corporation (FLOC), (Php0.05 billion), which were previously accounted for as
investment in jointly-controlled entities.
116
Consolidated costs and expenses increased by 19% from Php179.93 billion to Php214.04 billion with the following
breakdown:
(1) Php169.34 billion from TMP comprising cost of goods manufactured, cost of goods and services sold,
general and administrative expenses and interest expenses;
(2) Php25.91 billion from TMBC consisting of cost of goods and services sold, general and administrative
expenses and interest expenses;
(3) Php9.29 billion from Fed Land consisting of cost of real estate sales, cost of goods sold, cost of rental,
general and administrative expenses and interest expenses;
(4) Php6.62 billion from PCFI comprising cost of real estate sales, general and administrative expenses and
interest expenses; and
(5) Php2.88 billion from GT Capital representing interest expenses and general and administrative
expenses.
Cost of goods and services sold increased by 21% from Php122.06 billion to Php147.71 billion with TMP’s and
TMBC’s completely built-up units and spare parts accounting for Php147.15 billion and the balance of Php0.56
billion from Fed Land‘s petroleum service station business.
Cost of goods manufactured and sold comprising cost of materials, labor and overhead incurred in the assembly
of vehicles from TMP grew by 17% from Php33.79 billion in 2016 to Php39.63 billion in 2017.
Cost of real estate sales increased by 32% from Php7.59 billion to Php10.04 billion arising from the increase in
real estate sales. Fed Land contributed 61% of the cost while PCFI accounted for the remaining 39%.
Interest expenses increased from Php3.33 billion to Php3.39 billion with GT Capital, PCFI, TMP, Fed Land, and
TMBC accounting for Php2.61 billion, Php0.47 billion, Php0.12 billion, Php0.12 billion and Php0.07 billion,
respectively.
General and administrative expenses grew from Php12.84 billion in 2016 to Php12.90 billion in 2017. TMP
accounted for Php6.66 billion consisting of salaries and wages, advertisements and promotional expenses, taxes
and licenses and delivery and handling expenses. PCFI contributed Php2.24 billion consisting of salaries and
wages, commission expenses, advertising and promotional expenses, outside services and taxes and licenses. Fed
Land accounted for Php2.13 billion composed of salaries and wages, commission expenses, taxes and licenses
and repairs and maintenance expenses. TMBC contributed Php1.60 billion representing salaries and wages,
commission expenses and advertising and promotional expenses and taxes and licenses and GT Capital
contributed Php0.27 billion consisting of salaries and wages, professional fees and taxes and licenses.
Cost of rental grew by 10% from Php0.33 billion to Php0.36 billion due to an increase in depreciation of the
building leased out.
Income from discontinued operations in 2016 amounted to Php4.92 billion consisting of non-recurring gains
from sale of the Parent Company’s investment in GBPC and CPAIC amounting to Php3.44 billion and Php0.25
billion, respectively, and net income contribution of GBPC amounted to Php1.39 billion offset by Php0.16 billion
losses incurred by CPAIC.
Net income attributable to non-controlling interest decreased by 10% from Php7.89 billion to Php7.07 billion due
to the sale of GBPC in 2016, which is a majority-owned subsidiary.
Consolidated net income attributable to equity holders of the Parent Company declined by 3% from Php14.63
billion in 2016 to Php14.18 billion in 2017.
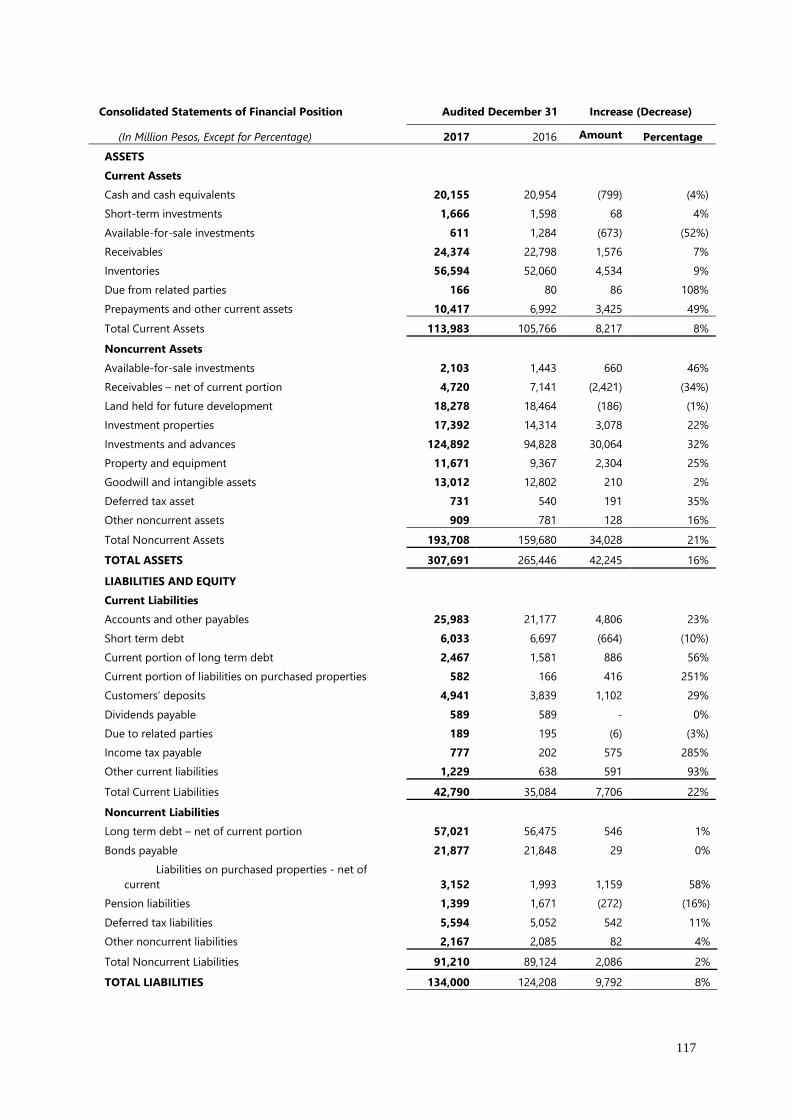
117
Consolidated Statements of Financial Position Audited December 31 Increase (Decrease)
(In Million Pesos, Except for Percentage) 2017 2016 Amount Percentage
ASSETS
Current Assets
Cash and cash equivalents 20,155 20,954 (799) (4%)
Short-term investments 1,666 1,598 68 4%
Available-for-sale investments 611 1,284 (673) (52%)
Receivables 24,374 22,798 1,576 7%
Inventories 56,594 52,060 4,534 9%
Due from related parties 166 80 86 108%
Prepayments and other current assets 10,417 6,992 3,425 49%
Total Current Assets 113,983 105,766 8,217 8%
Noncurrent Assets
Available-for-sale investments 2,103 1,443 660 46%
Receivables – net of current portion 4,720 7,141 (2,421) (34%)
Land held for future development 18,278 18,464 (186) (1%)
Investment properties 17,392 14,314 3,078 22%
Investments and advances 124,892 94,828 30,064 32%
Property and equipment 11,671 9,367 2,304 25%
Goodwill and intangible assets 13,012 12,802 210 2%
Deferred tax asset 731 540 191 35%
Other noncurrent assets 909 781 128 16%
Total Noncurrent Assets 193,708 159,680 34,028 21%
TOTAL ASSETS 307,691 265,446 42,245 16%
LIABILITIES AND EQUITY
Current Liabilities
Accounts and other payables 25,983 21,177 4,806 23%
Short term debt 6,033 6,697 (664) (10%)
Current portion of long term debt 2,467 1,581 886 56%
Current portion of liabilities on purchased properties 582 166 416 251%
Customers’ deposits 4,941 3,839 1,102 29%
Dividends payable 589 589 - 0%
Due to related parties 189 195 (6) (3%)
Income tax payable 777 202 575 285%
Other current liabilities 1,229 638 591 93%
Total Current Liabilities 42,790 35,084 7,706 22%
Noncurrent Liabilities
Long term debt – net of current portion 57,021 56,475 546 1%
Bonds payable 21,877 21,848 29 0%
Liabilities on purchased properties - net of
current 3,152 1,993 1,159 58%
Pension liabilities 1,399 1,671 (272) (16%)
Deferred tax liabilities 5,594 5,052 542 11%
Other noncurrent liabilities 2,167 2,085 82 4%
Total Noncurrent Liabilities 91,210 89,124 2,086 2%
TOTAL LIABILITIES 134,000 124,208 9,792 8%
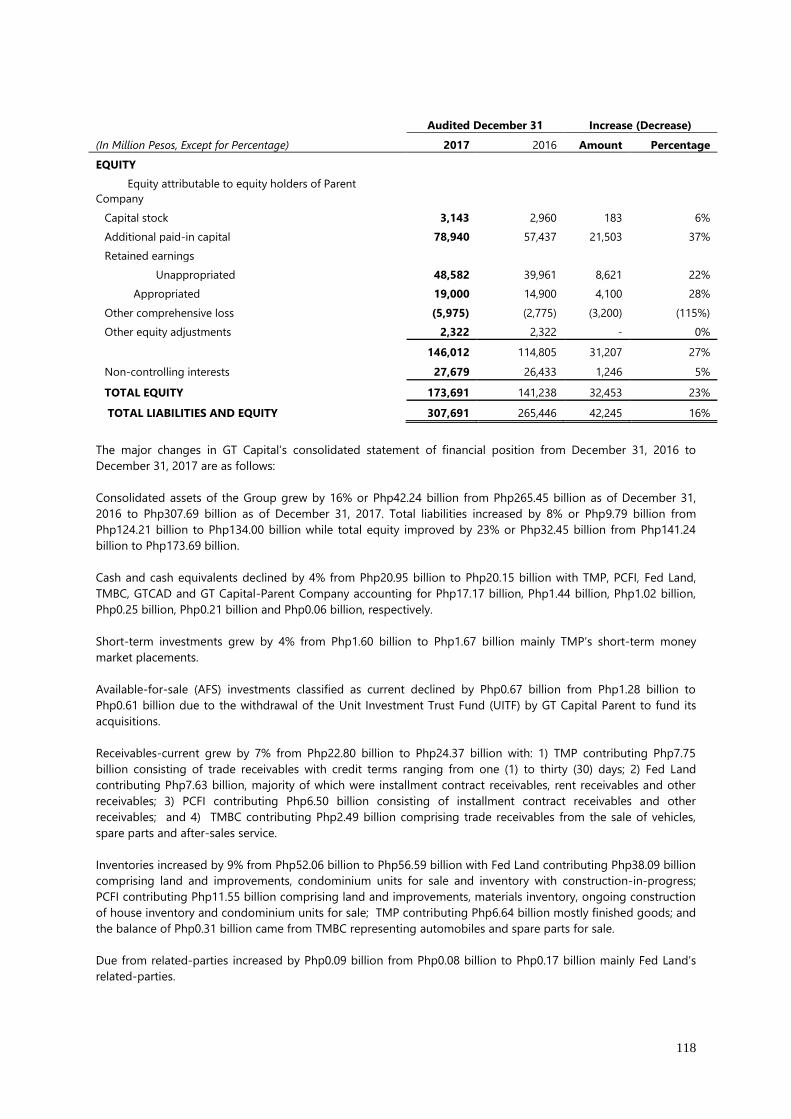
118
Audited December 31 Increase (Decrease)
(In Million Pesos, Except for Percentage) 2017 2016 Amount Percentage
EQUITY
Equity attributable to equity holders of Parent
Company
Capital stock 3,143 2,960 183 6%
Additional paid-in capital 78,940 57,437 21,503 37%
Retained earnings
Unappropriated 48,582 39,961 8,621 22%
Appropriated 19,000 14,900 4,100 28%
Other comprehensive loss (5,975) (2,775) (3,200) (115%)
Other equity adjustments 2,322 2,322 - 0%
146,012 114,805 31,207 27%
Non-controlling interests 27,679 26,433 1,246 5%
TOTAL EQUITY 173,691 141,238 32,453 23%
TOTAL LIABILITIES AND EQUITY 307,691 265,446 42,245 16%
The major changes in GT Capital’s consolidated statement of financial position from December 31, 2016 to
December 31, 2017 are as follows:
Consolidated assets of the Group grew by 16% or Php42.24 billion from Php265.45 billion as of December 31,
2016 to Php307.69 billion as of December 31, 2017. Total liabilities increased by 8% or Php9.79 billion from
Php124.21 billion to Php134.00 billion while total equity improved by 23% or Php32.45 billion from Php141.24
billion to Php173.69 billion.
Cash and cash equivalents declined by 4% from Php20.95 billion to Php20.15 billion with TMP, PCFI, Fed Land,
TMBC, GTCAD and GT Capital-Parent Company accounting for Php17.17 billion, Php1.44 billion, Php1.02 billion,
Php0.25 billion, Php0.21 billion and Php0.06 billion, respectively.
Short-term investments grew by 4% from Php1.60 billion to Php1.67 billion mainly TMP’s short-term money
market placements.
Available-for-sale (AFS) investments classified as current declined by Php0.67 billion from Php1.28 billion to
Php0.61 billion due to the withdrawal of the Unit Investment Trust Fund (UITF) by GT Capital Parent to fund its
acquisitions.
Receivables-current grew by 7% from Php22.80 billion to Php24.37 billion with: 1) TMP contributing Php7.75
billion consisting of trade receivables with credit terms ranging from one (1) to thirty (30) days; 2) Fed Land
contributing Php7.63 billion, majority of which were installment contract receivables, rent receivables and other
receivables; 3) PCFI contributing Php6.50 billion consisting of installment contract receivables and other
receivables; and 4) TMBC contributing Php2.49 billion comprising trade receivables from the sale of vehicles,
spare parts and after-sales service.
Inventories increased by 9% from Php52.06 billion to Php56.59 billion with Fed Land contributing Php38.09 billion
comprising land and improvements, condominium units for sale and inventory with construction-in-progress;
PCFI contributing Php11.55 billion comprising land and improvements, materials inventory, ongoing construction
of house inventory and condominium units for sale; TMP contributing Php6.64 billion mostly finished goods; and
the balance of Php0.31 billion came from TMBC representing automobiles and spare parts for sale.
Due from related-parties increased by Php0.09 billion from Php0.08 billion to Php0.17 billion mainly Fed Land’s
related-parties.
119
Prepayments and other current assets rose by 49% from Php6.99 billion to Php10.42 billion comprising advances
to contractors and suppliers, prepaid expenses, input VAT, deposit to land owners and creditable withholding tax
from Fed Land (Php4.96 billion); PCFI (Php4.20 billion); TMP (Php1.14 billion); TMBC (Php0.08 billion); and GT
Capital (Php0.04 billion).
Available-for-sale (AFS) investments classified as non-current grew by 46% from Php1.44 billion to Php2.10 billion
due to mark-to-market gains as of December 31, 2017.
Non-current receivables declined by 34% from Php7.14 billion to Php4.72 billion mainly bank take-out of
installment contract receivables.
Investment properties grew by 22% from Php14.31 billion to Php17.39 billion, comprising of properties held for
lease and capital appreciation from Fed Land (Php11.84 billion), PCFI (Php3.03 billion), TMP (Php2.22 billion) and
TMBC (Php0.30 billion).
Investments and advances increased by 32% from Php94.83 billion to Php124.89 billion primarily due to: (1)
Php24.74 billion additional 9.62% ownership over Metrobank; (2) Php8.70 billion equity in net income for 2017;
(3) Php0.78 billion additional investment in ST 6747 Resources Corporation; (4) Php0.48 billion additional
investment in TFS; (5) Php0.38 billion initial 20% investment in SMFC; (6) Php0.29 billion initial investment in
Sunshine Fort; and (7) Php0.10 billion advances to North Bonifacio Landmark Realty Development Corporation;
offset by (1) Php3.82 billion equity in other comprehensive loss and (2) cash dividends received from Metrobank
(Php0.84 billion), MPIC (Php0.50 billion) and Phil AXA (Php0.25 billion).
Property and equipment grew by 25% from Php9.37 billion to Php11.67 billion mostly from the newly completed
building of TMP and TMBC.
Deferred tax assets increased by 35% from Php0.54 billion to Php0.73 billion with TMP, PCFI, TMBC and Fed Land
accounting for Php0.48 billion, Php0.14 billion, Php0.08 billion and Php0.03 billion, respectively.
Other noncurrent assets grew by 16% from Php0.78 billion to Php0.91 billion comprising long-term deposits,
non-current input tax, non-current prepaid rent, other assets and retirement assets from PCFI (Php0.41 billion),
Fed Land (Php0.33 billion), TMP (Php0.12 billion), GTCAD (Php0.04 billion) and TMBC (Php0.01 billion).
Accounts and other payables increased by 23% from Php21.18 billion to Php25.98 billion with TMP, Fed Land,
PCFI, TMBC and GT Capital accounting for Php16.54 billion, Php5.04 billion, Php2.83 billion, Php1.41 billion and
Php0.16 billion, respectively.
Short-term debt declined by 10% from Php6.70 billion to Php6.03 billion due to loan payments by GT Capital-
Parent Company (Php3.00 billion), TMBC (Php4.87 billion), TMP dealership subsidiaries (Php1.75 billion), and Fed
Land (Php1.23 billion); offset by availments of short-term loans by TMBC (Php5.11 billion), TMP dealer subsidiaries
(Php2.57 billion); PCFI (Php1.25 billion) and Fed Land (Php1.25 billion).
Current-portion of long-term debt grew by Php0.89 billion from Php1.58 billion to Php2.47 billion due to a
reclassification from non-current to current for the loan portion due within one year.
Current-portion of liabilities on purchased properties grew by Php0.42 billion from Php0.17 billion to Php0.58
billion due to a reclassification from non-current to current for the loan portion due within one year.
Customers’ deposits grew by 29% from Php3.84 billion to Php4.94 billion mainly due to an improvement in
reservation sales for the year.
Income tax payable grew by Php0.58 billion from Php0.20 billion to Php0.78 billion due to an increase in taxable
income for the fourth quarter of 2017 vis-a-vis the fourth quarter of 2016.
Other current liabilities increased by Php0.59 billion from Php0.64 billion to Php1.23 billion due to an increase in
VAT payable and withholding taxes payable as of year-end for remittance to the BIR in January 2018.
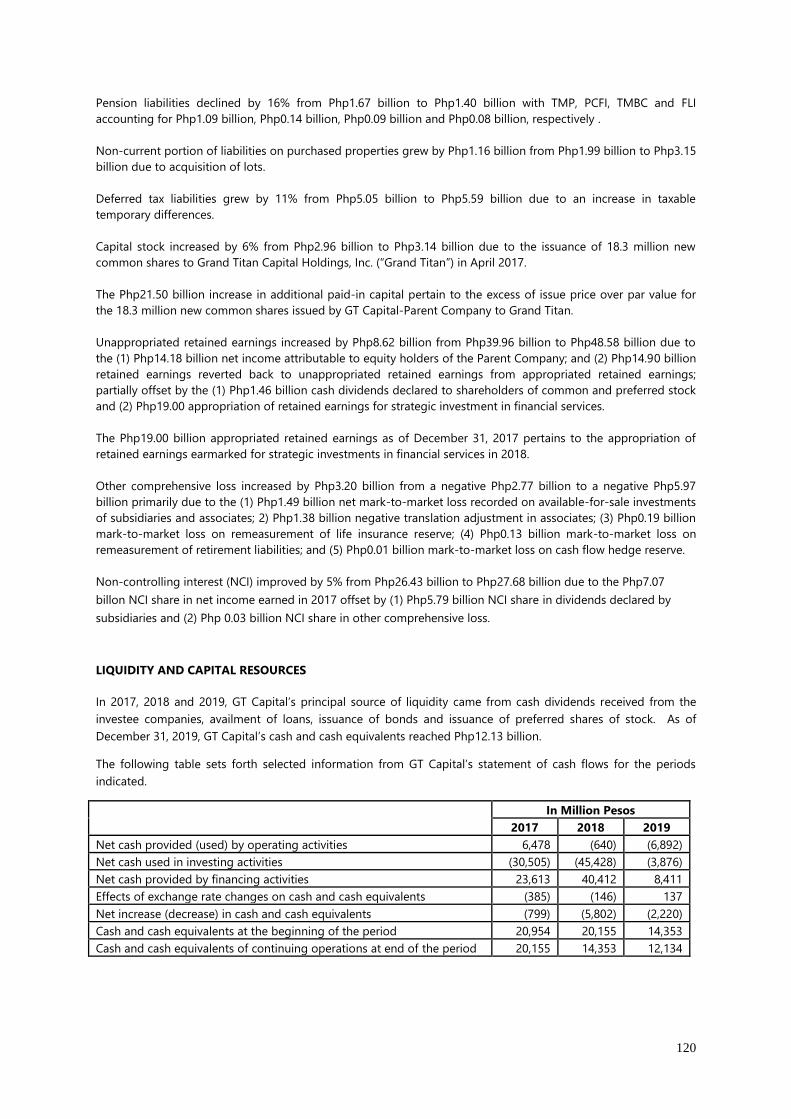
120
Pension liabilities declined by 16% from Php1.67 billion to Php1.40 billion with TMP, PCFI, TMBC and FLI
accounting for Php1.09 billion, Php0.14 billion, Php0.09 billion and Php0.08 billion, respectively .
Non-current portion of liabilities on purchased properties grew by Php1.16 billion from Php1.99 billion to Php3.15
billion due to acquisition of lots.
Deferred tax liabilities grew by 11% from Php5.05 billion to Php5.59 billion due to an increase in taxable
temporary differences.
Capital stock increased by 6% from Php2.96 billion to Php3.14 billion due to the issuance of 18.3 million new
common shares to Grand Titan Capital Holdings, Inc. (“Grand Titan”) in April 2017.
The Php21.50 billion increase in additional paid-in capital pertain to the excess of issue price over par value for
the 18.3 million new common shares issued by GT Capital-Parent Company to Grand Titan.
Unappropriated retained earnings increased by Php8.62 billion from Php39.96 billion to Php48.58 billion due to
the (1) Php14.18 billion net income attributable to equity holders of the Parent Company; and (2) Php14.90 billion
retained earnings reverted back to unappropriated retained earnings from appropriated retained earnings;
partially offset by the (1) Php1.46 billion cash dividends declared to shareholders of common and preferred stock
and (2) Php19.00 appropriation of retained earnings for strategic investment in financial services.
The Php19.00 billion appropriated retained earnings as of December 31, 2017 pertains to the appropriation of
retained earnings earmarked for strategic investments in financial services in 2018.
Other comprehensive loss increased by Php3.20 billion from a negative Php2.77 billion to a negative Php5.97
billion primarily due to the (1) Php1.49 billion net mark-to-market loss recorded on available-for-sale investments
of subsidiaries and associates; 2) Php1.38 billion negative translation adjustment in associates; (3) Php0.19 billion
mark-to-market loss on remeasurement of life insurance reserve; (4) Php0.13 billion mark-to-market loss on
remeasurement of retirement liabilities; and (5) Php0.01 billion mark-to-market loss on cash flow hedge reserve.
Non-controlling interest (NCI) improved by 5% from Php26.43 billion to Php27.68 billion due to the Php7.07
billon NCI share in net income earned in 2017 offset by (1) Php5.79 billion NCI share in dividends declared by
subsidiaries and (2) Php 0.03 billion NCI share in other comprehensive loss.
LIQUIDITY AND CAPITAL RESOURCES
In 2017, 2018 and 2019, GT Capital’s principal source of liquidity came from cash dividends received from the
investee companies, availment of loans, issuance of bonds and issuance of preferred shares of stock. As of
December 31, 2019, GT Capital’s cash and cash equivalents reached Php12.13 billion.
The following table sets forth selected information from GT Capital’s statement of cash flows for the periods
indicated.
In Million Pesos
2017 2018 2019
Net cash provided (used) by operating activities 6,478 (640) (6,892)
Net cash used in investing activities (30,505) (45,428) (3,876)
Net cash provided by financing activities 23,613 40,412 8,411
Effects of exchange rate changes on cash and cash equivalents (385) (146) 137
Net increase (decrease) in cash and cash equivalents (799) (5,802) (2,220)
Cash and cash equivalents at the beginning of the period 20,954 20,155 14,353
Cash and cash equivalents of continuing operations at end of the period 20,155 14,353 12,134
121
Cash flows from operating activities
Net cash provided by operating activities amounted to Php6.48 billion in 2017 and net cash used by operating
activities amounted to Php0.64 billion in 2018 and Php6.89 billion in 2019. In 2017, operating cash amounting to
Php21.91 billion was used to increase inventories by Php8.20 billion, prepayments and other current assets by
Php3.36 billion and pay dividends, income taxes and interest amounting to Php7.25 billion, Php3.70 billion and
Php3.43 billion, respectively. In 2018, operating cash amounting to Php16.21 billion was used to increase financial
assets at FVTPL by Php2.50 billion, receivables by Php2.21 billion and inventories by Php4.21 billion and to pay
dividends, income taxes and interest amounting to Php7.48 billion, Php4.38 billion and Php4.62 billion,
respectively. In 2019, operating cash amounting to Php18.43 billion was used to increase financial assets at FVTPL
by Php1.38 billion, receivables by Php6.32 billion and inventories by Php6.78 billion and to pay dividends, income
taxes and interest amounting to Php4.91 billion, Php4.61 billion and Php9.15 billion, respectively.
Cash flows used in investing activities
Net cash used in investing activities amounted to Php30.50 billion in 2017, Php45.43 billion in 2018 and Php3.88
billion in 2019. In 2017, cash flows used in investing activities went to increase investment in associates and a
joint venture by Php26.78 billion, investment properties by Php0.66 billion, property and equipment by Php3.48
billion, AFS investments by Php1.74 billion and intangible assets by Php0.24 billion. In 2018, cash flows used in
investing activities went to pay for additional investment in associates and a joint venture by Php29.63 billion,
financial assets at FVOCI by Php10.48 billion, property and equipment by Php3.92 billion, and investment
properties by Php0.22 billion. In 2019, cash flows used in investing activities went to pay for additional investment
in associates and a joint venture by Php0.94 billion, property and equipment by Php2.27 billion, and investment
properties by Php1.10 billion.
Cash flows from financing activities
Net cash provided by financing activities amounted to Php23.61 billion in 2017, Php40.41 billion in 2018 and
Php8.41 billion in 2019. In 2017, cash flows from financing activities came from Php38.35 billion in new loans and
issuance of capital stock of Php21.69 billion which were used to partially settle Php38.40 billion in outstanding
loans. In 2018, cash flows from financing activities came from loan availments of Php71.29 billion which were used
to partially settle Php31.43 billion in outstanding loans and Php0.50 billion in liabilities on purchased properties.
In 2019, cash flows from financing activities came from loan availments of Php43.98 billion which were used to
partially settle Php36.15 billion in outstanding loans.
Item 8. Financial Statements
The consolidated financial statements and schedules as listed in the accompanying Index to Exhibits are filed as
part of this SEC Form 17-A.
The accounting policies adopted in preparation of the consolidated financial statements are consistent with those
of the previous year except for the new and amended Philippine Financial Reporting Standards (PFRS), Philippine
Accounting Standards (PAS) and the Philippine Interpretations of International Financial Reporting Interpretation
Committee (IFRIC) which were adopted as of January 1, 2019.
The Group will also adopt several amended and revised standards and interpretations subsequent to 2019.
Please refer to Note 2 of the attached Company’s audited financial statements on the Summary of Significant
Accounting Policies for the accounting of the new PFRS and PAS which became effective in 2019 and new PFRS
and PAS that will be effective subsequent to 2019.
Item 9. Changes in and Disagreements with Accountants on Accounting and Financial Disclosure
The Company has engaged the services of SGV & Co. during the two most recent fiscal years. There have been
no disagreements with SGV & Co. on any matter of accounting principles or practices, financial statement
disclosures or auditing scope or procedure.
122
INDEPENDENT AUDITORS
The consolidated financial statements of the Company and its subsidiaries as of and for the years ended
December 31, 2017, 2018 and 2019 have been audited by SGV & Co. (a member firm of Ernst & Young Global
Limited), independent auditors, as stated in their reports appearing herein.
SGV & Co. has neither shareholdings in the Company nor any right, whether legally enforceable or not, to
nominate persons or to subscribe for the securities in the Company. SGV & Co. will not receive any direct or
indirect interest in the Company or in any securities thereof (including options, warrants or rights thereto)
pursuant to or in connection with the Offer. The foregoing is in accordance with the Code of Ethics for
Professional Accountants in the Philippines set by the Board of Accountancy and approved by the Professional
Regulation Commission.
In relation to the audit of the Company’s annual financial statements, its Corporate Governance Manual provides
that the audit committee shall, among other activities (i) evaluate significant issues reported by the external
auditors in relation to the adequacy, efficiency and effectiveness of the Company’s policies, controls, processes
and activities; (ii) ensure that other non-audit work provided by the external auditors is not in conflict with their
functions as external auditors; (iii) ensure the Company’s compliance with acceptable auditing and accounting
standards and regulations; and (iv) approve all related fees paid to the independent auditors.
The following table sets out the aggregate fees for audit and audit-related services, inclusive of out-of-pocket
expenses and value-added-tax for each of the years ended December 31, 2017, 2018 and 2019 for professional
services rendered by SGV & Co. to GT Capital:
Audit services rendered include the audit of the financial statements and supplementary schedules for submission
to SEC, and review of annual income tax returns. Non-audit services were also provided by SGV & Co. for
validation of stockholders' votes during Stockholder’s Meeting.
The Audit Committee has the primary responsibility of recommending to the Board of Directors the appointment,
re-appointment or removal of the external auditor and the fixing of the audit fees. The Board of Directors and
stockholders approve the Audit Committee’s recommendation.
2017 2018 2019
(in Php million)
Audit and Audit-Related Services 2.30 2.21 3.04
Non-Audit Services 0.04 0.32 0.04
Total 2.34 2.53 3.08
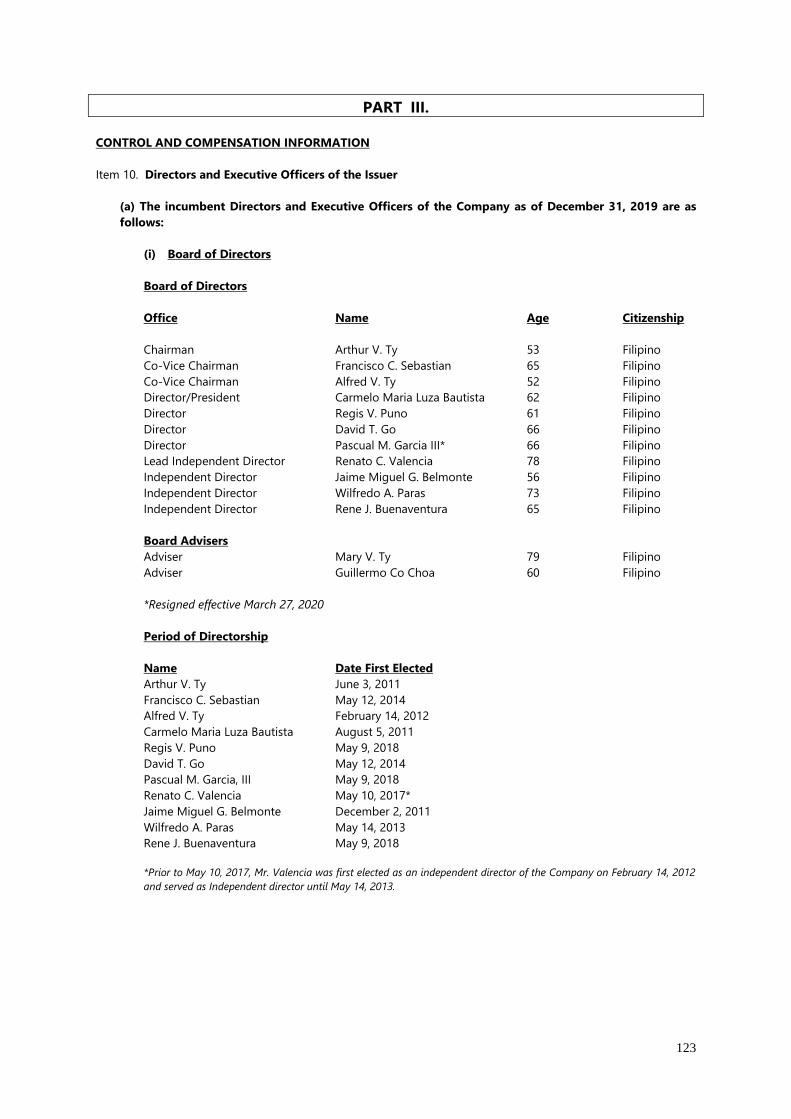
123
PART III.
CONTROL AND COMPENSATION INFORMATION
Item 10. Directors and Executive Officers of the Issuer
(a) The incumbent Directors and Executive Officers of the Company as of December 31, 2019 are as
follows:
(i) Board of Directors
Board of Directors
Office Name Age Citizenship
Chairman Arthur V. Ty 53 Filipino
Co-Vice Chairman Francisco C. Sebastian 65 Filipino
Co-Vice Chairman Alfred V. Ty 52 Filipino
Director/President Carmelo Maria Luza Bautista 62 Filipino
Director Regis V. Puno 61 Filipino
Director David T. Go 66 Filipino
Director Pascual M. Garcia III* 66 Filipino
Lead Independent Director Renato C. Valencia 78 Filipino
Independent Director Jaime Miguel G. Belmonte 56 Filipino
Independent Director Wilfredo A. Paras 73 Filipino
Independent Director Rene J. Buenaventura 65 Filipino
Board Advisers
Adviser Mary V. Ty 79 Filipino
Adviser Guillermo Co Choa 60 Filipino
*Resigned effective March 27, 2020
Period of Directorship
Name Date First Elected
Arthur V. Ty June 3, 2011
Francisco C. Sebastian May 12, 2014
Alfred V. Ty February 14, 2012
Carmelo Maria Luza Bautista August 5, 2011
Regis V. Puno May 9, 2018
David T. Go May 12, 2014
Pascual M. Garcia, III May 9, 2018
Renato C. Valencia May 10, 2017*
Jaime Miguel G. Belmonte December 2, 2011
Wilfredo A. Paras May 14, 2013
Rene J. Buenaventura May 9, 2018
*Prior to May 10, 2017, Mr. Valencia was first elected as an independent director of the Company on February 14, 2012
and served as Independent director until May 14, 2013.
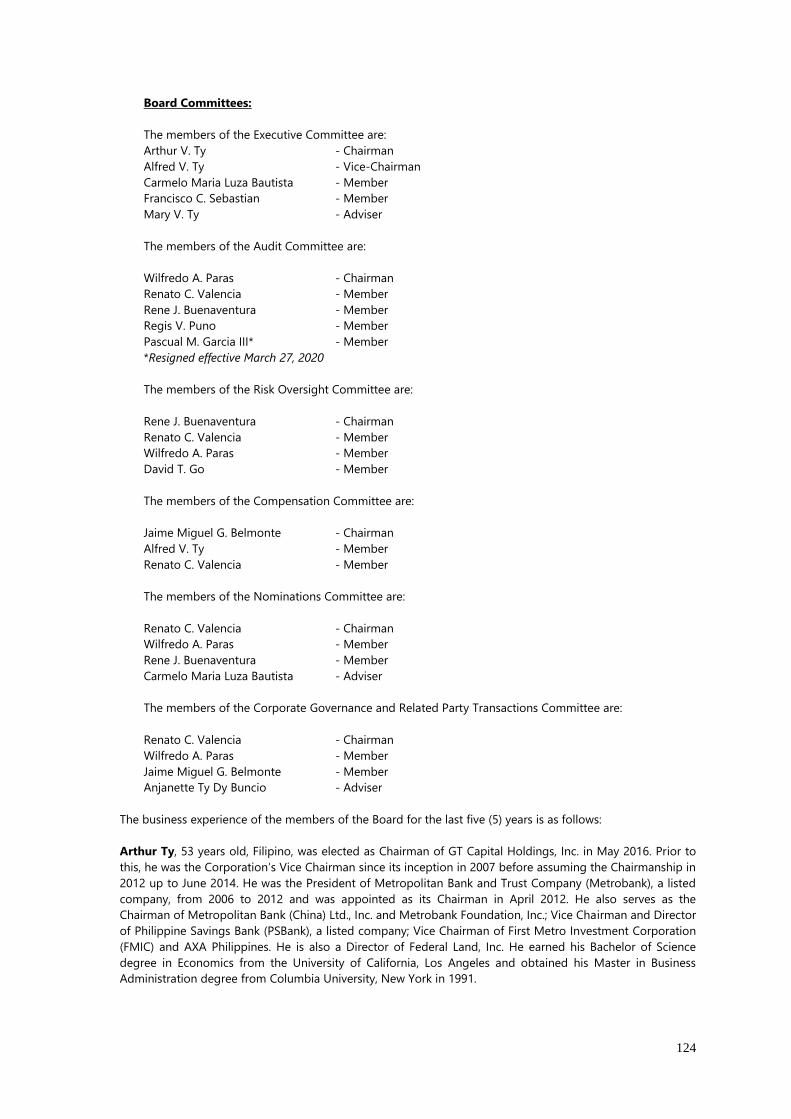
124
Board Committees:
The members of the Executive Committee are:
Arthur V. Ty - Chairman
Alfred V. Ty - Vice-Chairman
Carmelo Maria Luza Bautista - Member
Francisco C. Sebastian - Member
Mary V. Ty - Adviser
The members of the Audit Committee are:
Wilfredo A. Paras - Chairman
Renato C. Valencia - Member
Rene J. Buenaventura - Member
Regis V. Puno - Member
Pascual M. Garcia III* - Member
*Resigned effective March 27, 2020
The members of the Risk Oversight Committee are:
Rene J. Buenaventura - Chairman
Renato C. Valencia - Member
Wilfredo A. Paras - Member
David T. Go - Member
The members of the Compensation Committee are:
Jaime Miguel G. Belmonte - Chairman
Alfred V. Ty - Member
Renato C. Valencia - Member
The members of the Nominations Committee are:
Renato C. Valencia - Chairman
Wilfredo A. Paras - Member
Rene J. Buenaventura - Member
Carmelo Maria Luza Bautista - Adviser
The members of the Corporate Governance and Related Party Transactions Committee are:
Renato C. Valencia - Chairman
Wilfredo A. Paras - Member
Jaime Miguel G. Belmonte - Member
Anjanette Ty Dy Buncio - Adviser
The business experience of the members of the Board for the last five (5) years is as follows:
Arthur Ty, 53 years old, Filipino, was elected as Chairman of GT Capital Holdings, Inc. in May 2016. Prior to
this, he was the Corporation’s Vice Chairman since its inception in 2007 before assuming the Chairmanship in
2012 up to June 2014. He was the President of Metropolitan Bank and Trust Company (Metrobank), a listed
company, from 2006 to 2012 and was appointed as its Chairman in April 2012. He also serves as the
Chairman of Metropolitan Bank (China) Ltd., Inc. and Metrobank Foundation, Inc.; Vice Chairman and Director
of Philippine Savings Bank (PSBank), a listed company; Vice Chairman of First Metro Investment Corporation
(FMIC) and AXA Philippines. He is also a Director of Federal Land, Inc. He earned his Bachelor of Science
degree in Economics from the University of California, Los Angeles and obtained his Master in Business
Administration degree from Columbia University, New York in 1991.
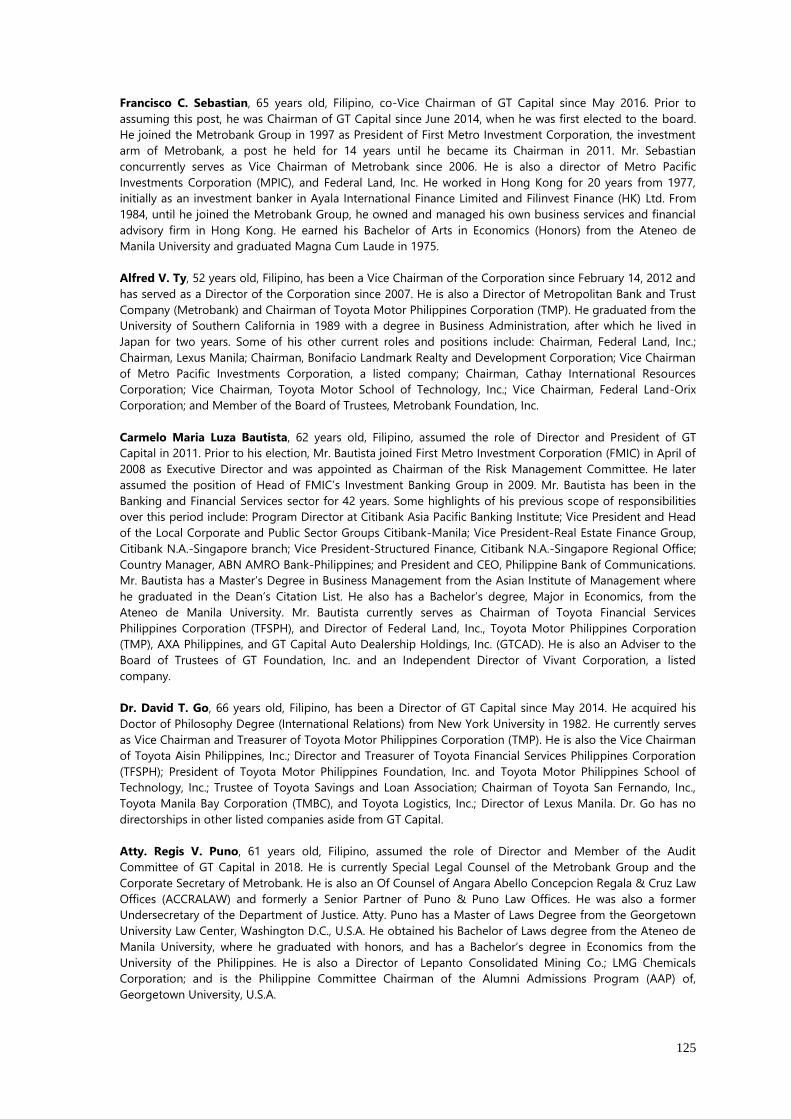
125
Francisco C. Sebastian, 65 years old, Filipino, co-Vice Chairman of GT Capital since May 2016. Prior to
assuming this post, he was Chairman of GT Capital since June 2014, when he was first elected to the board.
He joined the Metrobank Group in 1997 as President of First Metro Investment Corporation, the investment
arm of Metrobank, a post he held for 14 years until he became its Chairman in 2011. Mr. Sebastian
concurrently serves as Vice Chairman of Metrobank since 2006. He is also a director of Metro Pacific
Investments Corporation (MPIC), and Federal Land, Inc. He worked in Hong Kong for 20 years from 1977,
initially as an investment banker in Ayala International Finance Limited and Filinvest Finance (HK) Ltd. From
1984, until he joined the Metrobank Group, he owned and managed his own business services and financial
advisory firm in Hong Kong. He earned his Bachelor of Arts in Economics (Honors) from the Ateneo de
Manila University and graduated Magna Cum Laude in 1975.
Alfred V. Ty, 52 years old, Filipino, has been a Vice Chairman of the Corporation since February 14, 2012 and
has served as a Director of the Corporation since 2007. He is also a Director of Metropolitan Bank and Trust
Company (Metrobank) and Chairman of Toyota Motor Philippines Corporation (TMP). He graduated from the
University of Southern California in 1989 with a degree in Business Administration, after which he lived in
Japan for two years. Some of his other current roles and positions include: Chairman, Federal Land, Inc.;
Chairman, Lexus Manila; Chairman, Bonifacio Landmark Realty and Development Corporation; Vice Chairman
of Metro Pacific Investments Corporation, a listed company; Chairman, Cathay International Resources
Corporation; Vice Chairman, Toyota Motor School of Technology, Inc.; Vice Chairman, Federal Land-Orix
Corporation; and Member of the Board of Trustees, Metrobank Foundation, Inc.
Carmelo Maria Luza Bautista, 62 years old, Filipino, assumed the role of Director and President of GT
Capital in 2011. Prior to his election, Mr. Bautista joined First Metro Investment Corporation (FMIC) in April of
2008 as Executive Director and was appointed as Chairman of the Risk Management Committee. He later
assumed the position of Head of FMIC’s Investment Banking Group in 2009. Mr. Bautista has been in the
Banking and Financial Services sector for 42 years. Some highlights of his previous scope of responsibilities
over this period include: Program Director at Citibank Asia Pacific Banking Institute; Vice President and Head
of the Local Corporate and Public Sector Groups Citibank-Manila; Vice President-Real Estate Finance Group,
Citibank N.A.-Singapore branch; Vice President-Structured Finance, Citibank N.A.-Singapore Regional Office;
Country Manager, ABN AMRO Bank-Philippines; and President and CEO, Philippine Bank of Communications.
Mr. Bautista has a Master’s Degree in Business Management from the Asian Institute of Management where
he graduated in the Dean’s Citation List. He also has a Bachelor’s degree, Major in Economics, from the
Ateneo de Manila University. Mr. Bautista currently serves as Chairman of Toyota Financial Services
Philippines Corporation (TFSPH), and Director of Federal Land, Inc., Toyota Motor Philippines Corporation
(TMP), AXA Philippines, and GT Capital Auto Dealership Holdings, Inc. (GTCAD). He is also an Adviser to the
Board of Trustees of GT Foundation, Inc. and an Independent Director of Vivant Corporation, a listed
company.
Dr. David T. Go, 66 years old, Filipino, has been a Director of GT Capital since May 2014. He acquired his
Doctor of Philosophy Degree (International Relations) from New York University in 1982. He currently serves
as Vice Chairman and Treasurer of Toyota Motor Philippines Corporation (TMP). He is also the Vice Chairman
of Toyota Aisin Philippines, Inc.; Director and Treasurer of Toyota Financial Services Philippines Corporation
(TFSPH); President of Toyota Motor Philippines Foundation, Inc. and Toyota Motor Philippines School of
Technology, Inc.; Trustee of Toyota Savings and Loan Association; Chairman of Toyota San Fernando, Inc.,
Toyota Manila Bay Corporation (TMBC), and Toyota Logistics, Inc.; Director of Lexus Manila. Dr. Go has no
directorships in other listed companies aside from GT Capital.
Atty. Regis V. Puno, 61 years old, Filipino, assumed the role of Director and Member of the Audit
Committee of GT Capital in 2018. He is currently Special Legal Counsel of the Metrobank Group and the
Corporate Secretary of Metrobank. He is also an Of Counsel of Angara Abello Concepcion Regala & Cruz Law
Offices (ACCRALAW) and formerly a Senior Partner of Puno & Puno Law Offices. He was also a former
Undersecretary of the Department of Justice. Atty. Puno has a Master of Laws Degree from the Georgetown
University Law Center, Washington D.C., U.S.A. He obtained his Bachelor of Laws degree from the Ateneo de
Manila University, where he graduated with honors, and has a Bachelor’s degree in Economics from the
University of the Philippines. He is also a Director of Lepanto Consolidated Mining Co.; LMG Chemicals
Corporation; and is the Philippine Committee Chairman of the Alumni Admissions Program (AAP) of,
Georgetown University, U.S.A.
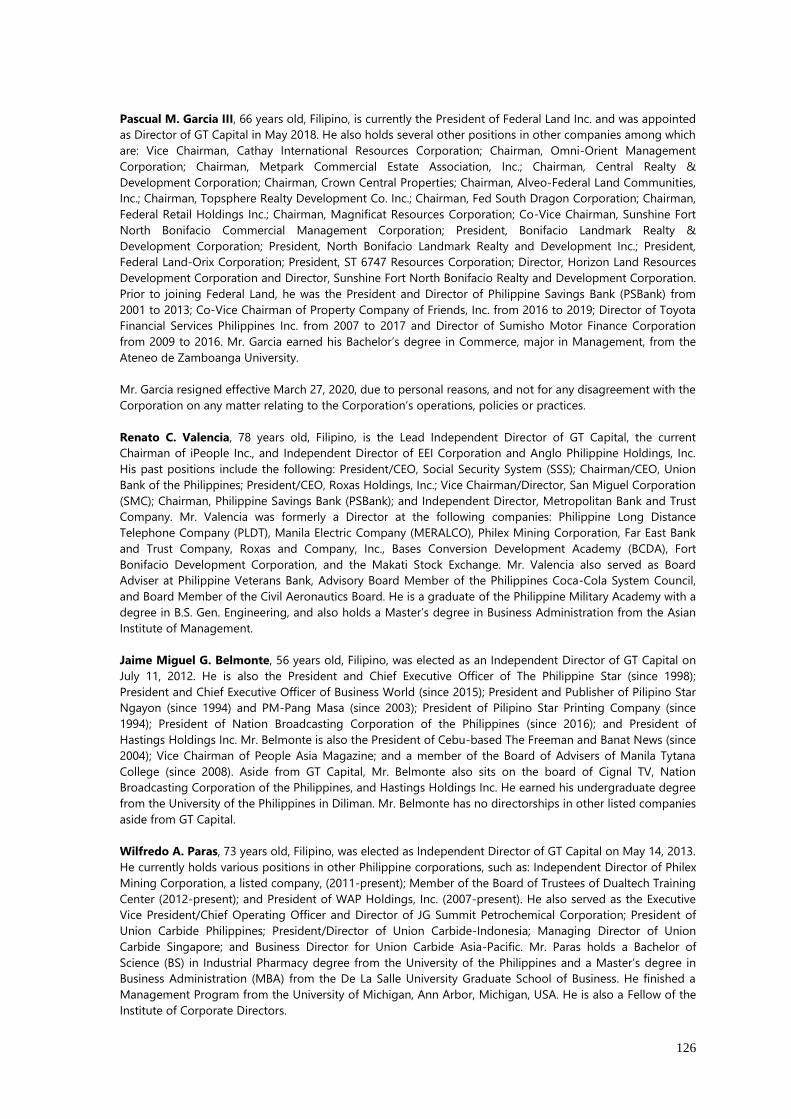
126
Pascual M. Garcia III, 66 years old, Filipino, is currently the President of Federal Land Inc. and was appointed
as Director of GT Capital in May 2018. He also holds several other positions in other companies among which
are: Vice Chairman, Cathay International Resources Corporation; Chairman, Omni-Orient Management
Corporation; Chairman, Metpark Commercial Estate Association, Inc.; Chairman, Central Realty &
Development Corporation; Chairman, Crown Central Properties; Chairman, Alveo-Federal Land Communities,
Inc.; Chairman, Topsphere Realty Development Co. Inc.; Chairman, Fed South Dragon Corporation; Chairman,
Federal Retail Holdings Inc.; Chairman, Magnificat Resources Corporation; Co-Vice Chairman, Sunshine Fort
North Bonifacio Commercial Management Corporation; President, Bonifacio Landmark Realty &
Development Corporation; President, North Bonifacio Landmark Realty and Development Inc.; President,
Federal Land-Orix Corporation; President, ST 6747 Resources Corporation; Director, Horizon Land Resources
Development Corporation and Director, Sunshine Fort North Bonifacio Realty and Development Corporation.
Prior to joining Federal Land, he was the President and Director of Philippine Savings Bank (PSBank) from
2001 to 2013; Co-Vice Chairman of Property Company of Friends, Inc. from 2016 to 2019; Director of Toyota
Financial Services Philippines Inc. from 2007 to 2017 and Director of Sumisho Motor Finance Corporation
from 2009 to 2016. Mr. Garcia earned his Bachelor’s degree in Commerce, major in Management, from the
Ateneo de Zamboanga University.
Mr. Garcia resigned effective March 27, 2020, due to personal reasons, and not for any disagreement with the
Corporation on any matter relating to the Corporation’s operations, policies or practices.
Renato C. Valencia, 78 years old, Filipino, is the Lead Independent Director of GT Capital, the current
Chairman of iPeople Inc., and Independent Director of EEI Corporation and Anglo Philippine Holdings, Inc.
His past positions include the following: President/CEO, Social Security System (SSS); Chairman/CEO, Union
Bank of the Philippines; President/CEO, Roxas Holdings, Inc.; Vice Chairman/Director, San Miguel Corporation
(SMC); Chairman, Philippine Savings Bank (PSBank); and Independent Director, Metropolitan Bank and Trust
Company. Mr. Valencia was formerly a Director at the following companies: Philippine Long Distance
Telephone Company (PLDT), Manila Electric Company (MERALCO), Philex Mining Corporation, Far East Bank
and Trust Company, Roxas and Company, Inc., Bases Conversion Development Academy (BCDA), Fort
Bonifacio Development Corporation, and the Makati Stock Exchange. Mr. Valencia also served as Board
Adviser at Philippine Veterans Bank, Advisory Board Member of the Philippines Coca-Cola System Council,
and Board Member of the Civil Aeronautics Board. He is a graduate of the Philippine Military Academy with a
degree in B.S. Gen. Engineering, and also holds a Master’s degree in Business Administration from the Asian
Institute of Management.
Jaime Miguel G. Belmonte, 56 years old, Filipino, was elected as an Independent Director of GT Capital on
July 11, 2012. He is also the President and Chief Executive Officer of The Philippine Star (since 1998);
President and Chief Executive Officer of Business World (since 2015); President and Publisher of Pilipino Star
Ngayon (since 1994) and PM-Pang Masa (since 2003); President of Pilipino Star Printing Company (since
1994); President of Nation Broadcasting Corporation of the Philippines (since 2016); and President of
Hastings Holdings Inc. Mr. Belmonte is also the President of Cebu-based The Freeman and Banat News (since
2004); Vice Chairman of People Asia Magazine; and a member of the Board of Advisers of Manila Tytana
College (since 2008). Aside from GT Capital, Mr. Belmonte also sits on the board of Cignal TV, Nation
Broadcasting Corporation of the Philippines, and Hastings Holdings Inc. He earned his undergraduate degree
from the University of the Philippines in Diliman. Mr. Belmonte has no directorships in other listed companies
aside from GT Capital.
Wilfredo A. Paras, 73 years old, Filipino, was elected as Independent Director of GT Capital on May 14, 2013.
He currently holds various positions in other Philippine corporations, such as: Independent Director of Philex
Mining Corporation, a listed company, (2011-present); Member of the Board of Trustees of Dualtech Training
Center (2012-present); and President of WAP Holdings, Inc. (2007-present). He also served as the Executive
Vice President/Chief Operating Officer and Director of JG Summit Petrochemical Corporation; President of
Union Carbide Philippines; President/Director of Union Carbide-Indonesia; Managing Director of Union
Carbide Singapore; and Business Director for Union Carbide Asia-Pacific. Mr. Paras holds a Bachelor of
Science (BS) in Industrial Pharmacy degree from the University of the Philippines and a Master’s degree in
Business Administration (MBA) from the De La Salle University Graduate School of Business. He finished a
Management Program from the University of Michigan, Ann Arbor, Michigan, USA. He is also a Fellow of the
Institute of Corporate Directors.
127
Rene J. Buenaventura, 65 years old, Filipino, is an Independent Director of GT Capital Holdings, Inc. He is
also the Vice Chairman of Equicom Manila Holdings, Inc., a holding company for businesses engaged in
healthcare, banking and finance, and information technology. In addition to his appointment to GT Capital’s
Board, he also holds the following positions: Independent Director of UBS Philippines, Inc., Independent
Director of AIG Insurance Philippines Inc. and Independent Director of Lorenzo Shipping Corporation. He is
likewise a Director and Member of the Executive Committee of Maxicare Healthcare Corporation, Vice
Chairman of Algo Leasing and Finance Corporation, and President of Cliveden Management Corporation. Mr.
Buenaventura is a Certified Public Accountant and graduated Summa Cum Laude for Bachelor of Arts, major
in Behavioral Sciences and Bachelor of Science in Commerce, major in Accounting at De La Salle University in
the Philippines. He also earned his Master in Business Administration from the same university.
* Independent director – The Corporation has complied with the Guidelines set forth by SRC (Securities
Regulation Code) Rule 38 regarding the Nomination and Election of Independent Director. The Corporation’s
By-Laws incorporate the procedures for the nomination and election of independent director/s in accordance
with the requirements of the said Rule. The Corporation’s By-laws were amended for this purpose and such
amendment was approved by the SEC on January 13, 2012.
The business experience of the Board Advisers for the last five (5) years is as follows:
Mary Vy Ty, 79 years old, Filipino, was appointed as Board Adviser of GT Capital in June 2014. Prior to this,
she served as the Corporation’s Treasurer since its incorporation in 2007. Mrs. Ty has more than 50 years of
experience in banking and general business. She currently holds the following positions: Assistant to the
Group Chairman, Metropolitan Bank and Trust Company (Metrobank); Adviser, Metrobank Foundation, Inc.
and Federal Land, Inc.; Adviser, Manila Medical Services, Inc.; Adviser, Horizon Land Development
Corporation; Chairperson, Horizon Royale Holdings, Inc.; Director, Grand Titan Capital Holdings, Inc.;
Chairperson, Ausan Resources Corporation; Chairperson, Grand Estate Property Corporation; Chairperson,
Inter-Par Philippines Resources Corporation; and Chairperson of Philippine Securities Corporation, Tytana
Corporation, and Federal Homes, Inc. Previously, Mrs. Ty held the position of Director for First Metro
Investment Corporation. She earned her collegiate degree from the University of Santo Tomas.
Guillermo Co Choa, 60 years old, Filipino, was appointed as Board Adviser of GT Capital in June 2016. He is
currently the Vice-Chairman and President of PCFI. Mr. Choa earned his Bachelor’s Degree in Commerce,
Major in Marketing, from the De La Salle University and his Master’s Degree in Business Economics from the
University of Asia and Pacific.
Nominee Directors
As of the date of this report, the nominees for independent directors are Messrs. Renato C. Valencia, Wilfredo
A. Paras, Jaime Miguel G. Belmonte and Rene J. Buenaventura. Messrs. Valencia, Paras, Belmonte and
Buenaventura were nominated by Aaron M. Say. The four (4) nominees for independent directors are not
related either by consanguinity or affinity to the person who nominated them.
Based on Section 2.1.4 of GT Capital’s Manual on Corporate Governance, the stockholders must elect at least
three (3) independent directors as defined by existing laws and regulations.
Aside from the above nominees for independent directors, the other nominees for director are Messrs.
Arthur Vy Ty, Alfred Vy Ty, Francisco C. Sebastian, Carmelo Maria Luza Bautista, David T. Go, Ms. Alesandra T.
Ty and Atty. Regis V. Puno.
All the nominees, except Ms. Alesandra T. Ty, are incumbent directors of GT Capital. The experience and
qualifications of the nominated incumbent directors are found above. The experience and qualifications of
Ms. Alesandra T. Ty follows:
Alesandra T. Ty, 39 years old, Filipino, was appointed Assistant Treasurer of GT
Capital on February 14, 2012. She graduated from the Ateneo de Manila University
with a Bachelor of Science degree in Legal Management. She then earned her
Masters in Business Administration from the China Europe International Business
128
School in Shanghai, China. She is currently Director and Corporate Treasurer of AXA
Philippines; Corporate Secretary and Corporate Treasurer of First Metro Investment
Corporation; Corporate Secretary of GT Foundation, Inc.; Senior Vice President and
Treasurer of Federal Homes, Inc.; and Executive Vice President of Grand Titan Capital
Holdings, Inc.
Review of qualifications of candidates nominated as Directors, including Independent Directors, is conducted
by the Nominations Committee prior to the stock0holders’ meeting. The Nominations Committee prepares a
Final List of Candidates of those who have passed the Guidelines, Screening Policies and Parameters for
nomination as Director of the Corporation, and which list contains information about the nominees. Only
nominees whose names appear on the Final List of Candidates shall be eligible for election as Directors of the
Corporation. No other nomination shall be entertained or allowed on the floor during the actual annual
stockholders’ meeting.
The Directors of the Corporation are elected at the annual stockholders’ meeting to hold office until the next
succeeding annual meeting and until their respective successors have been appointed or elected and
qualified. The Directors possess all the qualifications and none of the disqualifications provided for in the SRC
(Securities Regulation Code) and its Implementing Rules and Regulations, as well as the Corporation’s By-
laws.
In case of resignation, disqualification or cessation of any directorship, and only after notice has been made
with the Commission within five (5) days from such resignation, disqualification or cessation, may the vacancy
be filled by the vote of at least a majority of the remaining directors, if still constituting a quorum, upon the
nomination of the Nominations Committee; otherwise, said vacancies shall be filled by stockholders in a
regular or special meeting called for that purpose. A director so elected to fill a vacancy shall serve only for
the unexpired term of his or her predecessor in office.
The Nominations Committee created by the Board under its Manual on Corporate Governance nominated
the following for re-election to the Board of Directors at the forthcoming Annual Stockholders’ Meeting:
Arthur Vy Ty Atty. Regis V. Puno
Francisco C. Sebastian Jaime Miguel G. Belmonte
Alfred Vy Ty Wilfredo A. Paras
Carmelo Maria Luza Bautista Renato C. Valencia
Dr. David T. Go
Alesandra T. Ty
Rene J. Buenaventura
The Corporation has complied with the Guidelines set forth by SRC Rule 38 regarding the Nomination and
Election of Independent Directors. The same provision has been incorporated in the Amended By-Laws of the
Corporation.
(ii) Executive Officers
Name Office Age Citizenship
Carmelo Maria Luza Bautista President 62 Filipino
Francisco H. Suarez, Jr. Executive Vice President/Chief Financial
Officer
60 Filipino
Anjanette T. Dy Buncio Treasurer 51 Filipino
Alesandra T. Ty Assistant Treasurer 39 Filipino
Vicente S. Socco Chairman, GTCAD 60 Filipino
Antonio P. A. Zara III General Manager, GTCAD 52 Filipino
129
Name Office Age Citizenship
Antonio V. Viray Corporate Secretary 80 Filipino
Jocelyn Y. Kho Assistant Corporate Secretary 65 Filipino
Winston Andrew L. Peckson First Vice President/Chief Risk Officer 68 Filipino
Jose B. Crisol, Jr. First Vice President/Head, Investor Relations,
Strategic Planning and Corporate
Communication
53 Filipino
Reyna Rose P. Manon-og First Vice President/Controller and Head,
Accounting and Financial Control
37 Filipino
Susan E. Cornelio Vice President/Head, Human Resources and
Administration
48 Filipino
Leo Paul C. Maagma Vice President/Chief Audit Executive 49 Filipino
Elsie D. Paras Vice President/Head, Corporate Finance and
Business Development
47 Filipino
Renee Lynn Miciano-Atienza Vice President /Head, Legal and Compliance 37 Filipino
Period of Officership
Francisco H. Suarez Jr., 60 years old, Filipino, serves as GT Capital’s Executive Vice President and Chief
Financial Officer (CFO). He was appointed to the position on February 16, 2012. He is also a Director and the
Treasurer of GT Capital Auto Dealership Holdings, Inc., Toyota Subic Bay, GT Mobility Ventures and JBA
Philippines, Director of Toyota Manila Bay Corp., and Corporate Secretary of Toyota Financial Services. Over
his tenure, he has successfully supervised over the launch of the Corporation’s initial public offering, a top-up
private placement, two retail bond issuances, bilateral fixed rate term loans and two series of perpetual
preferred shares. Mr. Suarez brings to GT Capital over 35 years of solid and extensive experience in
investment banking and financial management. Prior to joining GT Capital, he was the CFO of three
subsidiaries of the ATR KimEng Group. For a time, he also served as Executive Director of ATR KimEng Capital
Partners, Inc. Before this, he was appointed as the CFO of PSI Technologies, Inc., and, prior to that, of SPi
Technologies, Inc. Previously, he was a Director for Corporate Finance at Asian Alliance Investment Corp. He
has also assumed various positions in Metrobank, International Corporate Bank, Far East Bank and Trust
Company, and the National Economic Development Authority. Mr. Suarez graduated from De La Salle
University with a Bachelor of Science degree in Applied Economics and is a candidate for the Master in
Business Administration degree at the Ateneo de Manila University.
Name Office Period Held
Carmelo Maria Luza Bautista President 2011-Present
Francisco H. Suarez, Jr. Executive Vice President/Chief Financial
Officer
2012-Present
Anjanette T. Dy Buncio Treasurer 2007-Present
Alesandra T. Ty Assistant Treasurer 2012-Present
Vicente Jose S. Socco Chairman of GTCAD 2019-Present
Antonio V. Viray Corporate Secretary 2009-Present
Jocelyn Y. Kho Assistant Corporate Secretary 2011-Present
Jose B. Crisol, Jr. First Vice President/Head, Investor Relations,
Strategic Planning and Corporate
Communication
2012-Present
Winston Andrew L. Peckson First Vice President/Chief Risk Officer 2016-Present
Reyna Rose P. Manon-og First Vice President/Controller and Head,
Accounting and Financial Control
2011-Present
Susan E. Cornelio Vice President/Head, Human Resources and
Administration
2012-Present
Elsie D. Paras Vice President/Head, Corporate Finance and
Business Development
2015-Present
Leo Paul C. Maagma Vice President/Chief Audit Executive 2018-Present
Renee Lynn Miciano-Atienza Vice President/Head, Legal and Compliance
2016-Present
130
Anjanette Ty Dy Buncio, 51 years old, Filipino, was appointed as GT Capital’s Treasurer in May 2015. Prior to
this, she served as the Corporation’s Assistant Treasurer since 2007. She holds several other positions in other
companies among which are: Vice Chairman and Director of Metrobank Card Corporation; Director,
Treasurer, and Senior Vice President of Federal Land, Inc.; Director and Chairman of the Board of Manila
Medical Services lnc.; Senior Vice President of Metrobank Foundation Inc.; Vice President of GT Foundation
Inc.; and Executive Vice President and Corporate Secretary of Pro Oil Corporation. She graduated from the
International Christian University in Tokyo, Japan with a Bachelor of Social Science Degree in Economics.
Alesandra T. Ty, 39 years old, Filipino, was appointed Assistant Treasurer of GT Capital on February 14, 2012.
She graduated from the Ateneo de Manila University with a Bachelor of Science degree in Legal
Management. She then earned her Masters in Business Administration from the China Europe International
Business School in Shanghai, China. She is currently Director and Corporate Treasurer of AXA Philippines;
Corporate Secretary and Corporate Treasurer of First Metro Investment Corporation; Corporate Secretary of
GT Foundation, Inc.; Senior Vice President and Treasurer of Federal Homes, Inc.; and Executive Vice President
of Grand Titan Capital Holdings, Inc.
Vicente Saniel Socco, 60 years old, is the Chairman of GT Capital Auto Dealership Holdings, Inc. (GTCAD).
GTCAD is a wholly-owned subsidiary of GT Capital and is the vehicle for the automotive holdings of the
Group. He brings close to forty years of expertise in the automotive sector. Mr. Socco began his career with
Toyota in the Philippines as a member of the marketing team. He was then appointed General Affairs
Manager of Toyota’s Manila Representative Office in 1984 until Toyota Motor Philippines Corporation (TMP)
opened in 1988, where he rose through the ranks to become Senior Vice President (SVP) for Marketing. In
2001, Mr. Socco joined the regional headquarters of Toyota in Singapore. Mr. Socco was appointed SVP of
Lexus Asia in 2007, concurrent with his roles as the Executive-in-Charge for country operations at Toyota
Motor Asia Pacific (TMAP). In 2012, he assumed the role of Executive Vice President and acting Chief
Operating Officer for the region. Then, in 2014, he was assigned to Toyota’s global headquarters as General
Manager for TMAP in Japan. He then returned to Singapore in 2017 as EVP for Lexus Asia until his retirement
in July 2019. Mr. Socco garnered his Bachelor of Science in Economics at the University of the Philippines in
Diliman and completed the Executive Development Program of the Wharton School of the University of
Pennsylvania.
Antonio P. A. Zara III, 52 years old, Filipino, is the General Manager of GT Capital Auto Dealership Holdings,
Inc. (GTCAD). He was appointed to the position in November 2018. Mr. Zara brings to GT Capital close to
three decades of global automotive industry experience in various technical, sales and marketing, and senior
leadership roles. Prior to his involvement with GTCAD, he was General Manager for Global Aftersales
Planning at the Nissan Motor Company global head office in Yokohama, Japan. Previously, he was the
President of Nissan Motor Distributor Indonesia, heading the country’s Nissan and Datsun assembly,
importation, and distribution operations. Before this, he was the President of Nissan Motor Philippines, Inc.,
overseeing consistent double-digit vehicle unit sales growth and nearly doubling the said car company’s
market share during his tenure. Prior to Nissan, he held several positions in various markets for General
Motors (GM): Managing Director of General Motors Korea in Incheon, South Korea; Vice President for Vehicle
Sales, Service and Marketing of General Motors Southeast Asia in Bangkok, Thailand; President of General
Motors Asia Pacific Japan, Ltd. in Tokyo, Japan; Vice President and Head of Vehicle Sales, Service, and
Marketing for Pt. General Motors Indonesia; and Director of the sales and aftersales departments of General
Motor Automobiles Philippines in Makati, Philippines. Mr. Zara graduated with honors from the Don Bosco
Technical Institute with a Degree in Mechanical Engineering.
Antonio V. Viray, 80 years old, has been GT Capital’s Corporate Secretary since 2009. He began his legal
profession by becoming a litigation lawyer of the Feria Law Office (formerly Feria Feria Lugtu & Lao). He then
embarked on a banking career with Philippine Savings Bank (PSBank), retiring as Senior Vice President and
Corporate Secretary. When PSBank was acquired by Metrobank, he was recruited as Metrobank’s General
Counsel (later Special Counsel), later to become Senior Vice President, Corporate Secretary, and Director. He
is currently Corporate Secretary of Grand Titan Capital Holdings, Inc., and Of Counsel at Feria Tantoco Daos
Law Firm. The foundations of his career as a successful corporate lawyer and secretary were provided by
Colegio de San Juan de Letran (Letran College), where he graduated Valedictorian, with an Associate in Arts
degree; University of Santo Tomas where he finished his Bachelor of Laws as Valedictorian and Magna Cum
Laude; and Northwestern University School of Law in Chicago, Illinois, U.S.A. where he obtained his Master of
Laws through a Ford Foundation Fellowship Grant. In addition, Atty. Viray was a former President of the
131
Bankers Institute of the Philippines (BAIPhil); and Association of Bank Lawyers. He also incorporated the
Chamber of Thrift Banks, the confederacy of three thrift bank associations: Savings Banks Association of the
Philippines, Stock Savings and Loan Associations and the Development Bankers Association.
Jocelyn Y. Kho, 65 years old, Filipino, has served as the Corporation’s Assistant Corporate Secretary since
June 2011 and formerly the Corporation’s Controller until 2010. She served as Vice President under the Office
of the Assistant to the Group Chairman of Metrobank from 1978 to 2009. She concurrently holds the
following positions: Assistant Corporate Secretary, Grand Titan Capital Holdings, Inc.; Controller and Assistant
Corporate Secretary, Global Treasure Holdings, Inc.; Director and Treasurer, Global Business Holdings, Inc.
and Circa 2000 Homes, Inc.; Director and Senior Vice President, Federal Homes, Inc.; Director, Treasurer, and
Corporate Secretary of Crown Central Properties Corporation; Director of Cathay International Resources, Inc.
and Magnificat Resources Corporation; Corporate Secretary and Ex-Com Member of Federal Land, Inc. ;
Director and Treasurer, Nove Ferum Holdings, Inc.; Director and Treasurer, Horizon Royale Holdings, Inc.;
Chairman and President, Glam Holdings Corporation, Yorktown Properties, Inc., Uni-Plastic International
Corporation, MBTC Management Consultancy, Inc. and The Metropolitan Park, Inc.; Director and President,
Harmony Property Holdings, Inc.; Splendor Fortune Holdings, Inc.; and Splendor Realty Corporation. She
earned her Bachelor of Science degree in Commerce with a major in Accounting from the University of Santo
Tomas in 1975, and is a candidate for the Master of Science Degree in Taxation from MLQ University.
Jose B. Crisol, Jr., 53 years old, Filipino, serves as First Vice President and Head of the Investor Relations,
Strategic Planning, and Corporate Communication Department of GT Capital. He was appointed to the
position on July 26, 2012. Before joining the Corporation, he was the Assistant Vice President for Investor
Relations of SM Investments Corporation (SM). Prior to working with SM, he was a Director at the
Department of Trade and Industry (DTI), heading its Trade and Industry Information Center. He also served
for a time, on a concurrent basis, as Head of DTI’s Office of Operational Planning. His other past employment
includes occupying various positions at The Philippine American Life Insurance Company and Merrill Lynch
Philippines, Inc., among others. He holds a Master in Business Economics degree from the University of Asia
and the Pacific, and a Bachelor of Science degree in Economics from the University of the Philippines -
Diliman. He completed his primary and secondary education at the Ateneo de Manila University.
Winston Andrew L. Peckson, 68 years old, Filipino, serves as First Vice President and Chief Risk Officer of GT
Capital. He was appointed to the position in February 2016. Mr. Peckson brings to the Corporation over 40
years of experience in banking. Concurrent to his position, he is a Director of the First Metro Philippine Equity
Exchange Traded Fund, Inc. and a Fellow of the Institute of Corporate Directors. Before joining GT Capital, he
served as a Consultant for the Treasury and Investment Banking Group of FMIC. Prior to his stint with FMIC,
he was the Head of Treasury Marketing of Philippine National Bank. Before this, he was also Vice President
and General Manager of ABN AMRO Bank NV’s Manila Offshore Branch, a position he held for 10 years.
Other previous positions he held were: Vice President and Corporate Treasury Advisor of Bank of America –
Manila Branch; CEO and Director of Danamon Finance Company (HK) Ltd. (DFCL); Manager for Corporate
Banking of Lloyds Bank PLC – Hong Kong Branch; Vice President for Commercial Banking of Lloyds Bank PLC
– Manila Offshore Branch; and Branch Banking Head of Far East Bank & Trust Company. He obtained his
Bachelor of Arts Degree, Major in Psychology and Minor in Business Administration, from the Ateneo de
Manila University and earned his Masters Degree in Business Management from the Asian Institute of
Management.
Reyna Rose P. Manon-og, 37 years old, Filipino, was appointed the Corporation’s controller in October
2011. Before joining the Corporation, she was the Assistant Vice President and Head of the Financial
Accounting Department of United Coconut Planters Bank. Prior to this, she was a Director in SGV & Co.
where she gained seven years of experience in external audit. She is a Certified Public Accountant and a cum
laude graduate of Bicol University with a Bachelor of Science degree in Accountancy. She recently completed
the Strategic Business Economics Program of the University of Asia and the Pacific.
Susan E. Cornelio, 48 years old, Filipino, joined the Corporation on July 4, 2012 as the Head of Human
Resources and Administration. Prior to this, she served as Vice President/ Head of Compensation and
Benefits of Sterling Bank of Asia and as Assistant Vice President/Head of Compensation and Benefits of
United Coconut Planters Bank. She has had other HR stints from the following institutions: Metrobank, ABN
AMRO Offshore Banking, Solidbank, and Citytrust. She holds a Bachelor of Science in Commerce major in
Accounting from the Sta. Isabel College and a Master Certificate in Human Resources and International HR
132
Practices from Cornell University’s School of Industrial and Labor Relations. She recently obtained a Master in
Business Economics from the University of Asia and the Pacific.
Leo Paul C. Maagma, 49 years old, Filipino, was appointed the Chief Audit Executive of GT Capital Holdings,
Inc. in April 2018. With over 26 years of extensive work experience—more than 21 years in audit and five
years in accounting, accounts receivables, treasury, and payroll—Mr. Maagma began his career in an external
auditing firm, then spent five years in a manufacturing foods business, and nearly 15 years in a business
engaged in the distribution of health care products. He spent eight of his nearly two decades in audit work at
the regional and country head offices of two multinational companies, Zuellig Pharma Corporation (Zuellig)
and Unilever Bestfoods (Unilever). Before joining GT Capital, for 14½ years, Mr. Maagma served in various
capacities at Zuellig—Internal Audit Manager from 2012 to 2018, Accounts Receivable Manager from 2010 to
2012, Corporate Internal Audit Manager from 2007 to 2010, and Internal Audit Manager from 2003 to 2007.
At Zuellig, he was chiefly responsible for the Philippine subsidiary’s internal audit function, while assisting in
regional risk–based internal audits for the Zuellig Pharma Group across 12 countries in the Asia-Pacific
region. Prior to his time at Zuellig, Mr. Maagma held several positions at Unilever from 1998 to 2003:
Regional Information Systems Audit Supervisor, Category Accounting Manager, and Treasury Manager.
Previously, he performed other supervisory roles in audit in Empire East Land Holdings, Inc. and Ernst and
Young, International. Mr. Maagma earned his Master’s Degree in Business Administration (MBA) at the Asian
Institute of Management (AIM). Aside from this, he is a Certified Public Accountant (CPA), Chartered Business
Administrator (CBA), and a certified Information Security Management Systems (ISMS) Internal Auditor. He
graduated from the University of Santo Tomas (UST) with a Bachelor of Science degree in Commerce, major
in Accountancy.
Elsie D. Paras, 47 years old, Filipino, serves as GT Capital’s Vice President and Head of Corporate Finance and
Business Development. She has taken the lead in the mergers, acquisitions, divestment activities, and some
fund-raising efforts of the Company since she joined on January 5, 2015. Prior to joining the Corporation, she
served as Finance Manager and Deputy CFO of SIA Engineering Philippines, a joint venture of Cebu Air and
SIA Engineering of Singapore. Before this, she was a Manager for Strategic Consulting for Jones Lang La Salle
MENA in Dubai. Her other employments include: Business Development Manager for Commercial Centers of
Robinsons Land Corporation and Project Development Manager at Ayala Land, Inc. for middle-income
housing among others. She attained her Masters in Business Management, Major in Finance from the Asian
Institute of Management in 2001. She was also a participant in the International Exchange Student Program
of HEC School of Management of France. Prior to her MBM, she worked for six years in equity research and
investment banking. She graduated with honors from the University of the Philippines with a Bachelor of
Science degree in Business Economics.
Renee Lynn Miciano-Atienza, 37 years old, Filipino, is Vice President and Head of the Legal & Compliance
Department of GT Capital. She was appointed to her position on May 11, 2016 and has been with GT Capital
since August 2012. She concurrently holds the following positions: Director, GT Capital Auto Dealership
Holdings, Inc.; Director, Toyota Subic, Inc. Prior to joining the Corporation, she was the Head of the
Investigation and Enforcement Department of the Capital Markets Integrity Corporation (CMIC). Before
joining CMIC, she was the Officer-in-Charge of the Prosecution and Enforcement Department of the PSE. She
was also Legal Counsel of the Office of Senator Miguel Zubiri, and prior to entering law school, a trader for
United Coconut Planters Bank. She earned her Bachelor of Science degree in Management from the Ateneo
de Manila University and finished her Juris Doctor degree in the same university. In 2019, she completed the
Strategic Business Economics Program of the University of Asia and the Pacific.
Directorships in Other Reporting Companies and Subsidiaries
The following are directorships held by Directors and Executive Officers in other reporting (listed) companies
and subsidiaries of the Corporation during the last five years:
Name of Corporation Position
Francisco C. Sebastian
Metropolitan Bank & Trust Company
Federal Land, Inc.
Metro Pacific Investments Corporation
Vice Chairman/Director
Director
Director

133
Property Company of Friends, Inc. Director
Arthur Vy Ty
Metropolitan Bank & Trust Company
Metropolitan Bank (China) Ltd., Inc.
Metrobank Foundation, Inc.
Philippine Savings Bank
First Metro Investment Corporation
Philippine AXA Life Insurance Corporation
Federal Land, Inc.
Chairman/Director
Chairman
Chairman
Vice Chairman/Director
Vice Chairman/Director
Vice-Chairman/Director
Director
Alfred Vy Ty
Toyota Motor Philippines Corporation
Federal Land, Inc.
Metropolitan Bank & Trust Company
Metrobank Foundation, Inc.
Property Company of Friends, Inc.
Metro Pacific Investment Corporation
Philippine Long Distance Telephone Company
GT Capital Auto Dealership Holdings, Inc.
Toyota Motor School of Technology, Inc.
Federal Land-Orix Corporation
Chairman/Director
Chairman/Director
Director
Trustee
Chairman/Director
Director
Independent Director
Director
Vice Chairman/Director
Vice Chairman/Director
Carmelo Maria Luza Bautista
Toyota Motor Philippines Corporation
Federal Land, Inc.
Property Company of Friends, Inc.
Philippine AXA Life Insurance Corporation
GT Capital Auto Dealership Holdings, Inc.
Toyota Subic, Inc.
Toyota Financial Services Philippines Corporation
GT Mobility Ventures
Vivant Corporation
Director
Director
Director
Director
Director**
Director**
Chairman/Director
Chairman/Director**
Independent Director
David T. Go
Toyota Manila Bay Corporation
Toyota Motor Philippines Corporation
GT Capital Auto Dealership Holdings, Inc.
Toyota Subic, Inc.
Toyota Financial Services Philippines Corporation
Toyota Cubao, Inc
Chairman/Director
Vice Chairman/ Director/ Treasurer
Chairman/President/Director
Chairman/Director
Director/Treasurer
Chairman/Director
Pascual M. Garcia
Federal Land, Inc.
Property Company of Friends, Inc.
Toyota Financial Services Philippines Corporation
Sumisho Motor Finance Corporation
Rene J. Buenaventura
Lorenzo Shipping Corporation
AIG Insurance, Philippines
UBS Investments, Philippines, Inc.
Consumer Creditscore Philippines, Inc.
Equitable Foundation
Go Kim Pah Foundation
Maxicare Healthcare Foundation
Algo Leasing and Finance Inc.
Equicom Savings Bank
President
Vice Chairman/Director**
Director**
Director**
Independent Director
Independent Director
Independent Director
Chairman
Trustee
Trustee
Director
Vice Chairman
Vice Chairman
134
Renato C. Valencia
iPeople, Inc.
EEI Corporation
Anglo Philippine Holdings Corporation
Roxas Holdings, Inc.
Metropolitan Bank & Trust Company
Chairman
Independent Director
Independent Director
President/CEO
Independent Director
Wilfredo A. Paras
Philex Mining Corporation
Independent Director
Anjanette Ty Dy Buncio
Federal Land, Inc.
Property Company of Friends, Inc.
Director/Treasurer/Senior Vice
President
Director/Treasurer
Alesandra T. Ty
Philippine AXA Life Insurance Corporation
Sumisho Motorcycle Finance Corp.
Vicente Saniel Socco
GT Capital Auto Dealership Holdings, Inc.
GT Mobility Ventures, Inc.
Antonio P. A. Zara III
GT Mobility Ventures, Inc.
JBA Philippines, Inc.
Director/Treasurer
Director
Chairman/Director
Chairman/Director
Director/President
Director/Chairman
Francisco H. Suarez, Jr.
GT Capital Auto Dealership Holdings, Inc.
Toyota Subic, Inc.
GT Mobility Ventures, Inc.
JBA Philippines, Inc.
Toyota Manila Bay Corporation
Director/Treasurer
Director/Treasurer
Director/Treasurer
Director/Treasurer
Director
Winston Andrew L. Peckson
First Metro Philippine Equity Exchange Traded
Fund, Inc.
Director
Renee Lynn Miciano-Atienza
GT Capital Auto Dealership Holdings, Inc.
Toyota Subic, Inc.
Director
Director
The following will be nominated as officers of the Corporation during the Organizational meeting:
Office Name
Chairman Arthur V. Ty
Co-Vice Chairman Alfred V. Ty
Co-Vice Chairman Francisco C. Sebastian
President Carmelo Maria Luza Bautista
Treasurer Anjanette T. Dy Buncio
Assistant Treasurer Alesandra T. Ty
Corporate Secretary Antonio V. Viray
Assistant Corporate Secretary Jocelyn Y. Kho
Chairman of GTCAD Vicente Jose S. Socco
General Manager of GTCAD Antonio P. A. Zara III
Chief Financial Officer Francisco H. Suarez, Jr.
135
Head, Investor Relations, Strategic Planning Jose B. Crisol, Jr.
& Corporate Communications
Chief Risk Officer Winston Andrew L. Peckson
Head, Human Resources & Administration Susan E. Cornelio
Chief Audit Executive Leo Paul C. Maagma
Controller and Head, Accounting and Reyna Rose P. Manon-og
Financial Control
Head, Corporate Finance and Business Development Elsie D. Paras
Head, Legal and Compliance Renee Lynn Miciano-Atienza
The following will be nominated as Board Advisers during the Organizational meeting:
Adviser Guillermo Co Choa
Adviser Mary V. Ty
(b) Significant Employees
The Corporation does not believe that its business is dependent on the services of any particular employee.
(c) Family Relationships
Mary Vy Ty is the wife of the late Dr. George S.K. Ty. Arthur Vy Ty, Alfred Vy Ty, Anjanette T. Dy Buncio, and
Alesandra T. Ty are the children of Dr. George S.K. Ty and Mary Vy Ty. All other directors and officers are not
related either by consanguinity or affinity. There are no other family relationships known to the registrant
other than the ones disclosed herein.
(d) Certain Relationships and Related Transactions
There are no known related party transactions other than those described in Note 12 (Disposal of Assets) and
Note 27 (Related Party Transactions) of the Notes to the Consolidated Financial Statements. Related Party
Transactions are made on an arm’s length basis.
(e) Involvement in Legal Proceedings
The Corporation is not aware of any of the following events having occurred during the past five years up to
the date of this report that are material to an evaluation of the ability or integrity of any director, nominee for
election as Director, executive officer, underwriter or controlling person of the Corporation:
(1) any bankruptcy petition filed by or against any business of which such person was a general partner or
executive officer either at the time of the bankruptcy or within two years prior to that time;
(2) any conviction by final judgment, including the nature of the offense, in a criminal proceeding,
domestic or foreign, or being subject to a pending criminal proceeding, domestic or foreign, excluding
traffic violations and other minor offenses;
(3) being subject to any order, judgment or decree, not subsequently reversed, suspended or vacated, of
any court of competent jurisdiction, domestic or foreign, permanently or temporarily enjoining,
barring suspending or otherwise limiting his involvement in any type of business, securities,
commodities or banking activities;
(4) being found by a domestic or foreign court of competent jurisdiction (in a civil action), the SEC or
comparable foreign body, or a domestic or foreign exchange or other organized trading market or
self-regulatory organization, to have violated a securities or commodities law or regulation, and the
judgment has not been reversed, suspended or vacated; and
(5) a securities or commodities law or regulation, and the judgment has not been reversed, suspended or
vacated.
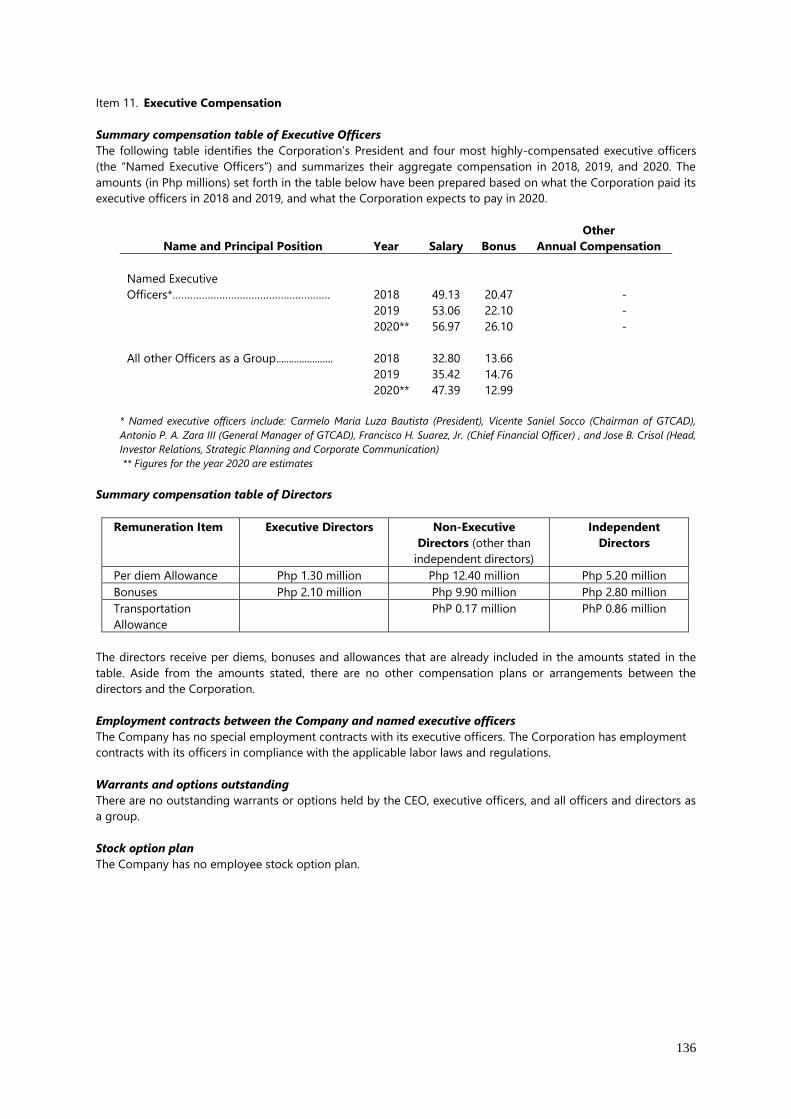
136
Item 11. Executive Compensation
Summary compensation table of Executive Officers
The following table identifies the Corporation’s President and four most highly-compensated executive officers
(the “Named Executive Officers”) and summarizes their aggregate compensation in 2018, 2019, and 2020. The
amounts (in Php millions) set forth in the table below have been prepared based on what the Corporation paid its
executive officers in 2018 and 2019, and what the Corporation expects to pay in 2020.
Name and Principal Position Year Salary Bonus
Other
Annual Compensation
Named Executive
Officers*……………………………………………… 2018 49.13 20.47 -
2019 53.06 22.10 -
2020** 56.97 26.10 -
All other Officers as a Group......................
2018
2019
2020**
32.80
35.42
47.39
13.66
14.76
12.99
* Named executive officers include: Carmelo Maria Luza Bautista (President), Vicente Saniel Socco (Chairman of GTCAD),
Antonio P. A. Zara III (General Manager of GTCAD), Francisco H. Suarez, Jr. (Chief Financial Officer) , and Jose B. Crisol (Head,
Investor Relations, Strategic Planning and Corporate Communication)
** Figures for the year 2020 are estimates
Summary compensation table of Directors
Remuneration Item Executive Directors Non-Executive
Directors (other than
independent directors)
Independent
Directors
Per diem Allowance Php 1.30 million Php 12.40 million Php 5.20 million
Bonuses Php 2.10 million Php 9.90 million Php 2.80 million
Transportation
Allowance
PhP 0.17 million PhP 0.86 million
The directors receive per diems, bonuses and allowances that are already included in the amounts stated in the
table. Aside from the amounts stated, there are no other compensation plans or arrangements between the
directors and the Corporation.
Employment contracts between the Company and named executive officers
The Company has no special employment contracts with its executive officers. The Corporation has employment
contracts with its officers in compliance with the applicable labor laws and regulations.
Warrants and options outstanding
There are no outstanding warrants or options held by the CEO, executive officers, and all officers and directors as
a group.
Stock option plan
The Company has no employee stock option plan.
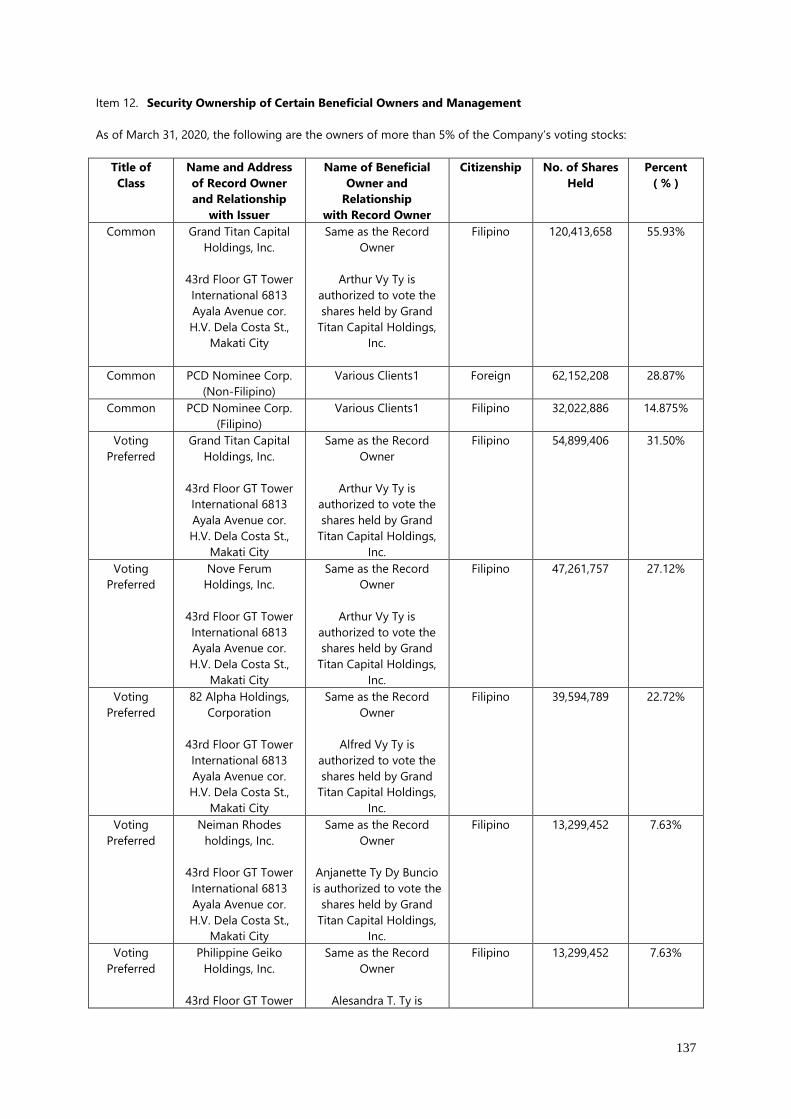
137
Item 12. Security Ownership of Certain Beneficial Owners and Management
As of March 31, 2020, the following are the owners of more than 5% of the Company’s voting stocks:
Title of
Class
Name and Address
of Record Owner
and Relationship
with Issuer
Name of Beneficial
Owner and
Relationship
with Record Owner
Citizenship No. of Shares
Held
Percent
( % )
Common Grand Titan Capital
Holdings, Inc.
43rd Floor GT Tower
International 6813
Ayala Avenue cor.
H.V. Dela Costa St.,
Makati City
Same as the Record
Owner
Arthur Vy Ty is
authorized to vote the
shares held by Grand
Titan Capital Holdings,
Inc.
Filipino 120,413,658 55.93%
Common PCD Nominee Corp.
(Non-Filipino)
Various Clients1 Foreign 62,152,208 28.87%
Common PCD Nominee Corp.
(Filipino)
Various Clients1 Filipino 32,022,886 14.875%
Voting
Preferred
Grand Titan Capital
Holdings, Inc.
43rd Floor GT Tower
International 6813
Ayala Avenue cor.
H.V. Dela Costa St.,
Makati City
Same as the Record
Owner
Arthur Vy Ty is
authorized to vote the
shares held by Grand
Titan Capital Holdings,
Inc.
Filipino 54,899,406 31.50%
Voting
Preferred
Nove Ferum
Holdings, Inc.
43rd Floor GT Tower
International 6813
Ayala Avenue cor.
H.V. Dela Costa St.,
Makati City
Same as the Record
Owner
Arthur Vy Ty is
authorized to vote the
shares held by Grand
Titan Capital Holdings,
Inc.
Filipino 47,261,757 27.12%
Voting
Preferred
82 Alpha Holdings,
Corporation
43rd Floor GT Tower
International 6813
Ayala Avenue cor.
H.V. Dela Costa St.,
Makati City
Same as the Record
Owner
Alfred Vy Ty is
authorized to vote the
shares held by Grand
Titan Capital Holdings,
Inc.
Filipino 39,594,789 22.72%
Voting
Preferred
Neiman Rhodes
holdings, Inc.
43rd Floor GT Tower
International 6813
Ayala Avenue cor.
H.V. Dela Costa St.,
Makati City
Same as the Record
Owner
Anjanette Ty Dy Buncio
is authorized to vote the
shares held by Grand
Titan Capital Holdings,
Inc.
Filipino 13,299,452 7.63%
Voting
Preferred
Philippine Geiko
Holdings, Inc.
43rd Floor GT Tower
Same as the Record
Owner
Alesandra T. Ty is
Filipino 13,299,452 7.63%
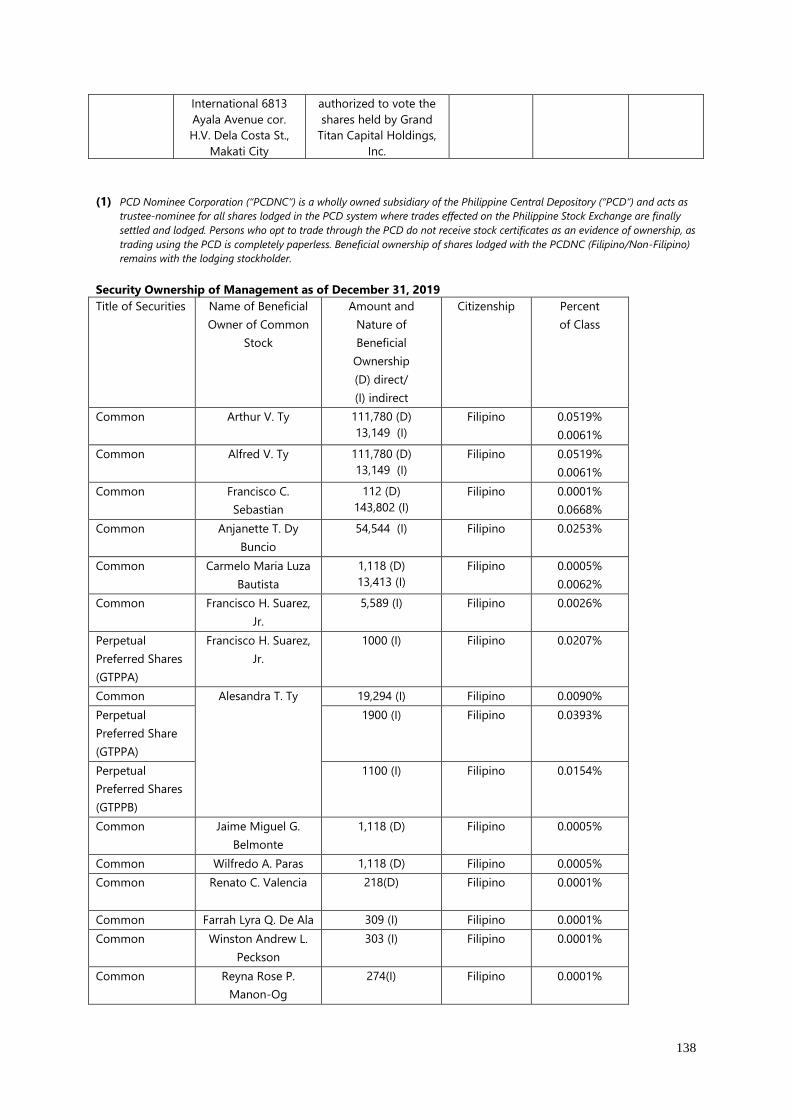
138
International 6813
Ayala Avenue cor.
H.V. Dela Costa St.,
Makati City
authorized to vote the
shares held by Grand
Titan Capital Holdings,
Inc.
(1) PCD Nominee Corporation (“PCDNC”) is a wholly owned subsidiary of the Philippine Central Depository (“PCD”) and acts as
trustee-nominee for all shares lodged in the PCD system where trades effected on the Philippine Stock Exchange are finally
settled and lodged. Persons who opt to trade through the PCD do not receive stock certificates as an evidence of ownership, as
trading using the PCD is completely paperless. Beneficial ownership of shares lodged with the PCDNC (Filipino/Non-Filipino)
remains with the lodging stockholder.
Security Ownership of Management as of December 31, 2019
Title of Securities Name of Beneficial
Owner of Common
Stock
Amount and
Nature of
Beneficial
Ownership
(D) direct/
(I) indirect
Citizenship Percent
of Class
Common Arthur V. Ty
111,780 (D)
13,149 (I)
Filipino 0.0519%
0.0061%
Common Alfred V. Ty
111,780 (D)
13,149 (I)
Filipino 0.0519%
0.0061%
Common Francisco C.
Sebastian
112 (D)
143,802 (I)
Filipino 0.0001%
0.0668%
Common Anjanette T. Dy
Buncio
54,544 (I) Filipino 0.0253%
Common Carmelo Maria Luza
Bautista
1,118 (D)
13,413 (I)
Filipino 0.0005%
0.0062%
Common Francisco H. Suarez,
Jr.
5,589 (I) Filipino 0.0026%
Perpetual
Preferred Shares
(GTPPA)
Francisco H. Suarez,
Jr.
1000 (I) Filipino 0.0207%
Common Alesandra T. Ty 19,294 (I) Filipino 0.0090%
Perpetual
Preferred Share
(GTPPA)
1900 (I) Filipino 0.0393%
Perpetual
Preferred Shares
(GTPPB)
1100 (I) Filipino 0.0154%
Common Jaime Miguel G.
Belmonte
1,118 (D) Filipino 0.0005%
Common Wilfredo A. Paras 1,118 (D) Filipino 0.0005%
Common Renato C. Valencia 218(D)
Filipino 0.0001%
Common Farrah Lyra Q. De Ala 309 (I) Filipino 0.0001%
Common Winston Andrew L.
Peckson
303 (I) Filipino 0.0001%
Common Reyna Rose P.
Manon-Og
274(I) Filipino 0.0001%
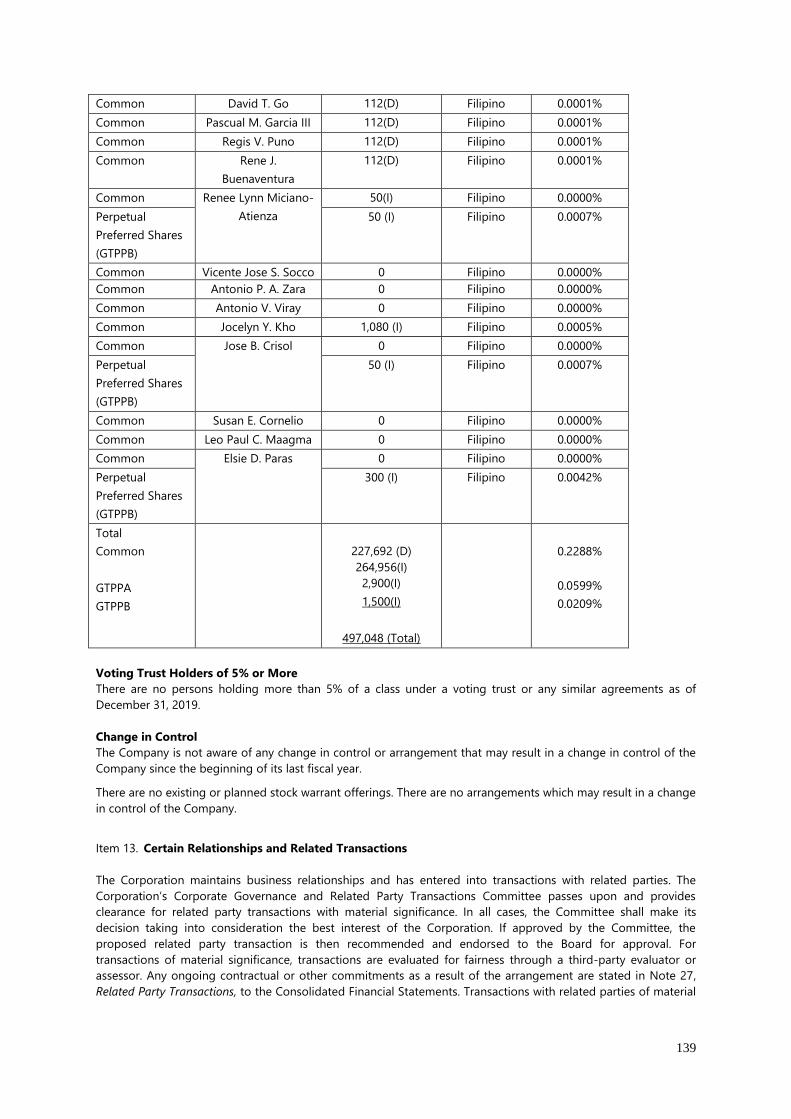
139
Common David T. Go 112(D) Filipino 0.0001%
Common Pascual M. Garcia III 112(D) Filipino 0.0001%
Common Regis V. Puno 112(D) Filipino 0.0001%
Common Rene J.
Buenaventura
112(D) Filipino 0.0001%
Common Renee Lynn Miciano-
Atienza
50(I) Filipino 0.0000%
Perpetual
Preferred Shares
(GTPPB)
50 (I) Filipino 0.0007%
Common Vicente Jose S. Socco 0 Filipino 0.0000%
Common Antonio P. A. Zara 0 Filipino 0.0000%
Common Antonio V. Viray 0 Filipino 0.0000%
Common Jocelyn Y. Kho 1,080 (I) Filipino 0.0005%
Common Jose B. Crisol 0 Filipino 0.0000%
Perpetual
Preferred Shares
(GTPPB)
50 (I) Filipino 0.0007%
Common Susan E. Cornelio 0 Filipino 0.0000%
Common Leo Paul C. Maagma 0 Filipino 0.0000%
Common Elsie D. Paras 0 Filipino 0.0000%
Perpetual
Preferred Shares
(GTPPB)
300 (I) Filipino 0.0042%
Total
Common
GTPPA
GTPPB
227,692 (D)
264,956(I)
2,900(I)
1,500(I)
497,048 (Total)
0.2288%
0.0599%
0.0209%
Voting Trust Holders of 5% or More
There are no persons holding more than 5% of a class under a voting trust or any similar agreements as of
December 31, 2019.
Change in Control
The Company is not aware of any change in control or arrangement that may result in a change in control of the
Company since the beginning of its last fiscal year.
There are no existing or planned stock warrant offerings. There are no arrangements which may result in a change
in control of the Company.
Item 13. Certain Relationships and Related Transactions
The Corporation maintains business relationships and has entered into transactions with related parties. The
Corporation’s Corporate Governance and Related Party Transactions Committee passes upon and provides
clearance for related party transactions with material significance. In all cases, the Committee shall make its
decision taking into consideration the best interest of the Corporation. If approved by the Committee, the
proposed related party transaction is then recommended and endorsed to the Board for approval. For
transactions of material significance, transactions are evaluated for fairness through a third-party evaluator or
assessor. Any ongoing contractual or other commitments as a result of the arrangement are stated in Note 27,
Related Party Transactions, to the Consolidated Financial Statements. Transactions with related parties of material
140
significance are made in the ordinary course of business, do not deviate substantially from market terms and
conditions and are made on an arm’s length basis.
There are no known related party transactions other than those described in Note 27, Related Party Transactions,
to the Consolidated Financial Statements. Related Party Transactions are made on an arm’s length basis.
There are no known transactions with parties that fall outside the definition of “related parties” under SFAS/IAS
No. 24 with whom the registrants or its related parties have a relationship that enables the parties to negotiate
terms of material transactions that may not be available from the other, more clearly independent, parties on an
arm’s length basis.
Transactions with Promoters
There are no transactions with promoters within the past five (5) years.
Events after the Reporting Period
For detailed discussion, please refer to Note 37 of the Consolidated Financial Statements for December 31, 2019
which forms part of the Annex of this SEC17A report.
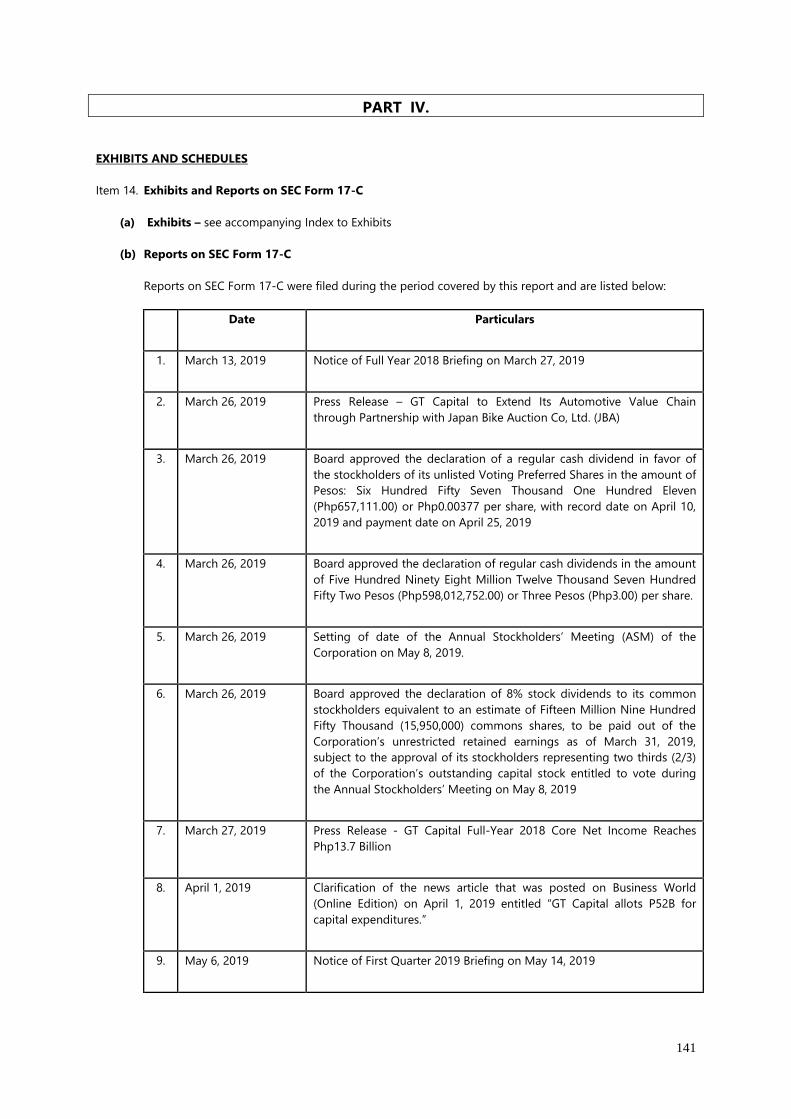
141
PART IV.
EXHIBITS AND SCHEDULES
Item 14. Exhibits and Reports on SEC Form 17-C
(a) Exhibits – see accompanying Index to Exhibits
(b) Reports on SEC Form 17-C
Reports on SEC Form 17-C were filed during the period covered by this report and are listed below:
Date Particulars
1. March 13, 2019 Notice of Full Year 2018 Briefing on March 27, 2019
2. March 26, 2019 Press Release – GT Capital to Extend Its Automotive Value Chain
through Partnership with Japan Bike Auction Co, Ltd. (JBA)
3. March 26, 2019 Board approved the declaration of a regular cash dividend in favor of
the stockholders of its unlisted Voting Preferred Shares in the amount of
Pesos: Six Hundred Fifty Seven Thousand One Hundred Eleven
(Php657,111.00) or Php0.00377 per share, with record date on April 10,
2019 and payment date on April 25, 2019
4. March 26, 2019 Board approved the declaration of regular cash dividends in the amount
of Five Hundred Ninety Eight Million Twelve Thousand Seven Hundred
Fifty Two Pesos (Php598,012,752.00) or Three Pesos (Php3.00) per share.
5. March 26, 2019 Setting of date of the Annual Stockholders’ Meeting (ASM) of the
Corporation on May 8, 2019.
6. March 26, 2019 Board approved the declaration of 8% stock dividends to its common
stockholders equivalent to an estimate of Fifteen Million Nine Hundred
Fifty Thousand (15,950,000) commons shares, to be paid out of the
Corporation’s unrestricted retained earnings as of March 31, 2019,
subject to the approval of its stockholders representing two thirds (2/3)
of the Corporation’s outstanding capital stock entitled to vote during
the Annual Stockholders’ Meeting on May 8, 2019
7. March 27, 2019 Press Release - GT Capital Full-Year 2018 Core Net Income Reaches
Php13.7 Billion
8. April 1, 2019 Clarification of the news article that was posted on Business World
(Online Edition) on April 1, 2019 entitled “GT Capital allots P52B for
capital expenditures.”
9. May 6, 2019 Notice of First Quarter 2019 Briefing on May 14, 2019
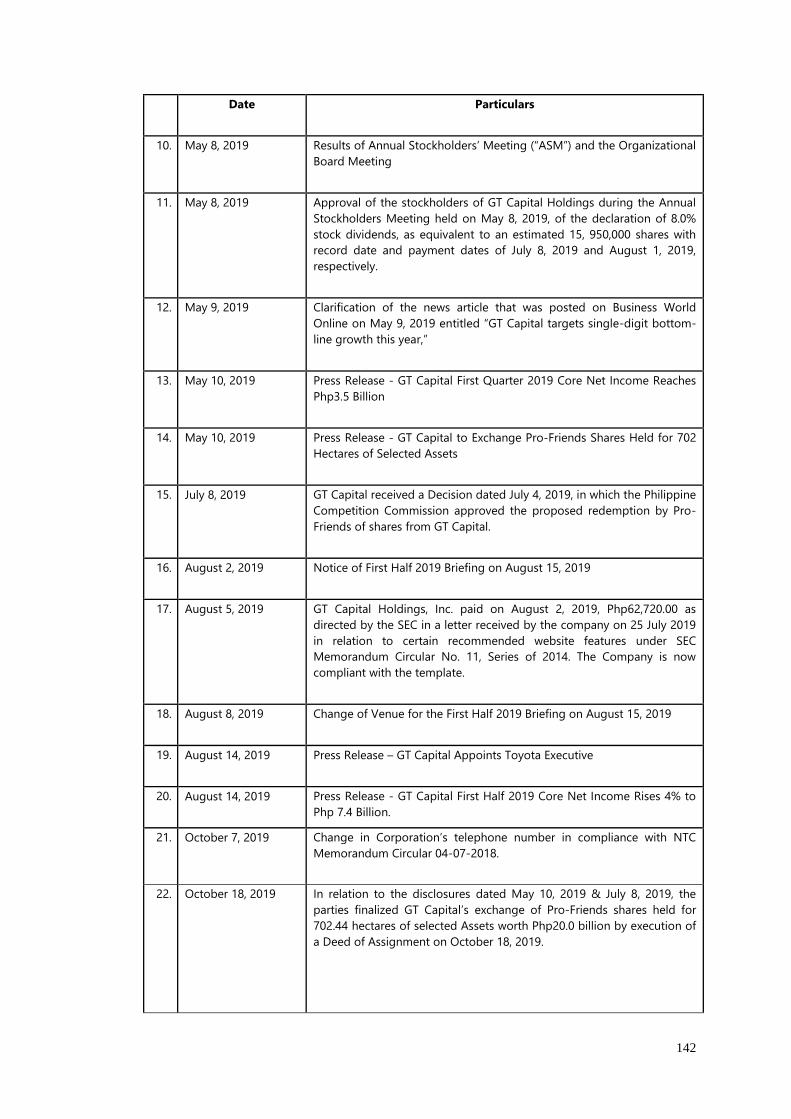
142
Date Particulars
10. May 8, 2019 Results of Annual Stockholders’ Meeting (“ASM”) and the Organizational
Board Meeting
11. May 8, 2019 Approval of the stockholders of GT Capital Holdings during the Annual
Stockholders Meeting held on May 8, 2019, of the declaration of 8.0%
stock dividends, as equivalent to an estimated 15, 950,000 shares with
record date and payment dates of July 8, 2019 and August 1, 2019,
respectively.
12. May 9, 2019 Clarification of the news article that was posted on Business World
Online on May 9, 2019 entitled “GT Capital targets single-digit bottom-
line growth this year,”
13. May 10, 2019 Press Release - GT Capital First Quarter 2019 Core Net Income Reaches
Php3.5 Billion
14. May 10, 2019 Press Release - GT Capital to Exchange Pro-Friends Shares Held for 702
Hectares of Selected Assets
15. July 8, 2019 GT Capital received a Decision dated July 4, 2019, in which the Philippine
Competition Commission approved the proposed redemption by Pro-
Friends of shares from GT Capital.
16. August 2, 2019 Notice of First Half 2019 Briefing on August 15, 2019
17. August 5, 2019 GT Capital Holdings, Inc. paid on August 2, 2019, Php62,720.00 as
directed by the SEC in a letter received by the company on 25 July 2019
in relation to certain recommended website features under SEC
Memorandum Circular No. 11, Series of 2014. The Company is now
compliant with the template.
18. August 8, 2019 Change of Venue for the First Half 2019 Briefing on August 15, 2019
19. August 14, 2019 Press Release – GT Capital Appoints Toyota Executive
20. August 14, 2019 Press Release - GT Capital First Half 2019 Core Net Income Rises 4% to
Php 7.4 Billion.
21. October 7, 2019 Change in Corporation’s telephone number in compliance with NTC
Memorandum Circular 04-07-2018.
22. October 18, 2019 In relation to the disclosures dated May 10, 2019 & July 8, 2019, the
parties finalized GT Capital’s exchange of Pro-Friends shares held for
702.44 hectares of selected Assets worth Php20.0 billion by execution of
a Deed of Assignment on October 18, 2019.

143
Date Particulars
23. November 14, 2019 Press Release - GT Capital January to September 2019 Consolidated Net
Income Grows 40% to Php15.3 Billion.
24. November 26, 2019 Declaration of quarterly cash dividends for its non-voting, non-
participating, non-convertible, and redeemable perpetual preferred
shares for the year 2020 in the amount per quarter of Pesos: Fifty Six
Million Twelve Thousand Nine Hundred Ninety Three and 19/100
(Php:56,012,993.19) for Series A (GTPPA) and Pesos: Ninety One Million
Two Hundred Eight Thousand three Hundred Ninety and 31/100 (Php91,
208,390.31) for Series B (GTPPB).
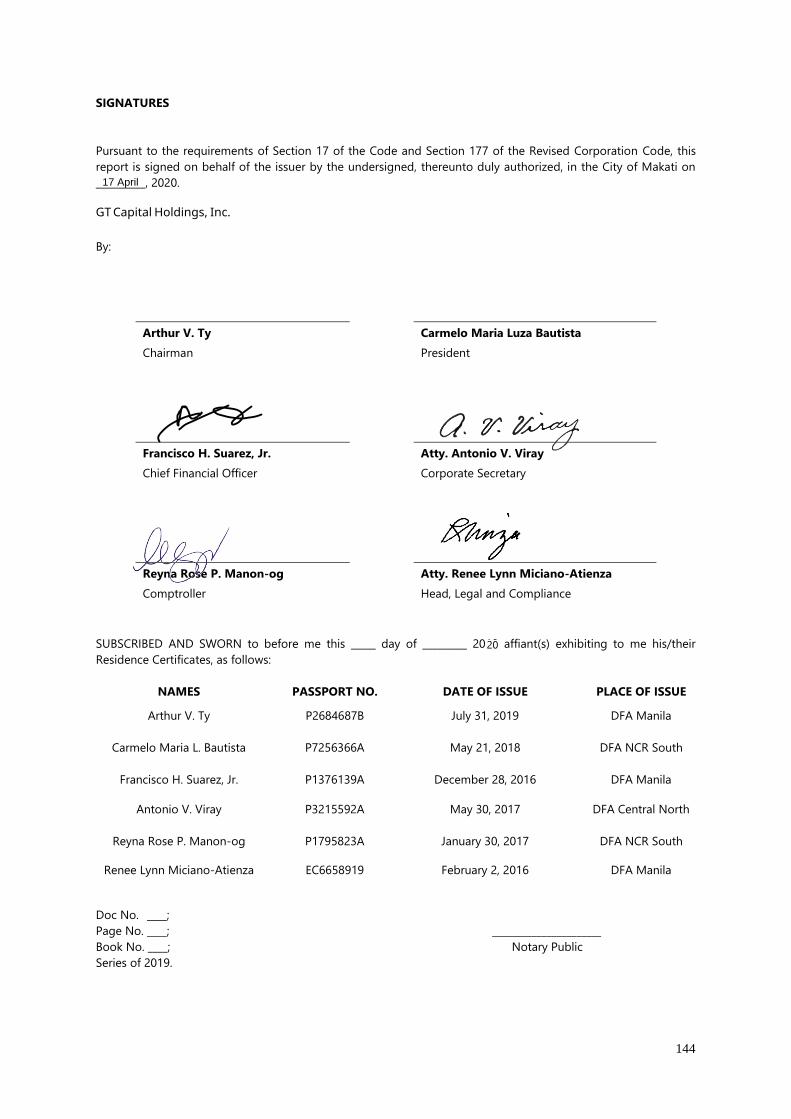
SIGNATURES
Pursuant to the requirements of Section 17 of the Code and Section 177 of the Revised Corporation Code, this report is signed on behalf of the issuer by the undersigned, thereunto duly authorized, in the City of Makati on __________, 2020.
By:
Arthur V. Ty
Carmelo Maria Luza Bautista
Chairman
President
Francisco H. Suarez, Jr.
Atty. Antonio V. Viray Chief Financial Officer
Corporate Secretary
Reyna Rose P. Manon-og
Atty. Renee Lynn Miciano-Atienza Comptroller
Head, Legal and Compliance
SUBSCRIBED AND SWORN to before me this _____ day of _________ 2019 affiant(s) exhibiting to me his/their Residence Certificates, as follows:
NAMES PASSPORT NO. DATE OF ISSUE PLACE OF ISSUE
Arthur V. Ty
P2684687B July 31, 2019 DFA Manila
Carmelo Maria L. Bautista P7256366A
May 21, 2018
DFA NCR South
Francisco H. Suarez, Jr. P1376139A December 28, 2016 DFA Manila
Antonio V. Viray P3215592A
May 30, 2017
DFA Central North
Reyna Rose P. Manon-og P1795823A January 30, 2017 DFA NCR South
Renee Lynn Miciano-Atienza EC6658919 February 2, 2016 DFA Manila
Doc No. ____; Page No. ____; ______________________ Book No. ____; Notary Public Series of 2019.
For
GT Capital Holdings, Inc.
17 April
144
20
145
INDEX TO EXHIBITS
I. FINANCIAL STATEMENTS AND SUPPLEMENTARY SCHEDULES
A. 2019 Audited Consolidated Financial Statements and Supplementary Schedules – GT Capital
Holdings, Inc.
Statement of Management’s Responsibility for Financial Statements
Independent Auditors’ Report
Consolidated Statements of Financial Position as of December 31, 2019 and 2018 and January 1, 2018
Consolidated Statements of Income for the Years Ended December 31, 2019, 2018 and 2017
Consolidated Statements of Comprehensive Income for the Years Ended December 31, 2019, 2018 and
2017
Consolidated Statements of Changes in Equity for the Years Ended December 31, 2019, 2018 and 2017
Consolidated Statements of Cash Flow for the Years Ended December 31, 2019, 2018 and 2017
Notes to Consolidated Financial Statements
Supplementary Schedules
Independent Auditors’ Report on Supplementary Schedules
Reconciliation of Retained Earnings Available for Dividend Declaration
Supplementary Schedules Required by Annex 68-E
A. Financial Assets
B. Amounts Receivable from Directors, Officers, Employees, Related Parties and Principal Stockholders
(Other than Related parties)
C. Amounts Receivable from Related Parties which are Eliminated During the Consolidation of the
Financial Statements
D. Long-Term Debt
E. Indebtedness to Related Parties (Long-Term Loans from Related Companies)
F. Guarantees of Securities of Other Issues
G. Capital Stock
Map of Relationship between and among the Parent Company, Subsidiaries, Jointly Controlled Entities
and Associates
Schedule of Financial Soundness Indicators
B. 2019 Audited Financial Statements - Metropolitan Bank and Trust Company
STATEMENT OF MANAGEMENT’S RESPONSIBILITY
FOR FINANCIAL STATEMENTS The management of GT Capital Holdings, Inc. (the Company) is responsible for the preparation and fair presentation of the parent and consolidated financial statements including the schedules attached therein, as of December 31, 2019, 2018 and 2017, and for each of the three years in the period ended December 31, 2019, in accordance with the prescribed financial reporting framework indicated therein, and for such internal control as management determines is necessary to enable the preparation of financial statements that are free from material misstatement, whether due to fraud or error. In preparing the financial statements, management is responsible for assessing the Company’s ability to continue as a going concern, disclosing, as applicable, matters related to going concern and using the going concern basis of accounting unless management either intends to liquidate the Company or to cease operations, or has no realistic alternative but to do so. The Board of Directors is responsible for overseeing the Company’s financial reporting process. The Board of Directors reviews and approves the financial statements including the schedules attached therein, and submits the same to the stockholders. SyCip Gorres Velayo & Co., the independent auditors, appointed by the stockholders, has audited the parent and consolidated financial statements of the Company in accordance with Philippine Standards on Auditing, and in its report to the stockholders, has expressed its opinion on the fairness of presentation upon completion of such examination. Signature: Arthur V. Ty, Chairman of the Board Signature: Carmelo Maria L. Bautista, President Signature: Francisco H. Suarez, Jr., Chief Financial Officer
March 27, 2020
For
REPUBLIC OF THE PHILIPPINES) CITY OF MAKATI ) S.S.
SUBSCRIBED AND SWORN to before me on ________________, affiants exhibiting to me their respective Tax Identification Numbers, as follows:
Arthur V. Ty TIN No. 121-526-580 Carmelo Maria L. Bautista TIN No. 106-903-668 Francisco H. Suarez, Jr. TIN No. 126-817-465
Doc. No. _________ Page No. _________ Book No. _________ Series of 2020
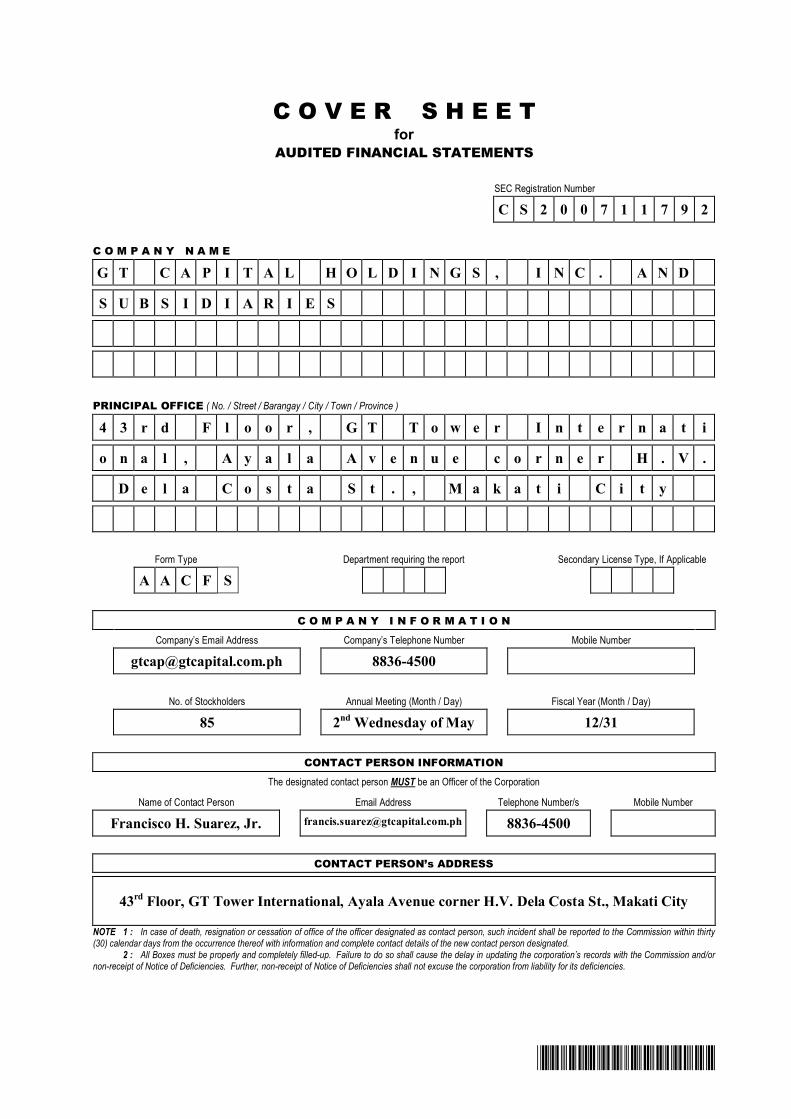
*SGVFSM000264*
C O V E R S H E E Tfor
AUDITED FINANCIAL STATEMENTS
SEC Registration Number
C S 2 0 0 7 1 1 7 9 2
C O M P A N Y N A M E
G T C A P I T A L H O L D I N G S , I N C . A N D
S U B S I D I A R I E S
PRINCIPAL OFFICE ( No. / Street / Barangay / City / Town / Province )
4 3 r d F l o o r , G T T o w e r I n t e r n a t i
o n a l , A y a l a A v e n u e c o r n e r H . V .
D e l a C o s t a S t . , M a k a t i C i t y
Form Type Department requiring the report Secondary License Type, If Applicable
A A C F S
C O M P A N Y I N F O R M A T I O N
Company’s Email Address Company’s Telephone Number Mobile Number
[email protected] 8836-4500
No. of Stockholders Annual Meeting (Month / Day) Fiscal Year (Month / Day)
85 2nd Wednesday of May 12/31
CONTACT PERSON INFORMATION
The designated contact person MUST be an Officer of the Corporation
Name of Contact Person Email Address Telephone Number/s Mobile Number
Francisco H. Suarez, Jr. [email protected] 8836-4500
CONTACT PERSON’s ADDRESS
43rd Floor, GT Tower International, Ayala Avenue corner H.V. Dela Costa St., Makati City
NOTE 1 : In case of death, resignation or cessation of office of the officer designated as contact person, such incident shall be reported to the Commission within thirty(30) calendar days from the occurrence thereof with information and complete contact details of the new contact person designated.
2 : All Boxes must be properly and completely filled-up. Failure to do so shall cause the delay in updating the corporation’s records with the Commission and/ornon-receipt of Notice of Deficiencies. Further, non-receipt of Notice of Deficiencies shall not excuse the corporation from liability for its deficiencies.
*SGVFSM000264*
INDEPENDENT AUDITOR’S REPORT
The Stockholders and the Board of DirectorsGT Capital Holdings, Inc.43rd Floor, GT Tower InternationalAyala Avenue corner H.V. Dela Costa StreetMakati City
Opinion
We have audited the consolidated financial statements of GT Capital Holdings, Inc. and its subsidiaries(the Group), which comprise the consolidated statements of financial position as at December 31, 2019and 2018, and the consolidated statements of income, consolidated statements of comprehensive income,consolidated statements of changes in equity and consolidated statements of cash flows for each of thethree years in the period ended December 31, 2019, and notes to the consolidated financial statements,including a summary of significant accounting policies.
In our opinion, the accompanying consolidated financial statements present fairly, in all material respects,the financial position of the Group as at December 31, 2019 and 2018, and its consolidated financialperformance and its consolidated cash flows for each of the three years in the period ended December 31,2019 in accordance with Philippine Financial Reporting Standards (PFRSs).
Basis for Opinion
We conducted our audits in accordance with Philippine Standards on Auditing (PSAs). Ourresponsibilities under those standards are further described in the Auditor’s Responsibilities for the Auditof the Consolidated Financial Statements section of our report. We are independent of the Group inaccordance with the Code of Ethics for Professional Accountants in the Philippines (Code of Ethics)together with the ethical requirements that are relevant to our audit of the consolidated financialstatements in the Philippines, and we have fulfilled our other ethical responsibilities in accordance withthese requirements and the Code of Ethics. We believe that the audit evidence we have obtained issufficient and appropriate to provide a basis for our opinion.
Key Audit Matters
Key audit matters are those matters that, in our professional judgment, were of most significance in ouraudit of the consolidated financial statements of the current period. These matters were addressed in thecontext of our audit of the consolidated financial statements as a whole, and in forming our opinionthereon, and we do not provide a separate opinion on these matters. For each matter below, ourdescription of how our audit addressed the matter is provided in that context.
SyCip Gorres Velayo & Co.6760 Ayala Avenue1226 Makati CityPhilippines
Tel: (632) 891 0307Fax: (632) 819 0872ey.com/ph
BOA/PRC Reg. No. 0001, October 4, 2018, valid until August 24, 2021SEC Accreditation No. 0012-FR-5 (Group A), November 6, 2018, valid until November 5, 2021
A member firm of Ernst & Young Global Limited
*SGVFSM000264*
- 2 -
We have fulfilled the responsibilities described in the Auditor’s Responsibilities for the Audit of theConsolidated Financial Statements section of our report, including in relation to these matters.Accordingly, our audit included the performance of procedures designed to respond to our assessment ofthe risks of material misstatement of the consolidated financial statements. The results of our auditprocedures, including the procedures performed to address the matters below, provide the basis for ouraudit opinion on the accompanying consolidated financial statements.
Redemption of shares in Property Company of Friends, Inc. (PCFI)
In 2019, GT Capital Holdings, Inc. (the Company) entered into a series of agreements with its thensubsidiary, PCFI, for the latter’s redemption, cancellation and retirement of 64,530,712 Series ARedeemable Voting Preferred Shares held by the Company, representing 51% ownership interest of theCompany in PCFI. In exchange for the shares, PCFI assigned and transferred certain real properties tothe Company, amounting to an aggregate fair value of P=20.00 billion.
Upon completion of the closing conditions, the Group lost control over PCFI and the latter has beendeconsolidated in the consolidated financial statements. Moreover, the results of PCFI’s operations werepresented as discontinued operations in the consolidated statements of income for the years endedDecember 31, 2019, 2018 and 2017. This transaction is significant to our audit as the amounts involvedare material to the consolidated financial statements. Moreover, accounting for this transaction requiredsignificant management judgments, particularly, on the assessment of loss of control, determination of thefair values of assets received as consideration and the classification of PCFI as a discontinued operation.The discussion of management’s judgments and other disclosures in relation to the redemption of sharesin PCFI are included in Notes 3 and 12 to the consolidated financial statements.
Audit Response
We obtained and reviewed the relevant contracts and agreements pertaining to the transaction. Weevaluated management’s judgment on the loss of control over PCFI. We reviewed the assets andliabilities to be deconsolidated as at the date of loss of control, including the results of operations of PCFIfor the six-month ended June 30, 2019. We also checked the propriety and valuation of propertiesreceived by reference to the related deeds of assignment, transfer certificates of titles, and appraisalreports.
We evaluated the Group’s basis for classifying the former subsidiary as discontinued operation bychecking whether the operations and cash flows of PCFI can be clearly distinguished, operationally andfor financial reporting purposes, from the rest of the Group. Furthermore, we reviewed the presentationand disclosures in the notes to the consolidated financial statements.
Revenue recognition from real estate services
The Group’s real estate revenue amounted to P=7.98 billion in 2019. We consider this as a key auditmatter because the revenue recognition of the Group requires the application of significant managementjudgment and estimation in the following areas: (1) assessment of the probability that the entity willcollect the consideration from the buyer; and (2) application of the output method as the measure ofprogress in determining real estate revenue; (3) determination of the actual costs incurred as cost of sales;and (4) recognition of cost to obtain a contract.
A member firm of Ernst & Young Global Limited
*SGVFSM000264*
- 3 -
In evaluating whether collectability of the amount of consideration is probable, the Group considers thesignificance of the buyer’s initial payments in relation to the total contract price (or buyer’s equity).Collectability is also assessed by considering factors such as past history with the buyer, age and pricingof the property. Management regularly evaluates the historical sales cancellations and back-outs if itwould still support its current threshold of buyers’ equity before commencing revenue recognition of realestate.
In measuring the progress of its performance obligation over time, the Group uses the output method.This method measures progress based on physical proportion of work done on the real estate projectwhich requires technical determination by the Group’s specialists (project engineers), as well as survey ofperformance completed to date. This is based on the monthly project accomplishment report prepared bythe project engineers as approved by the construction manager, which integrates the surveys ofperformance to date of the construction activities for both sub-contracted and those that are fulfilled bythe Group itself.
In determining the actual costs incurred to be recognized as cost of sales, the Group estimates costsincurred on materials, labor and overhead which have not yet been billed by the contractor. In othercases, the Group also compares the contractors’ billing forms against the budgeted costs and adjusts thecosts accordingly to real estate inventories or cost of real estate revenue.
The Group identifies sales commission after contract inception as the cost of obtaining the contract. Forcontracts which qualified for revenue recognition, the Group capitalizes the total sales commission due tosales agent as cost to obtain contract and recognizes the related commission payable. The Group usespercentage of completion method in amortizing sales commission consistent with the Group’s revenuerecognition policy. The assessment of the stage of completion and level of buyer’s equity involvessignificant management judgment as disclosed in Note 3 to the consolidated financial statements.
Audit Response
For the buyer’s equity, we evaluated management’s basis of the buyer’s equity by comparing this to thehistorical analysis of sales collections from buyers with accumulated payments above the collectionthreshold.
For the application of the output method, in determining real estate revenue, we obtained anunderstanding of the Group’s processes for determining the POC, and performed tests of the relevantcontrols. We obtained the certified POC reports prepared by the project engineers and assessed theircompetence and objectivity by reference to their qualifications, experience and reporting responsibilities.
For selected projects, we conducted ocular inspections, made relevant inquiries and obtained thesupporting details of POC reports showing the completion of the major activities of the projectconstruction.
For the cost of sales, we obtained an understanding of the Group’s cost accumulation process andperformed tests of the relevant controls. For selected projects, we traced costs accumulated, includingthose incurred but not yet billed costs, to supporting documents such as accomplishment reports andprogress billings from contractors.
A member firm of Ernst & Young Global Limited
*SGVFSM000264*
- 4 -
For the recognition of cost to obtain a contract, we obtained an understanding of the sales commissionprocess. For selected contracts, we agreed the basis for calculating the sales commission capitalized andportion recognized in profit or loss, particularly (a) the percentage of commission due against contractswith sales agents, (b) the total commissionable amount (e.g., net contract price) against the relatedcontract to sell, and, (c) the POC against the POC used in recognizing the related revenue from real estatesales.
Impairment Testing of Goodwill and Intangible Assets
Under PFRS, the Group is required to test goodwill and intangible assets with indefinite useful life forimpairment at least on an annual basis. As of December 31, 2019, the Group has goodwill and customerrelationship intangible asset amounting to P=5.93 billion and P=3.88 billion, respectively, which isconsidered significant to the consolidated financial statements. In addition, management’s assessmentprocess requires significant judgment and is based on assumptions, specifically estimated future cashinflows, budgeted gross margins, discount rates, long-term growth rates, attrition rate, and earnings beforeinterest and taxes (EBIT) margin on key customers. The disclosures in relation to the significantassumptions and carrying value of goodwill and intangible assets are included in Note 13 to theconsolidated financial statements.
Audit Response
We involved our internal specialists to evaluate the assumptions and methodologies used. Theseassumptions include discounted expected future cash inflows, budgeted gross margins, discount rates,long-term growth rates, attrition rate and EBIT margin on key customers. We compared the keyassumptions used, such as discount rates and growth rates against the historical performance of the cash-generating unit (CGU), industry/market outlook and other relevant external data. We tested theparameters used in the determination of the discount rate against market data.
We also reviewed the Group’s disclosures about those assumptions to which the outcome of theimpairment test is most sensitive; specifically, those that have the most significant effect on thedetermination of the recoverable amount of goodwill.
Accounting for Investments in Associates
The Group has effective ownership of 15.52% in MPIC and 36.65% in MBTC as of December 31, 2019.These investments are accounted for using the equity method. The application of equity method ofaccounting to these investments is a key audit matter because these investments in associates contributedP=13.08 billion or 51.89% to the consolidated net income of the Group in 2019, and accounted for 65.81%and 44.07% of the consolidated total noncurrent assets and total assets, respectively, of the Group as ofDecember 31, 2019.
A member firm of Ernst & Young Global Limited
*SGVFSM000264*
- 5 -
The Group’s share in MPIC’s net income is significantly affected by: (1) MPIC’s revenue on water andsewerage services from the Metropolitan Waterworks and Sewerage System (MWSS) West Service Area;(2) accounting for KKR & Co. (KKR)’s investments in Metro Pacific Hospital Holdings, Inc. (MPHHI);and (3) MPIC’s impairment testing of goodwill as well as its several service concession agreements withthe Philippine Government.
Water and sewerage service revenue recognition is significant to our audit because it is affected by the:(a) completeness of data captured during monthly meter readings, which involves processing largevolume of data from multiple locations and different billing cut-off dates for different customers; (b) thepropriety of the application of the relevant rates to the billable consumption of different customersclassified as residential, semi-business, commercial or industrial; and (c) the reliability of the systemsinvolved in processing bills and recording revenues.
Moreover, MPIC and MPHHI completed a series of transactions on December 9, 2019 for the investmentand entry of global investment firm, KKR, through Buhay (SG) Investments Pte. Ltd (Buhay SG),alongside Arran Investment Private Limited (Arran), in and to, MPHHI. These series of transactionswhich provided Buhay (SG) an economic interest of approximately 80%, on fully diluted basis postconversion of the Exchangeable Bonds, were accounted for as a single equity transaction with MPIClosing control over MPHHI. Subsequently, the retained investment in MPHHI is accounted for under theequity method. These matters are significant to our audit because these transactions required significantmanagement judgments and estimates, which include the assessment of loss of control, subsequentaccounting for retained investment, the determination of the fair values of liabilities assumed as part ofconsideration and the accounting for the Exchangeable Bonds. The amounts involved are also material tothe Group’s share in MPIC’s net income.
In addition, MPIC has goodwill arising from its acquisition of long-term investments in water andtollways business as well as several service concession agreements (SCAs) with the PhilippineGovernment and/or its agencies or instrumentalities that are not yet available for use and are required tobe tested for impairment at least annually under PFRS. Discussions are currently ongoing with theMWSS on the provisions of Maynilad’s Concession Agreement identified for renegotiation andamendment, which is an impairment indicator that requires an assessment of the recoverability of MPIC’sSCA related to Maynilad. This matter is important to our audit because the impairment assessment ofgoodwill and SCAs not available for use involves significant management judgment and estimation thatcould have a material effect on the Group’s share in MPIC’s net income.
The Group’s share in MBTC’s net income is significantly affected by MBTC’s application of ExpectedCredit Loss (ECL) model in calculating allowance for credit losses for its loans and receivables. Thismatter is a key area of judgment because it involves the exercise of significant management judgment.Key areas of judgment include: segmenting MBTC’s credit risk exposures; determining the method toestimate ECL; defining default; identifying exposures with significant deterioration in credit quality;determining assumptions to be used in the ECL model such as the counterparty credit risk rating, theexpected life of the financial asset and expected recoveries from defaulted accounts; and incorporatingforward-looking information (called overlays) in calculating ECL.
The Group assesses impairment of its investments in associates and joint ventures whenever events orchanges in circumstances indicate that the carrying amount of the investments may not be recoverable.
A member firm of Ernst & Young Global Limited
*SGVFSM000264*
- 6 -
As of December 31, 2019, the Group’s investment in MPIC amounted to P=36.96 billion and fair value hasdeclined significantly compared to the carrying value. The Group uses the higher between fair value lesscost to sell and value in use in determining the recoverable amount. The Group performed an impairmenttest on its investment in MPIC using the sum of the parts of the value-in-use (VIU) and fair value lesscost to sell (FVLCTS) of the MPIC Group. We considered the impairment testing of the Group’sinvestment in MPIC as a key audit matter as significant judgment and estimates are involved in thedetermination of the VIU and FVLCTS.
The relevant disclosures related to the Group’s investment in associates are provided in Note 8 to theconsolidated financial statements.
Audit Response
For MPIC, we obtained an understanding of the water and sewerage service revenue process, whichincludes maintaining the customer database, capturing billable water consumption, uploading capturedbillable water consumption to the billing system, calculating billable amounts based on MWSS approvedrates, and uploading data from the billing system to the financial reporting system. We also evaluated thedesign of and tested the relevant controls over this process. In addition, we performed test recalculationof the billed amounts using the MWSS approved rates and formulae, and compared them with theamounts reflected in the billing statements. Moreover, we involved our internal specialists in performingthe aforementioned procedures on the automated aspects of this process.
We obtained and reviewed relevant contracts and agreements related to the linked transactions involvingMPHII. We evaluated management’s judgments on the loss of control over MPHHI, subsequentaccounting for retained investment, and how the entry of KKR and issuance of Exchangeable Bondshould be accounted for, by reference to the related purchase agreements and documents. We reviewedthe assets and liabilities to be deconsolidated as at the date of loss of control. We also involved ourinternal specialists in reviewing the valuation methodology and key inputs, such as revenue growth,margins, estimates of certain taxes related to the fair values of liabilities assumed as part of consideration.We compared the revenue growth and margins to the historical performance of the investee. We alsoreviewed the presentation and disclosures in the notes to the consolidated financial statements.
We discussed with management and its legal counsel the status of the review of the concession agreementand obtained copies of correspondences with MWSS. We involved our internal specialist in evaluatingthe methodologies and the assumptions used in determining the value in use of goodwill and SCAs notyet available for use. These assumptions include the expected volume of traffic for the toll roads,ridership for the rail, billed water volume for the water concession, growth rate and discount rates. Wecompared the forecast revenue growth against the historical data of the CGUs and inquired frommanagement and operations personnel about the plans to support the forecast revenues. We alsocompared the key assumptions such as traffic volume, rail ridership and water volume against historicaldata and against available studies by independent parties that were commissioned by the respectivesubsidiaries. We reviewed the weighted average cost of capital (WACC) used in the impairment test bycomparing it with WACC of other comparable companies in the regions.
For MBTC, we obtained an understanding of the board-approved methodologies and models used for thedifferent credit exposures and assessed whether these considered the requirements of PFRS 9 to reflect anunbiased and probability-weighted outcome, and to consider time value of money and the best availableforward-looking information.
A member firm of Ernst & Young Global Limited
*SGVFSM000264*
- 7 -
We (a) assessed MBTC’s segmentation of its credit risk exposures based on homogeneity of credit riskcharacteristics; (b) tested the definition of default and significant increase in credit risk criteria againsthistorical analysis of accounts and credit risk management policies and practices in place; (c) testedMBTC’s application of internal credit risk rating system by reviewing the ratings of sample creditexposures; (d) assessed whether expected life is different from the contractual life by testing the maturitydates reflected in MBTC’s records and considering management’s assumptions regarding futurecollections, advances, extensions, renewals and modifications; (e) tested loss given default by inspectinghistorical recoveries and related costs, write-offs and collateral valuations; (f) tested exposure at defaultconsidering outstanding commitments and repayment scheme; (g) checked the reasonableness of forward-looking information used for overlay through statistical test and corroboration using publicly availableinformation and our understanding of the MBTC’s lending portfolios and broader industry knowledge;and (h) tested the effective interest rate used in discounting the expected loss.
Further, we checked the data used in the ECL models by reconciling data from source system reports tothe data warehouse and from the data warehouse to the loss allowance analysis/models and financialreporting systems. To the extent that the loss allowance analysis is based on credit exposures that havebeen disaggregated into subsets of debt financial assets with similar risk characteristics, we traced or re-performed the disaggregation from source systems to the loss allowance analysis. We also assessed theassumptions used where there are missing or insufficient data.
We recalculated impairment provisions on a sample basis and checked the appropriateness of thetransition adjustments.
We involved our internal specialists in the performance of the above procedures.
For the Group’s recoverability of investment in associates, we involved our internal specialist inevaluating the methodology and assumptions used. For MPIC’s toll and light rail segment, theassumptions used in determining the VIU include the expected volume of traffic for the toll roads,ridership for the rail, growth rate and discount rates. We compared the forecast revenue growth againstthe historical data of the CGUs and inquired from management and operations personnel about the plansto support the forecast revenues. We also compared the key assumptions used such as traffic volume andrail ridership against historical data and against available studies by independent parties that werecommissioned by the respective subsidiaries. We tested the WACC used in the impairment test bycomparing it with WACC of other comparable companies in the region.
For the other components of MPIC, we also involved our internal specialists in evaluating theassumptions and methodology used by Group in determining the FVLCTS, in particular those relating tothe use of price-earnings (P/E) ratios of comparable companies in the valuation of the unquoted equityshares. We also re-performed the calculation of the FVLCTS.
Other Information
Management is responsible for the other information. The other information comprises the informationincluded in the SEC Form 20-IS (Definitive Information Statement), SEC Form 17-A and Annual Reportfor the year ended December 31, 2019, but does not include the consolidated financial statements and ourauditor’s report thereon. The SEC Form 20-IS (Definitive Information Statement), SEC Form 17-A andthe Annual Report for the year ended December 31, 2019 are expected to be made available to us after thedate of this auditor’s report.
A member firm of Ernst & Young Global Limited
*SGVFSM000264*
- 8 -
Our opinion on the consolidated financial statements does not cover the other information and we will notexpress any form of assurance conclusion thereon.
In connection with our audits of the consolidated financial statements, our responsibility is to read theother information identified above when it becomes available and, in doing so, consider whether the otherinformation is materially inconsistent with the consolidated financial statements or our knowledgeobtained in the audits, or otherwise appears to be materially misstated.
Responsibilities of Management and the Those Charged with Governance for the ConsolidatedFinancial Statements
Management is responsible for the preparation and fair presentation of the consolidated financialstatements in accordance with PFRSs, and for such internal control as management determines isnecessary to enable the preparation of consolidated financial statements that are free from materialmisstatement, whether due to fraud or error.
In preparing the consolidated financial statements, management is responsible for assessing the Group’sability to continue as a going concern, disclosing, as applicable, matters related to going concern andusing the going concern basis of accounting unless management either intends to liquidate the Group or tocease operations, or has no realistic alternative but to do so.
Those charged with governance are responsible for overseeing the Group’s financial reporting process.
Auditor’s Responsibilities for the Audit of the Consolidated Financial Statements
Our objectives are to obtain reasonable assurance about whether the consolidated financial statements as awhole are free from material misstatement, whether due to fraud or error, and to issue an auditor’s reportthat includes our opinion. Reasonable assurance is a high level of assurance, but is not a guarantee that anaudit conducted in accordance with PSAs will always detect a material misstatement when it exists.Misstatements can arise from fraud or error and are considered material if, individually or in theaggregate, they could reasonably be expected to influence the economic decisions of users taken on thebasis of these consolidated financial statements.
As part of an audit in accordance with PSAs, we exercise professional judgment and maintainprofessional skepticism throughout the audit. We also:
• Identify and assess the risks of material misstatement of the consolidated financial statements,whether due to fraud or error, design and perform audit procedures responsive to those risks, andobtain audit evidence that is sufficient and appropriate to provide a basis for our opinion. The risk ofnot detecting a material misstatement resulting from fraud is higher than for one resulting from error,as fraud may involve collusion, forgery, intentional omissions, misrepresentations, or the override ofinternal control.
• Obtain an understanding of internal control relevant to the audit in order to design audit proceduresthat are appropriate in the circumstances, but not for the purpose of expressing an opinion on theeffectiveness of the Group’s internal control.
A member firm of Ernst & Young Global LimitedA member firm of Ernst & Young Global Limited
*SGVFSM000264*
- 9 -
• Evaluate the appropriateness of accounting policies used and the reasonableness of accountingestimates and related disclosures made by management.
• Conclude on the appropriateness of management’s use of the going concern basis of accounting and,based on the audit evidence obtained, whether a material uncertainty exists related to events orconditions that may cast significant doubt on the Group’s ability to continue as a going concern. Ifwe conclude that a material uncertainty exists, we are required to draw attention in our auditor’sreport to the related disclosures in the consolidated financial statements or, if such disclosures areinadequate, to modify our opinion. Our conclusions are based on the audit evidence obtained
• the date of our auditor’s report. However, future events or conditions may cause the Group to ceaseto continue as a going concern.
• Evaluate the overall presentation, structure and content of the consolidated financial statements,including the disclosures, and whether the consolidated financial statements represent the underlyingtransactions and events in a manner that achieves fair presentation.
• Obtain sufficient appropriate audit evidence regarding the financial information of the entities orbusiness activities within the Group to express an opinion on the consolidated financial statements.We are responsible for the direction, supervision and performance of the audit. We remain solelyresponsible for our audit opinion.
We communicate with those charged with governance regarding, among other matters, the planned scopeand timing of the audit and significant audit findings, including any significant deficiencies in internalcontrol that we identify during our audit.
We also provide those charged with governance with a statement that we have complied with relevantethical requirements regarding independence, and to communicate with them all relationships and othermatters that may reasonably be thought to bear on our independence, and where applicable, relatedsafeguards.
From the matters communicated with those charged with governance, we determine those matters thatwere of most significance in the audit of the consolidated financial statements of the current period andare therefore the key audit matters. We describe these matters in our auditor’s report unless law orregulation precludes public disclosure about the matter or when, in extremely rare circumstances, wedetermine that a matter should not be communicated in our report because the adverse consequences ofdoing so would reasonably be expected to outweigh the public interest benefits of such communication
A member firm of Ernst & Young Global Limited
*SGVFSM000264*
- 10 -
The engagement partner on the audit resulting in this independent auditor’s report is Miguel U. Ballelos, Jr.
SYCIP GORRES VELAYO & CO.
Miguel U. Ballelos, Jr.PartnerCPA Certificate No. 109950SEC Accreditation No. 1566-AR-1 (Group A), April 3, 2019, valid until April 2, 2022Tax Identification No. 241-031-088BIR Accreditation No. 08-001998-114-2019, January 28, 2019, valid until January 27, 2022PTR No. 8125210, January 7, 2020, Makati City
March 27, 2020
A member firm of Ernst & Young Global LimitedA member firm of Ernst & Young Global Limited
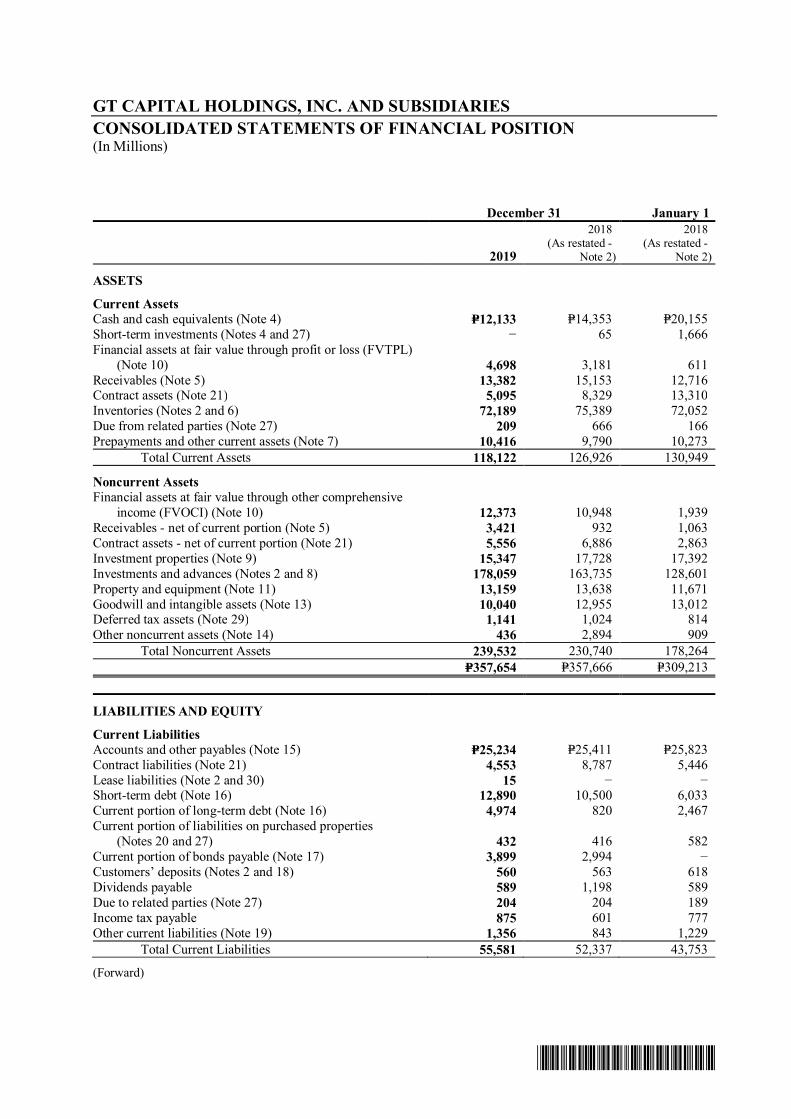
*SGVFSM000264*
GT CAPITAL HOLDINGS, INC. AND SUBSIDIARIESCONSOLIDATED STATEMENTS OF FINANCIAL POSITION(In Millions)
December 31 January 1
2019
2018(As restated -
Note 2)
2018(As restated -
Note 2)
ASSETS
Current AssetsCash and cash equivalents (Note 4) P=12,133 P=14,353 P=20,155Short-term investments (Notes 4 and 27) − 65 1,666Financial assets at fair value through profit or loss (FVTPL) (Note 10) 4,698 3,181 611Receivables (Note 5) 13,382 15,153 12,716Contract assets (Note 21) 5,095 8,329 13,310Inventories (Notes 2 and 6) 72,189 75,389 72,052Due from related parties (Note 27) 209 666 166Prepayments and other current assets (Note 7) 10,416 9,790 10,273 Total Current Assets 118,122 126,926 130,949
Noncurrent AssetsFinancial assets at fair value through other comprehensive
income (FVOCI) (Note 10) 12,373 10,948 1,939Receivables - net of current portion (Note 5) 3,421 932 1,063Contract assets - net of current portion (Note 21) 5,556 6,886 2,863Investment properties (Note 9) 15,347 17,728 17,392Investments and advances (Notes 2 and 8) 178,059 163,735 128,601Property and equipment (Note 11) 13,159 13,638 11,671Goodwill and intangible assets (Note 13) 10,040 12,955 13,012Deferred tax assets (Note 29) 1,141 1,024 814Other noncurrent assets (Note 14) 436 2,894 909 Total Noncurrent Assets 239,532 230,740 178,264
P=357,654 P=357,666 P=309,213
LIABILITIES AND EQUITY
Current LiabilitiesAccounts and other payables (Note 15) P=25,234 P=25,411 P=25,823Contract liabilities (Note 21) 4,553 8,787 5,446Lease liabilities (Note 2 and 30) 15 − −Short-term debt (Note 16) 12,890 10,500 6,033Current portion of long-term debt (Note 16) 4,974 820 2,467Current portion of liabilities on purchased properties (Notes 20 and 27) 432 416 582Current portion of bonds payable (Note 17) 3,899 2,994 −Customers’ deposits (Notes 2 and 18) 560 563 618Dividends payable 589 1,198 589Due to related parties (Note 27) 204 204 189Income tax payable 875 601 777Other current liabilities (Note 19) 1,356 843 1,229 Total Current Liabilities 55,581 52,337 43,753
(Forward)
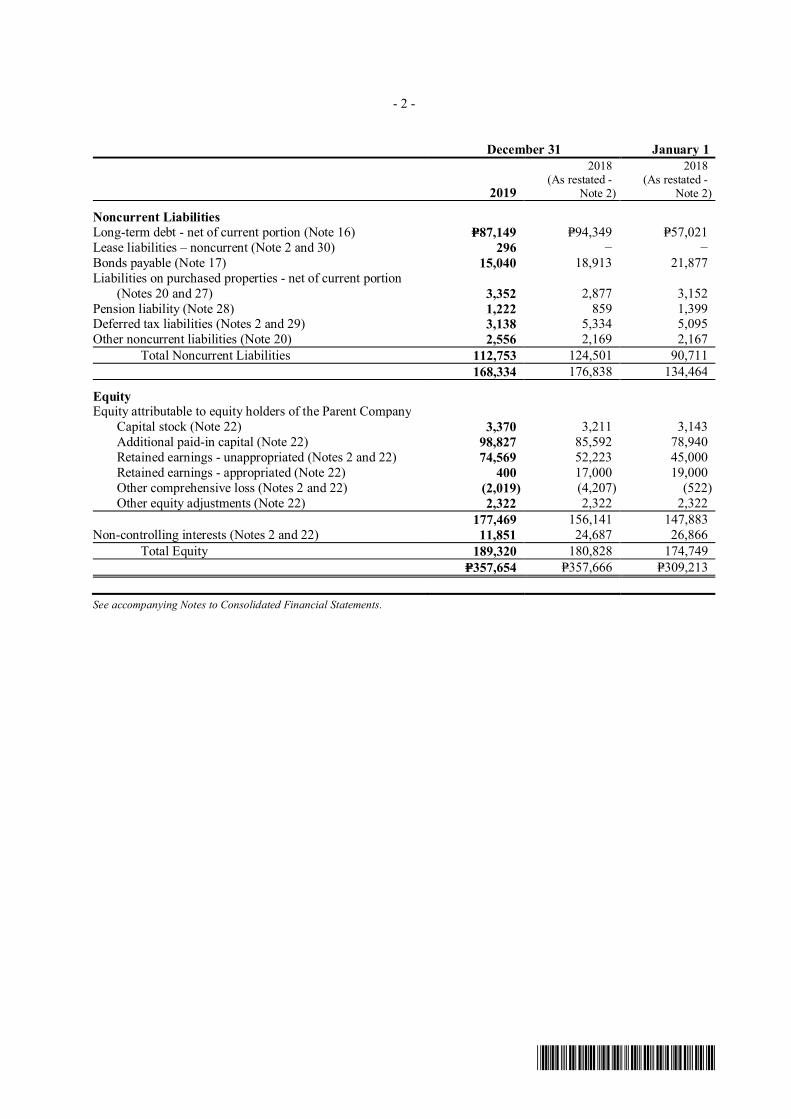
*SGVFSM000264*
- 2 -
December 31 January 1
2019
2018(As restated -
Note 2)
2018(As restated -
Note 2)
Noncurrent LiabilitiesLong-term debt - net of current portion (Note 16) P=87,149 P=94,349 P=57,021Lease liabilities – noncurrent (Note 2 and 30) 296 − −Bonds payable (Note 17) 15,040 18,913 21,877Liabilities on purchased properties - net of current portion
(Notes 20 and 27) 3,352 2,877 3,152Pension liability (Note 28) 1,222 859 1,399Deferred tax liabilities (Notes 2 and 29) 3,138 5,334 5,095Other noncurrent liabilities (Note 20) 2,556 2,169 2,167
Total Noncurrent Liabilities 112,753 124,501 90,711168,334 176,838 134,464
EquityEquity attributable to equity holders of the Parent Company Capital stock (Note 22) 3,370 3,211 3,143 Additional paid-in capital (Note 22) 98,827 85,592 78,940 Retained earnings - unappropriated (Notes 2 and 22) 74,569 52,223 45,000 Retained earnings - appropriated (Note 22) 400 17,000 19,000 Other comprehensive loss (Notes 2 and 22) (2,019) (4,207) (522) Other equity adjustments (Note 22) 2,322 2,322 2,322
177,469 156,141 147,883Non-controlling interests (Notes 2 and 22) 11,851 24,687 26,866 Total Equity 189,320 180,828 174,749
P=357,654 P=357,666 P=309,213
See accompanying Notes to Consolidated Financial Statements.
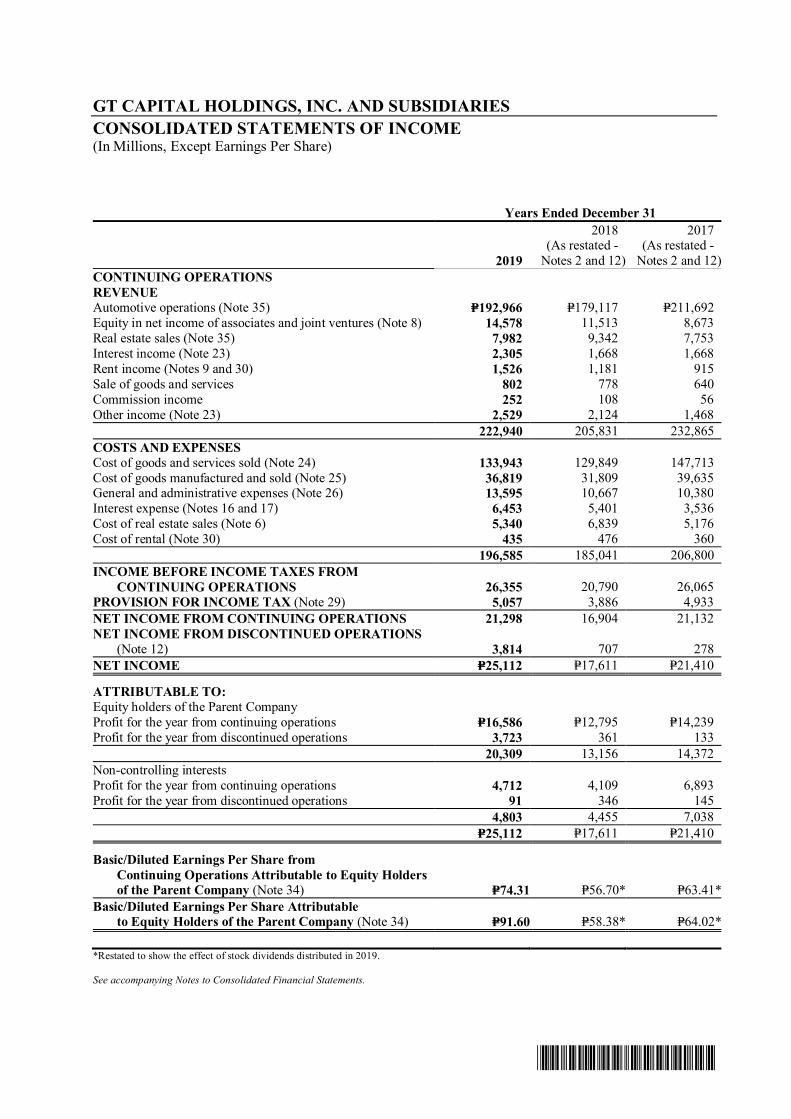
*SGVFSM000264*
GT CAPITAL HOLDINGS, INC. AND SUBSIDIARIESCONSOLIDATED STATEMENTS OF INCOME(In Millions, Except Earnings Per Share)
Years Ended December 31
2019
2018(As restated -
Notes 2 and 12)
2017(As restated -
Notes 2 and 12)CONTINUING OPERATIONSREVENUEAutomotive operations (Note 35) P=192,966 P=179,117 P=211,692Equity in net income of associates and joint ventures (Note 8) 14,578 11,513 8,673Real estate sales (Note 35) 7,982 9,342 7,753Interest income (Note 23) 2,305 1,668 1,668Rent income (Notes 9 and 30) 1,526 1,181 915Sale of goods and services 802 778 640Commission income 252 108 56Other income (Note 23) 2,529 2,124 1,468
222,940 205,831 232,865COSTS AND EXPENSESCost of goods and services sold (Note 24) 133,943 129,849 147,713Cost of goods manufactured and sold (Note 25) 36,819 31,809 39,635General and administrative expenses (Note 26) 13,595 10,667 10,380Interest expense (Notes 16 and 17) 6,453 5,401 3,536Cost of real estate sales (Note 6) 5,340 6,839 5,176Cost of rental (Note 30) 435 476 360
196,585 185,041 206,800INCOME BEFORE INCOME TAXES FROM
CONTINUING OPERATIONS 26,355 20,790 26,065PROVISION FOR INCOME TAX (Note 29) 5,057 3,886 4,933NET INCOME FROM CONTINUING OPERATIONS 21,298 16,904 21,132NET INCOME FROM DISCONTINUED OPERATIONS
(Note 12) 3,814 707 278NET INCOME P=25,112 P=17,611 P=21,410
ATTRIBUTABLE TO:Equity holders of the Parent CompanyProfit for the year from continuing operations P=16,586 P=12,795 P=14,239Profit for the year from discontinued operations 3,723 361 133
20,309 13,156 14,372Non-controlling interestsProfit for the year from continuing operations 4,712 4,109 6,893Profit for the year from discontinued operations 91 346 145
4,803 4,455 7,038P=25,112 P=17,611 P=21,410
Basic/Diluted Earnings Per Share fromContinuing Operations Attributable to Equity Holdersof the Parent Company (Note 34) P=74.31 P=56.70* P=63.41*
Basic/Diluted Earnings Per Share Attributableto Equity Holders of the Parent Company (Note 34) P=91.60 P=58.38* P=64.02*
*Restated to show the effect of stock dividends distributed in 2019.
See accompanying Notes to Consolidated Financial Statements.
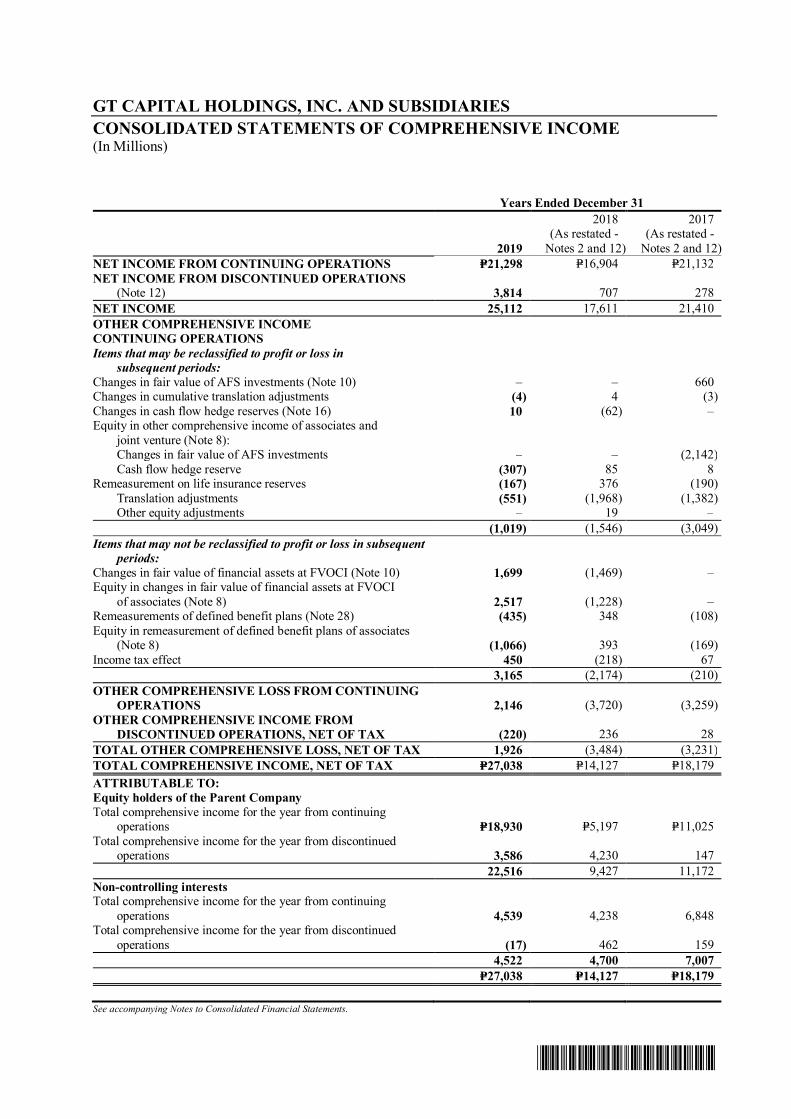
*SGVFSM000264*
GT CAPITAL HOLDINGS, INC. AND SUBSIDIARIESCONSOLIDATED STATEMENTS OF COMPREHENSIVE INCOME(In Millions)
See accompanying Notes to Consolidated Financial Statements.
Years Ended December 31
2019
2018(As restated -
Notes 2 and 12)
2017(As restated -
Notes 2 and 12)NET INCOME FROM CONTINUING OPERATIONS P=21,298 P=16,904 P=21,132NET INCOME FROM DISCONTINUED OPERATIONS
(Note 12) 3,814 707 278NET INCOME 25,112 17,611 21,410OTHER COMPREHENSIVE INCOMECONTINUING OPERATIONSItems that may be reclassified to profit or loss in
subsequent periods:Changes in fair value of AFS investments (Note 10) – – 660Changes in cumulative translation adjustments (4) 4 (3)Changes in cash flow hedge reserves (Note 16) 10 (62) –Equity in other comprehensive income of associates and joint venture (Note 8):
Changes in fair value of AFS investments – – (2,142) Cash flow hedge reserve (307) 85 8Remeasurement on life insurance reserves (167) 376 (190) Translation adjustments (551) (1,968) (1,382)
Other equity adjustments – 19 –(1,019) (1,546) (3,049)
Items that may not be reclassified to profit or loss in subsequentperiods:
Changes in fair value of financial assets at FVOCI (Note 10) 1,699 (1,469) –Equity in changes in fair value of financial assets at FVOCI
of associates (Note 8) 2,517 (1,228) –Remeasurements of defined benefit plans (Note 28) (435) 348 (108)Equity in remeasurement of defined benefit plans of associates
(Note 8) (1,066) 393 (169)Income tax effect 450 (218) 67
3,165 (2,174) (210)OTHER COMPREHENSIVE LOSS FROM CONTINUING
OPERATIONS 2,146 (3,720) (3,259)OTHER COMPREHENSIVE INCOME FROM
DISCONTINUED OPERATIONS, NET OF TAX (220) 236 28TOTAL OTHER COMPREHENSIVE LOSS, NET OF TAX 1,926 (3,484) (3,231)TOTAL COMPREHENSIVE INCOME, NET OF TAX P=27,038 P=14,127 P=18,179ATTRIBUTABLE TO:Equity holders of the Parent CompanyTotal comprehensive income for the year from continuing
operations P=18,930 P=5,197 P=11,025Total comprehensive income for the year from discontinued
operations 3,586 4,230 14722,516 9,427 11,172
Non-controlling interestsTotal comprehensive income for the year from continuing
operations 4,539 4,238 6,848Total comprehensive income for the year from discontinued
operations (17) 462 1594,522 4,700 7,007
P=27,038 P=14,127 P=18,179
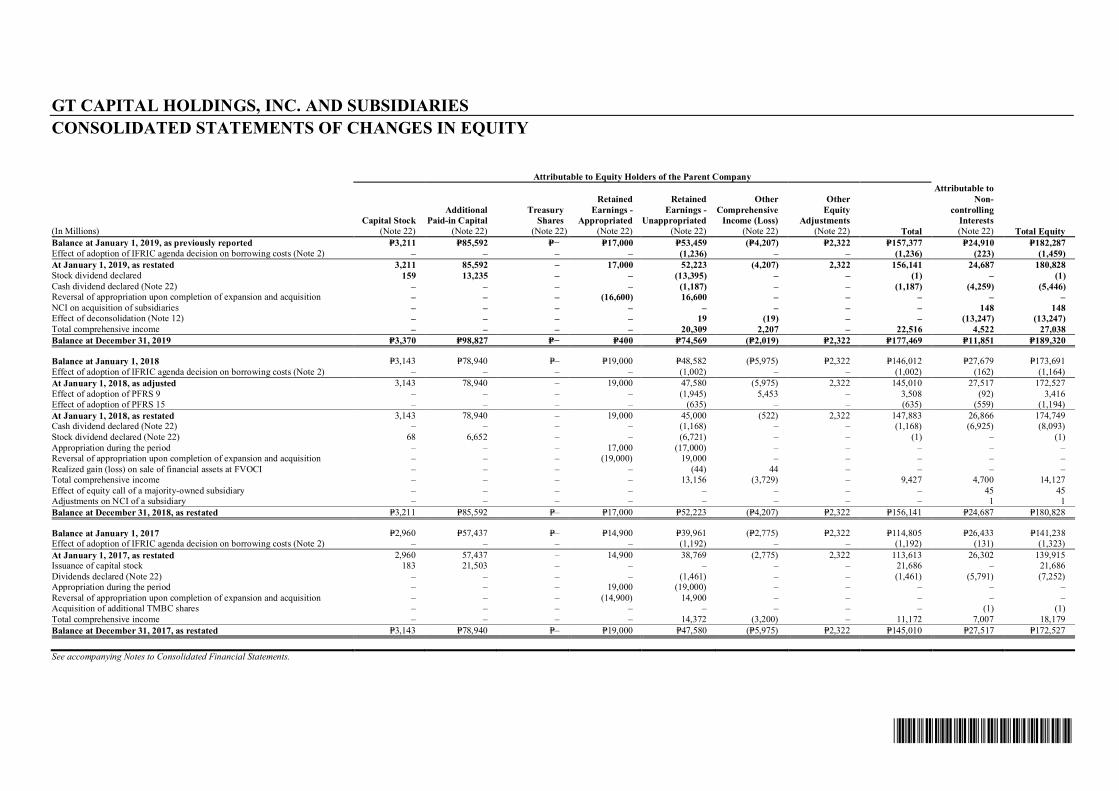
*SGVFSM000264*
GT CAPITAL HOLDINGS, INC. AND SUBSIDIARIESCONSOLIDATED STATEMENTS OF CHANGES IN EQUITY
Attributable to Equity Holders of the Parent Company
(In Millions)Capital Stock
(Note 22)
AdditionalPaid-in Capital
(Note 22)
TreasuryShares
(Note 22)
RetainedEarnings -
Appropriated(Note 22)
RetainedEarnings -
Unappropriated(Note 22)
OtherComprehensive
Income (Loss)(Note 22)
OtherEquity
Adjustments(Note 22) Total
Attributable toNon-
controllingInterests(Note 22) Total Equity
Balance at January 1, 2019, as previously reported P=3,211 P=85,592 P=− P=17,000 P=53,459 (P=4,207) P=2,322 P=157,377 P=24,910 P=182,287Effect of adoption of IFRIC agenda decision on borrowing costs (Note 2) – – – – (1,236) – – (1,236) (223) (1,459)At January 1, 2019, as restated 3,211 85,592 – 17,000 52,223 (4,207) 2,322 156,141 24,687 180,828Stock dividend declared 159 13,235 – – (13,395) – – (1) – (1)Cash dividend declared (Note 22) – – – – (1,187) – – (1,187) (4,259) (5,446)Reversal of appropriation upon completion of expansion and acquisition – – – (16,600) 16,600 – – – – –NCI on acquisition of subsidiaries – – – – – – – – 148 148Effect of deconsolidation (Note 12) – – – – 19 (19) – – (13,247) (13,247)Total comprehensive income – – – – 20,309 2,207 – 22,516 4,522 27,038Balance at December 31, 2019 P=3,370 P=98,827 P=− P=400 P=74,569 (P=2,019) P=2,322 P=177,469 P=11,851 P=189,320
Balance at January 1, 2018 P=3,143 P=78,940 P=– P=19,000 P=48,582 (P=5,975) P=2,322 P=146,012 P=27,679 P=173,691Effect of adoption of IFRIC agenda decision on borrowing costs (Note 2) – – – – (1,002) – – (1,002) (162) (1,164)At January 1, 2018, as adjusted 3,143 78,940 – 19,000 47,580 (5,975) 2,322 145,010 27,517 172,527Effect of adoption of PFRS 9 – – – – (1,945) 5,453 – 3,508 (92) 3,416Effect of adoption of PFRS 15 – – – – (635) – – (635) (559) (1,194)At January 1, 2018, as restated 3,143 78,940 – 19,000 45,000 (522) 2,322 147,883 26,866 174,749Cash dividend declared (Note 22) – – – – (1,168) – – (1,168) (6,925) (8,093)Stock dividend declared (Note 22) 68 6,652 – – (6,721) – – (1) – (1)Appropriation during the period – – – 17,000 (17,000) – – – – –Reversal of appropriation upon completion of expansion and acquisition – – – (19,000) 19,000 – – – – –Realized gain (loss) on sale of financial assets at FVOCI – – – – (44) 44 – – – –Total comprehensive income – – – – 13,156 (3,729) – 9,427 4,700 14,127Effect of equity call of a majority-owned subsidiary – – – – – – – – 45 45Adjustments on NCI of a subsidiary – – – – – – – – 1 1Balance at December 31, 2018, as restated P=3,211 P=85,592 P=– P=17,000 P=52,223 (P=4,207) P=2,322 P=156,141 P=24,687 P=180,828
Balance at January 1, 2017 P=2,960 P=57,437 P=– P=14,900 P=39,961 (P=2,775) P=2,322 P=114,805 P=26,433 P=141,238Effect of adoption of IFRIC agenda decision on borrowing costs (Note 2) – – – – (1,192) – – (1,192) (131) (1,323)At January 1, 2017, as restated 2,960 57,437 – 14,900 38,769 (2,775) 2,322 113,613 26,302 139,915Issuance of capital stock 183 21,503 – – – – – 21,686 – 21,686Dividends declared (Note 22) – – – – (1,461) – – (1,461) (5,791) (7,252)Appropriation during the period – – – 19,000 (19,000) – – – – –Reversal of appropriation upon completion of expansion and acquisition – – – (14,900) 14,900 – – – – –Acquisition of additional TMBC shares – – – – – – – – (1) (1)Total comprehensive income – – – – 14,372 (3,200) – 11,172 7,007 18,179Balance at December 31, 2017, as restated P=3,143 P=78,940 P=– P=19,000 P=47,580 (P=5,975) P=2,322 P=145,010 P=27,517 P=172,527
See accompanying Notes to Consolidated Financial Statements.
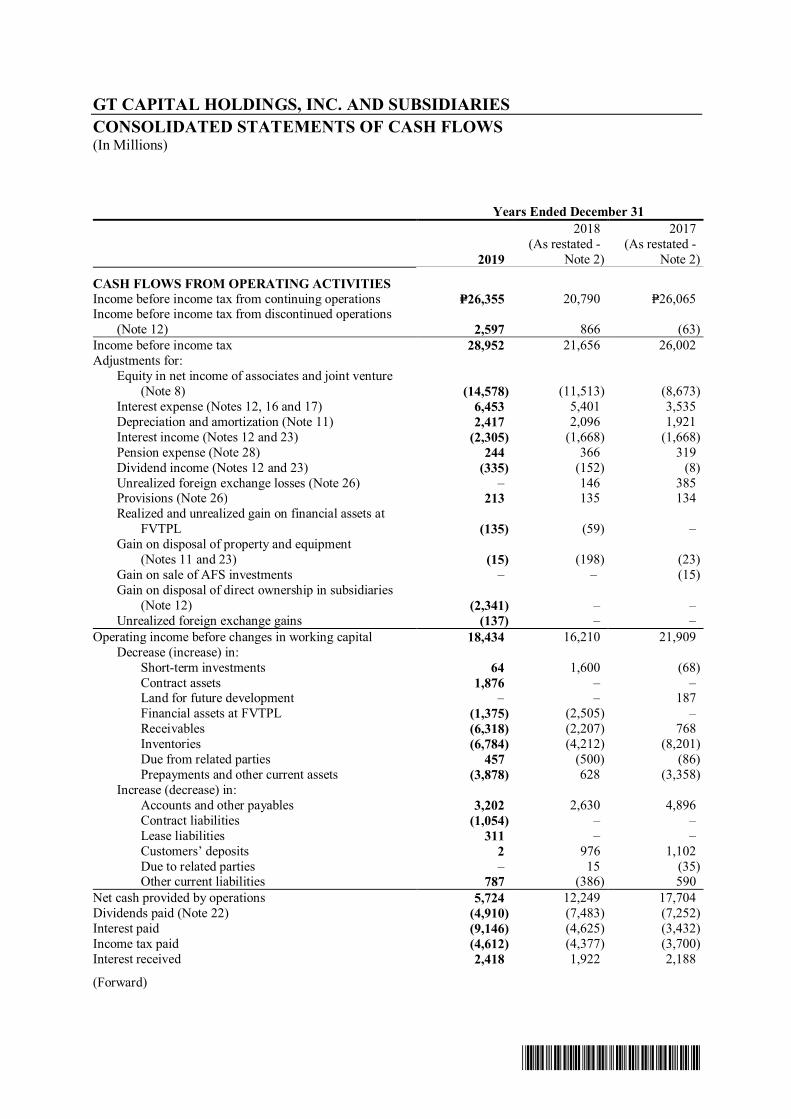
*SGVFSM000264*
GT CAPITAL HOLDINGS, INC. AND SUBSIDIARIESCONSOLIDATED STATEMENTS OF CASH FLOWS(In Millions)
Years Ended December 31
2019
2018(As restated -
Note 2)
2017(As restated -
Note 2)
CASH FLOWS FROM OPERATING ACTIVITIESIncome before income tax from continuing operations P=26,355 20,790 P=26,065Income before income tax from discontinued operations
(Note 12) 2,597 866 (63)Income before income tax 28,952 21,656 26,002Adjustments for: Equity in net income of associates and joint venture (Note 8) (14,578) (11,513) (8,673) Interest expense (Notes 12, 16 and 17) 6,453 5,401 3,535 Depreciation and amortization (Note 11) 2,417 2,096 1,921 Interest income (Notes 12 and 23) (2,305) (1,668) (1,668) Pension expense (Note 28) 244 366 319 Dividend income (Notes 12 and 23) (335) (152) (8) Unrealized foreign exchange losses (Note 26) – 146 385
Provisions (Note 26) 213 135 134 Realized and unrealized gain on financial assets at
FVTPL (135) (59) – Gain on disposal of property and equipment
(Notes 11 and 23) (15) (198) (23) Gain on sale of AFS investments – – (15) Gain on disposal of direct ownership in subsidiaries (Note 12) (2,341) – – Unrealized foreign exchange gains (137) – –Operating income before changes in working capital 18,434 16,210 21,909 Decrease (increase) in: Short-term investments 64 1,600 (68) Contract assets 1,876 – –
Land for future development – – 187 Financial assets at FVTPL (1,375) (2,505) – Receivables (6,318) (2,207) 768 Inventories (6,784) (4,212) (8,201) Due from related parties 457 (500) (86) Prepayments and other current assets (3,878) 628 (3,358) Increase (decrease) in: Accounts and other payables 3,202 2,630 4,896 Contract liabilities (1,054) – – Lease liabilities 311 – – Customers’ deposits 2 976 1,102 Due to related parties – 15 (35)
Other current liabilities 787 (386) 590Net cash provided by operations 5,724 12,249 17,704Dividends paid (Note 22) (4,910) (7,483) (7,252)Interest paid (9,146) (4,625) (3,432)Income tax paid (4,612) (4,377) (3,700)Interest received 2,418 1,922 2,188
(Forward)
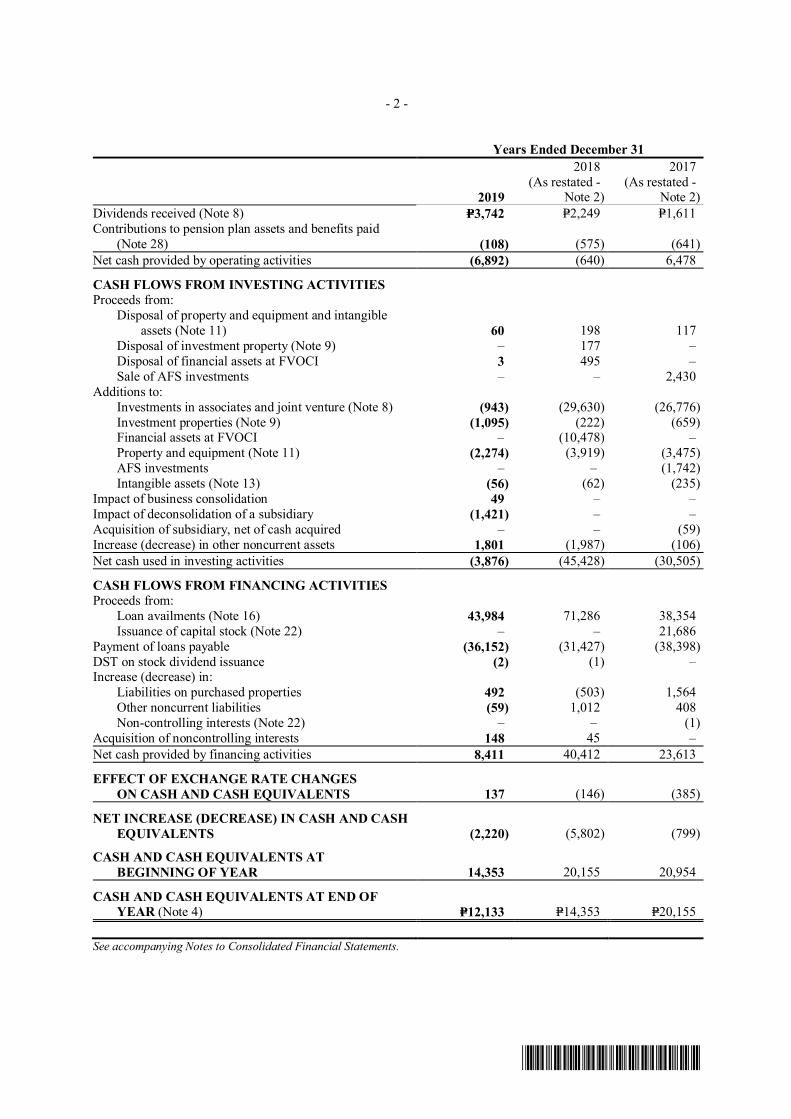
*SGVFSM000264*
- 2 -
Years Ended December 31
2019
2018(As restated -
Note 2)
2017(As restated -
Note 2)Dividends received (Note 8) P=3,742 P=2,249 P=1,611Contributions to pension plan assets and benefits paid
(Note 28) (108) (575) (641)Net cash provided by operating activities (6,892) (640) 6,478
CASH FLOWS FROM INVESTING ACTIVITIESProceeds from: Disposal of property and equipment and intangible assets (Note 11) 60 198 117 Disposal of investment property (Note 9) – 177 – Disposal of financial assets at FVOCI 3 495 – Sale of AFS investments – – 2,430Additions to: Investments in associates and joint venture (Note 8) (943) (29,630) (26,776) Investment properties (Note 9) (1,095) (222) (659)
Financial assets at FVOCI – (10,478) – Property and equipment (Note 11) (2,274) (3,919) (3,475) AFS investments – – (1,742) Intangible assets (Note 13) (56) (62) (235)Impact of business consolidation 49 – –Impact of deconsolidation of a subsidiary (1,421) – –Acquisition of subsidiary, net of cash acquired – – (59)Increase (decrease) in other noncurrent assets 1,801 (1,987) (106)Net cash used in investing activities (3,876) (45,428) (30,505)
CASH FLOWS FROM FINANCING ACTIVITIESProceeds from: Loan availments (Note 16) 43,984 71,286 38,354 Issuance of capital stock (Note 22) – – 21,686Payment of loans payable (36,152) (31,427) (38,398)DST on stock dividend issuance (2) (1) –Increase (decrease) in: Liabilities on purchased properties 492 (503) 1,564 Other noncurrent liabilities (59) 1,012 408 Non-controlling interests (Note 22) – – (1)Acquisition of noncontrolling interests 148 45 –Net cash provided by financing activities 8,411 40,412 23,613
EFFECT OF EXCHANGE RATE CHANGESON CASH AND CASH EQUIVALENTS 137 (146) (385)
NET INCREASE (DECREASE) IN CASH AND CASHEQUIVALENTS (2,220) (5,802) (799)
CASH AND CASH EQUIVALENTS ATBEGINNING OF YEAR 14,353 20,155 20,954
CASH AND CASH EQUIVALENTS AT END OFYEAR (Note 4) P=12,133 P=14,353 P=20,155
See accompanying Notes to Consolidated Financial Statements.
*SGVFSM000264*
GT CAPITAL HOLDINGS, INC. AND SUBSIDIARIESNOTES TO CONSOLIDATED FINANCIAL STATEMENTS
1. Corporate Information
GT Capital Holdings, Inc. (GT Capital or the Parent Company) was organized and registered withthe Philippine Securities and Exchange Commission (SEC) on July 26, 2007. The primary purposeof the Parent Company is to invest in, purchase, or otherwise acquire and own, hold, use, sell,assign, transfer, lease, mortgage, exchange, develop or otherwise dispose of real property of everykind and description, including shares of stocks, bonds, debentures, notes, evidences ofindebtedness, and other securities or obligations of any corporation or corporations, associations,domestic or foreign, and to possess and exercise in respect thereof all the rights, powers andprivileges of ownership, including all voting powers of any stock so owned.
The common shares of the Parent Company were listed beginning April 20, 2012 and have sincebeen traded in the Philippine Stock Exchange, Inc. (PSE).
Group ActivitiesThe Parent Company, Federal Land, Inc. (Federal Land) and Subsidiaries (Federal Land Group),Toyota Motor Philippines Corporation (Toyota or TMPC) and Subsidiaries (Toyota Group),Toyota Manila Bay Corp. (TMBC) and Subsidiary (TMBC Group) and GT Capital AutoDealership Holdings, Inc. (GTCAD) and Subsidiary are collectively referred herein as the“Group”. The Parent Company, which is the ultimate parent of the Group, the holding company ofthe Federal Land Group (real estate business), Toyota Group (automotive business), TMBC Group(automotive business) and GTCAD (automotive business) is engaged in investing, purchasing andholding shares of stock, notes and other securities and obligations.
The principal business interests of the Federal Land Group are real estate development and leasingand selling properties and acting as a marketing agent for and in behalf of any real estatedevelopment company or companies. The Federal Land Group is also engaged in the business oftrading of goods such as petroleum, non-fuel products on wholesale or retail basis, maintaining apetroleum service station and food and restaurant service.
Toyota Group is engaged in the assembly, manufacture, importation, sale and distribution of allkinds of motor vehicles including vehicle parts, accessories and instruments.
TMBC Group is engaged in purchasing, trading, exchanging, distributing, marketing, repairing andservicing automobiles, trucks and all kinds of motor vehicles and automobile products of everykind and description, motor vehicle parts, accessories, tools and supplies and equipment items.
The principal business interests of GTCAD are to invest in, purchase, or otherwise acquire andown, hold, use, sell, assign, transfer, lease, mortgage, exchange, develop, or otherwise dispose ofreal or personal property of every kind and description, including shares of stocks, bonds,debentures, notes, evidences of indebtedness, and other securities or obligations of any autodealership or other corporations, associations, domestic or foreign, and to possess and exercise inrespect thereof all the rights, powers and privileges of ownership, including all voting powers ofany stock so owned.
- 2 -
*SGVFSM000264*
The Parent Company also has significant shareholdings in Metropolitan Bank & Trust Company(MBTC or Metrobank), Metro Pacific Investments Corporation (MPIC), Philippine AXA LifeInsurance Corporation (AXA Philippines or Phil AXA), Toyota Financial Services PhilippinesCorporation (TFSPC) and Sumisho Motor Finance Corporation (SMFC).
The registered office address of the Parent Company is at the 43rd Floor, GT Tower International,Ayala Avenue corner H.V. Dela Costa Street, 1227 Makati City.
2. Summary of Significant Accounting Policies
Basis of PreparationThe accompanying consolidated financial statements of the Group have been prepared using thehistorical cost basis except for financial assets at fair value through profit or loss (FVTPL),financial assets at fair value through other comprehensive income (FVOCI), available-for-sale(AFS) investments and derivative financial instruments that have been measured at fair value. TheGroup’s consolidated financial statements are presented in Philippine Peso (P=), the ParentCompany’s functional currency. All values are rounded to the nearest million peso unlessotherwise indicated.
Statement of ComplianceThe consolidated financial statements of the Group have been prepared in compliance withPhilippine Financial Reporting Standards (PFRSs). PFRSs include Philippine Financial ReportingStandards, Philippine Accounting Standards (PAS) and Interpretations issued by the PhilippineInterpretations Committee (PIC).
Basis of ConsolidationThe consolidated financial statements of the Group comprise the financial statements of the ParentCompany and the following wholly and majority-owned domestic subsidiaries:
Direct Percentages ofOwnership
Effective Percentages ofOwnership
Country of December 31 December 31Incorporation 2019 2018 2019 2018
Federal Land and Subsidiaries Philippines 100.00 100.00 100.00 100.00Toyota and Subsidiaries -do- 51.00 51.00 51.00 51.00TMBC and Subsidiaries -do- 58.10 58.10 58.10 58.10GTCAD and Subsidiaries -do- 100.00 100.00 100.00 100.00PCFI and Subsidiaries -do- – 51.00 – 51.00
Federal Land’s Subsidiaries
Percentages of Ownership2019 2018
Horizon Land Property and Development Corp. (HLPDC) 100.00 100.00Federal Property Management Corp. (FPMC)* 100.00 100.00Federal Land Orix Corporation (FLOC) 100.00 100.00Topsphere Realty Development Company Inc. (TRDCI) 100.00 100.00Bonifacio Landmark Hotel Management Corporation (BLHMC) 100.00 100.00Fed South Dragon Corporation (FSDC) 100.00 100.00Federal Retail Holdings, Inc. (FRHI)** 100.00 –Magnificat Resources Corp. (MRC)*** 100.00 49.10Central Realty and Development Corp. (CRDC) 75.80 75.80Federal Brent Retail, Inc. (FBRI) 51.66 51.66* Formerly Omni Orient Management Corp. Amended Articles of Incorporation was approved by the SEC on October 25, 2019.** On April 30, 2019, FRHI was incorporated and has not started its commercial business operations.*** In September 2019, the Group increased ownership from 49.10% to 100.00% thereby obtaining control over Magnificat.
- 3 -
*SGVFSM000264*
Toyota’s Subsidiaries
Percentages of Ownership2019 2018
Toyota Makati, Inc. (TMI) 100.00 100.00Toyota Sta. Rosa Laguna, Inc. (TSRLI) 100.00 100.00Toyota Motor Philippines Logistics, Inc. (TLI) 100.00 100.00Lexus Manila, Inc. (LMI) 75.00 75.00Toyota San Fernando Pampanga, Inc. (TSFI) 55.00 55.00
TMBC’s Subsidiaries
Percentages of Ownership2019 2018
Oxfordshire Holdings, Inc. (OHI) 100.00 100.00TMBC Insurance Agency Corporation (TIAC) 100.00 100.00
GTCAD’s Subsidiaries
Percentages of Ownership2019 2018
GT Mobility Ventures, Inc. (GTMV)* 66.67 –Toyota Subic, Inc. (TSI) 55.00 55.00* On January 31, 2019, GTMV was incorporated and has not started its commercial business operations.
On September 9, 2019, the SEC approved GTMV’s increase in authorized capital stock, from1,000,000 shares with par value of P=1.00 per share to 600,000,000 shares with par value ofP=1.00 per share. GTCAD and Mitsui & Co. Ltd. (Mitsui) have subscribed to the increase in theauthorized capital stock of GTMV and has paid for such subscription amounting to P=99.75 millionand P=50.00 million, respectively. This resulted to a change in GTCAD’s direct holdings in GTMVfrom 100% to 66.67%.
In February 2019, the Parent Company remitted P=100.00 million to GTCAD to fund the latter’sinvestment in a used car auction business which had been completed in March 2019. GTCAD,through GTMV, a joint venture between the Company and Mitsui, formed JBA Philippines withauction house operator Japan Bike Auction Co., Ltd. (“JBA”). 60% of JBA Philippines will becontrolled by GTMV while 40% will be owned by JBA.
PCFI’s Subsidiaries
Percentages of Ownership2019* 2018
Micara Land, Inc. (MLI) – 100.00Firm Builders Realty Development Corporation (FBRDC) – 100.00Marcan Development Corporation (MDC) – 100.00Camarillo Development Corporation (CDC) – 100.00Branchton Development Corporation (BDC) – 100.00Williamton Financing Corporation (WFC) – 100.00* In July 2019, PCFI redeeemed its preferred shares and PCFI ceased to be a subsidiary of the Parent Company.Accordingly, the financial statements of PCFI were deconsolidated from the consolidated financial statements of the Group (Note 12).
- 4 -
*SGVFSM000264*
Subsidiaries are fully consolidated from the date of acquisition, being the date on which the Groupobtains control, and continue to be consolidated until the date when such control ceases. Control isachieved when the Parent Company is exposed, or has rights, to variable returns from itsinvolvement with the investee and has the ability to affect those returns through its power over theinvestee. Consolidation of subsidiaries ceases when control is transferred out of the ParentCompany.
Specifically, the Parent Company controls an investee if, and only if, the Parent Company has:
· power over the investee (i.e., existing rights that give it the current ability to direct the relevantactivities of the investee);
· exposure or rights to variable returns from its involvement with the investee; and· the ability to use its power over the investee to affect its returns.
When the Group has less than a majority of the voting or similar rights of an investee, the Groupconsiders all relevant facts and circumstances in assessing whether it has power over an investee,including:
i. the contractual arrangement with the other vote holders of the investeeii. rights arising from other contractual arrangementsiii. the Group’s voting rights and potential voting rights
The Group reassesses whether or not it controls an investee if facts and circumstances indicate thatthere are changes to one or more of the three elements of control.
The financial statements of the subsidiaries are prepared for the same reporting period as the ParentCompany, using consistent accounting policies. All intragroup transactions, balances, income andexpenses resulting from intragroup transactions and dividends are eliminated in full onconsolidation.
Non-controlling interests (NCI) represent the portion of profit or loss and net assets in a subsidiarynot attributed, directly or indirectly, to the Parent Company. The interest of non-controllingshareholders may be initially measured at fair value or share of the acquiree’s identifiable netassets. The choice of measurement basis is made on an acquisition-by-acquisition basis.Subsequent to acquisition, NCI consists of the amount attributed to such interests at initialrecognition and the NCI’s share of changes in equity since the date of combination.
NCI are presented separately in the consolidated statement of income, consolidated statement ofcomprehensive income, consolidated statement of changes in equity and within equity in theconsolidated statement of financial position, separately from the Parent Company’s equity.Profit or loss and each component of other comprehensive income (OCI) are attributed to theequity holders of the Parent Company and to the NCI, even if that results in the NCI having adeficit balance.
If the Group loses control over a subsidiary, it:
· derecognizes the assets (including goodwill) and liabilities of the subsidiary, the carryingamount of any NCI and the cumulative translation differences, recorded in equity;
· recognizes the fair value of the consideration received, the fair value of any investmentretained and any surplus or deficit in profit or loss; and
- 5 -
*SGVFSM000264*
· reclassifies the Parent Company’s share of components previously recognized in othercomprehensive income to profit or loss or retained earnings, as appropriate, as would berequired if the Group had directly disposed of the related assets or liabilities.
Business Combinations Involving Entities Under Common ControlA business combination involving entities under common control is accounted for using the unitingof interest method, except when the acquisition is deemed to have commercial substance for theGroup, in which case the business combination is accounted for under the acquisition method. Thecombined entities accounted for by the uniting of interests method reports the results of operationsfor the period in which the combination occurs as though the entities had been combined as of thebeginning of the period. Financial statements of the separate entities presented for prior years arealso restated on a combined basis to provide comparative information. The effects ofintercompany transactions on assets, liabilities, revenues, and expenses for the periods presented,and on retained earnings at the beginning of the periods presented are eliminated to the extentpossible.
Under the uniting of interest method, the acquirer accounts for the combination as follows:
· the assets and liabilities of the acquiree are consolidated using the existing carrying valuesinstead of fair values;
· intangible assets and contingent liabilities are recognized only to the extent that they wererecognized by the acquiree in accordance with applicable PFRSs;
· no amount is recognized as goodwill;· any non-controlling interest is measured as a proportionate share of the book values of the
related assets and liabilities; and· comparative amounts are restated as if the combination had taken place at the beginning of the
earliest comparative period presented.
The excess of the cost of business combinations over the net carrying amounts of the assets andliabilities of the acquired companies is recognized within the equity section of the consolidatedstatements of financial position.
When evaluating whether an acquisition has commercial substance, the Group considers thefollowing factors, among others:
· the purpose of the transaction;· the involvement of outside parties in the transaction, such as NCI or other third parties; and· whether or not the transaction is conducted at fair value.
Business Combinations and GoodwillBusiness combinations are accounted for using the acquisition method. The cost of an acquisitionis measured as the aggregate of the fair values, at the date of exchange, of assets given, liabilitiesincurred or assumed, and equity instruments issued by the Group in exchange for control of theacquiree. For each business combination, the acquirer elects whether to measure the NCI in theacquiree either at fair value or at the proportionate share of the acquiree’s identifiable net assets atthe date of acquisition. Acquisition-related costs are expensed and included in the consolidatedstatements of income.
When the Group acquires a business, it assesses the financial assets and liabilities of the acquireefor appropriate classification and designation in accordance with the contractual terms, economiccircumstances and pertinent conditions as at the acquisition date. This includes the separation of
- 6 -
*SGVFSM000264*
embedded derivatives in host contracts by the acquiree. The Group also assesses whether assets orliabilities of the acquiree that are previously unrecognized in the books of the acquiree will requireseparate recognition in the consolidated financial statements of the Group at the acquisition date.
In a business combination achieved in stages, the Group remeasures its previously held equityinterest in the acquiree at its acquisition-date fair value and recognizes the resulting gain or loss, ifany, in the consolidated statements of income. Any recognized changes in the value of its equityinterest in the acquiree previously recognized in other comprehensive income are recognized by theGroup in profit or loss, as if the previously held equity interest are disposed of.
Any contingent consideration to be transferred by the acquirer will be recognized at fair value atthe acquisition date. Subsequent changes to the fair value of the contingent consideration which isdeemed to be an asset or liability will be recognized either in the consolidated statements ofincome or as changes to other comprehensive income. If the contingent consideration is classifiedas equity, it shall not be remeasured until it is finally settled within equity.
If the initial accounting for a business combination is incomplete by the end of the reporting periodin which the combination occurs, the Group reports provisional amounts for the items for whichthe accounting incomplete. Those provisional amounts are adjusted during the measurementperiod, or additional assets or liabilities are recognized, to reflect new information obtained aboutfacts and circumstances that existed as at the acquisition date that if known, would have affectedthe amounts recognized as at that date. The measurement period is the period from the date ofacquisition to the date the Group receives complete information about facts and circumstances thatexisted as at the acquisition date and is subject to a maximum of one (1) year.
Goodwill is initially measured as the excess of the aggregate of the consideration transferred, theamount recognized for any NCI in the acquiree and the fair value of the acquirer’s previously heldinterest, if any, over the fair value of the net assets acquired.
If after reassessment, the fair value of the net assets acquired exceeds the consideration transferred,the amount recognized for any NCI in the acquiree and the fair value of the acquirer’s previouslyheld interest, if any, the difference is recognized immediately in the consolidated statements ofincome as ‘Gain on bargain purchase’.
After initial recognition, goodwill is measured at cost less any accumulated impairment losses.Any impairment loss is recognized immediately in the consolidated statements of income and isnot subsequently reversed. For the purpose of impairment testing, goodwill acquired in a businesscombination is allocated to each of the Group’s cash-generating units (CGU) that are expected tobenefit from the combination from the acquisition date irrespective of whether other assets orliabilities of the acquiree are assigned to those units.
Goodwill is not amortized but is reviewed for impairment at least annually. Any impairment lossesare recognized immediately in profit of loss and is not subsequently reversed.
Where goodwill forms part of a CGU and part of the operation within that unit is disposed of, thegoodwill associated with the operation disposed of is included in the carrying amount of theoperation when determining the gain or loss on disposal of the operation. Goodwill disposed of inthis circumstance is measured based on the relative values of the operation disposed of and theportion of the CGU retained.
- 7 -
*SGVFSM000264*
Change in Ownership without Loss of ControlChanges in the Group’s ownership interest in a subsidiary that do not result in a loss of control areaccounted for as equity transactions. In such circumstances, the carrying amounts of thecontrolling and NCI are adjusted by the Group to reflect the changes in its relative interests in thesubsidiary. Any difference between the amount by which the NCI is adjusted and the fair value ofthe consideration paid or received is recognized directly in equity and attributed to the equityholders of the Parent Company.
Changes in Accounting Policies and DisclosuresThe accounting policies adopted in preparation of the consolidated financial statements areconsistent with those of the previous year except for the following new and amended PFRSs andPAS which were adopted as of January 1, 2019.
Except as otherwise indicated, the following new and amended standards did not have a materialimpact on the accounting policies, financial position or performance of the Group.
New Standards
PFRS 16, LeasesThe Group applied the standard for the first time. It supersedes PAS 17, Leases, PhilippineInterpretation IFRIC 4, Determining Whether an Arrangement Contains a Lease, SIC-15,Operating Leases – Incentives, and SIC-27, Evaluating the Substance of Transactions Involvingthe Legal Form of a Lease. The standard sets out the principles for the recognition, measurement,presentation and disclosure of leases and requires lesses to account for most leases under a singleon-balance sheet model. The Group adopted the modified retrospective approach with certaintransition reliefs with the date of initial application of January 1, 2019 and applied the followingpractical expedients wherein it:
a. Applied the standard only to contracts that were previously identified as leases, applying theold standards at the date of initial application;
b. Used the recognition exemptions for short-term leases and lease contracts for low value assets;c. Relied on its assessement of whether leases are onerous immediately before the date of initial
application; andd. Excluded the initial direct costs from the measurement of the right-of-use asset at the date
ofinitial application.
The reconciliation of the operating lease commitments to the total gross lease payments used in themeasurement of the lease liabilities are as follows (in millions):
Operating lease commitments as of December 31, 2018 P=408Add: Lease payments relating to renewal periods not included in operating
lease commitments as of December 31, 2018 –Less: Lease payments pertaining to leases of short-term and low-value
assets –Operating lease commitments not considered on lease term –Total gross future lease payments as of January 1, 2019 P=408Weighted average incremental borrowing rate 5.00% - 9.02 %Lease liability as of January 1, 2019 P=393
Except for the additional disclosures required, PFRS 16 has no impact for leases where the Groupis the lessor.
- 8 -
*SGVFSM000264*
The Group has lease contracts for various office spaces. Prior to 2019, the Group classified each ofits leases (as lessee) at the inception date as either a finance lease or an operating lease. A leasewas classified as a finance lease if it transferred substantially all of the risks and rewards incidentalto ownership of the lease asset to the Group; otherwise it was classified as an operating lease. Allleases (as lessee) were classified as operating leases. In an operating lease, the leased property wasnot capitalized and the lease payments were recognized as rent expense under ‘General andAdministrative Expenses’ in the statement s of income on a straight-line basis over the lease term.Any prepaid rent and accrued rent were recognized under ‘Prepaid expenses’ and ‘Accrued otherexpenses’, respectively.
Effective January 1, 2019, the Group applied a single recognition and measurement approach forall leases (as lessee) except for short-term leases and leases of low-value assets. The Grouprecognized lease liabilities representing lease payments and right-of-use (ROU) assets representingthe right to use the underlying assets. Lease liabilities were recognized based on the present valueof the remaining lease payments, discounted using the incremental borrowing rate (IBR) at the dateof initial application. ROU assets were recognized based on the amount equal to the lease liabilitiesadjusted for any related prepaid and accrued lease payments previously recognized.
Based on the foregoing, as of January 1, 2019, the Group recognized ROU assets ofP=393.04 million (presented under ‘Property and equipment’); lease liability of P=392.13 million;and derecognized accrued rent expense of P=0.91 million related to previous operating leases.
Amendments
· Amendments to PFRS 9, Prepayment Features with Negative CompensationUnder PFRS 9, a debt instrument can be measured at amortized cost or at fair value throughother comprehensive income, provided that the contractual cash flows are ‘solely payments ofprincipal and interest on the principal amount outstanding’ (the SPPI criterion) and theinstrument is held within the appropriate business model for that classification. Theamendments to PFRS 9 clarify that a financial asset passes the SPPI criterion regardless of theevent or circumstance that causes the early termination of the contract and irrespective ofwhich party pays or receives reasonable compensation for the early termination of the contract.
· Amendments to PAS 28, Long-term Interests in Associates and Joint VenturesThe amendments clarify that an entity applies PFRS 9 to long-term interests in an associate orjoint venture to which the equity method is not applied but that, in substance, form part of thenet investment in the associate or joint venture (long-term interests). This clarification isrelevant because it implies that the expected credit loss model in PFRS 9 applies to such long-term interests.
The amendments also clarified that, in applying PFRS 9, an entity does not take account of anylosses of the associate or joint venture, or any impairment losses on the net investment,recognized as adjustments to the net investment in the associate or joint venture that arise fromapplying PAS 28, Investments in Associates and Joint Ventures.
· Amendments to PAS 19, Employee Benefits, Plan Amendment, Curtailment or SettlementThe amendments to PAS 19 address the accounting when a plan amendment, curtailment orsettlement occurs during a reporting period. The amendments specify that when a plan
- 9 -
*SGVFSM000264*
amendment, curtailment or settlement occurs during the annual reporting period, an entity isrequired to:
a. Determine current service cost for the remainder of the period after the plan amendment,curtailment or settlement, using the actuarial assumptions used to remeasure the netdefined benefit liability (asset) reflecting the benefits offered under the plan and the planassets after that event
b. Determine net interest for the remainder of the period after the plan amendment,curtailment or settlement using: the net defined benefit liability (asset) reflecting thebenefits offered under the plan and the plan assets after that event; and the discount rateused to remeasure that net defined benefit liability (asset).
The amendments also clarify that an entity first determines any past service cost, or a gain orloss on settlement, without considering the effect of the asset ceiling. This amount isrecognized in profit or loss. An entity then determines the effect of the asset ceiling after theplan amendment, curtailment or settlement. Any change in that effect, excluding amountsincluded in the net interest, is recognized in other comprehensive income.
· Annual Improvements to PFRSs 2015-2017 Cyclea. Amendments to PFRS 3, Business Combinations, and PFRS 11, Joint Arrangements,
Previously Held Interest in a Joint OperationThe amendments clarify that, when an entity obtains control of a business that is a jointoperation, it applies the requirements for a business combination achieved in stages,including remeasuring previously held interests in the assets and liabilities of the jointoperation at fair value. In doing so, the acquirer remeasures its entire previously heldinterest in the joint operation.
A party that participates in, but does not have joint control of, a joint operation mightobtain joint control of the joint operation in which the activity of the joint operationconstitutes a business as defined in PFRS 3. The amendments clarify that the previouslyheld interests in that joint operation are not remeasured.
b. Amendments to PAS 12, Income Tax Consequences of Payments on Financial InstrumentsClassified as EquityThe amendments clarify that the income tax consequences of dividends are linked moredirectly to past transactions or events that generated distributable profits than todistributions to owners. Therefore, an entity recognizes the income tax consequences ofdividends in profit or loss, other comprehensive income or equity according to where theentity originally recognized those past transactions or events.
c. Amendments to PAS 23, Borrowing Costs, Borrowing Costs Eligible for CapitalizationThe amendments clarify that an entity treats as part of general borrowings any borrowingoriginally made to develop a qualifying asset when substantially all of the activitiesnecessary to prepare that asset for its intended use or sale are complete.
Adoption of IFRIC Agenda Decision on Over Time Transfer of Constructed Goods(PAS 23, Borrowing Cost) for the Real Estate Industry
In March 2019, IFRIC published an Agenda Decision on whether borrowing costs can becapitalized on real estate inventories that are under construction and for which the relatedrevenue is/will be recognized over time under par. 35(c) of IFRS 15. IFRIC concluded that
- 10 -
*SGVFSM000264*
borrowing costs cannot be capitalized for such real estate inventories as they do not meetthe definition of a qualifying asset under IAS 23 considering that these inventories areready for their intended sale in their current condition.
The IFRIC agenda decision would change the Group’s current practice of capitalizingborrowing costs on real estate projects with pre-selling activities.
On February 11, 2020, the Philippine SEC issued Memorandum Circular No. 4, Series of2020, providing relief to the Real Estate Industry by deferring the implementation of theabove IFRIC Agenda Decision until December 31, 2020. Effective January 1, 2021, theReal Estate Industry will adopt the IFRIC agenda decision and any subsequentamendments thereto retrospectively or as the SEC will later prescribe. A real estatecompany may opt not to avail of the deferral and instead comply in full with therequirements of the IFRIC agenda decision.
For real estate companies that avail of the deferral, the SEC requires disclosure in theNotes to the Financial Statements of the accounting policies applied, a discussion of thedeferral of the subject implementation issues, and a qualitative discussion of the impact inthe financial statements had the IFRIC agenda decision been adopted.
The Group did not avail of the relief provided by the SEC and instead adopted the IFRICagenda decision retrospectively effective January 1, 2019.
A reconciliation between the carrying amounts under the old practice to the balancesreported is presented below (in millions):
December 31, 2019Before adoptionof IFRIC agenda
decision onborrowing cost
Effect ofIFRIC agenda
decision onborrowing costs As reported
Statement of Financial PositionAssetsCurrent AssetsInventories P=73,837 (P=1,648) P=72,189
Noncurrent AssetsInvestments and advances 178,096 (37) 178,059
LiabilitiesNoncurrent LiabilitiesDeferred tax liabilities 3,644 (506) 3,138
EquityRetained earnings – Unappropriated 75,748 (1,179) 74,569
Statement of Comprehensive IncomeRevenueEquity in net income of associates 14,615 (37) 14,578
Cost and ExpensesInterest expense 5,602 851 6,453Cost of real estate sales 5,977 (637) 5,340
Provision for income tax 5,132 (75) 5,057
- 11 -
*SGVFSM000264*
December 31, 2018
Aspreviously
reported
Effect ofIFRIC agenda
decision onborrowing costs As restated
Statement of Financial PositionAssetsCurrent AssetsInventories P=77,469 (P=2,080) P=75,389
Noncurrent AssetsInvestments and advances 163,739 (4) 163,735
LiabilitiesNoncurrent LiabilitiesDeferred tax liabilities 5,959 (625) 5,334
EquityRetained earnings – Unappropriated 53,459 (1, 236) 52,223Noncontrolling interests 24,910 (223) 24,687
Statement of Comprehensive IncomeRevenueEquity in net income of associates 11,517 (4) 11,513Real estate sales 18,508 (9,166) 9,342Interest income 2,082 (414) 1,668Rent income 1,257 (76) 1,181Other income 2,458 (334) 2,124
Cost and ExpensesGeneral and administrative expenses 14,040 (3,373) 10,667Interest expense 4,965 436 5,401Cost of real estate sales 12,609 (5,770) 6,839
Provision for income tax 4,171 (285) 3,886
January 1, 2018
As previously
reported
Effect ofIFRIC agenda
decision onborrowing costs As restated
Statement of Financial PositionAssetsCurrent AssetsInventories P=73,689 (P=1,637) P=72,052
Noncurrent AssetsInvestments and advances 128,627 (26) 128,601
LiabilitiesNoncurrent LiabilitiesDeferred tax liabilities 5,594 (499) 5,095
EquityRetained earnings – Unappropriated 46,002 (1,002) 45,000Noncontrolling interests 27,028 (162) 26,866
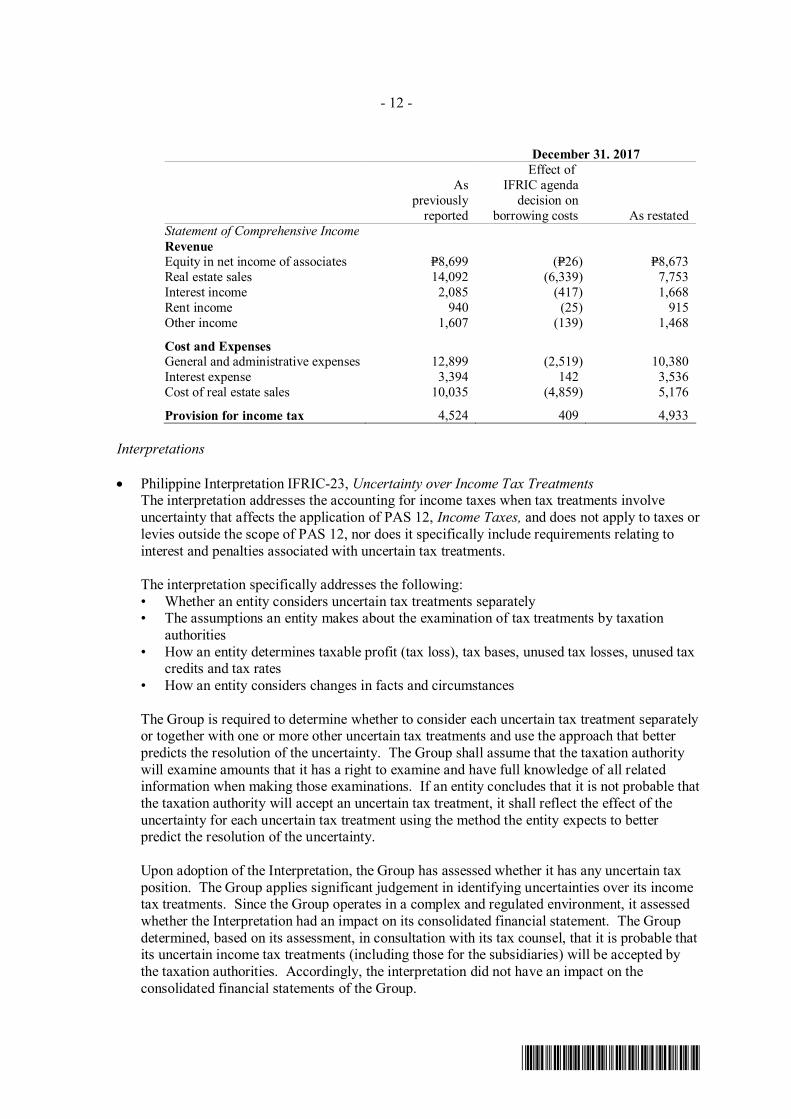
- 12 -
*SGVFSM000264*
December 31. 2017
As previously
reported
Effect ofIFRIC agenda
decision on borrowing costs As restated
Statement of Comprehensive IncomeRevenueEquity in net income of associates P=8,699 (P=26) P=8,673Real estate sales 14,092 (6,339) 7,753Interest income 2,085 (417) 1,668Rent income 940 (25) 915Other income 1,607 (139) 1,468
Cost and ExpensesGeneral and administrative expenses 12,899 (2,519) 10,380Interest expense 3,394 142 3,536Cost of real estate sales 10,035 (4,859) 5,176
Provision for income tax 4,524 409 4,933
Interpretations
· Philippine Interpretation IFRIC-23, Uncertainty over Income Tax TreatmentsThe interpretation addresses the accounting for income taxes when tax treatments involveuncertainty that affects the application of PAS 12, Income Taxes, and does not apply to taxes orlevies outside the scope of PAS 12, nor does it specifically include requirements relating tointerest and penalties associated with uncertain tax treatments.
The interpretation specifically addresses the following:• Whether an entity considers uncertain tax treatments separately• The assumptions an entity makes about the examination of tax treatments by taxation
authorities• How an entity determines taxable profit (tax loss), tax bases, unused tax losses, unused tax
credits and tax rates• How an entity considers changes in facts and circumstances
The Group is required to determine whether to consider each uncertain tax treatment separatelyor together with one or more other uncertain tax treatments and use the approach that betterpredicts the resolution of the uncertainty. The Group shall assume that the taxation authoritywill examine amounts that it has a right to examine and have full knowledge of all relatedinformation when making those examinations. If an entity concludes that it is not probable thatthe taxation authority will accept an uncertain tax treatment, it shall reflect the effect of theuncertainty for each uncertain tax treatment using the method the entity expects to betterpredict the resolution of the uncertainty.
Upon adoption of the Interpretation, the Group has assessed whether it has any uncertain taxposition. The Group applies significant judgement in identifying uncertainties over its incometax treatments. Since the Group operates in a complex and regulated environment, it assessedwhether the Interpretation had an impact on its consolidated financial statement. The Groupdetermined, based on its assessment, in consultation with its tax counsel, that it is probable thatits uncertain income tax treatments (including those for the subsidiaries) will be accepted bythe taxation authorities. Accordingly, the interpretation did not have an impact on theconsolidated financial statements of the Group.
- 13 -
*SGVFSM000264*
Significant Accounting Policies
Current versus Noncurrent ClassificationThe Group presents assets and liabilities in the consolidated statements of financial position basedon current/noncurrent classification. An asset is current when:
· It is expected to be realized or intended to be sold or consumed in normal operating cycle· It is held primarily for the purpose of trading· It is expected to be realized within twelve months after the reporting period
All other assets are classified as noncurrent.
A liability is current when:· It is expected to be settled in normal operating cycle· It is held primarily for the purpose of trading· It is due to be settled within twelve months after the reporting period or there is no
unconditional right to defer the settlement of liability for at least twelve months after thereporting period
The Group classifies all other liabilities as noncurrent.
Deferred income tax asset and liability are classified as noncurrent asset and liability, respectively.
Cash and Cash EquivalentsCash includes cash on hand and in banks. Cash equivalents are short-term, highly liquidinvestments that are readily convertible to known amounts of cash with original maturities of threemonths or less from dates of placement and that are subject to an insignificant risk of changes invalue.
Fair Value MeasurementFair value is the price that would be received to sell an asset or paid to transfer a liability in anorderly transaction between market participants at the measurement date. The fair valuemeasurement is based on the presumption that the transaction to sell the asset or transfer theliability takes place either:
· in the principal market for the asset or liability, or· in the absence of a principal market, in the most advantageous market for the asset or liability.
The principal or the most advantageous market must be accessible to the Group. The fair value ofan asset or a liability is measured using the assumptions that market participants would use whenpricing the asset or liability, assuming that market participants act in their best economic interest.
A fair value measurement of a non-financial asset takes into account a market participant's abilityto generate economic benefits by using the asset in its highest and best use or by selling it toanother market participant that would use the asset in its highest and best use.
The Group uses valuation techniques that are appropriate in the circumstances and for whichsufficient data are available to measure fair value, maximizing the use of relevant observable inputsand minimizing the use of unobservable inputs.
- 14 -
*SGVFSM000264*
All assets and liabilities for which fair value is measured or disclosed in the financial statementsare categorized within the fair value hierarchy, described as follows, based on the lowest levelinput that is significant to the fair value measurement as a whole:
· Level 1: Quoted (unadjusted) market prices in active markets for identical assets or liabilities· Level 2: Valuation techniques for which the lowest level input that is significant to the fair
value measurement is directly or indirectly observable· Level 3: Valuation techniques for which the lowest level input that is significant to the fair
value measurement is unobservable
For assets and liabilities that are recognized in the financial statements on a recurring basis, theGroup determines whether transfers have occurred between levels in the hierarchy by reassessingcategorization (based on the lowest level input that is significant to the fair value measurement as awhole) at the end of each reporting period.
External valuers are involved for valuation of significant assets, such as investment properties.Selection criteria include market knowledge, reputation, independence and whether professionalstandards are maintained.
The Group, in conjunction with the external valuers, also compares each of the changes in the fairvalue of each asset with relevant external sources to determine whether the change is reasonable.
For the purpose of fair value disclosures, the Group has determined classes of assets on the basis ofthe nature, characteristics and risks of the asset and the level of the fair value hierarchy asexplained above.
Financial Instruments – Initial Recognition and Subsequent Measurement effective January 1, 2018
Financial InstrumentsDate of recognitionThe Group recognizes a financial asset or a financial liability in the consolidated statement offinancial position when it becomes a party to the contractual provisions of the instrument.Purchases or sales of financial assets that require delivery of assets within the time frameestablished by regulation or convention in the marketplace are recognized on the trade date, whichis the date when the Group commits to purchase or sell assets.
a. Financial assetsInitial recognition of financial instrumentsAt initial recognition, financial assets are classified as, and subsequently measured at amortizedcost, FVOCI and FVTPL.
The classification of financial assets at initial recognition depends on the financial asset’scontractual cash flow characteristics and the Group’s business model for managing them. TheGroup initially measures a financial asset at its fair value plus, in the case of a financial asset not atfair value through profit or loss, transaction costs. Trade receivables, except for sales contractreceivables, are measured at the transaction price determined under PFRS 15. Refer to theaccounting policies on Revenue from contracts with customers.
- 15 -
*SGVFSM000264*
In order for a financial asset to be classified and measured at amortized cost or FVOCI, it needs togive rise to cash flows that are ‘solely payments of principal and interest (SPPI)’ on the principalamount outstanding. This assessment is referred to as the SPPI test and is performed at aninstrument level.
The Group’s business model for managing financial assets refers to how it manages its financialassets in order to generate cash flows. The business model determines whether cash flows willresult from collecting contractual cash flows, selling the financial assets, or both.
Subsequent measurementFor purposes of subsequent measurement, financial assets are classified in four categories:· Financial assets at amortized cost (debt instruments)· Financial assets at FVOCI with recycling of cumulative gains and losses (debt instruments)· Financial assets designated at FVOCI with no recycling of cumulative gains and losses upon
derecognition (equity instruments)· Financial assets at FVTPL
Financial assets at amortized costThis category is the most relevant to the Group. The Group measures financial assets at amortisedcost if both of the following conditions are met:· The financial asset is held within a business model with the objective to hold financial assets in
order to collect contractual cash flows; and· The contractual terms of the financial asset give rise on specified dates to cash flows that are
solely payments of principal and interest on the principal amount outstanding.
Financial assets at amortized cost are subsequently measured using the effective interest (EIR)method and are subject to impairment. Gains and losses are recognized in profit or loss when theasset is derecognized, modified or impaired.
The Group’s financial assets at amortized cost includes cash and cash equivalents, short-terminvestments and receivables.
FVOCI (debt instruments)The Group measures debt instruments at FVOCI if both of the following conditions are met:· The financial asset is held within a business model with the objective of both holding to collect
contractual cash flows and selling; and· The contractual terms of the financial asset give rise on specified dates to cash flows that are
solely payments of principal and interest on the principal amount outstanding.
For debt instruments at FVOCI, interest income, foreign exchange revaluation and impairmentlosses or reversals are recognized in the consolidated statement of income and computed in thesame manner as for financial assets measured at amortized cost. The remaining fair value changesare recognized in OCI. Upon derecognition, the cumulative fair value change recognized in OCI isrecycled to profit or loss.
The Group does not have debt instruments at FVOCI.
- 16 -
*SGVFSM000264*
Financial assets designated at FVOCI (equity instruments)Upon initial recognition, the Group can elect to classify irrevocably its equity investments as equityinstruments designated at FVOCI when they meet the definition of equity under PAS 32, FinancialInstruments: Presentation and are not held for trading. The classification is determined on aninstrument-by-instrument basis.
Gains and losses on these financial assets can no longer be recycled to profit or loss. Dividends arerecognized as other income in the consolidated statement of income when the right of payment hasbeen established, except when the Group benefits from such proceeds as a recovery of part of thecost of the financial asset, in which case, such gains are recorded in OCI. Equity instrumentsdesignated at FVOCI are not subject to impairment assessment.
The Group’s financial assets at FVOCI includes investments in quoted and unquoted equityinstruments.
Financial assets at FVTPLFinancial assets at FVTPL include financial assets held for trading, financial assets designatedupon initial recognition at fair value through profit or loss, or financial assets mandatorily requiredto be measured at fair value. Financial assets are classified as held for trading if they are acquiredfor the purpose of selling or repurchasing in the near term. Derivatives, including separatedembedded derivatives, are also classified as held for trading unless they are designated as effectivehedging instruments. Financial assets with cash flows that are not solely payments of principal andinterest are classified and measured at fair value through profit or loss, irrespective of the businessmodel. Notwithstanding the criteria for debt instruments to be classified at amortised cost or at fairvalue through OCI, as described above, debt instruments may be designated at fair value throughprofit or loss on initial recognition if doing so eliminates, or significantly reduces, an accountingmismatch.
Financial assets at FVTPL are carried in the statement of financial position at fair value with netchanges in fair value recognized in the statement of profit or loss.
This category includes investment in UITF as held for trading and classified these as FVTPL.
DerecognitionA financial asset (or, where applicable, a part of a financial asset or part of a group of similarfinancial assets) is primarily derecognized (i.e., removed from the Group’s consolidated statementof financial position) when:· The rights to receive cash flows from the asset have expired; or· The Group has transferred its rights to receive cash flows from the asset or has assumed an
obligation to pay the received cash flows in full without material delay to a third party under a‘pass-through’ arrangement; and either (a) the Group has transferred substantially all the risksand rewards of the asset, or (b) the Group has neither transferred nor retained substantially allthe risks and rewards of the asset, but has transferred control of the asset.
When the Group has transferred its rights to receive cash flows from an asset or has entered into apass-through arrangement, it evaluates if, and to what extent, it has retained the risks and rewardsof ownership. When it has neither transferred nor retained substantially all of the risks and rewardsof the asset, nor transferred control of the asset, the Group continues to recognize the transferredasset to the extent of its continuing involvement. In that case, the Group also recognizes anassociated liability. The transferred asset and the associated liability are measured on a basis thatreflects the rights and obligations that the Group has retained. Continuing involvement that takes
- 17 -
*SGVFSM000264*
the form of a guarantee over the transferred asset is measured at the lower of the original carryingamount of the asset and the maximum amount of consideration that the Group could be required torepay.
Impairment of Financial AssetsThe Group recognizes an allowance for ECLs for all debt instruments not held at FVTPL.ECL represents credit losses that reflect an unbiased and probability-weighted amount which isdetermined by evaluating a range of possible outcomes, the time value of money and reasonableand supportable information about past events, current conditions and forecasts of future economicconditions. The ECL allowance is based on the credit losses expected to arise over the life of theasset (the lifetime ECL), unless there has been no significant increase in credit risk sinceorigination, in which case, the allowance is based on the 12-month ECL. The 12-month ECL is theportion of lifetime ECL that results from default events on a financial instrument that are possiblewithin the 12 months after the reporting date. Lifetime ECL are credit losses that results from allpossible default events over the expected life of a financial instrument.
For trade receivables, installment contracts receivable and contract assets, the Group applies asimplified approach in calculating ECLs. Therefore, the Group does not track changes in creditrisk, but instead recognizes a loss allowance based on lifetime ECLs at each reporting date. TheGroup has established a provision matrix that is based on historical credit loss experience, adjustedfor forward-looking factors specific to the debtors and the economic environment.
For other financial assets such nontrade receivable, loans receivable, due from related parties andother receivables, ECLs are recognized in two stages. For credit exposures for which there has notbeen a significant increase in credit risk since initial recognition, ECLs are provided for creditlosses that result from default events that are possible within the next 12-months (a 12-monthECL). For those credit exposures for which there has been a SICR since initial recognition, a lossallowance is required for credit losses expected over the remaining life of the exposure,irrespective of the timing of the default (a lifetime ECL).
For cash and cash equivalents and short-term investments, the Group applies the low credit risksimplification. The probability of default and loss given defaults are publicly available and areconsidered to be low credit risk investments. It is the Group’s policy to measure ECLs on suchinstruments on a 12-month basis. However, when there has been a significant increase in creditrisk since origination, the allowance will be based on the lifetime ECL. The Group uses the ratingsfrom reputable credit rating agencies to determine whether the debt instrument has SICR and toestimate ECLs.
The Group considers a debt investment security to have low credit risk when its credit risk rating isequivalent to the globally understood definition of ‘investment grade’.
The key inputs in the model include the Group’s definition of default and historical data of threeyears for the origination, maturity date and default date. The Group considers trade receivablesand contract assets in default when contractual payment are 120 days past due, except for certaincircumstances when the reason for being past due is due to reconciliation with customers ofpayment records which are administrative in nature which may extend the definition of default to90 days and beyond. However, in certain cases, the Group may also consider a financial asset to bein default when internal or external information indicates that the Group is unlikely to receive theoutstanding contractual amounts in full before taking into account any credit enhancements held bythe Group.
- 18 -
*SGVFSM000264*
Determining the stage for impairmentAt each reporting date, the Group assesses whether there has been a SICR for financial assets sinceinitial recognition by comparing the risk of default occurring over the expected life between thereporting date and the date of initial recognition. The Group considers reasonable and supportableinformation that is relevant and available without undue cost or effort for this purpose. Thisincludes quantitative and qualitative information and forward-looking analysis.
The Group considers that there has been a SICR when contractual payments are more than 90 dayspast due.
An exposure will migrate through the ECL stages as asset quality deteriorates. If, in a subsequentperiod, asset quality improves and also reverses any previously assessed SICR since origination,then the loss allowance measurement reverts from lifetime ECL to 12-months ECL.
b. Financial liabilitiesInitial recognition and measurementFinancial liabilities are classified, at initial recognition, as financial liabilities at FVTPL, loans andborrowings, payables, or as derivatives designated as hedging instruments in an effective hedge, asappropriate.
All financial liabilities are recognized initially at fair value and, in the case of loans and borrowingsand payables, net of directly attributable transaction costs.
The Group’s financial liabilities include “Accounts and other payables” (other than “Taxespayable” which is covered by other accounting standard), “Short-term and long-term debts”,“Bonds payable”, “Liabilities on purchased properties” and “Other current liabilities”.
Subsequent measurementThe measurement of financial liabilities depends on their classification, as described below:
Loans and borrowingsThis is the category most relevant to the Group. After initial recognition, interest-bearing loansand borrowings are subsequently measured at amortized cost using the EIR method. Gains andlosses are recognized in profit or loss when the liabilities are derecognized as well as through theEIR amortization process.
Amortized cost is calculated by taking into account any discount or premium on acquisition andfees or costs that are an integral part of the EIR. The EIR amortization is included as finance costsin the consolidated statement of income.
This category generally applies to short-term debt, long-term debt, bonds payable and liabilities onpurchased properties.
Financial liabilities at FVTPLFinancial liabilities at FVTPL include financial liabilities held for trading and financial liabilitiesdesignated upon initial recognition as at fair value through profit or loss.
Financial liabilities are classified as held for trading if they are incurred for the purpose ofrepurchasing in the near term. This category also includes derivative financial instruments enteredinto by the Group that are not designated as hedging instruments in hedge relationships as definedby PFRS 9. Separated embedded derivatives are also classified as held for trading unless they aredesignated as effective hedging instruments.
- 19 -
*SGVFSM000264*
Gains or losses on liabilities held for trading are recognized in the consolidated statement ofincome.
Financial liabilities designated upon initial recognition at FVTPL are designated at the initial dateof recognition, and only if the criteria in PFRS 9 are satisfied. The Group has not designated anyfinancial liability as at FVTPL.
DerecognitionA financial liability is derecognized when the obligation under the liability is discharged orcancelled or expires. When an existing financial liability is replaced by another from the samelender on substantially different terms, or the terms of an existing liability are substantiallymodified, such an exchange or modification is treated as the derecognition of the original liabilityand the recognition of a new liability. The difference in the respective carrying amounts isrecognized in the consolidated statement of income.
c. Offsetting Financial InstrumentsFinancial assets and financial liabilities are offset and the net amount reported in the consolidatedstatement of financial position, if, and only if, there is a currently enforceable legal right to offsetthe recognized amounts and there is an intention to settle on a net basis, or to realize the asset andsettle the liability simultaneously.
d. Derivative Financial Instruments and Hedge AccountingInitial Recognition and Subsequent MeasurementThe Group uses derivative financial instruments such as cross-currency swaps, and interest rateswaps to hedge the risks associated with foreign currency and interest rate fluctuations. Derivativefinancial instruments are initially recognized at fair value on the date on which the derivativecontract is entered into and are subsequently re-measured at fair value. Derivatives are carried asfinancial assets when the fair value is positive and as financial liabilities when the fair value isnegative.
For the purpose of hedge accounting, hedges are classified as:· Fair value hedges when hedging the exposure to changes in the fair value of a recognized asset
or liability or an unrecognized firm commitment; or,· Cash flow hedges when hedging the exposure to variability in cash flows that is attributable to
a particular risk associated with a recognized asset or liability or a highly probable forecasttransaction or the foreign currency risk in an unrecognized firm commitment.
A hedging relationship qualifies for hedge accounting if it meets all of the following effectivenessrequirements:· There is an economic relationship between the hedged item and the hedging instrument.· The effect of credit risk does not dominate the value changes that result from that economic
relationship.· The hedge ratio of the hedging relationship is the same as that resulting from the quantity of
the hedged item that the Group actually hedges and the quantity of the hedging instrument thatthe Group actually uses to hedge that quantity of the hedged item.
Hedges are accounted for as fair value hedges or cash flow hedges.
Fair Value HedgeThe change in the fair value of a hedge instrument is recognized in the consolidated statement ofincome. The change in the fair value attributable to the risk hedged is recorded as part of the
- 20 -
*SGVFSM000264*
carrying value of the hedge instrument and is also recognized in the consolidated statement ofincome as other expense.
For fair value hedges carried at amortized cost, any adjustment to carrying value is amortizedthrough profit or loss over the remaining term of the hedge using the EIR method. The EIRamortization is initiated when an adjustment exists and no later than when the hedged instrumentceases to be adjusted for changes in its fair value attributable to the risk being hedged.In case of derecognition, the unamortized fair value of the hedged instrument is recognizedimmediately in profit or loss.
Cash Flow HedgesThe effective portion of the gain or loss on the hedging instrument is recognized in OCI, while anyineffective portion is recognized immediately in the consolidated statement of income. The cashflow hedge reserve is adjusted to the lower of the cumulative gain or loss on the hedginginstrument and the cumulative change in the fair value of the hedged instrument.
The amounts accumulated in OCI are accounted for depending on the nature of the underlyinghedged transaction. If the hedged transaction subsequently results in the recognition of a non-financial item, the amount accumulated in equity is removed from the separate component ofequity and included in the initial cost or other carrying amount of the hedged asset or liability. Thisis not a reclassification adjustment and will not be recognized in OCI for the period. This alsoapplies where the hedged forecast transaction of a non-financial asset or non-financial liabilitysubsequently becomes a firm commitment for which fair value hedge accounting is applied.
For any other cash flow hedges, the amount accumulated in OCI is reclassified to profit or loss as areclassification adjustment in the same period or periods during which hedged cash flows affectprofit or loss.
If hedge accounting is discontinued, the amount accumulated in OCI shall remain in accumulatedOCI if the hedged future cash flows are still expected to occur. Otherwise, the amount shall bereclassified to profit or loss as a reclassification adjustment. When the hedged cash flow occurs,any amount remaining in accumulated OCI shall be accounted for depending on the nature of theunderlying transaction.
Financial Instruments - Initial Recognition and Subsequent Measurement effective beforeJanuary 1, 2018Date of recognitionThe Group recognizes a financial asset or a financial liability in the consolidated statement offinancial position when it becomes a party to the contractual provisions of the instrument.Purchases or sales of financial assets that require delivery of assets within the time frameestablished by regulation or convention in the marketplace are recognized on the trade date, whichis the date when the Group commits to purchase or sell assets.
Initial recognition of financial instrumentsAll financial assets are initially recognized at fair value. Except for financial assets and financialliabilities at fair value through profit or loss (FVTPL), the initial measurement of financial assetsand financial liabilities includes transaction costs. The Group classifies its financial assets in thefollowing categories: financial assets at FVTPL, held-to-maturity (HTM) investments, AFSinvestments, and loans and receivables. The Group classifies its financial liabilities as eitherfinancial liabilities at FVTPL or other financial liabilities. The classification depends on thepurpose for which the investments were acquired and whether they are quoted in an active market.
- 21 -
*SGVFSM000264*
Management determines the classification of its investments at initial recognition and, whereallowed and appropriate, re-evaluates such designation at every reporting date.
‘Day 1’ differenceWhere the transaction price in a non-active market is different from the fair value from otherobservable current market transactions in the same instrument or based on a valuation techniquewhose variables include only data from observable markets, the Group recognizes the differencebetween the transaction price and fair value (a ‘Day 1’ difference) in the consolidated statement ofincome under ‘Interest income’ and ‘Interest expense’ accounts unless it qualifies for recognitionas some other type of asset or liability. In cases where transaction price used is made of data whichis not observable, the difference between the transaction price and model value is only recognizedin the consolidated statement of income when the inputs become observable or when theinstrument is derecognized. For each transaction, the Group determines the appropriate method ofrecognizing the ‘Day 1’ difference amount.
Loans and receivablesLoans and receivables are financial assets with fixed or determinable payments and fixedmaturities that are not quoted in an active market. They are not entered into with the intention ofimmediate or short-term resale and are not designated as AFS investments or financial assets atFVTPL. This accounting policy relates to the accounts in the consolidated statement of financialposition ‘Receivables’, ’Due from related parties’, ‘Cash and cash equivalents’ and ‘Short-terminvestments’.
Receivables are recognized initially at fair value which normally pertains to the billable amount.After initial measurement, loans and receivables are subsequently measured at amortized cost usingthe effective interest method, less allowance for impairment. Amortized cost is calculated bytaking into account any discount or premium on acquisition and fees that are an integral part of theeffective interest rate (EIR). The amortization is included in ‘Interest income’ in the consolidatedstatement of income. The losses arising from impairment of such loans and receivables arerecognized in the consolidated statement of income.
AFS investmentsAFS investments are those which are designated as such or do not qualify to be classified asdesignated at FVTPL, HTM investments, or loans and receivables. They are purchased and heldindefinitely, and may be sold in response to liquidity requirements or changes in market conditions.The Group’s AFS investments pertain to quoted and unquoted equity securities and other debtinstruments.
After initial recognition, AFS investments are measured at fair value with gains or lossesrecognized as a separate component of equity until the investment is derecognized or until theinvestment is determined to be impaired, at which time the cumulative gain or loss previouslyincluded in equity are included in the consolidated statement of income. Dividends on AFS equityinstruments are recognized in the consolidated statement of income when the entity’s right toreceive payment has been established. Interest earned on holding AFS debt instruments arereported in the consolidated statements of income as ‘Interest income’ using the effective interestmethod.
The fair value of investments that are traded in active markets is determined by reference to quotedmarket bid prices at the close of business on the reporting date. The unquoted equity instrumentsare carried at cost less any impairment losses because fair value cannot be measured reliably due tothe unpredictable nature of future cash flows and the lack of suitable methods of arriving at areliable fair value.
- 22 -
*SGVFSM000264*
Other financial liabilitiesThese are financial liabilities not designated at FVTPL where the substance of the contractualarrangement results in the Group having an obligation either to deliver cash or another financialasset to the holder or to satisfy the obligation other than by the exchange of a fixed amount of cashor another financial asset for a fixed number of own equity shares. After initial measurement,other financial liabilities are subsequently measured at amortized cost using the effective interestmethod. Amortized cost is calculated by taking into account any discount or premium on the issueand fees that are an integral part of the EIR.
This accounting policy applies primarily to the Group’s ‘Accounts and other payables’, ‘Short-termdebt’, ‘Long-term debt’, ‘Liabilities on purchased properties’, ‘Due to related parties’ and otherobligations that meet the above definition (other than liabilities covered by other accountingstandards, such as income tax payable). The components of issued financial instruments thatcontain both liability and equity elements are accounted for separately, with the equity componentbeing assigned the residual amount after deducting from the instrument, as a whole, the amountseparately determined as the fair value of the liability component on the date of issue.
Derivative Financial Instrument and Hedge AccountingThe Group uses derivative financial instruments such as cross currency interest rate swap to hedgeits foreign currency and interest rate risks. Such derivative financial instruments are initiallyrecognized at fair value on the date in which a derivative transaction is entered into and aresubsequently re-measured at fair value. Derivatives are carried as assets when the fair value ispositive and as liabilities when the fair value is negative.
Any gains or losses arising from the changes in fair value of derivatives are taken directly to profitor loss, except for the effective portion of cash flow hedges, which is recognized as OCI.
For the purpose of hedge accounting, hedges are classified as:· Fair value hedges when hedging the exposure to changes in the fair value of a recognized asset
or liability or an unrecognized firm commitment (except for foreign currency risk);· Cash flow hedges when hedging exposure to variability in cash flows that is either attributable
to a particular risk associated with a recognized asset or liability or a highly probable forecasttransaction or the foreign currency risk in an unrecognized firm commitment; or
· Hedges of a net investment in a foreign operation
At the inception of a hedge relationship, the Group formally designates and documents the hedgerelationship to which the Group wishes to apply hedge accounting and the risk managementobjective and strategy for undertaking the hedge.
Before 1 January 2018, the documentation includes identification of the hedging instrument, thehedged item or transaction, the nature of the risk being hedged and how the entity will assess thehedging instrument’s effectiveness in offsetting the exposure to changes in the hedge item’s fairvalue or cash flows attributable to the hedged risk. Such hedges are expected to be highly effectivein achieving offsetting changes in fair value or cash flows and are assessed on an on-going basis todetermine that they actually have been highly effective throughout the financial reporting periodsfor which they were designated.
Cash flow hedgesThe effective portion of the gain or loss on the hedging instrument is recognized directly as OCI inthe cash flow hedge reserve, while the ineffective portion is recognized directly in profit or loss.
- 23 -
*SGVFSM000264*
The cash flow hedge reserve is adjusted to the lower of the cumulative gain or loss on the hedginginstrument and the cumulative change in fair value of the hedged item.
Amounts recognized as OCI are transferred to profit or loss, such as when the hedged financialincome or financial expense is recognized or when a forecast sale occurs. Where the hedged item isthe cost of a non-financial asset or non-financial liability, the amounts recognized as OCI aretransferred to the initial carrying amount of the non-financial asset or liability.
If the forecast transaction or firm commitment is no longer expected to occur, the cumulative gainor loss previously recognized in OCI are transferred to profit or loss. If the hedging instrumentexpires or is sold, terminated or exercised without replacement or rollover or if its designation as ahedge is revoked, any cumulative gain or loss previously recognized in OCI remains in OCI untilthe forecast transaction or firm commitment affects profit or loss. If the related transaction is notexpected to occur, the amount is taken to profit or loss.
Impairment of Financial AssetsThe Group assesses at each reporting date whether there is objective evidence that a financial assetor a group of financial assets is impaired. A financial asset or a group of financial assets is deemedto be impaired if, and only if, there is objective evidence of impairment as a result of one or moreevents that has occurred after the initial recognition of the asset (an incurred ‘loss event’) and thatloss event (or events) has an impact on the estimated future cash flows of the financial asset or thegroup of financial assets that can be reliably estimated. Evidence of impairment may includeindications that the borrower or a group of borrowers is experiencing significant financialdifficulty, default or delinquency in interest or principal payments, the probability that they willenter bankruptcy or other financial reorganization and where observable data indicate that there ismeasurable decrease in the estimated future cash flows, such as changes in arrears or economicconditions that correlate with defaults.
Loans and receivablesFor loans and receivables carried at amortized cost, the Group first assesses whether objectiveevidence of impairment exists individually for financial assets that are individually significant, orcollectively for financial assets that are not individually significant.
If there is objective evidence that an impairment loss has been incurred, the amount of the loss ismeasured as the difference between the asset’s carrying amount and the present value of theestimated future cash flows (excluding future credit losses that have not been incurred). Thepresent value of the estimated future cash flows is discounted at the financial asset’s original EIR.If a loan has a variable interest rate, the discount rate for measuring any impairment loss is thecurrent EIR, adjusted for the original credit risk premium. The carrying amount of the asset isreduced through the use of an allowance account and the amount of loss is charged to theconsolidated statement of income. Interest income continues to be recognized based on theoriginal EIR of the asset.
If the Group determines that no objective evidence of impairment exists for individually assessedfinancial asset, whether significant or not, it includes the asset in a group of financial assets withsimilar credit risk characteristics and collectively assesses for impairment. Those characteristicsare relevant to the estimation of future cash flows for groups of such assets by being indicative ofthe debtors’ ability to pay all amounts due according to the contractual terms of the assets beingevaluated. Assets that are individually assessed for impairment and for which an impairment lossis, or continues to be, recognized are not included in the collective assessment for impairment.
- 24 -
*SGVFSM000264*
For the purpose of a collective evaluation of impairment, financial assets are grouped on the basisof such credit risk characteristics as past due status and term. Future cash flows in a group offinancial assets that are collectively evaluated for impairment are estimated on the basis ofhistorical loss experience for assets with credit risk characteristics similar to those in the group.Historical loss experience is adjusted on the basis of current observable data to reflect the effects ofcurrent conditions that did not affect the period on which the historical loss experience is based andto remove the effects of conditions in the historical period that do not exist currently. Themethodology and assumptions used for estimating future cash flows are reviewed regularly by theGroup to reduce any differences between loss estimates and actual loss experience.
Loans, together with the associated allowance accounts, are written off when there is no realisticprospect of future recovery and all collateral has been realized. If, in a subsequent year, theamount of the estimated impairment loss decreases because of an event occurring after theimpairment was recognized, the previously recognized impairment loss is reversed. Anysubsequent reversal of an impairment loss is recognized in the consolidated statement of income, tothe extent that the carrying value of the asset does not exceed its amortized cost as at the reversaldate.
AFS investmentsFor AFS investments, the Group assesses at each reporting date whether there is objective evidencethat a financial asset or group of financial assets is impaired.
In case of equity instruments classified as AFS investments, this would include a significant orprolonged decline in the fair value of the investments below its cost. Where there is evidence ofimpairment, the cumulative loss, measured as the difference between the acquisition cost and thecurrent fair value, less any impairment loss on that financial asset previously recognized in theconsolidated statement of income, is removed from the consolidated statement of changes in equityand recognized in the consolidated statement of income. Impairment losses on equity instrumentsare not reversed through profit or loss. Increases in fair value after impairment are recognizeddirectly in the consolidated statement of comprehensive income.
In the case of debt instruments classified as AFS investments, impairment is assessed based on thesame criteria as financial assets carried at amortized cost. Future interest income is based on thereduced carrying amount and is accrued based on the rate of interest used to discount future cashflows for the purpose of measuring impairment loss. Such accrual is recorded as ‘Interest income’in the consolidated statements of income. If, in the subsequent year, the fair value of the debtinstrument increases and the increase can be objectively related to an event occurring after theimpairment loss was recognized in the consolidated statement of income, the impairment loss isreversed through the consolidated statement of income.
Derecognition of Financial Assets and LiabilitiesFinancial assetA financial asset (or, where applicable a part of a financial asset or part of a group of financialassets) is derecognized when:
a. the rights to receive cash flows from the asset have expired;b. the Group retains the right to receive cash flows from the asset, but has assumed an obligation
to pay them in full without material delay to a third party under a “pass-through” arrangement;or
c. the Group has transferred its rights to receive cash flows from the asset and either (a) hastransferred substantially all the risks and rewards of the asset, or (b) has neither transferred norretained the risk and rewards of the asset but has transferred the control over the asset.
- 25 -
*SGVFSM000264*
Where the Group has transferred its rights to receive cash flows from an asset or has entered into apass-through arrangement, and has neither transferred nor retained substantially all the risks andrewards of the asset nor transferred control of the asset, the asset is recognized to the extent of theGroup’s continuing involvement in the asset. Continuing involvement that takes the form of aguarantee over the transferred asset is measured at the lower of original carrying amount of theasset and the maximum amount of consideration that the Group could be required to repay.
Financial liabilityA financial liability is derecognized when the obligation under the liability is discharged,cancelled, or has expired. Where an existing financial liability is replaced by another from thesame lender on substantially different terms, or the terms of an existing liability are substantiallymodified, such an exchange or modification is treated as a derecognition of the original liabilityand the recognition of a new liability, and the difference in the respective carrying amounts isrecognized in the consolidated statement of income.
Offsetting Financial InstrumentsFinancial assets and financial liabilities are offset and the net amount reported in the consolidatedstatement of financial position if, and only if, there is a currently enforceable legal right to offsetthe recognized amounts and there is an intention to settle on a net basis, or to realize the asset andsettle the liability simultaneously. The Group assesses that it has a currently enforceable right ofoffset if the right is not contingent on a future event, and is legally enforceable in the normal courseof business, event of default, and event of insolvency or bankruptcy of the Group and all of thecounterparties.
InventoriesReal estate inventoriesProperty acquired that are being developed or constructed for sale in the ordinary course ofbusiness, rather than to be held for rental or capital appreciation, is held as real estate inventory.Real estate inventories consist of land and improvements, condominium units held for sale andresidential units.
Land and improvements are carried at the lower of cost or net realizable value (NRV).
Cost includes:• Acquisition cost of subdivision land;• Amounts paid to contractors for construction and development of subdivision land, residential
houses and lots and condominium units;• Planning and design costs, cost of site preparation, professional fees for legal services, property
transfer taxes, construction overheads and other related costs; and• Borrowing costs capitalized prior to start of pre-selling activities for the real estate project.
NRV is the estimated selling price in the ordinary course of the business, based on market prices atthe reporting date, less costs to complete and the estimated costs of sale. The carrying amount ofinventories is reduced through the use of allowance account and the amount of loss is charged toprofit or loss.
Construction in progress (CIP) includes development or construction costs incurred for real estateprojects that have not yet reached the preliminary stage of completion and/or not yet launched.This account also includes owner supplied materials. Upon reaching the preliminary stage ofcompletion, these are transferred to ‘Condominium units held for sale’.
- 26 -
*SGVFSM000264*
Costs of condominium units held for sale includes the carrying amount of the land transferred from‘Land and improvements’ at the commencement of its real estate projects and those costs incurredfor construction, development and improvement of the properties, including capitalized borrowingcosts.
Costs of residential units include land cost, land improvement costs, borrowing costs, amounts paidto contractors for construction and development, planning and design cost, cost of site preparation,professional fees, property transfer taxes, construction overheads and other related costs.
Gasoline retail, petroleum products and chemicalsCost is determined using first-in, first-out method. The costs of oil, petroleum products andchemicals include cost incurred for acquisition and freight charges.
Automotive inventoriesThese are inventories of the Toyota Group which are valued at the lower of cost or NRV. NRV isthe estimated selling price in the ordinary course of business, less the estimated costs ofcompletion, marketing and distribution.
Costs incurred in bringing each product to its present location and condition are accounted for asfollows:
Raw materials and spare parts − Purchase cost on a weighted average costFinished goods and work-in-process − Cost of direct material and labor and proportion of
fixed and overhead manufacturing costs allocatedbased on normal operating capacity
Raw materials and spare parts in-transit − Cost is determined using the specific identificationmethod
Investments in Associates and Joint VentureInvestments in associates and joint venture are accounted for under the equity method ofaccounting. An associate is an entity in which the Group has significant influence and which isneither a subsidiary nor a joint venture of the Group. A joint venture (JV) is a contractualagreement whereby two or more parties undertake an economic activity that is subject to jointcontrol.
An investment is accounted for using the equity method from the day it becomes an associate or ajoint venture. On acquisition of investment, the excess of the cost of investment over the investor’sshare in the net fair value of the investee’s identifiable assets, liabilities and contingent liabilities isaccounted for as goodwill and included in the carrying amount of the investment and is neitheramortized nor individually tested for impairment. Any excess of the investor’s share of the net fairvalue of the associate’s identifiable assets, liabilities and contingent liabilities over the cost of theinvestment is excluded from the carrying amount of the investment, and is included as income inthe determination of the share in the earnings of the investee.
Under the equity method, the investments in and advances to associates and joint venture arecarried in the consolidated statement of financial position at cost plus post-acquisition changes inthe Group’s share in the net assets of the investees, less any impairment in value.The consolidated statement of comprehensive income reflects the Group’s share in the results ofoperations of the investee companies and the Group’s share on movements in the investee’s othercomprehensive income (OCI) are recognized directly in OCI in the consolidated financialstatements. The Group’s share on total comprehensive income of an associate is shown in theconsolidated statement of income and consolidated statement of comprehensive income. The
- 27 -
*SGVFSM000264*
aggregate of the Group’s equity in net income of associates and joint venture is shown on the faceof the consolidated statement of income as part of operating profit and represents profit or lossafter tax and NCI in the subsidiaries of the associate and joint venture.
Profits and losses resulting from transactions between the Group and the investee companies areeliminated to the extent of the interest in the investee companies, and for unrealized losses, to theextent that there is no evidence of impairment of the assets transferred. Dividends received frominvestee companies are treated as a reduction of the accumulated earnings included under‘Investments and advances’ account in the consolidated statements of financial position.
The Group discontinues applying the equity method when its investments in investee companiesare reduced to zero. Accordingly, additional losses are not recognized unless the Group hasguaranteed certain obligations of the associates or joint venture. When the investees subsequentlyreport net income, the Group will resume applying the equity method but only after its equity in thenet income equals the equity in net losses of associates and joint venture not recognized during theperiod the equity method was suspended.
Upon loss of significant influence over the associates or joint control over the joint venture, theGroup measures and recognizes any retained investments at its fair value. Any difference betweenthe carrying amount of the associate or JV upon loss of significant influence or joint control andthe fair value of the retained investment and proceeds from disposal in retained investments andproceeds from disposal is recognized in profit or loss.
Land held for Future DevelopmentLand held for future development consists of properties for future developments and are carried atthe lower of cost or NRV. NRV is the estimated selling price in the ordinary course of business,less cost to complete and costs of sale. Costs include cost incurred for development andimprovements of the properties. Upon start of development, the related cost of the land istransferred to real estate inventories.
Investment PropertiesInvestment properties consist of properties that are held to earn rentals and that are not occupied bythe companies in the Group. Investment properties, except for land, are carried at cost lessaccumulated depreciation and amortization and any impairment in residual value. Land is carriedat cost less any impairment in value.
Depreciation and amortization of investment properties are computed using the straight-linemethod over the estimated useful lives (EUL) of the properties which is 5 to 41 years.
Investment properties are derecognized when either they have been disposed of, or when theinvestment property is permanently withdrawn from use and no future economic benefit isexpected from its disposal. Any gains or losses on the retirement or disposal of an investmentproperty are recognized in the consolidated statement of income in the year of retirement ordisposal.
Transfers are made to investment property when there is a change in use, evidenced by ending ofowner-occupation, commencement of an operating lease to another party or ending of constructionor development. Transfers are made from investment property when and only when there is achange in use, evidenced by commencement of owner-occupation or commencement ofdevelopment with a view to sale. Transfers between investment property, owner-occupiedproperty and inventories do not change the carrying amount of the property transferred and they donot change the cost of that property for measurement or disclosure purposes.
- 28 -
*SGVFSM000264*
CIP is stated at cost. This includes cost of construction and other direct costs. Borrowing costs thatare directly attributable to the construction of investment properties are capitalized during theconstruction period. CIP is not depreciated until such time as the relevant assets are in the locationand condition necessary for it to be capable of operating in the manner intended by management.
Property and EquipmentProperty and equipment are stated at cost less accumulated depreciation and amortization and anyimpairment in value. The initial cost of property and equipment comprises its purchase price,including import duties, taxes and any directly attributable costs of bringing the property andequipment to its working condition and location for its intended use, including capitalizedborrowing costs.
CIP is stated at cost. This includes cost of construction and other direct costs. CIP is notdepreciated until such time that the relevant assets are completed and put into operational use.
Major repairs are capitalized as part of property and equipment only when it is probable that futureeconomic benefits associated with the item will flow to the Group and the cost of the items can bemeasured reliably. All other repairs and maintenance are charged against operations as incurred.
Depreciation and amortization of property and equipment commences once the property andequipment are available for use and are calculated on the straight-line basis over the followingEUL of the property and equipment as follows:
YearsTransportation equipment 5Furniture, fixtures and equipment 3 to 5Leasehold improvements 2 to 10 or lease term (whichever is shorter)Machinery, tools and equipment 2 to 10Building 15 to 41Boilers and powerhouse 9 to 25Turbine generators and desox system 9 to 25Buildings and land improvements 9 to 25Electrical distribution system 7 to 25Other property and equipment 3 to 5
The assets’ residual values, EUL and depreciation and amortization method are reviewedperiodically to ensure that the period and method of depreciation and amortization are consistentwith the expected pattern of economic benefits from items of property and equipment.
Transfers are made from property and equipment, when there is a change in use, evidenced byending of owner-occupation, and with a view of sale.
Impairment or losses of items of property, plant and equipment, related claims for or payments ofcompensation from third parties and any subsequent purchase or construction of replacement assetsare separate economic events and are accounted for separately.
When property and equipment are retired or otherwise disposed of, the cost of the relatedaccumulated depreciation and amortization and provision for impairment losses, if any, areremoved from the accounts and any resulting gain or loss is credited to or charged against currentoperations.
- 29 -
*SGVFSM000264*
Fully depreciated assets are still carried in the accounts until they no longer in use and no furtherdepreciation is charged against current operations.
Intangible AssetsIntangible assets acquired separately are measured on initial recognition at cost. The cost ofintangible assets acquired in a business combination is the fair value as at the date of theacquisition. Following initial recognition, intangible assets are carried at cost less any accumulatedamortization and any accumulated impairment losses. Internally generated intangible assets,excluding capitalized development costs, are not capitalized and expenditure is reflected in theconsolidated statement of income in the year in which the expenditure is incurred.
The useful lives of intangible assets with finite life are assessed at the individual asset level.Intangible assets with finite life are amortized over their useful life. Periods and method ofamortization for intangible assets with finite useful lives are reviewed annually or earlier when anindicator of impairment exists. Changes in the expected useful life or the expected pattern ofconsumption of future economic benefits embodied in the intangible asset is accounted for bychanging the amortization period or method, as appropriate, and are treated as changes inaccounting estimates.
Intangible assets with indefinite useful lives are tested for impairment annually either individuallyor at the cash-generating unit level. Such intangibles are not amortized. The useful life of anintangible asset with an indefinite useful life is reviewed annually to determine whether indefinitelife assessment continues to be supportable. If not, the change in the useful life assessment fromindefinite to finite is made on a prospective basis.
The Group’s intangible assets consist of customer relationship, software costs and franchise. Again or loss arising from derecognition of an intangible asset is measured as the difference betweenthe net disposal proceeds and the carrying amount of the intangible asset and is recognized in theconsolidated statement of income when the intangible asset is derecognized.
Customer RelationshipCustomer relationship pertains to Toyota’s contractual arrangements with its top dealer customers,which adds value to the operations of Toyota and enhances the latter’s earnings potential. This isrecognized initially at fair value and is assessed to have an indefinite useful life. Following initialrecognition, the intangible asset is not amortized but assessed annually for impairment.
Software CostsCosts related to software purchased by the Group for use in the operations are amortized on astraight-line basis over a period of 3 to 5 years.
Costs that are directly associated with identifiable and unique software controlled by the Group andwill generate economic benefits exceeding costs beyond one year, are recognized as intangibleassets to be measured at cost less accumulated amortization and provision for impairment losses, ifany. Expenditures which enhance or extend the performance of computer software programsbeyond their original specifications are recognized as capital improvements and added to theoriginal cost of the software.
GoodwillGoodwill acquired in a business combination from the acquisition date is allocated to each of theGroup’s cash-generating units, or groups of cash-generating units that are expected to benefit fromthe synergies of the combination, irrespective of whether other assets or liabilities of the Group areassigned to those units or groups of units.
- 30 -
*SGVFSM000264*
Each unit or group of units to which the goodwill is so allocated:
· represents the lowest level within the Group at which the goodwill is monitored for internalmanagement purposes; and
· is not larger than a segment based on the Group’s operating segments as determined inaccordance with PFRS 8, Operating Segments.
Following initial recognition, goodwill is measured at cost, less any accumulated impairment loss.Goodwill is reviewed for impairment annually or more frequently, if events or changes incircumstances indicate that the carrying value may be impaired (see Impairment of Non-financialAssets).
Where goodwill forms part of a cash-generating unit and part of the operations within that unit isdisposed of, the goodwill associated with the operations disposed of is included in the carryingamount of the operations when determining the gain or loss on disposal of the operations.Goodwill disposed of in this circumstance is measured based on the relative values of theoperations disposed of and the portion of the cash-generating unit retained.
Goodwill is presented together with the intangible assets in the consolidated statement of financialposition.
Impairment of Non-financial AssetsThe Group assesses at each financial reporting date whether there is an indication that theirnonfinancial assets (e.g., investments in associates and joint venture, investment properties,property and equipment, goodwill and intangible assets), may be impaired. If any such indicationexists, or when annual impairment testing for an asset is required, the Group makes an estimate ofthe asset’s recoverable amount. An asset’s recoverable amount is the higher of an asset’s orCGU’s fair value less costs to sell and its value in use (VIU) and is determined for an individualasset, unless the asset does not generate cash inflows that are largely independent of those fromother assets or groups of assets. Where the carrying amount of an asset exceeds its recoverableamount, the asset is considered impaired and is written down to its recoverable amount. Inassessing the value in use, the estimated future cash flows are discounted to their present valueusing a pre-tax discount rate that reflects current market assessments of the time value of moneyand the risks specific to the asset. Impairment losses of continuing operations are recognized in theconsolidated statement of income in those expense categories consistent with the function of theimpaired asset.
An assessment is made at each financial reporting date as to whether there is any indication thatpreviously recognized impairment losses may no longer exist or may have decreased. If suchindication exists, the recoverable amount is estimated. A previously recognized impairment loss isreversed only if there has been a change in the estimates used to determine the asset’s recoverableamount since the last impairment loss was recognized. If that is the case, the carrying amount ofthe asset is increased to its recoverable amount. The recoverable amount cannot exceed thecarrying amount that would have been determined, net of depreciation and amortization, had noimpairment loss been recognized for the asset in prior years. Such reversal is recognized in theconsolidated statement of income unless the asset is carried at revalued amount, in which case, thereversal is treated as a revaluation increase. After such reversal, the depreciation and amortizationcharge is adjusted in future periods to allocate the asset’s revised carrying amount, less anyresidual value, on a systematic basis over its remaining useful life.
- 31 -
*SGVFSM000264*
This accounting policy applies primarily to the Group’s property and equipment and investmentproperties. Additional considerations for other non-financial assets are discussed below.
Investments in associates and joint ventureAfter application of the equity method, the Group determines whether it is necessary to recognizegoodwill or any additional impairment loss with respect to the Group’s net investment in itsassociates and joint venture. The Group determines at each financial reporting date whether thereis any objective evidence that the investments in associates and joint venture are impaired.
If this is the case, the Group calculates the amount of impairment as being the difference betweenthe fair value of the associate and joint venture and the carrying cost and recognizes the amount inthe consolidated statement of income.
Intangible assetsCustomer relationship is reviewed for impairment annually, similar with goodwill, or morefrequently if events or changes in circumstances indicate that the carrying value may be impaired.For intangible assets with finite useful lives, the carrying amount is assessed and written down toits recoverable amount when an indication of impairment occurs.
GoodwillGoodwill is reviewed for impairment, annually or more frequently if events or changes incircumstances indicate that the carrying value may be impaired.
Impairment is determined for goodwill by assessing the recoverable amount of the CGU (or groupof CGUs) to which the goodwill relates. Where the recoverable amount of the CGU (or group ofCGUs) is less than the carrying amount of the CGU (or group of CGUs) to which goodwill hasbeen allocated, an impairment loss is recognized immediately in the consolidated statement ofincome. Impairment losses relating to goodwill cannot be reversed for subsequent increases in itsrecoverable amount in future periods. The Group performs its annual impairment test of goodwillat reporting date.
Value-added Tax (VAT)Revenue, expenses and assets are recognized net of the amount of sales tax except:
· where the tax incurred on a purchase of assets or services is not recoverable from the taxauthority, in which case, the tax is recognized as part of the cost of acquisition of the asset oras part of the expense item as applicable; and
· receivables and payables that are stated with the amount of tax included.
The net amount of VAT recoverable from the tax authority is included under ‘Prepayments andother current assets’ in the consolidated statement of financial position.
Discontinued OperationsA disposal group qualifies as discontinued operation if it is a component of an entity that either hasbeen disposed of, or is classified as held for sale, and:
· represents a separate major line of business or geographical area of operations· is part of a single co-ordinated plan to dispose of a separate major line of business or
geographical area of operations, or· is a subsidiary acquired exclusively with a view to resale.
- 32 -
*SGVFSM000264*
The disposal group is excluded from the results of continuing operations and is presented as asingle amount as ‘Net income from discontinued operations’ in the consolidated statement ofincome.
Additional disclosures are provided in Note 12. All other notes to the consolidated financialstatements include amounts of disposal group, unless otherwise mentioned.
Customers’ DepositsThe Group requires buyers of real estate to pay a minimum percentage of the total selling price.The minimum percentage is on the basis of the level of buyer’s commitment to pay and is part ofthe revenue recognition criteria. When the revenue recognition criteria are met, sales are thenrecognized and these deposits and downpayments will be applied against the related installmentcontracts receivable. In the event that the customer decides to terminate the purchase prior torecognition of sale, an amount equivalent to the cash surrender value of the deposit will berefunded to the buyer.
Customer’s deposits consist of payment from buyers which have not reached the minimumrequired percentage and amounts that have not been applied against the related installmentcontracts receivable.
EquityThe Group records common stock and preferred stock at par value and additional paid-in capital inexcess of the total contributions received over the aggregate par values of the equity share.Incremental costs incurred directly attributable to the issuance of new shares are deducted fromproceeds.
Capital stockThe Parent Company has issued common stock and preferred stock that are classified as equity.Incremental costs directly attributable to the issue of new common stock are shown in equity as adeduction, net of tax, from the proceeds. All other equity issuance costs are recognized as expenseas incurred.
Where the Parent Company purchases its own common stock (treasury shares), the considerationpaid, including any directly attributable incremental costs (net of applicable taxes) is deductedfrom equity attributable to the Parent Company’s equity holders until the shares are cancelled orreissued.
Where such shares are subsequently reissued, any consideration received, net of any directlyattributable incremental transaction costs and the related tax effects, and is included in equityattributable to the Parent Company’s equity holders.
Additional paid-in capitalAmount of contribution in excess of par value is accounted for as an additional paid-in capital.Additional paid-in capital also arises from additional capital contribution from the shareholders.
Retained earningsThe amount included in retained earnings includes profit or loss attributable to the Group’s equityholders and reduced by dividend on capital stock. Dividends on capital stock are recognized as aliability and deducted from equity when they are declared. Dividends for the year that areapproved after the reporting date are dealt with as an event after the reporting date.
- 33 -
*SGVFSM000264*
Retained earnings may also include effect of changes in accounting policy as may be required bythe standard’s transitional provisions.
Other Comprehensive IncomeOther comprehensive income comprises items of income and expenses that are recognized directlyin equity. OCI items are either reclassified to profit or loss or directly to equity in subsequentperiods.
Acquisition of Non-controlling Interest in a SubsidiaryAcquisition of non-controlling interest is accounted for as an equity transaction, whereby thedifference between the fair value of consideration given and the share in the net book value of thenet assets acquired is recognized in equity. In an acquisition without consideration involved, thedifference between the share of the non-controlling interests in the net assets at book value beforeand after the acquisition is treated as transaction between equity owners under the ‘Non-controllinginterests’ account in the consolidated statement of financial position.
Revenue Recognition effective January 1, 2018
Revenue from Contract with CustomersThe Group primarily derives its revenue from automotive operations and real estate sales. Revenuefrom contracts with customers is recognized when control of the goods or services are transferredto the customer at an amount that reflects the consideration to which the Group expects to beentitled in exchange for those goods or services.
The disclosures of significant accounting judgements, estimates and assumptions relating torevenue from contracts with customers are provided in Note 3.
Automotive operationsThe Group derives its revenue from automotive operations from the sale of manufactured vehicles,trading of completely built-up vehicles and local and imported auto parts and sale of services. Inthe sales contract with customers, services other than vehicle sales such as additional service,additional warranty and other services are separated from the sale of vehicles to identifyperformance obligations.
Timing of revenue recognition may change depending on when the performance obligation issatisfied, either at a point in time or over time. The Group recognizes revenue from goods orservices at a point in time when the goods or services are transferred to the customers and fulfillsthe performance obligations. In order to determine whether the control over the goods or services istransferred over time, the Group determines whether the customer simultaneously obtains andconsumes the benefits provided by the Group's performance and whether the assets controlled bythe customer and whether the assets created by the Group have no substitute purpose, and whetherthe Group has the right to make executable claims for the portion that has been completed so far.The Group allocates the transaction prices based on the stand-alone selling prices to the variousperformance obligations identified in a single contract.
The Group estimates the amounts of consideration depending on which method the entity expectsto better predict the amount of consideration to which it will be entitled - the expected value or themost likely amount. Variable consideration is included in the transaction price only to the extentthat it is highly probable that a significant reversal in the cumulative amount of revenue recognizedwill not occur in the future periods.
- 34 -
*SGVFSM000264*
If the period between the transfer of the goods or services promised to the customer and thepayment of the customer is within one year, a practical simple method that does not adjust thepromised price for a significant financing component is used.
Real estate salesThe Group derives its real estate revenue from sale of lots, house and lot and condominium units.Revenue from the sale of these real estate projects under pre-completion stage are recognized overtime during the construction period (or percentage of completion) since based on the terms andconditions of its contract with the buyers, the Group’s performance does not create an asset with analternative use and the Group has an enforceable right to payment for performance completed todate.
In measuring the progress of its performance obligation over time, the Group uses the outputmethod. The Group recognizes revenue on the basis of direct measurements of the value tocustomers of the goods or services transferred to date, relative to the remaining goods or servicespromised under the contract. Progress is measured using survey of performance completed to date.This is based on the monthly project accomplishment report as approved by the constructionmanager which integrates the surveys of performance to date of the construction activities.
Any excess of progress of work over the right to an amount of consideration that is unconditional,recognized as residential and office development receivables, under trade receivables, is includedin the “contract asset” account in the asset section of the consolidated statement of financialposition.
Any excess of collections over the total of recognized trade receivables and contract assets isincluded in the “contract liabilities” account in the liabilities section of the consolidated statementof financial position.
Cost recognitionThe Group recognizes costs relating to satisfied performance obligations as these are incurredtaking into consideration the contract fulfillment assets. These include costs of land, landdevelopment costs, building costs, professional fees, depreciation, permits and licenses andcapitalized borrowing costs. These costs are allocated to the saleable area, with the portionallocable to the sold area being recognized as costs of sales while the portion allocable to theunsold area being recognized as part of real estate inventories.
Contract costs include all direct materials and labor costs and those indirect costs related tocontract performance. Expected losses on contracts are recognized immediately when it is probablethat the total contract costs will exceed total contract revenue. Changes in contract performance,contract conditions and estimated profitability, including those arising from contract penaltyprovisions, and final contract settlements which may result in revisions to estimated costs and grossmargins are recognized in the year in which the changes are determined.
Rental income under noncancellable and cancellable leases on investment properties is recognizedin the consolidated statement of income on a straight-line basis over the lease term and the terms ofthe lease, respectively, or based on a certain percentage of the gross revenue of the tenants, asprovided under the terms of the lease contract.
Marketing fees, management fees from administration and property management are recognizedwhen services are rendered.
Interest income is recognized as it accrues using the effective interest method.
- 35 -
*SGVFSM000264*
Dividend income is recognized when the Group’s right to receive the payment is established.
Commission income is recognized by reference to the percentage of collection of the agreed salesprice or depending on the term of the sale as provided under the marketing agreement.Management fees from administrative, property management and other fees are recognized whenservices are rendered.
Other customer related fees such as penalties and surcharges are recognized as they accrue, takinginto account the provisions of the related contract. Other income also includes sale of scrap andsludge oil which is recognized when there is delivery of goods to the buyer, and recovery frominsurance which is recognized when the right to receive payment is established.
Contract BalancesReceivablesA receivable represents the Group’s right to an amount of consideration that is unconditional(i.e., only the passage of time is required before payment of the consideration is due).
Contract assetsA contract asset is the right to consideration in exchange for goods or services transferred to thecustomer. If the Group performs by transferring goods or services to a customer before thecustomer pays consideration or before payment is due, a contract asset is recognized for the earnedconsideration that is conditional.
Contract liabilitiesA contract liability is the obligation to transfer goods or services to a customer for which the Grouphas received consideration (or an amount of consideration is due) from the customer. If a customerpays consideration before the Group transfers goods or services to the customer, a contract liabilityis recognized when the payment is made or the payment is due (whichever is earlier). Contractliabilities are recognized as revenue when the Group performs under the contract.
The contract liabilities also include payments received by the Group from the customers for whichrevenue recognition has not yet commenced.
Costs to obtain contractThe incremental costs of obtaining a contract with a customer are recognized as an asset if theGroup expects to recover them. The Group has determined that commissions paid to brokers andmarketing agents on the sale of pre-completed real estate units are deferred when recovery isreasonably expected and are charged to expense in the period in which the related revenue isrecognized as earned. Commission expense is included in the “Real estate costs and expenses”account in the consolidated statement of income.
Costs incurred prior to obtaining contract with customer are not capitalized but are expensed asincurred.
Amortization, derecognition and impairment of capitalized costs to obtain a contractThe Group amortizes capitalized costs to obtain a contract to cost of sales over the expectedconstruction period using percentage of completion following the pattern of real estate revenuerecognition. The amortization is included within cost of sales.
A capitalized cost to obtain a contract is derecognized either when it is disposed of or when nofurther economic benefits are expected to flow from its use or disposal.
- 36 -
*SGVFSM000264*
At each reporting date, the Group determines whether there is an indication that cost to obtain acontract maybe impaired. If such indication exists, the Group makes an estimate by comparing thecarrying amount of the assets to the remaining amount of consideration that the Group expects toreceive less the costs that relate to providing services under the relevant contract. In determiningthe estimated amount of consideration, the Group uses the same principles as it does to determinethe contract transaction price, except that any constraints used to reduce the transaction price willbe removed for the impairment test.
Where the relevant costs or specific performance obligations are demonstrating marginalprofitability or other indicators of impairment, judgement is required in ascertaining whether or notthe future economic benefits from these contracts are sufficient to recover these assets. Inperforming this impairment assessment, management is required to make an assessment of thecosts to complete the contract. The ability to accurately forecast such costs involves estimatesaround cost savings to be achieved over time, anticipated profitability of the contract, as well asfuture performance against any contract-specific performance indicators that could trigger variableconsideration, or service credits. Where a contract is anticipated to make a loss, these judgementsare also relevant in determining whether or not an onerous contract provision is required and howthis is to be measured.
Revenue Recognition prior to January 1, 2018
Revenue and Cost RecognitionRevenue is recognized to the extent that it is probable that the economic benefits will flow to theGroup and the amount of revenue can be reliably measured. The Group assesses its revenuearrangements against specific criteria in order to determine if it is acting as principal or agent.
The Group has concluded that it is acting as principal in all of its revenue arrangements.The following specific recognition criteria must also be met before revenue is recognized:
Automotive operationsRevenue from automotive operations arises from sale of manufactured vehicles and trading ofcompletely built-up vehicles and local and imported parts. Revenue is recognized when thesignificant risks and rewards of ownership of the goods have passed to the buyer (including certain“bill and hold” sales, wherein in the buyer takes title and accepts billing), usually on dispatch ofgoods.
Real estate salesReal estate revenue and cost from completed projects is accounted for using the full accrualmethod. The percentage of completion method is used to recognize income from sales of projectswhere the Group has material obligations under the sales contract to complete the project after theproperty is sold. Under this method, revenue is recognized as the related obligations are fulfilled,measured principally on the basis of the estimated completion of a physical proportion of thecontract work.
In accordance with PIC Q&A No. 2006-01, the POC method is used to recognize income fromsales of projects where the Group has material obligations under the sales contract to complete theproject after the property is sold, the equitable interest has been transferred to the buyer,construction is beyond preliminary stage (i.e., engineering, design work, construction contractsexecution, site clearance and preparation, excavation and the building foundation are finished), andthe costs incurred or to be incurred can be measured reliably. Under this method, revenue isrecognized as the related obligations are fulfilled, measured principally on the basis of theestimated completion of a physical proportion of the contract work.
- 37 -
*SGVFSM000264*
When the sale of real estate does not meet the requirements for revenue recognition, the sale isaccounted under the deposit method until all the conditions are met. Under this method, revenue isnot recognized, the receivable from the buyer is not recorded and the cash received from buyers arepresented under the ‘Customers’ deposits’ account in the liabilities section of the consolidatedstatement of financial position. The related real estate inventories continue to be reported in theconsolidated statement of financial position as ‘Inventories’.
Cost of condominium units sold before the completion of the development is determined on thebasis of the acquisition cost of the land plus its full development costs, which include estimatedcosts for future development works, as determined by the Group’s in-house technical staff.
The cost of inventory recognized in the consolidated statement of income upon sale is determinedwith reference to the specific costs incurred on the property, allocated to saleable area based onrelative size and takes into account the POC used for revenue recognition purposes.
Interest incomeInterest is recognized as it accrues using the effective interest method.
Rent incomeRent income under noncancellable leases is recognized in the consolidated statement of income ona straight-line basis over the lease term and the terms of the lease, respectively, or based on acertain percentage of the gross revenue of the tenants, as provided under the terms of the leasecontract.
Sale of goodsSale of goods is recognized from retail customers at the point of sale in the stores. This ismeasured at the fair value of the consideration received, excluding (or ‘net of,’ or ‘reduced for’)discounts, returns, rebates and sales taxes.
Rendering of servicesService fees from installation of parts and repairs and maintenance of vehicles are recognized asrevenue when the related services have been rendered.
Commission incomeCommission income is recognized by reference to the percentage of collection of the agreed salesprice or depending on the term of the sale as provided under the marketing agreement.
Management feesManagement fees from administrative, property management and other fees are recognized whenservices are rendered.
Dividend incomeDividend income is recognized when the Group’s right to receive the payment is established.
Other incomeOther customer related fees such as penalties and surcharges are recognized as they accrue, takinginto account the provisions of the related contract. Other income also includes sale of scrap andsludge oil which is recognized when there is delivery of goods to the buyer, and recovery frominsurance which is recognized when the right to receive payment is established.
- 38 -
*SGVFSM000264*
Expense RecognitionCost of goods and services soldCost of goods sold for vehicles and spare parts includes the purchase price of the products sold, aswell as costs that are directly attributable in bringing the merchandise to its intended condition andlocation. These costs include the costs of storing and transporting the products. Vendor returnsand allowances are generally deducted from cost of goods and services sold.
Other cost of goods sold includes Federal Land’s gasoline and food products, and are recognizedwhen goods are delivered which is usually at the point of sale in stores. Cost of services arerecognized when services are rendered.
Cost of goods manufactured and soldCost of goods manufactured and sold includes the purchase price of the products manufactured, aswell as costs that are directly attributable in bringing the merchandise to its intended condition andlocation.
CommissionsCommissions paid to sales or marketing agents on the sale of pre-completed real estate units aredeferred when recovery is reasonably expected and are charged to expense in the period in whichthe related revenue is recognized as earned. Accordingly, when the POC method is used,commissions are likewise charged to expense in the period the related revenue is recognized.These are recorded as ‘Prepaid expenses’ under ‘Prepayments and other current assets’ account.
General and administrative expensesGeneral and administrative expenses constitute costs of administering the business and areexpensed as incurred.
Cost of real estate salesCost of real estate sales is recognized consistent with the revenue recognition method applied.Cost of subdivision land and condominium units sold before the completion of the development isdetermined on the basis of the acquisition cost of the land plus its full development costs, whichinclude estimated costs for future development works, as determined by the Group’s project andconstruction department.The cost of inventory recognized in the consolidated statement of income upon sale is determinedwith reference to the specific costs incurred on the property, allocated to saleable area based onrelative size and takes into account the POC used for revenue recognition purposes.
Pension CostsThe Parent Company and its subsidiaries have funded, noncontributory defined benefit retirementplans, administered by trustees, covering their permanent employees.
Pension cost is actuarially determined using the projected unit credit method. This method reflectsservices rendered by employees up to the date of valuation and incorporates assumptionsconcerning employees’ projected salaries. Actuarial valuations are conducted with sufficientregularity, with option to accelerate when significant changes to underlying assumptions occur.
The net defined benefit liability or asset is the aggregate of the present value of the defined benefitobligation at the end of the reporting period reduced by the fair value of plan assets (if any),adjusted for any effect of limiting a net defined benefit asset to the asset ceiling. The asset ceilingis the present value of any economic benefits available in the form of refunds from the plan orreductions in future contributions to the plan.
- 39 -
*SGVFSM000264*
Defined benefit costs comprise the following:
a. service cost;b. net interest on the net defined benefit liability or asset; andc. remeasurements of net defined benefit liability or asset.
Service costs which include current service costs, past service costs and gains or losses on non-routine settlements are recognized as expense in the consolidated statements of income. Pastservice costs are recognized when plan amendment or curtailment occurs. These amounts arecalculated periodically by independent qualified actuaries. Net interest on the net defined benefitliability or asset is the change during the period in the net defined benefit liability or asset thatarises from the passage of time which is determined by applying the discount rate based onPhilippine government bonds to the net defined benefit liability or asset. Net interest on the netdefined benefit liability or asset is recognized as expense or income in the consolidated statementsof income.
Remeasurements comprising actuarial gains and losses, return on plan assets and any change in theeffect of the asset ceiling (excluding net interest on defined benefit liability) are recognizedimmediately in other comprehensive income in the period in which they arise. Remeasurementsare not reclassified to profit or loss in subsequent periods.
Plan assets are assets that are held by a long-term employee benefit fund or qualifying insurancepolicies. Plan assets are not available to the creditors of the Group, nor can they be paid directly tothe Group. Fair value of plan assets is based on market price information. When no market priceis available, the fair value of plan assets is estimated by discounting expected future cash flowsusing a discount rate that reflects both the risk associated with the plan assets and the maturity orexpected disposal date of those assets (or, if they have no maturity, the expected period until thesettlement of the related obligations). If the fair value of the plan assets is higher than the presentvalue of the defined benefit obligation, the measurement of the resulting defined benefit asset islimited to the present value of economic benefits available in the form of refunds from the plan orreductions in future contributions to the plan.
The Group’s right to be reimbursed of some or all of the expenditure required to settle a definedbenefit obligation is recognized as a separate asset at fair value only when reimbursement isvirtually certain.
Employee leave entitlementEmployee entitlements to annual leave are recognized as a liability when they are accrued to theemployees. The undiscounted liability for leave expected to be settled wholly before twelve (12)months after the end of the annual reporting period is recognized for services rendered byemployees up to the end of the reporting period.
Income TaxCurrent taxCurrent tax assets and liabilities for the current and prior periods are measured at the amountexpected to be recovered from or paid to the taxation authorities. The tax rates and tax laws usedto compute the amount are those that are enacted or substantively enacted at the financial reportingdates.
- 40 -
*SGVFSM000264*
Deferred taxDeferred tax is provided using the balance sheet liability method on all temporary differences, withcertain exceptions, at the financial reporting date between the tax bases of assets and liabilities andtheir carrying amounts for financial reporting purposes.
Deferred tax liability is recognized for all taxable temporary differences. Deferred tax asset isrecognized for all deductible temporary differences, carryforward benefit of unused tax creditsfrom excess minimum corporate income tax (MCIT) and net operating loss carryover (NOLCO), tothe extent that it is probable that taxable income will be available against which the deductibletemporary differences and carryforward benefit of unused tax credits from MCIT and NOLCO canbe utilized. Deferred income tax, however, is not recognized when it arises from the initialrecognition of an asset or liability in a transaction that is not a business combination and, at thetime of the transaction, affects neither the accounting income nor taxable income.
The carrying amount of deferred tax asset is reviewed at each reporting date and reduced to theextent that it is no longer probable that sufficient taxable income will be available to allow all orpart of the deferred tax asset to be utilized.
Deferred tax asset and liabilities are measured at the tax rate that is expected to apply to the periodwhen the asset is realized or the liability is settled, based on tax rate and tax laws that have beenenacted or substantively enacted at the reporting date.
Foreign Currency TransactionsThe Group’s consolidated financial statements are presented in Philippine pesos, which is also theParent Company’s functional currency. Each entity within the Group determines its ownfunctional currency and items included in the consolidated financial statements of each entity aremeasured using that functional currency.
Transactions and balancesTransactions denominated in foreign currency are recorded using the exchange rate prevailing atthe date of the transactions. Monetary assets and liabilities denominated in foreign currencies areretranslated using the closing exchange rates prevailing at reporting date. Nonmonetary items thatare measured in terms of historical cost in foreign currency are translated using the exchange rateas at the date of the initial transaction and are not subsequently restated. All foreign exchangedifference are taken to the consolidated statements of income.
Segment ReportingThe Group’s operating businesses are organized and managed separately according to the nature ofthe products and services provided, with each segment representing a strategic business unit thatoffers different products and serves different markets. Financial information on the Group’sbusiness segments is presented in Note 35.
Borrowing CostsBorrowing costs directly attributable to the acquisition or construction of an asset that necessarilytakes a substantial period of time to get ready for its intended use or sale are capitalized as part ofthe cost of the respective assets (included in “Real estate inventories” and “Investment properties”accounts in the consolidated statement of financial position). Capitalization ceases when pre-selling of real estate inventories under construction commences. All other borrowing costs areexpensed in the period in which they occur. Borrowing costs consist of interest and other costs thatan entity incurs in connection with the borrowing of funds.
- 41 -
*SGVFSM000264*
The interest capitalized is calculated using the Group’s weighted average cost of borrowings afteradjusting for borrowings associated with specific developments. Where borrowings are associatedwith specific developments, the amounts capitalized is the gross interest incurred on thoseborrowings less any investment income arising on their temporary investment.
The capitalization of finance costs is suspended if there are prolonged periods when developmentactivity is interrupted. Interest is also capitalized on the purchase cost of a site of propertyacquired specifically for redevelopment but only where activities necessary to prepare the asset forredevelopment are in progress.
ProvisionsProvisions are recognized when the Group has: (a) a present obligation (legal or constructive) as aresult of a past event; (b) it is probable that an outflow of resources embodying economic benefitswill be required to settle the obligation; and (c) a reliable estimate can be made of the amount ofthe obligation. Where the Group expects a provision to be reimbursed, the reimbursement isrecognized as a separate asset but only when the reimbursement is virtually certain. If the effect ofthe time value of money is material, provisions are determined by discounting the expected futurecash flows at a pre-tax rate that reflects current market assessments of the time value of moneyand, where appropriate, the risks specific to the liability. Where discounting is used, the increasein the provision due to the passage of time is recognized as interest expense. Provisions arereviewed at each reporting date and adjusted to reflect the current best estimate. Where the Groupexpects a provision to be reimbursed, the reimbursement is recognized as a separate asset but onlywhen the receipt of the reimbursement is virtually certain. The expense relating to any provision ispresented in the consolidated statement of comprehensive income, net of any reimbursement.
Provision for product warrantiesProvision for product warranties are recognized when sale of the related products areconsummated. The best estimate of the provision is recorded based on three (3) year warrantycoverage provided by the Group as part of the sold product. Reversals are made against provisionfor the expired portion.
LeasesGroup as lesseePolicies applicable beginning January 1, 2019The Group assesses at contract inception whether a contract is, or contains a lease. A contractcontains a lease if it conveys the right to control the use of an identified asset for a period of time inexchange for consideration. The Group applies a single recognition and measurement approach forall leases, except for short-term leases and leases of low-value assets. The Group recognizes leaseliabilities to make lease payments and ROU assets representing the right-of-use the underlyingassets.
ROU assetsThe Group recognizes ROU assets (included in ‘Property and Equipment’) at the commencementdate of the lease (i.e. the date the underlying asset is available for use). ROU assets are measured atcost less any accumulated depreciation and impairment losses, and adjusted for any remeasurementof lease liabilities. The cost of ROU assets includes the amount of lease liabilities recognized andlease payments made at or before the commencement date less any lease incentives received. ROU

- 42 -
*SGVFSM000264*
assets are depreciated on a straight line basis over the shorter of the lease term and the estimateduseful lives of the assets, as follows:
YearsLand 50Office space 2 to 3
Lease liabilitiesAt the commencement date of the lease, the Group recognizes lease liabilities measured at thepresent value of lease payments to be made over the lease term. In calculating the present value oflease payments, the Group uses its incremental borrowing rate at the lease commencement datebecause the interest rate implicit in the lease is not readily determinable. After the commencementdate, the amount of lease liabilities is increased to reflect the accretion of interest (included in‘Interest expense on bills payable and SSURA, bonds payable, subordinated debt and others) andreduced for the lease payments made. In addition, the carrying amount of lease liabilities isremeasured if there is a modification, a change in the lease term or a change in the lease payments(Note 20).
Short-term leases and leases of low-value assetsThe Group applies the short-term lease recognition exemption to its short-term leases of officespaces (i.e., those leases that have a lease term of 12 months or less from the commencement dateand do not contain a purchase option). It also applies the lease of low-value assets recognitionexemption to leases of other equipment that are considered to be of low value (i.e., those withvalue of less than P=250,000). Lease payments on short-term leases of low-value assets arerecognized as expense on a straight-line basis over the lease term.
Residual value of leased assets and deposits on lease contractsThe residual value of leased assets, which approximates the amount of guaranty deposit paid by thelessee at the inception of the lease, is the estimated proceeds from the sale of the leased asset at theend of the lease term. At the end of the lease term, the residual value of the leased asset is generallyapplied against the guaranty deposit of the lessee when the lessee decides to buy the leased asset.
Policies applicable prior to January 1, 2019The determination of whether an arrangement is, or contains a lease is based on the substance ofthe arrangement and requires an assessment of whether the fulfillment of the arrangement isdependent on the use of a specific asset or assets and the arrangement conveys a right to use theasset. A reassessment is made after inception of the lease only if one of the following applies:(a) there is a change in contractual terms, other than a renewal or extension of the arrangement;(b) a renewal option is exercised or extension granted, unless that term of the renewal or extension
was initially included in the lease term;
(c) there is a change in the determination of whether fulfillment is dependent on a specified asset;or
(d) there is a substantial change to the asset.
Where a reassessment is made, lease accounting shall commence or cease from the date when thechange in circumstances gives rise to the reassessment for scenarios (a), (c) or (d) above, and at thedate of renewal or extension period for scenario (b).
Finance leases, which transfer to the Group substantially all the risks and benefits incidental to theownership of the leased item, are capitalized at the inception of the lease at the fair value of theleased property or, if lower, at the present value of the minimum lease payments and included in
- 43 -
*SGVFSM000264*
‘Property and equipment’ with the corresponding liability to the lessor included in ‘Leaseliabilities’. Lease payments are apportioned between the finance charges and reduction of the leaseliability so as to achieve a constant rate of interest on the remaining balance of the liability.Finance charges are recorded directly to ‘Interest expense’.
Capitalized leased assets are depreciated over the shorter of the estimated useful lives of the assetsor the respective lease terms, if there is no reasonable certainty that the Group will obtainownership by the end of the lease term.
Leases where the lessor retains substantially all the risk and benefits of ownership of the assets areclassified as operating leases. Operating lease payments are recognized as an expense in thestatement of income under ‘Ocupancy and equipment-related cost’ on a straight-line basis over thelease term. Contingent rental payables are recognized as expense in the year in which they areincurred. Any prepaid rent and accrued rent were recognized under ‘Prepaid expenses’ lodged in‘Other assets’ and ‘Accrued other expenses’ lodged in ‘Accrued interest and other expenses’,respectively.
Group as lessorFinance leases, where the Group transfers substantially all the risks and benefits incidental to theownership of the leased item to the lessee, are included in the statement of financial position under‘Loans and receivables’. All income resulting from the receivable is included in ‘Interest income’in the statement of income.
Leases where the Group does not transfer substantially all the risks and benefits of ownership ofthe assets are classified as operating leases. Initial direct costs incurred in negotiating operatingleases are added to the carrying amount of the leased asset and recognized over the lease term onthe same basis as the rental income. Contingent rents are recognized as revenue in the year inwhich they are earned.
Earnings Per ShareBasic earnings per share is calculated by dividing the net income for the year attributable to theowners of the Parent Company by the weighted average number of common shares outstandingduring the year, after considering the retroactive effect of stock dividend declaration, if any.Diluted earnings per share attributable to owners of the Parent Company is calculated in the samemanner assuming that, the weighted average number of common shares outstanding is adjusted forpotential common shares from the assumed exercise of dilutive instruments.
ContingenciesContingent liabilities are not recognized in the consolidated financial statements. These aredisclosed unless the possibility of an outflow of resources embodying economic benefits is remote.Contingent assets are not recognized in the consolidated financial statements but disclosed when aninflow of economic benefits is probable.
Events after Financial Reporting DatePost year-end events that provide additional information about the Group’s position at the reportingdate (adjusting events) are reflected in the consolidated financial statements. Post year-end eventsthat are not adjusting events are disclosed in the notes to the consolidated financial statementswhen material.
- 44 -
*SGVFSM000264*
Standards Issued But Not Yet EffectiveThe Group will adopt the following standards and interpretations when these become effective.Except as otherwise indicated, the Group does not expect the adoption of these new and amendedPFRS and Philippine Interpretations to have significant impact on its consolidated financialstatements.
Effective beginning on or after January 1, 2020
· Amendments to PFRS 3, Definition of a BusinessThe amendments to PFRS 3 clarify the minimum requirements to be a business, remove theassessment of a market participant’s ability to replace missing elements, and narrow thedefinition of outputs. The amendments also add guidance to assess whether an acquiredprocess is substantive and add illustrative examples. An optional fair value concentration testis introduced which permits a simplified assessment of whether an acquired set of activitiesand assets is not a business.
An entity applies those amendments prospectively for annual reporting periods beginning on orafter January 1, 2020, with earlier application permitted. These amendments will apply onfuture business combinations of the Group.
· Amendments to PAS 1, Presentation of Financial Statements, and PAS 8, Accounting Policies,Changes in Accounting Estimates and Errors, Definition of MaterialThe amendments refine the definition of material in PAS 1 and align the definitions usedacross PFRSs and other pronouncements. They are intended to improve the understanding ofthe existing requirements rather than to significantly impact an entity’s materiality judgements.
An entity applies those amendments prospectively for annual reporting periods beginning on orafter January 1, 2020, with earlier application permitted.
Effective beginning on or after January 1, 2021
· PFRS 17, Insurance ContractsPFRS 17 is a comprehensive new accounting standard for insurance contracts coveringrecognition and measurement, presentation and disclosure. Once effective, PFRS 17 willreplace PFRS 4, Insurance Contracts. This new standard on insurance contracts applies to alltypes of insurance contracts (i.e., life, non-life, direct insurance and re-insurance), regardless ofthe type of entities that issue them, as well as to certain guarantees and financial instrumentswith discretionary participation features. A few scope exceptions will apply.
The overall objective of PFRS 17 is to provide an accounting model for insurance contractsthat is more useful and consistent for insurers. In contrast to the requirements in PFRS 4, whichare largely based on grandfathering previous local accounting policies, PFRS 17 provides acomprehensive model for insurance contracts, covering all relevant accounting aspects. Thecore of PFRS 17 is the general model, supplemented by:
• A specific adaptation for contracts with direct participation features (the variable feeapproach)
• A simplified approach (the premium allocation approach) mainly for short-durationcontracts
- 45 -
*SGVFSM000264*
PFRS 17 is effective for reporting periods beginning on or after January 1, 2021, withcomparative figures required. Early application is permitted.
The Group is currently assessing the impact of adopting PFRS 17.
Deferred effectivity
· Amendments to PFRS 10, Consolidated Financial Statements, and PAS 28, Sale orContribution of Assets between an Investor and its Associate or Joint VentureThe amendments address the conflict between PFRS 10 and PAS 28 in dealing with the loss ofcontrol of a subsidiary that is sold or contributed to an associate or joint venture. Theamendments clarify that a full gain or loss is recognized when a transfer to an associate or jointventure involves a business as defined in PFRS 3. Any gain or loss resulting from the sale orcontribution of assets that does not constitute a business, however, is recognized only to theextent of unrelated investors’ interests in the associate or joint venture.
On January 13, 2016, the Financial Reporting Standards Council deferred the original effectivedate of January 1, 2016 of the said amendments until the International Accounting StandardsBoard (IASB) completes its broader review of the research project on equity accounting thatmay result in the simplification of accounting for such transactions and of other aspects ofaccounting for associates and joint ventures.
· PIC Q&A No. 2018-14, PFRS 15 - Accounting for Cancellation of Real Estate Sales
· PIC Q&A No. 2018-15, PAS 1 - Classification of Advances in the Nature of Prepayments:Current vs. Non – currentIn 2018, Philippine Interpretations Committee (PIC) issued PIC Q&A No. 2018-14 and 2018-15 which provides guidance on some implementation issues with regard to the adoption ofPFRS 15. Subsequently, SEC issued SEC Memorandum Circular No. 14 Series of 2018 andSEC Memorandum Circular No. 3 Series of 2019, respectively, providing relief to the realestate industry by deferring the applications of some of the provisions of the above PIC Q&As.Effective January 1, 2021, real estate companies need to adopt the PIC Q&As and anysubsequent amendments thereof retrospectively, or as the SEC will later prescribe.
3. Management’s Judgments and Use of Estimates
The preparation of the consolidated financial statements in compliance with PFRS requires theGroup’s management to make estimates and assumptions that affect the amounts reported in theconsolidated financial statements and accompanying notes. The estimates and assumptions used inthe accompanying consolidated financial statements are based upon management’s evaluation ofrelevant facts and circumstances as of reporting date. Actual results could differ from suchestimates.
Estimates and judgments are continually evaluated and are based on historical experience and otherfactors, including expectations of future events that are believed to be reasonable undercircumstances.
- 46 -
*SGVFSM000264*
JudgmentsIn the process of applying the Group’s accounting policies, management has made the followingjudgments, apart from those involving estimations, which have the most significant effect on theamounts recognized in the consolidated financial statements:
Accounting for redemption of shares in PCFIIn assessing whether the Group has lost control over PCFI, the Group considers if the followingfactors are still present: (a) power over the investee, (b) exposure, or rights, to variable returns fromits involvement with the investee; and (c) the ability to use its power over the investee to affect theamount of the investor’s returns. The Group assessed that it lost of control over PCFI upon thesigning of redemption agreement, combined with the approval of the transaction by the PhilippineCompetition Commission. See Note 12 for the details of the transaction.
Assessment of control over investeesThe determination on whether the Group has control over an investee requires significantjudgment. For this, the Group considers the following factors: (a) power over the investee, (b)exposure, or rights, to variable returns from its involvement with the investee; and (c) the ability touse its power over the investee to affect the amount of the investor’s returns. In assessing whetherthe Group has power over the investee, the Group assesses whether it has existing rights that give itthe current ability to direct the relevant activities of the investee.
Joint arrangementsThe Group has investments in joint arrangements. The Group has joint control over thesearrangements as under the contractual arrangements, unanimous consent is required from all theparties to the agreements for all relevant activities.
Determination of significant influence over another entityThe determination of significant influence over another entity, other than the rebuttablepresumption of ownership over twenty percent (20.0%), requires significant judgment. In makingjudgment, the Group evaluates existence of the following:
· representation on the BOD or equivalent governing body of the investee;· participation in policy-making processes, including participation in decisions about dividends
or other distributions;· material transactions between the entity and its investee;· interchange of managerial personnel; or· provision of essential technical information.
As at December 31, 2019 and 2018, the Group determined that it exercises significant influenceover MPIC in which it holds 15.52% and 15.55% ownership interest, respectively. Although theGroup holds less than 20.0% of the ownership interest and voting rights in MPIC, the Groupconsiders that it exercises significant influence through its entitlement to nominate at least two (2)out of fifteen (15) directors of MPIC. The Parent Company is also entitled to nominate one (1) outof three (3) members in each of the Audit Committee (AC), Risk Management Committee (RMC)and Governance Committee (GC) of MPIC.
The combination of the Parent Company’s 15.52% ownership over MPIC and representation in theBOD, AC, RMC and GC of MPIC provides the Parent Company with the ability to exercisesignificant influence over the operating and financial policies of MPIC. Accordingly, the ParentCompany accounted for its investment in MPIC as an associate using equity method of accounting.
- 47 -
*SGVFSM000264*
Revenue and cost recognitionSelecting an appropriate revenue recognition method for a particular real estate sale transactionrequires certain judgments based on, among others:
· buyer’s commitment on the sale which may be ascertained through the significance of thebuyer’s initial investment; and
· stage of completion of the project.
Existence of a contractThe Group’s primary document for a contract with a customer is a signed contract to sell. It hasdetermined, however, that in cases wherein contract to sell are not signed by both parties, thecombination of its other signed documentation such as reservation agreement, official receipts,buyers’ computation sheets and invoices, would contain all the criteria to qualify as contract withthe customer under PFRS 15.
In addition, part of the assessment process of the Group before revenue recognition is to assess theprobability that the Group will collect the consideration to which it will be entitled in exchange forthe real estate property that will be transferred to the customer. In evaluating whether collectabilityof an amount of consideration is probable, an entity considers the significance of the customer’sinitial payments in relation to the total contract price. Collectability is also assessed by consideringfactors such as past history with the customer, age and pricing of the property. Managementregularly evaluates the historical cancellations and back-outs if it would still support its currentthreshold of customers’ equity before commencing revenue recognition.
Revenue recognition method and measure of progressBeginning 1 January 2018, the Group concluded that revenue for real estate sales is to berecognized over time because: (a) the Group’s performance does not create an asset with analternative use and; (b) the Group has an enforceable right for performance completed to date. Thepromised property is specifically identified in the contract and the contractual restriction on theGroup’s ability to direct the promised property for another use is substantive. This is because theproperty promised to the customer is not interchangeable with other properties without breachingthe contract and without incurring significant costs that otherwise would not have been incurred inrelation to that contract. In addition, under the current legal framework, the customer iscontractually obliged to make payments to the developer up to the performance completed to date.In addition, the Group requires a certain percentage of buyer's payments of total selling price(buyer's equity), to be collected as one of the criteria in order to initiate revenue recognition.Reaching this level of collection is an indication of buyer’s continuing commitment and theprobability that economic benefits will flow to the Group. The Group considers that the initial andcontinuing investments by the buyer of about 10% would demonstrate the buyer’s commitment topay.
The Group has determined that output method used in measuring the progress of the performanceobligation faithfully depicts the Group’s performance in transferring control of real estatedevelopment to the customers.
Definition of default and credit-impaired financial assetsThe Group defines a financial instrument as in default, which is fully aligned with the definition ofcredit-impaired, when it meets one or more of the following criteria:
Quantitative criteria – for sales contracts receivable, the customer receives a notice of cancellationand does not continue the payments.
- 48 -
*SGVFSM000264*
Qualitative criteriaThe customer meets unlikeliness to pay criteria, which indicates the customer is in significantfinancial difficulty. These are instances where:a. The customer is experiencing financial difficulty or is insolventb. The customer is in breach of financial covenant(s)c. An active market for that financial assets has disappeared because of financial difficultiesd. Concessions have been granted by the Group, for economic or contractual reasons relating to
the customer’s financial difficultye. It is becoming probable that the customer will enter bankruptcy or other financial
reorganization
The criteria above have been applied to the financial instruments held by the Group and areconsistent with the definition of default used for internal credit risk management purposes. Thedefault definition has been applied consistently to model the Probability of Default (PD), LossGiven Default (LGD) and Exposure at Default (EAD) throughout the Group’s expected losscalculation. Incorporation of forward-looking information The Group incorporates forward-lookinginformation into both its assessment of whether the credit risk of an instrument has increasedsignificantly since its initial recognition and its measurement of ECL.
To do this, the Group considers a range of relevant forward-looking macro-economic assumptionsfor the determination of unbiased general industry adjustments and any related specific industryadjustments that support the calculation of ECLs. Based on the Group’s evaluation and assessmentand after taking into consideration external actual and forecast information, the Group formulates a‘base case’ view of the future direction of relevant economic variables as well as a representativerange of other possible forecast scenarios. This process involves developing two or more additionaleconomic scenarios and considering the relative probabilities of each outcome. Externalinformation includes economic data and forecasts published by governmental bodies, monetaryauthorities and selected private-sector and academic institutions.
The base case represents a most-likely outcome and is aligned with information used by the Groupfor other purposes such as strategic planning and budgeting. The other scenarios represent moreoptimistic and more pessimistic outcomes. Periodically, the Group carries out stress testing of moreextreme shocks to calibrate its determination of these other representative scenarios.
The Group has identified and documented key drivers of credit risk and credit losses of eachportfolio of financial instruments and, using an analysis of historical data, has estimatedrelationships between macro-economic variables and credit risk and credit losses.
Collectibility of the sales priceBefore January 1, 2018, in determining whether the sales prices are collectible, the Groupconsiders that initial and continuing investments by the buyer of about 10.00% would demonstratethe buyer’s commitment to pay.
Incorporation of forward-looking informationThe Group incorporates forward-looking information into both its assessment of whether the creditrisk of an instrument has increased significantly since its initial recognition and its measurement ofECL.
To do this, the Group considers a range of relevant forward-looking macro-economic assumptionsfor the determination of unbiased general industry adjustments and any related specific industryadjustments that support the calculation of ECLs. Based on the Group’s evaluation and assessmentand after taking into consideration external actual and forecast information, the Group formulates a
- 49 -
*SGVFSM000264*
‘base case’ view of the future direction of relevant economic variables as well as a representativerange of other possible forecast scenarios. This process involves developing two or more additionaleconomic scenarios and considering the relative probabilities of each outcome. Externalinformation includes economic data and forecasts published by governmental bodies, monetaryauthorities and selected private-sector and academic institutions.
The base case represents a most-likely outcome and is aligned with information used by the Groupfor other purposes such as strategic planning and budgeting. The other scenarios represent moreoptimistic and more pessimistic outcomes. Periodically, the Group carries out stress testing of moreextreme shocks to calibrate its determination of these other representative scenarios.
The Group has identified and documented key drivers of credit risk and credit losses of eachportfolio of financial instruments and, using an analysis of historical data, has estimatedrelationships between macro-economic variables and credit risk and credit losses.
Operating lease commitments – the Group as lessorThe Group entered into commercial property leases on its retail mall, investment properties andcertain units of its real estate projects to different parties for a specific amount depending on thelease contracts. The Group has determined that based on the evaluation of the terms and conditionsof the arrangements (i.e., the lease does not transfer the ownership of the asset to the lessee by theend of the lease term, the lessee has no option to purchase the asset at a price that is expected to besufficiently lower than the fair value at the date the option is exercisable, and the lease term is notfor the major part of the asset’s economic life), that it retains all significant risks and rewards ofownership of these properties and so accounts for the contracts as operating leases.
Distinction between investment properties and owner-occupied propertiesThe Group determines whether a property qualifies as investment property. In making itsjudgment, the Group considers whether the property generates cash flows largely independent ofthe other assets held by an entity. Owner-occupied properties generate cash flows that areattributable not only to property but also to the other assets used in the production or supplyprocess.
Some properties comprise a portion that is held to earn rentals or for capital appreciation andanother portion that is held for use in the production or supply of goods or services or foradministrative purposes. If these portions cannot be sold separately as of financial reporting date,the property is accounted for as investment property only if an insignificant portion is held for usein the production or supply of goods or services or for administrative purposes. Judgment isapplied in determining whether ancillary services are so significant that a property does not qualifyas investment property. The Group considers each property separately in making its judgment.
ContingenciesThe Group is currently involved in a few legal proceedings. The estimate of the probable costs forthe resolution of these claims has been developed in consultation with outside counsel handling thedefense in these matters and is based upon an analysis of potential results. The Group currentlydoes not believe that these proceedings will have a material effect on the Group’s financialposition. It is possible, however, that future results of operations could be materially affected bychanges in the estimates or in the effectiveness of the strategies relating to these proceedings.
Allocation of costs and expensesCosts and expenses are classified as exclusive and common. Exclusive costs such as raw materialsand direct labor are charged directly to the product line. Common costs and expenses are allocatedusing sales value.
- 50 -
*SGVFSM000264*
Discontinued operationsThe Group determined that the redemption of shares, equivalent to 51% ownership interest, byPCFI will qualify for presentation of the former subsidiary as discontinued operations since itrepresents a separate line of business and the operations and cash flows of PCFI can be clearlydistinguished, operationally and for financial reporting purposes, from the rest of the Group.(Note 12)
Management’s Use of EstimatesThe key assumptions concerning the future and other key sources of estimation and uncertainty atthe financial reporting date, that have a significant risk of causing a material adjustment to thecarrying amounts of assets and liabilities within the next financial year are discussed below.
Revenue recognitionThe Group’s revenue recognition policies require management to make use of estimates andassumptions that may affect the reported amounts of revenues and costs. The Group’s revenuefrom real estate sales recognized based on the percentage of completion are measured principallyon the basis of the estimated completion of a physical proportion of the contract work, and byreference to the actual costs incurred to date over the estimated total costs of the project. Theestimation of the total cost of the real estate project requires technical inputs from projectdevelopment engineers. See Note 5 for the related balances.
The carrying amount of installment contracts receivables is disclosed in Note 5. The Grouprecognized real estate sales in 2019 and 2018 amounting to P=7.98 billion and P=9.34 billion,respectively.
Estimating allowance for impairment losses (Prior to January 1, 2018)The Group reviews its loans and receivables at each reporting date to assess whether an allowancefor impairment should be recorded in the consolidated statement of financial position and anychanges thereto in profit or loss. In particular, judgment by management is required in theestimation of the amount and timing of future cash flows when determining the level of allowancerequired such as the financial condition of the counterparty and net selling prices of collateral.Such estimates are based on assumptions about a number of factors. Actual results may also differ,resulting in future changes to the allowance.
The Group maintains allowance for impairment losses based on the result of the individual andcollective assessment under PAS 39. Under the individual assessment, the Group is required toobtain the present value of estimated cash flows using the receivable’s original EIR. Impairmentloss is determined as the difference between the receivable’s carrying balance and the computedpresent value. The collective assessment would require the Group to classify its receivables basedon the credit risk characteristics (industry, customer type, customer location, past-due status andterm) of the customers. Impairment loss is then determined based on historical loss experience ofthe receivables grouped per credit risk profile. Historical loss experience is adjusted on the basis ofcurrent observable data to reflect the effects of current conditions that did not affect the period onwhich the historical loss experience is based and to remove the effects of conditions in thehistorical period that do not exist currently. The methodology and assumptions used for theindividual and collective assessments are based on management’s judgment and estimate.Therefore, the amount and timing of recorded expense for any period would differ depending onthe judgments and estimates made for the year.
The carrying values of these receivables and due from related parties are disclosed in Notes 5and 27, respectively.
- 51 -
*SGVFSM000264*
Evaluating net realizable value of inventoriesInventories are valued at the lower of cost and net realizable value. The Group reviews itsinventory to assess NRV at least annually. The amount and timing of recorded expenses for anyperiod would differ if different judgments were made or different estimates were utilized.
Real estate inventoriesThe Group adjusts the cost of its real estate inventories to net realizable value based on itsassessment of the recoverability of the inventories. In determining the recoverability of theinventories, management considers whether those inventories are damaged or if their selling priceshave declined. Likewise, management also considers whether the estimated costs of completion orthe estimated costs to be incurred to make the sale have increased. The amount and timing ofrecorded expense for any period would differ if different judgments were made or differentestimates were utilized.
Estimating the useful life of non-financial assetsThe Group determines the EUL of its intangibles assets based on the period over which the assetsare expected to be available for use. The Group reviews annually the EUL of property andequipment, investment properties and intangible assets based on factors that include assetutilization, internal technical evaluation, and anticipated use of the assets. It is possible that futureresults of operations could be materially affected by changes in these estimates brought about bychanges in the factors mentioned. A reduction in the EUL of intangible assets would increase therecorded amortization expense.
Customer relationship pertains to Toyota’s contractual arrangements with its top dealer customerswhich lay out the principal terms upon which its dealers agree to do business. Managementassessed the useful life of the customer relationship to be indefinite since management is of theview that there is no foreseeable limit to the period over which the customer relationship isexpected to generate net cash inflows to Toyota.
The said assessment is based on the track record of stability for the auto industry and the Toyotabrand. Added to this is the commitment of management to continue to invest for the long term, toextend the period over which the intangible asset is expected to continue to provide economicbenefits.
The carrying values of investment properties, property and equipment, intangible assets fromcustomer relationship and software costs are disclosed in Notes 9, 11 and 13, respectively.
Evaluating impairment of non-financial assetsThe Group reviews input VAT, investments in and advances to associates and joint venture,investment properties, creditable withholding tax, property and equipment, intangible assets fromcustomer relationship, software costs, and other noncurrent assets for impairment. This includesconsidering certain indications of impairment such as significant changes in asset usage, significantdecline in assets’ market value, obsolescence or physical damage of an asset, plans in the realestate projects, significant underperformance relative to expected historical or projected futureoperating results and significant negative industry or economic trends.
As described in the accounting policy, the Group estimates the recoverable amount as the higher ofthe fair value less cost to sell and value in use. In determining the present value of estimated futurecash flows expected to be generated from the continued use of the assets, the Group is required tomake estimates and assumptions that may affect investments in and advances to associates andjoint venture, property and equipment, and software cost.
- 52 -
*SGVFSM000264*
The Group considers the significant and prolonged decline in the quoted market price of MPIC asan indicator of impairment. Accordingly, the Group conducted an impairment assessment of itsinvestment in MPIC. The Group uses the higher between fair value less cost to sell and value inuse in determining the recoverable amount. The recoverable amount of the investment in MPIChas been determined based on the sum of the parts of the value in use and fair value less cost to sellof the MPIC Group. Based on the Group's impairment testing, the investment in MPIC isdetermined to be not impaired.
The carrying values of input VAT and creditable withholding taxes, investments in associates andjoint ventures, investment properties, property and equipment, intangible assets from customerrelationship, software costs, and other noncurrent assets are disclosed in Notes 7, 8, 9, 11, 13 and14, respectively.
Estimating the IBR for lease liabilitiesThe Group cannot readily determine the interest rate implicit in the lease, therefore, it uses its IBRto measure lease liabilities. The IBR for lease liabilities is the rate of interest that the Group wouldhave to pay to borrow over a similar term, and with a similar security, the funds necessary to obtainan asset of a similar value to the ROU asset in a similar economic environment. The Groupestimates the IBR for lease liabilities using observable inputs (by reference to prevailing risk-freerates) adjusted to take into account the entity’s credit risk (i.e., credit spread).
Estimating impairment of AFS investments (Prior to January 1, 2018)The Group treats AFS investments as impaired when there has been significant or prolongeddecline in the fair value below its cost or where other objective evidence of impairment exists. Thedetermination of what is ‘significant’ or when is ‘prolonged’ requires judgment. The Group treats‘significant’ generally as 20.00% or more of the cost of AFS and ‘prolonged’ if greater than sixmonths. In addition, the Group evaluates other factors, including normal and/or unusual volatilityin share price for quoted equities and the future cash flows and the discount factors for unquotedequities. The Group also considers the ability of the investee company to provide dividends.
The carrying values of AFS investments is disclosed in Note 10. The change in fair value of AFSinvestments is recorded in the consolidated statements of comprehensive income. The netunrealized gain on AFS investments is disclosed in Note 10.
Impairment of goodwill and intangible assets with indefinite useful lifeThe Group conducts an annual review for any impairment in the value of goodwill and intangibleassets with indefinite useful life (i.e., customer relationship). Goodwill is written down forimpairment when the net present value of the forecasted future cash flows from the business isinsufficient to support its carrying value. The Group estimates key inputs such as discountedfuture cash flows forecasts, expected gross margins, discount rates and long-term growth rates.The Group uses the weighted average cost of capital in discounting the expected cash flows fromspecific CGUs.
Refer to Note 13 for the details regarding the carrying values of the Group’s goodwill andintangible assets as well as details regarding the impairment review and assessment.
Recognition of deferred tax assetsThe Group reviews the carrying amounts of deferred taxes at each reporting date and reducesdeferred tax asset to the extent that it is no longer probable that sufficient taxable profit will beavailable to allow all or part of the deferred tax asset to be utilized. However, there is no assurancethat the Group will generate sufficient taxable profit to allow all or part of deferred income tax
- 53 -
*SGVFSM000264*
assets to be utilized. The Group looks at its projected performance in assessing the sufficiency offuture taxable income.
The recognized and unrecognized deferred tax assets on temporary differences of the Group aredisclosed in Note 29.
Estimating pension and other retirement benefitsThe determination of the obligation and cost of pension and other retirement benefits is dependenton the selection of certain assumptions used by actuaries in calculating such amounts. Thoseassumptions are described in Note 28 to the consolidated statement of financial position andinclude among others, discount rates, turnover rates and rates of salary increase. While the Groupbelieves that the assumptions are reasonable and appropriate, significant differences in actualexperience or significant changes in assumptions materially affect retirement obligations. Thecarrying values of pension asset, liability and expense are disclosed in Note 28.
Fair value of financial instrumentsWhere the fair values of financial assets and financial liabilities recorded in the consolidatedstatement of financial position cannot be derived from active markets, they are determined usinginternal valuation techniques using generally accepted market valuation models. The inputs tothese models are taken from observable markets where possible, but where this is not feasible,estimates are used in establishing fair values. These estimates may include considerations ofliquidity, volatility, and correlation.
Provision for product warrantiesEstimated warranty costs are provided at the time of sale. The provision is based on the estimatedcosts of future servicing the products sold, the costs of which are not recoverable from customers.A provision is recognized for expected warranty claims on products sold during the last two (2)years, based on past experience of the level of returns and repairs. It is expected that most of thesecosts will be incurred in the next financial year and all will be incurred within three (3) years as ofthe reporting date. Provision for product warranty is disclosed in Note 20.
Purchase price allocation of investment in MPICThe Parent Company is required to perform a purchase price allocation for its investment in MPICin 2017. A significant portion of MPIC’s net assets pertain to concession assets and the valuationof these concession assets require estimates from management. These estimates include revenuegrowth, gross margins, expected traffic volume and billed water volume, toll or tariff rates anddiscount rates.
Purchase price allocation of investment in MBTCThe Parent Company is required to perform a purchase price allocation for its investment inMBTC. A significant portion of MBTC’s net assets pertain to loans and receivables, property andequipment, investment properties and deposits, and the valuation of these assets require estimatesfrom management. These estimates include future cash flows forecasts, discount rates andappraised values of property, equipment and investment properties.
- 54 -
*SGVFSM000264*
4. Cash, Cash Equivalents and Short-term Investments
Cash and Cash EquivalentsThis account consists of:
2019 2018Cash on hand P=65 P=56Cash in banks and other financial institution (Note 27) 4,452 6,512Cash equivalents (Note 27) 7,616 7,785
P=12,133 P=14,353
Cash in banks earns interest at the prevailing bank deposit rates. Cash equivalents are made forvarying periods of up to three months depending on the immediate cash requirements of the Group,and earn interest at the prevailing interest rates ranging from 0.05% to 6.70% in 2019 and 2018 andfrom 0.10% to 3.75% in 2017 (Notes 23 and 27).
Short-term InvestmentsThese represent the Group’s foreign currency and peso-denominated time deposits, as well asmoney market placements, with original maturities of more than 3 months and up to 12 months andearn interest at the respective short-term investment rates, ranging from 0.01% to 2.50% in 2019and 2018 and from 0.01% to 3.00% in 2017 (Notes 23 and 27).
5. Receivables
This account consists of:
2019 2018Trade receivables P=11,210 P=9,681Loans receivable (Note 27) 3,421 932Nontrade receivables (Note 27) 1,043 1,438Accrued rent and commission income (Note 27) 445 479Installment contracts receivables 289 2,401Accrued interest receivable (Note 27) 97 210Management fee receivable (Note 27) 64 253Others (Note 27) 418 973
16,987 16,367Less: Allowance for credit losses 184 282
P=16,803 P=16,085
Total receivables shown in the consolidated statements of financial position follow:
2019 2018Current portion P=13,382 P=15,153Noncurrent portion 3,421 932
P=16,803 P=16,085
Trade ReceivablesTrade receivables pertain to receivables from sale of vehicles and/or parts and services. These arenoninterest-bearing and generally have 30 days to one year term.
- 55 -
*SGVFSM000264*
Loans ReceivableLoans receivable from various counterparties pertain to long-term receivables as follows:
2019 2018Real estate P=3,421 P=932
Loans receivable from Cathay International Resources Corp. (CIRC)In 2012, Federal Land entered into a loan agreement with CIRC. Federal Land agreed to lend toCIRC a total amount of P=705.00 million with a nominal and effective annual interest rate of 3.15%and 4.81%, respectively. The loan will mature on the tenth year anniversary from the date ofexecution of the agreement. Federal Land used discounted cash flow analyses to measure the fairvalue of the loan. The ‘Day 1’ difference for this receivable amounted to P=94.22 million atinception in 2012. Accretion of interest in 2019, 2018 and 2017 amounted to P=10.05 million,P=9.58 and P=8.52 million, respectively (Note 23).
On June 8, 2015, the Board of Federal Land approved the conversion of this receivable to equityin exchange for the common shares of CIRC. Federal Land is yet to apply with the SEC for theconversion as of report date. The outstanding balance of long-term loans receivable as ofDecember 31, 2019 and 2018 amounted to P=665.63 million and P=641.88 million, respectively(Note 27).
Loans receivable from Multi Fortune Holdings, Inc. (MFHI)In 2019, Federal Land entered into a new loan agreement with MFHI. Federal Land agreed to lendto MFHI a total amount of P=135.00 million with nominal interest rates ranging from 6.06% to6.60% annually. The loan will mature on the fifth year anniversary of the execution.
In 2017, Federal Land entered into a loan agreement with MFHI. Federal Land agreed to lend toMFHI a total amount of P=290.00 million with nominal interest rate of 6.60% annually. The loanwill mature on the fifth year anniversary of the execution.
Nominal interest income earned in 2019, 2018 and 2017 amounted to P=27.64 million,P=18.62 million and P=8.36 million, respectively (Note23).
The outstanding balance of long-term loans receivable from MFHI as of December 31, 2019 and2018 amounted to P=425.00 million and P=290.00 million, respectively.
Loans receivables of TMPC to local companiesIn 2019, TMPC entered into loan agreements with local companies. The loan bears fixed interestrate of 4.00% and is payable for a period of three (3) years up to December 2, 2022. Theoutstanding balance of long-term loans receivable as of December 31, 2019 amounted toP=2.33 billion.
Nontrade ReceivablesNontrade receivables mainly consist of vehicle acquisition plan loans extended to employees whichare collectible within one year and expenses of the affiliates which were advanced by the Group(Note 27).
Accrued Rent and Commission IncomeAccrued rent pertains to tenants’ rentals and their share in utilities (electricity, water and liquefiedpetroleum gas) and other charges to customers (Note 27). Commission income pertains tocommission earned from sale of real estate properties (Note 27).
- 56 -
*SGVFSM000264*
Installment Contracts ReceivablesInstallment contracts receivables pertain to receivables from the sale of residential andcondominium units. Titles to the sold residential and condominium units are transferred to thebuyers only upon full payment of the contract price.
The details of installment contracts receivables and contract assets follow:
2019 2018Installment contracts receivables P=293 P=3,314Less: Unearned interest income 4 913
289 2,401Less: Noncurrent portion − −Current portion P=289 P=2,401
Installment contracts receivables are collected over a period of one to 10 years. The fair valueupon initial recognition for Federal Land is derived using the discounted cash flow methodologyusing discount rates ranging from 8.00% to 12.00% in 2019 ,2018 and 2017. PCFI’s installmentcontracts receivables bear annual interest of 12.00% to 21.00% in 2018 and from 12.00% to 21% in2017, computed on the diminishing balance of the principal.
Movements in the unearned interest income in 2019 and 2018 follow:
2019 2018Balance at beginning of year P=913 P=1,085Additions 4 1,037Reclassication to contract assets (911) −Accretion (Note 23) (2) (1,209)Balance at end of year P=4 P=913
Management Fee ReceivablesManagement fee receivables pertain to management fee being charged by the real estate businessesfor the conduct of relevant studies for the maintenance, upkeep and improvement of real estateproperties and equipment of associates and affiliated companies (Note 27).
OthersOther receivables include receivable from employees and retention, bond and guarantee feereceivables (Note 27).
Allowance for Credit LossesChanges in the allowance for credit losses on receivables are as follows:
December 31, 2019Trade
ReceivablesOther
Receivables TotalBalance at beginning of the year P=8 P=274 P=282Provision for (reversal of) credit losses (Note 26) (2) (96) (98)Balance at end of year P=6 P=178 P=184
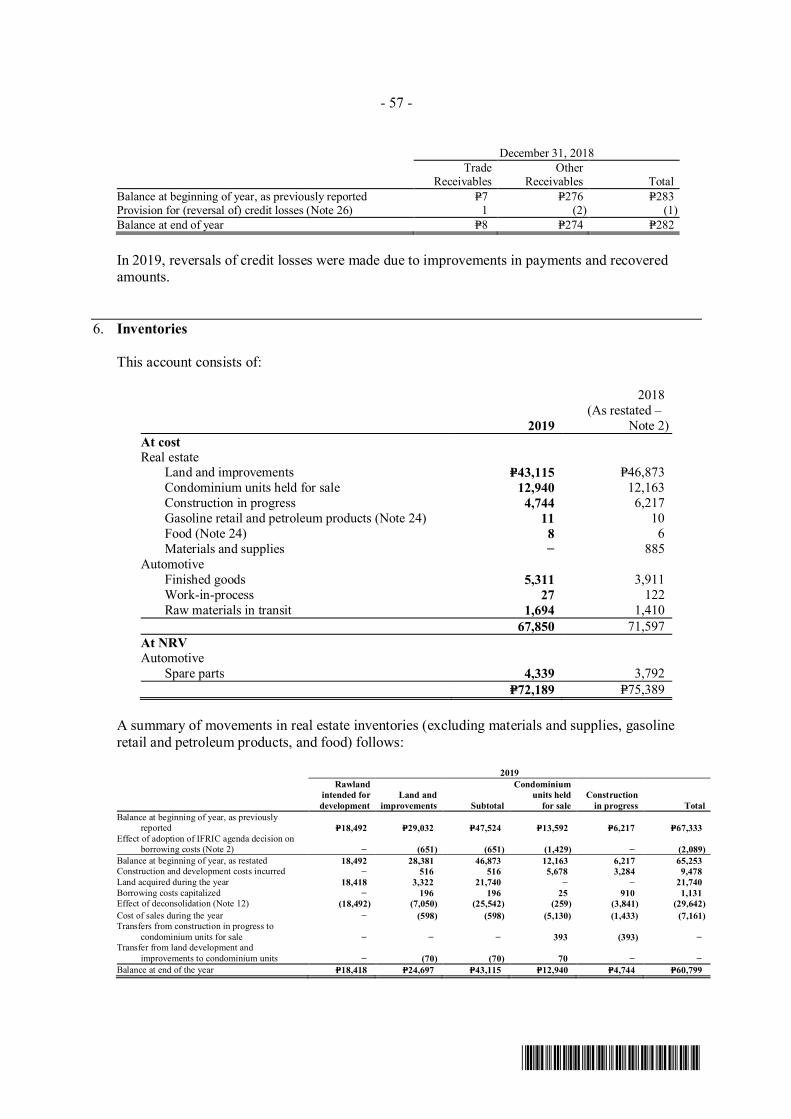
- 57 -
*SGVFSM000264*
December 31, 2018Trade
ReceivablesOther
Receivables TotalBalance at beginning of year, as previously reported P=7 P=276 P=283Provision for (reversal of) credit losses (Note 26) 1 (2) (1)Balance at end of year P=8 P=274 P=282
In 2019, reversals of credit losses were made due to improvements in payments and recoveredamounts.
6. Inventories
This account consists of:
2019
2018(As restated –
Note 2)At costReal estate
Land and improvements P=43,115 P=46,873 Condominium units held for sale 12,940 12,163 Construction in progress 4,744 6,217 Gasoline retail and petroleum products (Note 24) 11 10 Food (Note 24) 8 6 Materials and supplies − 885Automotive Finished goods 5,311 3,911 Work-in-process 27 122 Raw materials in transit 1,694 1,410
67,850 71,597At NRVAutomotive Spare parts 4,339 3,792
P=72,189 P=75,389
A summary of movements in real estate inventories (excluding materials and supplies, gasolineretail and petroleum products, and food) follows:
2019Rawland
intended fordevelopment
Land andimprovements Subtotal
Condominiumunits held
for saleConstruction
in progress TotalBalance at beginning of year, as previously
reported P=18,492 P=29,032 P=47,524 P=13,592 P=6,217 P=67,333Effect of adoption of IFRIC agenda decision on
borrowing costs (Note 2) − (651) (651) (1,429) − (2,089)Balance at beginning of year, as restated 18,492 28,381 46,873 12,163 6,217 65,253Construction and development costs incurred − 516 516 5,678 3,284 9,478Land acquired during the year 18,418 3,322 21,740 − − 21,740Borrowing costs capitalized − 196 196 25 910 1,131Effect of deconsolidation (Note 12) (18,492) (7,050) (25,542) (259) (3,841) (29,642)Cost of sales during the year − (598) (598) (5,130) (1,433) (7,161)Transfers from construction in progress to
condominium units for sale − − − 393 (393) −Transfer from land development and
improvements to condominium units − (70) (70) 70 − −Balance at end of the year P=18,418 P=24,697 P=43,115 P=12,940 P=4,744 P=60,799
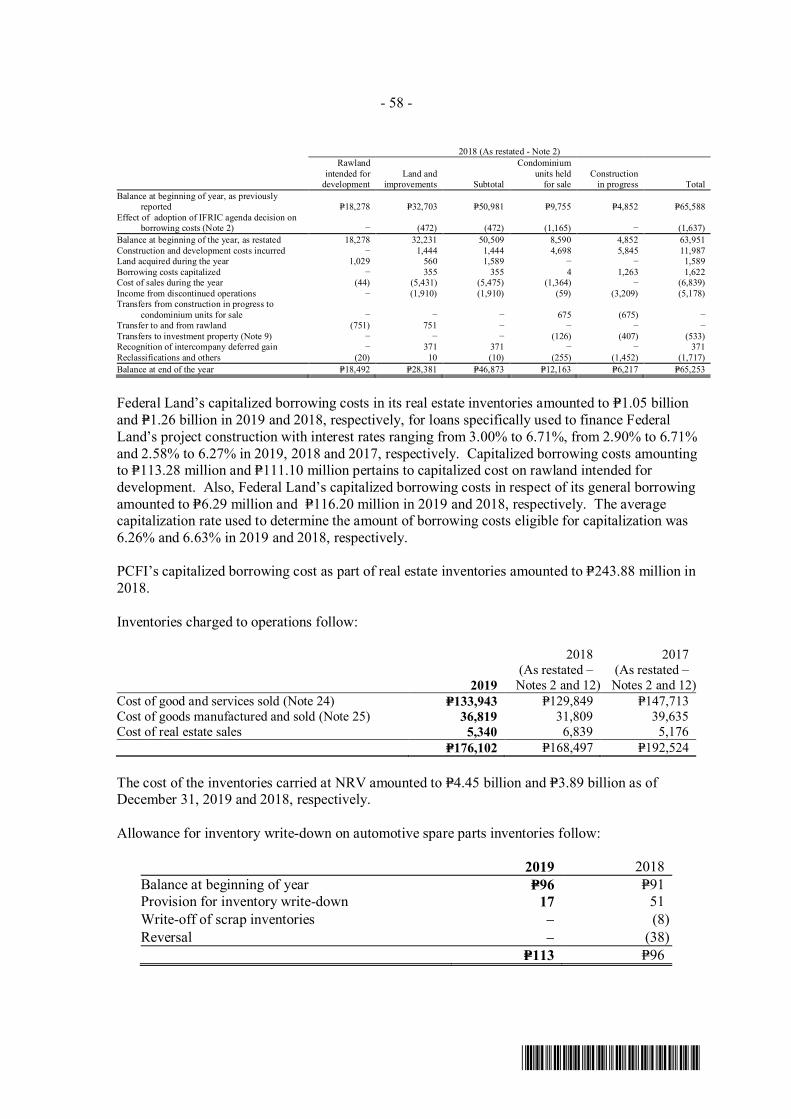
- 58 -
*SGVFSM000264*
2018 (As restated - Note 2)Rawland
intended fordevelopment
Land andimprovements Subtotal
Condominiumunits held
for saleConstruction
in progress TotalBalance at beginning of year, as previously
reported P=18,278 P=32,703 P=50,981 P=9,755 P=4,852 P=65,588Effect of adoption of IFRIC agenda decision on
borrowing costs (Note 2) − (472) (472) (1,165) − (1,637)Balance at beginning of the year, as restated 18,278 32,231 50,509 8,590 4,852 63,951Construction and development costs incurred − 1,444 1,444 4,698 5,845 11,987Land acquired during the year 1,029 560 1,589 − − 1,589Borrowing costs capitalized − 355 355 4 1,263 1,622Cost of sales during the year (44) (5,431) (5,475) (1,364) − (6,839)Income from discontinued operations − (1,910) (1,910) (59) (3,209) (5,178)Transfers from construction in progress to
condominium units for sale − − − 675 (675) −Transfer to and from rawland (751) 751 − − − −Transfers to investment property (Note 9) − − − (126) (407) (533)Recognition of intercompany deferred gain − 371 371 − − 371Reclassifications and others (20) 10 (10) (255) (1,452) (1,717)Balance at end of the year P=18,492 P=28,381 P=46,873 P=12,163 P=6,217 P=65,253
Federal Land’s capitalized borrowing costs in its real estate inventories amounted to P=1.05 billionand P=1.26 billion in 2019 and 2018, respectively, for loans specifically used to finance FederalLand’s project construction with interest rates ranging from 3.00% to 6.71%, from 2.90% to 6.71%and 2.58% to 6.27% in 2019, 2018 and 2017, respectively. Capitalized borrowing costs amountingto P=113.28 million and P=111.10 million pertains to capitalized cost on rawland intended fordevelopment. Also, Federal Land’s capitalized borrowing costs in respect of its general borrowingamounted to P=6.29 million and P=116.20 million in 2019 and 2018, respectively. The averagecapitalization rate used to determine the amount of borrowing costs eligible for capitalization was6.26% and 6.63% in 2019 and 2018, respectively.
PCFI’s capitalized borrowing cost as part of real estate inventories amounted to P=243.88 million in2018.
Inventories charged to operations follow:
2019
2018(As restated –Notes 2 and 12)
2017(As restated –Notes 2 and 12)
Cost of good and services sold (Note 24) P=133,943 P=129,849 P=147,713Cost of goods manufactured and sold (Note 25) 36,819 31,809 39,635Cost of real estate sales 5,340 6,839 5,176
P=176,102 P=168,497 P=192,524
The cost of the inventories carried at NRV amounted to P=4.45 billion and P=3.89 billion as ofDecember 31, 2019 and 2018, respectively.
Allowance for inventory write-down on automotive spare parts inventories follow:
2019 2018Balance at beginning of year P=96 P=91Provision for inventory write-down 17 51Write-off of scrap inventories - (8)Reversal - (38)
P=113 P=96
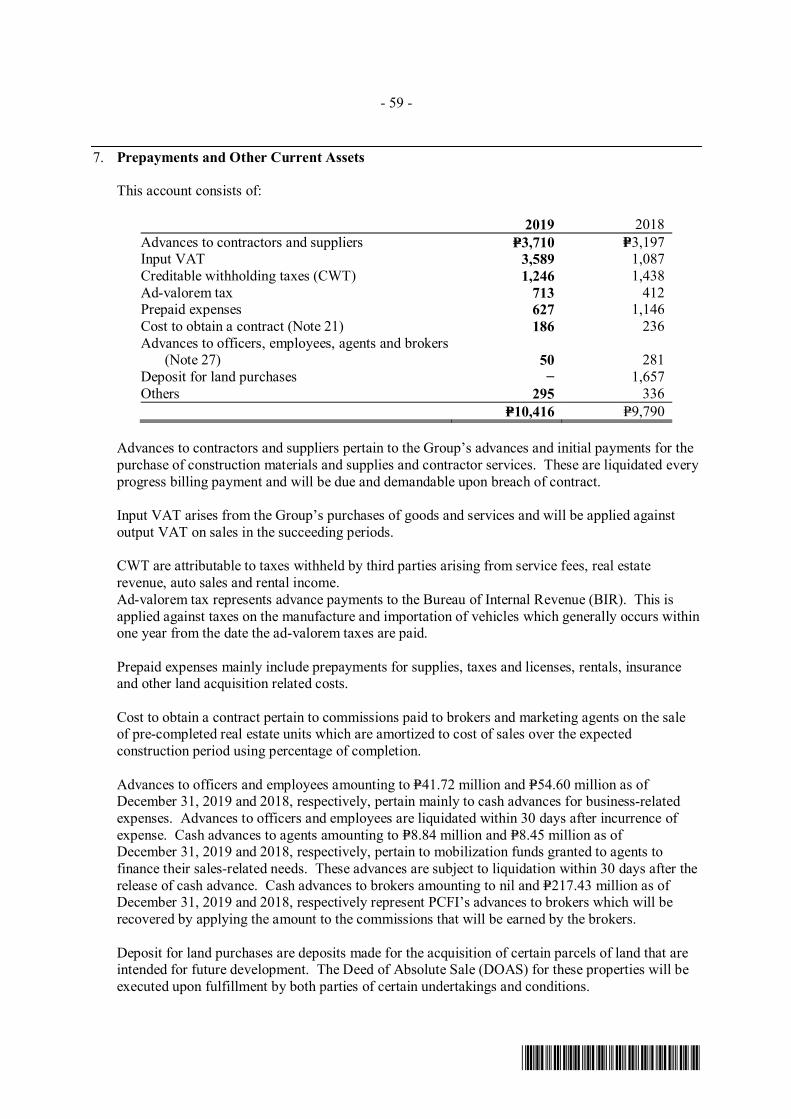
- 59 -
*SGVFSM000264*
7. Prepayments and Other Current Assets
This account consists of:
2019 2018Advances to contractors and suppliers P=3,710 P=3,197Input VAT 3,589 1,087Creditable withholding taxes (CWT) 1,246 1,438Ad-valorem tax 713 412Prepaid expenses 627 1,146Cost to obtain a contract (Note 21) 186 236Advances to officers, employees, agents and brokers
(Note 27) 50 281Deposit for land purchases − 1,657Others 295 336
P=10,416 P=9,790
Advances to contractors and suppliers pertain to the Group’s advances and initial payments for thepurchase of construction materials and supplies and contractor services. These are liquidated everyprogress billing payment and will be due and demandable upon breach of contract.
Input VAT arises from the Group’s purchases of goods and services and will be applied againstoutput VAT on sales in the succeeding periods.
CWT are attributable to taxes withheld by third parties arising from service fees, real estaterevenue, auto sales and rental income.Ad-valorem tax represents advance payments to the Bureau of Internal Revenue (BIR). This isapplied against taxes on the manufacture and importation of vehicles which generally occurs withinone year from the date the ad-valorem taxes are paid.
Prepaid expenses mainly include prepayments for supplies, taxes and licenses, rentals, insuranceand other land acquisition related costs.
Cost to obtain a contract pertain to commissions paid to brokers and marketing agents on the saleof pre-completed real estate units which are amortized to cost of sales over the expectedconstruction period using percentage of completion.
Advances to officers and employees amounting to P=41.72 million and P=54.60 million as ofDecember 31, 2019 and 2018, respectively, pertain mainly to cash advances for business-relatedexpenses. Advances to officers and employees are liquidated within 30 days after incurrence ofexpense. Cash advances to agents amounting to P=8.84 million and P=8.45 million as ofDecember 31, 2019 and 2018, respectively, pertain to mobilization funds granted to agents tofinance their sales-related needs. These advances are subject to liquidation within 30 days after therelease of cash advance. Cash advances to brokers amounting to nil and P=217.43 million as ofDecember 31, 2019 and 2018, respectively represent PCFI’s advances to brokers which will berecovered by applying the amount to the commissions that will be earned by the brokers.
Deposit for land purchases are deposits made for the acquisition of certain parcels of land that areintended for future development. The Deed of Absolute Sale (DOAS) for these properties will beexecuted upon fulfillment by both parties of certain undertakings and conditions.
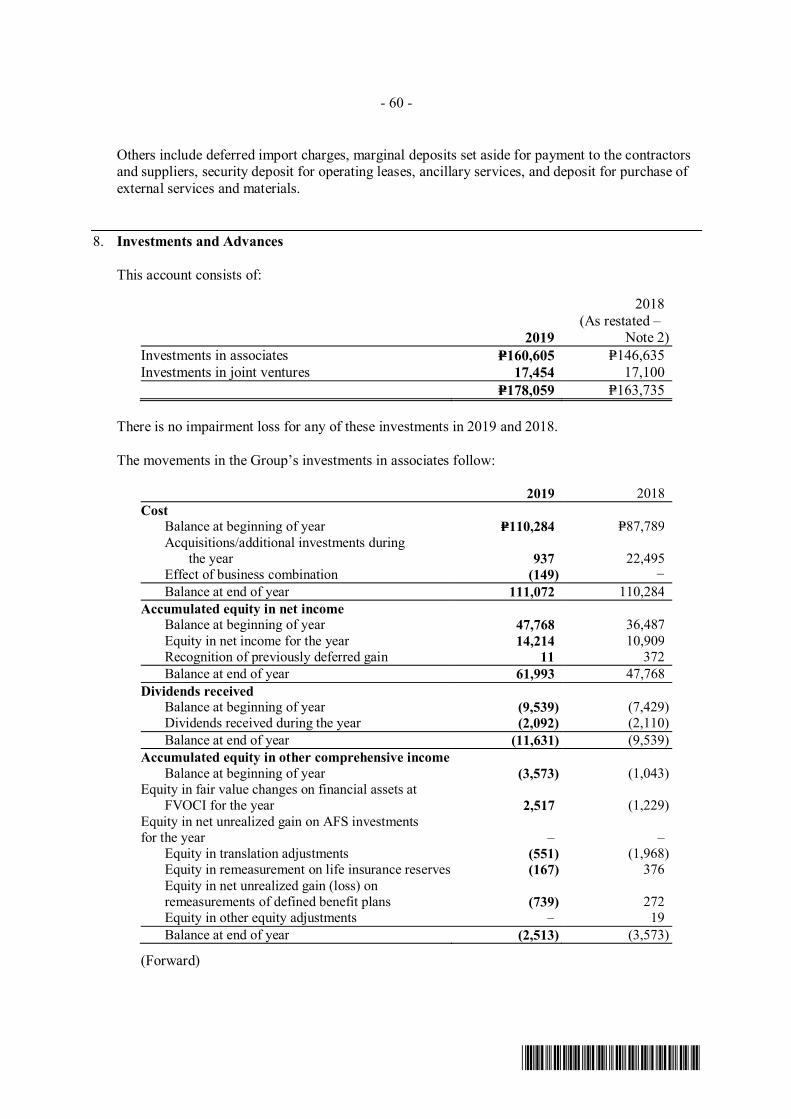
- 60 -
*SGVFSM000264*
Others include deferred import charges, marginal deposits set aside for payment to the contractorsand suppliers, security deposit for operating leases, ancillary services, and deposit for purchase ofexternal services and materials.
8. Investments and Advances
This account consists of:
2019
2018(As restated –
Note 2)Investments in associates P=160,605 P=146,635Investments in joint ventures 17,454 17,100
P=178,059 P=163,735
There is no impairment loss for any of these investments in 2019 and 2018.
The movements in the Group’s investments in associates follow:
2019 2018Cost
Balance at beginning of year P=110,284 P=87,789Acquisitions/additional investments during
the year 937 22,495Effect of business combination (149) −Balance at end of year 111,072 110,284
Accumulated equity in net incomeBalance at beginning of year 47,768 36,487Equity in net income for the year 14,214 10,909Recognition of previously deferred gain 11 372Balance at end of year 61,993 47,768
Dividends receivedBalance at beginning of year (9,539) (7,429)Dividends received during the year (2,092) (2,110)Balance at end of year (11,631) (9,539)
Accumulated equity in other comprehensive incomeBalance at beginning of year (3,573) (1,043)
Equity in fair value changes on financial assets at FVOCI for the year 2,517 (1,229)Equity in net unrealized gain on AFS investmentsfor the year – –
Equity in translation adjustments (551) (1,968)Equity in remeasurement on life insurance reserves (167) 376Equity in net unrealized gain (loss) onremeasurements of defined benefit plans (739) 272Equity in other equity adjustments – 19Balance at end of year (2,513) (3,573)
(Forward)
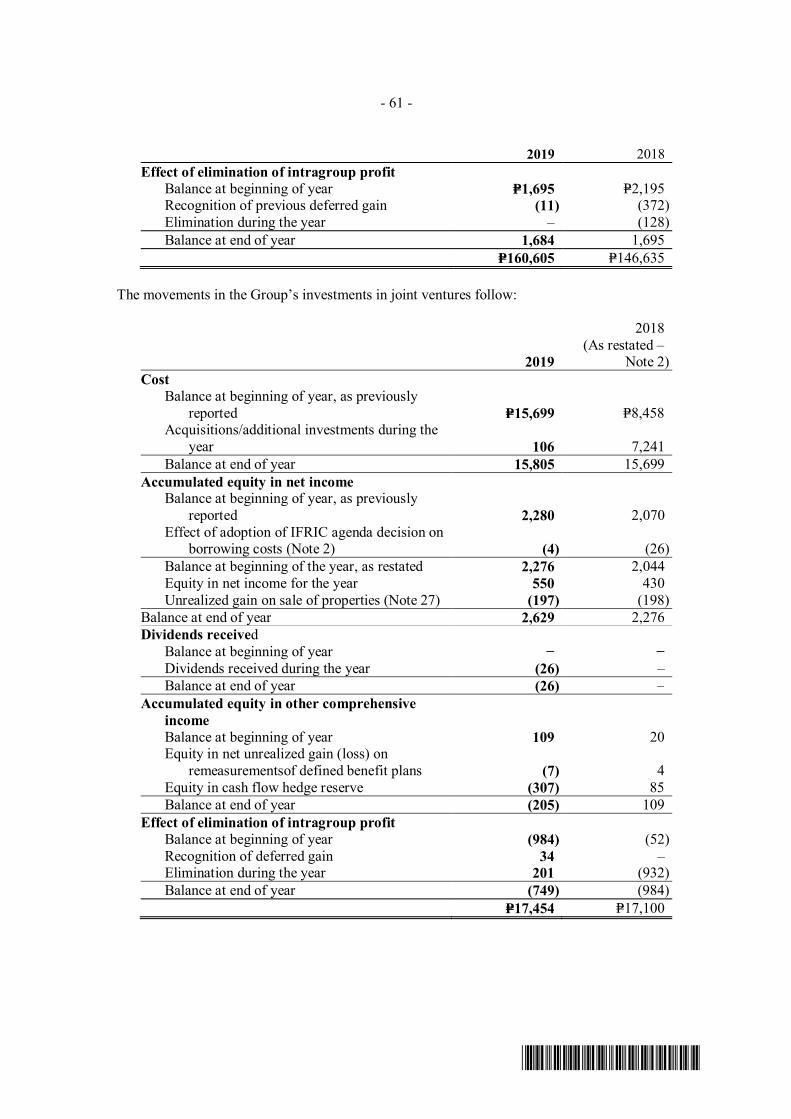
- 61 -
*SGVFSM000264*
2019 2018Effect of elimination of intragroup profit Balance at beginning of year P=1,695 P=2,195
Recognition of previous deferred gain (11) (372) Elimination during the year – (128) Balance at end of year 1,684 1,695
P=160,605 P=146,635
The movements in the Group’s investments in joint ventures follow:
2019
2018(As restated –
Note 2)Cost Balance at beginning of year, as previously reported P=15,699 P=8,458
Acquisitions/additional investments during the year 106 7,241 Balance at end of year 15,805 15,699Accumulated equity in net income
Balance at beginning of year, as previously reported 2,280 2,070 Effect of adoption of IFRIC agenda decision on borrowing costs (Note 2) (4) (26) Balance at beginning of the year, as restated 2,276 2,044 Equity in net income for the year 550 430 Unrealized gain on sale of properties (Note 27) (197) (198)Balance at end of year 2,629 2,276Dividends received Balance at beginning of year − − Dividends received during the year (26) –
Balance at end of year (26) –Accumulated equity in other comprehensive
income Balance at beginning of year 109 20
Equity in net unrealized gain (loss) on remeasurementsof defined benefit plans (7) 4
Equity in cash flow hedge reserve (307) 85Balance at end of year (205) 109
Effect of elimination of intragroup profit Balance at beginning of year (984) (52) Recognition of deferred gain 34 –
Elimination during the year 201 (932) Balance at end of year (749) (984)
P=17,454 P=17,100
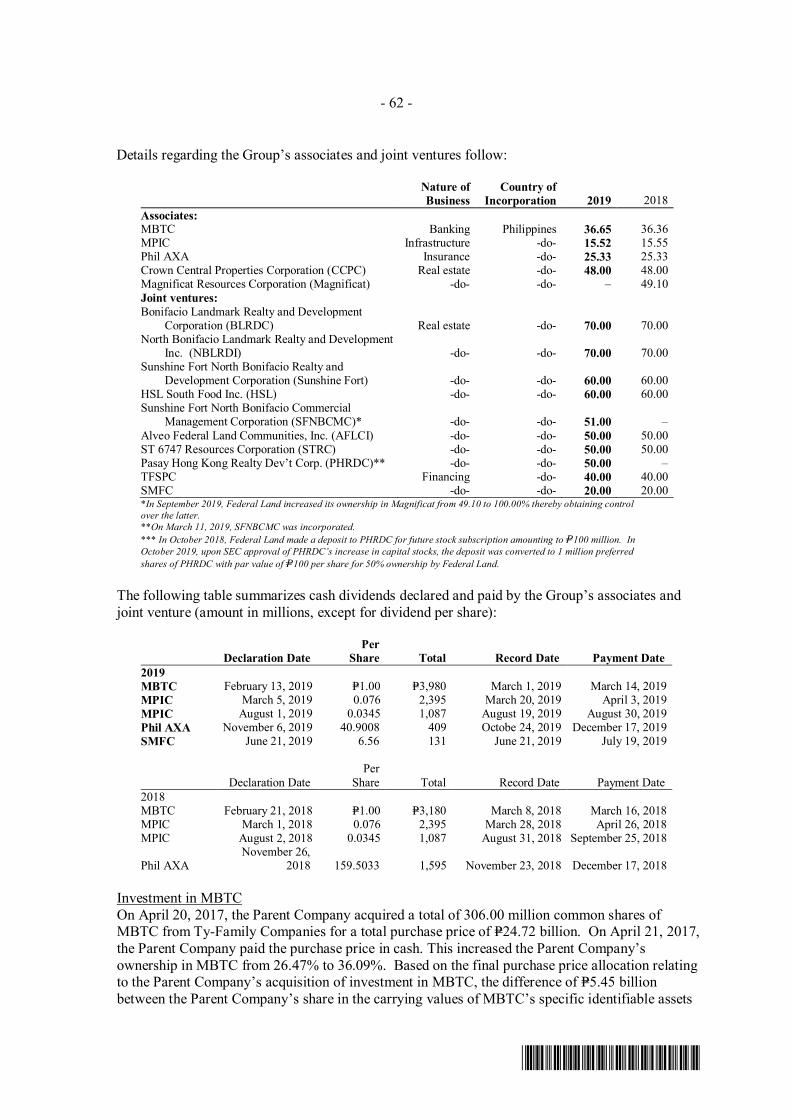
- 62 -
*SGVFSM000264*
Details regarding the Group’s associates and joint ventures follow:
Nature ofBusiness
Country ofIncorporation 2019 2018
Associates:MBTC Banking Philippines 36.65 36.36MPIC Infrastructure -do- 15.52 15.55Phil AXA Insurance -do- 25.33 25.33Crown Central Properties Corporation (CCPC) Real estate -do- 48.00 48.00Magnificat Resources Corporation (Magnificat) -do- -do- – 49.10Joint ventures:Bonifacio Landmark Realty and Development Corporation (BLRDC) Real estate -do- 70.00 70.00North Bonifacio Landmark Realty and Development Inc. (NBLRDI) -do- -do- 70.00 70.00Sunshine Fort North Bonifacio Realty and Development Corporation (Sunshine Fort) -do- -do- 60.00 60.00HSL South Food Inc. (HSL) -do- -do- 60.00 60.00Sunshine Fort North Bonifacio Commercial Management Corporation (SFNBCMC)* -do- -do- 51.00 –Alveo Federal Land Communities, Inc. (AFLCI) -do- -do- 50.00 50.00ST 6747 Resources Corporation (STRC) -do- -do- 50.00 50.00Pasay Hong Kong Realty Dev’t Corp. (PHRDC)** -do- -do- 50.00 –TFSPC Financing -do- 40.00 40.00SMFC -do- -do- 20.00 20.00*In September 2019, Federal Land increased its ownership in Magnificat from 49.10 to 100.00% thereby obtaining controlover the latter.**On March 11, 2019, SFNBCMC was incorporated.*** In October 2018, Federal Land made a deposit to PHRDC for future stock subscription amounting to P=100 million. InOctober 2019, upon SEC approval of PHRDC’s increase in capital stocks, the deposit was converted to 1 million preferredshares of PHRDC with par value of P=100 per share for 50% ownership by Federal Land.
The following table summarizes cash dividends declared and paid by the Group’s associates andjoint venture (amount in millions, except for dividend per share):
Declaration DatePer
Share Total Record Date Payment Date2019MBTC February 13, 2019 P=1.00 P=3,980 March 1, 2019 March 14, 2019MPIC March 5, 2019 0.076 2,395 March 20, 2019 April 3, 2019MPIC August 1, 2019 0.0345 1,087 August 19, 2019 August 30, 2019Phil AXA November 6, 2019 40.9008 409 Octobe 24, 2019 December 17, 2019SMFC June 21, 2019 6.56 131 June 21, 2019 July 19, 2019
Declaration DatePer
Share Total Record Date Payment Date2018MBTC February 21, 2018 P=1.00 P=3,180 March 8, 2018 March 16, 2018MPIC March 1, 2018 0.076 2,395 March 28, 2018 April 26, 2018MPIC August 2, 2018 0.0345 1,087 August 31, 2018 September 25, 2018
Phil AXANovember 26,
2018 159.5033 1,595 November 23, 2018 December 17, 2018
Investment in MBTCOn April 20, 2017, the Parent Company acquired a total of 306.00 million common shares ofMBTC from Ty-Family Companies for a total purchase price of P=24.72 billion. On April 21, 2017,the Parent Company paid the purchase price in cash. This increased the Parent Company’sownership in MBTC from 26.47% to 36.09%. Based on the final purchase price allocation relatingto the Parent Company’s acquisition of investment in MBTC, the difference of P=5.45 billionbetween the Parent Company’s share in the carrying values of MBTC’s specific identifiable assets
- 63 -
*SGVFSM000264*
and liabilities and total cost of the Parent Company’s investment was allocated to the ParentCompany’s share in the difference between the fair values and carrying values of MBTC’s specificand identifiable assets and liabilities amounting to P=1.60 billion and the remaining balance ofP=3.85 billion for notional goodwill.
In relation to the acquisition, the Parent Company capitalized advisory fees and other professionalfees amounting to P=0.02 billion as part of the cost of the investment.
In April 2018, the Parent Company participated in the P=59.99 billion stock rights offering ofMBTC for a total of 299.28 million shares, equivalent to P=22.45 billion. As a result, thepercentage ownership of the Parent Company in MBTC increased from 36.09% to 36.36%. Basedon the final purchase price allocation relating to the Parent Company’s increase of 0.27%ownership interest in MBTC, the difference of P=218.00 million between the Parent Company’sshare in the carrying values of MBTC’s specific identifiable assets and liabilities and total cost ofthe Parent Company’s investment was allocated to the Parent Company’s share in the differencebetween the fair values and carrying values of MBTC’s specific and identifiable assets andliabilities amounting to P=208.00 million and the remaining balance of P=10.00 million for notionalgoodwill.
In October 2019, the Parent Company received a stock dividend equivalent to a total of189.22 million common shares of Metrobank.
On various dates in 2019, the Parent Company acquired an aggregate of 12.26 million commonshares of Metrobank for a total consideration of P=836.53 million. This increased the ParentCompany’s ownership interest in Metrobank from 36.36% to 36.65%.
Investment in MPICOn May 27, 2016, the Parent Company subscribed to 3.60 billion common shares of MPIC for atotal subscription price of P=21.96 billion. On the same day, the Parent Company entered into aSale and Purchase Agreement with Metro Pacific Holdings, Inc. (MPHI), with the Parent Companyas the buyer and MPHI as the seller of 1.30 billion common shares of MPIC for a totalconsideration of P=7.94 billion. On August 5, 2016, the SEC approved the increase in theauthorized capital stock of MPIC. As a result, the Parent Company’s ownership interest is 15.55%of the issued and outstanding capital stock of MPIC.
In relation to the acquisition, the Parent Company capitalized advisory fees and other professionalfees amounting to P=0.24 billion and P=0.04 billion, respectively, as part of the cost of theinvestment.
Based on the final purchase price allocation relating to the Parent Company’s acquisition ofinvestment in MPIC, the difference of P=7.41 billion between the Parent Company’s share in thecarrying values of MPIC’s specific identifiable assets and liabilities and total cost of the ParentCompany’s investment was allocated to the Parent Company’s share in the difference between thefair values and carrying values of MPIC’s specific and identifiable assets and liabilities amountingto P=4.68 billion and the remaining balance of P=2.73 billion for goodwill.
Investment in BLRDCOn June 8, 2012, Federal Land and Orix Risingsun Properties II, Inc. (ORPI) entered into a jointventure agreement for the creation of BLRDC, with Federal Land owning 70% and ORPI owning30% to develop three (3) main projects, namely (1) residential condominium project, (2)hotel/office building, and (3) operation of the hotel.
- 64 -
*SGVFSM000264*
Federal Land does not exercise control at 70% ownership over BLRDC, but instead exercises jointcontrol because Federal Land and ORPI have contractually agreed to share control over theeconomic activities of BLRDC.
Investment in NBLRDIOn June 14, 2018, Federal Land entered into a Joint Venture Agreement with ORPI to incorporatea joint venture company, NBLRDI, in which Federal Land held 70% equity interest. Theagreement was entered to develop Grand Hyatt Residences Tower II. This was reflected asadditions of P=1.69 billion in the investment in associates and joint ventures in 2018.
Investment in Sunshine FortOn July 3, 2017, the Federal Land entered into a Joint Venture Agreement with NREMIDevelopment Company (NRE) to incorporate a joint venture company in which Federal Land held60% equity interest. In 2017, Federal Land made an initial investment amounting toP=288.75 million. In 2018, Federal Land made additional investments amounting to P=4.33 billion.
Investment in AFLCIOn April 29, 2015, Federal Land and Alveo Land Corp. executed a joint venture agreement for theorganization of a joint venture, AFLCI, to manage the development of a 45-hectare property alongLaguna Boulevard in Biñan, Laguna. AFLCI was incorporated on June 16, 2015. An initialinvestment amounting to P=574.13 million was reflected as additions to the investment in associatesand joint ventures in 2015. In 2016, an additional investment amounting to P=17.00 million wasmade.
Investment in STRCIn June 2016, SM Development Corporation (SMDC) entered into an agreement with Federal Landto incorporate a joint venture company, STRC, in which Federal Land holds a 50% stake. STRCwill develop a 3,200 square meter property located along Ayala Avenue as a high-end luxuryresidential tower. An initial investment amounting to P=250.00 million was reflected as additions tothe investment in associates and joint ventures in 2016.
On December 12, 2016, the BOD of Federal Land approved the additional investment in STRCamounting to P=750.00 million divided into preferred shares in the amount of P=712.50 million andcommon shares in the amount of P=37.50 million. On January 10, 2017, Federal Land has fullypaid its subscription to STRC. The percentage of ownership is retained as SMDC also invested anequivalent amount.
In 2018 and 2017, Federal Land made additional investments in STRC amounting to P=0.47 billionand P=0.03 billion, respectively.
Investment in TFSPCOn August 29, 2014, the Parent Company signed a Sale and Purchase Agreement with MBTC andPhilippine Savings Bank (PSBank), a majority owned subsidiary of MBTC, to purchase theirrespective shares in TFSPC representing 15.00% and 25.00%, respectively, of ownership interestfor an aggregate consideration of P=2.10 billion.
In 2018 and 2017, the Parent Company remitted P=720.00 million and P=480.00 million,respectively, to TFSPC in response to the latter’s equity call upon its stockholders.
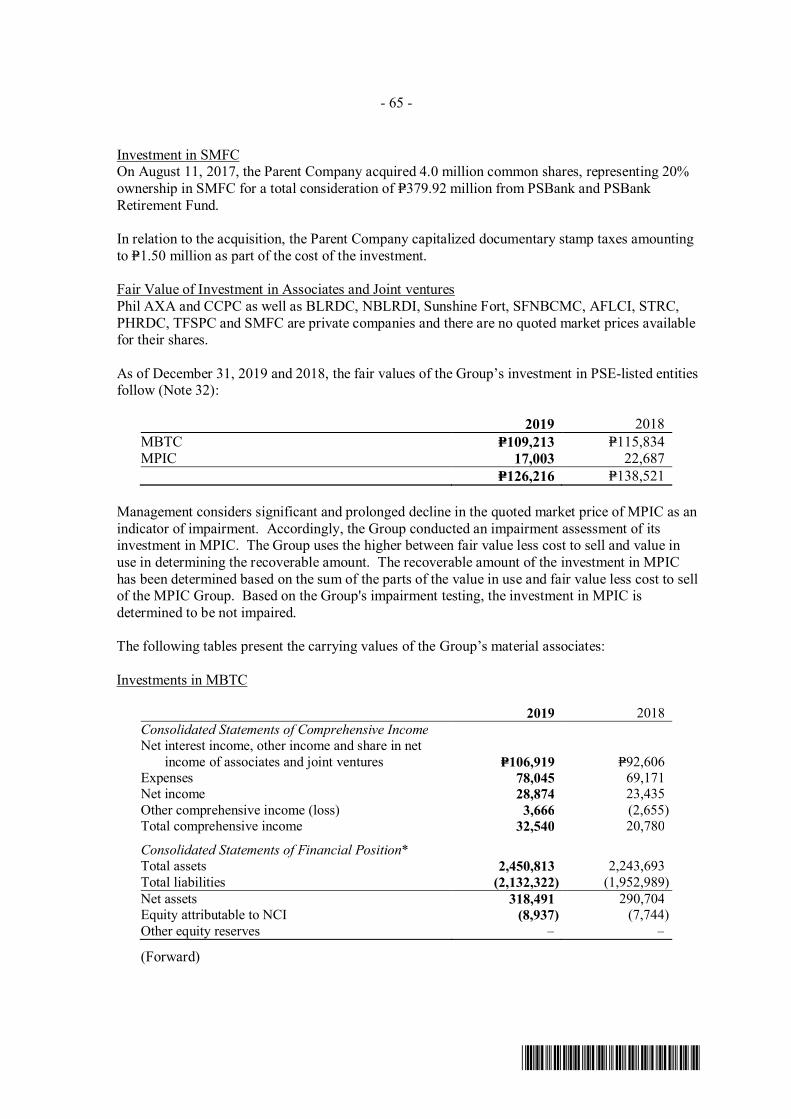
- 65 -
*SGVFSM000264*
Investment in SMFCOn August 11, 2017, the Parent Company acquired 4.0 million common shares, representing 20%ownership in SMFC for a total consideration of P=379.92 million from PSBank and PSBankRetirement Fund.
In relation to the acquisition, the Parent Company capitalized documentary stamp taxes amountingto P=1.50 million as part of the cost of the investment.
Fair Value of Investment in Associates and Joint venturesPhil AXA and CCPC as well as BLRDC, NBLRDI, Sunshine Fort, SFNBCMC, AFLCI, STRC,PHRDC, TFSPC and SMFC are private companies and there are no quoted market prices availablefor their shares.
As of December 31, 2019 and 2018, the fair values of the Group’s investment in PSE-listed entitiesfollow (Note 32):
2019 2018MBTC P=109,213 P=115,834MPIC 17,003 22,687
P=126,216 P=138,521
Management considers significant and prolonged decline in the quoted market price of MPIC as anindicator of impairment. Accordingly, the Group conducted an impairment assessment of itsinvestment in MPIC. The Group uses the higher between fair value less cost to sell and value inuse in determining the recoverable amount. The recoverable amount of the investment in MPIChas been determined based on the sum of the parts of the value in use and fair value less cost to sellof the MPIC Group. Based on the Group's impairment testing, the investment in MPIC isdetermined to be not impaired.
The following tables present the carrying values of the Group’s material associates:
Investments in MBTC
2019 2018Consolidated Statements of Comprehensive IncomeNet interest income, other income and share in net
income of associates and joint ventures P=106,919 P=92,606Expenses 78,045 69,171Net income 28,874 23,435Other comprehensive income (loss) 3,666 (2,655)Total comprehensive income 32,540 20,780
Consolidated Statements of Financial Position*Total assets 2,450,813 2,243,693Total liabilities (2,132,322) (1,952,989)Net assets 318,491 290,704Equity attributable to NCI (8,937) (7,744)Other equity reserves – –
(Forward)
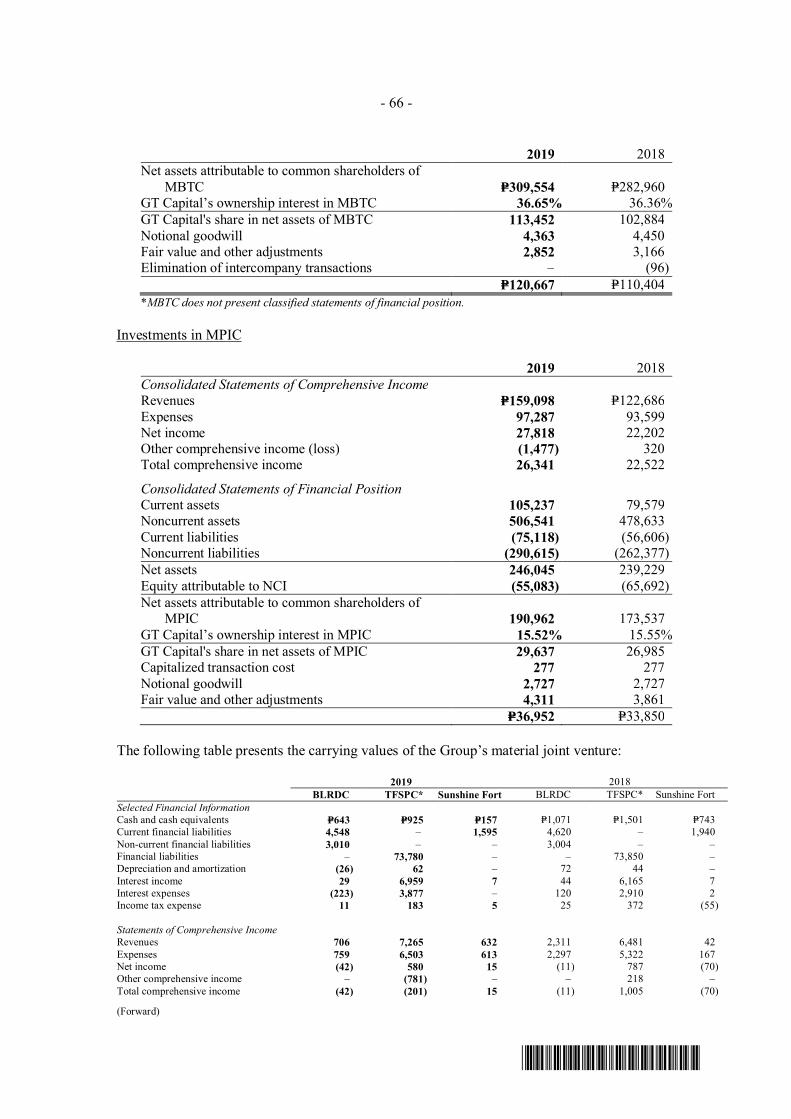
- 66 -
*SGVFSM000264*
2019 2018Net assets attributable to common shareholders of
MBTC P=309,554 P=282,960GT Capital’s ownership interest in MBTC 36.65% 36.36%GT Capital's share in net assets of MBTC 113,452 102,884Notional goodwill 4,363 4,450Fair value and other adjustments 2,852 3,166Elimination of intercompany transactions – (96)
P=120,667 P=110,404*MBTC does not present classified statements of financial position.
Investments in MPIC
2019 2018Consolidated Statements of Comprehensive IncomeRevenues P=159,098 P=122,686Expenses 97,287 93,599Net income 27,818 22,202Other comprehensive income (loss) (1,477) 320Total comprehensive income 26,341 22,522
Consolidated Statements of Financial PositionCurrent assets 105,237 79,579Noncurrent assets 506,541 478,633Current liabilities (75,118) (56,606)Noncurrent liabilities (290,615) (262,377)Net assets 246,045 239,229Equity attributable to NCI (55,083) (65,692)Net assets attributable to common shareholders of
MPIC 190,962 173,537GT Capital’s ownership interest in MPIC 15.52% 15.55%GT Capital's share in net assets of MPIC 29,637 26,985Capitalized transaction cost 277 277Notional goodwill 2,727 2,727Fair value and other adjustments 4,311 3,861
P=36,952 P=33,850
The following table presents the carrying values of the Group’s material joint venture:
2019 2018BLRDC TFSPC* Sunshine Fort BLRDC TFSPC* Sunshine Fort
Selected Financial InformationCash and cash equivalents P=643 P=925 P=157 P=1,071 P=1,501 P=743Current financial liabilities 4,548 – 1,595 4,620 – 1,940Non-current financial liabilities 3,010 – – 3,004 – –Financial liabilities – 73,780 – – 73,850 –Depreciation and amortization (26) 62 – 72 44 –Interest income 29 6,959 7 44 6,165 7Interest expenses (223) 3,877 – 120 2,910 2Income tax expense 11 183 5 25 372 (55)
Statements of Comprehensive IncomeRevenues 706 7,265 632 2,311 6,481 42Expenses 759 6,503 613 2,297 5,322 167Net income (42) 580 15 (11) 787 (70)Other comprehensive income – (781) – – 218 –Total comprehensive income (42) (201) 15 (11) 1,005 (70)
(Forward)
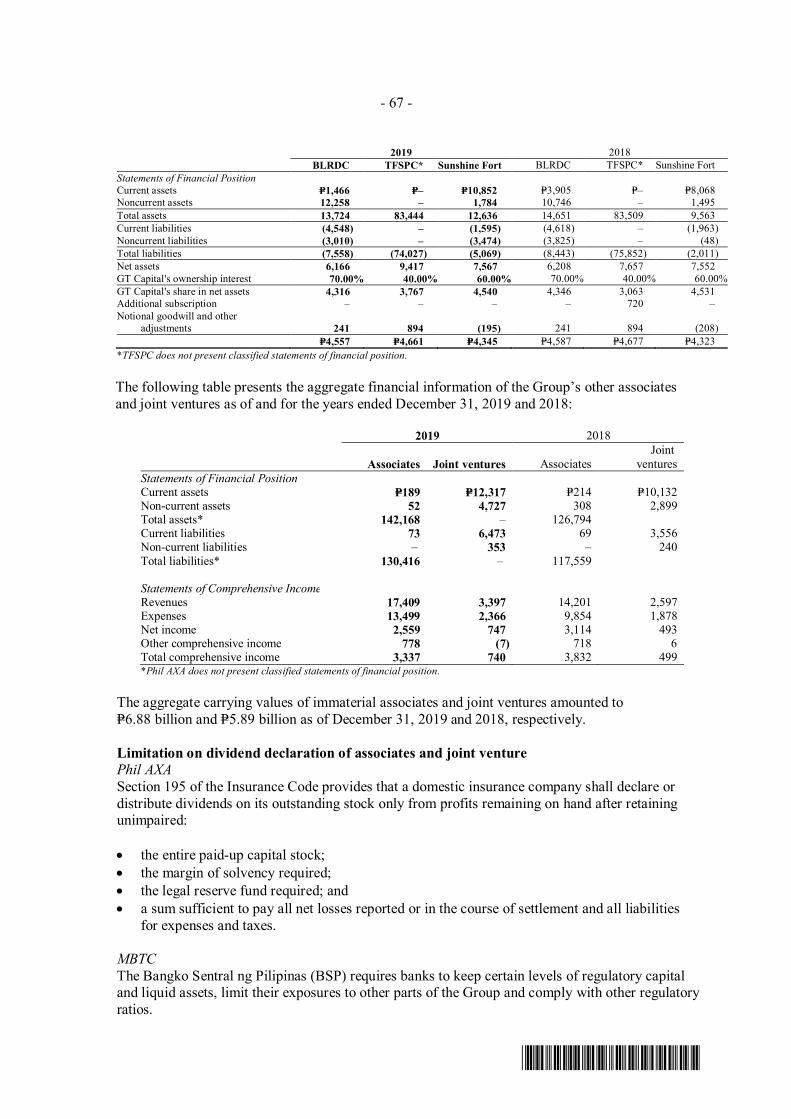
- 67 -
*SGVFSM000264*
2019 2018BLRDC TFSPC* Sunshine Fort BLRDC TFSPC* Sunshine Fort
Statements of Financial PositionCurrent assets P=1,466 P=– P=10,852 P=3,905 P=– P=8,068Noncurrent assets 12,258 – 1,784 10,746 – 1,495Total assets 13,724 83,444 12,636 14,651 83,509 9,563Current liabilities (4,548) – (1,595) (4,618) – (1,963)Noncurrent liabilities (3,010) – (3,474) (3,825) – (48)Total liabilities (7,558) (74,027) (5,069) (8,443) (75,852) (2,011)Net assets 6,166 9,417 7,567 6,208 7,657 7,552GT Capital's ownership interest 70.00% 40.00% 60.00% 70.00% 40.00% 60.00%GT Capital's share in net assets 4,316 3,767 4,540 4,346 3,063 4,531Additional subscription – – – – 720 –Notional goodwill and other
adjustments 241 894 (195) 241 894 (208)P=4,557 P=4,661 P=4,345 P=4,587 P=4,677 P=4,323
*TFSPC does not present classified statements of financial position.
The following table presents the aggregate financial information of the Group’s other associatesand joint ventures as of and for the years ended December 31, 2019 and 2018:
2019 2018
Associates Joint ventures AssociatesJoint
venturesStatements of Financial PositionCurrent assets P=189 P=12,317 P=214 P=10,132Non-current assets 52 4,727 308 2,899Total assets* 142,168 – 126,794Current liabilities 73 6,473 69 3,556Non-current liabilities – 353 – 240Total liabilities* 130,416 – 117,559
Statements of Comprehensive IncomeRevenues 17,409 3,397 14,201 2,597Expenses 13,499 2,366 9,854 1,878Net income 2,559 747 3,114 493Other comprehensive income 778 (7) 718 6Total comprehensive income 3,337 740 3,832 499*Phil AXA does not present classified statements of financial position.
The aggregate carrying values of immaterial associates and joint ventures amounted toP=6.88 billion and P=5.89 billion as of December 31, 2019 and 2018, respectively.
Limitation on dividend declaration of associates and joint venturePhil AXASection 195 of the Insurance Code provides that a domestic insurance company shall declare ordistribute dividends on its outstanding stock only from profits remaining on hand after retainingunimpaired:
· the entire paid-up capital stock;· the margin of solvency required;· the legal reserve fund required; and· a sum sufficient to pay all net losses reported or in the course of settlement and all liabilities
for expenses and taxes.
MBTCThe Bangko Sentral ng Pilipinas (BSP) requires banks to keep certain levels of regulatory capitaland liquid assets, limit their exposures to other parts of the Group and comply with other regulatoryratios.
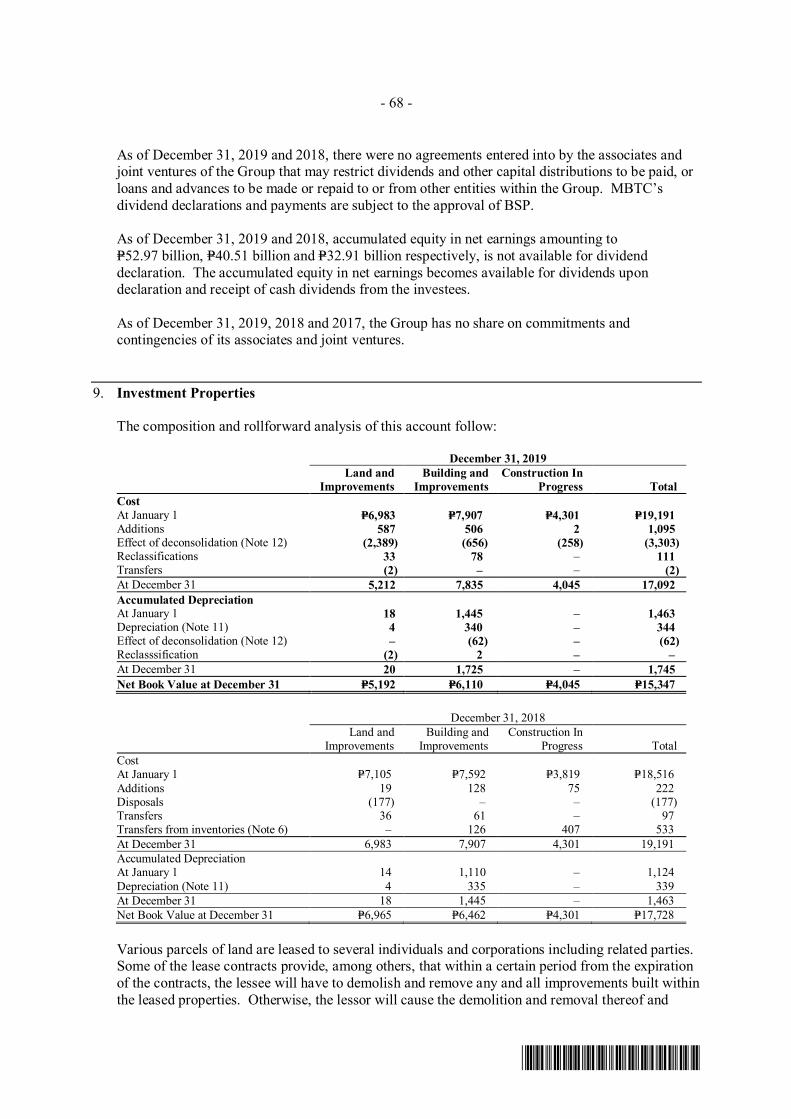
- 68 -
*SGVFSM000264*
As of December 31, 2019 and 2018, there were no agreements entered into by the associates andjoint ventures of the Group that may restrict dividends and other capital distributions to be paid, orloans and advances to be made or repaid to or from other entities within the Group. MBTC’sdividend declarations and payments are subject to the approval of BSP.
As of December 31, 2019 and 2018, accumulated equity in net earnings amounting toP=52.97 billion, P=40.51 billion and P=32.91 billion respectively, is not available for dividenddeclaration. The accumulated equity in net earnings becomes available for dividends upondeclaration and receipt of cash dividends from the investees.
As of December 31, 2019, 2018 and 2017, the Group has no share on commitments andcontingencies of its associates and joint ventures.
9. Investment Properties
The composition and rollforward analysis of this account follow:
December 31, 2019Land and
ImprovementsBuilding and
ImprovementsConstruction In
Progress TotalCostAt January 1 P=6,983 P=7,907 P=4,301 P=19,191Additions 587 506 2 1,095Effect of deconsolidation (Note 12) (2,389) (656) (258) (3,303)Reclassifications 33 78 – 111Transfers (2) – – (2)At December 31 5,212 7,835 4,045 17,092Accumulated DepreciationAt January 1 18 1,445 – 1,463Depreciation (Note 11) 4 340 – 344Effect of deconsolidation (Note 12) – (62) – (62)Reclasssification (2) 2 – –At December 31 20 1,725 – 1,745Net Book Value at December 31 P=5,192 P=6,110 P=4,045 P=15,347
December 31, 2018Land and
ImprovementsBuilding and
ImprovementsConstruction In
Progress TotalCostAt January 1 P=7,105 P=7,592 P=3,819 P=18,516Additions 19 128 75 222Disposals (177) – – (177)Transfers 36 61 – 97Transfers from inventories (Note 6) – 126 407 533At December 31 6,983 7,907 4,301 19,191Accumulated DepreciationAt January 1 14 1,110 – 1,124Depreciation (Note 11) 4 335 – 339At December 31 18 1,445 – 1,463Net Book Value at December 31 P=6,965 P=6,462 P=4,301 P=17,728
Various parcels of land are leased to several individuals and corporations including related parties.Some of the lease contracts provide, among others, that within a certain period from the expirationof the contracts, the lessee will have to demolish and remove any and all improvements built withinthe leased properties. Otherwise, the lessor will cause the demolition and removal thereof and
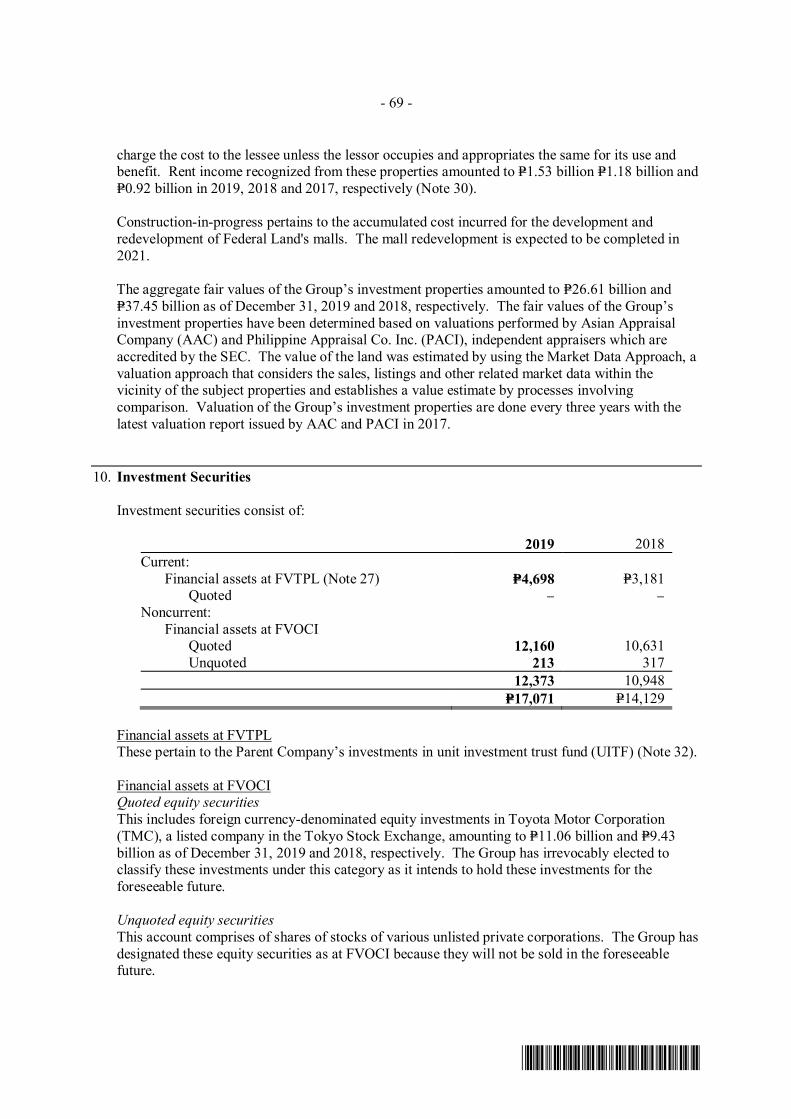
- 69 -
*SGVFSM000264*
charge the cost to the lessee unless the lessor occupies and appropriates the same for its use andbenefit. Rent income recognized from these properties amounted to P=1.53 billion P=1.18 billion andP=0.92 billion in 2019, 2018 and 2017, respectively (Note 30).
Construction-in-progress pertains to the accumulated cost incurred for the development andredevelopment of Federal Land's malls. The mall redevelopment is expected to be completed in2021.
The aggregate fair values of the Group’s investment properties amounted to P=26.61 billion andP=37.45 billion as of December 31, 2019 and 2018, respectively. The fair values of the Group’sinvestment properties have been determined based on valuations performed by Asian AppraisalCompany (AAC) and Philippine Appraisal Co. Inc. (PACI), independent appraisers which areaccredited by the SEC. The value of the land was estimated by using the Market Data Approach, avaluation approach that considers the sales, listings and other related market data within thevicinity of the subject properties and establishes a value estimate by processes involvingcomparison. Valuation of the Group’s investment properties are done every three years with thelatest valuation report issued by AAC and PACI in 2017.
10. Investment Securities
Investment securities consist of:
2019 2018Current: Financial assets at FVTPL (Note 27) P=4,698 P=3,181
Quoted – –Noncurrent: Financial assets at FVOCI
Quoted 12,160 10,631 Unquoted 213 317
12,373 10,948P=17,071 P=14,129
Financial assets at FVTPLThese pertain to the Parent Company’s investments in unit investment trust fund (UITF) (Note 32).
Financial assets at FVOCIQuoted equity securitiesThis includes foreign currency-denominated equity investments in Toyota Motor Corporation(TMC), a listed company in the Tokyo Stock Exchange, amounting to P=11.06 billion and P=9.43billion as of December 31, 2019 and 2018, respectively. The Group has irrevocably elected toclassify these investments under this category as it intends to hold these investments for theforeseeable future.
Unquoted equity securitiesThis account comprises of shares of stocks of various unlisted private corporations. The Group hasdesignated these equity securities as at FVOCI because they will not be sold in the foreseeablefuture.
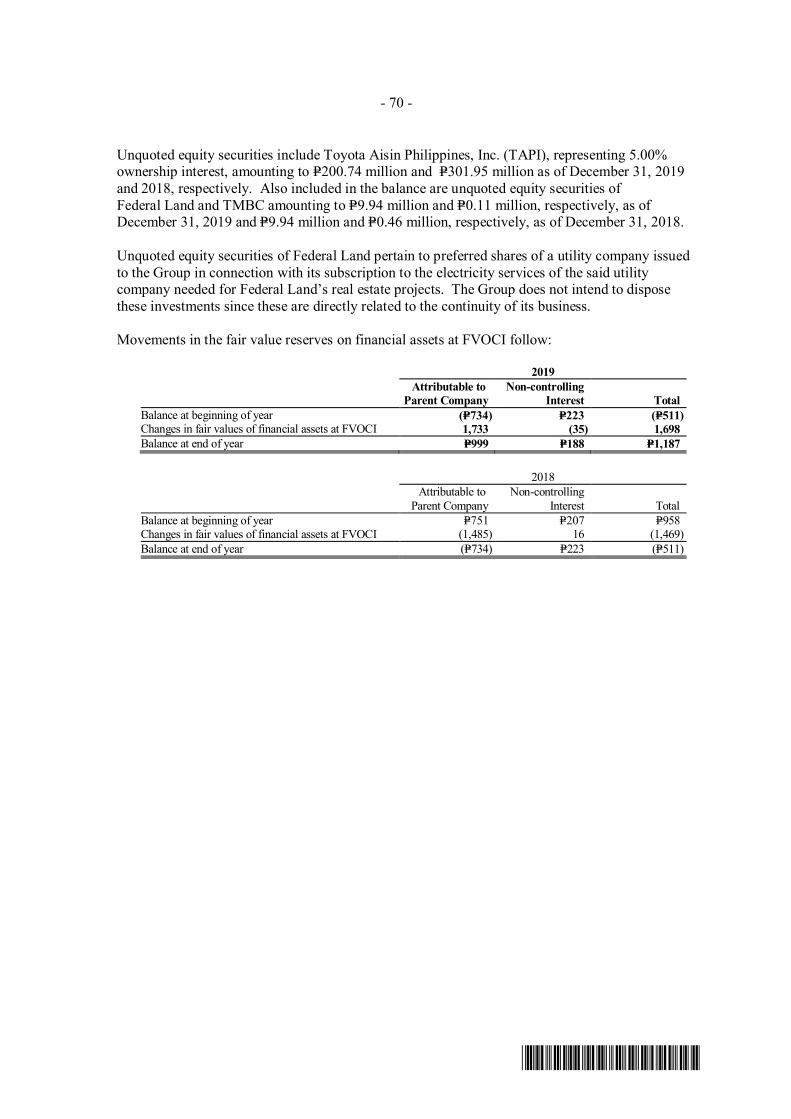
- 70 -
*SGVFSM000264*
Unquoted equity securities include Toyota Aisin Philippines, Inc. (TAPI), representing 5.00%ownership interest, amounting to P=200.74 million and P=301.95 million as of December 31, 2019and 2018, respectively. Also included in the balance are unquoted equity securities ofFederal Land and TMBC amounting to P=9.94 million and P=0.11 million, respectively, as ofDecember 31, 2019 and P=9.94 million and P=0.46 million, respectively, as of December 31, 2018.
Unquoted equity securities of Federal Land pertain to preferred shares of a utility company issuedto the Group in connection with its subscription to the electricity services of the said utilitycompany needed for Federal Land’s real estate projects. The Group does not intend to disposethese investments since these are directly related to the continuity of its business.
Movements in the fair value reserves on financial assets at FVOCI follow:
2019Attributable to
Parent CompanyNon-controlling
Interest TotalBalance at beginning of year (P=734) P=223 (P=511)Changes in fair values of financial assets at FVOCI 1,733 (35) 1,698Balance at end of year P=999 P=188 P=1,187
2018Attributable to
Parent CompanyNon-controlling
Interest TotalBalance at beginning of year P=751 P=207 P=958Changes in fair values of financial assets at FVOCI (1,485) 16 (1,469)Balance at end of year (P=734) P=223 (P=511)
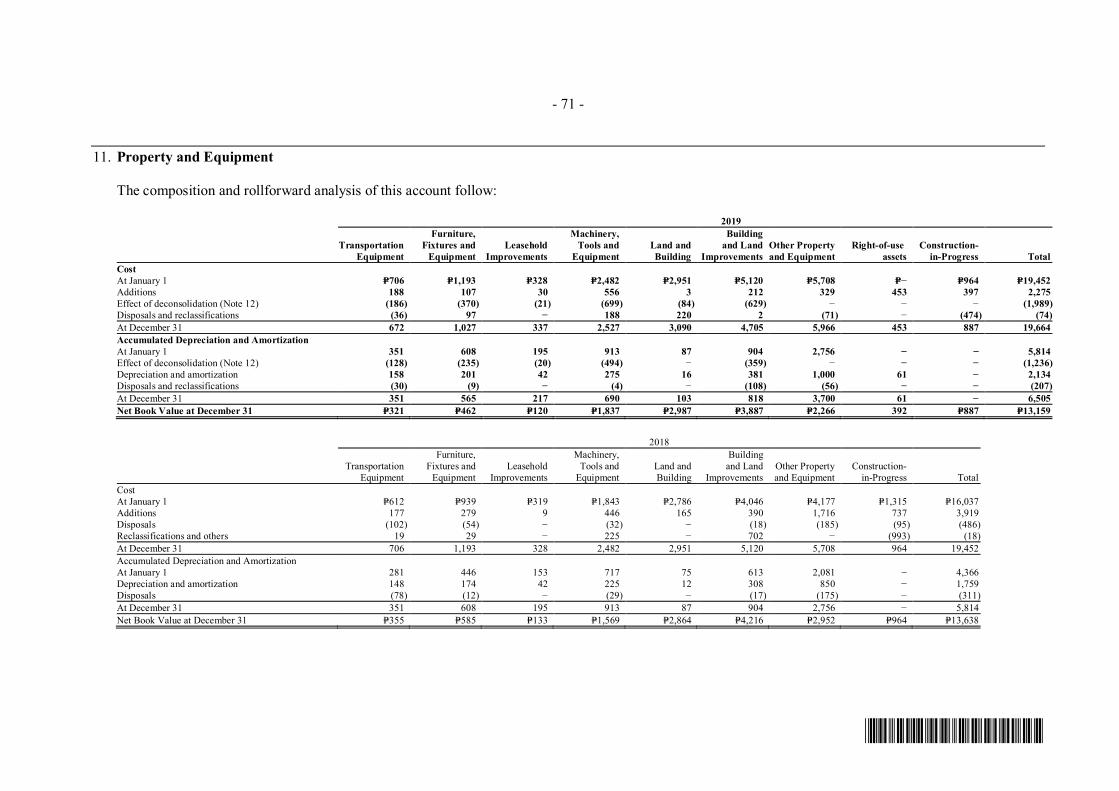
- 71 -
*SGVFSM000264*
11. Property and Equipment
The composition and rollforward analysis of this account follow:
2019
TransportationEquipment
Furniture,Fixtures and
EquipmentLeasehold
Improvements
Machinery,Tools and
EquipmentLand andBuilding
Buildingand Land
ImprovementsOther Propertyand Equipment
Right-of-useassets
Construction-in-Progress Total
CostAt January 1 P=706 P=1,193 P=328 P=2,482 P=2,951 P=5,120 P=5,708 P=− P=964 P=19,452Additions 188 107 30 556 3 212 329 453 397 2,275Effect of deconsolidation (Note 12) (186) (370) (21) (699) (84) (629) − − − (1,989)Disposals and reclassifications (36) 97 − 188 220 2 (71) − (474) (74)At December 31 672 1,027 337 2,527 3,090 4,705 5,966 453 887 19,664Accumulated Depreciation and AmortizationAt January 1 351 608 195 913 87 904 2,756 − − 5,814Effect of deconsolidation (Note 12) (128) (235) (20) (494) − (359) − − − (1,236)Depreciation and amortization 158 201 42 275 16 381 1,000 61 − 2,134Disposals and reclassifications (30) (9) − (4) − (108) (56) − − (207)At December 31 351 565 217 690 103 818 3,700 61 − 6,505Net Book Value at December 31 P=321 P=462 P=120 P=1,837 P=2,987 P=3,887 P=2,266 392 P=887 P=13,159
2018
TransportationEquipment
Furniture,Fixtures and
EquipmentLeasehold
Improvements
Machinery,Tools and
EquipmentLand andBuilding
Buildingand Land
ImprovementsOther Propertyand Equipment
Construction-in-Progress Total
CostAt January 1 P=612 P=939 P=319 P=1,843 P=2,786 P=4,046 P=4,177 P=1,315 P=16,037Additions 177 279 9 446 165 390 1,716 737 3,919Disposals (102) (54) − (32) − (18) (185) (95) (486)Reclassifications and others 19 29 − 225 − 702 − (993) (18)At December 31 706 1,193 328 2,482 2,951 5,120 5,708 964 19,452Accumulated Depreciation and AmortizationAt January 1 281 446 153 717 75 613 2,081 − 4,366Depreciation and amortization 148 174 42 225 12 308 850 − 1,759Disposals (78) (12) − (29) − (17) (175) − (311)At December 31 351 608 195 913 87 904 2,756 − 5,814Net Book Value at December 31 P=355 P=585 P=133 P=1,569 P=2,864 P=4,216 P=2,952 P=964 P=13,638
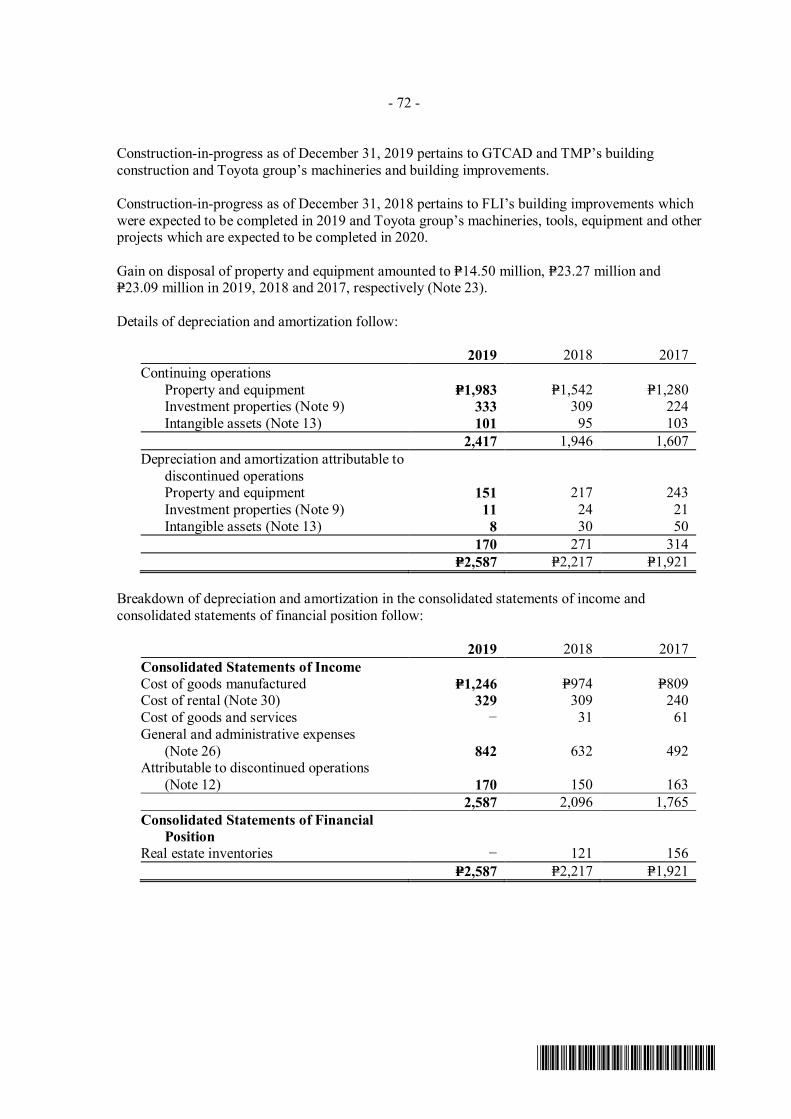
- 72 -
*SGVFSM000264*
Construction-in-progress as of December 31, 2019 pertains to GTCAD and TMP’s buildingconstruction and Toyota group’s machineries and building improvements.
Construction-in-progress as of December 31, 2018 pertains to FLI’s building improvements whichwere expected to be completed in 2019 and Toyota group’s machineries, tools, equipment and otherprojects which are expected to be completed in 2020.
Gain on disposal of property and equipment amounted to P=14.50 million, P=23.27 million andP=23.09 million in 2019, 2018 and 2017, respectively (Note 23).
Details of depreciation and amortization follow:
2019 2018 2017Continuing operations Property and equipment P=1,983 P=1,542 P=1,280
Investment properties (Note 9) 333 309 224 Intangible assets (Note 13) 101 95 103
2,417 1,946 1,607Depreciation and amortization attributable to
discontinued operationsProperty and equipment 151 217 243
Investment properties (Note 9) 11 24 21 Intangible assets (Note 13) 8 30 50
170 271 314P=2,587 P=2,217 P=1,921
Breakdown of depreciation and amortization in the consolidated statements of income andconsolidated statements of financial position follow:
2019 2018 2017Consolidated Statements of IncomeCost of goods manufactured P=1,246 P=974 P=809Cost of rental (Note 30) 329 309 240Cost of goods and services − 31 61General and administrative expenses
(Note 26) 842 632 492Attributable to discontinued operations
(Note 12) 170 150 1632,587 2,096 1,765
Consolidated Statements of FinancialPosition
Real estate inventories − 121 156P=2,587 P=2,217 P=1,921
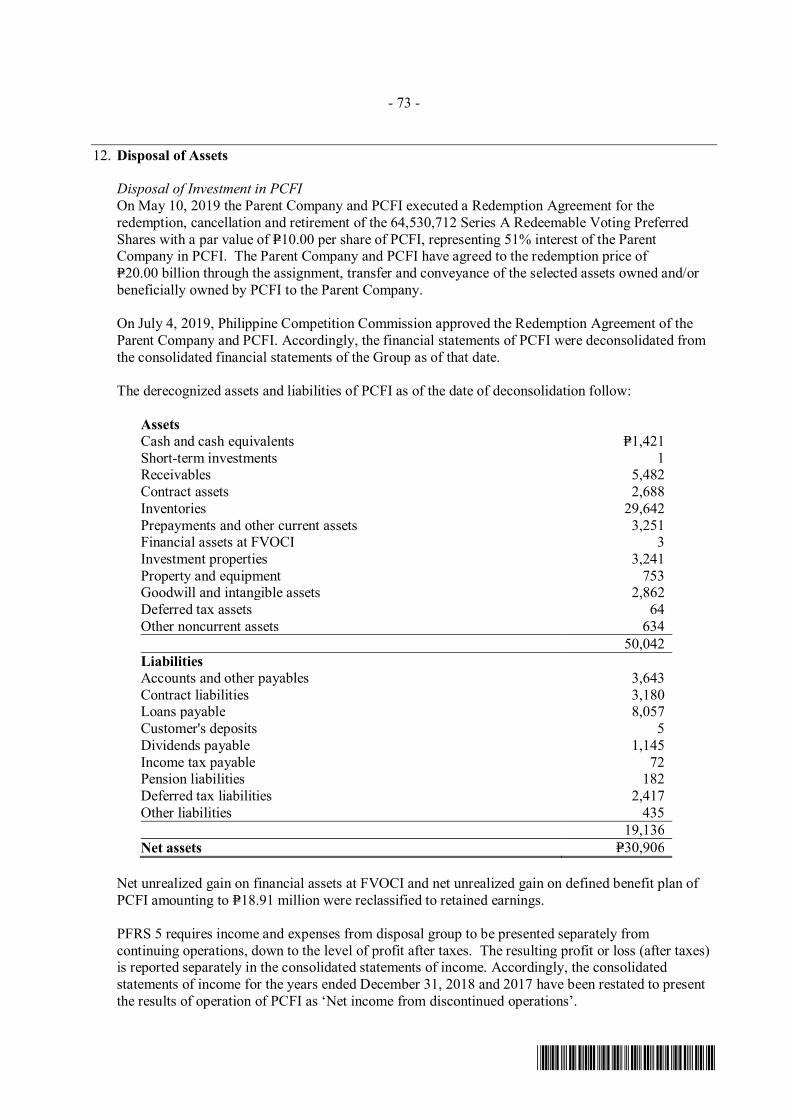
- 73 -
*SGVFSM000264*
12. Disposal of Assets
Disposal of Investment in PCFIOn May 10, 2019 the Parent Company and PCFI executed a Redemption Agreement for theredemption, cancellation and retirement of the 64,530,712 Series A Redeemable Voting PreferredShares with a par value of P=10.00 per share of PCFI, representing 51% interest of the ParentCompany in PCFI. The Parent Company and PCFI have agreed to the redemption price ofP=20.00 billion through the assignment, transfer and conveyance of the selected assets owned and/orbeneficially owned by PCFI to the Parent Company.
On July 4, 2019, Philippine Competition Commission approved the Redemption Agreement of theParent Company and PCFI. Accordingly, the financial statements of PCFI were deconsolidated fromthe consolidated financial statements of the Group as of that date.
The derecognized assets and liabilities of PCFI as of the date of deconsolidation follow:
AssetsCash and cash equivalents P=1,421Short-term investments 1Receivables 5,482Contract assets 2,688Inventories 29,642Prepayments and other current assets 3,251Financial assets at FVOCI 3Investment properties 3,241Property and equipment 753Goodwill and intangible assets 2,862Deferred tax assets 64Other noncurrent assets 634
50,042LiabilitiesAccounts and other payables 3,643Contract liabilities 3,180Loans payable 8,057Customer's deposits 5Dividends payable 1,145Income tax payable 72Pension liabilities 182Deferred tax liabilities 2,417Other liabilities 435
19,136Net assets P=30,906
Net unrealized gain on financial assets at FVOCI and net unrealized gain on defined benefit plan ofPCFI amounting to P=18.91 million were reclassified to retained earnings.
PFRS 5 requires income and expenses from disposal group to be presented separately fromcontinuing operations, down to the level of profit after taxes. The resulting profit or loss (after taxes)is reported separately in the consolidated statements of income. Accordingly, the consolidatedstatements of income for the years ended December 31, 2018 and 2017 have been restated to presentthe results of operation of PCFI as ‘Net income from discontinued operations’.
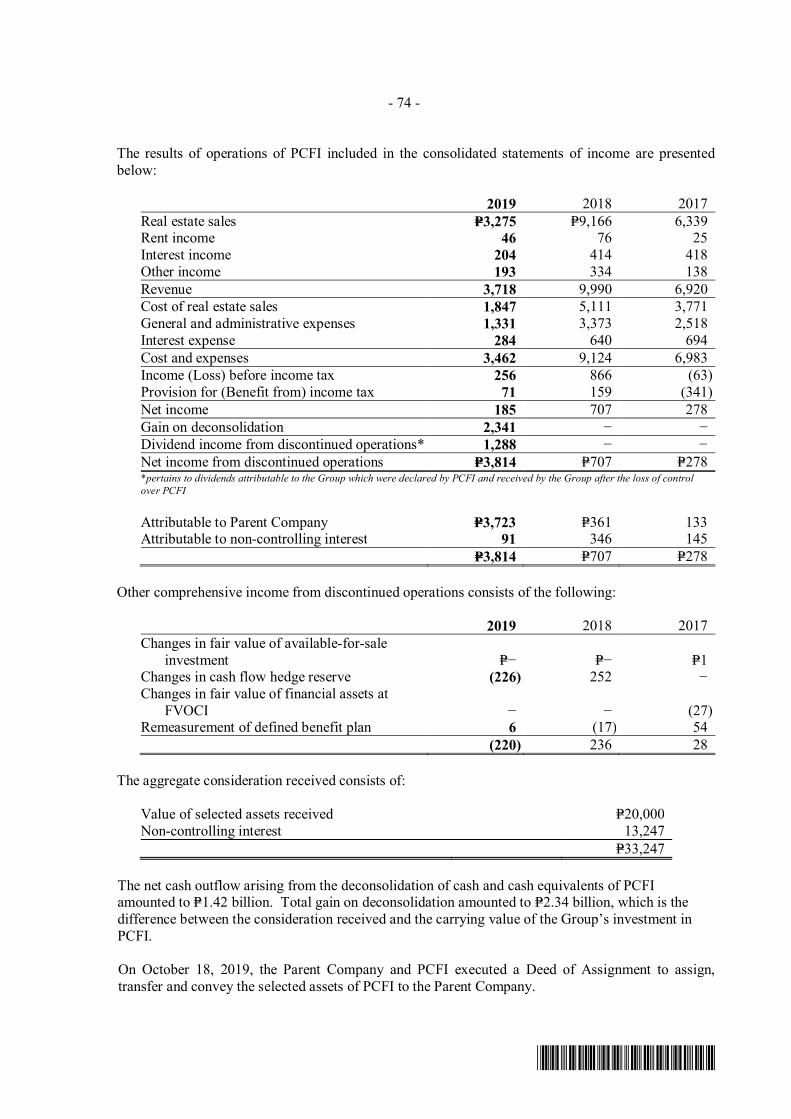
- 74 -
*SGVFSM000264*
The results of operations of PCFI included in the consolidated statements of income are presentedbelow:
2019 2018 2017Real estate sales P=3,275 P=9,166 6,339Rent income 46 76 25Interest income 204 414 418Other income 193 334 138Revenue 3,718 9,990 6,920Cost of real estate sales 1,847 5,111 3,771General and administrative expenses 1,331 3,373 2,518Interest expense 284 640 694Cost and expenses 3,462 9,124 6,983Income (Loss) before income tax 256 866 (63)Provision for (Benefit from) income tax 71 159 (341)Net income 185 707 278Gain on deconsolidation 2,341 − −Dividend income from discontinued operations* 1,288 − −Net income from discontinued operations P=3,814 P=707 P=278*pertains to dividends attributable to the Group which were declared by PCFI and received by the Group after the loss of controlover PCFI
Attributable to Parent Company P=3,723 P=361 133Attributable to non-controlling interest 91 346 145
P=3,814 P=707 P=278
Other comprehensive income from discontinued operations consists of the following:
2019 2018 2017Changes in fair value of available-for-sale
investment P=− P=− P=1Changes in cash flow hedge reserve (226) 252 −Changes in fair value of financial assets at
FVOCI − − (27)Remeasurement of defined benefit plan 6 (17) 54
(220) 236 28
The aggregate consideration received consists of:
Value of selected assets received P=20,000Non-controlling interest 13,247
P=33,247
The net cash outflow arising from the deconsolidation of cash and cash equivalents of PCFIamounted to P=1.42 billion. Total gain on deconsolidation amounted to P=2.34 billion, which is thedifference between the consideration received and the carrying value of the Group’s investment inPCFI.
On October 18, 2019, the Parent Company and PCFI executed a Deed of Assignment to assign,transfer and convey the selected assets of PCFI to the Parent Company.
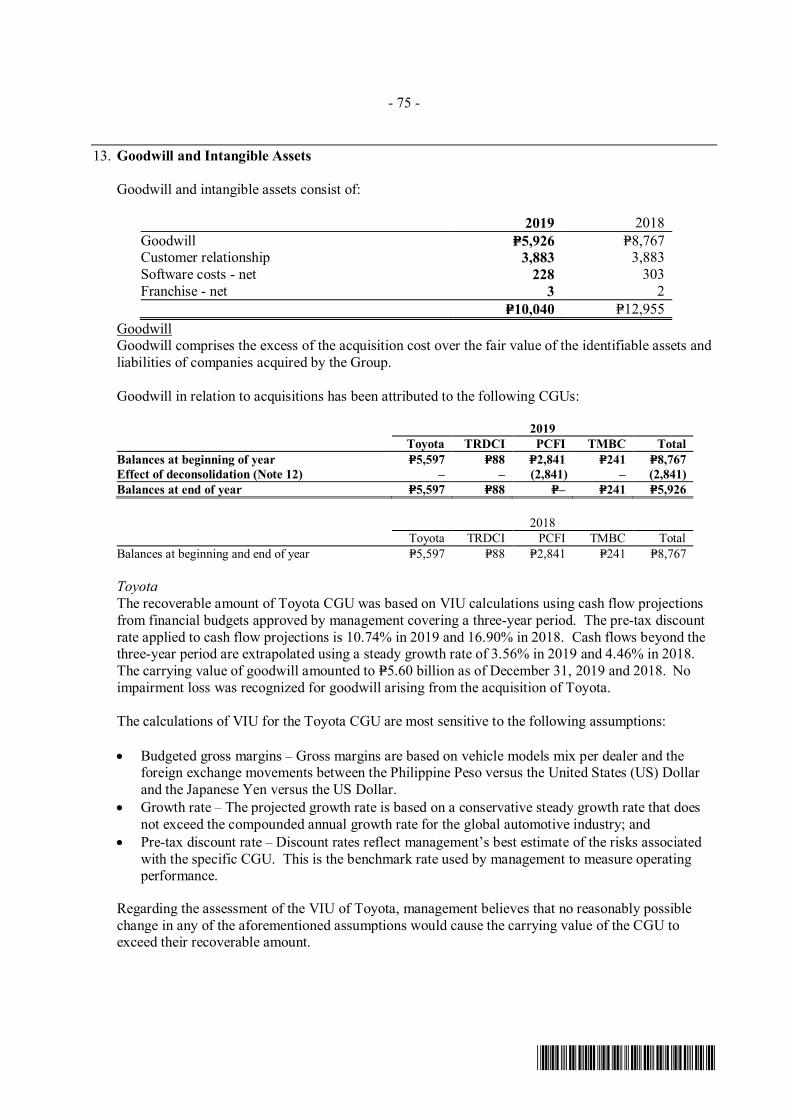
- 75 -
*SGVFSM000264*
13. Goodwill and Intangible Assets
Goodwill and intangible assets consist of:
2019 2018Goodwill P=5,926 P=8,767Customer relationship 3,883 3,883Software costs - net 228 303Franchise - net 3 2
P=10,040 P=12,955GoodwillGoodwill comprises the excess of the acquisition cost over the fair value of the identifiable assets andliabilities of companies acquired by the Group.
Goodwill in relation to acquisitions has been attributed to the following CGUs:
2019Toyota TRDCI PCFI TMBC Total
Balances at beginning of year P=5,597 P=88 P=2,841 P=241 P=8,767Effect of deconsolidation (Note 12) – – (2,841) – (2,841)Balances at end of year P=5,597 P=88 P=– P=241 P=5,926
2018Toyota TRDCI PCFI TMBC Total
Balances at beginning and end of year P=5,597 P=88 P=2,841 P=241 P=8,767
ToyotaThe recoverable amount of Toyota CGU was based on VIU calculations using cash flow projectionsfrom financial budgets approved by management covering a three-year period. The pre-tax discountrate applied to cash flow projections is 10.74% in 2019 and 16.90% in 2018. Cash flows beyond thethree-year period are extrapolated using a steady growth rate of 3.56% in 2019 and 4.46% in 2018.The carrying value of goodwill amounted to P=5.60 billion as of December 31, 2019 and 2018. Noimpairment loss was recognized for goodwill arising from the acquisition of Toyota.
The calculations of VIU for the Toyota CGU are most sensitive to the following assumptions:
· Budgeted gross margins – Gross margins are based on vehicle models mix per dealer and theforeign exchange movements between the Philippine Peso versus the United States (US) Dollarand the Japanese Yen versus the US Dollar.
· Growth rate – The projected growth rate is based on a conservative steady growth rate that doesnot exceed the compounded annual growth rate for the global automotive industry; and
· Pre-tax discount rate – Discount rates reflect management’s best estimate of the risks associatedwith the specific CGU. This is the benchmark rate used by management to measure operatingperformance.
Regarding the assessment of the VIU of Toyota, management believes that no reasonably possiblechange in any of the aforementioned assumptions would cause the carrying value of the CGU toexceed their recoverable amount.
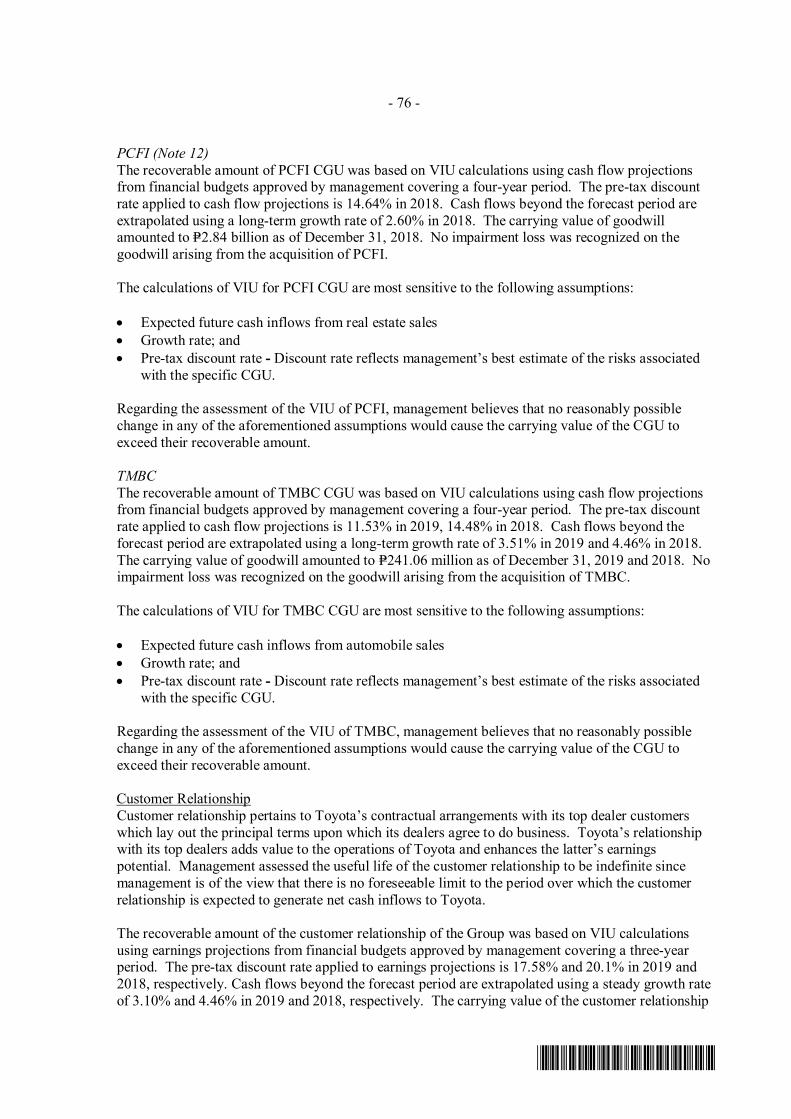
- 76 -
*SGVFSM000264*
PCFI (Note 12)The recoverable amount of PCFI CGU was based on VIU calculations using cash flow projectionsfrom financial budgets approved by management covering a four-year period. The pre-tax discountrate applied to cash flow projections is 14.64% in 2018. Cash flows beyond the forecast period areextrapolated using a long-term growth rate of 2.60% in 2018. The carrying value of goodwillamounted to P=2.84 billion as of December 31, 2018. No impairment loss was recognized on thegoodwill arising from the acquisition of PCFI.
The calculations of VIU for PCFI CGU are most sensitive to the following assumptions:
· Expected future cash inflows from real estate sales· Growth rate; and· Pre-tax discount rate - Discount rate reflects management’s best estimate of the risks associated
with the specific CGU.
Regarding the assessment of the VIU of PCFI, management believes that no reasonably possiblechange in any of the aforementioned assumptions would cause the carrying value of the CGU toexceed their recoverable amount.
TMBCThe recoverable amount of TMBC CGU was based on VIU calculations using cash flow projectionsfrom financial budgets approved by management covering a four-year period. The pre-tax discountrate applied to cash flow projections is 11.53% in 2019, 14.48% in 2018. Cash flows beyond theforecast period are extrapolated using a long-term growth rate of 3.51% in 2019 and 4.46% in 2018.The carrying value of goodwill amounted to P=241.06 million as of December 31, 2019 and 2018. Noimpairment loss was recognized on the goodwill arising from the acquisition of TMBC.
The calculations of VIU for TMBC CGU are most sensitive to the following assumptions:
· Expected future cash inflows from automobile sales· Growth rate; and· Pre-tax discount rate - Discount rate reflects management’s best estimate of the risks associated
with the specific CGU.
Regarding the assessment of the VIU of TMBC, management believes that no reasonably possiblechange in any of the aforementioned assumptions would cause the carrying value of the CGU toexceed their recoverable amount.
Customer RelationshipCustomer relationship pertains to Toyota’s contractual arrangements with its top dealer customerswhich lay out the principal terms upon which its dealers agree to do business. Toyota’s relationshipwith its top dealers adds value to the operations of Toyota and enhances the latter’s earningspotential. Management assessed the useful life of the customer relationship to be indefinite sincemanagement is of the view that there is no foreseeable limit to the period over which the customerrelationship is expected to generate net cash inflows to Toyota.
The recoverable amount of the customer relationship of the Group was based on VIU calculationsusing earnings projections from financial budgets approved by management covering a three-yearperiod. The pre-tax discount rate applied to earnings projections is 17.58% and 20.1% in 2019 and2018, respectively. Cash flows beyond the forecast period are extrapolated using a steady growth rateof 3.10% and 4.46% in 2019 and 2018, respectively. The carrying value of the customer relationship
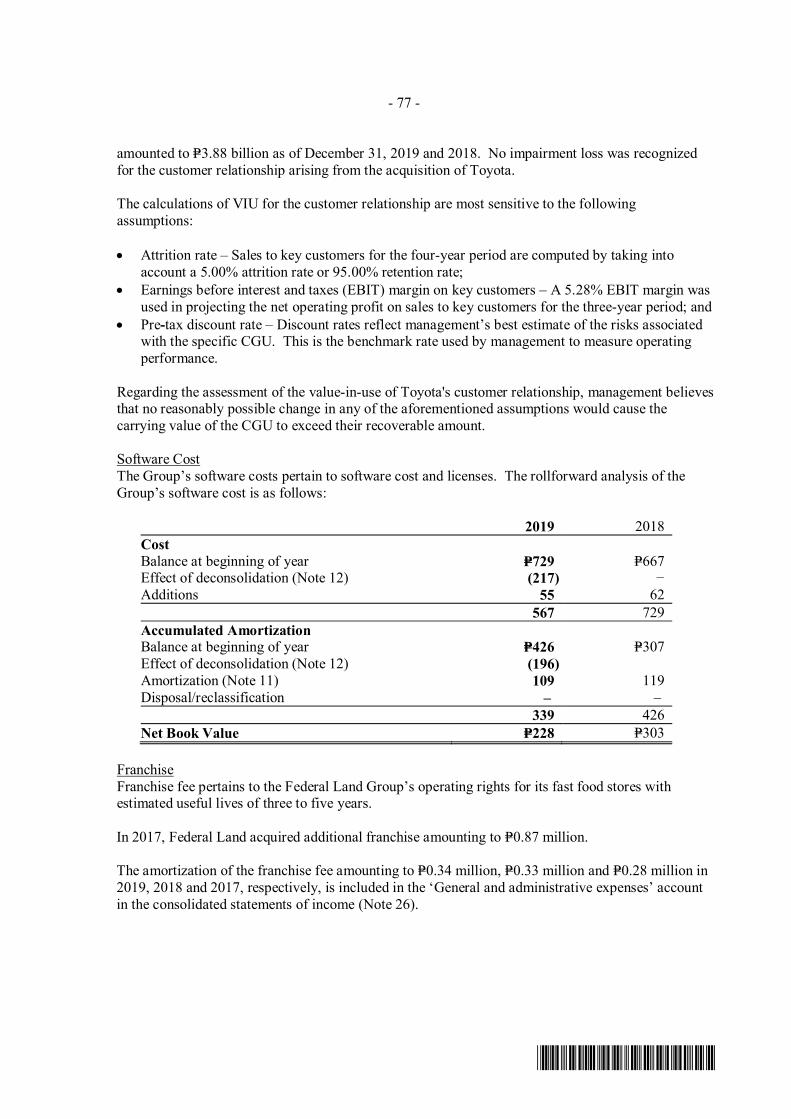
- 77 -
*SGVFSM000264*
amounted to P=3.88 billion as of December 31, 2019 and 2018. No impairment loss was recognizedfor the customer relationship arising from the acquisition of Toyota.
The calculations of VIU for the customer relationship are most sensitive to the followingassumptions:
· Attrition rate – Sales to key customers for the four-year period are computed by taking intoaccount a 5.00% attrition rate or 95.00% retention rate;
· Earnings before interest and taxes (EBIT) margin on key customers – A 5.28% EBIT margin wasused in projecting the net operating profit on sales to key customers for the three-year period; and
· Pre-tax discount rate – Discount rates reflect management’s best estimate of the risks associatedwith the specific CGU. This is the benchmark rate used by management to measure operatingperformance.
Regarding the assessment of the value-in-use of Toyota's customer relationship, management believesthat no reasonably possible change in any of the aforementioned assumptions would cause thecarrying value of the CGU to exceed their recoverable amount.
Software CostThe Group’s software costs pertain to software cost and licenses. The rollforward analysis of theGroup’s software cost is as follows:
2019 2018CostBalance at beginning of year P=729 P=667Effect of deconsolidation (Note 12) (217) −Additions 55 62
567 729Accumulated AmortizationBalance at beginning of year P=426 P=307Effect of deconsolidation (Note 12) (196)Amortization (Note 11) 109 119Disposal/reclassification – –
339 426Net Book Value P=228 P=303
FranchiseFranchise fee pertains to the Federal Land Group’s operating rights for its fast food stores withestimated useful lives of three to five years.
In 2017, Federal Land acquired additional franchise amounting to P=0.87 million.
The amortization of the franchise fee amounting to P=0.34 million, P=0.33 million and P=0.28 million in2019, 2018 and 2017, respectively, is included in the ‘General and administrative expenses’ accountin the consolidated statements of income (Note 26).
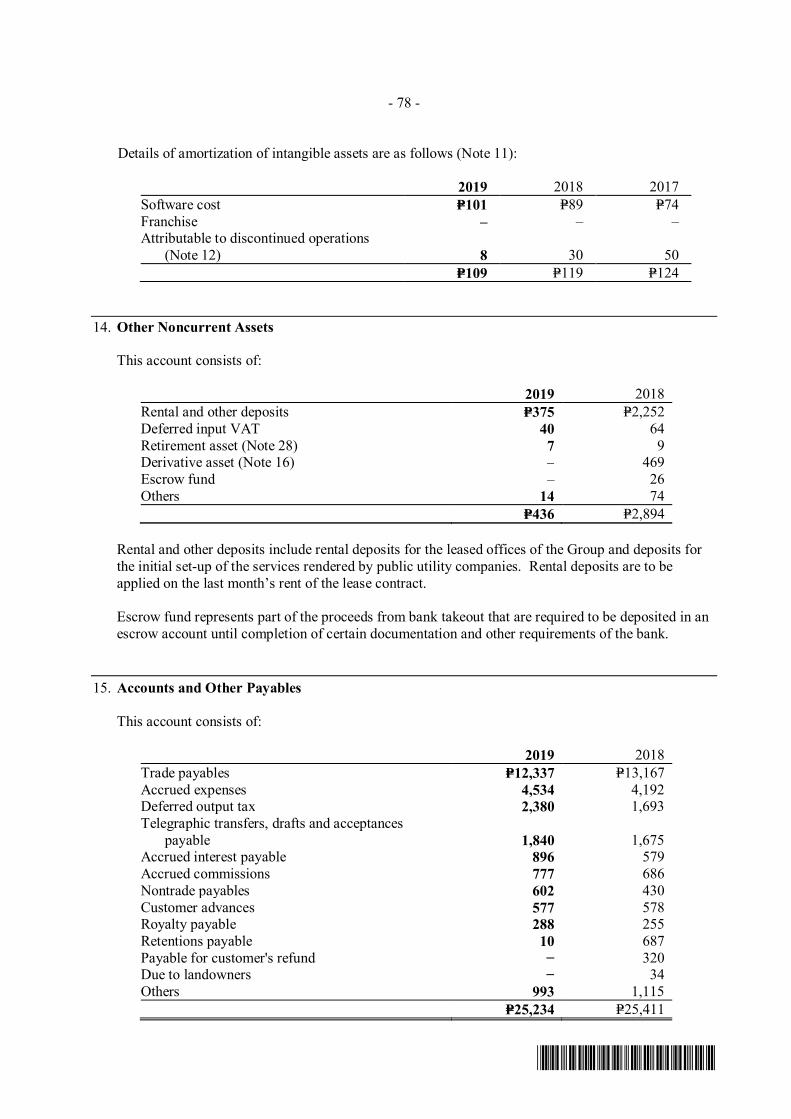
- 78 -
*SGVFSM000264*
Details of amortization of intangible assets are as follows (Note 11):
2019 2018 2017Software cost P=101 P=89 P=74Franchise – – –Attributable to discontinued operations
(Note 12) 8 30 50P=109 P=119 P=124
14. Other Noncurrent Assets
This account consists of:
2019 2018Rental and other deposits P=375 P=2,252Deferred input VAT 40 64Retirement asset (Note 28) 7 9Derivative asset (Note 16) – 469Escrow fund – 26Others 14 74
P=436 P=2,894
Rental and other deposits include rental deposits for the leased offices of the Group and deposits forthe initial set-up of the services rendered by public utility companies. Rental deposits are to beapplied on the last month’s rent of the lease contract.
Escrow fund represents part of the proceeds from bank takeout that are required to be deposited in anescrow account until completion of certain documentation and other requirements of the bank.
15. Accounts and Other Payables
This account consists of:
2019 2018Trade payables P=12,337 P=13,167Accrued expenses 4,534 4,192Deferred output tax 2,380 1,693Telegraphic transfers, drafts and acceptances
payable 1,840 1,675Accrued interest payable 896 579Accrued commissions 777 686Nontrade payables 602 430Customer advances 577 578Royalty payable 288 255Retentions payable 10 687Payable for customer's refund − 320Due to landowners − 34Others 993 1,115
P=25,234 P=25,411
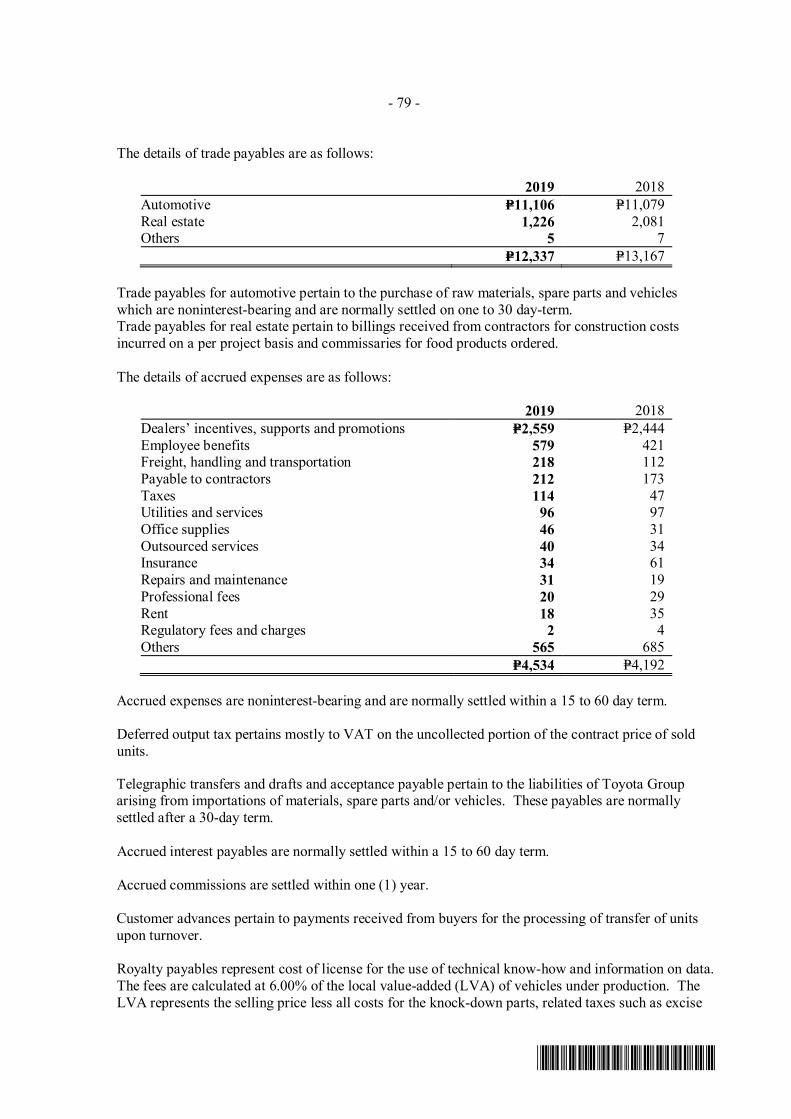
- 79 -
*SGVFSM000264*
The details of trade payables are as follows:
2019 2018Automotive P=11,106 P=11,079Real estate 1,226 2,081Others 5 7
P=12,337 P=13,167
Trade payables for automotive pertain to the purchase of raw materials, spare parts and vehicleswhich are noninterest-bearing and are normally settled on one to 30 day-term.Trade payables for real estate pertain to billings received from contractors for construction costsincurred on a per project basis and commissaries for food products ordered.
The details of accrued expenses are as follows:
2019 2018Dealers’ incentives, supports and promotions P=2,559 P=2,444Employee benefits 579 421Freight, handling and transportation 218 112Payable to contractors 212 173Taxes 114 47Utilities and services 96 97Office supplies 46 31Outsourced services 40 34Insurance 34 61Repairs and maintenance 31 19Professional fees 20 29Rent 18 35Regulatory fees and charges 2 4Others 565 685
P=4,534 P=4,192
Accrued expenses are noninterest-bearing and are normally settled within a 15 to 60 day term.
Deferred output tax pertains mostly to VAT on the uncollected portion of the contract price of soldunits.
Telegraphic transfers and drafts and acceptance payable pertain to the liabilities of Toyota Grouparising from importations of materials, spare parts and/or vehicles. These payables are normallysettled after a 30-day term.
Accrued interest payables are normally settled within a 15 to 60 day term.
Accrued commissions are settled within one (1) year.
Customer advances pertain to payments received from buyers for the processing of transfer of unitsupon turnover.
Royalty payables represent cost of license for the use of technical know-how and information on data.The fees are calculated at 6.00% of the local value-added (LVA) of vehicles under production. TheLVA represents the selling price less all costs for the knock-down parts, related taxes such as excise
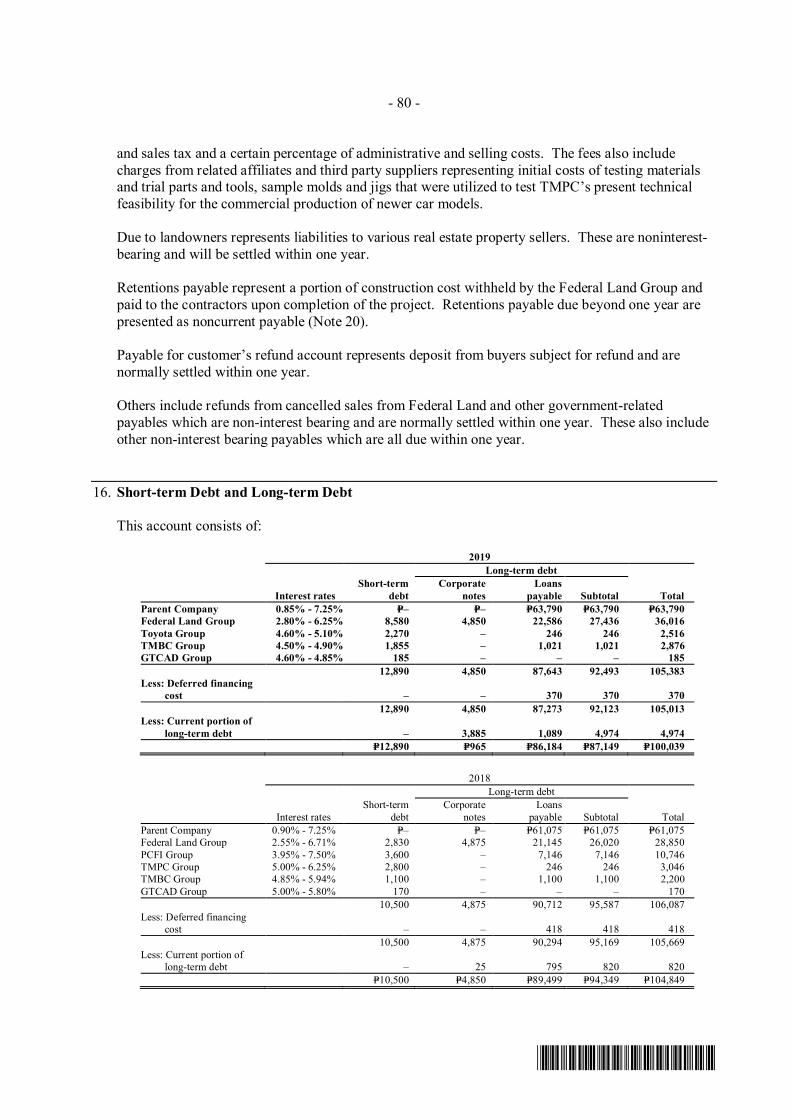
- 80 -
*SGVFSM000264*
and sales tax and a certain percentage of administrative and selling costs. The fees also includecharges from related affiliates and third party suppliers representing initial costs of testing materialsand trial parts and tools, sample molds and jigs that were utilized to test TMPC’s present technicalfeasibility for the commercial production of newer car models.
Due to landowners represents liabilities to various real estate property sellers. These are noninterest-bearing and will be settled within one year.
Retentions payable represent a portion of construction cost withheld by the Federal Land Group andpaid to the contractors upon completion of the project. Retentions payable due beyond one year arepresented as noncurrent payable (Note 20).
Payable for customer’s refund account represents deposit from buyers subject for refund and arenormally settled within one year.
Others include refunds from cancelled sales from Federal Land and other government-relatedpayables which are non-interest bearing and are normally settled within one year. These also includeother non-interest bearing payables which are all due within one year.
16. Short-term Debt and Long-term Debt
This account consists of:
2019Long-term debt
Interest ratesShort-term
debtCorporate
notesLoans
payable Subtotal TotalParent Company 0.85% - 7.25% P=– P=– P=63,790 P=63,790 P=63,790Federal Land Group 2.80% - 6.25% 8,580 4,850 22,586 27,436 36,016Toyota Group 4.60% - 5.10% 2,270 – 246 246 2,516TMBC Group 4.50% - 4.90% 1,855 – 1,021 1,021 2,876GTCAD Group 4.60% - 4.85% 185 – – – 185
12,890 4,850 87,643 92,493 105,383Less: Deferred financing
cost – – 370 370 37012,890 4,850 87,273 92,123 105,013
Less: Current portion oflong-term debt – 3,885 1,089 4,974 4,974
P=12,890 P=965 P=86,184 P=87,149 P=100,039
2018Long-term debt
Interest ratesShort-term
debtCorporate
notesLoans
payable Subtotal TotalParent Company 0.90% - 7.25% P=– P=– P=61,075 P=61,075 P=61,075Federal Land Group 2.55% - 6.71% 2,830 4,875 21,145 26,020 28,850PCFI Group 3.95% - 7.50% 3,600 – 7,146 7,146 10,746TMPC Group 5.00% - 6.25% 2,800 – 246 246 3,046TMBC Group 4.85% - 5.94% 1,100 – 1,100 1,100 2,200GTCAD Group 5.00% - 5.80% 170 – – – 170
10,500 4,875 90,712 95,587 106,087Less: Deferred financing
cost – – 418 418 41810,500 4,875 90,294 95,169 105,669
Less: Current portion oflong-term debt – 25 795 820 820
P=10,500 P=4,850 P=89,499 P=94,349 P=104,849
- 81 -
*SGVFSM000264*
Short-term DebtParent Company Short-term LoansIn June 2018, the Parent Company obtained an unsecured short-term loan denominated in JapaneseYen (JPY or ¥) with a term of less than 30 days from a non-affiliated foreign bank for a principalamount of ¥22.20 billion with an interest rate of 0.90% and was refinanced by a JPY-denominatedlong-term debt in July 2018.
Federal Land Group Short-term LoansNon-affiliated loansIn 2019 and 2018, Federal Land Group’s outstanding unsecured short-term borrowings amounting toP=6.38 billion and P=2.83 billion, respectively, have terms of over 60 to 180 day obtained for theGroup’s working capital requirements with interest rates ranging from 4.25% to 6.00%, 2.80% to6.00% and 2.80% to 4.00% in 2019, 2018 and 2017, respectively.
Affiliated loans (Note 27)In 2019 and 2018, Federal Land Group’s outstanding unsecured short-term borrowings from MBTC,an affiliated local bank amounting to P=2.20 billion and P=1.10 billion, respectively, have terms of over60 to 180 day obtained for the Group’s working capital requirements with interest rates ranging from4.60% to 6.25%, 4.60% to 5.50% and 2.80% to 3.00% in 2019, 2018 and 2017, respectively.
Toyota Group Short-term LoansNon-affiliated loansIn 2019 and 2018, Toyota Group’s outstanding unsecured short-term borrowingsamounting toP=0.62 billion and P=1.22 billion, respectively,have terms of one year or less obtained to finance itsoperating activities. These loans bear annual fixed interest rates ranging from 4.60% to 5.10%, 5.05%to 6.25% and 2.55% to 3.38% in 2019, 2018 and 2017, respectively.
Affiliated loans (Note 27)In 2019 and 2018, Toyota Group’s outstanding unsecured short-term borrowings from MBTC, anaffiliated local bank amounting to P=1.65 billion and P=1.58 billion, respectively, have terms of over60 to 180 day obtained to fund the Group’s working capital requirements with interest rates rangingfrom 4.60% to 4.85%, 5.00% to 5.65% and 2.50% to 2.98% in 2019, 2018 and 2017, respectively.
TMBC Group Short-term LoansNon-affiliated loansIn 2019 and 2018, TMBC Group’s unsecured short-term borrowings amounting to P=0.93 billion andP=0.25 billion, respectively, have terms ranging from 25 to 31 days obtained to finance its workingcapital requirements. These loans bear interest rates ranging from 4.55% to 4.90%, 5.10% to 5.50%,and 2.50% to 2.75% in 2019, 2018 and 2017, respectively.
Affiliated loans (Note 27)In 2019 and 2018, TMBC Group’s outstanding unsecured short-term borrowings from MBTC, anaffiliated local bank amounting to P=0.92 billion and P=0.85 billion, respectively, have terms of over 28to 39 days obtained to fund the Group’s working capital requirements with interest rates ranging from4.50% to 4.85%, 5.00% to 5.65% and 2.50% to 2.80% in 2019, 2018 and 2017, respectively.
GTCAD Group Short-term LoansNon-affiliated loansIn 2019 and 2018, GTCAD Group’s unsecured short short-term borrowings amounting toP=0.05 billion and P=0.08 billion, respectively, have terms ranging from 30 to 90 days obtained fromaffiliated and non-affiliated local banksto finance the working capital requirements with interest ratesof 4.60% to 4.85% and 5.50% to 5.80%, in 2019 and 2018, respectively.
- 82 -
*SGVFSM000264*
Affiliated loans (Note 27)In 2019 and 2018, GTCAD Group’s outstanding unsecured short-term borrowings from MBTC, anaffiliated local bank amounting to P=0.14 billion and P=0.09 billion, respectively, have terms of over 28to 39 days obtained to fund the Group’s working capital requirements with interest rates ranging from4.60% to 4.85%, and 5.00% to 5.35% in 2019 and 2018, respectively.
PCFI Group Short-term LoansIn 2018, PCFI Group’s unsecured short-term loans amounting to P=3.60 billion have terms of one yearor less obtained from various non-affiliated local banks to finance its working capital requirements.These loans bear fixed interest rates ranging from 4.00% to 5.75% and 3.12% to 3.95% in 2018 and2017, respectively.
Total interest expense charged to operations from the above-mentioned short-term loans amounted toP=37.68 million and P=145.39 million in 2018 and 2017, respectively. Interest expense capitalizedamounted to nil and P=20.51 million in 2018 and 2017, respectively.
Federal Land - Corporate NotesOn July 5, 2013, the Group issued P=4.00 billion unsecured notes with 5.57% interest per annummaturing on July 5, 2020 and an additional P=1.00 billion notes with 6.27% interest per annummaturing on July 5, 2023. The proceeds from the issuance were used to finance ongoing projects. Asof December 31, 2019 and 2018, outstanding balance amounted to P=4.85 billion and P=4.88 billion,respectively. As of December 31, 2019 and 2018, the current portion amounting to P=3.88 billion andP=0.02 billion, respectively, are presented as a current liability.
The agreements covering the above-mentioned Notes provide for restrictions and requirements withrespect to, among others, declaration or making payment of cash dividends/retirement of shares (otherthan dividends payable solely in shares of its capital stock and cash dividends due on its then-outstanding preferred shares); making distribution on its share capital; purchase, redemption oracquisition of any share of stock; incurrence or assumption of indebtedness; sale or transfer anddisposal of all or a substantial part of its capital assets; restrictions on use of funds; maintainingcertain financial ratios; and entering into any partnership, merger, consolidation or reorganization. Asof December 31, 2019 and 2018, the Group has complied with the loan covenants.
Interest expense charged to operations amounted to P=122.71 million in 2019, P=77.27 million in 2018and nil in 2017. Interest expense capitalized amounted to P=165.86 million, P=334.10 million andP=289.73 million in 2019, 2018 and 2017, respectively.
Long-term LoansParent Company Long-term Peso LoansIn November 2019, the Parent Company obtained an unsecured long-term loan with a non-affiliatedlocal bank with a principal amount of P=3.00 billion to refinance bonds due in November 2019. Saidloan bear fixed interest rate of 5.39% with a term of 10 years and maturity date of 2029.
In March 2018, the Parent Company obtained unsecured long-term loans with various non-affiliatedlocal banks with an aggregate principal amount of P=25.00 billion. Said loans bear fixed interest ratesranging from 6.50% to 7.25%, with terms ranging from 10 to 12 years and maturity dates rangingfrom 2028 to 2030.
In 2015, the Parent Company obtained unsecured long-term loans with various non-affiliated localbanks with an aggregate principal amount of P=25.00 billion. Said loans bear fixed interest ratesranging from 5.00% to 5.88%, with various terms ranging from 10 to 13 years and maturity datesranging from 2025 to 2028.
- 83 -
*SGVFSM000264*
As of December 31, 2019 and 2018, the carrying value of the above-mentioned long-term loanspayable amounted to P=52.74 billion and P=49.73 billion, respectively.
Parent Company Long-term JPY LoansIn July 2018, the Parent Company obtained an unsecured long-term loan from three (3) non-affiliatedforeign banks for an aggregate principal amount of ¥23.31 billion, 50% of which will mature in July2022 and the remaining 50% will mature in July 2024 with interest rate of 3-month JPY Libor plus0.65% spread. Proceeds from the loan were used to refinance a short-term loan from a non-affiliatedforeign bank for a principal amount of ¥22.20 billion with an interest rate of 0.90%. As ofDecember 31, 2019 and 2018, the carrying value of the said loan amounted to P=10.73 billion andP=11.00 billion, respectively.
In July 2018, the Parent Company entered into an interest rate swap agreement with MUFG Bank,Ltd., Labuan Branch. Under the agreement the Parent Company, on a quarterly basis, pays fixedinterest rate of 0.852% and receives floating interest rate of 3-month JPY Libor plus 0.65% spreadfrom July 19, 2018 to July 12, 2024. On the same date, the Parent Company designated the swap asan effective hedging instrument under a cash flow hedge arrangement. As such, the effective portionof the changes in fair value of the swaps was recognized under other comprehensive incomeamounting to P=52.58 million and P=62.18 million in 2019 and 2018, respectively. As ofDecember 31, 2019 and 2018 the negative fair value of the interest rate swap amountedP=52.58 million and P=62.18 million, respectively under ‘Other noncurrent liabilities’ (Note 20).
As of December 31, 2019 and 2018, the movement in the deferred financing cost follows:
2019 2018Balances at beginning of year P=346 P=103Additions 53 275Amortization (74) (32)Balances at end of year P=325 P=346
Total interest expense incurred on these long-term loans payable in 2019, 2018 and 2017 amounted toP=3.25 billion (including amortization of deferred financing cost of P=73.86 million), P=2.79 billion(including amortization of deferred financing cost of P=31.61 million) and P=1.41 billion (includingamortization of deferred financing cost of P=9.43 million), respectively.
Federal Land Long-term LoansNon-affiliated loansIn 2014, Federal Land obtained unsecured loans from various non-affiliated banks amounting toP=6.60 billion. The loan principal will be paid as follows: P=2.00 billion payable in full after 10 yearsfrom drawdown date with fixed interest rate of 5.86% per annum; P=1.50 billion payable in full after10 years from drawdown date with fixed interest rate of 5.85% per annum; P=2.00 billion payable at40.00% quarterly principal payment starting at the end of 5th year and 60.00% principal balance onmaturity date with fixed interest rate of 5.67% per annum; P=1.10 billion principal payable at 40%quarterly payment at the end of 5th year to 9th year and 60.00% principal balance on maturity datewith fixed interest rate of 5.05% per annum.
In 2015 to 2019, the Fed Land Group obtained unsecured long-term loans with various non-affiliatedlocal banks with an aggregate principal amount of P=7.08 billion. Said loans bear fixed annual interestrates ranging from 5.00% to 6.71%, various terms ranging from 5 to 10 years and maturity dates from2020 to 2026.
- 84 -
*SGVFSM000264*
As of December 31, 2019 and 2018, the carrying value of these non-affiliated long-term loansamounted to P=18.41 billion and P=12.14 billion, respectively, net of unamortized deferred financingcost.
Affiliated loans (Note 27)On August 25, 2016, Federal Land obtained a 5-year unsecured loan from MBTC, an affiliated bankwith a principal amount of P=2.00 billion and interest rate of 2.80% maturing on August 25, 2021.
On various dates in 2016, the Federal Land Group obtained unsecured long-term loans from anaffiliated bank with an aggregate principal amount of P=2.00 billion. The loans bear interest rates of2.55% to 2.60%, with terms of five (5) years and maturity date of 2021. The loan proceeds were usedto finance real estate projects.
On various dates in 2017, the Federal Land Group obtained various unsecured long-term loans froman affiliated bank totaling P=2.50 billion. Said loans bear interest rates of 2.75% to 2.90% and will bepayable in 2022. The loan proceeds were used to finance real estate projects.
On June 29, 2018, Federal Land obtained a 5-year unsecured loan from an affiliated local bank, witha principal amount of P=2.50 billion and interest rate of 4.25% maturing on June 29, 2023.
As of December 31, 2019 and 2018, the carrying value of these affiliated long-term loans payableamounted to P=8.98 billion and P=8.96 billion, respectively, net of unamortized deferred financing cost.
As of December 31, 2019 and 2018, the movement in the deferred financing cost is as follows:
2019 2018Balances at beginning of year P=42 P=26Additions 12 33Amortization (11) (17)Balances at end of year P=43 P=42
Interest expense charged to operations amounted to P=859.52 million in 2019, P=1.07 billion in 2018and P=621.40 million in 2017. Interest expense capitalized from the above-mentioned loans payableamounted to P=519.11 billion, P=1.38 billion and P=1.19 billion in 2019, 2018 and 2017, respectively.
Toyota Group Long-term LoansAs of December 31, 2019 and 2018, this account consists of unsecured long-term debt with thefollowing entities:
2019 2018TAPI P=79 P=79Other entities 167 167
P=246 P=246
The loan from TAPI bears a fixed interest rate of 4.20% per annum. This loan is for a period of fiveyears up to February 26, 2021 which is automatically renewed upon maturity for another period of5 years to 10 years.
The long-term unsecured interest-bearing loans with other entities consist of a 2.7% interest-bearing10-year term loan with a maturity date of September 28, 2025 and October 23, 2026. These loans areautomatically renewed upon maturity for another 10 years.
- 85 -
*SGVFSM000264*
The loan covenants restrict TMPC from encumbering or disposing properties leased by the lendersduring the respective terms of various loan agreements. TMPC is not required to maintain anyfinancial ratios under the mentioned loan agreements. Interest expense on these loans amounted toP=7.82 million, P=7.86 million and P=7.82 million in 2019, 2018 and 2017, respectively.
TMBC Long-term LoansOn March 21, 2016, TMBC entered into a Term Loan Facility with a non-affiliated local bankamounting to P=1.50 billion to finance the construction of the dealership facilities, with interest ratesranging from 4.85% to 5.94% and payable for a period of 10 years, inclusive of three (3) years graceperiod on principal repayments subject to interest rate based on 10-year PDST-R2 plus a minimumspread of 1.25%. TMBC loan is secured by a real estate mortgage. The carrying value of themortgaged properties amounted to P=392.68 million as of December 31, 2019 and 2018.
TMBC is required to maintain the following financial ratios during the term of the loans:
· Minimum current ratio (CR) of 1.0x - defined as Current Assets divided by Current Liabilities· Maximum debt to equity ratio (DER) of 4.0x - defined as Total Liabilities divided by Total
Tangible Net Worth (Total Equity - Intangibles)· Minimum debt service ratio (DSR) of 1.2x - defined as Earnings before Interest, Taxes,
Depreciation and Amortization divided by Interest Expense plus current portion of Long-termdebt of the previous year
As of December 31, 2019 and 2018, TMBC has complied with the required financial ratios.
As of December 31, 2019, 2018 and 2017, the movement in the deferred financing cost is as follows:
2019 2018Balances at beginning of year P=3 P=4Additions – –Amortization (1) (1)Balances at end of year P=2 P=3
As of December 31, 2019 and 2018, the carrying value of long-term loans payable amounted toP=1.02 billion and P=1.10 billion, respectively. As of December 31, 2019 and 2018, the current portionof long-term loans payable amounted to P=0.16 billion and P=0.08 billion, respectively.
Interest expense on long-term loans payable amounted to P=56.17 million, P=56.17 million andP=31.73 million in 2019, 2018 and 2017, respectively. Interest expense capitalized amounted tonil, P=0.77 million and P=28.10 million in 2019, 2018 and 2017, respectively.
PCFI Group Long-term LoansNon-affiliated LoansOn January 10, 2012, PCFI issued P=3.00 billion 5-year fixed rate notes to non-affiliated banks whichwere used to fund the acquisition of real estate properties, finance project development andconstruction costs and fund other general corporate purposes. The unsecured notes are payablequarterly and bear fixed rate of 7.18% plus 5% gross receipts tax and secured by various real estateproperties (Note 6). The notes were paid in full on January 26, 2017.
- 86 -
*SGVFSM000264*
On July 1, 2015, PCFI entered into a three-year unsecured Promissory Note Line facility with a non-affiliated bank amounting to P=1.00 billion. The note bears 5.29% interest rate fixed, payable monthlyin arrears and the principal are payable in lump sum on June 29, 2018. The loan was used to financeworking capital. The note was fully paid in 2017.
On December 11, 2015, PCFI entered into a 5-year Loan Facility Agreement with a non-affiliatedbank. The approved credit line was P=6.00 billion of which P=4.00 billion was drawn on December 31,2015 and P=2.00 billion was drawn on December 31, 2016. The loan bears a 6.00% interest ratepayable quarterly in arrears with a grace period on the payment of principal for one year, thereafter,the principal shall be payable on quarterly installment. The net proceeds from the unsecured loanpursuant to the loan facility were used for working capital. As of December 31, 2018, the outstandingbalance of the loan amounted to P=4.00 billion.
On December 19, 2016, WFC issued P=3.00 billion 5-year fixed rate term loan to non-affiliated bankswhich were used as permanent working capital in relation to the purchase of sales receivable fromPCFI. The unsecured notes are payable quarterly and bear fixed rate of 6.00%. The note was fullypaid in 2018.
Affiliated Loans (Note 27)On July 1, 2015, the Company entered into a three-year Promissory Note Line facility with anaffiliated bank amounting to P=1.50 billion (Note 27). The note is unsecured and bears 5.29% interestrate fixed, payable monthly in arrears and the principal are payable in lump sum on June 29, 2018.The loan was used to finance working capital requirement. The loan was settled in 2018.
On June 22, 2017, WFC entered into a unsecured US Dollar denominated loan agreement withMBTC, an affiliated bank. On the same day, WFC also entered into a cross-currency swap (CCS)agreement with the same affiliated bank to hedge the foreign currency and interest rate risks in the USDollar loan. WFC received $19.89 million on each tranche made in July, August and September2017 for a total of $59.67 million but will pay in peso equivalent to P=3.00 billion within 10 years inaccordance with the CCS agreement. Also, WFC, on a semi-annual basis, will pay fixed interest rateof 5.13% per annum on the peso principal amounting to P=3.00 billion and will receive floatinginterest rate at 6-month US Dollar LIBOR plus 0.75% on $59.67 million over a period of 10 years orup to the maturity date of June 25, 2027. Effectively, under the swap agreement, WFC swaps its USDollar-denominated floating rate loans into peso fixed rate loans. On the same date, WFC designatedthe swap as effective hedging instrument under a cash flow hedge relationship. As such, the effectiveportion of the changes in fair value of the swaps was recognized under other comprehensive incomeamounting to positive P=225.64 million as of December 31, 2018. As of December 31, 2018, thepositive fair value of the currency swap amounting to P=468.80 million is included in ‘Derivativeassets’ under ‘Other noncurrent assets’.
As of December 31, 2018, the carrying value of WFC's USD loan amounted to P=3.15 billion(including unrealized foreign exchange loss of P=0.15 billion)
The loan has one-year grace period on principal payments and the partial payment on principal willbe computed as follows:
i. 1% of original loan amount at the end of the 2nd yearii. 3% of original loan amount at the end of 3rd, 4th and 5th yeariii. 18% of original loan amount at the end of 6th, 7th, 8th, 9th and 10th year
- 87 -
*SGVFSM000264*
As of December 31, 2018, the movement of the deferred financing cost is as follows:
2018Balances at beginning of year P=43Additions –Amortization (16)Balances at end of year P=27
Total interest expense incurred in 2018 and 2017 from the aforementioned loans payable amounted toP=315.35 million and P=415.13 million, respectively. Interest expense capitalized as part of real estateinventories amounted to P=76.49 millionand P=293.76 million in 2018 and 2017, respectively.
Debt CovenantsThe agreements covering the above mentioned loans provide for restrictions and requirements withrespect to, among others, declaration or making payment of dividends (except stock dividends);making distribution on its share capital; purchase, redemption or acquisition of any share of stock;incurrence or assumption of indebtedness; sale or transfer and disposal of all or a substantial part ofits capital assets; restrictions on use of funds; sustaining current ratio of at least 1.75; debt-to-equityfinancial ratio should not be more than 2.00 and entering into any partnership, merger, consolidationor reorganization.
These restrictions and requirements were complied with by the Group as of December 31, 2019 and2018.
Required Financial RatiosThe table below presents a summary of the financial ratios required to be maintained by each entitywithin the Group under existing loan agreements.
Entity Financial Ratio Required RatioTMBC CR 1:1TMBC DER 4:1TMBC DSR 1.2xFederal Land - Corporate notes DER 2:1Parent Company - Long-term loans DER 2.3:1
As of December 31, 2019 and 2018, the Group has complied with the foregoing financial ratios.
17. Bonds Payable
Maturity Dates Interest rate Par Value 2019 2018P=10.0 billion BondsFebruary 27, 2020 4.8371% P=3,900 P=3,899 P=3,892February 27, 2023 5.0937% 6,100 6,076 6,069
10,000 9,975 9,961P=12.0 billion BondsNovember 7, 2019 4.7106% 3,000 – 2,994August 7, 2021 5.1965% 5,000 4,986 4,978August 7, 2024 5.6250% 4,000 3,978 3,974
12,000 8,964 11,94622,000 18,939 21,907
Less: Current portion of bonds payable (3,000) (3,899) (2,994)P=19,000 P=15,040 P=18,913
- 88 -
*SGVFSM000264*
P=10.00 billion GT Capital bonds due 2020 and 2023On February 13, 2013, the Parent Company issued P=10.00 billion 7-year and 10-year unsecuredbonds due on February 27, 2020 and February 27, 2023, respectively, with annual interestrate of 4.84% and 5.09%, respectively. Gross and net proceeds amounted to P=10.00 billion andP=9.90 billion, respectively, net of deferred financing cost of P=0.10 billion. The bonds were listed onthe Philippine Dealing and Exchange Corporation on February 27, 2013.
The net proceeds were utilized for general corporate requirements which included various equity calls(e.g., Toledo plant and Panay plant) and refinancing of corporate notes.
Prior to the relevant maturity dates, the Parent Company may redeem (in whole but not in part) anyseries of the outstanding bonds on every anniversary date, or the immediately succeeding banking dayif such is not a banking day, starting on the fourth (4th) anniversary date for the seven-year bonds andthe seventh anniversary date for the 10-year bonds (the relevant Optional Redemption Dates). TheParent Company shall give no less than 30 but not more than 60 days prior written notice of itsintention to redeem the bonds at the relevant Optional Redemption Date.
P=12.00 billion GT Capital bonds due 2019, 2021 and 2024On July 24, 2014, the Parent Company issued P=12.00 billion unsecured bonds with tenors of fiveyears, seven years and ten years due November 7, 2019 (Series A Bonds), August 7, 2021(Series B Bonds) and August 7, 2024 (Series C Bonds), respectively, with annual interest rates of4.71%, 5.20% and 5.63% respectively. Gross and net proceeds amounted to P=12.00 billion andP=11.88 billion, respectively, net of deferred financing cost incurred of P=0.12 billion. The bonds werelisted on August 7, 2014.
The net proceeds were utilized for general corporate requirements which included financing ofongoing projects (e.g., Veritown Fort and Metropolitan Park), refinancing of outstanding loans, andfor working capital requirement.
Prior to the relevant maturity dates, the Parent Company may redeem in whole but not in part theSeries B or Series C Bonds on every anniversary date, or the immediately succeeding banking day ifsuch is not a banking day, starting on: (i) for the series B bonds: the third month after the fifthanniversary from issue date and (ii) for the series C bonds: the seventh anniversary from issue date(the relevant Optional Redemption Dates). The redemption price is equal to 100.00% of the principalamount together with the accrued and unpaid interest. The Parent Company shall give no less than 30but not more than 60 days prior written notice of its intention to redeem the bonds, which notice shallbe irrevocable and binding upon the Parent Company to effect such early redemption of the bonds onthe Early Redemption Option Date stated in such notice.
The P=3.00 billion bonds with maturity date of November 7, 2019 were paid. This was refinanced inNovember 2019 with a long-term loan from a non-affiliated local bank.
As of December 31, 2019 and 2018, the movement in the deferred financing cost is as follows:
2019 2018Balances at beginning of year P=93 P=123Amortization (32) (30)Balances at end of year P=61 P=93
- 89 -
*SGVFSM000264*
Both bonds contain negative covenants, which among others, include provision that the ParentCompany should maintain a debt-to-equity ratio of 2.3 to 1.0. As of December 31, 2019 and 2018,the Parent Company has complied with its bond covenants. Total interest expense incurred on bondspayable in 2019, 2018 and 2017 amounted to P=1.15 billion (including amortization of deferredfinancing cost of P=31.18 million), P=1.15 billion (including amortization of deferred financingcost of P=30.54 million) and P=1.15 billion (including amortization of deferred financing cost ofP=28.98 million), respectively.
18. Customers’ Deposits
As of December 31, 2019 and 2018, customers’ deposits represent refundable reservation fees andadvance payments received from customers which can be applied as payment to the respectiveautomotive sale transaction with the Group.
As of December 31, 2019 and 2018, the balance of this account amounted to P=0.56 billion andP=0.56 billion, respectively (Note 27).
19. Other Current Liabilities
This account consists of:
2019 2018VAT Payable P=820 P=318Withholding taxes payable 379 424Others 157 101
P=1,356 P=843
Others pertain to payables on utilities, contracted maintenance and security agencies and regulatorypremium or contribution payable of the Group. These are normally payable within one year.
20. Liabilities on Purchased Properties and Other Noncurrent Liabilities
Liabilities on Purchased PropertiesLiabilities on purchased properties are payables to various real estate property sellers. Under theterms of the agreements executed by Federal Land covering the purchase of certain real estateproperties, the titles of the subject properties shall be transferred to Federal Land only upon fullpayment of the real estate loans.
In 2017, Federal Land entered into a contract with Kabayan Realty Corporation (KRC) to acquirecertain land for P=2.26 billion. Upon execution of the contract, Federal Land paid KRC with 22%downpayment amounting to P=500.00 million and the outstanding balance amounting to P=1.76 billionshall be paid in five installments with 3.00% interest per annum based on the outstanding balance.The outstanding balance was discounted at the prevailing market rate of 4.75% and the discountedliability as of December 31, 2019 and 2018, amounted to P=1.22 billion and P=1.44 billion,respectively.
- 90 -
*SGVFSM000264*
In 2017, HLPDC entered into various contracts to acquire parcels of land for P=161.37 million. Uponexecution of the contracts, HLPDC paid P=93.99 million and the outstanding balance amounting toP=67.37 million shall be paid in 2018.
In 2012, Federal Land acquired certain land and investment properties aggregating P=3.72 billion, with20.00% downpayment amounting to P=743.84 million. The outstanding balance amounting toP=2.98 billion is payable in 13 years with 3.00% interest per annum. The outstanding balance wasdiscounted at the prevailing market rate of 5.40% and the discounted liability as ofDecember 31, 2019 and 2018, amounted to P=1.50 billion and P=1.85 billion, respectively.
Total outstanding liabilities on purchased properties (including current portion) amounted toP=3.78 billion and P=3.29 billion as of December 31, 2019 and 2018, respectively (Note 27). Accretionof interest in 2019, 2018 and 2017 amounted to P=156.48 million and P=168.05 million and P=95.04million, respectively.
Other Noncurrent Liabilities
This account consists of:
2019 2018Retentions payable - noncurrent portion P=1,263 P=1,024Refundable and other deposits 727 676Provisions (Note 36) 505 399Derivative liabilities (Note 16) 53 62Finance lease obligation - net 8 8
P=2,556 P=2,169
Retentions payable represent a portion of construction cost withheld by the Group and paid to thecontractors after an agreed period commencing the completion of the project.
Refundable and other deposits consist mainly of tenants’ rental deposit from operating lease contractswith terms ranging from five to ten years. Rental deposits are obtained to secure faithful complianceof tenants’ obligation under the lease contract and to answer for unpaid bills of lessees affecting theleased premises, any damage to the leased premises, and other similar costs. Rental deposits mayalso be applied to the unpaid rentals upon termination of the lease contract.
Provisions consist of:
2019 2018Claims and assessments P=315 P=199Product warranties 190 200
P=505 P=399
Provisions for other expenses pertains to liabilities with uncertain amount or timing of actualdisbursement. These include regulatory fees, management incentives and other charges whichpayment is probable and the amount is estimable as of reporting date. The management reassessestheir estimates on an annual basis to determine the reasonableness of provision. Disclosure ofinformation usually required by PAS 37, Provisions, Contingent Liabilities and Contingent Assets arenot provided because of reasons permitted under paragraph 92 of PAS 37. Accordingly, generaldescriptions are provided.
- 91 -
*SGVFSM000264*
21. Contract Balances and Cost to Obtain a Contract
The contract balances of the Group consist of the following:
2019 2018Contract AssetsCurrent P=5,095 P=8,329Noncurrent 5,556 6,886
P=10,651 P=15,215(Forward)Contract LiabilitiesCurrent P=4,553 P=8,787Noncurrent – –
P=4,553 P=8,787
Contract assets are initially recognized for revenue earned from real estate sales as receipt ofconsideration is conditional on successful completion of installation. Upon completion ofperformance obligation and acceptance by the customer, the amounts recognized as contract assetsare reclassified to trade residential and office development receivables.
Contract liabilities consist of collections from real estate customers which have not reached the 10%threshold to qualify for revenue recognition and excess of collections over the recognized receivablesand contract assets based on percentage of completion.
The amount of revenue recognized in 2019 and 2018 from amounts included in contract liabilities atthe beginning of the year amounted to P=1.23 billion and P=1.55 billion, respectively.
Cost to Obtain a ContractThe balances below pertain to the cost to obtain contracts included in ‘Prepayments and other currentassets’ (see Note 7):
2019 2018Balance at beginning of year P=236 P=184Additions during the year 1,239 780Amortization (1,289) (728)
P=186 P=236
22. Equity
Capital Stock and Additional Paid-in CapitalAs of December 31, 2019, 2018 and 2017, the paid-up capital consists of the following (amounts inmillions, except for number of shares):
Shares Amount2019 2018 2019 2018
Voting Preferred stock - P=0.10 par value Authorized 174,300,000 174,300,000 Issued and outstanding 174,300,000 174,300,000 P=17 P=17
(Forward)
- 92 -
*SGVFSM000264*
Shares Amount2019 2018 2019 2018
Perpetual Preferred stock -P=100.00 par value Authorized 20,000,000 20,000,000 Issued and outstanding 12,000,000 12,000,000 P=1,200 P=1,200Common stock - P=10.00 par value Authorized 298,257,000 298,257,000 Issued and outstanding 215,284,587 199,337,584 2,153 1,994Subtotal P=3,370 P=3,211Additional paid-in capital 98,827 85,592
P=102,197 P=88,803
The Parent Company's common shares with par value of P=10.00 were listed on the Philippine StockExchange on April 20, 2012.
Amendment to Articles of Incorporation to Create Voting Preferred Shares of StockOn October 23, 2014, the BOD approved the proposed amendment to Article Seven of the ParentCompany’s Amended Articles of Incorporation to create a new class of shares – Voting PreferredShares, to be taken from existing authorized capital stock of P=5.00 billion. The Voting PreferredShares of stock shall be voting, non-cumulative, non-participating and non-convertible.
On January 9, 2015, the stockholders of the Parent Company by the affirmative vote of over two-thirds (2/3) of the outstanding capital stock of the Parent Company, approved the amendment toArticle Seventh of the Parent Company’s Articles of Incorporation to create of a new class of shares –voting preferred shares, taken out of the Parent Company’s existing and unissued portion of theAuthorized Capital Stock. The Amended Articles of Incorporation was approved by the Securitiesand Exchange Commission on February 18, 2015.
Voting Preferred Shares Stock Rights OfferingOn March 13, 2015, the BOD of the Parent Company approved the issuance of 174,300,000 VotingPreferred Shares with a par value of P=0.10 per share through a 1:1 Stock Rights Offering, to allstockholders of record as of March 25, 2015, offered from April 1 to 8, 2015 and issued onApril 13, 2015.
Amendment to Articles of Incorporation to Create Perpetual Preferred Shares of StockOn March 13, 2015, the BOD of the Parent Company approved the amendment to Article Seven of itsamended Articles of Incorporation to create a new class of shares (Perpetual Preferred Shares). Theauthorized capital stock of the corporation of P=5.00 billion in lawful money of the Philippines, will bedivided into 298,257,000 common shares with a par value of P=10.00 per share, 20,000,000 perpetualpreferred shares with a par value of P=100.00 per share and 174,300,000 voting preferred shares with apar value of P=0.10 per share.
On October 14, 2016, the Philippine SEC approved the offering of up to 12.00 million cumulative,non-voting, non-participating, non-convertible, redeemable peso-denominated perpetual preferredshares (‘the Offer’) with a par value of P=100.00 per share at an offer price of P=1,000.00 per share fora total offer price of P=12.00 billion. The Offer consists of Series A and Series B with dividend ratesper annum of 4.6299% and 5.0949%, respectively. Both series of said perpetual preferred shareswere listed on the Philippine Stock Exchange on October 27, 2016. The proceeds from the Offer willbe used to refinance short-term loans and fund strategic acquisitions.
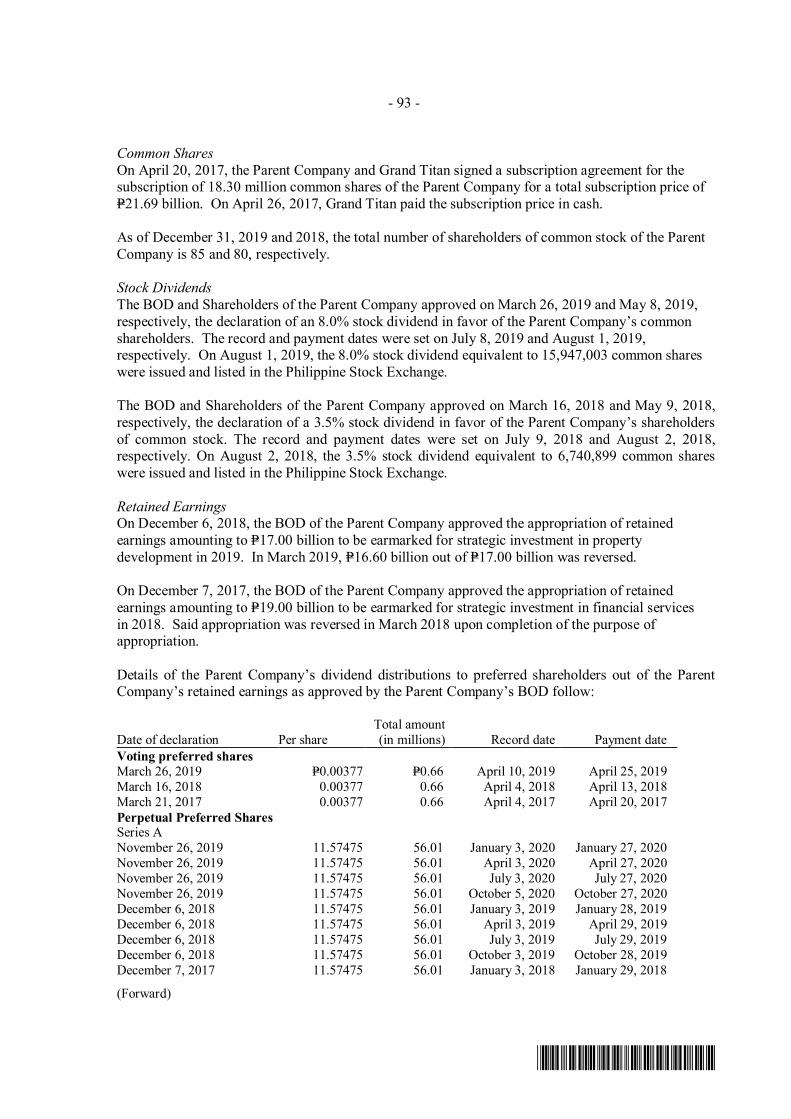
- 93 -
*SGVFSM000264*
Common SharesOn April 20, 2017, the Parent Company and Grand Titan signed a subscription agreement for thesubscription of 18.30 million common shares of the Parent Company for a total subscription price ofP=21.69 billion. On April 26, 2017, Grand Titan paid the subscription price in cash.
As of December 31, 2019 and 2018, the total number of shareholders of common stock of the ParentCompany is 85 and 80, respectively.
Stock DividendsThe BOD and Shareholders of the Parent Company approved on March 26, 2019 and May 8, 2019,respectively, the declaration of an 8.0% stock dividend in favor of the Parent Company’s commonshareholders. The record and payment dates were set on July 8, 2019 and August 1, 2019,respectively. On August 1, 2019, the 8.0% stock dividend equivalent to 15,947,003 common shareswere issued and listed in the Philippine Stock Exchange.
The BOD and Shareholders of the Parent Company approved on March 16, 2018 and May 9, 2018,respectively, the declaration of a 3.5% stock dividend in favor of the Parent Company’s shareholdersof common stock. The record and payment dates were set on July 9, 2018 and August 2, 2018,respectively. On August 2, 2018, the 3.5% stock dividend equivalent to 6,740,899 common shareswere issued and listed in the Philippine Stock Exchange.
Retained EarningsOn December 6, 2018, the BOD of the Parent Company approved the appropriation of retainedearnings amounting to P=17.00 billion to be earmarked for strategic investment in propertydevelopment in 2019. In March 2019, P=16.60 billion out of P=17.00 billion was reversed.
On December 7, 2017, the BOD of the Parent Company approved the appropriation of retainedearnings amounting to P=19.00 billion to be earmarked for strategic investment in financial servicesin 2018. Said appropriation was reversed in March 2018 upon completion of the purpose ofappropriation.
Details of the Parent Company’s dividend distributions to preferred shareholders out of the ParentCompany’s retained earnings as approved by the Parent Company’s BOD follow:
Date of declaration Per shareTotal amount(in millions) Record date Payment date
Voting preferred sharesMarch 26, 2019 P=0.00377 P=0.66 April 10, 2019 April 25, 2019March 16, 2018 0.00377 0.66 April 4, 2018 April 13, 2018March 21, 2017 0.00377 0.66 April 4, 2017 April 20, 2017Perpetual Preferred SharesSeries ANovember 26, 2019 11.57475 56.01 January 3, 2020 January 27, 2020November 26, 2019 11.57475 56.01 April 3, 2020 April 27, 2020November 26, 2019 11.57475 56.01 July 3, 2020 July 27, 2020November 26, 2019 11.57475 56.01 October 5, 2020 October 27, 2020December 6, 2018 11.57475 56.01 January 3, 2019 January 28, 2019December 6, 2018 11.57475 56.01 April 3, 2019 April 29, 2019December 6, 2018 11.57475 56.01 July 3, 2019 July 29, 2019December 6, 2018 11.57475 56.01 October 3, 2019 October 28, 2019December 7, 2017 11.57475 56.01 January 3, 2018 January 29, 2018
(Forward)
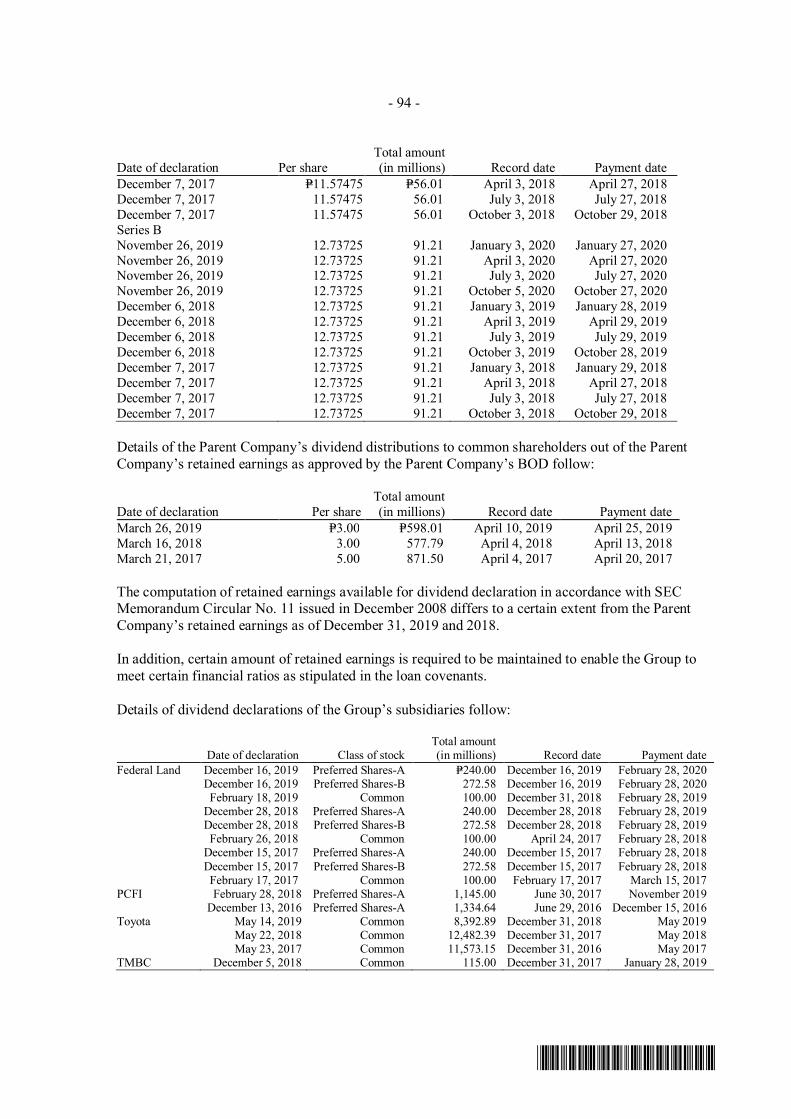
- 94 -
*SGVFSM000264*
Date of declaration Per shareTotal amount(in millions) Record date Payment date
December 7, 2017 P=11.57475 P=56.01 April 3, 2018 April 27, 2018December 7, 2017 11.57475 56.01 July 3, 2018 July 27, 2018December 7, 2017 11.57475 56.01 October 3, 2018 October 29, 2018Series BNovember 26, 2019 12.73725 91.21 January 3, 2020 January 27, 2020November 26, 2019 12.73725 91.21 April 3, 2020 April 27, 2020November 26, 2019 12.73725 91.21 July 3, 2020 July 27, 2020November 26, 2019 12.73725 91.21 October 5, 2020 October 27, 2020December 6, 2018 12.73725 91.21 January 3, 2019 January 28, 2019December 6, 2018 12.73725 91.21 April 3, 2019 April 29, 2019December 6, 2018 12.73725 91.21 July 3, 2019 July 29, 2019December 6, 2018 12.73725 91.21 October 3, 2019 October 28, 2019December 7, 2017 12.73725 91.21 January 3, 2018 January 29, 2018December 7, 2017 12.73725 91.21 April 3, 2018 April 27, 2018December 7, 2017 12.73725 91.21 July 3, 2018 July 27, 2018December 7, 2017 12.73725 91.21 October 3, 2018 October 29, 2018
Details of the Parent Company’s dividend distributions to common shareholders out of the ParentCompany’s retained earnings as approved by the Parent Company’s BOD follow:
Date of declaration Per shareTotal amount(in millions) Record date Payment date
March 26, 2019 P=3.00 P=598.01 April 10, 2019 April 25, 2019March 16, 2018 3.00 577.79 April 4, 2018 April 13, 2018March 21, 2017 5.00 871.50 April 4, 2017 April 20, 2017
The computation of retained earnings available for dividend declaration in accordance with SECMemorandum Circular No. 11 issued in December 2008 differs to a certain extent from the ParentCompany’s retained earnings as of December 31, 2019 and 2018.
In addition, certain amount of retained earnings is required to be maintained to enable the Group tomeet certain financial ratios as stipulated in the loan covenants.
Details of dividend declarations of the Group’s subsidiaries follow:
Date of declaration Class of stockTotal amount(in millions) Record date Payment date
Federal Land December 16, 2019 Preferred Shares-A P=240.00 December 16, 2019 February 28, 2020 December 16, 2019 Preferred Shares-B 272.58 December 16, 2019 February 28, 2020 February 18, 2019 Common 100.00 December 31, 2018 February 28, 2019 December 28, 2018 Preferred Shares-A 240.00 December 28, 2018 February 28, 2019 December 28, 2018 Preferred Shares-B 272.58 December 28, 2018 February 28, 2019 February 26, 2018 Common 100.00 April 24, 2017 February 28, 2018 December 15, 2017 Preferred Shares-A 240.00 December 15, 2017 February 28, 2018 December 15, 2017 Preferred Shares-B 272.58 December 15, 2017 February 28, 2018 February 17, 2017 Common 100.00 February 17, 2017 March 15, 2017
PCFI February 28, 2018 Preferred Shares-A 1,145.00 June 30, 2017 November 2019 December 13, 2016 Preferred Shares-A 1,334.64 June 29, 2016 December 15, 2016
Toyota May 14, 2019 Common 8,392.89 December 31, 2018 May 2019May 22, 2018 Common 12,482.39 December 31, 2017 May 2018May 23, 2017 Common 11,573.15 December 31, 2016 May 2017
TMBC December 5, 2018 Common 115.00 December 31, 2017 January 28, 2019
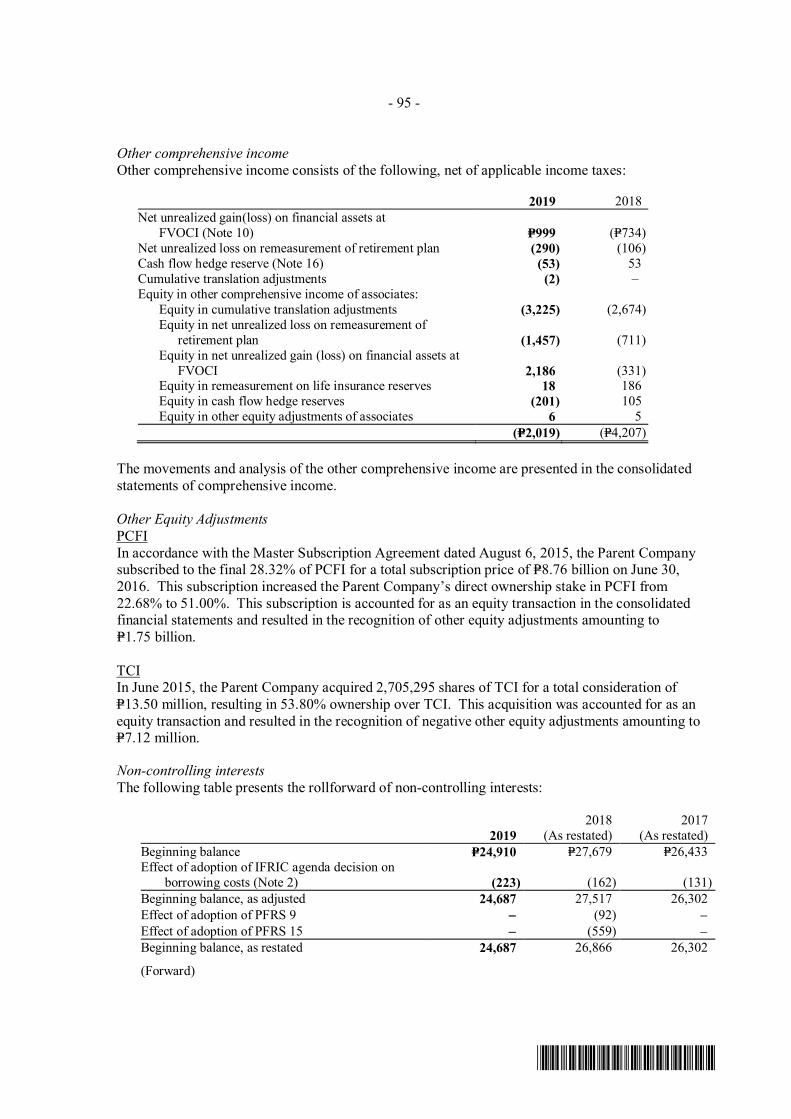
- 95 -
*SGVFSM000264*
Other comprehensive incomeOther comprehensive income consists of the following, net of applicable income taxes:
2019 2018Net unrealized gain(loss) on financial assets at
FVOCI (Note 10) P=999 (P=734)Net unrealized loss on remeasurement of retirement plan (290) (106)Cash flow hedge reserve (Note 16) (53) 53Cumulative translation adjustments (2) –Equity in other comprehensive income of associates:
Equity in cumulative translation adjustments (3,225) (2,674)Equity in net unrealized loss on remeasurement of
retirement plan (1,457) (711)Equity in net unrealized gain (loss) on financial assets at
FVOCI 2,186 (331)Equity in remeasurement on life insurance reserves 18 186Equity in cash flow hedge reserves (201) 105Equity in other equity adjustments of associates 6 5
(P=2,019) (P=4,207)
The movements and analysis of the other comprehensive income are presented in the consolidatedstatements of comprehensive income.
Other Equity AdjustmentsPCFIIn accordance with the Master Subscription Agreement dated August 6, 2015, the Parent Companysubscribed to the final 28.32% of PCFI for a total subscription price of P=8.76 billion on June 30,2016. This subscription increased the Parent Company’s direct ownership stake in PCFI from22.68% to 51.00%. This subscription is accounted for as an equity transaction in the consolidatedfinancial statements and resulted in the recognition of other equity adjustments amounting toP=1.75 billion.
TCIIn June 2015, the Parent Company acquired 2,705,295 shares of TCI for a total consideration ofP=13.50 million, resulting in 53.80% ownership over TCI. This acquisition was accounted for as anequity transaction and resulted in the recognition of negative other equity adjustments amounting toP=7.12 million.
Non-controlling interestsThe following table presents the rollforward of non-controlling interests:
20192018
(As restated)2017
(As restated)Beginning balance P=24,910 P=27,679 P=26,433Effect of adoption of IFRIC agenda decision on
borrowing costs (Note 2) (223) (162) (131)Beginning balance, as adjusted 24,687 27,517 26,302Effect of adoption of PFRS 9 - (92) -Effect of adoption of PFRS 15 - (559) -Beginning balance, as restated 24,687 26,866 26,302
(Forward)
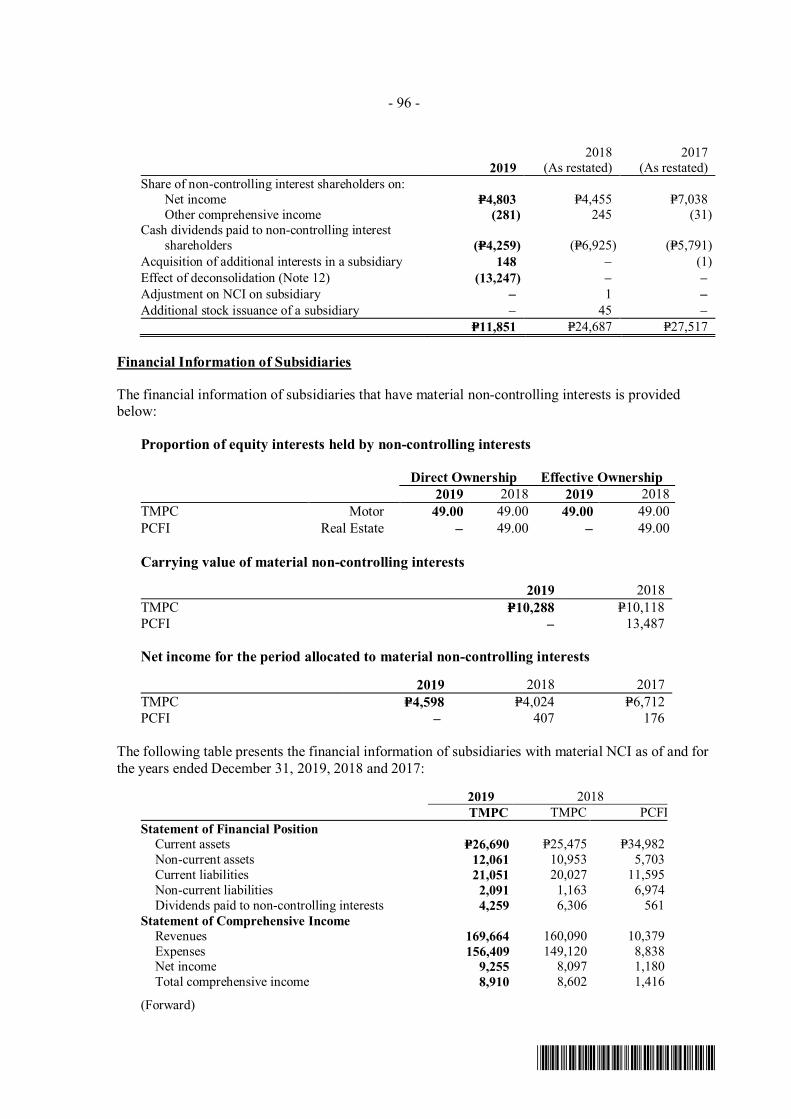
- 96 -
*SGVFSM000264*
20192018
(As restated)2017
(As restated)Share of non-controlling interest shareholders on: Net income P=4,803 P=4,455 P=7,038 Other comprehensive income (281) 245 (31)Cash dividends paid to non-controlling interest
shareholders (P=4,259) (P=6,925) (P=5,791)Acquisition of additional interests in a subsidiary 148 - (1)Effect of deconsolidation (Note 12) (13,247) - -Adjustment on NCI on subsidiary - 1 -Additional stock issuance of a subsidiary - 45 -
P=11,851 P=24,687 P=27,517
Financial Information of Subsidiaries
The financial information of subsidiaries that have material non-controlling interests is providedbelow:
Proportion of equity interests held by non-controlling interests
Direct Ownership Effective Ownership2019 2018 2019 2018
TMPC Motor 49.00 49.00 49.00 49.00PCFI Real Estate - 49.00 - 49.00
Carrying value of material non-controlling interests
2019 2018TMPC P=10,288 P=10,118PCFI - 13,487
Net income for the period allocated to material non-controlling interests
2019 2018 2017TMPC P=4,598 P=4,024 P=6,712PCFI - 407 176
The following table presents the financial information of subsidiaries with material NCI as of and forthe years ended December 31, 2019, 2018 and 2017:
2019 2018TMPC TMPC PCFI
Statement of Financial Position Current assets P=26,690 P=25,475 P=34,982 Non-current assets 12,061 10,953 5,703 Current liabilities 21,051 20,027 11,595 Non-current liabilities 2,091 1,163 6,974 Dividends paid to non-controlling interests 4,259 6,306 561Statement of Comprehensive Income Revenues 169,664 160,090 10,379 Expenses 156,409 149,120 8,838
Net income 9,255 8,097 1,180 Total comprehensive income 8,910 8,602 1,416
(Forward)
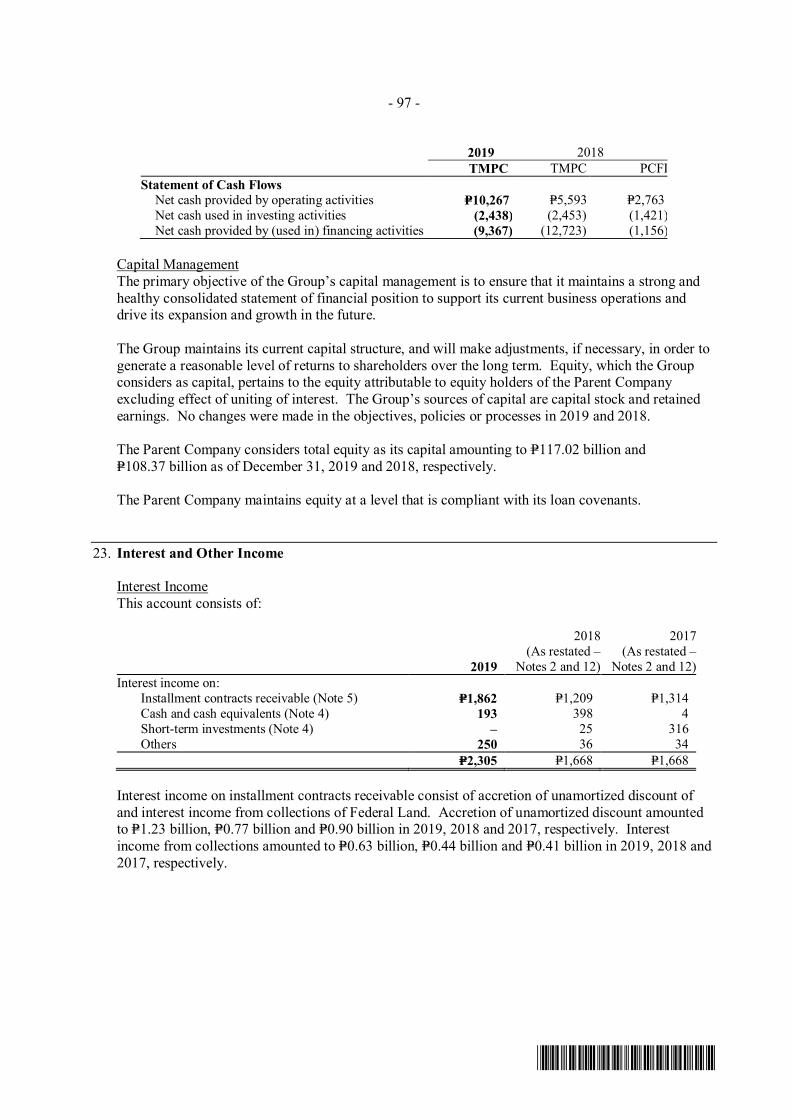
- 97 -
*SGVFSM000264*
2019 2018TMPC TMPC PCFI
Statement of Cash Flows Net cash provided by operating activities P=10,267 P=5,593 P=2,763 Net cash used in investing activities (2,438) (2,453) (1,421) Net cash provided by (used in) financing activities (9,367) (12,723) (1,156)
Capital ManagementThe primary objective of the Group’s capital management is to ensure that it maintains a strong andhealthy consolidated statement of financial position to support its current business operations anddrive its expansion and growth in the future.
The Group maintains its current capital structure, and will make adjustments, if necessary, in order togenerate a reasonable level of returns to shareholders over the long term. Equity, which the Groupconsiders as capital, pertains to the equity attributable to equity holders of the Parent Companyexcluding effect of uniting of interest. The Group’s sources of capital are capital stock and retainedearnings. No changes were made in the objectives, policies or processes in 2019 and 2018.
The Parent Company considers total equity as its capital amounting to P=117.02 billion andP=108.37 billion as of December 31, 2019 and 2018, respectively.
The Parent Company maintains equity at a level that is compliant with its loan covenants.
23. Interest and Other Income
Interest IncomeThis account consists of:
2019
2018(As restated –
Notes 2 and 12)
2017(As restated –
Notes 2 and 12)Interest income on: Installment contracts receivable (Note 5) P=1,862 P=1,209 P=1,314 Cash and cash equivalents (Note 4) 193 398 4 Short-term investments (Note 4) – 25 316 Others 250 36 34
P=2,305 P=1,668 P=1,668
Interest income on installment contracts receivable consist of accretion of unamortized discount ofand interest income from collections of Federal Land. Accretion of unamortized discount amountedto P=1.23 billion, P=0.77 billion and P=0.90 billion in 2019, 2018 and 2017, respectively. Interestincome from collections amounted to P=0.63 billion, P=0.44 billion and P=0.41 billion in 2019, 2018 and2017, respectively.
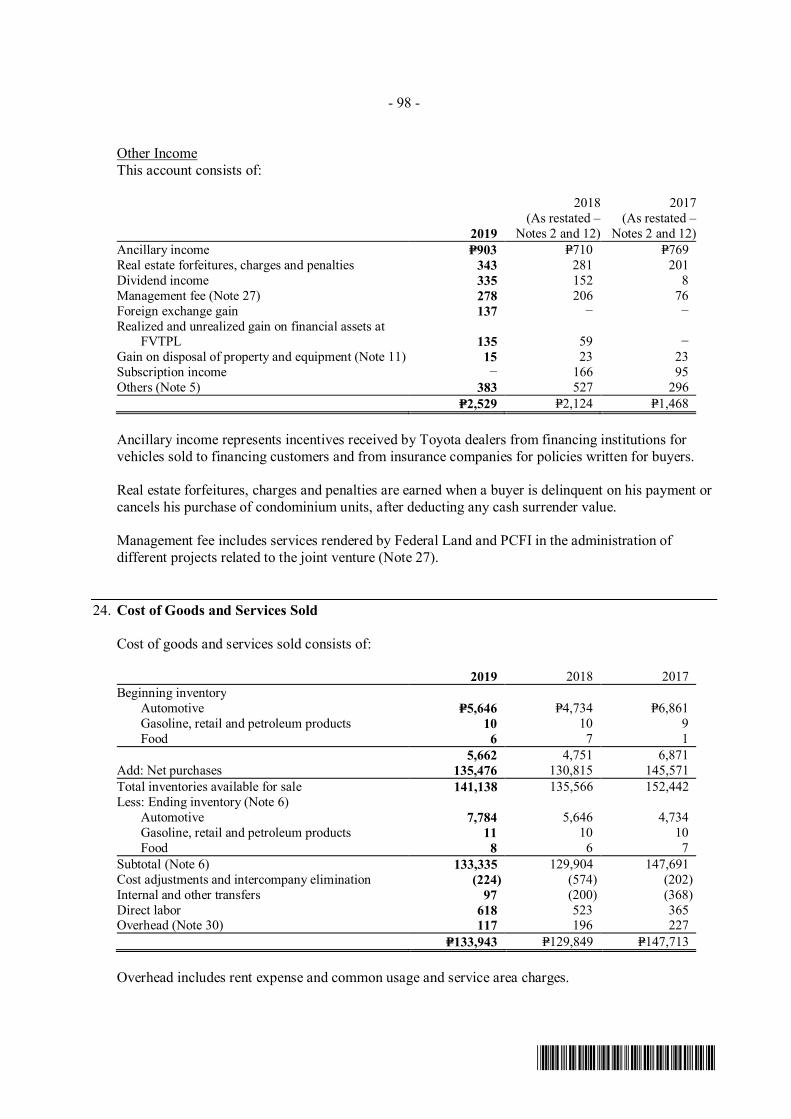
- 98 -
*SGVFSM000264*
Other IncomeThis account consists of:
2019
2018(As restated –
Notes 2 and 12)
2017(As restated –
Notes 2 and 12)Ancillary income P=903 P=710 P=769Real estate forfeitures, charges and penalties 343 281 201Dividend income 335 152 8Management fee (Note 27) 278 206 76Foreign exchange gain 137 − −Realized and unrealized gain on financial assets at
FVTPL 135 59 −Gain on disposal of property and equipment (Note 11) 15 23 23Subscription income − 166 95Others (Note 5) 383 527 296
P=2,529 P=2,124 P=1,468
Ancillary income represents incentives received by Toyota dealers from financing institutions forvehicles sold to financing customers and from insurance companies for policies written for buyers.
Real estate forfeitures, charges and penalties are earned when a buyer is delinquent on his payment orcancels his purchase of condominium units, after deducting any cash surrender value.
Management fee includes services rendered by Federal Land and PCFI in the administration ofdifferent projects related to the joint venture (Note 27).
24. Cost of Goods and Services Sold
Cost of goods and services sold consists of:
2019 2018 2017Beginning inventory Automotive P=5,646 P=4,734 P=6,861 Gasoline, retail and petroleum products 10 10 9 Food 6 7 1
5,662 4,751 6,871Add: Net purchases 135,476 130,815 145,571Total inventories available for sale 141,138 135,566 152,442Less: Ending inventory (Note 6) Automotive 7,784 5,646 4,734 Gasoline, retail and petroleum products 11 10 10 Food 8 6 7Subtotal (Note 6) 133,335 129,904 147,691Cost adjustments and intercompany elimination (224) (574) (202)Internal and other transfers 97 (200) (368)Direct labor 618 523 365Overhead (Note 30) 117 196 227
P=133,943 P=129,849 P=147,713
Overhead includes rent expense and common usage and service area charges.
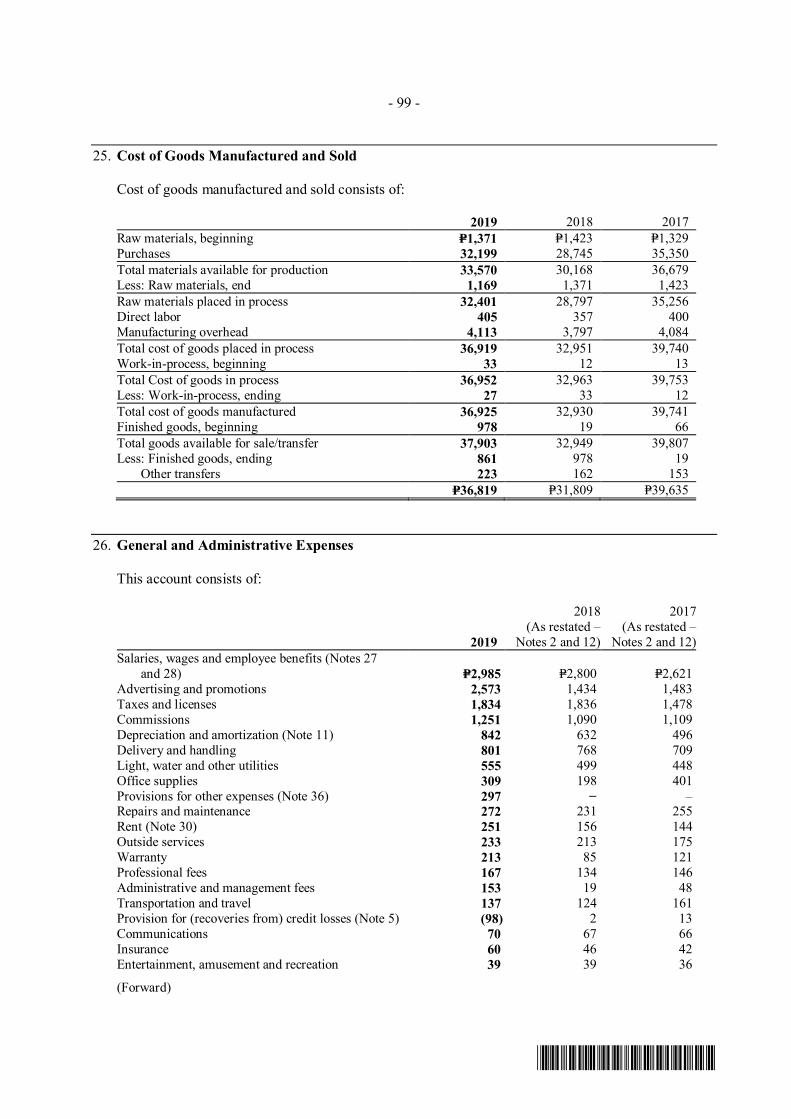
- 99 -
*SGVFSM000264*
25. Cost of Goods Manufactured and Sold
Cost of goods manufactured and sold consists of:
2019 2018 2017Raw materials, beginning P=1,371 P=1,423 P=1,329Purchases 32,199 28,745 35,350Total materials available for production 33,570 30,168 36,679Less: Raw materials, end 1,169 1,371 1,423Raw materials placed in process 32,401 28,797 35,256Direct labor 405 357 400Manufacturing overhead 4,113 3,797 4,084Total cost of goods placed in process 36,919 32,951 39,740Work-in-process, beginning 33 12 13Total Cost of goods in process 36,952 32,963 39,753Less: Work-in-process, ending 27 33 12Total cost of goods manufactured 36,925 32,930 39,741Finished goods, beginning 978 19 66Total goods available for sale/transfer 37,903 32,949 39,807Less: Finished goods, ending 861 978 19 Other transfers 223 162 153
P=36,819 P=31,809 P=39,635
26. General and Administrative Expenses
This account consists of:
2019
2018(As restated –
Notes 2 and 12)
2017(As restated –
Notes 2 and 12)Salaries, wages and employee benefits (Notes 27
and 28) P=2,985 P=2,800 P=2,621Advertising and promotions 2,573 1,434 1,483Taxes and licenses 1,834 1,836 1,478Commissions 1,251 1,090 1,109Depreciation and amortization (Note 11) 842 632 496Delivery and handling 801 768 709Light, water and other utilities 555 499 448Office supplies 309 198 401Provisions for other expenses (Note 36) 297 − –Repairs and maintenance 272 231 255Rent (Note 30) 251 156 144Outside services 233 213 175Warranty 213 85 121Professional fees 167 134 146Administrative and management fees 153 19 48Transportation and travel 137 124 161Provision for (recoveries from) credit losses (Note 5) (98) 2 13Communications 70 67 66Insurance 60 46 42Entertainment, amusement and recreation 39 39 36
(Forward)
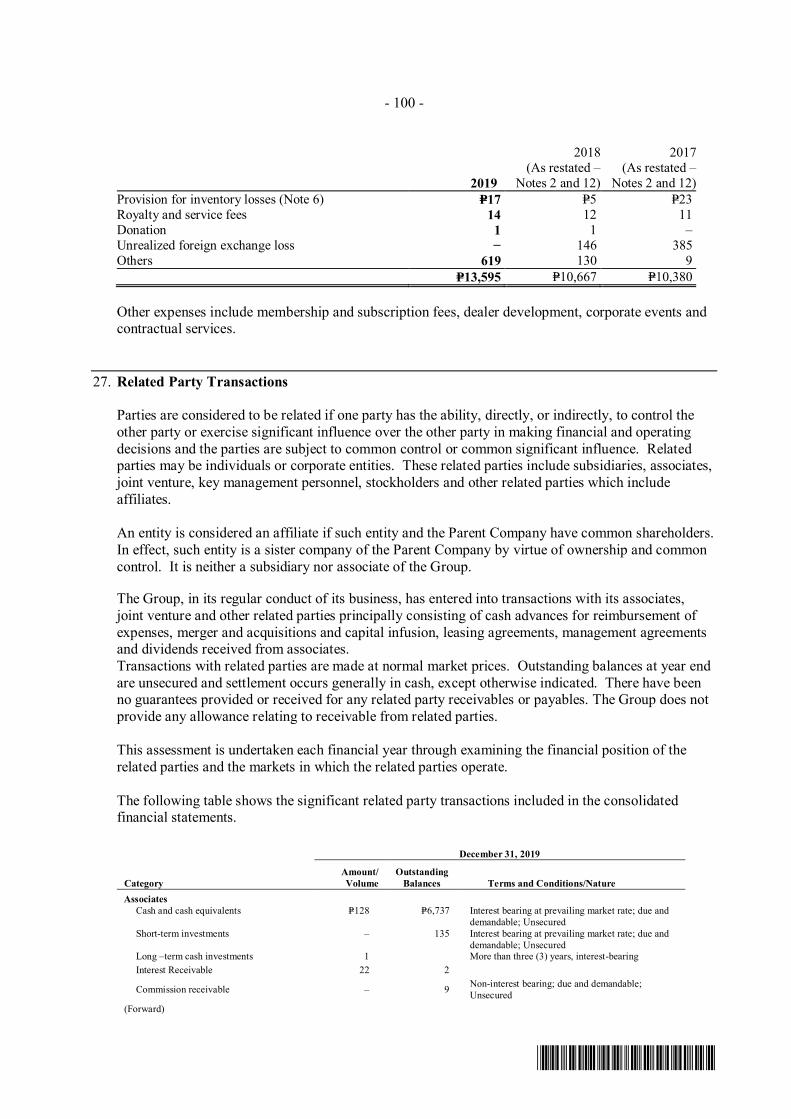
- 100 -
*SGVFSM000264*
2019
2018(As restated –
Notes 2 and 12)
2017(As restated –
Notes 2 and 12)Provision for inventory losses (Note 6) P=17 P=5 P=23Royalty and service fees 14 12 11Donation 1 1 –Unrealized foreign exchange loss − 146 385Others 619 130 9
P=13,595 P=10,667 P=10,380
Other expenses include membership and subscription fees, dealer development, corporate events andcontractual services.
27. Related Party Transactions
Parties are considered to be related if one party has the ability, directly, or indirectly, to control theother party or exercise significant influence over the other party in making financial and operatingdecisions and the parties are subject to common control or common significant influence. Relatedparties may be individuals or corporate entities. These related parties include subsidiaries, associates,joint venture, key management personnel, stockholders and other related parties which includeaffiliates.
An entity is considered an affiliate if such entity and the Parent Company have common shareholders.In effect, such entity is a sister company of the Parent Company by virtue of ownership and commoncontrol. It is neither a subsidiary nor associate of the Group.
The Group, in its regular conduct of its business, has entered into transactions with its associates,joint venture and other related parties principally consisting of cash advances for reimbursement ofexpenses, merger and acquisitions and capital infusion, leasing agreements, management agreementsand dividends received from associates.Transactions with related parties are made at normal market prices. Outstanding balances at year endare unsecured and settlement occurs generally in cash, except otherwise indicated. There have beenno guarantees provided or received for any related party receivables or payables. The Group does notprovide any allowance relating to receivable from related parties.
This assessment is undertaken each financial year through examining the financial position of therelated parties and the markets in which the related parties operate.
The following table shows the significant related party transactions included in the consolidatedfinancial statements.
December 31, 2019
CategoryAmount/Volume
OutstandingBalances Terms and Conditions/Nature
AssociatesCash and cash equivalents P=128 P=6,737 Interest bearing at prevailing market rate; due and
demandable; UnsecuredShort-term investments – 135 Interest bearing at prevailing market rate; due and
demandable; UnsecuredLong –term cash investments 1 More than three (3) years, interest-bearingInterest Receivable 22 2
Commission receivable – 9 Non-interest bearing; due and demandable;Unsecured
(Forward)
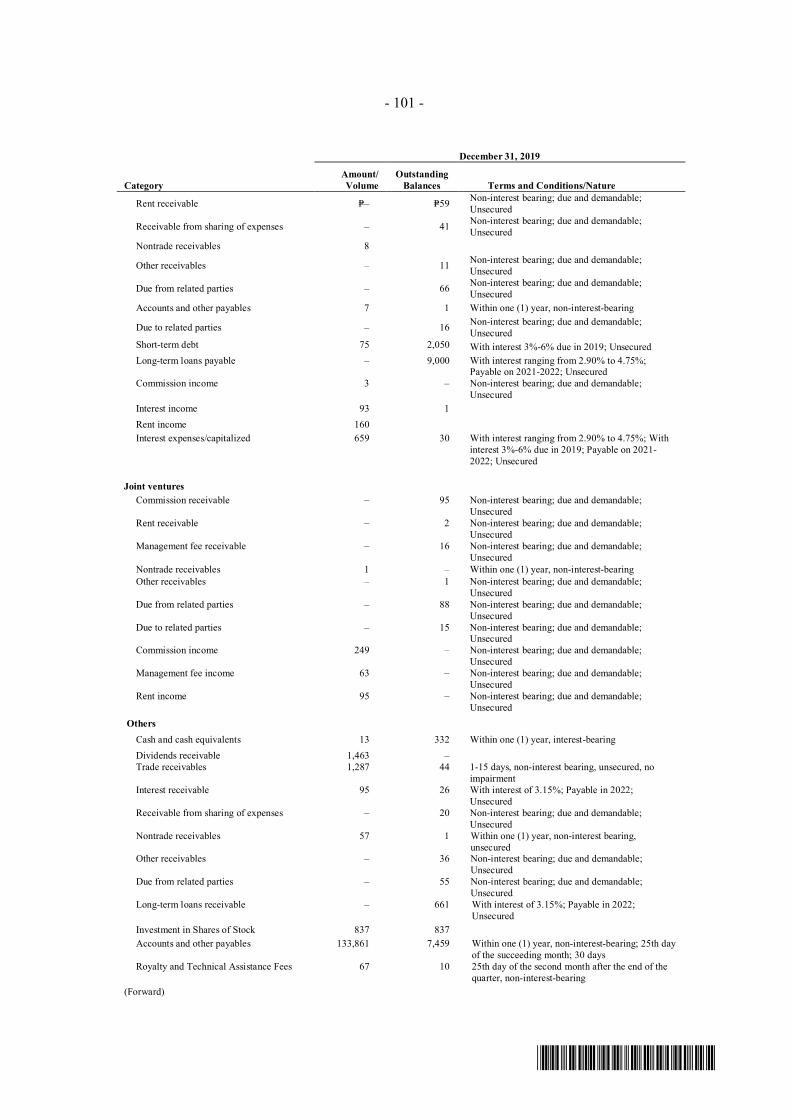
- 101 -
*SGVFSM000264*
December 31, 2019
CategoryAmount/Volume
OutstandingBalances Terms and Conditions/Nature
Rent receivable P=– P=59 Non-interest bearing; due and demandable;Unsecured
Receivable from sharing of expenses – 41 Non-interest bearing; due and demandable;Unsecured
Nontrade receivables 8
Other receivables – 11 Non-interest bearing; due and demandable;Unsecured
Due from related parties – 66 Non-interest bearing; due and demandable;Unsecured
Accounts and other payables 7 1 Within one (1) year, non-interest-bearing
Due to related parties – 16 Non-interest bearing; due and demandable;Unsecured
Short-term debt 75 2,050 With interest 3%-6% due in 2019; UnsecuredLong-term loans payable – 9,000 With interest ranging from 2.90% to 4.75%;
Payable on 2021-2022; UnsecuredCommission income 3 – Non-interest bearing; due and demandable;
UnsecuredInterest income 93 1Rent income 160Interest expenses/capitalized 659 30 With interest ranging from 2.90% to 4.75%; With
interest 3%-6% due in 2019; Payable on 2021-2022; Unsecured
Joint venturesCommission receivable – 95 Non-interest bearing; due and demandable;
UnsecuredRent receivable – 2 Non-interest bearing; due and demandable;
UnsecuredManagement fee receivable – 16 Non-interest bearing; due and demandable;
UnsecuredNontrade receivables 1 – Within one (1) year, non-interest-bearingOther receivables – 1 Non-interest bearing; due and demandable;
UnsecuredDue from related parties – 88 Non-interest bearing; due and demandable;
UnsecuredDue to related parties – 15 Non-interest bearing; due and demandable;
UnsecuredCommission income 249 – Non-interest bearing; due and demandable;
UnsecuredManagement fee income 63 – Non-interest bearing; due and demandable;
UnsecuredRent income 95 – Non-interest bearing; due and demandable;
Unsecured Others
Cash and cash equivalents 13 332 Within one (1) year, interest-bearingDividends receivable 1,463 –Trade receivables 1,287 44 1-15 days, non-interest bearing, unsecured, no
impairmentInterest receivable 95 26 With interest of 3.15%; Payable in 2022;
UnsecuredReceivable from sharing of expenses – 20 Non-interest bearing; due and demandable;
UnsecuredNontrade receivables 57 1 Within one (1) year, non-interest bearing,
unsecuredOther receivables – 36 Non-interest bearing; due and demandable;
UnsecuredDue from related parties – 55 Non-interest bearing; due and demandable;
UnsecuredLong-term loans receivable – 661 With interest of 3.15%; Payable in 2022;
UnsecuredInvestment in Shares of Stock 837 837Accounts and other payables 133,861 7,459 Within one (1) year, non-interest-bearing; 25th day
of the succeeding month; 30 daysRoyalty and Technical Assistance Fees 67 10 25th day of the second month after the end of the
quarter, non-interest-bearing(Forward)
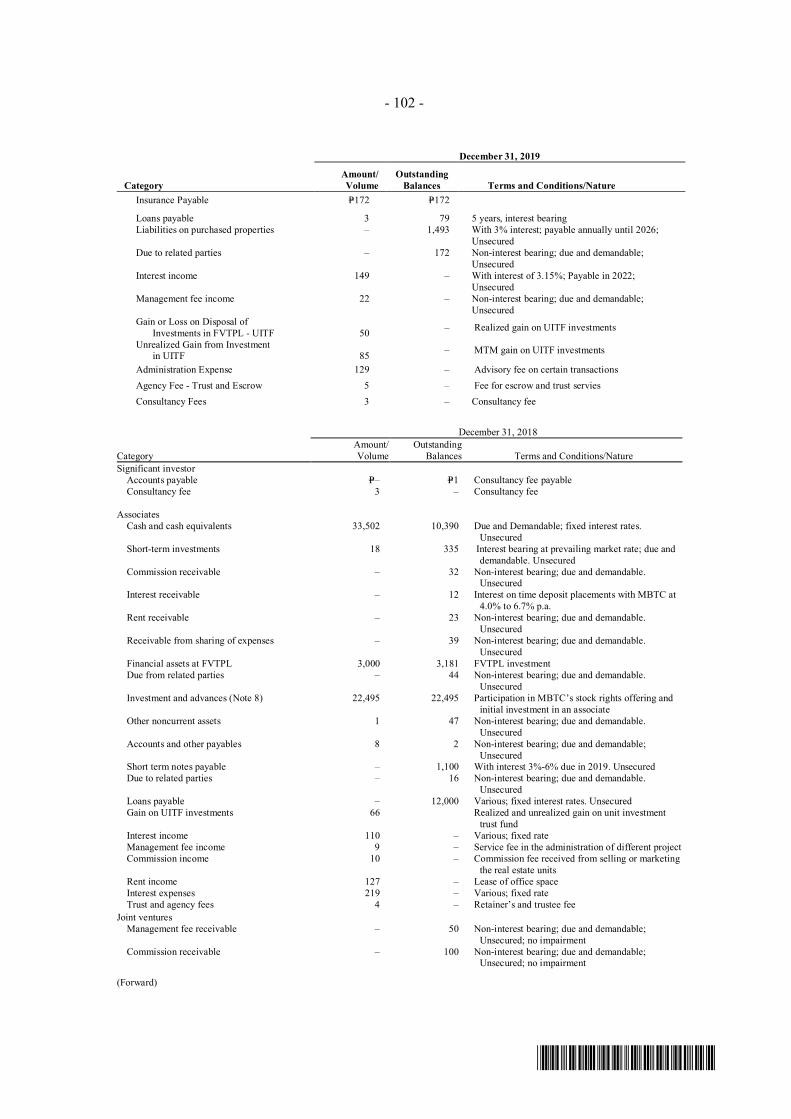
- 102 -
*SGVFSM000264*
December 31, 2019
CategoryAmount/Volume
OutstandingBalances Terms and Conditions/Nature
Insurance Payable P=172 P=172
Loans payable 3 79 5 years, interest bearingLiabilities on purchased properties – 1,493 With 3% interest; payable annually until 2026;
UnsecuredDue to related parties – 172 Non-interest bearing; due and demandable;
UnsecuredInterest income 149 – With interest of 3.15%; Payable in 2022;
UnsecuredManagement fee income 22 – Non-interest bearing; due and demandable;
UnsecuredGain or Loss on Disposal of Investments in FVTPL - UITF 50 – Realized gain on UITF investments
Unrealized Gain from Investment in UITF 85 – MTM gain on UITF investments
Administration Expense 129 – Advisory fee on certain transactionsAgency Fee - Trust and Escrow 5 – Fee for escrow and trust serviesConsultancy Fees 3 – Consultancy fee
December 31, 2018
CategoryAmount/ Volume
OutstandingBalances Terms and Conditions/Nature
Significant investorAccounts payable P=– P=1 Consultancy fee payableConsultancy fee 3 – Consultancy fee
AssociatesCash and cash equivalents 33,502 10,390 Due and Demandable; fixed interest rates.
UnsecuredShort-term investments 18 335 Interest bearing at prevailing market rate; due and
demandable. UnsecuredCommission receivable – 32 Non-interest bearing; due and demandable.
UnsecuredInterest receivable – 12 Interest on time deposit placements with MBTC at
4.0% to 6.7% p.a.Rent receivable – 23 Non-interest bearing; due and demandable.
UnsecuredReceivable from sharing of expenses – 39 Non-interest bearing; due and demandable.
UnsecuredFinancial assets at FVTPL 3,000 3,181 FVTPL investmentDue from related parties – 44 Non-interest bearing; due and demandable.
UnsecuredInvestment and advances (Note 8) 22,495 22,495 Participation in MBTC’s stock rights offering and
initial investment in an associateOther noncurrent assets 1 47 Non-interest bearing; due and demandable.
UnsecuredAccounts and other payables 8 2 Non-interest bearing; due and demandable;
UnsecuredShort term notes payable – 1,100 With interest 3%-6% due in 2019. UnsecuredDue to related parties – 16 Non-interest bearing; due and demandable.
UnsecuredLoans payable – 12,000 Various; fixed interest rates. UnsecuredGain on UITF investments 66 Realized and unrealized gain on unit investment
trust fundInterest income 110 – Various; fixed rateManagement fee income 9 – Service fee in the administration of different projectCommission income 10 – Commission fee received from selling or marketing
the real estate unitsRent income 127 – Lease of office spaceInterest expenses 219 – Various; fixed rateTrust and agency fees 4 – Retainer’s and trustee fee
Joint venturesManagement fee receivable – 50 Non-interest bearing; due and demandable;
Unsecured; no impairmentCommission receivable – 100 Non-interest bearing; due and demandable;
Unsecured; no impairment
(Forward)
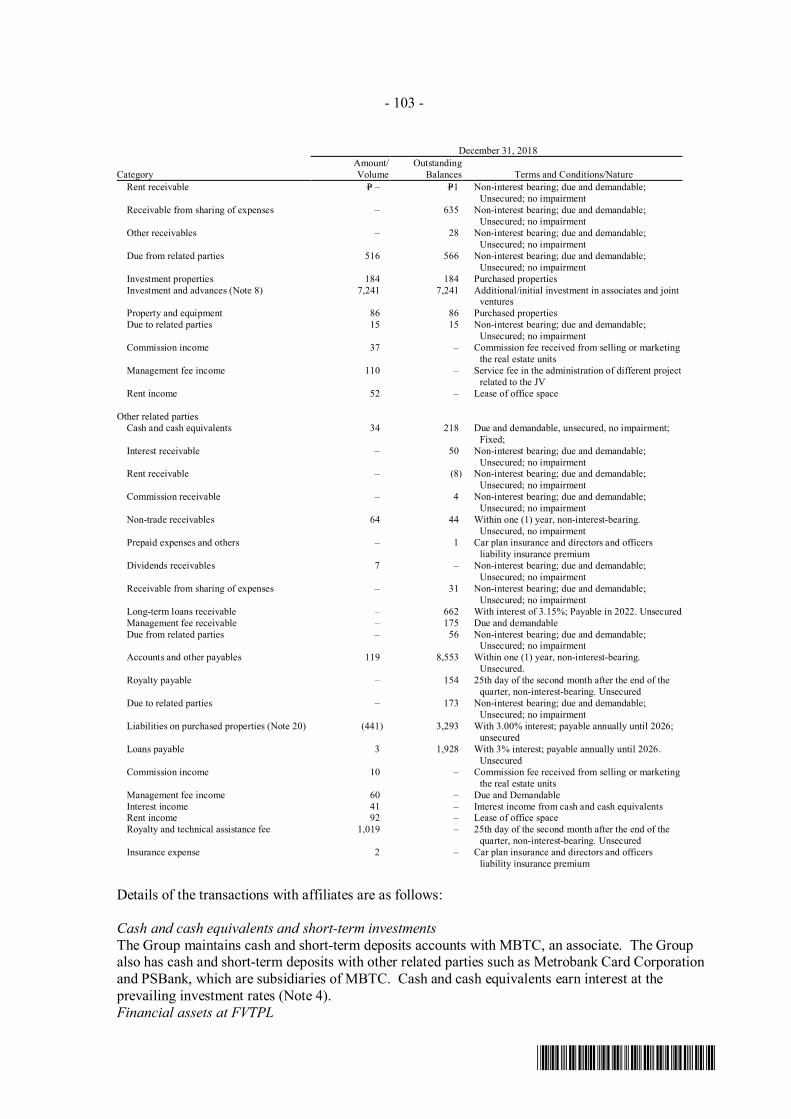
- 103 -
*SGVFSM000264*
December 31, 2018
CategoryAmount/ Volume
OutstandingBalances Terms and Conditions/Nature
Rent receivable P= – P=1 Non-interest bearing; due and demandable;Unsecured; no impairment
Receivable from sharing of expenses – 635 Non-interest bearing; due and demandable;Unsecured; no impairment
Other receivables – 28 Non-interest bearing; due and demandable;Unsecured; no impairment
Due from related parties 516 566 Non-interest bearing; due and demandable;Unsecured; no impairment
Investment properties 184 184 Purchased propertiesInvestment and advances (Note 8) 7,241 7,241 Additional/initial investment in associates and joint
venturesProperty and equipment 86 86 Purchased propertiesDue to related parties 15 15 Non-interest bearing; due and demandable;
Unsecured; no impairmentCommission income 37 – Commission fee received from selling or marketing
the real estate unitsManagement fee income 110 – Service fee in the administration of different project
related to the JVRent income 52 – Lease of office space
Other related partiesCash and cash equivalents 34 218 Due and demandable, unsecured, no impairment;
Fixed;Interest receivable – 50 Non-interest bearing; due and demandable;
Unsecured; no impairmentRent receivable – (8) Non-interest bearing; due and demandable;
Unsecured; no impairmentCommission receivable – 4 Non-interest bearing; due and demandable;
Unsecured; no impairmentNon-trade receivables 64 44 Within one (1) year, non-interest-bearing.
Unsecured, no impairmentPrepaid expenses and others – 1 Car plan insurance and directors and officers
liability insurance premiumDividends receivables 7 – Non-interest bearing; due and demandable;
Unsecured; no impairmentReceivable from sharing of expenses – 31 Non-interest bearing; due and demandable;
Unsecured; no impairmentLong-term loans receivable – 662 With interest of 3.15%; Payable in 2022. UnsecuredManagement fee receivable – 175 Due and demandableDue from related parties – 56 Non-interest bearing; due and demandable;
Unsecured; no impairmentAccounts and other payables 119 8,553 Within one (1) year, non-interest-bearing.
Unsecured.Royalty payable – 154 25th day of the second month after the end of the
quarter, non-interest-bearing. UnsecuredDue to related parties – 173 Non-interest bearing; due and demandable;
Unsecured; no impairmentLiabilities on purchased properties (Note 20) (441) 3,293 With 3.00% interest; payable annually until 2026;
unsecuredLoans payable 3 1,928 With 3% interest; payable annually until 2026.
UnsecuredCommission income 10 – Commission fee received from selling or marketing
the real estate unitsManagement fee income 60 – Due and DemandableInterest income 41 – Interest income from cash and cash equivalentsRent income 92 – Lease of office spaceRoyalty and technical assistance fee 1,019 – 25th day of the second month after the end of the
quarter, non-interest-bearing. UnsecuredInsurance expense 2 – Car plan insurance and directors and officers
liability insurance premium
Details of the transactions with affiliates are as follows:
Cash and cash equivalents and short-term investmentsThe Group maintains cash and short-term deposits accounts with MBTC, an associate. The Groupalso has cash and short-term deposits with other related parties such as Metrobank Card Corporationand PSBank, which are subsidiaries of MBTC. Cash and cash equivalents earn interest at theprevailing investment rates (Note 4).Financial assets at FVTPL
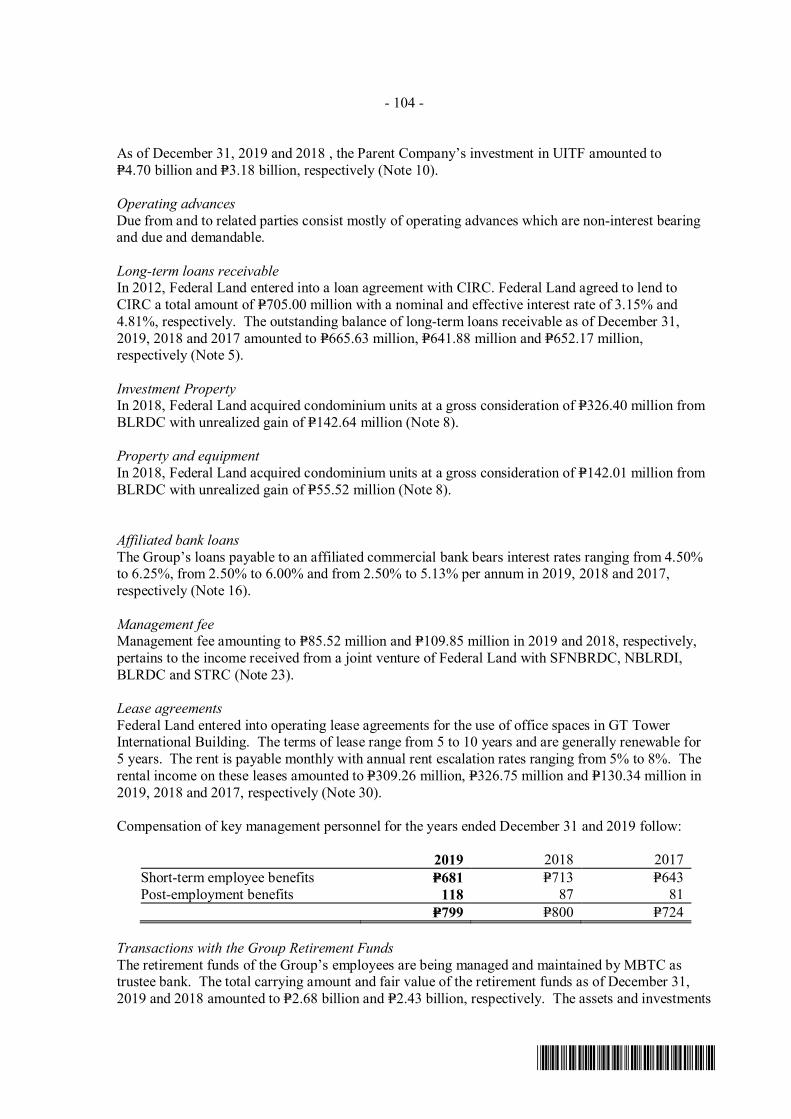
- 104 -
*SGVFSM000264*
As of December 31, 2019 and 2018 , the Parent Company’s investment in UITF amounted toP=4.70 billion and P=3.18 billion, respectively (Note 10).
Operating advancesDue from and to related parties consist mostly of operating advances which are non-interest bearingand due and demandable.
Long-term loans receivableIn 2012, Federal Land entered into a loan agreement with CIRC. Federal Land agreed to lend toCIRC a total amount of P=705.00 million with a nominal and effective interest rate of 3.15% and4.81%, respectively. The outstanding balance of long-term loans receivable as of December 31,2019, 2018 and 2017 amounted to P=665.63 million, P=641.88 million and P=652.17 million,respectively (Note 5).
Investment PropertyIn 2018, Federal Land acquired condominium units at a gross consideration of P=326.40 million fromBLRDC with unrealized gain of P=142.64 million (Note 8).
Property and equipmentIn 2018, Federal Land acquired condominium units at a gross consideration of P=142.01 million fromBLRDC with unrealized gain of P=55.52 million (Note 8).
Affiliated bank loansThe Group’s loans payable to an affiliated commercial bank bears interest rates ranging from 4.50%to 6.25%, from 2.50% to 6.00% and from 2.50% to 5.13% per annum in 2019, 2018 and 2017,respectively (Note 16).
Management feeManagement fee amounting to P=85.52 million and P=109.85 million in 2019 and 2018, respectively,pertains to the income received from a joint venture of Federal Land with SFNBRDC, NBLRDI,BLRDC and STRC (Note 23).
Lease agreementsFederal Land entered into operating lease agreements for the use of office spaces in GT TowerInternational Building. The terms of lease range from 5 to 10 years and are generally renewable for5 years. The rent is payable monthly with annual rent escalation rates ranging from 5% to 8%. Therental income on these leases amounted to P=309.26 million, P=326.75 million and P=130.34 million in2019, 2018 and 2017, respectively (Note 30).
Compensation of key management personnel for the years ended December 31 and 2019 follow:
2019 2018 2017Short-term employee benefits P=681 P=713 P=643Post-employment benefits 118 87 81
P=799 P=800 P=724
Transactions with the Group Retirement FundsThe retirement funds of the Group’s employees are being managed and maintained by MBTC astrustee bank. The total carrying amount and fair value of the retirement funds as of December 31,2019 and 2018 amounted to P=2.68 billion and P=2.43 billion, respectively. The assets and investments
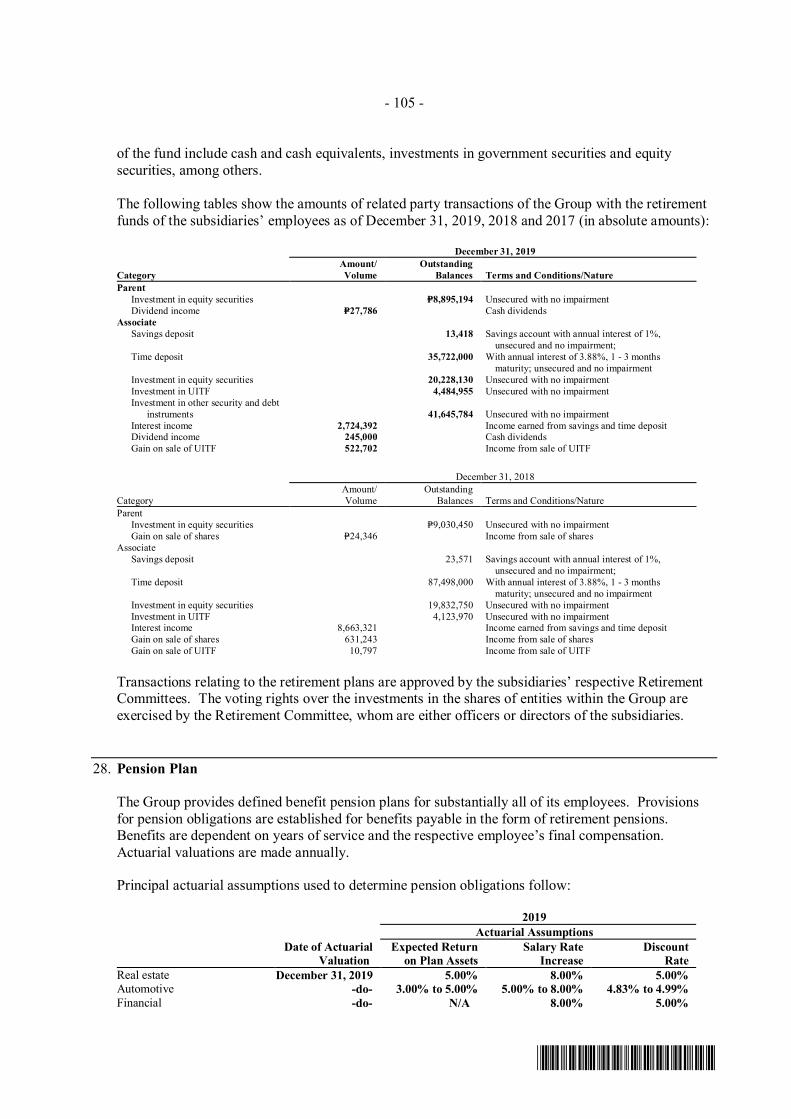
- 105 -
*SGVFSM000264*
of the fund include cash and cash equivalents, investments in government securities and equitysecurities, among others.
The following tables show the amounts of related party transactions of the Group with the retirementfunds of the subsidiaries’ employees as of December 31, 2019, 2018 and 2017 (in absolute amounts):
December 31, 2019
CategoryAmount/Volume
OutstandingBalances Terms and Conditions/Nature
Parent Investment in equity securities P=8,895,194 Unsecured with no impairment Dividend income P=27,786 Cash dividendsAssociate Savings deposit 13,418 Savings account with annual interest of 1%,
unsecured and no impairment; Time deposit 35,722,000 With annual interest of 3.88%, 1 - 3 months
maturity; unsecured and no impairment Investment in equity securities 20,228,130 Unsecured with no impairment Investment in UITF 4,484,955 Unsecured with no impairment Investment in other security and debt
instruments 41,645,784 Unsecured with no impairment Interest income 2,724,392 Income earned from savings and time deposit Dividend income 245,000 Cash dividends Gain on sale of UITF 522,702 Income from sale of UITF
December 31, 2018
CategoryAmount/Volume
OutstandingBalances Terms and Conditions/Nature
Parent Investment in equity securities P=9,030,450 Unsecured with no impairment Gain on sale of shares P=24,346 Income from sale of sharesAssociate Savings deposit 23,571 Savings account with annual interest of 1%,
unsecured and no impairment; Time deposit 87,498,000 With annual interest of 3.88%, 1 - 3 months
maturity; unsecured and no impairment Investment in equity securities 19,832,750 Unsecured with no impairment Investment in UITF 4,123,970 Unsecured with no impairment Interest income 8,663,321 Income earned from savings and time deposit Gain on sale of shares 631,243 Income from sale of shares Gain on sale of UITF 10,797 Income from sale of UITF
Transactions relating to the retirement plans are approved by the subsidiaries’ respective RetirementCommittees. The voting rights over the investments in the shares of entities within the Group areexercised by the Retirement Committee, whom are either officers or directors of the subsidiaries.
28. Pension Plan
The Group provides defined benefit pension plans for substantially all of its employees. Provisionsfor pension obligations are established for benefits payable in the form of retirement pensions.Benefits are dependent on years of service and the respective employee’s final compensation.Actuarial valuations are made annually.
Principal actuarial assumptions used to determine pension obligations follow:
2019Actuarial Assumptions
Date of ActuarialValuation
Expected Returnon Plan Assets
Salary RateIncrease
DiscountRate
Real estate December 31, 2019 5.00% 8.00% 5.00%Automotive -do- 3.00% to 5.00% 5.00% to 8.00% 4.83% to 4.99%Financial -do- N/A 8.00% 5.00%
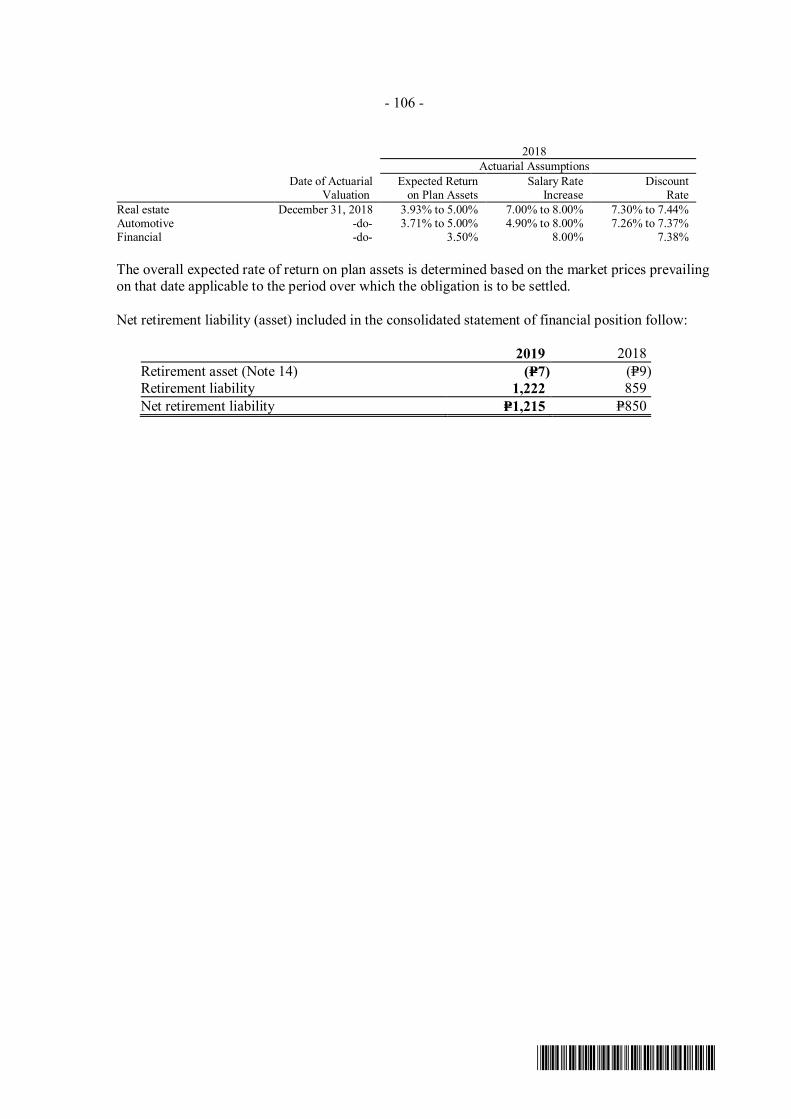
- 106 -
*SGVFSM000264*
2018Actuarial Assumptions
Date of ActuarialValuation
Expected Returnon Plan Assets
Salary RateIncrease
DiscountRate
Real estate December 31, 2018 3.93% to 5.00% 7.00% to 8.00% 7.30% to 7.44%Automotive -do- 3.71% to 5.00% 4.90% to 8.00% 7.26% to 7.37%Financial -do- 3.50% 8.00% 7.38%
The overall expected rate of return on plan assets is determined based on the market prices prevailingon that date applicable to the period over which the obligation is to be settled.
Net retirement liability (asset) included in the consolidated statement of financial position follow:
2019 2018Retirement asset (Note 14) (P=7) (P=9)Retirement liability 1,222 859Net retirement liability P=1,215 P=850
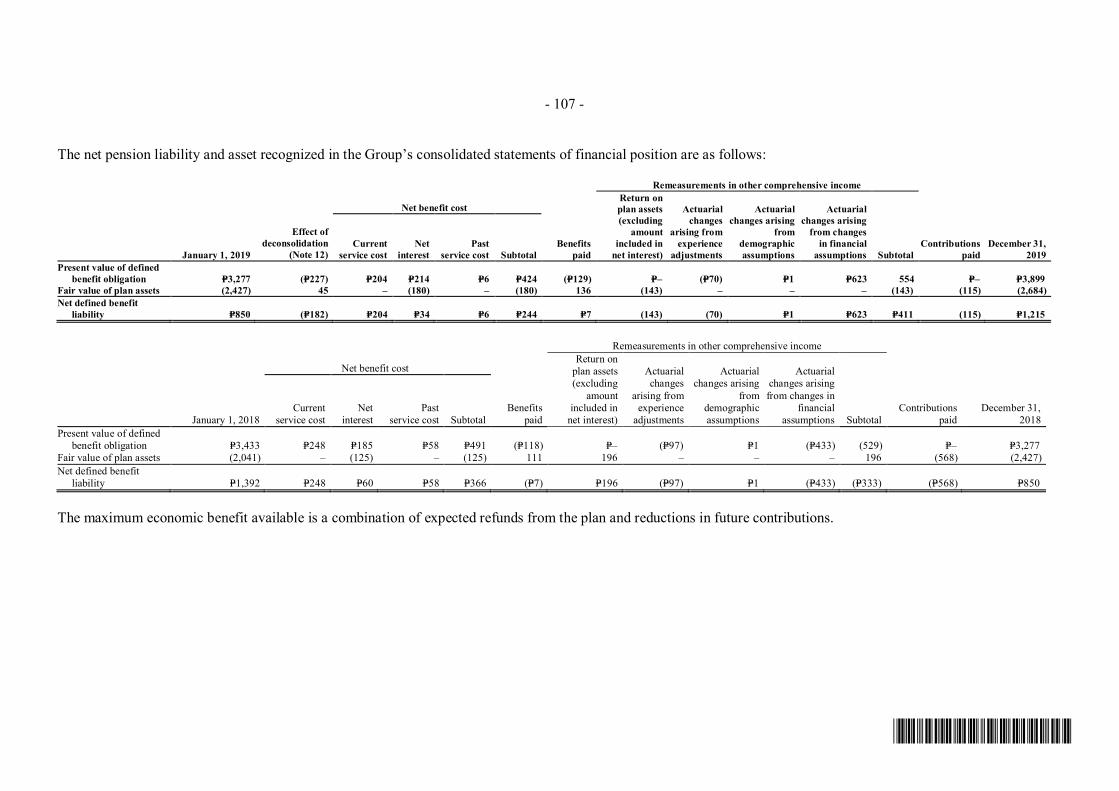
- 107 -
*SGVFSM000264*
The net pension liability and asset recognized in the Group’s consolidated statements of financial position are as follows:
Remeasurements in other comprehensive income
Net benefit costReturn onplan assets(excluding
amountincluded in
net interest)
Actuarialchanges
arising fromexperience
adjustments
Actuarialchanges arising
fromdemographicassumptions
Actuarialchanges arising
from changesin financial
assumptions SubtotalJanuary 1, 2019
Effect ofdeconsolidation
(Note 12)Current
service costNet
interestPast
service cost SubtotalBenefits
paidContributions
paidDecember 31,
2019Present value of defined
benefit obligation P=3,277 (P=227) P=204 P=214 P=6 P=424 (P=129) P=– (P=70) P=1 P=623 554 P=– P=3,899Fair value of plan assets (2,427) 45 – (180) – (180) 136 (143) – – – (143) (115) (2,684)Net defined benefit
liability P=850 (P=182) P=204 P=34 P=6 P=244 P=7 (143) (70) P=1 P=623 P=411 (115) P=1,215
Remeasurements in other comprehensive income
Net benefit costReturn on
plan assets(excluding
amountincluded in
net interest)
Actuarialchanges
arising fromexperience
adjustments
Actuarialchanges arising
fromdemographicassumptions
Actuarialchanges arisingfrom changes in
financialassumptions SubtotalJanuary 1, 2018
Currentservice cost
Net interest
Pastservice cost Subtotal
Benefitspaid
Contributionspaid
December 31,2018
Present value of definedbenefit obligation P=3,433 P=248 P=185 P=58 P=491 (P=118) P=– (P=97) P=1 (P=433) (529) P=– P=3,277
Fair value of plan assets (2,041) – (125) – (125) 111 196 – – – 196 (568) (2,427)Net defined benefit
liability P=1,392 P=248 P=60 P=58 P=366 (P=7) P=196 (P=97) P=1 (P=433) (P=333) (P=568) P=850
The maximum economic benefit available is a combination of expected refunds from the plan and reductions in future contributions.
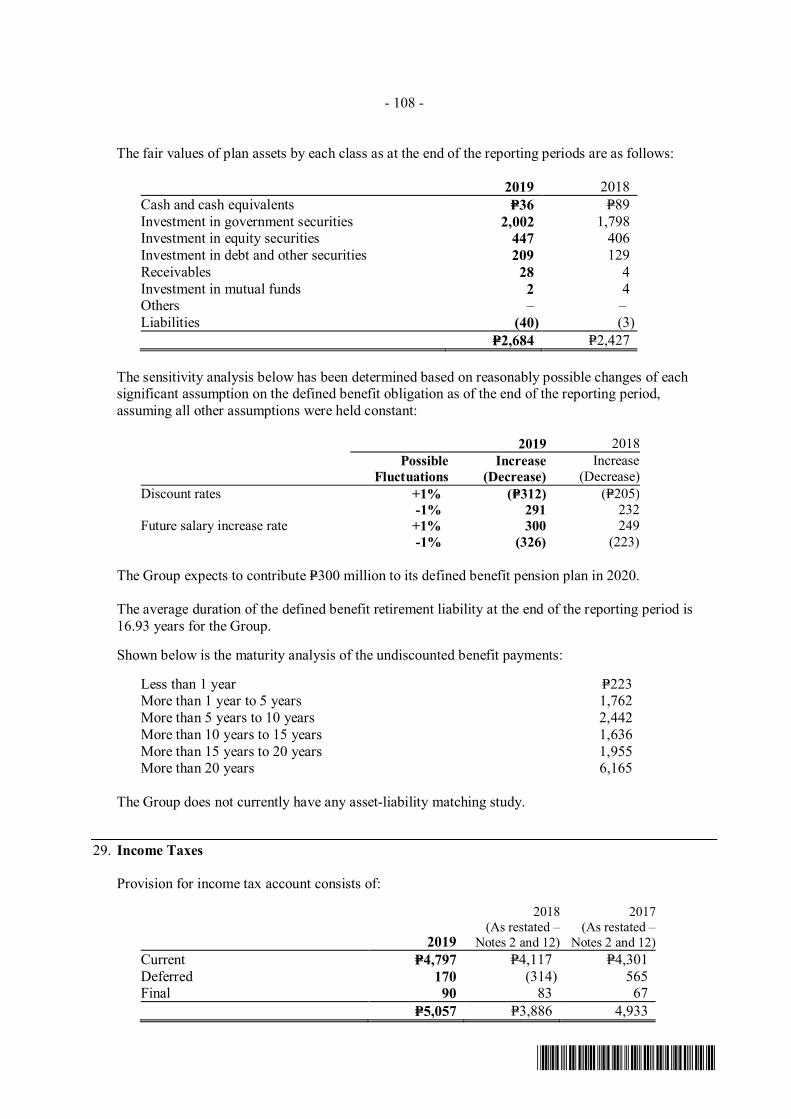
- 108 -
*SGVFSM000264*
The fair values of plan assets by each class as at the end of the reporting periods are as follows:
2019 2018Cash and cash equivalents P=36 P=89Investment in government securities 2,002 1,798Investment in equity securities 447 406Investment in debt and other securities 209 129Receivables 28 4Investment in mutual funds 2 4Others – –Liabilities (40) (3)
P=2,684 P=2,427
The sensitivity analysis below has been determined based on reasonably possible changes of eachsignificant assumption on the defined benefit obligation as of the end of the reporting period,assuming all other assumptions were held constant:
2019 2018Possible
FluctuationsIncrease
(Decrease)Increase
(Decrease)Discount rates +1% (P=312) (P=205)
-1% 291 232Future salary increase rate +1% 300 249
-1% (326) (223)
The Group expects to contribute P=300 million to its defined benefit pension plan in 2020.
The average duration of the defined benefit retirement liability at the end of the reporting period is16.93 years for the Group.
Shown below is the maturity analysis of the undiscounted benefit payments:
Less than 1 year P=223More than 1 year to 5 years 1,762More than 5 years to 10 years 2,442More than 10 years to 15 years 1,636More than 15 years to 20 years 1,955More than 20 years 6,165
The Group does not currently have any asset-liability matching study.
29. Income Taxes
Provision for income tax account consists of:
2019
2018(As restated –
Notes 2 and 12)
2017(As restated –
Notes 2 and 12)Current P=4,797 P=4,117 P=4,301Deferred 170 (314) 565Final 90 83 67
P=5,057 P=3,886 4,933
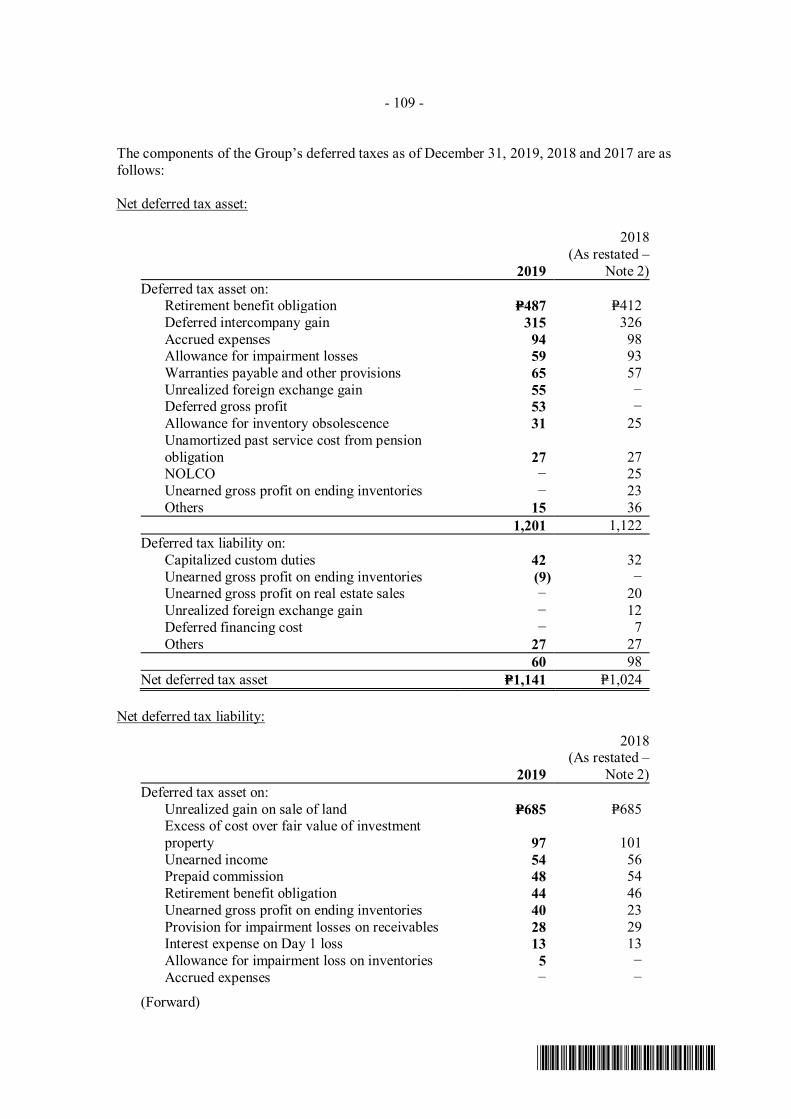
- 109 -
*SGVFSM000264*
The components of the Group’s deferred taxes as of December 31, 2019, 2018 and 2017 are asfollows:
Net deferred tax asset:
2019
2018(As restated –
Note 2)Deferred tax asset on:
Retirement benefit obligation P=487 P=412 Deferred intercompany gain 315 326 Accrued expenses 94 98
Allowance for impairment losses 59 93 Warranties payable and other provisions 65 57 Unrealized foreign exchange gain 55 −
Deferred gross profit 53 − Allowance for inventory obsolescence 31 25 Unamortized past service cost from pension
obligation 27 27NOLCO − 25
Unearned gross profit on ending inventories − 23 Others 15 36
1,201 1,122Deferred tax liability on: Capitalized custom duties 42 32 Unearned gross profit on ending inventories (9) −
Unearned gross profit on real estate sales − 20 Unrealized foreign exchange gain − 12 Deferred financing cost − 7 Others 27 27
60 98Net deferred tax asset P=1,141 P=1,024
Net deferred tax liability:
2019
2018(As restated –
Note 2)Deferred tax asset on: Unrealized gain on sale of land P=685 P=685
Excess of cost over fair value of investmentproperty 97 101
Unearned income 54 56Prepaid commission 48 54
Retirement benefit obligation 44 46 Unearned gross profit on ending inventories 40 23 Provision for impairment losses on receivables 28 29
Interest expense on Day 1 loss 13 13 Allowance for impairment loss on inventories 5 − Accrued expenses − −
(Forward)
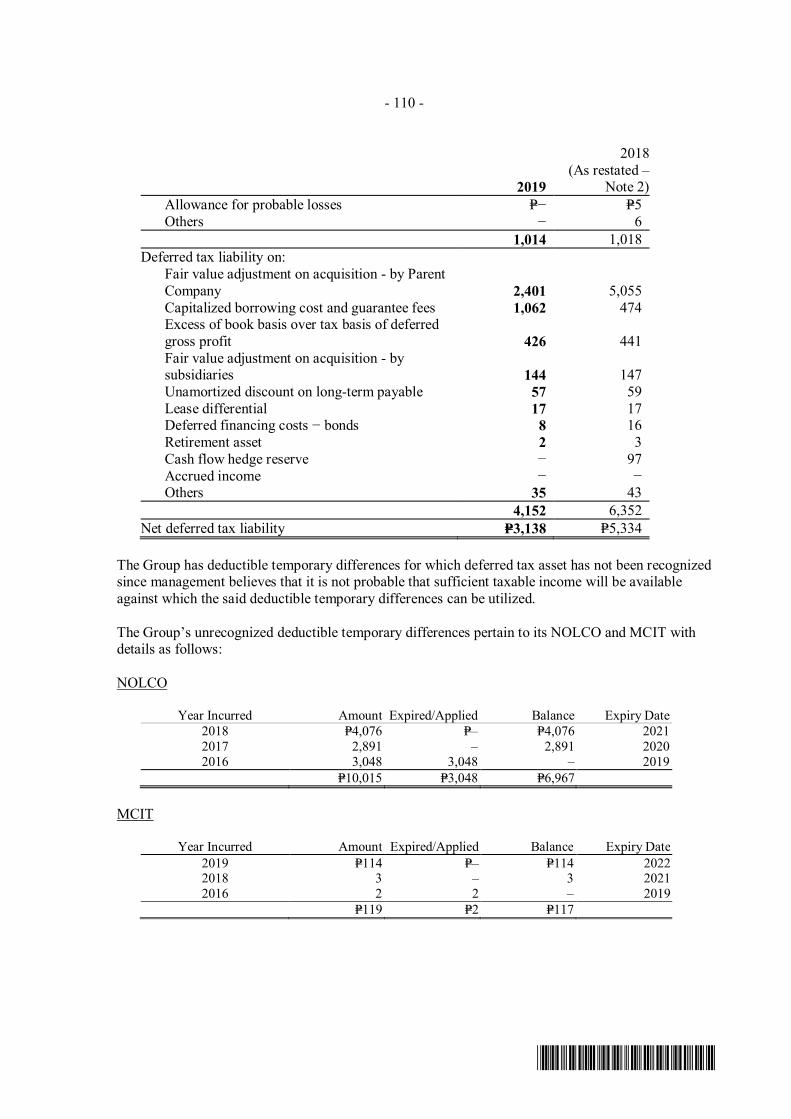
- 110 -
*SGVFSM000264*
2019
2018(As restated –
Note 2) Allowance for probable losses P=− P=5 Others − 6
1,014 1,018Deferred tax liability on: Fair value adjustment on acquisition - by Parent
Company 2,401 5,055 Capitalized borrowing cost and guarantee fees 1,062 474
Excess of book basis over tax basis of deferredgross profit 426 441
Fair value adjustment on acquisition - bysubsidiaries 144 147
Unamortized discount on long-term payable 57 59 Lease differential 17 17
Deferred financing costs − bonds 8 16 Retirement asset 2 3 Cash flow hedge reserve − 97 Accrued income − −
Others 35 434,152 6,352
Net deferred tax liability P=3,138 P=5,334
The Group has deductible temporary differences for which deferred tax asset has not been recognizedsince management believes that it is not probable that sufficient taxable income will be availableagainst which the said deductible temporary differences can be utilized.
The Group’s unrecognized deductible temporary differences pertain to its NOLCO and MCIT withdetails as follows:
NOLCO
Year Incurred Amount Expired/Applied Balance Expiry Date2018 P=4,076 P=– P=4,076 20212017 2,891 – 2,891 20202016 3,048 3,048 – 2019
P=10,015 P=3,048 P=6,967
MCIT
Year Incurred Amount Expired/Applied Balance Expiry Date2019 P=114 P=– P=114 20222018 3 – 3 20212016 2 2 – 2019
P=119 P=2 P=117
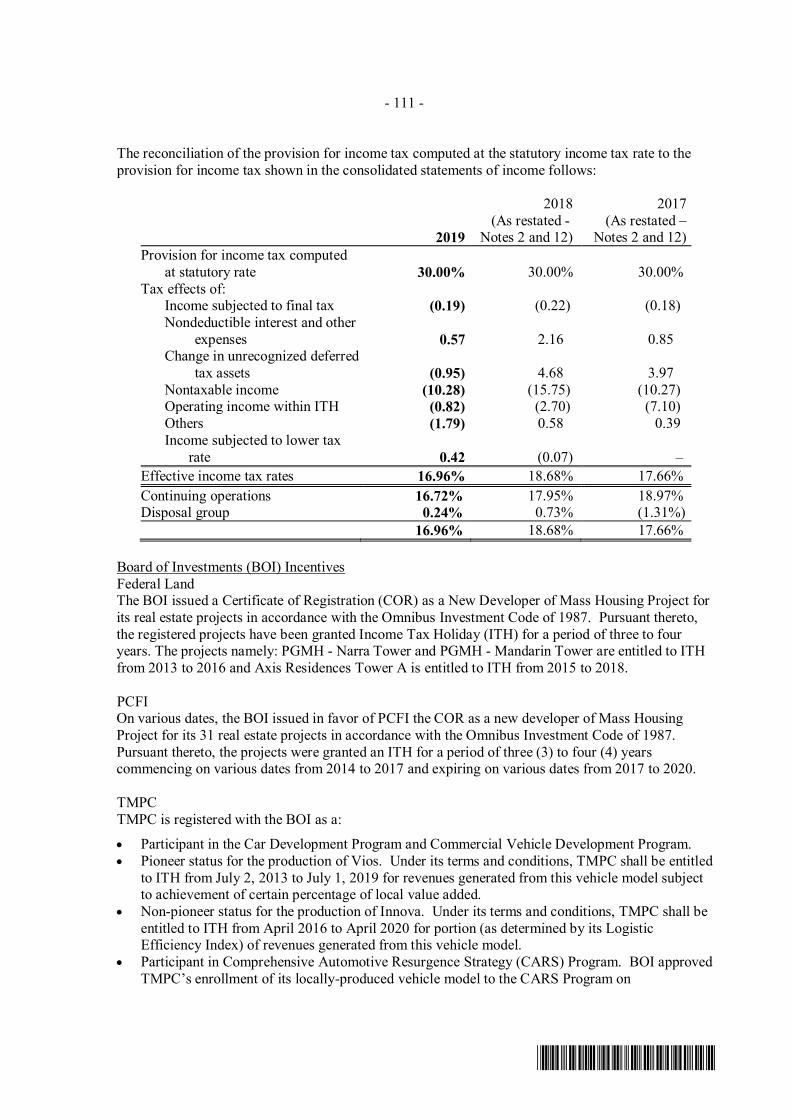
- 111 -
*SGVFSM000264*
The reconciliation of the provision for income tax computed at the statutory income tax rate to theprovision for income tax shown in the consolidated statements of income follows:
2019
2018(As restated -
Notes 2 and 12)
2017(As restated –
Notes 2 and 12)Provision for income tax computed
at statutory rate 30.00% 30.00% 30.00%Tax effects of:
Income subjected to final tax (0.19) (0.22) (0.18) Nondeductible interest and other
expenses 0.57 2.16 0.85Change in unrecognized deferred
tax assets (0.95) 4.68 3.97 Nontaxable income (10.28) (15.75) (10.27)
Operating income within ITH (0.82) (2.70) (7.10)Others (1.79) 0.58 0.39
Income subjected to lower taxrate 0.42 (0.07) –
Effective income tax rates 16.96% 18.68% 17.66%Continuing operations 16.72% 17.95% 18.97%Disposal group 0.24% 0.73% (1.31%)
16.96% 18.68% 17.66%
Board of Investments (BOI) IncentivesFederal LandThe BOI issued a Certificate of Registration (COR) as a New Developer of Mass Housing Project forits real estate projects in accordance with the Omnibus Investment Code of 1987. Pursuant thereto,the registered projects have been granted Income Tax Holiday (ITH) for a period of three to fouryears. The projects namely: PGMH - Narra Tower and PGMH - Mandarin Tower are entitled to ITHfrom 2013 to 2016 and Axis Residences Tower A is entitled to ITH from 2015 to 2018.
PCFIOn various dates, the BOI issued in favor of PCFI the COR as a new developer of Mass HousingProject for its 31 real estate projects in accordance with the Omnibus Investment Code of 1987.Pursuant thereto, the projects were granted an ITH for a period of three (3) to four (4) yearscommencing on various dates from 2014 to 2017 and expiring on various dates from 2017 to 2020.
TMPCTMPC is registered with the BOI as a:
· Participant in the Car Development Program and Commercial Vehicle Development Program.· Pioneer status for the production of Vios. Under its terms and conditions, TMPC shall be entitled
to ITH from July 2, 2013 to July 1, 2019 for revenues generated from this vehicle model subjectto achievement of certain percentage of local value added.
· Non-pioneer status for the production of Innova. Under its terms and conditions, TMPC shall beentitled to ITH from April 2016 to April 2020 for portion (as determined by its LogisticEfficiency Index) of revenues generated from this vehicle model.
· Participant in Comprehensive Automotive Resurgence Strategy (CARS) Program. BOI approvedTMPC’s enrollment of its locally-produced vehicle model to the CARS Program on
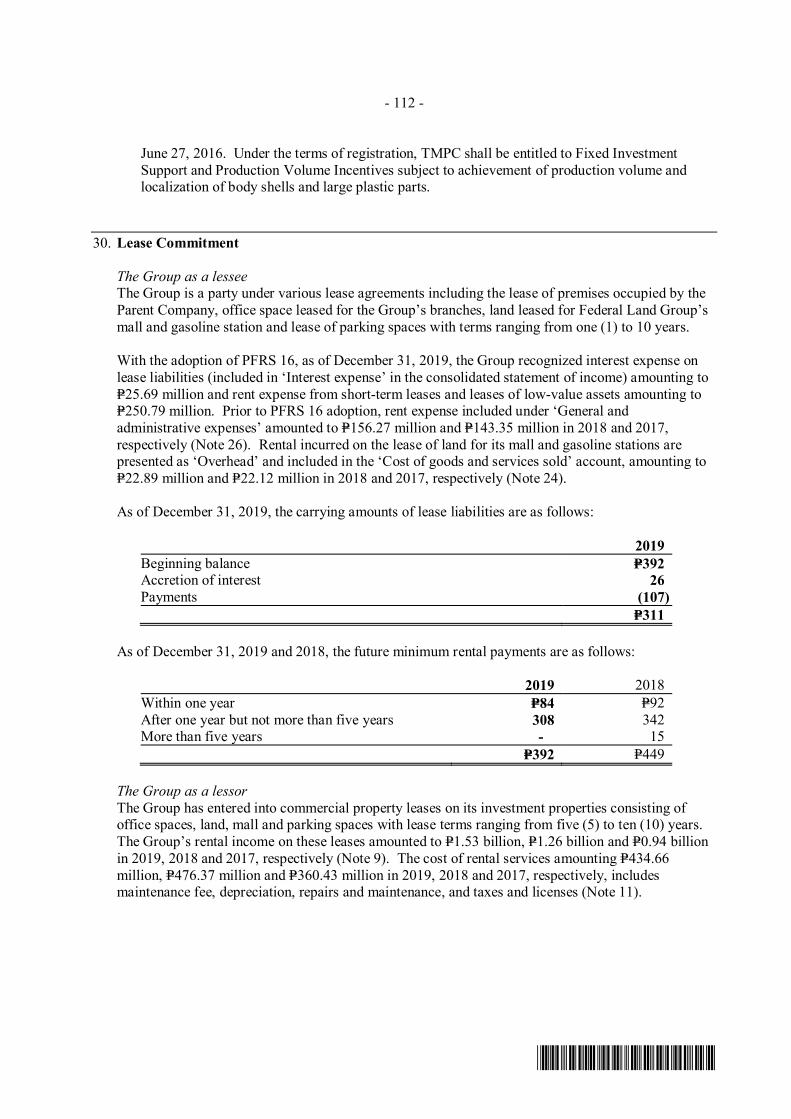
- 112 -
*SGVFSM000264*
June 27, 2016. Under the terms of registration, TMPC shall be entitled to Fixed InvestmentSupport and Production Volume Incentives subject to achievement of production volume andlocalization of body shells and large plastic parts.
30. Lease Commitment
The Group as a lesseeThe Group is a party under various lease agreements including the lease of premises occupied by theParent Company, office space leased for the Group’s branches, land leased for Federal Land Group’small and gasoline station and lease of parking spaces with terms ranging from one (1) to 10 years.
With the adoption of PFRS 16, as of December 31, 2019, the Group recognized interest expense onlease liabilities (included in ‘Interest expense’ in the consolidated statement of income) amounting toP=25.69 million and rent expense from short-term leases and leases of low-value assets amounting toP=250.79 million. Prior to PFRS 16 adoption, rent expense included under ‘General andadministrative expenses’ amounted to P=156.27 million and P=143.35 million in 2018 and 2017,respectively (Note 26). Rental incurred on the lease of land for its mall and gasoline stations arepresented as ‘Overhead’ and included in the ‘Cost of goods and services sold’ account, amounting toP=22.89 million and P=22.12 million in 2018 and 2017, respectively (Note 24).
As of December 31, 2019, the carrying amounts of lease liabilities are as follows:
2019Beginning balance P=392Accretion of interest 26Payments (107)
P=311
As of December 31, 2019 and 2018, the future minimum rental payments are as follows:
2019 2018Within one year P=84 P=92After one year but not more than five years 308 342More than five years - 15
P=392 P=449
The Group as a lessorThe Group has entered into commercial property leases on its investment properties consisting ofoffice spaces, land, mall and parking spaces with lease terms ranging from five (5) to ten (10) years.The Group’s rental income on these leases amounted to P=1.53 billion, P=1.26 billion and P=0.94 billionin 2019, 2018 and 2017, respectively (Note 9). The cost of rental services amounting P=434.66million, P=476.37 million and P=360.43 million in 2019, 2018 and 2017, respectively, includesmaintenance fee, depreciation, repairs and maintenance, and taxes and licenses (Note 11).
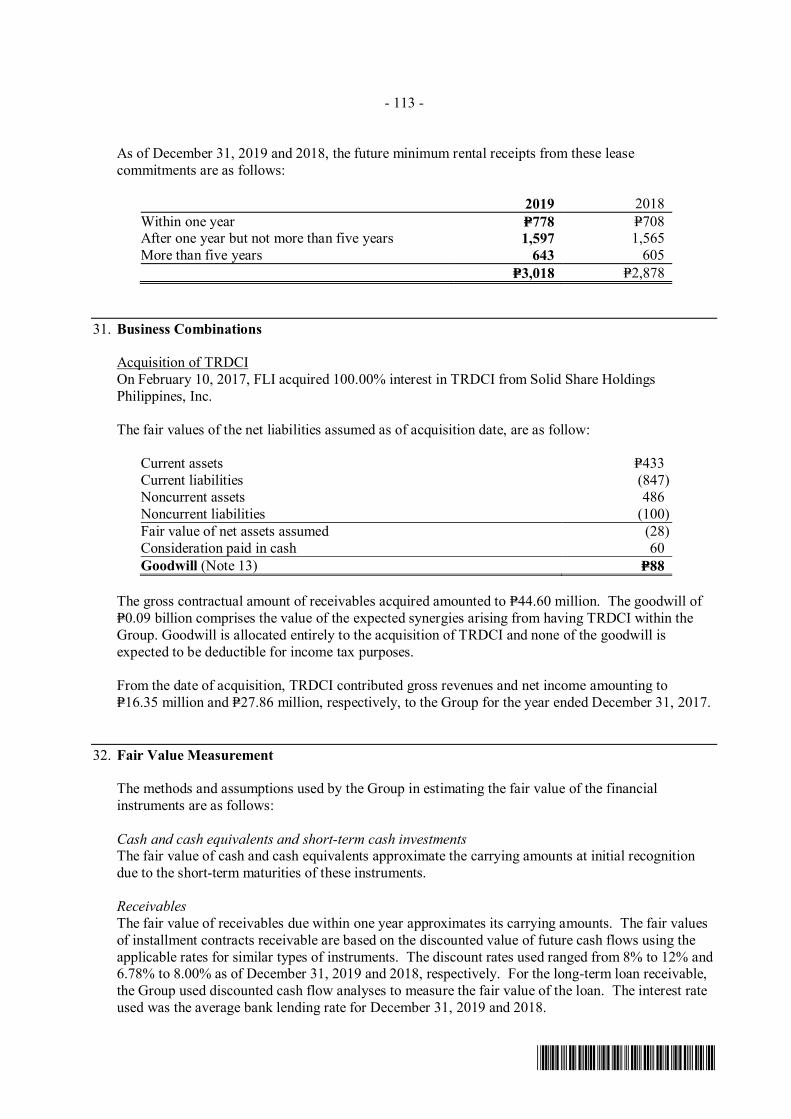
- 113 -
*SGVFSM000264*
As of December 31, 2019 and 2018, the future minimum rental receipts from these leasecommitments are as follows:
2019 2018Within one year P=778 P=708After one year but not more than five years 1,597 1,565More than five years 643 605
P=3,018 P=2,878
31. Business Combinations
Acquisition of TRDCIOn February 10, 2017, FLI acquired 100.00% interest in TRDCI from Solid Share HoldingsPhilippines, Inc.
The fair values of the net liabilities assumed as of acquisition date, are as follow:
Current assets P=433Current liabilities (847)Noncurrent assets 486Noncurrent liabilities (100)Fair value of net assets assumed (28)Consideration paid in cash 60Goodwill (Note 13) P=88
The gross contractual amount of receivables acquired amounted to P=44.60 million. The goodwill ofP=0.09 billion comprises the value of the expected synergies arising from having TRDCI within theGroup. Goodwill is allocated entirely to the acquisition of TRDCI and none of the goodwill isexpected to be deductible for income tax purposes.
From the date of acquisition, TRDCI contributed gross revenues and net income amounting toP=16.35 million and P=27.86 million, respectively, to the Group for the year ended December 31, 2017.
32. Fair Value Measurement
The methods and assumptions used by the Group in estimating the fair value of the financialinstruments are as follows:
Cash and cash equivalents and short-term cash investmentsThe fair value of cash and cash equivalents approximate the carrying amounts at initial recognitiondue to the short-term maturities of these instruments.
ReceivablesThe fair value of receivables due within one year approximates its carrying amounts. The fair valuesof installment contracts receivable are based on the discounted value of future cash flows using theapplicable rates for similar types of instruments. The discount rates used ranged from 8% to 12% and6.78% to 8.00% as of December 31, 2019 and 2018, respectively. For the long-term loan receivable,the Group used discounted cash flow analyses to measure the fair value of the loan. The interest rateused was the average bank lending rate for December 31, 2019 and 2018.
- 114 -
*SGVFSM000264*
Due from and to related pasrtiesThe carrying amounts approximate fair values due to short-term in nature. Related party receivablesand payables are due and demandable.
Financial assets at FVTPLThese pertain to the Group’s investment in UITFs. UITFs are ready-made investments that allowpooling of funds from different investors with similar investments objectives. These UITFs aremanaged by professional fund managers and may be invested in various financial instruments such asmoney market securities, bonds and equities, which are normally available to large investors only. AUITF uses the mark-to-market method in valuing the fund’s securities.
Financial assets at FVOCI - quotedThe fair value of quoted equity securities is based on the quoted market prices or binding dealer pricequotations, without any deduction for transaction cost.
Financial assets at FVOCI - unquotedThe fair value of unquoted equity securities is estimated based on the market data approach thatmakes use of market multiples derived from a set of comparables. Multiples were determined that ismost relevant to assessing the value of unquoted securities (e.g., earnings, book value). The selectionof the appropriate multiple within the range is based on qualitative and quantitative factors specific tothe measurement.
Derivative financial instrumentsThe fair values of cross currency and interest rate swap transactions are derived using acceptablevaluation method. The valuation assumptions are based on market conditions existing at the reportingdates.
Accounts and other payablesThe fair values of accounts and other payables approximate the carrying amounts due to the short-term nature of these transactions.
Loans payable and bonds payableCurrent portion of loans payable approximates its fair value due to its short-term maturity. Long-termportion of loans payable subjected to quarterly repricing is not discounted. Estimated fair value oflong-term portion of loans payable with fixed interest and not subjected to quarterly repricing is basedon the discounted value of future cash flows using applicable interest rates for similar types of loansas of reporting date. The interest rates used ranged from 0.085% to 7.35% and from 0.085% to7.35% for the year ended December 31, 2019 and 2018, respectively.
Liabilities on purchased propertiesEstimated fair value was based on the discounted value of future cash flows using the applicableinterest rates for similar types of loans as of reporting date. Long-term payable was incurred in 2017and 2012 with 3.00% interest per annum.
The following tables summarize the carrying amount and fair values of financial assets and liabilities,as well as nonfinancial assets, analyzed based on the fair value hierarchy (see accounting policy onFair Value Measurement), except for assets and liabilities where the carrying values as reflected in
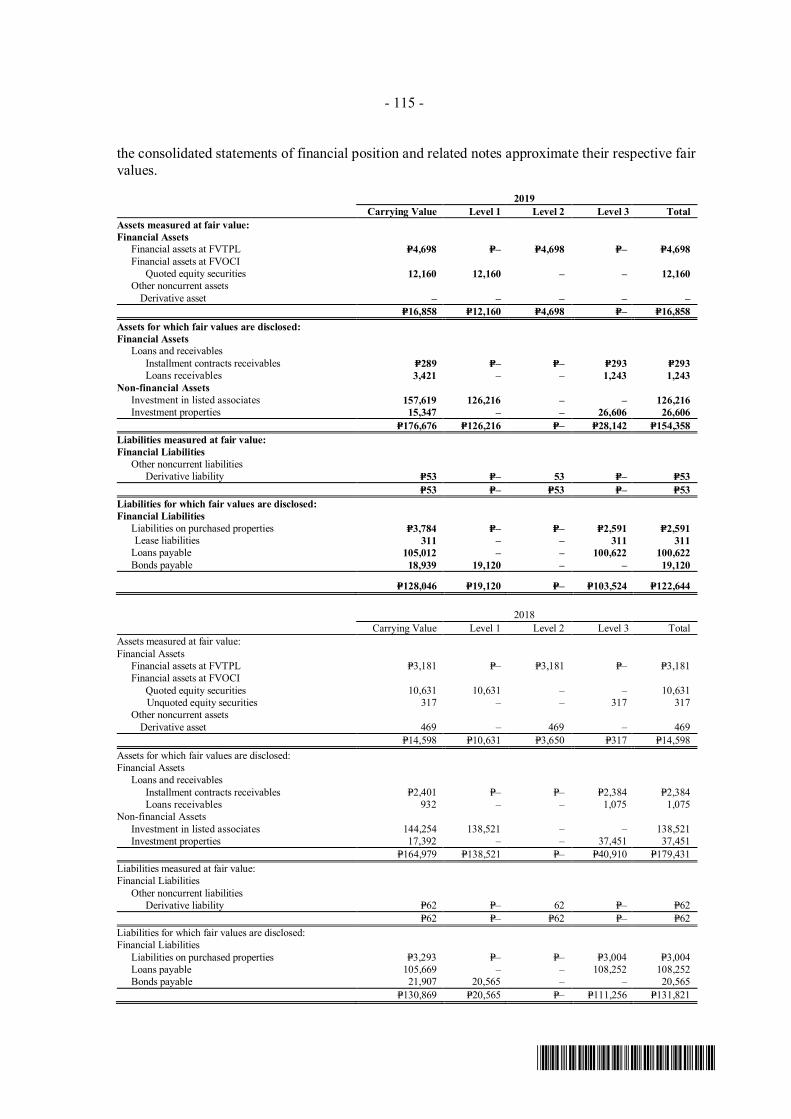
- 115 -
*SGVFSM000264*
the consolidated statements of financial position and related notes approximate their respective fairvalues.
2019Carrying Value Level 1 Level 2 Level 3 Total
Assets measured at fair value:Financial Assets Financial assets at FVTPL P=4,698 P=– P=4,698 P=– P=4,698 Financial assets at FVOCI Quoted equity securities 12,160 12,160 – – 12,160 Other noncurrent assets
Derivative asset – – – – –P=16,858 P=12,160 P=4,698 P=– P=16,858
Assets for which fair values are disclosed:Financial Assets Loans and receivables Installment contracts receivables P=289 P=– P=– P=293 P=293 Loans receivables 3,421 – – 1,243 1,243Non-financial Assets Investment in listed associates 157,619 126,216 – – 126,216 Investment properties 15,347 – – 26,606 26,606
P=176,676 P=126,216 P=– P=28,142 P=154,358Liabilities measured at fair value:Financial Liabilities Other noncurrent liabilities Derivative liability P=53 P=– 53 P=– P=53
P=53 P=– P=53 P=– P=53Liabilities for which fair values are disclosed:Financial Liabilities Liabilities on purchased properties P=3,784 P=– P=– P=2,591 P=2,591
Lease liabilities 311 – – 311 311 Loans payable 105,012 – – 100,622 100,622 Bonds payable 18,939 19,120 – – 19,120
P=128,046 P=19,120 P=– P=103,524 P=122,644
2018Carrying Value Level 1 Level 2 Level 3 Total
Assets measured at fair value:Financial Assets Financial assets at FVTPL P=3,181 P=– P=3,181 P=– P=3,181 Financial assets at FVOCI Quoted equity securities 10,631 10,631 – – 10,631
Unquoted equity securities 317 – – 317 317 Other noncurrent assets
Derivative asset 469 – 469 – 469P=14,598 P=10,631 P=3,650 P=317 P=14,598
Assets for which fair values are disclosed:Financial Assets Loans and receivables Installment contracts receivables P=2,401 P=– P=– P=2,384 P=2,384 Loans receivables 932 – – 1,075 1,075Non-financial Assets Investment in listed associates 144,254 138,521 – – 138,521 Investment properties 17,392 – – 37,451 37,451
P=164,979 P=138,521 P=– P=40,910 P=179,431Liabilities measured at fair value:Financial Liabilities Other noncurrent liabilities Derivative liability P=62 P=– 62 P=– P=62
P=62 P=– P=62 P=– P=62Liabilities for which fair values are disclosed:Financial Liabilities Liabilities on purchased properties P=3,293 P=– P=– P=3,004 P=3,004 Loans payable 105,669 – – 108,252 108,252 Bonds payable 21,907 20,565 – – 20,565
P=130,869 P=20,565 P=– P=111,256 P=131,821
- 116 -
*SGVFSM000264*
As of December 31, 2019 and 2018, no transfers were made among the three levels in the fair valuehierarchy.
Inputs used in estimating fair values of financial instruments carried at cost and categorized underLevel 3 include risk-free rates and applicable risk premium.
The fair value of the Group’s investment properties has been determined based on valuationsperformed by third party valuers. The value of the land was estimated by using the Market DataApproach, a valuation approach that considers the sales, listings and other related market data withinthe vicinity of the subject properties and establishes a value estimate by processes involvingcomparison.
The table below summarizes the valuation techniques used and the significant unobservable inputsvaluation for each type of investment properties held by the Group:
Valuation Techniques Significant Unobservable InputsLand Market Data Approach Price per square meter, size, location,
shape, time element and cornerinfluence
Building and LandImprovements
Cost Approach or Market DataApproach
Lineal and square meter, current costof materials, labor and equipment,contractor’s profits, overhead, taxesand fees
Description of the valuation techniques and significant unobservable inputs used in the valuation ofthe Group’s investment properties are as follows:
Valuation TechniquesMarket Data Approach A process of comparing the subject property being appraised to similar
comparable properties recently sold or being offered for sale.
Cost Approach A process of determining the cost to reproduce or replace in newcondition the assets appraised in accordance with current market pricesfor similar assets, with allowance for accrued depreciation on physicalwear and tear, and obsolescence.
Significant Unobservable InputsReproduction Cost New The cost to create a virtual replica of the existing structure, employing
the same design and similar building materials.
Size Size of lot in terms of area. Evaluate if the lot size of property orcomparable conforms to the average cut of the lots in the area andestimate the impact of lot size differences on land value.
Shape Particular form or configuration of the lot. A highly irregular shapelimits the usable area whereas an ideal lot configuration maximizes theusable area of the lot which is associated in designing an improvementwhich conforms with the highest and best use of the property.
- 117 -
*SGVFSM000264*
Significant Unobservable InputsLocation Location of comparative properties whether on a Main Road, or
secondary road. Road width could also be a consideration if data isavailable. As a rule, properties located along a Main Road are superiorto properties located along a secondary road.
Time Element “An adjustment for market conditions is made if general property valueshave appreciated or depreciated since the transaction dates due toinflation or deflation or a change in investors’ perceptions of the marketover time”. In which case, the current data is superior to historic data.
Discount Generally, asking prices in ads posted for sale are negotiable. Discountis the amount the seller or developer is willing to deduct from the postedselling price if the transaction will be in cash or equivalent.
Corner influence Bounded by two (2) roads.
33. Financial Risk Management and Objectives
The Group’s principal financial instruments are composed of cash and cash equivalents, short-terminvestments, receivables, due from related parties, financial assets at FVOCI and financial assets atFVTPL/AFS investments, accounts and other payables, due to/from related parties, loans payable andderivative liabilities.
Exposures to credit, liquidity, foreign currency, interest rate, and equity price risks arise in the normalcourse of the Group’s business activities. The main objectives of the Group’s financial riskmanagement are as follows:
· to identify and monitor such risks on an ongoing basis;· to minimize and mitigate such risks; and· to provide a degree of certainty about costs.
The use of financial derivative instruments (if any) is solely for the management of the Group’sfinancial risk exposures. It is the Group’s policy not to enter into derivative transactions forspeculative purposes.
The Group’s respective financing and treasury functions focus on managing financial risks andactivities as well as providing optimum investment yield and cost-efficient funding for the Group.
Credit RiskThe Group’s credit risks are primarily attributable to its financial assets. To manage credit risks, theGroup maintains defined credit policies and monitors on a continuous basis its exposure to creditrisks. Given the Group’s diverse base of counterparties, it is not exposed to large concentrations ofcredit risk.
Financial assets comprise cash and cash equivalents, short-term investments, receivables, due fromrelated parties and investment securities. The Group adheres to fixed limits and guidelines in itsdealings with counterparty banks and its investment in financial instruments. Bank limits areestablished on the basis of an internal rating system that principally covers the areas of liquidity,capital adequacy and financial stability. The rating system likewise makes use of available
- 118 -
*SGVFSM000264*
international credit ratings. Given the high credit standing of its accredited counterparty banks,management does not expect any of these financial institutions to fail in meeting their obligations.
In respect of installment receivables from the sale of properties, credit risk is managed primarilythrough credit reviews and an analysis of receivables on a continuous basis. The Group alsoundertakes supplemental credit review procedures for certain installment payment structures.Customer payments are facilitated through various collection modes including the use of postdatedchecks and auto-debit arrangements. Exposure to bad debts is not significant and the requirement forremedial procedures is minimal given the profile of buyers.
Maximum exposure to credit risk after taking into account collateral held or other creditenhancements
As of December 31, 2019 and 2018, the maximum exposure to credit risk of the Group’s financialassets is equal to its carrying value except for installment contracts receivable with nil exposure tocredit risk since the fair value of the related condominium and residential units collateral is greaterthan the carrying value of the installment contracts receivable.
a. Credit quality per class of financial assets
The credit quality of the financial assets was determined as follows:
Cash and cash equivalents and long term cash investment based on the nature of the counterpartyand the Group’s internal rating system.
Receivables - high grade pertains to receivables that had no default in payment; medium gradepertains to receivables with a history of being 30 to 90 days past due; and low grade pertains toreceivables with a history of being over 90 days past due.
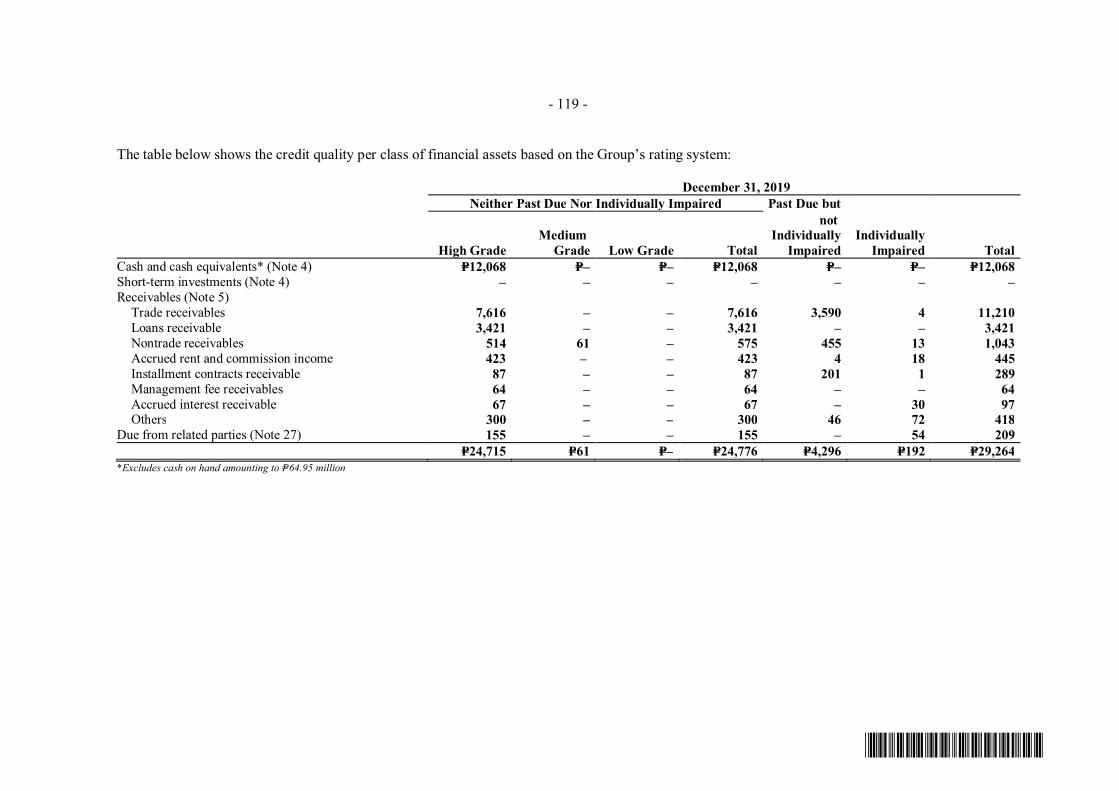
- 119 -
*SGVFSM000264*
The table below shows the credit quality per class of financial assets based on the Group’s rating system:
December 31, 2019Neither Past Due Nor Individually Impaired Past Due but
High GradeMedium
Grade Low Grade Total
notIndividually
ImpairedIndividually
Impaired TotalCash and cash equivalents* (Note 4) P=12,068 P=– P=– P=12,068 P=– P=– P=12,068Short-term investments (Note 4) – – – – – – –Receivables (Note 5) Trade receivables 7,616 – – 7,616 3,590 4 11,210 Loans receivable 3,421 – – 3,421 – – 3,421 Nontrade receivables 514 61 – 575 455 13 1,043 Accrued rent and commission income 423 – – 423 4 18 445 Installment contracts receivable 87 – – 87 201 1 289 Management fee receivables 64 – – 64 – – 64 Accrued interest receivable 67 – – 67 – 30 97
Others 300 – – 300 46 72 418Due from related parties (Note 27) 155 – – 155 – 54 209
P=24,715 P=61 P=– P=24,776 P=4,296 P=192 P=29,264*Excludes cash on hand amounting to P=64.95 million
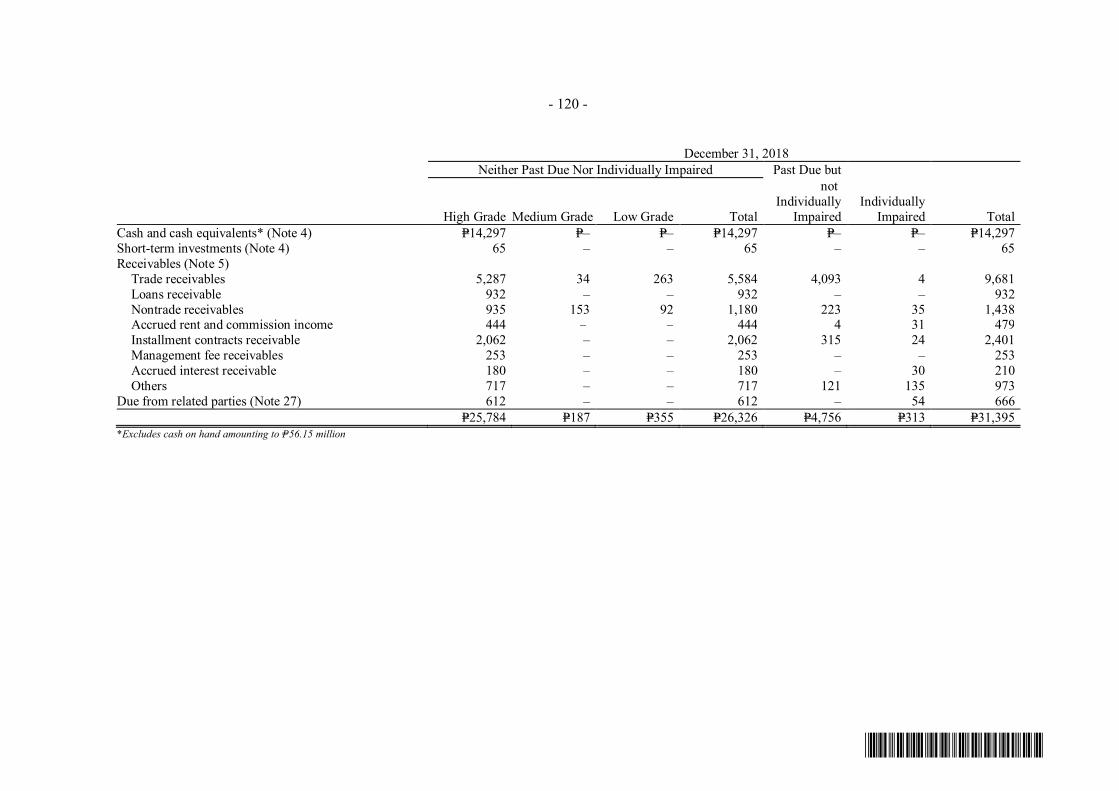
- 120 -
*SGVFSM000264*
December 31, 2018Neither Past Due Nor Individually Impaired Past Due but
High Grade Medium Grade Low Grade Total
notIndividually
ImpairedIndividually
Impaired TotalCash and cash equivalents* (Note 4) P=14,297 P=– P=– P=14,297 P=– P=– P=14,297Short-term investments (Note 4) 65 – – 65 – – 65Receivables (Note 5) Trade receivables 5,287 34 263 5,584 4,093 4 9,681 Loans receivable 932 – – 932 – – 932 Nontrade receivables 935 153 92 1,180 223 35 1,438
Accrued rent and commission income 444 – – 444 4 31 479 Installment contracts receivable 2,062 – – 2,062 315 24 2,401 Management fee receivables 253 – – 253 – – 253 Accrued interest receivable 180 – – 180 – 30 210 Others 717 – – 717 121 135 973Due from related parties (Note 27) 612 – – 612 – 54 666
P=25,784 P=187 P=355 P=26,326 P=4,756 P=313 P=31,395*Excludes cash on hand amounting to P=56.15 million
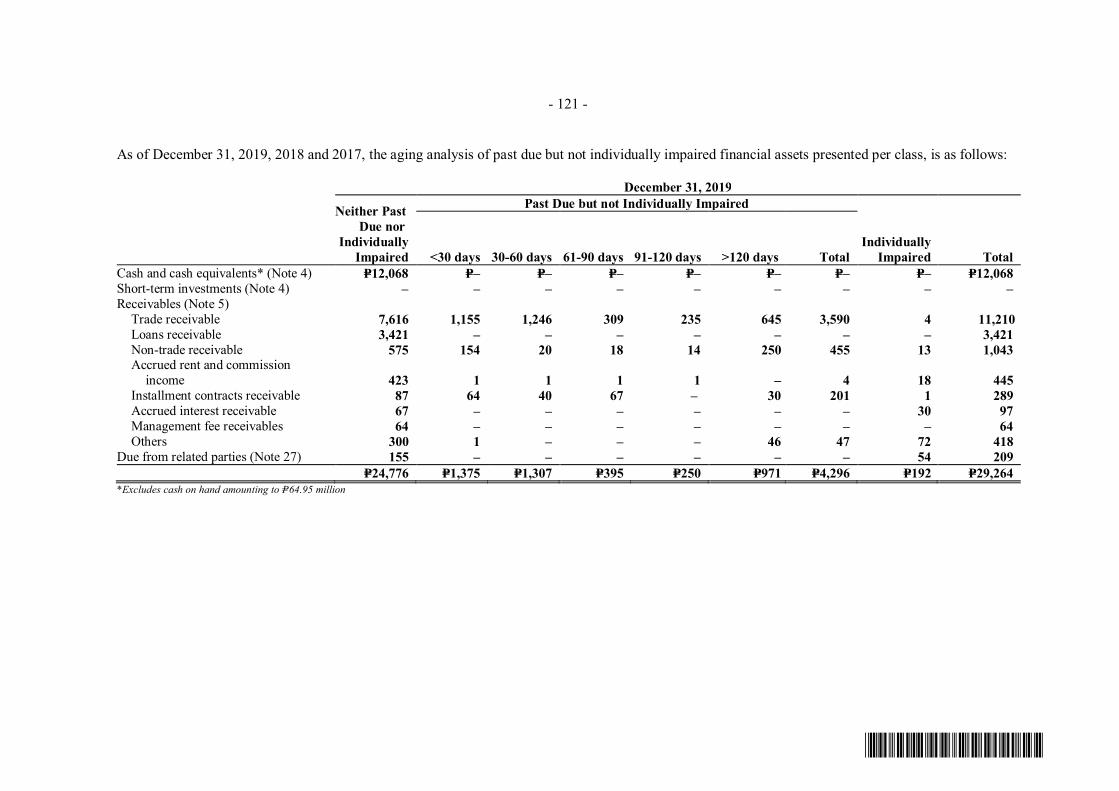
- 121 -
*SGVFSM000264*
As of December 31, 2019, 2018 and 2017, the aging analysis of past due but not individually impaired financial assets presented per class, is as follows:
December 31, 2019
Neither PastDue nor
IndividuallyImpaired
Past Due but not Individually Impaired
<30 days 30-60 days 61-90 days 91-120 days >120 days TotalIndividually
Impaired TotalCash and cash equivalents* (Note 4) P=12,068 P=– P=– P=– P=– P=– P=– P=– P=12,068Short-term investments (Note 4) – – – – – – – – –Receivables (Note 5) Trade receivable 7,616 1,155 1,246 309 235 645 3,590 4 11,210 Loans receivable 3,421 – – – – – – – 3,421 Non-trade receivable 575 154 20 18 14 250 455 13 1,043
Accrued rent and commissionincome 423 1 1 1 1 – 4 18 445
Installment contracts receivable 87 64 40 67 – 30 201 1 289 Accrued interest receivable 67 – – – – – – 30 97 Management fee receivables 64 – – – – – – – 64 Others 300 1 – – – 46 47 72 418Due from related parties (Note 27) 155 – – – – – – 54 209
P=24,776 P=1,375 P=1,307 P=395 P=250 P=971 P=4,296 P=192 P=29,264*Excludes cash on hand amounting to P=64.95 million
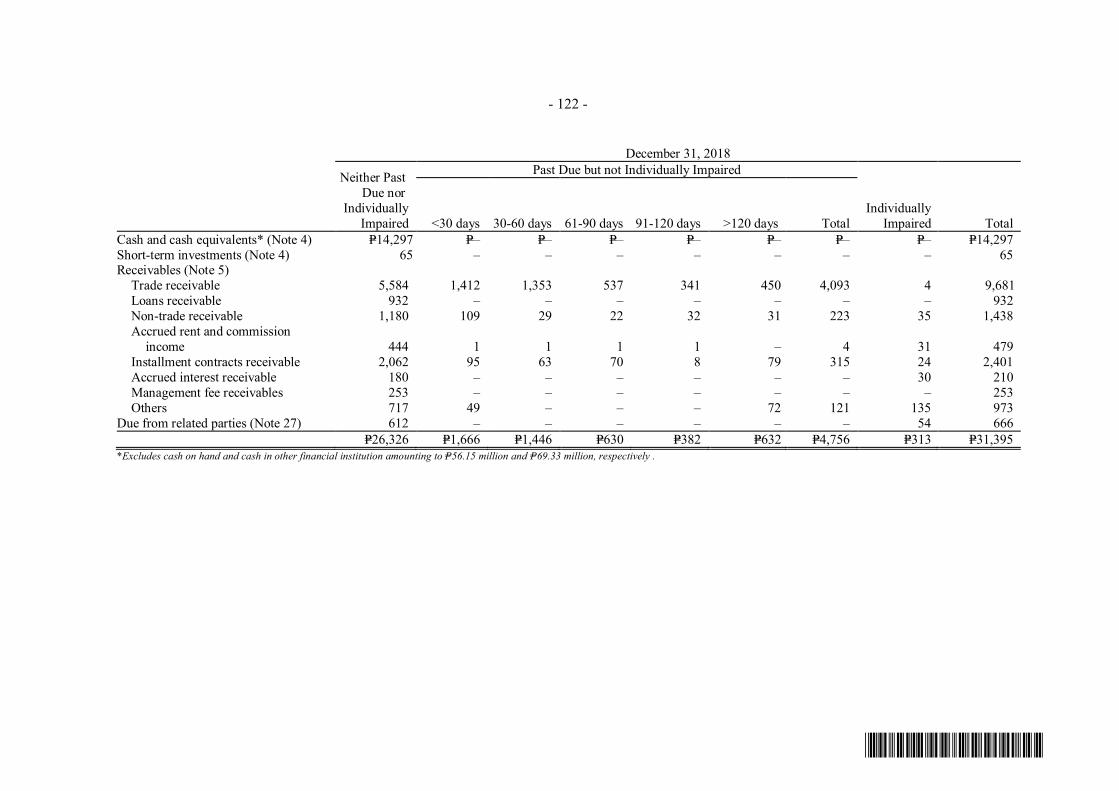
- 122 -
*SGVFSM000264*
December 31, 2018
Neither PastDue nor
IndividuallyImpaired
Past Due but not Individually Impaired
<30 days 30-60 days 61-90 days 91-120 days >120 days TotalIndividually
Impaired TotalCash and cash equivalents* (Note 4) P=14,297 P=– P=– P=– P=– P=– P=– P=– P=14,297Short-term investments (Note 4) 65 – – – – – – – 65Receivables (Note 5) Trade receivable 5,584 1,412 1,353 537 341 450 4,093 4 9,681 Loans receivable 932 – – – – – – – 932 Non-trade receivable 1,180 109 29 22 32 31 223 35 1,438 Accrued rent and commission
income 444 1 1 1 1 – 4 31 479 Installment contracts receivable 2,062 95 63 70 8 79 315 24 2,401 Accrued interest receivable 180 – – – – – – 30 210 Management fee receivables 253 – – – – – – – 253 Others 717 49 – – – 72 121 135 973Due from related parties (Note 27) 612 – – – – – – 54 666
P=26,326 P=1,666 P=1,446 P=630 P=382 P=632 P=4,756 P=313 P=31,395*Excludes cash on hand and cash in other financial institution amounting to P=56.15 million and P=69.33 million, respectively .
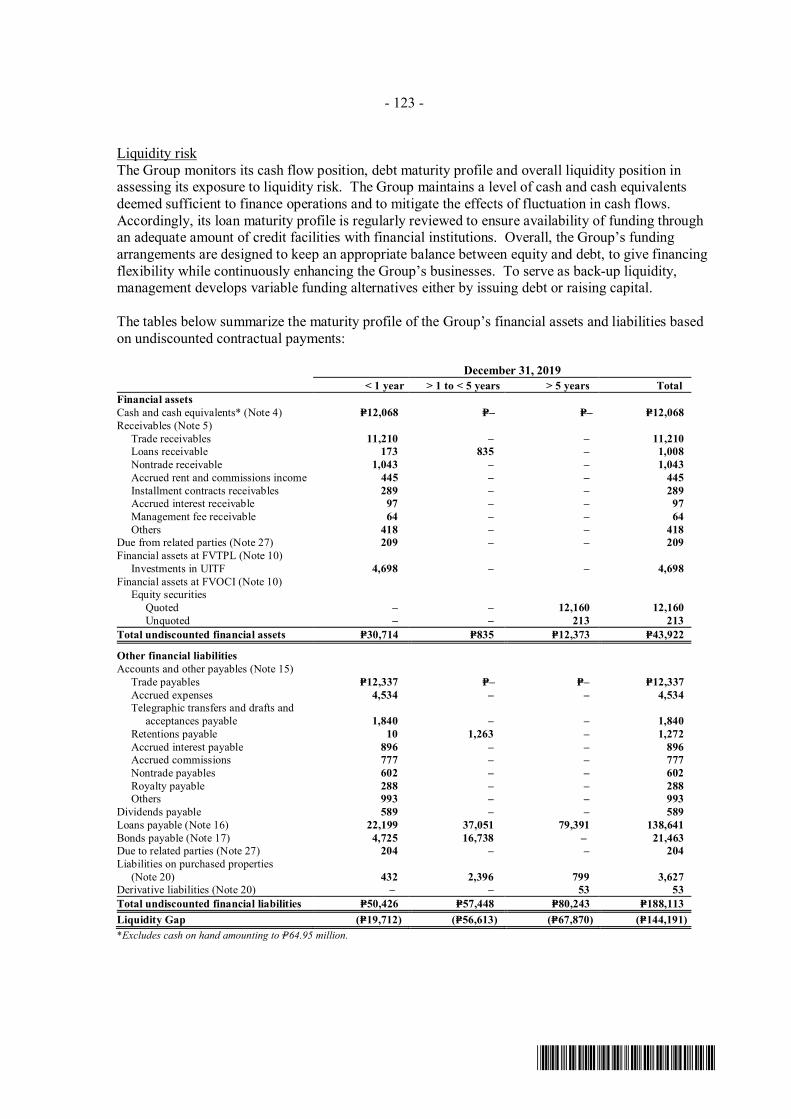
- 123 -
*SGVFSM000264*
Liquidity riskThe Group monitors its cash flow position, debt maturity profile and overall liquidity position inassessing its exposure to liquidity risk. The Group maintains a level of cash and cash equivalentsdeemed sufficient to finance operations and to mitigate the effects of fluctuation in cash flows.Accordingly, its loan maturity profile is regularly reviewed to ensure availability of funding throughan adequate amount of credit facilities with financial institutions. Overall, the Group’s fundingarrangements are designed to keep an appropriate balance between equity and debt, to give financingflexibility while continuously enhancing the Group’s businesses. To serve as back-up liquidity,management develops variable funding alternatives either by issuing debt or raising capital.
The tables below summarize the maturity profile of the Group’s financial assets and liabilities basedon undiscounted contractual payments:
December 31, 2019< 1 year > 1 to < 5 years > 5 years Total
Financial assetsCash and cash equivalents* (Note 4) P=12,068 P=– P=– P=12,068Receivables (Note 5) Trade receivables 11,210 – – 11,210 Loans receivable 173 835 – 1,008 Nontrade receivable 1,043 – – 1,043 Accrued rent and commissions income 445 – – 445 Installment contracts receivables 289 – – 289 Accrued interest receivable 97 – – 97 Management fee receivable 64 – – 64 Others 418 – – 418Due from related parties (Note 27) 209 – – 209Financial assets at FVTPL (Note 10) Investments in UITF 4,698 – – 4,698Financial assets at FVOCI (Note 10) Equity securities Quoted – – 12,160 12,160 Unquoted – – 213 213Total undiscounted financial assets P=30,714 P=835 P=12,373 P=43,922
Other financial liabilitiesAccounts and other payables (Note 15) Trade payables P=12,337 P=– P=– P=12,337 Accrued expenses 4,534 – – 4,534 Telegraphic transfers and drafts and
acceptances payable 1,840 – – 1,840 Retentions payable 10 1,263 – 1,272 Accrued interest payable 896 – – 896 Accrued commissions 777 – – 777 Nontrade payables 602 – – 602 Royalty payable 288 – – 288 Others 993 – – 993Dividends payable 589 – – 589Loans payable (Note 16) 22,199 37,051 79,391 138,641Bonds payable (Note 17) 4,725 16,738 – 21,463Due to related parties (Note 27) 204 – – 204Liabilities on purchased properties
(Note 20) 432 2,396 799 3,627Derivative liabilities (Note 20) – – 53 53Total undiscounted financial liabilities P=50,426 P=57,448 P=80,243 P=188,113Liquidity Gap (P=19,712) (P=56,613) (P=67,870) (P=144,191)*Excludes cash on hand amounting to P=64.95 million.
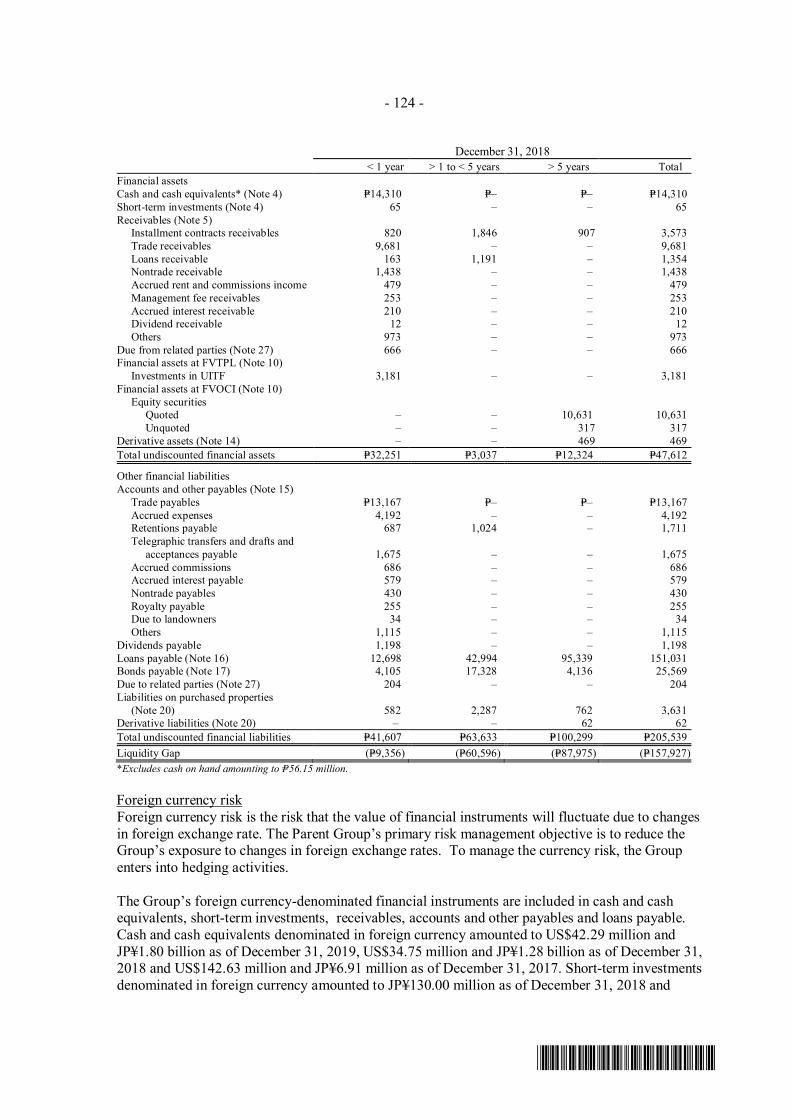
- 124 -
*SGVFSM000264*
December 31, 2018< 1 year > 1 to < 5 years > 5 years Total
Financial assetsCash and cash equivalents* (Note 4) P=14,310 P=– P=– P=14,310Short-term investments (Note 4) 65 – – 65Receivables (Note 5) Installment contracts receivables 820 1,846 907 3,573 Trade receivables 9,681 – – 9,681 Loans receivable 163 1,191 – 1,354 Nontrade receivable 1,438 – – 1,438 Accrued rent and commissions income 479 – – 479 Management fee receivables 253 – – 253 Accrued interest receivable 210 – – 210 Dividend receivable 12 – – 12 Others 973 – – 973Due from related parties (Note 27) 666 – – 666Financial assets at FVTPL (Note 10) Investments in UITF 3,181 – – 3,181Financial assets at FVOCI (Note 10) Equity securities Quoted – – 10,631 10,631 Unquoted – – 317 317Derivative assets (Note 14) – – 469 469Total undiscounted financial assets P=32,251 P=3,037 P=12,324 P=47,612
Other financial liabilitiesAccounts and other payables (Note 15) Trade payables P=13,167 P=– P=– P=13,167 Accrued expenses 4,192 – – 4,192 Retentions payable 687 1,024 – 1,711 Telegraphic transfers and drafts and
acceptances payable 1,675 – – 1,675 Accrued commissions 686 – – 686 Accrued interest payable 579 – – 579 Nontrade payables 430 – – 430 Royalty payable 255 – – 255 Due to landowners 34 – – 34 Others 1,115 – – 1,115Dividends payable 1,198 – – 1,198Loans payable (Note 16) 12,698 42,994 95,339 151,031Bonds payable (Note 17) 4,105 17,328 4,136 25,569Due to related parties (Note 27) 204 – – 204Liabilities on purchased properties
(Note 20) 582 2,287 762 3,631Derivative liabilities (Note 20) – – 62 62Total undiscounted financial liabilities P=41,607 P=63,633 P=100,299 P=205,539Liquidity Gap (P=9,356) (P=60,596) (P=87,975) (P=157,927)*Excludes cash on hand amounting to P=56.15 million.
Foreign currency riskForeign currency risk is the risk that the value of financial instruments will fluctuate due to changesin foreign exchange rate. The Parent Group’s primary risk management objective is to reduce theGroup’s exposure to changes in foreign exchange rates. To manage the currency risk, the Groupenters into hedging activities.
The Group’s foreign currency-denominated financial instruments are included in cash and cashequivalents, short-term investments, receivables, accounts and other payables and loans payable.Cash and cash equivalents denominated in foreign currency amounted to US$42.29 million andJP¥1.80 billion as of December 31, 2019, US$34.75 million and JP¥1.28 billion as of December 31,2018 and US$142.63 million and JP¥6.91 million as of December 31, 2017. Short-term investmentsdenominated in foreign currency amounted to JP¥130.00 million as of December 31, 2018 and
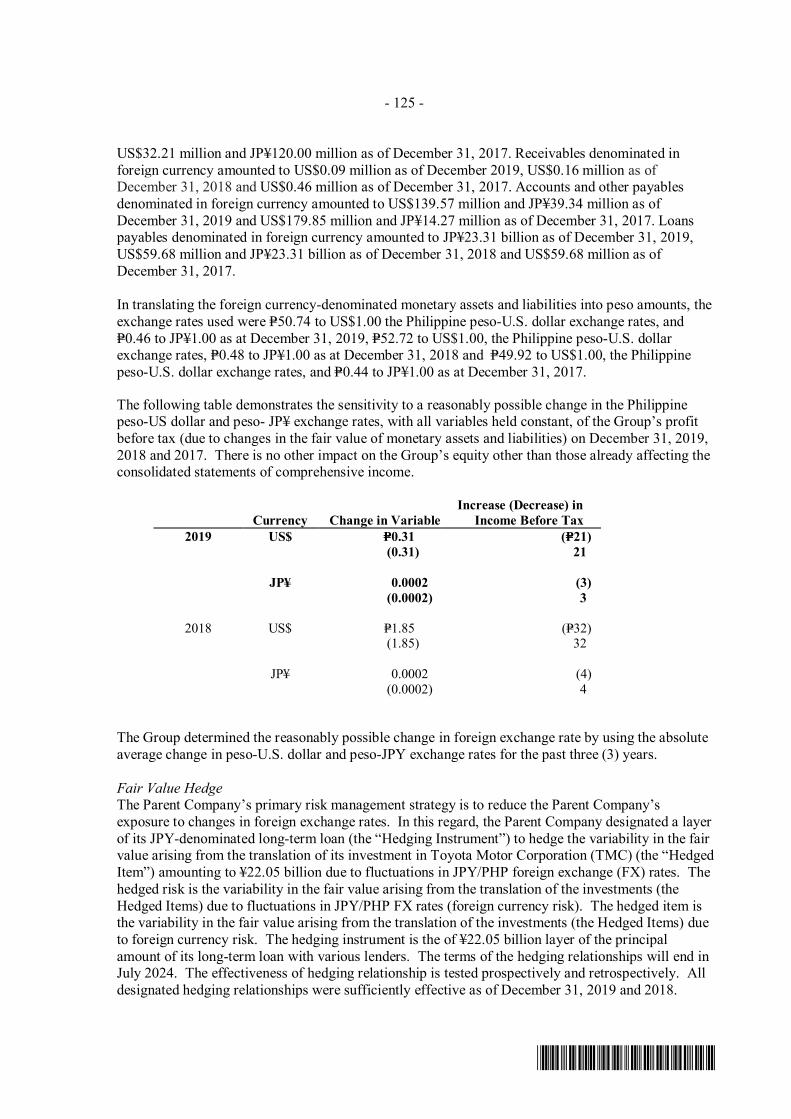
- 125 -
*SGVFSM000264*
US$32.21 million and JP¥120.00 million as of December 31, 2017. Receivables denominated inforeign currency amounted to US$0.09 million as of December 2019, US$0.16 million as ofDecember 31, 2018 and US$0.46 million as of December 31, 2017. Accounts and other payablesdenominated in foreign currency amounted to US$139.57 million and JP¥39.34 million as ofDecember 31, 2019 and US$179.85 million and JP¥14.27 million as of December 31, 2017. Loanspayables denominated in foreign currency amounted to JP¥23.31 billion as of December 31, 2019,US$59.68 million and JP¥23.31 billion as of December 31, 2018 and US$59.68 million as ofDecember 31, 2017.
In translating the foreign currency-denominated monetary assets and liabilities into peso amounts, theexchange rates used were P=50.74 to US$1.00 the Philippine peso-U.S. dollar exchange rates, andP=0.46 to JP¥1.00 as at December 31, 2019, P=52.72 to US$1.00, the Philippine peso-U.S. dollarexchange rates, P=0.48 to JP¥1.00 as at December 31, 2018 and P=49.92 to US$1.00, the Philippinepeso-U.S. dollar exchange rates, and P=0.44 to JP¥1.00 as at December 31, 2017.
The following table demonstrates the sensitivity to a reasonably possible change in the Philippinepeso-US dollar and peso- JP¥ exchange rates, with all variables held constant, of the Group’s profitbefore tax (due to changes in the fair value of monetary assets and liabilities) on December 31, 2019,2018 and 2017. There is no other impact on the Group’s equity other than those already affecting theconsolidated statements of comprehensive income.
Currency Change in VariableIncrease (Decrease) in
Income Before Tax2019 US$ P=0.31 (P=21)
(0.31) 21
JP¥ 0.0002 (3)(0.0002) 3
2018 US$ P=1.85 (P=32)(1.85) 32
JP¥ 0.0002 (4)(0.0002) 4
The Group determined the reasonably possible change in foreign exchange rate by using the absoluteaverage change in peso-U.S. dollar and peso-JPY exchange rates for the past three (3) years.
Fair Value HedgeThe Parent Company’s primary risk management strategy is to reduce the Parent Company’sexposure to changes in foreign exchange rates. In this regard, the Parent Company designated a layerof its JPY-denominated long-term loan (the “Hedging Instrument”) to hedge the variability in the fairvalue arising from the translation of its investment in Toyota Motor Corporation (TMC) (the “HedgedItem”) amounting to ¥22.05 billion due to fluctuations in JPY/PHP foreign exchange (FX) rates. Thehedged risk is the variability in the fair value arising from the translation of the investments (theHedged Items) due to fluctuations in JPY/PHP FX rates (foreign currency risk). The hedged item isthe variability in the fair value arising from the translation of the investments (the Hedged Items) dueto foreign currency risk. The hedging instrument is the of ¥22.05 billion layer of the principalamount of its long-term loan with various lenders. The terms of the hedging relationships will end inJuly 2024. The effectiveness of hedging relationship is tested prospectively and retrospectively. Alldesignated hedging relationships were sufficiently effective as of December 31, 2019 and 2018.
- 126 -
*SGVFSM000264*
Economic relation between the hedged item and the hedging instrument was qualitatively tested bymatching their critical terms. The hedged items create a foreign currency risk on the translation ofinvestments amounting to ¥22.05 billion while the hedging instruments create the exact offset of thisrisk. Since the critical terms of the hedged item and hedging instrument matched, a clear economicrelationship was established. The Parent Company’s and the counterparty’s credit risk weremonitored for adverse changes. The Parent Company assessed that the risk associated with them andthe counterparty is considered minimal, at inception, and during the year and did not dominate thevalue changes that result from the economic relationship. Consistent with the hedge ratio per theParent Company’s risk management policy, the hedge ratio for hedge accounting purposes is 1:1 or100% since only a layer of the long-term loan which exactly matches the notional amount of thehedged item was designated as hedging instrument.
Interest rate riskThe Group’s interest rate exposure management policy centers on reducing the Group’s overallinterest expense and exposure to changes in interest rates. Changes in market interest rates relateprimarily to the Group’s interest-bearing debt obligations with floating interest rate as it can cause achange in the amount of interest payments.
The Group manages its interest rate risk by leveraging on its premier credit rating and maintaining adebt portfolio mix of both fixed and floating interest rates. The portfolio mix is a function ofhistorical, current trend and outlook of interest rates, volatility of short-term interest rates, thesteepness of the yield curve and degree of variability of cash flows.
There is no sensitivity to the changes in interest rates of the Parent Company’s income before taxthrough the impact of floating rate borrowings because the risk is effectively hedged by an interestrate swap.
As of December 31, 2019 and 2018, the Group has no financial instruments subject to floatinginterest rates.
Cash Flow HedgeInterest rate swapThe Parent Company entered into an interest rate swap (IRS) agreement to hedge the variability in theinterest cash flows arising from its floating rate loan with various lenders (the “Loan”), attributable tochanges in the three-month Japanese Yen ICE LIBOR (3m JPY LIBOR). The hedged risk isvariability in interest cash flows of the Loan attributable to changes in the 3m JPY LIBOR (interestrate risk). The hedged item is the interest cash flows on the Loan which is based on 3m JPY LIBOR+ margin, floored at 0%. The hedging instrument is an IRS under which the Parent Company willpay fixed interest at a rate of 0.852% per annum and receive variable interest based on 3m JPYLIBOR. The terms of the hedging relationships will end in July 2024. The effectiveness of hedgingrelationship is tested prospectively and retrospectively. The designated hedging relationship wassufficiently effective as December 31, 2019 and 2018.
An economic relation between the hedged item and the hedging instrument was qualitatively testedby matching their critical terms. The hedged item creates an exposure to pay 3m JPY ICE LIBOR(floored at 0%) + 0.65%, settled quarterly. The hedging instrument creates an exact offset of thisexposure with a consequence of paying a fixed interest payment of 0.852% per annum. Since most ofthe critical terms of the hedged item and hedging instrument matched, a clear economic relationshipwas established. The Parent Company’s and the counterparty’s credit risk was monitored for adversechanges. The Parent Company assessed that the risk associated with them and the counterparty isconsidered minimal, at inception, and during the year and did not dominate the value changes thatresult from the economic relationship. Consistent with the hedge ratio per the Parent Company’s risk
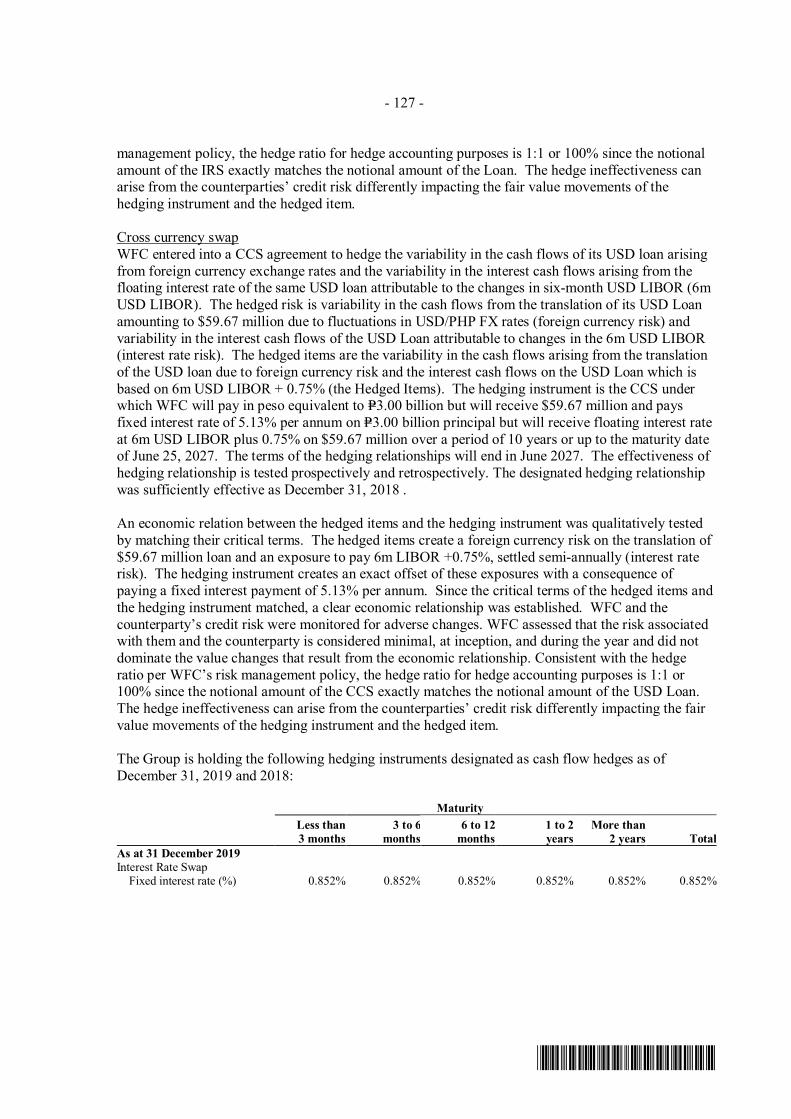
- 127 -
*SGVFSM000264*
management policy, the hedge ratio for hedge accounting purposes is 1:1 or 100% since the notionalamount of the IRS exactly matches the notional amount of the Loan. The hedge ineffectiveness canarise from the counterparties’ credit risk differently impacting the fair value movements of thehedging instrument and the hedged item.
Cross currency swapWFC entered into a CCS agreement to hedge the variability in the cash flows of its USD loan arisingfrom foreign currency exchange rates and the variability in the interest cash flows arising from thefloating interest rate of the same USD loan attributable to the changes in six-month USD LIBOR (6mUSD LIBOR). The hedged risk is variability in the cash flows from the translation of its USD Loanamounting to $59.67 million due to fluctuations in USD/PHP FX rates (foreign currency risk) andvariability in the interest cash flows of the USD Loan attributable to changes in the 6m USD LIBOR(interest rate risk). The hedged items are the variability in the cash flows arising from the translationof the USD loan due to foreign currency risk and the interest cash flows on the USD Loan which isbased on 6m USD LIBOR + 0.75% (the Hedged Items). The hedging instrument is the CCS underwhich WFC will pay in peso equivalent to P=3.00 billion but will receive $59.67 million and paysfixed interest rate of 5.13% per annum on P=3.00 billion principal but will receive floating interest rateat 6m USD LIBOR plus 0.75% on $59.67 million over a period of 10 years or up to the maturity dateof June 25, 2027. The terms of the hedging relationships will end in June 2027. The effectiveness ofhedging relationship is tested prospectively and retrospectively. The designated hedging relationshipwas sufficiently effective as December 31, 2018 .
An economic relation between the hedged items and the hedging instrument was qualitatively testedby matching their critical terms. The hedged items create a foreign currency risk on the translation of$59.67 million loan and an exposure to pay 6m LIBOR +0.75%, settled semi-annually (interest raterisk). The hedging instrument creates an exact offset of these exposures with a consequence ofpaying a fixed interest payment of 5.13% per annum. Since the critical terms of the hedged items andthe hedging instrument matched, a clear economic relationship was established. WFC and thecounterparty’s credit risk were monitored for adverse changes. WFC assessed that the risk associatedwith them and the counterparty is considered minimal, at inception, and during the year and did notdominate the value changes that result from the economic relationship. Consistent with the hedgeratio per WFC’s risk management policy, the hedge ratio for hedge accounting purposes is 1:1 or100% since the notional amount of the CCS exactly matches the notional amount of the USD Loan.The hedge ineffectiveness can arise from the counterparties’ credit risk differently impacting the fairvalue movements of the hedging instrument and the hedged item.
The Group is holding the following hedging instruments designated as cash flow hedges as ofDecember 31, 2019 and 2018:
MaturityLess than3 months
3 to 6months
6 to 12months
1 to 2years
More than2 years Total
As at 31 December 2019Interest Rate Swap Fixed interest rate (%) 0.852% 0.852% 0.852% 0.852% 0.852% 0.852%
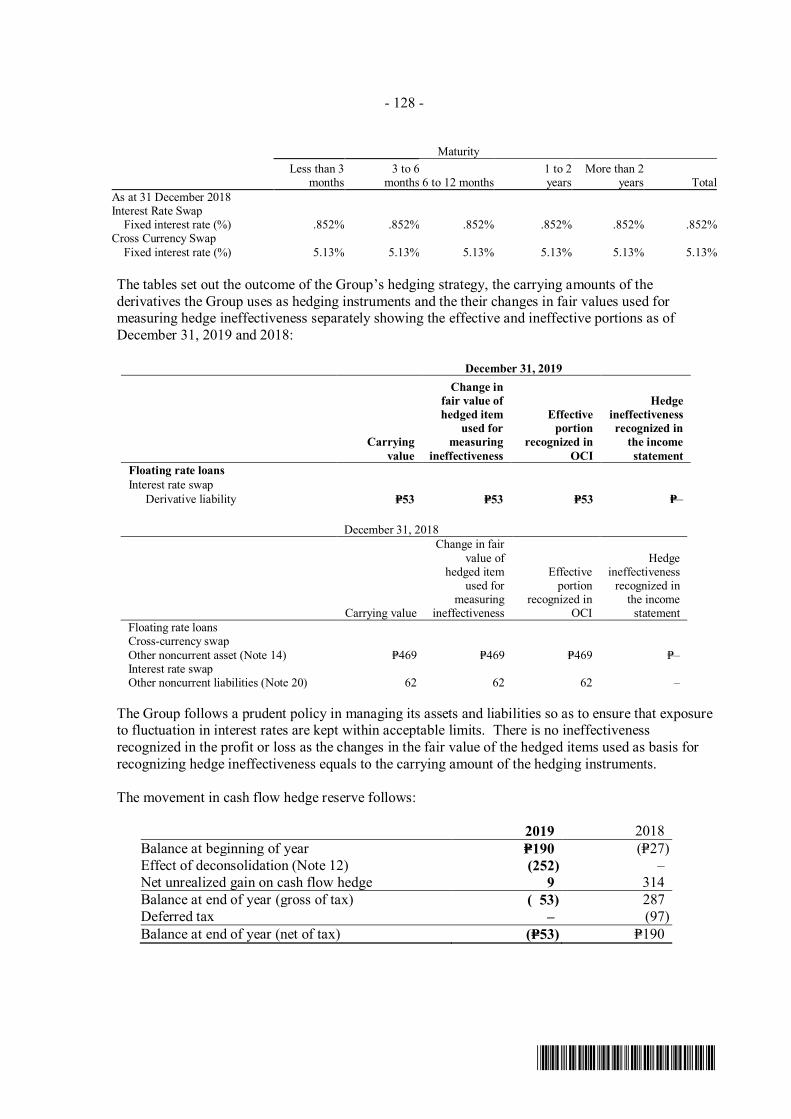
- 128 -
*SGVFSM000264*
MaturityLess than 3
months3 to 6
months 6 to 12 months1 to 2years
More than 2years Total
As at 31 December 2018Interest Rate Swap Fixed interest rate (%) .852% .852% .852% .852% .852% .852%Cross Currency Swap
Fixed interest rate (%) 5.13% 5.13% 5.13% 5.13% 5.13% 5.13%
The tables set out the outcome of the Group’s hedging strategy, the carrying amounts of thederivatives the Group uses as hedging instruments and the their changes in fair values used formeasuring hedge ineffectiveness separately showing the effective and ineffective portions as ofDecember 31, 2019 and 2018:
December 31, 2019
Carryingvalue
Change infair value ofhedged item
used formeasuring
ineffectiveness
Effectiveportion
recognized inOCI
Hedgeineffectivenessrecognized in
the incomestatement
Floating rate loansInterest rate swap
Derivative liability P=53 P=53 P=53 P=–
December 31, 2018
Carrying value
Change in fairvalue of
hedged itemused for
measuringineffectiveness
Effectiveportion
recognized inOCI
Hedgeineffectiveness
recognized inthe income
statementFloating rate loansCross-currency swapOther noncurrent asset (Note 14) P=469 P=469 P=469 P=–Interest rate swapOther noncurrent liabilities (Note 20) 62 62 62 –
The Group follows a prudent policy in managing its assets and liabilities so as to ensure that exposureto fluctuation in interest rates are kept within acceptable limits. There is no ineffectivenessrecognized in the profit or loss as the changes in the fair value of the hedged items used as basis forrecognizing hedge ineffectiveness equals to the carrying amount of the hedging instruments.
The movement in cash flow hedge reserve follows:
2019 2018Balance at beginning of year P=190 (P=27)Effect of deconsolidation (Note 12) (252) –Net unrealized gain on cash flow hedge 9 314Balance at end of year (gross of tax) ( 53) 287Deferred tax – (97)Balance at end of year (net of tax) (P=53) P=190
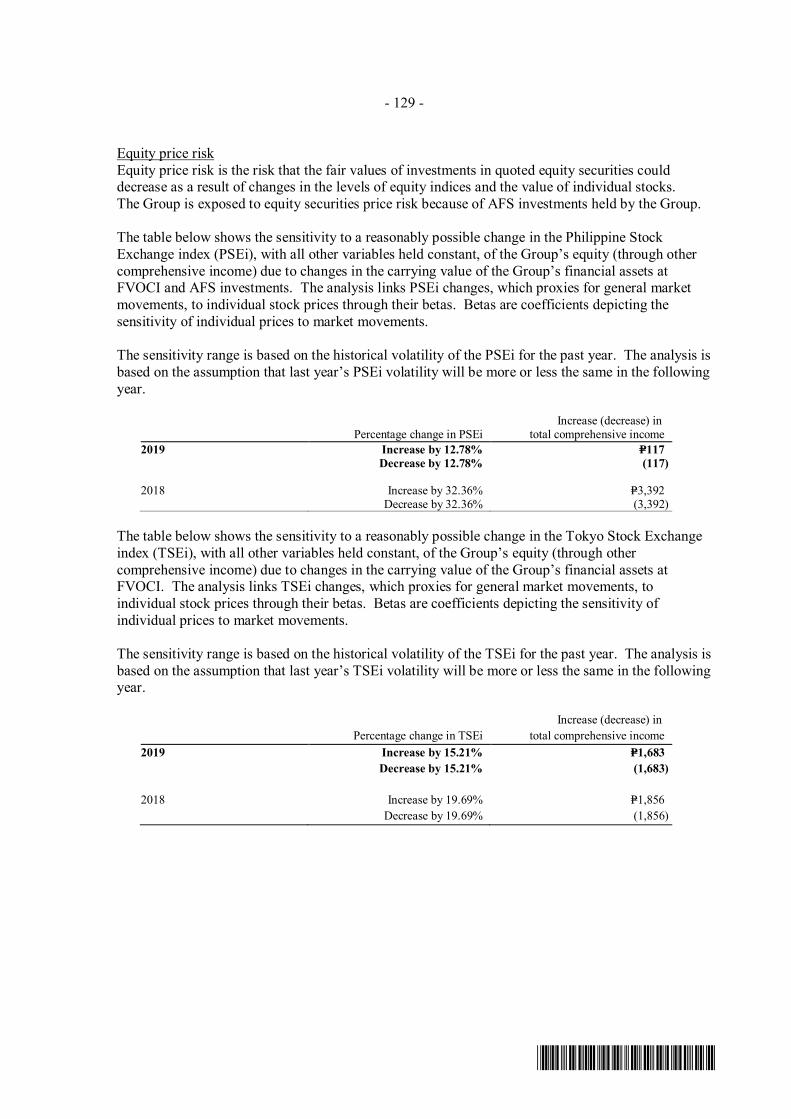
- 129 -
*SGVFSM000264*
Equity price riskEquity price risk is the risk that the fair values of investments in quoted equity securities coulddecrease as a result of changes in the levels of equity indices and the value of individual stocks.The Group is exposed to equity securities price risk because of AFS investments held by the Group.
The table below shows the sensitivity to a reasonably possible change in the Philippine StockExchange index (PSEi), with all other variables held constant, of the Group’s equity (through othercomprehensive income) due to changes in the carrying value of the Group’s financial assets atFVOCI and AFS investments. The analysis links PSEi changes, which proxies for general marketmovements, to individual stock prices through their betas. Betas are coefficients depicting thesensitivity of individual prices to market movements.
The sensitivity range is based on the historical volatility of the PSEi for the past year. The analysis isbased on the assumption that last year’s PSEi volatility will be more or less the same in the followingyear.
Percentage change in PSEiIncrease (decrease) in
total comprehensive income2019 Increase by 12.78% P=117
Decrease by 12.78% (117)
2018 Increase by 32.36% P=3,392Decrease by 32.36% (3,392)
The table below shows the sensitivity to a reasonably possible change in the Tokyo Stock Exchangeindex (TSEi), with all other variables held constant, of the Group’s equity (through othercomprehensive income) due to changes in the carrying value of the Group’s financial assets atFVOCI. The analysis links TSEi changes, which proxies for general market movements, toindividual stock prices through their betas. Betas are coefficients depicting the sensitivity ofindividual prices to market movements.
The sensitivity range is based on the historical volatility of the TSEi for the past year. The analysis isbased on the assumption that last year’s TSEi volatility will be more or less the same in the followingyear.
Percentage change in TSEiIncrease (decrease) in
total comprehensive income2019 Increase by 15.21% P=1,683
Decrease by 15.21% (1,683)
2018 Increase by 19.69% P=1,856Decrease by 19.69% (1,856)
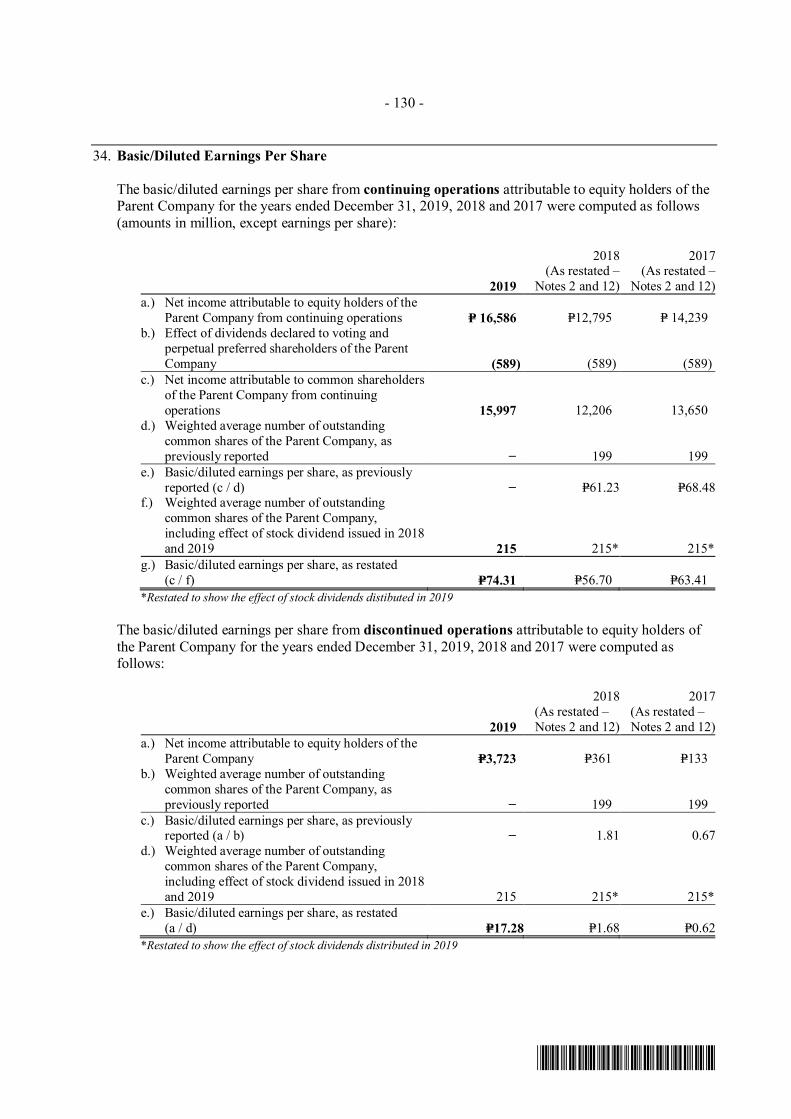
- 130 -
*SGVFSM000264*
34. Basic/Diluted Earnings Per Share
The basic/diluted earnings per share from continuing operations attributable to equity holders of theParent Company for the years ended December 31, 2019, 2018 and 2017 were computed as follows(amounts in million, except earnings per share):
2019
2018(As restated –
Notes 2 and 12)
2017(As restated –
Notes 2 and 12)a.) Net income attributable to equity holders of the
Parent Company from continuing operations P= 16,586 P=12,795 P= 14,239b.) Effect of dividends declared to voting and
perpetual preferred shareholders of the ParentCompany (589) (589) (589)
c.) Net income attributable to common shareholdersof the Parent Company from continuingoperations 15,997 12,206 13,650
d.) Weighted average number of outstandingcommon shares of the Parent Company, aspreviously reported − 199 199
e.) Basic/diluted earnings per share, as previouslyreported (c / d) − P=61.23 P=68.48
f.) Weighted average number of outstandingcommon shares of the Parent Company,including effect of stock dividend issued in 2018and 2019 215 215* 215*
g.) Basic/diluted earnings per share, as restated(c / f) P=74.31 P=56.70 P=63.41
*Restated to show the effect of stock dividends distibuted in 2019
The basic/diluted earnings per share from discontinued operations attributable to equity holders ofthe Parent Company for the years ended December 31, 2019, 2018 and 2017 were computed asfollows:
2019
2018(As restated –Notes 2 and 12)
2017(As restated –Notes 2 and 12)
a.) Net income attributable to equity holders of theParent Company P=3,723 P=361 P=133
b.) Weighted average number of outstandingcommon shares of the Parent Company, aspreviously reported − 199 199
c.) Basic/diluted earnings per share, as previouslyreported (a / b) − 1.81 0.67
d.) Weighted average number of outstandingcommon shares of the Parent Company,including effect of stock dividend issued in 2018and 2019 215 215* 215*
e.) Basic/diluted earnings per share, as restated(a / d) P=17.28 P=1.68 P=0.62
*Restated to show the effect of stock dividends distributed in 2019
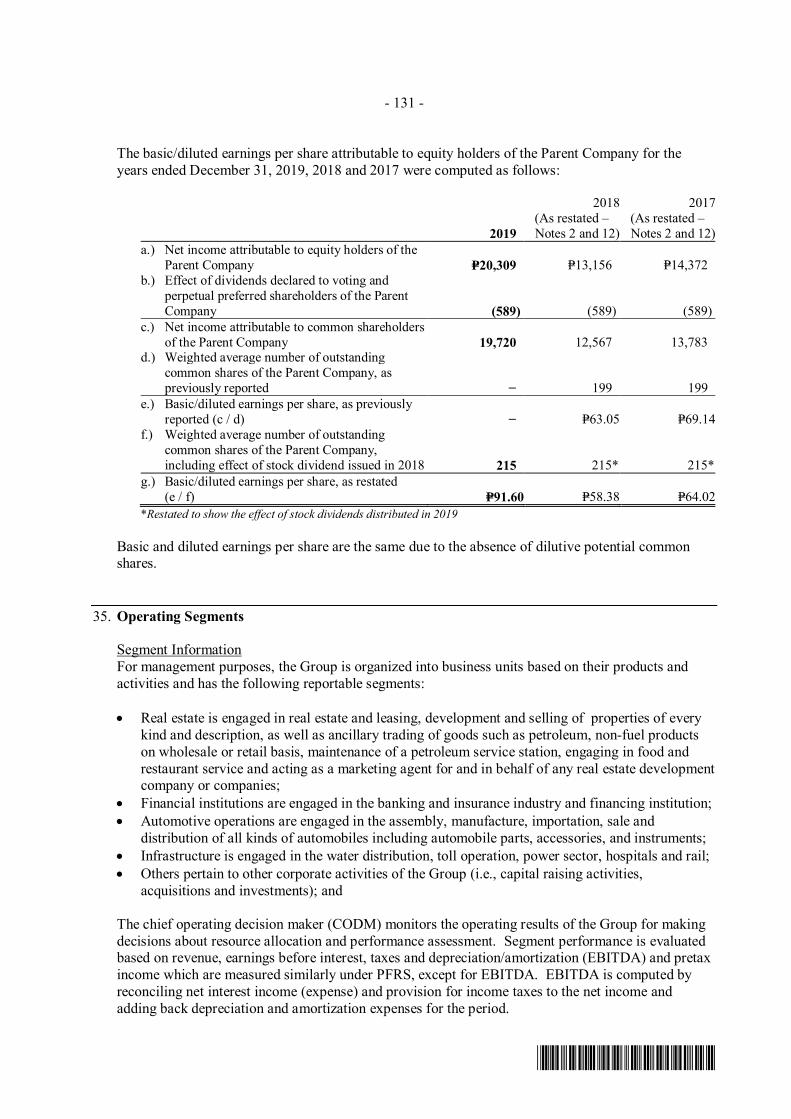
- 131 -
*SGVFSM000264*
The basic/diluted earnings per share attributable to equity holders of the Parent Company for theyears ended December 31, 2019, 2018 and 2017 were computed as follows:
2019
2018(As restated –Notes 2 and 12)
2017(As restated –Notes 2 and 12)
a.) Net income attributable to equity holders of theParent Company P=20,309 P=13,156 P=14,372
b.) Effect of dividends declared to voting andperpetual preferred shareholders of the ParentCompany (589) (589) (589)
c.) Net income attributable to common shareholdersof the Parent Company 19,720 12,567 13,783
d.) Weighted average number of outstandingcommon shares of the Parent Company, aspreviously reported − 199 199
e.) Basic/diluted earnings per share, as previouslyreported (c / d) − P=63.05 P=69.14
f.) Weighted average number of outstandingcommon shares of the Parent Company,including effect of stock dividend issued in 2018 215 215* 215*
g.) Basic/diluted earnings per share, as restated(e / f) P=91.60 P=58.38 P=64.02
*Restated to show the effect of stock dividends distributed in 2019
Basic and diluted earnings per share are the same due to the absence of dilutive potential commonshares.
35. Operating Segments
Segment InformationFor management purposes, the Group is organized into business units based on their products andactivities and has the following reportable segments:
· Real estate is engaged in real estate and leasing, development and selling of properties of everykind and description, as well as ancillary trading of goods such as petroleum, non-fuel productson wholesale or retail basis, maintenance of a petroleum service station, engaging in food andrestaurant service and acting as a marketing agent for and in behalf of any real estate developmentcompany or companies;
· Financial institutions are engaged in the banking and insurance industry and financing institution;· Automotive operations are engaged in the assembly, manufacture, importation, sale and
distribution of all kinds of automobiles including automobile parts, accessories, and instruments;· Infrastructure is engaged in the water distribution, toll operation, power sector, hospitals and rail;· Others pertain to other corporate activities of the Group (i.e., capital raising activities,
acquisitions and investments); and
The chief operating decision maker (CODM) monitors the operating results of the Group for makingdecisions about resource allocation and performance assessment. Segment performance is evaluatedbased on revenue, earnings before interest, taxes and depreciation/amortization (EBITDA) and pretaxincome which are measured similarly under PFRS, except for EBITDA. EBITDA is computed byreconciling net interest income (expense) and provision for income taxes to the net income andadding back depreciation and amortization expenses for the period.

- 132 -
*SGVFSM000264*
Segment AssetsSegment assets are resources owned by each of the operating segments that are employed in itsoperating activities.
Segment LiabilitiesSegment liabilities are obligations incurred by each of the operating segments from its operatingactivities.
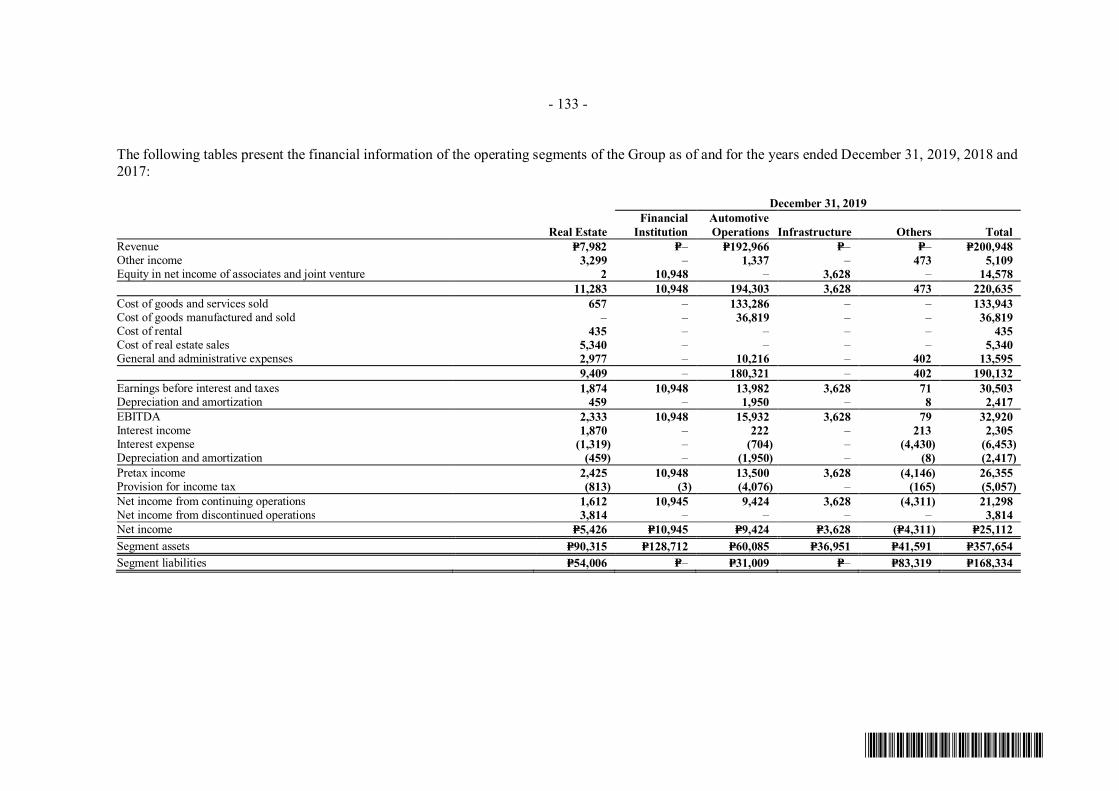
- 133 -
*SGVFSM000264*
The following tables present the financial information of the operating segments of the Group as of and for the years ended December 31, 2019, 2018 and2017:
December 31, 2019
Real EstateFinancial
InstitutionAutomotiveOperations Infrastructure Others Total
Revenue P=7,982 P=– P=192,966 P=– P=– P=200,948Other income 3,299 – 1,337 – 473 5,109Equity in net income of associates and joint venture 2 10,948 – 3,628 – 14,578
11,283 10,948 194,303 3,628 473 220,635Cost of goods and services sold 657 – 133,286 – – 133,943Cost of goods manufactured and sold – – 36,819 – – 36,819Cost of rental 435 – – – – 435Cost of real estate sales 5,340 – – – – 5,340General and administrative expenses 2,977 – 10,216 – 402 13,595
9,409 – 180,321 – 402 190,132Earnings before interest and taxes 1,874 10,948 13,982 3,628 71 30,503Depreciation and amortization 459 – 1,950 – 8 2,417EBITDA 2,333 10,948 15,932 3,628 79 32,920Interest income 1,870 – 222 – 213 2,305Interest expense (1,319) – (704) – (4,430) (6,453)Depreciation and amortization (459) – (1,950) – (8) (2,417)Pretax income 2,425 10,948 13,500 3,628 (4,146) 26,355Provision for income tax (813) (3) (4,076) – (165) (5,057)Net income from continuing operations 1,612 10,945 9,424 3,628 (4,311) 21,298Net income from discontinued operations 3,814 – – – – 3,814Net income P=5,426 P=10,945 P=9,424 P=3,628 (P=4,311) P=25,112Segment assets P=90,315 P=128,712 P=60,085 P=36,951 P=41,591 P=357,654Segment liabilities P=54,006 P=– P=31,009 P=– P=83,319 P=168,334
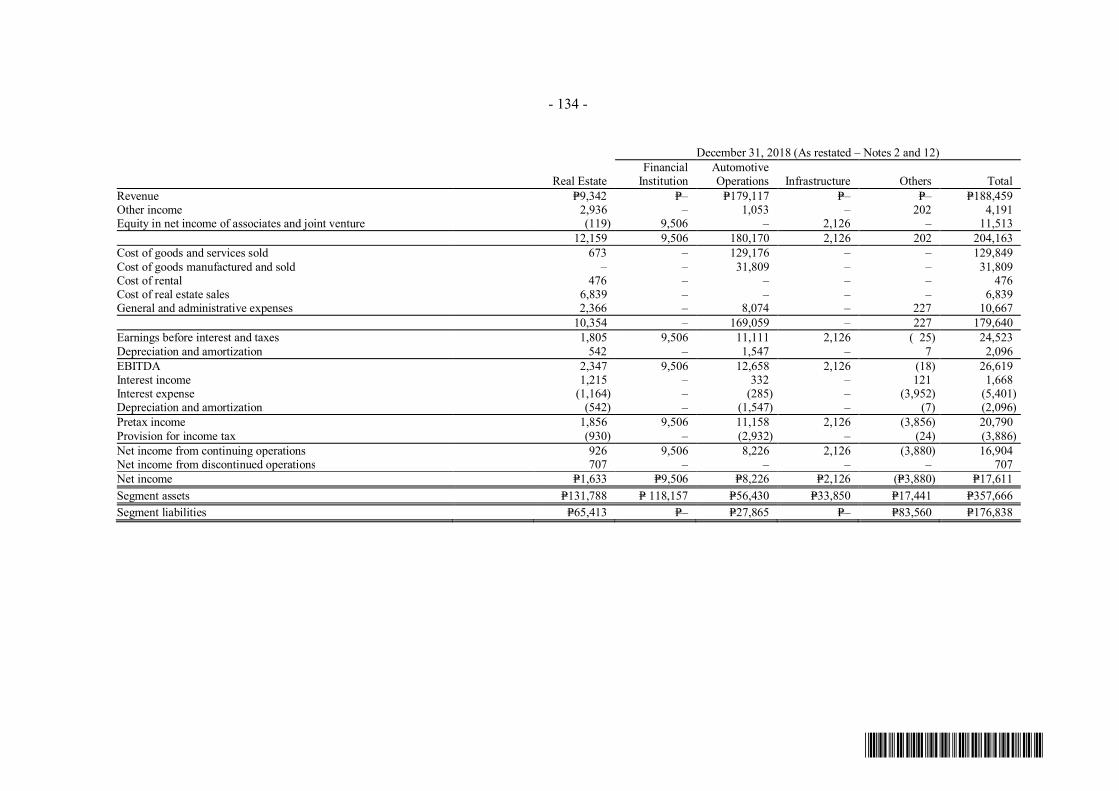
- 134 -
*SGVFSM000264*
December 31, 2018 (As restated – Notes 2 and 12)
Real EstateFinancial
InstitutionAutomotiveOperations Infrastructure Others Total
Revenue P=9,342 P=– P=179,117 P=– P=– P=188,459Other income 2,936 – 1,053 – 202 4,191Equity in net income of associates and joint venture (119) 9,506 – 2,126 – 11,513
12,159 9,506 180,170 2,126 202 204,163Cost of goods and services sold 673 – 129,176 – – 129,849Cost of goods manufactured and sold – – 31,809 – – 31,809Cost of rental 476 – – – – 476Cost of real estate sales 6,839 – – – – 6,839General and administrative expenses 2,366 – 8,074 – 227 10,667
10,354 – 169,059 – 227 179,640Earnings before interest and taxes 1,805 9,506 11,111 2,126 ( 25) 24,523Depreciation and amortization 542 – 1,547 – 7 2,096EBITDA 2,347 9,506 12,658 2,126 (18) 26,619Interest income 1,215 – 332 – 121 1,668Interest expense (1,164) – (285) – (3,952) (5,401)Depreciation and amortization (542) – (1,547) – (7) (2,096)Pretax income 1,856 9,506 11,158 2,126 (3,856) 20,790Provision for income tax (930) – (2,932) – (24) (3,886)Net income from continuing operations 926 9,506 8,226 2,126 (3,880) 16,904Net income from discontinued operations 707 – – – – 707Net income P=1,633 P=9,506 P=8,226 P=2,126 (P=3,880) P=17,611Segment assets P=131,788 P= 118,157 P=56,430 P=33,850 P=17,441 P=357,666Segment liabilities P=65,413 P=– P=27,865 P=– P=83,560 P=176,838

- 135 -
*SGVFSM000264*
December 31, 2017(As restated – Notes 2 and 12)
Real EstateFinancial
InstitutionAutomotiveOperations Infrastructure Others Total
Revenue P=7,753 P=– P=211,692 P=– P=– P=219,445Other income 2,006 – 1,068 – 5 3,079Equity in net income of associates and joint venture 134 6,979 – 1,560 – 8,673
9,893 6,979 212,760 1,560 5 231,197Cost of goods and services sold 555 – 147,158 – – 147,713Cost of goods manufactured and sold – – 39,635 – – 39,635Cost of rental 360 – – – – 360Cost of real estate sales 5,176 – – – – 5,176General and administrative expenses 1,850 – 8,262 – 268 10,380
7,941 – 195,055 – 268 203,264Earnings before interest and taxes 1,952 6,979 17,705 1,560 (263) 27,933Depreciation and amortization 476 – 1,283 – 6 1,765EBITDA 2,428 6,979 18,988 1,560 (257) 29,698Interest income 1,324 – 320 – 24 1,668Interest expense (736) – (189) – (2,611) (3,536)Depreciation and amortization (476) – (1,283) – (6) (1,765)Pretax income 2,540 6,979 17,836 1,560 (2,850) 26,065Provision for income tax (953) – (3,975) – (5) (4,933)Net income from continuing operations 1,587 6,979 13,861 1,560 (2,855) 21,132Net income from discontinued operations 278 – – – – 278Net incoe P=1,865 P=6,979 P=13,861 P=1,560 (P=2,855) P=21,410Segment assets P=123,817 P=85,771 P=61,835 P=32,365 P=2,240 P=306,028Segment liabilities P=56,745 P=– P=29,178 P=– P=47,578 P=133,501
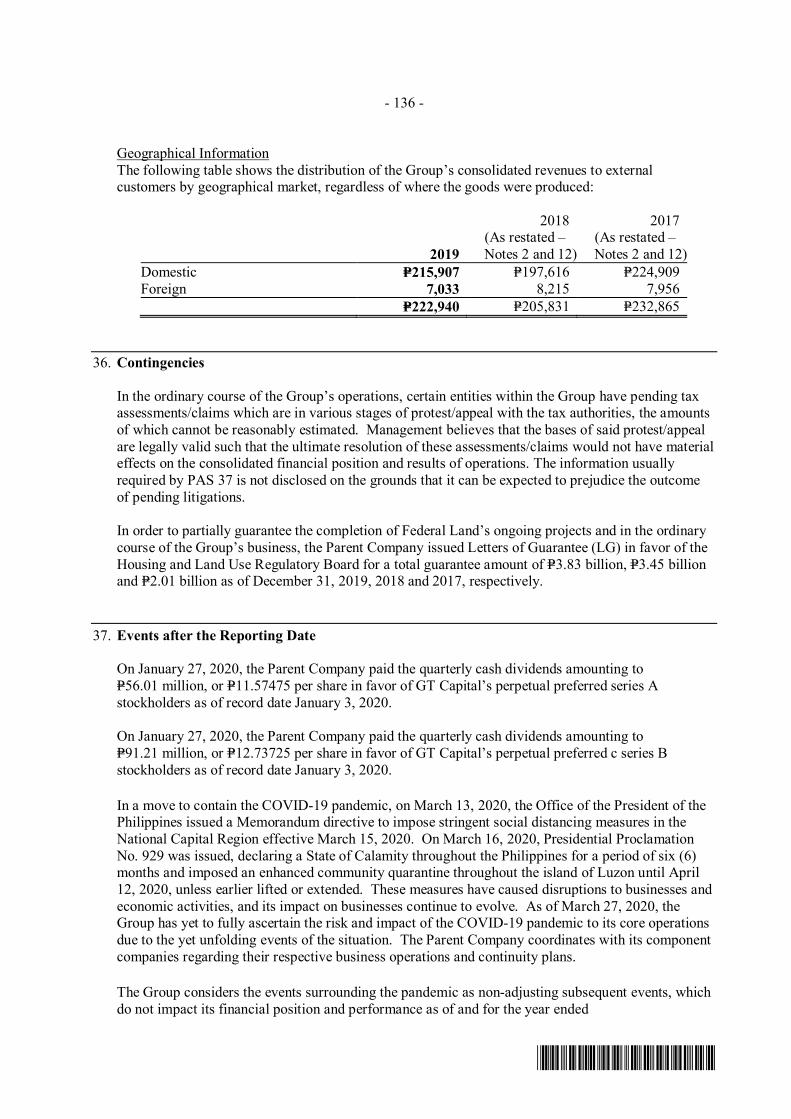
- 136 -
*SGVFSM000264*
Geographical InformationThe following table shows the distribution of the Group’s consolidated revenues to externalcustomers by geographical market, regardless of where the goods were produced:
2019
2018(As restated –Notes 2 and 12)
2017(As restated –Notes 2 and 12)
Domestic P=215,907 P=197,616 P=224,909Foreign 7,033 8,215 7,956
P=222,940 P=205,831 P=232,865
36. Contingencies
In the ordinary course of the Group’s operations, certain entities within the Group have pending taxassessments/claims which are in various stages of protest/appeal with the tax authorities, the amountsof which cannot be reasonably estimated. Management believes that the bases of said protest/appealare legally valid such that the ultimate resolution of these assessments/claims would not have materialeffects on the consolidated financial position and results of operations. The information usuallyrequired by PAS 37 is not disclosed on the grounds that it can be expected to prejudice the outcomeof pending litigations.
In order to partially guarantee the completion of Federal Land’s ongoing projects and in the ordinarycourse of the Group’s business, the Parent Company issued Letters of Guarantee (LG) in favor of theHousing and Land Use Regulatory Board for a total guarantee amount of P=3.83 billion, P=3.45 billionand P=2.01 billion as of December 31, 2019, 2018 and 2017, respectively.
37. Events after the Reporting Date
On January 27, 2020, the Parent Company paid the quarterly cash dividends amounting toP=56.01 million, or P=11.57475 per share in favor of GT Capital’s perpetual preferred series Astockholders as of record date January 3, 2020.
On January 27, 2020, the Parent Company paid the quarterly cash dividends amounting toP=91.21 million, or P=12.73725 per share in favor of GT Capital’s perpetual preferred c series Bstockholders as of record date January 3, 2020.
In a move to contain the COVID-19 pandemic, on March 13, 2020, the Office of the President of thePhilippines issued a Memorandum directive to impose stringent social distancing measures in theNational Capital Region effective March 15, 2020. On March 16, 2020, Presidential ProclamationNo. 929 was issued, declaring a State of Calamity throughout the Philippines for a period of six (6)months and imposed an enhanced community quarantine throughout the island of Luzon until April12, 2020, unless earlier lifted or extended. These measures have caused disruptions to businesses andeconomic activities, and its impact on businesses continue to evolve. As of March 27, 2020, theGroup has yet to fully ascertain the risk and impact of the COVID-19 pandemic to its core operationsdue to the yet unfolding events of the situation. The Parent Company coordinates with its componentcompanies regarding their respective business operations and continuity plans.
The Group considers the events surrounding the pandemic as non-adjusting subsequent events, whichdo not impact its financial position and performance as of and for the year ended
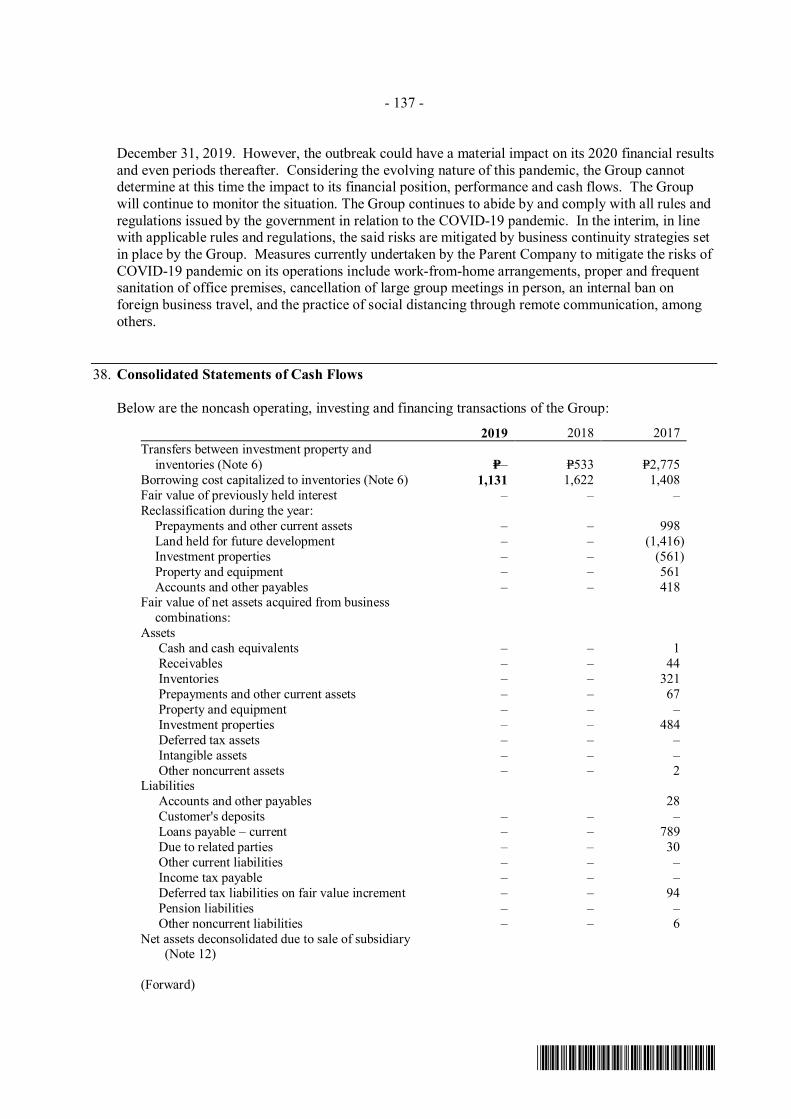
- 137 -
*SGVFSM000264*
December 31, 2019. However, the outbreak could have a material impact on its 2020 financial resultsand even periods thereafter. Considering the evolving nature of this pandemic, the Group cannotdetermine at this time the impact to its financial position, performance and cash flows. The Groupwill continue to monitor the situation. The Group continues to abide by and comply with all rules andregulations issued by the government in relation to the COVID-19 pandemic. In the interim, in linewith applicable rules and regulations, the said risks are mitigated by business continuity strategies setin place by the Group. Measures currently undertaken by the Parent Company to mitigate the risks ofCOVID-19 pandemic on its operations include work-from-home arrangements, proper and frequentsanitation of office premises, cancellation of large group meetings in person, an internal ban onforeign business travel, and the practice of social distancing through remote communication, amongothers.
38. Consolidated Statements of Cash Flows
Below are the noncash operating, investing and financing transactions of the Group:
2019 2018 2017Transfers between investment property and
inventories (Note 6) P=– P=533 P=2,775Borrowing cost capitalized to inventories (Note 6) 1,131 1,622 1,408Fair value of previously held interest – – –Reclassification during the year: Prepayments and other current assets – – 998 Land held for future development – – (1,416) Investment properties – – (561) Property and equipment – – 561 Accounts and other payables – – 418Fair value of net assets acquired from business
combinations:Assets
Cash and cash equivalents – – 1Receivables – – 44Inventories – – 321Prepayments and other current assets – – 67Property and equipment – – –Investment properties – – 484Deferred tax assets – – –Intangible assets – – –Other noncurrent assets – – 2
LiabilitiesAccounts and other payables 28Customer's deposits – – –Loans payable – current – – 789Due to related parties – – 30Other current liabilities – – –Income tax payable – – –Deferred tax liabilities on fair value increment – – 94Pension liabilities – – –Other noncurrent liabilities – – 6
Net assets deconsolidated due to sale of subsidiary(Note 12)
(Forward)
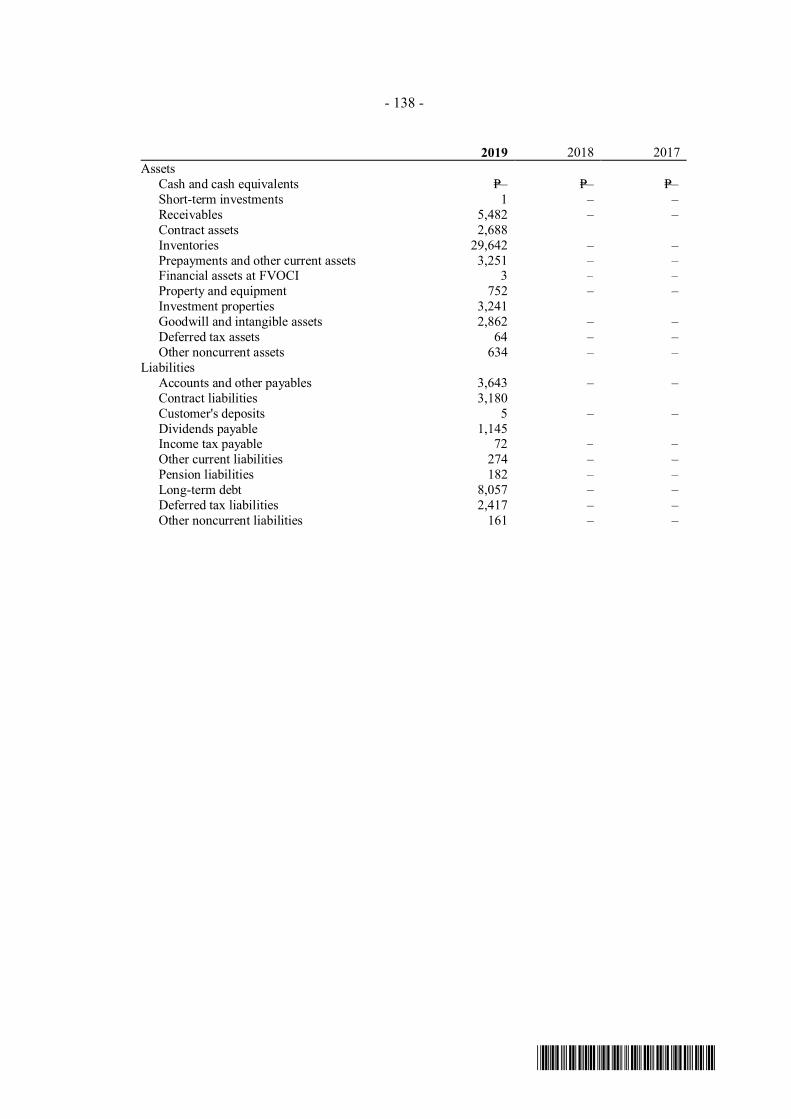
- 138 -
*SGVFSM000264*
2019 2018 2017Assets
Cash and cash equivalents P=– P=– P=–Short-term investments 1 – –Receivables 5,482 – –Contract assets 2,688Inventories 29,642 – –Prepayments and other current assets 3,251 – –Financial assets at FVOCI 3 – –Property and equipment 752 – –Investment properties 3,241Goodwill and intangible assets 2,862 – –Deferred tax assets 64 – –Other noncurrent assets 634 – –
LiabilitiesAccounts and other payables 3,643 – –Contract liabilities 3,180Customer's deposits 5 – –Dividends payable 1,145Income tax payable 72 – –Other current liabilities 274 – –Pension liabilities 182 – –Long-term debt 8,057 – –Deferred tax liabilities 2,417 – –Other noncurrent liabilities 161 – –
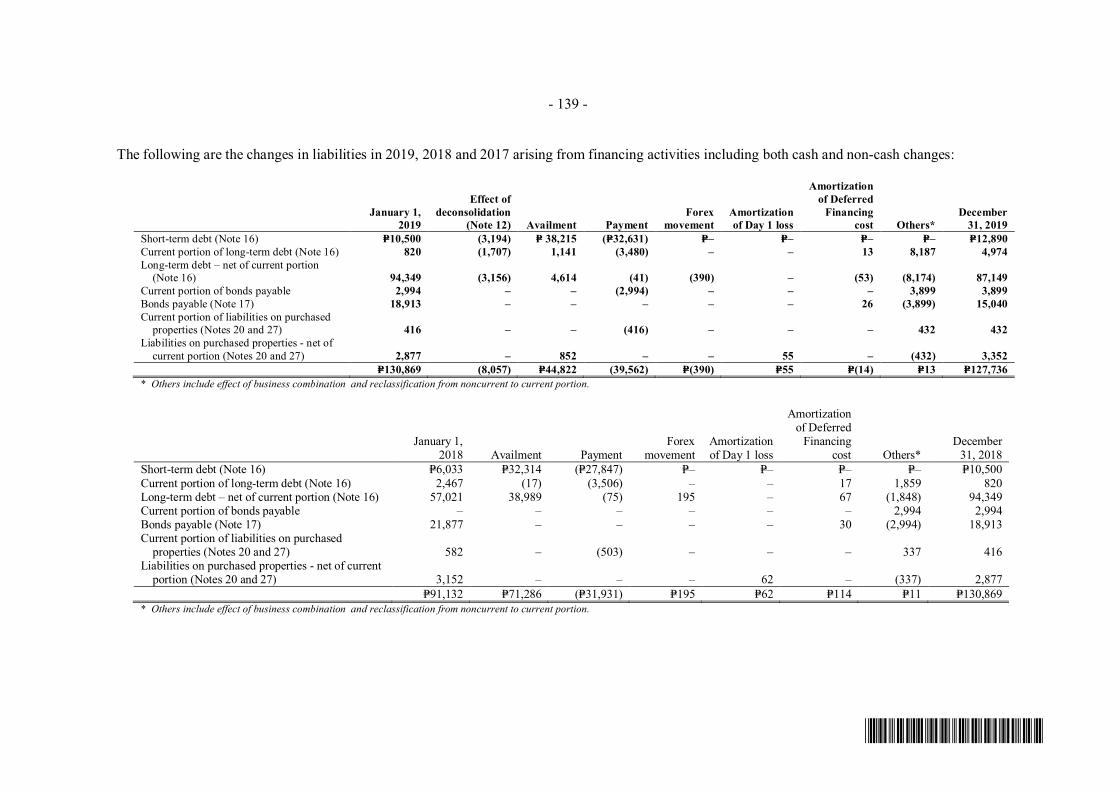
- 139 -
*SGVFSM000264*
The following are the changes in liabilities in 2019, 2018 and 2017 arising from financing activities including both cash and non-cash changes:
January 1,2019
Effect ofdeconsolidation
(Note 12) Availment PaymentForex
movementAmortizationof Day 1 loss
Amortizationof Deferred
Financingcost Others*
December31, 2019
Short-term debt (Note 16) P=10,500 (3,194) P= 38,215 (P=32,631) P=– P=– P=– P=– P=12,890Current portion of long-term debt (Note 16) 820 (1,707) 1,141 (3,480) – – 13 8,187 4,974Long-term debt – net of current portion
(Note 16) 94,349 (3,156) 4,614 (41) (390) – (53) (8,174) 87,149Current portion of bonds payable 2,994 – – (2,994) – – – 3,899 3,899Bonds payable (Note 17) 18,913 – – – – – 26 (3,899) 15,040Current portion of liabilities on purchased
properties (Notes 20 and 27) 416 – – (416) – – – 432 432Liabilities on purchased properties - net of
current portion (Notes 20 and 27) 2,877 – 852 – – 55 – (432) 3,352P=130,869 (8,057) P=44,822 (39,562) P=(390) P=55 P=(14) P=13 P=127,736
* Others include effect of business combination and reclassification from noncurrent to current portion.
January 1,2018 Availment Payment
Forexmovement
Amortizationof Day 1 loss
Amortizationof Deferred
Financingcost Others*
December31, 2018
Short-term debt (Note 16) P=6,033 P=32,314 (P=27,847) P=– P=– P=– P=– P=10,500Current portion of long-term debt (Note 16) 2,467 (17) (3,506) – – 17 1,859 820Long-term debt – net of current portion (Note 16) 57,021 38,989 (75) 195 – 67 (1,848) 94,349Current portion of bonds payable – – – – – – 2,994 2,994Bonds payable (Note 17) 21,877 – – – – 30 (2,994) 18,913Current portion of liabilities on purchased
properties (Notes 20 and 27) 582 – (503) – – – 337 416Liabilities on purchased properties - net of current
portion (Notes 20 and 27) 3,152 – – – 62 – (337) 2,877P=91,132 P=71,286 (P=31,931) P=195 P=62 P=114 P=11 P=130,869
* Others include effect of business combination and reclassification from noncurrent to current portion.
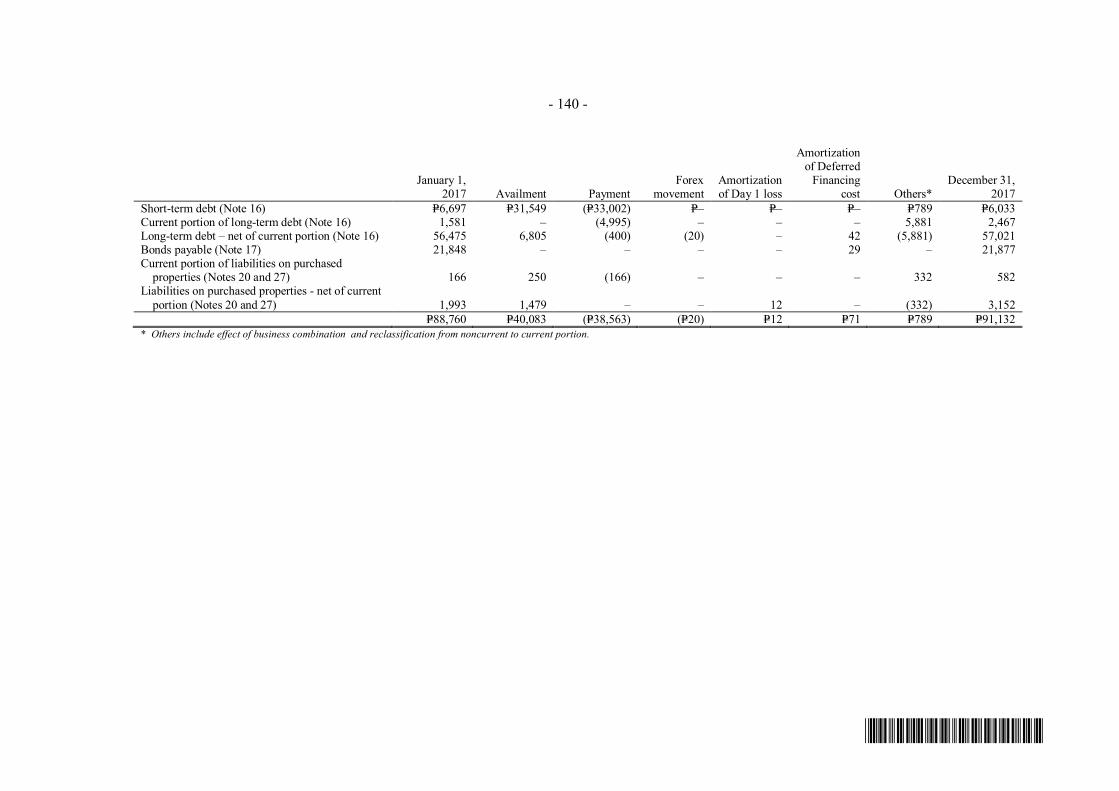
- 140 -
*SGVFSM000264*
January 1,2017 Availment Payment
Forexmovement
Amortizationof Day 1 loss
Amortizationof Deferred
Financingcost Others*
December 31,2017
Short-term debt (Note 16) P=6,697 P=31,549 (P=33,002) P=– P=– P=– P=789 P=6,033Current portion of long-term debt (Note 16) 1,581 – (4,995) – – – 5,881 2,467Long-term debt – net of current portion (Note 16) 56,475 6,805 (400) (20) – 42 (5,881) 57,021Bonds payable (Note 17) 21,848 – – – – 29 – 21,877Current portion of liabilities on purchased
properties (Notes 20 and 27) 166 250 (166) – – – 332 582Liabilities on purchased properties - net of current
portion (Notes 20 and 27) 1,993 1,479 – – 12 – (332) 3,152P=88,760 P=40,083 (P=38,563) (P=20) P=12 P=71 P=789 P=91,132
* Others include effect of business combination and reclassification from noncurrent to current portion.

- 141 -
*SGVFSM000264*
39. Approval for the Release of the Financial Statements
The accompanying financial statements of the Group were approved and authorized for issue by theParent Company’s BOD on March 27, 2020.
*SGVFSM000264*
INDEPENDENT AUDITOR’S REPORTON SUPPLEMENTARY SCHEDULES
The Stockholders and the Board of DirectorsGT Capital Holdings, Inc.43rd Floor, GT Tower InternationalAyala Avenue corner H.V. Dela Costa St.Makati City
We have audited in accordance with Philippine Standards on Auditing, the consolidated financialstatements of GT Capital Holdings, Inc. and Subsidiaries (the Group) as at December 31, 2019 and 2018and for each of the three years in the period ended December 31, 2019 included in this Form 17-A andhave issued our report thereon dated March 27, 2020. Our audits were made for the purpose of formingan opinion on the basic financial statements taken as a whole The schedules listed in the Index to theFinancial Statements and Supplementary Schedules are the responsibility of the Company’s management.These schedules are presented for purposes of complying with the Revised Securities Regulation CodeRule 68, and are not part of the basic financial statements. These schedules have been subjected to theauditing procedures applied in the audit of the basic financial statements and, in our opinion, fairly state,in all material respects, the financial information required to be set forth therein in relation to the basicfinancial statements taken as a whole.
SYCIP GORRES VELAYO & CO.
Miguel U. Ballelos, Jr.PartnerCPA Certificate No. 109950SEC Accreditation No. 1566-AR-1 (Group A), April 3, 2019, valid until April 2, 2022Tax Identification No. 241-031-088BIR Accreditation No. 08-001998-114-2019, January 28, 2019, valid until January 27, 2022PTR No. 8125210, January 7, 2020, Makati City
March 27, 2020
SyCip Gorres Velayo & Co.6760 Ayala Avenue1226 Makati CityPhilippines
Tel: (632) 891 0307Fax: (632) 819 0872ey.com/ph
BOA/PRC Reg. No. 0001, October 4, 2018, valid until August 24, 2021SEC Accreditation No. 0012-FR-5 (Group A), November 6, 2018, valid until November 5, 2021
A member firm of Ernst & Young Global Limited
*SGVFSM000264*
INDEPENDENT AUDITOR’S REPORTCOMPONENTS OF FINANCIAL SOUNDNESS INDICATORS
The Stockholders and the Board of DirectorsGT Capital Holdings, Inc.43rd Floor, GT Tower InternationalAyala Avenue corner H.V. Dela Costa St.Makati City
We have audited in accordance with Philippine Standards on Auditing, the financial statements ofGT Capital Holdings, Inc. and Subsidiaries (the Group) as at December 31, 2019 and 2018 and for eachof the three years in the period ended December 31, 2019, and have issued our report thereon datedMarch 27, 2020. Our audits were made for the purpose of forming an opinion on the basic financialstatements taken as a whole. The Supplementary Schedule on Financial Soundness Indicators, includingtheir definitions, formulas, calculation, and their appropriateness or usefulness to the intended users, arethe responsibility of the Company’s management. These financial soundness indicators are not measuresof operating performance defined by Philippine Financial Reporting Standards (PFRS) and may not becomparable to similarly titled measures presented by other companies. This schedule is presented for thepurpose of complying with the Revised Securities Regulation Code Rule 68 issued by the Securities andExchange Commission, and is not a required part of the basic financial statements prepared in accordancewith PFRS. The components of these financial soundness indicators have been traced to the Company’sfinancial statements as at December 31, 2019 and 2018 and for each of the three years in the period endedDecember 31, 2019 and no material exceptions were noted.
SYCIP GORRES VELAYO & CO.
Miguel U. Ballelos, Jr.PartnerCPA Certificate No. 109950SEC Accreditation No. 1566-AR-1 (Group A), April 3, 2019, valid until April 2, 2022Tax Identification No. 241-031-088BIR Accreditation No. 08-001998-114-2019, January 28, 2019, valid until January 27, 2022PTR No. 8125210, January 7, 2020, Makati City
March 27, 2020
SyCip Gorres Velayo & Co.6760 Ayala Avenue1226 Makati CityPhilippines
Tel: (632) 891 0307Fax: (632) 819 0872ey.com/ph
BOA/PRC Reg. No. 0001, October 4, 2018, valid until August 24, 2021SEC Accreditation No. 0012-FR-5 (Group A), November 6, 2018, valid until November 5, 2021
A member firm of Ernst & Young Global Limited
GT CAPITAL HOLDINGS, INC. AND SUBSIDIARIESINDEX TO THE CONSOLIDATED FINANCIAL STATEMENTSAND SUPPLEMENTARY SCHEDULESDECEMBER 31, 2019
Reconciliation of Retained Earnings Available for Dividend Declaration Schedule IList of Effective Standards and Interpretations under the Philippine Financial
Reporting Standards (PFRS) as of December 31, 2019 Schedule IISupplementary Schedules Required by Annex 68-E Schedule IIIMap of Relationship between and among the Parent Company and its Ultimate
Parent, Subsidiaries, Associates and Joint ventures Schedule IVSchedule of Financial Soundness Indicators Schedule V
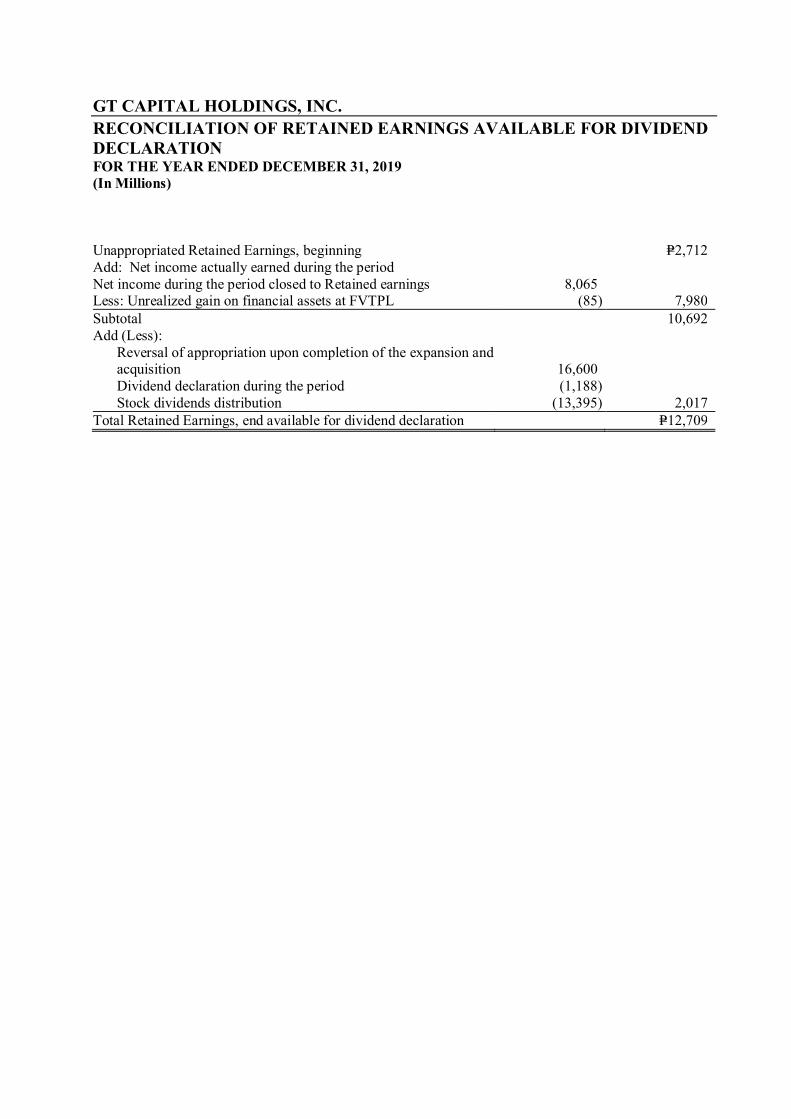
GT CAPITAL HOLDINGS, INC.RECONCILIATION OF RETAINED EARNINGS AVAILABLE FOR DIVIDENDDECLARATIONFOR THE YEAR ENDED DECEMBER 31, 2019(In Millions)
Unappropriated Retained Earnings, beginning P=2,712Add: Net income actually earned during the periodNet income during the period closed to Retained earnings 8,065Less: Unrealized gain on financial assets at FVTPL (85) 7,980Subtotal 10,692Add (Less):
Reversal of appropriation upon completion of the expansion andacquisition 16,600
Dividend declaration during the period (1,188) Stock dividends distribution (13,395) 2,017Total Retained Earnings, end available for dividend declaration P=12,709
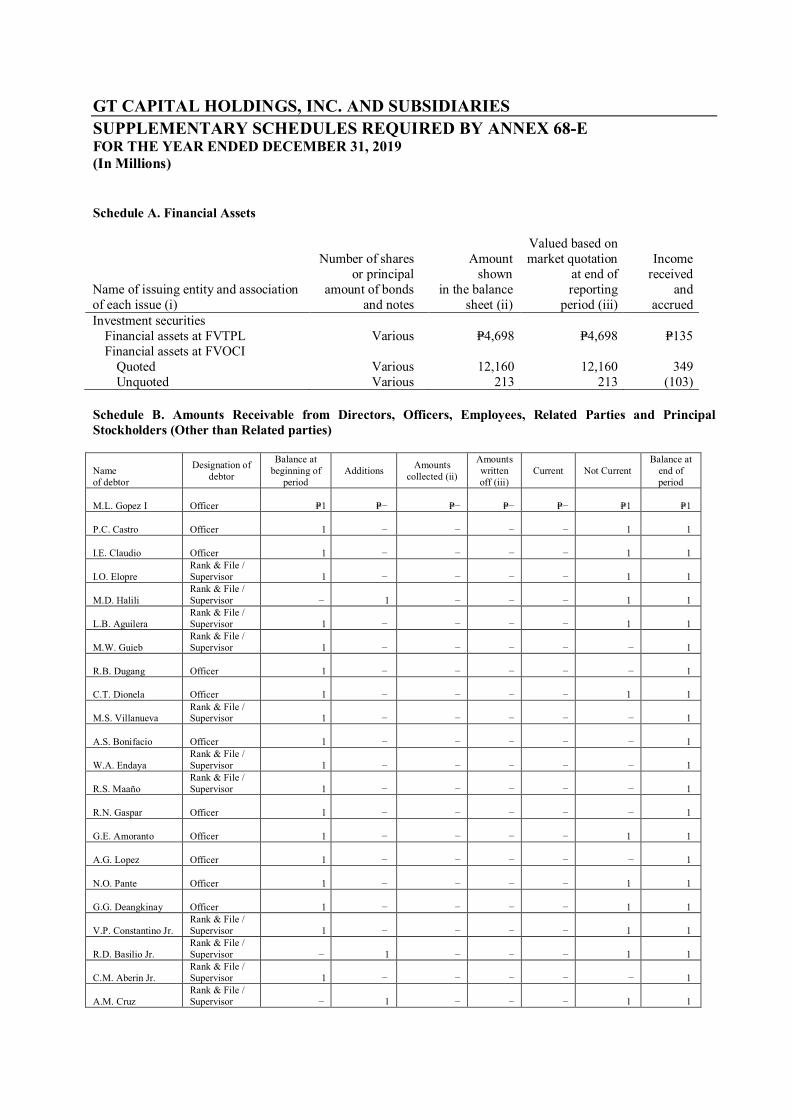
GT CAPITAL HOLDINGS, INC. AND SUBSIDIARIESSUPPLEMENTARY SCHEDULES REQUIRED BY ANNEX 68-EFOR THE YEAR ENDED DECEMBER 31, 2019(In Millions)
Schedule A. Financial Assets
Name of issuing entity and associationof each issue (i)
Number of sharesor principal
amount of bondsand notes
Amountshown
in the balancesheet (ii)
Valued based onmarket quotation
at end ofreporting
period (iii)
Incomereceived
andaccrued
Investment securitiesFinancial assets at FVTPL Various P=4,698 P=4,698 P=135Financial assets at FVOCI Quoted Various 12,160 12,160 349 Unquoted Various 213 213 (103)
Schedule B. Amounts Receivable from Directors, Officers, Employees, Related Parties and PrincipalStockholders (Other than Related parties)
Nameof debtor
Designation ofdebtor
Balance atbeginning of
periodAdditions Amounts
collected (ii)
Amountswrittenoff (iii)
Current Not CurrentBalance at
end ofperiod
M.L. Gopez I Officer P=1 P=− P=− P=− P=− P=1 P=1
P.C. Castro Officer 1 − − − − 1 1
I.E. Claudio Officer 1 − − − − 1 1
I.O. ElopreRank & File /Supervisor 1 − − − − 1 1
M.D. HaliliRank & File /Supervisor − 1 − − − 1 1
L.B. AguileraRank & File /Supervisor 1 − − − − 1 1
M.W. GuiebRank & File /Supervisor 1 − − − − − 1
R.B. Dugang Officer 1 − − − − − 1
C.T. Dionela Officer 1 − − − − 1 1
M.S. VillanuevaRank & File /Supervisor 1 − − − − − 1
A.S. Bonifacio Officer 1 − − − − − 1
W.A. EndayaRank & File /Supervisor 1 − − − − − 1
R.S. MaañoRank & File /Supervisor 1 − − − − − 1
R.N. Gaspar Officer 1 − − − − − 1
G.E. Amoranto Officer 1 − − − − 1 1
A.G. Lopez Officer 1 − − − − − 1
N.O. Pante Officer 1 − − − − 1 1
G.G. Deangkinay Officer 1 − − − − 1 1
V.P. Constantino Jr.Rank & File /Supervisor 1 − − − − 1 1
R.D. Basilio Jr.Rank & File /Supervisor − 1 − − − 1 1
C.M. Aberin Jr.Rank & File /Supervisor 1 − − − − − 1
A.M. CruzRank & File /Supervisor − 1 − − − 1 1
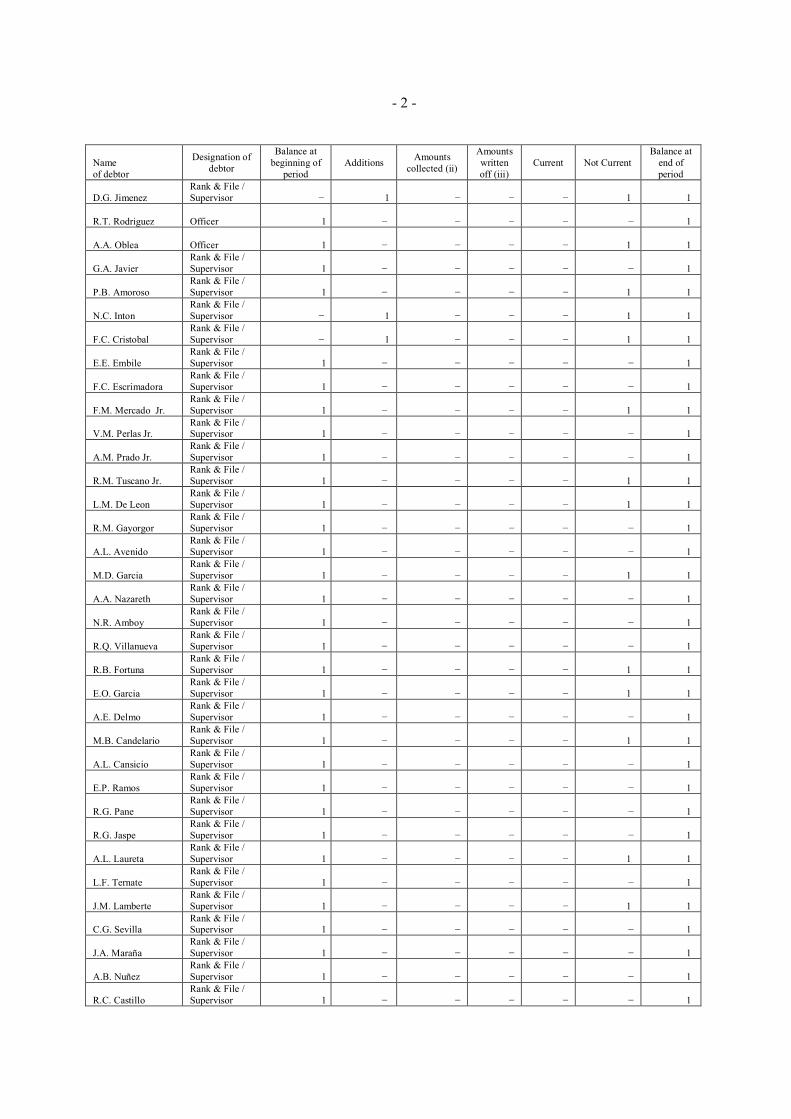
- 2 -
Nameof debtor
Designation ofdebtor
Balance atbeginning of
periodAdditions Amounts
collected (ii)
Amountswrittenoff (iii)
Current Not CurrentBalance at
end ofperiod
D.G. JimenezRank & File /Supervisor − 1 − − − 1 1
R.T. Rodriguez Officer 1 − − − − − 1
A.A. Oblea Officer 1 − − − − 1 1
G.A. JavierRank & File /Supervisor 1 − − − − − 1
P.B. AmorosoRank & File /Supervisor 1 − − − − 1 1
N.C. IntonRank & File /Supervisor − 1 − − − 1 1
F.C. CristobalRank & File /Supervisor − 1 − − − 1 1
E.E. EmbileRank & File /Supervisor 1 − − − − − 1
F.C. EscrimadoraRank & File /Supervisor 1 − − − − − 1
F.M. Mercado Jr.Rank & File /Supervisor 1 − − − − 1 1
V.M. Perlas Jr.Rank & File /Supervisor 1 − − − − − 1
A.M. Prado Jr.Rank & File /Supervisor 1 − − − − − 1
R.M. Tuscano Jr.Rank & File /Supervisor 1 − − − − 1 1
L.M. De LeonRank & File /Supervisor 1 − − − − 1 1
R.M. GayorgorRank & File /Supervisor 1 − − − − − 1
A.L. AvenidoRank & File /Supervisor 1 − − − − − 1
M.D. GarciaRank & File /Supervisor 1 − − − − 1 1
A.A. NazarethRank & File /Supervisor 1 − − − − − 1
N.R. AmboyRank & File /Supervisor 1 − − − − − 1
R.Q. VillanuevaRank & File /Supervisor 1 − − − − − 1
R.B. FortunaRank & File /Supervisor 1 − − − − 1 1
E.O. GarciaRank & File /Supervisor 1 − − − − 1 1
A.E. DelmoRank & File /Supervisor 1 − − − − − 1
M.B. CandelarioRank & File /Supervisor 1 − − − − 1 1
A.L. CansicioRank & File /Supervisor 1 − − − − − 1
E.P. RamosRank & File /Supervisor 1 − − − − − 1
R.G. PaneRank & File /Supervisor 1 − − − − − 1
R.G. JaspeRank & File /Supervisor 1 − − − − − 1
A.L. LauretaRank & File /Supervisor 1 − − − − 1 1
L.F. TernateRank & File /Supervisor 1 − − − − − 1
J.M. LamberteRank & File /Supervisor 1 − − − − 1 1
C.G. SevillaRank & File /Supervisor 1 − − − − − 1
J.A. MarañaRank & File /Supervisor 1 − − − − − 1
A.B. NuñezRank & File /Supervisor 1 − − − − − 1
R.C. CastilloRank & File /Supervisor 1 − − − − − 1
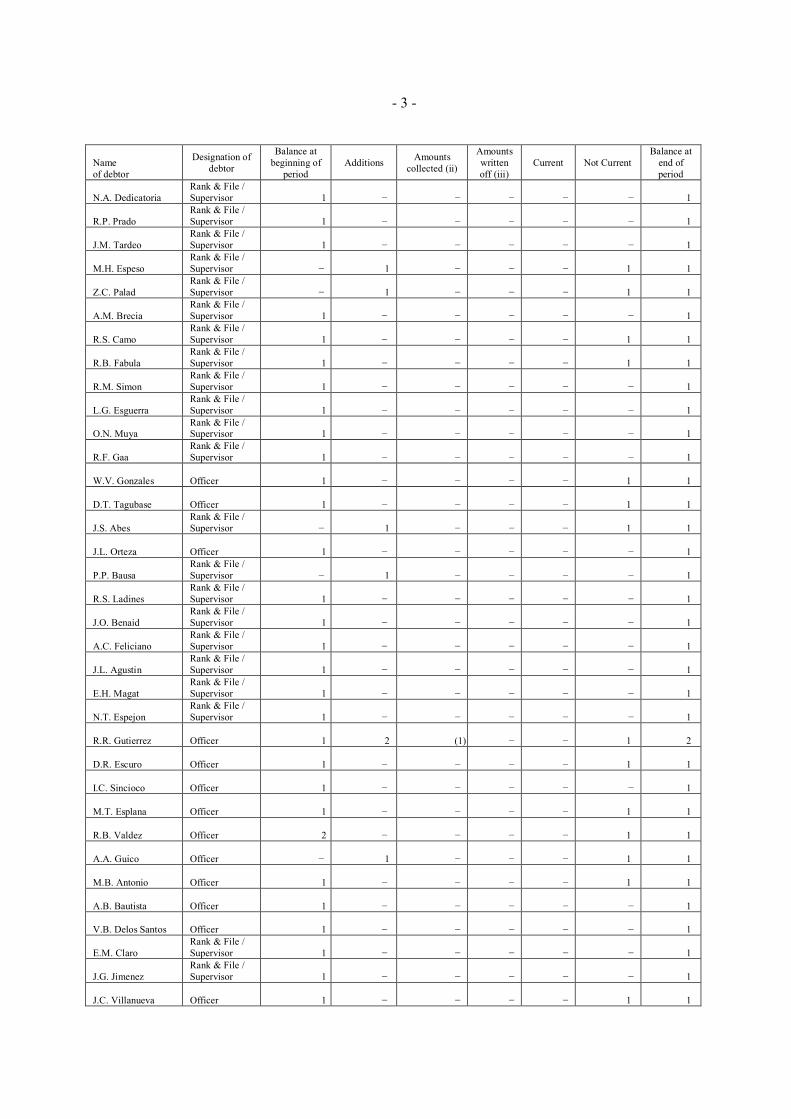
- 3 -
Nameof debtor
Designation ofdebtor
Balance atbeginning of
periodAdditions Amounts
collected (ii)
Amountswrittenoff (iii)
Current Not CurrentBalance at
end ofperiod
N.A. DedicatoriaRank & File /Supervisor 1 − − − − − 1
R.P. PradoRank & File /Supervisor 1 − − − − − 1
J.M. TardeoRank & File /Supervisor 1 − − − − − 1
M.H. EspesoRank & File /Supervisor − 1 − − − 1 1
Z.C. PaladRank & File /Supervisor − 1 − − − 1 1
A.M. BreciaRank & File /Supervisor 1 − − − − − 1
R.S. CamoRank & File /Supervisor 1 − − − − 1 1
R.B. FabulaRank & File /Supervisor 1 − − − − 1 1
R.M. SimonRank & File /Supervisor 1 − − − − − 1
L.G. EsguerraRank & File /Supervisor 1 − − − − − 1
O.N. MuyaRank & File /Supervisor 1 − − − − − 1
R.F. GaaRank & File /Supervisor 1 − − − − − 1
W.V. Gonzales Officer 1 − − − − 1 1
D.T. Tagubase Officer 1 − − − − 1 1
J.S. AbesRank & File /Supervisor − 1 − − − 1 1
J.L. Orteza Officer 1 − − − − − 1
P.P. BausaRank & File /Supervisor − 1 − − − − 1
R.S. LadinesRank & File /Supervisor 1 − − − − − 1
J.O. BenaidRank & File /Supervisor 1 − − − − − 1
A.C. FelicianoRank & File /Supervisor 1 − − − − − 1
J.L. AgustinRank & File /Supervisor 1 − − − − − 1
E.H. MagatRank & File /Supervisor 1 − − − − − 1
N.T. EspejonRank & File /Supervisor 1 − − − − − 1
R.R. Gutierrez Officer 1 2 (1) − − 1 2
D.R. Escuro Officer 1 − − − − 1 1
I.C. Sincioco Officer 1 − − − − − 1
M.T. Esplana Officer 1 − − − − 1 1
R.B. Valdez Officer 2 − − − − 1 1
A.A. Guico Officer − 1 − − − 1 1
M.B. Antonio Officer 1 − − − − 1 1
A.B. Bautista Officer 1 − − − − − 1
V.B. Delos Santos Officer 1 − − − − − 1
E.M. ClaroRank & File /Supervisor 1 − − − − − 1
J.G. JimenezRank & File /Supervisor 1 − − − − − 1
J.C. Villanueva Officer 1 − − − − 1 1
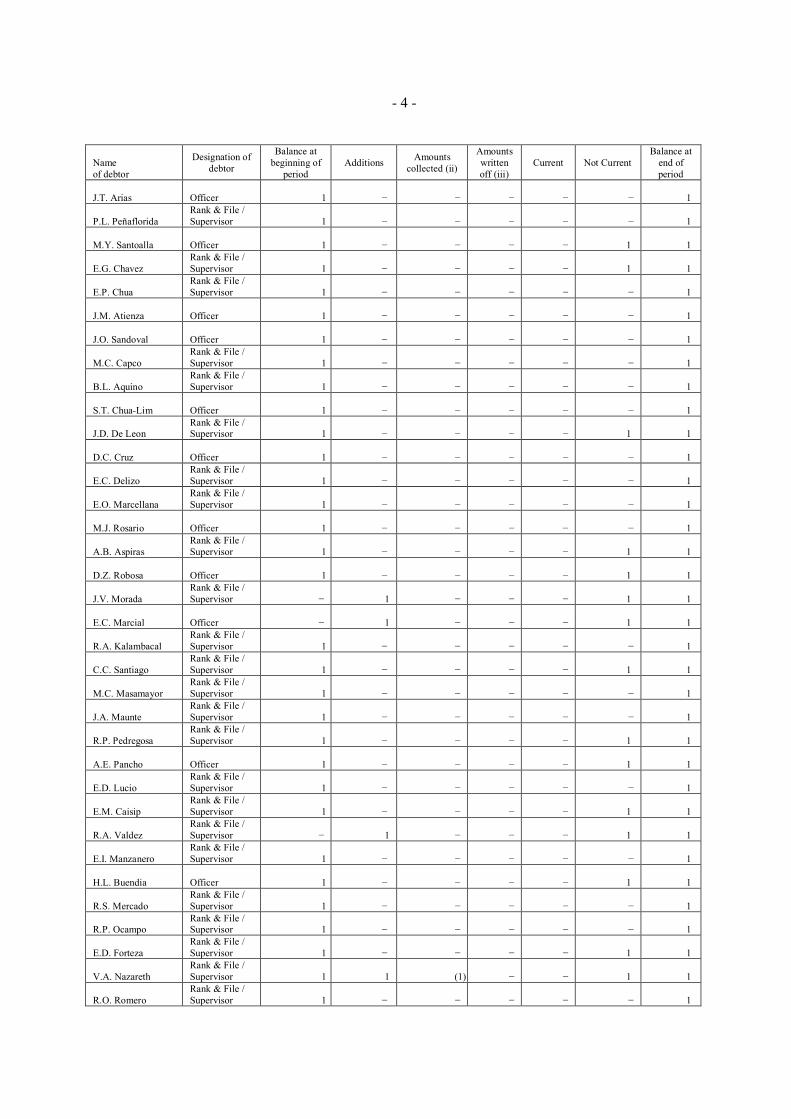
- 4 -
Nameof debtor
Designation ofdebtor
Balance atbeginning of
periodAdditions Amounts
collected (ii)
Amountswrittenoff (iii)
Current Not CurrentBalance at
end ofperiod
J.T. Arias Officer 1 − − − − − 1
P.L. PeñafloridaRank & File /Supervisor 1 − − − − − 1
M.Y. Santoalla Officer 1 − − − − 1 1
E.G. ChavezRank & File /Supervisor 1 − − − − 1 1
E.P. ChuaRank & File /Supervisor 1 − − − − − 1
J.M. Atienza Officer 1 − − − − − 1
J.O. Sandoval Officer 1 − − − − − 1
M.C. CapcoRank & File /Supervisor 1 − − − − − 1
B.L. AquinoRank & File /Supervisor 1 − − − − − 1
S.T. Chua-Lim Officer 1 − − − − − 1
J.D. De LeonRank & File /Supervisor 1 − − − − 1 1
D.C. Cruz Officer 1 − − − − − 1
E.C. DelizoRank & File /Supervisor 1 − − − − − 1
E.O. MarcellanaRank & File /Supervisor 1 − − − − − 1
M.J. Rosario Officer 1 − − − − − 1
A.B. AspirasRank & File /Supervisor 1 − − − − 1 1
D.Z. Robosa Officer 1 − − − − 1 1
J.V. MoradaRank & File /Supervisor − 1 − − − 1 1
E.C. Marcial Officer − 1 − − − 1 1
R.A. KalambacalRank & File /Supervisor 1 − − − − − 1
C.C. SantiagoRank & File /Supervisor 1 − − − − 1 1
M.C. MasamayorRank & File /Supervisor 1 − − − − − 1
J.A. MaunteRank & File /Supervisor 1 − − − − − 1
R.P. PedregosaRank & File /Supervisor 1 − − − − 1 1
A.E. Pancho Officer 1 − − − − 1 1
E.D. LucioRank & File /Supervisor 1 − − − − − 1
E.M. CaisipRank & File /Supervisor 1 − − − − 1 1
R.A. ValdezRank & File /Supervisor − 1 − − − 1 1
E.I. ManzaneroRank & File /Supervisor 1 − − − − − 1
H.L. Buendia Officer 1 − − − − 1 1
R.S. MercadoRank & File /Supervisor 1 − − − − − 1
R.P. OcampoRank & File /Supervisor 1 − − − − − 1
E.D. FortezaRank & File /Supervisor 1 − − − − 1 1
V.A. NazarethRank & File /Supervisor 1 1 (1) − − 1 1
R.O. RomeroRank & File /Supervisor 1 − − − − − 1
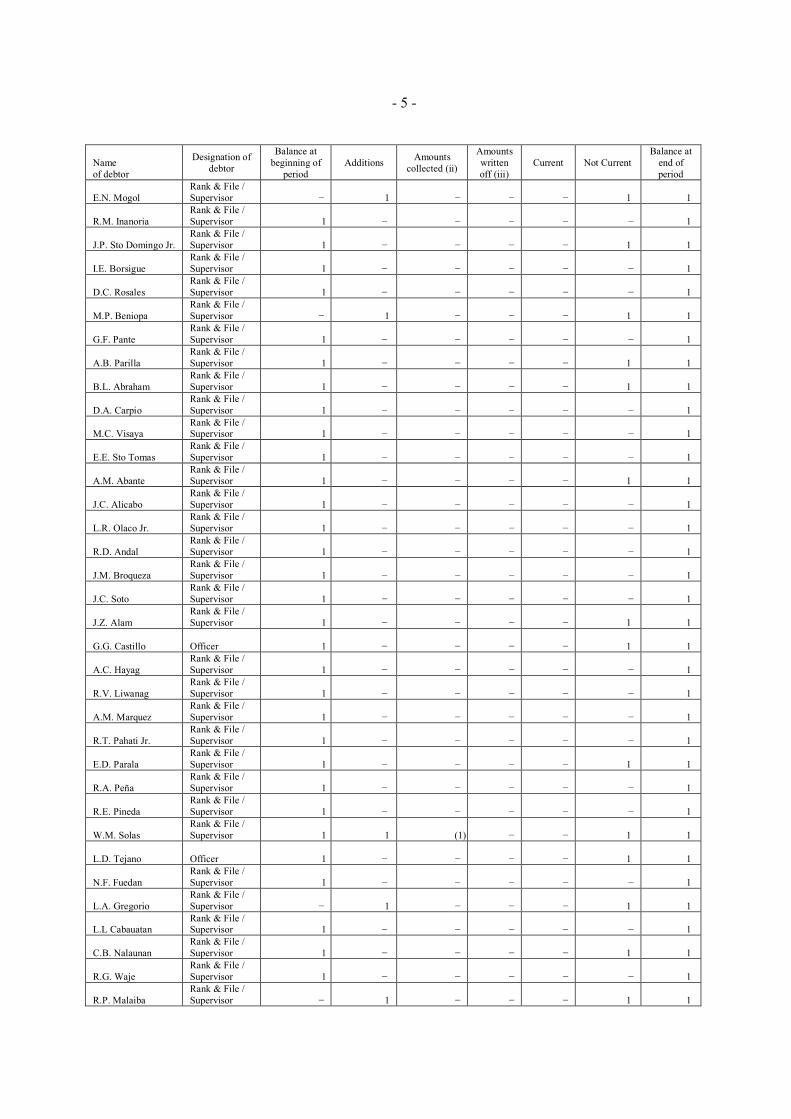
- 5 -
Nameof debtor
Designation ofdebtor
Balance atbeginning of
periodAdditions Amounts
collected (ii)
Amountswrittenoff (iii)
Current Not CurrentBalance at
end ofperiod
E.N. MogolRank & File /Supervisor − 1 − − − 1 1
R.M. InanoriaRank & File /Supervisor 1 − − − − − 1
J.P. Sto Domingo Jr.Rank & File /Supervisor 1 − − − − 1 1
I.E. BorsigueRank & File /Supervisor 1 − − − − − 1
D.C. RosalesRank & File /Supervisor 1 − − − − − 1
M.P. BeniopaRank & File /Supervisor − 1 − − − 1 1
G.F. PanteRank & File /Supervisor 1 − − − − − 1
A.B. ParillaRank & File /Supervisor 1 − − − − 1 1
B.L. AbrahamRank & File /Supervisor 1 − − − − 1 1
D.A. CarpioRank & File /Supervisor 1 − − − − − 1
M.C. VisayaRank & File /Supervisor 1 − − − − − 1
E.E. Sto TomasRank & File /Supervisor 1 − − − − − 1
A.M. AbanteRank & File /Supervisor 1 − − − − 1 1
J.C. AlicaboRank & File /Supervisor 1 − − − − − 1
L.R. Olaco Jr.Rank & File /Supervisor 1 − − − − − 1
R.D. AndalRank & File /Supervisor 1 − − − − − 1
J.M. BroquezaRank & File /Supervisor 1 − − − − − 1
J.C. SotoRank & File /Supervisor 1 − − − − − 1
J.Z. AlamRank & File /Supervisor 1 − − − − 1 1
G.G. Castillo Officer 1 − − − − 1 1
A.C. HayagRank & File /Supervisor 1 − − − − − 1
R.V. LiwanagRank & File /Supervisor 1 − − − − − 1
A.M. MarquezRank & File /Supervisor 1 − − − − − 1
R.T. Pahati Jr.Rank & File /Supervisor 1 − − − − − 1
E.D. ParalaRank & File /Supervisor 1 − − − − 1 1
R.A. PeñaRank & File /Supervisor 1 − − − − − 1
R.E. PinedaRank & File /Supervisor 1 − − − − − 1
W.M. SolasRank & File /Supervisor 1 1 (1) − − 1 1
L.D. Tejano Officer 1 − − − − 1 1
N.F. FuedanRank & File /Supervisor 1 − − − − − 1
L.A. GregorioRank & File /Supervisor − 1 − − − 1 1
L.L CabauatanRank & File /Supervisor 1 − − − − − 1
C.B. NalaunanRank & File /Supervisor 1 − − − − 1 1
R.G. WajeRank & File /Supervisor 1 − − − − − 1
R.P. MalaibaRank & File /Supervisor − 1 − − − 1 1
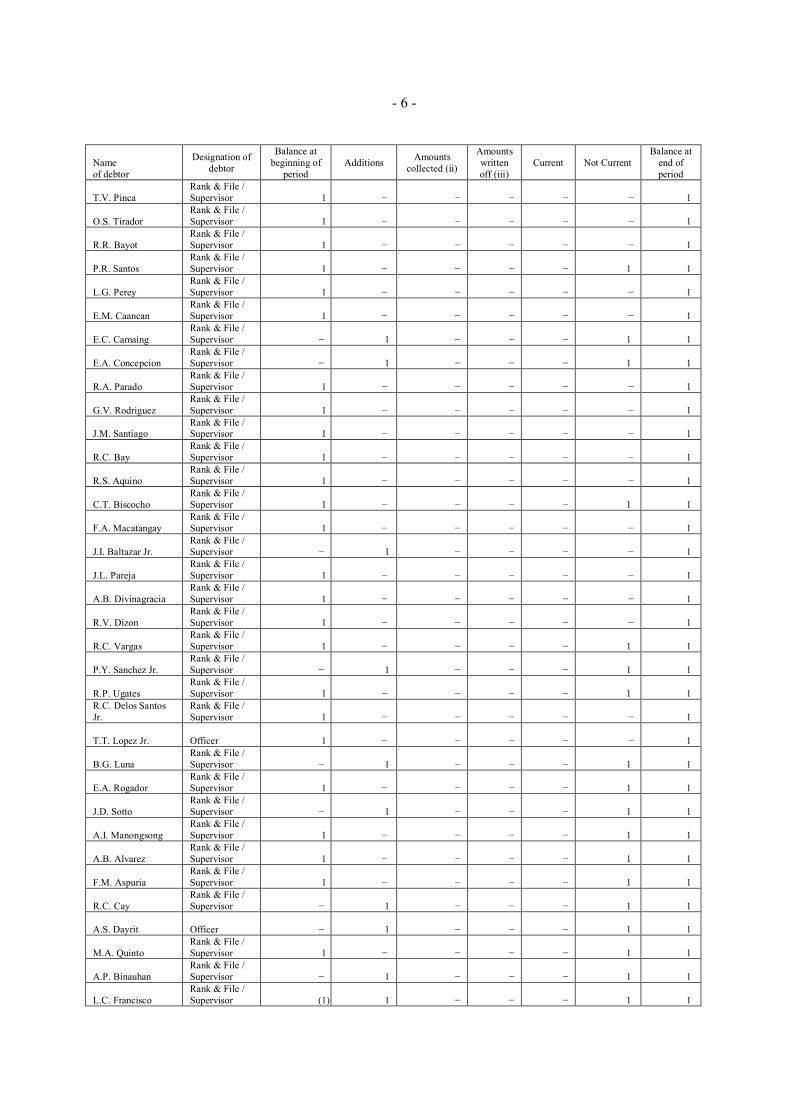
- 6 -
Nameof debtor
Designation ofdebtor
Balance atbeginning of
periodAdditions Amounts
collected (ii)
Amountswrittenoff (iii)
Current Not CurrentBalance at
end ofperiod
T.V. PincaRank & File /Supervisor 1 − − − − − 1
O.S. TiradorRank & File /Supervisor 1 − − − − − 1
R.R. BayotRank & File /Supervisor 1 − − − − − 1
P.R. SantosRank & File /Supervisor 1 − − − − 1 1
L.G. PereyRank & File /Supervisor 1 − − − − − 1
E.M. CaancanRank & File /Supervisor 1 − − − − − 1
E.C. CamaingRank & File /Supervisor − 1 − − − 1 1
E.A. ConcepcionRank & File /Supervisor − 1 − − − 1 1
R.A. ParadoRank & File /Supervisor 1 − − − − − 1
G.V. RodriguezRank & File /Supervisor 1 − − − − − 1
J.M. SantiagoRank & File /Supervisor 1 − − − − − 1
R.C. BayRank & File /Supervisor 1 − − − − − 1
R.S. AquinoRank & File /Supervisor 1 − − − − − 1
C.T. BiscochoRank & File /Supervisor 1 − − − − 1 1
F.A. MacatangayRank & File /Supervisor 1 − − − − − 1
J.I. Baltazar Jr.Rank & File /Supervisor − 1 − − − − 1
J.L. ParejaRank & File /Supervisor 1 − − − − − 1
A.B. DivinagraciaRank & File /Supervisor 1 − − − − − 1
R.V. DizonRank & File /Supervisor 1 − − − − − 1
R.C. VargasRank & File /Supervisor 1 − − − − 1 1
P.Y. Sanchez Jr.Rank & File /Supervisor − 1 − − − 1 1
R.P. UgatesRank & File /Supervisor 1 − − − − 1 1
R.C. Delos SantosJr.
Rank & File /Supervisor 1 − − − − − 1
T.T. Lopez Jr. Officer 1 − − − − − 1
B.G. LunaRank & File /Supervisor − 1 − − − 1 1
E.A. RogadorRank & File /Supervisor 1 − − − − 1 1
J.D. SottoRank & File /Supervisor − 1 − − − 1 1
A.I. ManongsongRank & File /Supervisor 1 − − − − 1 1
A.B. AlvarezRank & File /Supervisor 1 − − − − 1 1
F.M. AspuriaRank & File /Supervisor 1 − − − − 1 1
R.C. CayRank & File /Supervisor − 1 − − − 1 1
A.S. Dayrit Officer − 1 − − − 1 1
M.A. QuintoRank & File /Supervisor 1 − − − − 1 1
A.P. BinauhanRank & File /Supervisor − 1 − − − 1 1
L.C. FranciscoRank & File /Supervisor (1) 1 − − − 1 1
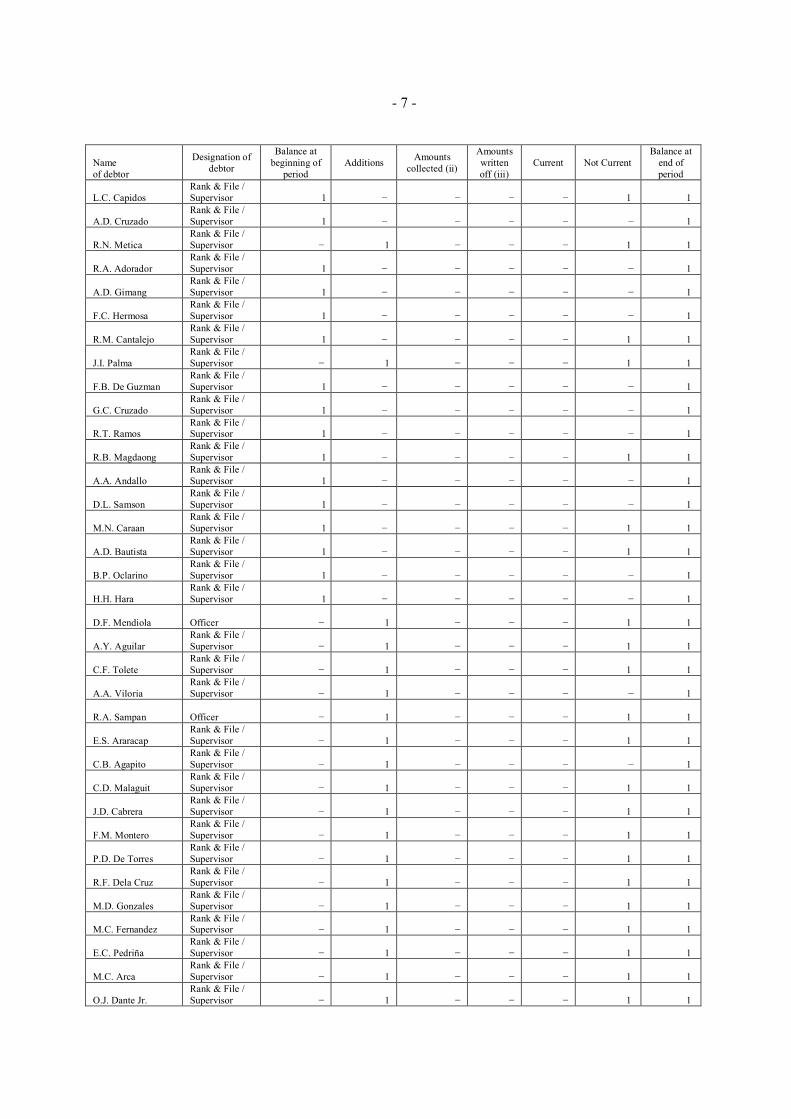
- 7 -
Nameof debtor
Designation ofdebtor
Balance atbeginning of
periodAdditions Amounts
collected (ii)
Amountswrittenoff (iii)
Current Not CurrentBalance at
end ofperiod
L.C. CapidosRank & File /Supervisor 1 − − − − 1 1
A.D. CruzadoRank & File /Supervisor 1 − − − − − 1
R.N. MeticaRank & File /Supervisor − 1 − − − 1 1
R.A. AdoradorRank & File /Supervisor 1 − − − − − 1
A.D. GimangRank & File /Supervisor 1 − − − − − 1
F.C. HermosaRank & File /Supervisor 1 − − − − − 1
R.M. CantalejoRank & File /Supervisor 1 − − − − 1 1
J.I. PalmaRank & File /Supervisor − 1 − − − 1 1
F.B. De GuzmanRank & File /Supervisor 1 − − − − − 1
G.C. CruzadoRank & File /Supervisor 1 − − − − − 1
R.T. RamosRank & File /Supervisor 1 − − − − − 1
R.B. MagdaongRank & File /Supervisor 1 − − − − 1 1
A.A. AndalloRank & File /Supervisor 1 − − − − − 1
D.L. SamsonRank & File /Supervisor 1 − − − − − 1
M.N. CaraanRank & File /Supervisor 1 − − − − 1 1
A.D. BautistaRank & File /Supervisor 1 − − − − 1 1
B.P. OclarinoRank & File /Supervisor 1 − − − − − 1
H.H. HaraRank & File /Supervisor 1 − − − − − 1
D.F. Mendiola Officer − 1 − − − 1 1
A.Y. AguilarRank & File /Supervisor − 1 − − − 1 1
C.F. ToleteRank & File /Supervisor − 1 − − − 1 1
A.A. ViloriaRank & File /Supervisor − 1 − − − − 1
R.A. Sampan Officer − 1 − − − 1 1
E.S. AraracapRank & File /Supervisor − 1 − − − 1 1
C.B. AgapitoRank & File /Supervisor − 1 − − − − 1
C.D. MalaguitRank & File /Supervisor − 1 − − − 1 1
J.D. CabreraRank & File /Supervisor − 1 − − − 1 1
F.M. MonteroRank & File /Supervisor − 1 − − − 1 1
P.D. De TorresRank & File /Supervisor − 1 − − − 1 1
R.F. Dela CruzRank & File /Supervisor − 1 − − − 1 1
M.D. GonzalesRank & File /Supervisor − 1 − − − 1 1
M.C. FernandezRank & File /Supervisor − 1 − − − 1 1
E.C. PedriñaRank & File /Supervisor − 1 − − − 1 1
M.C. ArcaRank & File /Supervisor − 1 − − − 1 1
O.J. Dante Jr.Rank & File /Supervisor − 1 − − − 1 1
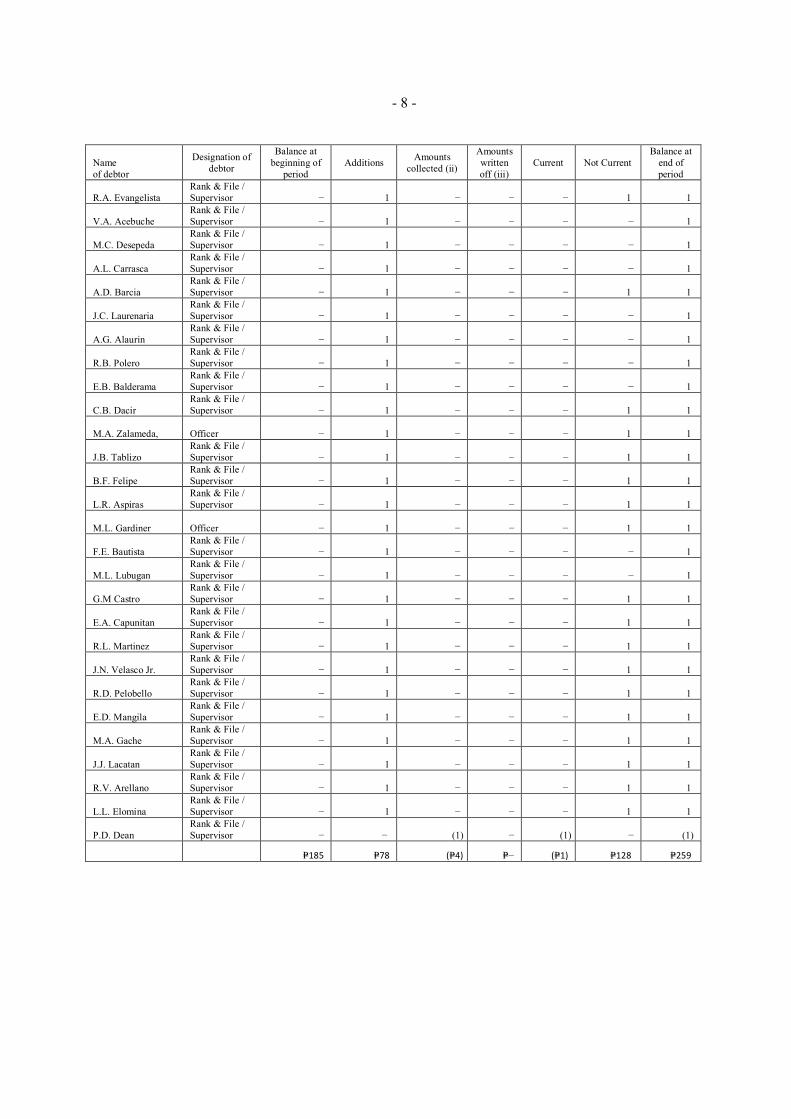
- 8 -
Nameof debtor
Designation ofdebtor
Balance atbeginning of
periodAdditions Amounts
collected (ii)
Amountswrittenoff (iii)
Current Not CurrentBalance at
end ofperiod
R.A. EvangelistaRank & File /Supervisor − 1 − − − 1 1
V.A. AcebucheRank & File /Supervisor − 1 − − − − 1
M.C. DesepedaRank & File /Supervisor − 1 − − − − 1
A.L. CarrascaRank & File /Supervisor − 1 − − − − 1
A.D. BarciaRank & File /Supervisor − 1 − − − 1 1
J.C. LaurenariaRank & File /Supervisor − 1 − − − − 1
A.G. AlaurinRank & File /Supervisor − 1 − − − − 1
R.B. PoleroRank & File /Supervisor − 1 − − − − 1
E.B. BalderamaRank & File /Supervisor − 1 − − − − 1
C.B. DacirRank & File /Supervisor − 1 − − − 1 1
M.A. Zalameda, Officer − 1 − − − 1 1
J.B. TablizoRank & File /Supervisor − 1 − − − 1 1
B.F. FelipeRank & File /Supervisor − 1 − − − 1 1
L.R. AspirasRank & File /Supervisor − 1 − − − 1 1
M.L. Gardiner Officer − 1 − − − 1 1
F.E. BautistaRank & File /Supervisor − 1 − − − − 1
M.L. LubuganRank & File /Supervisor − 1 − − − − 1
G.M CastroRank & File /Supervisor − 1 − − − 1 1
E.A. CapunitanRank & File /Supervisor − 1 − − − 1 1
R.L. MartinezRank & File /Supervisor − 1 − − − 1 1
J.N. Velasco Jr.Rank & File /Supervisor − 1 − − − 1 1
R.D. PelobelloRank & File /Supervisor − 1 − − − 1 1
E.D. MangilaRank & File /Supervisor − 1 − − − 1 1
M.A. GacheRank & File /Supervisor − 1 − − − 1 1
J.J. LacatanRank & File /Supervisor − 1 − − − 1 1
R.V. ArellanoRank & File /Supervisor − 1 − − − 1 1
L.L. ElominaRank & File /Supervisor − 1 − − − 1 1
P.D. DeanRank & File /Supervisor − − (1) − (1) − (1)
P=185 P=78 (P=4) P=− (P=1) P=128 P=259
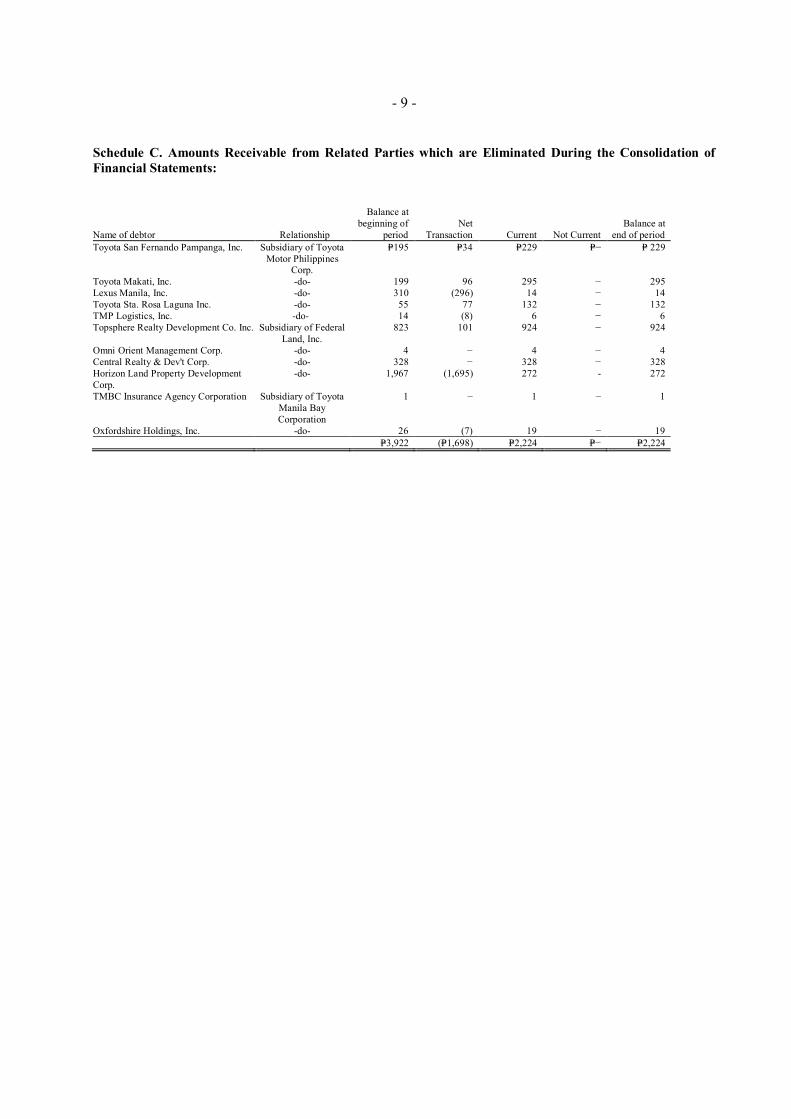
- 9 -
Schedule C. Amounts Receivable from Related Parties which are Eliminated During the Consolidation ofFinancial Statements:
Name of debtor Relationship
Balance atbeginning of
periodNet
Transaction Current Not CurrentBalance at
end of periodToyota San Fernando Pampanga, Inc. Subsidiary of Toyota
Motor PhilippinesCorp.
P=195 P=34 P=229 P=− P= 229
Toyota Makati, Inc. -do- 199 96 295 − 295Lexus Manila, Inc. -do- 310 (296) 14 − 14Toyota Sta. Rosa Laguna Inc. -do- 55 77 132 − 132TMP Logistics, Inc. -do- 14 (8) 6 − 6Topsphere Realty Development Co. Inc. Subsidiary of Federal
Land, Inc. 823 101 924 − 924
Omni Orient Management Corp. -do- 4 − 4 − 4Central Realty & Dev't Corp. -do- 328 − 328 − 328Horizon Land Property DevelopmentCorp.
-do- 1,967 (1,695) 272 - 272
TMBC Insurance Agency Corporation Subsidiary of ToyotaManila BayCorporation
1 − 1 − 1
Oxfordshire Holdings, Inc. -do- 26 (7) 19 − 19P=3,922 (P=1,698) P=2,224 P=− P=2,224
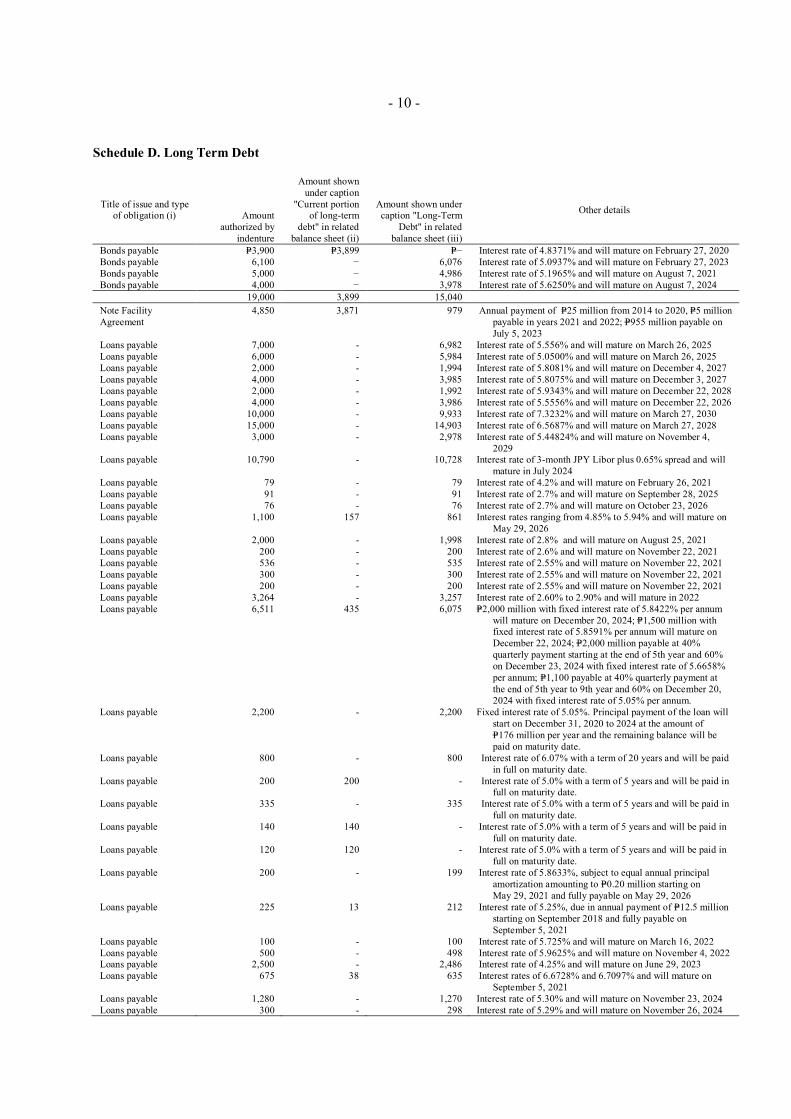
- 10 -
Schedule D. Long Term Debt
Title of issue and typeof obligation (i) Amount
authorized byindenture
Amount shownunder caption
"Current portionof long-term
debt" in relatedbalance sheet (ii)
Amount shown undercaption "Long-Term
Debt" in relatedbalance sheet (iii)
Other details
Bonds payable P=3,900 P=3,899 P=− Interest rate of 4.8371% and will mature on February 27, 2020Bonds payable 6,100 − 6,076 Interest rate of 5.0937% and will mature on February 27, 2023Bonds payable 5,000 − 4,986 Interest rate of 5.1965% and will mature on August 7, 2021Bonds payable 4,000 − 3,978 Interest rate of 5.6250% and will mature on August 7, 2024
19,000 3,899 15,040Note FacilityAgreement
4,850 3,871 979 Annual payment of P=25 million from 2014 to 2020, P=5 millionpayable in years 2021 and 2022; P=955 million payable onJuly 5, 2023
Loans payable 7,000 - 6,982 Interest rate of 5.556% and will mature on March 26, 2025Loans payable 6,000 - 5,984 Interest rate of 5.0500% and will mature on March 26, 2025Loans payable 2,000 - 1,994 Interest rate of 5.8081% and will mature on December 4, 2027Loans payable 4,000 - 3,985 Interest rate of 5.8075% and will mature on December 3, 2027Loans payable 2,000 - 1,992 Interest rate of 5.9343% and will mature on December 22, 2028Loans payable 4,000 - 3,986 Interest rate of 5.5556% and will mature on December 22, 2026Loans payable 10,000 - 9,933 Interest rate of 7.3232% and will mature on March 27, 2030Loans payable 15,000 - 14,903 Interest rate of 6.5687% and will mature on March 27, 2028Loans payable 3,000 - 2,978 Interest rate of 5.44824% and will mature on November 4,
2029Loans payable 10,790 - 10,728 Interest rate of 3-month JPY Libor plus 0.65% spread and will
mature in July 2024Loans payable 79 - 79 Interest rate of 4.2% and will mature on February 26, 2021Loans payable 91 - 91 Interest rate of 2.7% and will mature on September 28, 2025Loans payable 76 - 76 Interest rate of 2.7% and will mature on October 23, 2026Loans payable 1,100 157 861 Interest rates ranging from 4.85% to 5.94% and will mature on
May 29, 2026Loans payable 2,000 - 1,998 Interest rate of 2.8% and will mature on August 25, 2021Loans payable 200 - 200 Interest rate of 2.6% and will mature on November 22, 2021Loans payable 536 - 535 Interest rate of 2.55% and will mature on November 22, 2021Loans payable 300 - 300 Interest rate of 2.55% and will mature on November 22, 2021Loans payable 200 - 200 Interest rate of 2.55% and will mature on November 22, 2021Loans payable 3,264 - 3,257 Interest rate of 2.60% to 2.90% and will mature in 2022Loans payable 6,511 435 6,075 P=2,000 million with fixed interest rate of 5.8422% per annum
will mature on December 20, 2024; P=1,500 million withfixed interest rate of 5.8591% per annum will mature onDecember 22, 2024; P=2,000 million payable at 40%quarterly payment starting at the end of 5th year and 60%on December 23, 2024 with fixed interest rate of 5.6658%per annum; P=1,100 payable at 40% quarterly payment atthe end of 5th year to 9th year and 60% on December 20,2024 with fixed interest rate of 5.05% per annum.
Loans payable 2,200 - 2,200 Fixed interest rate of 5.05%. Principal payment of the loan willstart on December 31, 2020 to 2024 at the amount of
P=176 million per year and the remaining balance will bepaid on maturity date.
Loans payable 800 - 800 Interest rate of 6.07% with a term of 20 years and will be paidin full on maturity date.
Loans payable 200 200 - Interest rate of 5.0% with a term of 5 years and will be paid infull on maturity date.
Loans payable 335 - 335 Interest rate of 5.0% with a term of 5 years and will be paid infull on maturity date.
Loans payable 140 140 - Interest rate of 5.0% with a term of 5 years and will be paid infull on maturity date.
Loans payable 120 120 - Interest rate of 5.0% with a term of 5 years and will be paid infull on maturity date.
Loans payable 200 - 199 Interest rate of 5.8633%, subject to equal annual principalamortization amounting to P=0.20 million starting on
May 29, 2021 and fully payable on May 29, 2026Loans payable 225 13 212 Interest rate of 5.25%, due in annual payment of P=12.5 million
starting on September 2018 and fully payable on September 5, 2021
Loans payable 100 - 100 Interest rate of 5.725% and will mature on March 16, 2022Loans payable 500 - 498 Interest rate of 5.9625% and will mature on November 4, 2022Loans payable 2,500 - 2,486 Interest rate of 4.25% and will mature on June 29, 2023Loans payable 675 38 635 Interest rates of 6.6728% and 6.7097% and will mature on
September 5, 2021Loans payable 1,280 - 1,270 Interest rate of 5.30% and will mature on November 23, 2024Loans payable 300 - 298 Interest rate of 5.29% and will mature on November 26, 2024
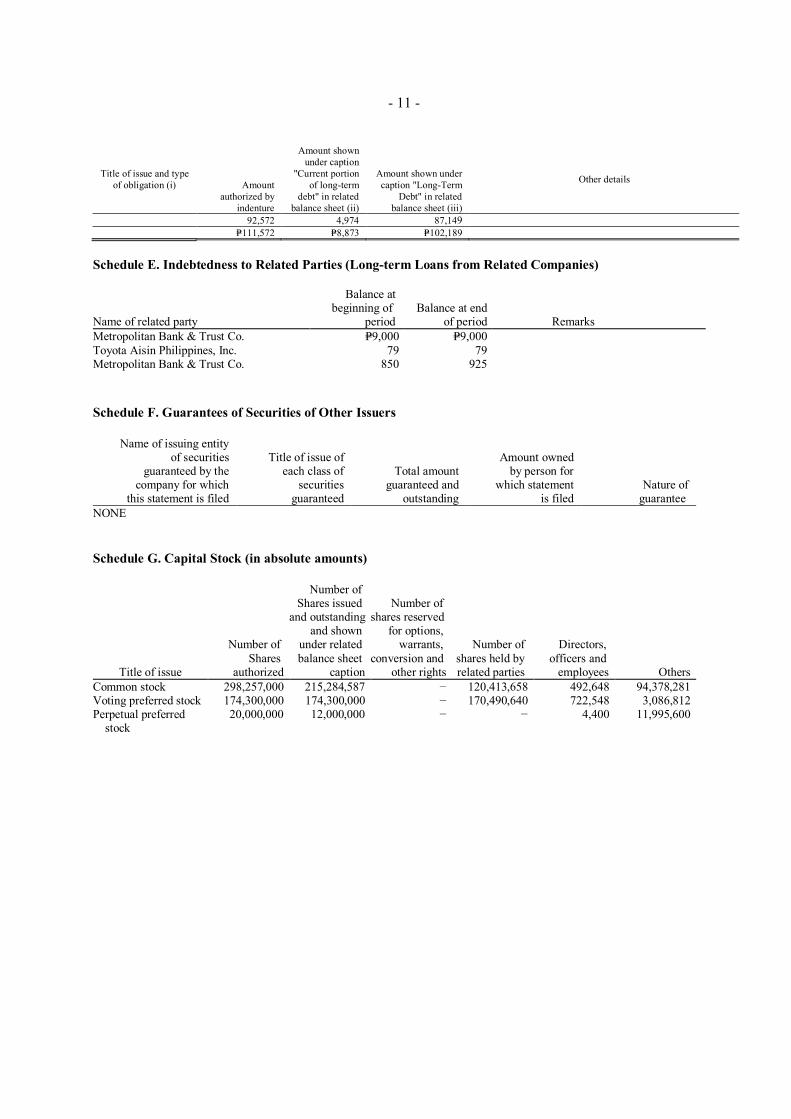
- 11 -
Title of issue and typeof obligation (i) Amount
authorized byindenture
Amount shownunder caption
"Current portionof long-term
debt" in relatedbalance sheet (ii)
Amount shown undercaption "Long-Term
Debt" in relatedbalance sheet (iii)
Other details
92,572 4,974 87,149P=111,572 P=8,873 P=102,189
Schedule E. Indebtedness to Related Parties (Long-term Loans from Related Companies)
Name of related party
Balance atbeginning of
periodBalance at end
of period RemarksMetropolitan Bank & Trust Co. P=9,000 P=9,000Toyota Aisin Philippines, Inc. 79 79Metropolitan Bank & Trust Co. 850 925
Schedule F. Guarantees of Securities of Other Issuers
Name of issuing entityof securities
guaranteed by thecompany for which
this statement is filed
Title of issue ofeach class of
securitiesguaranteed
Total amountguaranteed and
outstanding
Amount ownedby person for
which statementis filed
Nature ofguarantee
NONE
Schedule G. Capital Stock (in absolute amounts)
Title of issue
Number ofShares
authorized
Number ofShares issued
and outstandingand shown
under relatedbalance sheet
caption
Number ofshares reserved
for options,warrants,
conversion andother rights
Number ofshares held byrelated parties
Directors,officers and
employees OthersCommon stock 298,257,000 215,284,587 − 120,413,658 492,648 94,378,281Voting preferred stock 174,300,000 174,300,000 − 170,490,640 722,548 3,086,812Perpetual preferred
stock20,000,000 12,000,000 − − 4,400 11,995,600
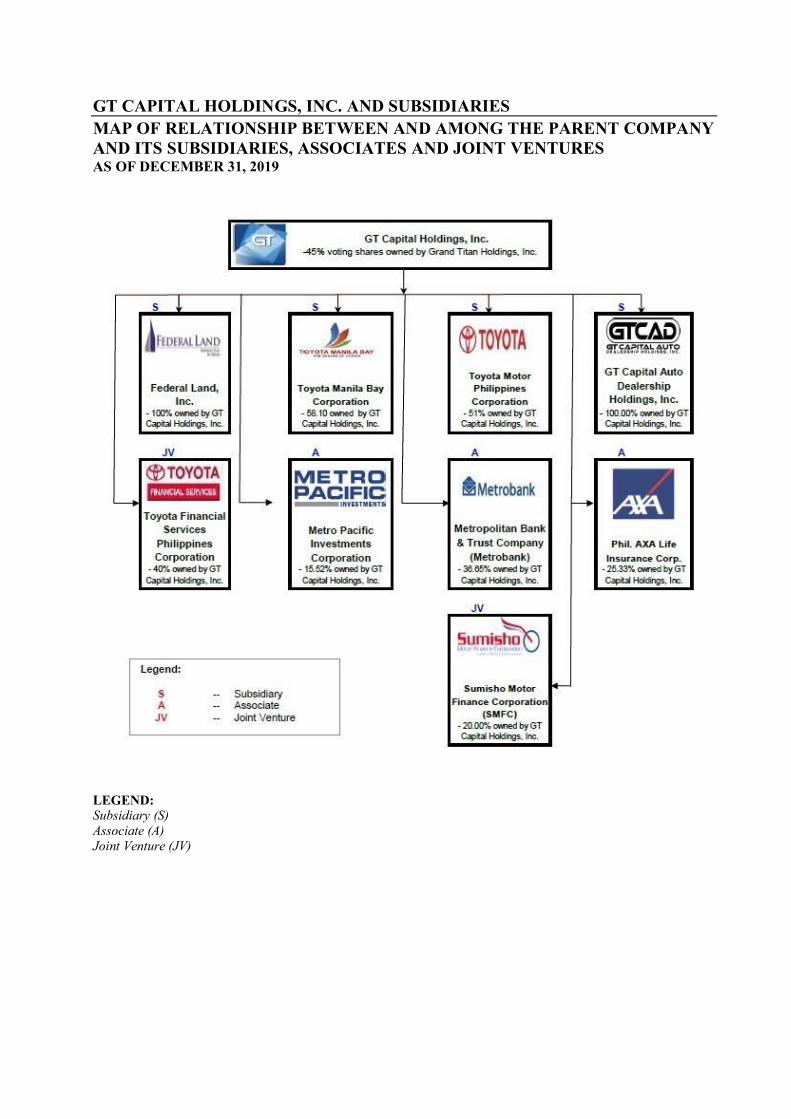
GT CAPITAL HOLDINGS, INC. AND SUBSIDIARIESMAP OF RELATIONSHIP BETWEEN AND AMONG THE PARENT COMPANYAND ITS SUBSIDIARIES, ASSOCIATES AND JOINT VENTURESAS OF DECEMBER 31, 2019
LEGEND:Subsidiary (S)Associate (A)Joint Venture (JV)
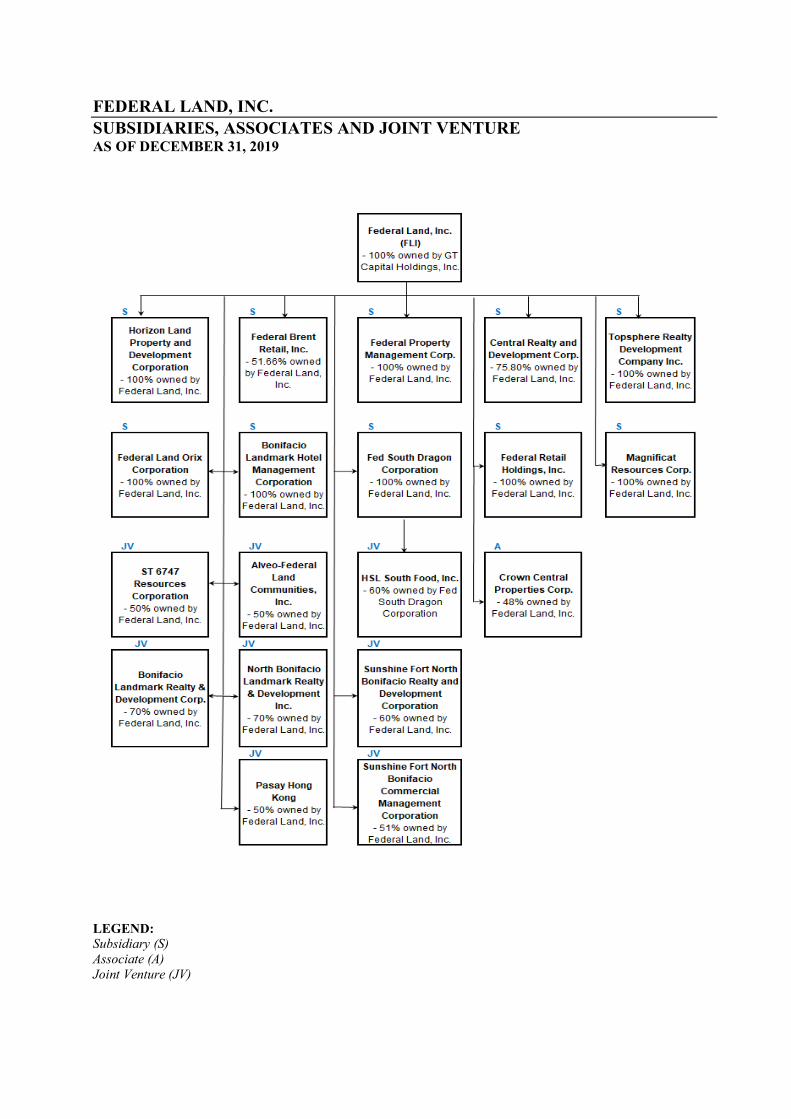
FEDERAL LAND, INC.SUBSIDIARIES, ASSOCIATES AND JOINT VENTUREAS OF DECEMBER 31, 2019
LEGEND:Subsidiary (S)Associate (A)Joint Venture (JV)
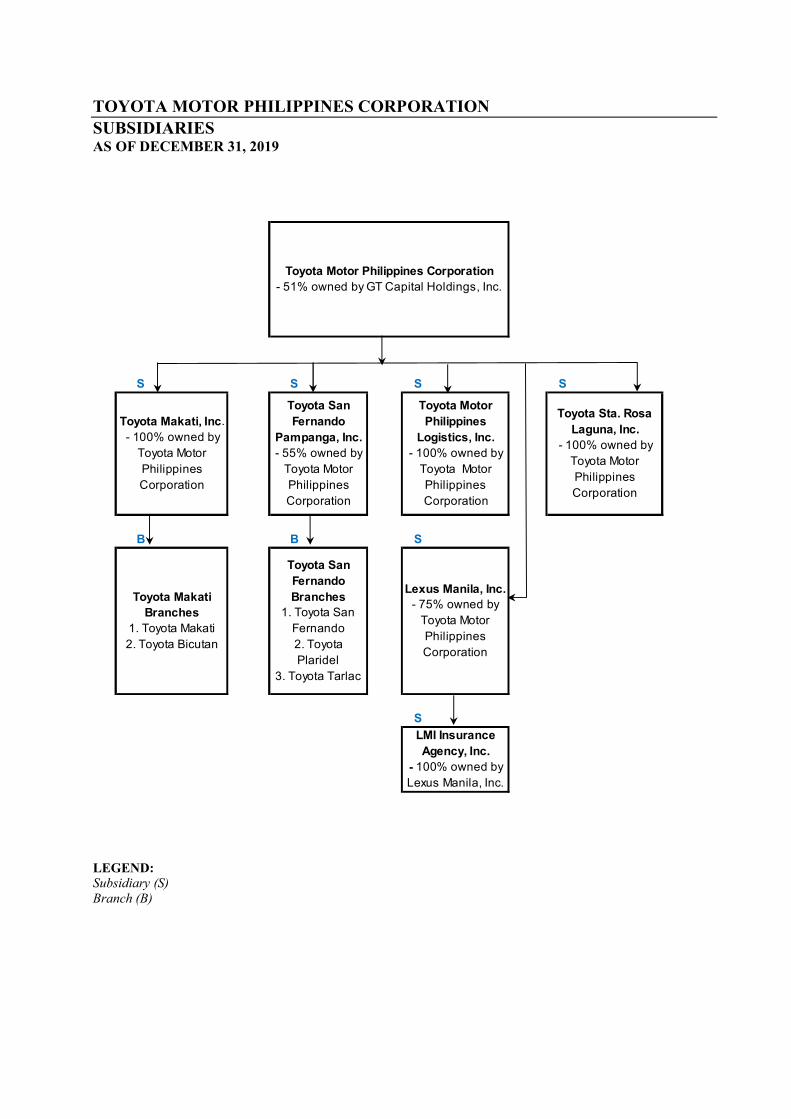
TOYOTA MOTOR PHILIPPINES CORPORATIONSUBSIDIARIESAS OF DECEMBER 31, 2019
LEGEND:Subsidiary (S)Branch (B)
S S S S
Toyota Makati, Inc.- 100% owned by
Toyota MotorPhilippinesCorporation
Toyota SanFernando
Pampanga, Inc.- 55% owned by
Toyota MotorPhilippinesCorporation
Toyota MotorPhilippines
Logistics, Inc.- 100% owned by
Toyota MotorPhilippinesCorporation
Toyota Sta. RosaLaguna, Inc.
- 100% owned byToyota MotorPhilippinesCorporation
B B S
Toyota MakatiBranches
1. Toyota Makati2. Toyota Bicutan
Toyota SanFernandoBranches
1. Toyota SanFernando2. ToyotaPlaridel
3. Toyota Tarlac
Lexus Manila, Inc.- 75% owned by
Toyota MotorPhilippinesCorporation
SLMI InsuranceAgency, Inc.
- 100% owned byLexus Manila, Inc.
Toyota Motor Philippines Corporation- 51% owned by GT Capital Holdings, Inc.
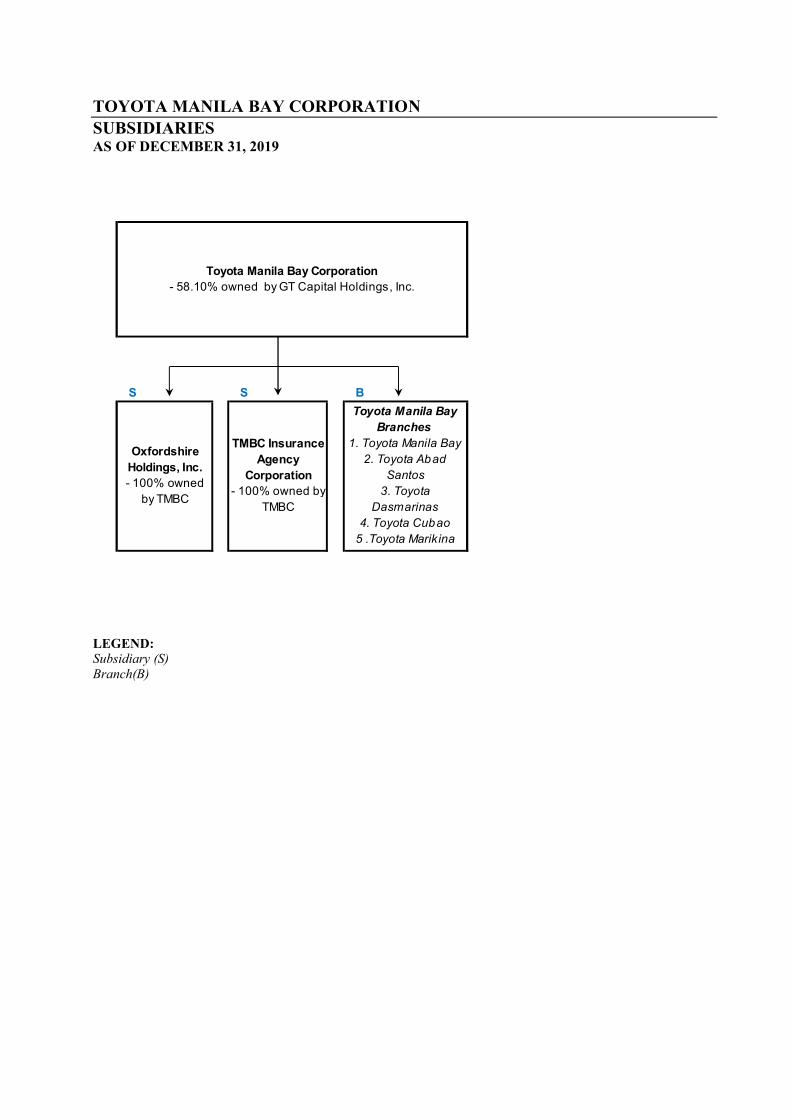
TOYOTA MANILA BAY CORPORATIONSUBSIDIARIESAS OF DECEMBER 31, 2019
LEGEND:Subsidiary (S)Branch(B)
S S B
Toyota Manila Bay Corporation- 58.10% owned by GT Capital Holdings, Inc.
OxfordshireHoldings, Inc.- 100% owned
by TMBC
Toyota Manila BayBranches
1. Toyota Manila Bay2. Toyota Abad
Santos3. Toyota
Dasmarinas4. Toyota Cubao
5 .Toyota Marikina
TMBC InsuranceAgency
Corporation- 100% owned by
TMBC
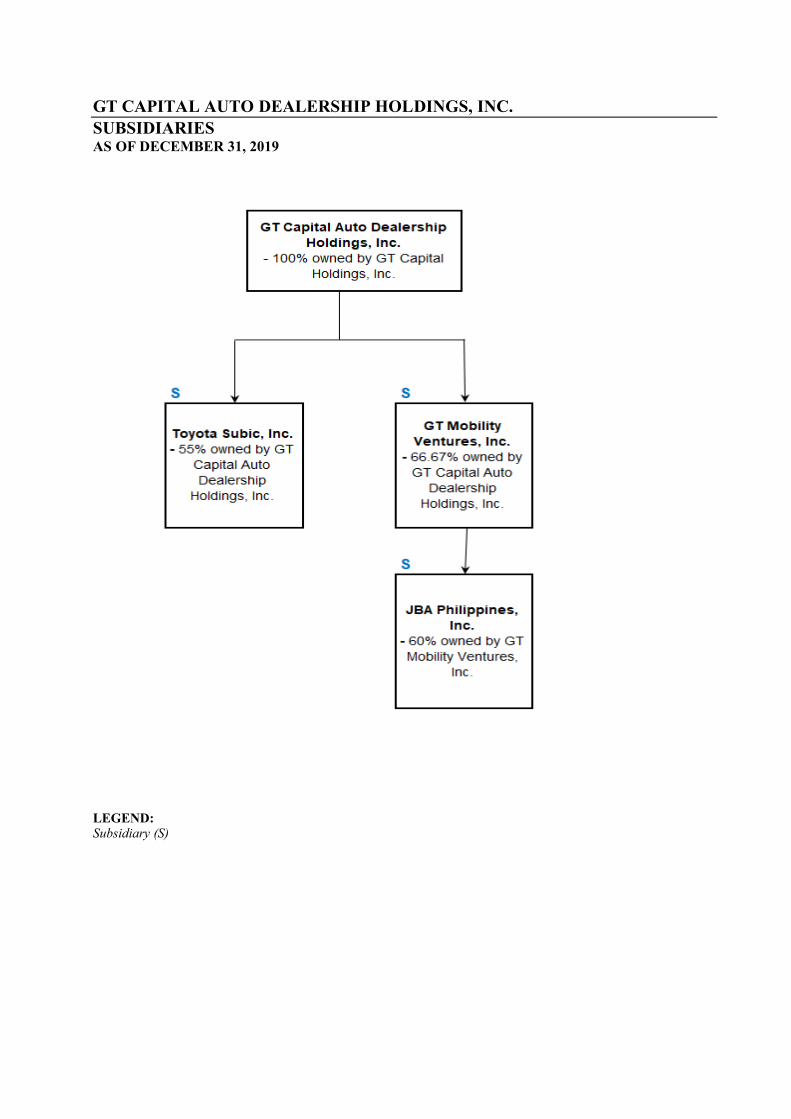
GT CAPITAL AUTO DEALERSHIP HOLDINGS, INC.SUBSIDIARIESAS OF DECEMBER 31, 2019
LEGEND:Subsidiary (S)
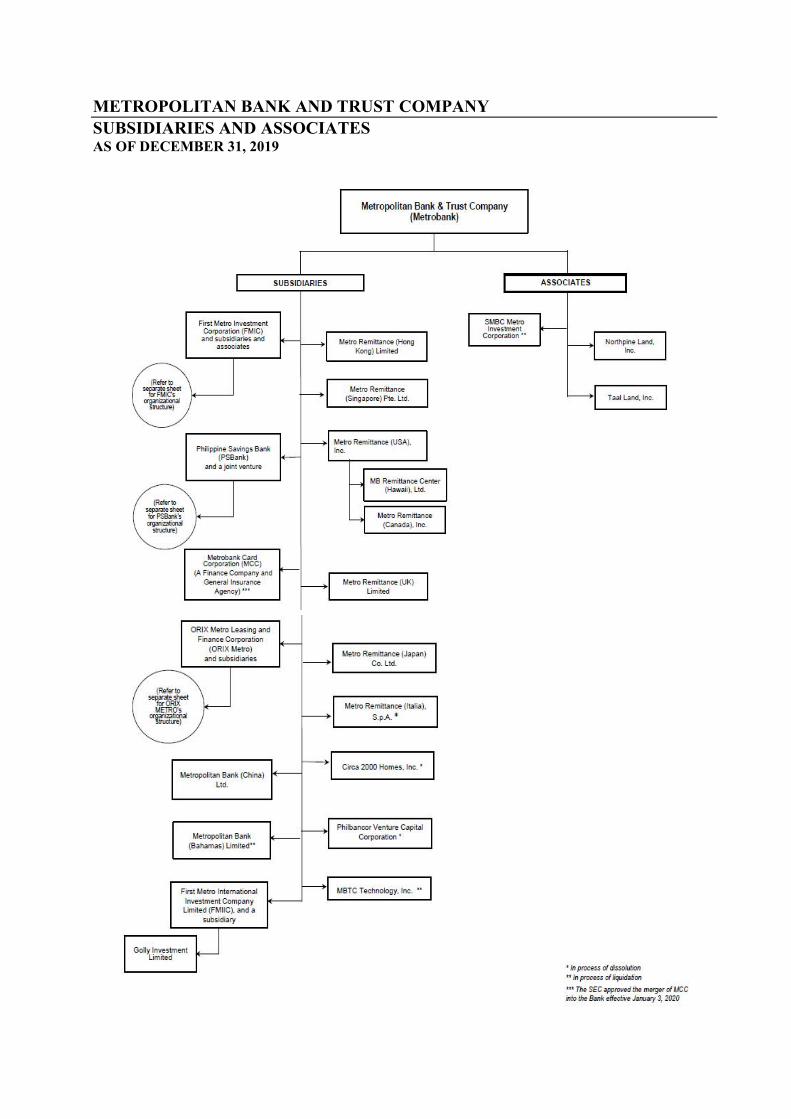
METROPOLITAN BANK AND TRUST COMPANYSUBSIDIARIES AND ASSOCIATESAS OF DECEMBER 31, 2019
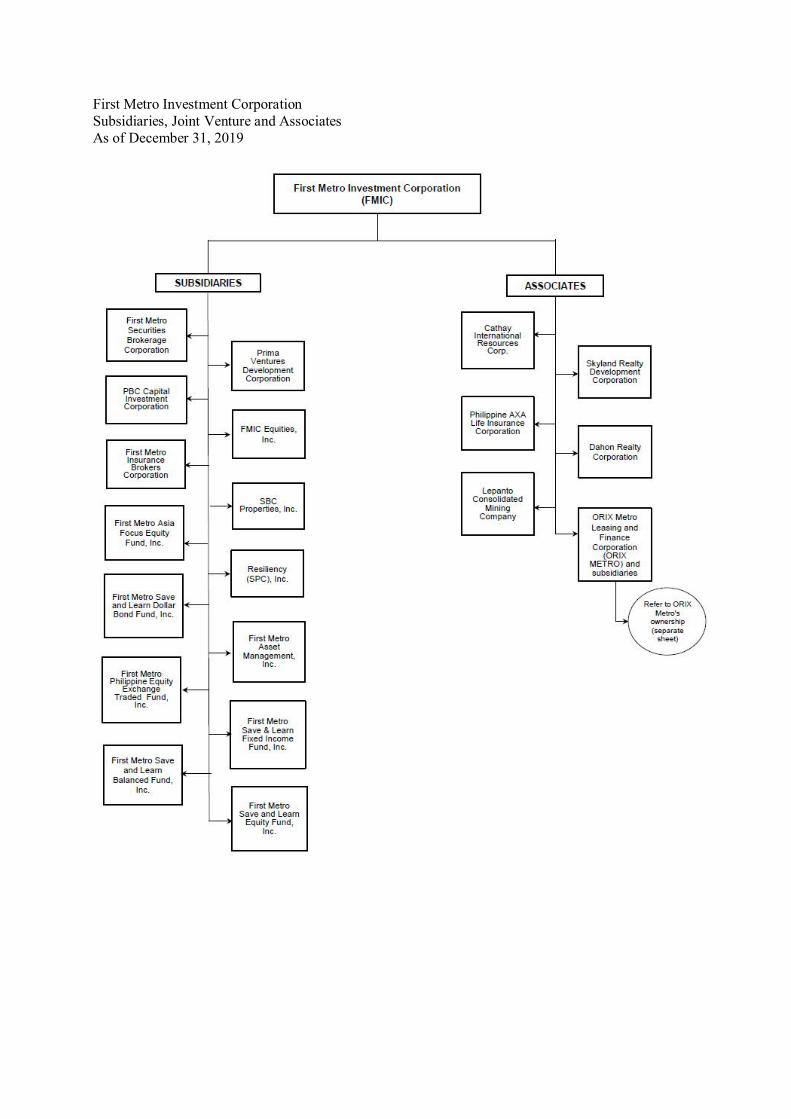
First Metro Investment CorporationSubsidiaries, Joint Venture and AssociatesAs of December 31, 2019
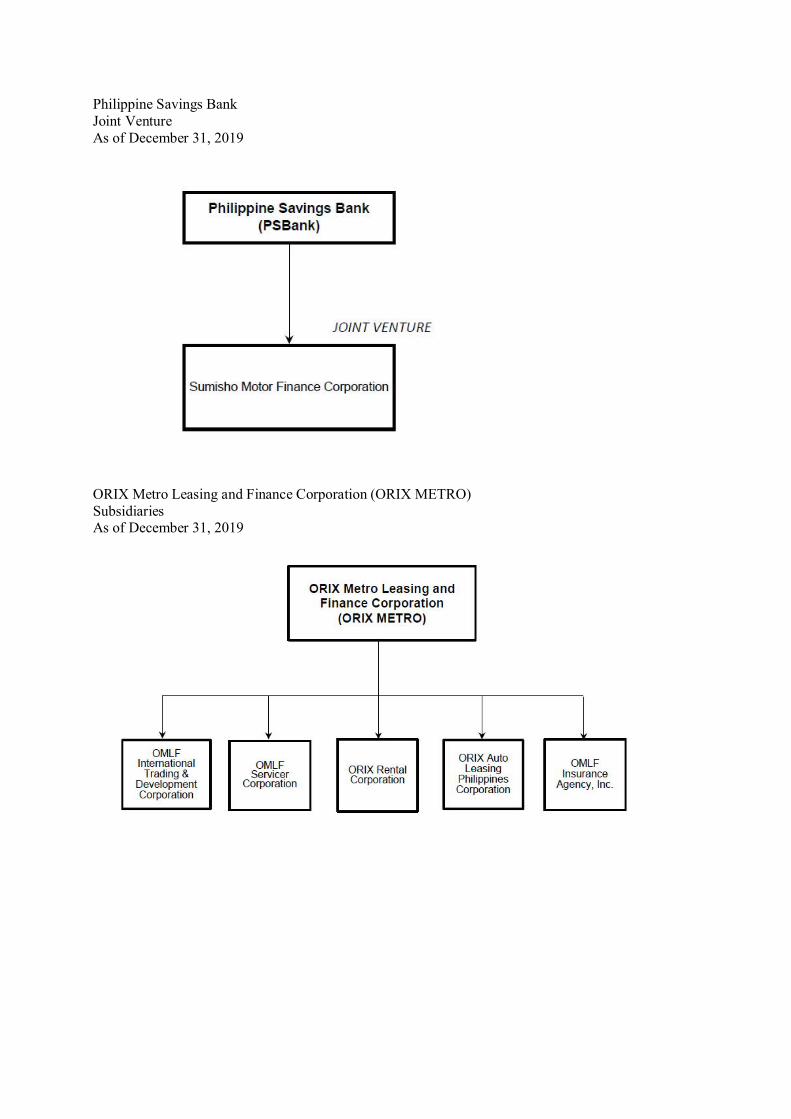
Philippine Savings BankJoint VentureAs of December 31, 2019
ORIX Metro Leasing and Finance Corporation (ORIX METRO)SubsidiariesAs of December 31, 2019
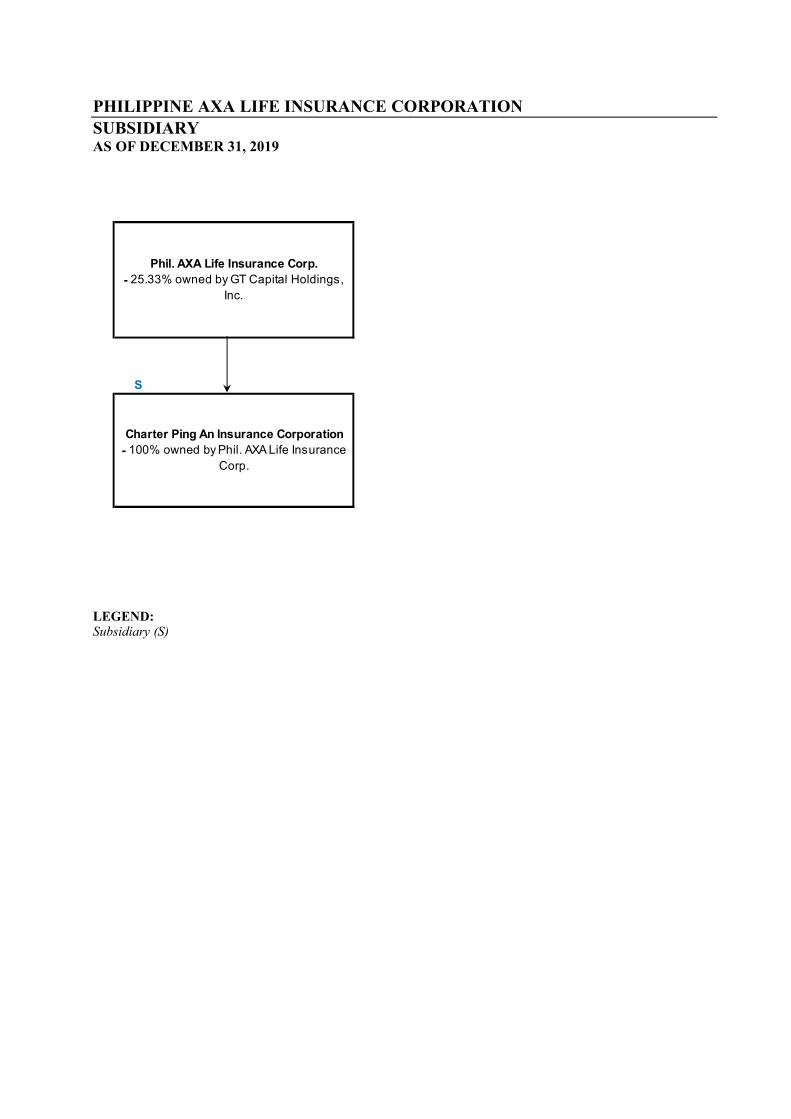
PHILIPPINE AXA LIFE INSURANCE CORPORATIONSUBSIDIARYAS OF DECEMBER 31, 2019
LEGEND:Subsidiary (S)
S
Phil. AXA Life Insurance Corp.- 25.33% owned by GT Capital Holdings,
Inc.
Charter Ping An Insurance Corporation- 100% owned by Phil. AXA Life Insurance
Corp.
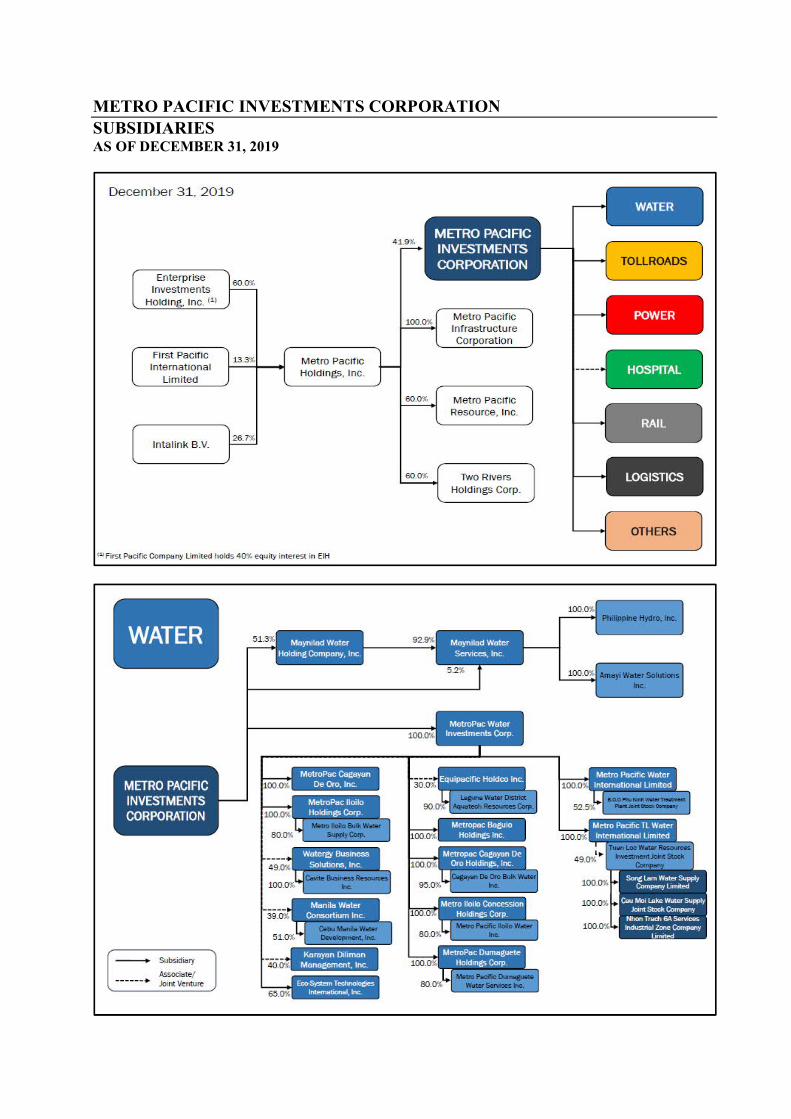
METRO PACIFIC INVESTMENTS CORPORATIONSUBSIDIARIESAS OF DECEMBER 31, 2019
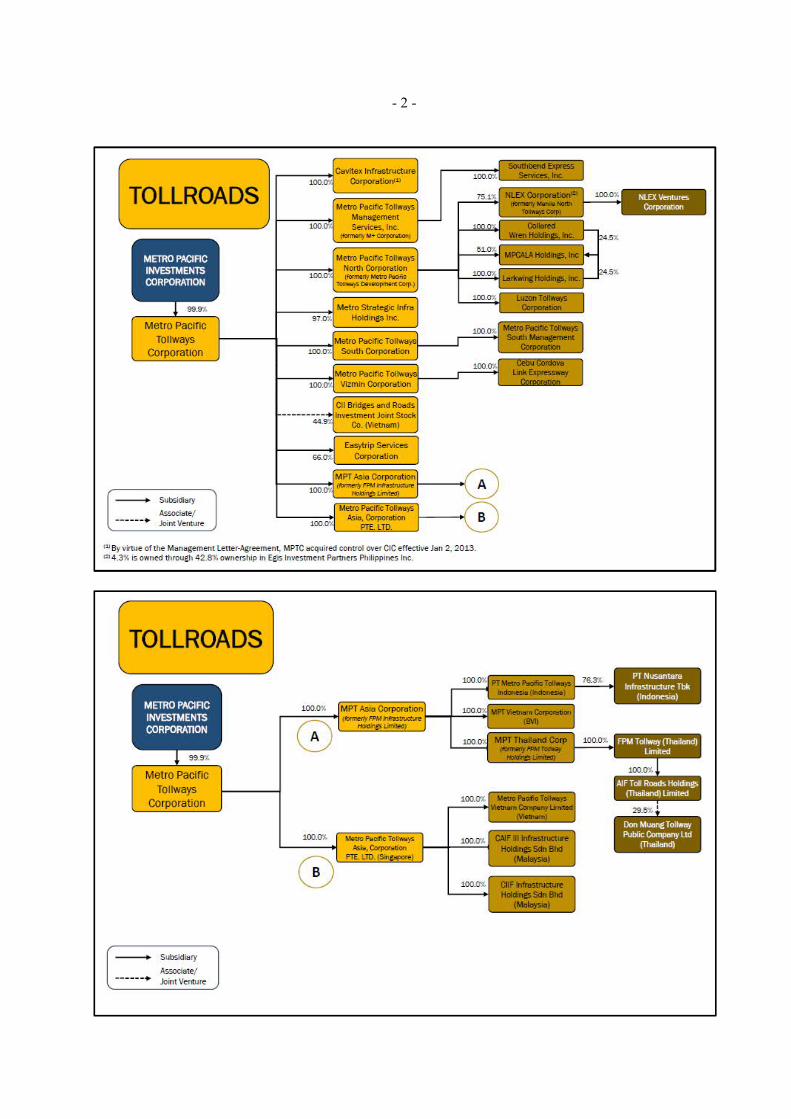
- 2 -
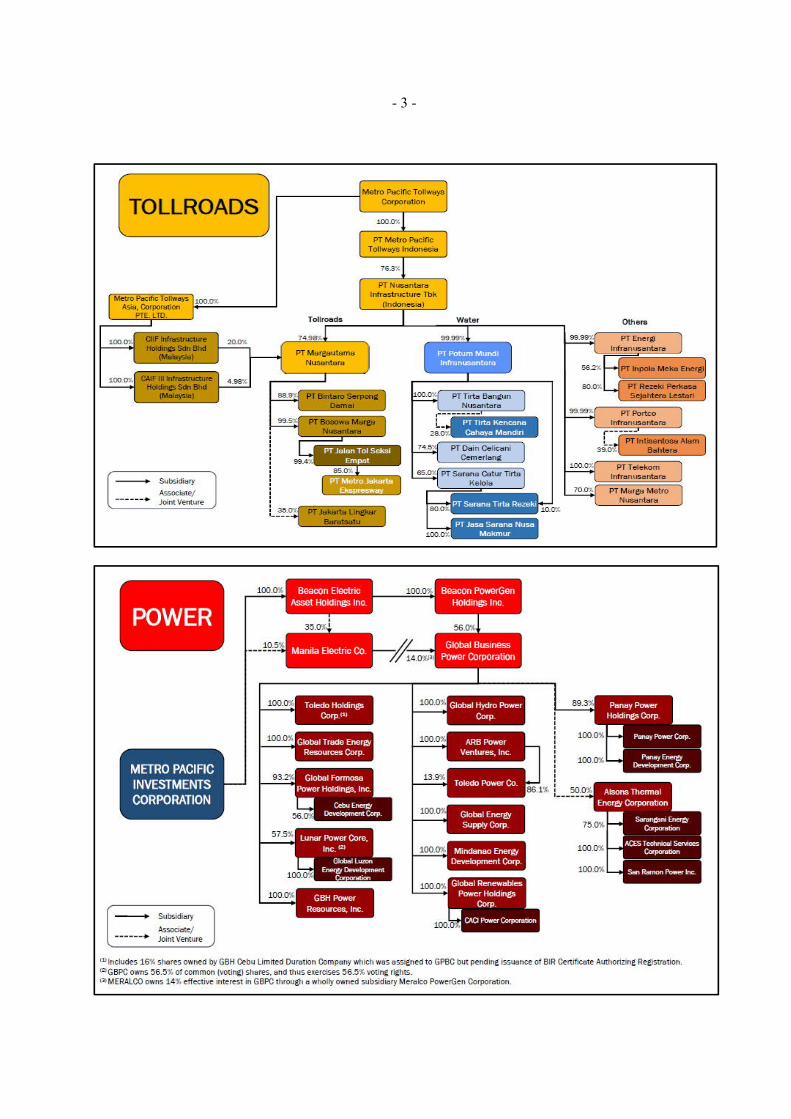
- 3 -
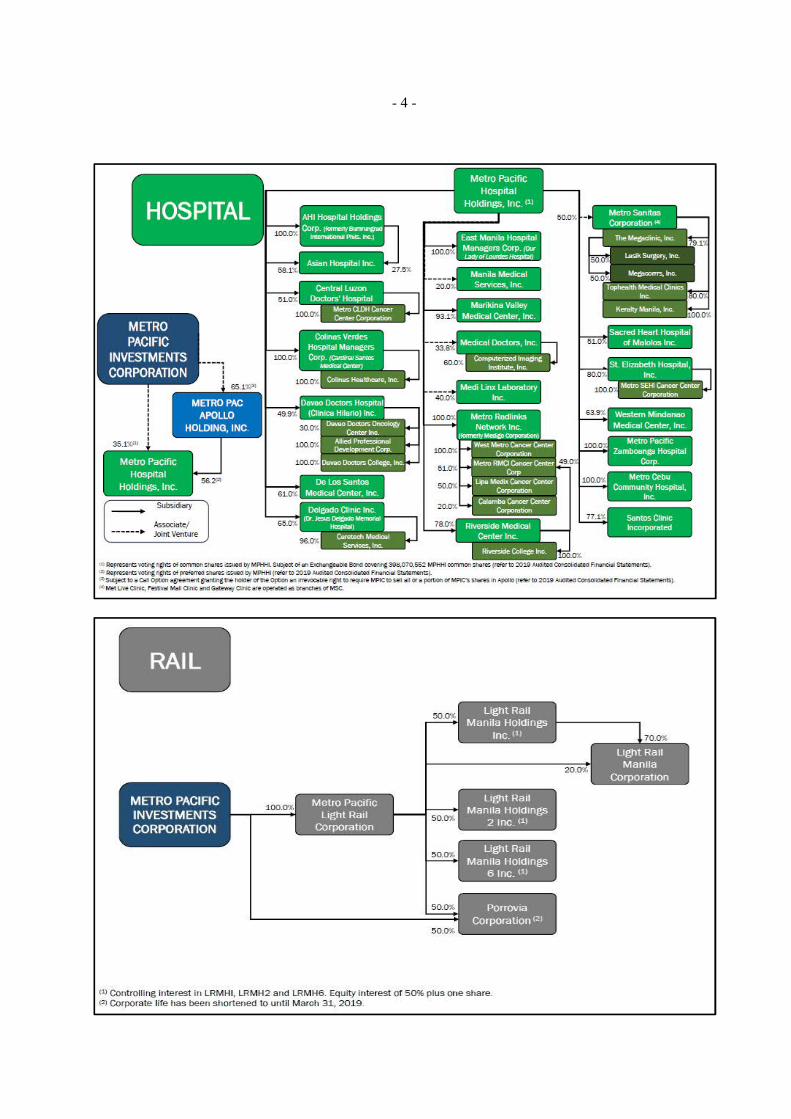
- 4 -
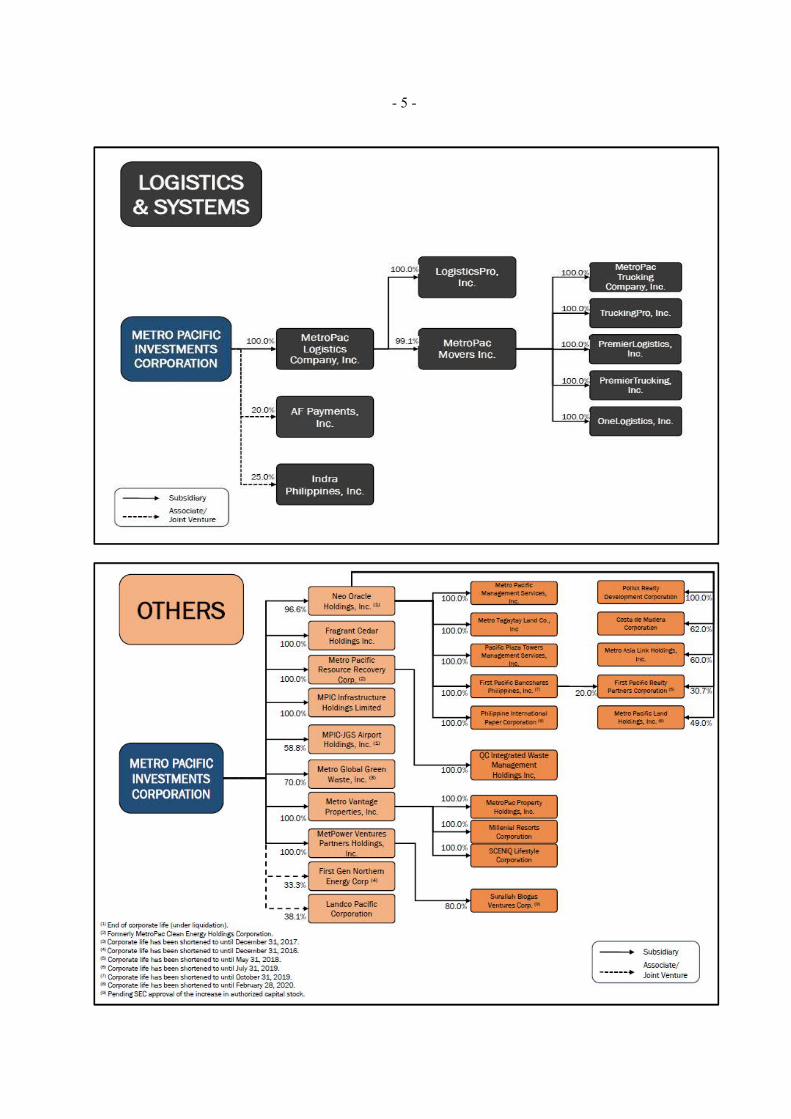
- 5 -
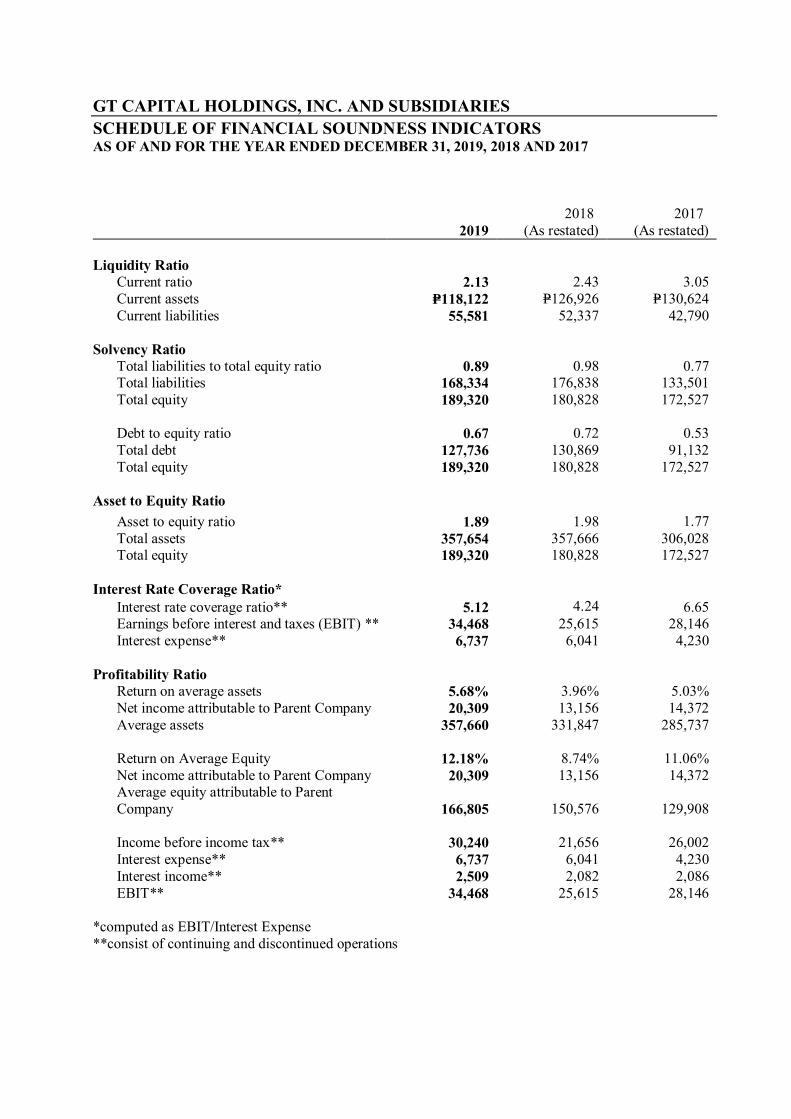
GT CAPITAL HOLDINGS, INC. AND SUBSIDIARIESSCHEDULE OF FINANCIAL SOUNDNESS INDICATORSAS OF AND FOR THE YEAR ENDED DECEMBER 31, 2019, 2018 AND 2017
20192018
(As restated)2017
(As restated)
Liquidity Ratio Current ratio 2.13 2.43 3.05 Current assets P=118,122 P=126,926 P=130,624 Current liabilities 55,581 52,337 42,790
Solvency Ratio Total liabilities to total equity ratio 0.89 0.98 0.77
Total liabilities 168,334 176,838 133,501 Total equity 189,320 180,828 172,527
Debt to equity ratio 0.67 0.72 0.53 Total debt 127,736 130,869 91,132 Total equity 189,320 180,828 172,527
Asset to Equity Ratio Asset to equity ratio 1.89 1.98 1.77 Total assets 357,654 357,666 306,028
Total equity 189,320 180,828 172,527
Interest Rate Coverage Ratio* Interest rate coverage ratio** 5.12 4.24 6.65
Earnings before interest and taxes (EBIT) ** 34,468 25,615 28,146 Interest expense** 6,737 6,041 4,230
Profitability Ratio Return on average assets 5.68% 3.96% 5.03% Net income attributable to Parent Company 20,309 13,156 14,372 Average assets 357,660 331,847 285,737
Return on Average Equity 12.18% 8.74% 11.06% Net income attributable to Parent Company 20,309 13,156 14,372
Average equity attributable to ParentCompany 166,805 150,576 129,908
Income before income tax** 30,240 21,656 26,002 Interest expense** 6,737 6,041 4,230
Interest income** 2,509 2,082 2,086 EBIT** 34,468 25,615 28,146
*computed as EBIT/Interest Expense**consist of continuing and discontinued operations
2 0 5 7 3
SEC Registration Number
M E T R O P O L I T A N B A N K & T R U S T C O M P A N Y
(Company’s Full Name)
M e t r o b a n k P l a z a , S e n . G i l P u y a t
A v e n u e , U r d a n e t a V i l l a g e , M a k a t i
C i t y , M e t r o M a n i l a
(Business Address: No. Street City/Town/Province)
MARILOU C. BARTOLOME-CIRILO 8898-8805 (Contact Person) (Company Telephone Number)
1 2 3 1 1 7 - C 0 4 2 2 Month Day (Form Type) Month Day
(Fiscal Year) (Annual Meeting)
NONE (Secondary License Type, If Applicable)
Dept. Requiring this Doc. Amended Articles Number/Section Total Amount of Borrowings
2,986 Total No. of Stockholders Domestic Foreign
To be accomplished by SEC Personnel concerned
File Number LCU
Document ID Cashier
S T A M P S Remarks: Please use BLACK ink for scanning purposes.
COVER SHEET
SECURITIES AND EXCHANGE COMMISSION SEC FORM 17-C
CURRENT REPORT UNDER SECTION 17
OF THE SECURITIES REGULATION CODE AND SRC RULE 17.2 (C) THEREUNDER
1. February 20, 2020 Date of Report
2. SEC Identification Number 20573 3. BIR Tax Identification No. 000-477-863 4. METROPOLITAN BANK & TRUST COMPANY
Exact name of issuer as specified in its charter 5. Manila 6. (SEC Use Only) Province, country or other Industry Classification Code: jurisdiction of incorporation 7. Metrobank Plaza, Sen. Gil Puyat Avenue
Urdaneta Village, Makati City 1200 Address of principal office Postal Code 8. (02) 8898-8000
Issuer’s telephone number, including area code 9. N.A.
Former name or former address, if changed since last report 10. Securities registered pursuant to Sections 8 and 12 of the SRC or Sections 4 and 8 of
the RSA Title of Each Class Number of Shares of Common Stock Outstanding Common Shares 4,497,415,555 11. Indicate the item numbers reported herein:
Item No. 9 – Other Events
Attached is a copy of the Audited Financial Statements of Metropolitan Bank & Trust Company and Subsidiaries as of December 31, 2019 and 2018 and for the years ended December 31, 2019, 2018 and 2017 and the corresponding Management Discussion and Analysis.

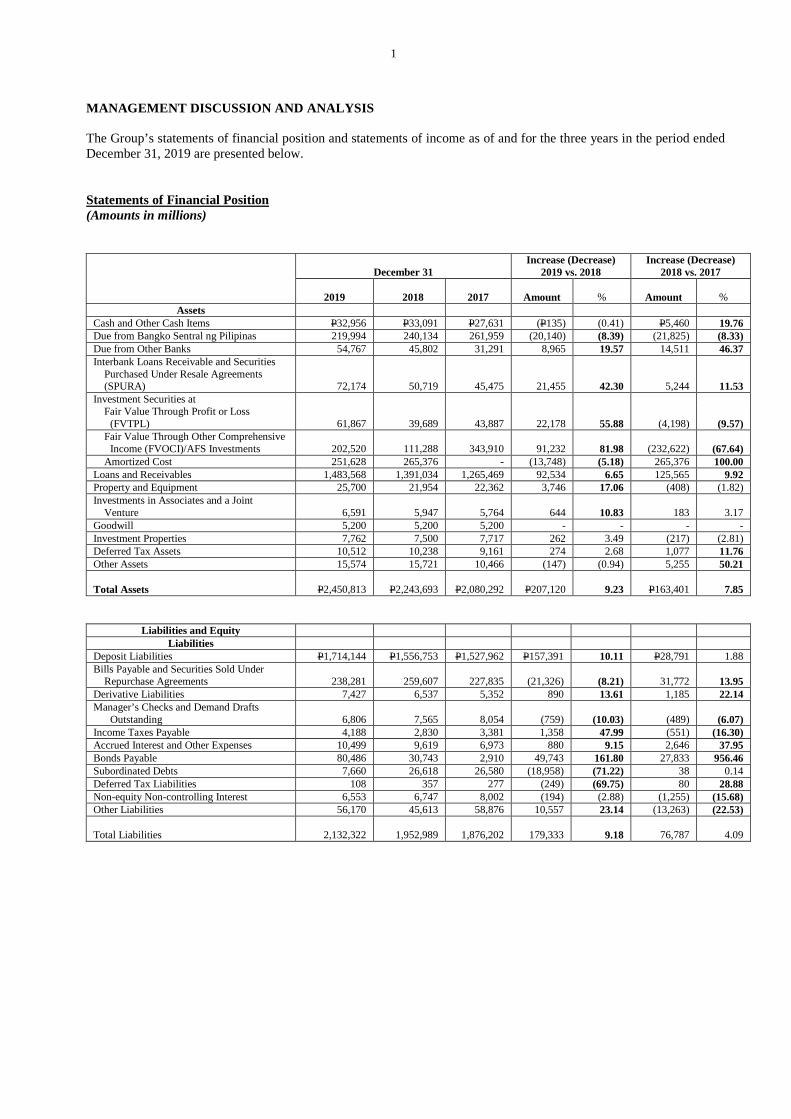
1
MANAGEMENT DISCUSSION AND ANALYSIS The Group’s statements of financial position and statements of income as of and for the three years in the period ended December 31, 2019 are presented below. Statements of Financial Position (Amounts in millions)
December 31
Increase (Decrease) 2019 vs. 2018
Increase (Decrease) 2018 vs. 2017
2019
2018
2017
Amount
%
Amount
%
Liabilities and Equity Liabilities
Deposit Liabilities P1,714,144 P1,556,753 P1,527,962 P157,391 10.11 P28,791 1.88 Bills Payable and Securities Sold Under
Repurchase Agreements
238,281
259,607
227,835
(21,326)
(8.21)
31,772
13.95 Derivative Liabilities 7,427 6,537 5,352 890 13.61 1,185 22.14 Manager’s Checks and Demand Drafts
Outstanding
6,806
7,565
8,054
(759)
(10.03)
(489)
(6.07) Income Taxes Payable 4,188 2,830 3,381 1,358 47.99 (551) (16.30) Accrued Interest and Other Expenses 10,499 9,619 6,973 880 9.15 2,646 37.95 Bonds Payable 80,486 30,743 2,910 49,743 161.80 27,833 956.46 Subordinated Debts 7,660 26,618 26,580 (18,958) (71.22) 38 0.14 Deferred Tax Liabilities 108 357 277 (249) (69.75) 80 28.88 Non-equity Non-controlling Interest 6,553 6,747 8,002 (194) (2.88) (1,255) (15.68) Other Liabilities 56,170 45,613 58,876 10,557 23.14 (13,263) (22.53) Total Liabilities
2,132,322
1,952,989
1,876,202
179,333
9.18
76,787
4.09
Assets Cash and Other Cash Items P32,956 P33,091 P27,631 (P135) (0.41) P5,460 19.76 Due from Bangko Sentral ng Pilipinas 219,994 240,134 261,959 (20,140) (8.39) (21,825) (8.33) Due from Other Banks 54,767 45,802 31,291 8,965 19.57 14,511 46.37 Interbank Loans Receivable and Securities
Purchased Under Resale Agreements (SPURA)
72,174
50,719
45,475
21,455
42.30
5,244
11.53 Investment Securities at
Fair Value Through Profit or Loss (FVTPL)
61,867
39,689
43,887
22,178
55.88
(4,198)
(9.57)
Fair Value Through Other Comprehensive Income (FVOCI)/AFS Investments
202,520
111,288
343,910
91,232
81.98
(232,622)
(67.64)
Amortized Cost 251,628 265,376 - (13,748) (5.18) 265,376 100.00 Loans and Receivables 1,483,568 1,391,034 1,265,469 92,534 6.65 125,565 9.92 Property and Equipment 25,700 21,954 22,362 3,746 17.06 (408) (1.82) Investments in Associates and a Joint
Venture
6,591
5,947
5,764
644
10.83
183
3.17 Goodwill 5,200 5,200 5,200 - - - - Investment Properties 7,762 7,500 7,717 262 3.49 (217) (2.81) Deferred Tax Assets 10,512 10,238 9,161 274 2.68 1,077 11.76 Other Assets 15,574 15,721 10,466 (147) (0.94) 5,255 50.21 Total Assets
P2,450,813
P2,243,693
P2,080,292
P207,120
9.23
P163,401
7.85
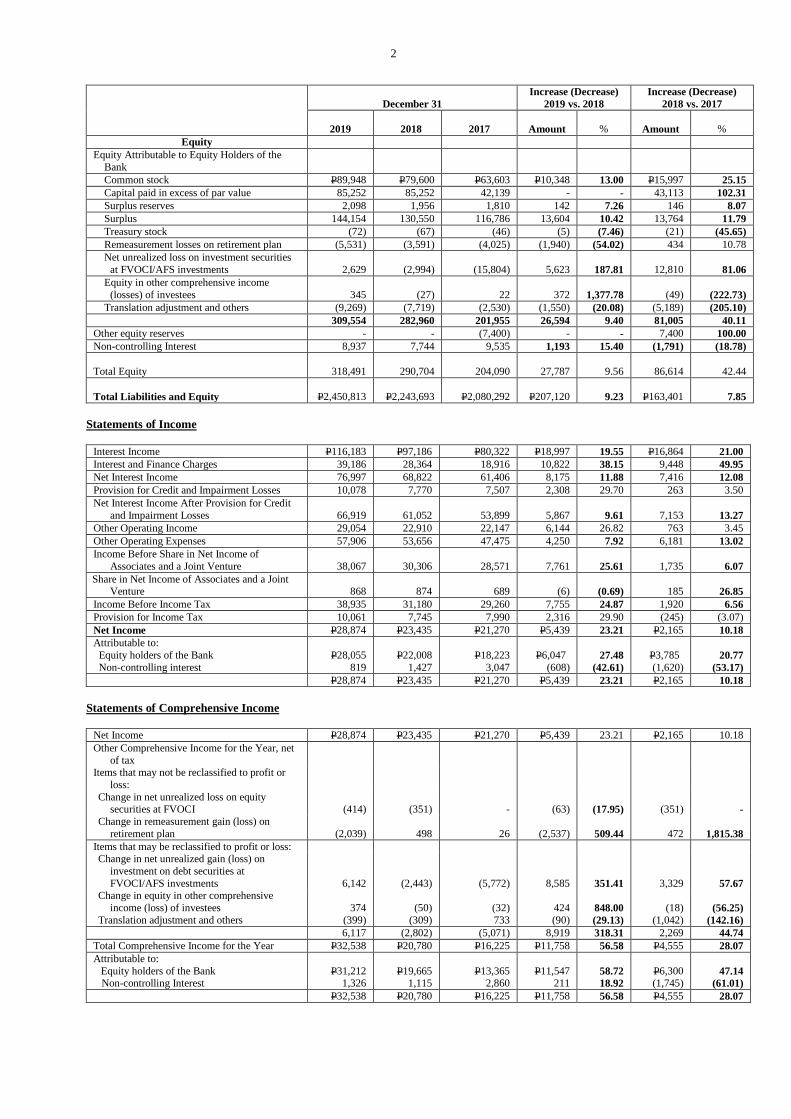
2
December 31
Increase (Decrease) 2019 vs. 2018
Increase (Decrease) 2018 vs. 2017
2019
2018
2017
Amount
%
Amount
%
Equity Equity Attributable to Equity Holders of the
Bank
Common stock P89,948 P79,600 P63,603 P10,348 13.00 P15,997 25.15 Capital paid in excess of par value 85,252 85,252 42,139 - - 43,113 102.31 Surplus reserves 2,098 1,956 1,810 142 7.26 146 8.07 Surplus 144,154 130,550 116,786 13,604 10.42 13,764 11.79 Treasury stock (72) (67) (46) (5) (7.46) (21) (45.65) Remeasurement losses on retirement plan (5,531) (3,591) (4,025) (1,940) (54.02) 434 10.78 Net unrealized loss on investment securities
at FVOCI/AFS investments
2,629
(2,994)
(15,804)
5,623
187.81
12,810
81.06 Equity in other comprehensive income
(losses) of investees
345
(27)
22
372
1,377.78
(49)
(222.73) Translation adjustment and others (9,269) (7,719) (2,530) (1,550) (20.08) (5,189) (205.10)
309,554 282,960 201,955 26,594 9.40 81,005 40.11 Other equity reserves - - (7,400) - - 7,400 100.00 Non-controlling Interest 8,937 7,744 9,535 1,193 15.40 (1,791) (18.78) Total Equity
318,491
290,704
204,090
27,787
9.56
86,614
42.44
Total Liabilities and Equity
P2,450,813
P2,243,693
P2,080,292
P207,120
9.23
P163,401
7.85
Statements of Income
Interest Income P116,183 P97,186 P80,322 P18,997 19.55 P16,864 21.00 Interest and Finance Charges 39,186 28,364 18,916 10,822 38.15 9,448 49.95 Net Interest Income 76,997 68,822 61,406 8,175 11.88 7,416 12.08 Provision for Credit and Impairment Losses 10,078 7,770 7,507 2,308 29.70 263 3.50 Net Interest Income After Provision for Credit
and Impairment Losses
66,919
61,052
53,899
5,867
9.61
7,153
13.27 Other Operating Income 29,054 22,910 22,147 6,144 26.82 763 3.45 Other Operating Expenses 57,906 53,656 47,475 4,250 7.92 6,181 13.02 Income Before Share in Net Income of
Associates and a Joint Venture
38,067
30,306
28,571
7,761
25.61
1,735
6.07 Share in Net Income of Associates and a Joint
Venture
868
874
689
(6)
(0.69)
185
26.85 Income Before Income Tax 38,935 31,180 29,260 7,755 24.87 1,920 6.56 Provision for Income Tax 10,061 7,745 7,990 2,316 29.90 (245) (3.07) Net Income P28,874 P23,435 P21,270 P5,439 23.21 P2,165 10.18 Attributable to: Equity holders of the Bank Non-controlling interest
P28,055
819
P22,008
1,427
P18,223
3,047
P6,047
(608)
27.48
(42.61)
P3,785
(1,620)
20.77
(53.17) P28,874 P23,435 P21,270 P5,439 23.21 P2,165 10.18
Statements of Comprehensive Income
Net Income P28,874 P23,435 P21,270 P5,439 23.21 P2,165 10.18 Other Comprehensive Income for the Year, net
of tax
Items that may not be reclassified to profit or loss:
Change in net unrealized loss on equity securities at FVOCI
(414)
(351)
-
(63)
(17.95)
(351)
-
Change in remeasurement gain (loss) on retirement plan
(2,039)
498
26
(2,537)
509.44
472
1,815.38
Items that may be reclassified to profit or loss: Change in net unrealized gain (loss) on
investment on debt securities at FVOCI/AFS investments
6,142
(2,443)
(5,772)
8,585
351.41
3,329
57.67 Change in equity in other comprehensive
income (loss) of investees
374
(50)
(32)
424
848.00
(18)
(56.25) Translation adjustment and others (399) (309) 733 (90) (29.13) (1,042) (142.16) 6,117 (2,802) (5,071) 8,919 318.31 2,269 44.74
Total Comprehensive Income for the Year P32,538 P20,780 P16,225 P11,758 56.58 P4,555 28.07 Attributable to: Equity holders of the Bank
Non-controlling Interest
P31,212
1,326
P19,665
1,115
P13,365
2,860
P11,547
211
58.72 18.92
P6,300 (1,745)
47.14
(61.01) P32,538 P20,780 P16,225 P11,758 56.58 P4,555 28.07
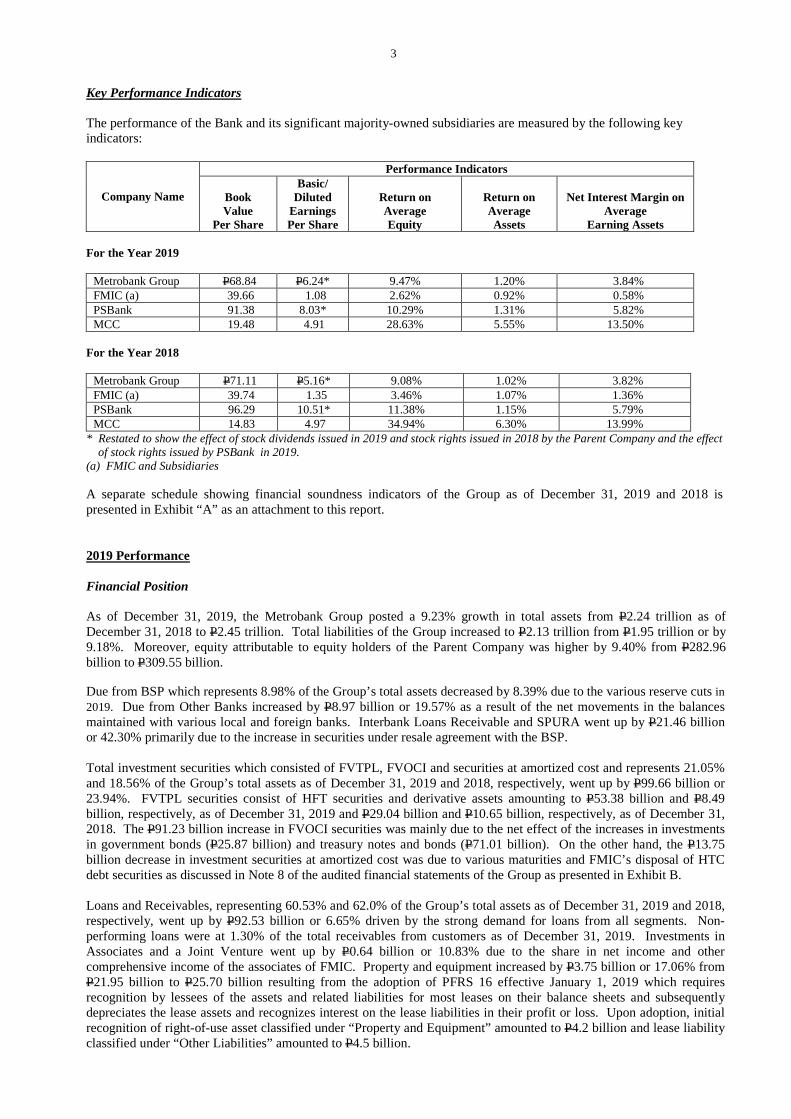
3
Key Performance Indicators The performance of the Bank and its significant majority-owned subsidiaries are measured by the following key indicators:
Company Name
Performance Indicators
Book Value
Per Share
Basic/ Diluted
Earnings Per Share
Return on Average Equity
Return on Average Assets
Net Interest Margin on
Average Earning Assets
For the Year 2019
Metrobank Group P68.84 P6.24* 9.47% 1.20% 3.84% FMIC (a) 39.66 1.08 2.62% 0.92% 0.58% PSBank 91.38 8.03* 10.29% 1.31% 5.82% MCC 19.48 4.91 28.63% 5.55% 13.50%
For the Year 2018
Metrobank Group P71.11 P5.16* 9.08% 1.02% 3.82% FMIC (a) 39.74 1.35 3.46% 1.07% 1.36% PSBank 96.29 10.51* 11.38% 1.15% 5.79% MCC 14.83 4.97 34.94% 6.30% 13.99%
* Restated to show the effect of stock dividends issued in 2019 and stock rights issued in 2018 by the Parent Company and the effect of stock rights issued by PSBank in 2019.
(a) FMIC and Subsidiaries A separate schedule showing financial soundness indicators of the Group as of December 31, 2019 and 2018 is presented in Exhibit “A” as an attachment to this report. 2019 Performance Financial Position As of December 31, 2019, the Metrobank Group posted a 9.23% growth in total assets from P2.24 trillion as of December 31, 2018 to P2.45 trillion. Total liabilities of the Group increased to P2.13 trillion from P1.95 trillion or by 9.18%. Moreover, equity attributable to equity holders of the Parent Company was higher by 9.40% from P282.96 billion to P309.55 billion. Due from BSP which represents 8.98% of the Group’s total assets decreased by 8.39% due to the various reserve cuts in 2019. Due from Other Banks increased by P8.97 billion or 19.57% as a result of the net movements in the balances maintained with various local and foreign banks. Interbank Loans Receivable and SPURA went up by P21.46 billion or 42.30% primarily due to the increase in securities under resale agreement with the BSP. Total investment securities which consisted of FVTPL, FVOCI and securities at amortized cost and represents 21.05% and 18.56% of the Group’s total assets as of December 31, 2019 and 2018, respectively, went up by P99.66 billion or 23.94%. FVTPL securities consist of HFT securities and derivative assets amounting to P53.38 billion and P8.49 billion, respectively, as of December 31, 2019 and P29.04 billion and P10.65 billion, respectively, as of December 31, 2018. The P91.23 billion increase in FVOCI securities was mainly due to the net effect of the increases in investments in government bonds (P25.87 billion) and treasury notes and bonds (P71.01 billion). On the other hand, the P13.75 billion decrease in investment securities at amortized cost was due to various maturities and FMIC’s disposal of HTC debt securities as discussed in Note 8 of the audited financial statements of the Group as presented in Exhibit B. Loans and Receivables, representing 60.53% and 62.0% of the Group’s total assets as of December 31, 2019 and 2018, respectively, went up by P92.53 billion or 6.65% driven by the strong demand for loans from all segments. Non-performing loans were at 1.30% of the total receivables from customers as of December 31, 2019. Investments in Associates and a Joint Venture went up by P0.64 billion or 10.83% due to the share in net income and other comprehensive income of the associates of FMIC. Property and equipment increased by P3.75 billion or 17.06% from P21.95 billion to P25.70 billion resulting from the adoption of PFRS 16 effective January 1, 2019 which requires recognition by lessees of the assets and related liabilities for most leases on their balance sheets and subsequently depreciates the lease assets and recognizes interest on the lease liabilities in their profit or loss. Upon adoption, initial recognition of right-of-use asset classified under “Property and Equipment” amounted to P4.2 billion and lease liability classified under “Other Liabilities” amounted to P4.5 billion.
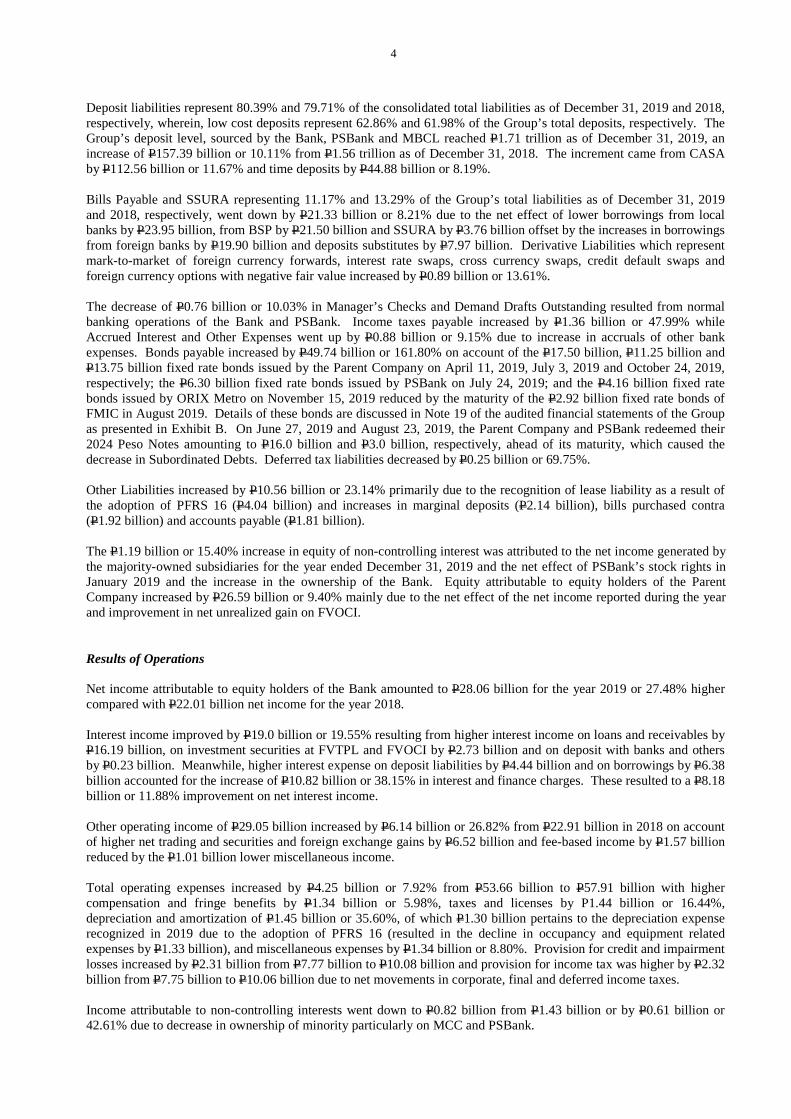
4
Deposit liabilities represent 80.39% and 79.71% of the consolidated total liabilities as of December 31, 2019 and 2018, respectively, wherein, low cost deposits represent 62.86% and 61.98% of the Group’s total deposits, respectively. The Group’s deposit level, sourced by the Bank, PSBank and MBCL reached P1.71 trillion as of December 31, 2019, an increase of P157.39 billion or 10.11% from P1.56 trillion as of December 31, 2018. The increment came from CASA by P112.56 billion or 11.67% and time deposits by P44.88 billion or 8.19%. Bills Payable and SSURA representing 11.17% and 13.29% of the Group’s total liabilities as of December 31, 2019 and 2018, respectively, went down by P21.33 billion or 8.21% due to the net effect of lower borrowings from local banks by P23.95 billion, from BSP by P21.50 billion and SSURA by P3.76 billion offset by the increases in borrowings from foreign banks by P19.90 billion and deposits substitutes by P7.97 billion. Derivative Liabilities which represent mark-to-market of foreign currency forwards, interest rate swaps, cross currency swaps, credit default swaps and foreign currency options with negative fair value increased by P0.89 billion or 13.61%. The decrease of P0.76 billion or 10.03% in Manager’s Checks and Demand Drafts Outstanding resulted from normal banking operations of the Bank and PSBank. Income taxes payable increased by P1.36 billion or 47.99% while Accrued Interest and Other Expenses went up by P0.88 billion or 9.15% due to increase in accruals of other bank expenses. Bonds payable increased by P49.74 billion or 161.80% on account of the P17.50 billion, P11.25 billion and P13.75 billion fixed rate bonds issued by the Parent Company on April 11, 2019, July 3, 2019 and October 24, 2019, respectively; the P6.30 billion fixed rate bonds issued by PSBank on July 24, 2019; and the P4.16 billion fixed rate bonds issued by ORIX Metro on November 15, 2019 reduced by the maturity of the P2.92 billion fixed rate bonds of FMIC in August 2019. Details of these bonds are discussed in Note 19 of the audited financial statements of the Group as presented in Exhibit B. On June 27, 2019 and August 23, 2019, the Parent Company and PSBank redeemed their 2024 Peso Notes amounting to P16.0 billion and P3.0 billion, respectively, ahead of its maturity, which caused the decrease in Subordinated Debts. Deferred tax liabilities decreased by P0.25 billion or 69.75%. Other Liabilities increased by P10.56 billion or 23.14% primarily due to the recognition of lease liability as a result of the adoption of PFRS 16 (P4.04 billion) and increases in marginal deposits (P2.14 billion), bills purchased contra (P1.92 billion) and accounts payable (P1.81 billion). The P1.19 billion or 15.40% increase in equity of non-controlling interest was attributed to the net income generated by the majority-owned subsidiaries for the year ended December 31, 2019 and the net effect of PSBank’s stock rights in January 2019 and the increase in the ownership of the Bank. Equity attributable to equity holders of the Parent Company increased by P26.59 billion or 9.40% mainly due to the net effect of the net income reported during the year and improvement in net unrealized gain on FVOCI. Results of Operations Net income attributable to equity holders of the Bank amounted to P28.06 billion for the year 2019 or 27.48% higher compared with P22.01 billion net income for the year 2018. Interest income improved by P19.0 billion or 19.55% resulting from higher interest income on loans and receivables by P16.19 billion, on investment securities at FVTPL and FVOCI by P2.73 billion and on deposit with banks and others by P0.23 billion. Meanwhile, higher interest expense on deposit liabilities by P4.44 billion and on borrowings by P6.38 billion accounted for the increase of P10.82 billion or 38.15% in interest and finance charges. These resulted to a P8.18 billion or 11.88% improvement on net interest income. Other operating income of P29.05 billion increased by P6.14 billion or 26.82% from P22.91 billion in 2018 on account of higher net trading and securities and foreign exchange gains by P6.52 billion and fee-based income by P1.57 billion reduced by the P1.01 billion lower miscellaneous income. Total operating expenses increased by P4.25 billion or 7.92% from P53.66 billion to P57.91 billion with higher compensation and fringe benefits by P1.34 billion or 5.98%, taxes and licenses by P1.44 billion or 16.44%, depreciation and amortization of P1.45 billion or 35.60%, of which P1.30 billion pertains to the depreciation expense recognized in 2019 due to the adoption of PFRS 16 (resulted in the decline in occupancy and equipment related expenses by P1.33 billion), and miscellaneous expenses by P1.34 billion or 8.80%. Provision for credit and impairment losses increased by P2.31 billion from P7.77 billion to P10.08 billion and provision for income tax was higher by P2.32 billion from P7.75 billion to P10.06 billion due to net movements in corporate, final and deferred income taxes. Income attributable to non-controlling interests went down to P0.82 billion from P1.43 billion or by P0.61 billion or 42.61% due to decrease in ownership of minority particularly on MCC and PSBank.
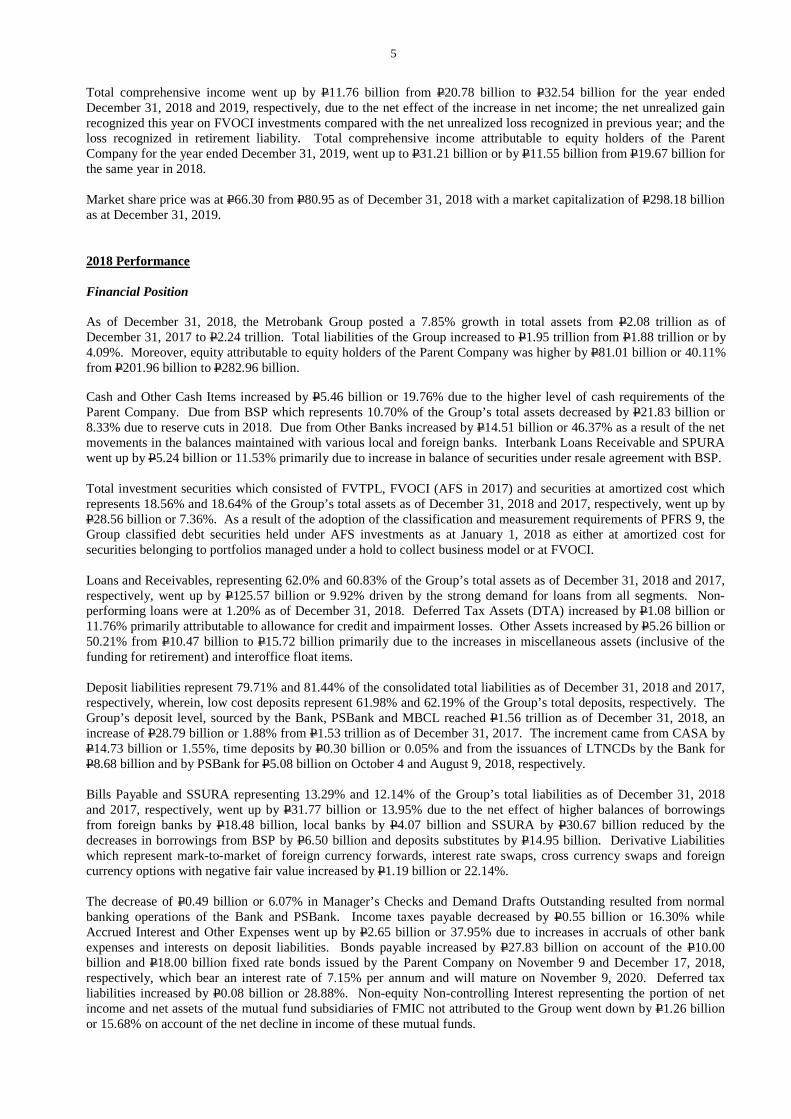
5
Total comprehensive income went up by P11.76 billion from P20.78 billion to P32.54 billion for the year ended December 31, 2018 and 2019, respectively, due to the net effect of the increase in net income; the net unrealized gain recognized this year on FVOCI investments compared with the net unrealized loss recognized in previous year; and the loss recognized in retirement liability. Total comprehensive income attributable to equity holders of the Parent Company for the year ended December 31, 2019, went up to P31.21 billion or by P11.55 billion from P19.67 billion for the same year in 2018. Market share price was at P66.30 from P80.95 as of December 31, 2018 with a market capitalization of P298.18 billion as at December 31, 2019. 2018 Performance Financial Position As of December 31, 2018, the Metrobank Group posted a 7.85% growth in total assets from P2.08 trillion as of December 31, 2017 to P2.24 trillion. Total liabilities of the Group increased to P1.95 trillion from P1.88 trillion or by 4.09%. Moreover, equity attributable to equity holders of the Parent Company was higher by P81.01 billion or 40.11% from P201.96 billion to P282.96 billion. Cash and Other Cash Items increased by P5.46 billion or 19.76% due to the higher level of cash requirements of the Parent Company. Due from BSP which represents 10.70% of the Group’s total assets decreased by P21.83 billion or 8.33% due to reserve cuts in 2018. Due from Other Banks increased by P14.51 billion or 46.37% as a result of the net movements in the balances maintained with various local and foreign banks. Interbank Loans Receivable and SPURA went up by P5.24 billion or 11.53% primarily due to increase in balance of securities under resale agreement with BSP. Total investment securities which consisted of FVTPL, FVOCI (AFS in 2017) and securities at amortized cost which represents 18.56% and 18.64% of the Group’s total assets as of December 31, 2018 and 2017, respectively, went up by P28.56 billion or 7.36%. As a result of the adoption of the classification and measurement requirements of PFRS 9, the Group classified debt securities held under AFS investments as at January 1, 2018 as either at amortized cost for securities belonging to portfolios managed under a hold to collect business model or at FVOCI. Loans and Receivables, representing 62.0% and 60.83% of the Group’s total assets as of December 31, 2018 and 2017, respectively, went up by P125.57 billion or 9.92% driven by the strong demand for loans from all segments. Non-performing loans were at 1.20% as of December 31, 2018. Deferred Tax Assets (DTA) increased by P1.08 billion or 11.76% primarily attributable to allowance for credit and impairment losses. Other Assets increased by P5.26 billion or 50.21% from P10.47 billion to P15.72 billion primarily due to the increases in miscellaneous assets (inclusive of the funding for retirement) and interoffice float items. Deposit liabilities represent 79.71% and 81.44% of the consolidated total liabilities as of December 31, 2018 and 2017, respectively, wherein, low cost deposits represent 61.98% and 62.19% of the Group’s total deposits, respectively. The Group’s deposit level, sourced by the Bank, PSBank and MBCL reached P1.56 trillion as of December 31, 2018, an increase of P28.79 billion or 1.88% from P1.53 trillion as of December 31, 2017. The increment came from CASA by P14.73 billion or 1.55%, time deposits by P0.30 billion or 0.05% and from the issuances of LTNCDs by the Bank for P8.68 billion and by PSBank for P5.08 billion on October 4 and August 9, 2018, respectively. Bills Payable and SSURA representing 13.29% and 12.14% of the Group’s total liabilities as of December 31, 2018 and 2017, respectively, went up by P31.77 billion or 13.95% due to the net effect of higher balances of borrowings from foreign banks by P18.48 billion, local banks by P4.07 billion and SSURA by P30.67 billion reduced by the decreases in borrowings from BSP by P6.50 billion and deposits substitutes by P14.95 billion. Derivative Liabilities which represent mark-to-market of foreign currency forwards, interest rate swaps, cross currency swaps and foreign currency options with negative fair value increased by P1.19 billion or 22.14%. The decrease of P0.49 billion or 6.07% in Manager’s Checks and Demand Drafts Outstanding resulted from normal banking operations of the Bank and PSBank. Income taxes payable decreased by P0.55 billion or 16.30% while Accrued Interest and Other Expenses went up by P2.65 billion or 37.95% due to increases in accruals of other bank expenses and interests on deposit liabilities. Bonds payable increased by P27.83 billion on account of the P10.00 billion and P18.00 billion fixed rate bonds issued by the Parent Company on November 9 and December 17, 2018, respectively, which bear an interest rate of 7.15% per annum and will mature on November 9, 2020. Deferred tax liabilities increased by P0.08 billion or 28.88%. Non-equity Non-controlling Interest representing the portion of net income and net assets of the mutual fund subsidiaries of FMIC not attributed to the Group went down by P1.26 billion or 15.68% on account of the net decline in income of these mutual funds.
6
Other Liabilities decreased by P13.26 billion or 22.53% primarily due to the settlement of the P14.80 billion liability on the agreed purchase of 40% stake in MCC and the funding of the P3.40 billion retirement liability, partially offset by the P1.00 billion increase in marginal deposits and the P2.60 billion unsecured notes issued by ORIX Metro on October 29, 2018. Equity attributable to equity holders of the Parent Company increased by P81.01 billion or 40.11% due to the net effect of the P59.1 billion net proceeds from the stock rights issued by the Parent Company on April 12, 2018, net income reported during the year, net impact of PFRS 9 adoption on Surplus and net unrealized loss on FVOCI/AFS investments, and the P3.18 billion cash dividends declared and paid during the year. The Group also recognized additional equity reserves (included in “Translation adjustment and others”) for the difference between the acquisition price and the acquired remaining non-controlling interest of 20% in MCC. The acquisition of the remaining 20% interest in MCC was completed on September 4, 2018 (“second tranche”) and the Group recognized equity reserves (included in “Translation adjustment and others”) for the difference between the acquisition price and the acquired non-controlling interest amounting to P5.1 billion. Other accounts affected by this transaction were “other equity reserves” and “non-controlling interest”. Results of Operations Net income attributable to equity holders of the Bank amounted to P22.01 billion for the year 2018 compared with P18.22 billion net income for the year 2017. Interest income improved by P16.86 billion or 21.00% resulting from higher interest income on loans and receivables by P16.27 billion and on total investment securities by P0.72 billion net of the P0.14 billion decrease in interest income on interbank loans and SPURA. Meanwhile, the increases in interest expense on deposit liabilities by P6.36 billion and on borrowings by P3.09 billion accounted for the increase of P9.45 billion or 49.95% in interest and finance charges. These resulted to a P7.42 billion or 12.08% increase net interest income. Other operating income of P22.91 billion increased by P0.76 billion or 3.45% from P22.15 billion in 2017 on account of the increases in fee-based income by P1.65 billion, income from leasing by P0.12 billion and profit from disposal of foreclosed properties by P0.30 billion, reduced by lower net trading and securities and foreign exchange gains by P1.10 billion. Provision for credit and impairment losses in 2018 was at P7.77 billion under PFRS 9 compared with P7.51 billion in 2017 under PAS 39 or increased by P0.26 billion or 3.50%. Total other operating expenses increased by P6.18 billion or 13.02% as a result of the increases in compensation and fringe benefits by P2.15 billion or 10.63%, taxes and licenses by P2.20 billion or 33.37% (as a result of changes on tax rates, particularly on documentary stamp taxes, brought about by the implementation of the TRAIN law in 2018), occupancy and equipment-related expenses by P0.26 billion or 9.01% and miscellaneous expenses by P1.51 billion or 10.96%. Provision for income tax was lower by P0.25 billion or 3.07% due to net movements in deferred income tax, corporate and final taxes. Share in net income of associates and a joint venture increased by P0.19 billion or 26.85% due to higher net income of certain associates while income attributable to non-controlling interest went down by P1.62 billion or 53.17% due to the effect of the acquisition of the remaining 20% interest in MCC. Total comprehensive income went up by P4.56 billion from P16.23 billion income in 2017 to P20.78 billion in 2018. The variance was attributable to the higher net income of the Group and the lower net unrealized loss recognized on investment securities. As a result, total comprehensive income attributable to equity holders of the Parent Company went up to P19.67 billion or by P6.30 billion from P13.37 billion in 2017. Market share price was at P80.95 from P101.40 as of December 31, 2017 with a market capitalization of P322.18 billion as at December 31, 2018.
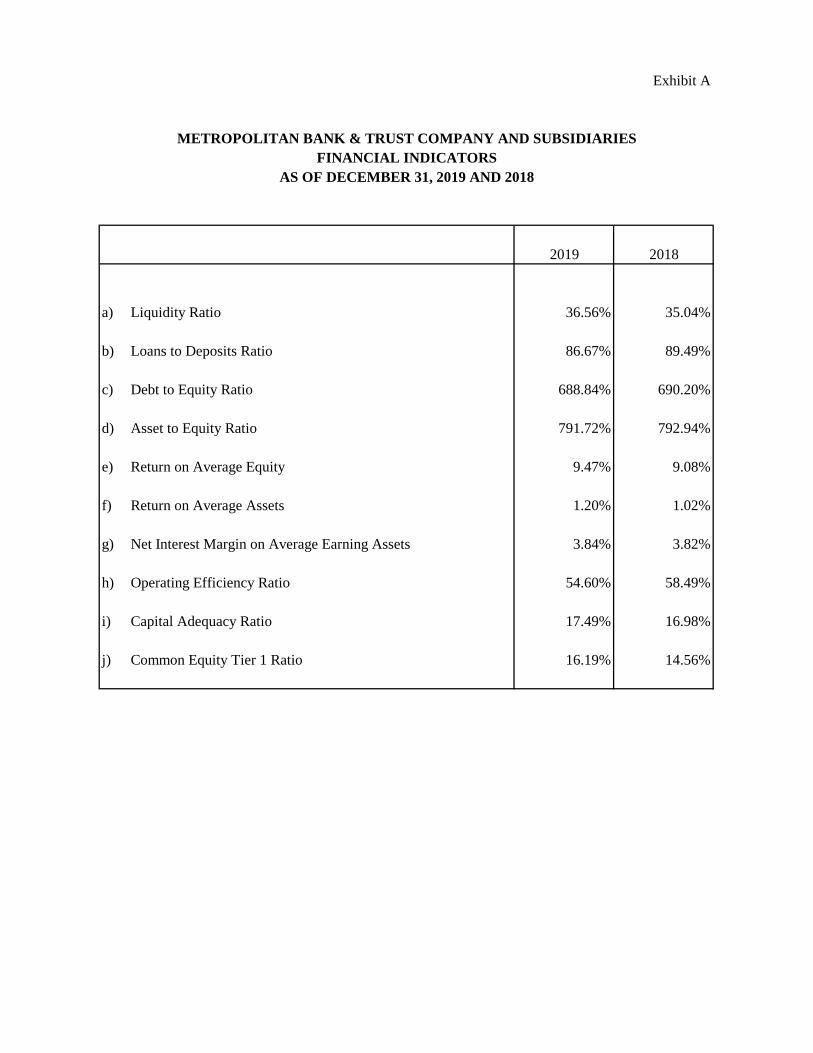
Exhibit A
2019 2018
a) Liquidity Ratio 36.56% 35.04%
b) Loans to Deposits Ratio 86.67% 89.49%
c) Debt to Equity Ratio 688.84% 690.20%
d) Asset to Equity Ratio 791.72% 792.94%
e) Return on Average Equity 9.47% 9.08%
f) Return on Average Assets 1.20% 1.02%
g) Net Interest Margin on Average Earning Assets 3.84% 3.82%
h) Operating Efficiency Ratio 54.60% 58.49%
i) Capital Adequacy Ratio 17.49% 16.98%
j) Common Equity Tier 1 Ratio 16.19% 14.56%
METROPOLITAN BANK & TRUST COMPANY AND SUBSIDIARIESFINANCIAL INDICATORS
AS OF DECEMBER 31, 2019 AND 2018
*SGVFS038804*
INDEPENDENT AUDITOR’S REPORT
The Board of Directors and StockholdersMetropolitan Bank & Trust CompanyMetrobank Plaza, Sen. Gil Puyat AvenueUrdaneta Village, Makati CityMetro Manila, Philippines
Report on the Consolidated and Parent Company Financial Statements
Opinion
We have audited the consolidated financial statements of Metropolitan Bank & Trust Company and itssubsidiaries (the Group) and the parent company financial statements of Metropolitan Bank & TrustCompany (the Parent Company), which comprise the consolidated and parent company statements offinancial position as at December 31, 2019 and 2018, and the consolidated and parent companystatements of income, consolidated and parent company statements of comprehensive income,consolidated and parent company statements of changes in equity and consolidated and parent companystatements of cash flows for each of the three years in the period ended December 31, 2019, and notes tothe consolidated and parent company financial statements, including a summary of significant accountingpolicies.
In our opinion, the accompanying consolidated and parent company financial statements present fairly, inall material respects, the financial position of the Group and the Parent Company as atDecember 31, 2019 and 2018, and their financial performance and their cash flows for each of the threeyears in the period ended December 31, 2019, in accordance with Philippine Financial ReportingStandards (PFRS).
Basis for Opinion
We conducted our audits in accordance with Philippine Standards on Auditing (PSAs). Ourresponsibilities under those standards are further described in the Auditor’s Responsibilities for the Auditof the Consolidated and Parent Company Financial Statements section of our report. We are independentof the Group and the Parent Company in accordance with the Code of Ethics for ProfessionalAccountants in the Philippines (Code of Ethics) together with the ethical requirements that are relevant toour audit of the consolidated and parent company financial statements in the Philippines, and we havefulfilled our other ethical responsibilities in accordance with these requirements and the Code of Ethics.We believe that the audit evidence we have obtained is sufficient and appropriate to provide a basis forour opinion.
SyCip Gorres Velayo & Co.6760 Ayala Avenue1226 Makati CityPhilippines
Tel: (632) 891 0307Fax: (632) 819 0872ey.com/ph
BOA/PRC Reg. No. 0001, October 4, 2018, valid until August 24, 2021SEC Accreditation No. 0012-FR-5 (Group A), November 6, 2018, valid until November 5, 2021
A member firm of Ernst & Young Global Limited
*SGVFS038804*
- 2 -
Key Audit Matters
Key audit matters are those matters that, in our professional judgment, were of most significance in ouraudit of the consolidated and parent company financial statements of the current period. These matterswere addressed in the context of our audit of the consolidated and parent company financial statements asa whole, and in forming our opinion thereon, and we do not provide a separate opinion on these matters.For each matter below, our description of how our audit addressed the matter is provided in that context.
We have fulfilled the responsibilities described in the Auditor’s Responsibilities for the Audit of theConsolidated and Parent Company Financial Statements section of our report, including in relation tothese matters. Accordingly, our audit included the performance of procedures designed to respond to ourassessment of the risks of material misstatement of the consolidated and parent company financialstatements. The results of our audit procedures, including the procedures performed to address thematters below, provide the basis for our audit opinion on the accompanying consolidated and parentcompany financial statements.
Applicable to the audit of the consolidated and parent company financial statements
Adoption of PFRS 16, LeasesEffective January 1, 2019, the Group and the Parent Company adopted PFRS 16, Leases, under themodified retrospective approach which resulted in significant changes in the Group’s and the ParentCompany’s accounting policy for leases. The Group’s and the Parent Company’s adoption of PFRS 16 issignificant to our audit because the Group and the Parent Company have high volume of leaseagreements; the recorded amounts are material to the consolidated and parent company financialstatements; and adoption involves application of significant judgment and estimation in determining thelease term, including evaluating whether the Group and the Parent Company are reasonably certain toexercise options to extend or terminate the lease, and in determining the incremental borrowing rate. Thisresulted in the recognition of right-of-use assets amounting to P=4.2 billion and P=2.2 billion for the Groupand Parent Company, respectively, and lease liability amounting to P=4.5 billion and P=2.4 billion for theGroup and Parent Company, respectively, as of January 1, 2019, and the recognition of depreciationexpense of P=1.3 billion and P=687.0 million for the Group and Parent Company, respectively, and interestexpense of P=319.3 million and P=169.9 million for the Group and Parent Company, respectively, for theyear ended December 31, 2019.
The disclosures related to the adoption of PFRS 16 are included in Notes 2, 10 and 13 to the financialstatements.
Audit responseWe obtained an understanding of the Group’s and the Parent Company’s process in implementing thenew standard, including the determination of the population of the lease contracts covered by PFRS 16,the application of the short-term and low value assets exemptions, the selection of the transition approachand any election of available practical expedients. We tested the completeness of the population of leaseagreements by comparing the number of leases per operational report against the master lease schedule.On a test basis, we inspected lease agreements (i.e., lease agreements existing prior to the adoption ofPFRS 16 and new lease agreements) from the master lease schedule, identified their contractual terms andconditions, and traced these contractual terms and conditions to the lease calculation prepared bymanagement, which covers the calculation of the financial impact of PFRS 16, including the transitionadjustments.
A member firm of Ernst & Young Global Limited
*SGVFS038804*
- 3 -
For selected lease contracts with renewal and/or termination option, we reviewed the management’sassessment of whether it is reasonably certain that the Group and the Parent Company will exercise theoption to renew or not exercise the option to terminate. We tested the parameters used in thedetermination of the incremental borrowing rate by reference to market data. We test computed the leasecalculation prepared by management on a sample basis, including the transition adjustments.
We reviewed the disclosures related to the transition adjustments based on the requirements of PFRS 16and PAS 8, Accounting Policies, Changes in Accounting Estimates and Errors.
Allowance for Credit LossesThe Group’s and the Parent Company’s application of the Expected Credit Loss (ECL) model incalculating the allowance for credit losses is significant to our audit as it involves the exercise ofsignificant management judgment. Key areas of judgment include: segmenting the Group’s and theParent Company’s credit risk exposures; determining the method to estimate ECL; defining default;identifying exposures with significant deterioration in credit quality; determining assumptions to be usedin the ECL model such as the counterparty credit risk rating, the expected life of the financial asset andexpected recoveries from defaulted accounts; and incorporating forward-looking information (calledoverlays) in calculating ECL.
Allowance for credit losses as of December 31, 2019 for the Group and the Parent Company amounted toP=24.3 billion and P=13.9 billion, respectively. Provision for credit losses of the Group and the ParentCompany in 2019 amounted to P=9.6 billion and P=1.6 billion, respectively.
Refer to Note 15 of the financial statements for the disclosure on the details of the allowance for creditlosses using the ECL model.
Audit responseWe obtained an understanding of the board-approved methodologies and models used for the Group’s andthe Parent Company’s different credit exposures and assessed whether these considered the requirementsof PFRS 9 to reflect an unbiased and probability-weighted outcome, and to consider time value of moneyand the best available forward-looking information.
We (a) assessed the Group’s and the Parent Company’s segmentation of its credit risk exposures based onhomogeneity of credit risk characteristics; (b) tested the definition of default and significant increase incredit risk criteria against historical analysis of accounts and credit risk management policies andpractices in place; (c) tested the Group’s and the Parent Company’s application of internal credit riskrating system by reviewing the ratings of sample credit exposures; (d) assessed whether expected life isdifferent from the contractual life by testing the maturity dates reflected in the Group’s and the ParentCompany’s records and considering management’s assumptions regarding future collections, advances,extensions, renewals and modifications; (e) tested loss given default by inspecting historical recoveriesand related costs, write-offs and collateral valuations; (f) tested exposure at default consideringoutstanding commitments and repayment scheme; (g) checked the reasonableness of forward-lookinginformation used for overlay through statistical test and corroboration using publicly availableinformation and our understanding of the Group’s and the Parent Company’s lending portfolios andbroader industry knowledge; and (h) tested the effective interest rate used in discounting the expectedloss.
A member firm of Ernst & Young Global Limited
*SGVFS038804*
- 4 -
Further, we checked the data used in the ECL models by reconciling data from source system reports tothe data warehouse and from the data warehouse to the loss allowance analysis/models and financialreporting systems. To the extent that the loss allowance analysis is based on credit exposures that havebeen disaggregated into subsets of debt financial assets with similar risk characteristics, we traced or re-performed the disaggregation from source systems to the loss allowance analysis. We also assessed theassumptions used where there are missing or insufficient data.
We recalculated impairment provisions on a sample basis. We reviewed the completeness of thedisclosures made in the financial statements.
We involved our internal specialists in the performance of the above procedures.
Applicable to the audit of the consolidated financial statements
Recoverability of Investments in Associates and a Joint VentureThe Group assesses the impairment of its investments in associates and a joint venture whenever eventsor changes in circumstances indicate that the carrying amount of the investments may not be recoverable.As of December 31, 2019, the Group has an investment in associate amounting to P=2.0 billion where itsfair value declined significantly compared to the carrying value. The Group performed impairmenttesting using the investment’s value-in-use (VIU). We considered the impairment testing of the Group’sinvestment in this associate as a key audit matter as significant judgment and estimates are involved in thedetermination of the investment’s VIU.
The disclosures relating to investments in associates and a joint venture are included in Notes 3 and 11 tothe financial statements.
Audit responseWe discussed with management the investee’s current business performance and prospects and how thesewere reflected in the Group’s VIU calculation. We involved our internal specialist in evaluating themethodology and assumptions used. We compared the expected production volume and capitalexpenditures used in the calculation to the historical performance and plans of the investee, and the priceassumption, exchange rates and long-term growth rate to available industry, economic and financial dataincluding consensus market forecasts. We also tested whether the discount rate used represents currentmarket assessment of risks associated with the investment.
Recoverability of GoodwillAs of December 31, 2019, the Group has goodwill amounting to P=5.2 billion as a result of variousbusiness acquisitions. Under PFRS, the Group is required to annually test the amount of goodwill forimpairment. The Group performed the impairment testing using the cash generating unit’s (CGU) fairvalue less costs to sell (FVLCTS). The annual impairment test was significant to our audit becausesignificant judgment and estimates are involved in the determination of the CGU’s FVLCTS. The CGU’sassets include significant investments in unquoted equity shares and their fair values were determinedusing price-to-earnings (P/E) ratios of comparable companies. Other assets of the CGU includeinvestments in quoted equity shares and debt financial assets, and real properties, while liabilities includeunquoted debt financial liabilities.
The disclosures in relation to goodwill are included in Notes 3 and 11 to the financial statements.
A member firm of Ernst & Young Global Limited
*SGVFS038804*
- 5 -
Audit responseWe involved our internal specialist in evaluating the assumptions and methodology used by the Group indetermining the FVLCTS of the CGU, in particular those relating to the use of P/E ratios of comparablecompanies in the valuation of the unquoted equity shares. We tested the fair value of the other assets andliabilities by referring to the quoted prices of listed equity and debt instruments, agreeing the appraisedvalues of real estate properties to the appraisal reports, comparing the future cash flows of unquoted debtinstruments to the related contracts, and testing the discount rate if based on prevailing interest rates forsimilar instruments. We also re-performed the calculation of the FVLCTS.
Other Information
Management is responsible for the other information. The other information comprises the informationincluded in the SEC Form 20-IS (Definitive Information Statement), SEC Form 17-A and Annual Reportfor the year ended December 31, 2019, but does not include the consolidated and parent companyfinancial statements and our auditor’s report thereon. The SEC Form 20-IS (Definitive InformationStatement), SEC Form 17-A and Annual Report for the year ended December 31, 2019 are expected to bemade available to us after the date of this auditor’s report.
Our opinion on the consolidated and parent company financial statements does not cover the otherinformation and we will not express any form of assurance conclusion thereon.
In connection with our audits of the consolidated and parent company financial statements, ourresponsibility is to read the other information identified above when it becomes available and, in doingso, consider whether the other information is materially inconsistent with the consolidated and parentcompany financial statements or our knowledge obtained in the audits, or otherwise appears to bematerially misstated.
Responsibilities of Management and Those Charged with Governance for the Consolidated andParent Company Financial Statements
Management is responsible for the preparation and fair presentation of the consolidated and parentcompany financial statements in accordance with PFRS, and for such internal control as managementdetermines is necessary to enable the preparation of consolidated and parent company financialstatements that are free from material misstatement, whether due to fraud or error.
In preparing the consolidated and parent company financial statements, management is responsible forassessing the Group’s and the Parent Company’s ability to continue as a going concern, disclosing, asapplicable, matters related to going concern and using the going concern basis of accounting unlessmanagement either intends to liquidate the Group and the Parent Company or to cease operations, or hasno realistic alternative but to do so.
Those charged with governance are responsible for overseeing the Group’s and the Parent Company’sfinancial reporting process.
A member firm of Ernst & Young Global Limited
*SGVFS038804*
- 6 -
Auditor’s Responsibilities for the Audit of the Consolidated and Parent Company FinancialStatements
Our objectives are to obtain reasonable assurance about whether the consolidated and parent companyfinancial statements as a whole are free from material misstatement, whether due to fraud or error, and toissue an auditor’s report that includes our opinion. Reasonable assurance is a high level of assurance, butis not a guarantee that an audit conducted in accordance with PSAs will always detect a materialmisstatement when it exists. Misstatements can arise from fraud or error and are considered material if,individually or in the aggregate, they could reasonably be expected to influence the economic decisions ofusers taken on the basis of these consolidated and parent company financial statements.
As part of an audit in accordance with PSAs, we exercise professional judgment and maintainprofessional skepticism throughout the audit. We also:
· Identify and assess the risks of material misstatement of the consolidated and parent companyfinancial statements, whether due to fraud or error, design and perform audit procedures responsive tothose risks, and obtain audit evidence that is sufficient and appropriate to provide a basis for ouropinion. The risk of not detecting a material misstatement resulting from fraud is higher than for oneresulting from error, as fraud may involve collusion, forgery, intentional omissions,misrepresentations, or the override of internal control.
· Obtain an understanding of internal control relevant to the audit in order to design audit proceduresthat are appropriate in the circumstances, but not for the purpose of expressing an opinion on theeffectiveness of the Group’s and the Parent Company’s internal control.
· Evaluate the appropriateness of accounting policies used and the reasonableness of accountingestimates and related disclosures made by management.
· Conclude on the appropriateness of management’s use of the going concern basis of accounting and,based on the audit evidence obtained, whether a material uncertainty exists related to events orconditions that may cast significant doubt on the Group’s and the Parent Company’s ability tocontinue as a going concern. If we conclude that a material uncertainty exists, we are required todraw attention in our auditor’s report to the related disclosures in the consolidated and parentcompany financial statements or, if such disclosures are inadequate, to modify our opinion. Ourconclusions are based on the audit evidence obtained up to the date of our auditor’s report. However,future events or conditions may cause the Group and the Parent Company to cease to continue as agoing concern.
· Evaluate the overall presentation, structure and content of the consolidated and parent companyfinancial statements, including the disclosures, and whether the consolidated and parent companyfinancial statements represent the underlying transactions and events in a manner that achieves fairpresentation.
· Obtain sufficient appropriate audit evidence regarding the financial information of the entities orbusiness activities within the Group to express an opinion on the consolidated financial statements.We are responsible for the direction, supervision and performance of the audit. We remain solelyresponsible for our audit opinion.
We communicate with those charged with governance regarding, among other matters, the planned scopeand timing of the audit and significant audit findings, including any significant deficiencies in internalcontrol that we identify during our audit.
A member firm of Ernst & Young Global Limited
*SGVFS038804*
- 7 -
We also provide those charged with governance with a statement that we have complied with relevantethical requirements regarding independence, and to communicate with them all relationships and othermatters that may reasonably be thought to bear on our independence, and where applicable, relatedsafeguards.
From the matters communicated with those charged with governance, we determine those matters thatwere of most significance in the audit of the consolidated and parent company financial statements of thecurrent period and are therefore the key audit matters. We describe these matters in our auditor’s reportunless law or regulation precludes public disclosure about the matter or when, in extremely rarecircumstances, we determine that a matter should not be communicated in our report because the adverseconsequences of doing so would reasonably be expected to outweigh the public interest benefits of suchcommunication.
Report on the Supplementary Information Required Under Revenue Regulations No. 15-2010
Our audits were conducted for the purpose of forming an opinion on the basic financial statements takenas a whole. The supplementary information required under Revenue Regulations No. 15-2010 in Note 37to the financial statements is presented for purposes of filing with the Bureau of Internal Revenue and isnot a required part of the basic financial statements. Such information is the responsibility of themanagement of the Parent Company. The information has been subjected to the auditing proceduresapplied in our audit of the basic financial statements. In our opinion, the information is fairly stated, in allmaterial respects, in relation to the basic financial statements taken as a whole.
The engagement partner on the audit resulting in this independent auditor’s report isJosephine Adrienne A. Abarca
SYCIP GORRES VELAYO & CO.
Josephine Adrienne A. AbarcaPartnerCPA Certificate No. 92126SEC Accreditation No. 0466-AR-4 (Group A), November 13, 2018, valid until November 12, 2021Tax Identification No. 163-257-145BIR Accreditation No. 08-001998-61-2018, February 26, 2018, valid until February 25, 2021PTR No. 8125200, January 7, 2020, Makati City
February 19, 2020
A member firm of Ernst & Young Global Limited
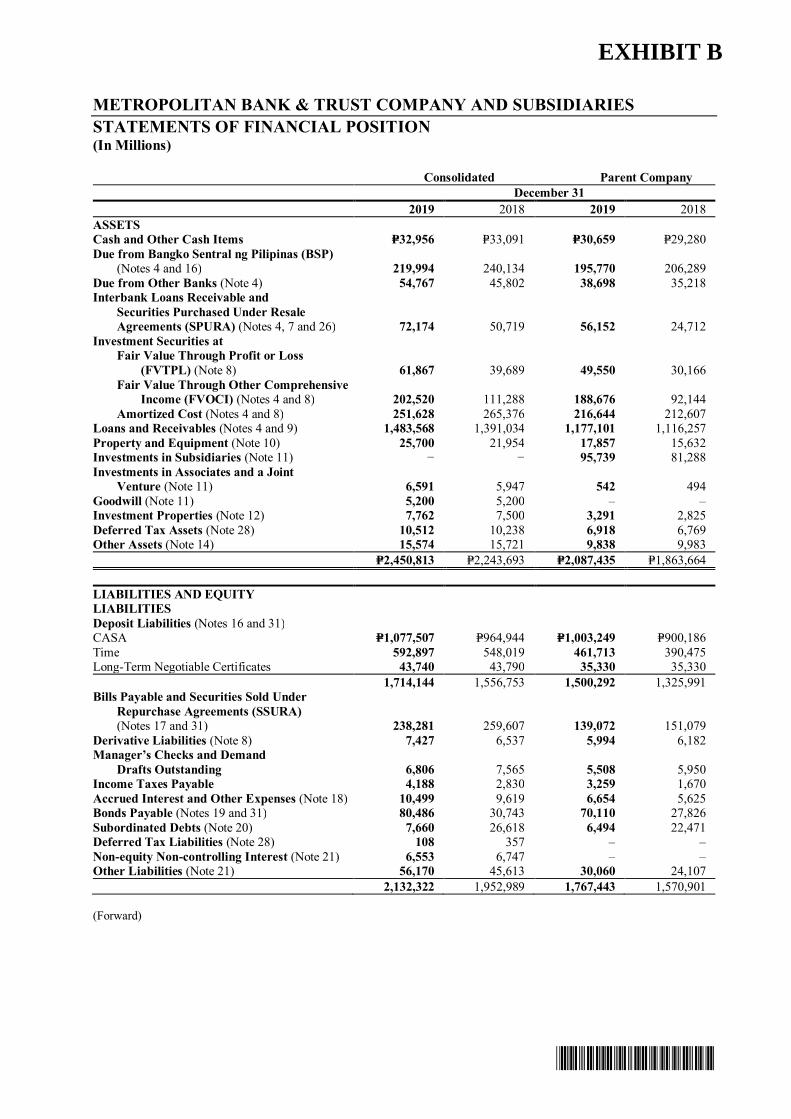
*SGVFS038804*
METROPOLITAN BANK & TRUST COMPANY AND SUBSIDIARIESSTATEMENTS OF FINANCIAL POSITION(In Millions)
Consolidated Parent CompanyDecember 31
2019 2018 2019 2018ASSETSCash and Other Cash Items P=32,956 P=33,091 P=30,659 P=29,280Due from Bangko Sentral ng Pilipinas (BSP)
(Notes 4 and 16) 219,994 240,134 195,770 206,289Due from Other Banks (Note 4) 54,767 45,802 38,698 35,218Interbank Loans Receivable and Securities Purchased Under Resale Agreements (SPURA) (Notes 4, 7 and 26) 72,174 50,719 56,152 24,712Investment Securities at
Fair Value Through Profit or Loss (FVTPL) (Note 8) 61,867 39,689 49,550 30,166Fair Value Through Other Comprehensive Income (FVOCI) (Notes 4 and 8) 202,520 111,288 188,676 92,144Amortized Cost (Notes 4 and 8) 251,628 265,376 216,644 212,607
Loans and Receivables (Notes 4 and 9) 1,483,568 1,391,034 1,177,101 1,116,257Property and Equipment (Note 10) 25,700 21,954 17,857 15,632Investments in Subsidiaries (Note 11) − − 95,739 81,288Investments in Associates and a Joint Venture (Note 11) 6,591 5,947 542 494Goodwill (Note 11) 5,200 5,200 ‒ ‒Investment Properties (Note 12) 7,762 7,500 3,291 2,825Deferred Tax Assets (Note 28) 10,512 10,238 6,918 6,769Other Assets (Note 14) 15,574 15,721 9,838 9,983
P=2,450,813 P=2,243,693 P=2,087,435 P=1,863,664
LIABILITIES AND EQUITYLIABILITIESDeposit Liabilities (Notes 16 and 31)CASA P=1,077,507 P=964,944 P=1,003,249 P=900,186Time 592,897 548,019 461,713 390,475Long-Term Negotiable Certificates 43,740 43,790 35,330 35,330
1,714,144 1,556,753 1,500,292 1,325,991Bills Payable and Securities Sold Under Repurchase Agreements (SSURA)
(Notes 17 and 31) 238,281 259,607 139,072 151,079Derivative Liabilities (Note 8) 7,427 6,537 5,994 6,182Manager’s Checks and Demand Drafts Outstanding 6,806 7,565 5,508 5,950Income Taxes Payable 4,188 2,830 3,259 1,670Accrued Interest and Other Expenses (Note 18) 10,499 9,619 6,654 5,625Bonds Payable (Notes 19 and 31) 80,486 30,743 70,110 27,826Subordinated Debts (Note 20) 7,660 26,618 6,494 22,471Deferred Tax Liabilities (Note 28) 108 357 – –Non-equity Non-controlling Interest (Note 21) 6,553 6,747 – ‒Other Liabilities (Note 21) 56,170 45,613 30,060 24,107
2,132,322 1,952,989 1,767,443 1,570,901
(Forward)
EXHIBIT B
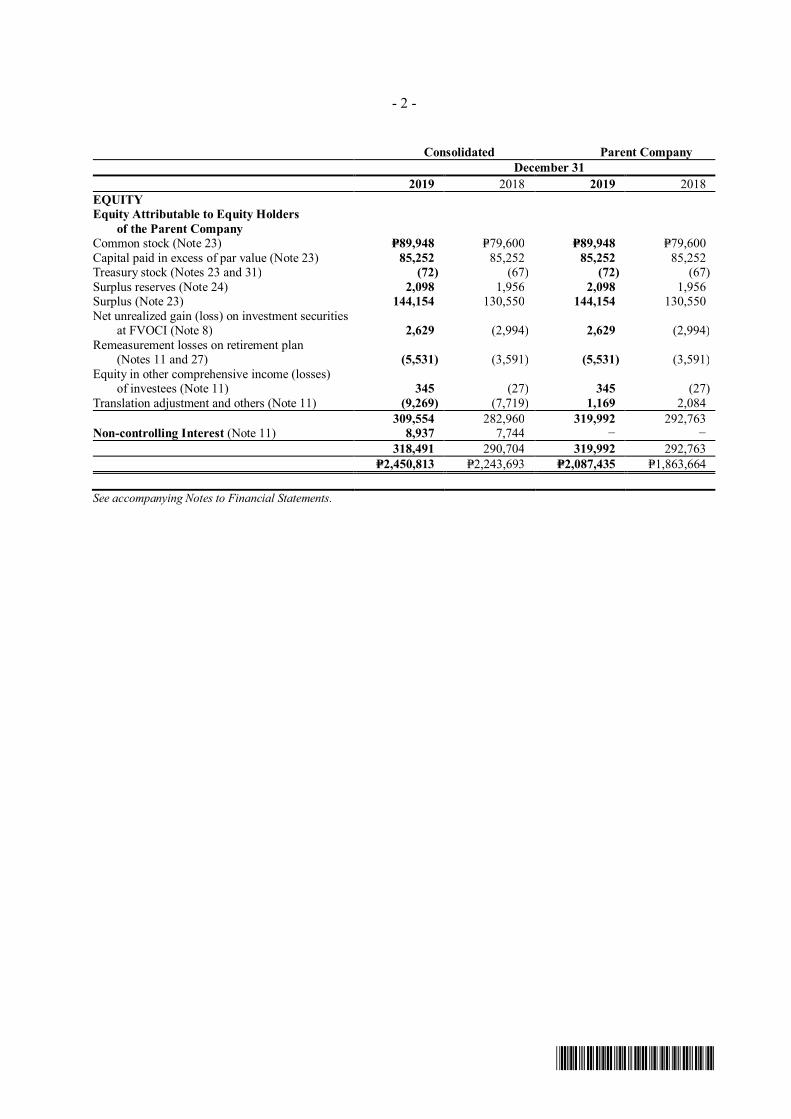
*SGVFS038804*
- 2 -
Consolidated Parent CompanyDecember 31
2019 2018 2019 2018EQUITYEquity Attributable to Equity Holders of the Parent CompanyCommon stock (Note 23) P=89,948 P=79,600 P=89,948 P=79,600Capital paid in excess of par value (Note 23) 85,252 85,252 85,252 85,252Treasury stock (Notes 23 and 31) (72) (67) (72) (67)Surplus reserves (Note 24) 2,098 1,956 2,098 1,956Surplus (Note 23) 144,154 130,550 144,154 130,550Net unrealized gain (loss) on investment securities
at FVOCI (Note 8) 2,629 (2,994) 2,629 (2,994)Remeasurement losses on retirement plan
(Notes 11 and 27) (5,531) (3,591) (5,531) (3,591)Equity in other comprehensive income (losses)
of investees (Note 11) 345 (27) 345 (27)Translation adjustment and others (Note 11) (9,269) (7,719) 1,169 2,084
309,554 282,960 319,992 292,763Non-controlling Interest (Note 11) 8,937 7,744 − −
318,491 290,704 319,992 292,763P=2,450,813 P=2,243,693 P=2,087,435 P=1,863,664
See accompanying Notes to Financial Statements.
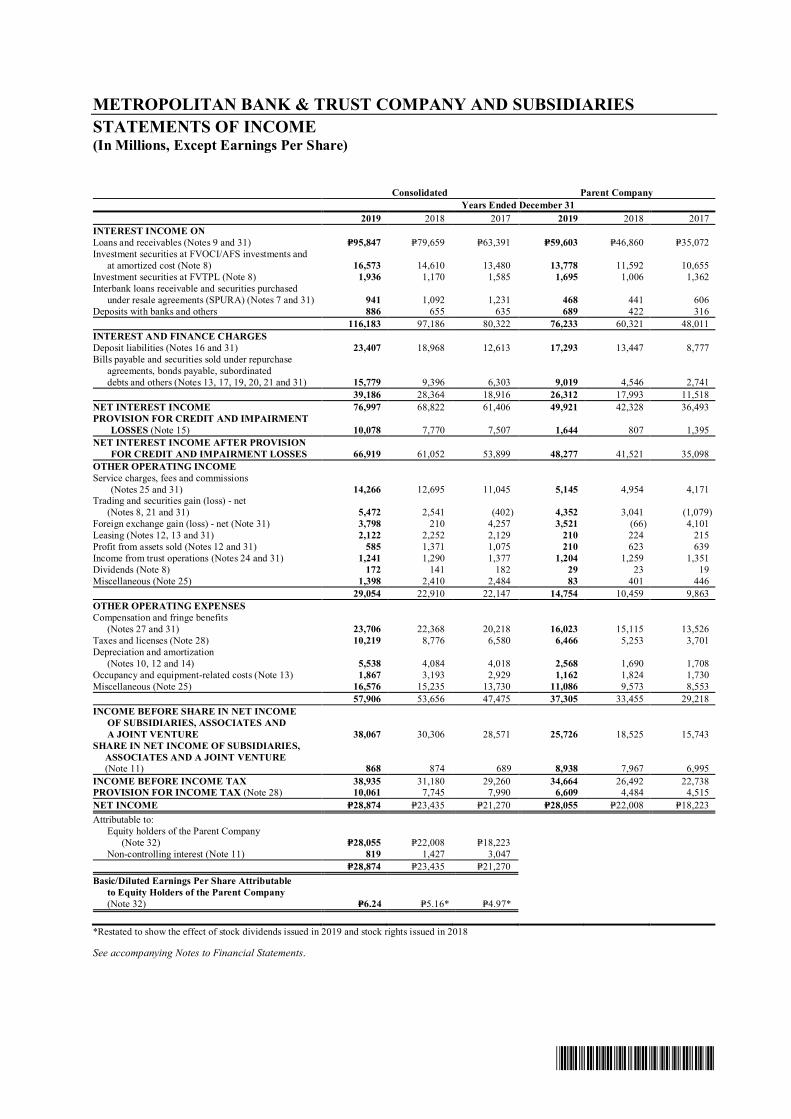
*SGVFS038804*
METROPOLITAN BANK & TRUST COMPANY AND SUBSIDIARIESSTATEMENTS OF INCOME(In Millions, Except Earnings Per Share)
Consolidated Parent CompanyYears Ended December 31
2019 2018 2017 2019 2018 2017INTEREST INCOME ONLoans and receivables (Notes 9 and 31) P=95,847 P=79,659 P=63,391 P=59,603 P=46,860 P=35,072Investment securities at FVOCI/AFS investments and at amortized cost (Note 8) 16,573 14,610 13,480 13,778 11,592 10,655Investment securities at FVTPL (Note 8) 1,936 1,170 1,585 1,695 1,006 1,362Interbank loans receivable and securities purchased under resale agreements (SPURA) (Notes 7 and 31) 941 1,092 1,231 468 441 606Deposits with banks and others 886 655 635 689 422 316
116,183 97,186 80,322 76,233 60,321 48,011INTEREST AND FINANCE CHARGESDeposit liabilities (Notes 16 and 31) 23,407 18,968 12,613 17,293 13,447 8,777Bills payable and securities sold under repurchase agreements, bonds payable, subordinated debts and others (Notes 13, 17, 19, 20, 21 and 31) 15,779 9,396 6,303 9,019 4,546 2,741
39,186 28,364 18,916 26,312 17,993 11,518NET INTEREST INCOME 76,997 68,822 61,406 49,921 42,328 36,493PROVISION FOR CREDIT AND IMPAIRMENT
LOSSES (Note 15) 10,078 7,770 7,507 1,644 807 1,395NET INTEREST INCOME AFTER PROVISION
FOR CREDIT AND IMPAIRMENT LOSSES 66,919 61,052 53,899 48,277 41,521 35,098OTHER OPERATING INCOMEService charges, fees and commissions
(Notes 25 and 31) 14,266 12,695 11,045 5,145 4,954 4,171Trading and securities gain (loss) - net (Notes 8, 21 and 31) 5,472 2,541 (402) 4,352 3,041 (1,079)Foreign exchange gain (loss) - net (Note 31) 3,798 210 4,257 3,521 (66) 4,101Leasing (Notes 12, 13 and 31) 2,122 2,252 2,129 210 224 215Profit from assets sold (Notes 12 and 31) 585 1,371 1,075 210 623 639Income from trust operations (Notes 24 and 31) 1,241 1,290 1,377 1,204 1,259 1,351Dividends (Note 8) 172 141 182 29 23 19Miscellaneous (Note 25) 1,398 2,410 2,484 83 401 446
29,054 22,910 22,147 14,754 10,459 9,863OTHER OPERATING EXPENSESCompensation and fringe benefits (Notes 27 and 31) 23,706 22,368 20,218 16,023 15,115 13,526Taxes and licenses (Note 28) 10,219 8,776 6,580 6,466 5,253 3,701Depreciation and amortization (Notes 10, 12 and 14) 5,538 4,084 4,018 2,568 1,690 1,708Occupancy and equipment-related costs (Note 13) 1,867 3,193 2,929 1,162 1,824 1,730Miscellaneous (Note 25) 16,576 15,235 13,730 11,086 9,573 8,553
57,906 53,656 47,475 37,305 33,455 29,218INCOME BEFORE SHARE IN NET INCOME OF SUBSIDIARIES, ASSOCIATES AND
A JOINT VENTURE 38,067 30,306 28,571 25,726 18,525 15,743SHARE IN NET INCOME OF SUBSIDIARIES,
ASSOCIATES AND A JOINT VENTURE(Note 11) 868 874 689 8,938 7,967 6,995
INCOME BEFORE INCOME TAX 38,935 31,180 29,260 34,664 26,492 22,738PROVISION FOR INCOME TAX (Note 28) 10,061 7,745 7,990 6,609 4,484 4,515NET INCOME P=28,874 P=23,435 P=21,270 P=28,055 P=22,008 P=18,223Attributable to: Equity holders of the Parent Company (Note 32) P=28,055 P=22,008 P=18,223 Non-controlling interest (Note 11) 819 1,427 3,047
P=28,874 P=23,435 P=21,270Basic/Diluted Earnings Per Share Attributable to Equity Holders of the Parent Company (Note 32) P=6.24 P=5.16* P=4.97*
*Restated to show the effect of stock dividends issued in 2019 and stock rights issued in 2018
See accompanying Notes to Financial Statements.
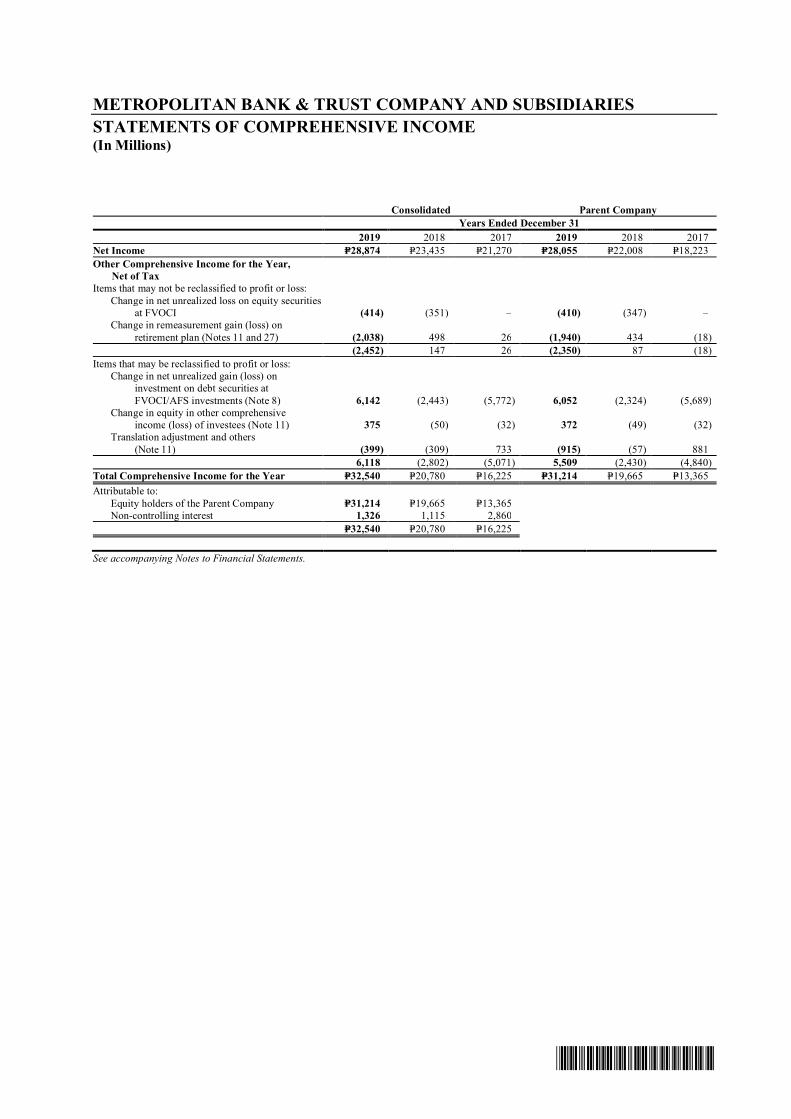
*SGVFS038804*
METROPOLITAN BANK & TRUST COMPANY AND SUBSIDIARIESSTATEMENTS OF COMPREHENSIVE INCOME(In Millions)
Consolidated Parent CompanyYears Ended December 31
2019 2018 2017 2019 2018 2017Net Income P=28,874 P=23,435 P=21,270 P=28,055 P=22,008 P=18,223Other Comprehensive Income for the Year, Net of TaxItems that may not be reclassified to profit or loss:
Change in net unrealized loss on equity securitiesat FVOCI (414) (351) ‒ (410) (347) ‒
Change in remeasurement gain (loss) onretirement plan (Notes 11 and 27) (2,038) 498 26 (1,940) 434 (18)
(2,452) 147 26 (2,350) 87 (18)Items that may be reclassified to profit or loss:
Change in net unrealized gain (loss) oninvestment on debt securities atFVOCI/AFS investments (Note 8) 6,142 (2,443) (5,772) 6,052 (2,324) (5,689)
Change in equity in other comprehensiveincome (loss) of investees (Note 11) 375 (50) (32) 372 (49) (32)
Translation adjustment and others(Note 11) (399) (309) 733 (915) (57) 881
6,118 (2,802) (5,071) 5,509 (2,430) (4,840)Total Comprehensive Income for the Year P=32,540 P=20,780 P=16,225 P=31,214 P=19,665 P=13,365Attributable to:
Equity holders of the Parent Company P=31,214 P=19,665 P=13,365Non-controlling interest 1,326 1,115 2,860
P=32,540 P=20,780 P=16,225
See accompanying Notes to Financial Statements.
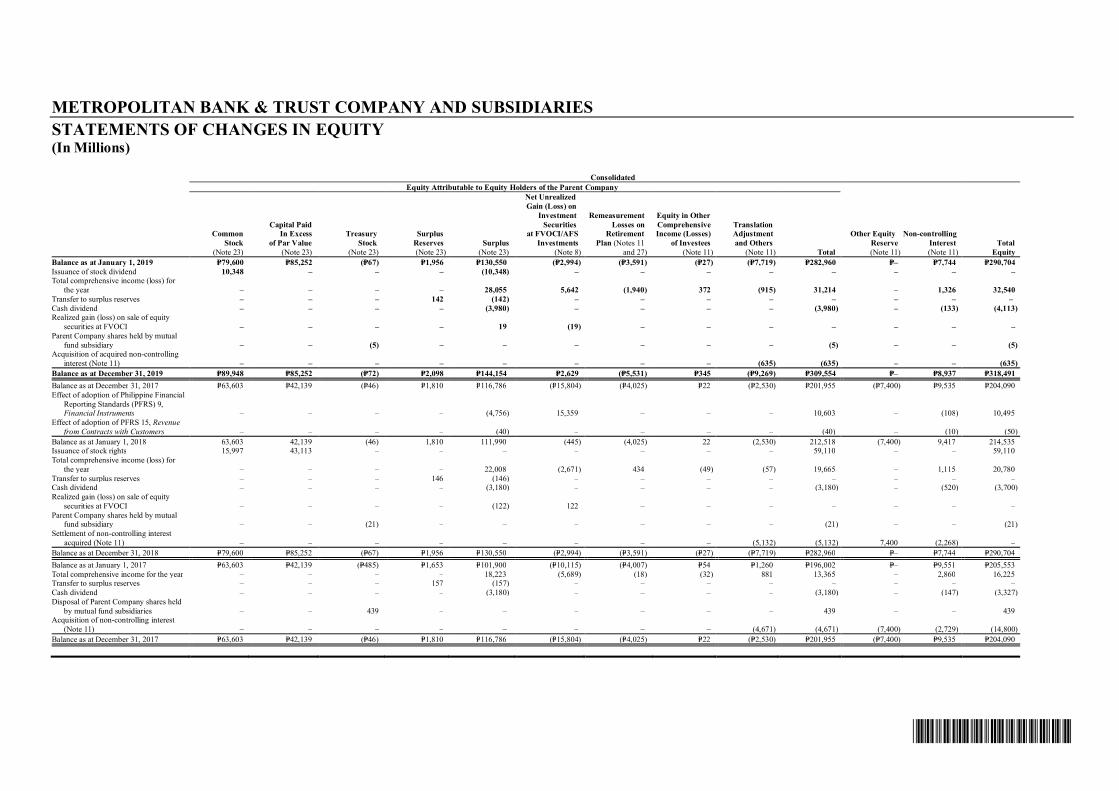
*SGVFS038804*
METROPOLITAN BANK & TRUST COMPANY AND SUBSIDIARIESSTATEMENTS OF CHANGES IN EQUITY(In Millions)
ConsolidatedEquity Attributable to Equity Holders of the Parent Company
CommonStock
(Note 23)
Capital PaidIn Excess
of Par Value(Note 23)
TreasuryStock
(Note 23)
SurplusReserves(Note 23)
Surplus(Note 23)
Net UnrealizedGain (Loss) on
InvestmentSecurities
at FVOCI/AFSInvestments
(Note 8)
RemeasurementLosses on
RetirementPlan (Notes 11
and 27)
Equity in OtherComprehensiveIncome (Losses)
of Investees(Note 11)
TranslationAdjustmentand Others
(Note 11) Total
Other EquityReserve(Note 11)
Non-controllingInterest(Note 11)
TotalEquity
Balance as at January 1, 2019 P=79,600 P=85,252 (P=67) P=1,956 P=130,550 (P=2,994) (P=3,591) (P=27) (P=7,719) P=282,960 P=– P=7,744 P=290,704Issuance of stock dividend 10,348 – – – (10,348) – – – – – – – –Total comprehensive income (loss) for
the year – – – – 28,055 5,642 (1,940) 372 (915) 31,214 – 1,326 32,540Transfer to surplus reserves – – – 142 (142) – – – – – – – –Cash dividend – – – – (3,980) – – – – (3,980) – (133) (4,113)Realized gain (loss) on sale of equity
securities at FVOCI – – – – 19 (19) – – – – – – –Parent Company shares held by mutual
fund subsidiary – – (5) – – – – – – (5) – – (5)Acquisition of acquired non-controlling
interest (Note 11) – – – – – – – – (635) (635) – – (635)Balance as at December 31, 2019 P=89,948 P=85,252 (P=72) P=2,098 P=144,154 P=2,629 (P=5,531) P=345 (P=9,269) P=309,554 P=– P=8,937 P=318,491Balance as at December 31, 2017 P=63,603 P=42,139 (P=46) P=1,810 P=116,786 (P=15,804) (P=4,025) P=22 (P=2,530) P=201,955 (P=7,400) P=9,535 P=204,090Effect of adoption of Philippine Financial
Reporting Standards (PFRS) 9,Financial Instruments – – – – (4,756) 15,359 – – – 10,603 – (108) 10,495
Effect of adoption of PFRS 15, Revenuefrom Contracts with Customers – – – – (40) – – – – (40) – (10) (50)
Balance as at January 1, 2018 63,603 42,139 (46) 1,810 111,990 (445) (4,025) 22 (2,530) 212,518 (7,400) 9,417 214,535Issuance of stock rights 15,997 43,113 – – – – – – – 59,110 – – 59,110Total comprehensive income (loss) for
the year – – – – 22,008 (2,671) 434 (49) (57) 19,665 – 1,115 20,780Transfer to surplus reserves – – – 146 (146) – – – – – – – –Cash dividend – – – – (3,180) – – – – (3,180) – (520) (3,700)Realized gain (loss) on sale of equity
securities at FVOCI – – – – (122) 122 – – – – – – –Parent Company shares held by mutual
fund subsidiary – – (21) – – – – – – (21) – – (21)Settlement of non-controlling interest
acquired (Note 11) – – – – – – – – (5,132) (5,132) 7,400 (2,268) –Balance as at December 31, 2018 P=79,600 P=85,252 (P=67) P=1,956 P=130,550 (P=2,994) (P=3,591) (P=27) (P=7,719) P=282,960 P=– P=7,744 P=290,704Balance as at January 1, 2017 P=63,603 P=42,139 (P=485) P=1,653 P=101,900 (P=10,115) (P=4,007) P=54 P=1,260 P=196,002 P=– P=9,551 P=205,553Total comprehensive income for the year – – – – 18,223 (5,689) (18) (32) 881 13,365 – 2,860 16,225Transfer to surplus reserves – – – 157 (157) – – – – – – – –Cash dividend – – – – (3,180) – – – – (3,180) – (147) (3,327)Disposal of Parent Company shares held
by mutual fund subsidiaries – – 439 – – – – – – 439 – – 439Acquisition of non-controlling interest
(Note 11) – – – – – – – – (4,671) (4,671) (7,400) (2,729) (14,800)Balance as at December 31, 2017 P=63,603 P=42,139 (P=46) P=1,810 P=116,786 (P=15,804) (P=4,025) P=22 (P=2,530) P=201,955 (P=7,400) P=9,535 P=204,090
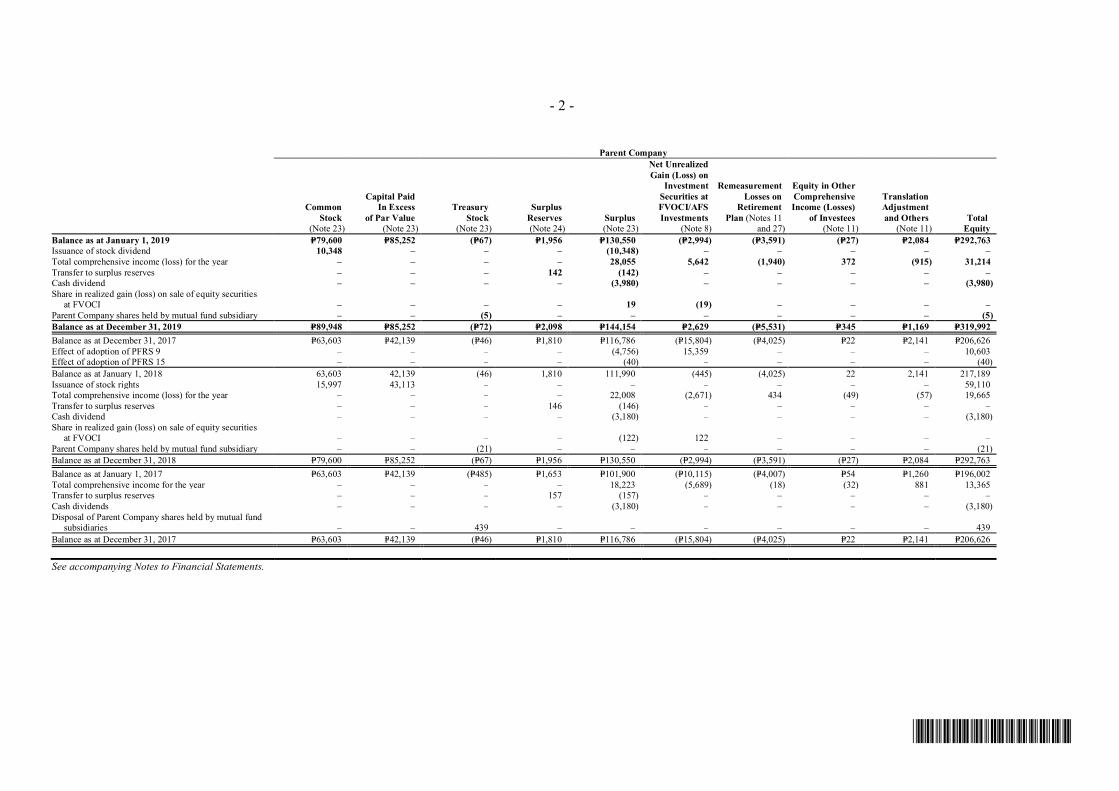
*SGVFS038804*
- 2 -
Parent Company
CommonStock
(Note 23)
Capital PaidIn Excess
of Par Value(Note 23)
TreasuryStock
(Note 23)
SurplusReserves(Note 24)
Surplus(Note 23)
Net UnrealizedGain (Loss) on
InvestmentSecurities atFVOCI/AFSInvestments
(Note 8)
RemeasurementLosses on
RetirementPlan (Notes 11
and 27)
Equity in OtherComprehensiveIncome (Losses)
of Investees(Note 11)
TranslationAdjustmentand Others
(Note 11)Total
EquityBalance as at January 1, 2019 P=79,600 P=85,252 (P=67) P=1,956 P=130,550 (P=2,994) (P=3,591) (P=27) P=2,084 P=292,763Issuance of stock dividend 10,348 – – – (10,348) – – – – –Total comprehensive income (loss) for the year – – – – 28,055 5,642 (1,940) 372 (915) 31,214Transfer to surplus reserves – – – 142 (142) – – – – –Cash dividend – – – – (3,980) – – – – (3,980)Share in realized gain (loss) on sale of equity securities
at FVOCI – – – – 19 (19) – – – –Parent Company shares held by mutual fund subsidiary – – (5) – – – – – – (5)Balance as at December 31, 2019 P=89,948 P=85,252 (P=72) P=2,098 P=144,154 P=2,629 (P=5,531) P=345 P=1,169 P=319,992Balance as at December 31, 2017 P=63,603 P=42,139 (P=46) P=1,810 P=116,786 (P=15,804) (P=4,025) P=22 P=2,141 P=206,626Effect of adoption of PFRS 9 – – – – (4,756) 15,359 – – – 10,603Effect of adoption of PFRS 15 – – – – (40) – – – – (40)Balance as at January 1, 2018 63,603 42,139 (46) 1,810 111,990 (445) (4,025) 22 2,141 217,189Issuance of stock rights 15,997 43,113 – – – – – – – 59,110Total comprehensive income (loss) for the year – – – – 22,008 (2,671) 434 (49) (57) 19,665Transfer to surplus reserves – – – 146 (146) – – – – –Cash dividend – – – – (3,180) – – – – (3,180)Share in realized gain (loss) on sale of equity securities
at FVOCI – – – – (122) 122 – – – –Parent Company shares held by mutual fund subsidiary – – (21) – – – – – – (21)Balance as at December 31, 2018 P=79,600 P=85,252 (P=67) P=1,956 P=130,550 (P=2,994) (P=3,591) (P=27) P=2,084 P=292,763Balance as at January 1, 2017 P=63,603 P=42,139 (P=485) P=1,653 P=101,900 (P=10,115) (P=4,007) P=54 P=1,260 P=196,002Total comprehensive income for the year ‒ ‒ ‒ ‒ 18,223 (5,689) (18) (32) 881 13,365Transfer to surplus reserves ‒ ‒ ‒ 157 (157) ‒ ‒ ‒ ‒ ‒Cash dividends ‒ ‒ ‒ ‒ (3,180) ‒ ‒ ‒ ‒ (3,180)Disposal of Parent Company shares held by mutual fund
subsidiaries ‒ ‒ 439 ‒ ‒ ‒ ‒ ‒ ‒ 439Balance as at December 31, 2017 P=63,603 P=42,139 (P=46) P=1,810 P=116,786 (P=15,804) (P=4,025) P=22 P=2,141 P=206,626
See accompanying Notes to Financial Statements.
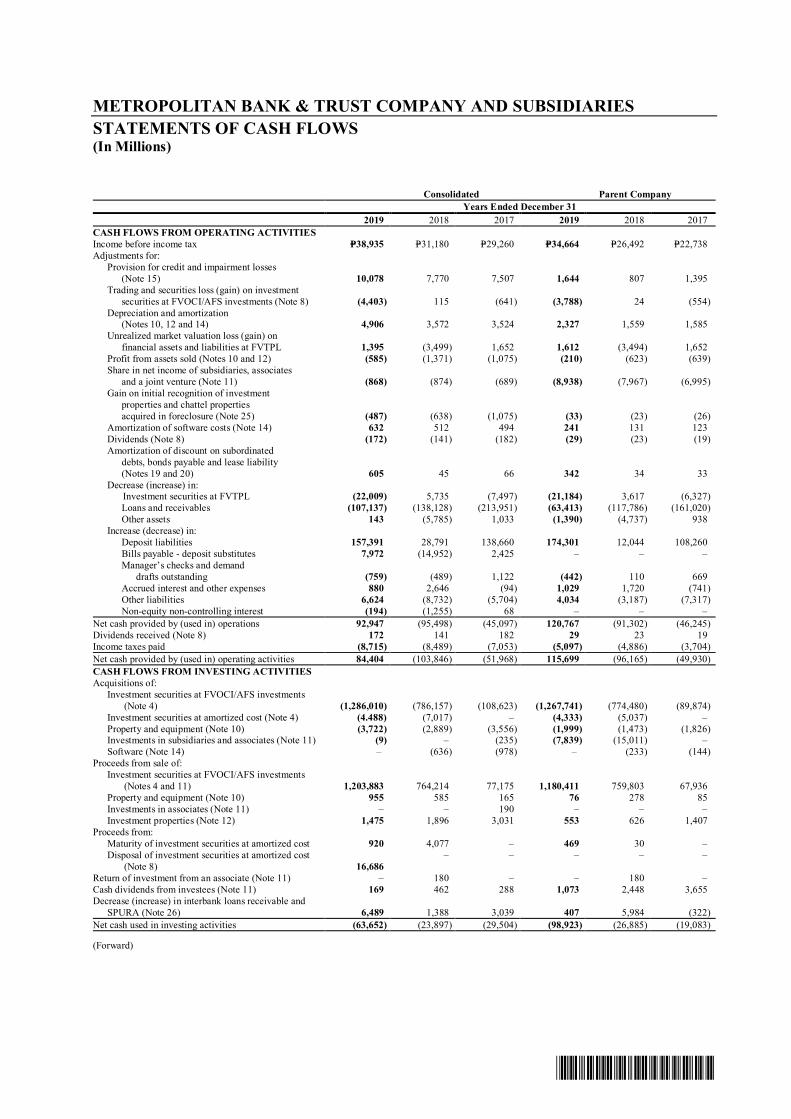
*SGVFS038804*
METROPOLITAN BANK & TRUST COMPANY AND SUBSIDIARIESSTATEMENTS OF CASH FLOWS(In Millions)
Consolidated Parent CompanyYears Ended December 31
2019 2018 2017 2019 2018 2017CASH FLOWS FROM OPERATING ACTIVITIESIncome before income tax P=38,935 P=31,180 P=29,260 P=34,664 P=26,492 P=22,738Adjustments for: Provision for credit and impairment losses
(Note 15) 10,078 7,770 7,507 1,644 807 1,395 Trading and securities loss (gain) on investment securities at FVOCI/AFS investments (Note 8) (4,403) 115 (641) (3,788) 24 (554) Depreciation and amortization
(Notes 10, 12 and 14) 4,906 3,572 3,524 2,327 1,559 1,585 Unrealized market valuation loss (gain) on financial assets and liabilities at FVTPL 1,395 (3,499) 1,652 1,612 (3,494) 1,652 Profit from assets sold (Notes 10 and 12) (585) (1,371) (1,075) (210) (623) (639) Share in net income of subsidiaries, associates and a joint venture (Note 11) (868) (874) (689) (8,938) (7,967) (6,995) Gain on initial recognition of investment
properties and chattel propertiesacquired in foreclosure (Note 25) (487) (638) (1,075) (33) (23) (26)
Amortization of software costs (Note 14) 632 512 494 241 131 123 Dividends (Note 8) (172) (141) (182) (29) (23) (19) Amortization of discount on subordinated debts, bonds payable and lease liability (Notes 19 and 20) 605 45 66 342 34 33 Decrease (increase) in:
Investment securities at FVTPL (22,009) 5,735 (7,497) (21,184) 3,617 (6,327) Loans and receivables (107,137) (138,128) (213,951) (63,413) (117,786) (161,020) Other assets 143 (5,785) 1,033 (1,390) (4,737) 938 Increase (decrease) in: Deposit liabilities 157,391 28,791 138,660 174,301 12,044 108,260 Bills payable - deposit substitutes 7,972 (14,952) 2,425 – – – Manager’s checks and demand
drafts outstanding (759) (489) 1,122 (442) 110 669 Accrued interest and other expenses 880 2,646 (94) 1,029 1,720 (741) Other liabilities 6,624 (8,732) (5,704) 4,034 (3,187) (7,317) Non-equity non-controlling interest (194) (1,255) 68 – – –Net cash provided by (used in) operations 92,947 (95,498) (45,097) 120,767 (91,302) (46,245)Dividends received (Note 8) 172 141 182 29 23 19Income taxes paid (8,715) (8,489) (7,053) (5,097) (4,886) (3,704)Net cash provided by (used in) operating activities 84,404 (103,846) (51,968) 115,699 (96,165) (49,930)CASH FLOWS FROM INVESTING ACTIVITIESAcquisitions of: Investment securities at FVOCI/AFS investments (Note 4) (1,286,010) (786,157) (108,623) (1,267,741) (774,480) (89,874) Investment securities at amortized cost (Note 4) (4.488) (7,017) – (4,333) (5,037) – Property and equipment (Note 10) (3,722) (2,889) (3,556) (1,999) (1,473) (1,826) Investments in subsidiaries and associates (Note 11) (9) – (235) (7,839) (15,011) – Software (Note 14) – (636) (978) – (233) (144)Proceeds from sale of: Investment securities at FVOCI/AFS investments (Notes 4 and 11) 1,203,883 764,214 77,175 1,180,411 759,803 67,936 Property and equipment (Note 10) 955 585 165 76 278 85 Investments in associates (Note 11) – – 190 – – – Investment properties (Note 12) 1,475 1,896 3,031 553 626 1,407Proceeds from: Maturity of investment securities at amortized cost 920 4,077 – 469 30 – Disposal of investment securities at amortized cost (Note 8) 16,686
– – – – –
Return of investment from an associate (Note 11) – 180 – – 180 –Cash dividends from investees (Note 11) 169 462 288 1,073 2,448 3,655Decrease (increase) in interbank loans receivable and SPURA (Note 26) 6,489 1,388 3,039 407 5,984 (322)Net cash used in investing activities (63,652) (23,897) (29,504) (98,923) (26,885) (19,083)
(Forward)
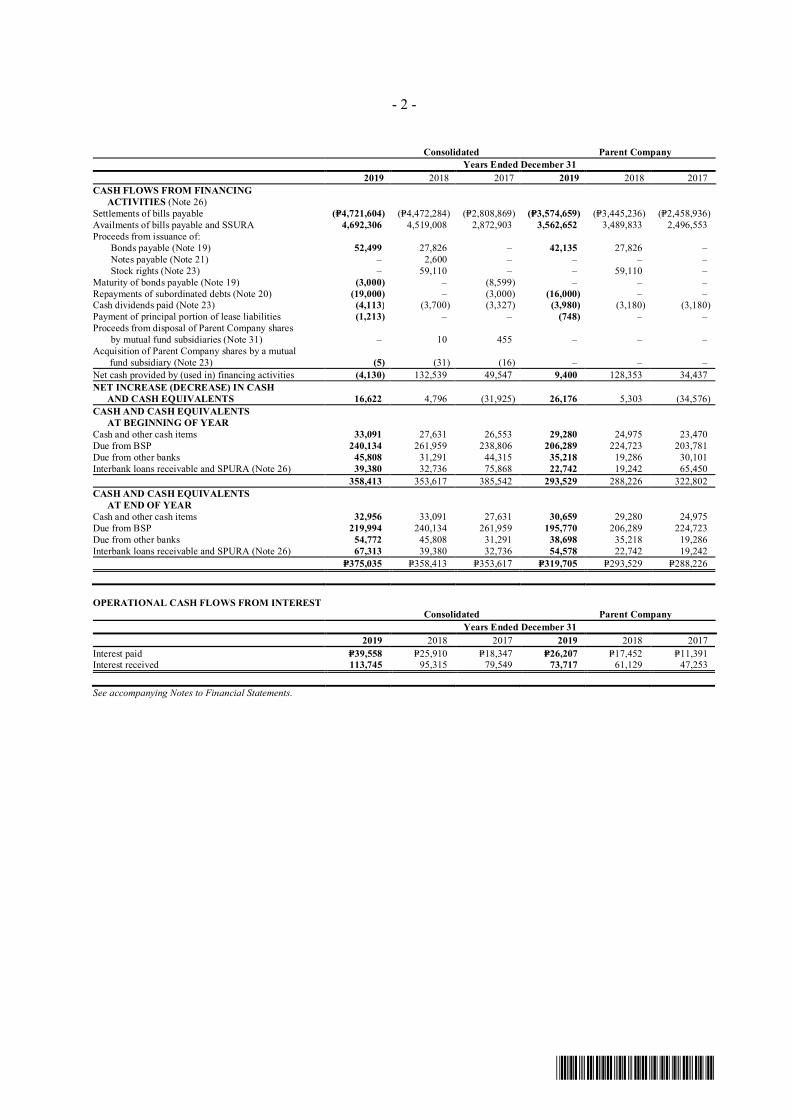
*SGVFS038804*
- 2 -
Consolidated Parent CompanyYears Ended December 31
2019 2018 2017 2019 2018 2017CASH FLOWS FROM FINANCING
ACTIVITIES (Note 26)Settlements of bills payable (P=4,721,604) (P=4,472,284) (P=2,808,869) (P=3,574,659) (P=3,445,236) (P=2,458,936)Availments of bills payable and SSURA 4,692,306 4,519,008 2,872,903 3,562,652 3,489,833 2,496,553Proceeds from issuance of:
Bonds payable (Note 19) 52,499 27,826 – 42,135 27,826 –Notes payable (Note 21) – 2,600 ‒ – ‒ ‒Stock rights (Note 23) – 59,110 – – 59,110 –
Maturity of bonds payable (Note 19) (3,000) ‒ (8,599) – – –Repayments of subordinated debts (Note 20) (19,000) – (3,000) (16,000) – –Cash dividends paid (Note 23) (4,113) (3,700) (3,327) (3,980) (3,180) (3,180)Payment of principal portion of lease liabilities (1,213) – – (748) – –Proceeds from disposal of Parent Company shares
by mutual fund subsidiaries (Note 31) – 10 455 – – –Acquisition of Parent Company shares by a mutual
fund subsidiary (Note 23) (5) (31) (16) – – –Net cash provided by (used in) financing activities (4,130) 132,539 49,547 9,400 128,353 34,437NET INCREASE (DECREASE) IN CASH
AND CASH EQUIVALENTS 16,622 4,796 (31,925) 26,176 5,303 (34,576)CASH AND CASH EQUIVALENTS
AT BEGINNING OF YEARCash and other cash items 33,091 27,631 26,553 29,280 24,975 23,470Due from BSP 240,134 261,959 238,806 206,289 224,723 203,781Due from other banks 45,808 31,291 44,315 35,218 19,286 30,101Interbank loans receivable and SPURA (Note 26) 39,380 32,736 75,868 22,742 19,242 65,450
358,413 353,617 385,542 293,529 288,226 322,802CASH AND CASH EQUIVALENTS
AT END OF YEARCash and other cash items 32,956 33,091 27,631 30,659 29,280 24,975Due from BSP 219,994 240,134 261,959 195,770 206,289 224,723Due from other banks 54,772 45,808 31,291 38,698 35,218 19,286Interbank loans receivable and SPURA (Note 26) 67,313 39,380 32,736 54,578 22,742 19,242
P=375,035 P=358,413 P=353,617 P=319,705 P=293,529 P=288,226
OPERATIONAL CASH FLOWS FROM INTERESTConsolidated Parent Company
Years Ended December 312019 2018 2017 2019 2018 2017
Interest paid P=39,558 P=25,910 P=18,347 P=26,207 P=17,452 P=11,391Interest received 113,745 95,315 79,549 73,717 61,129 47,253
See accompanying Notes to Financial Statements.
*SGVFS038804*
METROPOLITAN BANK & TRUST COMPANY AND SUBSIDIARIESNOTES TO FINANCIAL STATEMENTS
1. Corporate Information
Metropolitan Bank & Trust Company (the Parent Company) is a universal bank incorporated in thePhilippines on April 6, 1962. The Securities and Exchange Commission (SEC) approved the renewaluntil April 6, 2057 on November 19, 2007. The Parent Company’s shares were listed with thePhilippine Stock Exchange, Inc. (PSE) on February 26, 1981, as approved by the SEC inNovember 1980. It has a universal banking license granted by the Bangko Sentral ng Pilipinas (BSP)on August 21, 1981.
The Parent Company and its subsidiaries (the Group) are engaged in all aspects of banking, financing,leasing, real estate and stock brokering through a network of over 2,000 local and internationalbranches, subsidiaries, representative offices, remittance correspondents and agencies. As a bank, theParent Company, which is the ultimate parent of the Group, provides services such as depositproducts, loans and trade finance, domestic and foreign fund transfers, treasury, foreign exchange,trading and remittances, and trust services. Its principal place of business is at Metrobank Plaza, Sen.Gil Puyat Avenue, Urdaneta Village, Makati City, Metro Manila, Philippines.
2. Summary of Significant Accounting Policies
Basis of PreparationThe accompanying financial statements have been prepared on a historical cost basis except forfinancial assets and financial liabilities at fair value through profit or loss (FVTPL) and fair valuethrough other comprehensive income (FVOCI) that have been measured at fair value.
The financial statements of the Parent Company and Philippine Savings Bank (PSBank) include theaccounts maintained in the Regular Banking Unit (RBU) and Foreign Currency Deposit Unit(FCDU). The functional currency of RBU and FCDU is Philippine Peso (PHP) and United StatesDollar (USD), respectively. For financial reporting purposes, FCDU accounts and foreign currency-denominated accounts in the RBU are translated into their equivalents in PHP (see accounting policyon Foreign Currency Translation). The financial statements of these units are combined aftereliminating inter-unit accounts.
Each entity in the Group determines its own functional currency and items included in the financialstatements of each entity are measured using that functional currency. The respective functionalcurrencies of the subsidiaries are presented under Basis of Consolidation. The financial statementsare presented in PHP, and all values are rounded to the nearest million pesos (P=000,000), except whenotherwise indicated.
Statement of ComplianceThe financial statements of the Group and the Parent Company have been prepared in compliancewith Philippine Financial Reporting Standards (PFRS).
Presentation of Financial StatementsFinancial assets and financial liabilities are offset and the net amount reported in the statement offinancial position only when there is a legally enforceable right to offset the recognized amounts andthere is an intention to settle on a net basis, or to realize the assets and settle the liabilitysimultaneously. This is not generally the case with master netting agreements, and the related assetsand liabilities are presented gross in the statement of financial position. Income and expense are not
- 2 -
*SGVFS038804*
offset in the statement of income unless required or permitted by any accounting standard orinterpretation, and as specifically disclosed in the accounting policies of the Group.
Basis of ConsolidationThe consolidated financial statements include the financial statements of the Parent Company and ofits subsidiaries and are prepared for the same reporting period as the Parent Company usingconsistent accounting policies. The following are the wholly and majority-owned foreign anddomestic subsidiaries of the Parent Company in 2019 and 2018 (Note 11):
Subsidiary
Principal Placeof Business and
Country ofIncorporation
EffectivePercentage
of OwnershipFunctionalCurrency
Financial Markets:Domestic:
Metrobank Card Corporation (A Finance Company and General Insurance Agency) (MCC) Philippines 100.00 PHPFirst Metro Investment Corporation (FMIC) and Subsidiaries Philippines 99.27* PHPPSBank Philippines 88.38* PHPORIX Metro Leasing and Finance Corporation
(ORIX Metro) and Subsidiaries Philippines 59.85 PHPForeign:
Metropolitan Bank (China) Ltd. (MBCL) China 100.00 Chinese YuanMetropolitan Bank (Bahamas) Limited (Metrobank Bahamas)** The Bahamas 100.00 USDFirst Metro International Investment Company Limited
(FMIIC) and Subsidiary Hong Kong 100.00Hong Kong
Dollar (HKD)Remittances:
Metro Remittance (Hong Kong) Limited (MRHL) Hong Kong 100.00 HKD
Metro Remittance (Singapore) Pte. Ltd. (MRSPL) Singapore 100.00Singapore
Dollar
Metro Remittance (UK) Limited (MR UK) United Kingdom 100.00Great Britain
Pound
Metro Remittance (USA), Inc. (MR USA)United States ofAmerica (USA) 100.00 USD
Metro Remittance (Japan) Co. Ltd. (MR Japan) Japan 100.00 Japanese YenMetro Remittance (Italia), S.p.A. (MR Italia)*** Italy 100.00 Euro
Real Estate:Circa 2000 Homes, Inc. (Circa)*** Philippines 100.00 PHP
Others:Philbancor Venture Capital Corporation (PVCC)*** Philippines 60.00 PHPMBTC Technology, Inc. (MTI)**** Philippines 100.00 PHP
* In 2019, the Parent Company’s effective percentage of ownership in FMIC and PSBank increased from 99.25% and 82.68%, respectively.
** Dissolved in April 2019*** In process of dissolution**** In process of liquidation
All significant intra-group balances, transactions, income and expenses and profits and lossesresulting from intra-group transactions are eliminated in full at consolidation (Note 31). Subsidiariesare fully consolidated from the date on which control is transferred to the Group. Control is achievedwhere the Group is exposed, or has rights, to variable returns from its involvement with the investeeand has the ability to affect those returns through its power over the investee. Consolidation ofsubsidiaries ceases when control is transferred out of the Group or the Parent Company. The resultsof subsidiaries acquired or disposed of during the year are included in the consolidated statements ofincome and consolidated statements of comprehensive income from the date of acquisition or up tothe date of disposal, as appropriate.
- 3 -
*SGVFS038804*
Changes in the Parent Company’s ownership interest in a subsidiary that do not result in a loss ofcontrol are accounted for within equity. Any difference between the amount by which thenon-controlling interests are adjusted and the fair value of the consideration paid (or to be paid) orreceived is recognized directly in equity included as part of ‘Translation adjustment and others’ andattributed to the owners of the Parent Company.
When a change in ownership interest in a subsidiary occurs which results in a loss of control over thesubsidiary, the Parent Company: (a) derecognizes the assets (including goodwill) and liabilities of thesubsidiary; (b) derecognizes the carrying amount of any non-controlling interest; (c) derecognizes therelated other comprehensive income (OCI) recorded in equity and recycles the same to statement ofincome or retained earnings; (d) recognizes the fair value of the consideration received; (e) recognizesthe fair value of any investment retained; (f) recognizes any surplus or deficit in statement of income;and (g) reclassifies the Parent Company’s share of components’ gains (losses) previously recognizedin OCI to profit or loss or surplus, as appropriate, as would be required if the Group had directlydisposed of the related assets or liabilities.
Entity with Significant Influence over the GroupGT Capital Holdings, Inc. (GT Capital) holds 36.65% and 36.36% interest in the Parent Company asof December 31, 2019 and 2018, respectively (Note 31).
Non-controlling InterestNon-controlling interest represents the portion of profit or loss and the net assets of the funds not heldby the Group and are presented separately in the consolidated statement of income, consolidatedstatement of comprehensive income and within equity in the consolidated statement of financialposition, separately from equity attributable to the Parent Company. Any losses applicable to thenon-controlling interests in excess of the non-controlling interests are allocated against the interests ofthe non-controlling interest even if this results in the non-controlling interest having a deficit balance.Acquisitions of non-controlling interests are accounted for as equity transactions.
Non-equity Non-controlling InterestThe Group has seed capital investments in a number of funds where it is in a position to be able tocontrol those funds. These funds are consolidated.
Non-equity non-controlling interest represents the portion of net assets of the consolidated funds notattributed, directly or indirectly, to the Parent Company and is presented separately in the liabilitysection in the consolidated statement of financial position. This liability is accounted for at FVTPLand measured using net asset value per unit with changes recognized in ‘Trading and securities gain(loss) - net’ in the consolidated statement of income.
Changes in Accounting Policies and DisclosuresExcept for these new and amended standards which were adopted as of January 1, 2019, theaccounting policies adopted are consistent with those of previous financial year.
The Group applied for the first time, Philippine Financial Reporting Standards (PFRS) 16, Leases. Itsupersedes PAS 17, Leases, Philippine Interpretation IFRIC 4, Determining Whether an ArrangementContains a Lease, SIC-15, Operating Leases – Incentives, and SIC-27, Evaluating the Substance ofTransactions Involving the Legal Form of a Lease. The standard sets out the principles for therecognition, measurement, presentation and disclosure of leases and requires lesses to account formost leases under a single on-balance sheet model. The Group adopted the modified retrospective
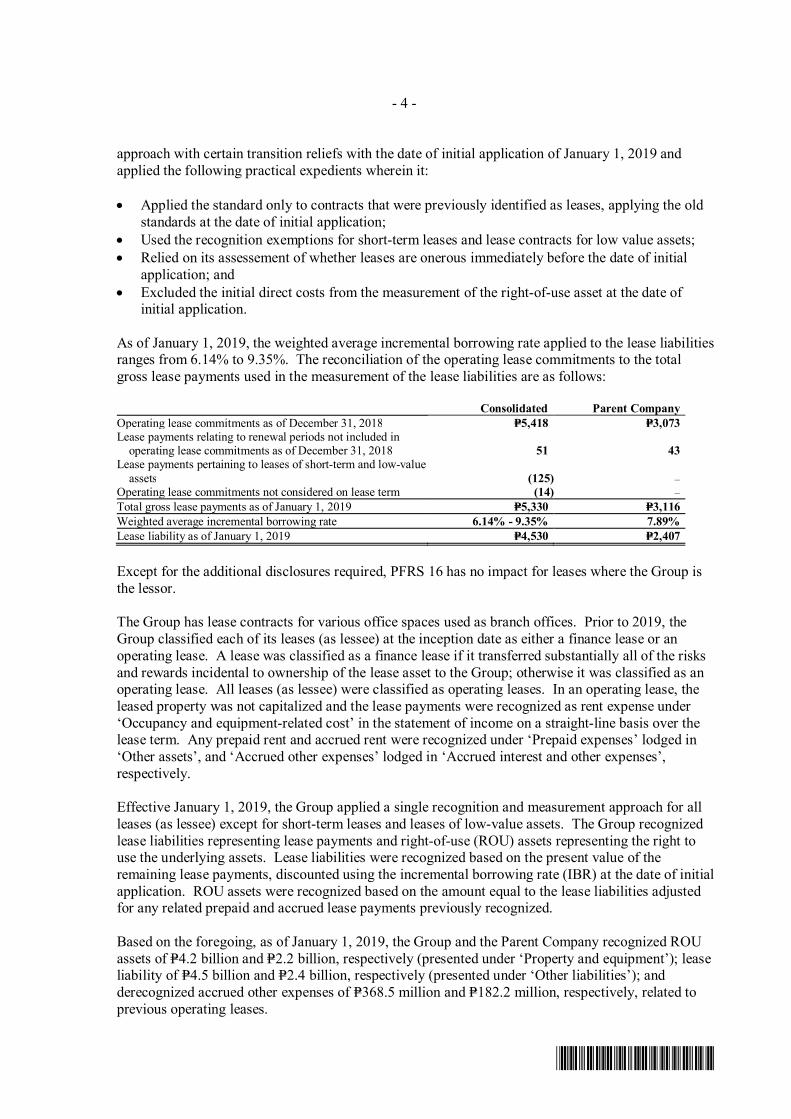
- 4 -
*SGVFS038804*
approach with certain transition reliefs with the date of initial application of January 1, 2019 andapplied the following practical expedients wherein it:
· Applied the standard only to contracts that were previously identified as leases, applying the oldstandards at the date of initial application;
· Used the recognition exemptions for short-term leases and lease contracts for low value assets;· Relied on its assessement of whether leases are onerous immediately before the date of initial
application; and· Excluded the initial direct costs from the measurement of the right-of-use asset at the date of
initial application.
As of January 1, 2019, the weighted average incremental borrowing rate applied to the lease liabilitiesranges from 6.14% to 9.35%. The reconciliation of the operating lease commitments to the totalgross lease payments used in the measurement of the lease liabilities are as follows:
Consolidated Parent CompanyOperating lease commitments as of December 31, 2018 P=5,418 P=3,073Lease payments relating to renewal periods not included in
operating lease commitments as of December 31, 2018 51 43Lease payments pertaining to leases of short-term and low-value
assets (125) –Operating lease commitments not considered on lease term (14) –Total gross lease payments as of January 1, 2019 P=5,330 P=3,116Weighted average incremental borrowing rate 6.14% - 9.35% 7.89%Lease liability as of January 1, 2019 P=4,530 P=2,407
Except for the additional disclosures required, PFRS 16 has no impact for leases where the Group isthe lessor.
The Group has lease contracts for various office spaces used as branch offices. Prior to 2019, theGroup classified each of its leases (as lessee) at the inception date as either a finance lease or anoperating lease. A lease was classified as a finance lease if it transferred substantially all of the risksand rewards incidental to ownership of the lease asset to the Group; otherwise it was classified as anoperating lease. All leases (as lessee) were classified as operating leases. In an operating lease, theleased property was not capitalized and the lease payments were recognized as rent expense under‘Occupancy and equipment-related cost’ in the statement of income on a straight-line basis over thelease term. Any prepaid rent and accrued rent were recognized under ‘Prepaid expenses’ lodged in‘Other assets’, and ‘Accrued other expenses’ lodged in ‘Accrued interest and other expenses’,respectively.
Effective January 1, 2019, the Group applied a single recognition and measurement approach for allleases (as lessee) except for short-term leases and leases of low-value assets. The Group recognizedlease liabilities representing lease payments and right-of-use (ROU) assets representing the right touse the underlying assets. Lease liabilities were recognized based on the present value of theremaining lease payments, discounted using the incremental borrowing rate (IBR) at the date of initialapplication. ROU assets were recognized based on the amount equal to the lease liabilities adjustedfor any related prepaid and accrued lease payments previously recognized.
Based on the foregoing, as of January 1, 2019, the Group and the Parent Company recognized ROUassets of P=4.2 billion and P=2.2 billion, respectively (presented under ‘Property and equipment’); leaseliability of P=4.5 billion and P=2.4 billion, respectively (presented under ‘Other liabilities’); andderecognized accrued other expenses of P=368.5 million and P=182.2 million, respectively, related toprevious operating leases.
- 5 -
*SGVFS038804*
The adoption of the following amendments and interpretation to standards did not have significantimpact on the financial statements of the Group:
Amendments· Amendments to PFRS 9, Financial Instruments – Prepayment Features with Negative
Compensation· Amendments to PAS 28, Investments in Associates and Joint Ventures – Long-term Interests in
Associates and Joint Ventures· Amendments to PAS 19, Employee Benefits – Plan Amendment, Curtailment or Settlement· Annual Improvements to PFRS 2015 to 2017 Cycle
o PFRS 3, Business Combinations and PFRS 11, Joint Arrangements – Previously held interestin a joint operation
o PAS 12, Income Taxes - Income tax consequence of payments on financial instrumentsclassified as equity
o PAS 23, Borrowing Costs – Borrowing costs eligible for capitalization
Interpretation· Philippine Interpretation IFRIC 23, Uncertainty over Income Tax Treatments
The Interpretation addresses the accounting for income taxes when tax treatments involveuncertainty that affects the application of PAS 12, Income Taxes. It does not apply to taxes orlevies outside the scope of PAS 12, nor does it specifically include requirements relating tointerest and penalties associated with uncertain tax treatments. The Interpretation specificallyaddresses the following:o Whether an entity considers uncertain tax treatments separatelyo The assumptions an entity makes about the examination of tax treatments by taxation
authoritieso How an entity determines taxable profit (tax loss), tax bases, unused tax losses, unused tax
credits and tax rateso How an entity considers changes in facts and circumstances
The Group is required to determine whether to consider each uncertain tax treatment separately ortogether with one or more other uncertain tax treatments and use the approach that better predicts theresolution of the uncertainty. The Group shall assume that the taxation authority will examineamounts that it has a right to examine and have full knowledge of all related information whenmaking those examinations. If an entity concludes that it is not probable that the taxation authoritywill accept an uncertain tax treatment, it shall reflect the effect of the uncertainty for each uncertaintax treatment using the method the entity expects to better predict the resolution of the uncertainty.
Upon adoption of the Interpretation, the Group has assessed whether it has any uncertain tax position.The Group applies significant judgement in identifying uncertainties over its income tax treatments.Since the Group operates in a complex and regulated environment, it assessed whether theInterpretation had an impact on its consolidated financial statement. The Group determined, based onits assessment, in consultation with its tax counsel, that it is probable that its uncertainincome taxtreatments (including those for the subsidiaries) will be accepted by the taxation authorities.Accordingly, the interpretation did not have an impact on the consolidated financial statements of theGroup.
- 6 -
*SGVFS038804*
Significant Accounting Policies
Foreign Currency TranslationTransactions and balancesFor financial reporting purposes, the foreign currency-denominated monetary assets and liabilities inthe RBU are translated in Philippine peso based on the Bankers Association of the Philippines (BAP)closing rate (for 2019 and 2018) and the Philippine Dealing System (PDS) closing rate (for 2017)prevailing at the statement of financial position date and foreign currency-denominated income andexpenses, at the prevailing exchange rates as at the date of transaction. Foreign exchange differencesarising from revaluation and translation of foreign currency-denominated assets and liabilities arecredited to or charged against operations in the year in which the rates change. Non-monetary itemsthat are measured in terms of historical cost in a foreign currency are translated using the exchangerates as at the dates of the initial transactions.
Non-monetary items measured at fair value in a foreign currency are translated using the exchangerates at the date when the fair value was determined.
FCDU, foreign branches and subsidiariesAs at the reporting date, the assets and liabilities of foreign branches and subsidiaries and FCDU ofthe Parent Company and PSBank are translated into the Parent Company’s presentation currency (thePHP) at BAP (PDS in 2017) closing rate prevailing at the statement of financial position date, andtheir income and expenses are translated at BAP weighted average rate for 2019 and 2018 while in2017, the basis was the PDS weighted average rate. Exchange differences arising on translation aretaken to the statement of comprehensive income under ‘Translation adjustment and others’. Upondisposal of a foreign entity or when the Parent Company ceases to have control over the subsidiariesor upon actual remittance of FCDU profits to RBU, the deferred cumulative amount recognized in thestatement of comprehensive income is recognized in the statement of income.
Fair Value MeasurementThe Group measures certain financial instruments, such as derivatives, at fair value at each statementof financial position date. Also, fair values of financial instruments measured at amortized cost andinvestment properties are disclosed in Note 5.
Fair value is the price that would be received to sell an asset or paid to transfer a liability in an orderlytransaction between market participants at the measurement date (i.e., an exit price). The fair valuemeasurement is based on the presumption that the transaction to sell the asset or transfer the liabilitytakes place either in the principal market for the asset or liability; or in the absence of a principalmarket, in the most advantageous market for the asset or liability. The principal or the mostadvantageous market must be accessible to the Group.
The fair value of an asset or a liability is measured using the assumptions that market participantswould use when pricing the asset or liability, assuming that market participants act in their economicbest interest.
If an asset or a liability measured at fair value has a bid price and an ask price, the price within the bid- ask spread that is most representative of fair value in the circumstances shall be used to measure fairvalue regardless of where the input is categorized within the fair value hierarchy.
A fair value measurement of a non-financial asset takes into account a market participant’s ability togenerate economic benefits by using the asset in its highest and best use or by selling it to anothermarket participant that would use the asset in its highest and best use.
- 7 -
*SGVFS038804*
For assets and liabilities not listed in an active market, the Group uses valuation techniques that areappropriate in the circumstances and for which sufficient data are available to measure fair value,maximizing the use of relevant observable inputs and minimizing the use of unobservable inputs.
All assets and liabilities for which fair value is measured or disclosed in the financial statements arecategorized within the fair value hierarchy, described as follows, based on the lowest level input thatis significant to the fair value measurement as a whole:· Level 1 - Quoted (unadjusted) market prices in active markets for identical assets or liabilities· Level 2 - Valuation techniques for which the lowest level input that is significant to the fair value
measurement is directly or indirectly observable· Level 3 - Valuation techniques for which the lowest level input that is significant to the fair value
measurement is unobservable
For assets and liabilities that are recognized in the financial statements on a recurring basis, the Groupdetermines whether transfers have occurred between Levels in the hierarchy by re-assessingcategorization (based on the lowest level input that is significant to the fair value measurement as awhole) at the end of each reporting period. The Group determines the policies and procedures forboth recurring fair value measurement, such as financial assets and liabilities at FVTPL, and for non-recurring measurement, such as investment properties.
External valuers are involved for valuation of significant assets, such as investment properties.Selection criteria include market knowledge, reputation, independence and whether professionalstandards are maintained.
For the purpose of fair value disclosures, the Group has determined classes of assets and liabilities onthe basis of the nature, characteristics and risks of the asset or liability and the level of the fair valuehierarchy as explained above.
Financial Instruments – Initial Recognition and Subsequent Measurement
Date of recognitionPurchases or sales of financial assets that require delivery of assets within the time frame establishedby regulation or convention in the marketplace are recognized on the settlement date. Derivatives arerecognized on trade date basis. Deposits, amounts due to banks and customers and loans are recognizedwhen cash is received by the Group or advanced to the borrowers.
Initial recognition of financial instrumentsAll financial instruments are initially measured at fair value. Except for financial assets and financialliabilities at FVTPL, the initial measurement of financial instruments includes transaction costs.
‘Day 1’ differenceWhere the transaction price in a non-active market is different from the fair value from other observablecurrent market transactions in the same instrument or based on a valuation technique whose variablesinclude only data from observable market, the Group recognizes the difference between the transactionprice and fair value (a ‘Day 1’ difference) in the statement of income. In cases where the transactionprice used is made of data which is not observable, the difference between the transaction price andmodel value is only recognized in the statement of income when the inputs become observable or whenthe instrument is derecognized. For each transaction, the Group determines the appropriate method ofrecognizing the ‘Day 1’ difference amount.
- 8 -
*SGVFS038804*
Classification and Subsequent MeasurementFinancial assets are measured at FVTPL unless these are measured at FVOCI or at amortized cost.Financial liabilities are classified as either financial liabilities at FVTPL or financial liabilities atamortized cost. The classification of financial assets depends on the contractual terms and the businessmodel for managing the financial assets. Subsequent to initial recognition, the Group may reclassify itsfinancial assets only when there is a change in its business model for managing these financial assets.Reclassification of financial liabilities is not allowed.
The Group determines its business model at the level that best reflects how it manages groups offinancial assets to achieve its business objective. The Group’s business model is not assessed on aninstrument-by-instrument basis, but at a higher level of aggregated portfolios. If cash flows after initialrecognition are realized in a way that is different from the Group’s original expectations, the Groupdoes not change the classification of the remaining financial assets held in that business model, butincorporates such information when assessing newly originated or newly purchased financial assetsgoing forward.
As a second step of it classification process, the Group assesses the contractual terms of financial assetsto identify whether they pass the contractual cash flows test (SPPI test). For the purpose of the SPPItest, principal is defined as the fair value of the financial asset at initial recognition and may changeover the life of the financial asset (for example, if there are repayments of principal or amortization ofthe premium or discount). The most significant elements of interest within a lending arrangement aretypically the consideration for the time value of money and credit risk. In contrast, contractual termsthat introduce a more than de minimis exposure to risks or volatility in the contractual cash flows thatare unrelated to a basic lending arrangement do not give rise to contractual cash flows that are SPPI. Insuch cases, the financial asset is required to be measured at FVTPL.
Financial assets at FVTPLThese are recorded in the statements of financial position at fair value with changes in fair valuerecognized in ‘Trading, securities and foreign exchange gain - net’. Interest earned is recorded in‘Interest Income’ while dividend income is recorded in ‘Dividends’ when the right to receive paymenthas been established. Included in this classification are debt and equity securities which have beenacquired principally for the purpose of selling or repurchasing in the near term.
Derivatives recorded at FVTPLThe Parent Company and some of its subsidiaries are counterparties to derivative contracts, such ascurrency forwards, currency swaps, interest rate swaps (IRS), call options, non-deliverable forwards(NDF) and other interest rate derivatives. These derivatives are entered into as a service to customersand as a means of reducing or managing their respective foreign exchange and interest rate exposures,as well as for trading purposes. Such derivative financial instruments are initially recorded at fair valueon the date at which the derivative contract is entered into and are subsequently remeasured at fairvalue. Any gains or losses arising from changes in fair values of derivatives (except those accountedfor as accounting hedges) are taken directly to the statement of income and are included in ‘Trading,securities and foreign exchange gain - net’. Derivatives are carried as assets when the fair value ispositive and as liabilities when the fair value is negative.
Investment securities at FVOCIInvestment securities at FVOCI include debt and equity securities. After initial measurement,investment securities at FVOCI are subsequently measured at fair value. The unrealized gains andlosses arising from the fair valuation of investment securities at FVOCI are excluded, net of tax asapplicable, from the reported earnings and are included in the statement of comprehensive income as‘Change in net unrealized loss on investment securities at FVOCI’.
- 9 -
*SGVFS038804*
Debt securities at FVOCI are those that meet both of the following conditions: (i) the asset is heldwithin a business model whose objective is to hold the financial assets in order to both collectcontractual cash flows and sell financial assets; and (ii) the contractual terms of the financial asset giverise on specified dates to cash flow that are SPPI on the outstanding principal amount. The effectiveyield component of debt securities at FVOCI, as well as the impact of restatement on foreign currency-denominated debt securities at FVOCI is reported in the statement of income. Interest earned on holdingdebt securities at FVOCI are reported as ‘Interest Income’ using the effective interest rate (EIR)method. When the debt securities at FVOCI are disposed of, the cumulative gain or loss previouslyrecognized in the statement of comprehensive income is recognized as ‘Trading, securities and foreignexchange gain - net’ in the statement of income. The expected credit loss (ECL) arising fromimpairment of such investments are recognized in OCI with a corresponding charge to ‘Provision forcredit and impairment losses’ in the statement of income.
Equity securities designated at FVOCI are those that the Group made an irrevocable election to presentin OCI the subsequent changes in fair value. Dividends earned on holding equity securities at FVOCIare recognized in the statement of income as ‘Dividends’ when the right of the payment has beenestablished, except when the Group benefits from such proceeds as a recovery part of the cost of theinstrument, in which case, such gains are recorded in OCI. Gains and losses on disposal of these equitysecurities are never recycled to profit or loss, but the cumulative gain or loss previously recognized inthe statement of comprehensive income is reclassified to ‘Surplus’ or any other appropriate equityaccount upon disposal. Equity securities at FVOCI are not subject to impairment assessment.
Financial assets at amortized costFinancial assets at amortized cost are debt financial assets that meet both of the following conditions:(i) these are held within a business model whose objective is to hold the financial assets in order tocollect contractual cash flows; and (ii) the contractual terms give rise on specified dates to cash flowsthat are SPPI on the outstanding principal amount. This accounting policy relates to the statement offinancial position captions ‘Due from BSP’, ‘Due from other banks’, ‘Interbank loans receivable andSPURA’, ‘Investment securities at amortized cost’ and ‘Loans and receivables’.
After initial measurement, financial assets at amortized cost are subsequently measured at amortizedcost using the EIR method, less impairment in value. Amortized cost is calculated by taking intoaccount any discount or premium on acquisition and fees that are an integral part of the EIR. Theamortization is included in ‘Interest income’ in the statement of income. Gains and losses arerecognized in statement of income when these investments are derecognized or impaired, as well asthrough the amortization process. The ECL are recognized in the statement of income under‘Provision for credit and impairment losses’. The effects of revaluation on foreign currency-denominated investments are recognized in the statement of income
Financial liabilities at amortized costIssued financial instruments or their components, which are not designated at FVTPL, are classifiedas liabilities under ‘Deposit liabilities’, ‘Bills payable and securities sold under repurchaseagreements (SSURA)’, ‘Bonds payable’, or ‘Subordinated debts’ or other appropriate financialliability accounts, where the substance of the contractual arrangement results in the Group having anobligation either to deliver cash or another financial asset to the holder, or to satisfy the obligationother than by the exchange of a fixed amount of cash or another financial asset for a fixed number ofown equity shares. The components of issued financial instruments that contain both liability andequity elements are accounted for separately, with the equity component being assigned the residualamount after deducting from the instrument as a whole the amount separately determined as the fairvalue of the liability component on the date of issue.
- 10 -
*SGVFS038804*
After initial measurement, bills payable and similar financial liabilities not qualified as and notdesignated at FVTPL, are subsequently measured at amortized cost using the EIR method.Amortized cost is calculated by taking into account any discount or premium on the issue and feesthat are an integral part of the EIR.
Financial Guarantees and Undrawn Loan CommitmentsThe Group issues financial guarantees and loan commitments. Financial guarantees are those issuedby the Group to creditors as allowed under existing rules and regulations whereby it guarantees thirdparty obligations by signing as guarantor in the contract/agreement. Undrawn loan commitments andletters of credit are commitments under which over the duration of the commitment, the Group isrequired to provide a loan with pre-specified terms to the customer. The nominal contractual value offinancial guarantees and undrawn loan commitments, where the loan agreed to be provided is onmarket terms, are not recorded in the statement of financial position. Starting January 1, 2018, thesecontracts are in the scope of the ECL requirements where the Group estimates the expected portion ofthe undrawn loan commitments that will be drawn over their expected life. The ECL related tofinancial guarantees and undrawn loan commitments is recognized in ‘Miscellaneous liabilities’under ‘Other liabilities’.
Derecognition of Financial Assets and Financial LiabilitiesFinancial assetsA financial asset (or, where applicable, a part of a financial asset or part of a group of financial assets)is derecognized when:· the rights to receive cash flows from the asset have expired; or· the Group retains the right to receive cash flows from the asset, but has assumed an obligation to
pay them in full without material delay to a third party under a “pass-through” arrangement; or· the Group has transferred its rights to receive cash flows from the asset and either (a) has
transferred substantially all the risks and rewards of the asset, or (b) has neither transferred norretained the risks and rewards of the asset but has transferred the control of the asset.
Where the Group has transferred its rights to receive cash flows from an asset or has entered into apass-through arrangement, and has neither transferred nor retained substantially all the risks andrewards of the asset nor transferred control of the asset, the asset is recognized to the extent of theGroup’s continuing involvement in the asset. The extent of the Group’s continuing involvement inthe transferred asset is the extent to which it is exposed to changes in the value of the transferredasset. When the Group’s continuing involvement takes the form of guaranteeing the transferred asset,the extent of the Group’s continuing involvement is the lower of (i) the amount of the asset and (ii)the maximum amount of the consideration received that the Group could be required to repay (‘theguarantee amount’). When the Group’s continuing involvement takes the form of a written orpurchased option (or both) on the transferred asset, the extent of the Group’s continuing involvementis the amount of the transferred asset that the Group may repurchase. However, in case of a writtenput option to an asset that is measured at fair value, the extent of the Group’s continuing involvementis limited to the lower of the fair value of the transferred asset and the option exercise price. Whenthe Group’s continuing involvement takes the form of a cash-settled option or similar provision onthe transferred asset, the extent of the Group’s continuing involvement is measured in the same wayas that which results from non-cash settled options.
Financial assets are written off either partially or in their entirety only when the Group has stoppedpursuing the recovery. If a write-off is later recovered, any amounts formerly charged are credited to‘Recovery on Charged-off Assets’ under ‘Miscellaneous Income’ in the Statements of Income.
- 11 -
*SGVFS038804*
Financial liabilitiesA financial liability is derecognized when the obligation under the liability is discharged, cancelled orhas expired. Where an existing financial liability is replaced by another from the same lender onsubstantially different terms, or the terms of an existing liability are substantially modified, such anexchange or modification is treated as a derecognition of the original liability and the recognition of anew liability, and the difference in the respective carrying amounts is recognized in the statement ofincome.
Repurchase and reverse repurchase agreementsSecurities sold under agreements to repurchase at a specified future date (‘repos’) are notderecognized from the statement of financial position. The corresponding cash received, includingaccrued interest, is recognized in the statement of financial position as SSURA included in ‘Billspayable and SSURA’ and is considered as a loan to the Group, reflecting the economic substance ofsuch transaction.
Conversely, securities purchased under agreements to resell at a specified future date (‘reverse repos’)are not recognized in the statement of financial position. The corresponding cash paid includingaccrued interest, is recognized in the statement of financial position as SPURA, and is considered aloan to the counterparty. The difference between the purchase price and resale price is treated asinterest income and is accrued over the life of the agreement using the EIR method.
Reclassification of Financial AssetsThe Group reclassifies its financial assets when there is a change in its business model for managingfinancial assets. A change in business model occurs when the Group either begins or ceases toperform an activity that is significant to its operations. The Group applies the reclassificationprospectively from the reclassification date and does not restate any previously recognized gains,losses or interest.
Impairment of Financial AssetsPolicies applicable beginning January 1, 2018The adoption of PFRS 9 has changed the Group’s loss impairment method on financial assets byreplacing PAS 39’s incurred loss approach with a forward-looking ECL approach which covers allloans and other debt financial assets not held at FVTPL, together with loan commitments andfinancial guarantee contracts.
Overview of the ECL principlesECL represents credit losses that reflect an unbiased and probability weighted amount which is basedon reasonable and supportable information about past events, current conditions and forecasts offuture economic conditions, and time value of money. The ECL allowance is based on the creditlosses expected to arise on a 12-month duration if there has been no SICR of the financial asset sinceorigination. Otherwise if a SICR is observed, then the ECL estimation is extended until the end of thelife of the financial asset. The 12-month ECL represents the losses that result from default events ona financial asset which may happen within 12 months after the reporting date. The Lifetime ECL onthe other hand represents the losses that result from default events on a financial asset which mayhappen over its life. Both Lifetime ECLs and 12-month ECLs are calculated on either an individualbasis or a collective basis, depending on the nature of the underlying portfolio of financialinstruments.
The major portfolios of financial assets identified upon initial analysis of the Group’s credit exposureare loan receivables, treasury accounts, and other receivables. Loan receivables may be availed byspecific individuals, corporations or organizations. Hence, these portfolios can be further segmented
- 12 -
*SGVFS038804*
to commercial and consumer portfolios. After segmentation, financial assets are grouped intoStage 1, Stage 2, and Stage 3 as described below.
Definition of “default” and “cure”The Group defines a financial instrument as in default, which is fully aligned with the definition ofnon-performing loans i.e. credit impaired, in all cases when the borrower becomes more than 90 days(more than 30 days in 2018) past due on its contractual payments. As a part of a qualitativeassessment of whether a customer is in default, the Group also considers a variety of instances thatmay indicate unlikeliness to pay. When such events occur, the Group carefully considers whether theevent should result in treating the customer as defaulted. An instrument is considered to be no longerin default (i.e. to have cured) when it no longer meets any of the default criteria and has exhibited asatisfactory track record.
Treasury exposures are considered in default upon occurrence of a credit event such as but not limitedto bankruptcy of counterparty, restructuring, failure to pay on agreed settlement date, or request formoratorium.
SICRIn order to determine whether an instrument is subject to 12-month or Lifetime ECL, the Groupassesses whether there has been a SICR since initial recognition. The criteria for determiningwhether credit risk has increased significantly vary by portfolio and include quantitative andqualitative factors. The credit risk of a particular exposure is deemed to have increased significantlysince initial recognition if, based on the Group’s internal credit assessment, the borrower orcounterparty is determined to have well-defined credit weaknesses (i.e. with internal credit rating of 6due to financial or repayment concerns or lower). These may include adverse trends or developmentsof financial, managerial, economic or political nature, or a significant weakness in collateral. Creditweakness may be manifested by unfavorable record or unsatisfactory characteristics or may only bepotential that deserves management’s close attention and may lead to significant losses or may resultin collection or liquidation of the outstanding loan amount to be highly improbable. For exposureswithout internal credit grades, if contractual payments are more than 30 days past due (1 day past duein 2018), the credit risk is deemed to have increased significantly since initial recognition. Days pastdue are determined by counting the number of days since the earliest elapsed due date in respect ofwhich full payment has not been received. In subsequent reporting periods, if the credit risk of thefinancial asset improves over an observable period such that there is no longer a SICR since initialrecognition, the Group shall revert to recognizing a 12-month ECL.
Staging assessmentFor non-credit-impaired financial assets:· Stage 1 is comprised of all non-impaired financial assets which have not experienced a SICR
since initial recognition. The Group recognizes a 12-month ECL for Stage 1 financial assets.· Stage 2 is comprised of all non-impaired financial assets which have experienced a SICR since
initial recognition. The Group recognizes a lifetime ECL for Stage 2 financial assets.
For credit-impaired financial assets:· Financial assets are classified as Stage 3 when there is objective evidence of impairment as a
result of one or more loss events that have occurred after initial recognition with a negativeimpact on the estimated future cash flows of a financial asset or a portfolio of financial assets.ECL for Stage 3 exposure are computed on a per account, taking into consideration the presentvalue of the expected recoverable cash flows from each transaction.
- 13 -
*SGVFS038804*
Financial assets that are credit-impaired on initial recognition are classified as purchased or originatedcredit-impaired (POCI) assets. These are recorded at fair value at original recognition and interestincome is subsequently recognized based on a credit-adjusted EIR. ECL is only recognized orreleased to the extent that there is a subsequent change in the ECLs. POCI assets pertain to loanspurchased by the Parent Company from MBCL.
Assessment of ECL on a collective basisThe Group calculates ECL either on an individual or a collective basis. The Group performscollective impairment by grouping exposures into smaller homogenous portfolios based on acombination of borrower and account characteristics. Accounts with similar risk attributes (i.e.facility, security, credit rating, months-on-books, utilization and collateral type, etc.) are pooledtogether for calculating provisions based on the ECL models.
ECL parameters and methodologiesECL is a function of the probability of default (PD), exposure-at-default (EAD), and loss-givendefault (LGD), with the timing of the loss also considered, and is estimated by incorporating forward-looking economic information and through the use of experienced credit judgement.
The PD represents the likelihood that a credit exposure will not be repaid and will go into default ineither a 12-month horizon for Stage 1 or lifetime horizon for Stage 2. The PD for each individualfinancial asset is modelled based on historical data and is estimated based on current marketconditions and reasonable and supportable information about future economic conditions. The Groupsegmented its credit exposures based on homogenous risk characteristics and developed acorresponding PD methodology for each portfolio. The PD methodology for each relevant portfoliois determined based on the underlying nature or characteristic of the portfolio, behavior of theaccounts and materiality of the segment as compared to the total portfolio.
EAD consists of the amortized cost and any accrued interest receivable. For off-balance sheet andundrawn committed amounts, EAD includes a credit conversion factor which is an estimate of anyfurther amount to be drawn at the time of default.
LGD is the amount that may not be recovered in the event of default and is modelled based onhistorical cash flow recovery and reasonable and supportable information about future economicconditions, where appropriate. LGD takes into consideration the amount and quality of any collateralheld.
The Group applies a simplified ECL approach for its accounts receivables wherein the Group uses aprovisioning matrix that considers historical changes in the behavior of the portfolio to predictconditions over the span of a given observation period.
MCC offers credit card facilities, in which MCC has the right to cancel and/or reduce the facilitieswith one-day notice. MCC does not limit its exposure to credit losses to the contractual notice period,but instead, calculates ECL over a period that reflects MCC’s expectations of the customers’behavior, their likelihood of default, and MCC’s future risk mitigation procedures, which couldinclude reducing or cancelling the facilities. Based on past experience and MCC’s expectations, theperiod over which MCC calculates ECL for these products is two years. The interest rate used todiscount the ECL for credit cards is based on contractual interest rate. These rates are also used todiscount future recoveries over a period of five years as these cover the cost of securing an equivalentfund. MCC uses the contractual interest rate as discounting factor as MCC estimates that this rate isreflective of the EIR.
- 14 -
*SGVFS038804*
Forward-looking informationThe Group incorporates forward-looking information into both its assessment of whether the creditrisk of a financial asset has increased significantly since its initial recognition and its measurement ofECL. A broad range of forward-looking information are considered as economic inputs, such asgrowth of the gross domestic product, inflation rates, unemployment rates, interest rates and BSPstatistical indicators. The inputs and models used for calculating ECL may not always capture allcharacteristics of the market at the date of the financial statements. To reflect this, qualitativeadjustments or overlays are occasionally made as temporary adjustments when such differences aresignificantly material.
In 2018, the Company incorporated forward-looking information to its ECL estimation using thefollowing economic inputs:· Gross Domestic Product (GDP) (current) growth· London Interbank Offered Rate (LIBOR)· PHP / USD exchange rate
In 2019, after model reviews and validation, the Company relied on the following as economic inputsin measuring ECL:· Treasury Bill (T-Bill) Rates· Philippine Stock Exchange (PSE) All Shares Index· GDP growth· External debt· PSE Financials Index· GDP Financial intermediation· Government expenditure
Debt investment securities measured at FVOCIThe ECL for debt securities at FVOCI do not reduce the carrying amount of these financial assets inthe statement of financial position, which remains at fair value. Instead, an amount equal to theallowance that would arise if the assets were measured at amortized cost is recognized in OCI as anaccumulated impairment amount, with a corresponding charge to profit or loss. The accumulated lossrecognized in OCI is recycled to profit or loss upon derecognition of these financial assets.
Policies applicable prior to January 1, 2018The Group assesses at each statement of financial position date whether there is objective evidencethat a financial asset or group of financial assets is impaired. A financial asset or a group of financialassets is deemed to be impaired if, and only if, there is objective evidence of impairment as a result ofone or more events that has occurred after the initial recognition of the asset (an incurred ‘loss event’)and that loss event (or events) has an impact on the estimated future cash flows of the financial assetor the group of financial assets that can be reliably estimated. Evidence of impairment may includeindications that the borrower or a group of borrowers is experiencing significant financial difficulty,default or delinquency in interest or principal payments, the probability that they will enterbankruptcy or other financial reorganization and where observable data indicate that there ismeasurable decrease in the estimated future cash flows, such as changes in arrears or economicconditions that correlate with defaults.
Financial assets carried at amortized costFor financial assets carried at amortized cost such as loans and receivables, due from other banks,interbank loans and SPURA, and HTM investments, the Group first assesses whether objectiveevidence of impairment exists individually for financial assets that are individually significant, orcollectively for financial assets that are not individually significant. For individually assessed
- 15 -
*SGVFS038804*
financial assets, the amount of the loss is measured as the difference between the asset’s carryingamount and the present value of the estimated future cash flows (excluding future credit losses thathave not been incurred). The present value of the estimated future cash flows is discounted at thefinancial asset’s original EIR. If a loan has a variable interest rate, the discount rate for measuringany impairment loss is the current EIR, adjusted for the original credit risk premium. The calculationof the present value of the estimated future cash flows of a collateralized financial asset reflects thecash flows that may result from foreclosure less costs for obtaining and selling the collateral.
Financial assets that are individually assessed for impairment and for which an impairment loss is, orcontinues to be, recognized are not included in a collective assessment for impairment. The carryingamount of the asset is reduced through use of an allowance account and the amount of loss is chargedto the statement of income. Interest income continues to be recognized based on the original EIR ofthe asset. Financial assets, together with the associated allowance accounts, are written off whenthere is no realistic prospect of future recovery and all collateral has been realized. If, in a subsequentperiod, the amount of the estimated impairment loss decreases because of an event occurring after theimpairment was recognized, the previously recognized impairment loss is reduced by adjusting theallowance account. If a future write-off is later recovered, any amounts formerly charged are creditedto ‘Recovery on charged-off assets’ under ‘Miscellaneous income’ in the statements of income. If theGroup determines that no objective evidence of impairment exists for individually assessed financialasset, whether significant or not, it includes the asset in a group of financial assets with similar creditrisk characteristics and collectively assesses for impairment. Those characteristics are relevant to theestimation of future cash flows for groups of such assets by being indicative of the debtors’ ability topay all amounts due according to the contractual terms of the assets being evaluated.
For the purpose of a collective evaluation of impairment, financial assets are grouped on the basis ofcredit risk characteristics such as industry, collateral type, past-due status and term. Future cashflows in a group of financial assets that are collectively evaluated for impairment are estimated on thebasis of historical loss experience for assets with credit risk characteristics similar to those in thegroup. Historical loss experience is adjusted on the basis of current observable data to reflect theeffects of current conditions that did not affect the period on which the historical loss experience isbased and to remove the effects of conditions in the historical period that do not exist currently.Estimates of changes in future cash flows reflect, and are directionally consistent with changes inrelated observable data from period to period (such as changes in property prices, payment status, orother factors that are indicative of incurred losses in the group and their magnitude). Themethodology and assumptions used for estimating future cash flows are reviewed regularly by theGroup to reduce any differences between loss estimates and actual loss experience.
The Group also uses the Net Flow Rate (NFR) method to determine the credit loss rate of a particulardelinquency age bucket based on historical data of flow-through and flow-back of loans acrossspecific delinquency age buckets. The allowance for credit losses is determined based on the resultsof the net flow to write-off methodology. Net flow tables are derived from monitoring of monthlypeso movements between different stage buckets, from 1-day past due to 180-day past due. The netflow to write-off methodology relies on the last 12 months of net flow tables to establish a NFRpercentage of accounts receivable that are current or in any state of delinquency (i.e., 30, 60, 90, 120,150 and 180 day past due) as of reporting date that will eventually result in write-off. The grossprovision is then computed based on the outstanding balances of the receivables as of statement offinancial position date and the NFRs determined for the current and each delinquency bucket. Thisgross provision is reduced by the estimated recoveries, which are also based on historical data, toarrive at the required allowance for credit losses.
- 16 -
*SGVFS038804*
If, in a subsequent period, the amount of the impairment loss decreases and the decrease can berelated objectively to an event occurring after the impairment was recognized, the previouslyrecognized impairment loss is reversed. Any subsequent reversal of an impairment loss is recognizedin the statement of income, to the extent that the carrying value of the asset does not exceed itsamortized cost at the reversal date.
AFS investmentsIn case of quoted equity securities classified as ‘AFS investments’, this would include a significant orprolonged decline in the fair value of the securities below their cost. Where there is evidence ofimpairment, the cumulative loss - measured as the difference between the acquisition cost and thecurrent fair value, less any impairment loss on that financial asset previously recognized in thestatement of income - is removed from OCI and recognized in the statement of income. Impairmentlosses on equity securities are not reversed through the statement of income. Increases in fair valueafter impairment are recognized directly in OCI. In case of unquoted equity securities classified as‘AFS investments’, the amount of the impairment is measured as the difference between theircarrying amount and the present value of estimated future cash flows discounted at the current marketrate of return for a similar financial asset. Such impairment losses shall not be reversed.
In case of debt instruments classified as ‘AFS investments’, impairment is assessed based on the samecriteria as financial assets carried at amortized cost. Future interest income is based on the reducedcarrying amount and is accrued based on the rate of interest used to discount future cash flows for thepurpose of measuring impairment loss. Such accrual is recorded as part of ‘Interest income’ in thestatement of income. If subsequently, the fair value of a debt instrument increased and the increasecan be objectively related to an event occurring after the impairment loss was recognized in thestatement of income, the impairment loss is reversed through the statement of income.
Restructured LoansWhere possible, the Group seeks to restructure loans rather than to take possession of collateral. Thismay involve extending the payment arrangements and the agreement of new loan conditions. Oncethe terms have been renegotiated, the loan is no longer considered past due. Managementcontinuously reviews and monitors restructured loans until derecognition to ensure that all criteria aremet and that future payments are likely to occur. The loans continue to be subject to an individual orcollective impairment assessment, calculated using the loan’s original EIR. The difference betweenthe recorded value of the original loan and the present value of the restructured cash flows,discounted at the original EIR, is recognized in ‘Provision for credit and impairment losses’ in thestatement of income. When the loan has been restructured but not derecognized, the Group alsoreassesses whether there has been a SICR and considers whether the assets should be classified asStage 3. If the restructuring terms are substantially different, the loan is derecognized and a new‘asset’ is recognized at fair value using the revised EIR.
Collateral Valuation of Financial AssetsCollateral, unless repossessed, is not recorded in the Group’s statement of financial position.However, the fair value of collateral affects the calculation of ECLs. It is generally assessed, at aminimum, at inception and re-assessed every other year. However, some collaterals, for example,cash or securities relating to margining requirements, are valued daily.
Revenue RecognitionEffective January 1, 2018Revenue from contracts with customers is recognized upon transfer of services to the customer at anamount that reflects the consideration to which the Group expects to be entitled in exchange for thoseservices.
- 17 -
*SGVFS038804*
The Group assesses its revenue arrangements against specific criteria in order to determine if it isacting as a principal or agent. The Group concluded that it is acting as a principal in all of its revenuearrangements except for certain brokerage transactions. The following specific recognition criteriamust also be met before revenue is recognized within the scope of PFRS 15:
Fee and commission incomeThe Group earns fee and commission income from a diverse range of services it provides to itscustomers, which are divided into the following two categories:
a. Fee income earned from services that are provided over a certain period of timeFees earned for the provision of services over a period of time are accrued over that period as thecustomer simultaneously receives and consumes the benefits provided by the Group. Using anoutput method, revenue is recognized if the Group has a right to invoice the customer for servicesdirectly corresponding to performance completed to date. These fees include investment fundfees, custodian fees, fiduciary fees, asset management fees, and income from trust operations.
b. Fee income from providing transaction servicesFees arising from negotiating or participating in the negotiation of a transaction for a third party -such as commission income, underwriting fees, corporate finance fees, advisory fees andbrokerage fees for the arrangement of the acquisition of shares or other securities or the purchaseor sale of businesses are recognized on completion of the underlying transaction. Fees orcomponents of fees that are linked to a certain performance are recognized after fulfilling thecorresponding criteria.
Prior to January 1, 2018, the Group adopted PAS 18 in accounting for the above fees andcommissions. The Group assessed that there is no difference in accounting for the above fees andcommission income under PFRS 15 and PAS 18.
Discounts earned, membership fees and awards revenue on credit cardsThe following table provides information about the nature and timing of the satisfaction ofperformance obligations for the Group’s credit card business, including significant payment terms,and the related revenue recognition policies.
Type ofproduct/service
Nature and timing of satisfaction ofperformance obligations, including
significant payment termsRevenue recognition
under PFRS 15Revenue recognition
under PAS 18Discounts earned Charges arising from credit availments
by the Group’s and other creditcompanies’ cardholders when theGroup is acting as an acquirer. Thesediscounts are computed based oncertain agreed rates. These alsoinclude interchange income fromtransactions processed by otheracquirers through VISA andMastercard and fees from cashadvance transactions of cardholders.
Recognized as revenue upon receiptfrom member establishments ofcharges arising from creditavailments by the Group’scardholders and other creditcompanies’ cardholders when theGroup is acting as an acquirer.
Recognized as revenue upon receiptfrom member establishments ofcharges arising from creditavailments by the Group’scardholders and other creditcompanies’ cardholders when theGroup is acting as an acquirer.
Membership fees anddues
Periodically charged to cardholdersupfront.
Deferred and recorded under‘Deferred revenue’ and recognizedon a straight-line basis over theperiod the fee entitles thecardholders to use the card.
Deferred and recorded under‘Deferred revenue’ and recognizedon a straight-line basis over theperiod the fee entitles thecardholders to use the card.
- 18 -
*SGVFS038804*
Type ofproduct/service
Nature and timing of satisfaction ofperformance obligations, including
significant payment termsRevenue recognition
under PFRS 15Revenue recognition
under PAS 18Awards revenue The Group operates a loyalty points
program, which allows customers toaccumulate points when they purchasefrom member establishments using theissued card of the Group. The pointsaccumulate and do not expire.
The Group allocates a portion of theconsideration received fromdiscounts earned and interchangefees from credit cards to the rewardpoints based on the estimated stand-alone selling prices. The amountallocated to the loyalty program isdeferred, and is recognized asrevenue when loyalty points areredeemed or the likelihood of thecustomer redeeming the loyaltypoints becomes remote.
A proportion of the revenue fromdiscounts earned and interchangefees from credit cards is allocated tothe reward points. The allocatedrevenue that corresponds to the totalfair value of the reward points isdetermined by applying statisticalanalysis. The fair value of thepoints issued is deferred andrecorded under ‘Deferred revenue’and recognized as revenue when thepoints are redeemed.
Revenues outside the scope of PFRS 15Interest incomeFor all financial instruments measured at amortized cost and interest-bearing financial instrumentsclassified as investment securities at FVOCI investments, interest income is recorded at the EIR,which is the rate that exactly discounts estimated future cash receipts through the expected life of thefinancial instrument or a shorter period, where appropriate, to the net carrying amount of the financialasset. The calculation takes into account all contractual terms of the financial instrument (forexample, prepayment options), including any fees or incremental costs that are directly attributable tothe instrument and are an integral part of the EIR. The adjusted carrying amount is calculated basedon the original EIR. The change in carrying amount is recorded as ‘Interest income’. Loancommitment fees that are likely to be drawn down are deferred (together with any incremental costs)and recognized as an adjustment to the EIR of the loan.
Under PFRS 9, when a financial asset becomes credit-impaired and is, therefore, regarded as Stage 3(as discussed in “Impairment of Financial Assets” above), the Group calculates interest income byapplying the EIR to the net amortized cost of the financial asset. If the financial asset cures and is nolonger credit-impaired, the Group reverts to calculating interest income on a gross basis. UnderPAS 39 (applicable prior to January 1, 2018), once the recorded value of a financial asset or group ofsimilar financial assets carried at amortized cost has been reduced due to an impairment loss, interestincome continues to be recognized using the original EIR applied to the new carrying amount.
Purchases by credit cardholders, collectible on an installment basis, are recorded at the cost of theitems purchased plus a certain percentage of cost. The excess over cost is credited to ‘Unearneddiscount’ and is shown as a deduction from ‘Loans and receivables’ in the consolidated statement offinancial position. The unearned discount is taken up to interest income over the installment termsand is computed using the EIR method.
Recovery on charged-off assetsIncome arising from collections on accounts or recoveries from impairment of items previouslywritten off are recognized in the year of recovery.
Leasing income - Finance leaseThe excess of aggregate lease rentals plus the estimated residual value over the cost of the leasedequipment constitutes the unearned lease income. Residual values represent estimated proceeds fromthe disposal of equipment at the time lease is estimated. The unearned lease income is amortized overthe term of the lease, commencing on the month the lease is executed using the EIR method.
Dividend incomeDividend income is recognized when the Group’s right to receive payment is established.
- 19 -
*SGVFS038804*
Trading and securities gain (loss) - netResults arising from trading activities include all gains and losses from changes in fair value forfinancial assets and financial liabilities at FVTPL and gains and losses from disposal of investmentsecurities at FVTPL, debt securities at FVOCI/AFS and HTM investments.
Rental incomeRental income arising on leased properties is accounted for on a straight-line basis over the leaseterms on ongoing leases and is recorded in the statement of income under ‘Leasing’.
Income on direct financing leases and receivables financedIncome on loans and receivables financed with short-term maturities is recorded in ‘Interest income’and is recognized using the EIR method. Interest and finance fees on finance leases and loans andreceivables financed with long-term maturities and the excess of the aggregate lease rentals plus theestimated terminal value of the leased equipment over its cost are credited to unearned discount andamortized over the term of the note or lease using the EIR method.
Gain on sale of investment in associateUpon loss of significant influence over an associate, the Group measures and recognizes any retainedinvestment at its fair value. Any difference between the carrying amount of the associate upon loss ofsignificant influence and the fair value of the retained investment and proceeds from disposal isrecognized in profit or loss.
Gain on sale of non-current asset held for saleThe gain or loss arising from the sale of non-current asset held for sale is included in profit or losswhen the item is derecognized. The gain or loss arising from the derecognition of non-current assetheld for sale is determined as the difference between the net disposal proceeds and its carryingamount on the date of the transaction.
Cash and Cash EquivalentsFor purposes of reporting cash flows, cash and cash equivalents include cash and other cash items,amounts due from BSP and other banks, and interbank loans receivable and SPURA with originalmaturities of three months or less from dates of placements and that are subject to insignificant risk ofchanges in value.
Property and EquipmentLand is stated at cost less any impairment in value and depreciable properties including buildings,furniture, fixtures and equipment and leasehold improvements are stated at cost less accumulateddepreciation and amortization, and any impairment in value. Such cost includes the cost of replacingpart of the property and equipment when that cost is incurred, if the recognition criteria are met butexcludes repairs and maintenance costs. Building under construction (BUC) is stated at cost andincludes cost of construction and other direct costs. BUC is not depreciated until such time that therelevant asset is completed and put into operational use.
Depreciation is calculated on the straight-line method over the estimated useful life of the depreciableassets. Leasehold improvements are amortized over the shorter of the terms of the covering leasesand the estimated useful lives of the improvements. The range of estimated useful lives of propertyand equipment follows:
Buildings 25 to 50 yearsFurniture, fixtures and equipment 2 to 5 yearsLeasehold improvements 5 to 20 years
- 20 -
*SGVFS038804*
The depreciation and amortization method and useful life are reviewed periodically to ensure that themethod and period of depreciation and amortization are consistent with the expected pattern ofeconomic benefits from items of property and equipment.
An item of property and equipment is derecognized upon disposal or when no future economicbenefits are expected from its use or disposal. Any gain or loss arising on derecognition of the asset(calculated as the difference between the net disposal proceeds and the carrying amount of the asset)is included in the statement of income under ‘Profit from assets sold’ in the year the asset isderecognized.
Investments in Subsidiaries, Associates and a Joint Venture (JV)Investment in subsidiariesSubsidiaries pertain to all entities over which the Group has control. Control is achieved when theGroup is exposed, or has rights, to variable returns from its involvement with the investee and has theability to affect those returns through its power over the investee. When the Group has less than amajority of the voting or similar rights of an investee, the Group considers all relevant facts andcircumstances in assessing whether it has power over an investee, including:· the contractual arrangement with the other vote holders of the investee;· rights arising from other contractual arrangements; and· the Group’s voting rights.
Investment in associatesAssociates pertain to all entities over which the Group and the Parent Company have significantinfluence. Significant influence is the power to participate in the financial and operating policydecisions of the investee, but is not control or joint control over those policies. Investment inassociates is accounted for under the equity method of accounting.
Investment in a JVA JV is a type of joint arrangement whereby the parties that have joint control of the arrangementhave rights to the net assets of the JV. Joint control is the contractually agreed sharing of control ofan arrangement, which exists only when decisions about the relevant activities require unanimousconsent of the parties sharing control. Investment in a JV is accounted for under the equity method ofaccounting. The Group’s investment in a JV represents the 30% interest of PSBank in SumishoMotor Finance Corporation (SMFC) (Note 11).
Upon loss of significant influence over the associate or joint control over the JV, the Group and theParent Company measure and recognize any retained investment at its fair value. Any differencebetween the carrying amount of the associate or JV upon loss of significant influence or joint controland the fair value of the retained investment and proceeds from disposal is recognized in thestatement of income.
Under the equity method, investments in associates and a JV are carried in the statement of financialposition at cost plus post-acquisition changes in the Group’s and the Parent Company’s share of thenet assets of the associate or JV less any impairment in value. Post-acquisition changes in the shareof net assets of the associate or a JV include the share in the: (a) income or losses; and (b) unrealizedgain or loss on investment securities, remeasurement of retirement plans and others. Dividendsreceived are treated as a reduction in the carrying values of the investments. Goodwill relating to theassociate and a JV is included in the carrying value of the investment and is not amortized. When theGroup and the Parent Company increase its ownership interest in an associate or a JV that continuesto be accounted for under the equity method, the cost for the additional interest is added to theexisting carrying amount of the associate or JV and the existing interest in the associate or JV is not
- 21 -
*SGVFS038804*
remeasured. The share in an associate or a JV’s post-acquisition profits or losses is recognized in thestatement of income as ‘Share in net income of subsidiaries, associates and a joint venture’ while itsshare of post-acquisition movements in the associate or JV’s equity reserves is recognized directly inthe statement of comprehensive income. When the share of losses in an associate or a JV equals orexceeds its interest in the associate or JV, including any other unsecured receivables, the Group andthe Parent Company do not recognize further losses, unless it incurred obligations or made paymentson behalf of the associate or JV which is recognized as miscellaneous liabilities. Profits and lossesresulting from transactions between the Group or the Parent Company and an associate or JV areeliminated to the extent of the Group or the Parent Company’s interest in the associate or JV.
Investments in subsidiaries in the separate financial statements are accounted for under the equitymethod similarly as investments in associates and JV. Equity in other comprehensive income (losses)of subsidiaries and changes therein are included in remeasurement losses on retirement plan, netunrealized loss on investment securities at FVOCI and AFS investments, and translation adjustmentsand others as appropriate together with the Parent Company in the separate statement of financialposition and statement of comprehensive income.
Investment PropertiesInvestment properties are measured initially at cost, including transaction costs. An investmentproperty acquired through an exchange transaction is measured at fair value of the asset acquiredunless the fair value of such an asset cannot be measured in which case the investment propertyacquired is measured at the carrying amount of asset given up. The difference between the fair valueof the asset received and the carrying amount of the asset given up is recorded as ‘Gain on initialrecognition of investment properties’ under ‘Miscellaneous income’. Foreclosed properties areclassified under ‘Investment properties’ upon: a.) entry of judgment in case of judicial foreclosure;b.) execution of the Sheriff’s Certificate of Sale in case of extra-judicial foreclosure; orc.) notarization of the Deed of Dacion in case of dation in payment (dacion en pago). Subsequent toinitial recognition, investment properties are carried at cost less accumulated depreciation (fordepreciable investment properties) and impairment in value.
Investment properties are derecognized when they have either been disposed of or when theinvestment property is permanently withdrawn from use and no future benefit is expected from itsdisposal. Any gains or losses on the retirement or disposal of an investment property are recognizedin the statement of income under ‘Profit from assets sold’ in the year of retirement or disposal.
Expenditures incurred after the investment properties have been put into operations, such as repairsand maintenance costs, are normally charged to operations in the year in which the costs are incurred.Depreciation is calculated on a straight-line basis using the remaining useful lives from the time ofacquisition of the investment properties based on appraisal reports but not to exceed 50 years forbuildings and condominium units.
Transfers are made to investment properties when, and only when, there is a change in use evidencedby ending of owner occupation, commencement of an operating lease to another party or ending ofconstruction or development. Transfers are made from investment properties when, and only when,there is a change in use evidenced by commencement of owner occupation or commencement ofdevelopment with a view to sale.
Interest in Joint OperationsThe Group is a party to joint operations whereby it contributed parcels of land for development intoresidential and commercial units. In respect of the Group’s interest in the joint operations, the Grouprecognizes the following: (a) the assets that it controls and the liabilities that it incurs; and (b) theexpenses that it incurs and its share of the income that it earns from the sale of units by the joint
- 22 -
*SGVFS038804*
operations. The assets contributed to the joint operations are measured at the lower of cost or netrealizable value. Net realizable value is the estimated selling price in the ordinary course of businessless estimated costs necessary to make the sale (Note 14).
Chattel Mortgage PropertiesChattel mortgage properties comprise of repossessed vehicles. Chattel mortgage properties are statedat cost less accumulated depreciation and impairment in value. Depreciation is calculated on astraight-line basis using the remaining useful lives from the time of acquisition of the vehicles. Theuseful lives of chattel mortgage properties are estimated to be five years.
Subordinated NotesSubordinated notes issued by Special Purpose Vehicles (SPV) (presented as ‘Investment in SPVs’under ‘Other assets’) are stated at amortized cost reduced by an allowance for credit losses. Theallowance for credit losses is determined based on the difference between the outstanding principalamount and the recoverable amount which is the present value of the future cash flow expected to bereceived as payment for the subordinated notes.
Intangible AssetsSoftware costsSoftware costs (presented under ‘Other assets’) are capitalized on the basis of the cost incurred toacquire and bring to use the specific software. These costs are amortized over three to five years on astraight-line basis. Costs associated with maintaining the computer software programs are recognizedas expense when incurred. Software costs are carried at cost less accumulated amortization.
Exchange trading rightExchange trading right (included in ‘Miscellaneous assets’ presented under ‘Other assets’) is a resultof the PSE conversion plan to preserve access of First Metro Securities Brokerage Corporation(FMSBC), a subsidiary of FMIC, to the trading facilities and continue transacting business in thePSE. The exchange trading right has an indefinite useful life as there is no foreseeable limit to theperiod over which this asset is expected to generate net cash inflows. It is carried at the amountallocated from the original cost to the exchange membership seat (after a corresponding allocationwas made to the value of the PSE shares) less any allowance for impairment losses. FMSBC does notintend to sell the exchange trading right in the near future.
GoodwillGoodwill acquired in a business combination is initially measured at cost being the excess of the costof the business combination over the Group’s interest in the net fair value of the acquiree’sidentifiable assets, liabilities and contingent liabilities. With respect to investments in associates anda JV, goodwill is included in the carrying amounts of the investments. Following initial recognition,goodwill is measured at cost net of impairment losses (see accounting policy on “Impairment of Non-financial Assets”).
Customized System Development CostCustomized system development cost consists of payments for customization of various bankingsystems. This account will be reclassified to appropriate accounts upon completion and will bedepreciated and amortized from the time the asset is ready for its intended use (Note 14).
Impairment of Non-financial AssetsProperty and equipment, investments in subsidiaries, associates and a JV, investment properties,chattel mortgage properties, intangible assets with finite useful lives and other assetsAt each statement of financial position date, the Group assesses whether there is any indication thatits non-financial assets may be impaired. When an indicator of impairment exists or when an annual
- 23 -
*SGVFS038804*
impairment testing for an asset is required, the Group makes a formal estimate of recoverable amount.Recoverable amount is the higher of an asset’s fair value less costs to sell (FVLCTS) and its value inuse (VIU) and is determined for an individual asset, unless the asset does not generate cash inflowsthat are largely independent of those from other assets or groups of assets, in which case therecoverable amount is assessed as part of the cash generating unit to which it belongs. Where thecarrying amount of an asset exceeds its recoverable amount, the asset is considered impaired and iswritten down to its recoverable amount. In assessing VIU, the estimated future cash flows arediscounted to their present value using a pre-tax discount rate that reflects current market assessmentsof the time value of money and the risks specific to the asset. An impairment loss is charged tooperations in the year in which it arises.
An assessment is made at each statement of financial position date as to whether there is anyindication that previously recognized impairment losses may no longer exist or may have decreased.If such indication exists, the recoverable amount is estimated. A previously recognized impairmentloss is reversed only if there has been a change in the estimates used to determine the asset’srecoverable amount since the last impairment loss was recognized. If that is the case, the carryingamount of the asset is increased to its recoverable amount. That increased amount cannot exceed thecarrying amount that would have been determined, net of depreciation and amortization, had noimpairment loss been recognized for the asset in prior years. Such reversal is recognized in thestatement of income. After such a reversal, the depreciation and amortization expense is adjusted infuture years to allocate the asset’s revised carrying amount, less any residual value, on a systematicbasis over its remaining life.
Intangible assets with indefinite useful lives and customized system development cost not yetavailable for useIntangible assets with indefinite useful lives such as exchange trading right and customized systemdevelopment cost not yet available for use are tested for impairment annually at statement of financialposition date either individually or at the cash generating unit level, as appropriate.
GoodwillGoodwill is reviewed for impairment, annually or more frequently if events or changes incircumstances indicate that the carrying value may be impaired. Impairment is determined forgoodwill by assessing the recoverable amount of the cash generating unit (CGU) (or group of CGUs)to which the goodwill relates. Where the recoverable amount of the CGU (or group of CGUs) is lessthan the carrying amount of the CGU (or group of CGUs) to which goodwill has been allocated, animpairment loss is recognized immediately in the statement of income. The Group uses the higher ofFVLCTS and VIU using cash flow projections from financial budgets approved by seniormanagement in determining the recoverable amount.
LeasesGroup as lesseePolicies applicable beginning January 1, 2019The Group assesses at contract inception whether a contract is, or contains a lease. A contractcontains a lease if it conveys the right to control the use of an identified asset for a period of time inexchange for consideration. The Group applies a single recognition and measurement approach for allleases, except for short-term leases and leases of low-value assets. The Group recognizes leaseliabilities to make lease payments and ROU assets representing the right-of-use the underlying assets.
ROU assetsThe Group recognizes ROU assets (included in ‘Property and Equipment’) at the commencement dateof the lease (i.e. the date the underlying asset is available for use). ROU assets are measured at costless any accumulated depreciation and impairment losses, and adjusted for any remeasurement of
- 24 -
*SGVFS038804*
lease liabilities. The cost of ROU assets includes the amount of lease liabilities recognized and leasepayments made at or before the commencement date less any lease incentives received. ROU assetsare depreciated on a straight line basis over the shorter of the lease term and the estimated useful livesof the assets, as follows:
Office space 1 to 29 yearsATM site and equipment 1 to 5 years
Lease liabilitiesAt the commencement date of the lease, the Group recognizes lease liabilities measured at the presentvalue of lease payments to be made over the lease term. In calculating the present value of leasepayments, the Group uses its incremental borrowing rate at the lease commencement date because theinterest rate implicit in the lease is not readily determinable. After the commencement date, theamount of lease liabilities is increased to reflect the accretion of interest (included in ‘Interest expenseon bills payable and SSURA, bonds payable, subordinated debt and others) and reduced for the leasepayments made. In addition, the carrying amount of lease liabilities is remeasured if there is amodification, a change in the lease term or a change in the lease payments.
The Group’s lease liabilities are included in Other Liabilities (Note 21).
Short-term leases and leases of low-value assetsThe Group applies the short-term lease recognition exemption to its short-term leases of office spacesand ATM sites (i.e., those leases that have a lease term of 12 months or less from the commencementdate and do not contain a purchase option). It also applies the lease of low-value assets recognitionexemption to leases of ATM site and other equipment that are considered to be of low value (i.e.,those with value of less than P=250,000). Lease payments on short-term leases of low-value assets arerecognized as expense on a straight-line basis over the lease term.
Residual value of leased assets and deposits on lease contractsThe residual value of leased assets, which approximates the amount of guaranty deposit paid by thelessee at the inception of the lease, is the estimated proceeds from the sale of the leased asset at theend of the lease term. At the end of the lease term, the residual value of the leased asset is generallyapplied against the guaranty deposit of the lessee when the lessee decides to buy the leased asset.
Policies applicable prior to January 1, 2019The determination of whether an arrangement is, or contains a lease is based on the substance of thearrangement and requires an assessment of whether the fulfillment of the arrangement is dependenton the use of a specific asset or assets and the arrangement conveys a right to use the asset. Areassessment is made after inception of the lease only if one of the following applies:(a) there is a change in contractual terms, other than a renewal or extension of the arrangement;(b) a renewal option is exercised or extension granted, unless that term of the renewal or extension
was initially included in the lease term;(c) there is a change in the determination of whether fulfillment is dependent on a specified asset; or(d) there is a substantial change to the asset.
Where a reassessment is made, lease accounting shall commence or cease from the date when thechange in circumstances gives rise to the reassessment for scenarios (a), (c) or (d) above, and at thedate of renewal or extension period for scenario (b).
Finance leases, which transfer to the Group substantially all the risks and benefits incidental to theownership of the leased item, are capitalized at the inception of the lease at the fair value of the leasedproperty or, if lower, at the present value of the minimum lease payments and included in ‘Property
- 25 -
*SGVFS038804*
and equipment’ with the corresponding liability to the lessor included in ‘Other liabilities’. Leasepayments are apportioned between the finance charges and reduction of the lease liability so as toachieve a constant rate of interest on the remaining balance of the liability. Finance charges arerecorded directly to ‘Interest expense’.
Capitalized leased assets are depreciated over the shorter of the estimated useful lives of the assets orthe respective lease terms, if there is no reasonable certainty that the Group will obtain ownership bythe end of the lease term.
Leases where the lessor retains substantially all the risk and benefits of ownership of the assets areclassified as operating leases. Operating lease payments are recognized as an expense in thestatement of income under ‘Ocupancy and equipment-related cost’ on a straight-line basis over thelease term. Contingent rental payables are recognized as expense in the year in which they areincurred. Any prepaid rent and accrued rent were recognized under ‘Prepaid expenses’ lodged in‘Other assets’ and ‘Accrued other expenses’ lodged in ‘Accrued interest and other expenses’,respectively.
Group as lessorFinance leases, where the Group transfers substantially all the risks and benefits incidental to theownership of the leased item to the lessee, are included in the statement of financial position under‘Loans and receivables’. All income resulting from the receivable is included in ‘Interest income’ inthe statement of income.
Leases where the Group does not transfer substantially all the risks and benefits of ownership of theassets are classified as operating leases. Initial direct costs incurred in negotiating operating leasesare added to the carrying amount of the leased asset and recognized over the lease term on the samebasis as the rental income. Contingent rents are recognized as revenue in the year in which they areearned.
Retirement CostThe Group has a non-contributory defined benefit retirement plan except for FMIIC and its subsidiarywhich follow the defined contribution retirement benefit plan and the Mandatory Provident FundScheme (MPFS). The retirement cost of the Parent Company and most of its subsidiaries isdetermined using the projected unit credit method. Under this method, the current service cost is thepresent value of retirement benefits payable in the future with respect to services rendered in thecurrent year. The net defined benefit liability or asset is the aggregate of the present value of thedefined benefit obligation (DBO) at the end of the reporting period reduced by the fair value of planassets (if any), adjusted for any effect of limiting a net defined benefit asset to the asset ceiling. Theasset ceiling is the present value of any economic benefits available in the form of refunds from theplan or reductions in future contributions to the plan. The cost of providing benefits under thedefined benefit plans is actuarially determined using the projected unit credit method.
Defined benefit costs comprise the following:· Service cost· Net interest on the net defined benefit liability or asset· Remeasurements of net defined benefit liability or asset
Service costs which include current service costs, past service costs and gains or losses on non-routine settlements are recognized as expense in profit or loss. Past service costs are recognizedwhen plan amendment or curtailment occurs. These amounts are calculated periodically byindependent qualified actuaries. Net interest on the net defined benefit liability or asset is the change
- 26 -
*SGVFS038804*
during the year in the net defined benefit liability or asset that arises from the passage of time whichis determined by applying the discount rate based on government bonds to the net defined benefitliability or asset. Net interest on the net defined benefit liability or asset is recognized as expense orincome in profit or loss. Retirement expense is presented under ‘Compensation and fringe benefits’in the statement of income. Remeasurements comprising actuarial gains and losses, return on planassets and any change in the effect of the asset ceiling (excluding net interest on defined benefitliability) are recognized immediately in OCI in the period in which they arise. Remeasurements arenot reclassified to profit or loss in subsequent periods. Plan assets are assets that are held by a long-term employee benefit fund or qualifying insurance policies. Plan assets are not available to thecreditors of the Group, nor can they be paid directly to the Group. Fair value of plan assets is basedon market price information. When no market price is available, the fair value of plan assets isestimated by discounting expected future cash flows using a discount rate that reflects both the riskassociated with the plan assets and the maturity or expected disposal date of those assets (or, if theyhave no maturity, the expected period until the settlement of the related obligations). If the fair valueof the plan assets is higher than the present value of the DBO, the measurement of the resultingdefined benefit asset is limited to the present value of economic benefits available in the form ofrefunds from the plan or reductions in future contributions to the plan.
The Group’s right to be reimbursed of some or all of the expenditure required to settle a DBO isrecognized as a separate asset at fair value when and only when reimbursement is virtually certain.Payments to the defined contribution retirement benefit plans and the MPFS are recognized asexpenses when employees have rendered service entitling them to the contributions.
EquityWhen the shares are sold at a premium, the difference between the proceeds and par value is creditedto ‘Capital paid in excess of par value’, net of direct costs incurred related to the equity issuance. If‘Capital paid in excess of par value’ is not sufficient, the excess is charged against surplus. When theGroup issues more than one class of stock, a separate account is maintained for each class of stockand the number of stocks issued.
Surplus represents accumulated earnings of the Group less dividends declared.
Own equity instruments which are reacquired or Parent Company’s shares acquired by its subsidiaries(treasury stock) are recognized at cost and deducted from equity. No gain or loss is recognized in theprofit or loss on the purchase, sale, issue or cancellation of the Parent Company’s own equityinstruments. Any difference between the carrying amount and the consideration, if reissued, isrecognized in ‘Capital paid in excess of par value’. Voting rights related to treasury stocks arenullified and no dividends are allocated. When the stocks are retired, the Common stock account isreduced by its par value and the excess of cost over par value upon retirement is debited to capitalpaid in excess of par value at the time the stocks were issued and to surplus for the remaining balance.
ProvisionsProvisions are recognized when the Group has a present obligation (legal or constructive) as a resultof a past event and it is probable that an outflow of resources embodying economic benefits will berequired to settle the obligation and a reliable estimate can be made of the amount of the obligation.Where the Group expects some or all of a provision to be reimbursed, for example, under aninsurance contract, the reimbursement is recognized as a separate asset but only when thereimbursement is virtually certain. The expense relating to any provision is presented in thestatement of income, net of any reimbursement. If the effect of the time value of money is material,provisions are determined by discounting the expected future cash flows at a pre-tax rate that reflectscurrent market assessments of the time value of money and, where appropriate, the risks specific to
- 27 -
*SGVFS038804*
the liability. Where discounting is used, the increase in the provision due to the passage of time isrecognized as ‘Interest expense’.
Contingent Liabilities and Contingent AssetsContingent liabilities are not recognized in the financial statements but are disclosed unless thepossibility of an outflow of resources embodying economic benefits is remote. Contingent assets arenot recognized but are disclosed in the financial statements when an inflow of economic benefits isprobable.
Income TaxesCurrent taxesCurrent tax assets and liabilities for the current and prior periods are measured at the amount expectedto be recovered from or paid to the taxing authorities. The tax rates and tax laws used to compute theamount are those that are enacted or substantively enacted at the statement of financial position date.Effective January 1, 2019, management periodically evaluates positions taken in the tax returns withrespect to situations in which applicable tax regulations are subject to interpretations and establishesprovisions where appropriate.
Deferred taxesDeferred tax is provided on temporary differences at the statement of financial position date betweenthe tax bases of assets and liabilities and their carrying amounts for financial reporting purposes.
Deferred tax liabilities are recognized for all taxable temporary differences, except:a. Where the deferred tax liability arises from the initial recognition of goodwill or of an asset or
liability in a transaction that is not a business combination and, at the time of the transaction,affects neither the accounting profit nor taxable profit or loss.
b. In respect of taxable temporary differences associated with investments in subsidiaries, where thetiming of the reversal of the temporary differences can be controlled and it is probable that thetemporary differences will not reverse in the foreseeable future.
Deferred tax assets are recognized for all deductible temporary differences, carryforward of unusedtax credits from the excess of minimum corporate income tax (MCIT) over the regular income tax,and unused net operating loss carryover (NOLCO), to the extent that it is probable that taxableincome will be available against which the deductible temporary differences and carryforward ofunused tax credits from MCIT and unused NOLCO can be utilized except:a. Where the deferred tax asset relating to the deductible temporary difference arises from the initial
recognition of an asset or liability in a transaction that is not a business combination and, at thetime of the transaction, affects neither the accounting profit nor taxable profit or loss.
b. In respect of deductible temporary differences associated with investments in subsidiaries,deferred tax assets are recognized only to the extent that it is probable that the temporarydifferences will reverse in the foreseeable future and taxable profit will be available against whichthe temporary differences can be utilized.
The carrying amount of deferred tax assets is reviewed at each statement of financial position dateand reduced to the extent that it is no longer probable that sufficient future taxable profit will beavailable to allow all or part of the deferred income tax asset to be utilized. Unrecognized deferredtax assets are reassessed at each statement of financial position date and are recognized to the extentthat it has become probable that future taxable income will allow the deferred tax asset to berecovered.
- 28 -
*SGVFS038804*
Deferred tax assets and liabilities are measured at the tax rates that are expected to apply in the yearwhen the asset is realized or the liability is settled, based on tax rates (and tax laws) that have beenenacted or substantively enacted at the statement of financial position date.
Current tax and deferred tax relating to items recognized directly in equity are recognized in OCI andnot in the statement of income.
Deferred tax assets and deferred tax liabilities are offset if a legally enforceable right exists to set offcurrent tax assets against current tax liabilities and deferred taxes relate to the same taxable entity andthe same taxation authority.
Earnings Per ShareBasic earnings per share is computed by dividing net income for the year attributable to equityholders of the Parent Company by the weighted average number of common shares outstandingduring the year after giving retroactive effect to stock dividends declared and stock rights exercisedduring the year. The Group does not have dilutive potential common shares.
Dividends on Common SharesCash dividends on common shares are recognized as a liability and deducted from the equity whenapproved by the Board of Directors (BOD) of the Parent Company while stock dividends arededucted from equity when approved by BOD and shareholders of the Parent Company. Dividendsdeclared during the year but are paid or issued after the statement of financial position date are dealtwith as a subsequent event.
Debt Issuance CostsIssuance, underwriting and other related costs incurred in connection with the issuance of debtinstruments are deferred and amortized over the terms of the instruments using the EIR method.Unamortized debt issuance costs are included in the related carrying amount of the debt instrument inthe statement of financial position.
Capital Securities Issuance CostsIssuance, underwriting and other related costs incurred in connection with the issuance of the capitalsecurities are treated as a reduction of equity against ‘Capital paid in excess of par value’.
Events after the Statement of Financial Position DatePost year-end events that provide additional information about the Group’s position at the statementof financial position date (adjusting event) are reflected in the financial statements. Post year-endevents that are not adjusting events, if any, are disclosed when material to the financial statements.
Segment ReportingThe Group’s operating businesses are organized and managed separately according to the nature ofthe products and services provided, with each segment representing a strategic business unit thatoffers different products and serves different markets. Financial information on business segments ispresented in Note 6.
Fiduciary ActivitiesAssets and income arising from fiduciary activities together with related undertakings to return suchassets to customers are excluded from the financial statements where the Parent Company andPSBank act in a fiduciary capacity such as nominee, trustee or agent.
- 29 -
*SGVFS038804*
Standards Issued but not yet Effective
The list below consists of standards and interpretations issued, which the Group reasonably expects tobe applicable at a future date. The Group intends to adopt these standards when they becomeeffective. Except as otherwise indicated, the Group does not expect the adoption of these new andamended standards and interpretations to have significant impact on its financial statements.
Effective beginning on or after January 1, 2020Amendments to PFRS 3, Business Combinations - Definition of a BusinessThe amendments to PFRS 3 clarify the minimum requirements to be a business, remove theassessment of a market participant’s ability to replace missing elements, and narrow the definition ofoutputs. The amendments also add guidance to assess whether an acquired process is substantive andadd illustrative examples. An optional fair value concentration test is introduced which permits asimplified assessment of whether an acquired set of activities and assets is not a business. An entityapplies those amendments prospectively for annual reporting periods beginning on or after January 1,2020, with earlier application permitted. These amendments will apply to future businesscombinations of the Group.
Amendments to PAS 1, Presentation of Financial Statements, and PAS 8, Accounting Policies,Changes in Accounting Estimates and Errors - Definition of MaterialThe amendments refine the definition of material in PAS 1 and align the definitions used acrossPFRSs and other pronouncements. They are intended to improve the understanding of the existingrequirements rather than to significantly impact an entity’s materiality judgements. An entity appliesthose amendments prospectively for annual reporting periods beginning on or after January 1, 2020,with earlier application permitted.
Effective beginning on or after January 1, 2021PFRS 17, Insurance ContractsPFRS 17 provides updated information about the obligation, risks and performance of insurancecontracts, increases transparency in financial information reported by insurance companies, andintroduces consistent accounting for all insurance contracts based on a current measurement model.The standard is effective for annual periods beginning on or after January 1, 2021. Early applicationis permitted but only if the entity also applies PFRS 9 and PFRS 15.
Deferred effectivityAmendments to PFRS 10, Consolidated Financial Statements and PAS 28, Investments in Associatesand Joint Ventures - Sale or Contribution of Assets between an Investor and its Associate or JointVentureThe amendments address the conflict between PFRS 10 and PAS 28 in dealing with the loss ofcontrol of a subsidiary that is sold or contributed to an associate or joint venture. The amendmentsclarify that a full gain or loss is recognized when a transfer to an associate or joint venture involves abusiness as defined in PFRS 3, Business Combinations. Any gain or loss resulting from the sale orcontribution of assets that does not constitute a business, however, is recognized only to the extent ofunrelated investors’ interests in the associate or joint venture. On January 13, 2016, the FinancialReporting Standards Council postponed the original effective date of January 1, 2016 of the saidamendments until the International Accounting Standards Board has completed its broader review ofthe research project on equity accounting that may result in the simplification of accounting for suchtransactions and of other aspects of accounting for associates and joint ventures.
- 30 -
*SGVFS038804*
3. Significant Accounting Judgments and Estimates
The preparation of the financial statements in compliance with PFRS requires the Group to makeestimates and assumptions that affect the reported amounts of assets, liabilities, income and expensesand the disclosures of contingent assets and contingent liabilities. Future events may occur which cancause the assumptions used in arriving at the estimates to change. The effects of any change inestimates are reflected in the financial statements as they become reasonably determinable.Judgments and estimates are continually evaluated and are based on historical experience and otherfactors, including expectations of future events that are believed to be reasonable under thecircumstances. The following are the critical judgments and key assumptions that have a significantrisk of material adjustment to the carrying amounts of assets and liabilities within the next financialyear:
Judgmentsa. Classification of financial assets
Beginning January 1, 2018, the Group classifies its financial assets depending on the businessmodel for managing those financial assets and whether the contractual terms of the financial assetare SPPI on the principal amount outstanding. The Group performs the business modelassessment based on observable factors such as:· Performance of the business model and the financial assets held within that business model
are evaluated and reported to the Group’s key management personnel· Risks that affect the performance of the business model (and the financial assets held within
that business model) and, in particular, the way those risks are managed· Compensation of business units whether based on the fair value of the assets managed or on
the contractual cash flows collected· Expected frequency, value and timing of sales
In performing the SPPI test, the Group applies judgment and considers relevant factors such asthe currency in which the financial asset is denominated, the period for which the interest rate isset, contingent events that would change the amount and timing of cash flows, leverage features,prepayment and extension terms and other features that may modify the consideration for thetime value of money.
b. Consolidation of subsidiariesThe determination whether the Group has control over an investee company requires significantjudgment. The Group considers that the following criteria are all met, including: (a) an investorhas the power over an investee; (b) the investor has exposure, or rights, to variable returns fromits involvement with the investee; and (c) the investor has the ability to use its power over theinvestee to affect the amount of the investor’s return.
In accordance with PFRS 10, the Group included the accounts of First Metro Save and LearnBalance Fund, Inc. (FMSALBF), First Metro Save and Learn Equity Fund, Inc. (FMSALEF),First Metro Save and Learn Fixed Income Fund (FMSLFIF), First Metro Philippine EquityExchange Traded Fund, Inc. (FMPETF), First Metro Save and Learn F.O.C.C.U.S. DynamicFund, Inc. and First Metro Save and Learn Money Market Fund, Inc., collectively the “Funds”, inits consolidated financial statements. The Group re-assessed the control conclusion for theseFunds. Although the ownership is less than half of the voting power of these investees, the Grouphas control due to its power to direct the relevant activities of the Funds through First MetroAsset Management Inc. (FAMI), a subsidiary of FMIC, which acts as the fund manager of theFunds. Further, the Group has the exposure to variable returns from its investments and its abilityto use its power over the Funds to affect their returns.
- 31 -
*SGVFS038804*
c. Existence of significant influence over an associate with less than 20.00% ownershipAs discussed in Note 11, there are instances that an investor exercises significant influence evenif its ownership is less than 20.00%. The Group applies significant judgment in assessingwhether it holds significant influence over an investee and considers the following:(a) representation in the board of directors or equivalent governing body of the investee;(b) participation in policy-making processes, including participation in decisions about dividendsor other distributions; (c) material transactions between the investor and the investee;(d) interchange of managerial personnel; (e) joint voting agreement with other investors; or(f) provision of essential technical information.
d. Fair value of financial instrumentsWhere the fair values of financial assets and financial liabilities recorded in the statement offinancial position or disclosed in the notes to financial statements cannot be derived from activemarkets, these are determined using internal valuation techniques using generally acceptedmarket valuation models. The inputs to these models are taken from observable markets wherepossible, but where this is not feasible, a degree of judgment is required in establishing fairvalues. These judgments may include considerations of liquidity and volatility for longer datedderivatives (Note 5).
e. LeasesGroup as lessorThe Group has entered into commercial property leases on its investment properties portfolio andover various items of furniture, fixtures and equipment. The Group has determined, based on anevaluation of the terms and conditions of the arrangements (i.e., the lease does not transferownership of the asset to the lessee by the end of the lease term, the lessee has no option topurchase the asset at a price that is expected to be sufficiently lower than the fair value at the datethe option is exercisable and the lease term is not for the major part of the asset’s economic life),that it retains all the significant risks and rewards of ownership of these properties which areleased out on operating leases.
Group as lesseeThe Group determines the lease term as the non-cancellable term of the lease, together with anyperiods covered by an option to extend the lease if it is reasonably certain to be exercised, or anyperiods covered by an option to terminate the lease, if it is reasonably certain not to be exercised.
Extension and termination optionsThe Group has several lease contracts that include extension and termination options. The Groupapplies judgment in evaluating whether it is reasonably certain whether or not to exercise theoption to renew or terminate the lease. That is, it considers all relevant factors such as leaseholdimprovements and location that create an economic incentive for it to exercise either the renewalor termination. After the commencement date, the Group reassess the lease term if there is asignificant event or change in circumstances that is within its control and affects its ability toexercise or not to exercise the option to renew or to terminate.
Estimating the IBR for lease liabilitiesThe Group cannot readily determine the interest rate implicit in the lease, therefore, it uses itsIBR to measure lease liabilities. The IBR for lease liabilities is the rate of interest that the Groupwould have to pay to borrow over a similar term, and with a similar security, the funds necessaryto obtain an asset of a similar value to the ROU asset in a similar economic environment. TheGroup estimates the IBR for lease liabilities using observable inputs (by reference to prevailingrisk-free rates) adjusted to take into account the entity’s credit risk (i.e., credit spread).
- 32 -
*SGVFS038804*
f. ContingenciesThe Group is currently involved in legal proceedings. The estimate of the probable cost for theresolution of claims has been developed in consultation with the aid of the outside legal counselhandling the Group’s defense in this matter and is based upon an analysis of potential results. Itis probable, however, that future results of operations could be materially affected by changes inthe estimates or in the effectiveness of the strategies relating to this proceeding (Note 31).
Estimatesa. Credit losses on financial assets
The Group reviews its debt financial assets subject to ECL on a semi-annual basis with updatingprovisions made during the intervals as necessary based on the continuing analysis andmonitoring of individual accounts by credit officers. The measurement of credit losses underPFRS 9 across all categories of such financial assets requires judgment, in particular, theestimation of the amount and timing of future cash flows and collateral values when determiningcredit losses and the assessment of a SICR. These estimates are driven by a number of factors,changes in which can result in different levels of allowances.
The Group’s ECL calculations are outputs of complex models with a number of underlyingassumptions regarding the choice of variable inputs and their interdependencies. Elements of theECL models that are considered accounting judgments and estimates include, among others:· Segmentation of the portfolio, where the appropriate model or ECL approach is used· Criteria for assessing if there has been a SICR and so allowances for debt financial assets
should be measured on a lifetime ECL basis and the qualitative assessment. In 2019, Stage 2includes those accounts that are “Watchlisted” due to financial and repayment concerns,which are previously under Stage 1, and aligned the definition of default (previously morethan 30 days past due) with the BSP’s definition of non-performing loans, i.e., more than 90days past due
· Segmentation of debt financial assets when their ECL is assessed on a collective basis· Development of ECL models, including the various formulas and the choice of inputs. In
2019, the Parent Company recalibrated its lifetime PD models and loss rates (for portfolios towhich the loss rate approach is applied).
· Determination of associations between macroeconomic scenarios and economic inputs, suchas unemployment levels and collateral values, and the effect on PDs, EADs and LGDs
· Selection of forward-looking macroeconomics scenarios and their probability weightings, toderive the economic inputs into the ECL models
The gross carrying amounts of financial assets subject to ECL as of December 31, 2019 andDecember 31, 2018 are disclosed in Note 4, while the related ECL allowances for credit lossesare disclosed in Note 15. In 2019 and 2018, provision for credit losses on these financial assetsamounted to P=9.6 billion and P=7.7 billion, respectively for the Group and P=1.6 billion andP=0.8 billion, repectively for the Parent Company (Note 16).
b. Recognition of deferred income taxesDeferred tax assets are recognized for all unused tax losses and deductible temporary differencesto the extent that it is probable that taxable profit will be available against which the losses can beutilized. Significant management judgment is required to determine the amount of deferred taxassets that can be recognized, based upon the likely timing and level of future taxable profitstogether with future tax planning strategies. The estimates of future taxable income indicate thatcertain temporary differences will be realized in the future. The recognized net deferred taxassets and unrecognized deferred tax assets for the Group and the Parent Company are disclosedin Note 28.
- 33 -
*SGVFS038804*
c. Present value of retirement liabilityThe cost of defined retirement pension plan is determined using actuarial valuations. Theactuarial valuation involves making assumptions about discount rates, future salary increases,mortality rates and future pension increases. Due to the complexities involved in the valuationand the long-term nature of these plans, such estimates are subject to significant uncertainty. Theassumed discount rates were determined using the market yields on Philippine government bondswith terms consistent with the expected employee benefit payout as of the statement of financialposition date. The present values of the retirement liability of the Group and the Parent Companyare disclosed in Note 27.
d. Impairment of non-financial assetsThe Group assesses impairment on non-financial assets (property and equipment, investments insubsidiaries, associates and a JV, investment properties, software costs, chattel mortgageproperties and other assets) whenever events or changes in circumstances indicate that thecarrying amount of an asset may not be recoverable. The factors that the Group considersimportant which could trigger an impairment review include the following: a) significantunderperformance relative to expected historical or projected future operating results;b) significant changes in the manner of use of the acquired assets or the strategy for overallbusiness; and c) significant negative industry or economic trends.
The Group uses the higher of FVLCTS and VIU in determining recoverable amount. As ofDecember 31, 2019 and 2018, there has been a significant and prolonged decline in the fair valueof an associate. The recoverable amount of the investment in the associate has been determinedbased on a VIU calculation. Key assumptions in VIU calculation are most sensitive to thefollowing assumptions: (a) production volume; (b) price; (c) exchange rates; (d) capitalexpenditures and (e) long-term growth rates. Based on the Group’s impairment testing as ofDecember 31, 2019, allowance for impairment loss on investment in associate amounted toP=513.6 million.
The carrying values of the property and equipment, investments in subsidiaries, associates and aJV, investment properties, software costs, chattel mortgage properties, and other assets of theGroup and the Parent Company are disclosed in Notes 11, 12, 13 and 15, respectively.
GoodwillGoodwill is reviewed for impairment, annually or more frequently if events or changes incircumstances indicate that the carrying value may be impaired. Impairment is determined forgoodwill by assessing the recoverable amount of the CGU (or group of CGUs) to which thegoodwill relates. Where the recoverable amount of the CGU (or group of CGUs) is less than thecarrying amount of the CGU (or group of CGUs) to which goodwill has been allocated, animpairment loss is recognized immediately in the statement of income. The recoverable amountof the CGU is determined based on FVLCTS.
The fair value of the CGU is determined using the cost approach, specifically the adjusted NetAsset Value (NAV) method. This method requires the measurement of the fair value of theindividual assets and liabilities recognized in the CGU, as well as the fair value of anyunrecognized assets and liabilities at the measurement date. The resulting net fair values of theassets and liabilities represent the fair value of the CGU. In determining the fair value of theCGU’s net assets, the Group used the discounted cash flow method for unquoted debt financialassets/liabilities at the appropriate market rate, the price-to-earnings (P/E) valuation model forunquoted equity investments, and the appraisal reports for the valuation of real properties. Fairvalues of listed debt and equity securities are based on their quoted market prices. The Groupapplied the P/E valuation model by reference to P/E ratios of listed comparable companies of the
- 34 -
*SGVFS038804*
CGU’s equity investments. The FVLCTS calculation of the CGU is most sensitive to discountrates and the P/E ratios of listed comparable companies of the CGU’s equity investments. As ofDecember 31, 2019 and 2018, the Group’s goodwill amounted to P=5.2 billion (Note 11).
4. Financial Risk and Capital Management
IntroductionThe Group has exposure to the following risks from its use of financial instruments: (a) credit;(b) liquidity; and (c) market risks.
Risk management frameworkThe Board of Directors (BOD) has overall responsibility for the oversight of the Parent Company’srisk management process. On the other hand, the risk management processes of the subsidiaries arethe separate responsibilities of their respective BOD. Supporting the BOD in this function are certainBoard-level committees such as Risk Oversight Committee (ROC), Audit Committee (AC) and seniormanagement committees through the Executive Committee and Asset and Liability Committee(ALCO) among others.
The ROC, which is composed primarily of independent members of the BOD, is responsible foroverseeing the Parent Company’s risk infrastructure, the adequacy and relevance of risk policies, andthe compliance to defined risk appetite and levels of exposure. The ROC is assisted in thisresponsibility by the Risk Management Group (RSK). The RSK undertakes the implementation andexecution of the Parent Company’s Risk Management framework which involves the identification,assessment, control, monitoring and reporting of risks.
The Parent Company and its subsidiaries manage their respective financial risks separately. Thesubsidiaries have their own risk management processes but are structured similar to that of the ParentCompany. To a certain extent, the respective risk management programs and objectives are the sameacross the Group. The risk management policies adopted by the subsidiaries and affiliates are alignedwith the Parent Company’s risk policies. To further promote compliance with PFRS and Basel III,the Parent Company created a Risk Management Coordinating Council (RMCC) composed of riskofficers of the Parent Company and its financial institution subsidiaries.
Credit RiskCredit risk is the risk of financial loss to the Group if a counterparty to a financial instrument fails tomeet its contractual obligations. The Group manages and controls credit risk by setting limits on theamount of risk it is willing to accept for individual counterparties, related groups of borrowers,market segments, and industry concentrations, and by monitoring exposures in relation to such limits,among others. The same is true for treasury-related activities. Each business unit is responsible forthe quality of its credit portfolio and for monitoring and controlling all credit risks in its portfolio.Regular reviews and audits of business units and credit processes are undertaken by the RSK andInternal Audit Group, respectively.
Management of credit riskThe Group faces potential credit risks every time it extends funds to borrowers, commits funds tocounterparties, guarantees the paying performance of its clients, invests funds to issuers(e.g., investment securities issued by either sovereign or corporate entities) or enter into eithermarket-traded or over-the-counter derivatives, either through implied or actual contractual agreements(i.e., on- or off-balance sheet exposures). The Parent Company manages its credit risk at variouslevels (i.e., strategic level, portfolio level down to individual obligor or transaction) by adopting acredit risk management environment that has the following components:
- 35 -
*SGVFS038804*
· Formulating credit policies in consultation with business units, covering collateral requirements,credit/financial assessment, risk grading and reporting and compliance with regulatoryrequirements;
· Establishment of authorization limits for the approval and renewal of credit facilities;· Limiting concentrations of exposure to counterparties and industries (for loans), and by issuer
(for investment securities);· Utilizing the Internal Credit Risk Rating System (ICRRS) in order to categorize exposures
according to their risk profile. The risk grading system is used for determining impairmentprovisions against credit exposures. The current risk grading framework consists of ten gradesreflecting varying degrees of risk of default and the availability of collateral or other credit riskmitigation; and
· Monitoring compliance with approved exposure limits.
Borrowers, counterparties or group of related accounts across the Group are aggregated and managedby the Parent Company’s Institutional Banking Sector as the “Control Unit”. Group Limits forconglomerates are set-up and approved to guide subsidiaries and affiliates of the Group.Consolidated exposures are regularly reported to senior management and the ROC.
Credit risk at initial recognitionThe Group uses internal credit assessment and approvals at various levels to determine the credit riskof exposures at initial recognition. Assessment can be quantitative or qualitative and depends on themateriality of the facility or the complexity of the portfolio to be assessed.
ModificationIn certain circumstances, the Group modifies the original terms and conditions of a credit exposure toform a new loan agreement or payment schedule. The modifications can be given depending on theborrower’s or counterparty’s current or expected financial difficulty. The modifications may include,but are not limited to, change in interest rate and terms, principal amount, maturity date, date andamount of periodic payments and accrual of interest and charges.
Maximum exposure to credit riskAn analysis of the maximum credit risk exposure (net of allowance for ECL) relating to financialassets with collateral or credit enhancements is shown below:
Consolidated2019 2018
MaximumExposure toCredit Risk
Fair Valueof Collateral
FinancialEffect of
Collateralor Credit
EnhancementNet
Exposure
MaximumExposure toCredit Risk
Fair Valueof Collateral
FinancialEffect of
Collateralor Credit
EnhancementNet
ExposureInterbank loans receivable and
SPURA P=401 P=401 P=401 P=– P=8,067 P=8,060 P=8,058 P=9Loans and receivables - net
Receivables from customersCommercial loans 341,616 856,065 299,588 42,028 305,371 793,563 283,893 21,478Auto loans 116,069 202,470 115,636 433 116,975 197,160 116,465 510Residential mortgage loans 109,093 207,864 93,723 15,370 106,818 202,043 96,980 9,838Trade loans 61,260 59,907 59,785 1,475 59,972 58,936 58,718 1,254Others 796 738 702 94 674 694 655 19
628,834 1,327,044 569,434 59,400 589,810 1,252,396 556,711 33,099Accrued interest receivable 3,507 3,370 3,370 137 3,424 3,416 3,416 8Sales contract receivable 142 414 100 42 155 347 122 33
632,483 1,330,828 572,904 59,579 593,389 1,256,159 560,249 33,140Total P=632,884 P=1,331,229 P=573,305 P=59,579 P=601,456 P=1,264,219 P=568,307 P=33,149
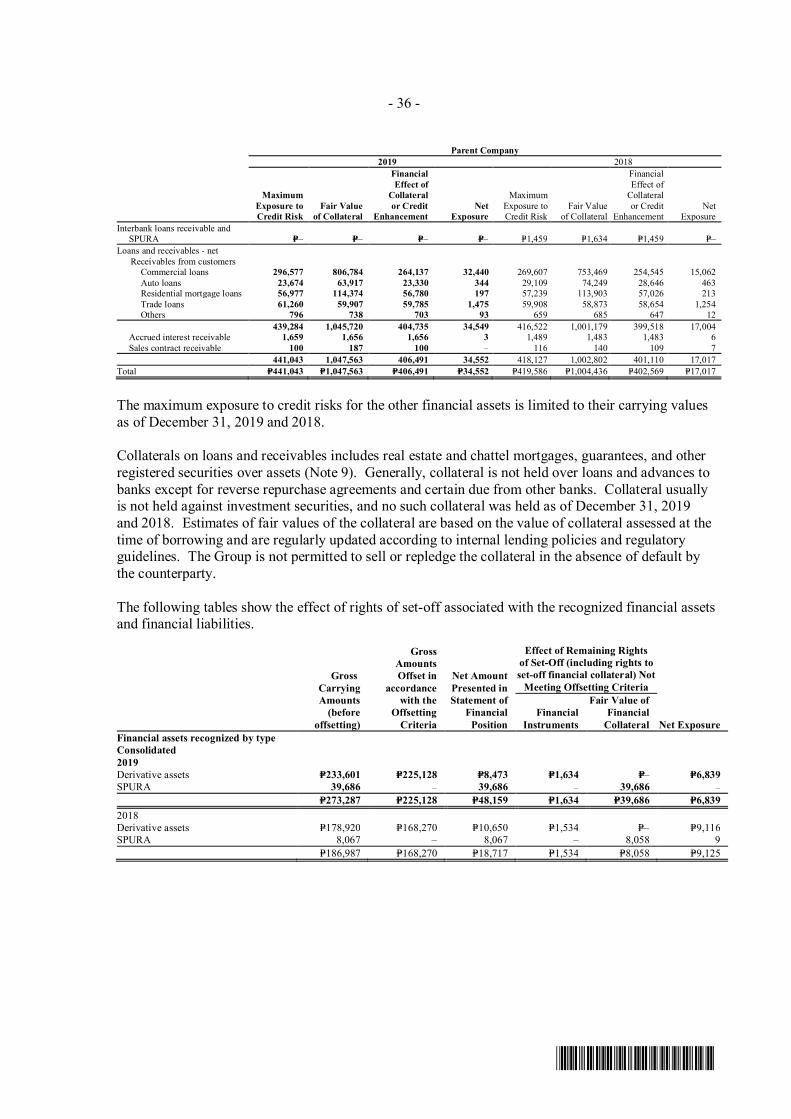
- 36 -
*SGVFS038804*
Parent Company2019 2018
MaximumExposure toCredit Risk
Fair Valueof Collateral
FinancialEffect of
Collateralor Credit
EnhancementNet
Exposure
MaximumExposure toCredit Risk
Fair Valueof Collateral
FinancialEffect of
Collateralor Credit
EnhancementNet
ExposureInterbank loans receivable and
SPURA P=– P=– P=– P=– P=1,459 P=1,634 P=1,459 P=–Loans and receivables - net
Receivables from customersCommercial loans 296,577 806,784 264,137 32,440 269,607 753,469 254,545 15,062Auto loans 23,674 63,917 23,330 344 29,109 74,249 28,646 463Residential mortgage loans 56,977 114,374 56,780 197 57,239 113,903 57,026 213Trade loans 61,260 59,907 59,785 1,475 59,908 58,873 58,654 1,254Others 796 738 703 93 659 685 647 12
439,284 1,045,720 404,735 34,549 416,522 1,001,179 399,518 17,004Accrued interest receivable 1,659 1,656 1,656 3 1,489 1,483 1,483 6Sales contract receivable 100 187 100 – 116 140 109 7
441,043 1,047,563 406,491 34,552 418,127 1,002,802 401,110 17,017Total P=441,043 P=1,047,563 P=406,491 P=34,552 P=419,586 P=1,004,436 P=402,569 P=17,017
The maximum exposure to credit risks for the other financial assets is limited to their carrying valuesas of December 31, 2019 and 2018.
Collaterals on loans and receivables includes real estate and chattel mortgages, guarantees, and otherregistered securities over assets (Note 9). Generally, collateral is not held over loans and advances tobanks except for reverse repurchase agreements and certain due from other banks. Collateral usuallyis not held against investment securities, and no such collateral was held as of December 31, 2019and 2018. Estimates of fair values of the collateral are based on the value of collateral assessed at thetime of borrowing and are regularly updated according to internal lending policies and regulatoryguidelines. The Group is not permitted to sell or repledge the collateral in the absence of default bythe counterparty.
The following tables show the effect of rights of set-off associated with the recognized financial assetsand financial liabilities.
GrossCarryingAmounts
(beforeoffsetting)
GrossAmountsOffset in
accordancewith the
OffsettingCriteria
Net AmountPresented inStatement of
FinancialPosition
Effect of Remaining Rightsof Set-Off (including rights toset-off financial collateral) Not
Meeting Offsetting Criteria
Net ExposureFinancial
Instruments
Fair Value ofFinancial
CollateralFinancial assets recognized by typeConsolidated2019Derivative assets P=233,601 P=225,128 P=8,473 P=1,634 P=– P=6,839SPURA 39,686 – 39,686 – 39,686 –
P=273,287 P=225,128 P=48,159 P=1,634 P=39,686 P=6,8392018Derivative assets P=178,920 P=168,270 P=10,650 P=1,534 P=‒ P=9,116SPURA 8,067 ‒ 8,067 ‒ 8,058 9
P=186,987 P=168,270 P=18,717 P=1,534 P=8,058 P=9,125
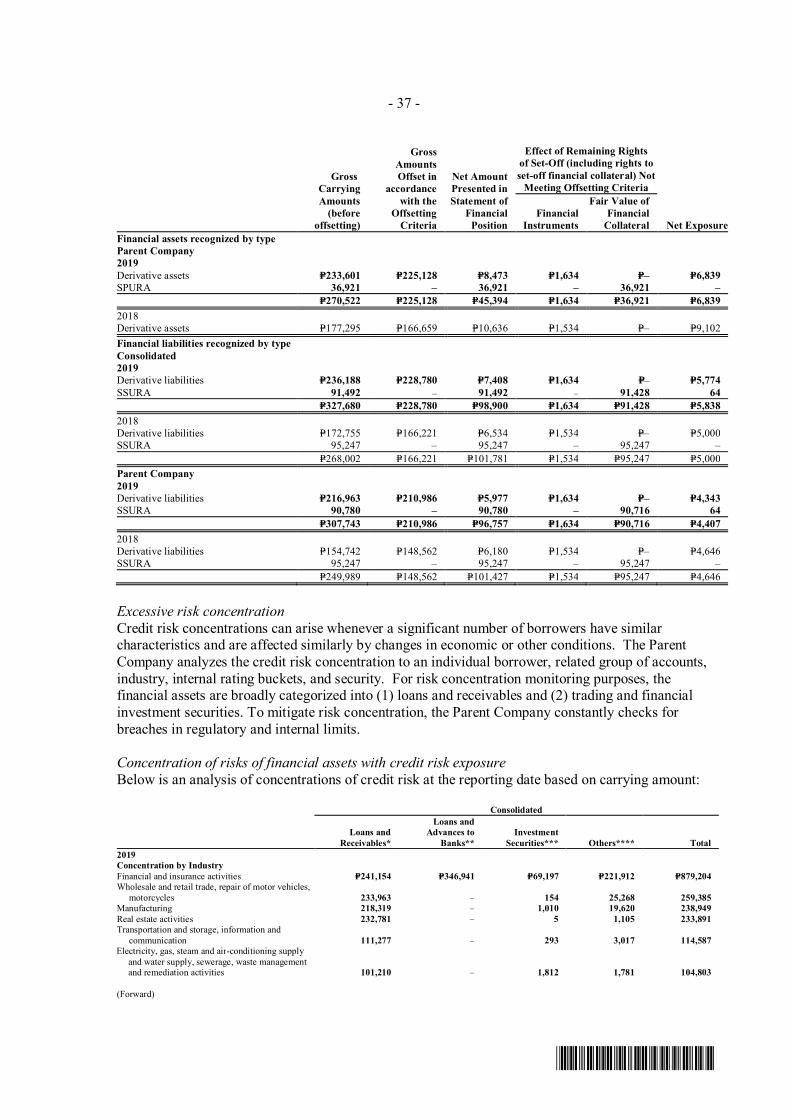
- 37 -
*SGVFS038804*
GrossCarryingAmounts
(beforeoffsetting)
GrossAmountsOffset in
accordancewith the
OffsettingCriteria
Net AmountPresented inStatement of
FinancialPosition
Effect of Remaining Rightsof Set-Off (including rights toset-off financial collateral) Not
Meeting Offsetting Criteria
Net ExposureFinancial
Instruments
Fair Value ofFinancial
CollateralFinancial assets recognized by typeParent Company2019Derivative assets P=233,601 P=225,128 P=8,473 P=1,634 P=‒ P=6,839SPURA 36,921 ‒ 36,921 ‒ 36,921 ‒
P=270,522 P=225,128 P=45,394 P=1,634 P=36,921 P=6,8392018Derivative assets P=177,295 P=166,659 P=10,636 P=1,534 P=– P=9,102Financial liabilities recognized by typeConsolidated2019Derivative liabilities P=236,188 P=228,780 P=7,408 P=1,634 P=– P=5,774SSURA 91,492 – 91,492 – 91,428 64
P=327,680 P=228,780 P=98,900 P=1,634 P=91,428 P=5,8382018Derivative liabilities P=172,755 P=166,221 P=6,534 P=1,534 P=– P=5,000SSURA 95,247 – 95,247 – 95,247 –
P=268,002 P=166,221 P=101,781 P=1,534 P=95,247 P=5,000Parent Company2019Derivative liabilities P=216,963 P=210,986 P=5,977 P=1,634 P=‒ P=4,343SSURA 90,780 ‒ 90,780 ‒ 90,716 64
P=307,743 P=210,986 P=96,757 P=1,634 P=90,716 P=4,4072018Derivative liabilities P=154,742 P=148,562 P=6,180 P=1,534 P=– P=4,646SSURA 95,247 – 95,247 – 95,247 –
P=249,989 P=148,562 P=101,427 P=1,534 P=95,247 P=4,646
Excessive risk concentrationCredit risk concentrations can arise whenever a significant number of borrowers have similarcharacteristics and are affected similarly by changes in economic or other conditions. The ParentCompany analyzes the credit risk concentration to an individual borrower, related group of accounts,industry, internal rating buckets, and security. For risk concentration monitoring purposes, thefinancial assets are broadly categorized into (1) loans and receivables and (2) trading and financialinvestment securities. To mitigate risk concentration, the Parent Company constantly checks forbreaches in regulatory and internal limits.
Concentration of risks of financial assets with credit risk exposureBelow is an analysis of concentrations of credit risk at the reporting date based on carrying amount:
Consolidated
Loans andReceivables*
Loans andAdvances to
Banks**Investment
Securities*** Others**** Total2019Concentration by IndustryFinancial and insurance activities P=241,154 P=346,941 P=69,197 P=221,912 P=879,204Wholesale and retail trade, repair of motor vehicles,
motorcycles 233,963 – 154 25,268 259,385Manufacturing 218,319 – 1,010 19,620 238,949Real estate activities 232,781 – 5 1,105 233,891Transportation and storage, information and
communication 111,277 – 293 3,017 114,587Electricity, gas, steam and air-conditioning supply
and water supply, sewerage, waste managementand remediation activities 101,210 – 1,812 1,781 104,803
(Forward)
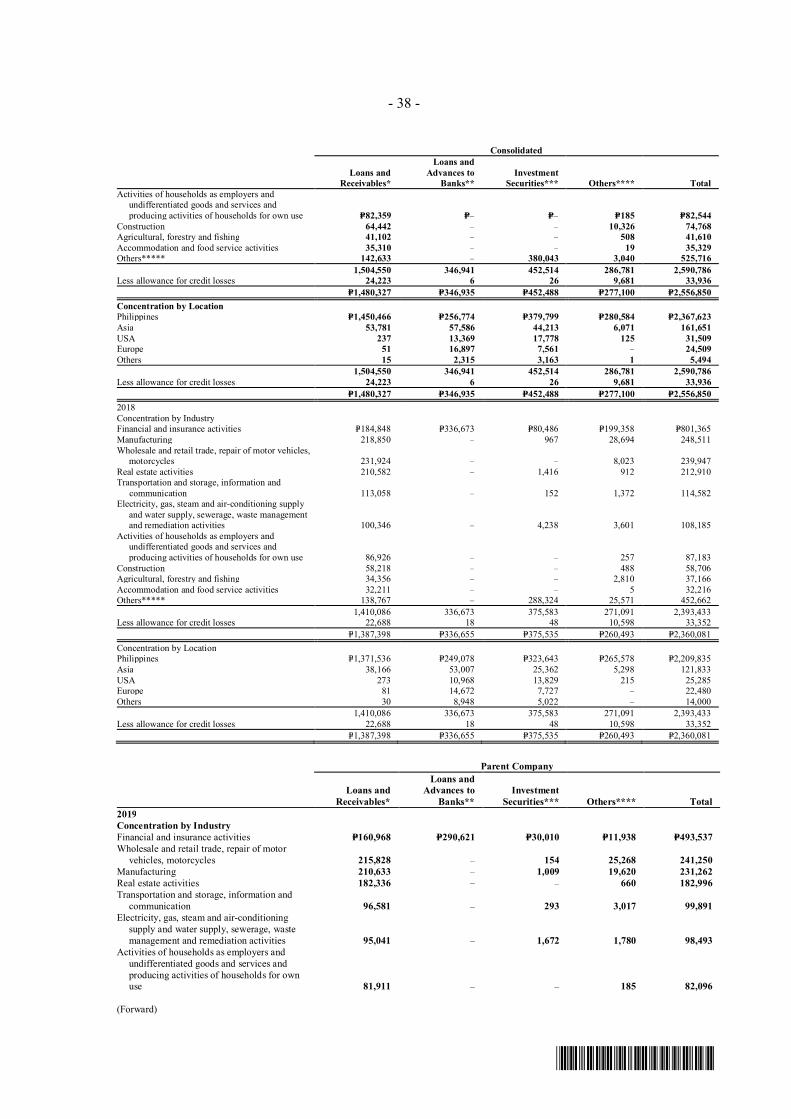
- 38 -
*SGVFS038804*
Consolidated
Loans andReceivables*
Loans andAdvances to
Banks**Investment
Securities*** Others**** TotalActivities of households as employers and
undifferentiated goods and services andproducing activities of households for own use P=82,359 P=– P=– P=185 P=82,544
Construction 64,442 – – 10,326 74,768Agricultural, forestry and fishing 41,102 – – 508 41,610Accommodation and food service activities 35,310 – – 19 35,329Others***** 142,633 – 380,043 3,040 525,716
1,504,550 346,941 452,514 286,781 2,590,786Less allowance for credit losses 24,223 6 26 9,681 33,936
P=1,480,327 P=346,935 P=452,488 P=277,100 P=2,556,850Concentration by LocationPhilippines P=1,450,466 P=256,774 P=379,799 P=280,584 P=2,367,623Asia 53,781 57,586 44,213 6,071 161,651USA 237 13,369 17,778 125 31,509Europe 51 16,897 7,561 – 24,509Others 15 2,315 3,163 1 5,494
1,504,550 346,941 452,514 286,781 2,590,786Less allowance for credit losses 24,223 6 26 9,681 33,936
P=1,480,327 P=346,935 P=452,488 P=277,100 P=2,556,8502018Concentration by IndustryFinancial and insurance activities P=184,848 P=336,673 P=80,486 P=199,358 P=801,365Manufacturing 218,850 – 967 28,694 248,511Wholesale and retail trade, repair of motor vehicles,
motorcycles 231,924 – ‒ 8,023 239,947Real estate activities 210,582 – 1,416 912 212,910Transportation and storage, information and
communication 113,058 – 152 1,372 114,582Electricity, gas, steam and air-conditioning supply
and water supply, sewerage, waste managementand remediation activities 100,346 – 4,238 3,601 108,185
Activities of households as employers andundifferentiated goods and services andproducing activities of households for own use 86,926 – ‒ 257 87,183
Construction 58,218 – ‒ 488 58,706Agricultural, forestry and fishing 34,356 – ‒ 2,810 37,166Accommodation and food service activities 32,211 – ‒ 5 32,216Others***** 138,767 – 288,324 25,571 452,662
1,410,086 336,673 375,583 271,091 2,393,433Less allowance for credit losses 22,688 18 48 10,598 33,352
P=1,387,398 P=336,655 P=375,535 P=260,493 P=2,360,081Concentration by LocationPhilippines P=1,371,536 P=249,078 P=323,643 P=265,578 P=2,209,835Asia 38,166 53,007 25,362 5,298 121,833USA 273 10,968 13,829 215 25,285Europe 81 14,672 7,727 ‒ 22,480Others 30 8,948 5,022 ‒ 14,000
1,410,086 336,673 375,583 271,091 2,393,433Less allowance for credit losses 22,688 18 48 10,598 33,352
P=1,387,398 P=336,655 P=375,535 P=260,493 P=2,360,081
Parent Company
Loans andReceivables*
Loans andAdvances to
Banks**Investment
Securities*** Others**** Total2019Concentration by IndustryFinancial and insurance activities P=160,968 P=290,621 P=30,010 P=11,938 P=493,537Wholesale and retail trade, repair of motor
vehicles, motorcycles 215,828 ‒ 154 25,268 241,250Manufacturing 210,633 ‒ 1,009 19,620 231,262Real estate activities 182,336 ‒ ‒ 660 182,996Transportation and storage, information and
communication 96,581 ‒ 293 3,017 99,891Electricity, gas, steam and air-conditioning
supply and water supply, sewerage, wastemanagement and remediation activities 95,041 ‒ 1,672 1,780 98,493
Activities of households as employers andundifferentiated goods and services andproducing activities of households for ownuse 81,911 ‒ ‒ 185 82,096
(Forward)
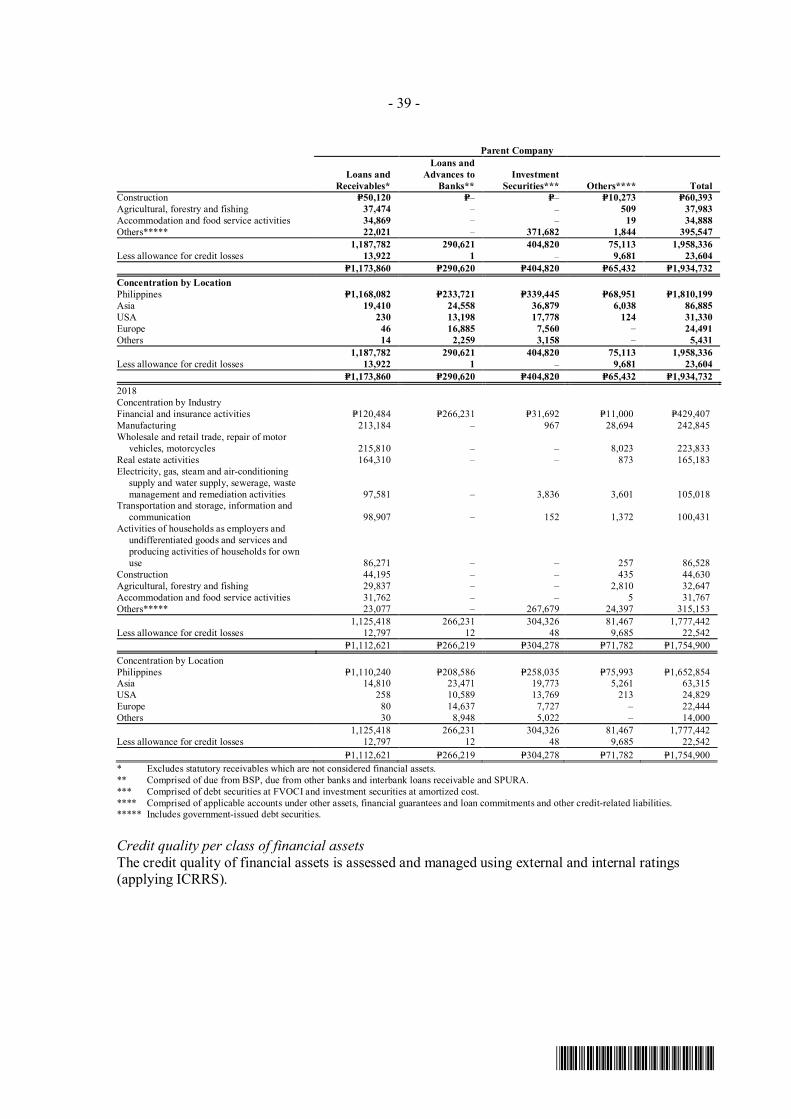
- 39 -
*SGVFS038804*
Parent Company
Loans andReceivables*
Loans andAdvances to
Banks**Investment
Securities*** Others**** TotalConstruction P=50,120 P=‒ P=‒ P=10,273 P=60,393Agricultural, forestry and fishing 37,474 ‒ ‒ 509 37,983Accommodation and food service activities 34,869 ‒ ‒ 19 34,888Others***** 22,021 ‒ 371,682 1,844 395,547
1,187,782 290,621 404,820 75,113 1,958,336Less allowance for credit losses 13,922 1 ‒ 9,681 23,604
P=1,173,860 P=290,620 P=404,820 P=65,432 P=1,934,732Concentration by LocationPhilippines P=1,168,082 P=233,721 P=339,445 P=68,951 P=1,810,199Asia 19,410 24,558 36,879 6,038 86,885USA 230 13,198 17,778 124 31,330Europe 46 16,885 7,560 ‒ 24,491Others 14 2,259 3,158 ‒ 5,431
1,187,782 290,621 404,820 75,113 1,958,336Less allowance for credit losses 13,922 1 ‒ 9,681 23,604
P=1,173,860 P=290,620 P=404,820 P=65,432 P=1,934,7322018Concentration by IndustryFinancial and insurance activities P=120,484 P=266,231 P=31,692 P=11,000 P=429,407Manufacturing 213,184 – 967 28,694 242,845Wholesale and retail trade, repair of motor
vehicles, motorcycles 215,810 – – 8,023 223,833Real estate activities 164,310 – – 873 165,183Electricity, gas, steam and air-conditioning
supply and water supply, sewerage, wastemanagement and remediation activities 97,581 – 3,836 3,601 105,018
Transportation and storage, information andcommunication 98,907 – 152 1,372 100,431
Activities of households as employers andundifferentiated goods and services andproducing activities of households for ownuse 86,271 – – 257 86,528
Construction 44,195 – – 435 44,630Agricultural, forestry and fishing 29,837 – – 2,810 32,647Accommodation and food service activities 31,762 – – 5 31,767Others***** 23,077 – 267,679 24,397 315,153
1,125,418 266,231 304,326 81,467 1,777,442Less allowance for credit losses 12,797 12 48 9,685 22,542
P=1,112,621 P=266,219 P=304,278 P=71,782 P=1,754,900Concentration by LocationPhilippines P=1,110,240 P=208,586 P=258,035 P=75,993 P=1,652,854Asia 14,810 23,471 19,773 5,261 63,315USA 258 10,589 13,769 213 24,829Europe 80 14,637 7,727 ‒ 22,444Others 30 8,948 5,022 ‒ 14,000
1,125,418 266,231 304,326 81,467 1,777,442Less allowance for credit losses 12,797 12 48 9,685 22,542
P=1,112,621 P=266,219 P=304,278 P=71,782 P=1,754,900* Excludes statutory receivables which are not considered financial assets.** Comprised of due from BSP, due from other banks and interbank loans receivable and SPURA.*** Comprised of debt securities at FVOCI and investment securities at amortized cost.**** Comprised of applicable accounts under other assets, financial guarantees and loan commitments and other credit-related liabilities.***** Includes government-issued debt securities.
Credit quality per class of financial assetsThe credit quality of financial assets is assessed and managed using external and internal ratings(applying ICRRS).
- 40 -
*SGVFS038804*
The ICRRS contains the following:a. Borrower Risk Rating (BRR) - an assessment of the credit worthiness of the borrower (or
guarantor) without considering the type or amount of the facility and security arrangements. It isan indicator of the probability that a borrower cannot meet its credit obligations when they falldue. The components of the assessment is described below:
Component DescriptionCredit FactorWeight
Financial Condition Refers to the financial condition of the borrower based on audited financial statementsas indicated by certain financial ratios. The Financial Factor Evaluation is conductedmanually.
40.00%
Industry Analysis Refers to the prospects of the industry as well as the company’s performance andposition in the industry.
30.00%
Management Quality Refers to the management’s ability to run the company successfully. 30.00%
b. Facility Risk Factor (FRF) - determined for each individual facility considering the term of thefacility, security arrangement and quality of documentation. This factor can downgrade orupgrade the BRR based on the elements relating to cover (collateral including pledged cashdeposits and guarantee), quality of documentation and structure of transactions.
c. Adjusted Borrower Risk Rating - combination of BRR and FRF.
Loans and receivablesThe credit quality is generally monitored using the 10-grade ICRRS which is integrated in the creditprocess. Validation of the individual borrower’s risk rating is performed by the Credit Group tomaintain accurate and consistent risk ratings across the credit portfolio. For commercial loans, thecredit quality with the corresponding ICRRS Grade and description follows:
High Grade1 - ExcellentAn excellent rating is given to a borrower with a very low probability of going into default and withhigh degree of stability, substance and diversity. Borrower has access to raise substantial amounts offunds through public market at any time; very strong debt service capacity and has conservativebalance sheet ratios. Track record in profit terms is very good. Borrower exhibits highest qualityunder virtually all economic conditions.
2 - StrongThis rating is given to borrowers with low probability of going into default in the coming year.Normally has a comfortable degree of stability, substance and diversity. Under normal marketconditions, borrower has good access to public markets to raise funds. Have a strong market andfinancial position with a history of successful performance. Overall debt service capacity is deemedvery strong; critical balance sheet ratios are conservative. Concerned multinationals or localcorporations are well capitalized.
Standard Grade3 - GoodThis rating is given to smaller corporations with limited access to public capital markets or toalternative financial markets during favorable economic and/or market conditions. As it bearscharacteristics of some degree of stability and substance, probability of default is quite low.However, susceptibility to cyclical changes and more concentration of business risk, by product ormarket, may be present. Typical is the combination of comfortable asset protection and an acceptablebalance sheet structure. Debt service capacity is strong.
- 41 -
*SGVFS038804*
4 - SatisfactoryA ‘satisfactory’ rating is given to a borrower where clear risk elements exist and probability of defaultis somewhat greater. Due to volatility of earnings and overall performance, borrower normally haslimited access to public markets. Borrower should be able to withstand normal business cycles, butany prolonged unfavorable economic period would create deterioration beyond acceptable levels.With the combination of reasonable sound asset and cash flow protection, the debt service capacity isadequate. Reported profits in the past year and is expected to report a profit in the current year.
5 - AcceptableAn ‘acceptable’ rating is given to a borrower whose risk elements are sufficiently pronouncedalthough borrower should still be able to withstand normal business cycles. Any prolongedunfavorable economic and/or market period would create an immediate deterioration beyondacceptable levels. Risk is still acceptable as there is sufficient cash flow either historically orexpected in the future from new business or projected finance transaction; an existing borrower wherethe nature of the exposure represents a higher risk because of extraordinary developments but forwhich a decreasing risk within an acceptable period can be expected.
Substandard Grade6 - WatchlistThis rating is given to a borrower that belongs to an unfavorable industry or has company-specificrisk factors which represent a concern. Operating performance and financial strength may bemarginal and it is uncertain if borrower can attract alternative course of finance. Borrower finds ithard to cope with any significant economic downturn and a default in such a case is more than apossibility. Borrower which incurs net losses and has salient financial weaknesses specifically inprofitability. Credit exposure is not at risk of loss at the moment but performance of the borrower hasweakened which, unless present trends are reversed, could lead to losses.
7 - Especially MentionedThis rating is given to a borrower that exhibits potential weaknesses that deserve management’s closeattention. These potential weaknesses, if left uncorrected, may affect the repayment of the loan andthus, increase credit risk of the Group.
Impaired8 - SubstandardThese are loans or portions thereof which appear to involve a substantial and unreasonable degree ofrisk to the Group because of unfavorable record or unsatisfactory characteristics. There exists thepossibility of future losses to the Group unless given closer supervision. Borrower has well-definedweaknesses or weaknesses that jeopardize loan liquidation. Such well-defined weaknesses mayinclude adverse trends or development of financial, managerial, economic or political nature, or asignificant weakness in collateral.
9 - DoubtfulThis rating is given to a nonperforming borrower whose loans or portions thereof have theweaknesses inherent in those classified as Substandard, with the added characteristics that existingfacts, conditions, and values make collection or liquidation in full, highly improbable and in whichsubstantial loss is probable.
10 - LossThis rating is given to a borrower whose loans or portions thereof are considered uncollectible orworthless and of such little value that their continuance as bankable assets is not warranted althoughthe loans may have some recoveries or salvage value. The amount of loss is difficult to measure and
- 42 -
*SGVFS038804*
it is not practical or desirable to defer writing off these basically worthless assets even though partialrecovery may be obtained in the future.
The credit quality of consumer loan applicants are currently evaluated using quantitative andqualitative criteria. For booked consumer loans, the description of credit quality is as follows:
High GradeGood credit ratingThis rating is given to a good repeat client with very satisfactory track record of its loan repayment(paid at least 50.00%) and whose account did not turn past due during the entire term of the loan.
Standard GradeGoodA good rating is given to accounts which did not turn past due for 90 days and over.
LimitedThis rating is given to borrowers who have average track record on loan repayment (paid less than50.00%) and whose account did not turn past due for 90 days and over.
Substandard GradePoorA poor rating is given to accounts who reached 90 days past due regardless of the number of timesand the number of months past due.
Poor litigationThis rating is given to accounts that were past due for 180 days and over and are currently beinghandled by lawyers.
ImpairedPoor repossessedThis rating is given to accounts whose collaterals were repossessed.
Poor written-offThis rating is given to accounts that were recommended for write-off.
Investment securitiesIn ensuring quality investment portfolio, the Group uses the credit risk rating from the published dataproviders like Moody’s, Standard & Poor’s (S&P) or other reputable rating agencies. The followingindicates the levels of equivalent credit quality and its relevant external rating:
Credit Quality External RatingHigh grade Aaa Aa1 Aa2 A1 A2 A3 Baa1 Baa2 Baa3Standard grade Ba1 Ba2 Ba3 B1 B2Substandard grade B3 Caa1 Caa2 Caa3 Ca CImpaired D
The Group considers a debt security to have low credit risk when its credit risk rating is equivalent tothose rated by external rating agencies as ‘Investment grade’ (i.e., those under High grade in the tableabove).
The following tables show the credit quality of loans and advances to banks and investmentsecurities, gross of allowance for credit losses, as of December 31, 2019 and 2018. All loans andadvances to banks are classified as Stage 1 in 2019 and 2018. As of December 31, 2018, all
- 43 -
*SGVFS038804*
investment securities are classified as Stage 1. In 2019, sovereign debt securities at FVOCI with totalcarrying value of P=37.8 million as of December 31, 2018 was transferred from Stage 1 to Stage 3. Asof December 31, 2019, the total carrying value of investment securities classified as Stage 1 andStage 3 amounts to P=200.8 billion and P=28.9 million, respectively.
Consolidated Parent Company2019 2018 2019 2018
Due from BSPHigh grade P=219,994 P=240,134 P=195,770 P=206,289
Due from other banksHigh grade 53,472 44,707 38,671 35,137Standard grade 941 697 – 50Unrated 359 404 27 31
54,772 45,808 38,698 35,218Interbank loans receivable and SPURA
High grade 71,646 48,757 55,624 22,750Unrated 529 1,974 529 1,974
72,175 50,731 56,153 24,724Total loans and advances to banks
High grade 345,112 333,598 290,065 264,176Standard grade 941 697 – 50Unrated 888 2,378 556 2,005
P=346,941 P=336,673 P=290,621 P=266,231Debt securities at FVOCIPrivate
High grade P=32,793 P=41,872 P=25,827 P=32,576Standard grade 3,163 258 254 258Unrated 243 239 243 239
36,199 42,369 26,324 33,073Treasury notes and bonds
High grade 111,791 40,786 109,203 37,377Government
High grade 52,841 26,226 52,620 20,443Sub-standard grade 29 778 29 778
52,870 27,004 52,649 21,221Total debt securities at FVOCI
High grade 197,425 108,884 187,650 90,396Standard grade 3,163 258 254 258Sub-standard grade 29 778 29 778Unrated 243 239 243 239
200,860 110,159 188,176 91,671Investment securities at amortized costTreasury notes and bonds
High grade 227,442 237,476 208,514 204,176Government
High grade 20,110 21,859 8,130 8,479Standard grade 122 – – –
20,232 21,859 8,130 8,479Private
High grade 331 5,298 – –Standard grade 3,543 742 – –Unrated 6 – – –
3,880 6,040 – –Treasury bills
High grade 100 49 – –Total investment securities at amortized cost
High grade 247,983 264,682 216,644 212,655Standard grade 3,665 742 – –Unrated 6 – – –
251,654 265,424 216,644 212,655
(Forward)
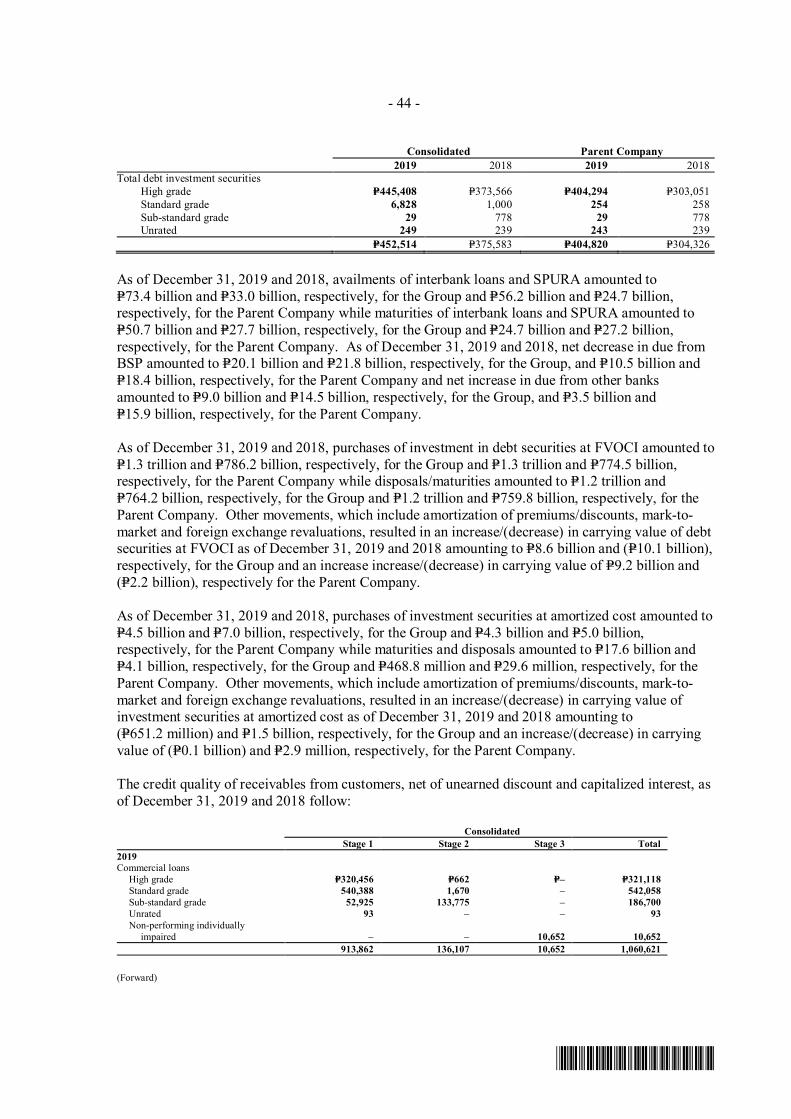
- 44 -
*SGVFS038804*
Consolidated Parent Company2019 2018 2019 2018
Total debt investment securitiesHigh grade P=445,408 P=373,566 P=404,294 P=303,051Standard grade 6,828 1,000 254 258Sub-standard grade 29 778 29 778Unrated 249 239 243 239
P=452,514 P=375,583 P=404,820 P=304,326
As of December 31, 2019 and 2018, availments of interbank loans and SPURA amounted toP=73.4 billion and P=33.0 billion, respectively, for the Group and P=56.2 billion and P=24.7 billion,respectively, for the Parent Company while maturities of interbank loans and SPURA amounted toP=50.7 billion and P=27.7 billion, respectively, for the Group and P=24.7 billion and P=27.2 billion,respectively, for the Parent Company. As of December 31, 2019 and 2018, net decrease in due fromBSP amounted to P=20.1 billion and P=21.8 billion, respectively, for the Group, and P=10.5 billion andP=18.4 billion, respectively, for the Parent Company and net increase in due from other banksamounted to P=9.0 billion and P=14.5 billion, respectively, for the Group, and P=3.5 billion andP=15.9 billion, respectively, for the Parent Company.
As of December 31, 2019 and 2018, purchases of investment in debt securities at FVOCI amounted toP=1.3 trillion and P=786.2 billion, respectively, for the Group and P=1.3 trillion and P=774.5 billion,respectively, for the Parent Company while disposals/maturities amounted to P=1.2 trillion andP=764.2 billion, respectively, for the Group and P=1.2 trillion and P=759.8 billion, respectively, for theParent Company. Other movements, which include amortization of premiums/discounts, mark-to-market and foreign exchange revaluations, resulted in an increase/(decrease) in carrying value of debtsecurities at FVOCI as of December 31, 2019 and 2018 amounting to P=8.6 billion and (P=10.1 billion),respectively, for the Group and an increase increase/(decrease) in carrying value of P=9.2 billion and(P=2.2 billion), respectively for the Parent Company.
As of December 31, 2019 and 2018, purchases of investment securities at amortized cost amounted toP=4.5 billion and P=7.0 billion, respectively, for the Group and P=4.3 billion and P=5.0 billion,respectively, for the Parent Company while maturities and disposals amounted to P=17.6 billion andP=4.1 billion, respectively, for the Group and P=468.8 million and P=29.6 million, respectively, for theParent Company. Other movements, which include amortization of premiums/discounts, mark-to-market and foreign exchange revaluations, resulted in an increase/(decrease) in carrying value ofinvestment securities at amortized cost as of December 31, 2019 and 2018 amounting to(P=651.2 million) and P=1.5 billion, respectively, for the Group and an increase/(decrease) in carryingvalue of (P=0.1 billion) and P=2.9 million, respectively, for the Parent Company.
The credit quality of receivables from customers, net of unearned discount and capitalized interest, asof December 31, 2019 and 2018 follow:
ConsolidatedStage 1 Stage 2 Stage 3 Total
2019Commercial loans
High grade P=320,456 P=662 P=– P=321,118Standard grade 540,388 1,670 – 542,058Sub-standard grade 52,925 133,775 – 186,700Unrated 93 – – 93Non-performing individually impaired – – 10,652 10,652
913,862 136,107 10,652 1,060,621
(Forward)
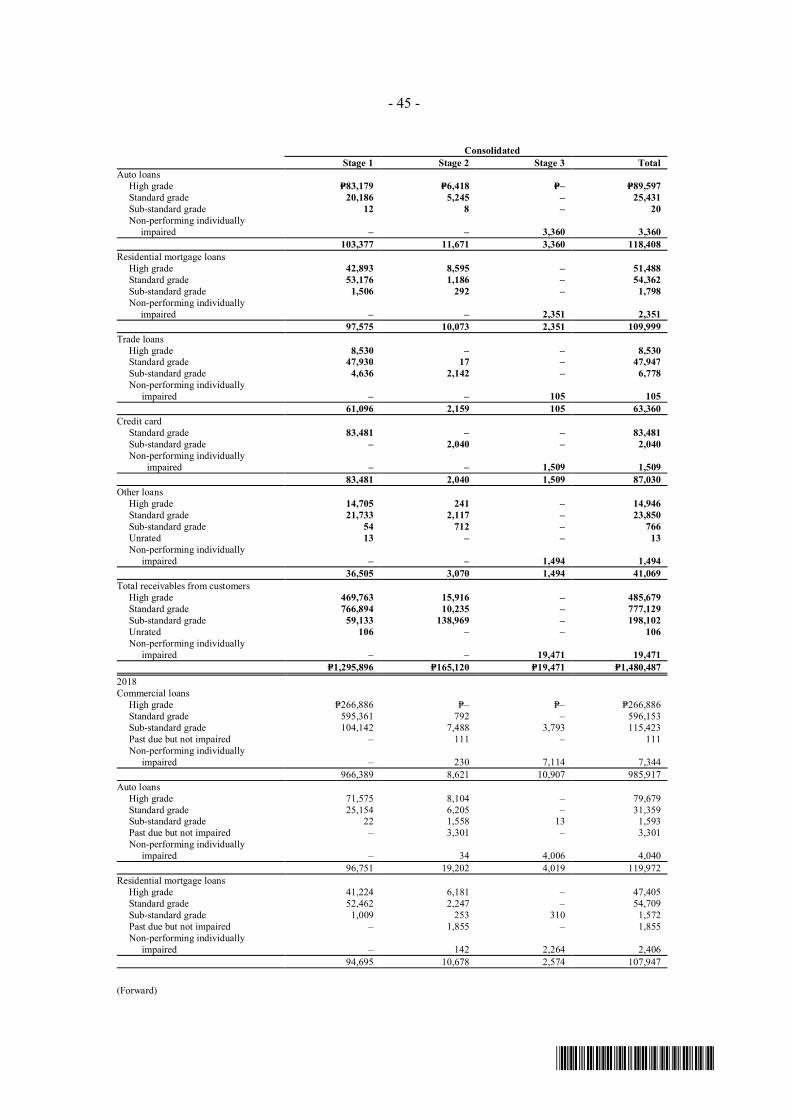
- 45 -
*SGVFS038804*
ConsolidatedStage 1 Stage 2 Stage 3 Total
Auto loansHigh grade P=83,179 P=6,418 P=– P=89,597Standard grade 20,186 5,245 – 25,431Sub-standard grade 12 8 – 20Non-performing individually impaired – – 3,360 3,360
103,377 11,671 3,360 118,408Residential mortgage loans
High grade 42,893 8,595 – 51,488Standard grade 53,176 1,186 – 54,362Sub-standard grade 1,506 292 – 1,798Non-performing individually impaired – – 2,351 2,351
97,575 10,073 2,351 109,999Trade loans
High grade 8,530 – – 8,530Standard grade 47,930 17 – 47,947Sub-standard grade 4,636 2,142 – 6,778Non-performing individually impaired – – 105 105
61,096 2,159 105 63,360Credit card
Standard grade 83,481 – – 83,481Sub-standard grade – 2,040 – 2,040Non-performing individually
impaired – – 1,509 1,50983,481 2,040 1,509 87,030
Other loansHigh grade 14,705 241 – 14,946Standard grade 21,733 2,117 – 23,850Sub-standard grade 54 712 – 766Unrated 13 – – 13Non-performing individually impaired – – 1,494 1,494
36,505 3,070 1,494 41,069Total receivables from customers
High grade 469,763 15,916 – 485,679Standard grade 766,894 10,235 – 777,129Sub-standard grade 59,133 138,969 – 198,102Unrated 106 – – 106Non-performing individually impaired – – 19,471 19,471
P=1,295,896 P=165,120 P=19,471 P=1,480,4872018Commercial loans
High grade P=266,886 P=– P=– P=266,886Standard grade 595,361 792 ‒ 596,153Sub-standard grade 104,142 7,488 3,793 115,423Past due but not impaired – 111 – 111Non-performing individually impaired – 230 7,114 7,344
966,389 8,621 10,907 985,917Auto loans
High grade 71,575 8,104 ‒ 79,679Standard grade 25,154 6,205 ‒ 31,359Sub-standard grade 22 1,558 13 1,593Past due but not impaired – 3,301 ‒ 3,301Non-performing individually impaired – 34 4,006 4,040
96,751 19,202 4,019 119,972Residential mortgage loans
High grade 41,224 6,181 ‒ 47,405Standard grade 52,462 2,247 ‒ 54,709Sub-standard grade 1,009 253 310 1,572Past due but not impaired – 1,855 ‒ 1,855Non-performing individually impaired – 142 2,264 2,406
94,695 10,678 2,574 107,947
(Forward)
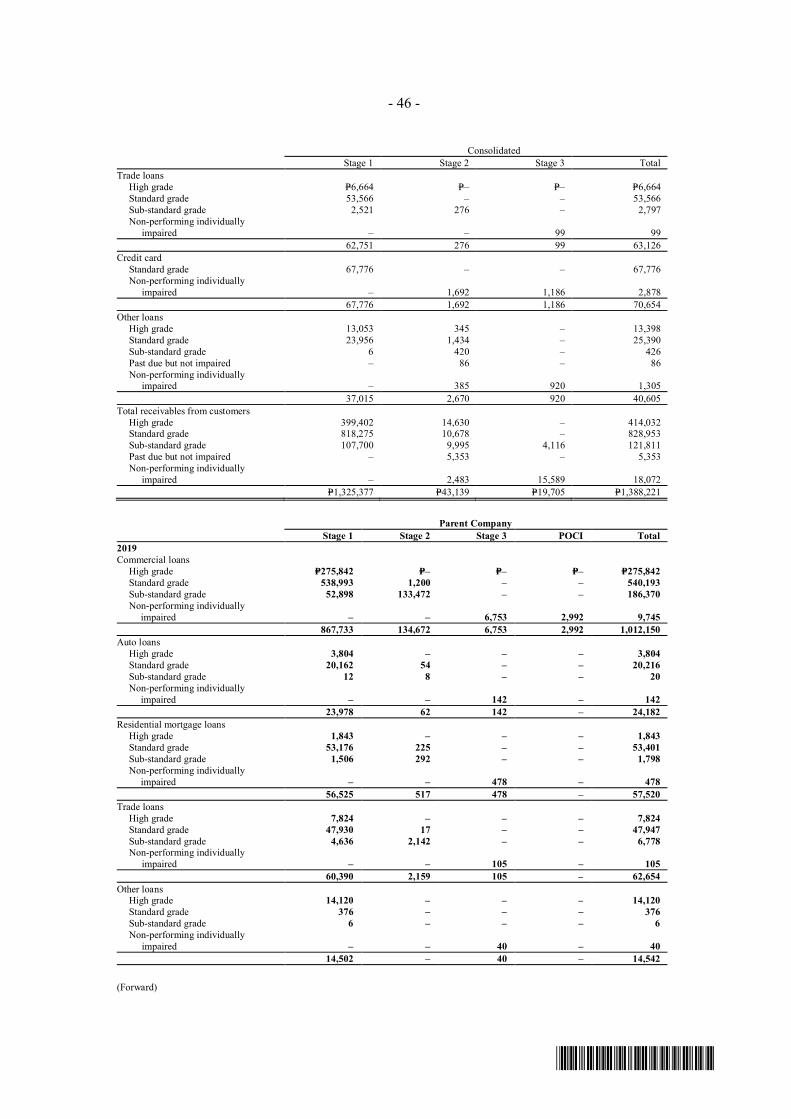
- 46 -
*SGVFS038804*
ConsolidatedStage 1 Stage 2 Stage 3 Total
Trade loansHigh grade P=6,664 P=– P=– P=6,664Standard grade 53,566 – – 53,566Sub-standard grade 2,521 276 – 2,797Non-performing individually impaired – – 99 99
62,751 276 99 63,126Credit card
Standard grade 67,776 – – 67,776Non-performing individually impaired – 1,692 1,186 2,878
67,776 1,692 1,186 70,654Other loans
High grade 13,053 345 – 13,398Standard grade 23,956 1,434 ‒ 25,390Sub-standard grade 6 420 ‒ 426Past due but not impaired – 86 – 86Non-performing individually impaired – 385 920 1,305
37,015 2,670 920 40,605Total receivables from customers
High grade 399,402 14,630 ‒ 414,032Standard grade 818,275 10,678 ‒ 828,953Sub-standard grade 107,700 9,995 4,116 121,811Past due but not impaired – 5,353 – 5,353Non-performing individually impaired – 2,483 15,589 18,072
P=1,325,377 P=43,139 P=19,705 P=1,388,221
Parent CompanyStage 1 Stage 2 Stage 3 POCI Total
2019Commercial loans
High grade P=275,842 P=– P=– P=– P=275,842Standard grade 538,993 1,200 – – 540,193Sub-standard grade 52,898 133,472 – – 186,370Non-performing individually impaired – – 6,753 2,992 9,745
867,733 134,672 6,753 2,992 1,012,150Auto loans
High grade 3,804 – – – 3,804Standard grade 20,162 54 – – 20,216Sub-standard grade 12 8 – – 20Non-performing individually impaired – – 142 – 142
23,978 62 142 – 24,182Residential mortgage loans
High grade 1,843 – – – 1,843Standard grade 53,176 225 – – 53,401Sub-standard grade 1,506 292 – – 1,798Non-performing individually impaired – – 478 – 478
56,525 517 478 – 57,520Trade loans
High grade 7,824 – – – 7,824Standard grade 47,930 17 – – 47,947Sub-standard grade 4,636 2,142 – – 6,778Non-performing individually impaired – – 105 – 105
60,390 2,159 105 – 62,654Other loans
High grade 14,120 – – – 14,120Standard grade 376 – – – 376Sub-standard grade 6 – – – 6Non-performing individually impaired – – 40 – 40
14,502 – 40 – 14,542
(Forward)
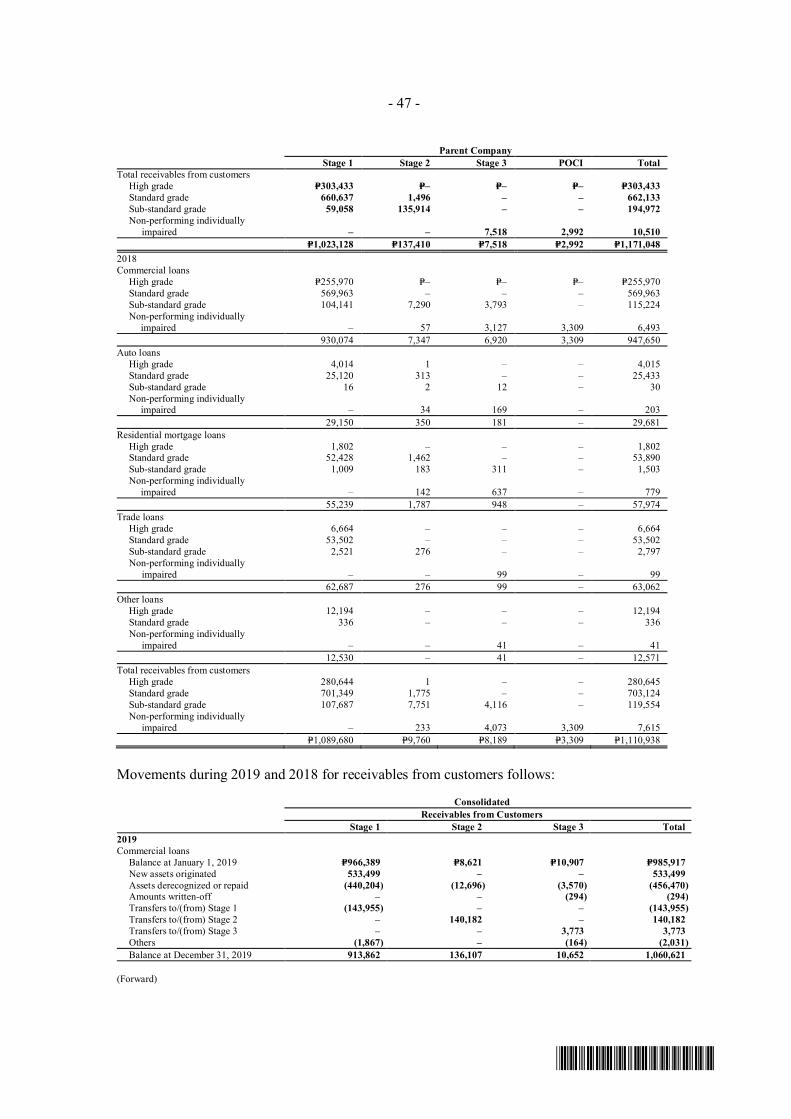
- 47 -
*SGVFS038804*
Parent CompanyStage 1 Stage 2 Stage 3 POCI Total
Total receivables from customersHigh grade P=303,433 P=– P=– P=– P=303,433Standard grade 660,637 1,496 – – 662,133Sub-standard grade 59,058 135,914 – – 194,972Non-performing individually impaired – – 7,518 2,992 10,510
P=1,023,128 P=137,410 P=7,518 P=2,992 P=1,171,0482018Commercial loans
High grade P=255,970 P=– P=– P=‒ P=255,970Standard grade 569,963 – – ‒ 569,963Sub-standard grade 104,141 7,290 3,793 ‒ 115,224Non-performing individually impaired – 57 3,127 3,309 6,493
930,074 7,347 6,920 3,309 947,650Auto loans
High grade 4,014 1 – ‒ 4,015Standard grade 25,120 313 – ‒ 25,433Sub-standard grade 16 2 12 ‒ 30Non-performing individually impaired – 34 169 ‒ 203
29,150 350 181 ‒ 29,681Residential mortgage loans
High grade 1,802 – – ‒ 1,802Standard grade 52,428 1,462 – ‒ 53,890Sub-standard grade 1,009 183 311 ‒ 1,503Non-performing individually impaired – 142 637 ‒ 779
55,239 1,787 948 ‒ 57,974Trade loans
High grade 6,664 – – ‒ 6,664Standard grade 53,502 – – ‒ 53,502Sub-standard grade 2,521 276 – ‒ 2,797Non-performing individually impaired – – 99 ‒ 99
62,687 276 99 ‒ 63,062Other loans
High grade 12,194 – – ‒ 12,194Standard grade 336 – – ‒ 336Non-performing individually impaired – – 41 ‒ 41
12,530 – 41 ‒ 12,571Total receivables from customers
High grade 280,644 1 – ‒ 280,645Standard grade 701,349 1,775 – ‒ 703,124Sub-standard grade 107,687 7,751 4,116 ‒ 119,554Non-performing individually impaired – 233 4,073 3,309 7,615
P=1,089,680 P=9,760 P=8,189 P=3,309 P=1,110,938
Movements during 2019 and 2018 for receivables from customers follows:
ConsolidatedReceivables from Customers
Stage 1 Stage 2 Stage 3 Total2019Commercial loans
Balance at January 1, 2019 P=966,389 P=8,621 P=10,907 P=985,917New assets originated 533,499 – – 533,499Assets derecognized or repaid (440,204) (12,696) (3,570) (456,470)Amounts written-off – – (294) (294)Transfers to/(from) Stage 1 (143,955) – – (143,955)Transfers to/(from) Stage 2 – 140,182 – 140,182Transfers to/(from) Stage 3 – – 3,773 3,773Others (1,867) – (164) (2,031)Balance at December 31, 2019 913,862 136,107 10,652 1,060,621
(Forward)
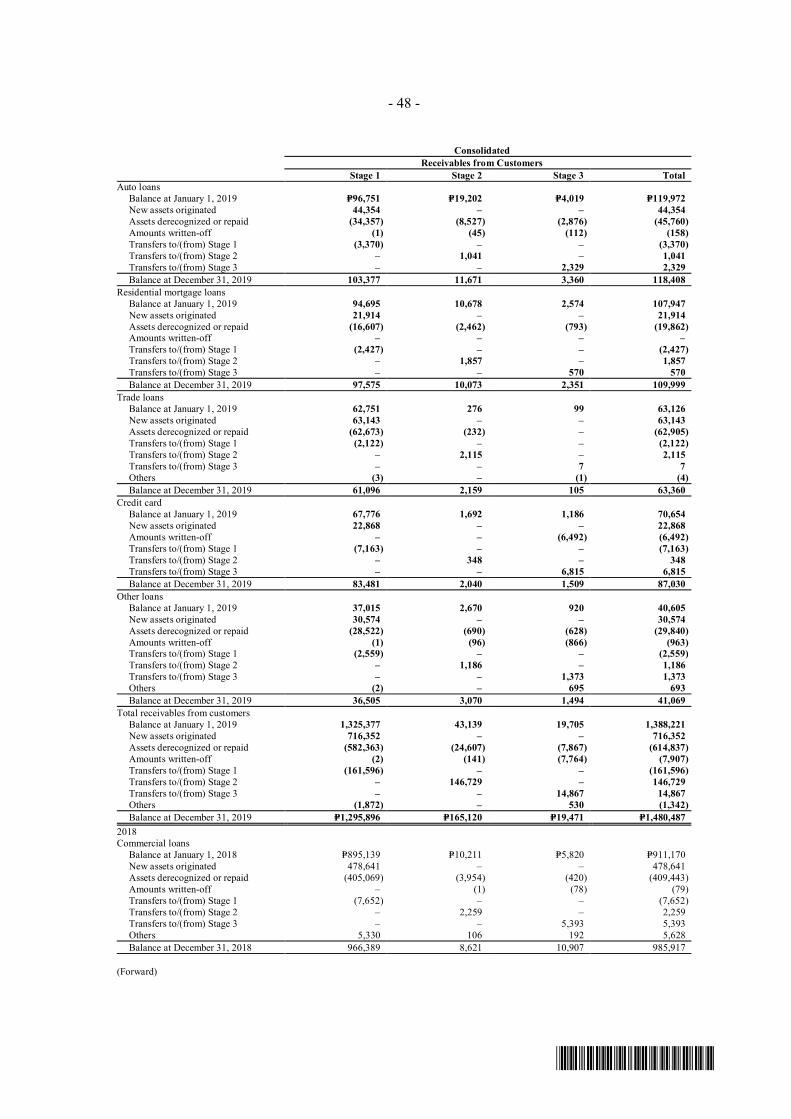
- 48 -
*SGVFS038804*
ConsolidatedReceivables from Customers
Stage 1 Stage 2 Stage 3 TotalAuto loans
Balance at January 1, 2019 P=96,751 P=19,202 P=4,019 P=119,972New assets originated 44,354 – – 44,354Assets derecognized or repaid (34,357) (8,527) (2,876) (45,760)Amounts written-off (1) (45) (112) (158)Transfers to/(from) Stage 1 (3,370) – – (3,370)Transfers to/(from) Stage 2 – 1,041 – 1,041Transfers to/(from) Stage 3 – – 2,329 2,329Balance at December 31, 2019 103,377 11,671 3,360 118,408
Residential mortgage loansBalance at January 1, 2019 94,695 10,678 2,574 107,947New assets originated 21,914 – – 21,914Assets derecognized or repaid (16,607) (2,462) (793) (19,862)Amounts written-off – – – –Transfers to/(from) Stage 1 (2,427) – – (2,427)Transfers to/(from) Stage 2 – 1,857 – 1,857Transfers to/(from) Stage 3 – – 570 570Balance at December 31, 2019 97,575 10,073 2,351 109,999
Trade loansBalance at January 1, 2019 62,751 276 99 63,126New assets originated 63,143 – – 63,143Assets derecognized or repaid (62,673) (232) – (62,905)Transfers to/(from) Stage 1 (2,122) – – (2,122)Transfers to/(from) Stage 2 – 2,115 – 2,115Transfers to/(from) Stage 3 – – 7 7Others (3) – (1) (4)Balance at December 31, 2019 61,096 2,159 105 63,360
Credit cardBalance at January 1, 2019 67,776 1,692 1,186 70,654New assets originated 22,868 – – 22,868Amounts written-off – – (6,492) (6,492)Transfers to/(from) Stage 1 (7,163) – – (7,163)Transfers to/(from) Stage 2 – 348 – 348Transfers to/(from) Stage 3 – – 6,815 6,815Balance at December 31, 2019 83,481 2,040 1,509 87,030
Other loansBalance at January 1, 2019 37,015 2,670 920 40,605New assets originated 30,574 – – 30,574Assets derecognized or repaid (28,522) (690) (628) (29,840)Amounts written-off (1) (96) (866) (963)Transfers to/(from) Stage 1 (2,559) – – (2,559)Transfers to/(from) Stage 2 – 1,186 – 1,186Transfers to/(from) Stage 3 – – 1,373 1,373Others (2) – 695 693Balance at December 31, 2019 36,505 3,070 1,494 41,069
Total receivables from customersBalance at January 1, 2019 1,325,377 43,139 19,705 1,388,221New assets originated 716,352 – – 716,352Assets derecognized or repaid (582,363) (24,607) (7,867) (614,837)Amounts written-off (2) (141) (7,764) (7,907)Transfers to/(from) Stage 1 (161,596) – – (161,596)Transfers to/(from) Stage 2 – 146,729 – 146,729Transfers to/(from) Stage 3 – – 14,867 14,867Others (1,872) – 530 (1,342)Balance at December 31, 2019 P=1,295,896 P=165,120 P=19,471 P=1,480,487
2018Commercial loans
Balance at January 1, 2018 P=895,139 P=10,211 P=5,820 P=911,170New assets originated 478,641 – – 478,641Assets derecognized or repaid (405,069) (3,954) (420) (409,443)Amounts written-off – (1) (78) (79)Transfers to/(from) Stage 1 (7,652) – – (7,652)Transfers to/(from) Stage 2 – 2,259 – 2,259Transfers to/(from) Stage 3 – – 5,393 5,393Others 5,330 106 192 5,628Balance at December 31, 2018 966,389 8,621 10,907 985,917
(Forward)
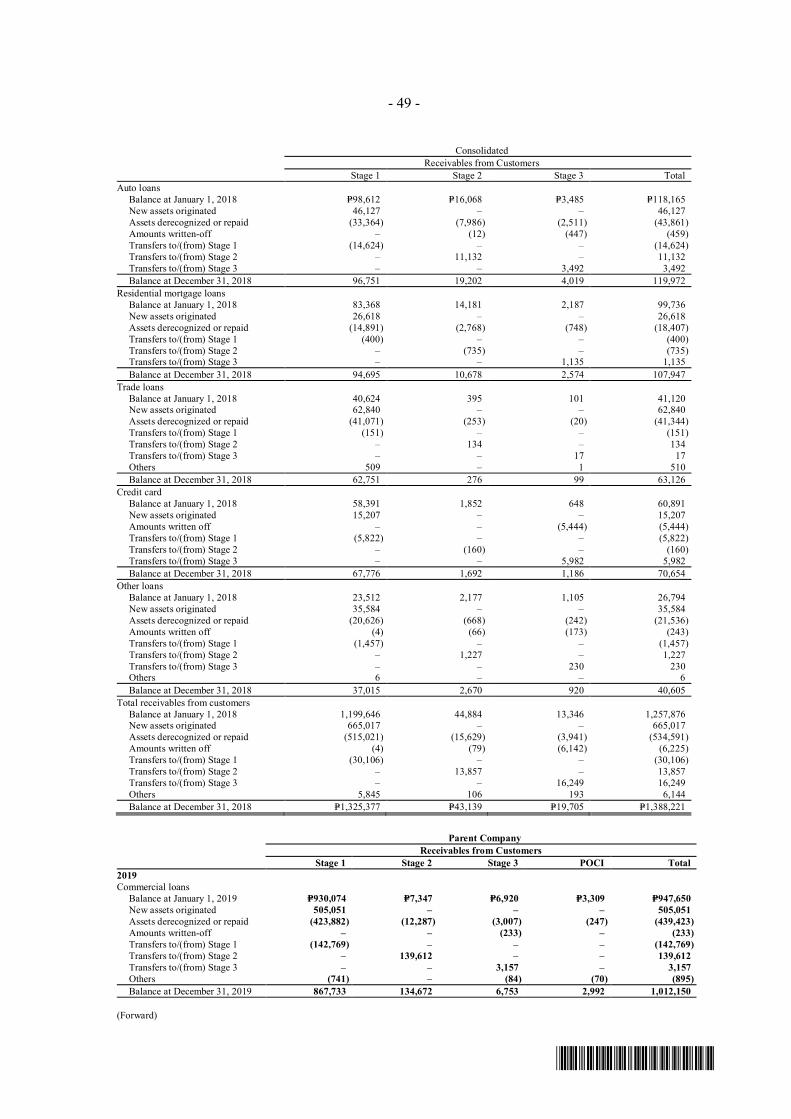
- 49 -
*SGVFS038804*
ConsolidatedReceivables from Customers
Stage 1 Stage 2 Stage 3 TotalAuto loans
Balance at January 1, 2018 P=98,612 P=16,068 P=3,485 P=118,165New assets originated 46,127 – – 46,127Assets derecognized or repaid (33,364) (7,986) (2,511) (43,861)Amounts written-off – (12) (447) (459)Transfers to/(from) Stage 1 (14,624) – – (14,624)Transfers to/(from) Stage 2 – 11,132 – 11,132Transfers to/(from) Stage 3 – – 3,492 3,492Balance at December 31, 2018 96,751 19,202 4,019 119,972
Residential mortgage loansBalance at January 1, 2018 83,368 14,181 2,187 99,736New assets originated 26,618 – – 26,618Assets derecognized or repaid (14,891) (2,768) (748) (18,407)Transfers to/(from) Stage 1 (400) – – (400)Transfers to/(from) Stage 2 – (735) – (735)Transfers to/(from) Stage 3 – – 1,135 1,135Balance at December 31, 2018 94,695 10,678 2,574 107,947
Trade loansBalance at January 1, 2018 40,624 395 101 41,120New assets originated 62,840 – – 62,840Assets derecognized or repaid (41,071) (253) (20) (41,344)Transfers to/(from) Stage 1 (151) – – (151)Transfers to/(from) Stage 2 – 134 – 134Transfers to/(from) Stage 3 – – 17 17Others 509 – 1 510Balance at December 31, 2018 62,751 276 99 63,126
Credit cardBalance at January 1, 2018 58,391 1,852 648 60,891New assets originated 15,207 – – 15,207Amounts written off – – (5,444) (5,444)Transfers to/(from) Stage 1 (5,822) – – (5,822)Transfers to/(from) Stage 2 – (160) – (160)Transfers to/(from) Stage 3 – – 5,982 5,982Balance at December 31, 2018 67,776 1,692 1,186 70,654
Other loansBalance at January 1, 2018 23,512 2,177 1,105 26,794New assets originated 35,584 – – 35,584Assets derecognized or repaid (20,626) (668) (242) (21,536)Amounts written off (4) (66) (173) (243)Transfers to/(from) Stage 1 (1,457) – – (1,457)Transfers to/(from) Stage 2 – 1,227 – 1,227Transfers to/(from) Stage 3 – – 230 230Others 6 – – 6Balance at December 31, 2018 37,015 2,670 920 40,605
Total receivables from customersBalance at January 1, 2018 1,199,646 44,884 13,346 1,257,876New assets originated 665,017 – – 665,017Assets derecognized or repaid (515,021) (15,629) (3,941) (534,591)Amounts written off (4) (79) (6,142) (6,225)Transfers to/(from) Stage 1 (30,106) – – (30,106)Transfers to/(from) Stage 2 – 13,857 – 13,857Transfers to/(from) Stage 3 – – 16,249 16,249Others 5,845 106 193 6,144Balance at December 31, 2018 P=1,325,377 P=43,139 P=19,705 P=1,388,221
Parent CompanyReceivables from Customers
Stage 1 Stage 2 Stage 3 POCI Total2019Commercial loans
Balance at January 1, 2019 P=930,074 P=7,347 P=6,920 P=3,309 P=947,650New assets originated 505,051 – – – 505,051Assets derecognized or repaid (423,882) (12,287) (3,007) (247) (439,423)Amounts written-off – – (233) – (233)Transfers to/(from) Stage 1 (142,769) – – – (142,769)Transfers to/(from) Stage 2 – 139,612 – – 139,612Transfers to/(from) Stage 3 – – 3,157 – 3,157Others (741) – (84) (70) (895)Balance at December 31, 2019 867,733 134,672 6,753 2,992 1,012,150
(Forward)
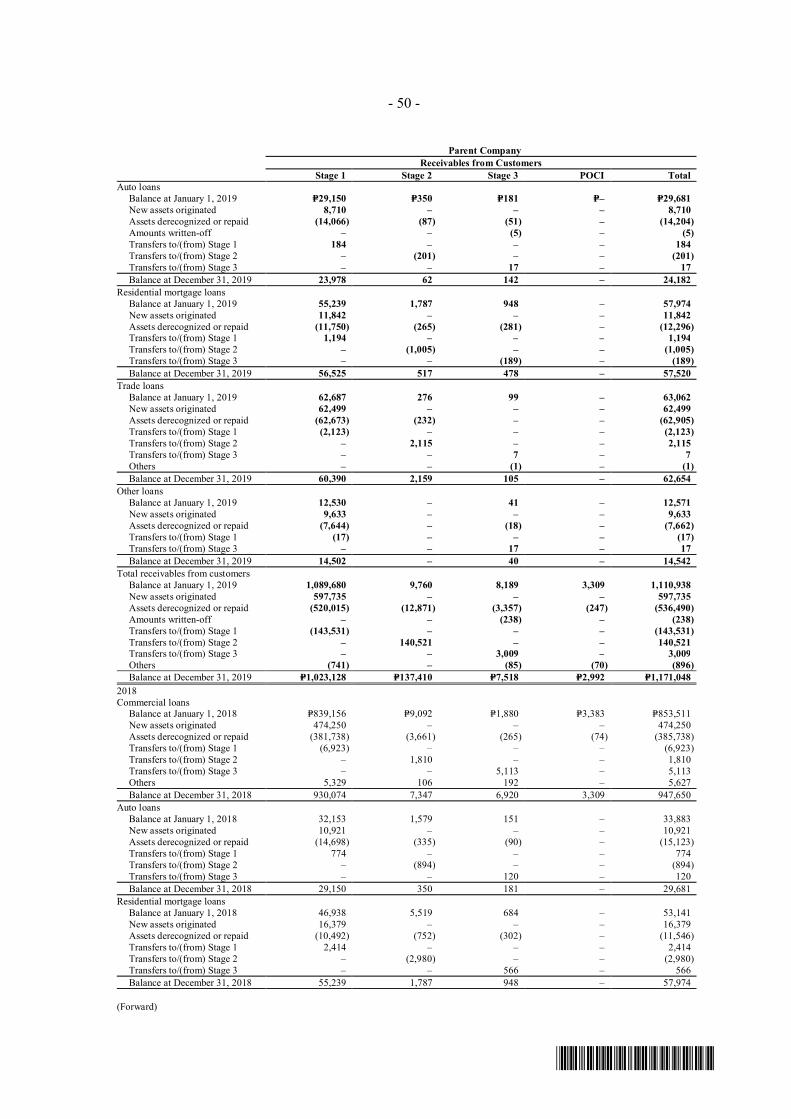
- 50 -
*SGVFS038804*
Parent CompanyReceivables from Customers
Stage 1 Stage 2 Stage 3 POCI TotalAuto loans
Balance at January 1, 2019 P=29,150 P=350 P=181 P=– P=29,681New assets originated 8,710 – – – 8,710Assets derecognized or repaid (14,066) (87) (51) – (14,204)Amounts written-off – – (5) – (5)Transfers to/(from) Stage 1 184 – – – 184Transfers to/(from) Stage 2 – (201) – – (201)Transfers to/(from) Stage 3 – – 17 – 17Balance at December 31, 2019 23,978 62 142 – 24,182
Residential mortgage loansBalance at January 1, 2019 55,239 1,787 948 – 57,974New assets originated 11,842 – – – 11,842Assets derecognized or repaid (11,750) (265) (281) – (12,296)Transfers to/(from) Stage 1 1,194 – – – 1,194Transfers to/(from) Stage 2 – (1,005) – – (1,005)Transfers to/(from) Stage 3 – – (189) – (189)Balance at December 31, 2019 56,525 517 478 – 57,520
Trade loansBalance at January 1, 2019 62,687 276 99 – 63,062New assets originated 62,499 – – – 62,499Assets derecognized or repaid (62,673) (232) – – (62,905)Transfers to/(from) Stage 1 (2,123) – – – (2,123)Transfers to/(from) Stage 2 – 2,115 – – 2,115Transfers to/(from) Stage 3 – – 7 – 7Others – – (1) – (1)Balance at December 31, 2019 60,390 2,159 105 – 62,654
Other loansBalance at January 1, 2019 12,530 – 41 – 12,571New assets originated 9,633 – – – 9,633Assets derecognized or repaid (7,644) – (18) – (7,662)Transfers to/(from) Stage 1 (17) – – – (17)Transfers to/(from) Stage 3 – – 17 – 17Balance at December 31, 2019 14,502 – 40 – 14,542
Total receivables from customersBalance at January 1, 2019 1,089,680 9,760 8,189 3,309 1,110,938New assets originated 597,735 – – – 597,735Assets derecognized or repaid (520,015) (12,871) (3,357) (247) (536,490)Amounts written-off – – (238) – (238)Transfers to/(from) Stage 1 (143,531) – – – (143,531)Transfers to/(from) Stage 2 – 140,521 – – 140,521Transfers to/(from) Stage 3 – – 3,009 – 3,009Others (741) – (85) (70) (896)Balance at December 31, 2019 P=1,023,128 P=137,410 P=7,518 P=2,992 P=1,171,048
2018Commercial loans
Balance at January 1, 2018 P=839,156 P=9,092 P=1,880 P=3,383 P=853,511New assets originated 474,250 – – – 474,250Assets derecognized or repaid (381,738) (3,661) (265) (74) (385,738)Transfers to/(from) Stage 1 (6,923) – – – (6,923)Transfers to/(from) Stage 2 – 1,810 – – 1,810Transfers to/(from) Stage 3 – – 5,113 – 5,113Others 5,329 106 192 – 5,627Balance at December 31, 2018 930,074 7,347 6,920 3,309 947,650
Auto loansBalance at January 1, 2018 32,153 1,579 151 – 33,883New assets originated 10,921 – – – 10,921Assets derecognized or repaid (14,698) (335) (90) – (15,123)Transfers to/(from) Stage 1 774 – – – 774Transfers to/(from) Stage 2 – (894) – – (894)Transfers to/(from) Stage 3 – – 120 – 120Balance at December 31, 2018 29,150 350 181 – 29,681
Residential mortgage loansBalance at January 1, 2018 46,938 5,519 684 – 53,141New assets originated 16,379 – – – 16,379Assets derecognized or repaid (10,492) (752) (302) – (11,546)Transfers to/(from) Stage 1 2,414 – – – 2,414Transfers to/(from) Stage 2 – (2,980) – – (2,980)Transfers to/(from) Stage 3 – – 566 – 566Balance at December 31, 2018 55,239 1,787 948 – 57,974
(Forward)
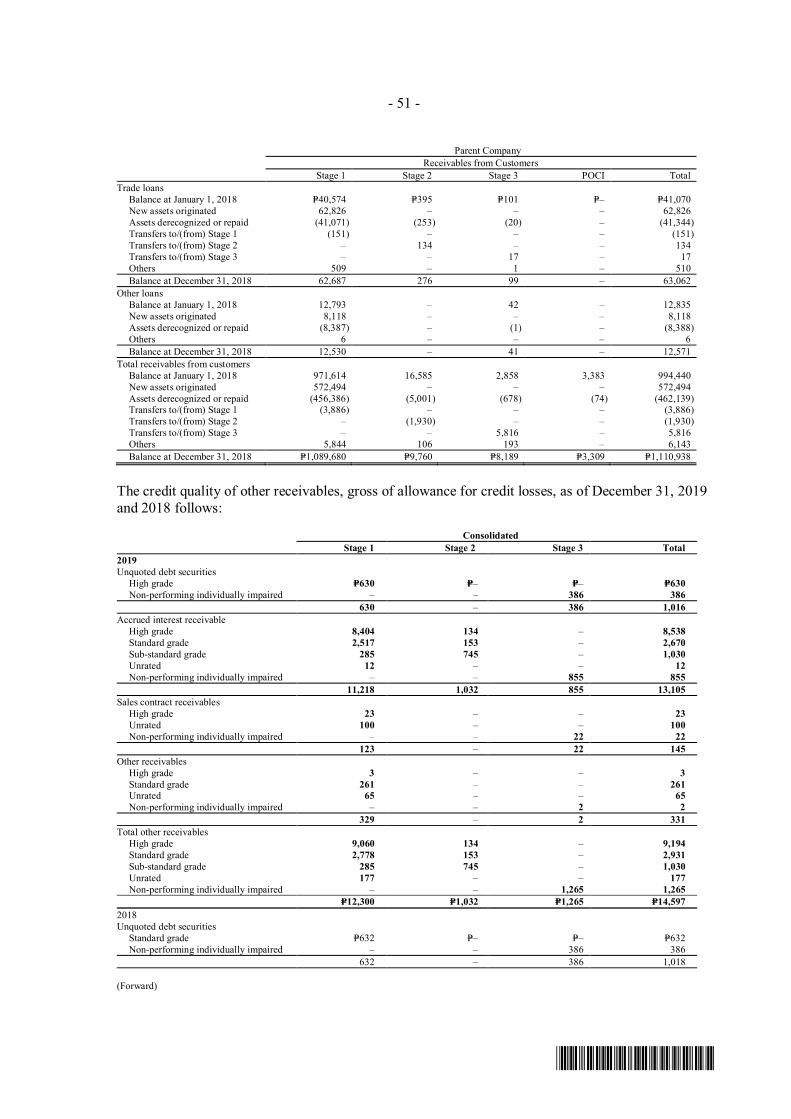
- 51 -
*SGVFS038804*
Parent CompanyReceivables from Customers
Stage 1 Stage 2 Stage 3 POCI TotalTrade loans
Balance at January 1, 2018 P=40,574 P=395 P=101 P=– P=41,070New assets originated 62,826 – – – 62,826Assets derecognized or repaid (41,071) (253) (20) – (41,344)Transfers to/(from) Stage 1 (151) – – – (151)Transfers to/(from) Stage 2 – 134 – – 134Transfers to/(from) Stage 3 – – 17 – 17Others 509 – 1 – 510Balance at December 31, 2018 62,687 276 99 – 63,062
Other loansBalance at January 1, 2018 12,793 – 42 – 12,835New assets originated 8,118 – – – 8,118Assets derecognized or repaid (8,387) – (1) – (8,388)Others 6 – – – 6Balance at December 31, 2018 12,530 – 41 – 12,571
Total receivables from customersBalance at January 1, 2018 971,614 16,585 2,858 3,383 994,440New assets originated 572,494 – – – 572,494Assets derecognized or repaid (456,386) (5,001) (678) (74) (462,139)Transfers to/(from) Stage 1 (3,886) – – – (3,886)Transfers to/(from) Stage 2 – (1,930) – – (1,930)Transfers to/(from) Stage 3 – – 5,816 – 5,816Others 5,844 106 193 – 6,143Balance at December 31, 2018 P=1,089,680 P=9,760 P=8,189 P=3,309 P=1,110,938
The credit quality of other receivables, gross of allowance for credit losses, as of December 31, 2019and 2018 follows:
ConsolidatedStage 1 Stage 2 Stage 3 Total
2019Unquoted debt securities
High grade P=630 P=– P=– P=630Non-performing individually impaired – – 386 386
630 – 386 1,016Accrued interest receivable
High grade 8,404 134 – 8,538Standard grade 2,517 153 – 2,670Sub-standard grade 285 745 – 1,030Unrated 12 – – 12Non-performing individually impaired – – 855 855
11,218 1,032 855 13,105Sales contract receivables
High grade 23 – – 23Unrated 100 – – 100Non-performing individually impaired – – 22 22
123 – 22 145Other receivables
High grade 3 – – 3Standard grade 261 – – 261Unrated 65 – – 65Non-performing individually impaired – – 2 2
329 – 2 331Total other receivables
High grade 9,060 134 – 9,194Standard grade 2,778 153 – 2,931Sub-standard grade 285 745 – 1,030Unrated 177 – – 177Non-performing individually impaired – – 1,265 1,265
P=12,300 P=1,032 P=1,265 P=14,5972018Unquoted debt securities
Standard grade P=632 P=– P=– P=632Non-performing individually impaired – – 386 386
632 – 386 1,018
(Forward)
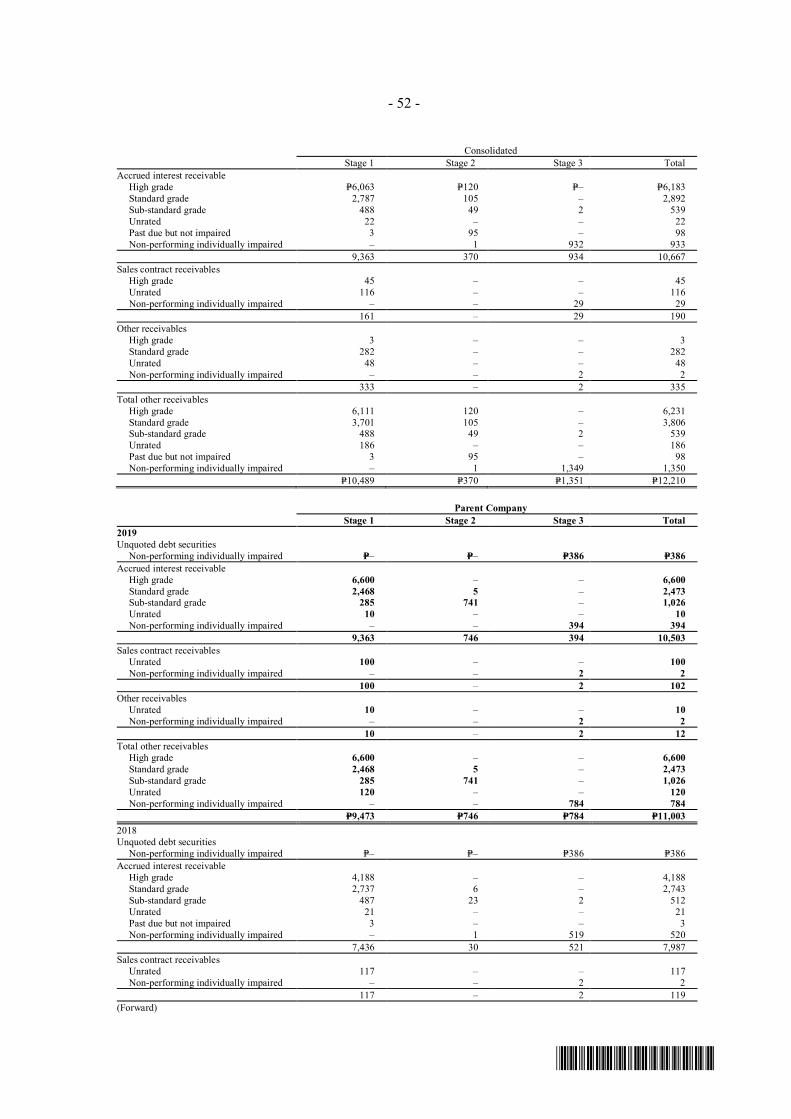
- 52 -
*SGVFS038804*
ConsolidatedStage 1 Stage 2 Stage 3 Total
Accrued interest receivableHigh grade P=6,063 P=120 P=– P=6,183Standard grade 2,787 105 – 2,892Sub-standard grade 488 49 2 539Unrated 22 – – 22Past due but not impaired 3 95 – 98Non-performing individually impaired – 1 932 933
9,363 370 934 10,667Sales contract receivables
High grade 45 – – 45Unrated 116 – – 116Non-performing individually impaired – – 29 29
161 – 29 190Other receivables
High grade 3 – – 3Standard grade 282 – – 282Unrated 48 – – 48Non-performing individually impaired – – 2 2
333 – 2 335Total other receivables
High grade 6,111 120 – 6,231Standard grade 3,701 105 – 3,806Sub-standard grade 488 49 2 539Unrated 186 – – 186Past due but not impaired 3 95 – 98Non-performing individually impaired – 1 1,349 1,350
P=10,489 P=370 P=1,351 P=12,210
Parent CompanyStage 1 Stage 2 Stage 3 Total
2019Unquoted debt securities
Non-performing individually impaired P=– P=– P=386 P=386Accrued interest receivable
High grade 6,600 – – 6,600Standard grade 2,468 5 – 2,473Sub-standard grade 285 741 – 1,026Unrated 10 – – 10Non-performing individually impaired – – 394 394
9,363 746 394 10,503Sales contract receivables
Unrated 100 – – 100Non-performing individually impaired – – 2 2
100 – 2 102Other receivables
Unrated 10 – – 10Non-performing individually impaired – – 2 2
10 – 2 12Total other receivables
High grade 6,600 – – 6,600Standard grade 2,468 5 – 2,473Sub-standard grade 285 741 – 1,026Unrated 120 – – 120Non-performing individually impaired – – 784 784
P=9,473 P=746 P=784 P=11,0032018Unquoted debt securities
Non-performing individually impaired P=– P=– P=386 P=386Accrued interest receivable
High grade 4,188 – – 4,188Standard grade 2,737 6 – 2,743Sub-standard grade 487 23 2 512Unrated 21 – – 21Past due but not impaired 3 – – 3Non-performing individually impaired – 1 519 520
7,436 30 521 7,987Sales contract receivables
Unrated 117 – – 117Non-performing individually impaired – – 2 2
117 – 2 119(Forward)
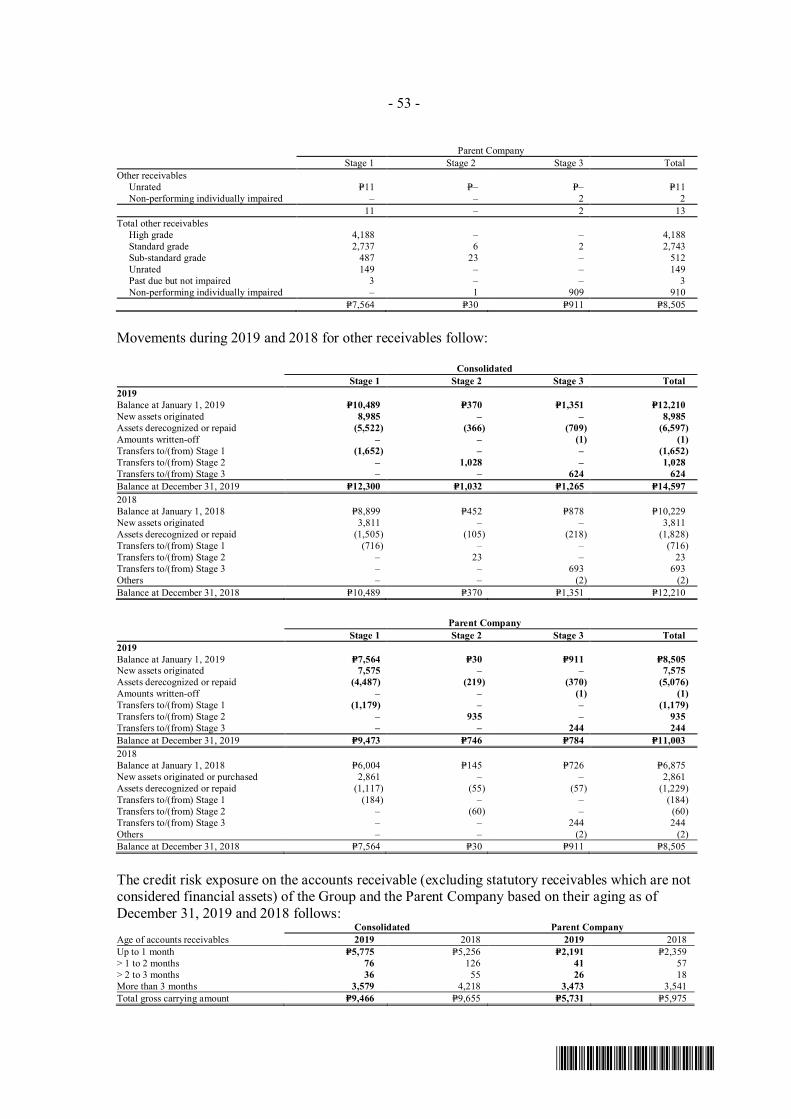
- 53 -
*SGVFS038804*
Parent CompanyStage 1 Stage 2 Stage 3 Total
Other receivablesUnrated P=11 P=– P=– P=11Non-performing individually impaired – – 2 2
11 – 2 13Total other receivables
High grade 4,188 – – 4,188Standard grade 2,737 6 2 2,743Sub-standard grade 487 23 – 512Unrated 149 – – 149Past due but not impaired 3 – – 3Non-performing individually impaired – 1 909 910
P=7,564 P=30 P=911 P=8,505
Movements during 2019 and 2018 for other receivables follow:
ConsolidatedStage 1 Stage 2 Stage 3 Total
2019Balance at January 1, 2019 P=10,489 P=370 P=1,351 P=12,210New assets originated 8,985 – – 8,985Assets derecognized or repaid (5,522) (366) (709) (6,597)Amounts written-off – – (1) (1)Transfers to/(from) Stage 1 (1,652) – – (1,652)Transfers to/(from) Stage 2 – 1,028 – 1,028Transfers to/(from) Stage 3 – – 624 624Balance at December 31, 2019 P=12,300 P=1,032 P=1,265 P=14,5972018Balance at January 1, 2018 P=8,899 P=452 P=878 P=10,229New assets originated 3,811 – – 3,811Assets derecognized or repaid (1,505) (105) (218) (1,828)Transfers to/(from) Stage 1 (716) – – (716)Transfers to/(from) Stage 2 – 23 – 23Transfers to/(from) Stage 3 – – 693 693Others – – (2) (2)Balance at December 31, 2018 P=10,489 P=370 P=1,351 P=12,210
Parent CompanyStage 1 Stage 2 Stage 3 Total
2019Balance at January 1, 2019 P=7,564 P=30 P=911 P=8,505New assets originated 7,575 – – 7,575Assets derecognized or repaid (4,487) (219) (370) (5,076)Amounts written-off – – (1) (1)Transfers to/(from) Stage 1 (1,179) – – (1,179)Transfers to/(from) Stage 2 – 935 – 935Transfers to/(from) Stage 3 – – 244 244Balance at December 31, 2019 P=9,473 P=746 P=784 P=11,0032018Balance at January 1, 2018 P=6,004 P=145 P=726 P=6,875New assets originated or purchased 2,861 – – 2,861Assets derecognized or repaid (1,117) (55) (57) (1,229)Transfers to/(from) Stage 1 (184) – – (184)Transfers to/(from) Stage 2 – (60) – (60)Transfers to/(from) Stage 3 – – 244 244Others – – (2) (2)Balance at December 31, 2018 P=7,564 P=30 P=911 P=8,505
The credit risk exposure on the accounts receivable (excluding statutory receivables which are notconsidered financial assets) of the Group and the Parent Company based on their aging as ofDecember 31, 2019 and 2018 follows:
Consolidated Parent CompanyAge of accounts receivables 2019 2018 2019 2018Up to 1 month P=5,775 P=5,256 P=2,191 P=2,359> 1 to 2 months 76 126 41 57> 2 to 3 months 36 55 26 18More than 3 months 3,579 4,218 3,473 3,541Total gross carrying amount P=9,466 P=9,655 P=5,731 P=5,975
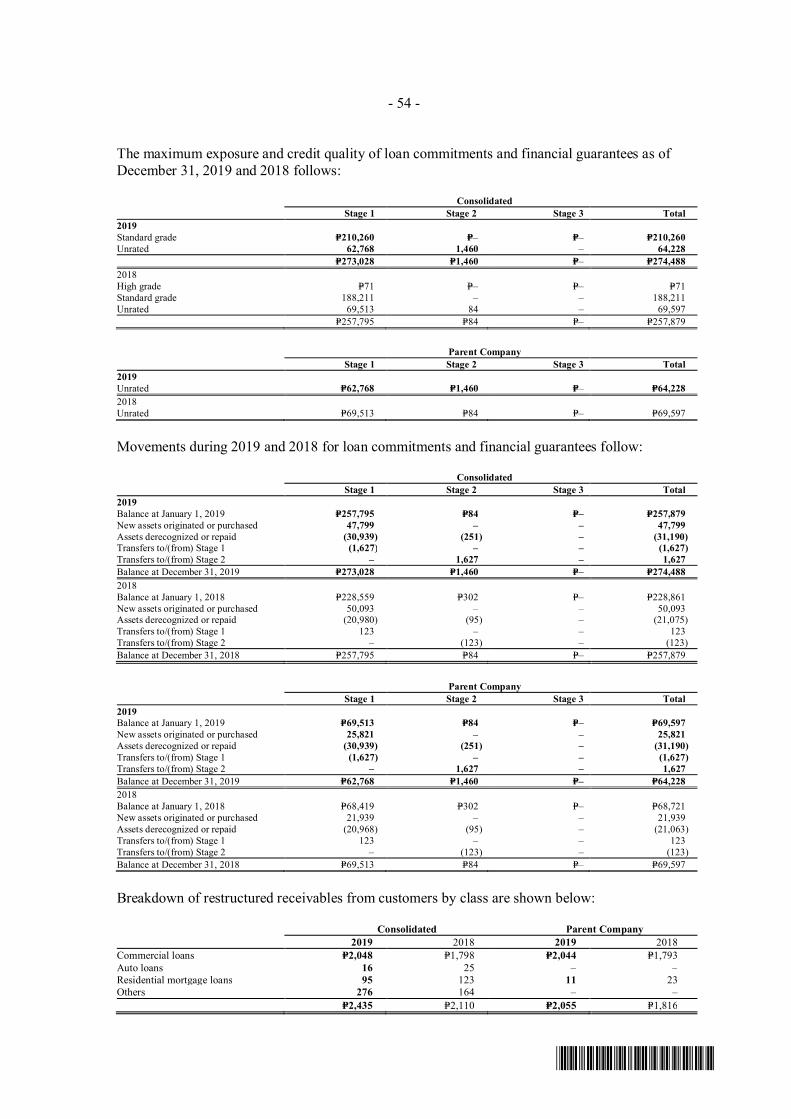
- 54 -
*SGVFS038804*
The maximum exposure and credit quality of loan commitments and financial guarantees as ofDecember 31, 2019 and 2018 follows:
ConsolidatedStage 1 Stage 2 Stage 3 Total
2019Standard grade P=210,260 P=– P=– P=210,260Unrated 62,768 1,460 – 64,228
P=273,028 P=1,460 P=– P=274,4882018High grade P=71 P=– P=– P=71Standard grade 188,211 – – 188,211Unrated 69,513 84 – 69,597
P=257,795 P=84 P=– P=257,879
Parent CompanyStage 1 Stage 2 Stage 3 Total
2019Unrated P=62,768 P=1,460 P=– P=64,2282018Unrated P=69,513 P=84 P=– P=69,597
Movements during 2019 and 2018 for loan commitments and financial guarantees follow:
ConsolidatedStage 1 Stage 2 Stage 3 Total
2019Balance at January 1, 2019 P=257,795 P=84 P=– P=257,879New assets originated or purchased 47,799 – – 47,799Assets derecognized or repaid (30,939) (251) – (31,190)Transfers to/(from) Stage 1 (1,627) – – (1,627)Transfers to/(from) Stage 2 – 1,627 – 1,627Balance at December 31, 2019 P=273,028 P=1,460 P=– P=274,4882018Balance at January 1, 2018 P=228,559 P=302 P=– P=228,861New assets originated or purchased 50,093 – – 50,093Assets derecognized or repaid (20,980) (95) – (21,075)Transfers to/(from) Stage 1 123 – – 123Transfers to/(from) Stage 2 – (123) – (123)Balance at December 31, 2018 P=257,795 P=84 P=– P=257,879
Parent CompanyStage 1 Stage 2 Stage 3 Total
2019Balance at January 1, 2019 P=69,513 P=84 P=– P=69,597New assets originated or purchased 25,821 – – 25,821Assets derecognized or repaid (30,939) (251) – (31,190)Transfers to/(from) Stage 1 (1,627) – – (1,627)Transfers to/(from) Stage 2 – 1,627 – 1,627Balance at December 31, 2019 P=62,768 P=1,460 P=– P=64,2282018Balance at January 1, 2018 P=68,419 P=302 P=– P=68,721New assets originated or purchased 21,939 – – 21,939Assets derecognized or repaid (20,968) (95) – (21,063)Transfers to/(from) Stage 1 123 – – 123Transfers to/(from) Stage 2 – (123) – (123)Balance at December 31, 2018 P=69,513 P=84 P=– P=69,597
Breakdown of restructured receivables from customers by class are shown below:
Consolidated Parent Company2019 2018 2019 2018
Commercial loans P=2,048 P=1,798 P=2,044 P=1,793Auto loans 16 25 ‒ ‒Residential mortgage loans 95 123 11 23Others 276 164 ‒ ‒
P=2,435 P=2,110 P=2,055 P=1,816
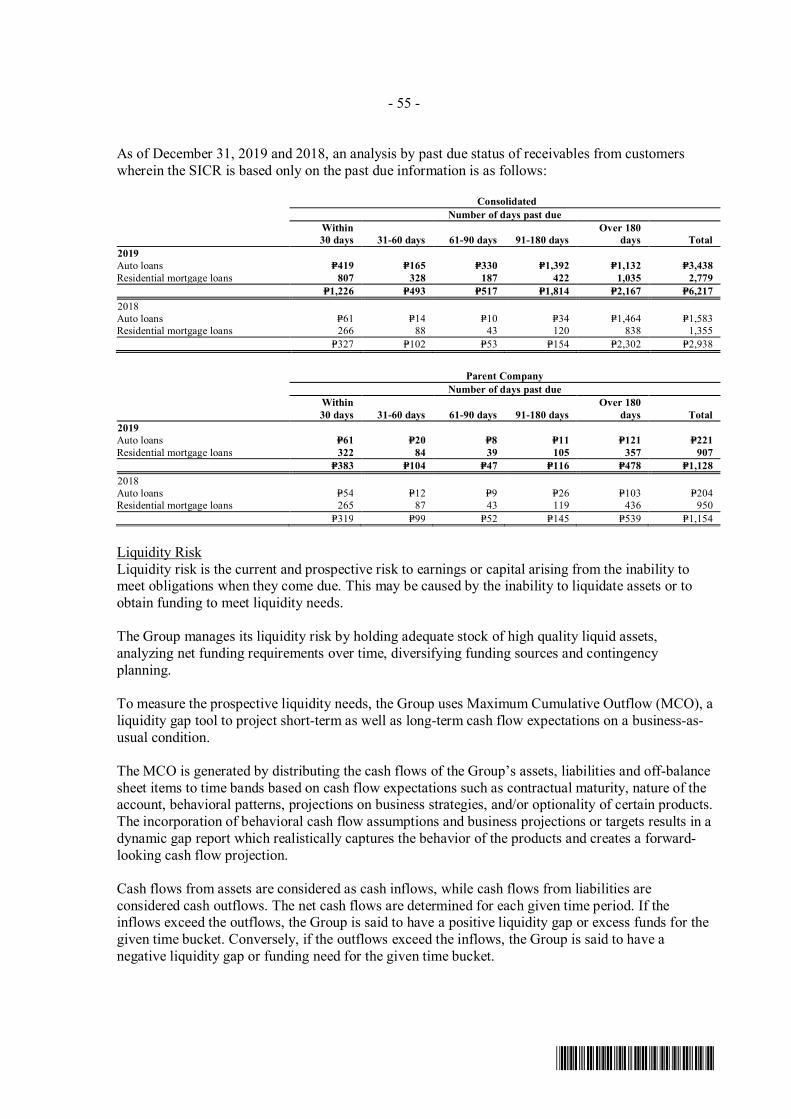
- 55 -
*SGVFS038804*
As of December 31, 2019 and 2018, an analysis by past due status of receivables from customerswherein the SICR is based only on the past due information is as follows:
ConsolidatedNumber of days past due
Within30 days 31-60 days 61-90 days 91-180 days
Over 180days Total
22019Auto loans P=419 P=165 P=330 P=1,392 P=1,132 P=3,438Residential mortgage loans 807 328 187 422 1,035 2,779
P=1,226 P=493 P=517 P=1,814 P=2,167 P=6,21722018Auto loans P=61 P=14 P=10 P=34 P=1,464 P=1,583Residential mortgage loans 266 88 43 120 838 1,355
P=327 P=102 P=53 P=154 P=2,302 P=2,938
Parent CompanyNumber of days past due
Within30 days 31-60 days 61-90 days 91-180 days
Over 180days Total
22019Auto loans P=61 P=20 P=8 P=11 P=121 P=221Residential mortgage loans 322 84 39 105 357 907
P=383 P=104 P=47 P=116 P=478 P=1,12822018Auto loans P=54 P=12 P=9 P=26 P=103 P=204Residential mortgage loans 265 87 43 119 436 950
P=319 P=99 P=52 P=145 P=539 P=1,154
Liquidity RiskLiquidity risk is the current and prospective risk to earnings or capital arising from the inability tomeet obligations when they come due. This may be caused by the inability to liquidate assets or toobtain funding to meet liquidity needs.
The Group manages its liquidity risk by holding adequate stock of high quality liquid assets,analyzing net funding requirements over time, diversifying funding sources and contingencyplanning.
To measure the prospective liquidity needs, the Group uses Maximum Cumulative Outflow (MCO), aliquidity gap tool to project short-term as well as long-term cash flow expectations on a business-as-usual condition.
The MCO is generated by distributing the cash flows of the Group’s assets, liabilities and off-balancesheet items to time bands based on cash flow expectations such as contractual maturity, nature of theaccount, behavioral patterns, projections on business strategies, and/or optionality of certain products.The incorporation of behavioral cash flow assumptions and business projections or targets results in adynamic gap report which realistically captures the behavior of the products and creates a forward-looking cash flow projection.
Cash flows from assets are considered as cash inflows, while cash flows from liabilities areconsidered cash outflows. The net cash flows are determined for each given time period. If theinflows exceed the outflows, the Group is said to have a positive liquidity gap or excess funds for thegiven time bucket. Conversely, if the outflows exceed the inflows, the Group is said to have anegative liquidity gap or funding need for the given time bucket.
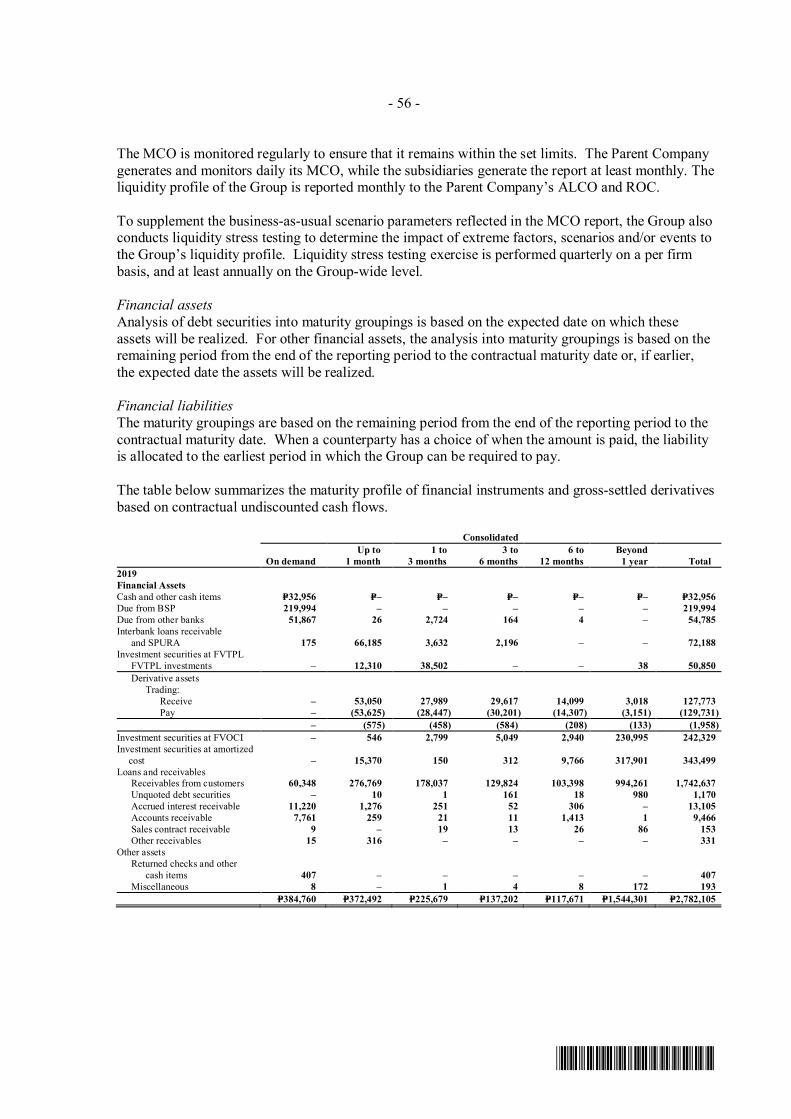
- 56 -
*SGVFS038804*
The MCO is monitored regularly to ensure that it remains within the set limits. The Parent Companygenerates and monitors daily its MCO, while the subsidiaries generate the report at least monthly. Theliquidity profile of the Group is reported monthly to the Parent Company’s ALCO and ROC.
To supplement the business-as-usual scenario parameters reflected in the MCO report, the Group alsoconducts liquidity stress testing to determine the impact of extreme factors, scenarios and/or events tothe Group’s liquidity profile. Liquidity stress testing exercise is performed quarterly on a per firmbasis, and at least annually on the Group-wide level.
Financial assetsAnalysis of debt securities into maturity groupings is based on the expected date on which theseassets will be realized. For other financial assets, the analysis into maturity groupings is based on theremaining period from the end of the reporting period to the contractual maturity date or, if earlier,the expected date the assets will be realized.
Financial liabilitiesThe maturity groupings are based on the remaining period from the end of the reporting period to thecontractual maturity date. When a counterparty has a choice of when the amount is paid, the liabilityis allocated to the earliest period in which the Group can be required to pay.
The table below summarizes the maturity profile of financial instruments and gross-settled derivativesbased on contractual undiscounted cash flows.
Consolidated
On demandUp to
1 month1 to
3 months3 to
6 months6 to
12 monthsBeyond
1 year Total2019Financial AssetsCash and other cash items P=32,956 P=– P=– P=– P=– P=– P=32,956Due from BSP 219,994 – – – – – 219,994Due from other banks 51,867 26 2,724 164 4 – 54,785Interbank loans receivable
and SPURA 175 66,185 3,632 2,196 – – 72,188Investment securities at FVTPL FVTPL investments – 12,310 38,502 – – 38 50,850 Derivative assets
Trading: Receive – 53,050 27,989 29,617 14,099 3,018 127,773 Pay – (53,625) (28,447) (30,201) (14,307) (3,151) (129,731)
– (575) (458) (584) (208) (133) (1,958)Investment securities at FVOCI – 546 2,799 5,049 2,940 230,995 242,329Investment securities at amortized
cost – 15,370 150 312 9,766 317,901 343,499Loans and receivables Receivables from customers 60,348 276,769 178,037 129,824 103,398 994,261 1,742,637 Unquoted debt securities – 10 1 161 18 980 1,170 Accrued interest receivable 11,220 1,276 251 52 306 – 13,105 Accounts receivable 7,761 259 21 11 1,413 1 9,466 Sales contract receivable 9 – 19 13 26 86 153 Other receivables 15 316 – – – – 331Other assets Returned checks and other
cash items 407 – – – – – 407 Miscellaneous 8 – 1 4 8 172 193
P=384,760 P=372,492 P=225,679 P=137,202 P=117,671 P=1,544,301 P=2,782,105
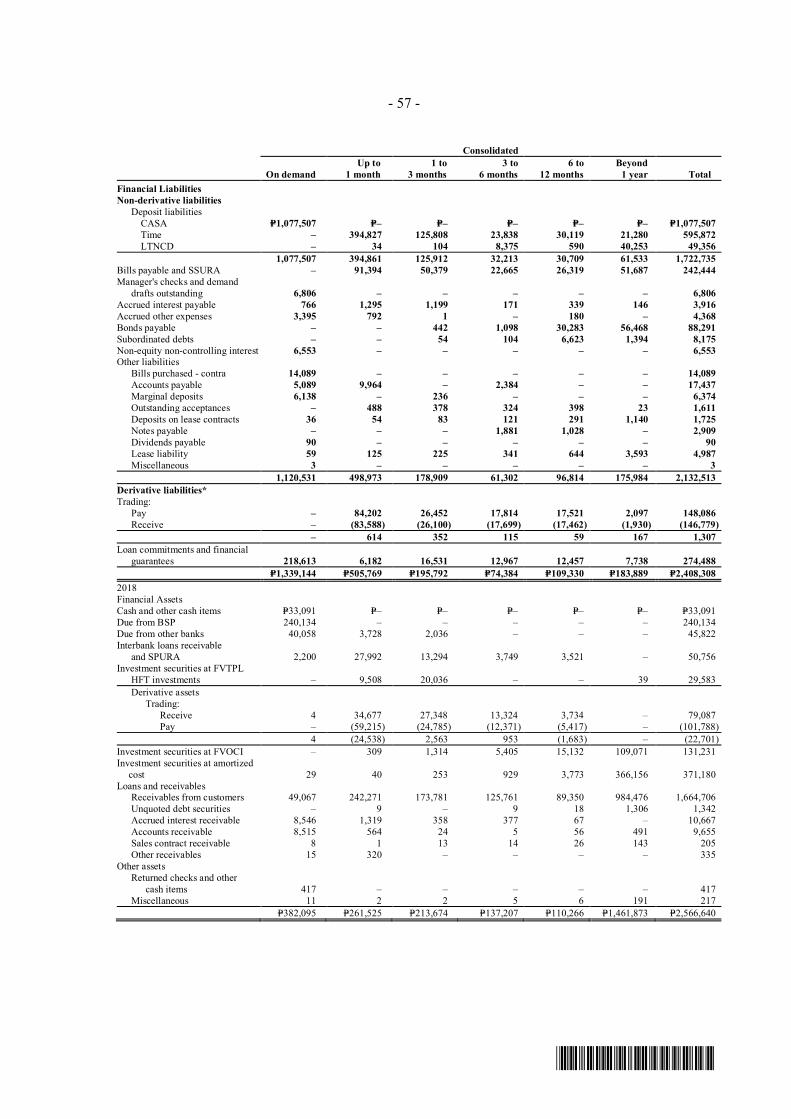
- 57 -
*SGVFS038804*
Consolidated
On demandUp to
1 month1 to
3 months3 to
6 months6 to
12 monthsBeyond
1 year TotalFinancial LiabilitiesNon-derivative liabilities Deposit liabilities CASA P=1,077,507 P=– P=– P=– P=– P=– P=1,077,507 Time – 394,827 125,808 23,838 30,119 21,280 595,872
LTNCD – 34 104 8,375 590 40,253 49,3561,077,507 394,861 125,912 32,213 30,709 61,533 1,722,735
Bills payable and SSURA – 91,394 50,379 22,665 26,319 51,687 242,444Manager's checks and demand drafts outstanding 6,806 – – – – – 6,806Accrued interest payable 766 1,295 1,199 171 339 146 3,916Accrued other expenses 3,395 792 1 – 180 – 4,368Bonds payable – – 442 1,098 30,283 56,468 88,291Subordinated debts – – 54 104 6,623 1,394 8,175Non-equity non-controlling interest 6,553 – – – – – 6,553Other liabilities Bills purchased - contra 14,089 – – – – – 14,089 Accounts payable 5,089 9,964 – 2,384 – – 17,437 Marginal deposits 6,138 – 236 – – – 6,374 Outstanding acceptances – 488 378 324 398 23 1,611 Deposits on lease contracts 36 54 83 121 291 1,140 1,725 Notes payable – – – 1,881 1,028 – 2,909 Dividends payable 90 – – – – – 90
Lease liability 59 125 225 341 644 3,593 4,987Miscellaneous 3 – – – – – 3
1,120,531 498,973 178,909 61,302 96,814 175,984 2,132,513Derivative liabilities*Trading: Pay – 84,202 26,452 17,814 17,521 2,097 148,086 Receive – (83,588) (26,100) (17,699) (17,462) (1,930) (146,779)
– 614 352 115 59 167 1,307Loan commitments and financial guarantees 218,613 6,182 16,531 12,967 12,457 7,738 274,488
P=1,339,144 P=505,769 P=195,792 P=74,384 P=109,330 P=183,889 P=2,408,3082018Financial AssetsCash and other cash items P=33,091 P=– P=– P=– P=– P=– P=33,091Due from BSP 240,134 – – – – – 240,134Due from other banks 40,058 3,728 2,036 ‒ ‒ – 45,822Interbank loans receivable
and SPURA 2,200 27,992 13,294 3,749 3,521 – 50,756Investment securities at FVTPL HFT investments – 9,508 20,036 – – 39 29,583 Derivative assets
Trading: Receive 4 34,677 27,348 13,324 3,734 – 79,087 Pay – (59,215) (24,785) (12,371) (5,417) – (101,788)
4 (24,538) 2,563 953 (1,683) – (22,701)Investment securities at FVOCI – 309 1,314 5,405 15,132 109,071 131,231Investment securities at amortized
cost 29 40 253 929 3,773 366,156 371,180Loans and receivables Receivables from customers 49,067 242,271 173,781 125,761 89,350 984,476 1,664,706 Unquoted debt securities ‒ 9 ‒ 9 18 1,306 1,342 Accrued interest receivable 8,546 1,319 358 377 67 ‒ 10,667 Accounts receivable 8,515 564 24 5 56 491 9,655 Sales contract receivable 8 1 13 14 26 143 205 Other receivables 15 320 – – – – 335Other assets Returned checks and other
cash items 417 – ‒ – – – 417 Miscellaneous 11 2 2 5 6 191 217
P=382,095 P=261,525 P=213,674 P=137,207 P=110,266 P=1,461,873 P=2,566,640
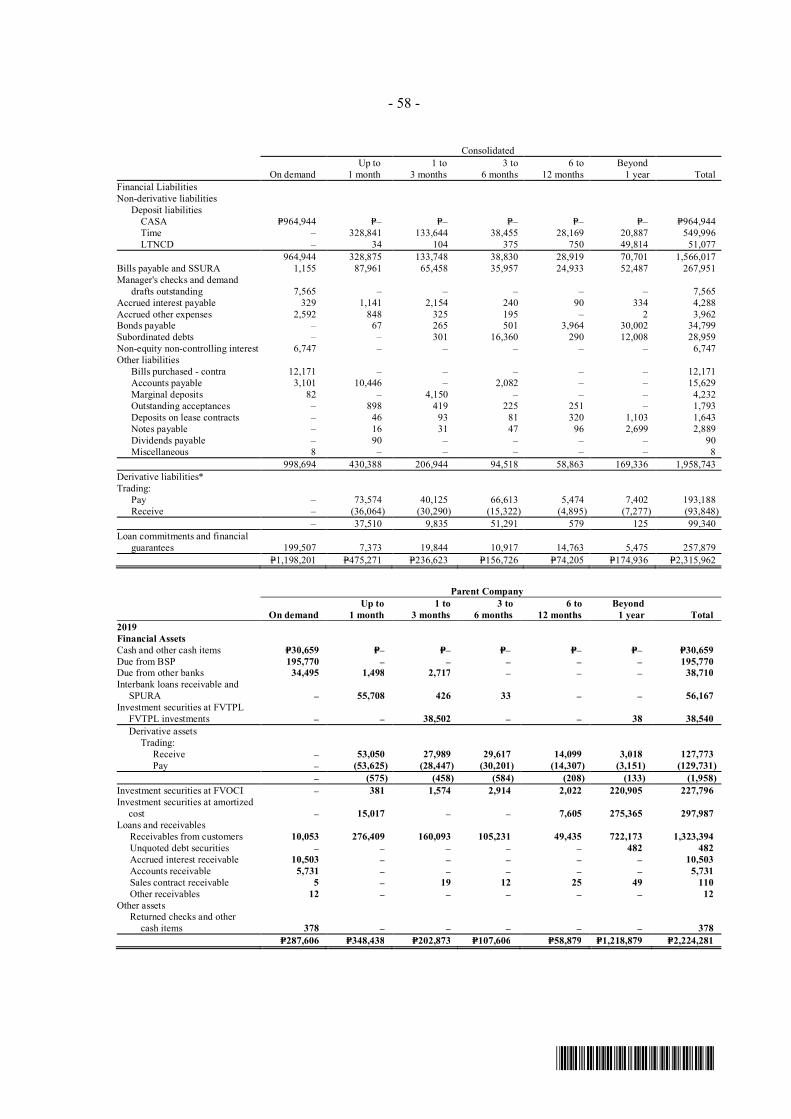
- 58 -
*SGVFS038804*
Consolidated
On demandUp to
1 month1 to
3 months3 to
6 months6 to
12 monthsBeyond
1 year TotalFinancial LiabilitiesNon-derivative liabilities Deposit liabilities CASA P=964,944 P=– P=– P=– P=– P=– P=964,944 Time – 328,841 133,644 38,455 28,169 20,887 549,996
LTNCD ‒ 34 104 375 750 49,814 51,077964,944 328,875 133,748 38,830 28,919 70,701 1,566,017
Bills payable and SSURA 1,155 87,961 65,458 35,957 24,933 52,487 267,951Manager's checks and demand drafts outstanding 7,565 – – – – – 7,565Accrued interest payable 329 1,141 2,154 240 90 334 4,288Accrued other expenses 2,592 848 325 195 – 2 3,962Bonds payable ‒ 67 265 501 3,964 30,002 34,799Subordinated debts ‒ ‒ 301 16,360 290 12,008 28,959Non-equity non-controlling interest 6,747 – – – – – 6,747Other liabilities Bills purchased - contra 12,171 – – – – – 12,171 Accounts payable 3,101 10,446 ‒ 2,082 – – 15,629 Marginal deposits 82 ‒ 4,150 – – – 4,232 Outstanding acceptances – 898 419 225 251 ‒ 1,793 Deposits on lease contracts – 46 93 81 320 1,103 1,643 Notes payable – 16 31 47 96 2,699 2,889 Dividends payable – 90 – – – – 90
Miscellaneous 8 – – – – – 8998,694 430,388 206,944 94,518 58,863 169,336 1,958,743
Derivative liabilities*Trading: Pay – 73,574 40,125 66,613 5,474 7,402 193,188 Receive – (36,064) (30,290) (15,322) (4,895) (7,277) (93,848)
– 37,510 9,835 51,291 579 125 99,340Loan commitments and financial guarantees 199,507 7,373 19,844 10,917 14,763 5,475 257,879
P=1,198,201 P=475,271 P=236,623 P=156,726 P=74,205 P=174,936 P=2,315,962
Parent Company
On demandUp to
1 month1 to
3 months3 to
6 months6 to
12 monthsBeyond
1 year Total2019Financial AssetsCash and other cash items P=30,659 P=– P=– P=– P=– P=– P=30,659Due from BSP 195,770 – – – – – 195,770Due from other banks 34,495 1,498 2,717 – – – 38,710Interbank loans receivable and
SPURA – 55,708 426 33 – – 56,167Investment securities at FVTPL FVTPL investments – – 38,502 – – 38 38,540 Derivative assets Trading: Receive – 53,050 27,989 29,617 14,099 3,018 127,773 Pay – (53,625) (28,447) (30,201) (14,307) (3,151) (129,731)
– (575) (458) (584) (208) (133) (1,958)Investment securities at FVOCI – 381 1,574 2,914 2,022 220,905 227,796Investment securities at amortized
cost – 15,017 – – 7,605 275,365 297,987Loans and receivables Receivables from customers 10,053 276,409 160,093 105,231 49,435 722,173 1,323,394 Unquoted debt securities – – – – – 482 482 Accrued interest receivable 10,503 – – – – – 10,503 Accounts receivable 5,731 – – – – – 5,731 Sales contract receivable 5 – 19 12 25 49 110 Other receivables 12 – – – – – 12Other assets Returned checks and other
cash items 378 – – – – – 378P=287,606 P=348,438 P=202,873 P=107,606 P=58,879 P=1,218,879 P=2,224,281
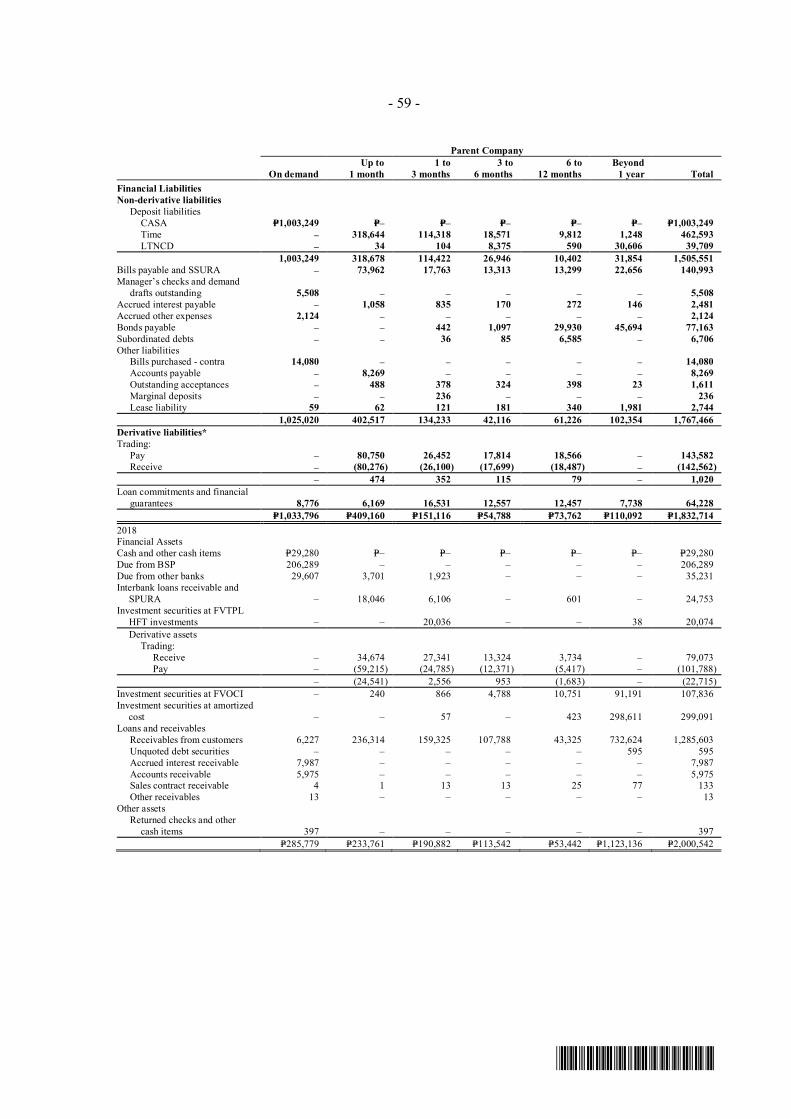
- 59 -
*SGVFS038804*
Parent Company
On demandUp to
1 month1 to
3 months3 to
6 months6 to
12 monthsBeyond
1 year TotalFinancial LiabilitiesNon-derivative liabilities Deposit liabilities CASA P=1,003,249 P=– P=– P=– P=– P=– P=1,003,249 Time – 318,644 114,318 18,571 9,812 1,248 462,593
LTNCD – 34 104 8,375 590 30,606 39,7091,003,249 318,678 114,422 26,946 10,402 31,854 1,505,551
Bills payable and SSURA – 73,962 17,763 13,313 13,299 22,656 140,993Manager’s checks and demand drafts outstanding 5,508 – – – – – 5,508Accrued interest payable – 1,058 835 170 272 146 2,481Accrued other expenses 2,124 – – – – – 2,124Bonds payable – – 442 1,097 29,930 45,694 77,163Subordinated debts – – 36 85 6,585 – 6,706Other liabilities Bills purchased - contra 14,080 – – – – – 14,080 Accounts payable – 8,269 – – – – 8,269 Outstanding acceptances – 488 378 324 398 23 1,611 Marginal deposits – – 236 – – – 236 Lease liability 59 62 121 181 340 1,981 2,744
1,025,020 402,517 134,233 42,116 61,226 102,354 1,767,466Derivative liabilities*Trading: Pay – 80,750 26,452 17,814 18,566 – 143,582 Receive – (80,276) (26,100) (17,699) (18,487) – (142,562)
– 474 352 115 79 – 1,020Loan commitments and financial guarantees 8,776 6,169 16,531 12,557 12,457 7,738 64,228
P=1,033,796 P=409,160 P=151,116 P=54,788 P=73,762 P=110,092 P=1,832,7142018Financial AssetsCash and other cash items P=29,280 P=– P=– P=– P=– P=– P=29,280Due from BSP 206,289 – – – – – 206,289Due from other banks 29,607 3,701 1,923 – – – 35,231Interbank loans receivable and
SPURA – 18,046 6,106 – 601 – 24,753Investment securities at FVTPL HFT investments – – 20,036 – – 38 20,074 Derivative assets Trading: Receive – 34,674 27,341 13,324 3,734 – 79,073 Pay – (59,215) (24,785) (12,371) (5,417) – (101,788)
– (24,541) 2,556 953 (1,683) – (22,715)Investment securities at FVOCI – 240 866 4,788 10,751 91,191 107,836Investment securities at amortized
cost – – 57 – 423 298,611 299,091Loans and receivables Receivables from customers 6,227 236,314 159,325 107,788 43,325 732,624 1,285,603 Unquoted debt securities – – – – – 595 595 Accrued interest receivable 7,987 – – – – – 7,987 Accounts receivable 5,975 – – – – – 5,975 Sales contract receivable 4 1 13 13 25 77 133 Other receivables 13 – – – – – 13Other assets Returned checks and other
cash items 397 – ‒ – – – 397P=285,779 P=233,761 P=190,882 P=113,542 P=53,442 P=1,123,136 P=2,000,542
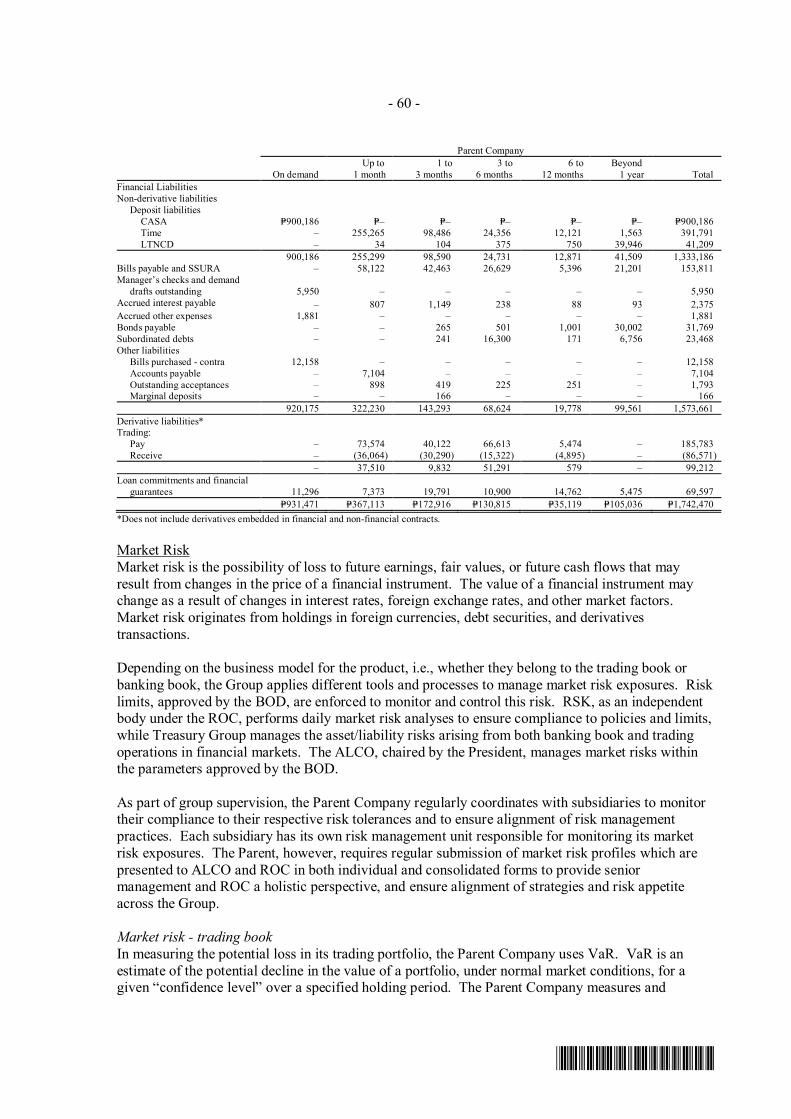
- 60 -
*SGVFS038804*
Parent Company
On demandUp to
1 month1 to
3 months3 to
6 months6 to
12 monthsBeyond
1 year TotalFinancial LiabilitiesNon-derivative liabilities Deposit liabilities CASA P=900,186 P=– P=– P=– P=– P=– P=900,186 Time – 255,265 98,486 24,356 12,121 1,563 391,791
LTNCD – 34 104 375 750 39,946 41,209900,186 255,299 98,590 24,731 12,871 41,509 1,333,186
Bills payable and SSURA – 58,122 42,463 26,629 5,396 21,201 153,811Manager’s checks and demand drafts outstanding 5,950 – – – – – 5,950Accrued interest payable – 807 1,149 238 88 93 2,375Accrued other expenses 1,881 – – – – – 1,881Bonds payable – – 265 501 1,001 30,002 31,769Subordinated debts – – 241 16,300 171 6,756 23,468Other liabilities Bills purchased - contra 12,158 – – – – – 12,158 Accounts payable – 7,104 – – – – 7,104 Outstanding acceptances – 898 419 225 251 – 1,793 Marginal deposits – – 166 – – – 166
920,175 322,230 143,293 68,624 19,778 99,561 1,573,661Derivative liabilities*Trading: Pay – 73,574 40,122 66,613 5,474 – 185,783 Receive – (36,064) (30,290) (15,322) (4,895) – (86,571)
– 37,510 9,832 51,291 579 – 99,212Loan commitments and financial guarantees 11,296 7,373 19,791 10,900 14,762 5,475 69,597
P=931,471 P=367,113 P=172,916 P=130,815 P=35,119 P=105,036 P=1,742,470*Does not include derivatives embedded in financial and non-financial contracts.
Market RiskMarket risk is the possibility of loss to future earnings, fair values, or future cash flows that mayresult from changes in the price of a financial instrument. The value of a financial instrument maychange as a result of changes in interest rates, foreign exchange rates, and other market factors.Market risk originates from holdings in foreign currencies, debt securities, and derivativestransactions.
Depending on the business model for the product, i.e., whether they belong to the trading book orbanking book, the Group applies different tools and processes to manage market risk exposures. Risklimits, approved by the BOD, are enforced to monitor and control this risk. RSK, as an independentbody under the ROC, performs daily market risk analyses to ensure compliance to policies and limits,while Treasury Group manages the asset/liability risks arising from both banking book and tradingoperations in financial markets. The ALCO, chaired by the President, manages market risks withinthe parameters approved by the BOD.
As part of group supervision, the Parent Company regularly coordinates with subsidiaries to monitortheir compliance to their respective risk tolerances and to ensure alignment of risk managementpractices. Each subsidiary has its own risk management unit responsible for monitoring its marketrisk exposures. The Parent, however, requires regular submission of market risk profiles which arepresented to ALCO and ROC in both individual and consolidated forms to provide seniormanagement and ROC a holistic perspective, and ensure alignment of strategies and risk appetiteacross the Group.
Market risk - trading bookIn measuring the potential loss in its trading portfolio, the Parent Company uses VaR. VaR is anestimate of the potential decline in the value of a portfolio, under normal market conditions, for agiven “confidence level” over a specified holding period. The Parent Company measures and
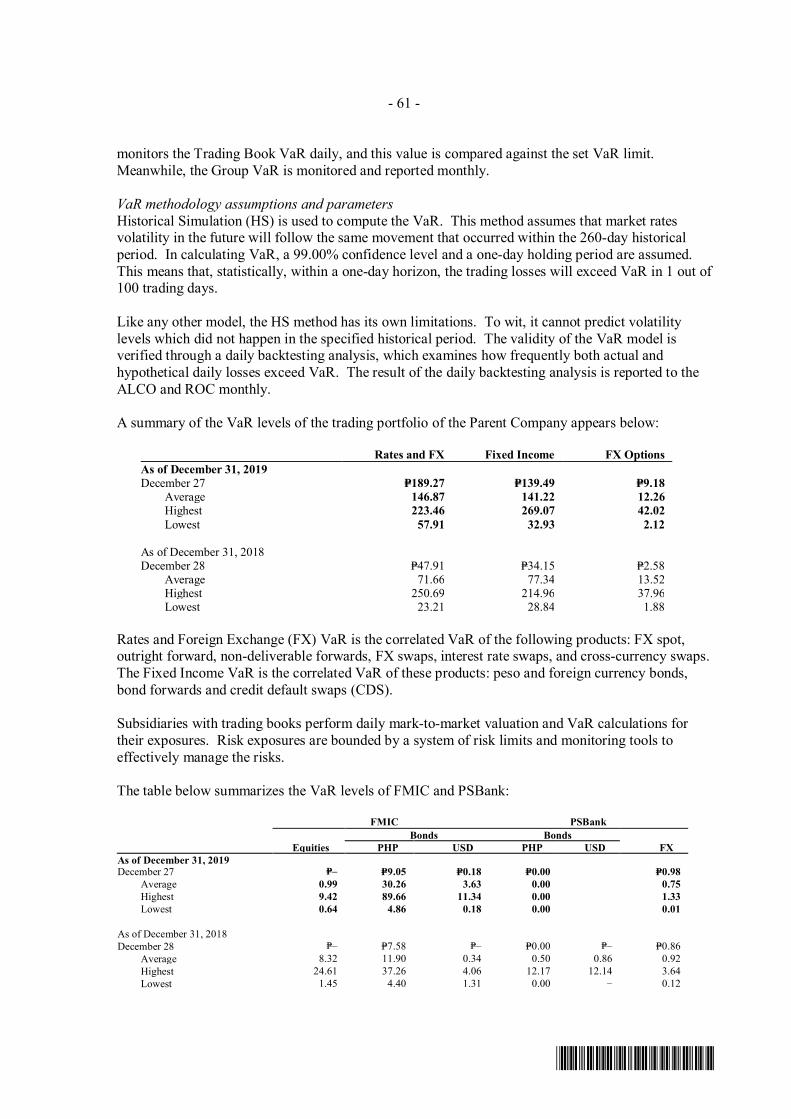
- 61 -
*SGVFS038804*
monitors the Trading Book VaR daily, and this value is compared against the set VaR limit.Meanwhile, the Group VaR is monitored and reported monthly.
VaR methodology assumptions and parametersHistorical Simulation (HS) is used to compute the VaR. This method assumes that market ratesvolatility in the future will follow the same movement that occurred within the 260-day historicalperiod. In calculating VaR, a 99.00% confidence level and a one-day holding period are assumed.This means that, statistically, within a one-day horizon, the trading losses will exceed VaR in 1 out of100 trading days.
Like any other model, the HS method has its own limitations. To wit, it cannot predict volatilitylevels which did not happen in the specified historical period. The validity of the VaR model isverified through a daily backtesting analysis, which examines how frequently both actual andhypothetical daily losses exceed VaR. The result of the daily backtesting analysis is reported to theALCO and ROC monthly.
A summary of the VaR levels of the trading portfolio of the Parent Company appears below:
Rates and FX Fixed Income FX OptionsAs of December 31, 2019December 27 P=189.27 P=139.49 P=9.18
Average 146.87 141.22 12.26 Highest 223.46 269.07 42.02
Lowest 57.91 32.93 2.12
As of December 31, 2018December 28 P=47.91 P=34.15 P=2.58
Average 71.66 77.34 13.52Highest 250.69 214.96 37.96Lowest 23.21 28.84 1.88
Rates and Foreign Exchange (FX) VaR is the correlated VaR of the following products: FX spot,outright forward, non-deliverable forwards, FX swaps, interest rate swaps, and cross-currency swaps.The Fixed Income VaR is the correlated VaR of these products: peso and foreign currency bonds,bond forwards and credit default swaps (CDS).
Subsidiaries with trading books perform daily mark-to-market valuation and VaR calculations fortheir exposures. Risk exposures are bounded by a system of risk limits and monitoring tools toeffectively manage the risks.
The table below summarizes the VaR levels of FMIC and PSBank:
FMIC PSBankBonds Bonds
Equities PHP USD PHP USD FXAs of December 31, 2019December 27 P=– P=9.05 P=0.18 P=0.00 P=0.98
Average 0.99 30.26 3.63 0.00 0.75Highest 9.42 89.66 11.34 0.00 1.33Lowest 0.64 4.86 0.18 0.00 0.01
As of December 31, 2018December 28 P=– P=7.58 P=– P=0.00 P=– P=0.86
Average 8.32 11.90 0.34 0.50 0.86 0.92Highest 24.61 37.26 4.06 12.17 12.14 3.64Lowest 1.45 4.40 1.31 0.00 – 0.12
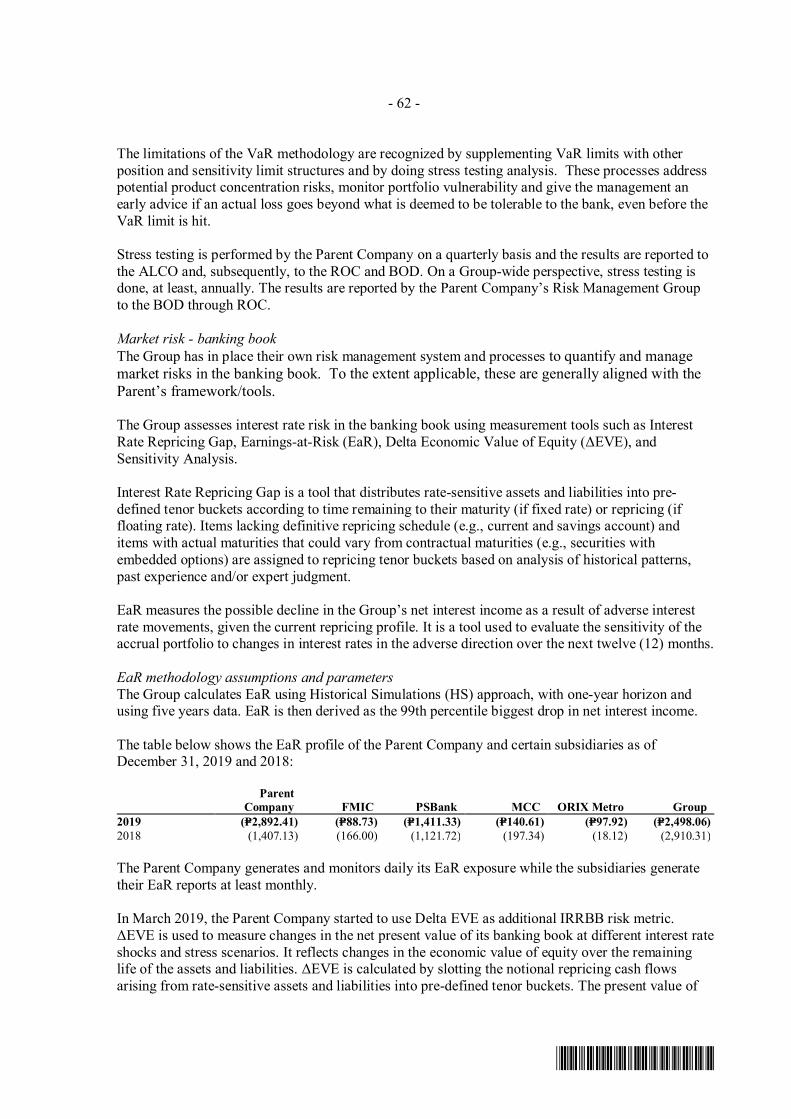
- 62 -
*SGVFS038804*
The limitations of the VaR methodology are recognized by supplementing VaR limits with otherposition and sensitivity limit structures and by doing stress testing analysis. These processes addresspotential product concentration risks, monitor portfolio vulnerability and give the management anearly advice if an actual loss goes beyond what is deemed to be tolerable to the bank, even before theVaR limit is hit.
Stress testing is performed by the Parent Company on a quarterly basis and the results are reported tothe ALCO and, subsequently, to the ROC and BOD. On a Group-wide perspective, stress testing isdone, at least, annually. The results are reported by the Parent Company’s Risk Management Groupto the BOD through ROC.
Market risk - banking bookThe Group has in place their own risk management system and processes to quantify and managemarket risks in the banking book. To the extent applicable, these are generally aligned with theParent’s framework/tools.
The Group assesses interest rate risk in the banking book using measurement tools such as InterestRate Repricing Gap, Earnings-at-Risk (EaR), Delta Economic Value of Equity (ΔEVE), andSensitivity Analysis.
Interest Rate Repricing Gap is a tool that distributes rate-sensitive assets and liabilities into pre-defined tenor buckets according to time remaining to their maturity (if fixed rate) or repricing (iffloating rate). Items lacking definitive repricing schedule (e.g., current and savings account) anditems with actual maturities that could vary from contractual maturities (e.g., securities withembedded options) are assigned to repricing tenor buckets based on analysis of historical patterns,past experience and/or expert judgment.
EaR measures the possible decline in the Group’s net interest income as a result of adverse interestrate movements, given the current repricing profile. It is a tool used to evaluate the sensitivity of theaccrual portfolio to changes in interest rates in the adverse direction over the next twelve (12) months.
EaR methodology assumptions and parametersThe Group calculates EaR using Historical Simulations (HS) approach, with one-year horizon andusing five years data. EaR is then derived as the 99th percentile biggest drop in net interest income.
The table below shows the EaR profile of the Parent Company and certain subsidiaries as ofDecember 31, 2019 and 2018:
ParentCompany FMIC PSBank MCC ORIX Metro Group
2019 (P=2,892.41) (P=88.73) (P=1,411.33) (P=140.61) (P=97.92) (P=2,498.06)2018 (1,407.13) (166.00) (1,121.72) (197.34) (18.12) (2,910.31)
The Parent Company generates and monitors daily its EaR exposure while the subsidiaries generatetheir EaR reports at least monthly.
In March 2019, the Parent Company started to use Delta EVE as additional IRRBB risk metric.ΔEVE is used to measure changes in the net present value of its banking book at different interest rateshocks and stress scenarios. It reflects changes in the economic value of equity over the remaininglife of the assets and liabilities. ΔEVE is calculated by slotting the notional repricing cash flowsarising from rate-sensitive assets and liabilities into pre-defined tenor buckets. The present value of
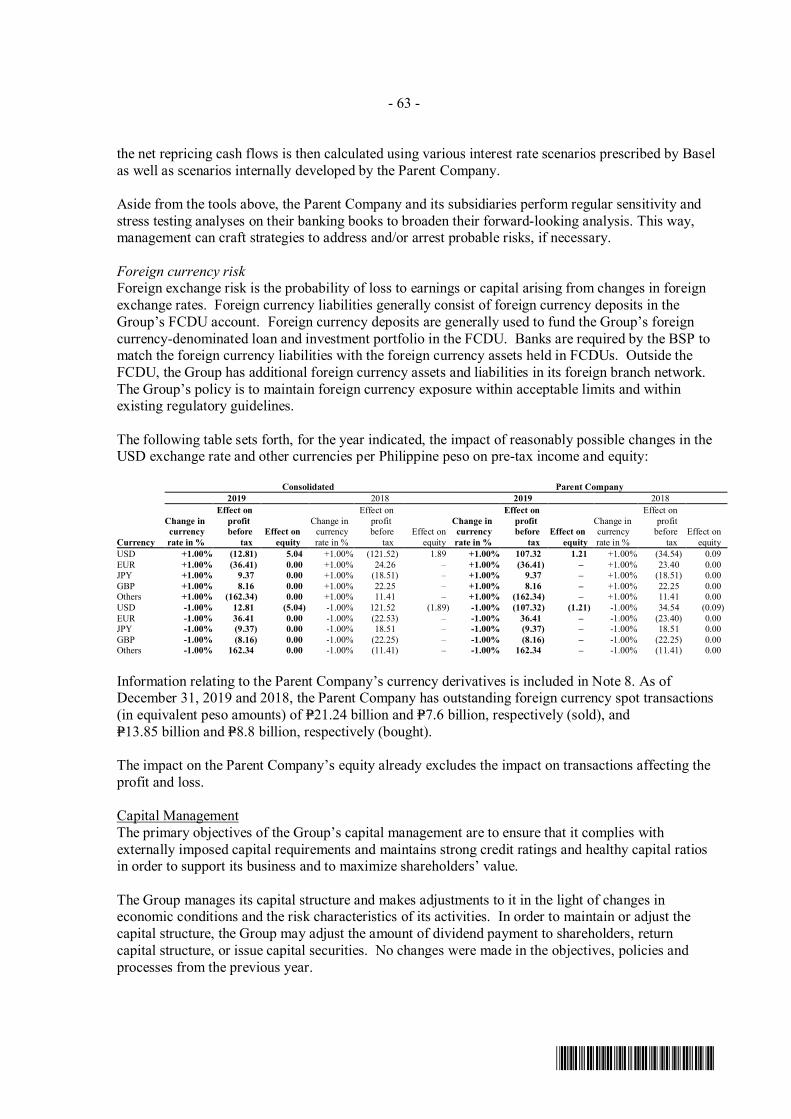
- 63 -
*SGVFS038804*
the net repricing cash flows is then calculated using various interest rate scenarios prescribed by Baselas well as scenarios internally developed by the Parent Company.
Aside from the tools above, the Parent Company and its subsidiaries perform regular sensitivity andstress testing analyses on their banking books to broaden their forward-looking analysis. This way,management can craft strategies to address and/or arrest probable risks, if necessary.
Foreign currency riskForeign exchange risk is the probability of loss to earnings or capital arising from changes in foreignexchange rates. Foreign currency liabilities generally consist of foreign currency deposits in theGroup’s FCDU account. Foreign currency deposits are generally used to fund the Group’s foreigncurrency-denominated loan and investment portfolio in the FCDU. Banks are required by the BSP tomatch the foreign currency liabilities with the foreign currency assets held in FCDUs. Outside theFCDU, the Group has additional foreign currency assets and liabilities in its foreign branch network.The Group’s policy is to maintain foreign currency exposure within acceptable limits and withinexisting regulatory guidelines.
The following table sets forth, for the year indicated, the impact of reasonably possible changes in theUSD exchange rate and other currencies per Philippine peso on pre-tax income and equity:
Consolidated Parent Company2019 2018 2019 2018
Currency
Change incurrencyrate in %
Effect onprofitbefore
taxEffect on
equity
Change incurrencyrate in %
Effect onprofitbefore
taxEffect on
equity
Change incurrencyrate in %
Effect onprofitbefore
taxEffect on
equity
Change incurrencyrate in %
Effect onprofit
beforetax
Effect onequity
USD +1.00% (12.81) 5.04 +1.00% (121.52) 1.89 +1.00% 107.32 1.21 +1.00% (34.54) 0.09EUR +1.00% (36.41) 0.00 +1.00% 24.26 – +1.00% (36.41) – +1.00% 23.40 0.00JPY +1.00% 9.37 0.00 +1.00% (18.51) – +1.00% 9.37 – +1.00% (18.51) 0.00GBP +1.00% 8.16 0.00 +1.00% 22.25 – +1.00% 8.16 – +1.00% 22.25 0.00Others +1.00% (162.34) 0.00 +1.00% 11.41 – +1.00% (162.34) – +1.00% 11.41 0.00USD -1.00% 12.81 (5.04) -1.00% 121.52 (1.89) -1.00% (107.32) (1.21) -1.00% 34.54 (0.09)EUR -1.00% 36.41 0.00 -1.00% (22.53) – -1.00% 36.41 – -1.00% (23.40) 0.00JPY -1.00% (9.37) 0.00 -1.00% 18.51 – -1.00% (9.37) – -1.00% 18.51 0.00GBP -1.00% (8.16) 0.00 -1.00% (22.25) – -1.00% (8.16) – -1.00% (22.25) 0.00Others -1.00% 162.34 0.00 -1.00% (11.41) – -1.00% 162.34 – -1.00% (11.41) 0.00
Information relating to the Parent Company’s currency derivatives is included in Note 8. As ofDecember 31, 2019 and 2018, the Parent Company has outstanding foreign currency spot transactions(in equivalent peso amounts) of P=21.24 billion and P=7.6 billion, respectively (sold), andP=13.85 billion and P=8.8 billion, respectively (bought).
The impact on the Parent Company’s equity already excludes the impact on transactions affecting theprofit and loss.
Capital ManagementThe primary objectives of the Group’s capital management are to ensure that it complies withexternally imposed capital requirements and maintains strong credit ratings and healthy capital ratiosin order to support its business and to maximize shareholders’ value.
The Group manages its capital structure and makes adjustments to it in the light of changes ineconomic conditions and the risk characteristics of its activities. In order to maintain or adjust thecapital structure, the Group may adjust the amount of dividend payment to shareholders, returncapital structure, or issue capital securities. No changes were made in the objectives, policies andprocesses from the previous year.
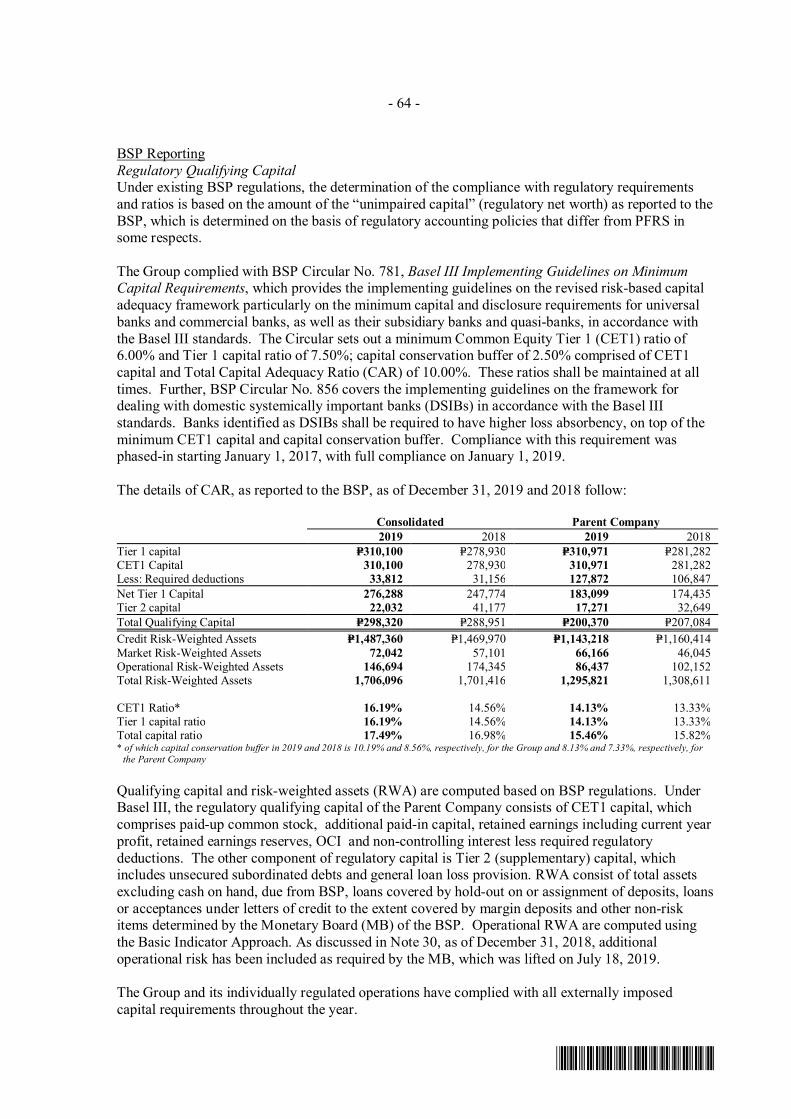
- 64 -
*SGVFS038804*
BSP ReportingRegulatory Qualifying CapitalUnder existing BSP regulations, the determination of the compliance with regulatory requirementsand ratios is based on the amount of the “unimpaired capital” (regulatory net worth) as reported to theBSP, which is determined on the basis of regulatory accounting policies that differ from PFRS insome respects.
The Group complied with BSP Circular No. 781, Basel III Implementing Guidelines on MinimumCapital Requirements, which provides the implementing guidelines on the revised risk-based capitaladequacy framework particularly on the minimum capital and disclosure requirements for universalbanks and commercial banks, as well as their subsidiary banks and quasi-banks, in accordance withthe Basel III standards. The Circular sets out a minimum Common Equity Tier 1 (CET1) ratio of6.00% and Tier 1 capital ratio of 7.50%; capital conservation buffer of 2.50% comprised of CET1capital and Total Capital Adequacy Ratio (CAR) of 10.00%. These ratios shall be maintained at alltimes. Further, BSP Circular No. 856 covers the implementing guidelines on the framework fordealing with domestic systemically important banks (DSIBs) in accordance with the Basel IIIstandards. Banks identified as DSIBs shall be required to have higher loss absorbency, on top of theminimum CET1 capital and capital conservation buffer. Compliance with this requirement wasphased-in starting January 1, 2017, with full compliance on January 1, 2019.
The details of CAR, as reported to the BSP, as of December 31, 2019 and 2018 follow:
Consolidated Parent Company2019 2018 2019 2018
Tier 1 capital P=310,100 P=278,930 P=310,971 P=281,282CET1 Capital 310,100 278,930 310,971 281,282Less: Required deductions 33,812 31,156 127,872 106,847Net Tier 1 Capital 276,288 247,774 183,099 174,435Tier 2 capital 22,032 41,177 17,271 32,649Total Qualifying Capital P=298,320 P=288,951 P=200,370 P=207,084Credit Risk-Weighted Assets P=1,487,360 P=1,469,970 P=1,143,218 P=1,160,414Market Risk-Weighted Assets 72,042 57,101 66,166 46,045Operational Risk-Weighted Assets 146,694 174,345 86,437 102,152Total Risk-Weighted Assets 1,706,096 1,701,416 1,295,821 1,308,611
CET1 Ratio* 16.19% 14.56% 14.13% 13.33%Tier 1 capital ratio 16.19% 14.56% 14.13% 13.33%Total capital ratio 17.49% 16.98% 15.46% 15.82%* of which capital conservation buffer in 2019 and 2018 is 10.19% and 8.56%, respectively, for the Group and 8.13% and 7.33%, respectively, for
the Parent Company
Qualifying capital and risk-weighted assets (RWA) are computed based on BSP regulations. UnderBasel III, the regulatory qualifying capital of the Parent Company consists of CET1 capital, whichcomprises paid-up common stock, additional paid-in capital, retained earnings including current yearprofit, retained earnings reserves, OCI and non-controlling interest less required regulatorydeductions. The other component of regulatory capital is Tier 2 (supplementary) capital, whichincludes unsecured subordinated debts and general loan loss provision. RWA consist of total assetsexcluding cash on hand, due from BSP, loans covered by hold-out on or assignment of deposits, loansor acceptances under letters of credit to the extent covered by margin deposits and other non-riskitems determined by the Monetary Board (MB) of the BSP. Operational RWA are computed usingthe Basic Indicator Approach. As discussed in Note 30, as of December 31, 2018, additionaloperational risk has been included as required by the MB, which was lifted on July 18, 2019.
The Group and its individually regulated operations have complied with all externally imposedcapital requirements throughout the year.
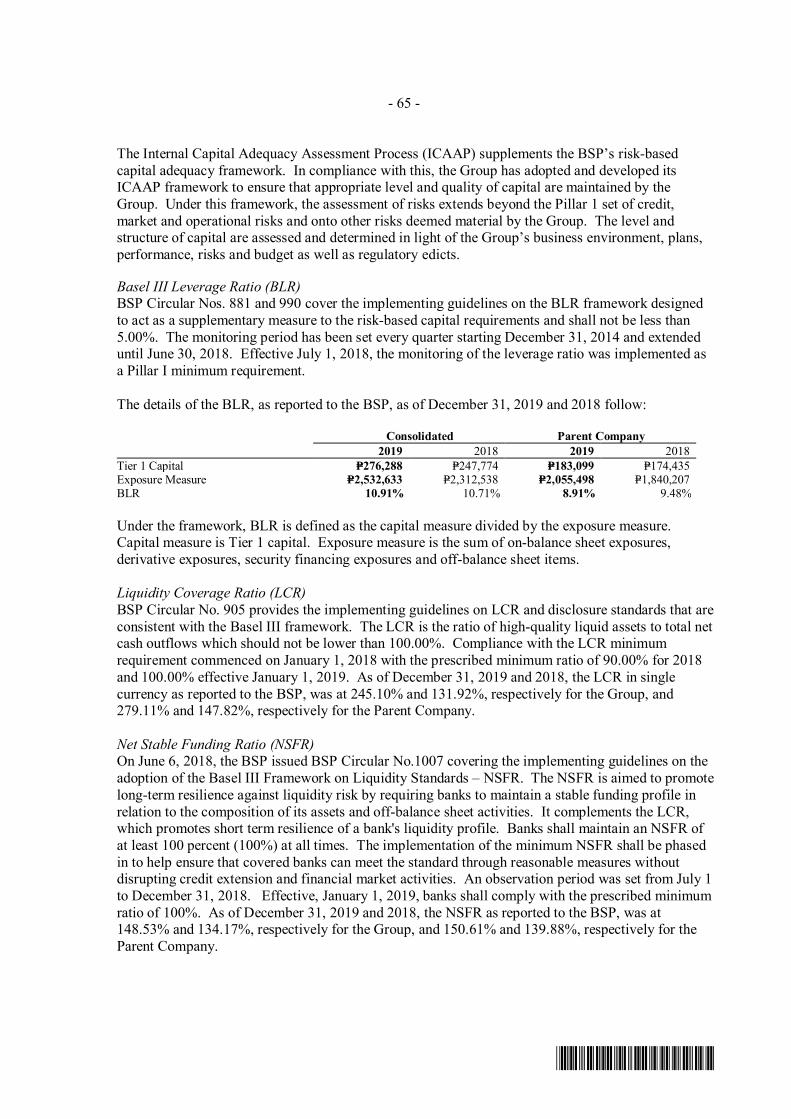
- 65 -
*SGVFS038804*
The Internal Capital Adequacy Assessment Process (ICAAP) supplements the BSP’s risk-basedcapital adequacy framework. In compliance with this, the Group has adopted and developed itsICAAP framework to ensure that appropriate level and quality of capital are maintained by theGroup. Under this framework, the assessment of risks extends beyond the Pillar 1 set of credit,market and operational risks and onto other risks deemed material by the Group. The level andstructure of capital are assessed and determined in light of the Group’s business environment, plans,performance, risks and budget as well as regulatory edicts.
Basel III Leverage Ratio (BLR)BSP Circular Nos. 881 and 990 cover the implementing guidelines on the BLR framework designedto act as a supplementary measure to the risk-based capital requirements and shall not be less than5.00%. The monitoring period has been set every quarter starting December 31, 2014 and extendeduntil June 30, 2018. Effective July 1, 2018, the monitoring of the leverage ratio was implemented asa Pillar I minimum requirement.
The details of the BLR, as reported to the BSP, as of December 31, 2019 and 2018 follow:
Consolidated Parent Company2019 2018 2019 2018
Tier 1 Capital P=276,288 P=247,774 P=183,099 P=174,435Exposure Measure P=2,532,633 P=2,312,538 P=2,055,498 P=1,840,207BLR 10.91% 10.71% 8.91% 9.48%
Under the framework, BLR is defined as the capital measure divided by the exposure measure.Capital measure is Tier 1 capital. Exposure measure is the sum of on-balance sheet exposures,derivative exposures, security financing exposures and off-balance sheet items.
Liquidity Coverage Ratio (LCR)BSP Circular No. 905 provides the implementing guidelines on LCR and disclosure standards that areconsistent with the Basel III framework. The LCR is the ratio of high-quality liquid assets to total netcash outflows which should not be lower than 100.00%. Compliance with the LCR minimumrequirement commenced on January 1, 2018 with the prescribed minimum ratio of 90.00% for 2018and 100.00% effective January 1, 2019. As of December 31, 2019 and 2018, the LCR in singlecurrency as reported to the BSP, was at 245.10% and 131.92%, respectively for the Group, and279.11% and 147.82%, respectively for the Parent Company.
Net Stable Funding Ratio (NSFR)On June 6, 2018, the BSP issued BSP Circular No.1007 covering the implementing guidelines on theadoption of the Basel III Framework on Liquidity Standards – NSFR. The NSFR is aimed to promotelong-term resilience against liquidity risk by requiring banks to maintain a stable funding profile inrelation to the composition of its assets and off-balance sheet activities. It complements the LCR,which promotes short term resilience of a bank's liquidity profile. Banks shall maintain an NSFR ofat least 100 percent (100%) at all times. The implementation of the minimum NSFR shall be phasedin to help ensure that covered banks can meet the standard through reasonable measures withoutdisrupting credit extension and financial market activities. An observation period was set from July 1to December 31, 2018. Effective, January 1, 2019, banks shall comply with the prescribed minimumratio of 100%. As of December 31, 2019 and 2018, the NSFR as reported to the BSP, was at148.53% and 134.17%, respectively for the Group, and 150.61% and 139.88%, respectively for theParent Company.
- 66 -
*SGVFS038804*
5. Fair Value Measurement
Financial InstrumentsThe methods and assumptions used by the Group and the Parent Company in estimating the fairvalues of financial assets and financial liabilities are:
Cash and other cash items, due from BSP and other banks and interbank loans receivable andSPURACarrying amounts approximate fair values in view of the relatively short-term maturities of theseinstruments.
Trading and investment securitiesFair values of debt and equity securities are generally based on quoted market prices. Where the debtsecurities are not quoted or the market prices are not readily available, the Group and the ParentCompany obtained valuations from independent parties offering pricing services, used adjustedquoted market prices of comparable investments, or applied discounted cash flow methodologies. Forequity securities that are not quoted, remeasurement to their fair values is not material to the financialstatements.
Derivative instrumentsFair values are estimated based on quoted market prices, prices provided by independent parties, orprices derived using acceptable valuation models. The models utilize published underlying rates (e.g.interest rates, FX rates, CDS rates, FX volatilities and spot and forward FX rates) and areimplemented through validated calculation engines.
Loans and receivablesFair values of the Group’s loans and receivables are estimated using the discounted cash flowmethodology, using current incremental lending rates for similar types of loans. Where theinstrument reprices on a quarterly basis or has a relatively short maturity, the carrying amountsapproximate fair values.
LiabilitiesFair values are estimated using the discounted cash flow methodology using the Group’s currentborrowing rate for similar borrowings with maturities consistent with those remaining for the liabilitybeing valued, if any. The carrying amounts of demand and savings deposit liabilities and other short-term liabilities approximate fair values considering that these are either due and demandable or withshort-term maturities.
Non-Financial AssetsInvestment propertiesFair value of investment properties is determined based on valuations performed by independent andin-house appraisers using valuation technique with significant inputs that are not based on observablemarket data (Level 3). The valuation of investment properties was based on the Sales ComparisonApproach and considered recent sales of similar or substitute properties in the same areas where theinvestment properties are located, taking into account the economic conditions prevailing at the timeof the valuation. Other factors considered were the location and shape of the properties,environmental issues, development controls such as the height restrictions, building coverage andfloor area ratio restrictions, among others. The fair value of investment properties is based on itshighest and best use, which is their current use.
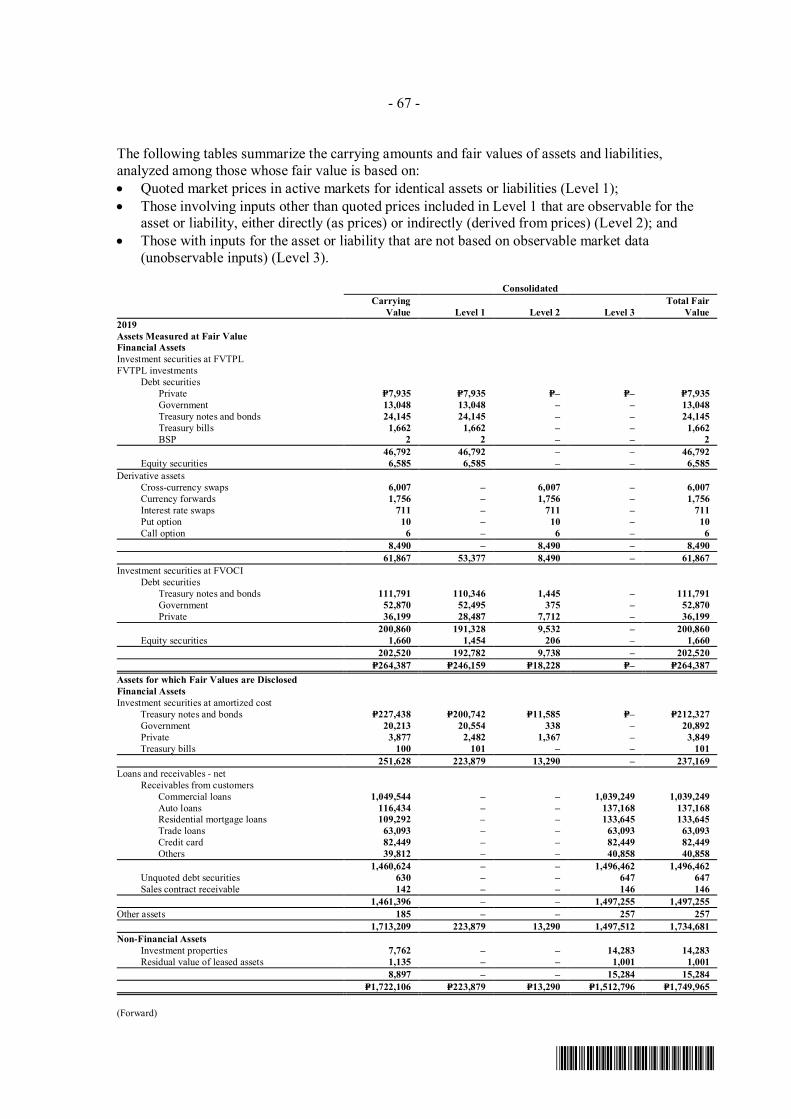
- 67 -
*SGVFS038804*
The following tables summarize the carrying amounts and fair values of assets and liabilities,analyzed among those whose fair value is based on:· Quoted market prices in active markets for identical assets or liabilities (Level 1);· Those involving inputs other than quoted prices included in Level 1 that are observable for the
asset or liability, either directly (as prices) or indirectly (derived from prices) (Level 2); and· Those with inputs for the asset or liability that are not based on observable market data
(unobservable inputs) (Level 3).
ConsolidatedCarrying
Value Level 1 Level 2 Level 3Total Fair
Value2019Assets Measured at Fair ValueFinancial AssetsInvestment securities at FVTPLFVTPL investments
Debt securitiesPrivate P=7,935 P=7,935 P=– P=– P=7,935Government 13,048 13,048 – – 13,048Treasury notes and bonds 24,145 24,145 – – 24,145Treasury bills 1,662 1,662 – – 1,662BSP 2 2 – – 2
46,792 46,792 – – 46,792Equity securities 6,585 6,585 – – 6,585
Derivative assetsCross-currency swaps 6,007 – 6,007 – 6,007Currency forwards 1,756 – 1,756 – 1,756Interest rate swaps 711 – 711 – 711Put option 10 – 10 – 10Call option 6 – 6 – 6
8,490 – 8,490 – 8,49061,867 53,377 8,490 – 61,867
Investment securities at FVOCIDebt securities
Treasury notes and bonds 111,791 110,346 1,445 – 111,791Government 52,870 52,495 375 – 52,870Private 36,199 28,487 7,712 – 36,199
200,860 191,328 9,532 – 200,860Equity securities 1,660 1,454 206 – 1,660
202,520 192,782 9,738 – 202,520P=264,387 P=246,159 P=18,228 P=– P=264,387
Assets for which Fair Values are DisclosedFinancial AssetsInvestment securities at amortized cost
Treasury notes and bonds P=227,438 P=200,742 P=11,585 P=– P=212,327Government 20,213 20,554 338 – 20,892Private 3,877 2,482 1,367 – 3,849Treasury bills 100 101 – – 101
251,628 223,879 13,290 – 237,169Loans and receivables - net
Receivables from customersCommercial loans 1,049,544 – – 1,039,249 1,039,249Auto loans 116,434 – – 137,168 137,168Residential mortgage loans 109,292 – – 133,645 133,645Trade loans 63,093 – – 63,093 63,093Credit card 82,449 – – 82,449 82,449Others 39,812 – – 40,858 40,858
1,460,624 – – 1,496,462 1,496,462Unquoted debt securities 630 – – 647 647Sales contract receivable 142 – – 146 146
1,461,396 – – 1,497,255 1,497,255Other assets 185 – – 257 257
1,713,209 223,879 13,290 1,497,512 1,734,681Non-Financial Assets
Investment properties 7,762 – – 14,283 14,283Residual value of leased assets 1,135 – – 1,001 1,001
8,897 – – 15,284 15,284P=1,722,106 P=223,879 P=13,290 P=1,512,796 P=1,749,965
(Forward)
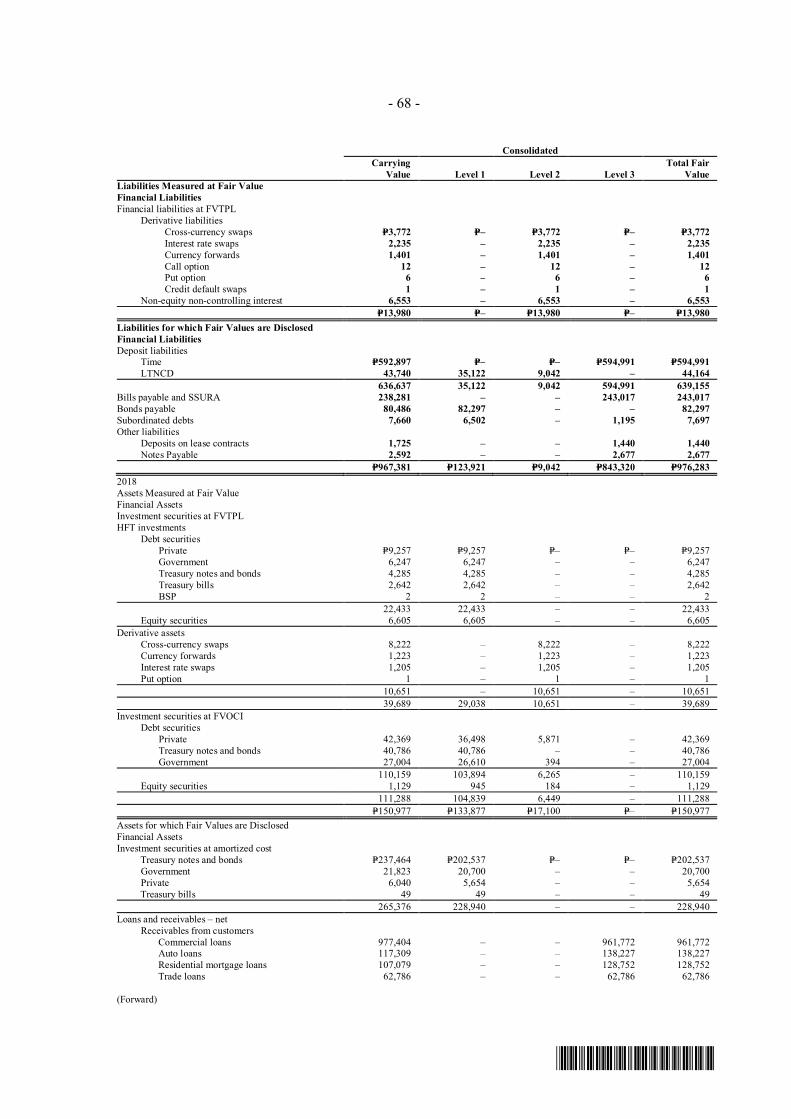
- 68 -
*SGVFS038804*
ConsolidatedCarrying
Value Level 1 Level 2 Level 3Total Fair
ValueLiabilities Measured at Fair ValueFinancial LiabilitiesFinancial liabilities at FVTPL
Derivative liabilitiesCross-currency swaps P=3,772 P=– P=3,772 P=– P=3,772Interest rate swaps 2,235 – 2,235 – 2,235Currency forwards 1,401 – 1,401 – 1,401Call option 12 – 12 – 12Put option 6 – 6 – 6Credit default swaps 1 – 1 – 1
Non-equity non-controlling interest 6,553 – 6,553 – 6,553P=13,980 P=– P=13,980 P=– P=13,980
Liabilities for which Fair Values are DisclosedFinancial LiabilitiesDeposit liabilities
Time P=592,897 P=– P=– P=594,991 P=594,991LTNCD 43,740 35,122 9,042 – 44,164
636,637 35,122 9,042 594,991 639,155Bills payable and SSURA 238,281 – – 243,017 243,017Bonds payable 80,486 82,297 – – 82,297Subordinated debts 7,660 6,502 – 1,195 7,697Other liabilities
Deposits on lease contracts 1,725 – – 1,440 1,440Notes Payable 2,592 – – 2,677 2,677
P=967,381 P=123,921 P=9,042 P=843,320 P=976,2832018Assets Measured at Fair ValueFinancial AssetsInvestment securities at FVTPLHFT investments
Debt securitiesPrivate P=9,257 P=9,257 P=– P=– P=9,257Government 6,247 6,247 – – 6,247Treasury notes and bonds 4,285 4,285 – – 4,285Treasury bills 2,642 2,642 – – 2,642BSP 2 2 – – 2
22,433 22,433 – – 22,433Equity securities 6,605 6,605 – – 6,605
Derivative assetsCross-currency swaps 8,222 – 8,222 – 8,222Currency forwards 1,223 – 1,223 – 1,223Interest rate swaps 1,205 – 1,205 – 1,205Put option 1 – 1 – 1
10,651 – 10,651 – 10,65139,689 29,038 10,651 – 39,689
Investment securities at FVOCIDebt securities
Private 42,369 36,498 5,871 – 42,369Treasury notes and bonds 40,786 40,786 – – 40,786Government 27,004 26,610 394 – 27,004
110,159 103,894 6,265 – 110,159Equity securities 1,129 945 184 – 1,129
111,288 104,839 6,449 – 111,288P=150,977 P=133,877 P=17,100 P=– P=150,977
Assets for which Fair Values are DisclosedFinancial AssetsInvestment securities at amortized cost
Treasury notes and bonds P=237,464 P=202,537 P=– P=– P=202,537Government 21,823 20,700 – – 20,700Private 6,040 5,654 – – 5,654Treasury bills 49 49 – – 49
265,376 228,940 – – 228,940Loans and receivables – net
Receivables from customersCommercial loans 977,404 – – 961,772 961,772Auto loans 117,309 – – 138,227 138,227Residential mortgage loans 107,079 – – 128,752 128,752Trade loans 62,786 – – 62,786 62,786
(Forward)
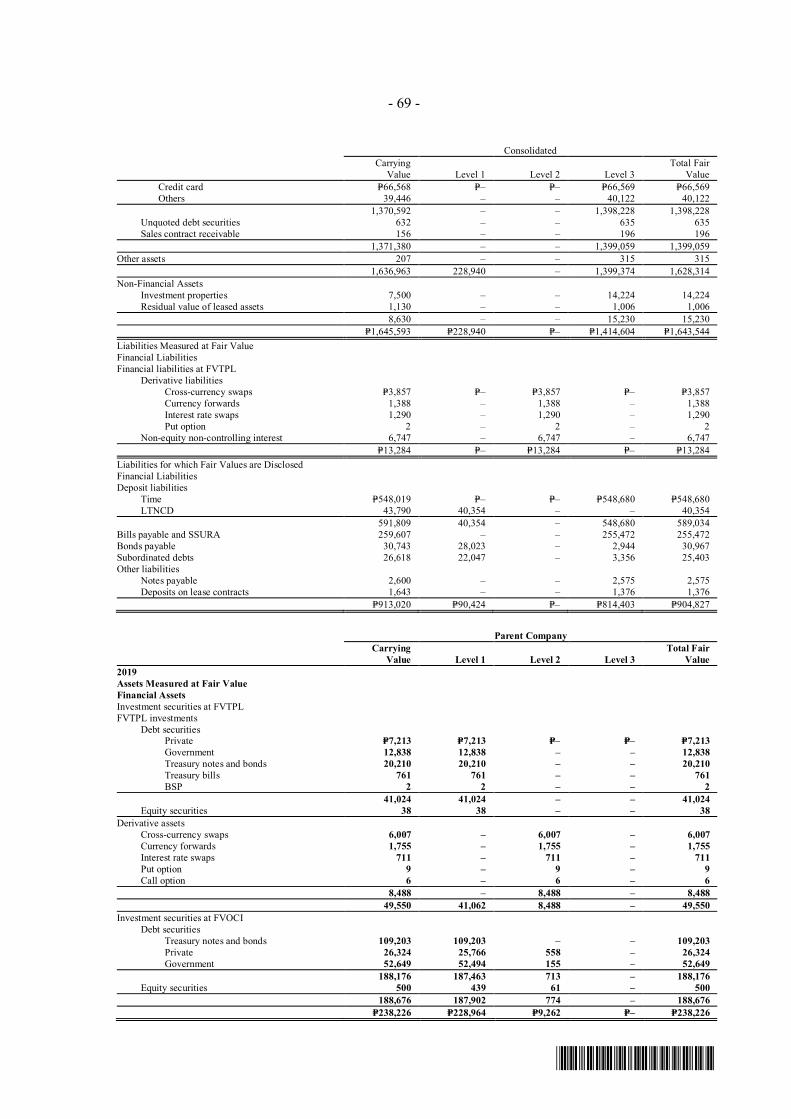
- 69 -
*SGVFS038804*
ConsolidatedCarrying
Value Level 1 Level 2 Level 3Total Fair
ValueCredit card P=66,568 P=– P=– P=66,569 P=66,569Others 39,446 – – 40,122 40,122
1,370,592 – – 1,398,228 1,398,228Unquoted debt securities 632 – – 635 635Sales contract receivable 156 – – 196 196
1,371,380 – – 1,399,059 1,399,059Other assets 207 – – 315 315
1,636,963 228,940 – 1,399,374 1,628,314Non-Financial Assets
Investment properties 7,500 – – 14,224 14,224Residual value of leased assets 1,130 – – 1,006 1,006
8,630 – – 15,230 15,230P=1,645,593 P=228,940 P=– P=1,414,604 P=1,643,544
Liabilities Measured at Fair ValueFinancial LiabilitiesFinancial liabilities at FVTPL
Derivative liabilitiesCross-currency swaps P=3,857 P=– P=3,857 P=– P=3,857Currency forwards 1,388 – 1,388 – 1,388Interest rate swaps 1,290 – 1,290 – 1,290Put option 2 – 2 – 2
Non-equity non-controlling interest 6,747 – 6,747 – 6,747P=13,284 P=– P=13,284 P=– P=13,284
Liabilities for which Fair Values are DisclosedFinancial LiabilitiesDeposit liabilities
Time P=548,019 P=– P=– P=548,680 P=548,680LTNCD 43,790 40,354 – – 40,354
591,809 40,354 ‒ 548,680 589,034Bills payable and SSURA 259,607 – – 255,472 255,472Bonds payable 30,743 28,023 – 2,944 30,967Subordinated debts 26,618 22,047 – 3,356 25,403Other liabilities
Notes payable 2,600 ‒ ‒ 2,575 2,575Deposits on lease contracts 1,643 – – 1,376 1,376
P=913,020 P=90,424 P=– P=814,403 P=904,827
Parent CompanyCarrying
Value Level 1 Level 2 Level 3Total Fair
Value2019Assets Measured at Fair ValueFinancial AssetsInvestment securities at FVTPLFVTPL investments
Debt securitiesPrivate P=7,213 P=7,213 P=– P=– P=7,213Government 12,838 12,838 – – 12,838Treasury notes and bonds 20,210 20,210 – – 20,210Treasury bills 761 761 – – 761BSP 2 2 – – 2
41,024 41,024 – – 41,024Equity securities 38 38 – – 38
Derivative assetsCross-currency swaps 6,007 – 6,007 – 6,007Currency forwards 1,755 – 1,755 – 1,755Interest rate swaps 711 – 711 – 711Put option 9 – 9 – 9Call option 6 – 6 – 6
8,488 – 8,488 – 8,48849,550 41,062 8,488 – 49,550
Investment securities at FVOCIDebt securities
Treasury notes and bonds 109,203 109,203 – – 109,203Private 26,324 25,766 558 – 26,324Government 52,649 52,494 155 – 52,649
188,176 187,463 713 – 188,176Equity securities 500 439 61 – 500
188,676 187,902 774 – 188,676P=238,226 P=228,964 P=9,262 P=– P=238,226
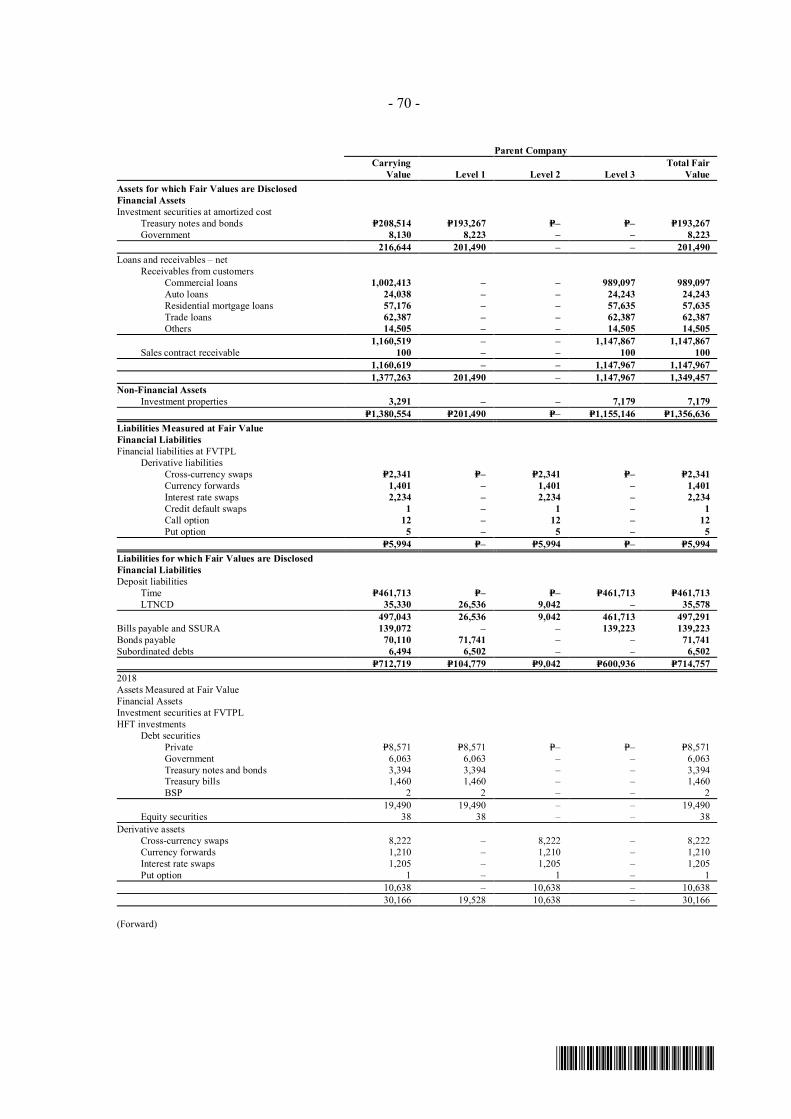
- 70 -
*SGVFS038804*
Parent CompanyCarrying
Value Level 1 Level 2 Level 3Total Fair
ValueAssets for which Fair Values are DisclosedFinancial AssetsInvestment securities at amortized cost
Treasury notes and bonds P=208,514 P=193,267 P=– P=– P=193,267Government 8,130 8,223 – – 8,223
216,644 201,490 – – 201,490Loans and receivables – net
Receivables from customersCommercial loans 1,002,413 – – 989,097 989,097
Auto loans 24,038 – – 24,243 24,243Residential mortgage loans 57,176 – – 57,635 57,635Trade loans 62,387 – – 62,387 62,387Others 14,505 – – 14,505 14,505
1,160,519 – – 1,147,867 1,147,867Sales contract receivable 100 – – 100 100
1,160,619 – – 1,147,967 1,147,9671,377,263 201,490 – 1,147,967 1,349,457
Non-Financial AssetsInvestment properties 3,291 – – 7,179 7,179
P=1,380,554 P=201,490 P=– P=1,155,146 P=1,356,636Liabilities Measured at Fair ValueFinancial LiabilitiesFinancial liabilities at FVTPL
Derivative liabilitiesCross-currency swaps P=2,341 P=– P=2,341 P=– P=2,341Currency forwards 1,401 – 1,401 – 1,401Interest rate swaps 2,234 – 2,234 – 2,234Credit default swaps 1 – 1 – 1Call option 12 – 12 – 12Put option 5 – 5 – 5
P=5,994 P=– P=5,994 P=– P=5,994Liabilities for which Fair Values are DisclosedFinancial LiabilitiesDeposit liabilities
Time P=461,713 P=– P=– P=461,713 P=461,713LTNCD 35,330 26,536 9,042 – 35,578
497,043 26,536 9,042 461,713 497,291Bills payable and SSURA 139,072 – – 139,223 139,223Bonds payable 70,110 71,741 – – 71,741Subordinated debts 6,494 6,502 – – 6,502
P=712,719 P=104,779 P=9,042 P=600,936 P=714,7572018Assets Measured at Fair ValueFinancial AssetsInvestment securities at FVTPLHFT investments
Debt securitiesPrivate P=8,571 P=8,571 P=– P=– P=8,571Government 6,063 6,063 – – 6,063Treasury notes and bonds 3,394 3,394 – – 3,394Treasury bills 1,460 1,460 – – 1,460BSP 2 2 – – 2
19,490 19,490 – – 19,490Equity securities 38 38 – – 38
Derivative assetsCross-currency swaps 8,222 – 8,222 – 8,222Currency forwards 1,210 – 1,210 – 1,210Interest rate swaps 1,205 – 1,205 – 1,205Put option 1 – 1 – 1
10,638 – 10,638 – 10,63830,166 19,528 10,638 – 30,166
(Forward)
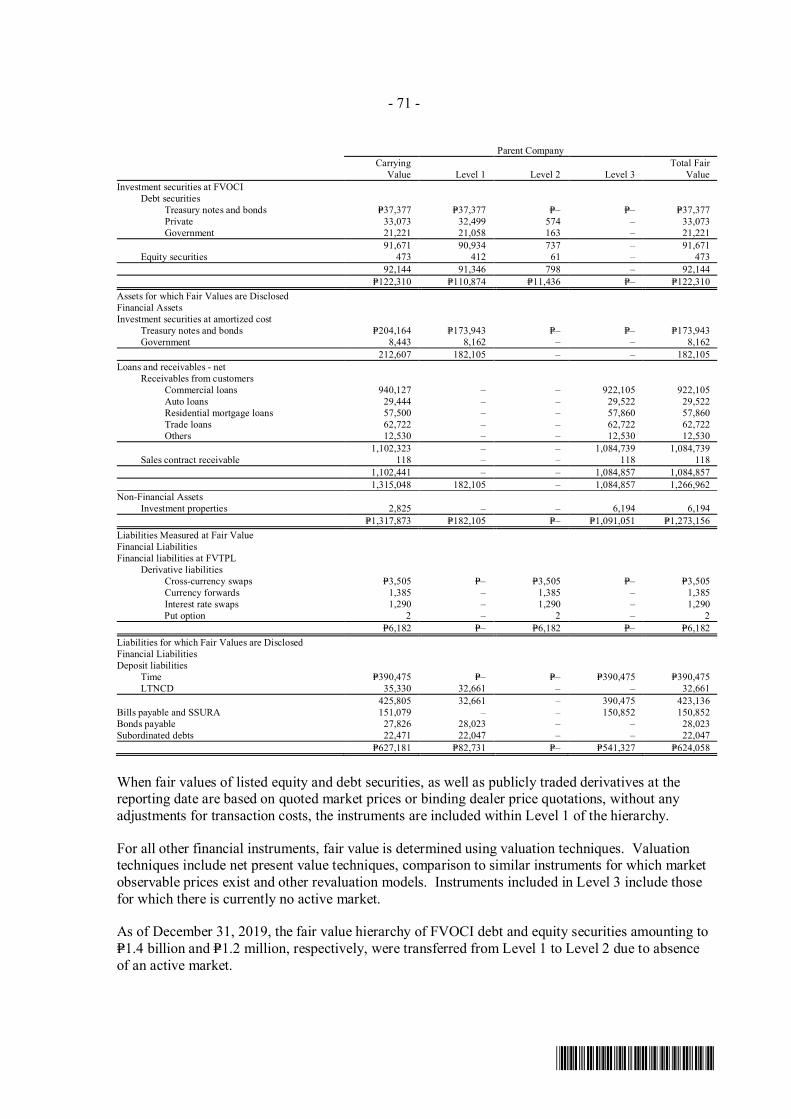
- 71 -
*SGVFS038804*
Parent CompanyCarrying
Value Level 1 Level 2 Level 3Total Fair
ValueInvestment securities at FVOCI
Debt securitiesTreasury notes and bonds P=37,377 P=37,377 P=– P=– P=37,377Private 33,073 32,499 574 – 33,073Government 21,221 21,058 163 – 21,221
91,671 90,934 737 – 91,671Equity securities 473 412 61 – 473
92,144 91,346 798 – 92,144P=122,310 P=110,874 P=11,436 P=– P=122,310
Assets for which Fair Values are DisclosedFinancial AssetsInvestment securities at amortized cost
Treasury notes and bonds P=204,164 P=173,943 P=– P=– P=173,943Government 8,443 8,162 – – 8,162
212,607 182,105 – – 182,105Loans and receivables - net
Receivables from customersCommercial loans 940,127 – – 922,105 922,105
Auto loans 29,444 – – 29,522 29,522Residential mortgage loans 57,500 – – 57,860 57,860Trade loans 62,722 – – 62,722 62,722Others 12,530 – – 12,530 12,530
1,102,323 – – 1,084,739 1,084,739Sales contract receivable 118 – – 118 118
1,102,441 – – 1,084,857 1,084,8571,315,048 182,105 ‒ 1,084,857 1,266,962
Non-Financial AssetsInvestment properties 2,825 – – 6,194 6,194
P=1,317,873 P=182,105 P=– P=1,091,051 P=1,273,156Liabilities Measured at Fair ValueFinancial LiabilitiesFinancial liabilities at FVTPL
Derivative liabilitiesCross-currency swaps P=3,505 P=– P=3,505 P=– P=3,505Currency forwards 1,385 – 1,385 – 1,385Interest rate swaps 1,290 – 1,290 – 1,290
Put option 2 – 2 – 2P=6,182 P=– P=6,182 P=– P=6,182
Liabilities for which Fair Values are DisclosedFinancial LiabilitiesDeposit liabilities
Time P=390,475 P=– P=– P=390,475 P=390,475LTNCD 35,330 32,661 – – 32,661
425,805 32,661 – 390,475 423,136Bills payable and SSURA 151,079 – – 150,852 150,852Bonds payable 27,826 28,023 – – 28,023Subordinated debts 22,471 22,047 – – 22,047
P=627,181 P=82,731 P=– P=541,327 P=624,058
When fair values of listed equity and debt securities, as well as publicly traded derivatives at thereporting date are based on quoted market prices or binding dealer price quotations, without anyadjustments for transaction costs, the instruments are included within Level 1 of the hierarchy.
For all other financial instruments, fair value is determined using valuation techniques. Valuationtechniques include net present value techniques, comparison to similar instruments for which marketobservable prices exist and other revaluation models. Instruments included in Level 3 include thosefor which there is currently no active market.
As of December 31, 2019, the fair value hierarchy of FVOCI debt and equity securities amounting toP=1.4 billion and P=1.2 million, respectively, were transferred from Level 1 to Level 2 due to absenceof an active market.
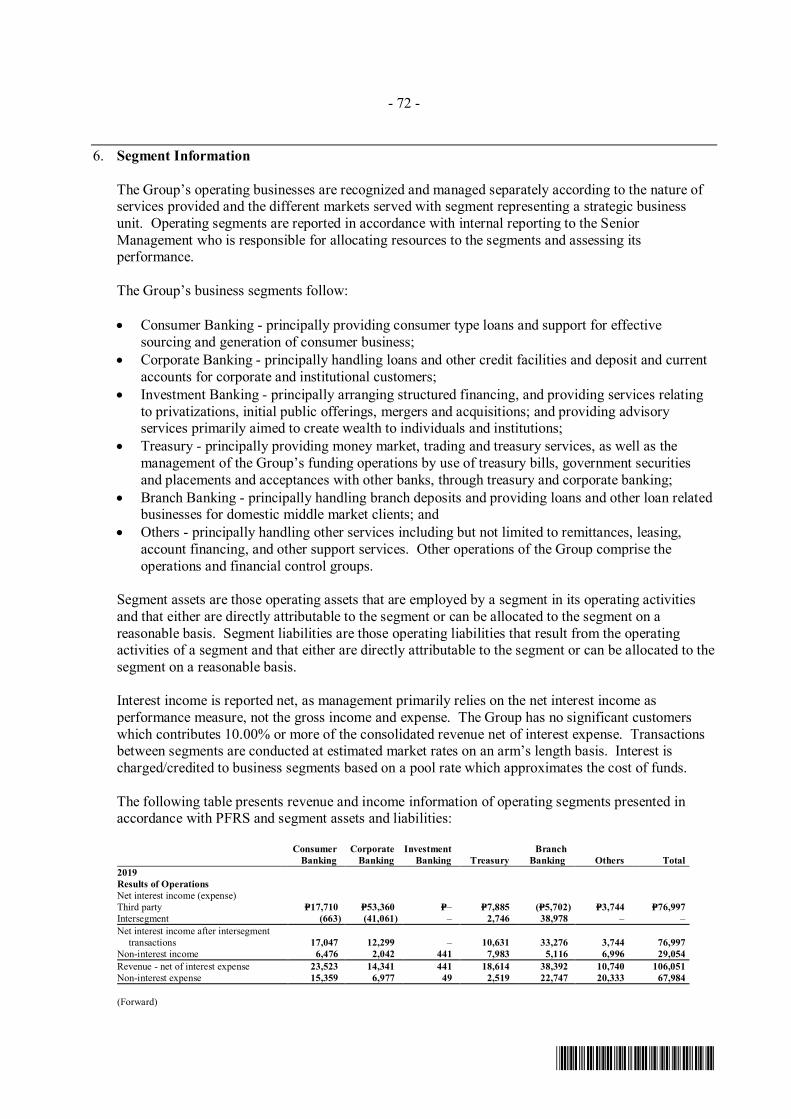
- 72 -
*SGVFS038804*
6. Segment Information
The Group’s operating businesses are recognized and managed separately according to the nature ofservices provided and the different markets served with segment representing a strategic businessunit. Operating segments are reported in accordance with internal reporting to the SeniorManagement who is responsible for allocating resources to the segments and assessing itsperformance.
The Group’s business segments follow:
· Consumer Banking - principally providing consumer type loans and support for effectivesourcing and generation of consumer business;
· Corporate Banking - principally handling loans and other credit facilities and deposit and currentaccounts for corporate and institutional customers;
· Investment Banking - principally arranging structured financing, and providing services relatingto privatizations, initial public offerings, mergers and acquisitions; and providing advisoryservices primarily aimed to create wealth to individuals and institutions;
· Treasury - principally providing money market, trading and treasury services, as well as themanagement of the Group’s funding operations by use of treasury bills, government securitiesand placements and acceptances with other banks, through treasury and corporate banking;
· Branch Banking - principally handling branch deposits and providing loans and other loan relatedbusinesses for domestic middle market clients; and
· Others - principally handling other services including but not limited to remittances, leasing,account financing, and other support services. Other operations of the Group comprise theoperations and financial control groups.
Segment assets are those operating assets that are employed by a segment in its operating activitiesand that either are directly attributable to the segment or can be allocated to the segment on areasonable basis. Segment liabilities are those operating liabilities that result from the operatingactivities of a segment and that either are directly attributable to the segment or can be allocated to thesegment on a reasonable basis.
Interest income is reported net, as management primarily relies on the net interest income asperformance measure, not the gross income and expense. The Group has no significant customerswhich contributes 10.00% or more of the consolidated revenue net of interest expense. Transactionsbetween segments are conducted at estimated market rates on an arm’s length basis. Interest ischarged/credited to business segments based on a pool rate which approximates the cost of funds.
The following table presents revenue and income information of operating segments presented inaccordance with PFRS and segment assets and liabilities:
ConsumerBanking
CorporateBanking
InvestmentBanking Treasury
BranchBanking Others Total
2019Results of OperationsNet interest income (expense)Third party P=17,710 P=53,360 P=– P=7,885 (P=5,702) P=3,744 P=76,997Intersegment (663) (41,061) – 2,746 38,978 – –Net interest income after intersegment
transactions 17,047 12,299 – 10,631 33,276 3,744 76,997Non-interest income 6,476 2,042 441 7,983 5,116 6,996 29,054Revenue - net of interest expense 23,523 14,341 441 18,614 38,392 10,740 106,051Non-interest expense 15,359 6,977 49 2,519 22,747 20,333 67,984
(Forward)
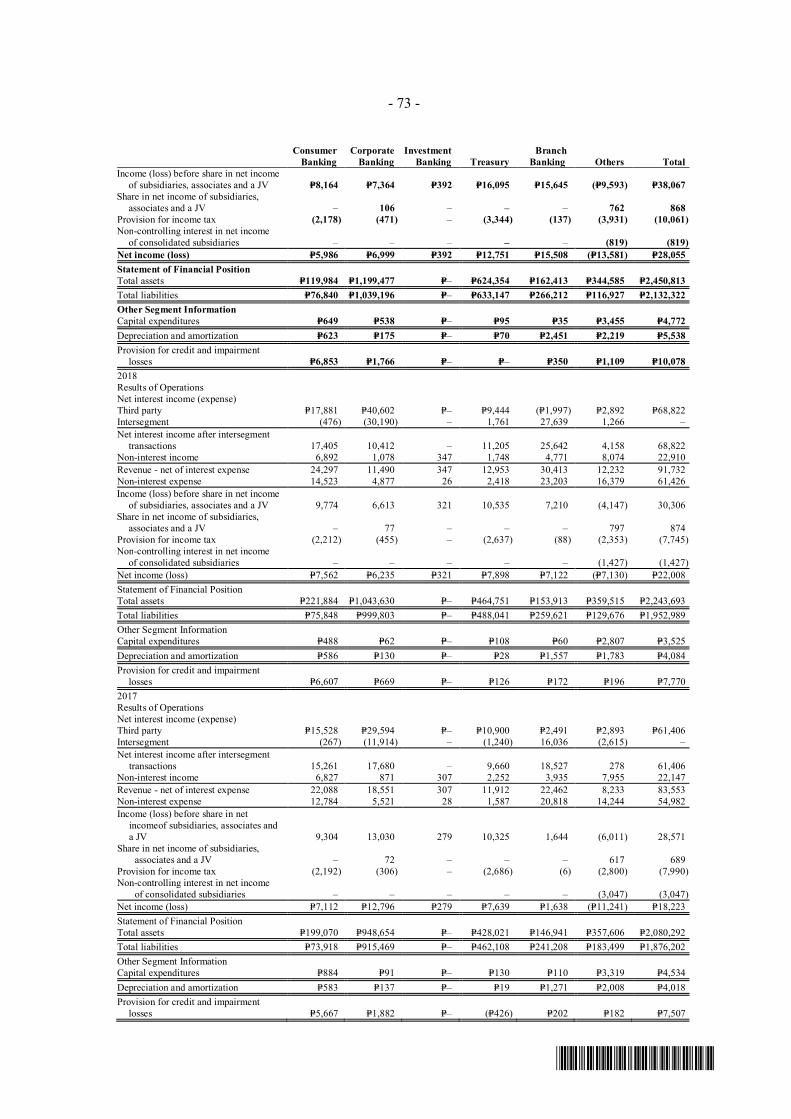
- 73 -
*SGVFS038804*
ConsumerBanking
CorporateBanking
InvestmentBanking Treasury
BranchBanking Others Total
Income (loss) before share in net incomeof subsidiaries, associates and a JV P=8,164 P=7,364 P=392 P=16,095 P=15,645 (P=9,593) P=38,067
Share in net income of subsidiaries,associates and a JV – 106 – – – 762 868
Provision for income tax (2,178) (471) – (3,344) (137) (3,931) (10,061)Non-controlling interest in net income
of consolidated subsidiaries – – – – – (819) (819)Net income (loss) P=5,986 P=6,999 P=392 P=12,751 P=15,508 (P=13,581) P=28,055Statement of Financial PositionTotal assets P=119,984 P=1,199,477 P=– P=624,354 P=162,413 P=344,585 P=2,450,813Total liabilities P=76,840 P=1,039,196 P=– P=633,147 P=266,212 P=116,927 P=2,132,322Other Segment InformationCapital expenditures P=649 P=538 P=– P=95 P=35 P=3,455 P=4,772Depreciation and amortization P=623 P=175 P=– P=70 P=2,451 P=2,219 P=5,538Provision for credit and impairment
losses P=6,853 P=1,766 P=– P=– P=350 P=1,109 P=10,0782018Results of OperationsNet interest income (expense)Third party P=17,881 P=40,602 P=– P=9,444 (P=1,997) P=2,892 P=68,822Intersegment (476) (30,190) – 1,761 27,639 1,266 –Net interest income after intersegment
transactions 17,405 10,412 – 11,205 25,642 4,158 68,822Non-interest income 6,892 1,078 347 1,748 4,771 8,074 22,910Revenue - net of interest expense 24,297 11,490 347 12,953 30,413 12,232 91,732Non-interest expense 14,523 4,877 26 2,418 23,203 16,379 61,426Income (loss) before share in net income
of subsidiaries, associates and a JV 9,774 6,613 321 10,535 7,210 (4,147) 30,306Share in net income of subsidiaries,
associates and a JV – 77 – – – 797 874Provision for income tax (2,212) (455) – (2,637) (88) (2,353) (7,745)Non-controlling interest in net income
of consolidated subsidiaries – – – – – (1,427) (1,427)Net income (loss) P=7,562 P=6,235 P=321 P=7,898 P=7,122 (P=7,130) P=22,008Statement of Financial PositionTotal assets P=221,884 P=1,043,630 P=– P=464,751 P=153,913 P=359,515 P=2,243,693Total liabilities P=75,848 P=999,803 P=– P=488,041 P=259,621 P=129,676 P=1,952,989Other Segment InformationCapital expenditures P=488 P=62 P=– P=108 P=60 P=2,807 P=3,525Depreciation and amortization P=586 P=130 P=– P=28 P=1,557 P=1,783 P=4,084Provision for credit and impairment
losses P=6,607 P=669 P=– P=126 P=172 P=196 P=7,7702017Results of OperationsNet interest income (expense)Third party P=15,528 P=29,594 P=– P=10,900 P=2,491 P=2,893 P=61,406Intersegment (267) (11,914) – (1,240) 16,036 (2,615) –Net interest income after intersegment
transactions 15,261 17,680 – 9,660 18,527 278 61,406Non-interest income 6,827 871 307 2,252 3,935 7,955 22,147Revenue - net of interest expense 22,088 18,551 307 11,912 22,462 8,233 83,553Non-interest expense 12,784 5,521 28 1,587 20,818 14,244 54,982Income (loss) before share in net incomeof subsidiaries, associates and a JV 9,304 13,030 279 10,325 1,644 (6,011) 28,571Share in net income of subsidiaries, associates and a JV – 72 – – – 617 689Provision for income tax (2,192) (306) – (2,686) (6) (2,800) (7,990)Non-controlling interest in net income
of consolidated subsidiaries – – – – – (3,047) (3,047)Net income (loss) P=7,112 P=12,796 P=279 P=7,639 P=1,638 (P=11,241) P=18,223Statement of Financial PositionTotal assets P=199,070 P=948,654 P=– P=428,021 P=146,941 P=357,606 P=2,080,292Total liabilities P=73,918 P=915,469 P=– P=462,108 P=241,208 P=183,499 P=1,876,202Other Segment InformationCapital expenditures P=884 P=91 P=– P=130 P=110 P=3,319 P=4,534Depreciation and amortization P=583 P=137 P=– P=19 P=1,271 P=2,008 P=4,018Provision for credit and impairment
losses P=5,667 P=1,882 P=– (P=426) P=202 P=182 P=7,507
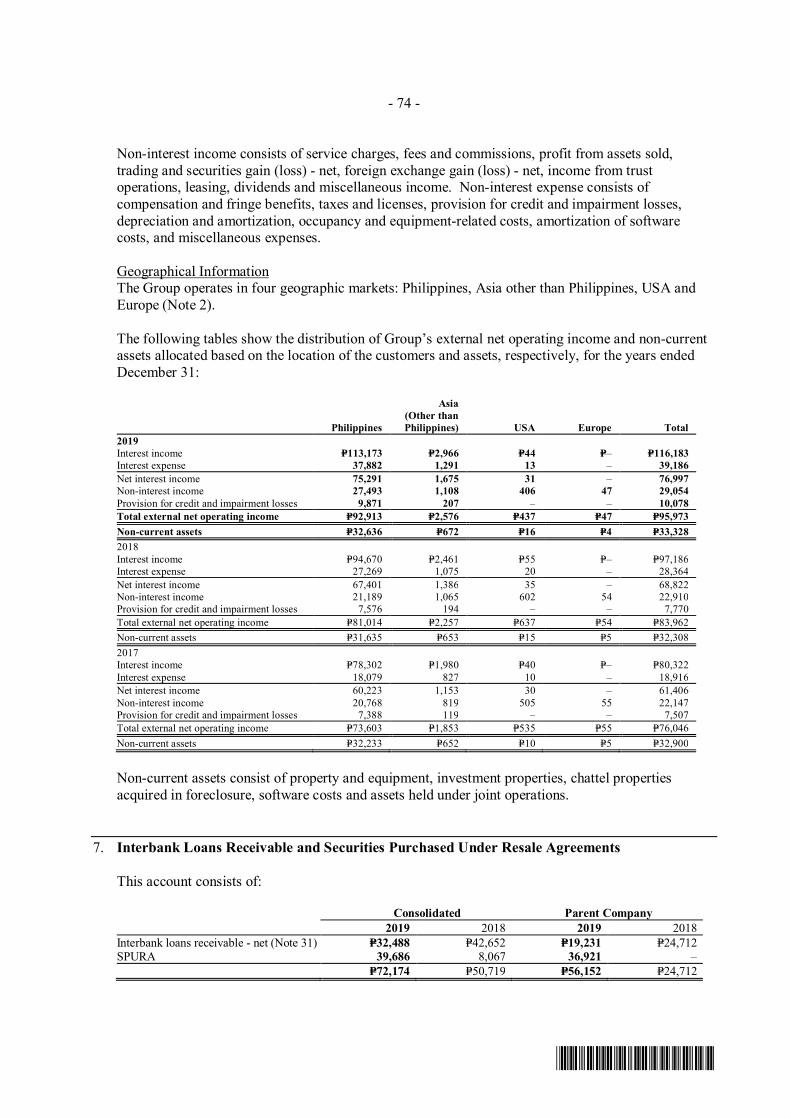
- 74 -
*SGVFS038804*
Non-interest income consists of service charges, fees and commissions, profit from assets sold,trading and securities gain (loss) - net, foreign exchange gain (loss) - net, income from trustoperations, leasing, dividends and miscellaneous income. Non-interest expense consists ofcompensation and fringe benefits, taxes and licenses, provision for credit and impairment losses,depreciation and amortization, occupancy and equipment-related costs, amortization of softwarecosts, and miscellaneous expenses.
Geographical InformationThe Group operates in four geographic markets: Philippines, Asia other than Philippines, USA andEurope (Note 2).
The following tables show the distribution of Group’s external net operating income and non-currentassets allocated based on the location of the customers and assets, respectively, for the years endedDecember 31:
Philippines
Asia(Other thanPhilippines) USA Europe Total
2019Interest income P=113,173 P=2,966 P=44 P=– P=116,183Interest expense 37,882 1,291 13 – 39,186Net interest income 75,291 1,675 31 – 76,997Non-interest income 27,493 1,108 406 47 29,054Provision for credit and impairment losses 9,871 207 – – 10,078Total external net operating income P=92,913 P=2,576 P=437 P=47 P=95,973Non-current assets P=32,636 P=672 P=16 P=4 P=33,3282018Interest income P=94,670 P=2,461 P=55 P=– P=97,186Interest expense 27,269 1,075 20 – 28,364Net interest income 67,401 1,386 35 – 68,822Non-interest income 21,189 1,065 602 54 22,910Provision for credit and impairment losses 7,576 194 – – 7,770Total external net operating income P=81,014 P=2,257 P=637 P=54 P=83,962Non-current assets P=31,635 P=653 P=15 P=5 P=32,3082017Interest income P=78,302 P=1,980 P=40 P=– P=80,322Interest expense 18,079 827 10 – 18,916Net interest income 60,223 1,153 30 – 61,406Non-interest income 20,768 819 505 55 22,147Provision for credit and impairment losses 7,388 119 – – 7,507Total external net operating income P=73,603 P=1,853 P=535 P=55 P=76,046Non-current assets P=32,233 P=652 P=10 P=5 P=32,900
Non-current assets consist of property and equipment, investment properties, chattel propertiesacquired in foreclosure, software costs and assets held under joint operations.
7. Interbank Loans Receivable and Securities Purchased Under Resale Agreements
This account consists of:
Consolidated Parent Company2019 2018 2019 2018
Interbank loans receivable - net (Note 31) P=32,488 P=42,652 P=19,231 P=24,712SPURA 39,686 8,067 36,921 –
P=72,174 P=50,719 P=56,152 P=24,712
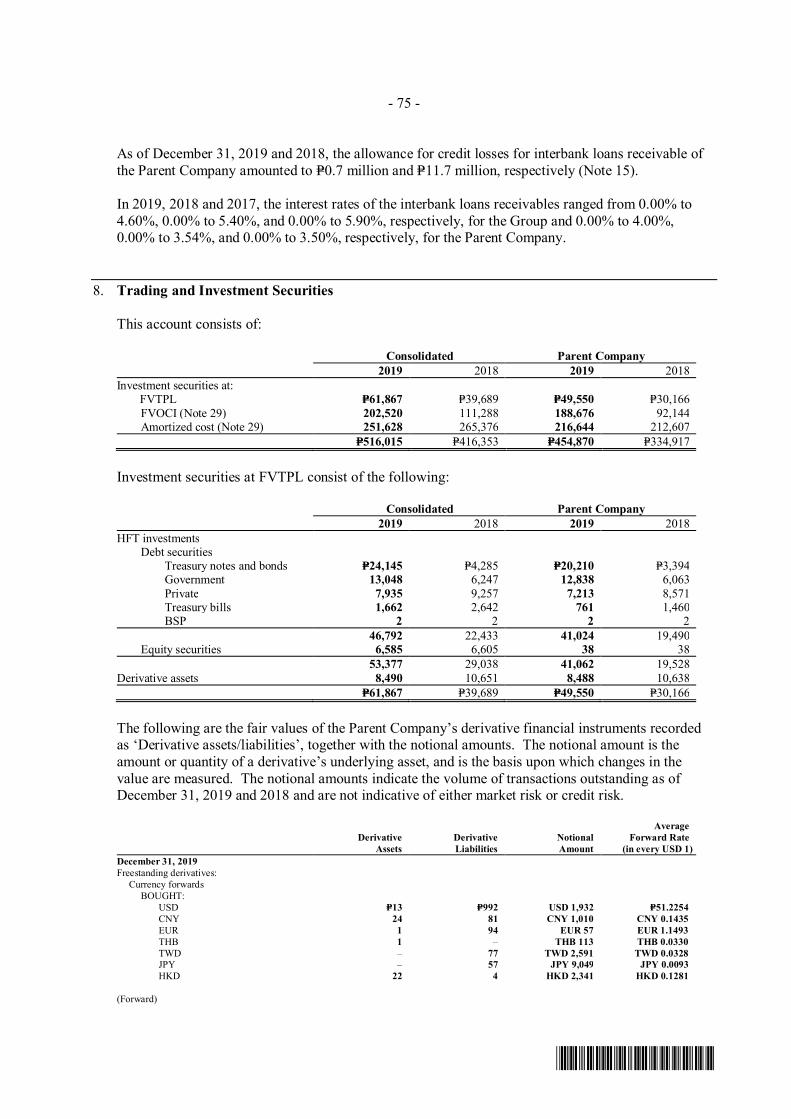
- 75 -
*SGVFS038804*
As of December 31, 2019 and 2018, the allowance for credit losses for interbank loans receivable ofthe Parent Company amounted to P=0.7 million and P=11.7 million, respectively (Note 15).
In 2019, 2018 and 2017, the interest rates of the interbank loans receivables ranged from 0.00% to4.60%, 0.00% to 5.40%, and 0.00% to 5.90%, respectively, for the Group and 0.00% to 4.00%,0.00% to 3.54%, and 0.00% to 3.50%, respectively, for the Parent Company.
8. Trading and Investment Securities
This account consists of:
Consolidated Parent Company2019 2018 2019 2018
Investment securities at:FVTPL P=61,867 P=39,689 P=49,550 P=30,166FVOCI (Note 29) 202,520 111,288 188,676 92,144Amortized cost (Note 29) 251,628 265,376 216,644 212,607
P=516,015 P=416,353 P=454,870 P=334,917
Investment securities at FVTPL consist of the following:
Consolidated Parent Company2019 2018 2019 2018
HFT investmentsDebt securities
Treasury notes and bonds P=24,145 P=4,285 P=20,210 P=3,394 Government 13,048 6,247 12,838 6,063
Private 7,935 9,257 7,213 8,571Treasury bills 1,662 2,642 761 1,460BSP 2 2 2 2
46,792 22,433 41,024 19,490Equity securities 6,585 6,605 38 38
53,377 29,038 41,062 19,528Derivative assets 8,490 10,651 8,488 10,638
P=61,867 P=39,689 P=49,550 P=30,166
The following are the fair values of the Parent Company’s derivative financial instruments recordedas ‘Derivative assets/liabilities’, together with the notional amounts. The notional amount is theamount or quantity of a derivative’s underlying asset, and is the basis upon which changes in thevalue are measured. The notional amounts indicate the volume of transactions outstanding as ofDecember 31, 2019 and 2018 and are not indicative of either market risk or credit risk.
DerivativeAssets
DerivativeLiabilities
NotionalAmount
AverageForward Rate
(in every USD 1)December 31, 2019Freestanding derivatives:
Currency forwardsBOUGHT:
USD P=13 P=992 USD 1,932 P=51.2254CNY 24 81 CNY 1,010 CNY 0.1435EUR 1 94 EUR 57 EUR 1.1493THB 1 – THB 113 THB 0.0330TWD – 77 TWD 2,591 TWD 0.0328JPY – 57 JPY 9,049 JPY 0.0093HKD 22 4 HKD 2,341 HKD 0.1281
(Forward)
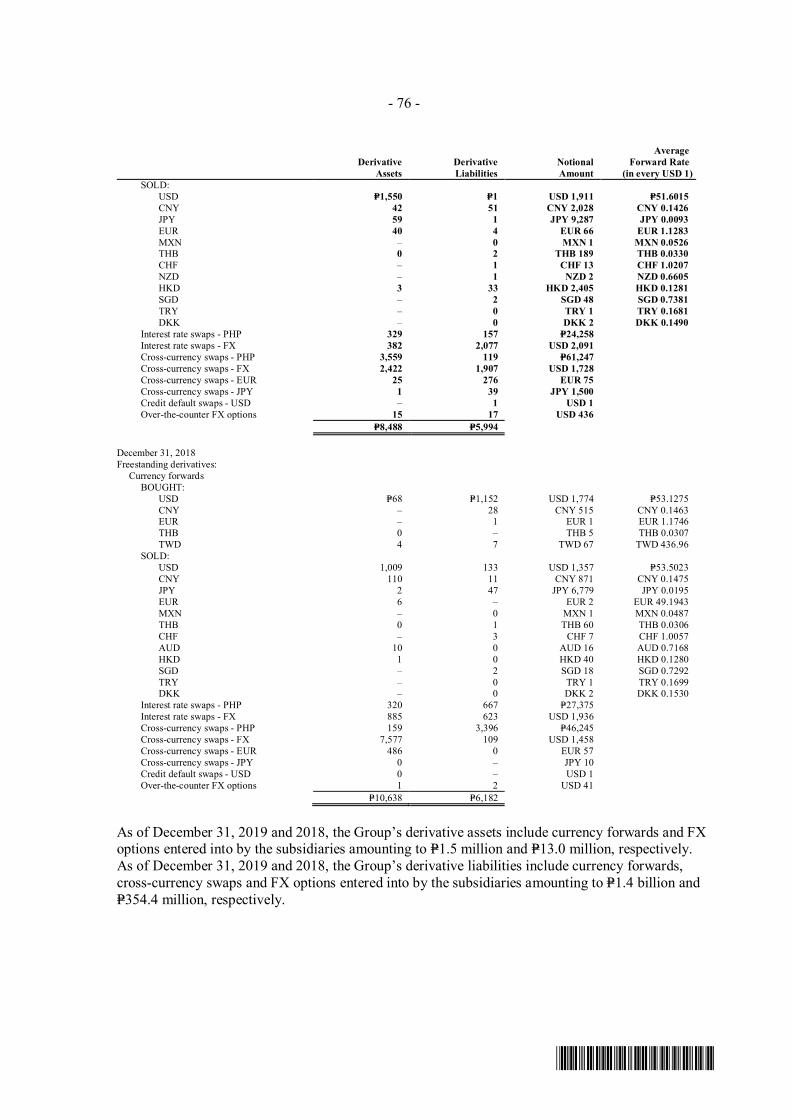
- 76 -
*SGVFS038804*
DerivativeAssets
DerivativeLiabilities
NotionalAmount
AverageForward Rate
(in every USD 1)SOLD:
USD P=1,550 P=1 USD 1,911 P=51.6015CNY 42 51 CNY 2,028 CNY 0.1426JPY 59 1 JPY 9,287 JPY 0.0093EUR 40 4 EUR 66 EUR 1.1283MXN – 0 MXN 1 MXN 0.0526THB 0 2 THB 189 THB 0.0330CHF – 1 CHF 13 CHF 1.0207NZD – 1 NZD 2 NZD 0.6605HKD 3 33 HKD 2,405 HKD 0.1281SGD – 2 SGD 48 SGD 0.7381TRY – 0 TRY 1 TRY 0.1681DKK – 0 DKK 2 DKK 0.1490
Interest rate swaps - PHP 329 157 P=24,258Interest rate swaps - FX 382 2,077 USD 2,091Cross-currency swaps - PHP 3,559 119 P=61,247Cross-currency swaps - FX 2,422 1,907 USD 1,728Cross-currency swaps - EUR 25 276 EUR 75Cross-currency swaps - JPY 1 39 JPY 1,500Credit default swaps - USD – 1 USD 1Over-the-counter FX options 15 17 USD 436
P=8,488 P=5,994
December 31, 2018Freestanding derivatives:
Currency forwardsBOUGHT:
USD P=68 P=1,152 USD 1,774 P=53.1275CNY – 28 CNY 515 CNY 0.1463EUR – 1 EUR 1 EUR 1.1746THB 0 – THB 5 THB 0.0307TWD 4 7 TWD 67 TWD 436.96
SOLD:USD 1,009 133 USD 1,357 P=53.5023CNY 110 11 CNY 871 CNY 0.1475JPY 2 47 JPY 6,779 JPY 0.0195EUR 6 – EUR 2 EUR 49.1943MXN – 0 MXN 1 MXN 0.0487THB 0 1 THB 60 THB 0.0306CHF – 3 CHF 7 CHF 1.0057AUD 10 0 AUD 16 AUD 0.7168HKD 1 0 HKD 40 HKD 0.1280SGD – 2 SGD 18 SGD 0.7292TRY – 0 TRY 1 TRY 0.1699DKK – 0 DKK 2 DKK 0.1530
Interest rate swaps - PHP 320 667 P=27,375Interest rate swaps - FX 885 623 USD 1,936Cross-currency swaps - PHP 159 3,396 P=46,245Cross-currency swaps - FX 7,577 109 USD 1,458Cross-currency swaps - EUR 486 0 EUR 57Cross-currency swaps - JPY 0 ‒ JPY 10Credit default swaps - USD 0 ‒ USD 1Over-the-counter FX options 1 2 USD 41
P=10,638 P=6,182
As of December 31, 2019 and 2018, the Group’s derivative assets include currency forwards and FXoptions entered into by the subsidiaries amounting to P=1.5 million and P=13.0 million, respectively.As of December 31, 2019 and 2018, the Group’s derivative liabilities include currency forwards,cross-currency swaps and FX options entered into by the subsidiaries amounting to P=1.4 billion andP=354.4 million, respectively.
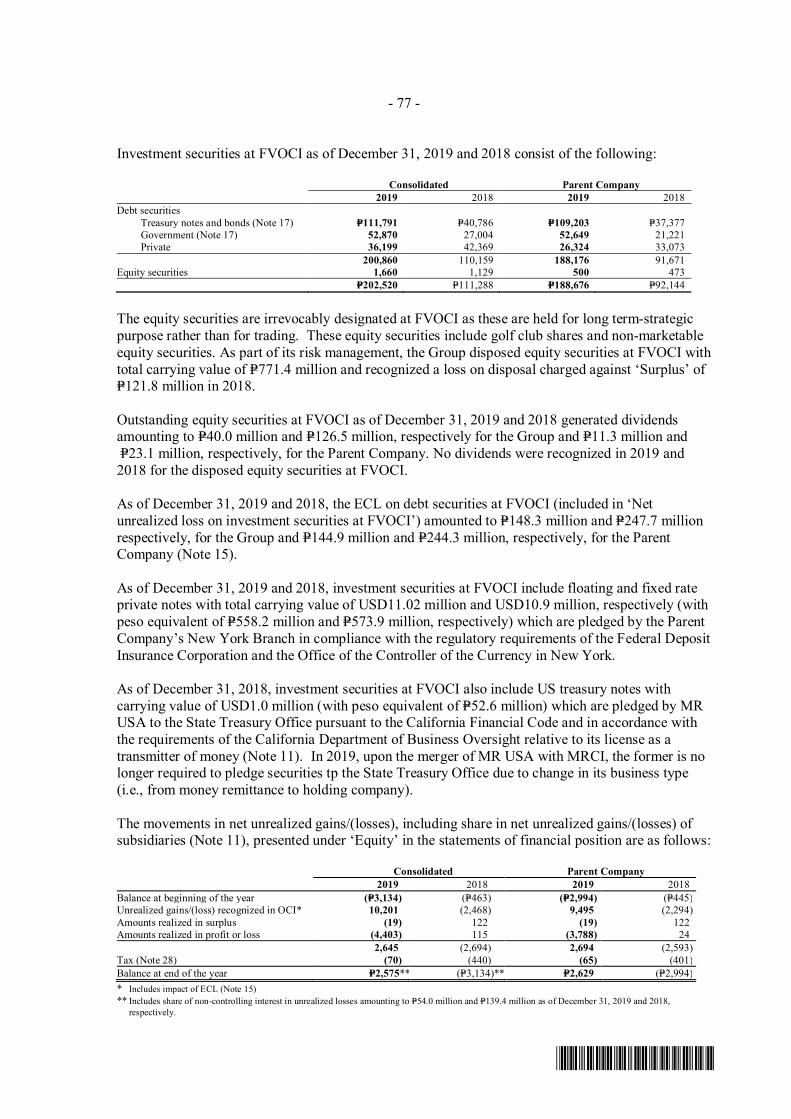
- 77 -
*SGVFS038804*
Investment securities at FVOCI as of December 31, 2019 and 2018 consist of the following:
Consolidated Parent Company2019 2018 2019 2018
Debt securitiesTreasury notes and bonds (Note 17) P=111,791 P=40,786 P=109,203 P=37,377Government (Note 17) 52,870 27,004 52,649 21,221Private 36,199 42,369 26,324 33,073
200,860 110,159 188,176 91,671Equity securities 1,660 1,129 500 473
P=202,520 P=111,288 P=188,676 P=92,144
The equity securities are irrevocably designated at FVOCI as these are held for long term-strategicpurpose rather than for trading. These equity securities include golf club shares and non-marketableequity securities. As part of its risk management, the Group disposed equity securities at FVOCI withtotal carrying value of P=771.4 million and recognized a loss on disposal charged against ‘Surplus’ ofP=121.8 million in 2018.
Outstanding equity securities at FVOCI as of December 31, 2019 and 2018 generated dividendsamounting to P=40.0 million and P=126.5 million, respectively for the Group and P=11.3 million and P=23.1 million, respectively, for the Parent Company. No dividends were recognized in 2019 and2018 for the disposed equity securities at FVOCI.
As of December 31, 2019 and 2018, the ECL on debt securities at FVOCI (included in ‘Netunrealized loss on investment securities at FVOCI’) amounted to P=148.3 million and P=247.7 millionrespectively, for the Group and P=144.9 million and P=244.3 million, respectively, for the ParentCompany (Note 15).
As of December 31, 2019 and 2018, investment securities at FVOCI include floating and fixed rateprivate notes with total carrying value of USD11.02 million and USD10.9 million, respectively (withpeso equivalent of P=558.2 million and P=573.9 million, respectively) which are pledged by the ParentCompany’s New York Branch in compliance with the regulatory requirements of the Federal DepositInsurance Corporation and the Office of the Controller of the Currency in New York.
As of December 31, 2018, investment securities at FVOCI also include US treasury notes withcarrying value of USD1.0 million (with peso equivalent of P=52.6 million) which are pledged by MRUSA to the State Treasury Office pursuant to the California Financial Code and in accordance withthe requirements of the California Department of Business Oversight relative to its license as atransmitter of money (Note 11). In 2019, upon the merger of MR USA with MRCI, the former is nolonger required to pledge securities tp the State Treasury Office due to change in its business type(i.e., from money remittance to holding company).
The movements in net unrealized gains/(losses), including share in net unrealized gains/(losses) ofsubsidiaries (Note 11), presented under ‘Equity’ in the statements of financial position are as follows:
Consolidated Parent Company2019 2018 2019 2018
Balance at beginning of the year (P=3,134) (P=463) (P=2,994) (P=445)Unrealized gains/(loss) recognized in OCI* 10,201 (2,468) 9,495 (2,294)Amounts realized in surplus (19) 122 (19) 122Amounts realized in profit or loss (4,403) 115 (3,788) 24
2,645 (2,694) 2,694 (2,593)Tax (Note 28) (70) (440) (65) (401)Balance at end of the year P=2,575** (P=3,134)** P=2,629 (P=2,994)
* Includes impact of ECL (Note 15) ** Includes share of non-controlling interest in unrealized losses amounting to P=54.0 million and P=139.4 million as of December 31, 2019 and 2018,
respectively.
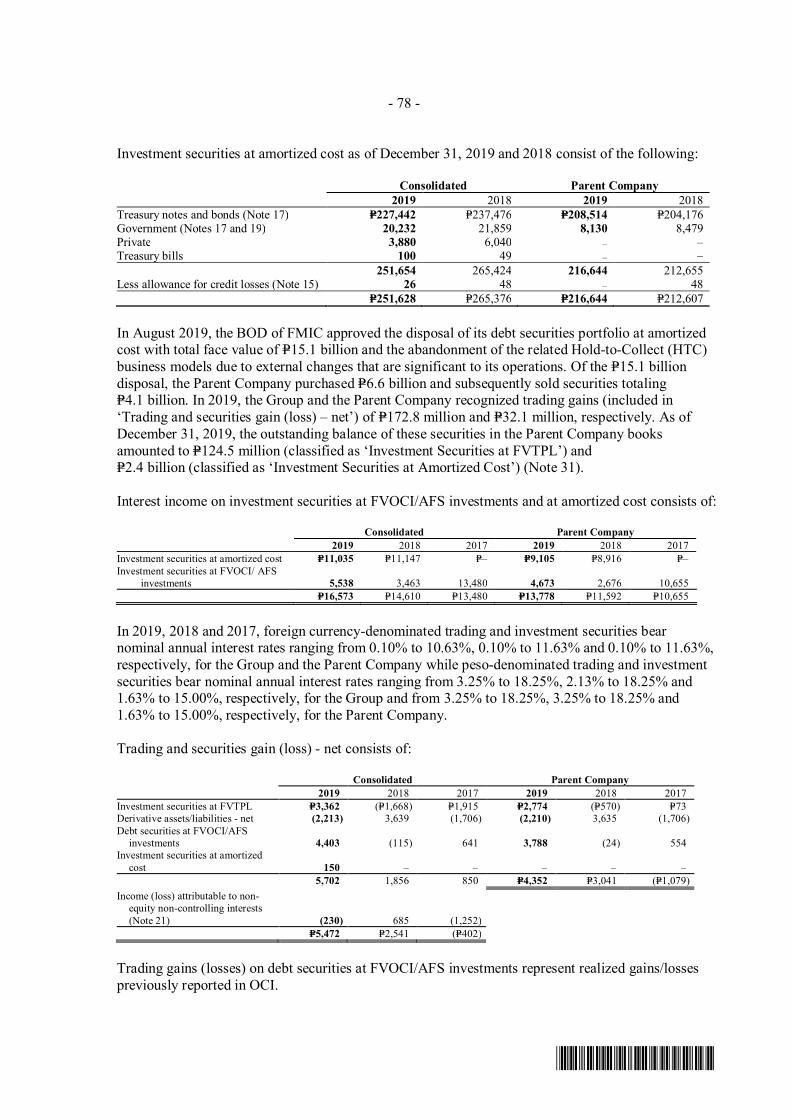
- 78 -
*SGVFS038804*
Investment securities at amortized cost as of December 31, 2019 and 2018 consist of the following:
Consolidated Parent Company2019 2018 2019 2018
Treasury notes and bonds (Note 17) P=227,442 P=237,476 P=208,514 P=204,176Government (Notes 17 and 19) 20,232 21,859 8,130 8,479Private 3,880 6,040 – –Treasury bills 100 49 – –
251,654 265,424 216,644 212,655Less allowance for credit losses (Note 15) 26 48 – 48
P=251,628 P=265,376 P=216,644 P=212,607
In August 2019, the BOD of FMIC approved the disposal of its debt securities portfolio at amortizedcost with total face value of P=15.1 billion and the abandonment of the related Hold-to-Collect (HTC)business models due to external changes that are significant to its operations. Of the P=15.1 billiondisposal, the Parent Company purchased P=6.6 billion and subsequently sold securities totalingP=4.1 billion. In 2019, the Group and the Parent Company recognized trading gains (included in‘Trading and securities gain (loss) – net’) of P=172.8 million and P=32.1 million, respectively. As ofDecember 31, 2019, the outstanding balance of these securities in the Parent Company booksamounted to P=124.5 million (classified as ‘Investment Securities at FVTPL’) andP=2.4 billion (classified as ‘Investment Securities at Amortized Cost’) (Note 31).
Interest income on investment securities at FVOCI/AFS investments and at amortized cost consists of:
Consolidated Parent Company2019 2018 2017 2019 2018 2017
Investment securities at amortized cost P=11,035 P=11,147 P=– P=9,105 P=8,916 P=–Investment securities at FVOCI/ AFS
investments 5,538 3,463 13,480 4,673 2,676 10,655P=16,573 P=14,610 P=13,480 P=13,778 P=11,592 P=10,655
In 2019, 2018 and 2017, foreign currency-denominated trading and investment securities bearnominal annual interest rates ranging from 0.10% to 10.63%, 0.10% to 11.63% and 0.10% to 11.63%,respectively, for the Group and the Parent Company while peso-denominated trading and investmentsecurities bear nominal annual interest rates ranging from 3.25% to 18.25%, 2.13% to 18.25% and1.63% to 15.00%, respectively, for the Group and from 3.25% to 18.25%, 3.25% to 18.25% and1.63% to 15.00%, respectively, for the Parent Company.
Trading and securities gain (loss) - net consists of:
Consolidated Parent Company2019 2018 2017 2019 2018 2017
Investment securities at FVTPL P=3,362 (P=1,668) P=1,915 P=2,774 (P=570) P=73Derivative assets/liabilities - net (2,213) 3,639 (1,706) (2,210) 3,635 (1,706)Debt securities at FVOCI/AFS
investments 4,403 (115) 641 3,788 (24) 554Investment securities at amortized
cost 150 – – – – –5,702 1,856 850 P=4,352 P=3,041 (P=1,079)
Income (loss) attributable to non-equity non-controlling interests(Note 21) (230) 685 (1,252)
P=5,472 P=2,541 (P=402)
Trading gains (losses) on debt securities at FVOCI/AFS investments represent realized gains/lossespreviously reported in OCI.
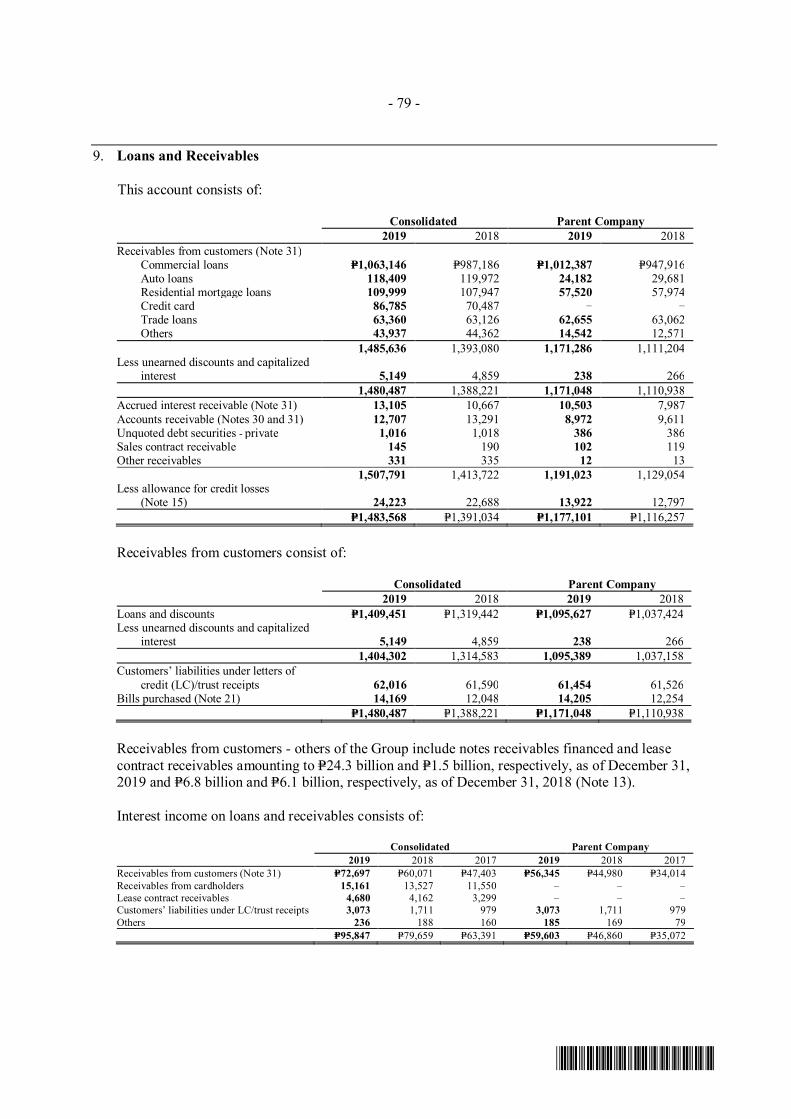
- 79 -
*SGVFS038804*
9. Loans and Receivables
This account consists of:
Consolidated Parent Company2019 2018 2019 2018
Receivables from customers (Note 31)Commercial loans P=1,063,146 P=987,186 P=1,012,387 P=947,916Auto loans 118,409 119,972 24,182 29,681Residential mortgage loans 109,999 107,947 57,520 57,974Credit card 86,785 70,487 – –Trade loans 63,360 63,126 62,655 63,062
Others 43,937 44,362 14,542 12,5711,485,636 1,393,080 1,171,286 1,111,204
Less unearned discounts and capitalizedinterest 5,149 4,859 238 266
1,480,487 1,388,221 1,171,048 1,110,938Accrued interest receivable (Note 31) 13,105 10,667 10,503 7,987Accounts receivable (Notes 30 and 31) 12,707 13,291 8,972 9,611Unquoted debt securities - private 1,016 1,018 386 386Sales contract receivable 145 190 102 119Other receivables 331 335 12 13
1,507,791 1,413,722 1,191,023 1,129,054Less allowance for credit losses
(Note 15) 24,223 22,688 13,922 12,797P=1,483,568 P=1,391,034 P=1,177,101 P=1,116,257
Receivables from customers consist of:
Consolidated Parent Company2019 2018 2019 2018
Loans and discounts P=1,409,451 P=1,319,442 P=1,095,627 P=1,037,424Less unearned discounts and capitalized
interest 5,149 4,859 238 2661,404,302 1,314,583 1,095,389 1,037,158
Customers’ liabilities under letters ofcredit (LC)/trust receipts 62,016 61,590 61,454 61,526
Bills purchased (Note 21) 14,169 12,048 14,205 12,254P=1,480,487 P=1,388,221 P=1,171,048 P=1,110,938
Receivables from customers - others of the Group include notes receivables financed and leasecontract receivables amounting to P=24.3 billion and P=1.5 billion, respectively, as of December 31,2019 and P=6.8 billion and P=6.1 billion, respectively, as of December 31, 2018 (Note 13).
Interest income on loans and receivables consists of:
Consolidated Parent Company2019 2018 2017 2019 2018 2017
Receivables from customers (Note 31) P=72,697 P=60,071 P=47,403 P=56,345 P=44,980 P=34,014Receivables from cardholders 15,161 13,527 11,550 – – –Lease contract receivables 4,680 4,162 3,299 – – –Customers’ liabilities under LC/trust receipts 3,073 1,711 979 3,073 1,711 979Others 236 188 160 185 169 79
P=95,847 P=79,659 P=63,391 P=59,603 P=46,860 P=35,072
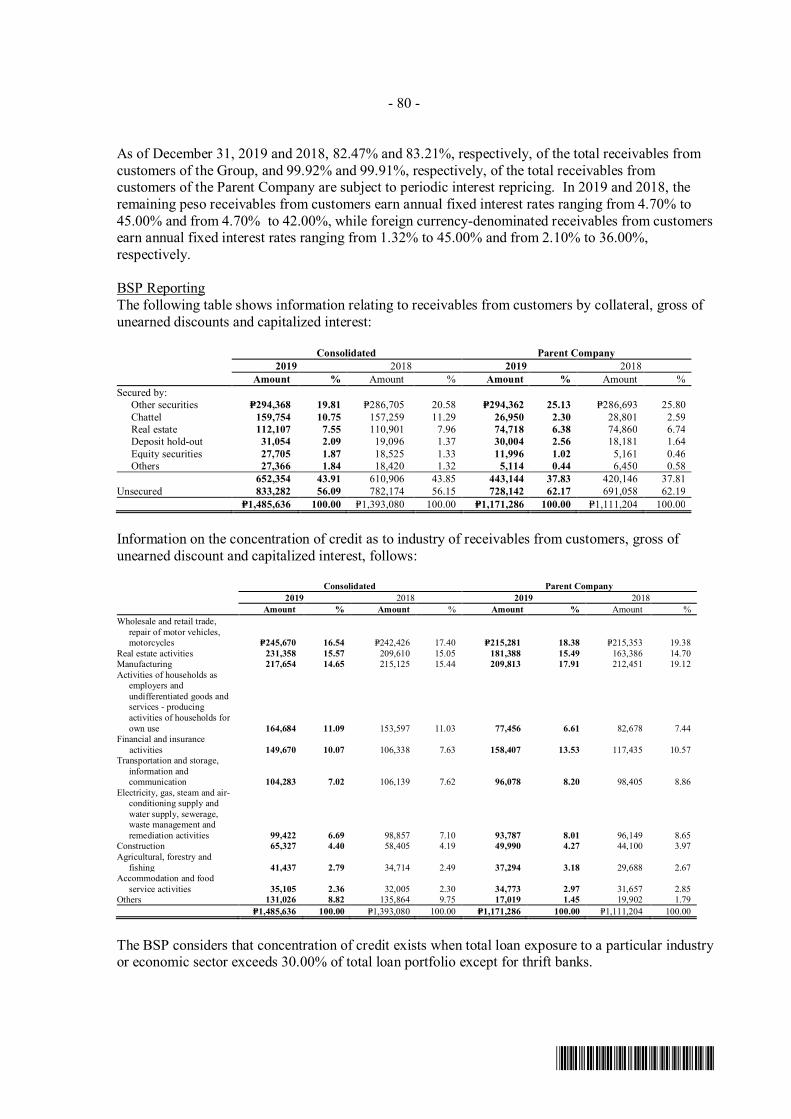
- 80 -
*SGVFS038804*
As of December 31, 2019 and 2018, 82.47% and 83.21%, respectively, of the total receivables fromcustomers of the Group, and 99.92% and 99.91%, respectively, of the total receivables fromcustomers of the Parent Company are subject to periodic interest repricing. In 2019 and 2018, theremaining peso receivables from customers earn annual fixed interest rates ranging from 4.70% to45.00% and from 4.70% to 42.00%, while foreign currency-denominated receivables from customersearn annual fixed interest rates ranging from 1.32% to 45.00% and from 2.10% to 36.00%,respectively.
BSP ReportingThe following table shows information relating to receivables from customers by collateral, gross ofunearned discounts and capitalized interest:
Consolidated Parent Company2019 2018 2019 2018
Amount % Amount % Amount % Amount %Secured by: Other securities P=294,368 19.81 P=286,705 20.58 P=294,362 25.13 P=286,693 25.80
Chattel 159,754 10.75 157,259 11.29 26,950 2.30 28,801 2.59Real estate 112,107 7.55 110,901 7.96 74,718 6.38 74,860 6.74
Deposit hold-out 31,054 2.09 19,096 1.37 30,004 2.56 18,181 1.64Equity securities 27,705 1.87 18,525 1.33 11,996 1.02 5,161 0.46Others 27,366 1.84 18,420 1.32 5,114 0.44 6,450 0.58
652,354 43.91 610,906 43.85 443,144 37.83 420,146 37.81Unsecured 833,282 56.09 782,174 56.15 728,142 62.17 691,058 62.19
P=1,485,636 100.00 P=1,393,080 100.00 P=1,171,286 100.00 P=1,111,204 100.00
Information on the concentration of credit as to industry of receivables from customers, gross ofunearned discount and capitalized interest, follows:
Consolidated Parent Company2019 2018 2019 2018
Amount % Amount % Amount % Amount %Wholesale and retail trade,
repair of motor vehicles,motorcycles P=245,670 16.54 P=242,426 17.40 P=215,281 18.38 P=215,353 19.38
Real estate activities 231,358 15.57 209,610 15.05 181,388 15.49 163,386 14.70Manufacturing 217,654 14.65 215,125 15.44 209,813 17.91 212,451 19.12Activities of households as
employers andundifferentiated goods andservices - producingactivities of households forown use 164,684 11.09 153,597 11.03 77,456 6.61 82,678 7.44
Financial and insuranceactivities 149,670 10.07 106,338 7.63 158,407 13.53 117,435 10.57
Transportation and storage,information andcommunication 104,283 7.02 106,139 7.62 96,078 8.20 98,405 8.86
Electricity, gas, steam and air-conditioning supply andwater supply, sewerage,waste management andremediation activities 99,422 6.69 98,857 7.10 93,787 8.01 96,149 8.65
Construction 65,327 4.40 58,405 4.19 49,990 4.27 44,100 3.97Agricultural, forestry and
fishing 41,437 2.79 34,714 2.49 37,294 3.18 29,688 2.67Accommodation and food
service activities 35,105 2.36 32,005 2.30 34,773 2.97 31,657 2.85Others 131,026 8.82 135,864 9.75 17,019 1.45 19,902 1.79
P=1,485,636 100.00 P=1,393,080 100.00 P=1,171,286 100.00 P=1,111,204 100.00
The BSP considers that concentration of credit exists when total loan exposure to a particular industryor economic sector exceeds 30.00% of total loan portfolio except for thrift banks.
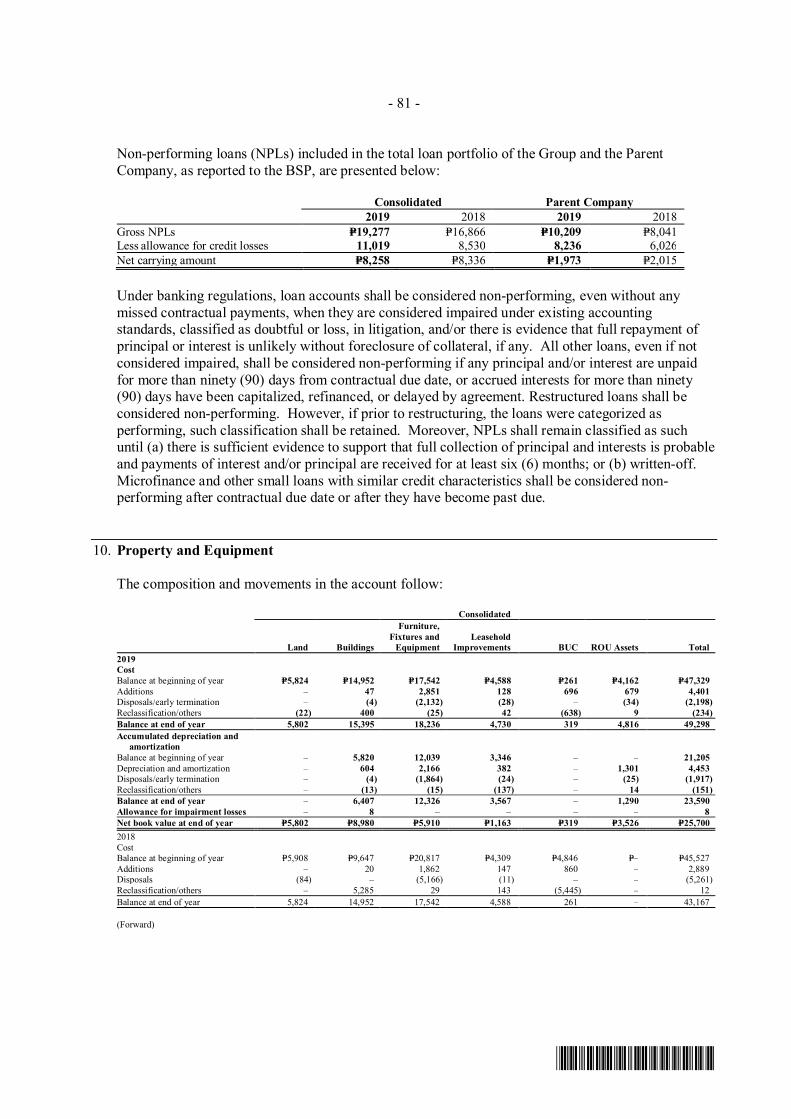
- 81 -
*SGVFS038804*
Non-performing loans (NPLs) included in the total loan portfolio of the Group and the ParentCompany, as reported to the BSP, are presented below:
Consolidated Parent Company2019 2018 2019 2018
Gross NPLs P=19,277 P=16,866 P=10,209 P=8,041Less allowance for credit losses 11,019 8,530 8,236 6,026Net carrying amount P=8,258 P=8,336 P=1,973 P=2,015
Under banking regulations, loan accounts shall be considered non-performing, even without anymissed contractual payments, when they are considered impaired under existing accountingstandards, classified as doubtful or loss, in litigation, and/or there is evidence that full repayment ofprincipal or interest is unlikely without foreclosure of collateral, if any. All other loans, even if notconsidered impaired, shall be considered non-performing if any principal and/or interest are unpaidfor more than ninety (90) days from contractual due date, or accrued interests for more than ninety(90) days have been capitalized, refinanced, or delayed by agreement. Restructured loans shall beconsidered non-performing. However, if prior to restructuring, the loans were categorized asperforming, such classification shall be retained. Moreover, NPLs shall remain classified as suchuntil (a) there is sufficient evidence to support that full collection of principal and interests is probableand payments of interest and/or principal are received for at least six (6) months; or (b) written-off.Microfinance and other small loans with similar credit characteristics shall be considered non-performing after contractual due date or after they have become past due.
10. Property and Equipment
The composition and movements in the account follow:
Consolidated
Land Buildings
Furniture,Fixtures and
EquipmentLeasehold
Improvements BUC ROU Assets Total2019CostBalance at beginning of year P=5,824 P=14,952 P=17,542 P=4,588 P=261 P=4,162 P=47,329Additions – 47 2,851 128 696 679 4,401Disposals/early termination – (4) (2,132) (28) – (34) (2,198)Reclassification/others (22) 400 (25) 42 (638) 9 (234)Balance at end of year 5,802 15,395 18,236 4,730 319 4,816 49,298Accumulated depreciation and
amortizationBalance at beginning of year – 5,820 12,039 3,346 – – 21,205Depreciation and amortization – 604 2,166 382 – 1,301 4,453Disposals/early termination – (4) (1,864) (24) – (25) (1,917)Reclassification/others – (13) (15) (137) – 14 (151)Balance at end of year – 6,407 12,326 3,567 – 1,290 23,590Allowance for impairment losses – 8 – – – – 8Net book value at end of year P=5,802 P=8,980 P=5,910 P=1,163 P=319 P=3,526 P=25,7002018CostBalance at beginning of year P=5,908 P=9,647 P=20,817 P=4,309 P=4,846 P=– P=45,527Additions – 20 1,862 147 860 – 2,889Disposals (84) – (5,166) (11) – – (5,261)Reclassification/others – 5,285 29 143 (5,445) – 12Balance at end of year 5,824 14,952 17,542 4,588 261 – 43,167
(Forward)
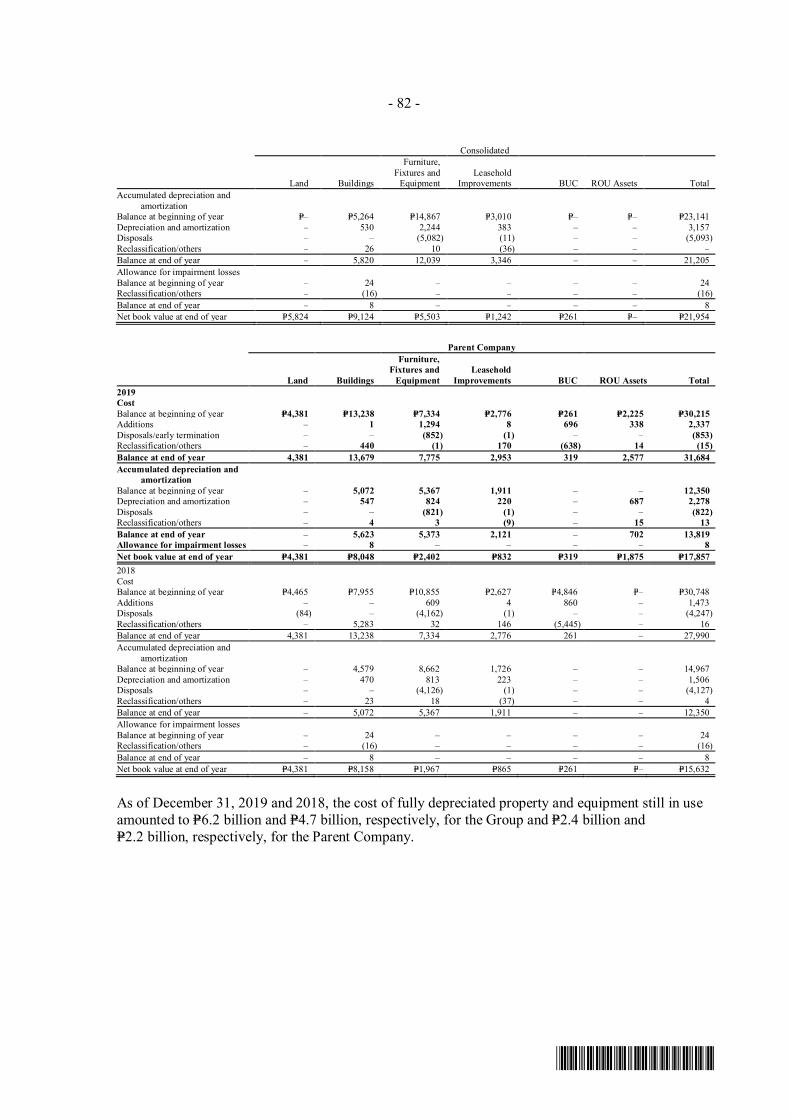
- 82 -
*SGVFS038804*
Consolidated
Land Buildings
Furniture,Fixtures and
EquipmentLeasehold
Improvements BUC ROU Assets TotalAccumulated depreciation and
amortizationBalance at beginning of year P=– P=5,264 P=14,867 P=3,010 P=– P=– P=23,141Depreciation and amortization – 530 2,244 383 – – 3,157Disposals – – (5,082) (11) – – (5,093)Reclassification/others – 26 10 (36) – – –Balance at end of year – 5,820 12,039 3,346 – – 21,205Allowance for impairment lossesBalance at beginning of year – 24 – – – – 24Reclassification/others – (16) – – – – (16)Balance at end of year – 8 – – – – 8Net book value at end of year P=5,824 P=9,124 P=5,503 P=1,242 P=261 P=– P=21,954
Parent Company
Land Buildings
Furniture,Fixtures and
EquipmentLeasehold
Improvements BUC ROU Assets Total2019CostBalance at beginning of year P=4,381 P=13,238 P=7,334 P=2,776 P=261 P=2,225 P=30,215Additions – 1 1,294 8 696 338 2,337Disposals/early termination – – (852) (1) – – (853)Reclassification/others – 440 (1) 170 (638) 14 (15)Balance at end of year 4,381 13,679 7,775 2,953 319 2,577 31,684Accumulated depreciation and
amortizationBalance at beginning of year – 5,072 5,367 1,911 – – 12,350Depreciation and amortization – 547 824 220 – 687 2,278Disposals – – (821) (1) – – (822)Reclassification/others – 4 3 (9) – 15 13Balance at end of year – 5,623 5,373 2,121 – 702 13,819Allowance for impairment losses – 8 – – – – 8Net book value at end of year P=4,381 P=8,048 P=2,402 P=832 P=319 P=1,875 P=17,8572018CostBalance at beginning of year P=4,465 P=7,955 P=10,855 P=2,627 P=4,846 P=– P=30,748Additions – – 609 4 860 – 1,473Disposals (84) – (4,162) (1) – – (4,247)Reclassification/others – 5,283 32 146 (5,445) – 16Balance at end of year 4,381 13,238 7,334 2,776 261 – 27,990Accumulated depreciation and
amortizationBalance at beginning of year – 4,579 8,662 1,726 – – 14,967Depreciation and amortization – 470 813 223 – – 1,506Disposals – – (4,126) (1) – – (4,127)Reclassification/others – 23 18 (37) – – 4Balance at end of year – 5,072 5,367 1,911 – – 12,350Allowance for impairment lossesBalance at beginning of year – 24 – – – – 24Reclassification/others – (16) – – – – (16)Balance at end of year – 8 – – – – 8Net book value at end of year P=4,381 P=8,158 P=1,967 P=865 P=261 P=– P=15,632
As of December 31, 2019 and 2018, the cost of fully depreciated property and equipment still in useamounted to P=6.2 billion and P=4.7 billion, respectively, for the Group and P=2.4 billion andP=2.2 billion, respectively, for the Parent Company.
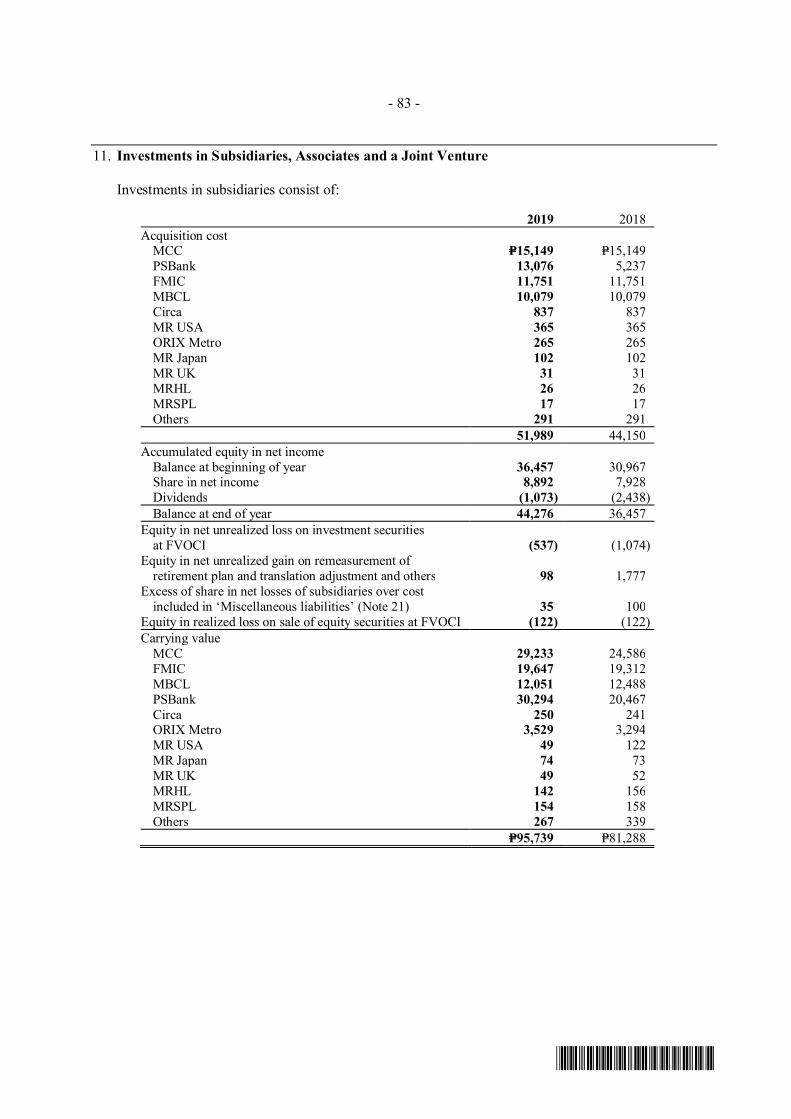
- 83 -
*SGVFS038804*
11. Investments in Subsidiaries, Associates and a Joint Venture
Investments in subsidiaries consist of:
2019 2018Acquisition cost
MCC P=15,149 P=15,149PSBank 13,076 5,237FMIC 11,751 11,751MBCL 10,079 10,079Circa 837 837MR USA 365 365ORIX Metro 265 265MR Japan 102 102MR UK 31 31MRHL 26 26MRSPL 17 17Others 291 291
51,989 44,150Accumulated equity in net income
Balance at beginning of year 36,457 30,967Share in net income 8,892 7,928Dividends (1,073) (2,438)Balance at end of year 44,276 36,457
Equity in net unrealized loss on investment securitiesat FVOCI (537) (1,074)
Equity in net unrealized gain on remeasurement ofretirement plan and translation adjustment and others 98 1,777
Excess of share in net losses of subsidiaries over costincluded in ‘Miscellaneous liabilities’ (Note 21) 35 100
Equity in realized loss on sale of equity securities at FVOCI (122) (122)Carrying value
MCC 29,233 24,586FMIC 19,647 19,312MBCL 12,051 12,488PSBank 30,294 20,467Circa 250 241ORIX Metro 3,529 3,294MR USA 49 122MR Japan 74 73MR UK 49 52MRHL 142 156MRSPL 154 158Others 267 339
P=95,739 P=81,288
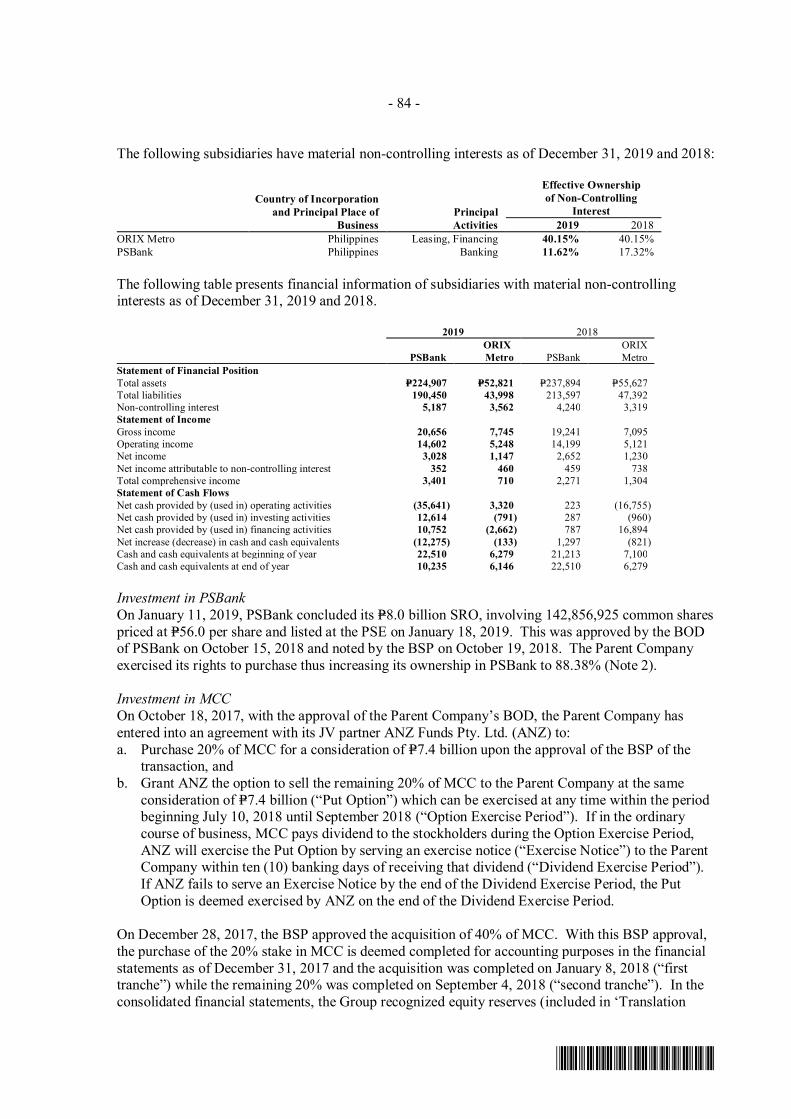
- 84 -
*SGVFS038804*
The following subsidiaries have material non-controlling interests as of December 31, 2019 and 2018:
Country of Incorporationand Principal Place of
BusinessPrincipalActivities
Effective Ownershipof Non-Controlling
Interest2019 2018
ORIX Metro Philippines Leasing, Financing 40.15% 40.15%PSBank Philippines Banking 11.62% 17.32%
The following table presents financial information of subsidiaries with material non-controllinginterests as of December 31, 2019 and 2018.
2019 2018
PSBankORIXMetro PSBank
ORIXMetro
Statement of Financial PositionTotal assets P=224,907 P=52,821 P=237,894 P=55,627Total liabilities 190,450 43,998 213,597 47,392Non-controlling interest 5,187 3,562 4,240 3,319Statement of IncomeGross income 20,656 7,745 19,241 7,095Operating income 14,602 5,248 14,199 5,121Net income 3,028 1,147 2,652 1,230Net income attributable to non-controlling interest 352 460 459 738Total comprehensive income 3,401 710 2,271 1,304Statement of Cash FlowsNet cash provided by (used in) operating activities (35,641) 3,320 223 (16,755)Net cash provided by (used in) investing activities 12,614 (791) 287 (960)Net cash provided by (used in) financing activities 10,752 (2,662) 787 16,894Net increase (decrease) in cash and cash equivalents (12,275) (133) 1,297 (821)Cash and cash equivalents at beginning of year 22,510 6,279 21,213 7,100Cash and cash equivalents at end of year 10,235 6,146 22,510 6,279
Investment in PSBankOn January 11, 2019, PSBank concluded its P=8.0 billion SRO, involving 142,856,925 common sharespriced at P=56.0 per share and listed at the PSE on January 18, 2019. This was approved by the BODof PSBank on October 15, 2018 and noted by the BSP on October 19, 2018. The Parent Companyexercised its rights to purchase thus increasing its ownership in PSBank to 88.38% (Note 2).
Investment in MCCOn October 18, 2017, with the approval of the Parent Company’s BOD, the Parent Company hasentered into an agreement with its JV partner ANZ Funds Pty. Ltd. (ANZ) to:a. Purchase 20% of MCC for a consideration of P=7.4 billion upon the approval of the BSP of the
transaction, andb. Grant ANZ the option to sell the remaining 20% of MCC to the Parent Company at the same
consideration of P=7.4 billion (“Put Option”) which can be exercised at any time within the periodbeginning July 10, 2018 until September 2018 (“Option Exercise Period”). If in the ordinarycourse of business, MCC pays dividend to the stockholders during the Option Exercise Period,ANZ will exercise the Put Option by serving an exercise notice (“Exercise Notice”) to the ParentCompany within ten (10) banking days of receiving that dividend (“Dividend Exercise Period”).If ANZ fails to serve an Exercise Notice by the end of the Dividend Exercise Period, the PutOption is deemed exercised by ANZ on the end of the Dividend Exercise Period.
On December 28, 2017, the BSP approved the acquisition of 40% of MCC. With this BSP approval,the purchase of the 20% stake in MCC is deemed completed for accounting purposes in the financialstatements as of December 31, 2017 and the acquisition was completed on January 8, 2018 (“firsttranche”) while the remaining 20% was completed on September 4, 2018 (“second tranche”). In theconsolidated financial statements, the Group recognized equity reserves (included in ‘Translation
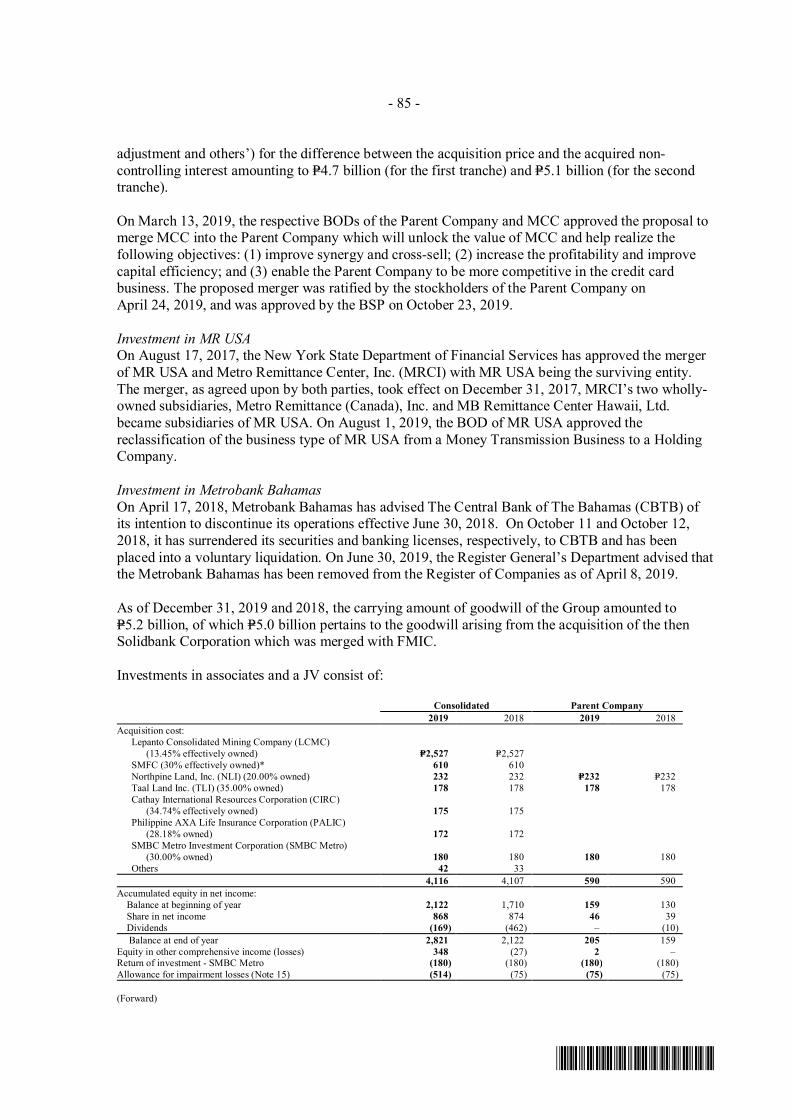
- 85 -
*SGVFS038804*
adjustment and others’) for the difference between the acquisition price and the acquired non-controlling interest amounting to P=4.7 billion (for the first tranche) and P=5.1 billion (for the secondtranche).
On March 13, 2019, the respective BODs of the Parent Company and MCC approved the proposal tomerge MCC into the Parent Company which will unlock the value of MCC and help realize thefollowing objectives: (1) improve synergy and cross-sell; (2) increase the profitability and improvecapital efficiency; and (3) enable the Parent Company to be more competitive in the credit cardbusiness. The proposed merger was ratified by the stockholders of the Parent Company onApril 24, 2019, and was approved by the BSP on October 23, 2019.
Investment in MR USAOn August 17, 2017, the New York State Department of Financial Services has approved the mergerof MR USA and Metro Remittance Center, Inc. (MRCI) with MR USA being the surviving entity.The merger, as agreed upon by both parties, took effect on December 31, 2017, MRCI’s two wholly-owned subsidiaries, Metro Remittance (Canada), Inc. and MB Remittance Center Hawaii, Ltd.became subsidiaries of MR USA. On August 1, 2019, the BOD of MR USA approved thereclassification of the business type of MR USA from a Money Transmission Business to a HoldingCompany.
Investment in Metrobank BahamasOn April 17, 2018, Metrobank Bahamas has advised The Central Bank of The Bahamas (CBTB) ofits intention to discontinue its operations effective June 30, 2018. On October 11 and October 12,2018, it has surrendered its securities and banking licenses, respectively, to CBTB and has beenplaced into a voluntary liquidation. On June 30, 2019, the Register General’s Department advised thatthe Metrobank Bahamas has been removed from the Register of Companies as of April 8, 2019.
As of December 31, 2019 and 2018, the carrying amount of goodwill of the Group amounted toP=5.2 billion, of which P=5.0 billion pertains to the goodwill arising from the acquisition of the thenSolidbank Corporation which was merged with FMIC.
Investments in associates and a JV consist of:
Consolidated Parent Company2019 2018 2019 2018
Acquisition cost:Lepanto Consolidated Mining Company (LCMC) (13.45% effectively owned) P=2,527 P=2,527SMFC (30% effectively owned)* 610 610Northpine Land, Inc. (NLI) (20.00% owned) 232 232 P=232 P=232Taal Land Inc. (TLI) (35.00% owned) 178 178 178 178Cathay International Resources Corporation (CIRC) (34.74% effectively owned) 175 175Philippine AXA Life Insurance Corporation (PALIC) (28.18% owned) 172 172SMBC Metro Investment Corporation (SMBC Metro) (30.00% owned) 180 180 180 180Others 42 33
4,116 4,107 590 590Accumulated equity in net income:
Balance at beginning of year 2,122 1,710 159 130Share in net income 868 874 46 39Dividends (169) (462) – (10)Balance at end of year 2,821 2,122 205 159
Equity in other comprehensive income (losses) 348 (27) 2 –Return of investment - SMBC Metro (180) (180) (180) (180)Allowance for impairment losses (Note 15) (514) (75) (75) (75)
(Forward)
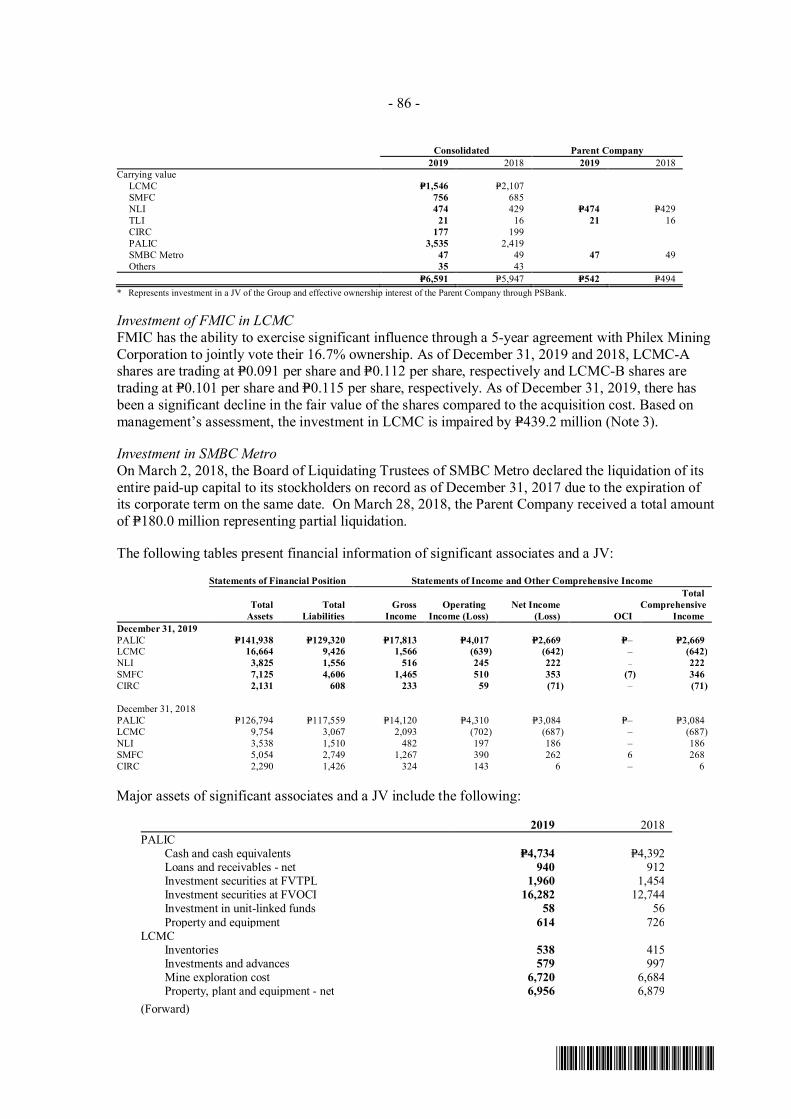
- 86 -
*SGVFS038804*
Consolidated Parent Company2019 2018 2019 2018
Carrying value LCMC P=1,546 P=2,107 SMFC 756 685 NLI 474 429 P=474 P=429 TLI 21 16 21 16 CIRC 177 199 PALIC 3,535 2,419 SMBC Metro 47 49 47 49 Others 35 43
P=6,591 P=5,947 P=542 P=494* Represents investment in a JV of the Group and effective ownership interest of the Parent Company through PSBank.
Investment of FMIC in LCMCFMIC has the ability to exercise significant influence through a 5-year agreement with Philex MiningCorporation to jointly vote their 16.7% ownership. As of December 31, 2019 and 2018, LCMC-Ashares are trading at P=0.091 per share and P=0.112 per share, respectively and LCMC-B shares aretrading at P=0.101 per share and P=0.115 per share, respectively. As of December 31, 2019, there hasbeen a significant decline in the fair value of the shares compared to the acquisition cost. Based onmanagement’s assessment, the investment in LCMC is impaired by P=439.2 million (Note 3).
Investment in SMBC MetroOn March 2, 2018, the Board of Liquidating Trustees of SMBC Metro declared the liquidation of itsentire paid-up capital to its stockholders on record as of December 31, 2017 due to the expiration ofits corporate term on the same date. On March 28, 2018, the Parent Company received a total amountof P=180.0 million representing partial liquidation.
The following tables present financial information of significant associates and a JV:
Statements of Financial Position Statements of Income and Other Comprehensive Income
TotalAssets
TotalLiabilities
GrossIncome
OperatingIncome (Loss)
Net Income(Loss) OCI
TotalComprehensive
IncomeDecember 31, 2019PALIC P=141,938 P=129,320 P=17,813 P=4,017 P=2,669 P=– P=2,669LCMC 16,664 9,426 1,566 (639) (642) – (642)NLI 3,825 1,556 516 245 222 – 222SMFC 7,125 4,606 1,465 510 353 (7) 346CIRC 2,131 608 233 59 (71) – (71)
December 31, 2018PALIC P=126,794 P=117,559 P=14,120 P=4,310 P=3,084 P=– P=3,084LCMC 9,754 3,067 2,093 (702) (687) – (687)NLI 3,538 1,510 482 197 186 – 186SMFC 5,054 2,749 1,267 390 262 6 268CIRC 2,290 1,426 324 143 6 – 6
Major assets of significant associates and a JV include the following:
2019 2018PALIC
Cash and cash equivalents P=4,734 P=4,392Loans and receivables - net 940 912Investment securities at FVTPL 1,960 1,454Investment securities at FVOCI 16,282 12,744
Investment in unit-linked funds 58 56Property and equipment 614 726
LCMCInventories 538 415Investments and advances 579 997Mine exploration cost 6,720 6,684Property, plant and equipment - net 6,956 6,879
(Forward)
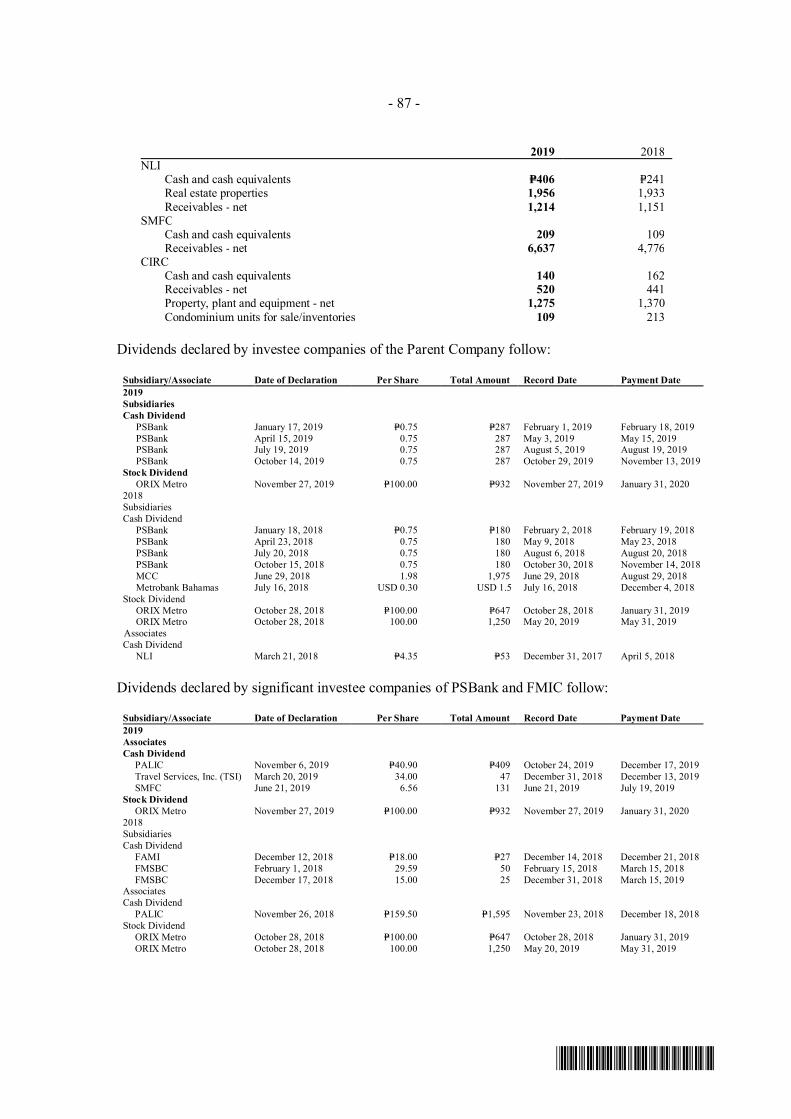
- 87 -
*SGVFS038804*
2019 2018NLI
Cash and cash equivalents P=406 P=241 Real estate properties 1,956 1,933
Receivables - net 1,214 1,151SMFC
Cash and cash equivalents 209 109Receivables - net 6,637 4,776
CIRCCash and cash equivalents 140 162Receivables - net 520 441
Property, plant and equipment - net 1,275 1,370Condominium units for sale/inventories 109 213
Dividends declared by investee companies of the Parent Company follow:
Subsidiary/Associate Date of Declaration Per Share Total Amount Record Date Payment Date2019SubsidiariesCash Dividend
PSBank January 17, 2019 P=0.75 P=287 February 1, 2019 February 18, 2019PSBank April 15, 2019 0.75 287 May 3, 2019 May 15, 2019PSBank July 19, 2019 0.75 287 August 5, 2019 August 19, 2019PSBank October 14, 2019 0.75 287 October 29, 2019 November 13, 2019
Stock DividendORIX Metro November 27, 2019 P=100.00 P=932 November 27, 2019 January 31, 2020
2018SubsidiariesCash Dividend
PSBank January 18, 2018 P=0.75 P=180 February 2, 2018 February 19, 2018PSBank April 23, 2018 0.75 180 May 9, 2018 May 23, 2018PSBank July 20, 2018 0.75 180 August 6, 2018 August 20, 2018PSBank October 15, 2018 0.75 180 October 30, 2018 November 14, 2018MCC June 29, 2018 1.98 1,975 June 29, 2018 August 29, 2018Metrobank Bahamas July 16, 2018 USD 0.30 USD 1.5 July 16, 2018 December 4, 2018
Stock DividendORIX Metro October 28, 2018 P=100.00 P=647 October 28, 2018 January 31, 2019ORIX Metro October 28, 2018 100.00 1,250 May 20, 2019 May 31, 2019
AssociatesCash Dividend
NLI March 21, 2018 P=4.35 P=53 December 31, 2017 April 5, 2018
Dividends declared by significant investee companies of PSBank and FMIC follow:
Subsidiary/Associate Date of Declaration Per Share Total Amount Record Date Payment Date2019AssociatesCash Dividend
PALIC November 6, 2019 P=40.90 P=409 October 24, 2019 December 17, 2019Travel Services, Inc. (TSI) March 20, 2019 34.00 47 December 31, 2018 December 13, 2019SMFC June 21, 2019 6.56 131 June 21, 2019 July 19, 2019
Stock DividendORIX Metro November 27, 2019 P=100.00 P=932 November 27, 2019 January 31, 2020
2018SubsidiariesCash Dividend
FAMI December 12, 2018 P=18.00 P=27 December 14, 2018 December 21, 2018FMSBC February 1, 2018 29.59 50 February 15, 2018 March 15, 2018FMSBC December 17, 2018 15.00 25 December 31, 2018 March 15, 2019
AssociatesCash Dividend
PALIC November 26, 2018 P=159.50 P=1,595 November 23, 2018 December 18, 2018Stock Dividend
ORIX Metro October 28, 2018 P=100.00 P=647 October 28, 2018 January 31, 2019ORIX Metro October 28, 2018 100.00 1,250 May 20, 2019 May 31, 2019
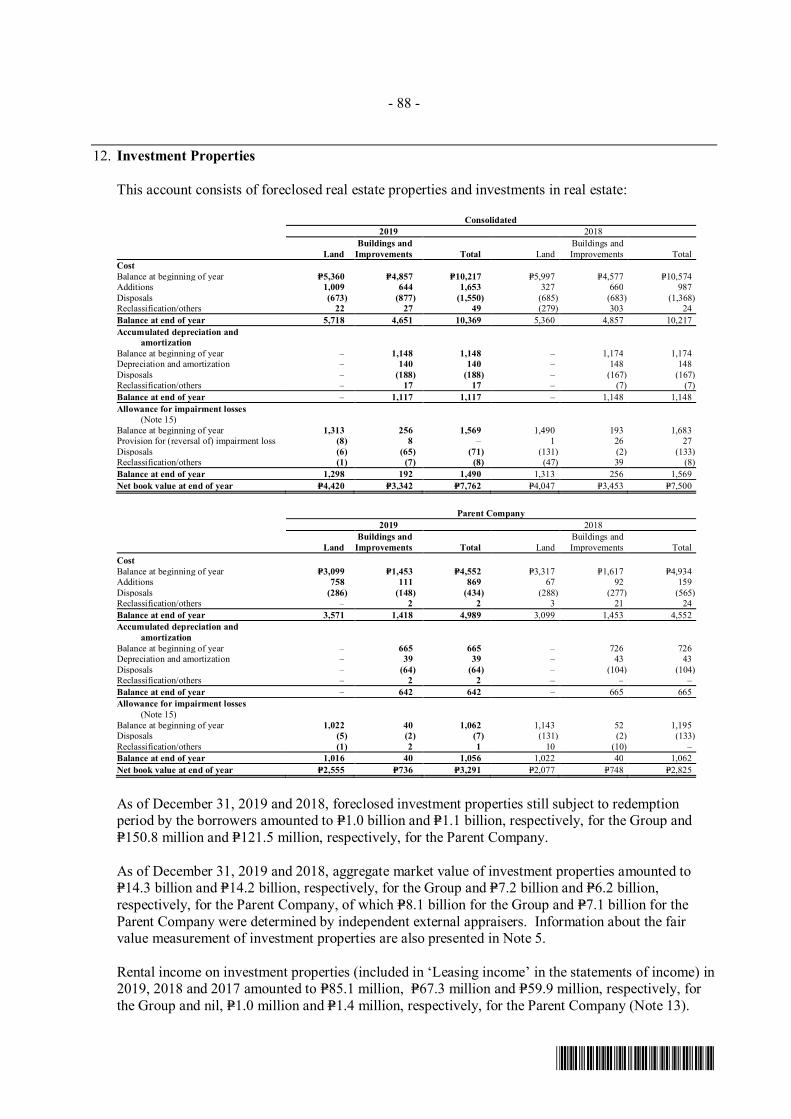
- 88 -
*SGVFS038804*
12. Investment Properties
This account consists of foreclosed real estate properties and investments in real estate:
Consolidated2019 2018
LandBuildings and
Improvements Total LandBuildings andImprovements Total
CostBalance at beginning of year P=5,360 P=4,857 P=10,217 P=5,997 P=4,577 P=10,574Additions 1,009 644 1,653 327 660 987Disposals (673) (877) (1,550) (685) (683) (1,368)Reclassification/others 22 27 49 (279) 303 24Balance at end of year 5,718 4,651 10,369 5,360 4,857 10,217Accumulated depreciation and
amortizationBalance at beginning of year – 1,148 1,148 – 1,174 1,174Depreciation and amortization – 140 140 – 148 148Disposals – (188) (188) – (167) (167)Reclassification/others – 17 17 – (7) (7)Balance at end of year – 1,117 1,117 – 1,148 1,148Allowance for impairment losses
(Note 15)Balance at beginning of year 1,313 256 1,569 1,490 193 1,683Provision for (reversal of) impairment loss (8) 8 – 1 26 27Disposals (6) (65) (71) (131) (2) (133)Reclassification/others (1) (7) (8) (47) 39 (8)Balance at end of year 1,298 192 1,490 1,313 256 1,569Net book value at end of year P=4,420 P=3,342 P=7,762 P=4,047 P=3,453 P=7,500
Parent Company2019 2018
LandBuildings and
Improvements Total LandBuildings andImprovements Total
CostBalance at beginning of year P=3,099 P=1,453 P=4,552 P=3,317 P=1,617 P=4,934Additions 758 111 869 67 92 159Disposals (286) (148) (434) (288) (277) (565)Reclassification/others – 2 2 3 21 24Balance at end of year 3,571 1,418 4,989 3,099 1,453 4,552Accumulated depreciation and
amortizationBalance at beginning of year – 665 665 – 726 726Depreciation and amortization – 39 39 – 43 43Disposals – (64) (64) – (104) (104)Reclassification/others – 2 2 – – –Balance at end of year – 642 642 – 665 665Allowance for impairment losses
(Note 15)Balance at beginning of year 1,022 40 1,062 1,143 52 1,195Disposals (5) (2) (7) (131) (2) (133)Reclassification/others (1) 2 1 10 (10) –Balance at end of year 1,016 40 1,056 1,022 40 1,062Net book value at end of year P=2,555 P=736 P=3,291 P=2,077 P=748 P=2,825
As of December 31, 2019 and 2018, foreclosed investment properties still subject to redemptionperiod by the borrowers amounted to P=1.0 billion and P=1.1 billion, respectively, for the Group andP=150.8 million and P=121.5 million, respectively, for the Parent Company.
As of December 31, 2019 and 2018, aggregate market value of investment properties amounted toP=14.3 billion and P=14.2 billion, respectively, for the Group and P=7.2 billion and P=6.2 billion,respectively, for the Parent Company, of which P=8.1 billion for the Group and P=7.1 billion for theParent Company were determined by independent external appraisers. Information about the fairvalue measurement of investment properties are also presented in Note 5.
Rental income on investment properties (included in ‘Leasing income’ in the statements of income) in2019, 2018 and 2017 amounted to P=85.1 million, P=67.3 million and P=59.9 million, respectively, forthe Group and nil, P=1.0 million and P=1.4 million, respectively, for the Parent Company (Note 13).
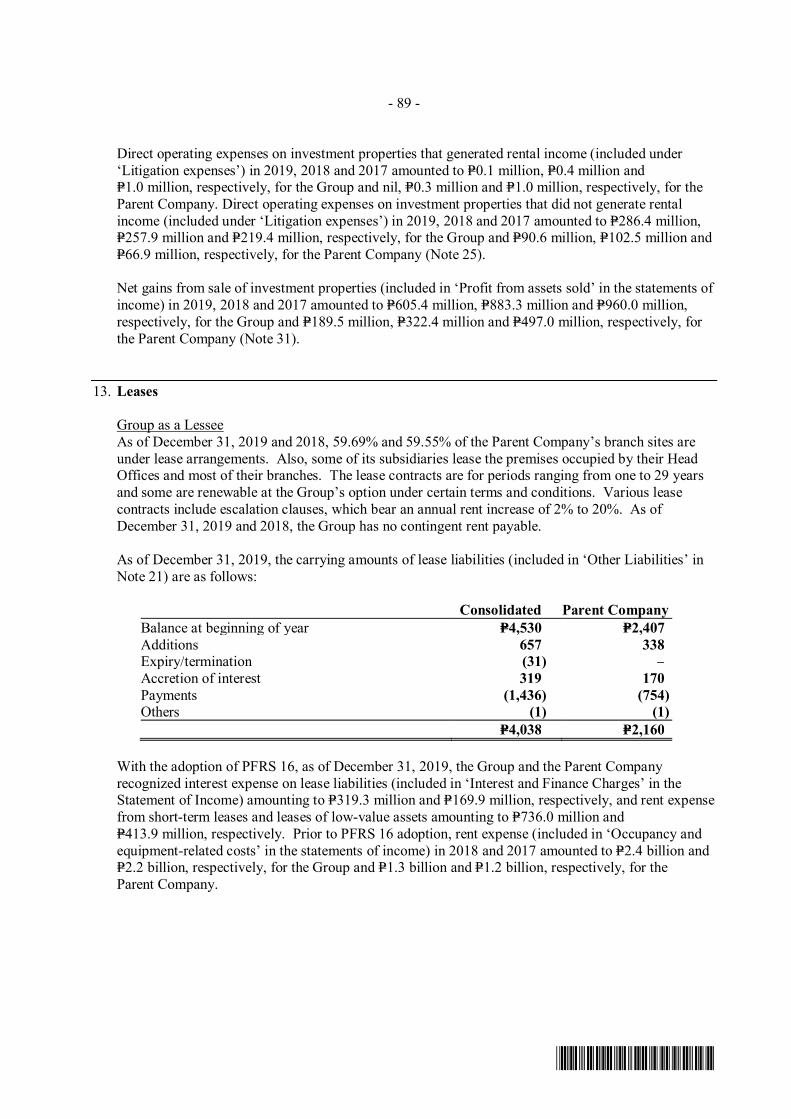
- 89 -
*SGVFS038804*
Direct operating expenses on investment properties that generated rental income (included under‘Litigation expenses’) in 2019, 2018 and 2017 amounted to P=0.1 million, P=0.4 million andP=1.0 million, respectively, for the Group and nil, P=0.3 million and P=1.0 million, respectively, for theParent Company. Direct operating expenses on investment properties that did not generate rentalincome (included under ‘Litigation expenses’) in 2019, 2018 and 2017 amounted to P=286.4 million,P=257.9 million and P=219.4 million, respectively, for the Group and P=90.6 million, P=102.5 million andP=66.9 million, respectively, for the Parent Company (Note 25).
Net gains from sale of investment properties (included in ‘Profit from assets sold’ in the statements ofincome) in 2019, 2018 and 2017 amounted to P=605.4 million, P=883.3 million and P=960.0 million,respectively, for the Group and P=189.5 million, P=322.4 million and P=497.0 million, respectively, forthe Parent Company (Note 31).
13. Leases
Group as a LesseeAs of December 31, 2019 and 2018, 59.69% and 59.55% of the Parent Company’s branch sites areunder lease arrangements. Also, some of its subsidiaries lease the premises occupied by their HeadOffices and most of their branches. The lease contracts are for periods ranging from one to 29 yearsand some are renewable at the Group’s option under certain terms and conditions. Various leasecontracts include escalation clauses, which bear an annual rent increase of 2% to 20%. As ofDecember 31, 2019 and 2018, the Group has no contingent rent payable.
As of December 31, 2019, the carrying amounts of lease liabilities (included in ‘Other Liabilities’ inNote 21) are as follows:
Consolidated Parent CompanyBalance at beginning of year P=4,530 P=2,407Additions 657 338Expiry/termination (31) –Accretion of interest 319 170Payments (1,436) (754)Others (1) (1)
P=4,038 P=2,160
With the adoption of PFRS 16, as of December 31, 2019, the Group and the Parent Companyrecognized interest expense on lease liabilities (included in ‘Interest and Finance Charges’ in theStatement of Income) amounting to P=319.3 million and P=169.9 million, respectively, and rent expensefrom short-term leases and leases of low-value assets amounting to P=736.0 million andP=413.9 million, respectively. Prior to PFRS 16 adoption, rent expense (included in ‘Occupancy andequipment-related costs’ in the statements of income) in 2018 and 2017 amounted to P=2.4 billion andP=2.2 billion, respectively, for the Group and P=1.3 billion and P=1.2 billion, respectively, for theParent Company.
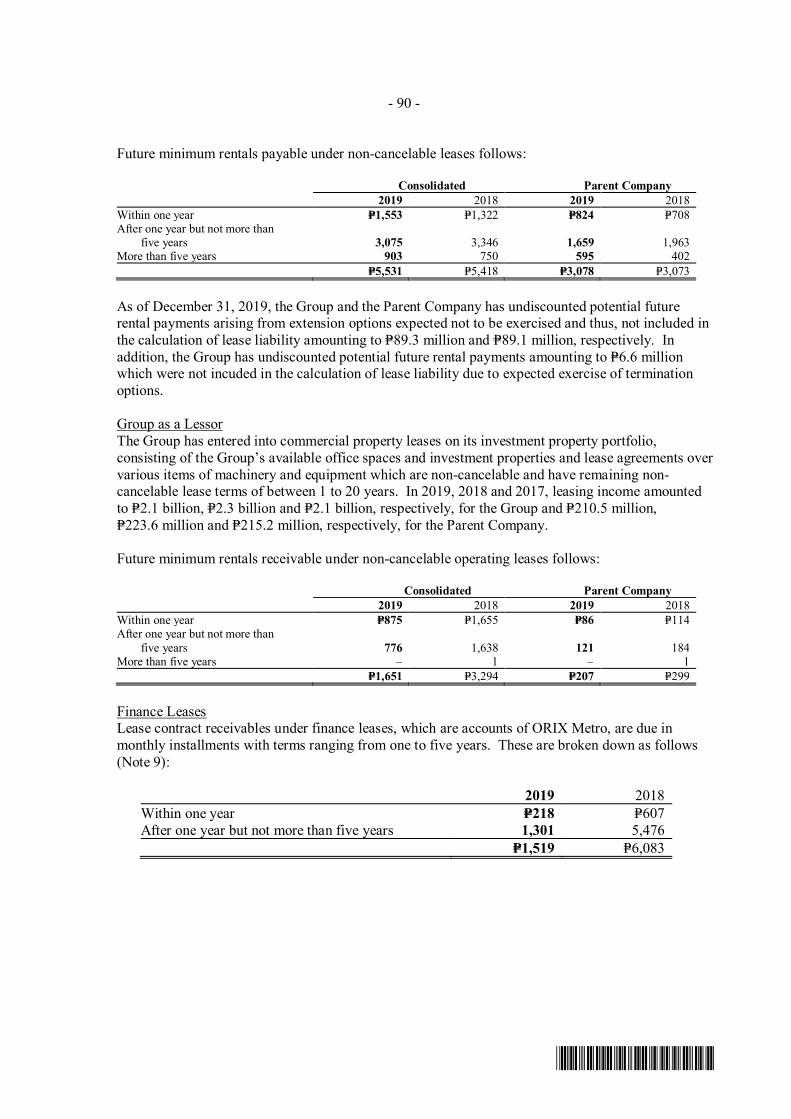
- 90 -
*SGVFS038804*
Future minimum rentals payable under non-cancelable leases follows:
Consolidated Parent Company2019 2018 2019 2018
Within one year P=1,553 P=1,322 P=824 P=708After one year but not more than
five years 3,075 3,346 1,659 1,963More than five years 903 750 595 402
P=5,531 P=5,418 P=3,078 P=3,073
As of December 31, 2019, the Group and the Parent Company has undiscounted potential futurerental payments arising from extension options expected not to be exercised and thus, not included inthe calculation of lease liability amounting to P=89.3 million and P=89.1 million, respectively. Inaddition, the Group has undiscounted potential future rental payments amounting to P=6.6 millionwhich were not incuded in the calculation of lease liability due to expected exercise of terminationoptions.
Group as a LessorThe Group has entered into commercial property leases on its investment property portfolio,consisting of the Group’s available office spaces and investment properties and lease agreements overvarious items of machinery and equipment which are non-cancelable and have remaining non-cancelable lease terms of between 1 to 20 years. In 2019, 2018 and 2017, leasing income amountedto P=2.1 billion, P=2.3 billion and P=2.1 billion, respectively, for the Group and P=210.5 million,P=223.6 million and P=215.2 million, respectively, for the Parent Company.
Future minimum rentals receivable under non-cancelable operating leases follows:
Consolidated Parent Company2019 2018 2019 2018
Within one year P=875 P=1,655 P=86 P=114After one year but not more than
five years 776 1,638 121 184More than five years ‒ 1 ‒ 1
P=1,651 P=3,294 P=207 P=299
Finance LeasesLease contract receivables under finance leases, which are accounts of ORIX Metro, are due inmonthly installments with terms ranging from one to five years. These are broken down as follows(Note 9):
2019 2018Within one year P=218 P=607After one year but not more than five years 1,301 5,476
P=1,519 P=6,083
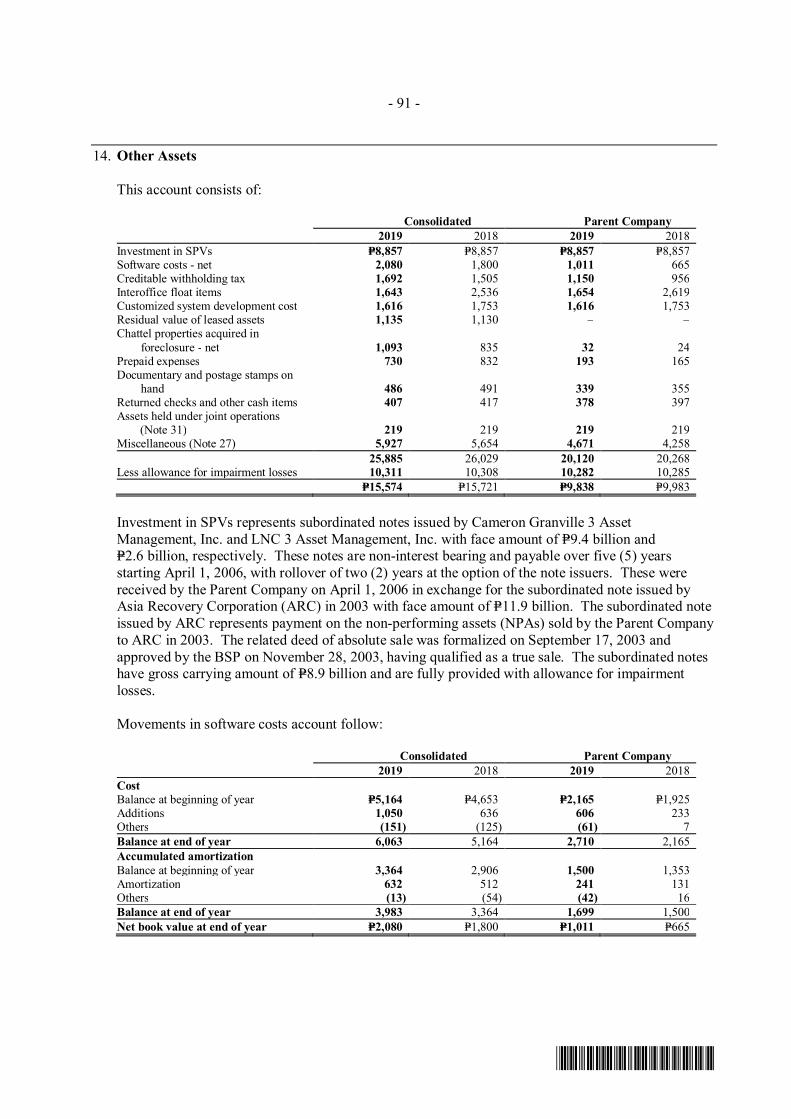
- 91 -
*SGVFS038804*
14. Other Assets
This account consists of:
Consolidated Parent Company2019 2018 2019 2018
Investment in SPVs P=8,857 P=8,857 P=8,857 P=8,857Software costs - net 2,080 1,800 1,011 665Creditable withholding tax 1,692 1,505 1,150 956Interoffice float items 1,643 2,536 1,654 2,619Customized system development cost 1,616 1,753 1,616 1,753Residual value of leased assets 1,135 1,130 ‒ ‒Chattel properties acquired in
foreclosure - net 1,093 835 32 24Prepaid expenses 730 832 193 165Documentary and postage stamps on
hand 486 491 339 355Returned checks and other cash items 407 417 378 397Assets held under joint operations
(Note 31) 219 219 219 219Miscellaneous (Note 27) 5,927 5,654 4,671 4,258
25,885 26,029 20,120 20,268Less allowance for impairment losses 10,311 10,308 10,282 10,285
P=15,574 P=15,721 P=9,838 P=9,983
Investment in SPVs represents subordinated notes issued by Cameron Granville 3 AssetManagement, Inc. and LNC 3 Asset Management, Inc. with face amount of P=9.4 billion andP=2.6 billion, respectively. These notes are non-interest bearing and payable over five (5) yearsstarting April 1, 2006, with rollover of two (2) years at the option of the note issuers. These werereceived by the Parent Company on April 1, 2006 in exchange for the subordinated note issued byAsia Recovery Corporation (ARC) in 2003 with face amount of P=11.9 billion. The subordinated noteissued by ARC represents payment on the non-performing assets (NPAs) sold by the Parent Companyto ARC in 2003. The related deed of absolute sale was formalized on September 17, 2003 andapproved by the BSP on November 28, 2003, having qualified as a true sale. The subordinated noteshave gross carrying amount of P=8.9 billion and are fully provided with allowance for impairmentlosses.
Movements in software costs account follow:
Consolidated Parent Company2019 2018 2019 2018
CostBalance at beginning of year P=5,164 P=4,653 P=2,165 P=1,925Additions 1,050 636 606 233Others (151) (125) (61) 7Balance at end of year 6,063 5,164 2,710 2,165Accumulated amortizationBalance at beginning of year 3,364 2,906 1,500 1,353Amortization 632 512 241 131Others (13) (54) (42) 16Balance at end of year 3,983 3,364 1,699 1,500Net book value at end of year P=2,080 P=1,800 P=1,011 P=665
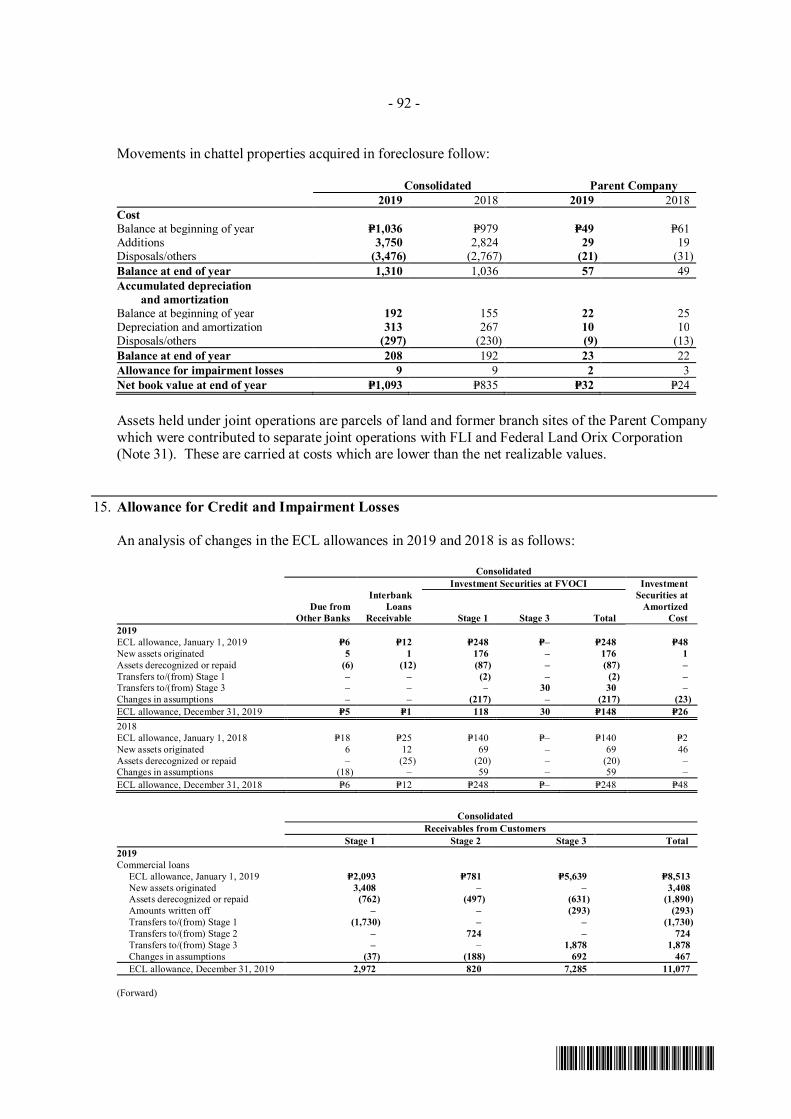
- 92 -
*SGVFS038804*
Movements in chattel properties acquired in foreclosure follow:
Consolidated Parent Company2019 2018 2019 2018
CostBalance at beginning of year P=1,036 P=979 P=49 P=61Additions 3,750 2,824 29 19Disposals/others (3,476) (2,767) (21) (31)Balance at end of year 1,310 1,036 57 49Accumulated depreciation
and amortizationBalance at beginning of year 192 155 22 25Depreciation and amortization 313 267 10 10Disposals/others (297) (230) (9) (13)Balance at end of year 208 192 23 22Allowance for impairment losses 9 9 2 3Net book value at end of year P=1,093 P=835 P=32 P=24
Assets held under joint operations are parcels of land and former branch sites of the Parent Companywhich were contributed to separate joint operations with FLI and Federal Land Orix Corporation(Note 31). These are carried at costs which are lower than the net realizable values.
15. Allowance for Credit and Impairment Losses
An analysis of changes in the ECL allowances in 2019 and 2018 is as follows:
Consolidated
Due fromOther Banks
InterbankLoans
Receivable
Investment Securities at FVOCI InvestmentSecurities at
AmortizedCostStage 1 Stage 3 Total
2019ECL allowance, January 1, 2019 P=6 P=12 P=248 P=– P=248 P=48New assets originated 5 1 176 – 176 1Assets derecognized or repaid (6) (12) (87) – (87) –Transfers to/(from) Stage 1 – – (2) – (2) –Transfers to/(from) Stage 3 – – – 30 30 –Changes in assumptions – – (217) – (217) (23)ECL allowance, December 31, 2019 P=5 P=1 118 30 P=148 P=262018ECL allowance, January 1, 2018 P=18 P=25 P=140 P=– P=140 P=2New assets originated 6 12 69 – 69 46Assets derecognized or repaid – (25) (20) – (20) –Changes in assumptions (18) – 59 – 59 ‒ECL allowance, December 31, 2018 P=6 P=12 P=248 P=– P=248 P=48
ConsolidatedReceivables from Customers
Stage 1 Stage 2 Stage 3 Total2019Commercial loans
ECL allowance, January 1, 2019 P=2,093 P=781 P=5,639 P=8,513New assets originated 3,408 – – 3,408Assets derecognized or repaid (762) (497) (631) (1,890)Amounts written off – – (293) (293)Transfers to/(from) Stage 1 (1,730) – – (1,730)Transfers to/(from) Stage 2 – 724 – 724Transfers to/(from) Stage 3 – – 1,878 1,878Changes in assumptions (37) (188) 692 467ECL allowance, December 31, 2019 2,972 820 7,285 11,077
(Forward)
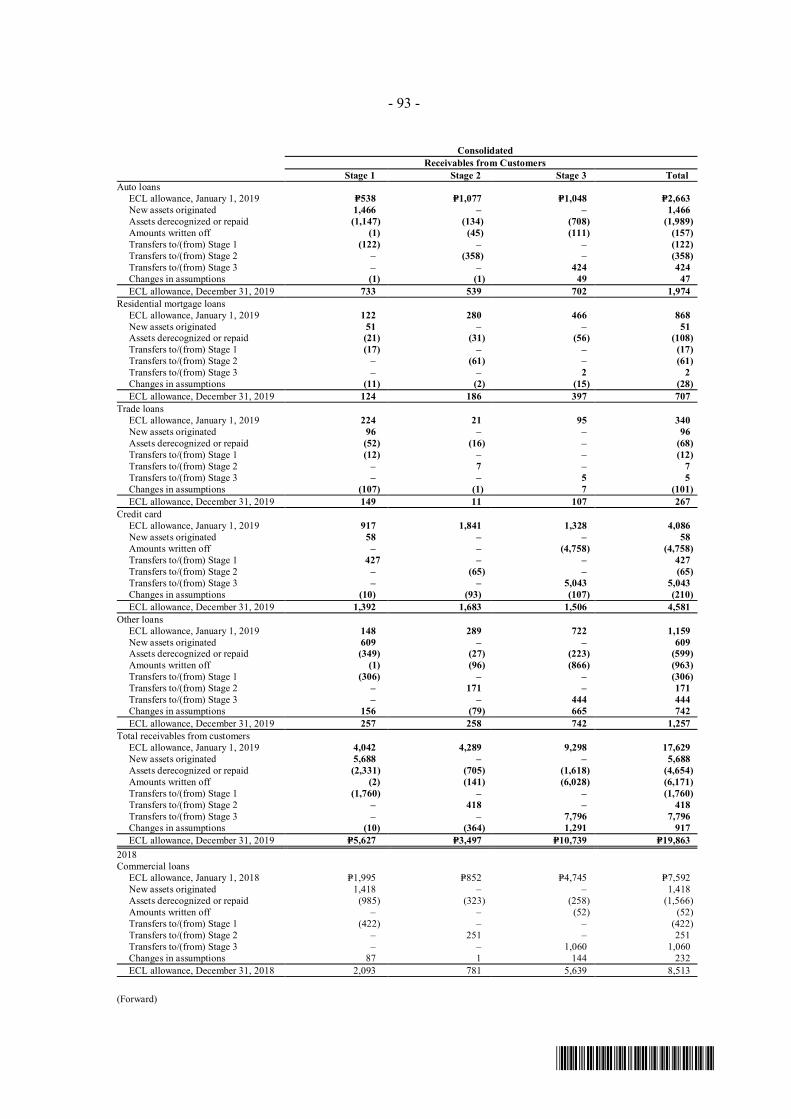
- 93 -
*SGVFS038804*
ConsolidatedReceivables from Customers
Stage 1 Stage 2 Stage 3 TotalAuto loans
ECL allowance, January 1, 2019 P=538 P=1,077 P=1,048 P=2,663New assets originated 1,466 – – 1,466Assets derecognized or repaid (1,147) (134) (708) (1,989)Amounts written off (1) (45) (111) (157)Transfers to/(from) Stage 1 (122) – – (122)Transfers to/(from) Stage 2 – (358) – (358)Transfers to/(from) Stage 3 – – 424 424Changes in assumptions (1) (1) 49 47ECL allowance, December 31, 2019 733 539 702 1,974
Residential mortgage loansECL allowance, January 1, 2019 122 280 466 868New assets originated 51 – – 51Assets derecognized or repaid (21) (31) (56) (108)Transfers to/(from) Stage 1 (17) – – (17)Transfers to/(from) Stage 2 – (61) – (61)Transfers to/(from) Stage 3 – – 2 2Changes in assumptions (11) (2) (15) (28)ECL allowance, December 31, 2019 124 186 397 707
Trade loansECL allowance, January 1, 2019 224 21 95 340New assets originated 96 – – 96Assets derecognized or repaid (52) (16) – (68)Transfers to/(from) Stage 1 (12) – – (12)Transfers to/(from) Stage 2 – 7 – 7Transfers to/(from) Stage 3 – – 5 5Changes in assumptions (107) (1) 7 (101)ECL allowance, December 31, 2019 149 11 107 267
Credit cardECL allowance, January 1, 2019 917 1,841 1,328 4,086New assets originated 58 – – 58Amounts written off – – (4,758) (4,758)Transfers to/(from) Stage 1 427 – – 427Transfers to/(from) Stage 2 – (65) – (65)Transfers to/(from) Stage 3 – – 5,043 5,043Changes in assumptions (10) (93) (107) (210)ECL allowance, December 31, 2019 1,392 1,683 1,506 4,581
Other loansECL allowance, January 1, 2019 148 289 722 1,159New assets originated 609 – – 609Assets derecognized or repaid (349) (27) (223) (599)Amounts written off (1) (96) (866) (963)Transfers to/(from) Stage 1 (306) – – (306)Transfers to/(from) Stage 2 – 171 – 171Transfers to/(from) Stage 3 – – 444 444Changes in assumptions 156 (79) 665 742ECL allowance, December 31, 2019 257 258 742 1,257
Total receivables from customersECL allowance, January 1, 2019 4,042 4,289 9,298 17,629New assets originated 5,688 – – 5,688Assets derecognized or repaid (2,331) (705) (1,618) (4,654)Amounts written off (2) (141) (6,028) (6,171)Transfers to/(from) Stage 1 (1,760) – – (1,760)Transfers to/(from) Stage 2 – 418 – 418Transfers to/(from) Stage 3 – – 7,796 7,796Changes in assumptions (10) (364) 1,291 917ECL allowance, December 31, 2019 P=5,627 P=3,497 P=10,739 P=19,863
2018Commercial loans
ECL allowance, January 1, 2018 P=1,995 P=852 P=4,745 P=7,592New assets originated 1,418 ‒ ‒ 1,418Assets derecognized or repaid (985) (323) (258) (1,566)Amounts written off ‒ ‒ (52) (52)Transfers to/(from) Stage 1 (422) ‒ ‒ (422)Transfers to/(from) Stage 2 ‒ 251 ‒ 251Transfers to/(from) Stage 3 ‒ ‒ 1,060 1,060Changes in assumptions 87 1 144 232ECL allowance, December 31, 2018 2,093 781 5,639 8,513
(Forward)
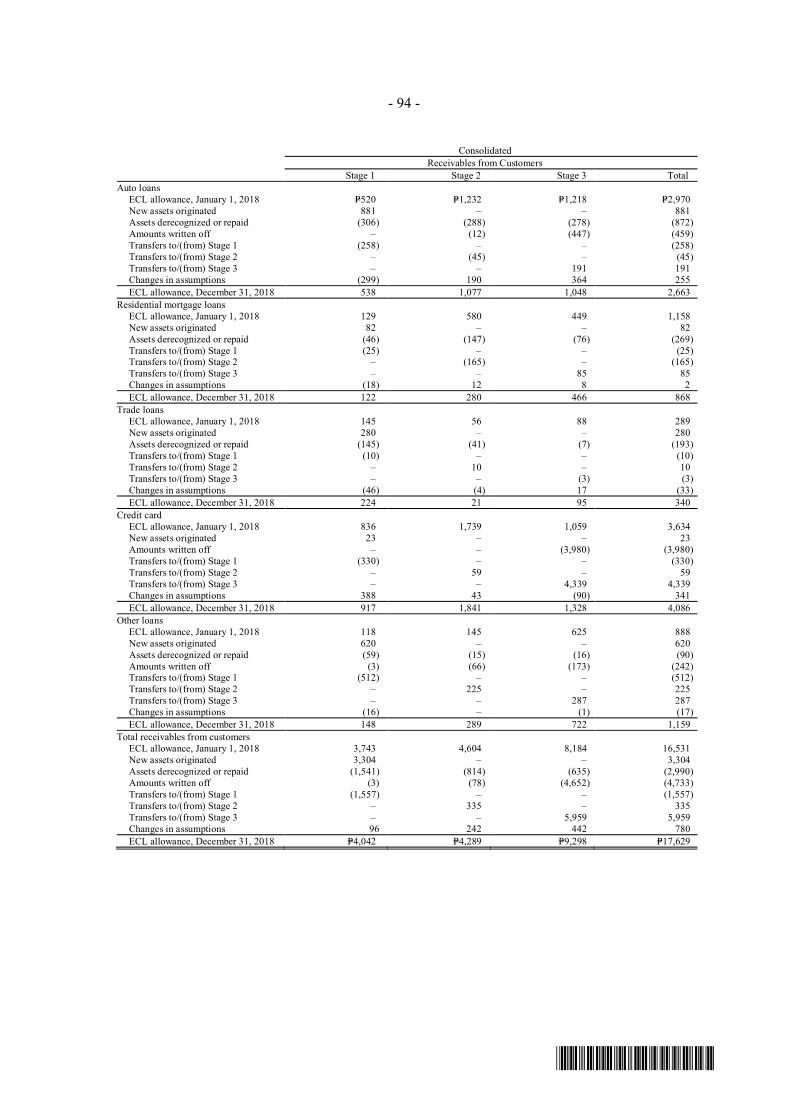
- 94 -
*SGVFS038804*
ConsolidatedReceivables from Customers
Stage 1 Stage 2 Stage 3 TotalAuto loans
ECL allowance, January 1, 2018 P=520 P=1,232 P=1,218 P=2,970New assets originated 881 ‒ ‒ 881Assets derecognized or repaid (306) (288) (278) (872)Amounts written off ‒ (12) (447) (459)Transfers to/(from) Stage 1 (258) ‒ ‒ (258)Transfers to/(from) Stage 2 ‒ (45) ‒ (45)Transfers to/(from) Stage 3 ‒ ‒ 191 191Changes in assumptions (299) 190 364 255ECL allowance, December 31, 2018 538 1,077 1,048 2,663
Residential mortgage loansECL allowance, January 1, 2018 129 580 449 1,158New assets originated 82 ‒ ‒ 82Assets derecognized or repaid (46) (147) (76) (269)Transfers to/(from) Stage 1 (25) ‒ ‒ (25)Transfers to/(from) Stage 2 ‒ (165) ‒ (165)Transfers to/(from) Stage 3 ‒ ‒ 85 85Changes in assumptions (18) 12 8 2ECL allowance, December 31, 2018 122 280 466 868
Trade loansECL allowance, January 1, 2018 145 56 88 289New assets originated 280 ‒ ‒ 280Assets derecognized or repaid (145) (41) (7) (193)Transfers to/(from) Stage 1 (10) ‒ ‒ (10)Transfers to/(from) Stage 2 ‒ 10 ‒ 10Transfers to/(from) Stage 3 ‒ ‒ (3) (3)Changes in assumptions (46) (4) 17 (33)ECL allowance, December 31, 2018 224 21 95 340
Credit cardECL allowance, January 1, 2018 836 1,739 1,059 3,634New assets originated 23 ‒ ‒ 23Amounts written off ‒ ‒ (3,980) (3,980)Transfers to/(from) Stage 1 (330) ‒ ‒ (330)Transfers to/(from) Stage 2 ‒ 59 ‒ 59Transfers to/(from) Stage 3 ‒ ‒ 4,339 4,339Changes in assumptions 388 43 (90) 341ECL allowance, December 31, 2018 917 1,841 1,328 4,086
Other loansECL allowance, January 1, 2018 118 145 625 888New assets originated 620 ‒ ‒ 620Assets derecognized or repaid (59) (15) (16) (90)Amounts written off (3) (66) (173) (242)Transfers to/(from) Stage 1 (512) ‒ ‒ (512)Transfers to/(from) Stage 2 ‒ 225 ‒ 225Transfers to/(from) Stage 3 ‒ ‒ 287 287Changes in assumptions (16) ‒ (1) (17)ECL allowance, December 31, 2018 148 289 722 1,159
Total receivables from customersECL allowance, January 1, 2018 3,743 4,604 8,184 16,531New assets originated 3,304 ‒ ‒ 3,304Assets derecognized or repaid (1,541) (814) (635) (2,990)Amounts written off (3) (78) (4,652) (4,733)Transfers to/(from) Stage 1 (1,557) ‒ ‒ (1,557)Transfers to/(from) Stage 2 ‒ 335 ‒ 335Transfers to/(from) Stage 3 ‒ ‒ 5,959 5,959Changes in assumptions 96 242 442 780ECL allowance, December 31, 2018 P=4,042 P=4,289 P=9,298 P=17,629
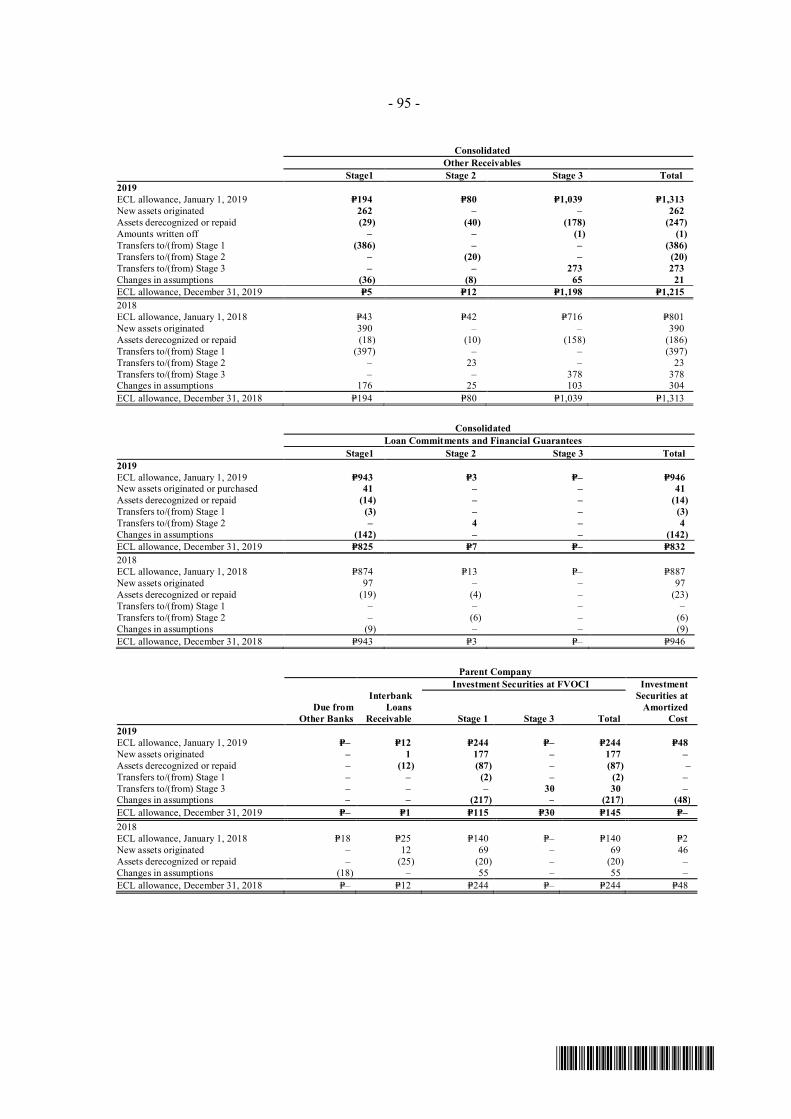
- 95 -
*SGVFS038804*
ConsolidatedOther Receivables
Stage1 Stage 2 Stage 3 Total2019ECL allowance, January 1, 2019 P=194 P=80 P=1,039 P=1,313New assets originated 262 ‒ ‒ 262Assets derecognized or repaid (29) (40) (178) (247)Amounts written off ‒ ‒ (1) (1)Transfers to/(from) Stage 1 (386) ‒ ‒ (386)Transfers to/(from) Stage 2 ‒ (20) ‒ (20)Transfers to/(from) Stage 3 ‒ ‒ 273 273Changes in assumptions (36) (8) 65 21ECL allowance, December 31, 2019 P=5 P=12 P=1,198 P=1,2152018ECL allowance, January 1, 2018 P=43 P=42 P=716 P=801New assets originated 390 – ‒ 390Assets derecognized or repaid (18) (10) (158) (186)Transfers to/(from) Stage 1 (397) – ‒ (397)Transfers to/(from) Stage 2 – 23 – 23Transfers to/(from) Stage 3 – – 378 378Changes in assumptions 176 25 103 304ECL allowance, December 31, 2018 P=194 P=80 P=1,039 P=1,313
ConsolidatedLoan Commitments and Financial Guarantees
Stage1 Stage 2 Stage 3 Total2019ECL allowance, January 1, 2019 P=943 P=3 P=– P=946New assets originated or purchased 41 – – 41Assets derecognized or repaid (14) – – (14)Transfers to/(from) Stage 1 (3) – – (3)Transfers to/(from) Stage 2 – 4 – 4Changes in assumptions (142) – – (142)ECL allowance, December 31, 2019 P=825 P=7 P=– P=8322018ECL allowance, January 1, 2018 P=874 P=13 P=– P=887New assets originated 97 – – 97Assets derecognized or repaid (19) (4) – (23)Transfers to/(from) Stage 1 – – – –Transfers to/(from) Stage 2 – (6) – (6)Changes in assumptions (9) – – (9)ECL allowance, December 31, 2018 P=943 P=3 P=– P=946
Parent Company
Due fromOther Banks
InterbankLoans
Receivable
Investment Securities at FVOCI InvestmentSecurities at
AmortizedCostStage 1 Stage 3 Total
2019ECL allowance, January 1, 2019 P=– P=12 P=244 P=– P=244 P=48New assets originated – 1 177 – 177 –Assets derecognized or repaid – (12) (87) – (87) –Transfers to/(from) Stage 1 – – (2) – (2) –Transfers to/(from) Stage 3 – – – 30 30 –Changes in assumptions – – (217) – (217) (48)ECL allowance, December 31, 2019 P=– P=1 P=115 P=30 P=145 P=–2018ECL allowance, January 1, 2018 P=18 P=25 P=140 P=– P=140 P=2New assets originated ‒ 12 69 – 69 46Assets derecognized or repaid – (25) (20) – (20) –Changes in assumptions (18) – 55 – 55 ‒ECL allowance, December 31, 2018 P=‒ P=12 P=244 P=– P=244 P=48
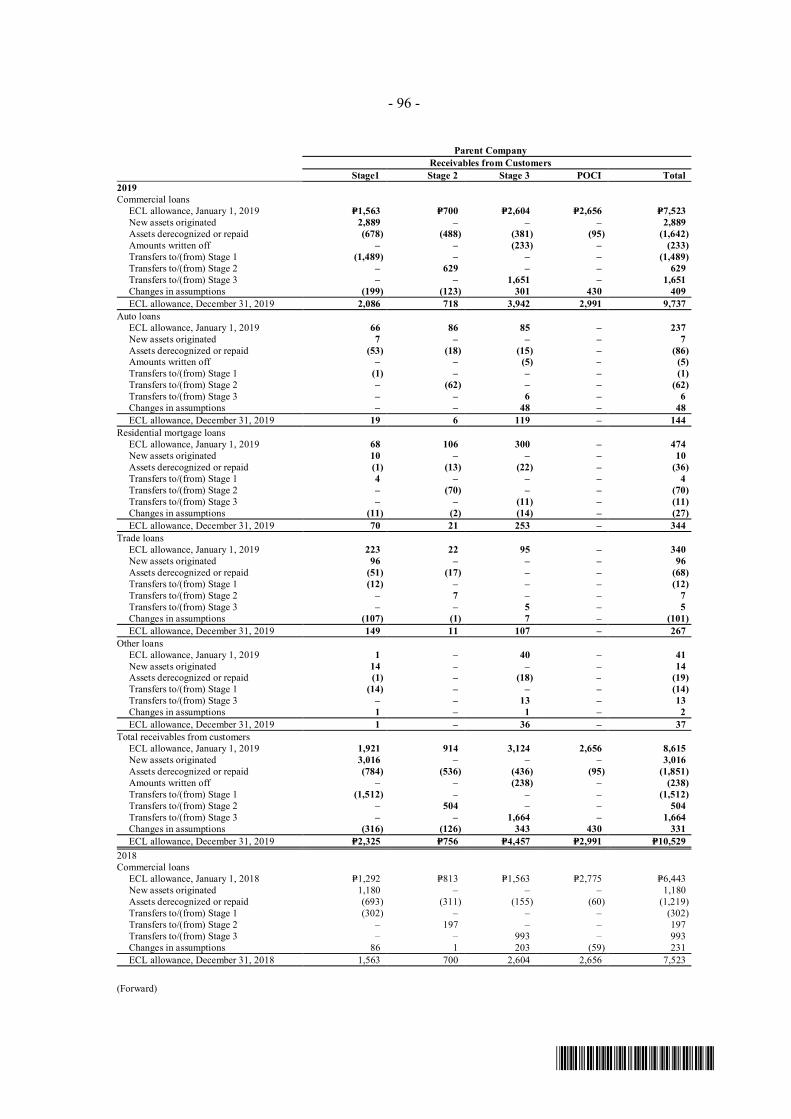
- 96 -
*SGVFS038804*
Parent CompanyReceivables from Customers
Stage1 Stage 2 Stage 3 POCI Total2019Commercial loans
ECL allowance, January 1, 2019 P=1,563 P=700 P=2,604 P=2,656 P=7,523New assets originated 2,889 – – – 2,889Assets derecognized or repaid (678) (488) (381) (95) (1,642)Amounts written off – – (233) – (233)Transfers to/(from) Stage 1 (1,489) – – – (1,489)Transfers to/(from) Stage 2 – 629 – – 629Transfers to/(from) Stage 3 – – 1,651 – 1,651Changes in assumptions (199) (123) 301 430 409ECL allowance, December 31, 2019 2,086 718 3,942 2,991 9,737
Auto loansECL allowance, January 1, 2019 66 86 85 – 237New assets originated 7 – – – 7Assets derecognized or repaid (53) (18) (15) – (86)Amounts written off – – (5) – (5)Transfers to/(from) Stage 1 (1) – – – (1)Transfers to/(from) Stage 2 – (62) – – (62)Transfers to/(from) Stage 3 – – 6 – 6Changes in assumptions – – 48 – 48ECL allowance, December 31, 2019 19 6 119 – 144
Residential mortgage loansECL allowance, January 1, 2019 68 106 300 – 474New assets originated 10 – – – 10Assets derecognized or repaid (1) (13) (22) – (36)Transfers to/(from) Stage 1 4 – – – 4Transfers to/(from) Stage 2 – (70) – – (70)Transfers to/(from) Stage 3 – – (11) – (11)Changes in assumptions (11) (2) (14) – (27)ECL allowance, December 31, 2019 70 21 253 – 344
Trade loansECL allowance, January 1, 2019 223 22 95 – 340New assets originated 96 – – – 96Assets derecognized or repaid (51) (17) – – (68)Transfers to/(from) Stage 1 (12) – – – (12)Transfers to/(from) Stage 2 – 7 – – 7Transfers to/(from) Stage 3 – – 5 – 5Changes in assumptions (107) (1) 7 – (101)ECL allowance, December 31, 2019 149 11 107 – 267
Other loansECL allowance, January 1, 2019 1 – 40 – 41New assets originated 14 – – – 14Assets derecognized or repaid (1) – (18) – (19)Transfers to/(from) Stage 1 (14) – – – (14)Transfers to/(from) Stage 3 – – 13 – 13Changes in assumptions 1 – 1 – 2ECL allowance, December 31, 2019 1 – 36 – 37
Total receivables from customersECL allowance, January 1, 2019 1,921 914 3,124 2,656 8,615New assets originated 3,016 – – – 3,016Assets derecognized or repaid (784) (536) (436) (95) (1,851)Amounts written off – – (238) – (238)Transfers to/(from) Stage 1 (1,512) – – – (1,512)Transfers to/(from) Stage 2 – 504 – – 504Transfers to/(from) Stage 3 – – 1,664 – 1,664Changes in assumptions (316) (126) 343 430 331ECL allowance, December 31, 2019 P=2,325 P=756 P=4,457 P=2,991 P=10,529
2018Commercial loans
ECL allowance, January 1, 2018 P=1,292 P=813 P=1,563 P=2,775 P=6,443New assets originated 1,180 – ‒ ‒ 1,180Assets derecognized or repaid (693) (311) (155) (60) (1,219)Transfers to/(from) Stage 1 (302) – – ‒ (302)Transfers to/(from) Stage 2 – 197 – ‒ 197Transfers to/(from) Stage 3 – – 993 ‒ 993Changes in assumptions 86 1 203 (59) 231ECL allowance, December 31, 2018 1,563 700 2,604 2,656 7,523
(Forward)
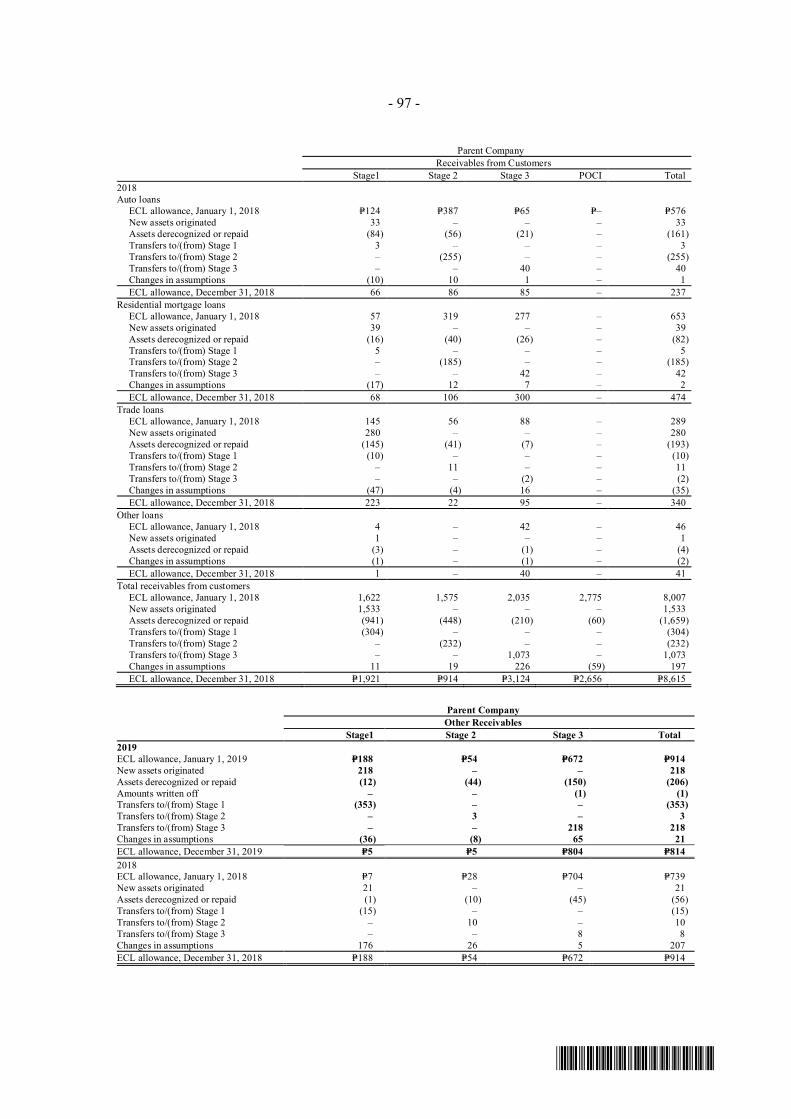
- 97 -
*SGVFS038804*
Parent CompanyReceivables from Customers
Stage1 Stage 2 Stage 3 POCI Total2018Auto loans
ECL allowance, January 1, 2018 P=124 P=387 P=65 P=– P=576New assets originated 33 – ‒ – 33Assets derecognized or repaid (84) (56) (21) – (161)Transfers to/(from) Stage 1 3 – – – 3Transfers to/(from) Stage 2 – (255) – – (255)Transfers to/(from) Stage 3 – – 40 – 40Changes in assumptions (10) 10 1 – 1ECL allowance, December 31, 2018 66 86 85 – 237
Residential mortgage loansECL allowance, January 1, 2018 57 319 277 – 653New assets originated 39 – ‒ – 39Assets derecognized or repaid (16) (40) (26) – (82)Transfers to/(from) Stage 1 5 – – – 5Transfers to/(from) Stage 2 – (185) – – (185)Transfers to/(from) Stage 3 – – 42 – 42Changes in assumptions (17) 12 7 – 2ECL allowance, December 31, 2018 68 106 300 – 474
Trade loansECL allowance, January 1, 2018 145 56 88 – 289New assets originated 280 – ‒ – 280Assets derecognized or repaid (145) (41) (7) – (193)Transfers to/(from) Stage 1 (10) – ‒ – (10)Transfers to/(from) Stage 2 – 11 – – 11Transfers to/(from) Stage 3 – – (2) – (2)Changes in assumptions (47) (4) 16 – (35)ECL allowance, December 31, 2018 223 22 95 – 340
Other loansECL allowance, January 1, 2018 4 – 42 – 46New assets originated 1 – ‒ – 1Assets derecognized or repaid (3) – (1) – (4)Changes in assumptions (1) – (1) – (2)ECL allowance, December 31, 2018 1 – 40 – 41
Total receivables from customersECL allowance, January 1, 2018 1,622 1,575 2,035 2,775 8,007New assets originated 1,533 – ‒ – 1,533Assets derecognized or repaid (941) (448) (210) (60) (1,659)Transfers to/(from) Stage 1 (304) – – – (304)Transfers to/(from) Stage 2 – (232) – – (232)Transfers to/(from) Stage 3 – – 1,073 – 1,073Changes in assumptions 11 19 226 (59) 197ECL allowance, December 31, 2018 P=1,921 P=914 P=3,124 P=2,656 P=8,615
Parent CompanyOther Receivables
Stage1 Stage 2 Stage 3 Total2019ECL allowance, January 1, 2019 P=188 P=54 P=672 P=914New assets originated 218 – – 218Assets derecognized or repaid (12) (44) (150) (206)Amounts written off – – (1) (1)Transfers to/(from) Stage 1 (353) – – (353)Transfers to/(from) Stage 2 – 3 – 3Transfers to/(from) Stage 3 – – 218 218Changes in assumptions (36) (8) 65 21ECL allowance, December 31, 2019 P=5 P=5 P=804 P=8142018ECL allowance, January 1, 2018 P=7 P=28 P=704 P=739New assets originated 21 – ‒ 21Assets derecognized or repaid (1) (10) (45) (56)Transfers to/(from) Stage 1 (15) – – (15)Transfers to/(from) Stage 2 – 10 – 10Transfers to/(from) Stage 3 – – 8 8Changes in assumptions 176 26 5 207ECL allowance, December 31, 2018 P=188 P=54 P=672 P=914
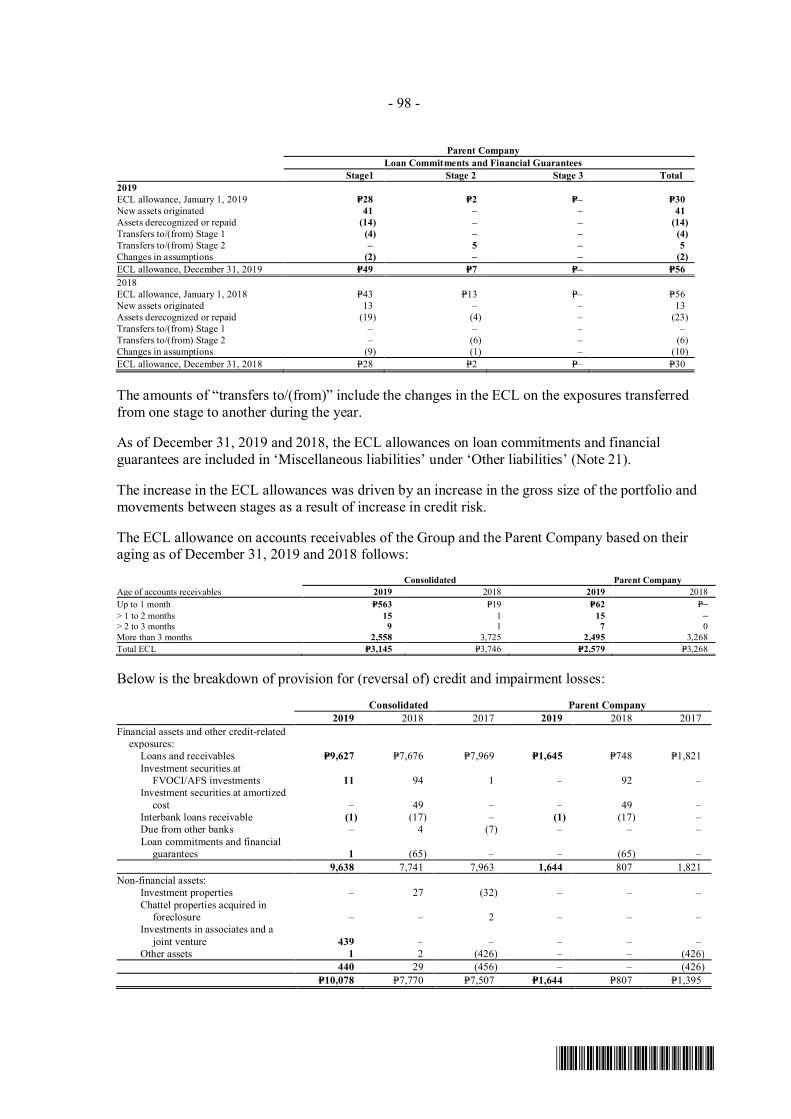
- 98 -
*SGVFS038804*
Parent CompanyLoan Commitments and Financial Guarantees
Stage1 Stage 2 Stage 3 Total2019ECL allowance, January 1, 2019 P=28 P=2 P=– P=30New assets originated 41 – – 41Assets derecognized or repaid (14) – – (14)Transfers to/(from) Stage 1 (4) – – (4)Transfers to/(from) Stage 2 – 5 – 5Changes in assumptions (2) – – (2)ECL allowance, December 31, 2019 P=49 P=7 P=– P=562018ECL allowance, January 1, 2018 P=43 P=13 P=– P=56New assets originated 13 – – 13Assets derecognized or repaid (19) (4) – (23)Transfers to/(from) Stage 1 – – – –Transfers to/(from) Stage 2 – (6) – (6)Changes in assumptions (9) (1) – (10)ECL allowance, December 31, 2018 P=28 P=2 P=– P=30
The amounts of “transfers to/(from)” include the changes in the ECL on the exposures transferredfrom one stage to another during the year.
As of December 31, 2019 and 2018, the ECL allowances on loan commitments and financialguarantees are included in ‘Miscellaneous liabilities’ under ‘Other liabilities’ (Note 21).
The increase in the ECL allowances was driven by an increase in the gross size of the portfolio andmovements between stages as a result of increase in credit risk.
The ECL allowance on accounts receivables of the Group and the Parent Company based on theiraging as of December 31, 2019 and 2018 follows:
Consolidated Parent CompanyAge of accounts receivables 2019 2018 2019 2018Up to 1 month P=563 P=19 P=62 P=‒> 1 to 2 months 15 1 15 ‒> 2 to 3 months 9 1 7 0More than 3 months 2,558 3,725 2,495 3,268Total ECL P=3,145 P=3,746 P=2,579 P=3,268
Below is the breakdown of provision for (reversal of) credit and impairment losses:
Consolidated Parent Company2019 2018 2017 2019 2018 2017
Financial assets and other credit-relatedexposures:
Loans and receivables P=9,627 P=7,676 P=7,969 P=1,645 P=748 P=1,821Investment securities at
FVOCI/AFS investments 11 94 1 ‒ 92 ‒Investment securities at amortized
cost – 49 – ‒ 49 ‒Interbank loans receivable (1) (17) – (1) (17) –Due from other banks – 4 (7) ‒ – –Loan commitments and financial
guarantees 1 (65) ‒ ‒ (65) ‒9,638 7,741 7,963 1,644 807 1,821
Non-financial assets:Investment properties – 27 (32) ‒ – –Chattel properties acquired in
foreclosure – – 2 ‒ – –Investments in associates and a
joint venture 439 ‒ – ‒ – –Other assets 1 2 (426) ‒ – (426)
440 29 (456) ‒ ‒ (426)P=10,078 P=7,770 P=7,507 P=1,644 P=807 P=1,395
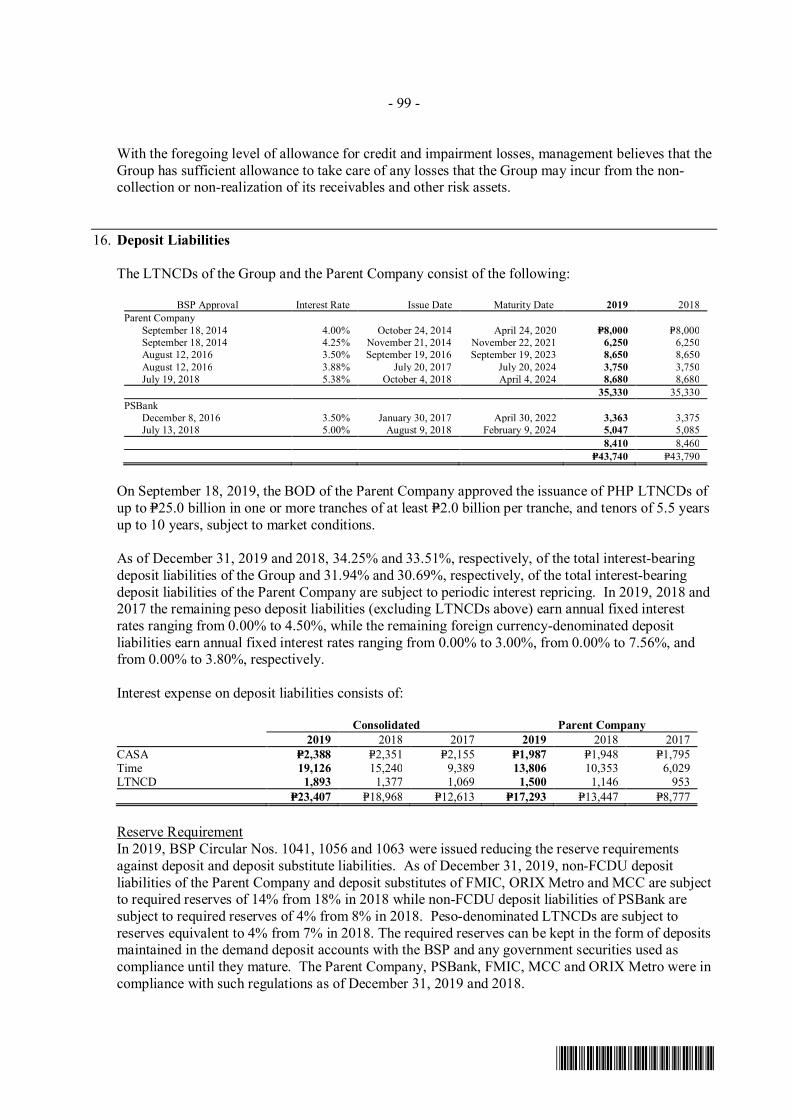
- 99 -
*SGVFS038804*
With the foregoing level of allowance for credit and impairment losses, management believes that theGroup has sufficient allowance to take care of any losses that the Group may incur from the non-collection or non-realization of its receivables and other risk assets.
16. Deposit Liabilities
The LTNCDs of the Group and the Parent Company consist of the following:
BSP Approval Interest Rate Issue Date Maturity Date 2019 2018Parent Company
September 18, 2014 4.00% October 24, 2014 April 24, 2020 P=8,000 P=8,000September 18, 2014 4.25% November 21, 2014 November 22, 2021 6,250 6,250August 12, 2016 3.50% September 19, 2016 September 19, 2023 8,650 8,650August 12, 2016 3.88% July 20, 2017 July 20, 2024 3,750 3,750July 19, 2018 5.38% October 4, 2018 April 4, 2024 8,680 8,680
35,330 35,330PSBank
December 8, 2016 3.50% January 30, 2017 April 30, 2022 3,363 3,375July 13, 2018 5.00% August 9, 2018 February 9, 2024 5,047 5,085
8,410 8,460P=43,740 P=43,790
On September 18, 2019, the BOD of the Parent Company approved the issuance of PHP LTNCDs ofup to P=25.0 billion in one or more tranches of at least P=2.0 billion per tranche, and tenors of 5.5 yearsup to 10 years, subject to market conditions.
As of December 31, 2019 and 2018, 34.25% and 33.51%, respectively, of the total interest-bearingdeposit liabilities of the Group and 31.94% and 30.69%, respectively, of the total interest-bearingdeposit liabilities of the Parent Company are subject to periodic interest repricing. In 2019, 2018 and2017 the remaining peso deposit liabilities (excluding LTNCDs above) earn annual fixed interestrates ranging from 0.00% to 4.50%, while the remaining foreign currency-denominated depositliabilities earn annual fixed interest rates ranging from 0.00% to 3.00%, from 0.00% to 7.56%, andfrom 0.00% to 3.80%, respectively.
Interest expense on deposit liabilities consists of:
Consolidated Parent Company2019 2018 2017 2019 2018 2017
CASA P=2,388 P=2,351 P=2,155 P=1,987 P=1,948 P=1,795Time 19,126 15,240 9,389 13,806 10,353 6,029LTNCD 1,893 1,377 1,069 1,500 1,146 953
P=23,407 P=18,968 P=12,613 P=17,293 P=13,447 P=8,777
Reserve RequirementIn 2019, BSP Circular Nos. 1041, 1056 and 1063 were issued reducing the reserve requirementsagainst deposit and deposit substitute liabilities. As of December 31, 2019, non-FCDU depositliabilities of the Parent Company and deposit substitutes of FMIC, ORIX Metro and MCC are subjectto required reserves of 14% from 18% in 2018 while non-FCDU deposit liabilities of PSBank aresubject to required reserves of 4% from 8% in 2018. Peso-denominated LTNCDs are subject toreserves equivalent to 4% from 7% in 2018. The required reserves can be kept in the form of depositsmaintained in the demand deposit accounts with the BSP and any government securities used ascompliance until they mature. The Parent Company, PSBank, FMIC, MCC and ORIX Metro were incompliance with such regulations as of December 31, 2019 and 2018.
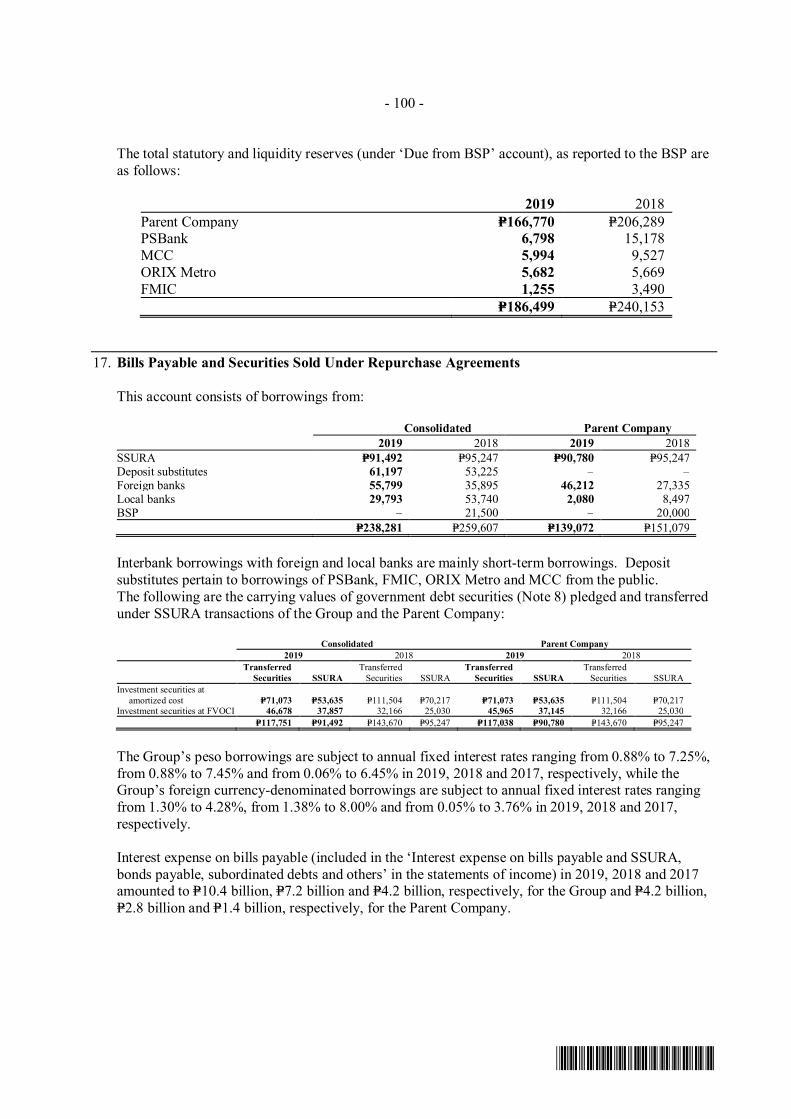
- 100 -
*SGVFS038804*
The total statutory and liquidity reserves (under ‘Due from BSP’ account), as reported to the BSP areas follows:
2019 2018Parent Company P=166,770 P=206,289PSBank 6,798 15,178MCC 5,994 9,527ORIX Metro 5,682 5,669FMIC 1,255 3,490
P=186,499 P=240,153
17. Bills Payable and Securities Sold Under Repurchase Agreements
This account consists of borrowings from:
Consolidated Parent Company2019 2018 2019 2018
SSURA P=91,492 P=95,247 P=90,780 P=95,247Deposit substitutes 61,197 53,225 ‒ ‒Foreign banks 55,799 35,895 46,212 27,335Local banks 29,793 53,740 2,080 8,497BSP ‒ 21,500 ‒ 20,000
P=238,281 P=259,607 P=139,072 P=151,079
Interbank borrowings with foreign and local banks are mainly short-term borrowings. Depositsubstitutes pertain to borrowings of PSBank, FMIC, ORIX Metro and MCC from the public.The following are the carrying values of government debt securities (Note 8) pledged and transferredunder SSURA transactions of the Group and the Parent Company:
Consolidated Parent Company2019 2018 2019 2018
TransferredSecurities SSURA
TransferredSecurities SSURA
TransferredSecurities SSURA
TransferredSecurities SSURA
Investment securities atamortized cost P=71,073 P=53,635 P=111,504 P=70,217 P=71,073 P=53,635 P=111,504 P=70,217
Investment securities at FVOCI 46,678 37,857 32,166 25,030 45,965 37,145 32,166 25,030P=117,751 P=91,492 P=143,670 P=95,247 P=117,038 P=90,780 P=143,670 P=95,247
The Group’s peso borrowings are subject to annual fixed interest rates ranging from 0.88% to 7.25%,from 0.88% to 7.45% and from 0.06% to 6.45% in 2019, 2018 and 2017, respectively, while theGroup’s foreign currency-denominated borrowings are subject to annual fixed interest rates rangingfrom 1.30% to 4.28%, from 1.38% to 8.00% and from 0.05% to 3.76% in 2019, 2018 and 2017,respectively.
Interest expense on bills payable (included in the ‘Interest expense on bills payable and SSURA,bonds payable, subordinated debts and others’ in the statements of income) in 2019, 2018 and 2017amounted to P=10.4 billion, P=7.2 billion and P=4.2 billion, respectively, for the Group and P=4.2 billion,P=2.8 billion and P=1.4 billion, respectively, for the Parent Company.
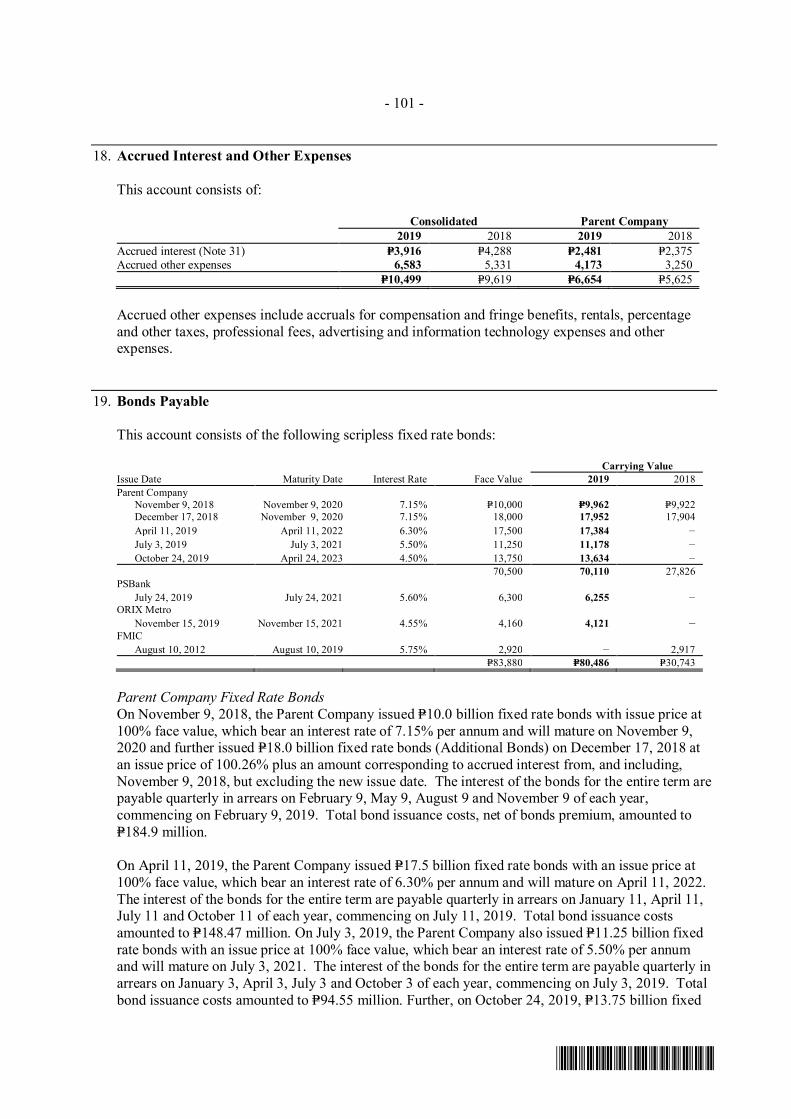
- 101 -
*SGVFS038804*
18. Accrued Interest and Other Expenses
This account consists of:
Consolidated Parent Company2019 2018 2019 2018
Accrued interest (Note 31) P=3,916 P=4,288 P=2,481 P=2,375Accrued other expenses 6,583 5,331 4,173 3,250
P=10,499 P=9,619 P=6,654 P=5,625
Accrued other expenses include accruals for compensation and fringe benefits, rentals, percentageand other taxes, professional fees, advertising and information technology expenses and otherexpenses.
19. Bonds Payable
This account consists of the following scripless fixed rate bonds:
Carrying ValueIssue Date Maturity Date Interest Rate Face Value 2019 2018Parent Company
November 9, 2018 November 9, 2020 7.15% P=10,000 P=9,962 P=9,922December 17, 2018 November 9, 2020 7.15% 18,000 17,952 17,904April 11, 2019 April 11, 2022 6.30% 17,500 17,384 ‒July 3, 2019 July 3, 2021 5.50% 11,250 11,178 ‒October 24, 2019 April 24, 2023 4.50% 13,750 13,634 ‒
70,500 70,110 27,826PSBank
July 24, 2019 July 24, 2021 5.60% 6,300 6,255 ‒ORIX Metro
November 15, 2019 November 15, 2021 4.55% 4,160 4,121 ‒FMIC
August 10, 2012 August 10, 2019 5.75% 2,920 ‒ 2,917P=83,880 P=80,486 P=30,743
Parent Company Fixed Rate BondsOn November 9, 2018, the Parent Company issued P=10.0 billion fixed rate bonds with issue price at100% face value, which bear an interest rate of 7.15% per annum and will mature on November 9,2020 and further issued P=18.0 billion fixed rate bonds (Additional Bonds) on December 17, 2018 atan issue price of 100.26% plus an amount corresponding to accrued interest from, and including,November 9, 2018, but excluding the new issue date. The interest of the bonds for the entire term arepayable quarterly in arrears on February 9, May 9, August 9 and November 9 of each year,commencing on February 9, 2019. Total bond issuance costs, net of bonds premium, amounted toP=184.9 million.
On April 11, 2019, the Parent Company issued P=17.5 billion fixed rate bonds with an issue price at100% face value, which bear an interest rate of 6.30% per annum and will mature on April 11, 2022.The interest of the bonds for the entire term are payable quarterly in arrears on January 11, April 11,July 11 and October 11 of each year, commencing on July 11, 2019. Total bond issuance costsamounted to P=148.47 million. On July 3, 2019, the Parent Company also issued P=11.25 billion fixedrate bonds with an issue price at 100% face value, which bear an interest rate of 5.50% per annumand will mature on July 3, 2021. The interest of the bonds for the entire term are payable quarterly inarrears on January 3, April 3, July 3 and October 3 of each year, commencing on July 3, 2019. Totalbond issuance costs amounted to P=94.55 million. Further, on October 24, 2019, P=13.75 billion fixed
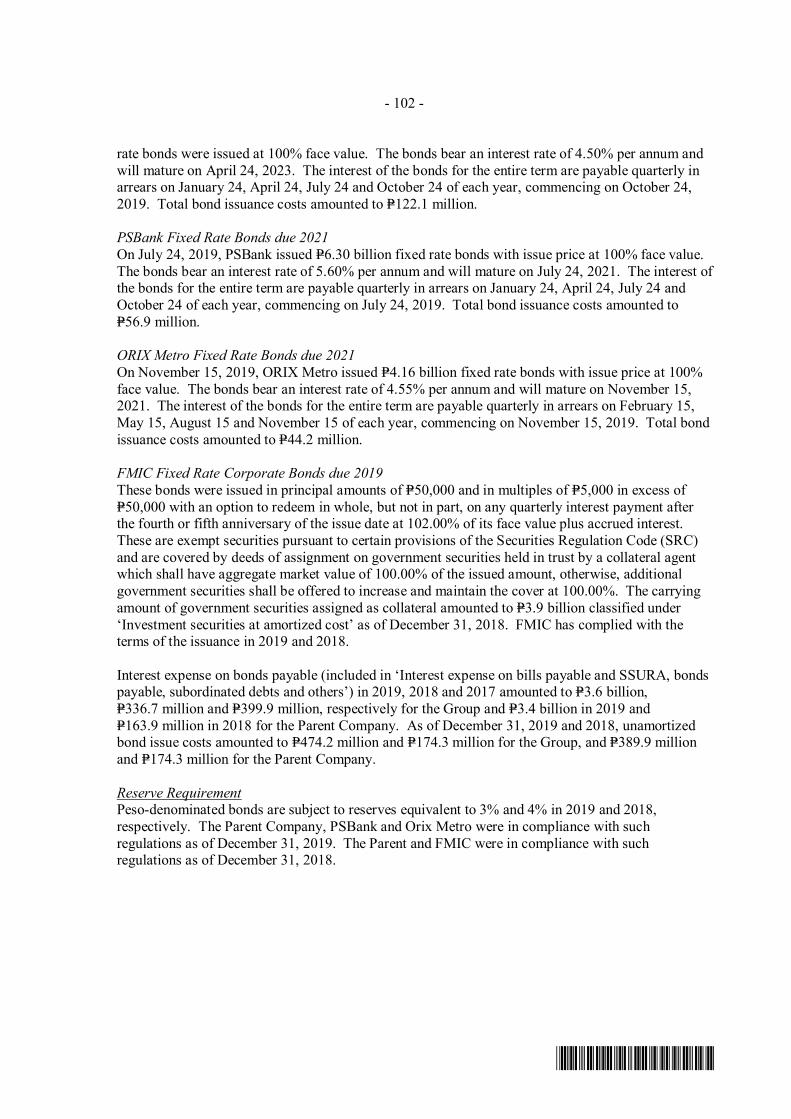
- 102 -
*SGVFS038804*
rate bonds were issued at 100% face value. The bonds bear an interest rate of 4.50% per annum andwill mature on April 24, 2023. The interest of the bonds for the entire term are payable quarterly inarrears on January 24, April 24, July 24 and October 24 of each year, commencing on October 24,2019. Total bond issuance costs amounted to P=122.1 million.
PSBank Fixed Rate Bonds due 2021On July 24, 2019, PSBank issued P=6.30 billion fixed rate bonds with issue price at 100% face value.The bonds bear an interest rate of 5.60% per annum and will mature on July 24, 2021. The interest ofthe bonds for the entire term are payable quarterly in arrears on January 24, April 24, July 24 andOctober 24 of each year, commencing on July 24, 2019. Total bond issuance costs amounted toP=56.9 million.
ORIX Metro Fixed Rate Bonds due 2021On November 15, 2019, ORIX Metro issued P=4.16 billion fixed rate bonds with issue price at 100%face value. The bonds bear an interest rate of 4.55% per annum and will mature on November 15,2021. The interest of the bonds for the entire term are payable quarterly in arrears on February 15,May 15, August 15 and November 15 of each year, commencing on November 15, 2019. Total bondissuance costs amounted to P=44.2 million.
FMIC Fixed Rate Corporate Bonds due 2019These bonds were issued in principal amounts of P=50,000 and in multiples of P=5,000 in excess ofP=50,000 with an option to redeem in whole, but not in part, on any quarterly interest payment afterthe fourth or fifth anniversary of the issue date at 102.00% of its face value plus accrued interest.These are exempt securities pursuant to certain provisions of the Securities Regulation Code (SRC)and are covered by deeds of assignment on government securities held in trust by a collateral agentwhich shall have aggregate market value of 100.00% of the issued amount, otherwise, additionalgovernment securities shall be offered to increase and maintain the cover at 100.00%. The carryingamount of government securities assigned as collateral amounted to P=3.9 billion classified under‘Investment securities at amortized cost’ as of December 31, 2018. FMIC has complied with theterms of the issuance in 2019 and 2018.
Interest expense on bonds payable (included in ‘Interest expense on bills payable and SSURA, bondspayable, subordinated debts and others’) in 2019, 2018 and 2017 amounted to P=3.6 billion,P=336.7 million and P=399.9 million, respectively for the Group and P=3.4 billion in 2019 andP=163.9 million in 2018 for the Parent Company. As of December 31, 2019 and 2018, unamortizedbond issue costs amounted to P=474.2 million and P=174.3 million for the Group, and P=389.9 millionand P=174.3 million for the Parent Company.
Reserve RequirementPeso-denominated bonds are subject to reserves equivalent to 3% and 4% in 2019 and 2018,respectively. The Parent Company, PSBank and Orix Metro were in compliance with suchregulations as of December 31, 2019. The Parent and FMIC were in compliance with suchregulations as of December 31, 2018.
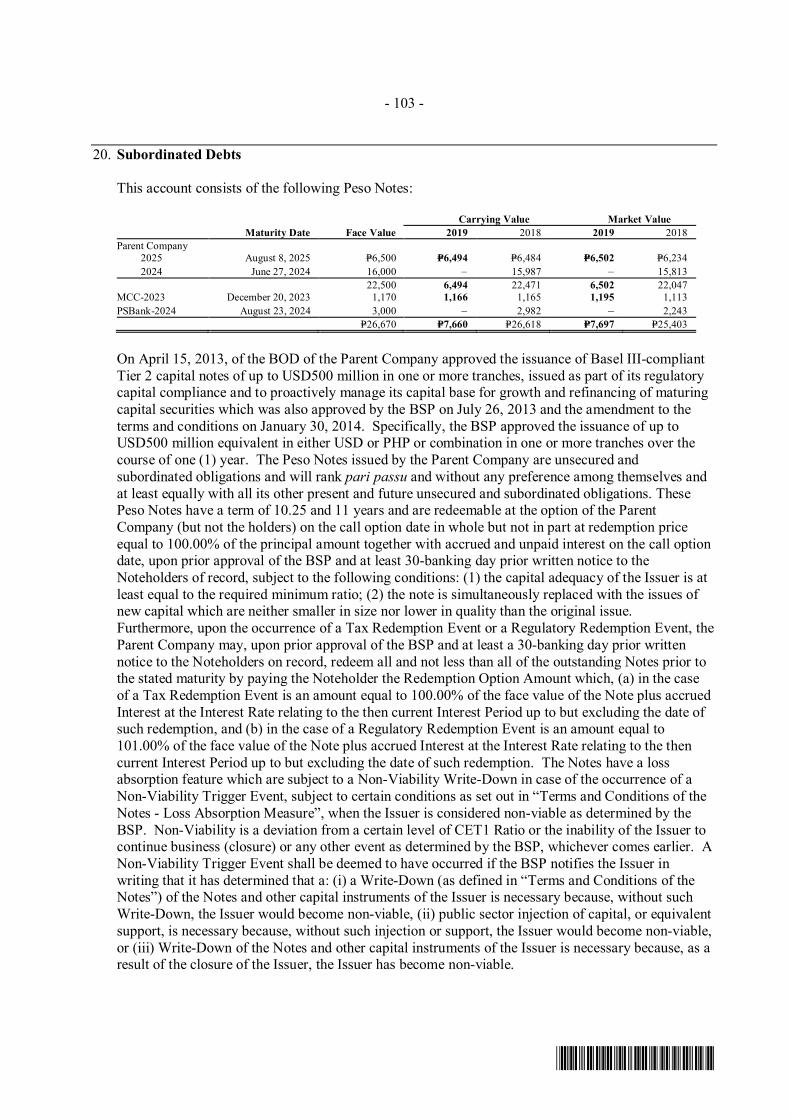
- 103 -
*SGVFS038804*
20. Subordinated Debts
This account consists of the following Peso Notes:
Carrying Value Market ValueMaturity Date Face Value 2019 2018 2019 2018
Parent Company2025 August 8, 2025 P=6,500 P=6,494 P=6,484 P=6,502 P=6,2342024 June 27, 2024 16,000 ‒ 15,987 ‒ 15,813
22,500 6,494 22,471 6,502 22,047MCC-2023 December 20, 2023 1,170 1,166 1,165 1,195 1,113PSBank-2024 August 23, 2024 3,000 ‒ 2,982 ‒ 2,243
P=26,670 P=7,660 P=26,618 P=7,697 P=25,403
On April 15, 2013, of the BOD of the Parent Company approved the issuance of Basel III-compliantTier 2 capital notes of up to USD500 million in one or more tranches, issued as part of its regulatorycapital compliance and to proactively manage its capital base for growth and refinancing of maturingcapital securities which was also approved by the BSP on July 26, 2013 and the amendment to theterms and conditions on January 30, 2014. Specifically, the BSP approved the issuance of up toUSD500 million equivalent in either USD or PHP or combination in one or more tranches over thecourse of one (1) year. The Peso Notes issued by the Parent Company are unsecured andsubordinated obligations and will rank pari passu and without any preference among themselves andat least equally with all its other present and future unsecured and subordinated obligations. ThesePeso Notes have a term of 10.25 and 11 years and are redeemable at the option of the ParentCompany (but not the holders) on the call option date in whole but not in part at redemption priceequal to 100.00% of the principal amount together with accrued and unpaid interest on the call optiondate, upon prior approval of the BSP and at least 30-banking day prior written notice to theNoteholders of record, subject to the following conditions: (1) the capital adequacy of the Issuer is atleast equal to the required minimum ratio; (2) the note is simultaneously replaced with the issues ofnew capital which are neither smaller in size nor lower in quality than the original issue.Furthermore, upon the occurrence of a Tax Redemption Event or a Regulatory Redemption Event, theParent Company may, upon prior approval of the BSP and at least a 30-banking day prior writtennotice to the Noteholders on record, redeem all and not less than all of the outstanding Notes prior tothe stated maturity by paying the Noteholder the Redemption Option Amount which, (a) in the caseof a Tax Redemption Event is an amount equal to 100.00% of the face value of the Note plus accruedInterest at the Interest Rate relating to the then current Interest Period up to but excluding the date ofsuch redemption, and (b) in the case of a Regulatory Redemption Event is an amount equal to101.00% of the face value of the Note plus accrued Interest at the Interest Rate relating to the thencurrent Interest Period up to but excluding the date of such redemption. The Notes have a lossabsorption feature which are subject to a Non-Viability Write-Down in case of the occurrence of aNon-Viability Trigger Event, subject to certain conditions as set out in “Terms and Conditions of theNotes - Loss Absorption Measure”, when the Issuer is considered non-viable as determined by theBSP. Non-Viability is a deviation from a certain level of CET1 Ratio or the inability of the Issuer tocontinue business (closure) or any other event as determined by the BSP, whichever comes earlier. ANon-Viability Trigger Event shall be deemed to have occurred if the BSP notifies the Issuer inwriting that it has determined that a: (i) a Write-Down (as defined in “Terms and Conditions of theNotes”) of the Notes and other capital instruments of the Issuer is necessary because, without suchWrite-Down, the Issuer would become non-viable, (ii) public sector injection of capital, or equivalentsupport, is necessary because, without such injection or support, the Issuer would become non-viable,or (iii) Write-Down of the Notes and other capital instruments of the Issuer is necessary because, as aresult of the closure of the Issuer, the Issuer has become non-viable.
- 104 -
*SGVFS038804*
Each Noteholder may not exercise or claim any right of set-off in respect of any amount owed to it bythe Parent Company arising under or in connection with the Peso Notes and to the fullest extentpermitted by applicable law, waive and be deemed to have waived all such rights of set-off. TheseNotes are not deposits and are not insured by the Philippine Deposit Insurance Corporation.
Specific terms of these Basel III-compliant Peso Notes follow:
Parent Company2024 Peso Notes - issued on March 27, 2014 at 100.00% of the principal amount of P=16.0 billion· Bear interest at 5.375% per annum from March 27, 2014 to but excluding June 27, 2019. Interest
will be payable quarterly in arrears on March 27, June 27, September 27 and December 27 ofeach year, commencing on June 27, 2014. Unless the Notes are previously redeemed, the initialinterest rate will be reset at the equivalent of the five-year PDST-F as of reset date plus a spreadof 1.51% per annum and such interest will be payable commencing on June 27, 2019 (call optiondate) up to and including June 27, 2024. As approved by the BSP on April 25, 2019, on June 27,2019, the Parent Company redeemed the Notes ahead of its maturity.
2025 Peso Notes - issued on August 8, 2014 at 100.00% of the principal amount of P=6.5 billion· Bear interest at 5.25% per annum from August 8, 2014 to but excluding August 8, 2020. Interest
will be payable quarterly in arrears on February 8, May 8, August 8 and November 8 of eachyear, commencing on November 8, 2014. Unless the Notes are previously redeemed, the initialinterest rate will be reset at equivalent of the five-year PDST-R2 as of reset date plus a spread of1.67% per annum and such interest will be payable commencing on August 8, 2020 (call optiondate) up to and including August 8, 2025.
MCC2023 Peso Notes - issued on December 20, 2013 at 100.00% of the principal amount of P=1.2 billion· Bear interest at 6.21% per annum payable quarterly in arrears every 20th of March, June,
September and December each year, commencing on March 20, 2014.· Basel III - compliant unsecured subordinated notes qualified as Tier 2 capital as approved by the
BSP on February 17, 2013.· In case of insolvency or liquidation of MCC, the notes will be subordinated in the right of
payment of principal and interest to all depositors and other creditors of MCC, except thosecreditors expressed to rank equally with, or behind holders of the notes.
· If a non-viability trigger event occurs, MCC shall immediately write down some or all of thenotes in accordance with the BSP’s determination.
· Subject to the written approval of the BSP, MCC may redeem all and not less than the entireoutstanding 2023 Notes, at a redemption price equal to the face value together with the accruedand unpaid interest based on the interest rate.
PSBank2024 Peso Notes - issued on May 23, 2014 at 100.00% of the face value of P=3.0 billion· Bear interest at the rate 5.50% per annum for the first 5 years and 3 months. Interest will be
payable quarterly in arrears on August 23, November 23, February 23 and May 23 of each year,commencing on August 23, 2014. Unless the Notes are previously redeemed, the initial interestrate will be reset at the equivalent of the five-year PDST-F as of reset date plus a spread of1.4438% per annum.
· Basel III - compliant unsecured subordinated notes qualified as Tier 2 capital as approved by theBSP on April 14, 2014.
· May be redeemed by PSBank in full, but not in part, on the call option date upon prior approvalof the BSP and subject to certain conditions.
- 105 -
*SGVFS038804*
· May be redeemed by PSBank in full, but not in part, upon the occurrence of a Tax Redemption orRegulatory Redemption Event prior to maturity by paying the Holders the following:a) In the case of a Tax Redemption Event, 100.00% of the face value of the Note plus accrued
interestb) In the case of a Regulatory Redemption Event, 101.00% of the face value of the Note plus
accrued interest.· Have a loss absorption feature which means the Notes are subject to a Non-Viability Write-Down
in case of the occurrence of a Non-Viability Trigger Event, subject to certain conditions.
As approved by the BSP on April 25, 2019, on August 23, 2019, PSBank redeemed the Notes aheadof its maturity.
As of December 31, 2019 and 2018, the Parent Company, PSBank and MCC are in compliance withthe terms and conditions upon which these subordinated notes have been issued.
In 2019, 2018 and 2017, interest expense on subordinated debts included in ‘Interest expense on billspayable and SSURA, bonds payable, subordinated debts and others’ amounted to P=983.0 million,P=1.5 billion and P=1.5 billion (including amortization of debt issue cost and premium of P=41.9 million,P=38.2 million and P=35.3 million), respectively, for the Group, and P=0.8 billion, P=1.2 billion andP=1.2 billion, respectively (including amortization of debt issue cost and premium of P=22.5 million,P=34.4 million and P=32.6 million, respectively) for the Parent Company.
21. Non-equity Non-controlling Interest and Other Liabilities
Non-equity Non-controlling InterestThis account arises when mutual funds are consolidated and where the Group holds less than100.00% of the investment in these funds. When this occurs, the Group acquires a liability in respectof non-controlling interests in the funds of which the Group has control. Such non-controllinginterests are distinguished from equity non-controlling interests in that the Group does not hold anequity stake in such funds. Further, income (loss) attributable to non-equity non-controlling interestsamounting to (P=0.2 billion), P=0.7 billion, and (P=1.3 billion) in 2019, 2018 and 2017, respectively, isincluded under ‘Trading and securities gain (loss) - net’ in the statements of income (Note 8).
Other LiabilitiesThis account consists of:
Consolidated Parent Company2019 2018 2019 2018
Accounts payable P=17,436 P=15,629 P=8,269 P=7,104Bills purchased - contra (Note 9) 14,089 12,171 14,080 12,158Marginal deposits 6,374 4,232 236 166Lease liability (Note 13) 4,038 ‒ 2,160 ‒Notes payable 2,592 2,600 ‒ ‒Other credits 1,800 1,887 853 726Deposits on lease contracts 1,725 1,643 ‒ ‒Outstanding acceptances 1,611 1,793 1,611 1,793Deferred revenues (Note 25) 1,486 1,398 63 64Retirement liability (Note 27) 938 277 ‒ ‒Withholding taxes payable 742 897 448 564Miscellaneous (Notes 11 and 15) 3,339 3,086 2,340 1,532
P=56,170 P=45,613 P=30,060 P=24,107
- 106 -
*SGVFS038804*
Notes payable represent unsecured notes issued by ORIX Metro on October 29, 2018 maturing onApril 29, 2020 and October 29, 2020 with annual interest rates of 7.02% and 7.45%, respectively,payable quarterly in arrears every January 29, April 29, July 29 and October 29 until their maturity.In 2019 and 2018, interest expense on notes payable included in ‘Interest expense on bills payableand SSURA, bonds payable, subordinated debts and others’ amounted to P=188.8 million andP=32.6 million, respectively.
Deferred revenues include deferral and release of MCC’s loyalty points program transactions andmembership fees and dues.
As of December 31, 2019 and 2018, miscellaneous liabilities of the Group include dividends payableamounting to P=90.0 million and P=90.4 million, respectively.
22. Maturity Profile of Assets and Liabilities
The following tables present the assets and liabilities by contractual maturity and settlement dates:
Consolidated2019 2018
Due WithinOne Year
Due BeyondOne Year Total
Due WithinOne Year
Due BeyondOne Year Total
Financial Assets - at grossCash and other cash items P=32,956 P=– P=32,956 P=33,091 P=– P=33,091Due from BSP 219,994 – 219,994 240,134 – 240,134Due from other banks 54,772 – 54,772 45,808 – 45,808Interbank loans receivable and SPURA (Note 7) 72,175 – 72,175 50,731 – 50,731Investment securities at FVTPL (Note 8) 61,867 – 61,867 39,689 – 39,689Investment securities at FVOCI (Note 8) 16,418 186,102 202,520 25,167 86,121 111,288Investment securities at amortized cost (Note 8) 24,075 227,579 251,654 2,684 262,740 265,424Loans and receivables (Note 9)
Receivables from customers 697,171 788,465 1,485,636 631,150 761,930 1,393,080Unquoted debt securities 150 866 1,016 ‒ 1,018 1,018Accrued interest receivable 13,102 3 13,105 10,661 6 10,667Accounts receivable 9,382 84 9,466 9,574 81 9,655Sales contract receivable 62 83 145 119 71 190Other receivables 313 18 331 335 – 335
Other assets (Note 14)Investments in SPVs 8,857 – 8,857 8,857 – 8,857Interoffice float items 1,643 – 1,643 2,536 – 2,536Returned checks and other cash items 407 – 407 417 ‒ 417Other investments – 31 31 – 26 26
1,213,344 1,203,231 2,416,575 1,100,953 1,111,993 2,212,946Non-Financial Assets - at grossInvestments in associates and a JV (Note 11) – 7,105 7,105 – 6,022 6,022Property and equipment (Note 10) – 49,298 49,298 – 43,167 43,167Investment properties (Note 12) – 10,369 10,369 – 10,217 10,217Deferred tax assets (Note 28) – 10,512 10,512 – 10,238 10,238Goodwill (Note 11) – 5,200 5,200 – 5,200 5,200Assets held under joint operations (Note 14) – 219 219 – 219 219Accounts receivable (Note 9) – 3,241 3,241 – 3,636 3,636Residual value of leased asset 390 745 1,135 354 776 1,130Other assets (Note 14) 2,908 14,885 17,793 2,828 13,581 16,409
3,298 101,574 104,872 3,182 93,056 96,238P=1,216,642 P=1,304,805 2,521,447 P=1,104,135 P=1,205,049 2,309,184
Less: Unearned discounts and capitalized interest
(Note 9) 5,149 4,859 Accumulated depreciation and amortization
(Notes 10, 12 and 14) 28,898 25,909 Allowance for credit and impairment losses
(Notes 10, 11, 12, 14, and 15) 36,587 34,723P=2,450,813 P=2,243,693
- 107 -
*SGVFS038804*
Consolidated2019 2018
Due WithinOne Year
Due BeyondOne Year Total
Due WithinOne Year
Due BeyondOne Year Total
Financial LiabilitiesDeposit liabilities
CASA P=1,077,507 P=– P=1,077,507 P=964,944 P=– P=964,944Time 565,982 26,915 592,897 527,635 20,384 548,019LTNCD (Note 16) 8,000 35,740 43,740 – 43,790 43,790
1,651,489 62,655 1,714,144 1,492,579 64,174 1,556,753Bills payable and SSURA (Note 17) 195,762 42,519 238,281 212,478 47,129 259,607Derivative liabilities (Note 8) 6,322 1,105 7,427 6,537 – 6,537Manager’s checks and demand drafts outstanding 6,806 – 6,806 7,565 – 7,565Accrued interest and other expenses 8,412 43 8,455 8,155 95 8,250Bonds payable (Note 19) 27,914 52,572 80,486 2,917 27,826 30,743Subordinated debts (Note 20) 6,494 1,166 7,660 15,987 10,631 26,618Non-equity non-controlling interest (Note 21) 6,553 – 6,553 6,747 – 6,747Other liabilities (Note 21)
Bills purchased – contra 14,089 – 14,089 12,171 – 12,171Accounts payable 17,226 210 17,436 15,629 – 15,629Marginal deposits 6,374 – 6,374 4,232 – 4,232Notes payable – 2,592 2,592 ‒ 2,600 2,600Outstanding acceptances 1,588 23 1,611 1,793 – 1,793Deposits on lease contracts 627 1,098 1,725 540 1,103 1,643Dividends payable 90 – 90 90 – 90
1,949,746 163,983 2,113,729 1,787,420 153,558 1,940,978Non-Financial LiabilitiesRetirement liability (Note 21 and 27) – 938 938 ‒ 277 277Income taxes payable 4,188 – 4,188 2,830 ‒ 2,830Lease liability 779 3,259 4,038 ‒ ‒ ‒Accrued other expenses 2,044 – 2,044 1,369 – 1,369Withholding taxes payable (Note 21) 742 – 742 897 – 897Deferred tax and other liabilities (Notes 21 and 28) 4,735 1,908 6,643 4,394 2,244 6,638
12,488 6,105 18,593 9,490 2,521 12,011P=1,962,234 P=170,088 P=2,132,322 P=1,796,910 P=156,079 P=1,952,989
Parent Company2019 2018
Due Within Due Beyond Due Within Due BeyondOne Year One Year Total One Year One Year Total
Financial Assets - at grossCash and other cash items P=30,659 P=– P=30,659 P=29,280 P=– P=29,280Due from BSP 195,770 – 195,770 206,289 – 206,289Due from other banks 38,698 – 38,698 35,218 – 35,218Interbank loans receivable and SPURA (Note 7) 56,153 – 56,153 24,724 – 24,724Investment securities at FVTPL (Note 8) 7,551 41,999 49,550 30,166 – 30,166Investment securities at FVOCI (Note 8) 8,262 180,414 188,676 16,647 75,497 92,144Investment securities at amortized cost (Note 8) 22,420 194,224 216,644 471 212,184 212,655Loans and receivables (Note 9)
Receivables from customers 596,047 575,239 1,171,286 547,558 563,646 1,111,204Unquoted debt securities – 386 386 ‒ 386 386Accrued interest receivable 10,500 3 10,503 7,981 6 7,987Accounts receivable 5,731 – 5,731 5,975 – 5,975Sales contract receivable 55 47 102 47 72 119Other receivables 12 – 12 13 – 13
Other assets (Note 14)Investments in SPVs 8,857 – 8,857 8,857 – 8,857Interoffice float items 1,654 – 1,654 2,619 – 2,619Returned checks and other cash items 378 – 378 397 ‒ 397
982,747 992,312 1,975,059 916,242 851,791 1,768,033Non-Financial Assets - at grossInvestments in subsidiaries (Note 11) – 95,739 95,739 – 81,288 81,288Investments in associates (Note 11) – 617 617 – 569 569Property and equipment (Note 10) – 31,684 31,684 – 27,990 27,990Investment properties (Note 12) – 4,989 4,989 – 4,552 4,552Deferred tax assets (Note 28) – 6,918 6,918 – 6,769 6,769Assets held under joint operations (Note 14) – 219 219 – 219 219Accounts receivable (Note 9) – 3,241 3,241 – 3,636 3,636Other assets (Note 14) 1,682 9,054 10,736 1,477 8,224 9,701
1,682 152,461 154,143 1,477 133,247 134,724P=984,429 P=1,144,773 2,129,202 P=917,719 P=985,038 1,902,757
Less: Unearned discounts and capitalized interest
(Note 9) 238 266 Accumulated depreciation and amortization
(Notes 10, 12 and 14) 16,183 14,537 Allowance for credit and impairment losses
(Notes 10, 11, 12, 14, and 15) 25,346 24,290P=2,087,435 P=1,863,664
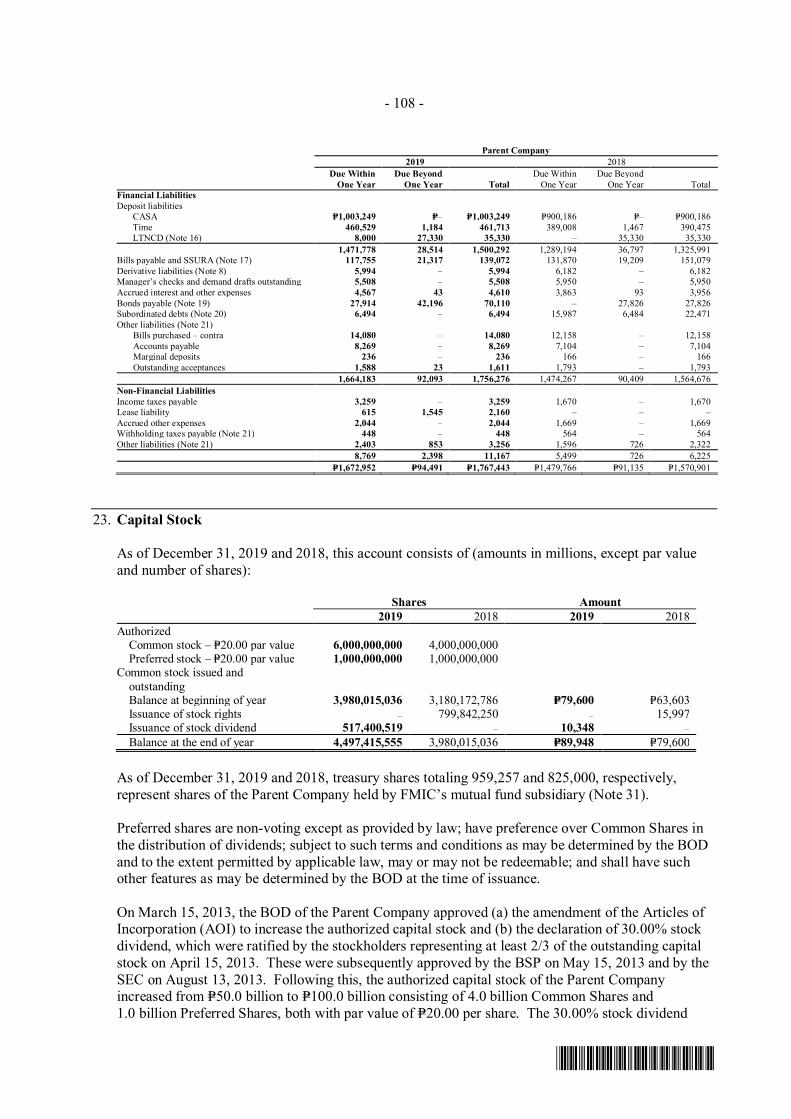
- 108 -
*SGVFS038804*
Parent Company2019 2018
Due Within Due Beyond Due Within Due BeyondOne Year One Year Total One Year One Year Total
Financial LiabilitiesDeposit liabilities
CASA P=1,003,249 P=– P=1,003,249 P=900,186 P=– P=900,186Time 460,529 1,184 461,713 389,008 1,467 390,475LTNCD (Note 16) 8,000 27,330 35,330 – 35,330 35,330
1,471,778 28,514 1,500,292 1,289,194 36,797 1,325,991Bills payable and SSURA (Note 17) 117,755 21,317 139,072 131,870 19,209 151,079Derivative liabilities (Note 8) 5,994 – 5,994 6,182 – 6,182Manager’s checks and demand drafts outstanding 5,508 – 5,508 5,950 – 5,950Accrued interest and other expenses 4,567 43 4,610 3,863 93 3,956Bonds payable (Note 19) 27,914 42,196 70,110 – 27,826 27,826Subordinated debts (Note 20) 6,494 – 6,494 15,987 6,484 22,471Other liabilities (Note 21)
Bills purchased – contra 14,080 – 14,080 12,158 – 12,158Accounts payable 8,269 – 8,269 7,104 – 7,104Marginal deposits 236 – 236 166 – 166Outstanding acceptances 1,588 23 1,611 1,793 – 1,793
1,664,183 92,093 1,756,276 1,474,267 90,409 1,564,676Non-Financial LiabilitiesIncome taxes payable 3,259 – 3,259 1,670 – 1,670Lease liability 615 1,545 2,160 – – –Accrued other expenses 2,044 – 2,044 1,669 – 1,669Withholding taxes payable (Note 21) 448 – 448 564 – 564Other liabilities (Note 21) 2,403 853 3,256 1,596 726 2,322
8,769 2,398 11,167 5,499 726 6,225P=1,672,952 P=94,491 P=1,767,443 P=1,479,766 P=91,135 P=1,570,901
23. Capital Stock
As of December 31, 2019 and 2018, this account consists of (amounts in millions, except par valueand number of shares):
Shares Amount2019 2018 2019 2018
AuthorizedCommon stock – P=20.00 par value 6,000,000,000 4,000,000,000Preferred stock – P=20.00 par value 1,000,000,000 1,000,000,000
Common stock issued andoutstandingBalance at beginning of year 3,980,015,036 3,180,172,786 P=79,600 P=63,603Issuance of stock rights – 799,842,250 – 15,997Issuance of stock dividend 517,400,519 – 10,348 –Balance at the end of year 4,497,415,555 3,980,015,036 P=89,948 P=79,600
As of December 31, 2019 and 2018, treasury shares totaling 959,257 and 825,000, respectively,represent shares of the Parent Company held by FMIC’s mutual fund subsidiary (Note 31).
Preferred shares are non-voting except as provided by law; have preference over Common Shares inthe distribution of dividends; subject to such terms and conditions as may be determined by the BODand to the extent permitted by applicable law, may or may not be redeemable; and shall have suchother features as may be determined by the BOD at the time of issuance.
On March 15, 2013, the BOD of the Parent Company approved (a) the amendment of the Articles ofIncorporation (AOI) to increase the authorized capital stock and (b) the declaration of 30.00% stockdividend, which were ratified by the stockholders representing at least 2/3 of the outstanding capitalstock on April 15, 2013. These were subsequently approved by the BSP on May 15, 2013 and by theSEC on August 13, 2013. Following this, the authorized capital stock of the Parent Companyincreased from P=50.0 billion to P=100.0 billion consisting of 4.0 billion Common Shares and1.0 billion Preferred Shares, both with par value of P=20.00 per share. The 30.00% stock dividend
- 109 -
*SGVFS038804*
equivalent to 633,415,049 common shares amounting to P=12.7 billion represents at least the minimum25.00% subscribed and paid-up capital for the increase in the authorized capital stock referred toabove which was issued/paid on September 16, 2013 with record date on September 3, 2013. OnSeptember 10, 2013, the PSE approved the listing of such additional common shares.
On January 21, 2015, the Parent Company’s BOD approved the Stock Rights Offer (SRO) by way ofissuance from the unissued portion of the authorized capital stock which was noted by BSP with theissuance of a letter of no objection to the Rights Issue on February 17, 2015. On February 24, 2015,the SEC confirmed the exemption of this issuance of P=32.0 billion worth of common shares from theregistration requirements under Section 8 of the SRC. On February 25, 2015, the PSE approved thelisting of up to 500.0 million common shares to cover the SRO to all stockholders of record as ofMarch 18, 2015. On April 7, 2015, following regulatory approvals, the Parent Company concludedthe P=32.0 billion SRO, involving 435,371,720 common shares with par value of P=20.00 priced atP=73.50 per share and listed with the PSE on the same date. The difference between the issued priceand the par value is recognized as ‘Capital paid in excess of par value’.
On January 17, 2018, the Parent Company’s BOD approved the SRO by way of issuance of up to amaximum of 819,827,214 common shares to raise additional capital of up to P=60.0 billion. This wasnoted by the BSP with the issuance of a letter of no objection to the rights issue on January 29, 2018.On April 4, 2018, following the regulatory approvals, the Parent Company concluded theP=60.0 billion SRO, involving 799,842,250 common shares with par value of P=20.00 priced atP=75.00 per share and listed on the PSE on April 12, 2018. Transaction costs on SRO amounting toP=878.2 million were charged against ‘Capital paid in excess of par value’.
On February 13, 2019, the BOD of the Parent Company approved (a) the amendment of the AOI toincrease the authorized capital stock from P=100.0 billion to P=140.0 billion and (b) the declaration of a13% stock dividend equivalent to 517,401,955 shares amounting to P=10.3 billion representing theminimum 25% subscription and paid-up capital for the increase in the authorized capital stock whichwere ratified by the stockholders representing at least 2/3 of the outstanding capital stock on April 24,2019. These were approved by the BSP on August 8, 2019 and by the SEC on October 4, 2019.Following this, the authorized capital stock of the Parent Company increased from P=100.0 billion toP=140.0 billion consisting of 6.0 billion common shares and 1.0 billion preferred shares, both with parvalues of P=20.0 per share. On October 16, 2019, the Parent Company received the SEC Order fixingthe Record Date of the 13% stock dividend on October 31, 2019. The 13% stock dividend was issuedon November 26, 2019 with record date on October 31, 2019. On November 19, 2019, the PSEapproved the listing of such stock dividend.
All issued and outstanding shares of the Parent Company are listed with the PSE (Note 1). As ofDecember 31, 2019 and 2018, there are 2,986 and 3,031 holders, respectively, of the listed shares ofthe Parent Company, with share price closed at P=66.30 and P=80.95 a share, respectively.
The history of share issuances during the last ten years follows:
Year Issuance Listing Date Number of Shares Issued2019 Stock dividend November 26, 2019 517,400,5192018 Stock rights April 12, 2018 799,842,2502015 Stock rights April 7, 2015 435,371,7202013 Stock dividend September 16, 2013 633,415,0492011 Stock rights January 24, 2011 200,000,000
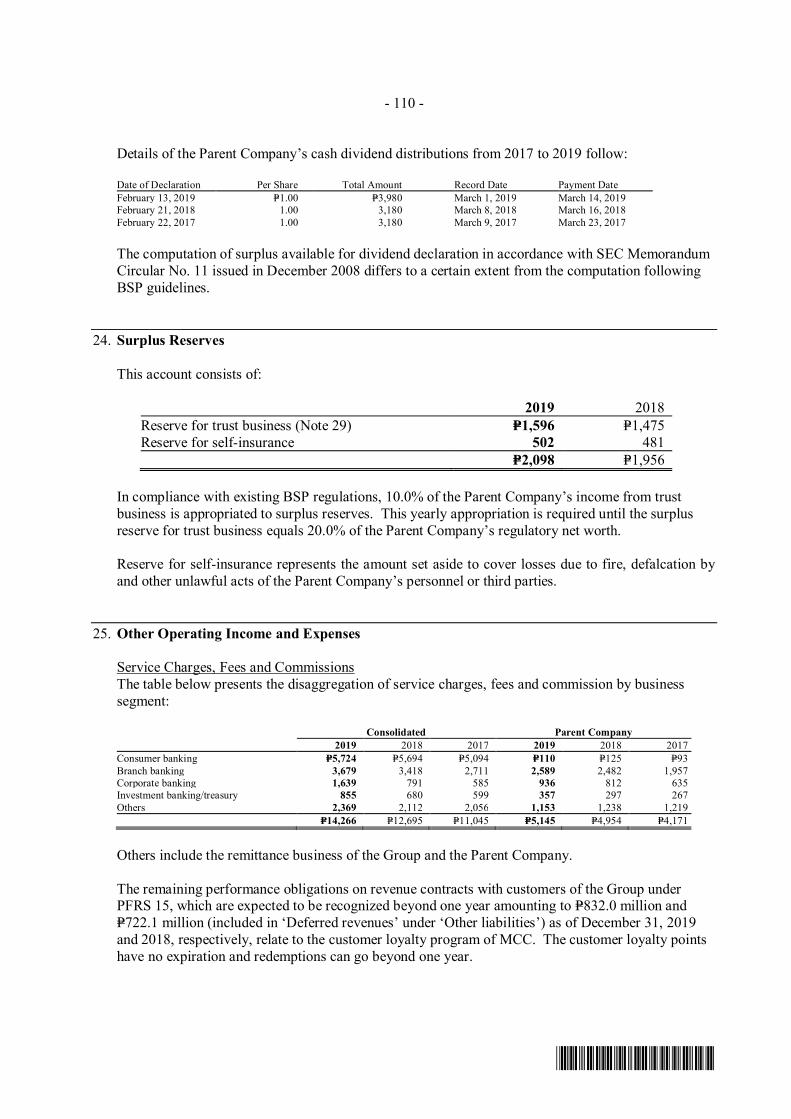
- 110 -
*SGVFS038804*
Details of the Parent Company’s cash dividend distributions from 2017 to 2019 follow:
Date of Declaration Per Share Total Amount Record Date Payment DateFebruary 13, 2019 P=1.00 P=3,980 March 1, 2019 March 14, 2019February 21, 2018 1.00 3,180 March 8, 2018 March 16, 2018February 22, 2017 1.00 3,180 March 9, 2017 March 23, 2017
The computation of surplus available for dividend declaration in accordance with SEC MemorandumCircular No. 11 issued in December 2008 differs to a certain extent from the computation followingBSP guidelines.
24. Surplus Reserves
This account consists of:
2019 2018Reserve for trust business (Note 29) P=1,596 P=1,475Reserve for self-insurance 502 481
P=2,098 P=1,956
In compliance with existing BSP regulations, 10.0% of the Parent Company’s income from trustbusiness is appropriated to surplus reserves. This yearly appropriation is required until the surplusreserve for trust business equals 20.0% of the Parent Company’s regulatory net worth.
Reserve for self-insurance represents the amount set aside to cover losses due to fire, defalcation byand other unlawful acts of the Parent Company’s personnel or third parties.
25. Other Operating Income and Expenses
Service Charges, Fees and CommissionsThe table below presents the disaggregation of service charges, fees and commission by businesssegment:
Consolidated Parent Company2019 2018 2017 2019 2018 2017
Consumer banking P=5,724 P=5,694 P=5,094 P=110 P=125 P=93Branch banking 3,679 3,418 2,711 2,589 2,482 1,957Corporate banking 1,639 791 585 936 812 635Investment banking/treasury 855 680 599 357 297 267Others 2,369 2,112 2,056 1,153 1,238 1,219
P=14,266 P=12,695 P=11,045 P=5,145 P=4,954 P=4,171
Others include the remittance business of the Group and the Parent Company.
The remaining performance obligations on revenue contracts with customers of the Group underPFRS 15, which are expected to be recognized beyond one year amounting to P=832.0 million andP=722.1 million (included in ‘Deferred revenues’ under ‘Other liabilities’) as of December 31, 2019and 2018, respectively, relate to the customer loyalty program of MCC. The customer loyalty pointshave no expiration and redemptions can go beyond one year.
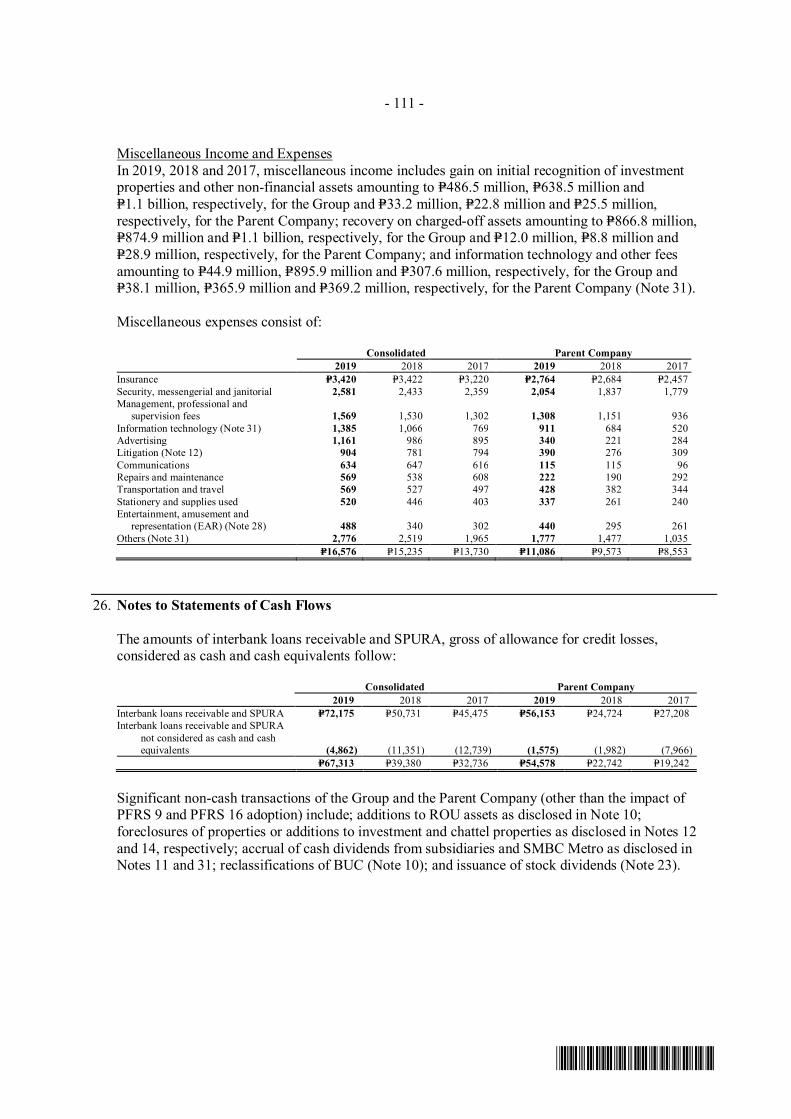
- 111 -
*SGVFS038804*
Miscellaneous Income and ExpensesIn 2019, 2018 and 2017, miscellaneous income includes gain on initial recognition of investmentproperties and other non-financial assets amounting to P=486.5 million, P=638.5 million andP=1.1 billion, respectively, for the Group and P=33.2 million, P=22.8 million and P=25.5 million,respectively, for the Parent Company; recovery on charged-off assets amounting to P=866.8 million,P=874.9 million and P=1.1 billion, respectively, for the Group and P=12.0 million, P=8.8 million andP=28.9 million, respectively, for the Parent Company; and information technology and other feesamounting to P=44.9 million, P=895.9 million and P=307.6 million, respectively, for the Group andP=38.1 million, P=365.9 million and P=369.2 million, respectively, for the Parent Company (Note 31).
Miscellaneous expenses consist of:
Consolidated Parent Company2019 2018 2017 2019 2018 2017
Insurance P=3,420 P=3,422 P=3,220 P=2,764 P=2,684 P=2,457Security, messengerial and janitorial 2,581 2,433 2,359 2,054 1,837 1,779Management, professional and
supervision fees 1,569 1,530 1,302 1,308 1,151 936Information technology (Note 31) 1,385 1,066 769 911 684 520Advertising 1,161 986 895 340 221 284Litigation (Note 12) 904 781 794 390 276 309Communications 634 647 616 115 115 96Repairs and maintenance 569 538 608 222 190 292Transportation and travel 569 527 497 428 382 344Stationery and supplies used 520 446 403 337 261 240Entertainment, amusement and
representation (EAR) (Note 28) 488 340 302 440 295 261Others (Note 31) 2,776 2,519 1,965 1,777 1,477 1,035
P=16,576 P=15,235 P=13,730 P=11,086 P=9,573 P=8,553
26. Notes to Statements of Cash Flows
The amounts of interbank loans receivable and SPURA, gross of allowance for credit losses,considered as cash and cash equivalents follow:
Consolidated Parent Company2019 2018 2017 2019 2018 2017
Interbank loans receivable and SPURA P=72,175 P=50,731 P=45,475 P=56,153 P=24,724 P=27,208Interbank loans receivable and SPURA
not considered as cash and cashequivalents (4,862) (11,351) (12,739) (1,575) (1,982) (7,966)
P=67,313 P=39,380 P=32,736 P=54,578 P=22,742 P=19,242
Significant non-cash transactions of the Group and the Parent Company (other than the impact ofPFRS 9 and PFRS 16 adoption) include; additions to ROU assets as disclosed in Note 10;foreclosures of properties or additions to investment and chattel properties as disclosed in Notes 12and 14, respectively; accrual of cash dividends from subsidiaries and SMBC Metro as disclosed inNotes 11 and 31; reclassifications of BUC (Note 10); and issuance of stock dividends (Note 23).
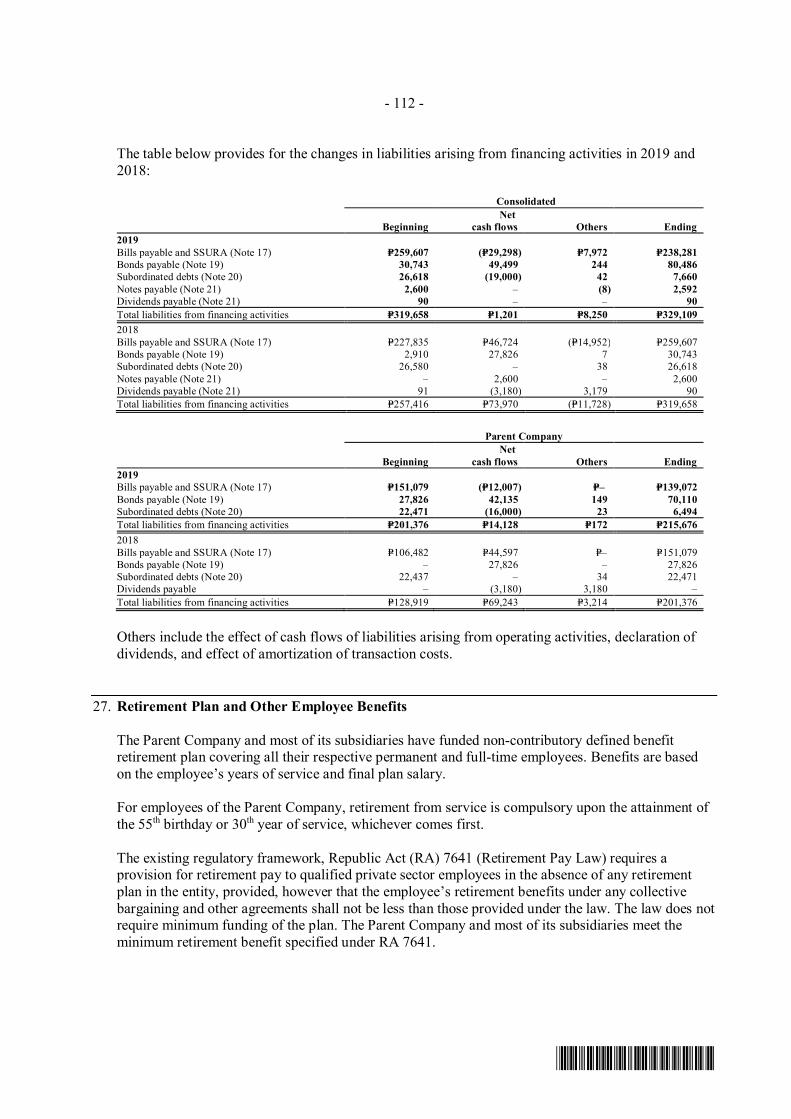
- 112 -
*SGVFS038804*
The table below provides for the changes in liabilities arising from financing activities in 2019 and2018:
Consolidated
BeginningNet
cash flows Others Ending2019Bills payable and SSURA (Note 17) P=259,607 (P=29,298) P=7,972 P=238,281Bonds payable (Note 19) 30,743 49,499 244 80,486Subordinated debts (Note 20) 26,618 (19,000) 42 7,660Notes payable (Note 21) 2,600 – (8) 2,592Dividends payable (Note 21) 90 – – 90Total liabilities from financing activities P=319,658 P=1,201 P=8,250 P=329,1092018Bills payable and SSURA (Note 17) P=227,835 P=46,724 (P=14,952) P=259,607Bonds payable (Note 19) 2,910 27,826 7 30,743Subordinated debts (Note 20) 26,580 – 38 26,618Notes payable (Note 21) ‒ 2,600 ‒ 2,600Dividends payable (Note 21) 91 (3,180) 3,179 90Total liabilities from financing activities P=257,416 P=73,970 (P=11,728) P=319,658
Parent Company
BeginningNet
cash flows Others Ending2019Bills payable and SSURA (Note 17) P=151,079 (P=12,007) P=– P=139,072Bonds payable (Note 19) 27,826 42,135 149 70,110Subordinated debts (Note 20) 22,471 (16,000) 23 6,494Total liabilities from financing activities P=201,376 P=14,128 P=172 P=215,6762018Bills payable and SSURA (Note 17) P=106,482 P=44,597 P=– P=151,079Bonds payable (Note 19) – 27,826 – 27,826Subordinated debts (Note 20) 22,437 – 34 22,471Dividends payable – (3,180) 3,180 –Total liabilities from financing activities P=128,919 P=69,243 P=3,214 P=201,376
Others include the effect of cash flows of liabilities arising from operating activities, declaration ofdividends, and effect of amortization of transaction costs.
27. Retirement Plan and Other Employee Benefits
The Parent Company and most of its subsidiaries have funded non-contributory defined benefitretirement plan covering all their respective permanent and full-time employees. Benefits are basedon the employee’s years of service and final plan salary.
For employees of the Parent Company, retirement from service is compulsory upon the attainment ofthe 55th birthday or 30th year of service, whichever comes first.
The existing regulatory framework, Republic Act (RA) 7641 (Retirement Pay Law) requires aprovision for retirement pay to qualified private sector employees in the absence of any retirementplan in the entity, provided, however that the employee’s retirement benefits under any collectivebargaining and other agreements shall not be less than those provided under the law. The law does notrequire minimum funding of the plan. The Parent Company and most of its subsidiaries meet theminimum retirement benefit specified under RA 7641.
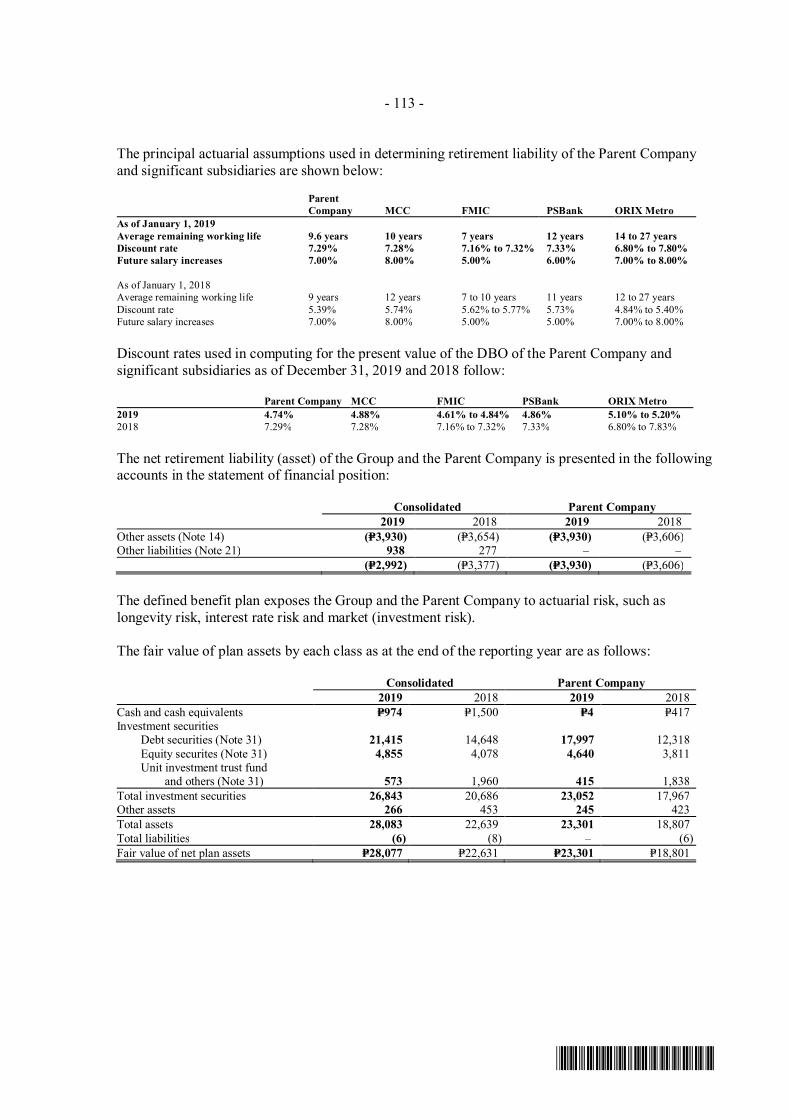
- 113 -
*SGVFS038804*
The principal actuarial assumptions used in determining retirement liability of the Parent Companyand significant subsidiaries are shown below:
ParentCompany MCC FMIC PSBank ORIX Metro
As of January 1, 2019Average remaining working life 9.6 years 10 years 7 years 12 years 14 to 27 yearsDiscount rate 7.29% 7.28% 7.16% to 7.32% 7.33% 6.80% to 7.80%Future salary increases 7.00% 8.00% 5.00% 6.00% 7.00% to 8.00%
As of January 1, 2018Average remaining working life 9 years 12 years 7 to 10 years 11 years 12 to 27 yearsDiscount rate 5.39% 5.74% 5.62% to 5.77% 5.73% 4.84% to 5.40%Future salary increases 7.00% 8.00% 5.00% 5.00% 7.00% to 8.00%
Discount rates used in computing for the present value of the DBO of the Parent Company andsignificant subsidiaries as of December 31, 2019 and 2018 follow:
Parent Company MCC FMIC PSBank ORIX Metro2019 4.74% 4.88% 4.61% to 4.84% 4.86% 5.10% to 5.20%2018 7.29% 7.28% 7.16% to 7.32% 7.33% 6.80% to 7.83%
The net retirement liability (asset) of the Group and the Parent Company is presented in the followingaccounts in the statement of financial position:
Consolidated Parent Company2019 2018 2019 2018
Other assets (Note 14) (P=3,930) (P=3,654) (P=3,930) (P=3,606)Other liabilities (Note 21) 938 277 ‒ ‒
(P=2,992) (P=3,377) (P=3,930) (P=3,606)
The defined benefit plan exposes the Group and the Parent Company to actuarial risk, such aslongevity risk, interest rate risk and market (investment risk).
The fair value of plan assets by each class as at the end of the reporting year are as follows:
Consolidated Parent Company2019 2018 2019 2018
Cash and cash equivalents P=974 P=1,500 P=4 P=417Investment securities Debt securities (Note 31) 21,415 14,648 17,997 12,318
Equity securites (Note 31) 4,855 4,078 4,640 3,811 Unit investment trust fund
and others (Note 31) 573 1,960 415 1,838Total investment securities 26,843 20,686 23,052 17,967Other assets 266 453 245 423Total assets 28,083 22,639 23,301 18,807Total liabilities (6) (8) – (6)Fair value of net plan assets P=28,077 P=22,631 P=23,301 P=18,801
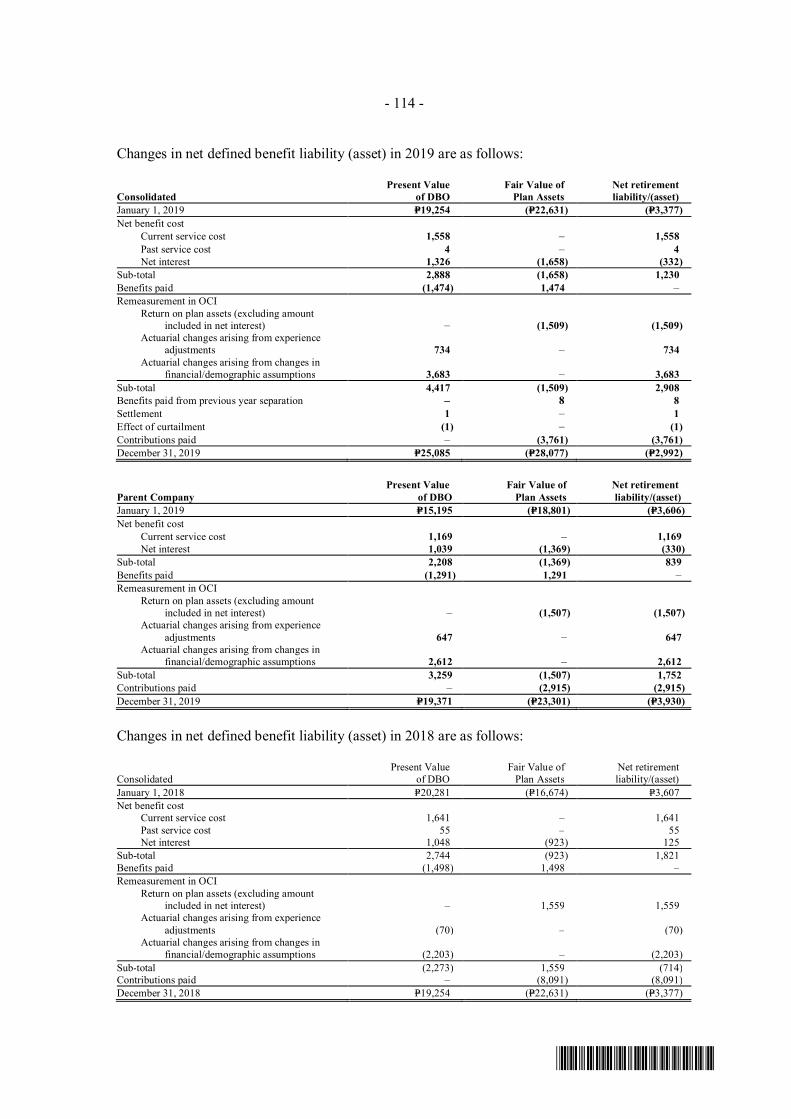
- 114 -
*SGVFS038804*
Changes in net defined benefit liability (asset) in 2019 are as follows:
ConsolidatedPresent Value
of DBOFair Value of
Plan AssetsNet retirementliability/(asset)
January 1, 2019 P=19,254 (P=22,631) (P=3,377)Net benefit cost
Current service cost 1,558 – 1,558Past service cost 4 – 4Net interest 1,326 (1,658) (332)
Sub-total 2,888 (1,658) 1,230Benefits paid (1,474) 1,474 –Remeasurement in OCI
Return on plan assets (excluding amountincluded in net interest) – (1,509) (1,509)
Actuarial changes arising from experienceadjustments 734 – 734
Actuarial changes arising from changes infinancial/demographic assumptions 3,683 – 3,683
Sub-total 4,417 (1,509) 2,908Benefits paid from previous year separation – 8 8Settlement 1 – 1Effect of curtailment (1) – (1)Contributions paid – (3,761) (3,761)December 31, 2019 P=25,085 (P=28,077) (P=2,992)
Parent CompanyPresent Value
of DBOFair Value of
Plan AssetsNet retirementliability/(asset)
January 1, 2019 P=15,195 (P=18,801) (P=3,606)Net benefit cost
Current service cost 1,169 – 1,169Net interest 1,039 (1,369) (330)
Sub-total 2,208 (1,369) 839Benefits paid (1,291) 1,291 –Remeasurement in OCI
Return on plan assets (excluding amountincluded in net interest) – (1,507) (1,507)
Actuarial changes arising from experienceadjustments 647 – 647
Actuarial changes arising from changes infinancial/demographic assumptions 2,612 – 2,612
Sub-total 3,259 (1,507) 1,752Contributions paid – (2,915) (2,915)December 31, 2019 P=19,371 (P=23,301) (P=3,930)
Changes in net defined benefit liability (asset) in 2018 are as follows:
ConsolidatedPresent Value
of DBOFair Value of
Plan AssetsNet retirementliability/(asset)
January 1, 2018 P=20,281 (P=16,674) P=3,607Net benefit cost
Current service cost 1,641 – 1,641Past service cost 55 – 55Net interest 1,048 (923) 125
Sub-total 2,744 (923) 1,821Benefits paid (1,498) 1,498 –Remeasurement in OCI
Return on plan assets (excluding amountincluded in net interest) – 1,559 1,559
Actuarial changes arising from experienceadjustments (70) – (70)
Actuarial changes arising from changes infinancial/demographic assumptions (2,203) – (2,203)
Sub-total (2,273) 1,559 (714)Contributions paid – (8,091) (8,091)December 31, 2018 P=19,254 (P=22,631) (P=3,377)
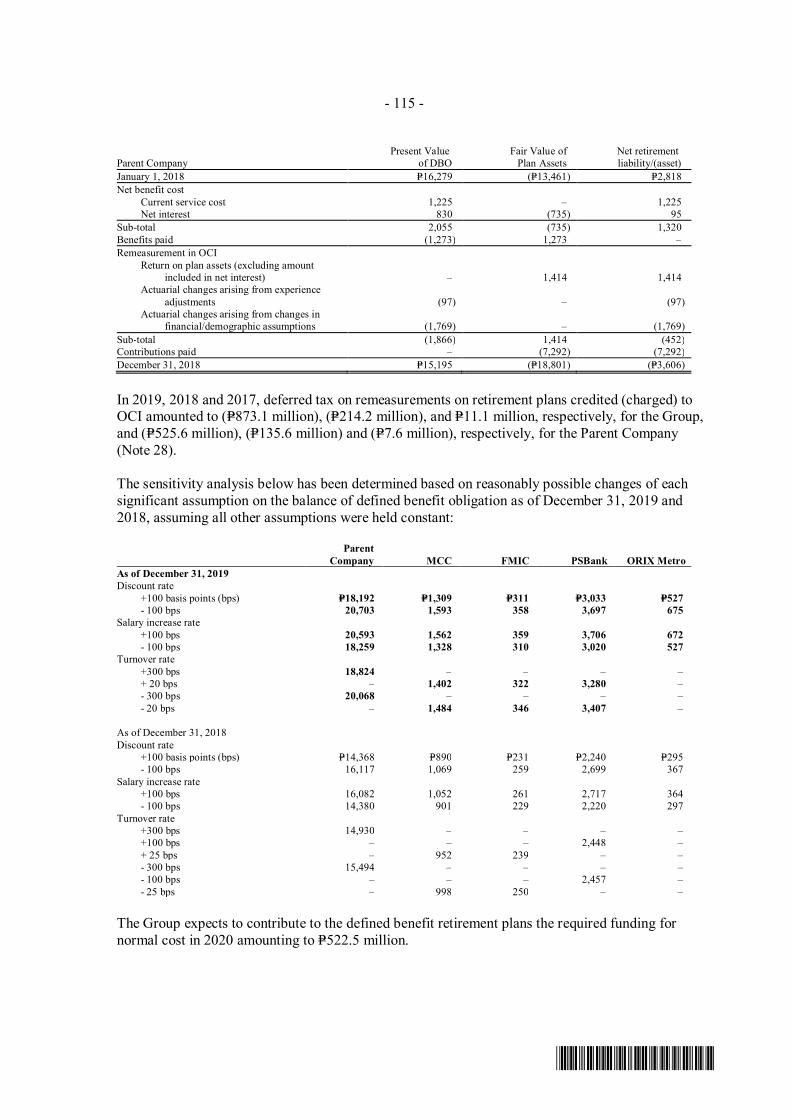
- 115 -
*SGVFS038804*
Parent CompanyPresent Value
of DBOFair Value of
Plan AssetsNet retirementliability/(asset)
January 1, 2018 P=16,279 (P=13,461) P=2,818Net benefit cost
Current service cost 1,225 – 1,225Net interest 830 (735) 95
Sub-total 2,055 (735) 1,320Benefits paid (1,273) 1,273 ‒Remeasurement in OCI
Return on plan assets (excluding amountincluded in net interest) – 1,414 1,414
Actuarial changes arising from experienceadjustments (97) – (97)
Actuarial changes arising from changes infinancial/demographic assumptions (1,769) – (1,769)
Sub-total (1,866) 1,414 (452)Contributions paid ‒ (7,292) (7,292)December 31, 2018 P=15,195 (P=18,801) (P=3,606)
In 2019, 2018 and 2017, deferred tax on remeasurements on retirement plans credited (charged) toOCI amounted to (P=873.1 million), (P=214.2 million), and P=11.1 million, respectively, for the Group,and (P=525.6 million), (P=135.6 million) and (P=7.6 million), respectively, for the Parent Company(Note 28).
The sensitivity analysis below has been determined based on reasonably possible changes of eachsignificant assumption on the balance of defined benefit obligation as of December 31, 2019 and2018, assuming all other assumptions were held constant:
ParentCompany MCC FMIC PSBank ORIX Metro
As of December 31, 2019Discount rate
+100 basis points (bps) P=18,192 P=1,309 P=311 P=3,033 P=527- 100 bps 20,703 1,593 358 3,697 675
Salary increase rate+100 bps 20,593 1,562 359 3,706 672- 100 bps 18,259 1,328 310 3,020 527
Turnover rate+300 bps 18,824 – – – –+ 20 bps – 1,402 322 3,280 –- 300 bps 20,068 – – – –- 20 bps – 1,484 346 3,407 –
As of December 31, 2018Discount rate
+100 basis points (bps) P=14,368 P=890 P=231 P=2,240 P=295- 100 bps 16,117 1,069 259 2,699 367
Salary increase rate+100 bps 16,082 1,052 261 2,717 364- 100 bps 14,380 901 229 2,220 297
Turnover rate+300 bps 14,930 – – – –+100 bps – – – 2,448 –+ 25 bps – 952 239 – –- 300 bps 15,494 – – – –- 100 bps – – – 2,457 –- 25 bps – 998 250 – –
The Group expects to contribute to the defined benefit retirement plans the required funding fornormal cost in 2020 amounting to P=522.5 million.
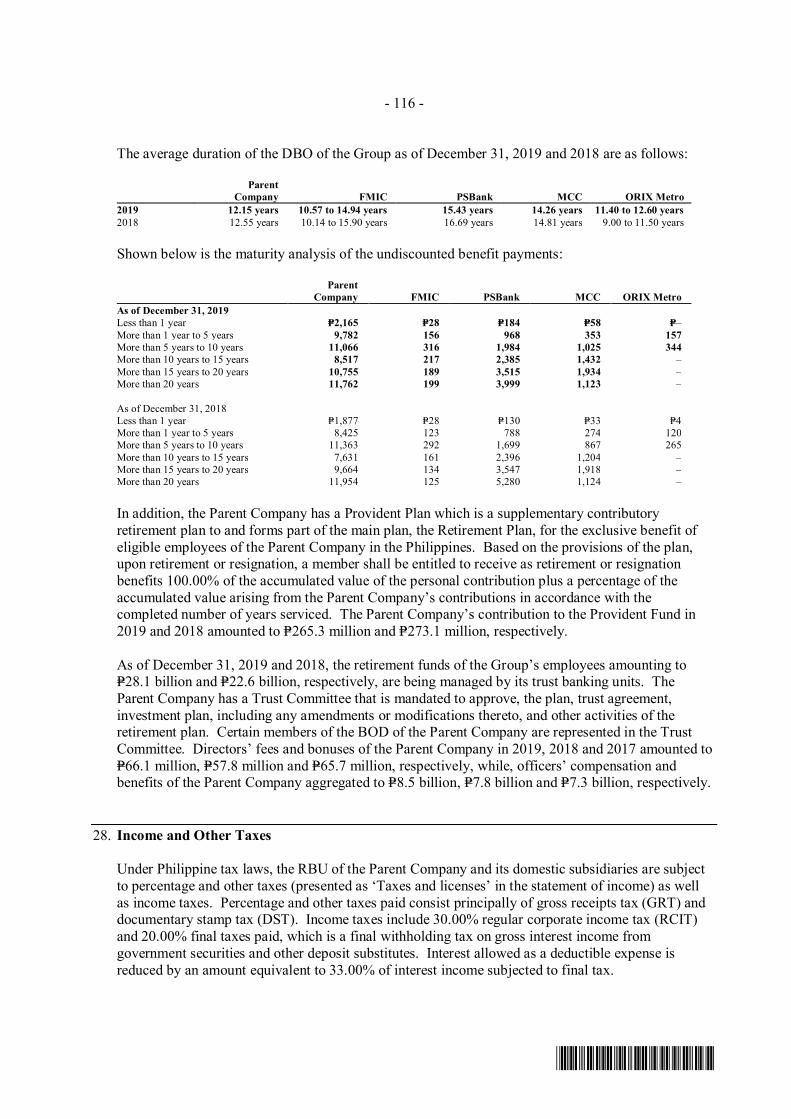
- 116 -
*SGVFS038804*
The average duration of the DBO of the Group as of December 31, 2019 and 2018 are as follows:
ParentCompany FMIC PSBank MCC ORIX Metro
2019 12.15 years 10.57 to 14.94 years 15.43 years 14.26 years 11.40 to 12.60 years2018 12.55 years 10.14 to 15.90 years 16.69 years 14.81 years 9.00 to 11.50 years
Shown below is the maturity analysis of the undiscounted benefit payments:
ParentCompany FMIC PSBank MCC ORIX Metro
As of December 31, 2019Less than 1 year P=2,165 P=28 P=184 P=58 P=–More than 1 year to 5 years 9,782 156 968 353 157More than 5 years to 10 years 11,066 316 1,984 1,025 344More than 10 years to 15 years 8,517 217 2,385 1,432 –More than 15 years to 20 years 10,755 189 3,515 1,934 –More than 20 years 11,762 199 3,999 1,123 –
As of December 31, 2018Less than 1 year P=1,877 P=28 P=130 P=33 P=4More than 1 year to 5 years 8,425 123 788 274 120More than 5 years to 10 years 11,363 292 1,699 867 265More than 10 years to 15 years 7,631 161 2,396 1,204 –More than 15 years to 20 years 9,664 134 3,547 1,918 –More than 20 years 11,954 125 5,280 1,124 –
In addition, the Parent Company has a Provident Plan which is a supplementary contributoryretirement plan to and forms part of the main plan, the Retirement Plan, for the exclusive benefit ofeligible employees of the Parent Company in the Philippines. Based on the provisions of the plan,upon retirement or resignation, a member shall be entitled to receive as retirement or resignationbenefits 100.00% of the accumulated value of the personal contribution plus a percentage of theaccumulated value arising from the Parent Company’s contributions in accordance with thecompleted number of years serviced. The Parent Company’s contribution to the Provident Fund in2019 and 2018 amounted to P=265.3 million and P=273.1 million, respectively.
As of December 31, 2019 and 2018, the retirement funds of the Group’s employees amounting toP=28.1 billion and P=22.6 billion, respectively, are being managed by its trust banking units. TheParent Company has a Trust Committee that is mandated to approve, the plan, trust agreement,investment plan, including any amendments or modifications thereto, and other activities of theretirement plan. Certain members of the BOD of the Parent Company are represented in the TrustCommittee. Directors’ fees and bonuses of the Parent Company in 2019, 2018 and 2017 amounted toP=66.1 million, P=57.8 million and P=65.7 million, respectively, while, officers’ compensation andbenefits of the Parent Company aggregated to P=8.5 billion, P=7.8 billion and P=7.3 billion, respectively.
28. Income and Other Taxes
Under Philippine tax laws, the RBU of the Parent Company and its domestic subsidiaries are subjectto percentage and other taxes (presented as ‘Taxes and licenses’ in the statement of income) as wellas income taxes. Percentage and other taxes paid consist principally of gross receipts tax (GRT) anddocumentary stamp tax (DST). Income taxes include 30.00% regular corporate income tax (RCIT)and 20.00% final taxes paid, which is a final withholding tax on gross interest income fromgovernment securities and other deposit substitutes. Interest allowed as a deductible expense isreduced by an amount equivalent to 33.00% of interest income subjected to final tax.
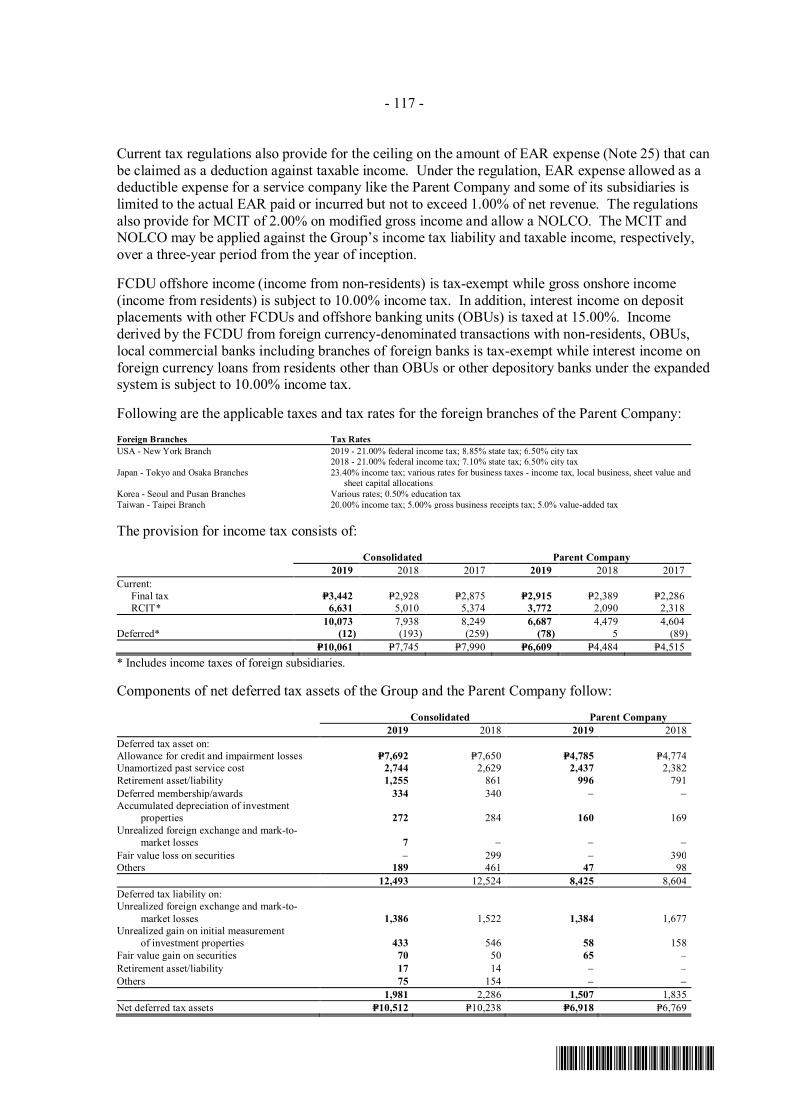
- 117 -
*SGVFS038804*
Current tax regulations also provide for the ceiling on the amount of EAR expense (Note 25) that canbe claimed as a deduction against taxable income. Under the regulation, EAR expense allowed as adeductible expense for a service company like the Parent Company and some of its subsidiaries islimited to the actual EAR paid or incurred but not to exceed 1.00% of net revenue. The regulationsalso provide for MCIT of 2.00% on modified gross income and allow a NOLCO. The MCIT andNOLCO may be applied against the Group’s income tax liability and taxable income, respectively,over a three-year period from the year of inception.
FCDU offshore income (income from non-residents) is tax-exempt while gross onshore income(income from residents) is subject to 10.00% income tax. In addition, interest income on depositplacements with other FCDUs and offshore banking units (OBUs) is taxed at 15.00%. Incomederived by the FCDU from foreign currency-denominated transactions with non-residents, OBUs,local commercial banks including branches of foreign banks is tax-exempt while interest income onforeign currency loans from residents other than OBUs or other depository banks under the expandedsystem is subject to 10.00% income tax.
Following are the applicable taxes and tax rates for the foreign branches of the Parent Company:Foreign Branches Tax RatesUSA - New York Branch 2019 - 21.00% federal income tax; 8.85% state tax; 6.50% city tax
2018 - 21.00% federal income tax; 7.10% state tax; 6.50% city taxJapan - Tokyo and Osaka Branches 23.40% income tax; various rates for business taxes - income tax, local business, sheet value and
sheet capital allocationsKorea - Seoul and Pusan Branches Various rates; 0.50% education taxTaiwan - Taipei Branch 20.00% income tax; 5.00% gross business receipts tax; 5.0% value-added tax
The provision for income tax consists of:
Consolidated Parent Company2019 2018 2017 2019 2018 2017
Current:Final tax P=3,442 P=2,928 P=2,875 P=2,915 P=2,389 P=2,286
RCIT* 6,631 5,010 5,374 3,772 2,090 2,31810,073 7,938 8,249 6,687 4,479 4,604
Deferred* (12) (193) (259) (78) 5 (89)P=10,061 P=7,745 P=7,990 P=6,609 P=4,484 P=4,515
* Includes income taxes of foreign subsidiaries.
Components of net deferred tax assets of the Group and the Parent Company follow:
Consolidated Parent Company2019 2018 2019 2018
Deferred tax asset on:Allowance for credit and impairment losses P=7,692 P=7,650 P=4,785 P=4,774Unamortized past service cost 2,744 2,629 2,437 2,382Retirement asset/liability 1,255 861 996 791Deferred membership/awards 334 340 - -Accumulated depreciation of investment
properties 272 284 160 169Unrealized foreign exchange and mark-to-
market losses 7 - - -Fair value loss on securities - 299 - 390Others 189 461 47 98
12,493 12,524 8,425 8,604Deferred tax liability on:Unrealized foreign exchange and mark-to-
market losses 1,386 1,522 1,384 1,677Unrealized gain on initial measurement
of investment properties 433 546 58 158Fair value gain on securities 70 50 65 ‒Retirement asset/liability 17 14 - ‒Others 75 154 - -
1,981 2,286 1,507 1,835Net deferred tax assets P=10,512 P=10,238 P=6,918 P=6,769
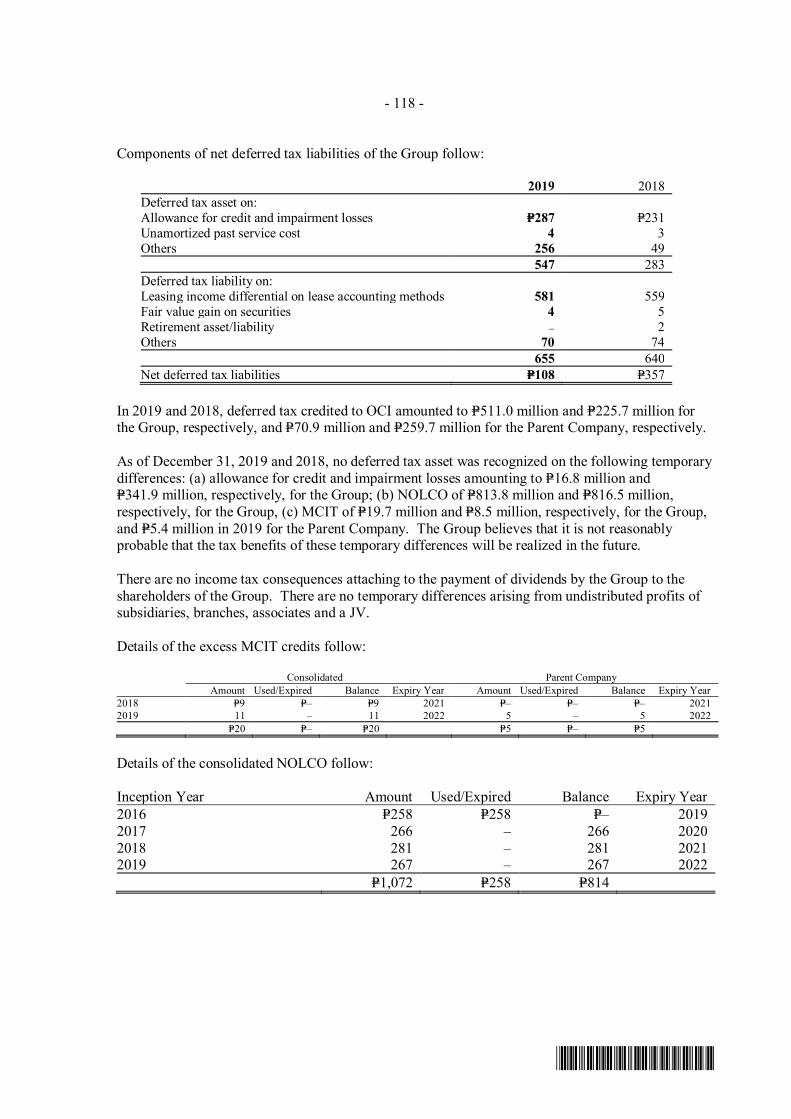
- 118 -
*SGVFS038804*
Components of net deferred tax liabilities of the Group follow:
2019 2018Deferred tax asset on:Allowance for credit and impairment losses P=287 P=231Unamortized past service cost 4 3Others 256 49
547 283Deferred tax liability on:Leasing income differential on lease accounting methods 581 559Fair value gain on securities 4 5Retirement asset/liability - 2Others 70 74
655 640Net deferred tax liabilities P=108 P=357
In 2019 and 2018, deferred tax credited to OCI amounted to P=511.0 million and P=225.7 million forthe Group, respectively, and P=70.9 million and P=259.7 million for the Parent Company, respectively.
As of December 31, 2019 and 2018, no deferred tax asset was recognized on the following temporarydifferences: (a) allowance for credit and impairment losses amounting to P=16.8 million andP=341.9 million, respectively, for the Group; (b) NOLCO of P=813.8 million and P=816.5 million,respectively, for the Group, (c) MCIT of P=19.7 million and P=8.5 million, respectively, for the Group,and P=5.4 million in 2019 for the Parent Company. The Group believes that it is not reasonablyprobable that the tax benefits of these temporary differences will be realized in the future.
There are no income tax consequences attaching to the payment of dividends by the Group to theshareholders of the Group. There are no temporary differences arising from undistributed profits ofsubsidiaries, branches, associates and a JV.
Details of the excess MCIT credits follow:
Consolidated Parent CompanyAmount Used/Expired Balance Expiry Year Amount Used/Expired Balance Expiry Year
2018 P=9 P=– P=9 2021 P=– P=– P=– 20212019 11 – 11 2022 5 – 5 2022
P=20 P=– P=20 P=5 P=– P=5
Details of the consolidated NOLCO follow:
Inception Year Amount Used/Expired Balance Expiry Year2016 P=258 P=258 P=– 20192017 266 – 266 20202018 281 – 281 20212019 267 – 267 2022
P=1,072 P=258 P=814
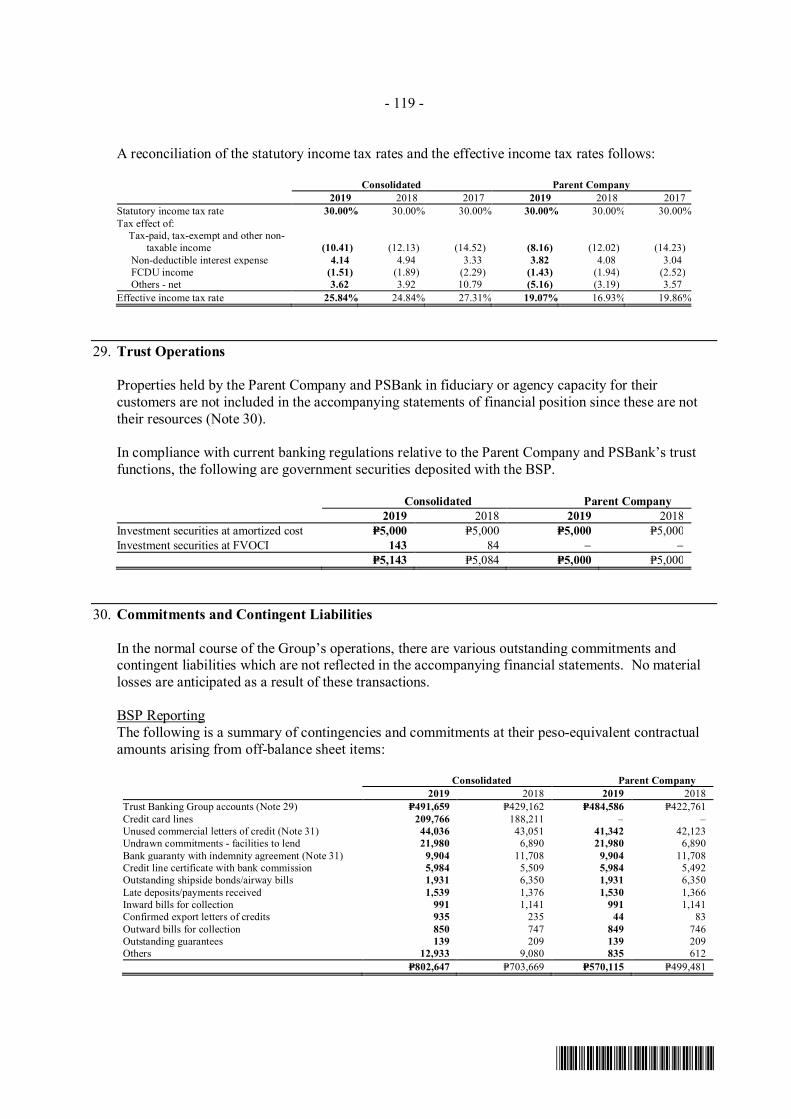
- 119 -
*SGVFS038804*
A reconciliation of the statutory income tax rates and the effective income tax rates follows:
Consolidated Parent Company2019 2018 2017 2019 2018 2017
Statutory income tax rate 30.00% 30.00% 30.00% 30.00% 30.00% 30.00%Tax effect of:
Tax-paid, tax-exempt and other non-taxable income (10.41) (12.13) (14.52) (8.16) (12.02) (14.23)
Non-deductible interest expense 4.14 4.94 3.33 3.82 4.08 3.04FCDU income (1.51) (1.89) (2.29) (1.43) (1.94) (2.52)
Others - net 3.62 3.92 10.79 (5.16) (3.19) 3.57Effective income tax rate 25.84% 24.84% 27.31% 19.07% 16.93% 19.86%
29. Trust Operations
Properties held by the Parent Company and PSBank in fiduciary or agency capacity for theircustomers are not included in the accompanying statements of financial position since these are nottheir resources (Note 30).
In compliance with current banking regulations relative to the Parent Company and PSBank’s trustfunctions, the following are government securities deposited with the BSP.
Consolidated Parent Company2019 2018 2019 2018
Investment securities at amortized cost P=5,000 P=5,000 P=5,000 P=5,000Investment securities at FVOCI 143 84 - -
P=5,143 P=5,084 P=5,000 P=5,000
30. Commitments and Contingent Liabilities
In the normal course of the Group’s operations, there are various outstanding commitments andcontingent liabilities which are not reflected in the accompanying financial statements. No materiallosses are anticipated as a result of these transactions.
BSP ReportingThe following is a summary of contingencies and commitments at their peso-equivalent contractualamounts arising from off-balance sheet items:
Consolidated Parent Company2019 2018 2019 2018
Trust Banking Group accounts (Note 29) P=491,659 P=429,162 P=484,586 P=422,761Credit card lines 209,766 188,211 – –Unused commercial letters of credit (Note 31) 44,036 43,051 41,342 42,123Undrawn commitments - facilities to lend 21,980 6,890 21,980 6,890Bank guaranty with indemnity agreement (Note 31) 9,904 11,708 9,904 11,708Credit line certificate with bank commission 5,984 5,509 5,984 5,492Outstanding shipside bonds/airway bills 1,931 6,350 1,931 6,350Late deposits/payments received 1,539 1,376 1,530 1,366Inward bills for collection 991 1,141 991 1,141Confirmed export letters of credits 935 235 44 83Outward bills for collection 850 747 849 746Outstanding guarantees 139 209 139 209Others 12,933 9,080 835 612
P=802,647 P=703,669 P=570,115 P=499,481
- 120 -
*SGVFS038804*
Upon its own discovery, the Bank immediately caused the arrest of its Corporate ServiceManagement Division Head, Ma. Victoria S. Lopez on July 17, 2017 for qualified theft throughfalsification of commercial documents. Both the Motion to Fix Bail and Motion for Reconsiderationwere denied. On July 24, 2017, another criminal complaint for qualified theft through falsification ofcommercial documents and violation of Section 55 of the General Banking Law (GBL) was filedagainst her and her cohorts for the abstraction of P=900.0 million before the Regional Trial Court(RTC) of Makati City. On December 5, 2017, a third criminal case for the qualified theft throughfalsification of commercial documents and violation of Section 55 of GBL was filed against her, hercohorts and family members relative to the abstraction of P=850.0 million. In addition, foreignproceedings are ongoing on the cases which were filed in the United States of America and inSingapore to preserve and recover their identified properties. Accounts receivable classified under‘Loans and Receivables’ includes total identified claims of P=1.75 billion with provisioning. Relativeto this incident, the Monetary Board (MB) approved the imposition of certain sanctions to the Bank(Note 4) and added that the MB took into consideration the strong financial condition and immediatecorrective actions of the Bank as well as its safety and soundness given the medium to long-terminitiatives that improve governance, controls and compliance. The Bank does not expect this isolatedincident to have long term material impact on its financial statements. Further, the Bank is reinforcingits commitment to the highest standards of integrity and upholds the protection of its customers as itsmain priority.
In June 2019, Ms. Lopez was found guilty of qualified theft and was sentenced accordingly. Twomore convictions followed in September 2019 and October 2019. Ms. Lopez is serving her prisonsentence at the Correctional Institute for Women as her convictions are already final andunappealable. Two counts of qualified theft are still pending with the RTC. In the civil case, the RTCissued judgment ordering Ms. Lopez to restitute the Bank.
Several suits and claims relating to the Group’s lending operations and labor-related cases remainunsettled. In the opinion of management, these suits and claims, if decided adversely, will notinvolve sums having a material effect on the Group’s financial statements.
31. Related Party Transactions
Parties are considered to be related if one party has the ability, directly or indirectly, to control theother party or exercise significant influence over the other party in making financial and operatingdecisions or if they are subjected to common control or common significant influence such assubsidiaries and associates of subsidiaries or other related parties. Related parties may be individualsor corporate entities and are classified as entities with significant influence, subsidiaries, associates,other related parties and key personnel (Notes 2 and 11).
The Group has several business relationships with related parties. Transactions with such parties aremade in the ordinary course of business and on substantially same terms, including interest andcollateral, as those prevailing at the time for comparable transactions with other parties. Thesetransactions also did not involve more than the normal risk of collectibility and did not present otherunfavorable conditions.
The Parent Company has a Related Party Transactions Committee (RPTC) and a Related PartyTransactions Management Committee (RPTMC), both of which are created to assist the BOD inensuring that transactions with related parties are reviewed to assess risks and are subjected toappropriate restrictions to ensure that these are conducted at arm’s-length terms and that corporate orbusiness resources of the Parent Company are not misappropriated or misapplied. After appropriatereview, RPTMC (through RPTC) and RPTC disclose all information and endorses to the BOD with
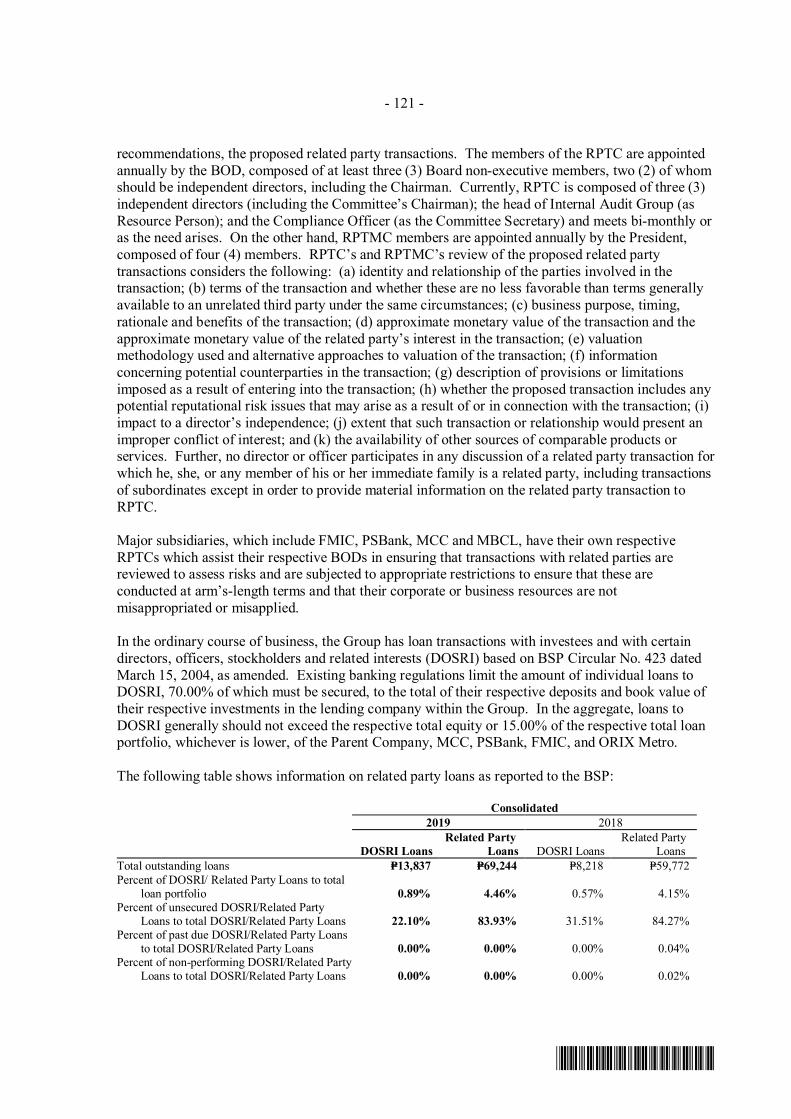
- 121 -
*SGVFS038804*
recommendations, the proposed related party transactions. The members of the RPTC are appointedannually by the BOD, composed of at least three (3) Board non-executive members, two (2) of whomshould be independent directors, including the Chairman. Currently, RPTC is composed of three (3)independent directors (including the Committee’s Chairman); the head of Internal Audit Group (asResource Person); and the Compliance Officer (as the Committee Secretary) and meets bi-monthly oras the need arises. On the other hand, RPTMC members are appointed annually by the President,composed of four (4) members. RPTC’s and RPTMC’s review of the proposed related partytransactions considers the following: (a) identity and relationship of the parties involved in thetransaction; (b) terms of the transaction and whether these are no less favorable than terms generallyavailable to an unrelated third party under the same circumstances; (c) business purpose, timing,rationale and benefits of the transaction; (d) approximate monetary value of the transaction and theapproximate monetary value of the related party’s interest in the transaction; (e) valuationmethodology used and alternative approaches to valuation of the transaction; (f) informationconcerning potential counterparties in the transaction; (g) description of provisions or limitationsimposed as a result of entering into the transaction; (h) whether the proposed transaction includes anypotential reputational risk issues that may arise as a result of or in connection with the transaction; (i)impact to a director’s independence; (j) extent that such transaction or relationship would present animproper conflict of interest; and (k) the availability of other sources of comparable products orservices. Further, no director or officer participates in any discussion of a related party transaction forwhich he, she, or any member of his or her immediate family is a related party, including transactionsof subordinates except in order to provide material information on the related party transaction toRPTC.
Major subsidiaries, which include FMIC, PSBank, MCC and MBCL, have their own respectiveRPTCs which assist their respective BODs in ensuring that transactions with related parties arereviewed to assess risks and are subjected to appropriate restrictions to ensure that these areconducted at arm’s-length terms and that their corporate or business resources are notmisappropriated or misapplied.
In the ordinary course of business, the Group has loan transactions with investees and with certaindirectors, officers, stockholders and related interests (DOSRI) based on BSP Circular No. 423 datedMarch 15, 2004, as amended. Existing banking regulations limit the amount of individual loans toDOSRI, 70.00% of which must be secured, to the total of their respective deposits and book value oftheir respective investments in the lending company within the Group. In the aggregate, loans toDOSRI generally should not exceed the respective total equity or 15.00% of the respective total loanportfolio, whichever is lower, of the Parent Company, MCC, PSBank, FMIC, and ORIX Metro.
The following table shows information on related party loans as reported to the BSP:
Consolidated2019 2018
DOSRI LoansRelated Party
Loans DOSRI LoansRelated Party
LoansTotal outstanding loans P=13,837 P=69,244 P=8,218 P=59,772Percent of DOSRI/ Related Party Loans to total
loan portfolio 0.89% 4.46% 0.57% 4.15%Percent of unsecured DOSRI/Related Party
Loans to total DOSRI/Related Party Loans 22.10% 83.93% 31.51% 84.27%Percent of past due DOSRI/Related Party Loans
to total DOSRI/Related Party Loans 0.00% 0.00% 0.00% 0.04%Percent of non-performing DOSRI/Related Party
Loans to total DOSRI/Related Party Loans 0.00% 0.00% 0.00% 0.02%
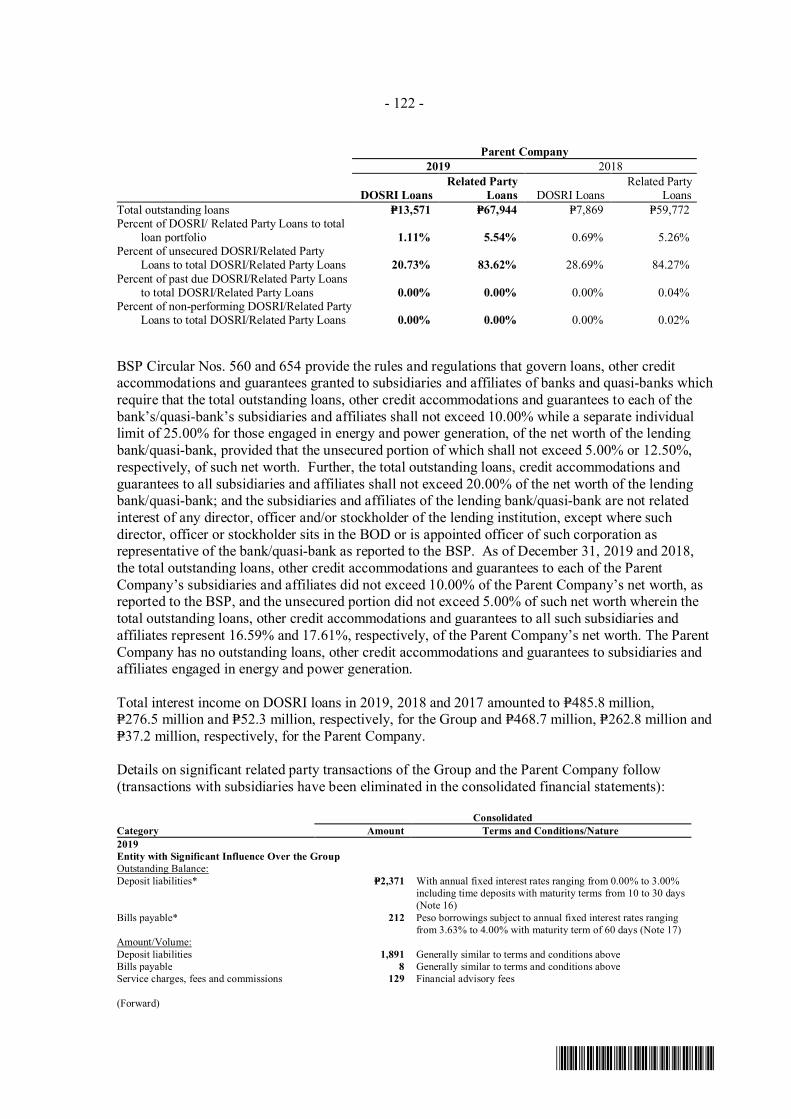
- 122 -
*SGVFS038804*
Parent Company2019 2018
DOSRI LoansRelated Party
Loans DOSRI LoansRelated Party
LoansTotal outstanding loans P=13,571 P=67,944 P=7,869 P=59,772Percent of DOSRI/ Related Party Loans to total
loan portfolio 1.11% 5.54% 0.69% 5.26%Percent of unsecured DOSRI/Related Party
Loans to total DOSRI/Related Party Loans 20.73% 83.62% 28.69% 84.27%Percent of past due DOSRI/Related Party Loans
to total DOSRI/Related Party Loans 0.00% 0.00% 0.00% 0.04%Percent of non-performing DOSRI/Related Party
Loans to total DOSRI/Related Party Loans 0.00% 0.00% 0.00% 0.02%
BSP Circular Nos. 560 and 654 provide the rules and regulations that govern loans, other creditaccommodations and guarantees granted to subsidiaries and affiliates of banks and quasi-banks whichrequire that the total outstanding loans, other credit accommodations and guarantees to each of thebank’s/quasi-bank’s subsidiaries and affiliates shall not exceed 10.00% while a separate individuallimit of 25.00% for those engaged in energy and power generation, of the net worth of the lendingbank/quasi-bank, provided that the unsecured portion of which shall not exceed 5.00% or 12.50%,respectively, of such net worth. Further, the total outstanding loans, credit accommodations andguarantees to all subsidiaries and affiliates shall not exceed 20.00% of the net worth of the lendingbank/quasi-bank; and the subsidiaries and affiliates of the lending bank/quasi-bank are not relatedinterest of any director, officer and/or stockholder of the lending institution, except where suchdirector, officer or stockholder sits in the BOD or is appointed officer of such corporation asrepresentative of the bank/quasi-bank as reported to the BSP. As of December 31, 2019 and 2018,the total outstanding loans, other credit accommodations and guarantees to each of the ParentCompany’s subsidiaries and affiliates did not exceed 10.00% of the Parent Company’s net worth, asreported to the BSP, and the unsecured portion did not exceed 5.00% of such net worth wherein thetotal outstanding loans, other credit accommodations and guarantees to all such subsidiaries andaffiliates represent 16.59% and 17.61%, respectively, of the Parent Company’s net worth. The ParentCompany has no outstanding loans, other credit accommodations and guarantees to subsidiaries andaffiliates engaged in energy and power generation.
Total interest income on DOSRI loans in 2019, 2018 and 2017 amounted to P=485.8 million,P=276.5 million and P=52.3 million, respectively, for the Group and P=468.7 million, P=262.8 million andP=37.2 million, respectively, for the Parent Company.
Details on significant related party transactions of the Group and the Parent Company follow(transactions with subsidiaries have been eliminated in the consolidated financial statements):
ConsolidatedCategory Amount Terms and Conditions/Nature2019Entity with Significant Influence Over the GroupOutstanding Balance:Deposit liabilities* P=2,371 With annual fixed interest rates ranging from 0.00% to 3.00%
including time deposits with maturity terms from 10 to 30 days(Note 16)
Bills payable* 212 Peso borrowings subject to annual fixed interest rates rangingfrom 3.63% to 4.00% with maturity term of 60 days (Note 17)
Amount/Volume:Deposit liabilities 1,891 Generally similar to terms and conditions aboveBills payable 8 Generally similar to terms and conditions aboveService charges, fees and commissions 129 Financial advisory fees
(Forward)
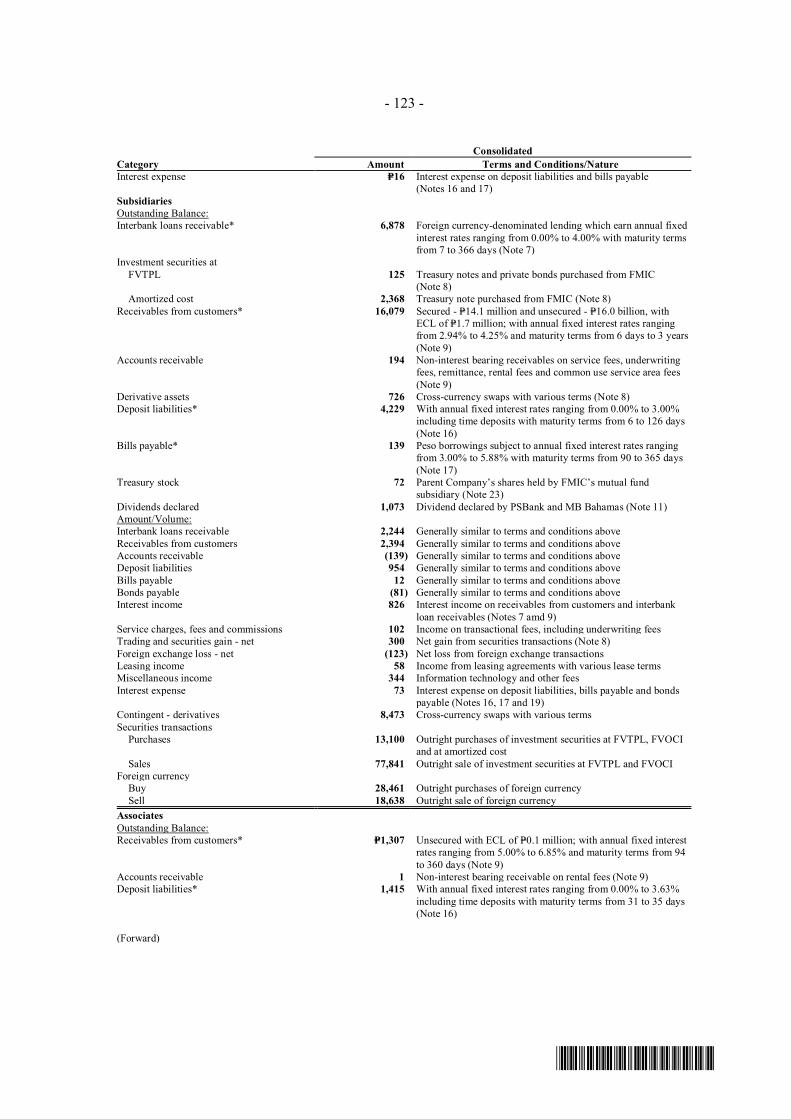
- 123 -
*SGVFS038804*
ConsolidatedCategory Amount Terms and Conditions/NatureInterest expense P=16 Interest expense on deposit liabilities and bills payable
(Notes 16 and 17)SubsidiariesOutstanding Balance:Interbank loans receivable* 6,878 Foreign currency-denominated lending which earn annual fixed
interest rates ranging from 0.00% to 4.00% with maturity termsfrom 7 to 366 days (Note 7)
Investment securities at FVTPL 125 Treasury notes and private bonds purchased from FMIC
(Note 8) Amortized cost 2,368 Treasury note purchased from FMIC (Note 8)Receivables from customers* 16,079 Secured - P=14.1 million and unsecured - P=16.0 billion, with
ECL of P=1.7 million; with annual fixed interest rates rangingfrom 2.94% to 4.25% and maturity terms from 6 days to 3 years(Note 9)
Accounts receivable 194 Non-interest bearing receivables on service fees, underwritingfees, remittance, rental fees and common use service area fees(Note 9)
Derivative assets 726 Cross-currency swaps with various terms (Note 8)Deposit liabilities* 4,229 With annual fixed interest rates ranging from 0.00% to 3.00%
including time deposits with maturity terms from 6 to 126 days(Note 16)
Bills payable* 139 Peso borrowings subject to annual fixed interest rates rangingfrom 3.00% to 5.88% with maturity terms from 90 to 365 days(Note 17)
Treasury stock 72 Parent Company’s shares held by FMIC’s mutual fundsubsidiary (Note 23)
Dividends declared 1,073 Dividend declared by PSBank and MB Bahamas (Note 11)Amount/Volume:Interbank loans receivable 2,244 Generally similar to terms and conditions aboveReceivables from customers 2,394 Generally similar to terms and conditions aboveAccounts receivable (139) Generally similar to terms and conditions aboveDeposit liabilities 954 Generally similar to terms and conditions aboveBills payable 12 Generally similar to terms and conditions aboveBonds payable (81) Generally similar to terms and conditions aboveInterest income 826 Interest income on receivables from customers and interbank
loan receivables (Notes 7 amd 9)Service charges, fees and commissions 102 Income on transactional fees, including underwriting feesTrading and securities gain - net 300 Net gain from securities transactions (Note 8)Foreign exchange loss - net (123) Net loss from foreign exchange transactionsLeasing income 58 Income from leasing agreements with various lease termsMiscellaneous income 344 Information technology and other feesInterest expense 73 Interest expense on deposit liabilities, bills payable and bonds
payable (Notes 16, 17 and 19)Contingent - derivatives 8,473 Cross-currency swaps with various termsSecurities transactions Purchases 13,100 Outright purchases of investment securities at FVTPL, FVOCI
and at amortized costSales 77,841 Outright sale of investment securities at FVTPL and FVOCI
Foreign currency Buy 28,461 Outright purchases of foreign currency
Sell 18,638 Outright sale of foreign currencyAssociatesOutstanding Balance:Receivables from customers* P=1,307 Unsecured with ECL of P=0.1 million; with annual fixed interest
rates ranging from 5.00% to 6.85% and maturity terms from 94to 360 days (Note 9)
Accounts receivable 1 Non-interest bearing receivable on rental fees (Note 9)Deposit liabilities* 1,415 With annual fixed interest rates ranging from 0.00% to 3.63%
including time deposits with maturity terms from 31 to 35 days(Note 16)
(Forward)
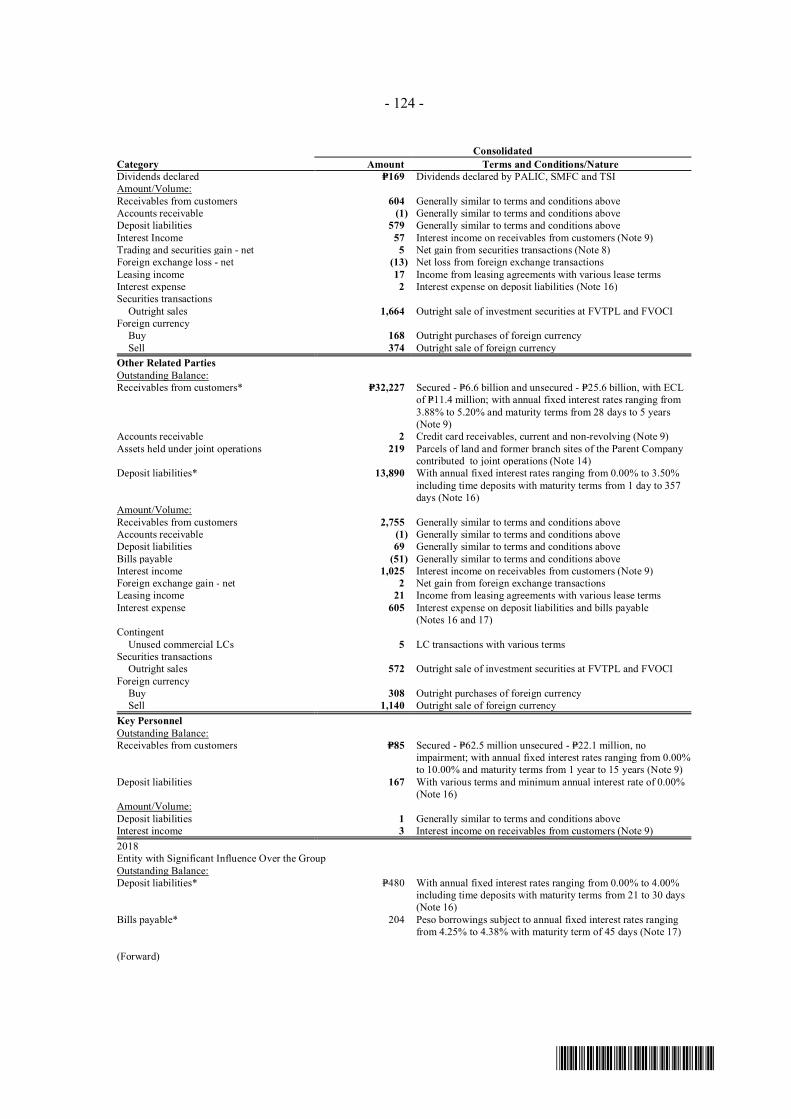
- 124 -
*SGVFS038804*
ConsolidatedCategory Amount Terms and Conditions/NatureDividends declared P=169 Dividends declared by PALIC, SMFC and TSIAmount/Volume:Receivables from customers 604 Generally similar to terms and conditions aboveAccounts receivable (1) Generally similar to terms and conditions aboveDeposit liabilities 579 Generally similar to terms and conditions aboveInterest Income 57 Interest income on receivables from customers (Note 9)Trading and securities gain - net 5 Net gain from securities transactions (Note 8)Foreign exchange loss - net (13) Net loss from foreign exchange transactionsLeasing income 17 Income from leasing agreements with various lease termsInterest expense 2 Interest expense on deposit liabilities (Note 16)Securities transactions
Outright sales 1,664 Outright sale of investment securities at FVTPL and FVOCIForeign currency Buy 168 Outright purchases of foreign currency
Sell 374 Outright sale of foreign currencyOther Related PartiesOutstanding Balance:Receivables from customers* P=32,227 Secured - P=6.6 billion and unsecured - P=25.6 billion, with ECL
of P=11.4 million; with annual fixed interest rates ranging from3.88% to 5.20% and maturity terms from 28 days to 5 years(Note 9)
Accounts receivable 2 Credit card receivables, current and non-revolving (Note 9)Assets held under joint operations 219 Parcels of land and former branch sites of the Parent Company
contributed to joint operations (Note 14)Deposit liabilities* 13,890 With annual fixed interest rates ranging from 0.00% to 3.50%
including time deposits with maturity terms from 1 day to 357days (Note 16)
Amount/Volume:Receivables from customers 2,755 Generally similar to terms and conditions aboveAccounts receivable (1) Generally similar to terms and conditions aboveDeposit liabilities 69 Generally similar to terms and conditions aboveBills payable (51) Generally similar to terms and conditions aboveInterest income 1,025 Interest income on receivables from customers (Note 9)Foreign exchange gain - net 2 Net gain from foreign exchange transactionsLeasing income 21 Income from leasing agreements with various lease termsInterest expense 605 Interest expense on deposit liabilities and bills payable
(Notes 16 and 17)Contingent
Unused commercial LCs 5 LC transactions with various termsSecurities transactions
Outright sales 572 Outright sale of investment securities at FVTPL and FVOCIForeign currency
Buy 308 Outright purchases of foreign currency Sell 1,140 Outright sale of foreign currencyKey PersonnelOutstanding Balance:Receivables from customers P=85 Secured - P=62.5 million unsecured - P=22.1 million, no
impairment; with annual fixed interest rates ranging from 0.00%to 10.00% and maturity terms from 1 year to 15 years (Note 9)
Deposit liabilities 167 With various terms and minimum annual interest rate of 0.00%(Note 16)
Amount/Volume:Deposit liabilities 1 Generally similar to terms and conditions aboveInterest income 3 Interest income on receivables from customers (Note 9)2018Entity with Significant Influence Over the GroupOutstanding Balance:Deposit liabilities* P=480 With annual fixed interest rates ranging from 0.00% to 4.00%
including time deposits with maturity terms from 21 to 30 days(Note 16)
Bills payable*
(Forward)
204 Peso borrowings subject to annual fixed interest rates rangingfrom 4.25% to 4.38% with maturity term of 45 days (Note 17)
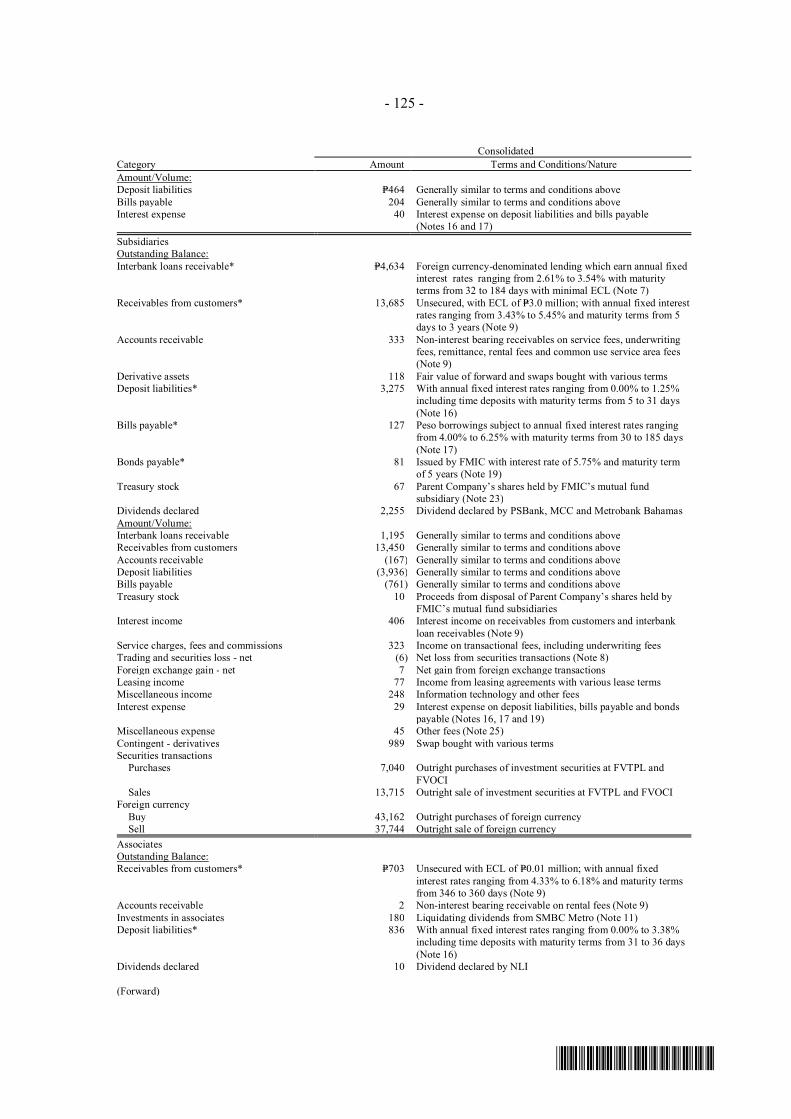
- 125 -
*SGVFS038804*
ConsolidatedCategory Amount Terms and Conditions/NatureAmount/Volume:Deposit liabilities P=464 Generally similar to terms and conditions aboveBills payable 204 Generally similar to terms and conditions aboveInterest expense 40 Interest expense on deposit liabilities and bills payable
(Notes 16 and 17)SubsidiariesOutstanding Balance:Interbank loans receivable* P=4,634 Foreign currency-denominated lending which earn annual fixed
interest rates ranging from 2.61% to 3.54% with maturityterms from 32 to 184 days with minimal ECL (Note 7)
Receivables from customers* 13,685 Unsecured, with ECL of P=3.0 million; with annual fixed interestrates ranging from 3.43% to 5.45% and maturity terms from 5days to 3 years (Note 9)
Accounts receivable 333 Non-interest bearing receivables on service fees, underwritingfees, remittance, rental fees and common use service area fees(Note 9)
Derivative assets 118 Fair value of forward and swaps bought with various termsDeposit liabilities* 3,275 With annual fixed interest rates ranging from 0.00% to 1.25%
including time deposits with maturity terms from 5 to 31 days(Note 16)
Bills payable* 127 Peso borrowings subject to annual fixed interest rates rangingfrom 4.00% to 6.25% with maturity terms from 30 to 185 days(Note 17)
Bonds payable* 81 Issued by FMIC with interest rate of 5.75% and maturity termof 5 years (Note 19)
Treasury stock 67 Parent Company’s shares held by FMIC’s mutual fundsubsidiary (Note 23)
Dividends declared 2,255 Dividend declared by PSBank, MCC and Metrobank BahamasAmount/Volume:Interbank loans receivable 1,195 Generally similar to terms and conditions aboveReceivables from customers 13,450 Generally similar to terms and conditions aboveAccounts receivable (167) Generally similar to terms and conditions aboveDeposit liabilities (3,936) Generally similar to terms and conditions aboveBills payable (761) Generally similar to terms and conditions aboveTreasury stock 10 Proceeds from disposal of Parent Company’s shares held by
FMIC’s mutual fund subsidiariesInterest income 406 Interest income on receivables from customers and interbank
loan receivables (Note 9)Service charges, fees and commissions 323 Income on transactional fees, including underwriting feesTrading and securities loss - net (6) Net loss from securities transactions (Note 8)Foreign exchange gain - net 7 Net gain from foreign exchange transactionsLeasing income 77 Income from leasing agreements with various lease termsMiscellaneous income 248 Information technology and other feesInterest expense 29 Interest expense on deposit liabilities, bills payable and bonds
payable (Notes 16, 17 and 19)Miscellaneous expense 45 Other fees (Note 25)Contingent - derivatives 989 Swap bought with various termsSecurities transactions Purchases 7,040 Outright purchases of investment securities at FVTPL and
FVOCISales 13,715 Outright sale of investment securities at FVTPL and FVOCI
Foreign currencyBuy 43,162 Outright purchases of foreign currencySell 37,744 Outright sale of foreign currency
AssociatesOutstanding Balance:Receivables from customers* P=703 Unsecured with ECL of P=0.01 million; with annual fixed
interest rates ranging from 4.33% to 6.18% and maturity termsfrom 346 to 360 days (Note 9)
Accounts receivable 2 Non-interest bearing receivable on rental fees (Note 9)Investments in associates 180 Liquidating dividends from SMBC Metro (Note 11)Deposit liabilities* 836 With annual fixed interest rates ranging from 0.00% to 3.38%
including time deposits with maturity terms from 31 to 36 days(Note 16)
Dividends declared
(Forward)
10 Dividend declared by NLI
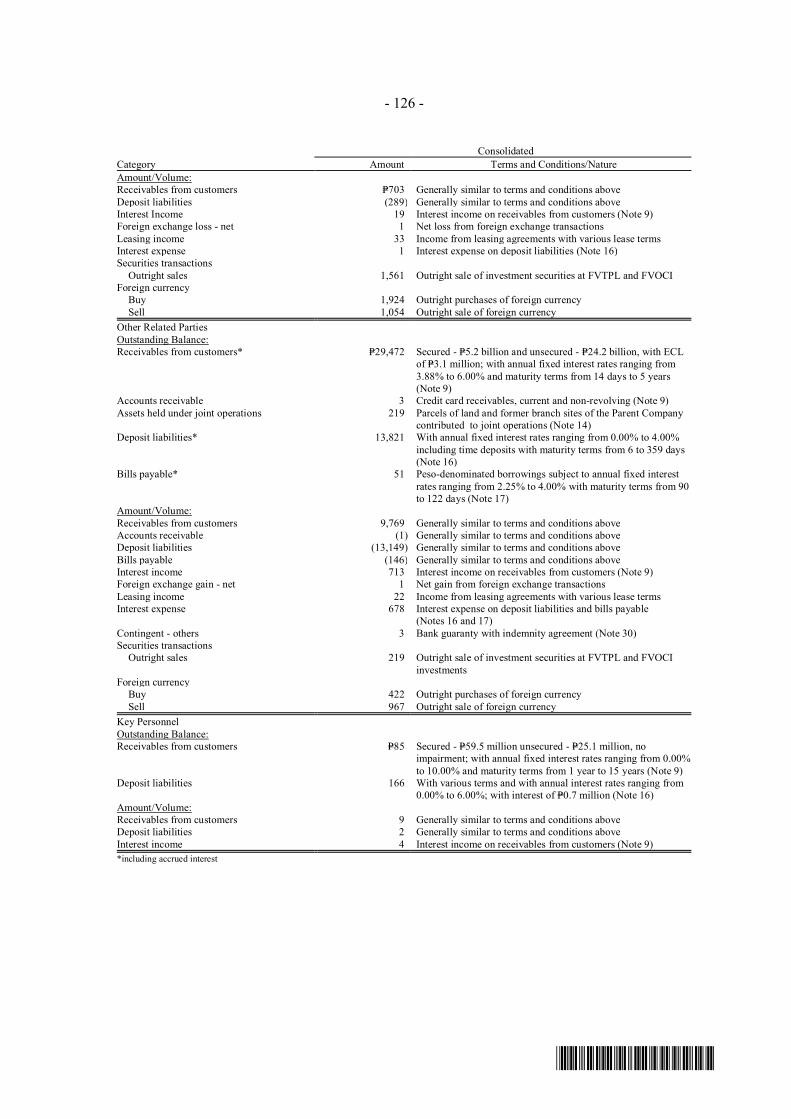
- 126 -
*SGVFS038804*
ConsolidatedCategory Amount Terms and Conditions/NatureAmount/Volume:Receivables from customers P=703 Generally similar to terms and conditions aboveDeposit liabilities (289) Generally similar to terms and conditions aboveInterest Income 19 Interest income on receivables from customers (Note 9)Foreign exchange loss - net 1 Net loss from foreign exchange transactionsLeasing income 33 Income from leasing agreements with various lease termsInterest expense 1 Interest expense on deposit liabilities (Note 16)Securities transactions
Outright sales 1,561 Outright sale of investment securities at FVTPL and FVOCIForeign currency Buy 1,924 Outright purchases of foreign currency
Sell 1,054 Outright sale of foreign currencyOther Related PartiesOutstanding Balance:Receivables from customers* P=29,472 Secured - P=5.2 billion and unsecured - P=24.2 billion, with ECL
of P=3.1 million; with annual fixed interest rates ranging from3.88% to 6.00% and maturity terms from 14 days to 5 years(Note 9)
Accounts receivable 3 Credit card receivables, current and non-revolving (Note 9)Assets held under joint operations 219 Parcels of land and former branch sites of the Parent Company
contributed to joint operations (Note 14)Deposit liabilities* 13,821 With annual fixed interest rates ranging from 0.00% to 4.00%
including time deposits with maturity terms from 6 to 359 days(Note 16)
Bills payable* 51 Peso-denominated borrowings subject to annual fixed interestrates ranging from 2.25% to 4.00% with maturity terms from 90to 122 days (Note 17)
Amount/Volume:Receivables from customers 9,769 Generally similar to terms and conditions aboveAccounts receivable (1) Generally similar to terms and conditions aboveDeposit liabilities (13,149) Generally similar to terms and conditions aboveBills payable (146) Generally similar to terms and conditions aboveInterest income 713 Interest income on receivables from customers (Note 9)Foreign exchange gain - net 1 Net gain from foreign exchange transactionsLeasing income 22 Income from leasing agreements with various lease termsInterest expense 678 Interest expense on deposit liabilities and bills payable
(Notes 16 and 17)Contingent - others 3 Bank guaranty with indemnity agreement (Note 30)Securities transactions
Outright sales 219 Outright sale of investment securities at FVTPL and FVOCIinvestments
Foreign currency Buy 422 Outright purchases of foreign currency
Sell 967 Outright sale of foreign currencyKey PersonnelOutstanding Balance:Receivables from customers P=85 Secured - P=59.5 million unsecured - P=25.1 million, no
impairment; with annual fixed interest rates ranging from 0.00%to 10.00% and maturity terms from 1 year to 15 years (Note 9)
Deposit liabilities 166 With various terms and with annual interest rates ranging from0.00% to 6.00%; with interest of P=0.7 million (Note 16)
Amount/Volume:Receivables from customers 9 Generally similar to terms and conditions aboveDeposit liabilities 2 Generally similar to terms and conditions aboveInterest income 4 Interest income on receivables from customers (Note 9)*including accrued interest
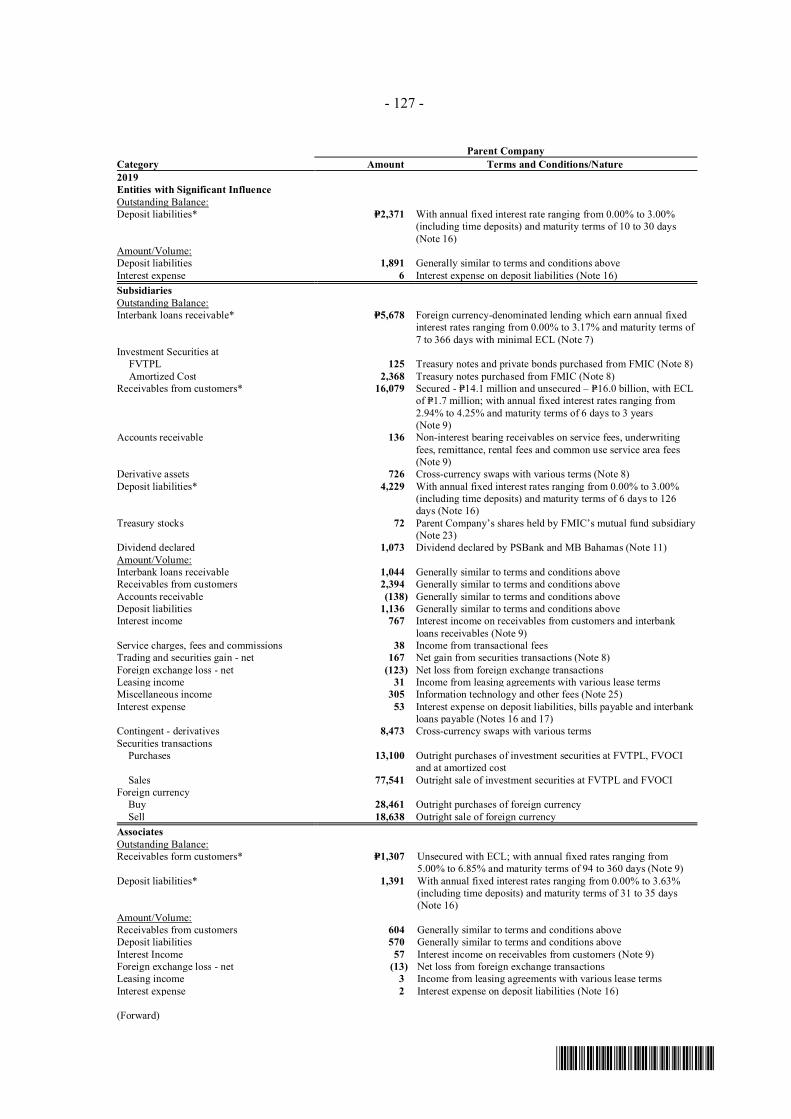
- 127 -
*SGVFS038804*
Parent CompanyCategory Amount Terms and Conditions/Nature2019Entities with Significant InfluenceOutstanding Balance:Deposit liabilities* P=2,371 With annual fixed interest rate ranging from 0.00% to 3.00%
(including time deposits) and maturity terms of 10 to 30 days(Note 16)
Amount/Volume:Deposit liabilities 1,891 Generally similar to terms and conditions aboveInterest expense 6 Interest expense on deposit liabilities (Note 16)SubsidiariesOutstanding Balance:Interbank loans receivable* P=5,678 Foreign currency-denominated lending which earn annual fixed
interest rates ranging from 0.00% to 3.17% and maturity terms of7 to 366 days with minimal ECL (Note 7)
Investment Securities atFVTPL 125 Treasury notes and private bonds purchased from FMIC (Note 8)Amortized Cost 2,368 Treasury notes purchased from FMIC (Note 8)
Receivables from customers* 16,079 Secured - P=14.1 million and unsecured – P=16.0 billion, with ECLof P=1.7 million; with annual fixed interest rates ranging from2.94% to 4.25% and maturity terms of 6 days to 3 years(Note 9)
Accounts receivable 136 Non-interest bearing receivables on service fees, underwritingfees, remittance, rental fees and common use service area fees(Note 9)
Derivative assets 726 Cross-currency swaps with various terms (Note 8)Deposit liabilities* 4,229 With annual fixed interest rates ranging from 0.00% to 3.00%
(including time deposits) and maturity terms of 6 days to 126days (Note 16)
Treasury stocks 72 Parent Company’s shares held by FMIC’s mutual fund subsidiary(Note 23)
Dividend declared 1,073 Dividend declared by PSBank and MB Bahamas (Note 11)Amount/Volume:Interbank loans receivable 1,044 Generally similar to terms and conditions aboveReceivables from customers 2,394 Generally similar to terms and conditions aboveAccounts receivable (138) Generally similar to terms and conditions aboveDeposit liabilities 1,136 Generally similar to terms and conditions aboveInterest income 767 Interest income on receivables from customers and interbank
loans receivables (Note 9)Service charges, fees and commissions 38 Income from transactional feesTrading and securities gain - net 167 Net gain from securities transactions (Note 8)Foreign exchange loss - net (123) Net loss from foreign exchange transactionsLeasing income 31 Income from leasing agreements with various lease termsMiscellaneous income 305 Information technology and other fees (Note 25)Interest expense 53 Interest expense on deposit liabilities, bills payable and interbank
loans payable (Notes 16 and 17)Contingent - derivatives 8,473 Cross-currency swaps with various termsSecurities transactions Purchases 13,100 Outright purchases of investment securities at FVTPL, FVOCI
and at amortized costSales 77,541 Outright sale of investment securities at FVTPL and FVOCI
Foreign currency Buy 28,461 Outright purchases of foreign currency
Sell 18,638 Outright sale of foreign currencyAssociatesOutstanding Balance:Receivables form customers* P=1,307 Unsecured with ECL; with annual fixed rates ranging from
5.00% to 6.85% and maturity terms of 94 to 360 days (Note 9)Deposit liabilities* 1,391 With annual fixed interest rates ranging from 0.00% to 3.63%
(including time deposits) and maturity terms of 31 to 35 days(Note 16)
Amount/Volume:Receivables from customers 604 Generally similar to terms and conditions aboveDeposit liabilities 570 Generally similar to terms and conditions aboveInterest Income 57 Interest income on receivables from customers (Note 9)Foreign exchange loss - net (13) Net loss from foreign exchange transactionsLeasing income 3 Income from leasing agreements with various lease termsInterest expense 2 Interest expense on deposit liabilities (Note 16)
(Forward)
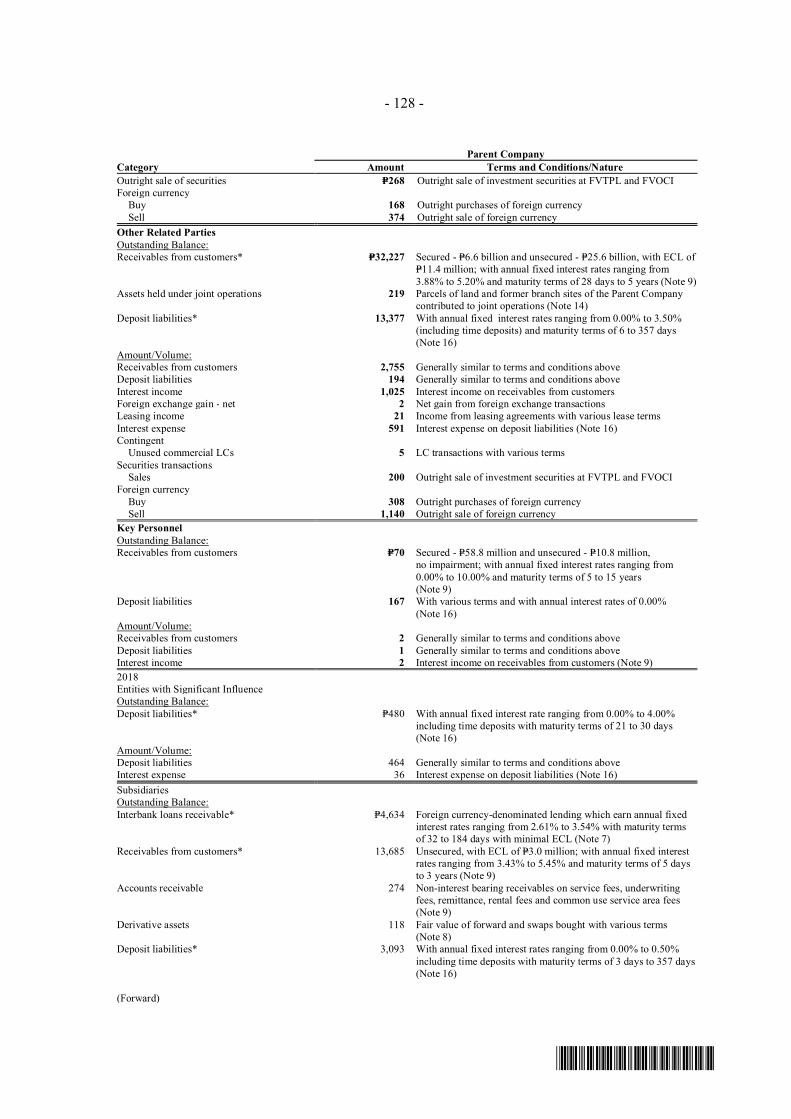
- 128 -
*SGVFS038804*
Parent CompanyCategory Amount Terms and Conditions/NatureOutright sale of securities P=268 Outright sale of investment securities at FVTPL and FVOCIForeign currency Buy 168 Outright purchases of foreign currency
Sell 374 Outright sale of foreign currencyOther Related PartiesOutstanding Balance:Receivables from customers* P=32,227 Secured - P=6.6 billion and unsecured - P=25.6 billion, with ECL of
P=11.4 million; with annual fixed interest rates ranging from3.88% to 5.20% and maturity terms of 28 days to 5 years (Note 9)
Assets held under joint operations 219 Parcels of land and former branch sites of the Parent Companycontributed to joint operations (Note 14)
Deposit liabilities* 13,377 With annual fixed interest rates ranging from 0.00% to 3.50%(including time deposits) and maturity terms of 6 to 357 days(Note 16)
Amount/Volume:Receivables from customers 2,755 Generally similar to terms and conditions aboveDeposit liabilities 194 Generally similar to terms and conditions aboveInterest income 1,025 Interest income on receivables from customersForeign exchange gain - net 2 Net gain from foreign exchange transactionsLeasing income 21 Income from leasing agreements with various lease termsInterest expense 591 Interest expense on deposit liabilities (Note 16)Contingent Unused commercial LCs 5 LC transactions with various termsSecurities transactions
Sales 200 Outright sale of investment securities at FVTPL and FVOCIForeign currency
Buy 308 Outright purchases of foreign currencySell 1,140 Outright sale of foreign currency
Key PersonnelOutstanding Balance:Receivables from customers P=70 Secured - P=58.8 million and unsecured - P=10.8 million,
no impairment; with annual fixed interest rates ranging from0.00% to 10.00% and maturity terms of 5 to 15 years(Note 9)
Deposit liabilities 167 With various terms and with annual interest rates of 0.00%(Note 16)
Amount/Volume:Receivables from customers 2 Generally similar to terms and conditions aboveDeposit liabilities 1 Generally similar to terms and conditions aboveInterest income 2 Interest income on receivables from customers (Note 9)2018Entities with Significant InfluenceOutstanding Balance:Deposit liabilities* P=480 With annual fixed interest rate ranging from 0.00% to 4.00%
including time deposits with maturity terms of 21 to 30 days(Note 16)
Amount/Volume:Deposit liabilities 464 Generally similar to terms and conditions aboveInterest expense 36 Interest expense on deposit liabilities (Note 16)SubsidiariesOutstanding Balance:Interbank loans receivable* P=4,634 Foreign currency-denominated lending which earn annual fixed
interest rates ranging from 2.61% to 3.54% with maturity termsof 32 to 184 days with minimal ECL (Note 7)
Receivables from customers* 13,685 Unsecured, with ECL of P=3.0 million; with annual fixed interestrates ranging from 3.43% to 5.45% and maturity terms of 5 daysto 3 years (Note 9)
Accounts receivable 274 Non-interest bearing receivables on service fees, underwritingfees, remittance, rental fees and common use service area fees(Note 9)
Derivative assets 118 Fair value of forward and swaps bought with various terms(Note 8)
Deposit liabilities* 3,093 With annual fixed interest rates ranging from 0.00% to 0.50%including time deposits with maturity terms of 3 days to 357 days(Note 16)
(Forward)
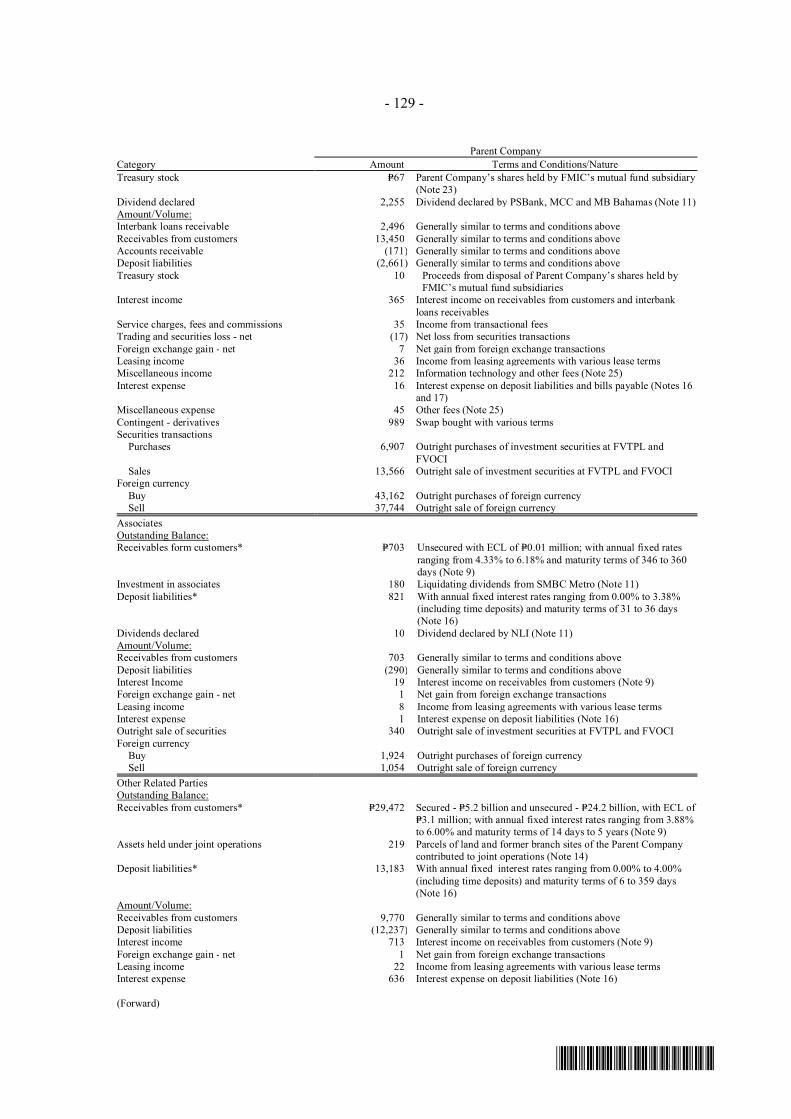
- 129 -
*SGVFS038804*
Parent CompanyCategory Amount Terms and Conditions/NatureTreasury stock P=67 Parent Company’s shares held by FMIC’s mutual fund subsidiary
(Note 23)Dividend declared 2,255 Dividend declared by PSBank, MCC and MB Bahamas (Note 11)Amount/Volume:Interbank loans receivable 2,496 Generally similar to terms and conditions aboveReceivables from customers 13,450 Generally similar to terms and conditions aboveAccounts receivable (171) Generally similar to terms and conditions aboveDeposit liabilities (2,661) Generally similar to terms and conditions aboveTreasury stock 10 Proceeds from disposal of Parent Company’s shares held by
FMIC’s mutual fund subsidiariesInterest income 365 Interest income on receivables from customers and interbank
loans receivablesService charges, fees and commissions 35 Income from transactional feesTrading and securities loss - net (17) Net loss from securities transactionsForeign exchange gain - net 7 Net gain from foreign exchange transactionsLeasing income 36 Income from leasing agreements with various lease termsMiscellaneous income 212 Information technology and other fees (Note 25)Interest expense 16 Interest expense on deposit liabilities and bills payable (Notes 16
and 17)Miscellaneous expense 45 Other fees (Note 25)Contingent - derivatives 989 Swap bought with various termsSecurities transactions Purchases 6,907 Outright purchases of investment securities at FVTPL and
FVOCISales 13,566 Outright sale of investment securities at FVTPL and FVOCI
Foreign currencyBuy 43,162 Outright purchases of foreign currencySell 37,744 Outright sale of foreign currency
AssociatesOutstanding Balance:Receivables form customers* P=703 Unsecured with ECL of P=0.01 million; with annual fixed rates
ranging from 4.33% to 6.18% and maturity terms of 346 to 360days (Note 9)
Investment in associates 180 Liquidating dividends from SMBC Metro (Note 11)Deposit liabilities* 821 With annual fixed interest rates ranging from 0.00% to 3.38%
(including time deposits) and maturity terms of 31 to 36 days(Note 16)
Dividends declared 10 Dividend declared by NLI (Note 11)Amount/Volume:Receivables from customers 703 Generally similar to terms and conditions aboveDeposit liabilities (290) Generally similar to terms and conditions aboveInterest Income 19 Interest income on receivables from customers (Note 9)Foreign exchange gain - net 1 Net gain from foreign exchange transactionsLeasing income 8 Income from leasing agreements with various lease termsInterest expense 1 Interest expense on deposit liabilities (Note 16)Outright sale of securities 340 Outright sale of investment securities at FVTPL and FVOCIForeign currency
Buy 1,924 Outright purchases of foreign currencySell 1,054 Outright sale of foreign currency
Other Related PartiesOutstanding Balance:Receivables from customers* P=29,472 Secured - P=5.2 billion and unsecured - P=24.2 billion, with ECL of
P=3.1 million; with annual fixed interest rates ranging from 3.88%to 6.00% and maturity terms of 14 days to 5 years (Note 9)
Assets held under joint operations 219 Parcels of land and former branch sites of the Parent Companycontributed to joint operations (Note 14)
Deposit liabilities* 13,183 With annual fixed interest rates ranging from 0.00% to 4.00%(including time deposits) and maturity terms of 6 to 359 days(Note 16)
Amount/Volume:Receivables from customers 9,770 Generally similar to terms and conditions aboveDeposit liabilities (12,237) Generally similar to terms and conditions aboveInterest income 713 Interest income on receivables from customers (Note 9)Foreign exchange gain - net 1 Net gain from foreign exchange transactionsLeasing income 22 Income from leasing agreements with various lease termsInterest expense 636 Interest expense on deposit liabilities (Note 16)
(Forward)
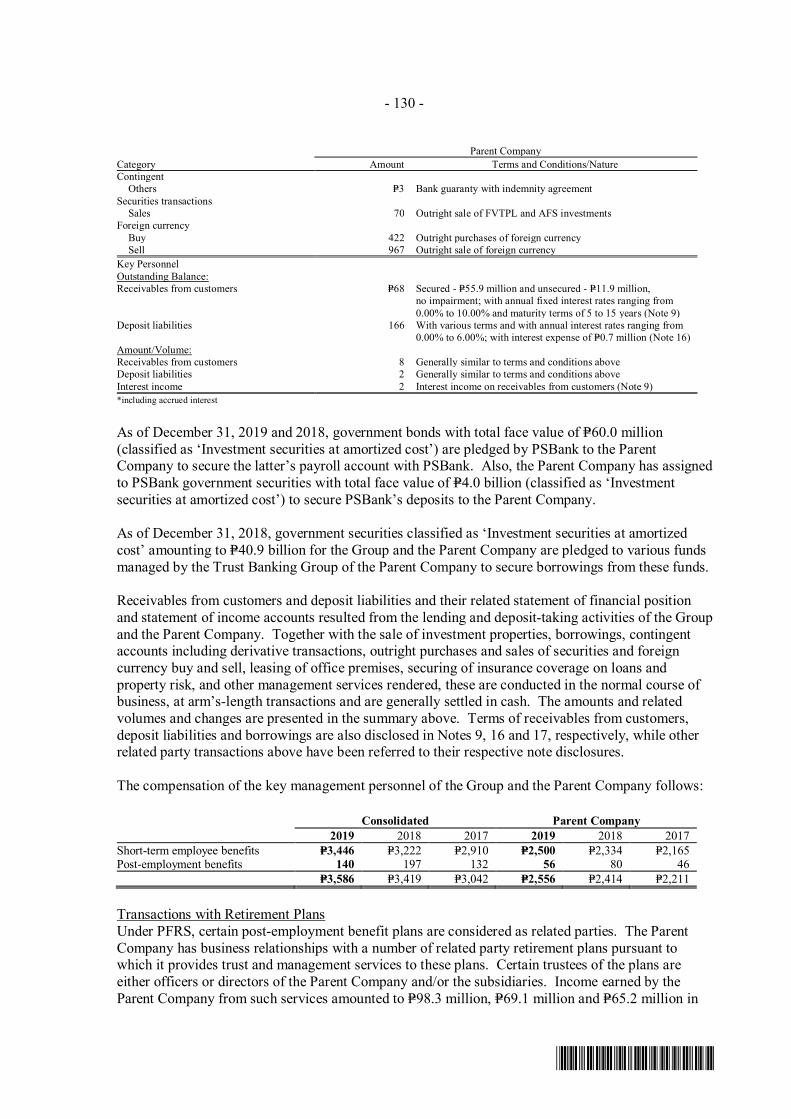
- 130 -
*SGVFS038804*
Parent CompanyCategory Amount Terms and Conditions/NatureContingent Others P=3 Bank guaranty with indemnity agreementSecurities transactions
Sales 70 Outright sale of FVTPL and AFS investmentsForeign currency
Buy 422 Outright purchases of foreign currencySell 967 Outright sale of foreign currency
Key PersonnelOutstanding Balance:Receivables from customers P=68 Secured - P=55.9 million and unsecured - P=11.9 million,
no impairment; with annual fixed interest rates ranging from0.00% to 10.00% and maturity terms of 5 to 15 years (Note 9)
Deposit liabilities 166 With various terms and with annual interest rates ranging from0.00% to 6.00%; with interest expense of P=0.7 million (Note 16)
Amount/Volume:Receivables from customers 8 Generally similar to terms and conditions aboveDeposit liabilities 2 Generally similar to terms and conditions aboveInterest income 2 Interest income on receivables from customers (Note 9)*including accrued interest
As of December 31, 2019 and 2018, government bonds with total face value of P=60.0 million(classified as ‘Investment securities at amortized cost’) are pledged by PSBank to the ParentCompany to secure the latter’s payroll account with PSBank. Also, the Parent Company has assignedto PSBank government securities with total face value of P=4.0 billion (classified as ‘Investmentsecurities at amortized cost’) to secure PSBank’s deposits to the Parent Company.
As of December 31, 2018, government securities classified as ‘Investment securities at amortizedcost’ amounting to P=40.9 billion for the Group and the Parent Company are pledged to various fundsmanaged by the Trust Banking Group of the Parent Company to secure borrowings from these funds.
Receivables from customers and deposit liabilities and their related statement of financial positionand statement of income accounts resulted from the lending and deposit-taking activities of the Groupand the Parent Company. Together with the sale of investment properties, borrowings, contingentaccounts including derivative transactions, outright purchases and sales of securities and foreigncurrency buy and sell, leasing of office premises, securing of insurance coverage on loans andproperty risk, and other management services rendered, these are conducted in the normal course ofbusiness, at arm’s-length transactions and are generally settled in cash. The amounts and relatedvolumes and changes are presented in the summary above. Terms of receivables from customers,deposit liabilities and borrowings are also disclosed in Notes 9, 16 and 17, respectively, while otherrelated party transactions above have been referred to their respective note disclosures.
The compensation of the key management personnel of the Group and the Parent Company follows:
Consolidated Parent Company2019 2018 2017 2019 2018 2017
Short-term employee benefits P=3,446 P=3,222 P=2,910 P=2,500 P=2,334 P=2,165Post-employment benefits 140 197 132 56 80 46
P=3,586 P=3,419 P=3,042 P=2,556 P=2,414 P=2,211
Transactions with Retirement PlansUnder PFRS, certain post-employment benefit plans are considered as related parties. The ParentCompany has business relationships with a number of related party retirement plans pursuant towhich it provides trust and management services to these plans. Certain trustees of the plans areeither officers or directors of the Parent Company and/or the subsidiaries. Income earned by theParent Company from such services amounted to P=98.3 million, P=69.1 million and P=65.2 million in
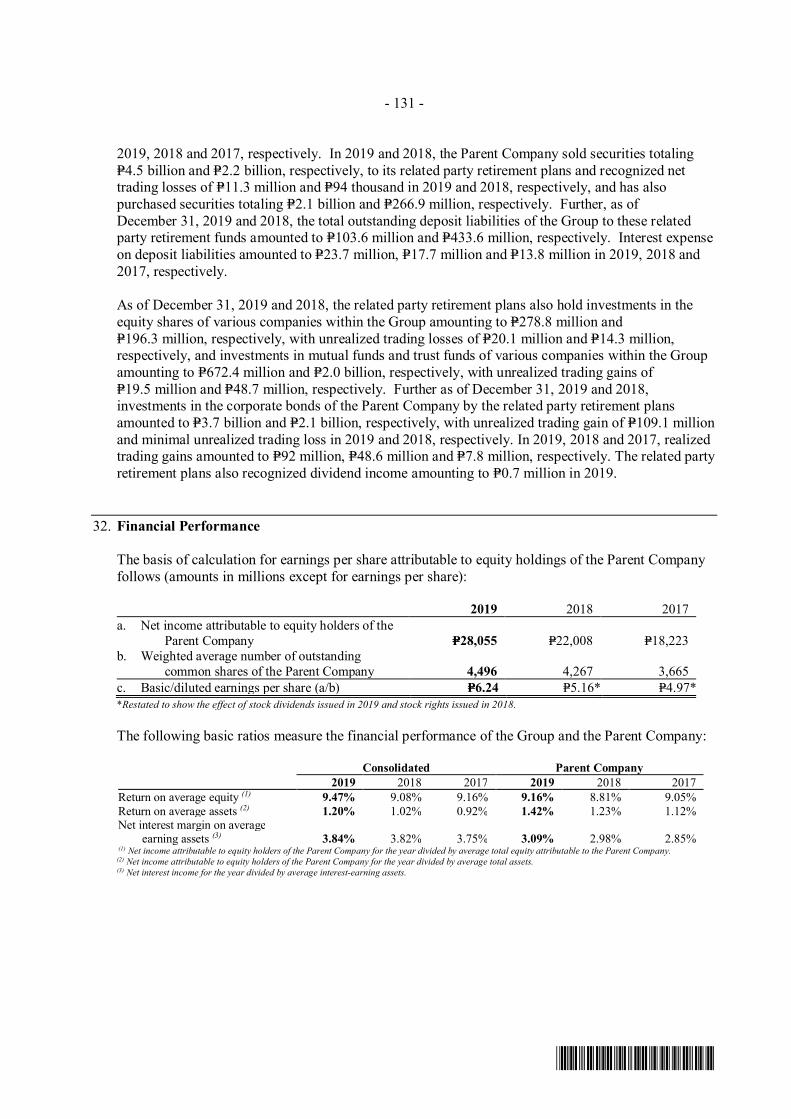
- 131 -
*SGVFS038804*
2019, 2018 and 2017, respectively. In 2019 and 2018, the Parent Company sold securities totalingP=4.5 billion and P=2.2 billion, respectively, to its related party retirement plans and recognized nettrading losses of P=11.3 million and P=94 thousand in 2019 and 2018, respectively, and has alsopurchased securities totaling P=2.1 billion and P=266.9 million, respectively. Further, as ofDecember 31, 2019 and 2018, the total outstanding deposit liabilities of the Group to these relatedparty retirement funds amounted to P=103.6 million and P=433.6 million, respectively. Interest expenseon deposit liabilities amounted to P=23.7 million, P=17.7 million and P=13.8 million in 2019, 2018 and2017, respectively.
As of December 31, 2019 and 2018, the related party retirement plans also hold investments in theequity shares of various companies within the Group amounting to P=278.8 million andP=196.3 million, respectively, with unrealized trading losses of P=20.1 million and P=14.3 million,respectively, and investments in mutual funds and trust funds of various companies within the Groupamounting to P=672.4 million and P=2.0 billion, respectively, with unrealized trading gains ofP=19.5 million and P=48.7 million, respectively. Further as of December 31, 2019 and 2018,investments in the corporate bonds of the Parent Company by the related party retirement plansamounted to P=3.7 billion and P=2.1 billion, respectively, with unrealized trading gain of P=109.1 millionand minimal unrealized trading loss in 2019 and 2018, respectively. In 2019, 2018 and 2017, realizedtrading gains amounted to P=92 million, P=48.6 million and P=7.8 million, respectively. The related partyretirement plans also recognized dividend income amounting to P=0.7 million in 2019.
32. Financial Performance
The basis of calculation for earnings per share attributable to equity holdings of the Parent Companyfollows (amounts in millions except for earnings per share):
2019 2018 2017a. Net income attributable to equity holders of the
Parent Company P=28,055 P=22,008 P=18,223b. Weighted average number of outstanding
common shares of the Parent Company 4,496 4,267 3,665c. Basic/diluted earnings per share (a/b) P=6.24 P=5.16* P=4.97**Restated to show the effect of stock dividends issued in 2019 and stock rights issued in 2018.
The following basic ratios measure the financial performance of the Group and the Parent Company:
Consolidated Parent Company2019 2018 2017 2019 2018 2017
Return on average equity (1) 9.47% 9.08% 9.16% 9.16% 8.81% 9.05%Return on average assets (2) 1.20% 1.02% 0.92% 1.42% 1.23% 1.12%Net interest margin on average
earning assets (3) 3.84% 3.82% 3.75% 3.09% 2.98% 2.85% (1) Net income attributable to equity holders of the Parent Company for the year divided by average total equity attributable to the Parent Company.(2) Net income attributable to equity holders of the Parent Company for the year divided by average total assets.(3) Net interest income for the year divided by average interest-earning assets.
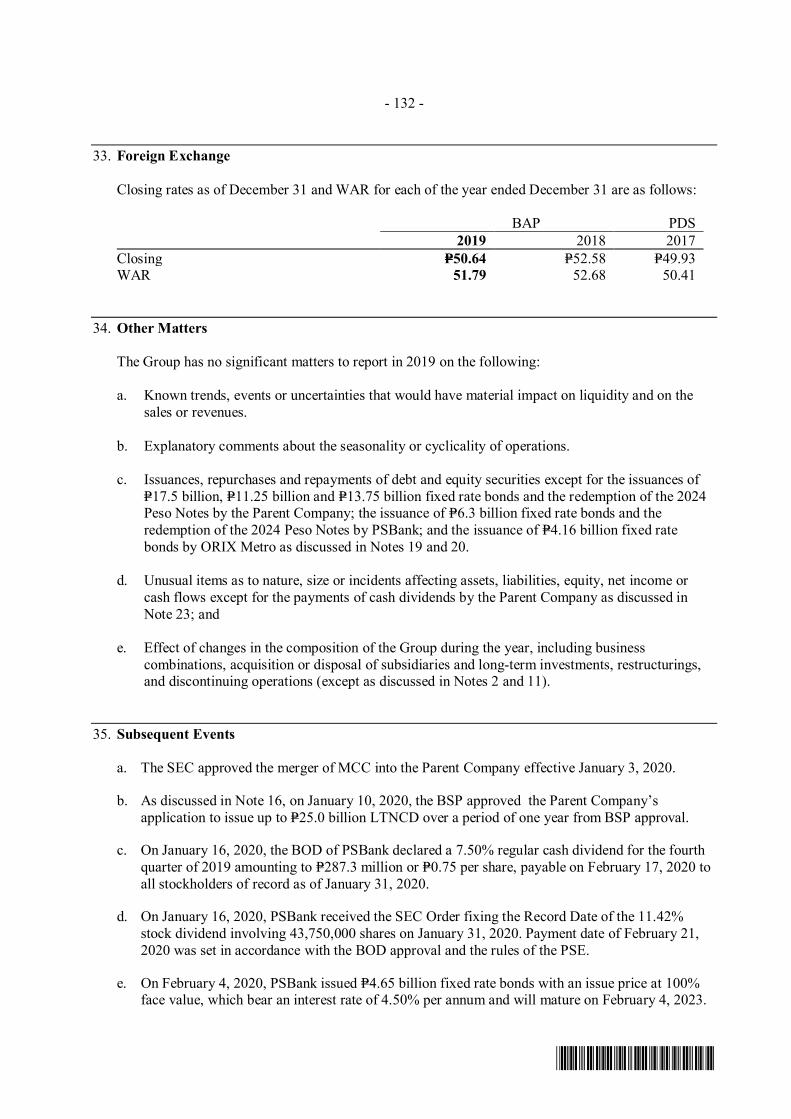
- 132 -
*SGVFS038804*
33. Foreign Exchange
Closing rates as of December 31 and WAR for each of the year ended December 31 are as follows:
BAP PDS2019 2018 2017
Closing P=50.64 P=52.58 P=49.93WAR 51.79 52.68 50.41
34. Other Matters
The Group has no significant matters to report in 2019 on the following:
a. Known trends, events or uncertainties that would have material impact on liquidity and on thesales or revenues.
b. Explanatory comments about the seasonality or cyclicality of operations.
c. Issuances, repurchases and repayments of debt and equity securities except for the issuances ofP=17.5 billion, P=11.25 billion and P=13.75 billion fixed rate bonds and the redemption of the 2024Peso Notes by the Parent Company; the issuance of P=6.3 billion fixed rate bonds and theredemption of the 2024 Peso Notes by PSBank; and the issuance of P=4.16 billion fixed ratebonds by ORIX Metro as discussed in Notes 19 and 20.
d. Unusual items as to nature, size or incidents affecting assets, liabilities, equity, net income orcash flows except for the payments of cash dividends by the Parent Company as discussed inNote 23; and
e. Effect of changes in the composition of the Group during the year, including businesscombinations, acquisition or disposal of subsidiaries and long-term investments, restructurings,and discontinuing operations (except as discussed in Notes 2 and 11).
35. Subsequent Events
a. The SEC approved the merger of MCC into the Parent Company effective January 3, 2020.
b. As discussed in Note 16, on January 10, 2020, the BSP approved the Parent Company’sapplication to issue up to P=25.0 billion LTNCD over a period of one year from BSP approval.
c. On January 16, 2020, the BOD of PSBank declared a 7.50% regular cash dividend for the fourthquarter of 2019 amounting to P=287.3 million or P=0.75 per share, payable on February 17, 2020 toall stockholders of record as of January 31, 2020.
d. On January 16, 2020, PSBank received the SEC Order fixing the Record Date of the 11.42%stock dividend involving 43,750,000 shares on January 31, 2020. Payment date of February 21,2020 was set in accordance with the BOD approval and the rules of the PSE.
e. On February 4, 2020, PSBank issued P=4.65 billion fixed rate bonds with an issue price at 100%face value, which bear an interest rate of 4.50% per annum and will mature on February 4, 2023.
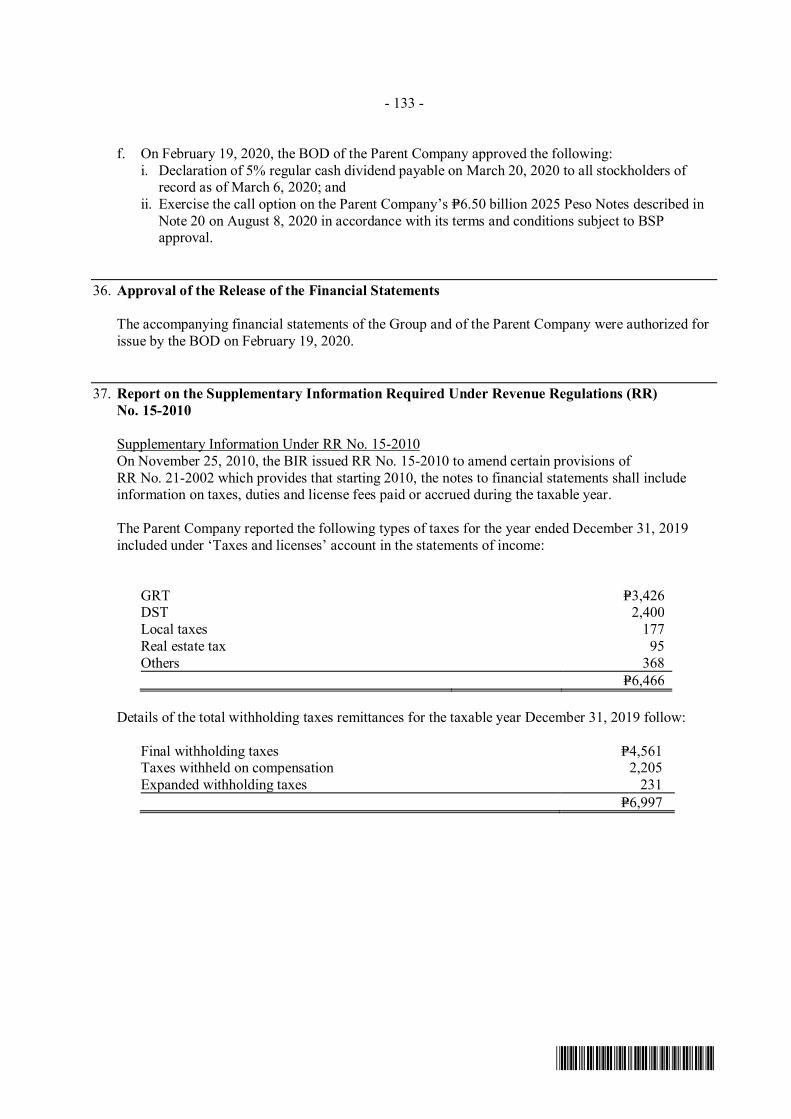
- 133 -
*SGVFS038804*
f. On February 19, 2020, the BOD of the Parent Company approved the following:i. Declaration of 5% regular cash dividend payable on March 20, 2020 to all stockholders of
record as of March 6, 2020; andii. Exercise the call option on the Parent Company’s P=6.50 billion 2025 Peso Notes described in
Note 20 on August 8, 2020 in accordance with its terms and conditions subject to BSPapproval.
36. Approval of the Release of the Financial Statements
The accompanying financial statements of the Group and of the Parent Company were authorized forissue by the BOD on February 19, 2020.
37. Report on the Supplementary Information Required Under Revenue Regulations (RR)No. 15-2010
Supplementary Information Under RR No. 15-2010On November 25, 2010, the BIR issued RR No. 15-2010 to amend certain provisions ofRR No. 21-2002 which provides that starting 2010, the notes to financial statements shall includeinformation on taxes, duties and license fees paid or accrued during the taxable year.
The Parent Company reported the following types of taxes for the year ended December 31, 2019included under ‘Taxes and licenses’ account in the statements of income:
GRT P=3,426DST 2,400Local taxes 177Real estate tax 95Others 368
P=6,466
Details of the total withholding taxes remittances for the taxable year December 31, 2019 follow:
Final withholding taxes P=4,561Taxes withheld on compensation 2,205Expanded withholding taxes 231
P=6,997
1
Reporting Template
per SEC Memorandum Circular No. 4 Series of 2019 Contextual Information Company Details Name of Organization GT Capital Holdings, Inc. (“GT Capital” or the “Company”) Location of Headquarters 43rd Floor, GT Tower International, 6813 Ayala Avenue
corner H.V. dela Costa St., Makati City Location of Operations Philippines Report Boundary This report discusses GT Capital’s performance at the
parent company level. Business Model, including Primary Activities, Brands, Products, and Services
GT Capital is a listed major Philippine conglomerate with interests in market-leading businesses across banking, property development, infrastructure and utilities, automotive assembly, importation, wholesaling, dealership, and financing, and life and non-life insurance.
Reporting Period January 1 to December 31, 2019 Highest Ranking Person responsible for this report
Mr. Winston Andrew L. Peckson, Chief Risk Officer
Materiality Process Explain how you applied the materiality principle (or the materiality process) in identifying your material topics.1 GT Capital partnered with the University of Asia and the Pacific (“UA&P”) to conduct the materiality process. With the help of UA&P, GT Capital identified the following stakeholder groups that would be consulted on the basis of their influence on the Company’s economic, social, and environmental performance, and who are most affected by its operations: (a) principals; (b) capital fund providers; (c) employees; (d) senior executives; (e) regulators; and (f) component companies. A structured and codified online survey was distributed among the identified stakeholders. This process resulted in the following material topics and disclosures that are part of this reporting template:
I. Economic A. Economic Performance
1. Direct Economic Value Generated and Distributed B. Anti-corruption
1. Training on Anti-corruption Policies and Procedures
II. Environment A. Resource Management
1 See GRI 102-46 (2016) for more guidance.
2
1. Reduction of energy consumption B. Environmental Compliance
1. Non-compliance with Environmental Laws and Regulations
III. Social A. Employee Management
1. Employee Hiring and Benefits 2. Employee Training and Development 3. Diversity and Equal Opportunity
B. Supplier Chain Management C. Customer Management
1. Marketing and labelling 2. Customer privacy 3. Data security
GT Capital is also expected to release its 2019 Sustainability Report in accordance with Global Reporting Initiative (“GRI”) Standards: Core Option within the second-third quarter of 2020.
3
ECONOMIC Economic Performance Direct Economic Value Generated and Distributed Disclosure Amount (in millions) Units Direct economic value generated (revenue) 226,754 PhP Direct economic value distributed:
a. Operating costs 176,537 PhP
b. Employee wages and benefits 2,985 PhP
c. Payments to suppliers, other operating costs 10,609 Php
d. Dividends given to stockholders and interest payments to loan providers
21,035 PhP
e. Taxes given to government 4,887 PhP
f. Investments to community (e.g. donations, CSR) 1 PhP
What is the impact and where does it occur? What is the organization’s involvement in the impact?
Which stakeholders are affected?
Management Approach
This determines how value is generated and distributed among our stakeholders.
Principals, minority shareholders, management, regulatory agencies, suppliers, capital fund providers, employees, and component companies.
GT Capital manages the impacts by reviewing and validating the component companies’ annual budget. The Company also develops an annual budget, periodic forecasts, and long-term projections that are regularly updated and compared with actual vs budget to evaluate if targets are achieved.
GT Capital has also developed several accounting policies and processes to guide the finance and accounting group in monitoring the economic performance of the company.
What are the Risk/s Identified? Which stakeholders are affected?
Management Approach
Economic indicators may not be Minority shareholders, The Company takes steps to be more
4
aligned with metrics measured by some investor groups.
capital fund providers.
transparent in its sustainability reporting process to better address the needs of said investor groups.
What are the Opportunity/ies Identified?
Which stakeholders are affected?
Management Approach
Direct economic value generated and distributed translates the Company’s operations to its corresponding impact from a sustainability context. This provides the Company an indication of how well it performs using this set of metrics.
Principals, minority shareholders, management, regulatory agencies, suppliers, capital fund providers, employees, and component companies.
The Company shall use this data to eventually set sustainability-related targets and to benchmark against its peers.
Climate-related risks and opportunities2 GT Capital does not have sufficient information to fully assess the climate-related risks and opportunities at this stage.
Governance Strategy Risk Management Metrics and Targets N/A N/A N/A N/A Recommended Disclosures N/A N/A N/A N/A
2 Adopted from the Recommendations of the Task Force on Climate-Related Financial Disclosures. The TCFD Recommendations apply to non-financial companies and financial-sector organizations, including banks, insurance companies, asset managers and asset owners.
5
Procurement Practices Proportion of spending on local suppliers This disclosure is not material to GT Capital as per materiality process. Disclosure Quantity Units Percentage of procurement budget used for significant locations of operations that is spent on local suppliers
N/A %
What is the impact and where does it occur? What is the organization’s involvement in the impact?
Which stakeholders are affected?
Management Approach
N/A N/A N/A What are the Risk/s Identified? Which stakeholders are
affected? Management Approach
N/A N/A N/A What are the Opportunity/ies Identified?
Which stakeholders are affected?
Management Approach
N/A N/A N/A Anti-corruption Training on Anti-corruption Policies and Procedures Disclosure Quantity Units Percentage of employees to whom the organization’s anti-corruption policies and procedures have been communicated to
42 100%
Percentage of business partners to whom the organization’s anti-corruption policies and procedures have been communicated to
No available data for this report.
%
Percentage of directors and management that have received anti-corruption training
No available data for this report.
%
Percentage of employees that have received anti-corruption training
No available data for this report.
%
6
What is the impact and where does it occur? What is the organization’s involvement in the impact?
Which stakeholders are affected?
Management Approach
Corruption in the workplace may damage GT Capital’s reputation which may eventually result in low morale of internal stakeholders and may have financial, legal, and regulatory consequences.
Internal stakeholders The Corporation promotes a culture of good governance. GT Capital’s Code of Discipline provides penalties for corruption violations. Its Code of Ethics also states that all directors, officers, and employees shall ensure the conduct of fair business transactions and that personal interest does not affect the exercise of their duties. Likewise, they shall not use their position to profit or acquire benefits or advantage for themselves or related interests. GT Capital has established procurement policies and contracts to avail crucial services which are reviewed and approved by the Bids and Awards Committee or the Executive Committee for extraordinary service engagements. The Company aims to continue its zero corruption-related violations. It intends to have a refresher on policies for internal stakeholders. Likewise, it aims to have a periodic review and adjustment of its Code of Discipline. The Company also has whistleblowing as part of its grievance mechanisms. GT Capital assigns its audit department for monitoring and the human resource department for implementation of sanctions. These departments facilitate the distribution and orientation of the Code of Discipline and Ethics among its internal stakeholders. They are also in charge of the periodic review and adjustment of these documents.
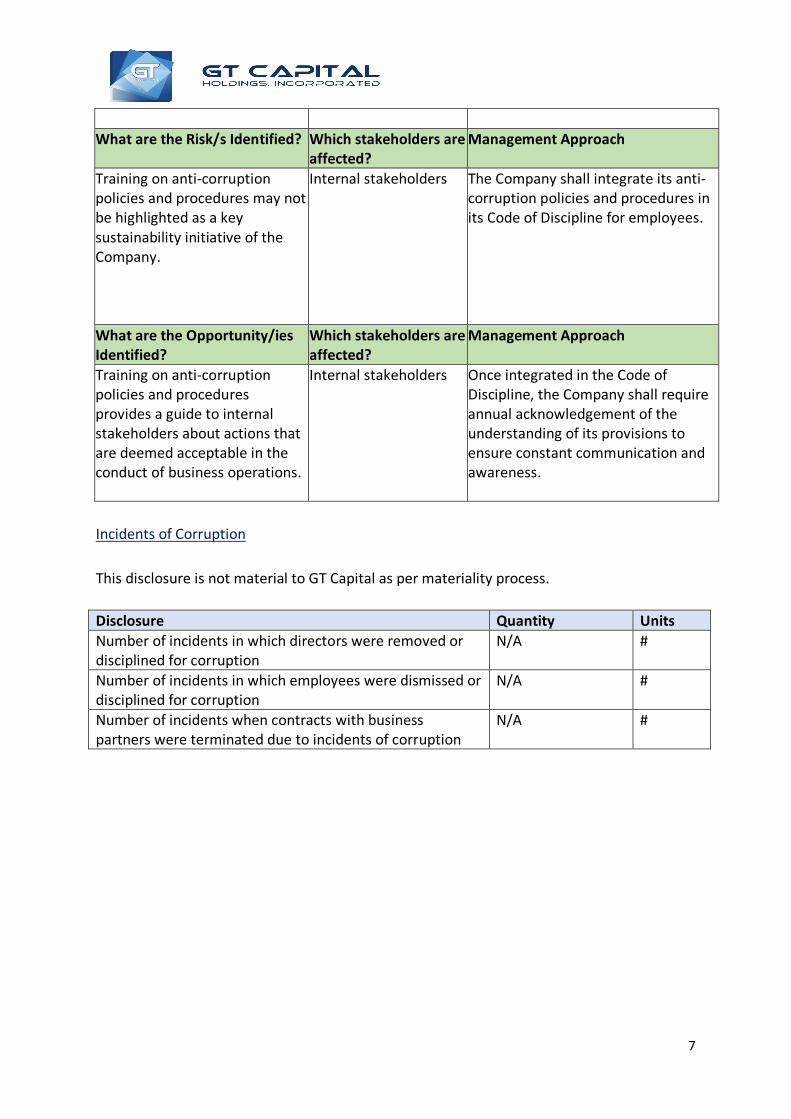
7
What are the Risk/s Identified? Which stakeholders are
affected? Management Approach
Training on anti-corruption policies and procedures may not be highlighted as a key sustainability initiative of the Company.
Internal stakeholders The Company shall integrate its anti-corruption policies and procedures in its Code of Discipline for employees.
What are the Opportunity/ies Identified?
Which stakeholders are affected?
Management Approach
Training on anti-corruption policies and procedures provides a guide to internal stakeholders about actions that are deemed acceptable in the conduct of business operations.
Internal stakeholders Once integrated in the Code of Discipline, the Company shall require annual acknowledgement of the understanding of its provisions to ensure constant communication and awareness.
Incidents of Corruption This disclosure is not material to GT Capital as per materiality process. Disclosure Quantity Units Number of incidents in which directors were removed or disciplined for corruption
N/A #
Number of incidents in which employees were dismissed or disciplined for corruption
N/A #
Number of incidents when contracts with business partners were terminated due to incidents of corruption
N/A #
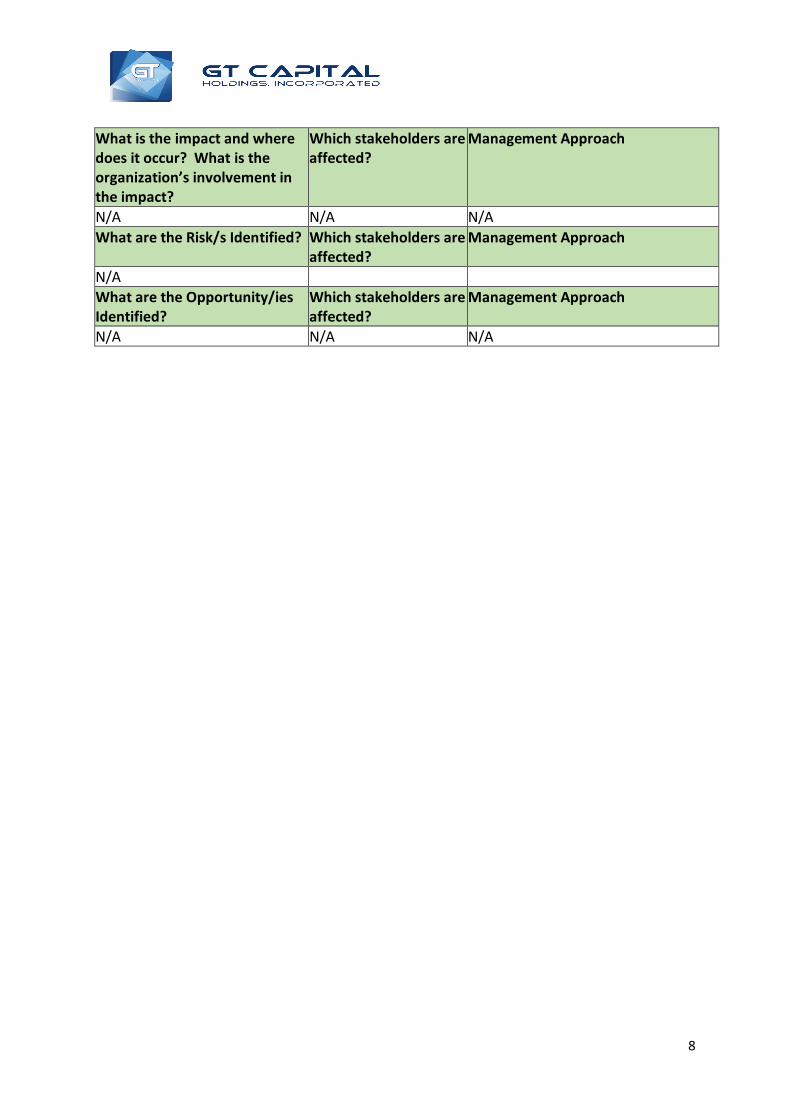
8
What is the impact and where does it occur? What is the organization’s involvement in the impact?
Which stakeholders are affected?
Management Approach
N/A N/A N/A What are the Risk/s Identified? Which stakeholders are
affected? Management Approach
N/A What are the Opportunity/ies Identified?
Which stakeholders are affected?
Management Approach
N/A N/A N/A
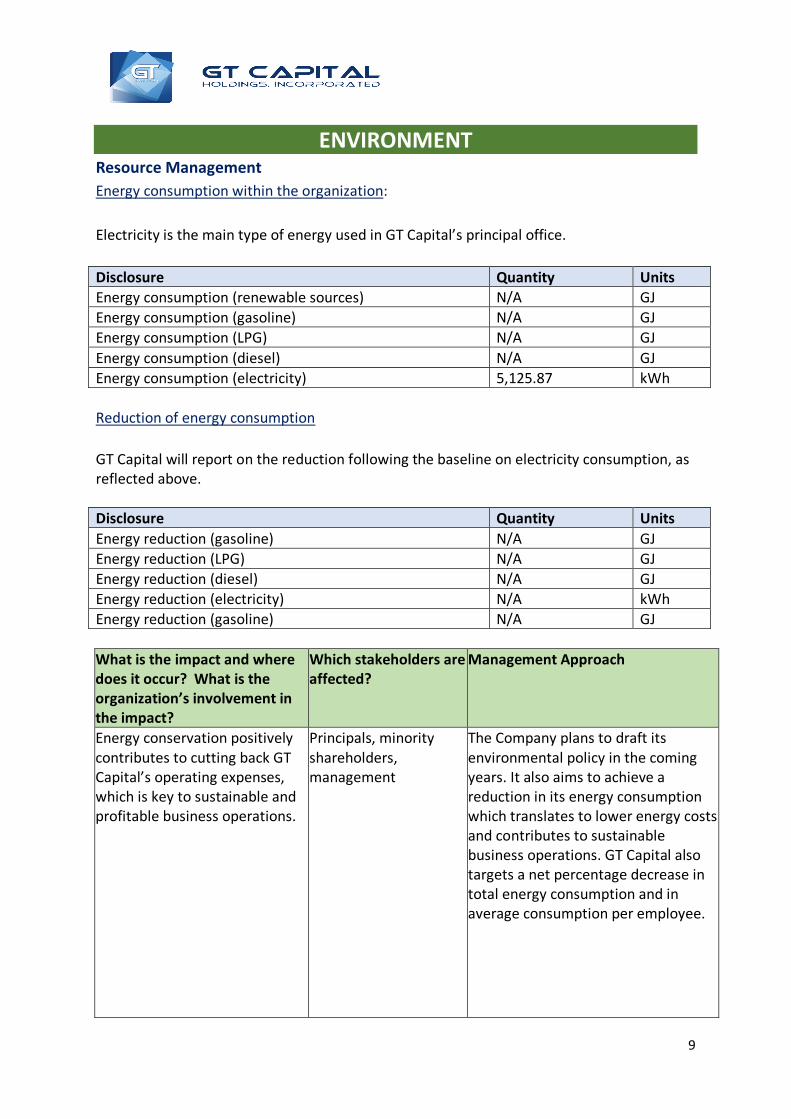
9
ENVIRONMENT Resource Management Energy consumption within the organization: Electricity is the main type of energy used in GT Capital’s principal office. Disclosure Quantity Units Energy consumption (renewable sources) N/A GJ Energy consumption (gasoline) N/A GJ Energy consumption (LPG) N/A GJ Energy consumption (diesel) N/A GJ Energy consumption (electricity) 5,125.87 kWh Reduction of energy consumption GT Capital will report on the reduction following the baseline on electricity consumption, as reflected above. Disclosure Quantity Units Energy reduction (gasoline) N/A GJ Energy reduction (LPG) N/A GJ Energy reduction (diesel) N/A GJ Energy reduction (electricity) N/A kWh Energy reduction (gasoline) N/A GJ What is the impact and where does it occur? What is the organization’s involvement in the impact?
Which stakeholders are affected?
Management Approach
Energy conservation positively contributes to cutting back GT Capital’s operating expenses, which is key to sustainable and profitable business operations.
Principals, minority shareholders, management
The Company plans to draft its environmental policy in the coming years. It also aims to achieve a reduction in its energy consumption which translates to lower energy costs and contributes to sustainable business operations. GT Capital also targets a net percentage decrease in total energy consumption and in average consumption per employee.
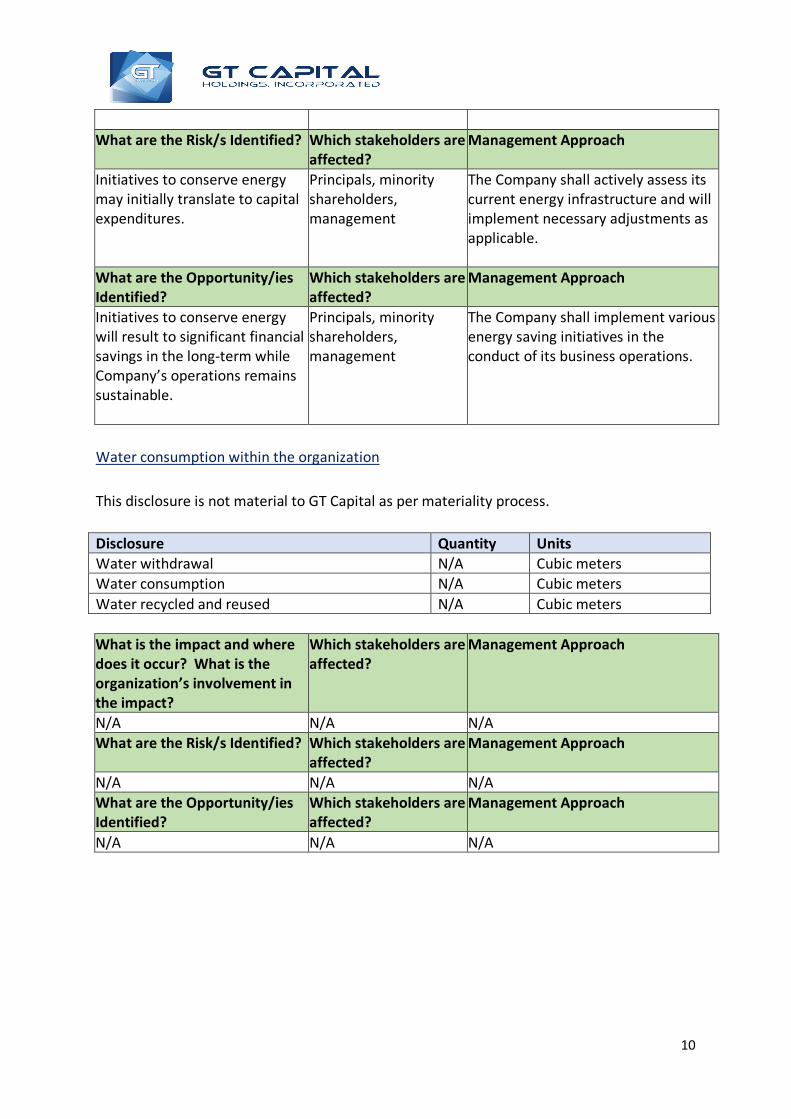
10
What are the Risk/s Identified? Which stakeholders are
affected? Management Approach
Initiatives to conserve energy may initially translate to capital expenditures.
Principals, minority shareholders, management
The Company shall actively assess its current energy infrastructure and will implement necessary adjustments as applicable.
What are the Opportunity/ies Identified?
Which stakeholders are affected?
Management Approach
Initiatives to conserve energy will result to significant financial savings in the long-term while Company’s operations remains sustainable.
Principals, minority shareholders, management
The Company shall implement various energy saving initiatives in the conduct of its business operations.
Water consumption within the organization This disclosure is not material to GT Capital as per materiality process. Disclosure Quantity Units Water withdrawal N/A Cubic meters Water consumption N/A Cubic meters Water recycled and reused N/A Cubic meters What is the impact and where does it occur? What is the organization’s involvement in the impact?
Which stakeholders are affected?
Management Approach
N/A N/A N/A What are the Risk/s Identified? Which stakeholders are
affected? Management Approach
N/A N/A N/A What are the Opportunity/ies Identified?
Which stakeholders are affected?
Management Approach
N/A N/A N/A
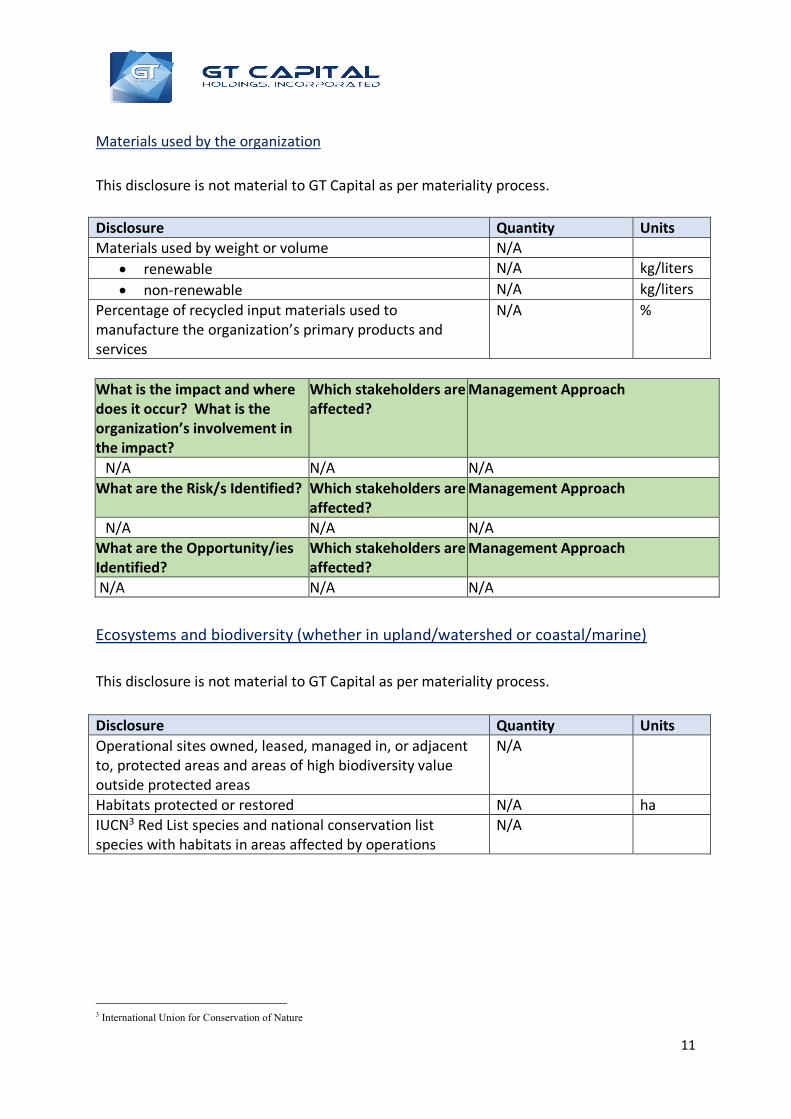
11
Materials used by the organization This disclosure is not material to GT Capital as per materiality process. Disclosure Quantity Units Materials used by weight or volume N/A
• renewable N/A kg/liters • non-renewable N/A kg/liters
Percentage of recycled input materials used to manufacture the organization’s primary products and services
N/A %
What is the impact and where does it occur? What is the organization’s involvement in the impact?
Which stakeholders are affected?
Management Approach
N/A N/A N/A What are the Risk/s Identified? Which stakeholders are
affected? Management Approach
N/A N/A N/A What are the Opportunity/ies Identified?
Which stakeholders are affected?
Management Approach
N/A N/A N/A Ecosystems and biodiversity (whether in upland/watershed or coastal/marine) This disclosure is not material to GT Capital as per materiality process. Disclosure Quantity Units Operational sites owned, leased, managed in, or adjacent to, protected areas and areas of high biodiversity value outside protected areas
N/A
Habitats protected or restored N/A ha IUCN3 Red List species and national conservation list species with habitats in areas affected by operations
N/A
3 International Union for Conservation of Nature
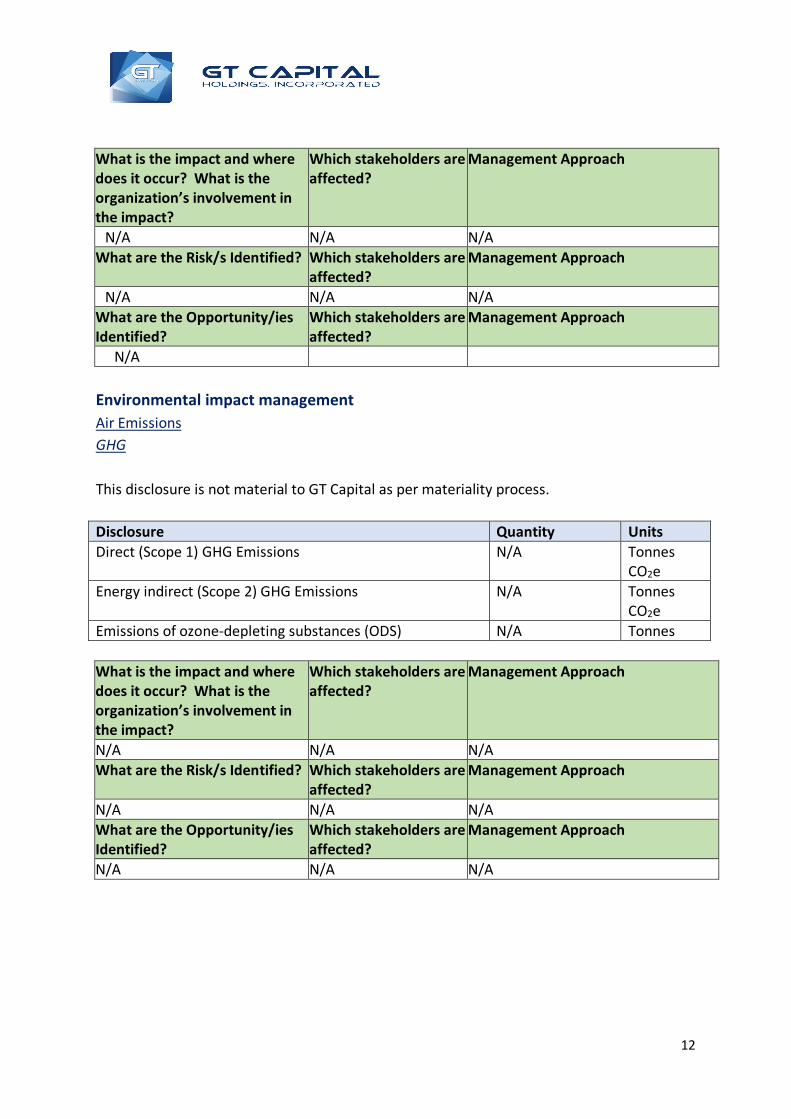
12
What is the impact and where does it occur? What is the organization’s involvement in the impact?
Which stakeholders are affected?
Management Approach
N/A N/A N/A What are the Risk/s Identified? Which stakeholders are
affected? Management Approach
N/A N/A N/A What are the Opportunity/ies Identified?
Which stakeholders are affected?
Management Approach
N/A Environmental impact management Air Emissions GHG This disclosure is not material to GT Capital as per materiality process. Disclosure Quantity Units Direct (Scope 1) GHG Emissions N/A Tonnes
CO2e Energy indirect (Scope 2) GHG Emissions N/A Tonnes
CO2e Emissions of ozone-depleting substances (ODS) N/A Tonnes What is the impact and where does it occur? What is the organization’s involvement in the impact?
Which stakeholders are affected?
Management Approach
N/A N/A N/A What are the Risk/s Identified? Which stakeholders are
affected? Management Approach
N/A N/A N/A What are the Opportunity/ies Identified?
Which stakeholders are affected?
Management Approach
N/A N/A N/A
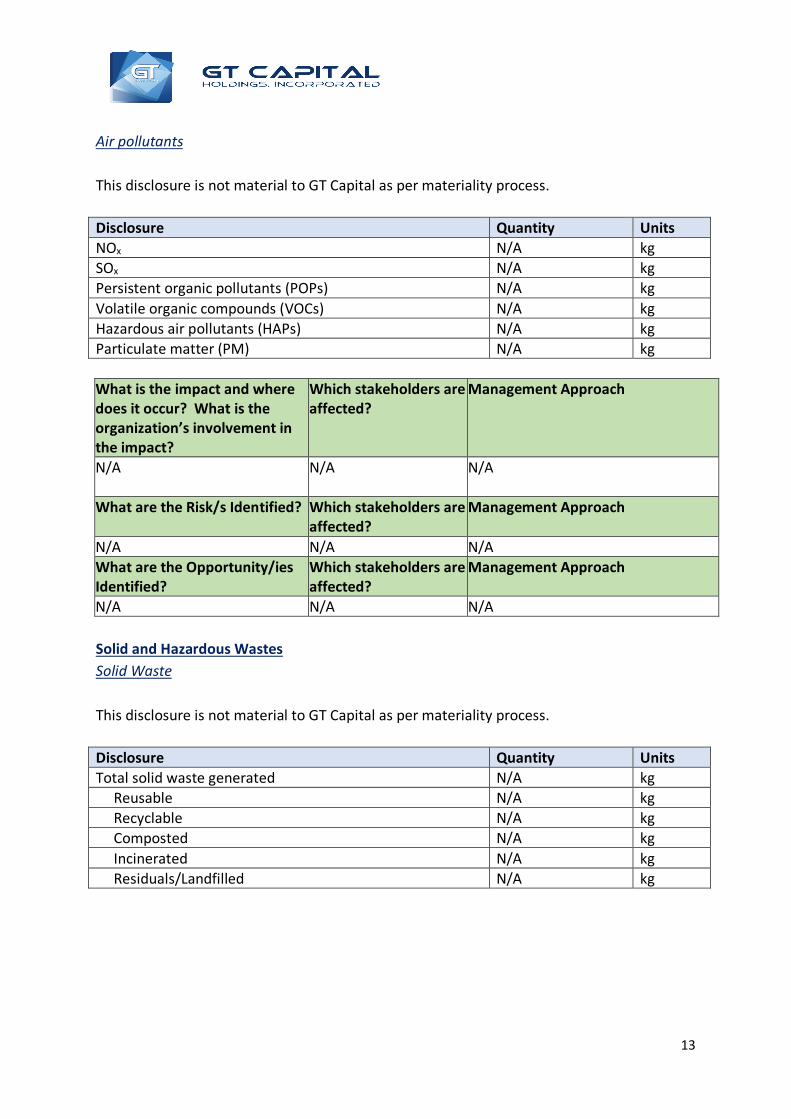
13
Air pollutants This disclosure is not material to GT Capital as per materiality process. Disclosure Quantity Units NOx N/A kg SOx N/A kg Persistent organic pollutants (POPs) N/A kg Volatile organic compounds (VOCs) N/A kg Hazardous air pollutants (HAPs) N/A kg Particulate matter (PM) N/A kg What is the impact and where does it occur? What is the organization’s involvement in the impact?
Which stakeholders are affected?
Management Approach
N/A N/A N/A
What are the Risk/s Identified? Which stakeholders are affected?
Management Approach
N/A N/A N/A What are the Opportunity/ies Identified?
Which stakeholders are affected?
Management Approach
N/A N/A N/A Solid and Hazardous Wastes Solid Waste This disclosure is not material to GT Capital as per materiality process. Disclosure Quantity Units Total solid waste generated N/A kg Reusable N/A kg Recyclable N/A kg Composted N/A kg Incinerated N/A kg Residuals/Landfilled N/A kg
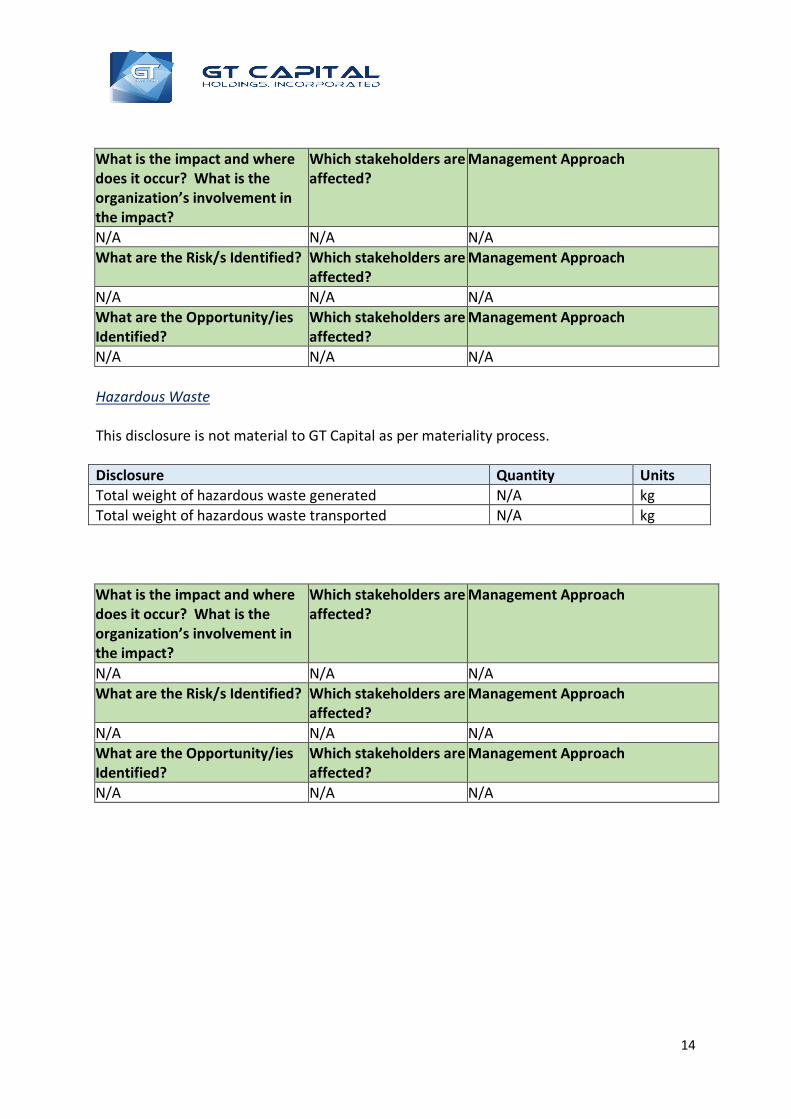
14
What is the impact and where does it occur? What is the organization’s involvement in the impact?
Which stakeholders are affected?
Management Approach
N/A N/A N/A What are the Risk/s Identified? Which stakeholders are
affected? Management Approach
N/A N/A N/A What are the Opportunity/ies Identified?
Which stakeholders are affected?
Management Approach
N/A N/A N/A Hazardous Waste This disclosure is not material to GT Capital as per materiality process. Disclosure Quantity Units Total weight of hazardous waste generated N/A kg Total weight of hazardous waste transported N/A kg What is the impact and where does it occur? What is the organization’s involvement in the impact?
Which stakeholders are affected?
Management Approach
N/A N/A N/A What are the Risk/s Identified? Which stakeholders are
affected? Management Approach
N/A N/A N/A What are the Opportunity/ies Identified?
Which stakeholders are affected?
Management Approach
N/A N/A N/A
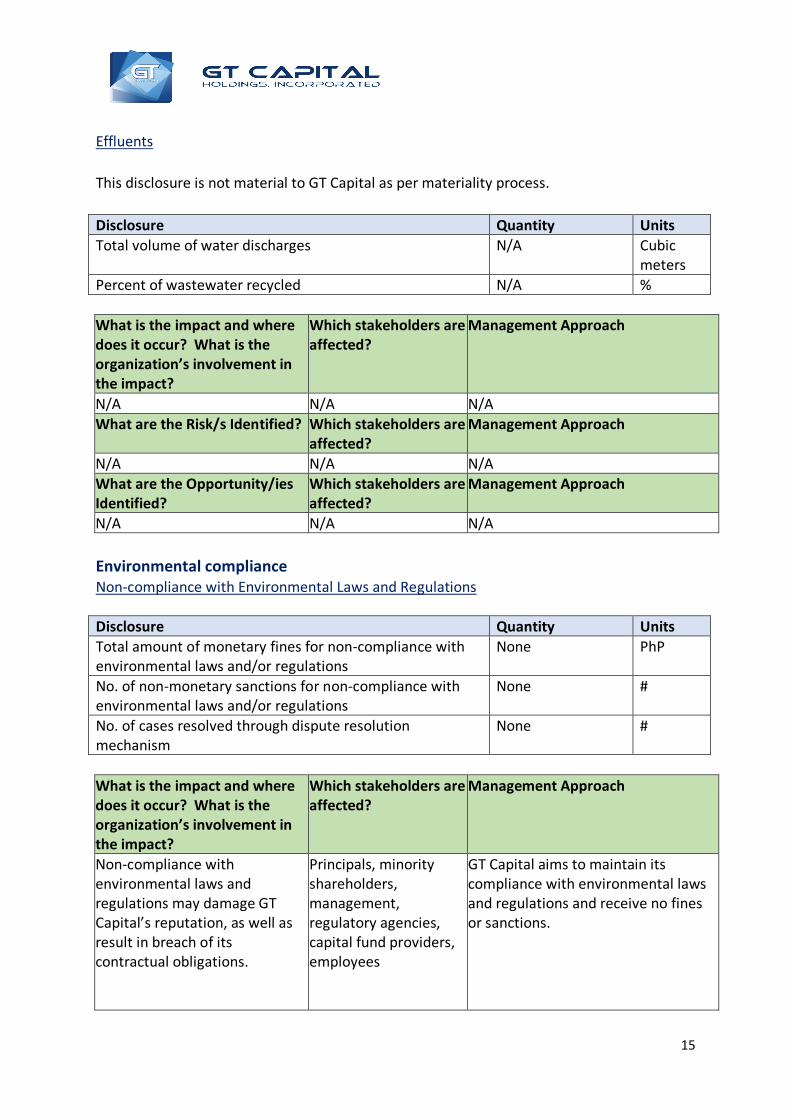
15
Effluents This disclosure is not material to GT Capital as per materiality process. Disclosure Quantity Units Total volume of water discharges N/A Cubic
meters Percent of wastewater recycled N/A % What is the impact and where does it occur? What is the organization’s involvement in the impact?
Which stakeholders are affected?
Management Approach
N/A N/A N/A What are the Risk/s Identified? Which stakeholders are
affected? Management Approach
N/A N/A N/A What are the Opportunity/ies Identified?
Which stakeholders are affected?
Management Approach
N/A N/A N/A Environmental compliance Non-compliance with Environmental Laws and Regulations Disclosure Quantity Units Total amount of monetary fines for non-compliance with environmental laws and/or regulations
None PhP
No. of non-monetary sanctions for non-compliance with environmental laws and/or regulations
None #
No. of cases resolved through dispute resolution mechanism
None #
What is the impact and where does it occur? What is the organization’s involvement in the impact?
Which stakeholders are affected?
Management Approach
Non-compliance with environmental laws and regulations may damage GT Capital’s reputation, as well as result in breach of its contractual obligations.
Principals, minority shareholders, management, regulatory agencies, capital fund providers, employees
GT Capital aims to maintain its compliance with environmental laws and regulations and receive no fines or sanctions.
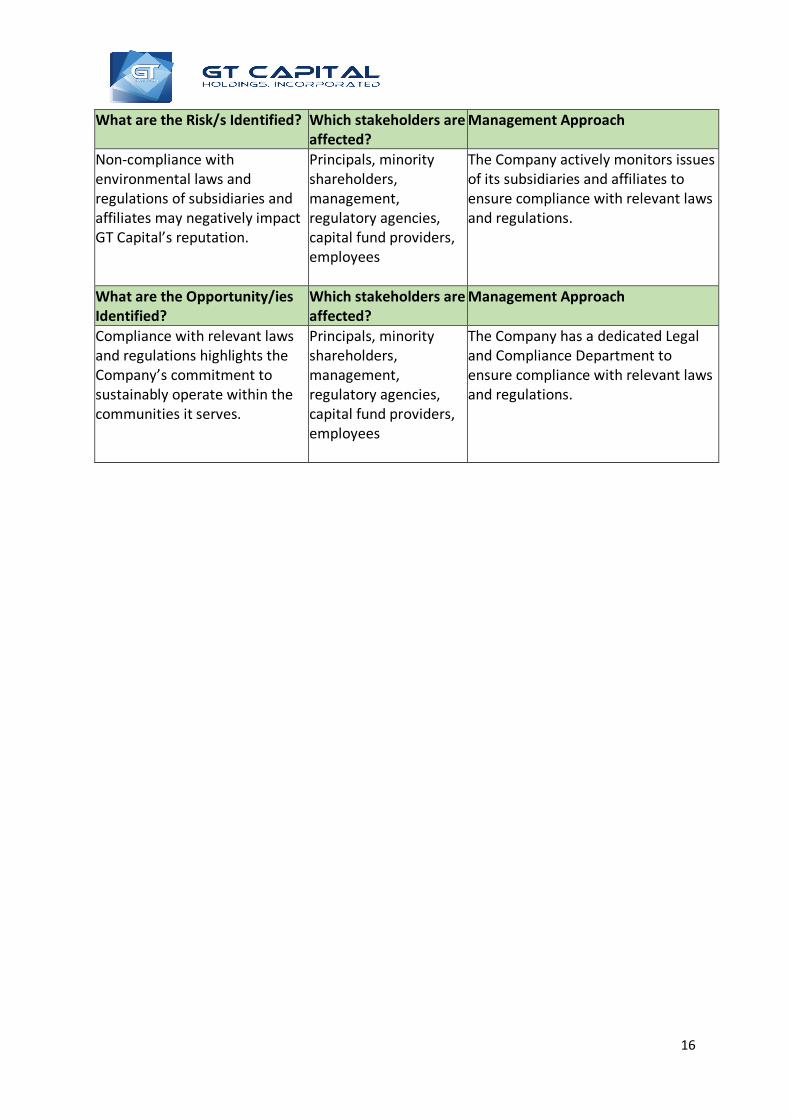
16
What are the Risk/s Identified? Which stakeholders are affected?
Management Approach
Non-compliance with environmental laws and regulations of subsidiaries and affiliates may negatively impact GT Capital’s reputation.
Principals, minority shareholders, management, regulatory agencies, capital fund providers, employees
The Company actively monitors issues of its subsidiaries and affiliates to ensure compliance with relevant laws and regulations.
What are the Opportunity/ies Identified?
Which stakeholders are affected?
Management Approach
Compliance with relevant laws and regulations highlights the Company’s commitment to sustainably operate within the communities it serves.
Principals, minority shareholders, management, regulatory agencies, capital fund providers, employees
The Company has a dedicated Legal and Compliance Department to ensure compliance with relevant laws and regulations.
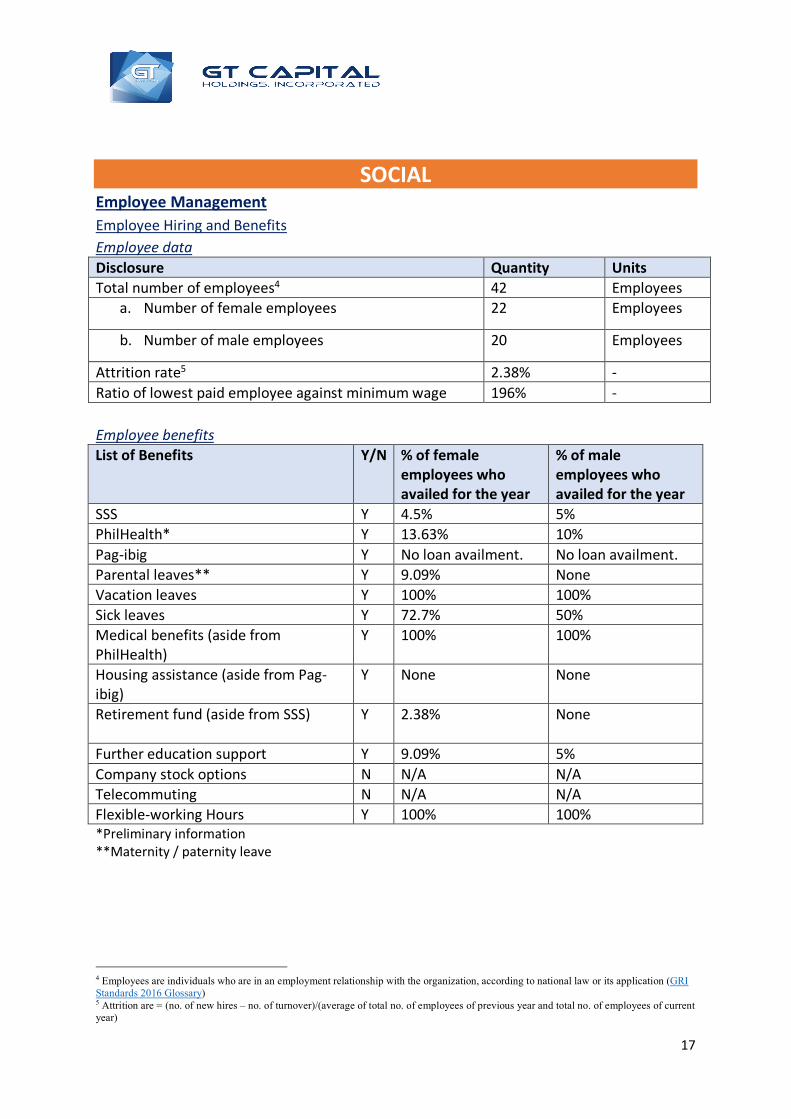
17
SOCIAL Employee Management Employee Hiring and Benefits Employee data Disclosure Quantity Units Total number of employees4 42 Employees
a. Number of female employees 22 Employees
b. Number of male employees 20 Employees
Attrition rate5 2.38% - Ratio of lowest paid employee against minimum wage 196% - Employee benefits List of Benefits Y/N % of female
employees who availed for the year
% of male employees who availed for the year
SSS Y 4.5% 5% PhilHealth* Y 13.63% 10% Pag-ibig Y No loan availment. No loan availment. Parental leaves** Y 9.09% None Vacation leaves Y 100% 100% Sick leaves Y 72.7% 50% Medical benefits (aside from PhilHealth)
Y 100% 100%
Housing assistance (aside from Pag-ibig)
Y None None
Retirement fund (aside from SSS) Y 2.38% None
Further education support Y 9.09% 5% Company stock options N N/A N/A Telecommuting N N/A N/A Flexible-working Hours Y 100% 100% *Preliminary information **Maternity / paternity leave
4 Employees are individuals who are in an employment relationship with the organization, according to national law or its application (GRI Standards 2016 Glossary) 5 Attrition are = (no. of new hires – no. of turnover)/(average of total no. of employees of previous year and total no. of employees of current year)
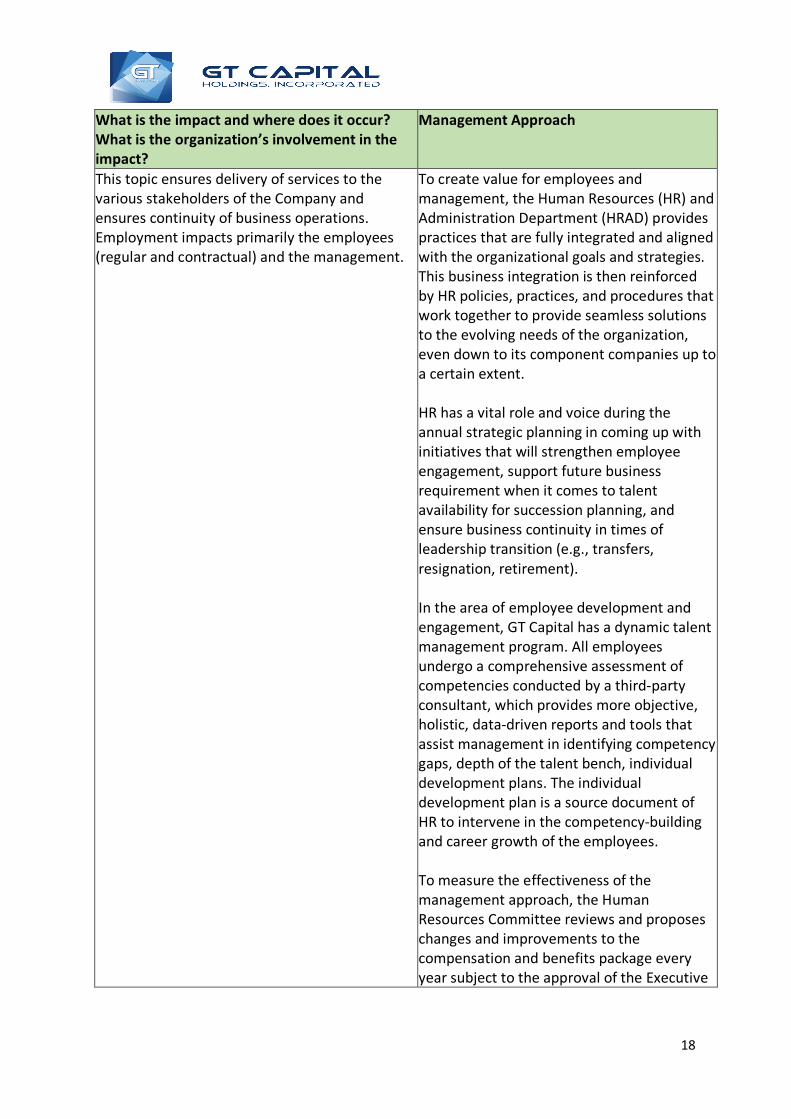
18
What is the impact and where does it occur? What is the organization’s involvement in the impact?
Management Approach
This topic ensures delivery of services to the various stakeholders of the Company and ensures continuity of business operations. Employment impacts primarily the employees (regular and contractual) and the management.
To create value for employees and management, the Human Resources (HR) and Administration Department (HRAD) provides practices that are fully integrated and aligned with the organizational goals and strategies. This business integration is then reinforced by HR policies, practices, and procedures that work together to provide seamless solutions to the evolving needs of the organization, even down to its component companies up to a certain extent. HR has a vital role and voice during the annual strategic planning in coming up with initiatives that will strengthen employee engagement, support future business requirement when it comes to talent availability for succession planning, and ensure business continuity in times of leadership transition (e.g., transfers, resignation, retirement). In the area of employee development and engagement, GT Capital has a dynamic talent management program. All employees undergo a comprehensive assessment of competencies conducted by a third-party consultant, which provides more objective, holistic, data-driven reports and tools that assist management in identifying competency gaps, depth of the talent bench, individual development plans. The individual development plan is a source document of HR to intervene in the competency-building and career growth of the employees. To measure the effectiveness of the management approach, the Human Resources Committee reviews and proposes changes and improvements to the compensation and benefits package every year subject to the approval of the Executive
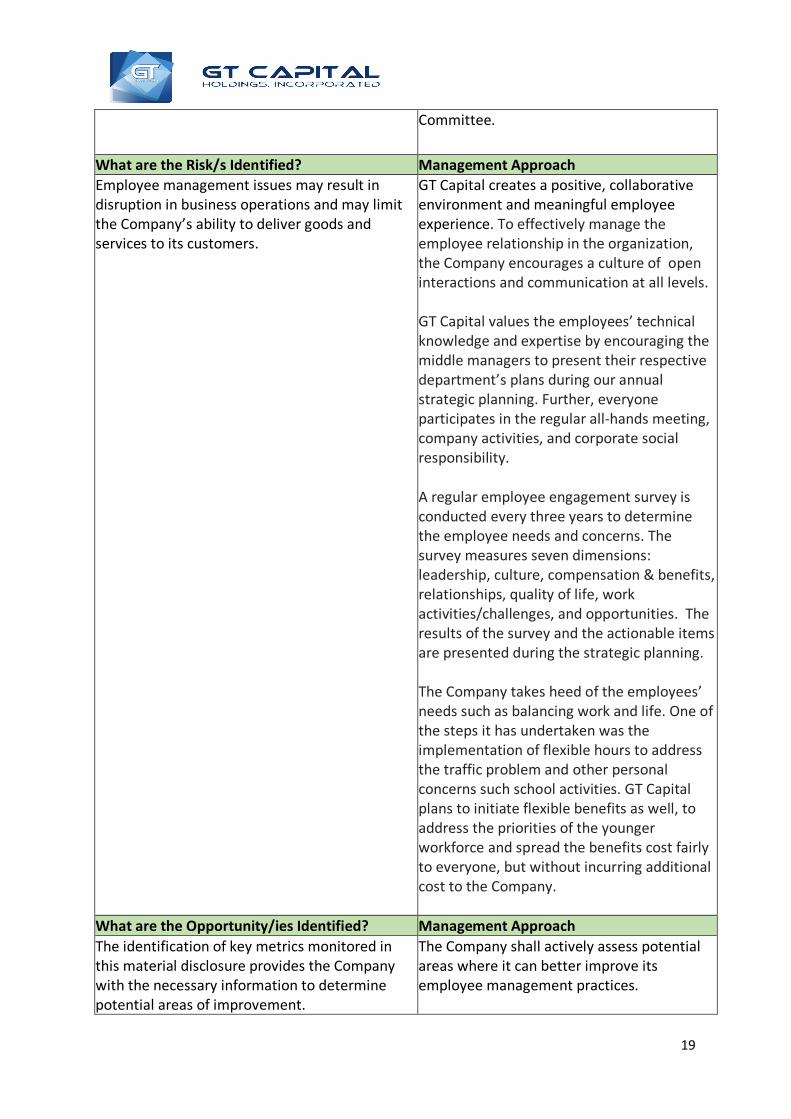
19
Committee.
What are the Risk/s Identified? Management Approach Employee management issues may result in disruption in business operations and may limit the Company’s ability to deliver goods and services to its customers.
GT Capital creates a positive, collaborative environment and meaningful employee experience. To effectively manage the employee relationship in the organization, the Company encourages a culture of open interactions and communication at all levels. GT Capital values the employees’ technical knowledge and expertise by encouraging the middle managers to present their respective department’s plans during our annual strategic planning. Further, everyone participates in the regular all-hands meeting, company activities, and corporate social responsibility. A regular employee engagement survey is conducted every three years to determine the employee needs and concerns. The survey measures seven dimensions: leadership, culture, compensation & benefits, relationships, quality of life, work activities/challenges, and opportunities. The results of the survey and the actionable items are presented during the strategic planning. The Company takes heed of the employees’ needs such as balancing work and life. One of the steps it has undertaken was the implementation of flexible hours to address the traffic problem and other personal concerns such school activities. GT Capital plans to initiate flexible benefits as well, to address the priorities of the younger workforce and spread the benefits cost fairly to everyone, but without incurring additional cost to the Company.
What are the Opportunity/ies Identified? Management Approach The identification of key metrics monitored in this material disclosure provides the Company with the necessary information to determine potential areas of improvement.
The Company shall actively assess potential areas where it can better improve its employee management practices.
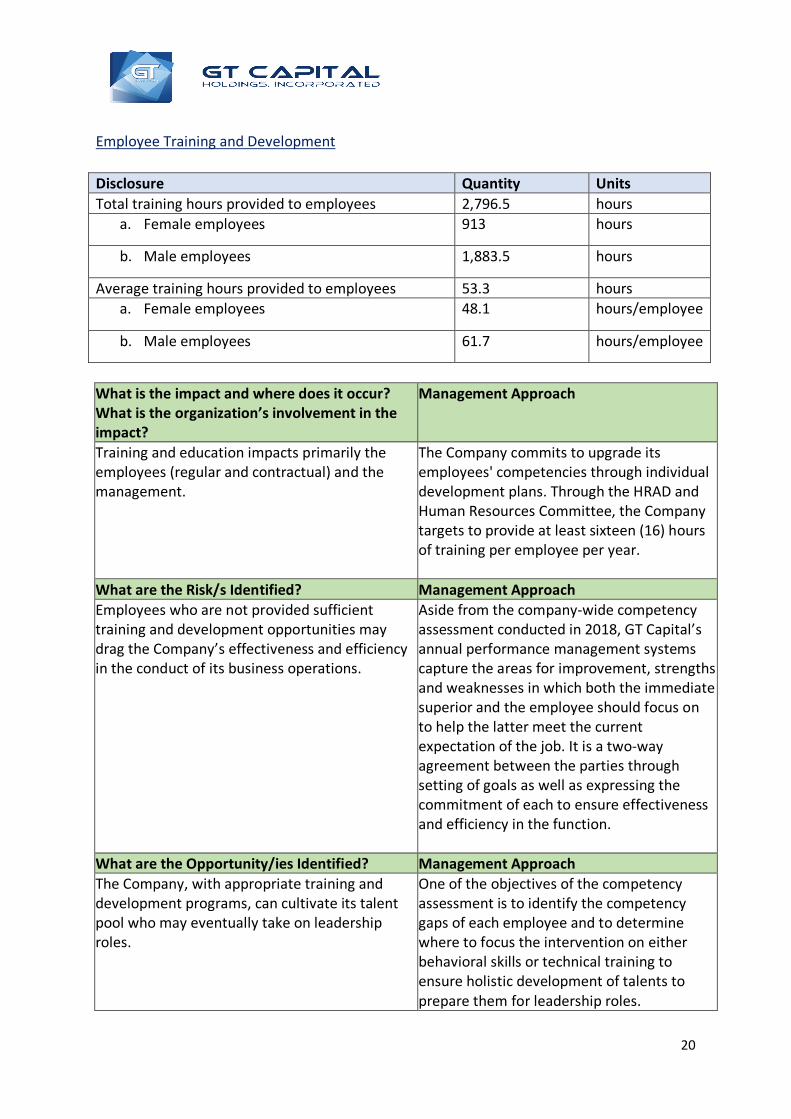
20
Employee Training and Development Disclosure Quantity Units Total training hours provided to employees 2,796.5 hours
a. Female employees 913 hours
b. Male employees 1,883.5 hours
Average training hours provided to employees 53.3 hours a. Female employees 48.1 hours/employee
b. Male employees 61.7 hours/employee
What is the impact and where does it occur? What is the organization’s involvement in the impact?
Management Approach
Training and education impacts primarily the employees (regular and contractual) and the management.
The Company commits to upgrade its employees' competencies through individual development plans. Through the HRAD and Human Resources Committee, the Company targets to provide at least sixteen (16) hours of training per employee per year.
What are the Risk/s Identified? Management Approach Employees who are not provided sufficient training and development opportunities may drag the Company’s effectiveness and efficiency in the conduct of its business operations.
Aside from the company-wide competency assessment conducted in 2018, GT Capital’s annual performance management systems capture the areas for improvement, strengths and weaknesses in which both the immediate superior and the employee should focus on to help the latter meet the current expectation of the job. It is a two-way agreement between the parties through setting of goals as well as expressing the commitment of each to ensure effectiveness and efficiency in the function.
What are the Opportunity/ies Identified? Management Approach The Company, with appropriate training and development programs, can cultivate its talent pool who may eventually take on leadership roles.
One of the objectives of the competency assessment is to identify the competency gaps of each employee and to determine where to focus the intervention on either behavioral skills or technical training to ensure holistic development of talents to prepare them for leadership roles.
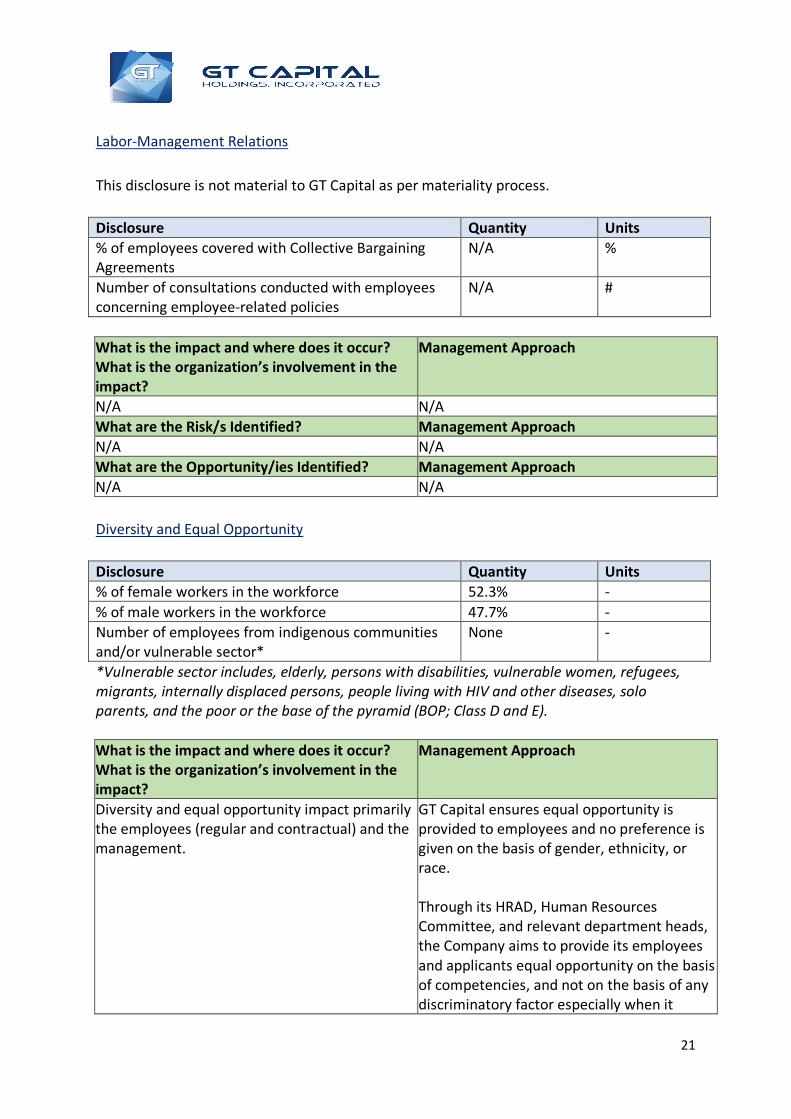
21
Labor-Management Relations This disclosure is not material to GT Capital as per materiality process. Disclosure Quantity Units % of employees covered with Collective Bargaining Agreements
N/A %
Number of consultations conducted with employees concerning employee-related policies
N/A #
What is the impact and where does it occur? What is the organization’s involvement in the impact?
Management Approach
N/A N/A What are the Risk/s Identified? Management Approach N/A N/A What are the Opportunity/ies Identified? Management Approach N/A N/A Diversity and Equal Opportunity Disclosure Quantity Units % of female workers in the workforce 52.3% - % of male workers in the workforce 47.7% - Number of employees from indigenous communities and/or vulnerable sector*
None -
*Vulnerable sector includes, elderly, persons with disabilities, vulnerable women, refugees, migrants, internally displaced persons, people living with HIV and other diseases, solo parents, and the poor or the base of the pyramid (BOP; Class D and E). What is the impact and where does it occur? What is the organization’s involvement in the impact?
Management Approach
Diversity and equal opportunity impact primarily the employees (regular and contractual) and the management.
GT Capital ensures equal opportunity is provided to employees and no preference is given on the basis of gender, ethnicity, or race. Through its HRAD, Human Resources Committee, and relevant department heads, the Company aims to provide its employees and applicants equal opportunity on the basis of competencies, and not on the basis of any discriminatory factor especially when it
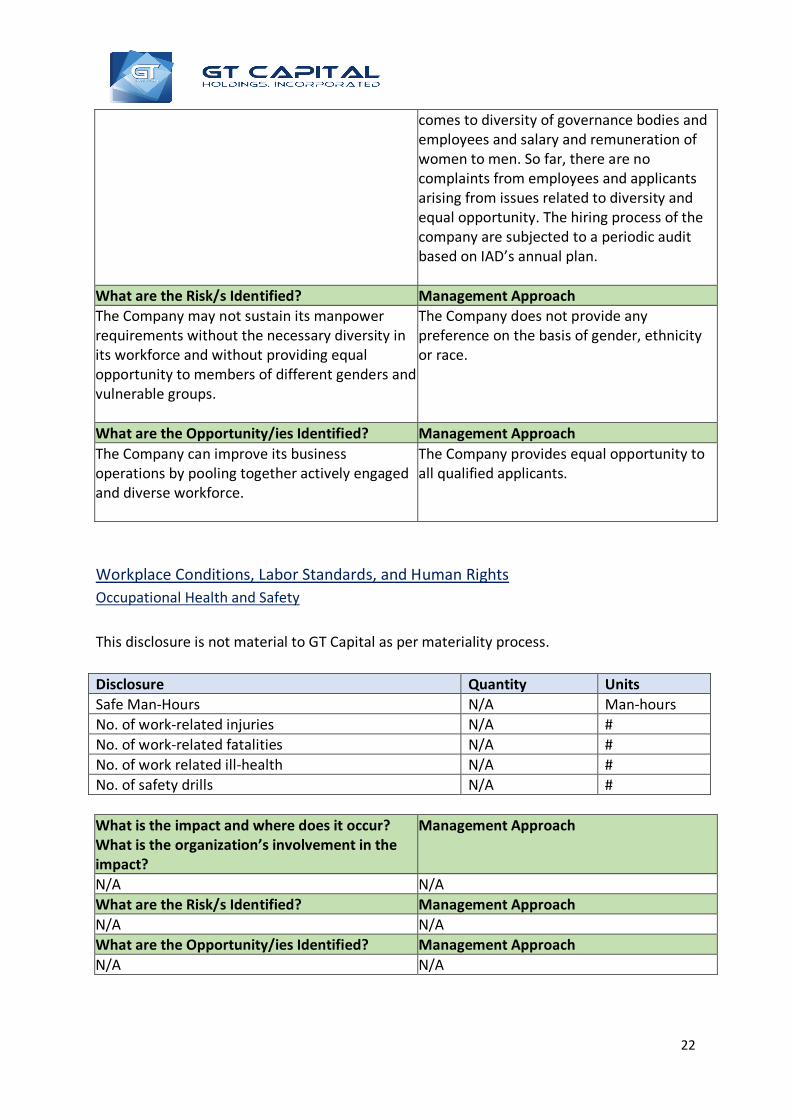
22
comes to diversity of governance bodies and employees and salary and remuneration of women to men. So far, there are no complaints from employees and applicants arising from issues related to diversity and equal opportunity. The hiring process of the company are subjected to a periodic audit based on IAD’s annual plan.
What are the Risk/s Identified? Management Approach The Company may not sustain its manpower requirements without the necessary diversity in its workforce and without providing equal opportunity to members of different genders and vulnerable groups.
The Company does not provide any preference on the basis of gender, ethnicity or race.
What are the Opportunity/ies Identified? Management Approach The Company can improve its business operations by pooling together actively engaged and diverse workforce.
The Company provides equal opportunity to all qualified applicants.
Workplace Conditions, Labor Standards, and Human Rights Occupational Health and Safety This disclosure is not material to GT Capital as per materiality process. Disclosure Quantity Units Safe Man-Hours N/A Man-hours No. of work-related injuries N/A # No. of work-related fatalities N/A # No. of work related ill-health N/A # No. of safety drills N/A # What is the impact and where does it occur? What is the organization’s involvement in the impact?
Management Approach
N/A N/A What are the Risk/s Identified? Management Approach N/A N/A What are the Opportunity/ies Identified? Management Approach N/A N/A
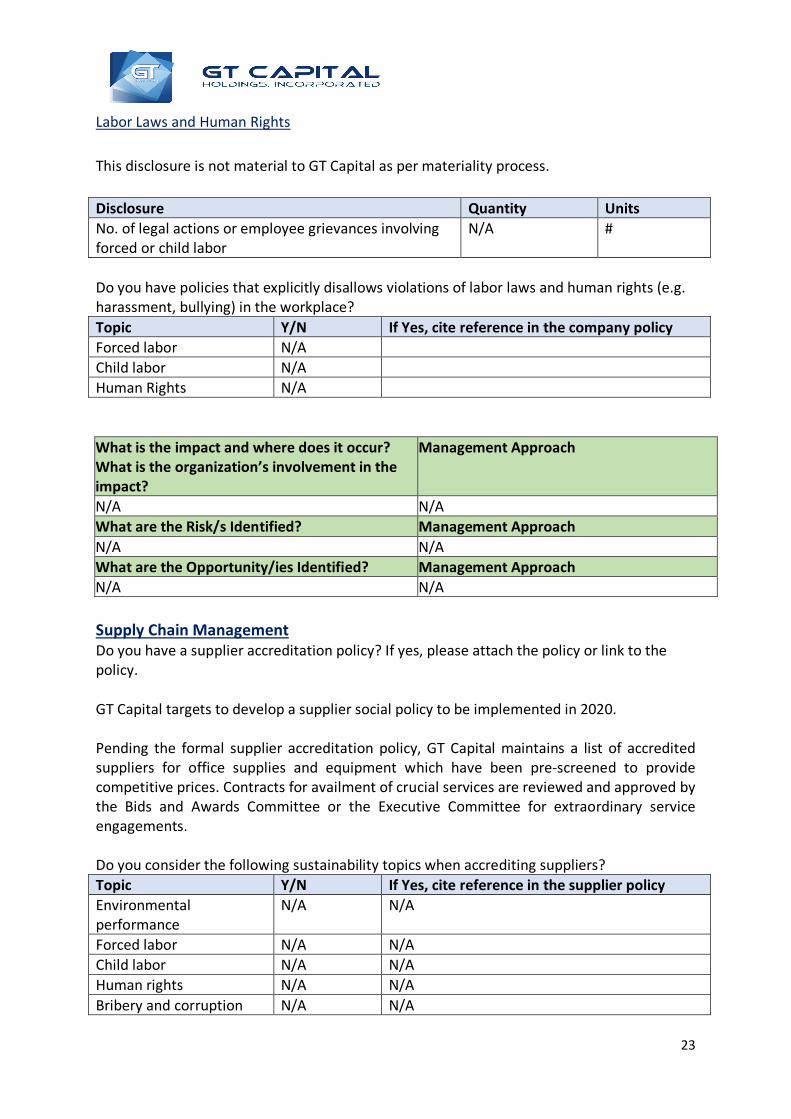
23
Labor Laws and Human Rights This disclosure is not material to GT Capital as per materiality process. Disclosure Quantity Units No. of legal actions or employee grievances involving forced or child labor
N/A #
Do you have policies that explicitly disallows violations of labor laws and human rights (e.g. harassment, bullying) in the workplace? Topic Y/N If Yes, cite reference in the company policy Forced labor N/A Child labor N/A Human Rights N/A What is the impact and where does it occur? What is the organization’s involvement in the impact?
Management Approach
N/A N/A What are the Risk/s Identified? Management Approach N/A N/A What are the Opportunity/ies Identified? Management Approach N/A N/A Supply Chain Management Do you have a supplier accreditation policy? If yes, please attach the policy or link to the policy. GT Capital targets to develop a supplier social policy to be implemented in 2020. Pending the formal supplier accreditation policy, GT Capital maintains a list of accredited suppliers for office supplies and equipment which have been pre-screened to provide competitive prices. Contracts for availment of crucial services are reviewed and approved by the Bids and Awards Committee or the Executive Committee for extraordinary service engagements. Do you consider the following sustainability topics when accrediting suppliers? Topic Y/N If Yes, cite reference in the supplier policy Environmental performance
N/A N/A
Forced labor N/A N/A Child labor N/A N/A Human rights N/A N/A Bribery and corruption N/A N/A
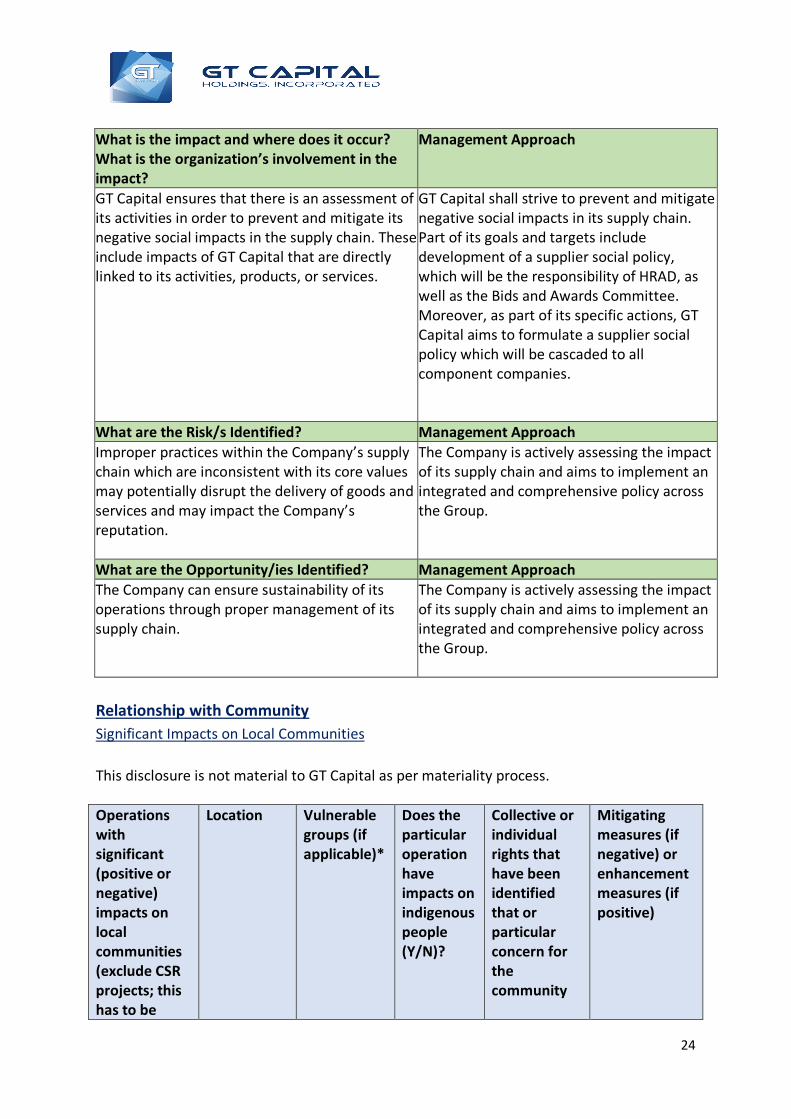
24
What is the impact and where does it occur? What is the organization’s involvement in the impact?
Management Approach
GT Capital ensures that there is an assessment of its activities in order to prevent and mitigate its negative social impacts in the supply chain. These include impacts of GT Capital that are directly linked to its activities, products, or services.
GT Capital shall strive to prevent and mitigate negative social impacts in its supply chain. Part of its goals and targets include development of a supplier social policy, which will be the responsibility of HRAD, as well as the Bids and Awards Committee. Moreover, as part of its specific actions, GT Capital aims to formulate a supplier social policy which will be cascaded to all component companies.
What are the Risk/s Identified? Management Approach Improper practices within the Company’s supply chain which are inconsistent with its core values may potentially disrupt the delivery of goods and services and may impact the Company’s reputation.
The Company is actively assessing the impact of its supply chain and aims to implement an integrated and comprehensive policy across the Group.
What are the Opportunity/ies Identified? Management Approach The Company can ensure sustainability of its operations through proper management of its supply chain.
The Company is actively assessing the impact of its supply chain and aims to implement an integrated and comprehensive policy across the Group.
Relationship with Community Significant Impacts on Local Communities This disclosure is not material to GT Capital as per materiality process. Operations with significant (positive or negative) impacts on local communities (exclude CSR projects; this has to be
Location Vulnerable groups (if applicable)*
Does the particular operation have impacts on indigenous people (Y/N)?
Collective or individual rights that have been identified that or particular concern for the community
Mitigating measures (if negative) or enhancement measures (if positive)
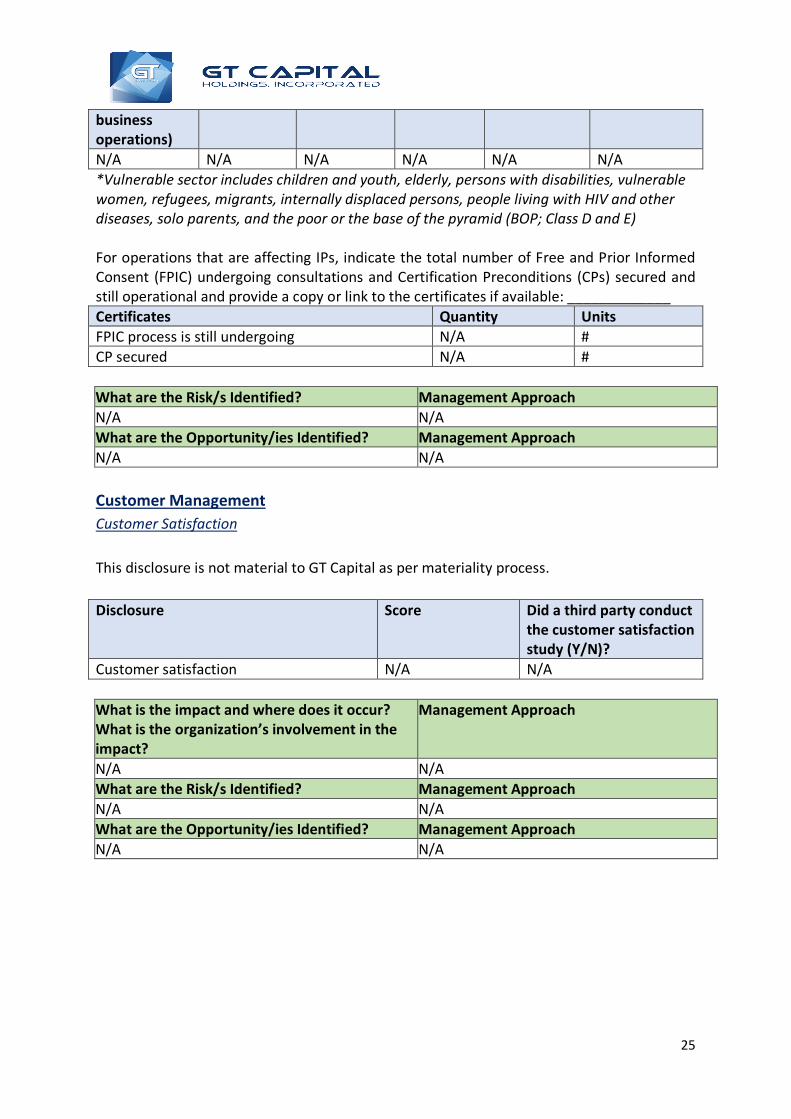
25
business operations) N/A N/A N/A N/A N/A N/A *Vulnerable sector includes children and youth, elderly, persons with disabilities, vulnerable women, refugees, migrants, internally displaced persons, people living with HIV and other diseases, solo parents, and the poor or the base of the pyramid (BOP; Class D and E) For operations that are affecting IPs, indicate the total number of Free and Prior Informed Consent (FPIC) undergoing consultations and Certification Preconditions (CPs) secured and still operational and provide a copy or link to the certificates if available: _____________ Certificates Quantity Units FPIC process is still undergoing N/A # CP secured N/A # What are the Risk/s Identified? Management Approach N/A N/A What are the Opportunity/ies Identified? Management Approach N/A N/A Customer Management Customer Satisfaction This disclosure is not material to GT Capital as per materiality process. Disclosure Score Did a third party conduct
the customer satisfaction study (Y/N)?
Customer satisfaction N/A N/A What is the impact and where does it occur? What is the organization’s involvement in the impact?
Management Approach
N/A N/A What are the Risk/s Identified? Management Approach N/A N/A What are the Opportunity/ies Identified? Management Approach N/A N/A
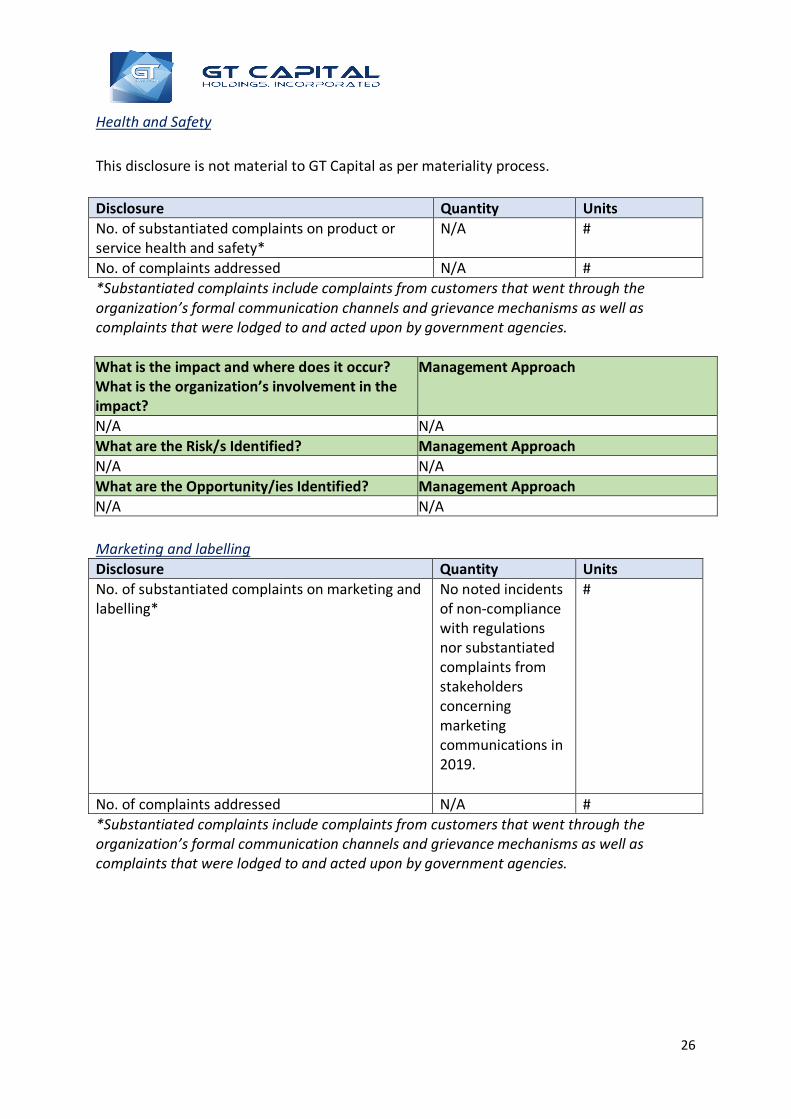
26
Health and Safety This disclosure is not material to GT Capital as per materiality process. Disclosure Quantity Units No. of substantiated complaints on product or service health and safety*
N/A #
No. of complaints addressed N/A # *Substantiated complaints include complaints from customers that went through the organization’s formal communication channels and grievance mechanisms as well as complaints that were lodged to and acted upon by government agencies. What is the impact and where does it occur? What is the organization’s involvement in the impact?
Management Approach
N/A N/A What are the Risk/s Identified? Management Approach N/A N/A What are the Opportunity/ies Identified? Management Approach N/A N/A Marketing and labelling Disclosure Quantity Units No. of substantiated complaints on marketing and labelling*
No noted incidents of non-compliance with regulations nor substantiated complaints from stakeholders concerning marketing communications in 2019.
#
No. of complaints addressed N/A # *Substantiated complaints include complaints from customers that went through the organization’s formal communication channels and grievance mechanisms as well as complaints that were lodged to and acted upon by government agencies.
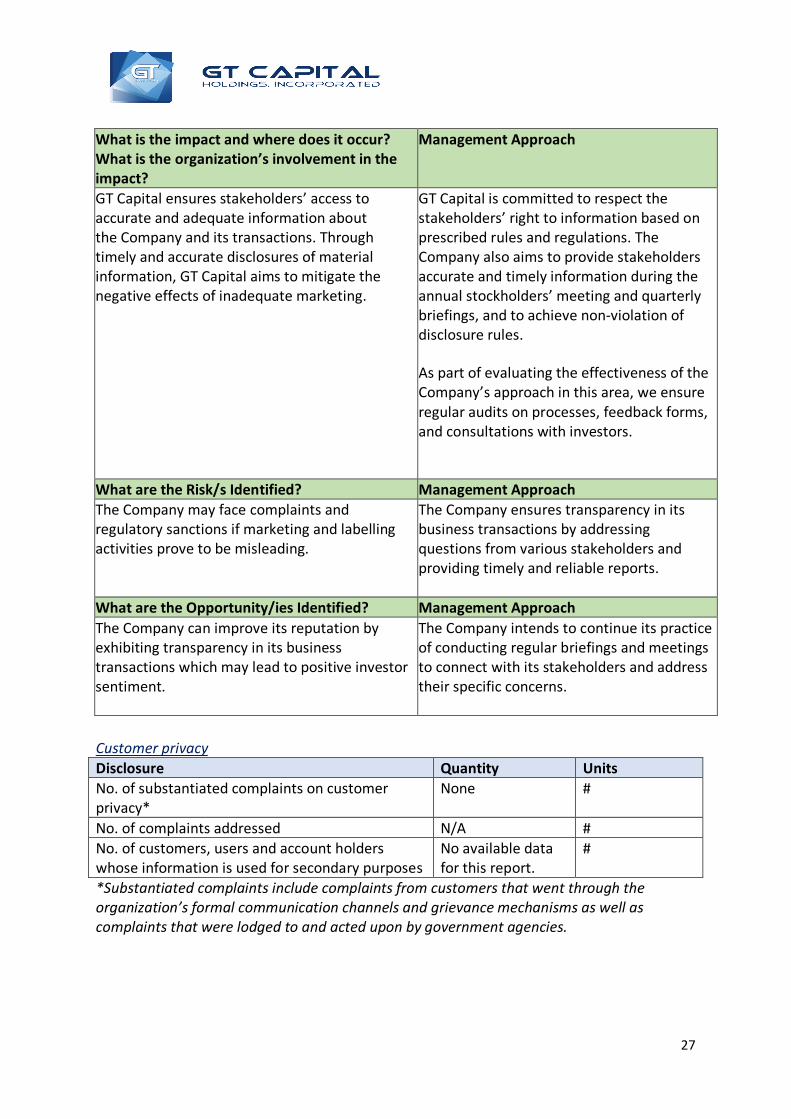
27
What is the impact and where does it occur? What is the organization’s involvement in the impact?
Management Approach
GT Capital ensures stakeholders’ access to accurate and adequate information about the Company and its transactions. Through timely and accurate disclosures of material information, GT Capital aims to mitigate the negative effects of inadequate marketing.
GT Capital is committed to respect the stakeholders’ right to information based on prescribed rules and regulations. The Company also aims to provide stakeholders accurate and timely information during the annual stockholders’ meeting and quarterly briefings, and to achieve non-violation of disclosure rules.
As part of evaluating the effectiveness of the Company’s approach in this area, we ensure regular audits on processes, feedback forms, and consultations with investors.
What are the Risk/s Identified? Management Approach The Company may face complaints and regulatory sanctions if marketing and labelling activities prove to be misleading.
The Company ensures transparency in its business transactions by addressing questions from various stakeholders and providing timely and reliable reports.
What are the Opportunity/ies Identified? Management Approach The Company can improve its reputation by exhibiting transparency in its business transactions which may lead to positive investor sentiment.
The Company intends to continue its practice of conducting regular briefings and meetings to connect with its stakeholders and address their specific concerns.
Customer privacy Disclosure Quantity Units No. of substantiated complaints on customer privacy*
None #
No. of complaints addressed N/A # No. of customers, users and account holders whose information is used for secondary purposes
No available data for this report.
#
*Substantiated complaints include complaints from customers that went through the organization’s formal communication channels and grievance mechanisms as well as complaints that were lodged to and acted upon by government agencies.
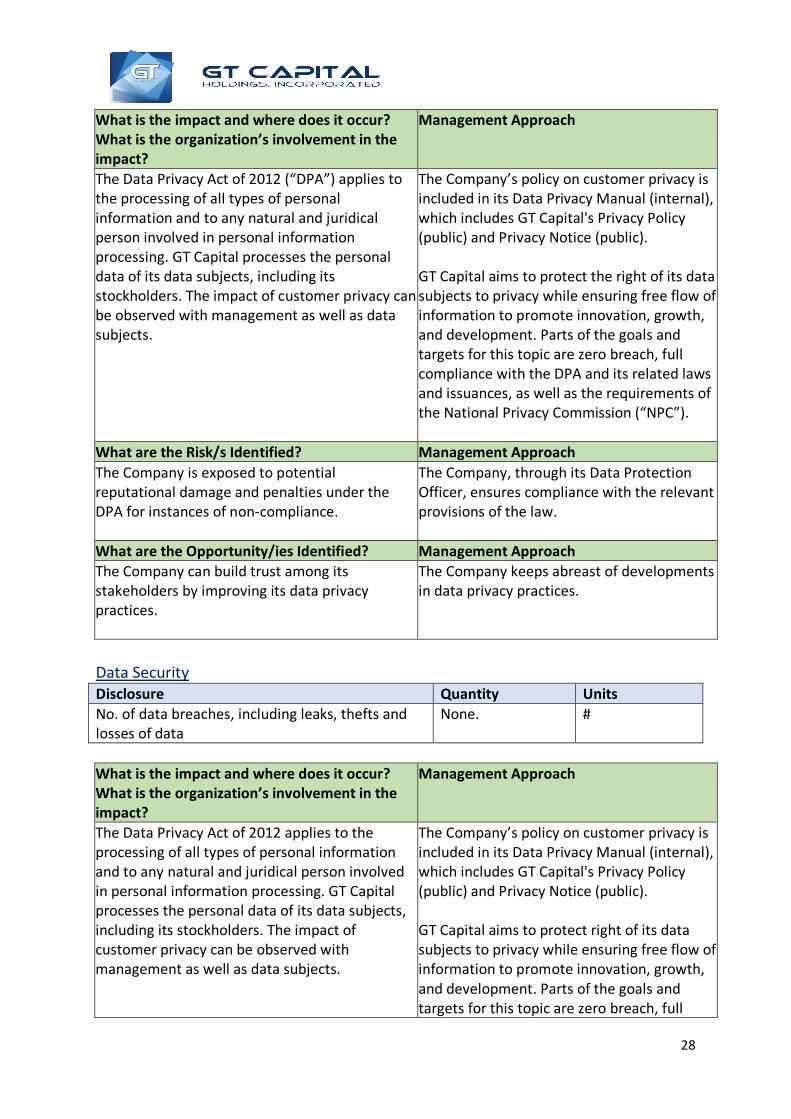
28
What is the impact and where does it occur? What is the organization’s involvement in the impact?
Management Approach
The Data Privacy Act of 2012 (“DPA”) applies to the processing of all types of personal information and to any natural and juridical person involved in personal information processing. GT Capital processes the personal data of its data subjects, including its stockholders. The impact of customer privacy can be observed with management as well as data subjects.
The Company’s policy on customer privacy is included in its Data Privacy Manual (internal), which includes GT Capital's Privacy Policy (public) and Privacy Notice (public). GT Capital aims to protect the right of its data subjects to privacy while ensuring free flow of information to promote innovation, growth, and development. Parts of the goals and targets for this topic are zero breach, full compliance with the DPA and its related laws and issuances, as well as the requirements of the National Privacy Commission (“NPC”).
What are the Risk/s Identified? Management Approach The Company is exposed to potential reputational damage and penalties under the DPA for instances of non-compliance.
The Company, through its Data Protection Officer, ensures compliance with the relevant provisions of the law.
What are the Opportunity/ies Identified? Management Approach The Company can build trust among its stakeholders by improving its data privacy practices.
The Company keeps abreast of developments in data privacy practices.
Data Security Disclosure Quantity Units No. of data breaches, including leaks, thefts and losses of data
None. #
What is the impact and where does it occur? What is the organization’s involvement in the impact?
Management Approach
The Data Privacy Act of 2012 applies to the processing of all types of personal information and to any natural and juridical person involved in personal information processing. GT Capital processes the personal data of its data subjects, including its stockholders. The impact of customer privacy can be observed with management as well as data subjects.
The Company’s policy on customer privacy is included in its Data Privacy Manual (internal), which includes GT Capital's Privacy Policy (public) and Privacy Notice (public). GT Capital aims to protect right of its data subjects to privacy while ensuring free flow of information to promote innovation, growth, and development. Parts of the goals and targets for this topic are zero breach, full
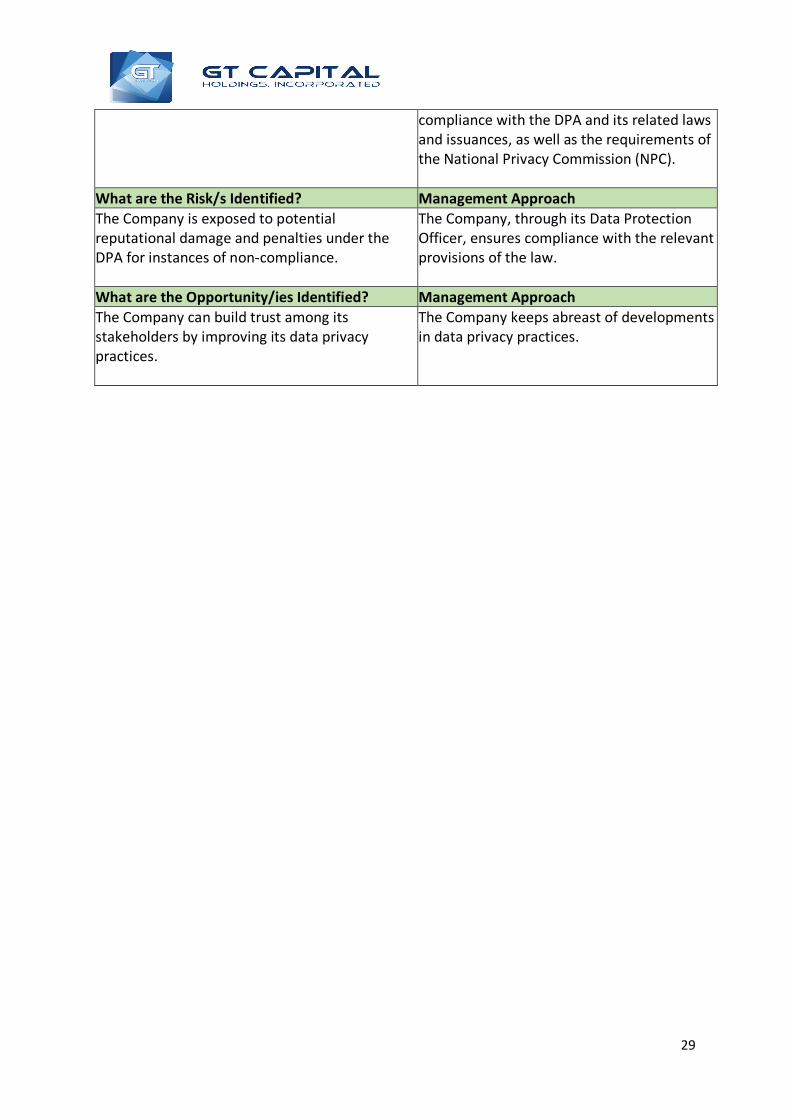
29
compliance with the DPA and its related laws and issuances, as well as the requirements of the National Privacy Commission (NPC).
What are the Risk/s Identified? Management Approach The Company is exposed to potential reputational damage and penalties under the DPA for instances of non-compliance.
The Company, through its Data Protection Officer, ensures compliance with the relevant provisions of the law.
What are the Opportunity/ies Identified? Management Approach The Company can build trust among its stakeholders by improving its data privacy practices.
The Company keeps abreast of developments in data privacy practices.
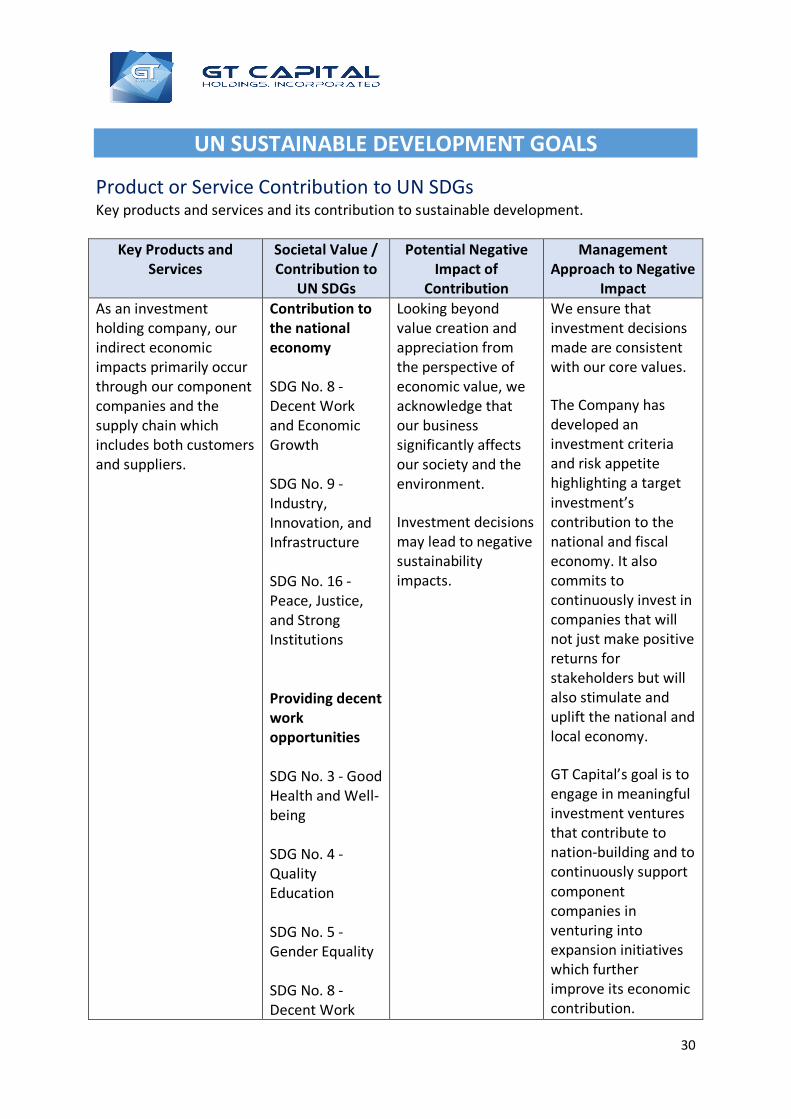
30
UN SUSTAINABLE DEVELOPMENT GOALS
Product or Service Contribution to UN SDGs Key products and services and its contribution to sustainable development.
Key Products and Services
Societal Value / Contribution to
UN SDGs
Potential Negative Impact of
Contribution
Management Approach to Negative
Impact As an investment holding company, our indirect economic impacts primarily occur through our component companies and the supply chain which includes both customers and suppliers.
Contribution to the national economy SDG No. 8 - Decent Work and Economic Growth SDG No. 9 - Industry, Innovation, and Infrastructure SDG No. 16 - Peace, Justice, and Strong Institutions Providing decent work opportunities SDG No. 3 - Good Health and Well-being SDG No. 4 - Quality Education SDG No. 5 - Gender Equality SDG No. 8 - Decent Work
Looking beyond value creation and appreciation from the perspective of economic value, we acknowledge that our business significantly affects our society and the environment.
Investment decisions may lead to negative sustainability impacts.
We ensure that investment decisions made are consistent with our core values.
The Company has developed an investment criteria and risk appetite highlighting a target investment’s contribution to the national and fiscal economy. It also commits to continuously invest in companies that will not just make positive returns for stakeholders but will also stimulate and uplift the national and local economy.
GT Capital’s goal is to engage in meaningful investment ventures that contribute to nation-building and to continuously support component companies in venturing into expansion initiatives which further improve its economic contribution.
31
and Economic Growth SDG No. 10 - Reduced Inequalities SDG No. 16 - Peace, Justice, and Strong Institutions