coupled heat and moisture transport in concrete at elevated temperatures---effects of capillary...
TRANSCRIPT
Pre-print version Final Article published in: Numerical Heat Transfer, Part A, 49: 733–763, 2006 ISSN: 1040-7782 print=1521-0634 online DOI: 10.1080/10407780500503854
2
COUPLED HEAT AND MOISTURE TRANSPORT IN CONCRETE AT ELEVATED
TEMPERATURES - EFFECTS OF CAPILLARY PRESSURE AND ADSORBED WATER
Colin T. Davie †, Chris J. Pearce ‡ and Nenad Bićanić‡
†School of Civil Engineering and Geosciences, University of Newcastle
‡Department of Civil Engineering, University of Glasgow
Mailing Address:
School of Civil Engineering and Geosciences
School Office: Drummond Building
University of Newcastle
Newcastle upon Tyne
NE1 7RU
UK
Abbreviated Title:
COUPLED HEAT AND MOISTURE TRANSPORT IN CONCRETE
3
Abstract
The importance of capillary pressure and adsorbed water in the behaviour of heat and moisture
transport in concrete exposed to high temperatures is explored by incorporating their behaviour
explicitly into a computational model. The inclusion of these two phenomena is realised with a
formulation of a modified model, which represents an extension to the significant work of Tenchev et
al. Comparative studies were carried out, using a benchmark problem, and it was determined that,
while the Tenchev formulation under estimated the capacity for fluid transport in the concrete
resulting in an over prediction of pore pressures (which may affect the prediction of mechanical
damage and spalling), the inclusion of capillary pressure had little effect on the results. More
important was the accurate representation of the free water flux, which has a significant effect on the
prediction of vapour content and subsequently pore pressure. It was furthermore found that, while the
adsorbed water flux may be minimal when concrete is exposed to high temperature, its presence has a
significant effect on the fluid transport behaviour and the prediction of pore pressures.
4
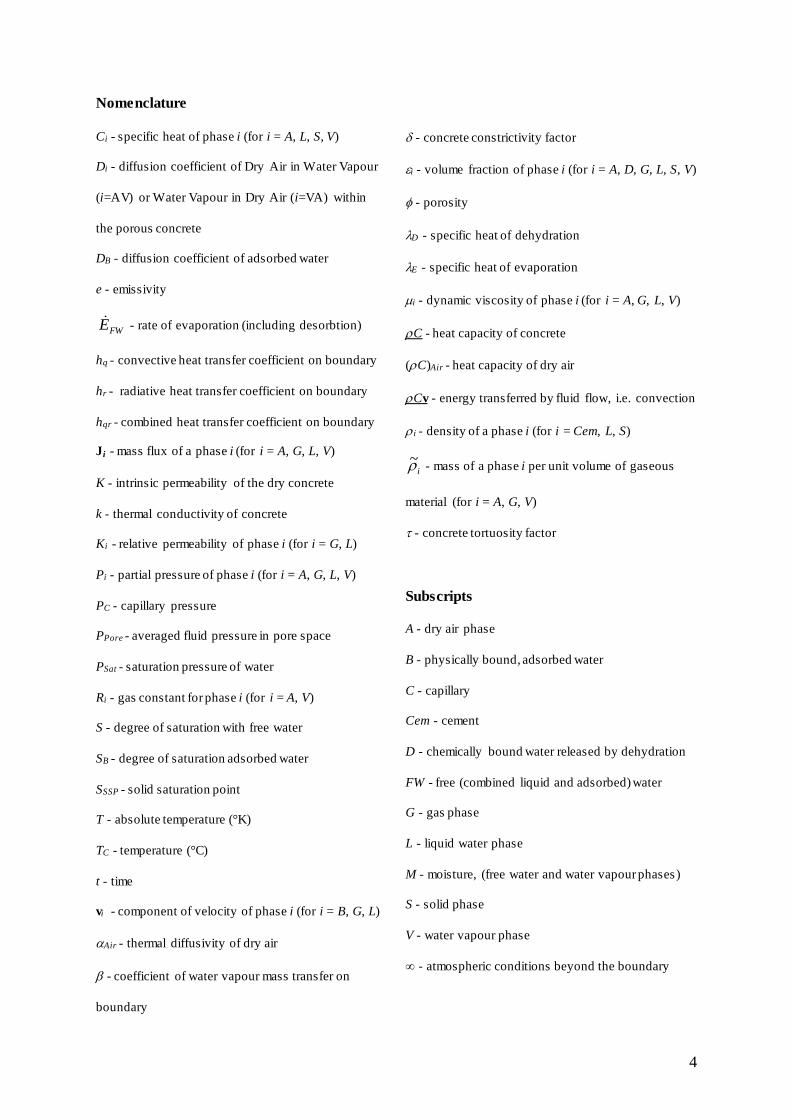
Nomenclature
Ci - specific heat of phase i (for i = A, L, S, V)
Di - diffusion coefficient of Dry Air in Water Vapour
(i=AV) or Water Vapour in Dry Air (i=VA) within
the porous concrete
DB - diffusion coefficient of adsorbed water
e - emissivity
FWE - rate of evaporation (including desorbtion)
hq - convective heat transfer coefficient on boundary
hr - radiative heat transfer coefficient on boundary
hqr - combined heat transfer coefficient on boundary
Ji - mass flux of a phase i (for i = A, G, L, V)
K - intrinsic permeability of the dry concrete
k - thermal conductivity of concrete
Ki - relative permeability of phase i (for i = G, L)
Pi - partial pressure of phase i (for i = A, G, L, V)
PC - capillary pressure
PPore - averaged fluid pressure in pore space
PSat - saturation pressure of water
Ri - gas constant for phase i (for i = A, V)
S - degree of saturation with free water
SB - degree of saturation adsorbed water
SSSP - solid saturation point
T - absolute temperature (°K)
TC - temperature (°C)
t - time
vi - component of velocity of phase i (for i = B, G, L)
Air - thermal diffusivity of dry air
- coefficient of water vapour mass transfer on
boundary
- concrete constrictivity factor
i- volume fraction of phase i (for i = A, D, G, L, S, V)
- porosity
D - specific heat of dehydration
E - specific heat of evaporation
i - dynamic viscosity of phase i (for i = A, G, L, V)
C - heat capacity of concrete
(C)Air - heat capacity of dry air
Cv - energy transferred by fluid flow, i.e. convection
i - density of a phase i (for i = Cem, L, S)
i~
- mass of a phase i per unit volume of gaseous
material (for i = A, G, V)
- concrete tortuosity factor
Subscripts
A - dry air phase
B - physically bound, adsorbed water
C - capillary
Cem - cement
D - chemically bound water released by dehydration
FW - free (combined liquid and adsorbed) water
G - gas phase
L - liquid water phase
M - moisture, (free water and water vapour phases)
S - solid phase
V - water vapour phase
∞ - atmospheric conditions beyond the boundary
5
1. Introduction and Scope
Although, for many years concrete has been one of the most widely used and well understood
construction materials, in the light of recent extreme events, including accidents, arson and terrorism,
its performance when exposed to high temperature has come to the forefront of interest for both
industry and research. These events and recent research work have highlighted the lack of a full
understanding of how concrete behaves under rapid thermal loading. For example, the Channel
Tunnel fire in 1996 illustrated the structural, safety and economic consequences of a 10-hour fire that
reached temperatures of 700oC, when thermal spalling of the concrete liner resulted in severe
structural damage over a significant length of the tunnel [1]. After subsequent investigations, no real
consensus emerged as to the exact mechanisms underlying the observed spalling phenomenon.
However, full consensus exists that the behaviour of concrete under exposure to high
temperatures is greatly dependent on its composite structure and in particular on the physical and
chemical composition of the cement paste. The hardened cement paste is a highly porous,
hygroscopic material, the volume of which comprises approximately 28% gel pores (i.e. pores ≤
2.6nm in diameter) and up to 40% capillary pores (i.e. pores in the range of 1m in diameter) [2]. At
room temperature, the pores may be fully or partially filled with fluids typically including liquid
water, water vapour and dry air. Furthermore, within the gel pores and on the surfaces of the capillary
pores, the water exists as adsorbed water, physically bound to the solid, and as such does not behave
as a liquid. The solid skeleton of the paste itself is composed of various chemical compounds and
chemically bound water.
When exposed to high temperature, heat is conducted and convected through the material,
resulting in changes in the chemical composition, physical structure and fluid content of the cement
paste which in turn affect the overall mechanical (strength, stiffness, fracture energy, etc.) and other
physical properties (thermal conductivity, permeability, porosity, etc.) of the concrete.
In order to construct an appropriate mathematical model for concrete subject to thermal
loading all of these (mostly non-linear) phenomena and their coupled interactions must be considered.
Such a model is therefore very complex. To model the changes in fluid content alone, both pressure
driven flow and diffusion must be considered for all fluids present, along with evaporation and
6
condensation phase changes. Despite these difficulties, much work has previously been conducted in
this area and several models have been developed, including important contributions by Coussy [3],
Gawin et al. [4] and Lewis & Schrefler [5].
The starting point for this work represents a significant, albeit less well known, model for the
coupled transfer of heat and moisture in concrete clearly elucidated in Tenchev et al. [6] and
formulated in the context of coupled Finite Element analysis (subsequently referred to here as the
Tenchev Model). This model, while quite comprehensive and fully generalised for 3-dimensional
analysis, includes several assumptions and restrictions which warrant further attention, while
excluding various phenomena that may be vital for a more detailed analysis of the transport
phenomena within concrete exposed to high temperature. This work focuses on the treatment of two
important aspects - capillary pressure phenomena and adsorbed water. These phenomena may be of
particular relevance if the hygro-thermal model is also coupled with mechanical behaviour. Moreover
this work will not consider any implications associated with other specific constitutive relationships
employed in the original Tenchev Model.
As far as capillary pressure is concerned, the Tenchev Model is not completely consistent.
The model assumes that the pressures of the liquid and gases contained in the pores, both of which
have a significant influence on the fluid transport behaviour, are equal, i.e. PG = PL, at all times. Since
capillary pressure is defined as, PC = PG - PL, the difference between the gas and the liquid pressures,
the statement PG = PL is only physically correct when there is no capillary pressure. Moreover,
following from the Kelvin Equation, the capillary pressure is also related to the relative humidity and,
for thermodynamic equilibrium, the constraint PG = PL implies a relative humidity of 100%. Since the
relative humidity can vary considerably from 100% when concrete is exposed to high temperatures,
PL would vary considerably from PG and it is uncertain to what extent the adopted constraint is a valid
approximation. No further evidence or justification is given in [6] in support of this approximation.
Instead, in order to account for the effects of capillary pressure on the transport behaviour the
Tenchev Model adopts a fixed relative permeability of the liquid phase, KL=0.01. This is clearly not
consistent with the previous assumptions discussed above since, while the reduction of KL may to
some extent simulate the reduction in transport that would be caused by capillary suction, the choice
7
of this particular value seems arbitrary and it is difficult to justify the fact that it is assumed constant
when relative humidity, and therefore capillary pressure, is seen to vary.
Moreover, the Tenchev Model ignores the diffusion of adsorbed water on the assumption that
its flux is negligible. Again no supporting statements are made and furthermore, no other behaviour
relating to the presence of water in an adsorbed state rather than in liquid form is considered. Given
the very large internal surface area of hardened cement paste (~500m2 per cm3 [7]) and its high gel
pore content, a very large proportion (up to 50-60% at room temperature) of the free water content in
the concrete exists as adsorbed water [4]. Therefore, although the flux may be low, the presence of
adsorbed water can be a significant factor when considering the overall transport of moisture in
concrete. Furthermore, as will be shown, this has implications for the evolution of capillary pressure.
Following a brief review of the Tenchev Model, a modified model is proposed which
accounts explicitly for capillary pressure and part of the free water existing in an adsorbed state. The
results of a Finite Element study of the effects of the phenomena described above on heat and
moisture transfer in concrete subjected to high temperatures predicted by the Modified Model were
then compared with those of the Tenchev Model. The aim was to determine the importance of
capillary pressure and adsorbed water in the development of fluid transport behaviour in concrete
exposed to intense heating, as well as to assess the adequacy of the modelling assumptions and
constraints made in the Tenchev Model.
To ensure the validity of the study and that the effects on the results were solely related to the
modified consideration of capillary pressure and adsorbed water, all other constituent parts of the
Modified Model, as well as the values of all material parameters and relationships, were unchanged
compared those employed in the Tenchev Model.
2. Mathematical Model
In the following description of the model formulation, the nomenclature and style adopted by Tenchev
et al. [6] have been followed as closely as possible and extended where required to include capillary
pressure and adsorbed water effects. In order to allow for such generalisations, the subscript L,
employed by Tenchev to represent liquid water, has been replaced where appropriate with FW to
8
signify free water, which consists of both liquid water and, in certain cases, adsorbed water. It may
also be noted that, in order to allow complete freedom for model development, all phase contents are
described in terms of volume fractions and densities, i i, rather then the ‘mass per volume concrete’,
i , as used by Tenchev et al.
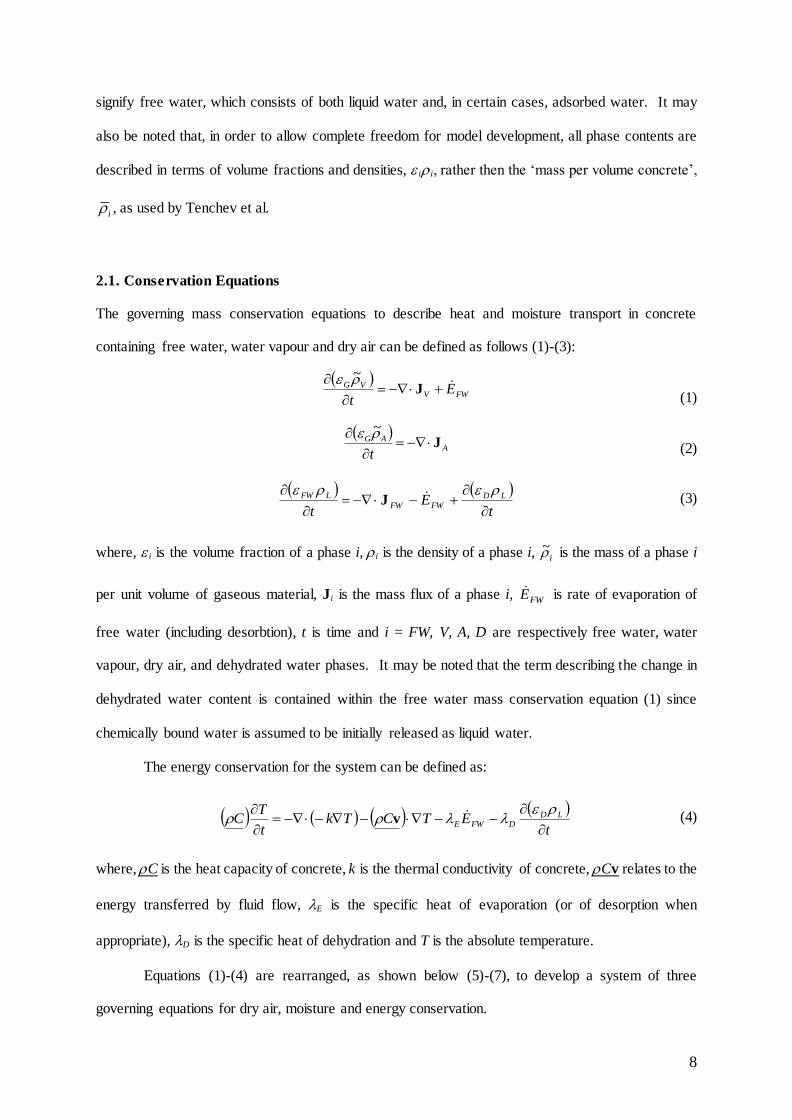
2.1. Conservation Equations
The governing mass conservation equations to describe heat and moisture transport in concrete
containing free water, water vapour and dry air can be defined as follows (1)-(3):
(1)
(2)
(3)
where, iis the volume fraction of a phase i, i is the density of a phase i, i~ is the mass of a phase i
per unit volume of gaseous material, Ji is the mass flux of a phase i, FWE is rate of evaporation of
free water (including desorbtion), t is time and i = FW, V, A, D are respectively free water, water
vapour, dry air, and dehydrated water phases. It may be noted that the term describing the change in
dehydrated water content is contained within the free water mass conservation equation (1) since
chemically bound water is assumed to be initially released as liquid water.
The energy conservation for the system can be defined as:
(4)
where, C is the heat capacity of concrete, k is the thermal conductivity of concrete, Cv relates to the
energy transferred by fluid flow, E is the specific heat of evaporation (or of desorption when
appropriate), D is the specific heat of dehydration and T is the absolute temperature.
Equations (1)-(4) are rearranged, as shown below (5)-(7), to develop a system of three
governing equations for dry air, moisture and energy conservation.
t
Et
LD
FWFW
LFW
J
FWV
VG Et
J
~
A
AG
tJ
~
t
ETCTkt
TC LD
DFWE
v
9
(5)
(6)
(7)
This formulation (1)-(7) is identical to that derived by Tenchev et al. [6], and is employed, unchanged
for all models discussed in the following sections.
2.2. Original Formulation of the Tenchev Model [6]
Constitutive Laws
This section reviews the constitutive laws derived for the Tenchev Model using the notation adopted
in this work. The mass fluxes of dry air, water vapour and free water can be expressed in terms of
pressure and concentration gradients assuming that Darcy’s and Fick’s laws are applicable and that
the diffusion of adsorbed water on the surface of the solid cement paste skeleton is negligible (8)-(10).
(8)
(9)
(10)
where, DAV and DVA are respectively the diffusion coefficients of dry air in water vapour and water
vapour in dry air within the porous concrete (which are subsequently assumed to be equal [8]), and vG
and vL are the velocities of the gas and liquid water phases resulting from pressure driven flow as
given below by Darcy’s law (11) & (12)
(11)
(12)
where, K is the intrinsic permeability of the dry concrete, KG & KL are the relative permeabilities of
the gas and liquid phases, G & L are their dynamic viscosities and PG & PL are the corresponding
G
AAVGGGAGA D
~
~~~ vJ
G
VVAGGGVGV D
~
~~~ vJ
LLFWFW vJ
G
G
GG P
KK
v
L
L
LL P
KK
v
FWV
LDLFWVG
tttJJ
~
TCTk
ttt
TC FWE
LDED
LFWE
vJ
A
AG
tJ
~
10
pressures. As described earlier, for simplicity, the liquid pressure is, by Tenchev et al., assumed to be
equal to the gas pressure, PG = PL (see discussion regarding capillary pressure in the introduction),
and thus, equation (12) may be rewritten as:
(12a)
The dry air and water vapour are assumed to behave as ideal gases (13) and their pressures and partial
densities are considered to be additive as defined by Dalton’s law [8] (14):
(13)
(14)
where, PA & PV are the pressures and RA & RV the gas constants of the dry air and water vapour [8].
For temperatures below the critical point of water (374.14°C), the volume fraction of free
water in the concrete is determined from Sorption Isotherms, as defined by Bažant and Kaplan [9],
which relate the free water content to the cement content of the concrete and the relative humidity and
temperature in the pores (15).
(15)
where, CemCem is the cement content per unit volume of concrete, PSat is the saturation pressure of
water vapour and (PV /PSat) is the relative humidity (See AI.33 in Appendix I). For temperatures
above the critical point for water, where liquid water cannot exist, PSat is undefined, and the free water
content is taken as zero.
The gas volume fraction can then be determined from equation (16) below:
(16)
where, is the concrete porosity.
Finally, the term describing energy transport by fluid flow ( TC v in (7)) is neglected
since it is assumed that the transfer of energy by convection is accounted for within the relationship
for the thermal conductivity of concrete, k , which has been determined empirically for wet concrete.
In addition to the thermal conductivity, k , there are further parameters that occur in the above
formulation which are interdependent and typically functions of temperature. The specific
TRP AAA ~
VAG PPP VAG ~~~
GFW
T
P
Pf
Sat
V
L
CemCemFW ,
G
L
LL P
KK
v
TRP VVV ~
11
relationships used both in this work, as well as in Tenchev et al. [6], are listed in full in Appendix I.
While it is clear that some of these may be considered oversimplified, the specific nature of the
relationships employed does not affect the overall formulation of the models and it does not affect the
model extension which will be introduced in Section 2.3. It is however noted that certain physical
parameters critical to the transport behaviour, such as the intrinsic permeability and porosity of the
concrete, as well as the proportional volumes of chemically bound water, free water and water vapour,
are heavily interrelated and furthermore that they are strongly dependent on the initial water/cement
ratio of the concrete mix. In that context, it is not certain whether the values of the parameters
employed by Tenchev et al. [6] were fully consistent with one another or with a particular
water/cement ratio. Nonetheless, in order to conduct a valid comparison of the suggested
modification with the original Tenchev Model the same reported parameters and values were utilised.
It was therefore tacitly assumed that the values and temperature dependent formulations for porosity,
, intrinsic permeability, K, and the saturation free water content†, FW0L
0, were consistent for the
concrete under investigation.
Numerical Model - Differential Equations
From the governing equations (5)-(7) a system of coupled differential equations can be developed,
with reference to an appropriate choice of primary variables, leading to (17):
(17)
The chosen set of primary variables in the Tenchev Model was (18):
(18)
After extensive algebraic manipulation, the system of governing differential equations can be written
in the form below (19)-(21).
(19)
(20)
† The saturation free water content, referred to by Tenchev et al. as the ‘initial water content’, represents the free
water content in the concrete when thermodynamic equilibrium is reached at 100% relative humidity. It is used
in the model formulation to define Bažant’s Sorption Isotherms (See equations (15) and (AI.33)).
VTVGTPTTV
TVG
TPTT KPKTKt
Ct
PC
t
TC
~~
T~VGPT u
VAVGAPATV
AVG
APAT KPKTKt
Ct
PC
t
TC
~~
0 uKuC
12
(21)
where,
(22)
(23)
(24)
(25)
(26)
(27)
These differential equations can then be solved using a standard finite element formulation as
described in the sections below. It should be noted that fundamental to the formulation given above
are the assumptions that the diffusion of dry air in water vapour is equal to the diffusion of water
vapour in dry air, DAV = DVA, and that the liquid pressure is equal to gas pressure, PL = PG. Full
derivations for all of the matrix components can be found in the original paper by Tenchev et al. [6].
2.3. Extended Formulation - The Modified Model
Constitutive Laws
As discussed earlier, the formulation for the Tenchev Model is here modified and extended in order to
explicitly consider two potentially significant effects - capillary pressure and physically bound,
adsorbed water. This required the modification of the free water flux equation (10), whilst the
remaining constitutive laws (8)-(16) were unchanged from the Tenchev Model.
Similarly to the work of Gawin et al. [4], the free water is separated into liquid and adsorbed
water components, whereby the former is subject to pressure driven flow and the latter diffuses due to
a concentration gradient. It is assumed that moisture entering a dry sample of concrete will initially
fill the gel pores and adhere to the surface of capillary pores as adsorbed water, up to a maximum
;~
~
2TR
PDK
AG
GVAVGAT
;
TTTTCC FW
LL
LED
LL
DEDTT
;~~
TTTTC D
LFW
VLL
DFWVMT
;0TPCV
FWLETVC
~
VMVGMPMTV
MVG
MPMT KPKTKt
Ct
PC
t
TC
~~
;0MPC V
FWVLGMVC
~~
;kKTT ;L
LLFWETP
KKK
0TVK
;~
~~
TR
DKKK
AG
VAVGAG
G
GAP
V
A
VA
G
AVGAV
R
RDK
~~~
;~
~
2TR
PDK
AG
GVAVGMT
;~
~~
L
LLFW
AG
VAVGVG
G
GMP
KK
TR
DKKK
V
A
VA
G
AVGMV
R
RDK
~~~
;~2TR
P
TTC
A
GGFWAAT
;
TRC
A
GAP
V
FWA
A
VGAV
R
RC
~
~
13
volume, before the remaining capillary pore space fills with liquid water. An analogous process is
also assumed to occur in reverse during drying.
The degree of saturation with free water can therefore be described in terms of the free water
volume fraction, FW , and the porosity, , as given in (28):
(28)
and the degree of saturation with adsorbed water, SB, is given by (29):
(29)
where, SSSP is the solid saturation point, i.e. the upper limit of the hygroscopic moisture range and the
maximum degree of saturation with adsorbed water [4].
Thus, the free water mass flux equation (10) can be rewritten as (30):
(30)
vB being the velocity of the adsorbed water resulting from diffusion (31).
(31)
where, DB is the coefficient of adsorbed water diffusion [4].
vL is the velocity of the liquid phase resulting from pressure driven flow as given by Darcy’s
law (32).
(32)
Equation (32) is identical to equation (12) in the original model, but it is restated here to emphasise
that for the Modified Model the liquid pressure is not necessarily equal to the gas pressure, PL ≠ PG.
Instead, PL is calculated from equation (33) below.
(33)
where, PC is the capillary pressure.
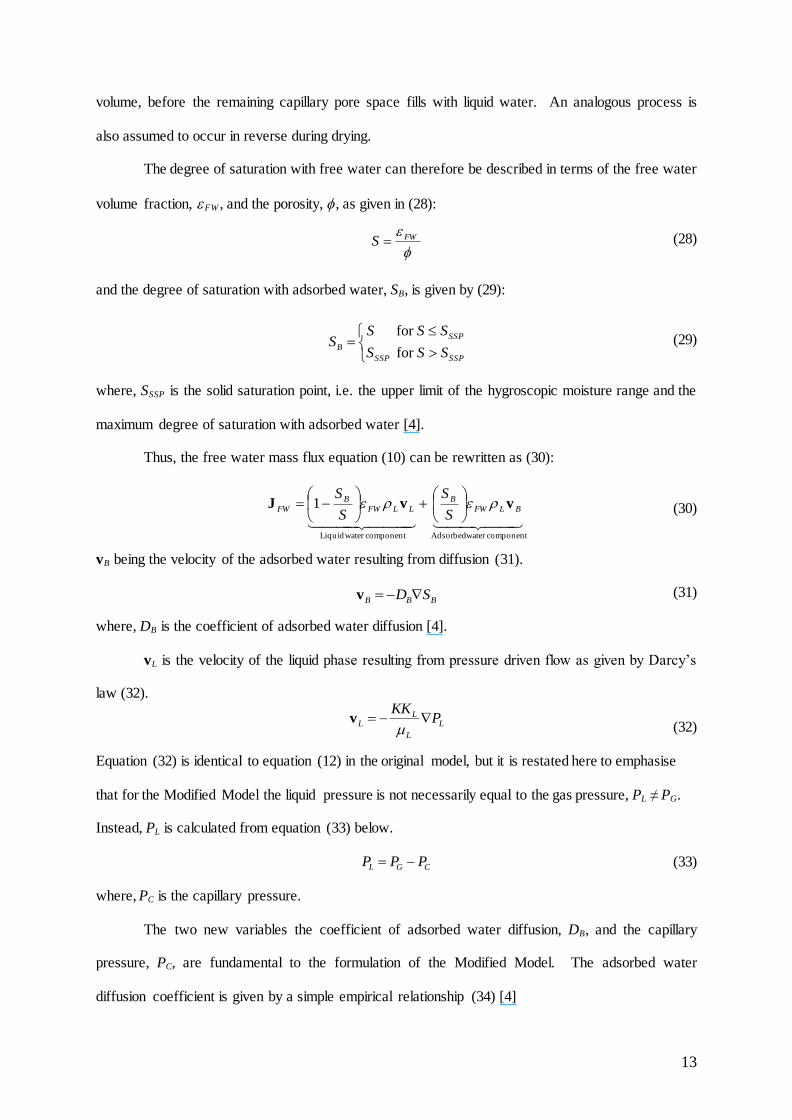
The two new variables the coefficient of adsorbed water diffusion, DB, and the capillary
pressure, PC, are fundamental to the formulation of the Modified Model. The adsorbed water
diffusion coefficient is given by a simple empirical relationship (34) [4]
BBB SD v
CGL PPP
FWS
SSPSSP
SSP
BSSS
SSSS
for
for
L
L
LL P
KK
v
component water Adsorbedcomponent water Liquid
1 BLFW
B
LLFW
B
FWS
S
S
SvvJ
14
(34)
and the capillary pressure is calculated via the Kelvin Equation (35).
(35)
Where no liquid water exists, i.e. for temperatures above the critical temperature for water and where
S ≤ SSSP, capillary pressures are not physically defined and PC is taken as zero.
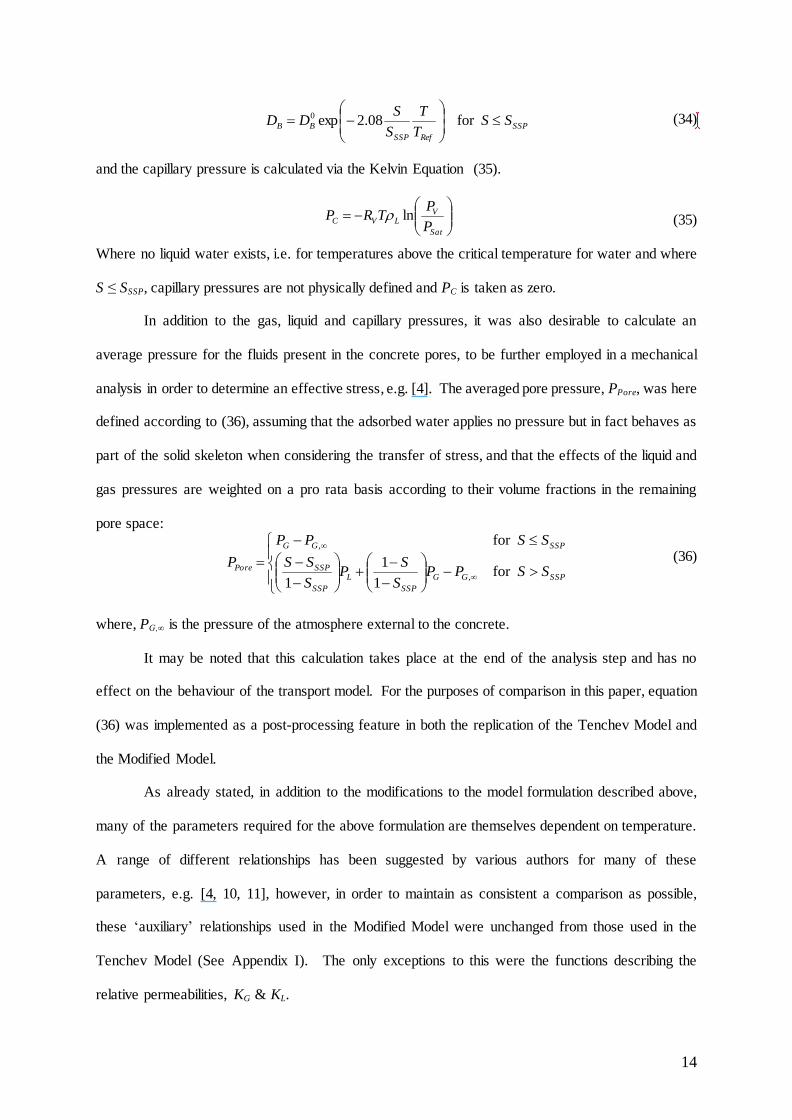
In addition to the gas, liquid and capillary pressures, it was also desirable to calculate an
average pressure for the fluids present in the concrete pores, to be further employed in a mechanical
analysis in order to determine an effective stress, e.g. [4]. The averaged pore pressure, PPore, was here
defined according to (36), assuming that the adsorbed water applies no pressure but in fact behaves as
part of the solid skeleton when considering the transfer of stress, and that the effects of the liquid and
gas pressures are weighted on a pro rata basis according to their volume fractions in the remaining
pore space:
(36)
where, PG,∞ is the pressure of the atmosphere external to the concrete.
It may be noted that this calculation takes place at the end of the analysis step and has no
effect on the behaviour of the transport model. For the purposes of comparison in this paper, equation
(36) was implemented as a post-processing feature in both the replication of the Tenchev Model and
the Modified Model.
As already stated, in addition to the modifications to the model formulation described above,
many of the parameters required for the above formulation are themselves dependent on temperature.
A range of different relationships has been suggested by various authors for many of these
parameters, e.g. [4, 10, 11], however, in order to maintain as consistent a comparison as possible,
these ‘auxiliary’ relationships used in the Modified Model were unchanged from those used in the
Tenchev Model (See Appendix I). The only exceptions to this were the functions describing the
relative permeabilities, KG & KL.
Sat
VLVC
P
PTRP ln
SSPGG
SSP
L
SSP
SSP
SSPGG
Pore SSPPS
SP
S
SS
SSPP
Pfor
1
1
1
for
,
,
SSP
RefSSP
BB SST
T
S
SDD
for 08.2exp0
15
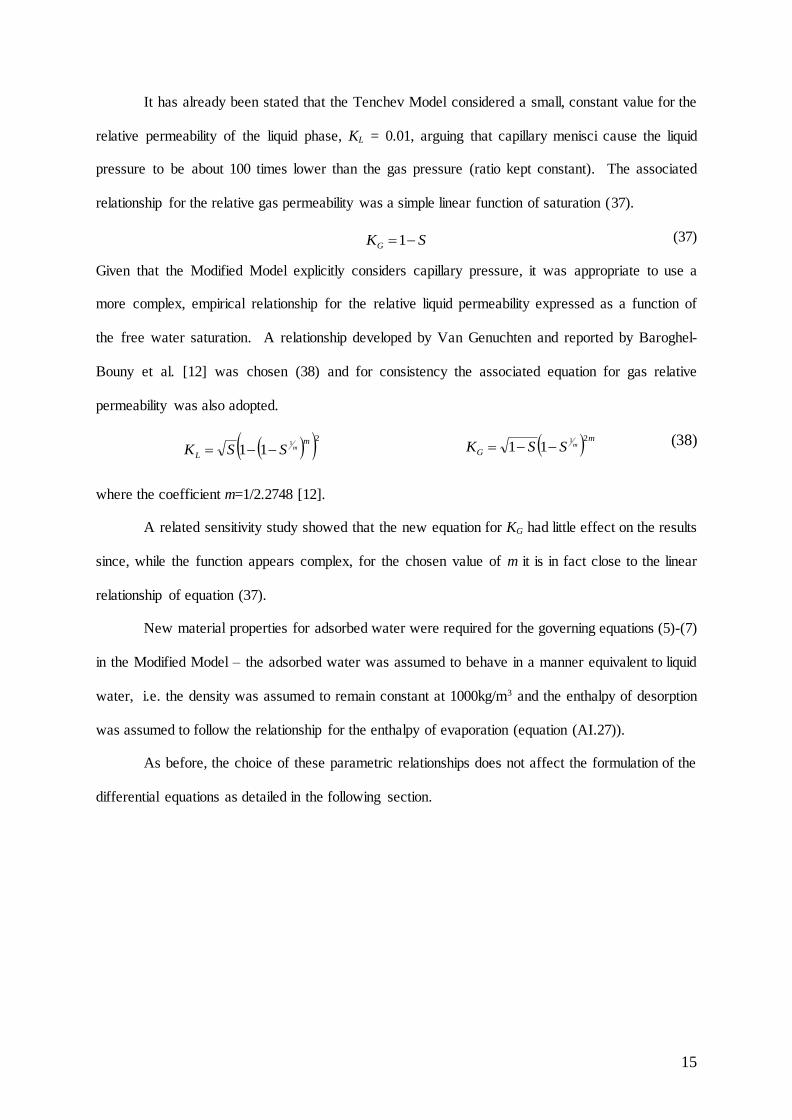
It has already been stated that the Tenchev Model considered a small, constant value for the
relative permeability of the liquid phase, KL = 0.01, arguing that capillary menisci cause the liquid
pressure to be about 100 times lower than the gas pressure (ratio kept constant). The associated
relationship for the relative gas permeability was a simple linear function of saturation (37).
(37)
Given that the Modified Model explicitly considers capillary pressure, it was appropriate to use a
more complex, empirical relationship for the relative liquid permeability expressed as a function of
the free water saturation. A relationship developed by Van Genuchten and reported by Baroghel-
Bouny et al. [12] was chosen (38) and for consistency the associated equation for gas relative
permeability was also adopted.
(38)
where the coefficient m=1/2.2748 [12].
A related sensitivity study showed that the new equation for KG had little effect on the results
since, while the function appears complex, for the chosen value of m it is in fact close to the linear
relationship of equation (37).
New material properties for adsorbed water were required for the governing equations (5)-(7)
in the Modified Model – the adsorbed water was assumed to behave in a manner equivalent to liquid
water, i.e. the density was assumed to remain constant at 1000kg/m3 and the enthalpy of desorption
was assumed to follow the relationship for the enthalpy of evaporation (equation (AI.27)).
As before, the choice of these parametric relationships does not affect the formulation of the
differential equations as detailed in the following section.
SKG 1
21
11m
LmSSK m
GmSSK
21
11
16
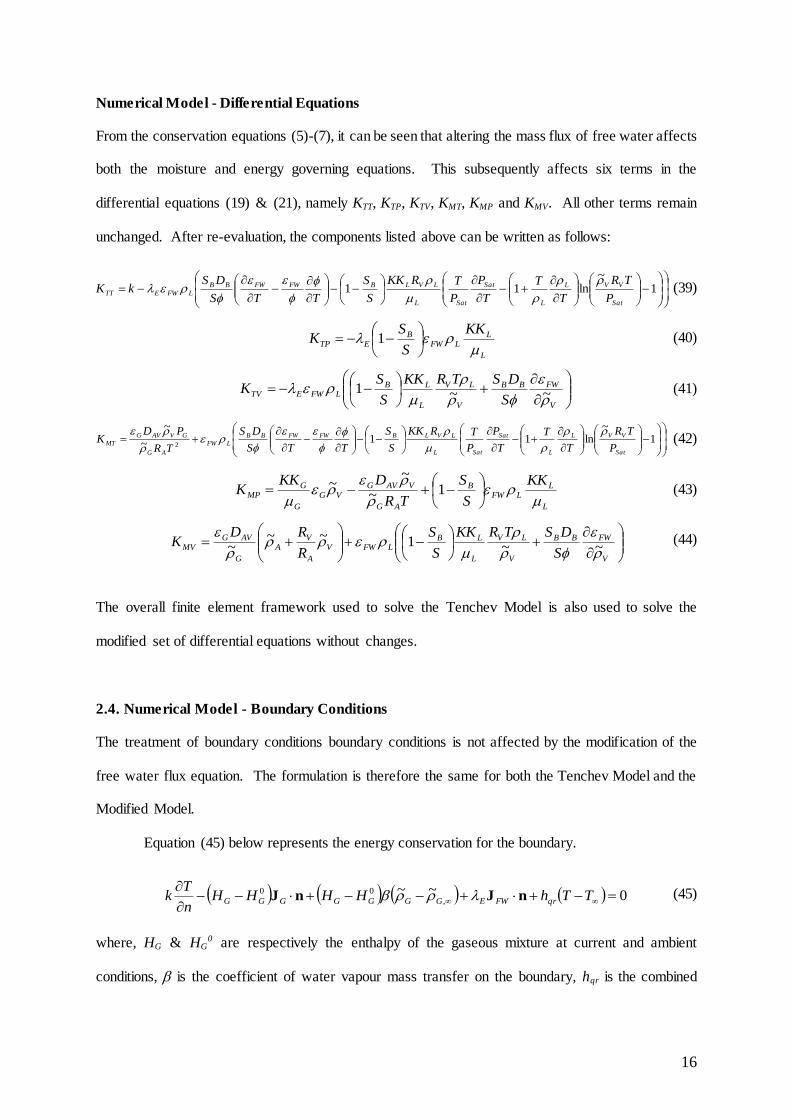
Numerical Model - Differential Equations
From the conservation equations (5)-(7), it can be seen that altering the mass flux of free water affects
both the moisture and energy governing equations. This subsequently affects six terms in the
differential equations (19) & (21), namely KTT, KTP, KTV, KMT, KMP and KMV. All other terms remain
unchanged. After re-evaluation, the components listed above can be written as follows:
(39)
(40)
(41)
(42)
(43)
(44)
The overall finite element framework used to solve the Tenchev Model is also used to solve the
modified set of differential equations without changes.
2.4. Numerical Model - Boundary Conditions
The treatment of boundary conditions boundary conditions is not affected by the modification of the
free water flux equation. The formulation is therefore the same for both the Tenchev Model and the
Modified Model.
Equation (45) below represents the energy conservation for the boundary.
(45)
where, HG & HG0 are respectively the enthalpy of the gaseous mixture at current and ambient
conditions, is the coefficient of water vapour mass transfer on the boundary, hqr is the combined
0~~,
00
TThHHHH
n
Tk qrFWEGGGGGGG nJnJ
1
~ln11
Sat
VVL
L
Sat
SatL
LVLBFWFWBB
LFWETTP
TR
T
T
T
P
P
TRKK
S
S
TTS
DSkK
L
LLFW
BETP
KK
S
SK
1
V
FWBB
V
LV
L
LBLFWETV
S
DSTRKK
S
SK
~~1
1
~ln11~
~
2Sat
VVL
L
Sat
SatL
LVLBFWFWBB
LFW
AG
GVAVG
MTP
TR
T
T
T
P
P
TRKK
S
S
TTS
DS
TR
PDK
L
LLFW
B
AG
VAVGVG
G
GMP
KK
S
S
TR
DKKK
1~
~~
V
FWBB
V
LV
L
LBLFWV
A
VA
G
AVGMV
S
DSTRKK
S
S
R
RDK
~~1~~
~
17
convection and radiation heat transfer coefficient on the boundary, G,~ & T∞ are the vapour content
and temperature of the atmosphere and n is the vector normal to the boundary.
The flux of gaseous material transferred to the boundary from inside the concrete must equal
the gaseous material dissipated into the atmosphere from the boundary. Hence, the mass conservation
for the gaseous mixture on the boundary can be written as (46):
(46)
It may also be assumed that the surface of the concrete exposed to the atmosphere, especially when
exposed to fire, will be dry and consequently there will be no free water (either liquid or adsorbed)
flux across the boundary from the concrete to the atmosphere, i.e. JFW = 0.
The energy conservation equation for the boundary (45) may thus be rewritten and rearranged
to give the temperature gradient across the boundary as below (47):
(47)
For the gas pressure boundary condition, it may be noted that the gas pressure on the boundary will
always be equal to the atmospheric pressure and so the gas pressure gradient across the boundary will
always be zero (48).
(48) Following from the assumption for the mass conservation of gaseous material on the boundary, the
mass conservation of water vapour on the boundary can be written as (49):
(49)
From the original derivation of the differential equations by Tenchev et al. [6], it is shown that the
water vapour flux can be written as (50):
(50)
Substituting into equation (49) gives:
(51)
Therefore: (52)
0
TTh
n
Tk qr
0~~, VVV nJ
0~~, GGG nJ
VVVGVPVTV KPKTK ~ J
TTk
h
n
T qr
0~~~, VVVVVGVPVT KPKTK n
0~~~
,
VV
VVV
GVPVT
nK
n
PK
n
TK
0
n
PG
18
Rearranging and substituting in equations (47) and (48) it can be shown that the vapour content
gradient across the boundary is:
(53)
Although the boundary conditions are the same for both models it may be noted that in [6] k was
replaced with KTT for consistency. In the Modified Model KTT is no longer equal to k and this
consistency no longer holds.
2.5. Finite Element Formulation
As shown previously (17)-(21) the governing differential equations can be written in matrix-vector
form such that:
(54) where,
(55)
By applying Green’s Theorem to the weighted residual form of (54), the weak form of the governing
equations, expressed for an incremental-iterative solution scheme (at iteration i + 1 for a given time
step), can be written as (56):
(56)
where, W is a set of arbitrary scalar weighting functions and u & u are the set of primary variables
and their rates, such that:
(57)
Discretising in the normal way, (56) & (57) can be rearranged and written in matrix-vector form as:
(58)
where, for example, the term KTT is expressed as:
VV
VV
qr
VV
VTV
KTT
k
h
K
K
n
~~~
,
0 uKuC
;
MVMPMT
AVAPAT
TVTPTT
KKK
KKK
KKK
K;
MVMPMT
AVAPAT
TVTPTT
CCC
CCC
CCC
C
V
GP
T
~u
uuu dii 1
uu dt
i
11
int
int
int
MM
AA
TT
ff
ff
ff
d
ext
ext
ext
a
KKK
KKK
KKK
MVMPMT
AVAPAT
TVTPTT
SV
ii dSdV
11 0 WKquKWuWC
19
(59)
extTf is expressed as:
(60)
intTf is expressed as:
(61)
and h & a are respectively the set of shape functions and the set of discrete primary variables.
3. Numerical Investigation
In order to compare the performance of the two models discussed above and to study the significance
of capillary pressure and adsorbed water on the transport of heat and moisture in concrete, the
benchmark problem employed by Tenchev et al. [6] was considered. Four analyses with an increasing
level of complexity were undertaken. First, the problem was run with the Tenchev Model and then
repeated, with the Tenchev Model altered to adopt the relative permeabilities from Baroghel-Bouny
[12] (38). A further two analyses were undertaken by introducing different features of the Modified
Model, whilst maintaining the permeabilities from Baroghel-Bouny. For the first analysis with the
Modified Model, the effect of capillary pressure only was examined. This was done by setting the
upper limit of the hygroscopic moisture range, SSSP, to zero, which in turn fixes the degree of
saturation with adsorbed water, SB, to zero at all times. In this case the free water flux equation (30)
then reduces to the original equation (10), although the liquid phase velocity is still driven by liquid
pressure and the capillary pressure is considered through equation (35). For the second analysis with
the Modified Model, the effect of adsorbed water is also accounted for.
Summary of Benchmark Analyses:
Analysis 1 - Tenchev Model (reproduction)
Analysis 2 – Tenchev Model (relative permeabilites from Baroghel-Bouny (38))
Analysis 3 - Modified Model (relative permeabilites (38) and capillary pressure only)
Analysis 4 - Modified Model (relative permeabilites (38), capillary pressure and adsorbed water)
dVKCtV
TTTT 1
TT
hhhhKTT
dSn
TKf
STTText
T
h
iT
VTTT dVKf ahh
T
int
20
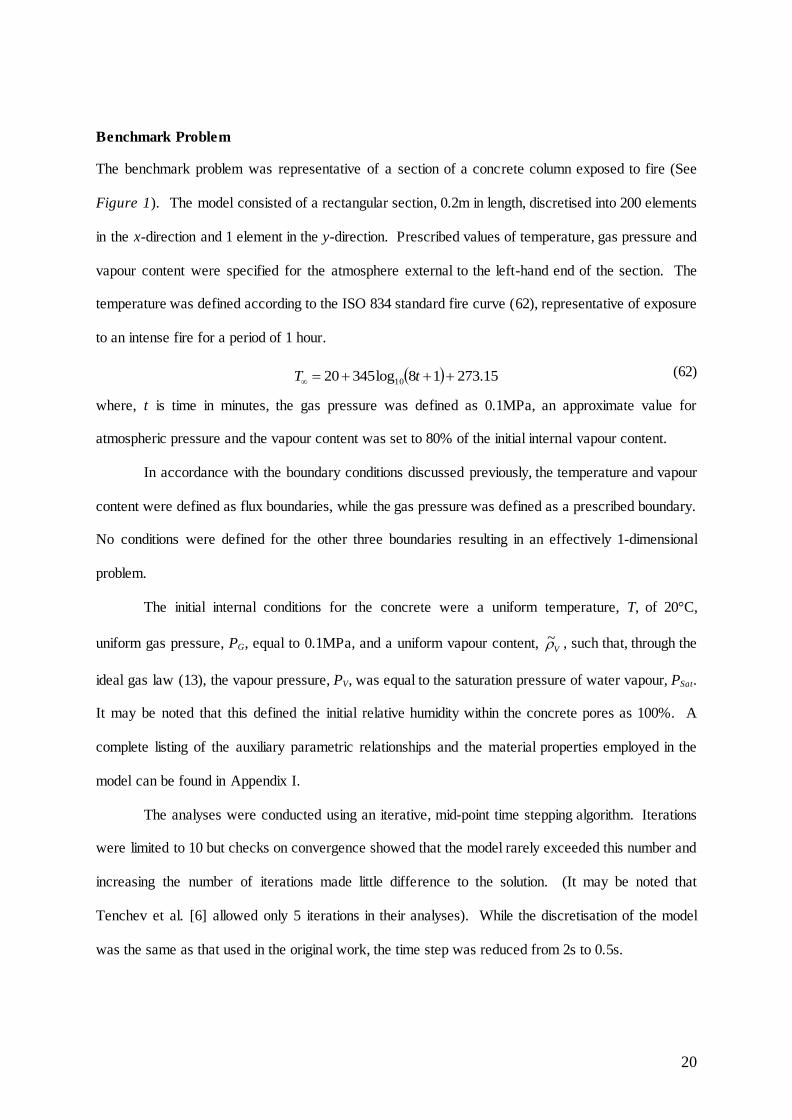
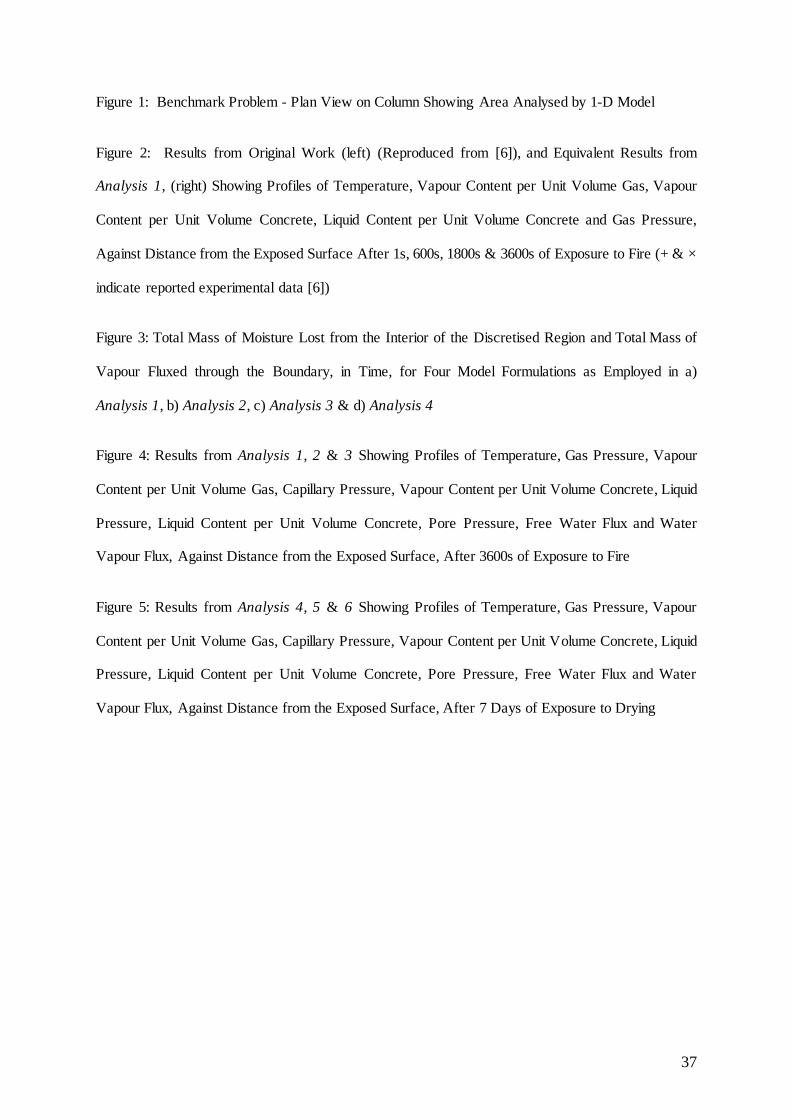
Benchmark Problem
The benchmark problem was representative of a section of a concrete column exposed to fire (See
Figure 1). The model consisted of a rectangular section, 0.2m in length, discretised into 200 elements
in the x-direction and 1 element in the y-direction. Prescribed values of temperature, gas pressure and
vapour content were specified for the atmosphere external to the left-hand end of the section. The
temperature was defined according to the ISO 834 standard fire curve (62), representative of exposure
to an intense fire for a period of 1 hour.
(62)
where, t is time in minutes, the gas pressure was defined as 0.1MPa, an approximate value for
atmospheric pressure and the vapour content was set to 80% of the initial internal vapour content.
In accordance with the boundary conditions discussed previously, the temperature and vapour
content were defined as flux boundaries, while the gas pressure was defined as a prescribed boundary.
No conditions were defined for the other three boundaries resulting in an effectively 1-dimensional
problem.
The initial internal conditions for the concrete were a uniform temperature, T, of 20°C,
uniform gas pressure, PG, equal to 0.1MPa, and a uniform vapour content, V
~ , such that, through the
ideal gas law (13), the vapour pressure, PV, was equal to the saturation pressure of water vapour, PSat.
It may be noted that this defined the initial relative humidity within the concrete pores as 100%. A
complete listing of the auxiliary parametric relationships and the material properties employed in the
model can be found in Appendix I.
The analyses were conducted using an iterative, mid-point time stepping algorithm. Iterations
were limited to 10 but checks on convergence showed that the model rarely exceeded this number and
increasing the number of iterations made little difference to the solution. (It may be noted that
Tenchev et al. [6] allowed only 5 iterations in their analyses). While the discretisation of the model
was the same as that used in the original work, the time step was reduced from 2s to 0.5s.
15.27318log34520 10 tT
21
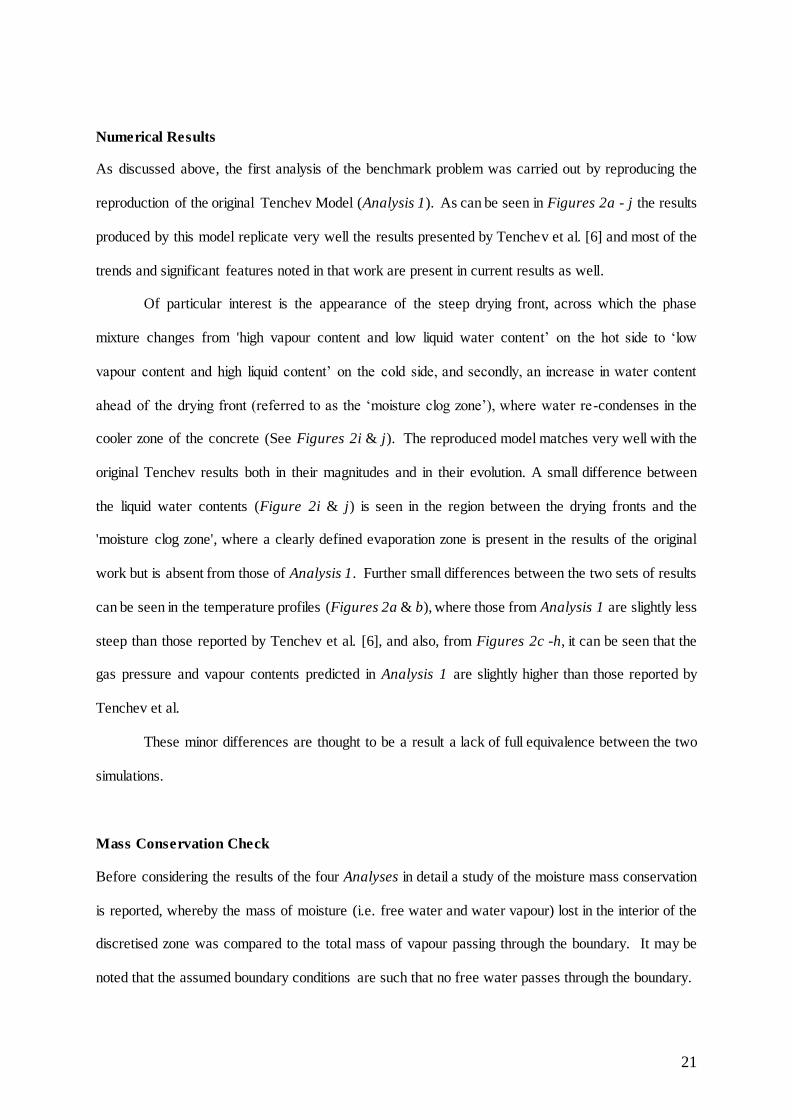
Numerical Results
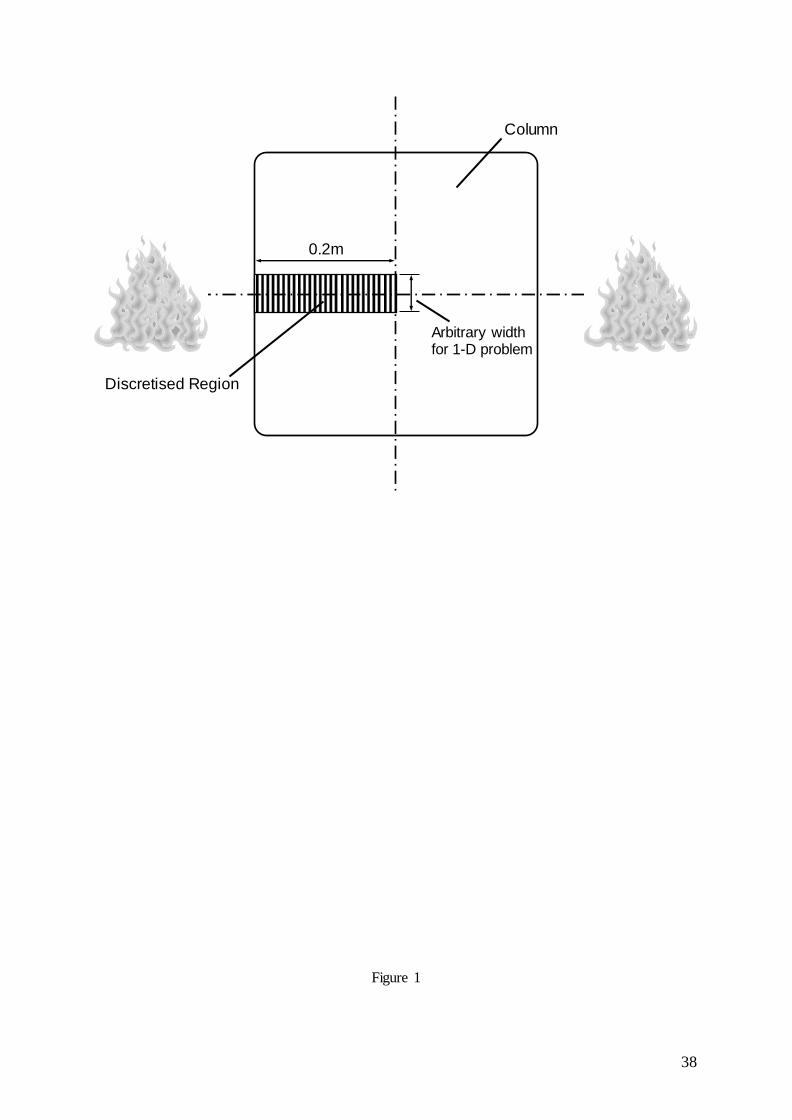
As discussed above, the first analysis of the benchmark problem was carried out by reproducing the
reproduction of the original Tenchev Model (Analysis 1). As can be seen in Figures 2a - j the results
produced by this model replicate very well the results presented by Tenchev et al. [6] and most of the
trends and significant features noted in that work are present in current results as well.
Of particular interest is the appearance of the steep drying front, across which the phase
mixture changes from 'high vapour content and low liquid water content’ on the hot side to ‘low
vapour content and high liquid content’ on the cold side, and secondly, an increase in water content
ahead of the drying front (referred to as the ‘moisture clog zone’), where water re-condenses in the
cooler zone of the concrete (See Figures 2i & j). The reproduced model matches very well with the
original Tenchev results both in their magnitudes and in their evolution. A small difference between
the liquid water contents (Figure 2i & j) is seen in the region between the drying fronts and the
'moisture clog zone', where a clearly defined evaporation zone is present in the results of the original
work but is absent from those of Analysis 1. Further small differences between the two sets of results
can be seen in the temperature profiles (Figures 2a & b), where those from Analysis 1 are slightly less
steep than those reported by Tenchev et al. [6], and also, from Figures 2c -h, it can be seen that the
gas pressure and vapour contents predicted in Analysis 1 are slightly higher than those reported by
Tenchev et al.
These minor differences are thought to be a result a lack of full equivalence between the two
simulations.
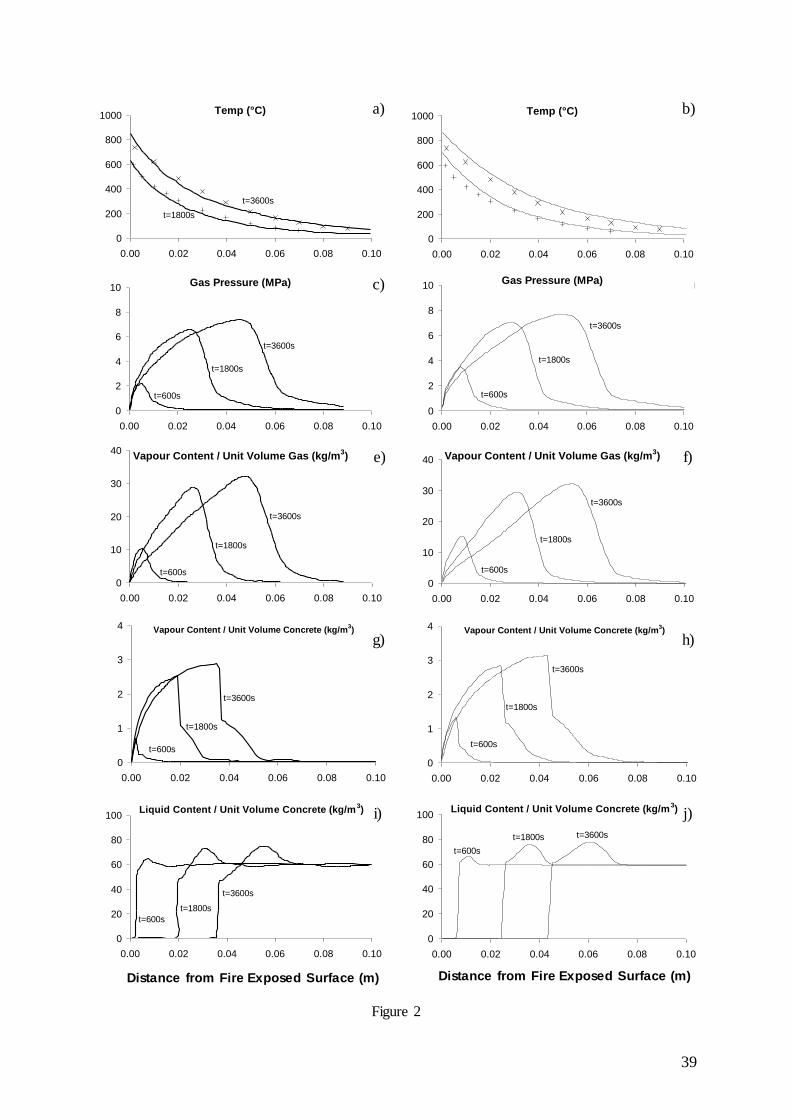
Mass Conservation Check
Before considering the results of the four Analyses in detail a study of the moisture mass conservation
is reported, whereby the mass of moisture (i.e. free water and water vapour) lost in the interior of the
discretised zone was compared to the total mass of vapour passing through the boundary. It may be
noted that the assumed boundary conditions are such that no free water passes through the boundary.
22
As can be seen in Figures 3a - d, that for all cases the mass of vapour lost to the atmosphere
matched very well the mass lost in the interior of the concrete. It may also be noted that in all cases
oscillations were observed in the internal moisture mass loss. A similar effect was noted by Tenchev
et al. [6] and it was considered to be a result of sudden changes in the gradient of the Sorption
Isotherms that result in instantaneous imbalances in the moisture mass conservation that are however
rebalanced over time. A further contribution to this effect may be the difficulty in capturing the
almost vertical nature of the drying front within a discretised region. The drying front jumps from
one element to another as it recedes, causing discretisation errors in the mass balance as it does so.
Again, this effect will rebalance over time.
Comparison of Results from Analysis 1, 2, 3 & 4
Again as discussed, three further analyses of the benchmark problem were carried out, first with the
Tenchev Model formulation altered by adopting the relative permeabilities from Baroghel-Bouny [12]
(equation (38)) (Analysis 2), and secondly, with the Modified Model, considering either capillary
pressure only (Analysis 3) or considering both capillary pressure and adsorbed water (Analysis 4).
Analysis 3 is included in order to isolate the effect of adsorbed water while Analysis 4 is believed to
be the most realistic. Comparative plots showing the results of Analyses 1, 2, 3 & 4 after 1 hour of
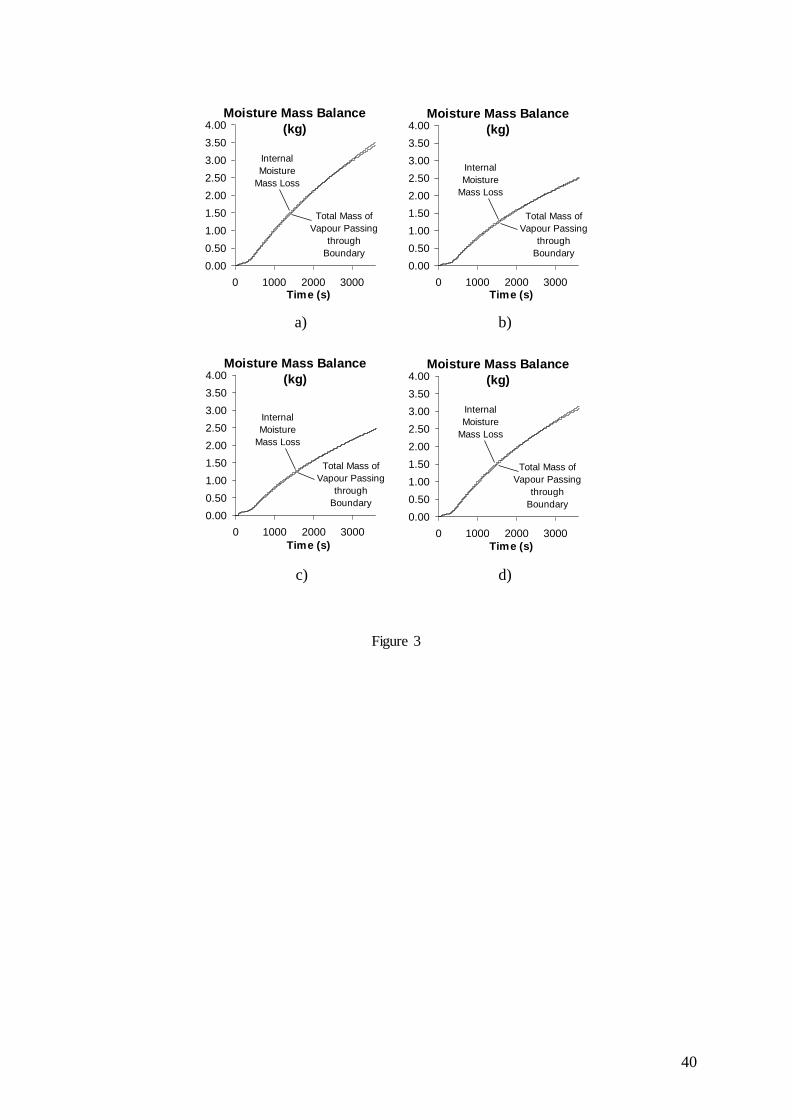
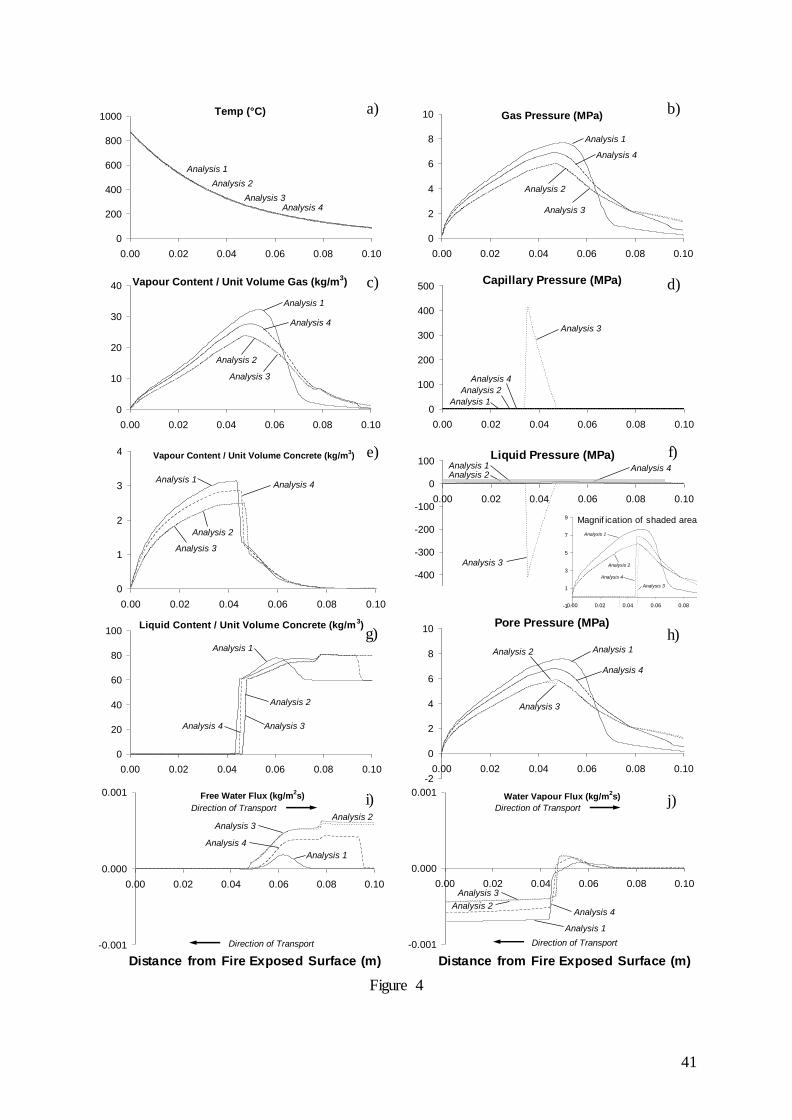
exposure to fire are shown in Figures 4a - j.
As can be seen in Figure 4a, the temperature profiles from all four analyses are virtually
identical, indicating that the differences in fluid transport predicted by the two models have little
effect on the heat transfer. This is indeed expected since the convection term, TC v in the
governing equation (7), is ignored in both models (See Part 1 above).
It can also be seen in Figure 4 that the main features discussed above in reference to the
original work [6], e.g. the steep drying fronts and peaks in gas pressure and vapour content, are also
clearly visible in both sets of results from the Modified Model. It may further be noted that the rates
of evolution of the profiles for all three analyses are very similar. However, significant differences
are noted for the results pertaining to gas and liquid pressures and vapour and liquid contents (Figures
23
4b - j), although it is also clear that the results of Analysis 2 are extremely similar to those of Analysis
3. The significance of this will be discussed in due course.
As can be seen in Figures 4b & c, the peaks of the gas pressure and vapour content profiles
predicted in Analyses 2, 3 & 4 are more diffuse than their respective counterparts from Analysis 1 and
that their maxima occur at the drying fronts rather than ahead of them (c.f. Figure 4g). It may also be
seen that the maximum values predicted are lower than those from Analysis 1, by approximately 20-
25% for Analyses 2 & 3 and by 10-15% for Analysis 4.
The lower predicted gas pressures obviously affect the averaged pore pressures (Figure 4h)
calculated according to equation (36) and this in turn has significance when considering the potential
for spalling, a principal cause of which is thought be the internal pore pressure of the concrete.
The lower predicted vapour contents have several effects on the overall behaviour of the
model. Firstly, they are partly responsible for the described differences in the gas pressure profiles
since vapour content and gas pressure are directly linked via the ideal gas law (13) and Dalton’s law
(14). Secondly, since the vapour content controls the relative humidity, it is also directly associated
with the free water content, via the ideal gas law (13) and the Sorption Isotherms (15), and the
differences in the predicted vapour contents must therefore be related to the differences that can be
seen in the water content profiles for the three sets of results (Figure 4g).
From Figure 4g it can be seen that the results from Analyses 2, 3 & 4 show larger areas of
increased water content ahead of the drying front, and thus more extensive ‘moisture clog zones’, than
the results of Analysis 1. This observation is consistent with the profiles in Figure 4c, which show
that significantly higher vapour contents are predicted in this region in Analyses 2, 3 & 4, leading
directly to the higher liquid content via the Sorption Isotherms. The physical mechanism behind this
can be explained by Figure 4j, where it can be seen that in Analysis 1, the original formulation of the
Tenchev Model predicts a much higher water vapour flux towards the face exposed to fire than is
predicted in any of the other three Analyses and consequently there is less vapour ahead of the drying
front available to condense into liquid water.
In addition to this effect, the liquid water is more easily able to flow away into the cooler
regions of the concrete due to the increased fluid transport capacity predicted by both the altered
24
Tenchev Model (Analysis 2) and the Modified Model (Analyses 3 & 4). This accounts for the more
extensive ‘moisture clog zones’ and comes about through two processes. Firstly, for Analyses 2,3 and
4, the relative permeability of the liquid phase, KL, is not fixed as in Analysis 1 and is generally much
higher since it is related to the saturation according to equation (38) and ranges between 0.0 and 1.0.
Secondly, for Analyses 3 & 4, the free water flux equation (30) is formulated in terms of the liquid
pressure, PL, rather than the gas pressure, PG, (as in Analysis 1) and is directly affected by the
inclusion of the capillary pressure terms (See Appendix II).
However, since the results of Analysis 2, in which the new relationship for KL is used while
the rest of the Tenchev Model remains unchanged, are almost identical to those of Analysis 3, in
which the Modified Model is employed and both the new relationship for KL and explicit
consideration of capillary pressure are employed, it is clear that the change in KL has by far the
greatest effect on the transport behaviour under the conditions applied in the benchmark problem.
As can be seen in Figure 4f, due to the increased fluid transport, the liquid pressure profiles
predicted in Analyses 2, 3 & 4 are less steep and consequently of a greater extent than those of
Analysis 1. This results in a much larger region of concrete in which the liquid pressure gradient
drives liquid water away from the face exposed to fire and into the cooler regions of the concrete.
Furthermore, while the peaks of the liquid pressure profiles predicted in Analyses 2, 3 & 4 occur at the
drying front (coincident with the gas pressure profiles discussed previously), the peak in Analysis 1
occurs ahead of the drying front and consequently there is a small region in which the pressure
gradient drives liquid water towards the face exposed to fire and evaporation (hence the larger flux of
vapour towards the boundary).
These observations are confirmed by the plot of the free water fluxes (Figure 4i), which
illustrates the generally higher free water transport predicted in Analyses 2, 3 & 4. However, from
Figures 4g & i, it may also be seen that the increase in transport capacity gained through the
modification of the free water flux equation is partially lost when adsorbed water is considered and
only the liquid fraction of the free water is driven by the liquid pressure gradient. This can be
explained by considering the regions ahead and behind the drying front. In the region ahead of the
drying front, where the largest free water fluxes are seen, liquid water is present and adsorbed water
25
saturation, SB, is at its maximum value, equal to SSSP, there is no gradient of SB and the adsorbed water
does not flow. Thus it can be seen that the free water flux from Analysis 4, consisting of only the
liquid water flowing under a pressure gradient, is lower than those of Analyses 2 & 3 (Figure 4i) in
which all free water is considered to flow under a pressure gradient and the difference between the
profiles is the effect of considering adsorbed water behaviour as distinct from liquid water behaviour.
Furthermore, in the region behind the drying front, where free water content is very low or zero, there
is almost no free water flux (liquid or adsorbed) predicted by any of the Analyses. As such there is
almost no adsorbed water flux predicted anywhere in the concrete during Analysis 4.
Therefore, although Tenchev’s assumption that adsorbed flux is negligible and can
consequently be ignored is, at first glance, reasonable, Figure 4i illustrates that recognising the large
fraction of free water held in the wet region as adsorbed water is extremely important and that to
ignore it and thus assume that all free water can be convected under pressure driven flow can have a
significant effect not only on the free water flux but also on the vapour content and gas pressures
(Figures 4b - j).
Capillary Pressure in Analyses 1, 2, 3 & 4
The most significant difference between the results of the four Analyses is the difference in the
predicted liquid pressures and which potentially has significant implications for the fluid transport
behaviour. In the Tenchev Model (Analyses 1 & 2), the liquid pressure is assumed to be equal to the
gas pressure and therefore the capillary pressure (defined as PC = PG - PL) is apparently always zero
(Figure 4d). In the Modified Model, since capillary pressure is explicitly considered, the liquid and
gas pressures are not necessarily equal (Figure 4b & f). As can be deduced from the Kelvin Equation
(35) the capillary pressure increases rapidly with the reduction in relative humidity. Therefore, in the
drying zone just behind the drying front, where the temperature is below the critical value and free
water is present, high capillary pressures may be expected. This can be clearly seen in the results
from Analysis 3 in Figure 4d, where capillary pressures of more than 400MPa were predicted,
resulting in similarly large negative liquid pressures in the same region (Figure 4f). No capillary
26
pressures were predicted ahead of the drying zone where the relative humidity did not drop below the
initial value of 100% and the liquid and gas pressures were indeed equal.
It is interesting to note that, irrespective of the capillary pressures predicted in Analysis 3, the
overall results are very similar to those of Analysis 2, with only a small difference in the peak pore
pressures (Figure 4h). This suggests that the capillary pressures have little or no effect on the
transport behaviour in concrete under intense heating (largely because they only exist in a region
where there is almost no water content), which in turn supports the approximation of PG = PL for the
problem of concrete exposed to fire, as adopted in the Tenchev Model [6] for the problem of concrete
exposed to fire. Furthermore, it questions the need to account for the influence of capillary pressure at
all, as was the case with the Tenchev Model via an artificially reduced relative permeability for liquid.
The insignificance of capillary pressures in problems of concrete exposed to fire appears to be
further borne out by the results of Analysis 4, which despite explicitly considering capillary pressure,
did not predict any. This effect is again due to the consideration of adsorbed water and also
associated with the steep nature of the drying front. Behind the drying front, the water content drops
very rapidly below the solid saturation point, SSSP. Below this point, there is no liquid water, only
adsorbed water is present, and so, although the relative humidity is less than 100%, capillary menisci
cannot develop.
It can furthermore be argued that, by considering the physical behaviour of adsorbed water as
distinct from the that of liquid water, the results of Analysis 4 are more representative of the physical
behaviour of a hygroscopic material such as a concrete than those of Analysis 3, since below
approximately 50% relative humidity capillary menisci become unstable and dissipate, leaving only a
film of adsorbed water on the surface of the solid [13, 14]. Consequently, from the Kelvin Equation
(35), capillary pressures in the range ~100-200MPa represent the maximum achievable level. The
capillary pressures predicted in Analysis 3, when adsorbed water behaviour is neglected, are
unrealistically high.
27
4. Conclusions
The Modified Model was presented as a modification and extension of the Tenchev Model to include
explicitly capillary pressure and adsorbed water behaviour in the finite element analysis of heat and
moisture transfer in concrete exposed to fire. Studies were carried out to investigate the effect of
these modifications and to assess the significance of related modelling assumptions and
approximations made in the Tenchev Model.
When applied to the problem of concrete exposed to intense heating, the original formulation
of the Tenchev Model, with the relative permeability for liquid water artificially restricted in order to
represent the influence of capillary pressure, was found to under predict the fluid transport capacity in
the concrete and consequently over predict the gas pressure and vapour content (by up to 25%) in
comparison with the altered model when the relative permeability was allowed to vary with the degree
of saturation. This shows that the original formulation of the Tenchev Model would be conservative
when utilised in the prediction of mechanical damage phenomena, such as spalling, which are related
to pore pressures.
It was furthermore found that the Modified Model, with only capillary pressure explicitly
considered, produced very similar results to the original Tenchev Model, thereby indicating that
capillary pressure is relatively unimportant in the heat and moisture transport behaviour in concrete
exposed to fire, which provides numerical evidence in support of the previously unsupported
assumptions made by Tenchev et al.
When the Modified Model considering both capillary pressure and adsorbed water behaviour
was applied to the same problem, no capillary pressures were predicted, again emphasising that the
inclusion of capillary pressure may be unnecessary. However, the gas pressures and vapour contents
predicted were higher than those seen for the altered Tenchev Model and the Modified Model
including capillary pressures only. As with the original Tenchev Model, this was caused by a
reduction in the predicted fluid transport capacity due to the diffusion rather than pressure driven flow
of adsorbed water. Although more work is required to study the flux behaviour of adsorbed water in
these conditions, the constitutive laws employed in the Modified Model are based on clear physical
concepts and it is felt that the flow behaviour predicted is quite representative. It was also noted that
28
the inclusion of adsorbed water behaviour allowed the model to naturally capture realistic capillary
pressure behaviour, whereas without adsorbed water the Modified Model predicted non-physical
capillary pressures,
In summary, it has been shown that capillary pressures have little effect on the fluid transport
behaviour in concrete exposed to high temperatures and whether they are ignored or explicitly
included in a model formulation appears to make little difference. However, it may also be noted that
in order to make the model generally applicable to problems of heating or even drying of concrete (i.e.
not only high temperature), where significant capillary pressures may develop, it should be included
in the model formulation.
It has also been shown that although the actual flux of adsorbed water is minimal in problems
of concrete exposed to high temperature, the consideration of its behaviour can nevertheless have a
significant effect on the fluid transport behaviour and the predicted vapour content and the gas
pressures. Ignoring this behaviour may lead to under prediction of the pore pressures in concrete and
to an overestimation of its resistance to mechanical damage such as spalling.
Acknowledgements
This work was carried out as part of the MAECENAS research project "Modelling of ageing in
concrete nuclear power plants", supported by the European Community through the EURATOM
programme (Contract no. FIKS-CT-2001-00186).
References
1. Ulm, F.-J., Coussy, O. and Bažant, Z. P., The "Chunnel" Fire. I: Chemoplastic Softening in
Rapidly Heated Concrete, Journal of Engineering Mechanics, 1999; 125(3): p. 272 - 282.
2. Neville, A.M., Properties of Concrete. 2nd ed, 1973: Pitman.
3. Coussy, O., Mechanics of Porous Continua, 1995; Chichester: Wiley & Sons.
4. Gawin, D., Majorana, C. E. & Schrefler, B. A., Numerical Analysis of Hygro-Thermal
Behaviour and Damage of Concrete at High Temperature, Mechanics of Cohesive-Frictional
Materials, 1999; 4: p. 37 - 74.
29
5. Lewis, R.W., & Schrefler, B. A., The Finite Element Method in the Static and Dynamic
Deformation and Consolidation of Porous Media . 2nd ed, 1998: Wiley.
6. Tenchev, R.T., Li, L. Y. & Purkiss, J. A., Finite Element Analysis of Coupled Heat and
Moisture Transfer in Concrete Subjected to Fire, Numerical Heat Transfer, Part A, 2001; 39:
p. 685 - 710.
7. Bažant, Z.P., Hauggaard, A. B., Baweja, S. & Ulm, F-J., Microprestress-Solidification Theory
for Concrete Creep, I: Aging and Drying Effects, Journal of Engineering Mechanics, 1997;
123(11): p. 1188 - 1194.
8. Cengel, Y.A., Heat Transfer: A Practical Approach. 2nd ed, 2003; New York: McGraw-Hill.
9. Bažant, Z.P., & Kaplan, M. F., Concrete at High Temperatures: Material Properties and
Mathematical Models, 1996; Harlow: Longman.
10. EN 1992-1-2, Eurocode 2: Design of Concrete Structures, 1992.
11. Ichikawa, Y., Prediction of Pore Pressures, Heat and Moisture Transfer Leading to Spalling of
Concrete During Fire, 2000; Ph.D Thesis, Imperial College: London.
12. Baroghel-Bouny, V., Mainguy, M. Lassabatere, T. & Coussy, O., Characterization and
Identification of Equilibrium and Transfer Moisture Properties for Ordinary and High-
Performance Cementitious Materials, Cement and Concrete Research, 1999; 29: p. 1225 -
1238.
13. Grasley, Z.C., David A. Lange, D. A. & D'Ambrosia, M. D., New Embedded Sensor for
Measuring Relative Humidity of Concrete, submitted to Cement and Concrete Research,
2002.
14. Pesavento, F., Nonlinear Modelling of Concrete as Multiphase Porous Material in High
Temperature Conditions, in Department of Construction and Transportation, 2000; PhD
Thesis, University of Padova.
30
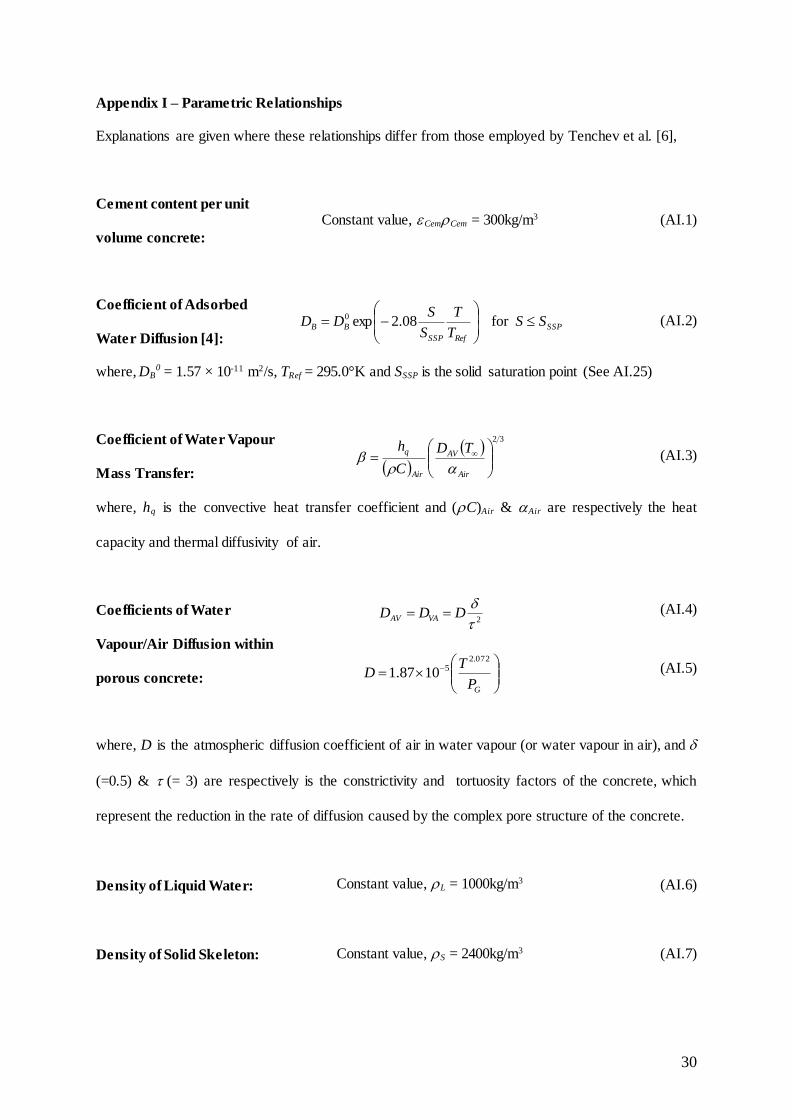
Appendix I – Parametric Relationships
Explanations are given where these relationships differ from those employed by Tenchev et al. [6],
Cement content per unit
volume concrete:
Constant value, CemCem = 300kg/m3 (AI.1)
Coefficient of Adsorbed
Water Diffusion [4]:
(AI.2)
where, DB0 = 1.57 × 10⁻¹¹ m2/s, TRef = 295.0°K and SSSP is the solid saturation point (See AI.25)
Coefficient of Water Vapour
Mass Transfer:
(AI.3)
where, hq is the convective heat transfer coefficient and (C)Air & Air are respectively the heat
capacity and thermal diffusivity of air.
Coefficients of Water
Vapour/Air Diffusion within
porous concrete:
(AI.4)
(AI.5)
where, D is the atmospheric diffusion coefficient of air in water vapour (or water vapour in air), and
(=0.5) & (= 3) are respectively is the constrictivity and tortuosity factors of the concrete, which
represent the reduction in the rate of diffusion caused by the complex pore structure of the concrete.
Density of Liquid Water: Constant value, L = 1000kg/m3 (AI.6)
Density of Solid Skeleton: Constant value, S = 2400kg/m3 (AI.7)
2
DDD VAAV
GP
TD
072.251087.1
SSP
RefSSP
BB SST
T
S
SDD
for 08.2exp0
32
Air
AV
Air
q TD
C
h
31
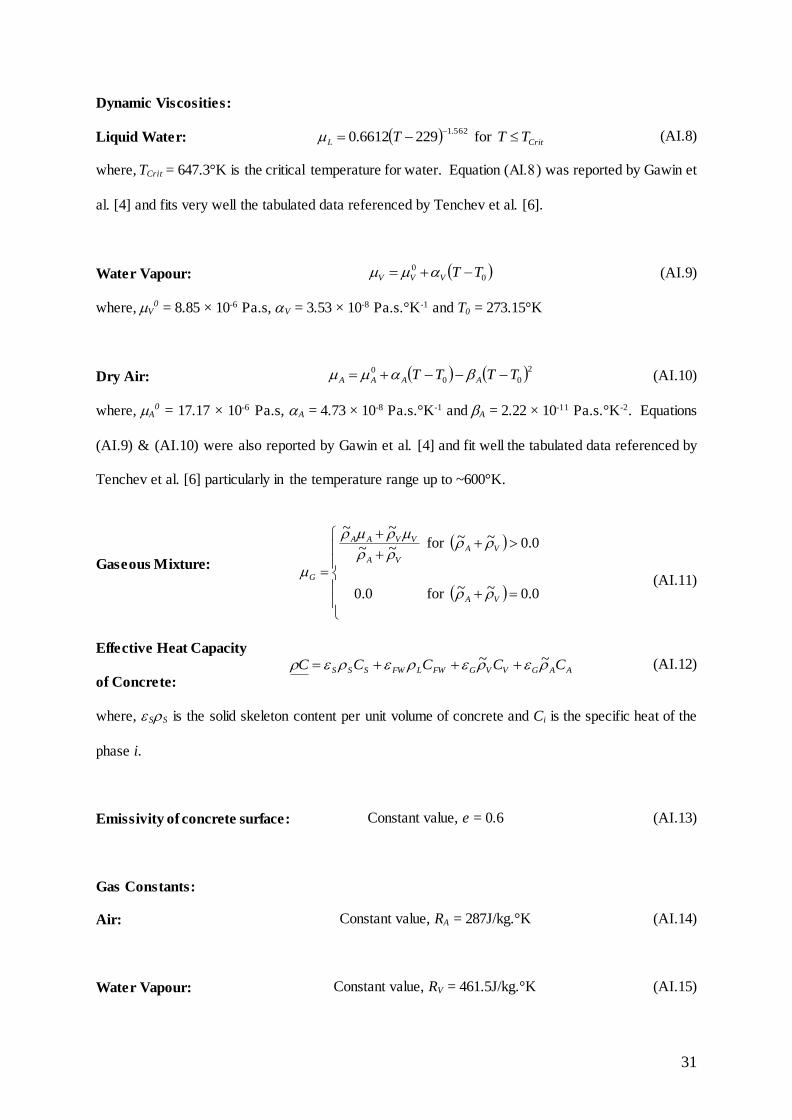
Dynamic Viscosities:
Liquid Water: (AI.8)
where, TCrit = 647.3°K is the critical temperature for water. Equation () was reported by Gawin et
al. [4] and fits very well the tabulated data referenced by Tenchev et al. [6].
Water Vapour: (AI.9)
where, V0 = 8.85 × 10⁻⁶ Pa.s, V = 3.53 × 10⁻⁸ Pa.s.°K-1 and T0 = 273.15°K
Dry Air: (AI.10)
where, A0 = 17.17 × 10⁻⁶ Pa.s, A = 4.73 × 10⁻⁸ Pa.s.°K-1 and A = 2.22 × 10⁻¹¹ Pa.s.°K-2. Equations
(AI.9) & (AI.10) were also reported by Gawin et al. [4] and fit well the tabulated data referenced by
Tenchev et al. [6] particularly in the temperature range up to ~600°K.
Gaseous Mixture:
(AI.11)
Effective Heat Capacity
of Concrete:
(AI.12)
where, SS is the solid skeleton content per unit volume of concrete and Ci is the specific heat of the
phase i.
Emissivity of concrete surface: Constant value, e = 0.6 (AI.13)
Gas Constants:
Air: Constant value, RA = 287J/kg.°K (AI.14)
Water Vapour: Constant value, RV = 461.5J/kg.°K (AI.15)
CritL TTT
for 2296612.0562.1
0
0 TTVVV
200
0 TTTT AAAA
0.0~~for 0.0
0.0~~for ~~
~~
VA
VA
VA
VVAA
G
AAGVVGFWLFWSSS CCCCC ~~
32
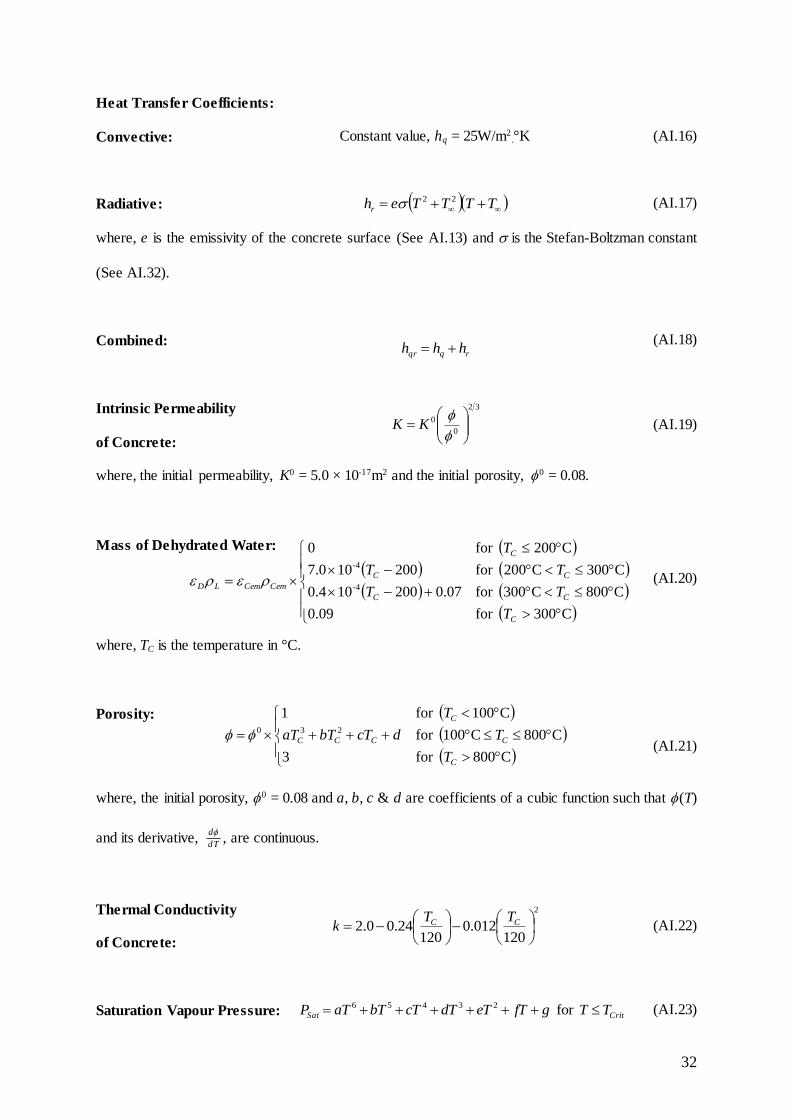
Heat Transfer Coefficients:
Convective: Constant value, hq = 25W/m2.°K (AI.16)
Radiative: (AI.17)
where, e is the emissivity of the concrete surface (See AI.13) and is the Stefan-Boltzman constant
(See AI.32).
Combined: (AI.18)
Intrinsic Permeability
of Concrete:
(AI.19)
where, the initial permeability, K0 = 5.0 × 10⁻¹⁷m2 and the initial porosity, 0 = 0.08.
Mass of Dehydrated Water:
(AI.20) where, TC is the temperature in °C.
Porosity:
(AI.21)
where, the initial porosity, 0 = 0.08 and a, b, c & d are coefficients of a cubic function such that (T)
and its derivative, dT
d, are continuous.
Thermal Conductivity
of Concrete:
(AI.22)
Saturation Vapour Pressure: (AI.23)
TTTTehr
22
rqqr hhh
32
0
0
KK
C800for 3
C800C100for
C100for 1230
C
CCCC
C
T
TdcTbTaT
T
2
120012.0
12024.00.2
CC TT
k
C300for 09.0
C800C300for 07.0200104.0
C300C200for 200107.0
C200for 0
4-
4-
C
CC
CC
C
CemCemLD
T
TT
TT
T
CritSat TTgfTeTdTcTbTaTP for 23456
33
where, a = -1.43742221944687 × 10⁻⁹, b = 4.42439058302123 × 10⁻⁶, c = -3.92808082125791 × 10⁻³,
d = 1.59103252944303, e = -3.25887438504847 × 10², f = 3.21477952751975 × 10⁴ and g = -
1.15466360325087 × 10⁶. Equation (AI.23) was developed by curve fitting to the tabulated data
referenced by Tenchev et al. [6].
Saturation Free Water Content: Constant value, FW0L
0 = 60kg/m3 (AI.24)
Solid Saturation Point: Constant value, SSSP = 0.55 when adsorbed water considered
Or, SSSP = 0.0 when adsorbed water ignored
(AI.25)
Values deduced from the work of Gawin et al. [4].
Specific Enthalpies:
Dehydration of Chemically
Bound Water:
Constant value, D = 2400 × 103J/kg (AI.26)
Evaporation (and desorption): (AI.27)
Equation (AI.27) was reported by Gawin et al. [4] and fits very well the tabulated data referenced by
Tenchev et al. [6]. It is also assumed to be valid for desorption of physically bound water.
Specific Heats:
Dry Air: (AI.28)
where, a = -9.84936701814735 × 10⁻⁸, b = 3.56436257769861 × 10⁻⁴, c = -1.21617923987757 × 10⁻¹
and d = 1.01250255216324 × 10³. Equation (AI.28) was developed by curve fitting to the tabulated
data referenced by Tenchev et al. [6].
Free Water:
(AI.29)
where, a = 1.08542631988638 and b = 31.4447657616636. Equation (AI.29) was developed by curve
fitting to the tabulated data referenced by Tenchev et al. [6].
38.0510672.2 TTCritE
dcTbTaTCA 23
Crit
Crit
b
FW
TT
TTaT
TC
for 0.24515
for 15.513
2.33684768.2
34
Solid Skeleton:
(AI.30)
Water Vapour: (AI.31)
where, a = 1.13771502228162 and b = 29.4435287521143. Equation (AI.31) was developed by curve
fitting to the tabulated data referenced by Tenchev et al. [6].
Stefan-Boltzman constant: Constant value, = 5.67 × 10⁻⁸W/m2.°K4 (AI.32)
Volume Fraction of Free Water: Sorption Isotherms
(AI.33)
where, a, b, c & d are complex temperature dependent coefficients of a cubic function such that FW
and its derivatives SatV
FW
PP
ε
, T
εFW
&
V
FW
ρ
ε~
are always continuous, and m is a temperature dependent
coefficient as given by (AI.34):
(AI.34)
The cubic function fitted to the intermediate section of the sorption curves, 0.96 < PV/PSat < 1.04, was
developed in order to reproduce the ‘smoothed transition’ described but not defined by Tenchev et al.
[6]. The complex coefficients were themselves functions of temperature and specific to the other
parameters of the sorption curves.
2
1204
12080900
CC
S
TTC
Crit
Crit
b
V
TT
TTaT
TC
for 45821.04
for 15.513
4431399.7
04.1for 04.112.01
04.10.96for
96.0for
00
23
100
Sat
V
Sat
V
L
LFW
Sat
V
Sat
V
Sat
V
Sat
V
Sat
V
m
Sat
V
CemCem
LFW
L
CemCem
FW
P
P
P
P
P
Pd
P
Pc
P
Pb
P
Pa
P
P
P
P
22
2
10253.2210
1004.1
C
C
T
Tm
35
Appendix II – derivation of free water flux
(AII.1)
(AII.2)
(AII.3)
(AII.4)
(AII.5)
(AII.6)
(AII.7)
(AII.8)
(AII.9)
(AII.10)
(AII.11)
(AII.12)
(AII.13)
(AII.14)
(AII.15)
(AII.16)
BBLFWB
L
L
LLFW
BFW SD
S
SP
KK
S
SJ
1
BBLFWB
CG
L
LLFW
BFW SD
S
SPP
KK
S
SJ
1
V
V
CCGCG
PT
T
PPPP
~
~
CGL PPP
Sat
VLVC
P
PTRP ln
TRP VVV ~
Sat
VVLVC
P
TRTRP
~ln
1
~ln1
Sat
VVL
L
Sat
Sat
LVC
P
TR
T
T
T
P
P
TR
T
P
V
LV
V
C TRP
~~
V
V
LV
Sat
VVL
L
Sat
Sat
LVGCG
TRT
P
TR
T
T
T
P
P
TRPPP
~
~1~
ln1
SSPSSP
SSPFW
B
SSConst S
SS SS
for
for
SSPSSP
SSPFW
B
SS S
SS SS
for 0
for
SSPFWFW
B SS S
for 2
TmTTPTP LSatVVFWFW ,,,,~
TT
FWV
V
FWFW
~
~
T
36
(AII.17)
(AII.18)
(AII.19)
(AII.20)
(AII.21)
(AII.22)
(AII.23) For S ≤ SSSP
(AII.24)
(AII.25)
(AII.26)
For S > SSSP (∇SB = 0. Terms from Eq. AII.19 disappear)
(AII.27)
(AII.28)
(AII.29)
TT
2
~~
TT
TT
S
FWFW
V
V
FW
B
V
V
FWFWFW TTT
~
~11
BBLFWB
CG
L
LLFW
BFW SD
S
SPP
KK
S
SJ
1
VLVGLPLTFW KPKTKJ ~
TTT
DS
S
TRT
P
TR
T
T
T
P
P
TRP
KK
S
SJ
FWFW
V
V
FW
BLFWB
V
V
LV
Sat
VVL
L
Sat
Sat
LVG
L
LLFW
BFW
1~~
1
~~1
~ln11
V
V
FWBB
V
LV
L
LBLFW
G
L
LLFW
B
Sat
VVL
L
Sat
SatL
LVLBFWFWBBLFW
S
DSTRKK
S
S
PKK
S
S
TP
TR
T
T
T
P
P
TRKK
S
S
TTS
DS
~~~1
1
1~
ln11
1
~ln11
Sat
VVL
L
Sat
SatL
LVLBFWFWBBLFWLT
P
TR
T
T
T
P
P
TRKK
S
S
TTS
DSK
L
LLFW
BLP
KK
S
SK
1
V
FWBB
V
LV
L
LBLFWLV
S
DSTRKK
S
SK
~~1
1
~ln11
Sat
VVL
L
Sat
SatL
LVLBLFWLT
P
TR
T
T
T
P
P
TRKK
S
SK
L
LLFW
BLP
KK
S
SK
1
V
LV
L
LBLFWLV
TRKK
S
SK
~1
37
Figure 1: Benchmark Problem - Plan View on Column Showing Area Analysed by 1-D Model Figure 2: Results from Original Work (left) (Reproduced from [6]), and Equivalent Results from
Analysis 1, (right) Showing Profiles of Temperature, Vapour Content per Unit Volume Gas, Vapour
Content per Unit Volume Concrete, Liquid Content per Unit Volume Concrete and Gas Pressure,
Against Distance from the Exposed Surface After 1s, 600s, 1800s & 3600s of Exposure to Fire (+ & ×
indicate reported experimental data [6])
Figure 3: Total Mass of Moisture Lost from the Interior of the Discretised Region and Total Mass of
Vapour Fluxed through the Boundary, in Time, for Four Model Formulations as Employed in a)
Analysis 1, b) Analysis 2, c) Analysis 3 & d) Analysis 4
Figure 4: Results from Analysis 1, 2 & 3 Showing Profiles of Temperature, Gas Pressure, Vapour
Content per Unit Volume Gas, Capillary Pressure, Vapour Content per Unit Volume Concrete, Liquid
Pressure, Liquid Content per Unit Volume Concrete, Pore Pressure, Free Water Flux and Water
Vapour Flux, Against Distance from the Exposed Surface, After 3600s of Exposure to Fire
Figure 5: Results from Analysis 4, 5 & 6 Showing Profiles of Temperature, Gas Pressure, Vapour
Content per Unit Volume Gas, Capillary Pressure, Vapour Content per Unit Volume Concrete, Liquid
Pressure, Liquid Content per Unit Volume Concrete, Pore Pressure, Free Water Flux and Water
Vapour Flux, Against Distance from the Exposed Surface, After 7 Days of Exposure to Drying
38
Figure 1
Discretised Region
Column
0.2m
Arbitrary width for 1-D problem
39
Figure 2
Temp (°C)
0
200
400
600
800
1000
0.00 0.02 0.04 0.06 0.08 0.10
Distance from Hot Face (m)
t=1800s
t=3600s
Vapour Content / Unit Volume Gas (kg/m3)
0
10
20
30
40
0.00 0.02 0.04 0.06 0.08 0.10Distance from Hot Face (m)
t=600s
t=1800s
t=3600s
Vapour Content / Unit Volume Concrete (kg/m3)
0
1
2
3
4
0.00 0.02 0.04 0.06 0.08 0.10Distance from Hot Face (m)
t=600s
t=1800s
t=3600s
Liquid Content / Unit Volume Concrete (kg/m3)
0
20
40
60
80
100
0.00 0.02 0.04 0.06 0.08 0.10
Distance from Hot Face (m)
t=600s
t=1800s
t=3600s
Gas Pressure (MPa)
0
2
4
6
8
10
0.00 0.02 0.04 0.06 0.08 0.10
Distance from Hot Face (m)
t=600s
t=1800s
t=3600s
Temp (°C)
0
200
400
600
800
1000
0.00 0.02 0.04 0.06 0.08 0.10
Distance from Hot Face (m)
Vapour Content / Unit Volume Gas (kg/m3)
0
10
20
30
40
0.00 0.02 0.04 0.06 0.08 0.10
Distance from Hot Face (m)
t=3600s
t=1800s
t=600s
Vapour Content / Unit Volume Concrete (kg/m3)
0
1
2
3
4
0.00 0.02 0.04 0.06 0.08 0.10Distance from Hot Face (m)
t=3600s
t=1800s
t=600s
Liquid Content / Unit Volume Concrete (kg/m3)
0
20
40
60
80
100
0.00 0.02 0.04 0.06 0.08 0.10
Distance from Hot Face (m)
t=3600s
t=600s
t=1800s
Distance from Fire Exposed Surface (m) Distance from Fire Exposed Surface (m)
a)
c)
e)
g)
i)
b)
d)
f)
h)
j)
Gas Pressure (MPa)
0
2
4
6
8
10
0.00 0.02 0.04 0.06 0.08 0.10Distance from Hot Face (m)
t=3600s
t=1800s
t=600s
40
Figure 3
Moisture Mass Balance
(kg)
0.00
0.50
1.00
1.50
2.00
2.50
3.00
3.50
4.00
0 1000 2000 3000
Total Mass of
Vapour Passing
through
Boundary
Internal
Moisture
Mass Loss
Moisture Mass Balance
(kg)
0.00
0.50
1.00
1.50
2.00
2.50
3.00
3.50
4.00
0 1000 2000 3000
Total Mass of
Vapour Passing
through
Boundary
Internal
Moisture
Mass Loss
Moisture Mass Balance
(kg)
0.00
0.50
1.00
1.50
2.00
2.50
3.00
3.50
4.00
0 1000 2000 3000
Total Mass of
Vapour Passing
through
Boundary
Internal
Moisture
Mass Loss
Moisture Mass Balance
(kg)
0.00
0.50
1.00
1.50
2.00
2.50
3.00
3.50
4.00
0 1000 2000 3000
Total Mass of
Vapour Passing
through
Boundary
Internal
Moisture
Mass Loss
a) b)
c)
Time (s) Time (s)
Time (s) Time (s)
d)
41
Figure 4
Liquid Content / Unit Volume Concrete (kg/m3)
0
20
40
60
80
100
0.00 0.02 0.04 0.06 0.08 0.10
Distance from Hot Face (m)
Analysis 1
Analysis 3Analysis 4
Analysis 2
Distance from Fire Exposed Surface (m) Distance from Fire Exposed Surface (m)
Temp (°C)
0
200
400
600
800
1000
0.00 0.02 0.04 0.06 0.08 0.10
Distance from Hot Face (m)
Analysis 1
Analysis 2
Analysis 3Analysis 4
Gas Pressure (MPa)
0
2
4
6
8
10
0.00 0.02 0.04 0.06 0.08 0.10
Distance from Hot Face (m)
Analysis 1
Analysis 2
Analysis 4
Analysis 3
Vapour Content / Unit Volume Gas (kg/m3)
0
10
20
30
40
0.00 0.02 0.04 0.06 0.08 0.10Distance from Hot Face (m)
Analysis 1
Analysis 2
Analysis 4
Analysis 3
Capillary Pressure (MPa)
0
100
200
300
400
500
0.00 0.02 0.04 0.06 0.08 0.10
Distance from Hot Face (m)
Analysis 1
Analysis 3
Analysis 2
Analysis 4
Vapour Content / Unit Volume Concrete (kg/m3)
0
1
2
3
4
0.00 0.02 0.04 0.06 0.08 0.10Distance from Hot Face (m)
Analysis 1
Analysis 3
Analysis 4
Analysis 2
Pore Pressure (MPa)
-2
0
2
4
6
8
10
0.00 0.02 0.04 0.06 0.08 0.10
Analysis 1
Analysis 3
Analysis 4
Analysis 2
Free Water Flux (kg/m2s)
-0.001
0.000
0.001
0.00 0.02 0.04 0.06 0.08 0.10
Distance from Hot Face (m)
Analysis 1
Analysis 3
Analysis 4
Direction of Transport
Direction of Transport
Analysis 2
Water Vapour Flux (kg/m2s)
-0.001
0.000
0.001
0.00 0.02 0.04 0.06 0.08 0.10
Distance from Hot Face (m)
Analysis 1
Analysis 3
Analysis 4
Direction of Transport
Direction of Transport
Analysis 2
Liquid Pressure (MPa)
-500
-400
-300
-200
-100
0
100
0.00 0.02 0.04 0.06 0.08 0.10
Distance from Hot Face (m)
Analysis 1
Analysis 3
Analysis 4Analysis 2
-1
1
3
5
7
9
0.00 0.02 0.04 0.06 0.08 0.10
Analysis 4
Analysis 1
Analysis 3
Analysis 2
Magnif ication of shaded area
a)
c)
e)
g)
b)
d)
f)
h)
i) j)