countering misinformation with targeted messages ... - econstor
TRANSCRIPT
econstorMake Your Publications Visible.
A Service of
zbwLeibniz-InformationszentrumWirtschaftLeibniz Information Centrefor Economics
Armand, Alex; Augsburg, Britta; Bancalari, Antonella; Kameshwara, KalyanKumar
Working Paper
Countering misinformation with targeted messages:Experimental evidence using mobile phones
IFS Working Paper, No. W21/27
Provided in Cooperation with:Institute for Fiscal Studies (IFS), London
Suggested Citation: Armand, Alex; Augsburg, Britta; Bancalari, Antonella; Kameshwara, KalyanKumar (2021) : Countering misinformation with targeted messages: Experimental evidenceusing mobile phones, IFS Working Paper, No. W21/27, Institute for Fiscal Studies (IFS),London,http://dx.doi.org/10.1920/wp.ifs.2021.2721
This Version is available at:http://hdl.handle.net/10419/242926
Standard-Nutzungsbedingungen:
Die Dokumente auf EconStor dürfen zu eigenen wissenschaftlichenZwecken und zum Privatgebrauch gespeichert und kopiert werden.
Sie dürfen die Dokumente nicht für öffentliche oder kommerzielleZwecke vervielfältigen, öffentlich ausstellen, öffentlich zugänglichmachen, vertreiben oder anderweitig nutzen.
Sofern die Verfasser die Dokumente unter Open-Content-Lizenzen(insbesondere CC-Lizenzen) zur Verfügung gestellt haben sollten,gelten abweichend von diesen Nutzungsbedingungen die in der dortgenannten Lizenz gewährten Nutzungsrechte.
Terms of use:
Documents in EconStor may be saved and copied for yourpersonal and scholarly purposes.
You are not to copy documents for public or commercialpurposes, to exhibit the documents publicly, to make thempublicly available on the internet, or to distribute or otherwiseuse the documents in public.
If the documents have been made available under an OpenContent Licence (especially Creative Commons Licences), youmay exercise further usage rights as specified in the indicatedlicence.
www.econstor.eu
lnstitute for Fiscal StudiesW
orkin
g pap
erAlex ArmandBritta AugsburgAntonella BancalariKalyan Kumar Kameshwara
Countering misinformation with targeted messages:Experimental evidence using mobile phones21/27
Countering misinformation with targeted messages:
Experimental evidence using mobile phones*
Alex Armand Britta Augsburg Antonella Bancalari
Kalyan Kumar Kameshwara
August 2021
Abstract
Widespread misconceptions can be critical, especially in times of crisis. Through a field ex-
periment, we study how to address such wrong or inaccurate beliefs using messages delivered to
individual citizens using mobile phones. We focus on misinformation related to the COVID-19 pan-
demic in a hard-to-reach population – India’s slum residents. We randomly allocate participants to
receive voice and video messages introduced by a local citizen, the messenger, and in which medi-
cal practitioners debunk misconceptions. To understand the role of targeting, we randomly vary the
signaled religious identity of the messenger into either Muslim or Hindu, guaranteeing exogenous
variation in religion concordance between messenger and recipient. Doctor messages are effective
at increasing knowledge of, and compliance with, COVID-19 policy guidelines. Changes in mis-
conceptions are observed only when there is religion concordance and mainly for religious-salient
misconceptions. Correcting misconceptions with information requires targeting messages to specific
populations and tailoring them to individual characteristics. (JEL D04, D80, D83, I10, I15, Z12)
Keywords: Misinformation, Misconception, Fake news, Religion, India, Social media, COVID-19.
*Armand: Nova School of Business and Economics – Universidade Nova de Lisboa, CEPR, NOVAFRICA, and Institutefor Fiscal Studies (e-mail: [email protected]); Augsburg: Institute for Fiscal Studies (e-mail: britta [email protected]);Bancalari: School of Economics and Finance, University of St. Andrews, and Institute for Fiscal Studies (e-mail: [email protected]; Kameshwara: University of Bath and Institute for Fiscal Studies (e-mail:[email protected]). We would like to thank Oriana Bandiera, Maithreesh Ghatak and Michael Calum, as wellas participants at the LSE-STICERD Development Economics Seminar and the Institute for Fiscal Studies Seminar for helpfulcomments. This project would have not been possible without the generous and insightful support of our partners in the field,Bhartendu Trivedi, Yashashvi Singh, Tatheer Fatima and the field team of Morsel Research and Development. We are alsoindebted to study participants for their willingness to contribute to the study. We gratefully acknowledge financial support fromthe International Growth Centre and the LSE Special Grant for Coronavirus Research. Ethics approval was secured from LSE(REC ref. 1132). The pre-analysis plan was registered on the AEA RCT registry (Armand et al., 2020).
1
Misinformation play an important role in distorting people’s beliefs (Gerber et al., 2009; Barrera et al.,
2020). Media, and in particular social media and instant messaging platforms, are often used as channels
to propagate fake news, spreading misconceptions (Allcott and Gentzkow, 2017; Barrera et al., 2020).1
This can have deep consequences in the way people make decisions in a wide variety of domains.2 In the
context of the COVID-19 pandemic, misinformation has become so widespread to have been deemed a
major concern for public health, labeling its diffusion as infodemic (Vicario et al., 2016; World Health
Organisation, 2020; Bursztyn et al., 2020). While the literature highlights the importance of misinforma-
tion in spreading misconceptions among citizens, their persistence is ‘incompletely understood’ (Chan
et al., 2017), and evidence about the instruments that can counteract them remains limited.
We study how targeted messages, i.e. messages delivered and tailored to an individual citizen, can
correct misconceptions. To this purpose, we implement a field experiment among slum residents of
the two largest cities of Uttar Pradesh (UP), India, amid the COVID-19 pandemic. Misinformation is
a particularly pressing issue in India, which has seen dramatic increases in access to platforms that are
widely used to spread misleading information. Internet penetration rate increased from about 4% in
2007 to 50% in 2020, giving access to 622 million users, while social media platforms are becoming
the primary source of news (Statista, 2021). With the onset of the COVID-19 pandemic, a wave of
misinformation flooded India to the extent that PM Narendra Modi addressed the nation urging everyone
to rely only on credible medical advice and demanding social media companies to curb misinformation
on their platforms (Purohit, 2020; Akbar et al., 2020). Misconceptions about COVID-19 were widespread
in our target population from early in the pandemic.
Being the most marginalized and less-educated share of the urban population in India, focusing on slum
residents allows studying the roots of misconception among the citizens that are most-at-risk for the con-
sequences of misinformation (Lazer et al., 2018; Bavel et al., 2020). Worldwide one billion people live
in such settlements -– more than half of these in Asia and almost a fifth in India (World Bank, 2020).
From June 2020, amid the early months of the pandemic, we followed more than 4,000 slum residents via
phone surveys for up to 6 months. Using standard measures of agreement with self-reported misconcep-
tion together with a novel survey instrument to capture agreement with other citizen’s misconceptions,
we gathered rich information about people’s beliefs related to the COVID-19 pandemic.
By varying the content of a message sent to citizens using mobile phone technology, the experiment tests
two hypotheses about the persistence of misconception among citizens. First, we test whether receiving
credible and informative messages can correct misconceptions. We randomly allocate participants to
receive messages on their mobile phones in which doctors working in locally-renowned hospitals debunk
misconceptions related to COVID-19 (versus receiving an unrelated message about a Bollywood gossip).
In the study setting, 95% of the target population report doctors and health experts as the most trusted1A misconception is defined as a wrong or inaccurate idea/belief. See, e.g., Scheufele and Krause (2019) for an application
to science.2These include women’s agency and fertility choices (Jensen and Oster, 2009; La Ferrara et al., 2012; Kearney and Levine,
2015), political accountability (Besley et al., 2002; Stromberg, 2004), crime (Muller and Schwarz, 2021; Bursztyn et al., 2019;Card and Dahl, 2011; Dahl and Dellavigna, 2009), social capital and attitudes (Olken, 2009; Paluck and Green, 2009).
2
source of COVID-19 information. In addition, given concerns that class differences between the recipient
and the doctors can induce skepticism (Gauchat, 2012; Eichengreen et al., 2021), the messages were
introduced by a local citizen (labeled the messenger). While trusted voices have shown to increase the
credibility of the source and improve knowledge and health outcomes (O’Keefe, 2016; Greyling et al.,
2016; Khan et al., 2021; Sadish et al., 2021), there is limited knowledge on how targeted messages can
affect persistent misconceptions.
Second, we test whether tailoring the message by introducing shared characteristics between the mes-
senger and the recipient improves its effectiveness. Building on the literature on identity (Akerlof and
Kranton, 2000), we focus on religion concordance and we further randomize the signaled religious iden-
tity of the messenger to be either Muslim or Hindu, by altering its name, clothing, and greeting. Religious
identity is highly salient in India, and was particularly so during the onset of the COVID-19 pandemic,
which fueled pre-existent tensions that spurred violence against the Muslim population (Banaji and Bhat,
2020; Menon, 2020).3 At baseline, misleading claims about the role of Muslim citizens in the spread of
the virus were identified as the primary driver of the increase in fake news on social media (Appendix A;
Purohit, 2020); other widely-spread misconceptions had similarly a clear religious connotation. While
misconceptions are often tied with tensions across different identities (Greenwood et al., 2018; Bazzi
et al., 2019; Alsan et al., 2019, 2020; Greenwood et al., 2020; Hill et al., 2020; Alsan and Eichmeyer,
2021; Lowe, 2021), it remains unclear whether identity can play a role in debunking them.
Our results show that targeted messages containing informative content from trusted sources is an effec-
tive way to inform citizens: Doctor messages increase knowledge about ways to prevent infection with
COVID-19, and reported compliance with the related policy guidelines. Similar findings are reported by
Alsan et al. (2020) and Torres et al. (2021) in the context of the US.
While citizens become more acknowledged about the recommendations received, misconceptions aris-
ing from fake news are hard to change and a large proportion of the targeted population holds on to
their wrong beliefs. The effectiveness of messages in debunking them relies on whether there is religion
concordance with the messenger. Misconceptions are corrected only when the religious identity is re-
lated to the misconception, and when the misconception is religion-salient, i.e. wrong beliefs are stably
different across religions. Results are robust to alternative specifications and to multiple hypothesis test-
ing. This result reinforces the importance of identity in they way views and decisions are formed (Bazzi
et al., 2019; Lowe, 2021), and especially in the way health outcomes are improved (Alsan et al., 2019;
Greenwood et al., 2018, 2020; Hill et al., 2020; Alsan and Eichmeyer, 2021). It also contributes to the
understanding of the role of religion among interacting citizens, a growing field of research (Iyer, 2016),
highlighting an important role of diversity in the persistence of misinformation (see, e.g., Habyarimana3The Hindu-Muslim conflict in India goes back to the pre-partition era and flared up at regular frequency since (see, e.g.,
Mitra and Ray, 2014). During the pandemic, UP was repeatedly in the news for religious incidents (Arya, 2020; Al Jazeera,2020). In addition, in early 2020, the Citizenship Amendment Act, a new law that offers Indian citizenship to people from threeneighboring countries, but restricted to non-Muslim only, led to protests across the country (see, e.g., Bhatia, 2021). Discrim-ination and violence against stigmatized groups has been documented in other pandemic settings (Desai and Amarasingam,2020).
3
et al., 2007).
Overall, findings provide important insights into how governments and agencies across the world can rely
on targeted messages to counter misconceptions. They underline that careful consideration of the type of
misconception and the population targeted need to be taken into account for their design, highlighting the
importance of tailoring messages to specific individuals. These results contribute to the literature iden-
tifying ways to counteract agreement with misconceptions (Bolsen and Druckman, 2015; Ecker et al.,
2010; van der Linden et al., 2017), without undermining agreement with accurate information, a concern
highlighted in other contexts (Clayton et al., 2019).
1 Intervention and experimental design
The intervention targets the population of slum residents in the two largest urban agglomerations in UP,
Lucknow and Kanpur. Appendix B provides a description of the study area. Similar to other states of
India, UP was hit hard by the COVID-19 pandemic during the period of the study (Appendix Figure
A1 shows he number of COVID-19 cases and deaths in UP during this period). Guidelines of social
distancing and wearing face masks remained constant throughout these periods. Appendix Figure A2
shows details of which restrictions applied when over the study period.
The intervention consists of sending messages targeted at individual citizens using mobile phone tech-
nology. We sent the messages to targeted recipients in two forms: as an audio via voice messages, and as
a short video through a WhatsApp chatbot.4 Each message is structured in two components: the intro-
duction of a messenger, i.e. a local citizen closer in socio-economic status to the targeted population, and
the informative content of the message. In the main treatment, the informative content is represented by
doctors from locally renowned medical institutions updating priors about misinformed ways to prevent
COVID-19. Qualified medical practitioners were chosen as the main messengers since 95% of respon-
dents named doctors and health experts as their most trusted source of COVID-19 information in the
baseline survey. We sent two rounds of messages debunking two misconceptions prevalent in India: first
that eating a vegetarian diet protects against COVID-19 (sent in October–November 2020), and second
that the immune system of Indians is resilient to COVID-19 (sent in December 2020–January 2021).
Pre-intervention, these two beliefs about protection against COVID-19 were the two most prevalent in
the targeted population (Appendix Figure D5): about two-thirds of our study population believed that a
vegetarian diet can protect from infection with COVID-19, and only 16% disagree with the idea that the
Indian immune system ensures protection against the virus.
To build the informative content, we first asked several doctors from renowned local institutions to reply,
unscripted, to the questions “Is it true that eating a vegetarian diet protects against COVID-19?” and
“Is it true that the immune system of Indians is resilient to COVID-19?”. Responses were then collated4WhatsApp chatbot is a software program that runs on the encrypted WhatsApp platform, purposely programmed for the
intervention. Users can communicate with the chatbot through the chat interface.
4

ensuring that every message was composed by a first part debunking the misconception and a second
part providing a reminder about the proven ways to protect against COVID-19. We refer to this as the
doctor message treatment arm. The full script is provided in Appendix E.
A control message was designed with a similar structure to hold all features not varied experimentally
constant, but replacing the informative content with an unsubstantiated gossip concerning Bollywood
stars. Sending a control message, rather than no message, allows us to disentangle the effects of the
intervention from receiving a message through mobile phone technologies. The final message duration
was 112 seconds for the doctor message and 40 seconds for the control message.
For each message, we introduced two additional variations by changing the signaled religious identity
of the messenger. In one version, keeping all else constant (including the informative content), the mes-
senger signaled a Hindu identity by dressing with traditional Hindu head wear and colors (see Appendix
E), using “namaste” as salutation, and introducing himself as “Rajesh”. In the other version, again
keeping all else constant, the messenger signaled a Muslim identity by dressing with traditional Muslim
head wear and colors, using “salam alaikum” as salutation, and introducing himself as “Abdul”.5 In our
analysis, we refer to religion concordance of the message when the signaled religious identity of the
messenger is the same as the religion stated by the receiver of the message. We therefore refer to this
cross-randomization as the religion concordance variation.
All messages were incentivized to increase attention to the message by giving participants the chance to
enter a lottery if they replied correctly to a follow-up question about the message. During the introduction
of the message, the messenger announced the financial incentive to be paid out through mobile top-
up.6 Lottery incentives have been widely used in experimental economics to increase response rates,
particularly relevant when faced with potentially extremely low uptake. For instance, Banerjee et al.
(2020), sending video messages to Indian citizens urging them to comply with COVID-19 policies and
report symptoms, achieved a viewing rate of information videos of only 1.14%, consistent with low rates
of ‘click-through’ studies (Richardson et al., 2007; Kanich et al., 2008).
We perform household-level randomization by randomly allocate targeted households, independent of
the number of mobile phones in each household, to receive one of the message variation, stratifying by
religion of the household head and by city. Randomization into the experimental arms was conducted
at the household level because the intervention is directed one-to-one through mobile phones. Using
households as the unit of randomization allows us to take advantage of greater variation in response to
the intervention within slums. Concerns over spillover effects are mitigated because the voice message5The names are the two most common male name by religion in the census of the targeted population. Refer to Armand
et al. (2021) for further details about the census.6We introduced two types of incentives: a low-incentive lottery with a value of Rs. 2,500 (US$35) and a high-incentive
lottery with a value of Rs. 5,000. The two modalities were randomly allocated to participants in the process of randomization.Results on the effectiveness of different incentives are shown in Appendix Tables G7–G9. Potentially driven by the lotteryamounts being both sizable for our study context (approximately 14 days of pay under the Government’s National RuralEmployment Generation Scheme), and in line with Porter and Whitcomb (2003), we do not find any differential impactsalong this margin.
5
is in the form of an automatic call which cannot be forwarded or shared, and the share of participants
accessing short videos through WhatsApp is small (see Section 2). There remains the possibility of word-
of-mouth information sharing, which we cannot test for. To the extent that it did occur, our estimates
would provide lower bounds to the true treatment effect.
2 Data
We draw on two data sources: administrative data on message delivery and time listened, and a panel
survey of slum residents.
Administrative data. We gather information about the delivery of both the WhatsApp chatbot and
the voice message, and about the share of the voice message that is listened by the user. Concerning
the WhatsApp chatbot, 50% of the sample had WhatsApp installed on their phone, 39% received the
message, 7% interacted with the chatbot, but only 3% replied accurately with ‘Hi’, a precondition to
play the video. The voice messages were instead sent to the whole sample, in which 37% picked-up
the phone when receiving the call, and once picked-up, the average listen time was 42 seconds (55%
of the message). Listening times vary between the experimental arms, given that the control message
was significantly shorter. For those who listened to the message, the average listening time was 51
seconds (43% of the message) of the doctor message, and 33 seconds (67% of the message) of the
control message.
Primary panel data. A baseline survey was collected in June–July 2020, followed by two panel data
waves in October–November 2020, and December 2020–January 2021 (3.5 and 5.5 months after the
baseline survey). Interviews were conducted via phone conversation. Multiple follow-up measurements
allows the averaging out of noise in the outcome variables, and increases power (McKenzie, 2012). The
sampling frame for targeted recipients was a census conducted in the second half of 2018 of more than
30,000 households living in the slums of the study area (see Armand et al., 2021 for further details). We
selected 5,261 residents to be part of the study, all of of which were sent the messages. Of these, we were
able to interview 3,991 at baseline, 3,816 during the first follow-up and 3,906 during the second follow-
up survey. Combining both follow-up surveys, we re-interviewed 87% of residents at least once, with
a low implied attrition rate (13%) compared to phone surveys conducted in similar settings.7 A likely
important driver of attrition rate is represented by people using multiple SIM cards to avail discounts
offered by different providers (Silver and Huang, 2019). Importantly, attrition is orthogonal to treatment
allocation (Panel B, Table C2).8
Appendix Table C1 presents descriptive statistics of the sample. Twenty-one percent are Muslim, similar
to the religion composition at the state level. Almost 80% of respondents are male, mostly represented7Response rates are typically around 50% in non-crisis contexts, while during crisis contexts this is expected to be lower.
For instance, a study during the Ebola crisis was able to re-interview only 38% (Himelein et al., 2020).8Appendix Table C3 correlates observable characteristics with attrition. Being female and dwelling owners reduces attrition.
6
by the household head, with an average age of 40 years. More than 80% live in a strong dwelling
with four other members and 38% have a ration card (i.e., an official document by state governments
for subsidized purchase of essential commodities). At the time of the baseline survey, when lockdown
restrictions started to ease in both cities, 12% of respondents report that at least one member was having
COVID-19 symptoms, and respondents knew on average 1.6 COVID-19 symptoms.
The surveys elicited information on households’ experiences during the COVID-19 pandemic, such as
their knowledge on how to prevent the virus, compliance with policies, risk perceptions, symptoms and
testing, as well as information on sources of information and trust.9
A key part of the surveys was the elicitation of the level of agreement or disagreement with miscon-
ceptions about prevention of COVID-19. In the follow-up surveys, we ask whether respondents agree or
disagree with the following ways of preventing COVID-19: (1) eating a vegetarian diet, (2) just being In-
dian because of stronger immune systems, (3) living in warm weather because the virus does not survive,
and (4) being a disease of rich people, poor people are safe.10 The idea that Indians have stronger immu-
nity to prevent COVID-19 is the one most widely held, with two thirds of respondents voicing agreement.
But even the least perceived misconception – that COVID-19 is a disease that only rich people can get – is
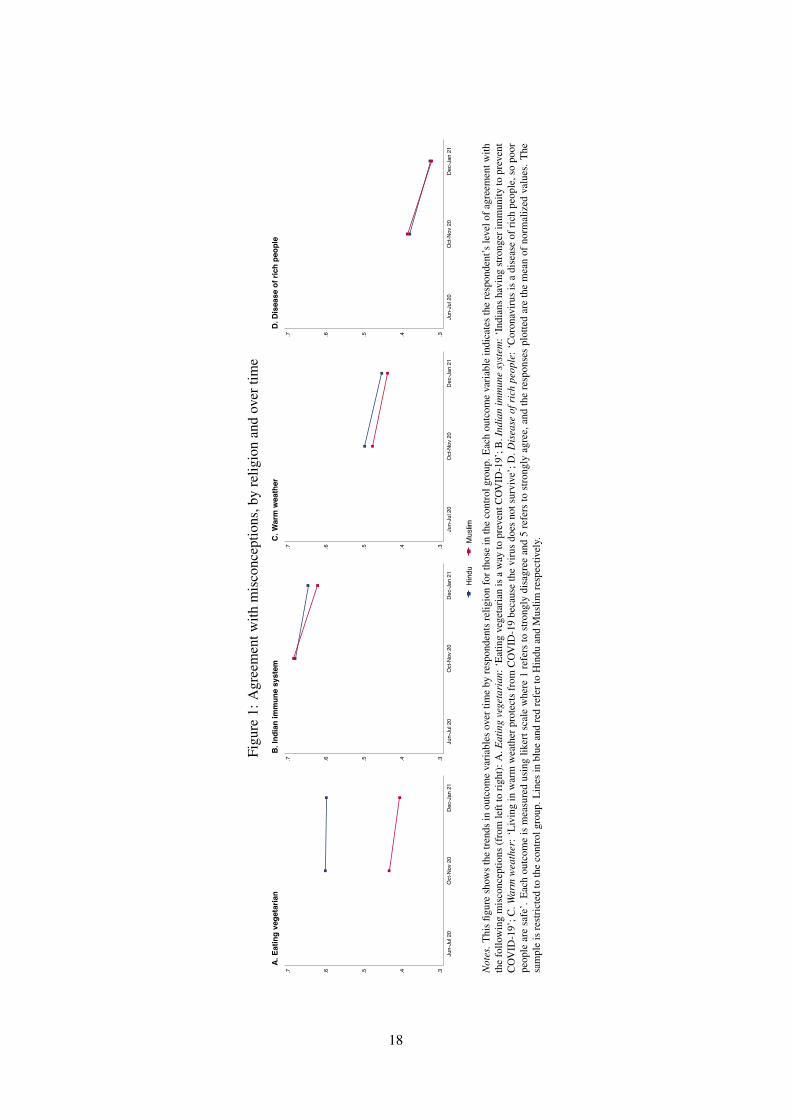
still believed by one third of respondents. Figure 1 shows the average (normalized) agreement with these
misconceptions over time (Appendix Figure D6 breaks down the level of agreement using categorical
responses). Responses to the misconception that eating a vegetarian diet is a mean to prevent COVID-19
differ in two ways from responses to other statements: the percentage of respondents agreeing does not
reduce over time, and the misconception is religion-salient, i.e. Hindus are significantly more likely to
hold this belief than Muslims, likely because they are also significantly more likely to follow a vegetarian
diet.
Because misconceptions are often spread by groups or individuals with a particular identity where the
legitimacy is drawn from, we introduce a novel survey instrument to capture misconceptions originating
from these specific sources. We first inform respondent that ‘we have surveyed people from UP and
would like to hear whether you agree with their opinion’. We then reveal identity information of the per-
son making a statement by providing a name which signals his or her religion. Similar to the messenger,
we choose names common to the local context. For a randomly selected one third of the sample the name
is associated with Hindu religion, for one third with Islam and for the remaining respondents, the state-
ment is introduced by ‘people say’. We elicit level of agreement with four statements that have a religious
connotation: [NAME] says/People say that (1) ‘if you are vegetarian, you do not need to worry about the
coronavirus’, (2) ‘if you are a good person you do not need to worry about the coronavirus’, (3) ‘unity
and brotherhood will help us fight the coronavirus’, and (4) ‘religious gatherings should be allowed’.
The first statement carries religious salience since, in the context of India, vegetarianism is widely asso-9In order to collect detailed high-quality data, while at the same time balancing the need for concise phone survey, some
modules were administered to a random subset of households only. This was for example the case for compliance with COVID-19 rules and regulations: some households were asked about social distancing and other households about hand washing.
10At baseline, we asked respondents about prevention of COVID-19 using open-ended questions. Answers included miscon-ceptions, which helped shaping the interventions and are summarized in Appendix D.
7
ciated with the dominant ideology of Hinduism. The second statement alludes to the idea that religion
helps a person to become a ‘good person’, and in the third statement, ‘unity and brotherhood’ is typically
connected with Islam, but in the context of India, it is also associated with the Hindu nationalist ruling
party Bharatiya Janata Party (BJP).11 The fourth statement talks explicitly about religious gatherings.
We highlight that this statement can be interpreted as an opinion rather than a misconception. It bears
weight in the study context in view of an early outbreak in India linked to a congregation by the Tab-
lighi Jamaat, an Islamic missionary movement, which led to strong Islamophobic reactions across media
(Menon, 2020).
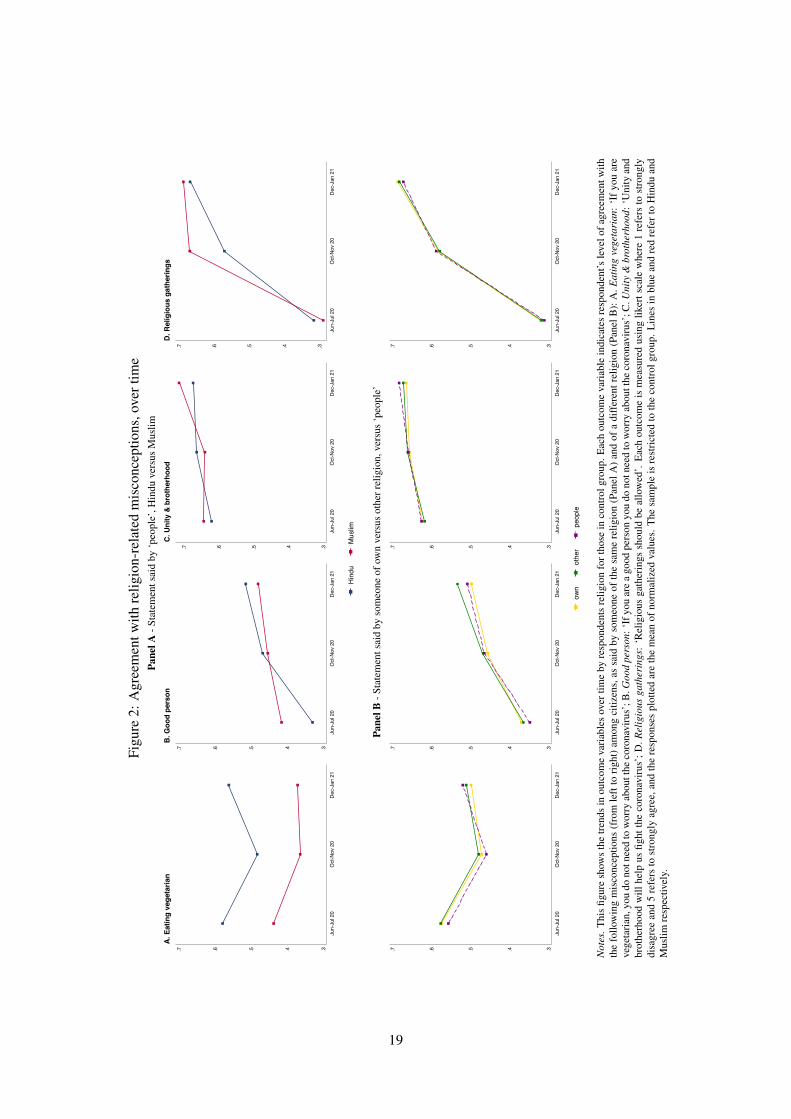
Panel A of Figure 2 shows levels of agreement for the random subset of households where statements
were said by ‘people’, split by whether the respondent is Hindu or Muslim. As with the generic statement,
Hindus are significantly more likely than Muslims to agree that vegetarianism implies not needing to
worry about being infected. Remaining statements, although carrying religious connotation, do not show
similarly stark differences by religion. Except for the statement about vegetarianism, we observe an
increase in agreement over time for both Hindus and Muslims. This trend is particularly stark for the
statement about religious gatherings, possibly linked to the fact that the first wave of cases was receding
when the follow-up data was collected, making it safer for gatherings to take place.
Panel B of Figure 2 displays levels of agreement with the statements said by someone of the same religion
as the respondent (‘own’), of a different religion (‘other’), or whether it was said by ‘people’. We find
relatively small differences in levels of agreement by religious concordance. This suggests low levels
of taste-based discrimination (driven by an aversion towards other religious identities) in our sample.12
The largest (statistically significant) difference is found in the statement ‘if you are a good person you do
not need to worry about the coronavirus’, where respondents tend to agree more, on average, when said
by somebody from another religion. Our study will shed light on whether one could leverage on these
(small) identity biases to correct misconceptions.
3 Results
To assess intervention impacts we rely on post-baseline data, in line with the trial registry (Armand et al.,
2020) and justified by having successfully created observationally-equivalent groups (we report mean
differences at baseline between control and treatment groups for various characteristics in Appendix
Table C1 and for outcomes at baseline in Appendix Table C2). We estimate treatment effects using the
following specification:11Slogans such as Vasudhaiva Kutumbakam (brotherhood of mankind) and unity among religions were evoked multiple times
by key party leadership before and during the pandemic as one of the ideological foundations of Hinduism (Kulkarni, 2017;Choudhury, 2020; Hindustan Times, 2020; The Economic Times, 2020).
12Low levels of taste-based discrimination could be driven by the close proximity households of different religions live in,thereby having more information about each other (Farber and Gibbons, 1996; Altonji and Pierret, 2001; Arnold et al., 2018).While one might be concerned that the name itself does not carry sufficient information for the respondent to react, we recordreligious concordance of the citizen to have significant treatment effects that survive multiple hypothesis testing (Section 3).
8
Yijt = β Ti + αXij + δt + εit (1)
where Yijt are outcomes of interest of recipient i in slum j at time t. Ti is an indicator variable equal
to 1 if the recipient i is in the treatment group, and 0 otherwise. Xij is a set of indicator variables for
randomization strata, and δt are period-of-survey indicator variables. The error term εit is assumed to be
clustered at the slum level.13 Because 63% of recipients did not receive or listen to any message (Section
1), the parameter β identifies the intention to treat (ITT) impact of the treatment.
Results are presented in Tables 1–3. In each table, Panel A provides estimates of treatment effects using
equation 1, where Ti indicates allocation to the doctor treatment, while Panel B restricts the sample to
those that were allocated to the doctor message and Ti becomes an indicator of religion concordance
between the messenger of the doctor message and the intended recipient. Appendix Tables C1–C2 show
that, conditional on having received the doctor messages, baseline characteristics are also balanced be-
tween those that were allocated to different introductions of to the informative content of the message.
Appendix G.4 reports heterogeneous impacts by pre-specified variables, as well as by a social desirability
index, and no noteworthy differences are found.
In terms of exposure to the intervention, participants who received the doctor message have a 2.0 percent-
age point higher probability of recalling at least one of the keywords about COVID-19 from the message
sent to their mobile phones (last Panel of Appendix Table C2). While small in magnitude, this is a
40% increase over the control mean. Appendix Tables G1–G3 show treatment on the treated estimates,
obtained through an instrumental variable strategy where the endogenous treatment variable a proxy of
treatment intensity, i.e., a variable that multiplies the amount of time the message is listened with the
number of key words mentioned during this time) is instrumented with the random treatment indicators
Ti.14 The first stages are strong both when comparing the exposure to the doctor message versus the
control message, and when comparing the exposure to a religious-concordant introduction to the doctor
message versus non-religious concordant introduction. The doctor message increases listening intensity
by 14 percentage points (p-value < 0.001) and the F-stat is 74.4. The religious concordance introduction
treatment has a similar coefficient and F-stat of 45.9. In line with expectations, IV estimates are larger in
magnitude, and their statistical significance remain comparable to ITT estimates.
Level of agreement with misconceptions
Table 1 presents estimates of treatment effects on agreement with COVID-19 misconceptions. Column
(1) concerns the misconception that eating vegetarian is a mean to prevent COVID-19, column (2) that
Indians have a stronger immunity to prevent COVID-19, column (3) is about agreement with the mis-13Results are robust to heteroskedasticity and to clustering standard errors at the individual level. In addition, using weights
to increase representativeness of the population does not affect results.14We estimate ‘listening time’ for those 2.5% that were able to view the video as 50% of the video length. Varying these
imputations does not alter results.
9
conception that living in warm weather protects from COVID-19 because the virus does not survive, and
column (4) that coronavirus is a disease of rich people, so poor people are safe.
We do not find any evidence that the doctor messages are successful in shifting agreement with these
general statements (Panel A). However, when the doctor message is introduced by religion-concordant
messenger, the respondent’s likelihood of agreeing with the statement that eating vegetarian protects
from getting COVID-19 reduces by 1.6 percentage points. This effect results from combining religion
concordance with the doctor message, rather than from the religion concordant introduction by itself
(Appendix Table G4 shows estimates of the effect of receiving the religion-concordant introduction with
the Bollywood control message). When accounting for multiple hypothesis testing, the p-value increases
from 0.04 to 0.16.
Table 2 assesses whether the interventions are effective when misconceptions are linked to identity and
local context. Columns (1)-(4) estimate impacts on agreement with statements, when the person making
the statement is of the same religion as the recipient, whereas in columns (5)-(8) the statement is made
by a person of a different religion.15 Columns (1) and (5) indicates level of agreement with [NAME]
saying that ‘if you are vegetarian, you do not need to worry about the coronavirus’, Columns (2) and
(6) that ‘if you are a good person you do not need to worry about the coronavirus’, Columns (3) and (7)
that ‘unity and brotherhood will help us fight the coronavirus’, and Columns (4) and (8) that ‘religious
gatherings should be allowed’.
Focusing first on the left Panel of the table, which shows outcomes where the statements are made by
someone of the same religion, we find that for statements 1 to 3 the estimated effects are in line with
those for the religious generic statement (Column (1) of Table 2), both in terms of size and sign. This
suggests that respondents might interpret generic statements as said by someone closer to their identity.
The effect of the religious-concordant introduction on the statement about vegetarianism is, however, no
longer statistically significant, possibly driven by the reduction in sample size due to only two-thirds of
the sample having been presented with a statement introduced by a named person.
Being allocated to the doctor message with a religion-concordant introduction reduces by 3 percentage
points the agreement with the misconception that ‘being a good person protects from getting the virus’.
This effect is statistically significant at the 5% level and is robust to multiple hypothesis testing. People
seem to be only persuaded to disagree with a statement said by their own religion when the message
delivered leverages on religion concordance.
The right Panel of Table 2 shows impact estimates when statements were made by someone of a differ-
ent religion as compared to the respondent. The doctor message reduces agreement with misconceptions
stated by someone else, statistically significant only for the statement of ‘being a good person’. The doc-
tor message successfully decreases agreement with this statement by 3.9 percentage points, statistically
significant and robust to multiple hypothesis testing. We find no effects driven by religion concordance.15Appendix Table G10 shows impacts when statements are said by ‘people’. We find no significant effects.
10
This effect brings the level of agreement with someone of another religion down to that of someone of the
own religion (Figure 2. For other statements, the baseline difference between ‘own’ and ‘other’ religion
is less pronounced, leaving less room to be aligned. Correcting misconceptions said by someone from
another religion is achieved through messages from doctors (a trusted source in our context), without the
need to leverage on religion concordance.
Knowledge and reported behavior
Column (1) in Table 3 shows impact estimates on the extent to which respondent check truthfulness of
news, proxied with an indicator variable equal to 1 if news shared or discussed with family and friends is
always or frequently checked for truthfulness. We find a significant reduction in reported fact checking of
news. We interpret this result as respondents having now received information they trust more, decreasing
their felt need for additional checks.
Columns (2)–(5) show impacts on knowledge of and compliance with COVID-19 WHO guidelines,
which are included at the end of the doctor message (i.e, using a mask in crowded places, social distanc-
ing, and washing hands). Knowledge of guidelines is calculated as the normalized mean of responses
on different policies, measured using a likert scale. Compliance with policy guidelines is captured as an
indicator variable, equal to 1 if the respondent does not visit any other slum nor receive any visitors from
other slums within the previous week, and 0 otherwise.
The increased exposure to the doctor message translates into changes in knowledge and reported behav-
ior. We find a significant increase in knowledge of guidelines about using a mask and on hand washing,
as well as a significant increase in reported compliance with these guidelines. Respondents are 4 per-
centage points more likely to report compliant behavior. The effects on knowledge are smaller, partly
attributable to the fact that knowledge on guidelines is high also without the intervention taking place.
When accounting for multiple hypothesis testing, only the effect on checking truthfulness loses signif-
icance at conventional levels, with the p-value changing to 0.107. The effect on reported behavior is
particularly encouraging considering that previous literature has found that slum residents would find it
challenging to adhere to COVID-19 guidelines, given the lack of access to water (Patel, 2020) and the
limitations on social distancing imposed by crowded spaces (Wasdani and Prasad, 2020).
4 Conclusions
The internet and social media have become popular resources for news. At the same time, they have be-
come spreaders of inaccurate and misleading information. Ensuring that misconceptions resulting from
misinformation and fake news do not drown out scientific evidence and affect behavior in consequential
ways is of global importance.
In this study, we demonstrate that a low-cost intervention, relying on mobile technology, can be effec-
11
tively deployed to reduce agreement with misconceptions about how to prevent COVID-19 infection.
We provide such evidence for a hugely important, while significantly understudied population: the urban
poor, living in overcrowded conditions at great risk of infectious diseases. Design choices are, however,
important. We show that messages from a trusted source can shift beliefs when the messenger and recip-
ient share identity. In our setting, the trusted source of information is a public health specialist (a doctor
from a local and renown institution) and the messenger is a local citizen (closer in socio-economic status)
of the same religion as the respondent. Even under these circumstances, we find that only misconceptions
that have a religious association are shifted, and only when Muslims and Hindus, the two main religions
in our setting, have on average different beliefs.
This study provides important insights into how governments and agencies across the world can rely on
mobile phone messages to counter COVID-19 misconceptions, and improve adherence to policy guide-
lines. While results highlight the importance of shaping messages to the characteristics of individual
citizens, further research is needed to understand how to target communication against misconception in
a more effective way.
References
Akbar, S. Z., Kukreti, D., Sagarika, S., and Pal, J. (2020). Increase in Communal Tone in COVID-19
Fake News in India: Study.
Akerlof, G. A. and Kranton, R. E. (2000). Economics and identity. Quarterly Journal of Economics,
115(3):715–753.
Al Jazeera (2020). ‘Do not buy from Muslims’: BJP leader in India calls for boy-
cott. https://www.aljazeera.com/news/2020/4/29/do-not-buy-from-muslims-bjp-leader-in-india-calls-
for-boycott.
Allcott, H. and Gentzkow, M. (2017). Social media and fake news in the 2016 election. Journal of
Economic Perspectives, 31(2):211–236.
Alsan, M. and Eichmeyer, S. (2021). Experimental Evidence on the Effectiveness of Non-Experts for
Improving Vaccine Demand.
Alsan, M., Garrick, O., and Graziani, G. (2019). Does diversity matter for health? Experimental evidence
from Oakland. American Economic Review, 109(12):4071–4111.
Alsan, M., Stantcheva, S., Yang, D., and Cutler, D. (2020). Disparities in coronavirus 2019 reported in-
cidence, knowledge, and behavior among us adults. JAMA Network Open, 3(6):e2012403–e2012403.
Altonji, J. G. and Pierret, C. R. (2001). Employer learning and statistical discrimination. Quarterly
Journal of Economics, 116(1):313–350.
12
Armand, A., Augsburg, B., and Bancalari, A. (2020). COVID-19, fake news and religious tensions:
experimental evidence from India. AEA RCT Registry, October 08. https://doi.org/10.1257/rct.6564-
1.0.
Armand, A., Augsburg, B., and Bancalari, A. (2021). Coordination and the Poor Maintenance Trap: an
Experiment on Public Infrastructure in India. CEPR discussion paper DP16284, Centre for Economic
Policy and Research.
Arnold, D., Dobbie, W., and Yang, C. S. (2018). Racial bias in bail decisions. Quarterly Journal of
Economics, 133(4):1885–1932.
Arya, S. (2020). Muslims face social boycott in Buldhana, business too hit. The Times
of India, https://timesofindia.indiatimes.com/city/nagpur/muslims-face-social-boycott-in-buldhana-
business-too-hit/articleshow/7.
Banaji, S. and Bhat, R. (2020). WhatsApp Vigilantes: An exploration of citizen reception and circulation
of WhatsApp misinformation linked to mob violence in India. LSE Media and Communication, 2:1–
14.
Banerjee, A., Faye, M., Krueger, A., Niehaus, P., and Suri, T. (2020). Effects of a Universal Basic Income
during the pandemic. Technical report, UC San Diego.
Barrera, O., Guriev, S., Henry, E., and Zhuravskaya, E. (2020). Facts, alternative facts, and fact checking
in times of post-truth politics. Journal of Public Economics, 182:104123.
Bavel, J. J., Baicker, K., Boggio, P. S., Capraro, V., Cichocka, A., Cikara, M., Crockett, M. J., Crum,
A. J., Douglas, K. M., Druckman, J. N., Drury, J., Dube, O., Ellemers, N., Finkel, E. J., Fowler, J. H.,
Gelfand, M., Han, S., Haslam, S. A., Jetten, J., Kitayama, S., Mobbs, D., Napper, L. E., Packer, D. J.,
Pennycook, G., Peters, E., Petty, R. E., Rand, D. G., Reicher, S. D., Schnall, S., Shariff, A., Skitka,
L. J., Smith, S. S., Sunstein, C. R., Tabri, N., Tucker, J. A., van der Linden, S., van Lange, P., Weeden,
K. A., Wohl, M. J., Zaki, J., Zion, S. R., and Willer, R. (2020). Using social and behavioural science
to support COVID-19 pandemic response. Nature Human Behaviour, 4(5):460–471.
Bazzi, S., Gaduh, A., Rothenberg, A. D., and Wong, M. (2019). Unity in diversity? How intergroup
contact can foster nation building. American Economic Review, 109(11):3978–4025.
Besley, T., Burgess, R., and Pratt, A. (2002). Mass media and political accountability.
Bhatia, M. (2021). State Violence in India: From Border Killings to the National Register of Citizens
and the Citizenship Amendment Act. In Stealing Time, pages 171–196. Springer.
Bolsen, T. and Druckman, J. N. (2015). Counteracting the Politicization of Science. Journal of Commu-
nication, 65(5):745–769.
13
Bursztyn, L., Egorov, G., Enikolopov, R., and Petrova, M. (2019). Social Media and Xenophobia:
Evidence from Russia. SSRN Electronic Journal.
Bursztyn, L., Rao, A., Roth, C., and Yanagizawa-Drott, D. (2020). Misinformation During a Pandemic.
Card, D. and Dahl, G. B. (2011). Family violence and football: The effect of unexpected emotional cues
on violent behavior. Quarterly Journal of Economics, 126(1):103–143.
Chan, M. p. S., Jones, C. R., Hall Jamieson, K., and Albarracın, D. (2017). Debunking: A Meta-
Analysis of the Psychological Efficacy of Messages Countering Misinformation. Psychological Sci-
ence, 28(11):1531–1546.
Choudhury, C. (2020). Under the BJP’s Big Tent. The Caravan. A Journal of Politics and Culture.
Clayton, K., Davis, J., Hinckley, K., and Horiuchi, Y. (2019). Partisan motivated reasoning and misin-
formation in the media: Is news from ideologically uncongenial sources more suspicious? Japanese
Journal of Political Science, 20(3):129–142.
Dahl, G. and Dellavigna, S. (2009). Does movie violence increase violent crime? Quarterly Journal of
Economics, 124(2):677–734.
Desai, S. and Amarasingam, A. (2020). CoronaJihad: Covid-19, misinformation, and anti-Muslim vio-
lence in India. Technical report, ISD Global.
Ecker, U. K., Lewandowsky, S., and Tang, D. T. (2010). Explicit warnings reduce but do not eliminate
the continued influence of misinformation. Memory and Cognition, 38(8):1087–1100.
Eichengreen, B., Aksoy, C. G., and Saka, O. (2021). Revenge of the experts: Will COVID-19 renew or
diminish public trust in science? Journal of Public Economics, 193:104343.
Farber, H. S. and Gibbons, R. (1996). Learning and wage dynamics. Quarterly Journal of Economics,
111(4):1006–1047.
Gauchat, G. (2012). Politicization of science in the public sphere: A study of public trust in the United
States, 1974 to 2010. American Sociological Review, 77(2):167–187.
Gerber, A. S., Karlan, D., and Bergan, D. (2009). Does the media matter? A field experiment measuring
the effect of newspapers on voting behavior and political opinions. American Economic Journal:
Applied Economics, 1(2):35–52.
Greenwood, B. N., Carnahan, S., and Huang, L. (2018). Patient–physician gender concordance and
increased mortality among female heart attack patients. Proceedings of the National Academy of
Sciences of the United States of America, 115(34):8569–8574.
14

Greenwood, B. N., Hardeman, R. R., Huang, L., and Sojourner, A. (2020). Physician-patient racial
concordance and disparities in birthing mortality for newborns. Proceedings of the National Academy
of Sciences of the United States of America, 117(35):21194–21200.
Greyling, C., Maulit, J. A., Parry, S., Robinson, D., Smith, S., Street, A., and Vitillo, R. (2016). Lessons
from the Faith-Driven Response to the West africa Ebola Epidemic.
Habyarimana, J., Humphreys, M., Posner, D. N., and Weinstein, J. M. (2007). Why does ethnic diversity
undermine public goods provision? American Political Science Review, 101(4):709–725.
Hill, A., Jones, D., and Woodworth, L. (2020). Physician-Patient Race-Match and Patient Outcomes.
Himelein, K., Eckman, S., and McKenzie, D. (2020). Mobile Phone Surveys for Understanding COVID-
19 Impacts: Part II Response, Quality, and Questions.
Hindustan Times (2020). Modi calls for unity, says virus doesn’t see religion.
https://www.hindustantimes.com/india-news/modi-calls-for-unity-saysvirus-doesn-t-see-
religion/story-odKsutBpjYQ6hdv5lVWj, New Delhi.
Iyer, S. (2016). The new economics of religion. Journal of Economic Literature, 54(2):395–411.
Jensen, R. and Oster, E. (2009). The power of TV: Cable television and women’s status in India. Quar-
terly Journal of Economics, 124(3):1057–1094.
Kanich, C., Kreibich, C., Levchenko, K., Enright, B., Voelker, G. M., Paxsonf, V., and Savage, S. (2008).
Spamalytics: An empirical analysis of spam marketing conversion. Proceedings of the ACM Confer-
ence on Computer and Communications Security, pages 3–14.
Kearney, M. S. and Levine, P. B. (2015). Media influences on social outcomes: The impact of MTV’s
16 and pregnant on teen childbearing. American Economic Review, 105(12):3597–3632.
Khan, A., Nasim, S., Shaukat, M. I., and Stegmann, A. (2021). Building Trust in the State with Informa-
tion: Evidence from Urban Punjab. Journal of Public Economics, forthcomin.
Kulkarni, S. (2017). RSS-BJP Symbiosis: On the Cusp of Culture and Politics. Prabhat Prakashan, New
Delhi.
La Ferrara, E., Chong, A., and Duryea, S. (2012). Soap operas and fertility: Evidence from Brazil.
American Economic Journal: Applied Economics, 4(4):1–31.
Lazer, D. M., Baum, M. A., Benkler, Y., Berinsky, A. J., Greenhill, K. M., Menczer, F., Metzger, M. J.,
Nyhan, B., Pennycook, G., Rothschild, D., Schudson, M., Sloman, S. A., Sunstein, C. R., Thorson,
E. A., Watts, D. J., and Zittrain, J. L. (2018). The science of fake news: Addressing fake news requires
a multidisciplinary effort. Science, 359(6380):1094–1096.
15
Lowe, M. (2021). Types of contact: A field experiment on collaborative and adversarial caste integration.
American Economic Review, 111(6):1807–1844.
McKenzie, D. (2012). Beyond baseline and follow-up: The case for more T in experiments. Journal of
Development Economics, 99(2):210–221.
Menon, S. (2020). Coronavirus: The human cost of fake news in India. BBC News, BBC Reality Check
https://www.bbc.co.uk/news/world-asia-india-53165436.
Mitra, A. and Ray, D. (2014). Implications of an economic theory of conflict: Hindu-Muslim violence
in India. Journal of Political Economy, 122(4):719–765.
Muller, K. and Schwarz, C. (2021). Fanning the Flames of Hate: Social Media and Hate Crime. Journal
of the European Economic Association, 19(4):2131–2167.
O’Keefe, D. J. (2016). Persuasion: Theory and Research. SAGE Publications, Inc, Thousand Oaks, CA,
3 edition.
Olken, B. A. (2009). Do television and radio destroy social capital? Evidence from indonesian villages.
American Economic Journal: Applied Economics, 1(4):1–33.
Paluck, E. L. and Green, D. P. (2009). Deference, dissent, and dispute resolution: An experimental
intervention using mass media to change norms and behavior in Rwanda. American Political Science
Review, 103(4):622–644.
Patel, A. (2020). Preventing COVID-19 Amid Public Health and Urban Planning Failures in Slums of
Indian Cities. World Medical and Health Policy, 12(3):266–273.
Porter, S. R. and Whitcomb, M. E. (2003). The impact of lottery incentives on student survey response
rates. Research in Higher Education, 44(4):389–407.
Purohit, K. (2020). Misinformation, fake news spark India coronavirus fears.
Richardson, M., Dominowska, E., and Ragno, R. (2007). Predicting clicks: Estimating the click-through
rate for new ads. 16th International World Wide Web Conference, WWW2007, pages 521–530.
Sadish, D., Adhvaryu, A., and Nyshadham, A. (2021). (Mis)information and anxiety: Evidence from a
randomized Covid-19 information campaign. Journal of Development Economics, 152(102699).
Scheufele, D. A. and Krause, N. M. (2019). Science audiences, misinformation, and fake news. Pro-
ceedings of the National Academy of Sciences of the United States of America, 116(16):7662–7669.
Silver, L. and Huang, C. (2019). Smartphone, Social Media Users Have Broader Social Networks In
Emerging Economies.
Statista (2021). Main sources of news across India in 2019, by age.
16

Stromberg, D. (2004). Mass media competition, political competition, and public policy. Review of
Economic Studies, 71(1):265–284.
The Economic Times (2020). COVID-19 fallout makes Indian philosophy of ’Vasudhaiva Kutumbakam’
more relevant. https://m.economictimes.com/news/politics-and-nation/covid-19-fallout-makes-indi.
Torres, C., Ogbu-Nwobodo, L., Alsan, M., Stanford, F. C., Banerjee, A., Breza, E., Chandrasekhar,
A. G., Eichmeyer, S., Karnani, M., Loisel, T., Goldsmith-Pinkham, P., Olken, B. A., Vautrey, P. L.,
Warner, E., and Duflo, E. (2021). Effect of Physician-Delivered COVID-19 Public Health Messages
and Messages Acknowledging Racial Inequity on Black and White Adults’ Knowledge, Beliefs, and
Practices Related to COVID-19: A Randomized Clinical Trial. JAMA Network Open, 4(7):e2117115–
e2117115.
van der Linden, S., Leiserowitz, A., Rosenthal, S., and Maibach, E. (2017). Inoculating the Public against
Misinformation about Climate Change. Global Challenges, 1(2):1600008.
Vicario, M. D., Bessi, A., Zollo, F., Petroni, F., Scala, A., Caldarelli, G., Stanley, H. E., and Quattro-
ciocchi, W. (2016). The spreading of misinformation online. Proceedings of the National Academy of
Sciences of the United States of America, 113(3):554–559.
Wasdani, K. P. and Prasad, A. (2020). The impossibility of social distancing among the urban poor: the
case of an Indian slum in the times of COVID-19. Local Environment, 25(5):414–418.
World Bank (2020). World Development Indicators. Technical report.
World Health Organisation (2020). COVID-19 Response. Seventy-third world health assembly
(a73.conf./1 rev. 1), World Health Organization.
17
Figu
re1:
Agr
eem
entw
ithm
isco
ncep
tions
,by
relig
ion
and
over
time
.3.4.5.6.7
Jun-
Jul 2
0O
ct-N
ov 2
0De
c-Ja
n 21
A. E
atin
g ve
geta
rian
.3.4.5.6.7
Jun-
Jul 2
0O
ct-N
ov 2
0De
c-Ja
n 21
B. I
ndia
n im
mun
e sy
stem
.3.4.5.6.7
Jun-
Jul 2
0O
ct-N
ov 2
0De
c-Ja
n 21
C. W
arm
wea
ther
.3.4.5.6.7
Jun-
Jul 2
0O
ct-N
ov 2
0De
c-Ja
n 21
D. D
isea
se o
f ric
h pe
ople
Hind
uM
uslim
Not
es.T
his
figur
esh
ows
the
tren
dsin
outc
ome
vari
able
sov
ertim
eby
resp
onde
nts
relig
ion
fort
hose
inth
eco
ntro
lgro
up.E
ach
outc
ome
vari
able
indi
cate
sth
ere
spon
dent
’sle
velo
fagr
eem
entw
ithth
efo
llow
ing
mis
conc
eptio
ns(f
rom
left
tori
ght)
:A.E
atin
gve
geta
rian
:‘E
atin
gve
geta
rian
isa
way
topr
even
tCO
VID
-19’
;B.I
ndia
nim
mun
esy
stem
:‘In
dian
sha
ving
stro
nger
imm
unity
topr
even
tC
OV
ID-1
9’;C
.War
mw
eath
er:
‘Liv
ing
inw
arm
wea
ther
prot
ects
from
CO
VID
-19
beca
use
the
viru
sdo
esno
tsur
vive
’;D
.Dis
ease
ofri
chpe
ople
:‘C
oron
avir
usis
adi
seas
eof
rich
peop
le,s
opo
orpe
ople
are
safe
’.E
ach
outc
ome
ism
easu
red
usin
glik
erts
cale
whe
re1
refe
rsto
stro
ngly
disa
gree
and
5re
fers
tost
rong
lyag
ree,
and
the
resp
onse
spl
otte
dar
eth
em
ean
ofno
rmal
ized
valu
es.
The
sam
ple
isre
stri
cted
toth
eco
ntro
lgro
up.L
ines
inbl
uean
dre
dre
fert
oH
indu
and
Mus
limre
spec
tivel
y.
18
Figu
re2:
Agr
eem
entw
ithre
ligio
n-re
late
dm
isco
ncep
tions
,ove
rtim
ePa
nelA
-Sta
tem
ents
aid
by‘p
eopl
e’,H
indu
vers
usM
uslim
.3.4.5.6.7
Jun-
Jul 2
0O
ct-N
ov 2
0De
c-Ja
n 21
A. E
atin
g ve
geta
rian
.3.4.5.6.7
Jun-
Jul 2
0O
ct-N
ov 2
0De
c-Ja
n 21
B. G
ood
pers
on
.3.4.5.6.7
Jun-
Jul 2
0O
ct-N
ov 2
0De
c-Ja
n 21
C. U
nity
& b
roth
erho
od
.3.4.5.6.7
Jun-
Jul 2
0O
ct-N
ov 2
0De
c-Ja
n 21
D. R
elig
ious
gat
herin
gs
Hind
uM
uslim
Pane
lB-S
tate
men
tsai
dby
som
eone
ofow
nve
rsus
othe
rrel
igio
n,ve
rsus
‘peo
ple’
.3.4.5.6.7
Jun-
Jul 2
0O
ct-N
ov 2
0De
c-Ja
n 21
.3.4.5.6.7
Jun-
Jul 2
0O
ct-N
ov 2
0De
c-Ja
n 21
.3.4.5.6.7
Jun-
Jul 2
0O
ct-N
ov 2
0De
c-Ja
n 21
.3.4.5.6.7
Jun-
Jul 2
0O
ct-N
ov 2
0De
c-Ja
n 21
own
othe
rpe
ople
Not
es.T
his
figur
esh
ows
the
tren
dsin
outc
ome
vari
able
sov
ertim
eby
resp
onde
nts
relig
ion
fort
hose
inco
ntro
lgro
up.E
ach
outc
ome
vari
able
indi
cate
sre
spon
dent
’sle
velo
fagr
eem
entw
ithth
efo
llow
ing
mis
conc
eptio
ns(f
rom
left
tori
ght)
amon
gci
tizen
s,as
said
byso
meo
neof
the
sam
ere
ligio
n(P
anel
A)
and
ofa
diff
eren
trel
igio
n(P
anel
B):
A.E
atin
gve
geta
rian
:‘I
fyo
uar
eve
geta
rian
,you
dono
tnee
dto
wor
ryab
outt
heco
rona
viru
s’;B
.Goo
dpe
rson
:‘If
you
are
ago
odpe
rson
you
dono
tnee
dto
wor
ryab
outt
heco
rona
viru
s’;C
.Uni
ty&
brot
herh
ood:
‘Uni
tyan
dbr
othe
rhoo
dw
illhe
lpus
fight
the
coro
navi
rus’
;D.R
elig
ious
gath
erin
gs:
‘Rel
igio
usga
ther
ings
shou
ldbe
allo
wed
’.E
ach
outc
ome
ism
easu
red
usin
glik
erts
cale
whe
re1
refe
rsto
stro
ngly
disa
gree
and
5re
fers
tost
rong
lyag
ree,
and
the
resp
onse
spl
otte
dar
eth
em
ean
ofno
rmal
ized
valu
es.
The
sam
ple
isre
stri
cted
toth
eco
ntro
lgro
up.
Lin
esin
blue
and
red
refe
rto
Hin
duan
dM
uslim
resp
ectiv
ely.
19
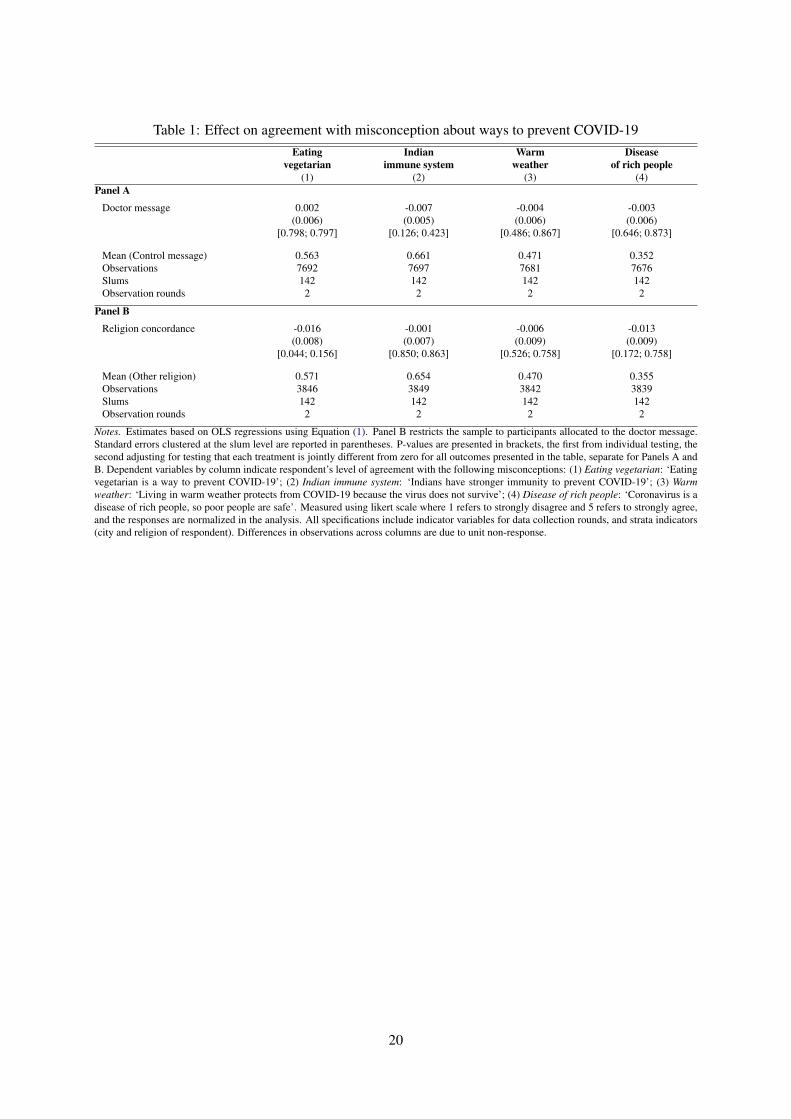
Table 1: Effect on agreement with misconception about ways to prevent COVID-19Eating Indian Warm Disease
vegetarian immune system weather of rich people(1) (2) (3) (4)
Panel A
Doctor message 0.002 -0.007 -0.004 -0.003(0.006) (0.005) (0.006) (0.006)
[0.798; 0.797] [0.126; 0.423] [0.486; 0.867] [0.646; 0.873]
Mean (Control message) 0.563 0.661 0.471 0.352Observations 7692 7697 7681 7676Slums 142 142 142 142Observation rounds 2 2 2 2
Panel B
Religion concordance -0.016 -0.001 -0.006 -0.013(0.008) (0.007) (0.009) (0.009)
[0.044; 0.156] [0.850; 0.863] [0.526; 0.758] [0.172; 0.758]
Mean (Other religion) 0.571 0.654 0.470 0.355Observations 3846 3849 3842 3839Slums 142 142 142 142Observation rounds 2 2 2 2
Notes. Estimates based on OLS regressions using Equation (1). Panel B restricts the sample to participants allocated to the doctor message.Standard errors clustered at the slum level are reported in parentheses. P-values are presented in brackets, the first from individual testing, thesecond adjusting for testing that each treatment is jointly different from zero for all outcomes presented in the table, separate for Panels A andB. Dependent variables by column indicate respondent’s level of agreement with the following misconceptions: (1) Eating vegetarian: ‘Eatingvegetarian is a way to prevent COVID-19’; (2) Indian immune system: ‘Indians have stronger immunity to prevent COVID-19’; (3) Warmweather: ‘Living in warm weather protects from COVID-19 because the virus does not survive’; (4) Disease of rich people: ‘Coronavirus is adisease of rich people, so poor people are safe’. Measured using likert scale where 1 refers to strongly disagree and 5 refers to strongly agree,and the responses are normalized in the analysis. All specifications include indicator variables for data collection rounds, and strata indicators(city and religion of respondent). Differences in observations across columns are due to unit non-response.
20

Tabl
e2:
Eff
ecto
nag
reem
entw
ithm
isco
ncep
tions
said
byso
meo
neof
own
orot
herr
elig
ion
...fr
omow
nre
ligio
n...
from
othe
rre
ligio
nE
atin
gG
ood
Uni
ty&
Rel
igio
usE
atin
gG
ood
Uni
ty&
Rel
igio
usve
geta
rian
pers
onbr
othe
rhoo
dga
ther
ings
vege
tari
anpe
rson
brot
herh
ood
gath
erin
gs(1
)(2
)(3
)(4
)(5
)(6
)(7
)(8
)Pa
nelA
Doc
torm
essa
ge0.
003
0.01
10.
010
-0.0
02-0
.014
-0.0
39-0
.001
-0.0
11(0
.009
)(0
.010
)(0
.009
)(0
.008
)(0
.009
)(0
.009
)(0
.009
)(0
.009
)[0
.716
;0.9
20]
[0.2
47;0
.674
][0
.287
;0.6
54]
[0.7
57;0
.755
][0
.141
;0.4
02]
[0.0
00;0
.000
][0
.883
;0.8
77]
[0.2
36;0
.425
]
Mea
n(C
ontr
olm
essa
ge)
0.48
50.
476
0.66
00.
635
0.49
50.
501
0.66
60.
631
Obs
erva
tions
3040
3138
3049
3118
3111
3067
3125
3101
Slum
s14
214
214
214
214
214
214
214
2O
bser
vatio
nro
unds
22
22
22
22
Pane
lB
Rel
igio
nco
ncor
danc
e-0
.015
-0.0
30-0
.015
0.01
4-0
.002
0.01
50.
006
-0.0
07(0
.012
)(0
.012
)(0
.013
)(0
.011
)(0
.013
)(0
.015
)(0
.015
)(0
.013
)[0
.222
;0.4
04]
[0.0
14;0
.067
][0
.246
;0.2
50]
[0.1
91;0
.473
][0
.888
;0.8
83]
[0.3
16;0
.791
][0
.694
;0.9
06]
[0.5
76;0
.927
]
Mea
n(O
ther
relig
ion)
0.49
20.
500
0.67
90.
626
0.48
10.
456
0.66
30.
626
Obs
erva
tions
1514
1584
1530
1568
1606
1519
1505
1536
Slum
s14
214
214
014
114
214
114
213
7O
bser
vatio
nro
unds
22
22
22
22
Not
es.E
stim
ates
base
don
OL
Sre
gres
sion
sus
ing
equa
tion
(1).
Pane
lBre
stri
cts
the
sam
ple
topa
rtic
ipan
tsal
loca
ted
toth
edo
ctor
mes
sage
.Sta
ndar
der
rors
clus
tere
dat
the
slum
leve
lare
repo
rted
inpa
rent
hese
s.P-
valu
esar
epr
esen
ted
inbr
acke
ts,t
hefir
stfr
omin
divi
dual
test
ing,
the
seco
ndad
just
ing
fort
estin
gth
atea
chtr
eatm
enti
sjo
intly
diff
eren
tfro
mze
ro,t
estin
gjo
intly
colu
mns
(1)-
(4)a
nd(5
)-(8
),se
para
tefo
rPan
els
Aan
dB
.Dep
ende
ntva
riab
les
byco
lum
nin
dica
tere
spon
dent
’sle
velo
fag
reem
entw
ithth
efo
llow
ing
mis
conc
eptio
ns(f
rom
left
tori
ght)
amon
gci
tizen
s,as
said
byso
meo
neof
the
sam
ere
ligio
n(P
anel
A)
and
ofa
diff
eren
trel
igio
n(P
anel
B):
(1)
Eat
ing
vege
tari
an:
‘If
you
are
vege
tari
an,y
oudo
notn
eed
tow
orry
abou
tthe
coro
navi
rus’
;(2)
Goo
dpe
rson
:‘I
fyo
uar
ea
good
pers
onyo
udo
notn
eed
tow
orry
abou
tthe
coro
navi
rus’
;(3)
Uni
ty&
brot
herh
ood:
‘Uni
tyan
dbr
othe
rhoo
dw
illhe
lpus
fight
the
coro
navi
rus’
;(4)
Rel
igio
usga
ther
ings
:‘R
elig
ious
gath
erin
gssh
ould
beal
low
ed’.
Eac
hou
tcom
eis
mea
sure
dus
ing
liker
tsca
lew
here
1re
fers
tost
rong
lydi
sagr
eean
d5
refe
rsto
stro
ngly
agre
e,an
dth
ere
spon
ses
plot
ted
are
the
mea
nof
norm
aliz
edva
lues
.A
llsp
ecifi
catio
nsin
clud
ein
dica
tor
vari
able
sfo
rda
taco
llect
ion
roun
ds,a
ndst
rata
indi
cato
rs(c
ityan
dre
ligio
nof
resp
onde
nt).
Diff
eren
ces
inob
serv
atio
nsac
ross
colu
mns
are
due
toun
itno
n-re
spon
se.
21

Table 3: Effect on behavioral outcomesCheck Knowledge of policy guidelines Compliance with
truthfulness Using mask Social distancing Wash hands guidelines(1) (2) (3) (4) (5)
Panel A
Doctor message -0.023 0.006 0.005 0.006 0.041(0.010) (0.003) (0.004) (0.003) (0.015)
[0.029; 0.107] [0.030; 0.088] [0.195; 0.200] [0.042; 0.077] [0.006; 0.032]
Mean (Control message) 0.352 0.813 0.799 0.786 0.578Observations 7700 7696 7698 7696 5079Slums 142 142 142 142 142Observation rounds 2 2 2 2 2
Panel B
Religion concordance 0.006 -0.002 -0.006 -0.004 0.026(0.015) (0.005) (0.004) (0.005) (0.022)
[0.687; 0.693] [0.628; 0.857] [0.202; 0.645] [0.338; 0.706] [0.241; 0.686]
Mean (Other religion) 0.326 0.820 0.806 0.795 0.604Observations 3851 3849 3849 3849 2519Slums 142 142 142 142 142Observation rounds 2 2 2 2 2
Notes. Estimates based on OLS regressions using equation (1). Panel B restricts the sample to participants allocated to the doctor message.Standard errors clustered at the slum level are reported in parentheses. P-values are presented in brackets, the first from individual testing,the second adjusting for testing that each treatment is jointly different from zero for all outcomes presented in the table, separate for PanelsA and B. Dependent variables in Column (1) Check truthfulness is indicator variable equal to 1 if the respondent ’always or very frequently’checks the truthfulness of news s/he shares or discusses with family and friends, and 0 otherwise. Columns (2)–(4) indicate respondent’s levelof agreement with (normalized mean of) COVID-19 guidelines, measured using likert scale where 1 refers to strongly disagree and 5 refers tostrongly agree. In particular, column (2) Using mask concerns mask-wearing in crowded places; column (3) Social distancing concerns keepingphysical distance with other people; column (4) Wash hands concerns washing hands more frequently and for longer with soap. Column (5)Compliance with guidelines is an indicator variable equal to 1 if respondent complied with a randomly asked COVID-19 guideline (eitherleaving the slum and receiving visitors or washing hands after all events indicated by the World Health Organization), and 0 otherwise. Allspecifications include indicator variables for data collection rounds, and strata indicators (city and religion of respondent). Differences inobservations across columns are due to unit non-response, as well as some outcomes collected only for a random sub-set of study participants.
22
ONLINE APPENDIX
Countering misinformation with targeted messages: Experimental evidence using mobile phones
Alex Armand, Britta Augsburg, Antonella Bancalari and Kalyan Kumar Kameshwara
A The COVID-19 pandemic and infodemic in UP
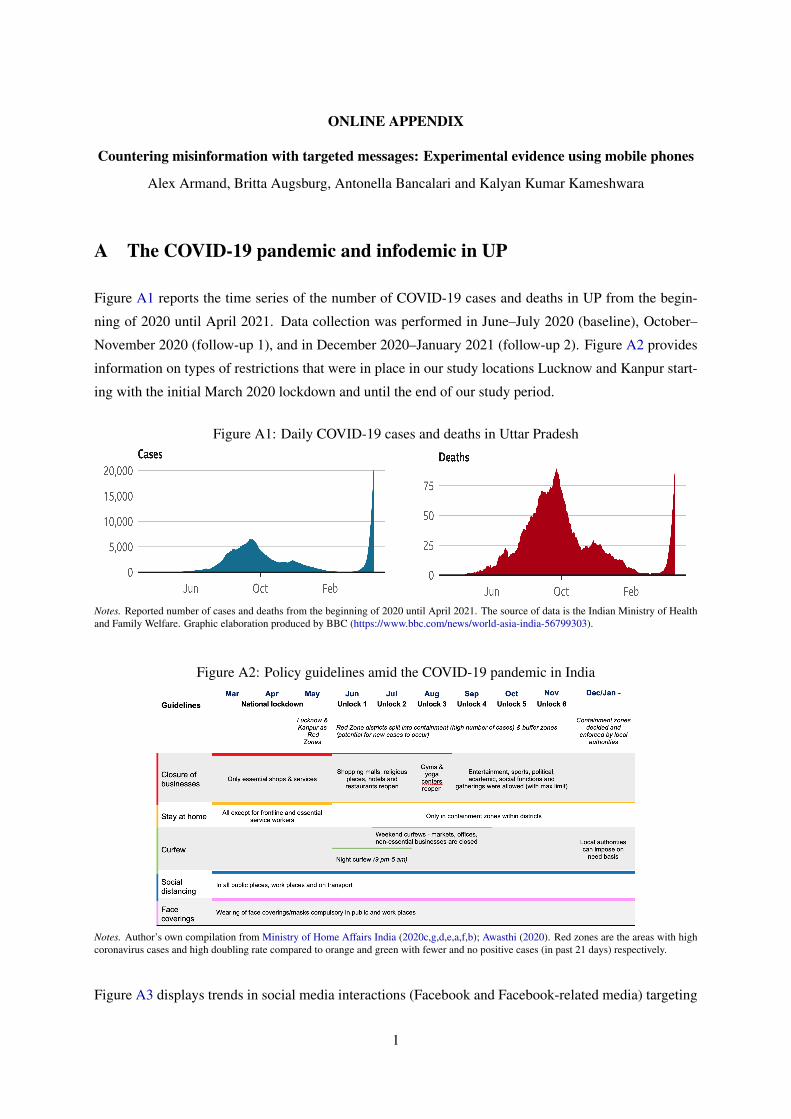
Figure A1 reports the time series of the number of COVID-19 cases and deaths in UP from the begin-
ning of 2020 until April 2021. Data collection was performed in June–July 2020 (baseline), October–
November 2020 (follow-up 1), and in December 2020–January 2021 (follow-up 2). Figure A2 provides
information on types of restrictions that were in place in our study locations Lucknow and Kanpur start-
ing with the initial March 2020 lockdown and until the end of our study period.
Figure A1: Daily COVID-19 cases and deaths in Uttar Pradesh
Notes. Reported number of cases and deaths from the beginning of 2020 until April 2021. The source of data is the Indian Ministry of Healthand Family Welfare. Graphic elaboration produced by BBC (https://www.bbc.com/news/world-asia-india-56799303).
Figure A2: Policy guidelines amid the COVID-19 pandemic in India
Notes. Author’s own compilation from Ministry of Home Affairs India (2020c,g,d,e,a,f,b); Awasthi (2020). Red zones are the areas with highcoronavirus cases and high doubling rate compared to orange and green with fewer and no positive cases (in past 21 days) respectively.
Figure A3 displays trends in social media interactions (Facebook and Facebook-related media) targeting
1
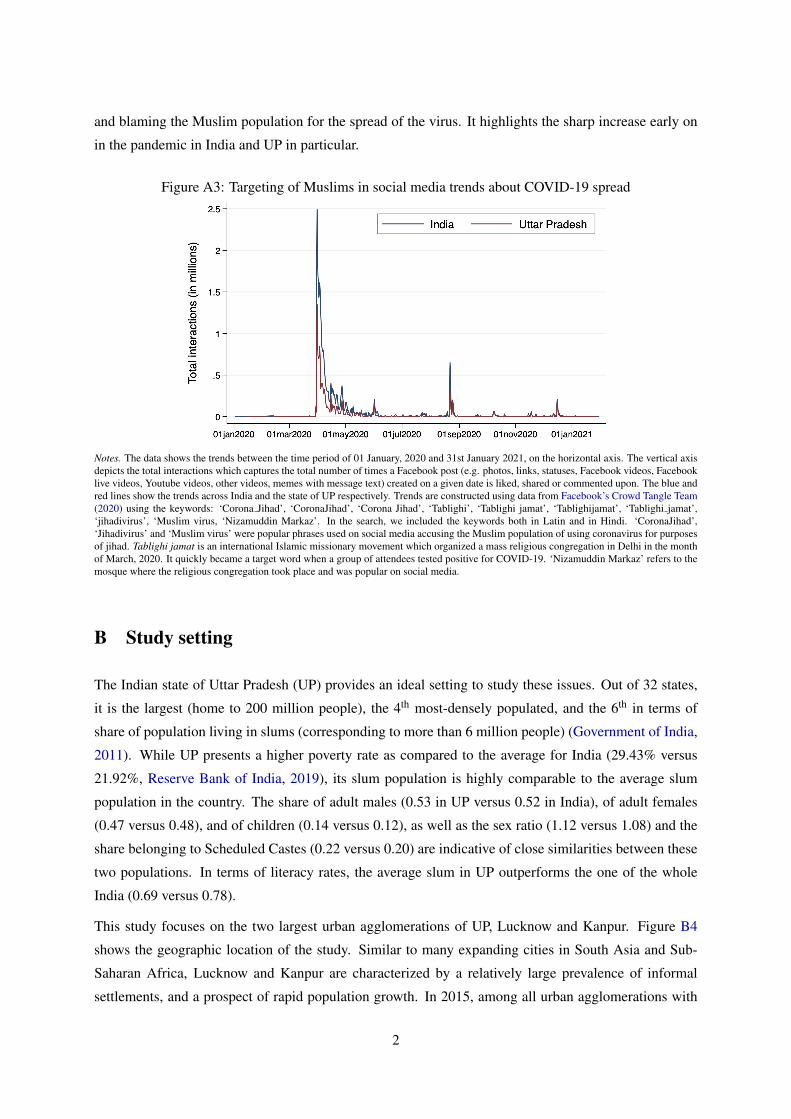
and blaming the Muslim population for the spread of the virus. It highlights the sharp increase early on
in the pandemic in India and UP in particular.
Figure A3: Targeting of Muslims in social media trends about COVID-19 spread
Notes. The data shows the trends between the time period of 01 January, 2020 and 31st January 2021, on the horizontal axis. The vertical axisdepicts the total interactions which captures the total number of times a Facebook post (e.g. photos, links, statuses, Facebook videos, Facebooklive videos, Youtube videos, other videos, memes with message text) created on a given date is liked, shared or commented upon. The blue andred lines show the trends across India and the state of UP respectively. Trends are constructed using data from Facebook’s Crowd Tangle Team(2020) using the keywords: ‘Corona Jihad’, ‘CoronaJihad’, ‘Corona Jihad’, ‘Tablighi’, ‘Tablighi jamat’, ‘Tablighijamat’, ‘Tablighi jamat’,‘jihadivirus’, ‘Muslim virus, ‘Nizamuddin Markaz’. In the search, we included the keywords both in Latin and in Hindi. ‘CoronaJihad’,‘Jihadivirus’ and ‘Muslim virus’ were popular phrases used on social media accusing the Muslim population of using coronavirus for purposesof jihad. Tablighi jamat is an international Islamic missionary movement which organized a mass religious congregation in Delhi in the monthof March, 2020. It quickly became a target word when a group of attendees tested positive for COVID-19. ‘Nizamuddin Markaz’ refers to themosque where the religious congregation took place and was popular on social media.
B Study setting
The Indian state of Uttar Pradesh (UP) provides an ideal setting to study these issues. Out of 32 states,
it is the largest (home to 200 million people), the 4th most-densely populated, and the 6th in terms of
share of population living in slums (corresponding to more than 6 million people) (Government of India,
2011). While UP presents a higher poverty rate as compared to the average for India (29.43% versus
21.92%, Reserve Bank of India, 2019), its slum population is highly comparable to the average slum
population in the country. The share of adult males (0.53 in UP versus 0.52 in India), of adult females
(0.47 versus 0.48), and of children (0.14 versus 0.12), as well as the sex ratio (1.12 versus 1.08) and the
share belonging to Scheduled Castes (0.22 versus 0.20) are indicative of close similarities between these
two populations. In terms of literacy rates, the average slum in UP outperforms the one of the whole
India (0.69 versus 0.78).
This study focuses on the two largest urban agglomerations of UP, Lucknow and Kanpur. Figure B4
shows the geographic location of the study. Similar to many expanding cities in South Asia and Sub-
Saharan Africa, Lucknow and Kanpur are characterized by a relatively large prevalence of informal
settlements, and a prospect of rapid population growth. In 2015, among all urban agglomerations with
2
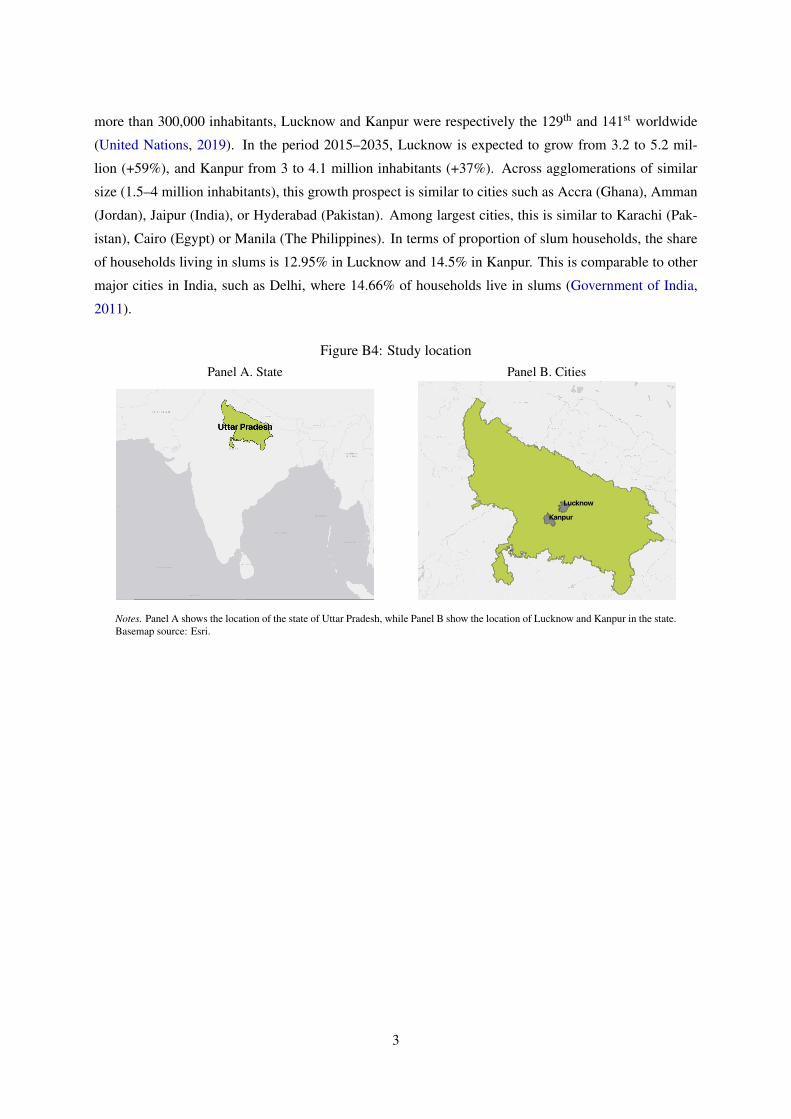
more than 300,000 inhabitants, Lucknow and Kanpur were respectively the 129th and 141st worldwide
(United Nations, 2019). In the period 2015–2035, Lucknow is expected to grow from 3.2 to 5.2 mil-
lion (+59%), and Kanpur from 3 to 4.1 million inhabitants (+37%). Across agglomerations of similar
size (1.5–4 million inhabitants), this growth prospect is similar to cities such as Accra (Ghana), Amman
(Jordan), Jaipur (India), or Hyderabad (Pakistan). Among largest cities, this is similar to Karachi (Pak-
istan), Cairo (Egypt) or Manila (The Philippines). In terms of proportion of slum households, the share
of households living in slums is 12.95% in Lucknow and 14.5% in Kanpur. This is comparable to other
major cities in India, such as Delhi, where 14.66% of households live in slums (Government of India,
2011).
Figure B4: Study locationPanel A. State Panel B. Cities
Notes. Panel A shows the location of the state of Uttar Pradesh, while Panel B show the location of Lucknow and Kanpur in the state.Basemap source: Esri.
3
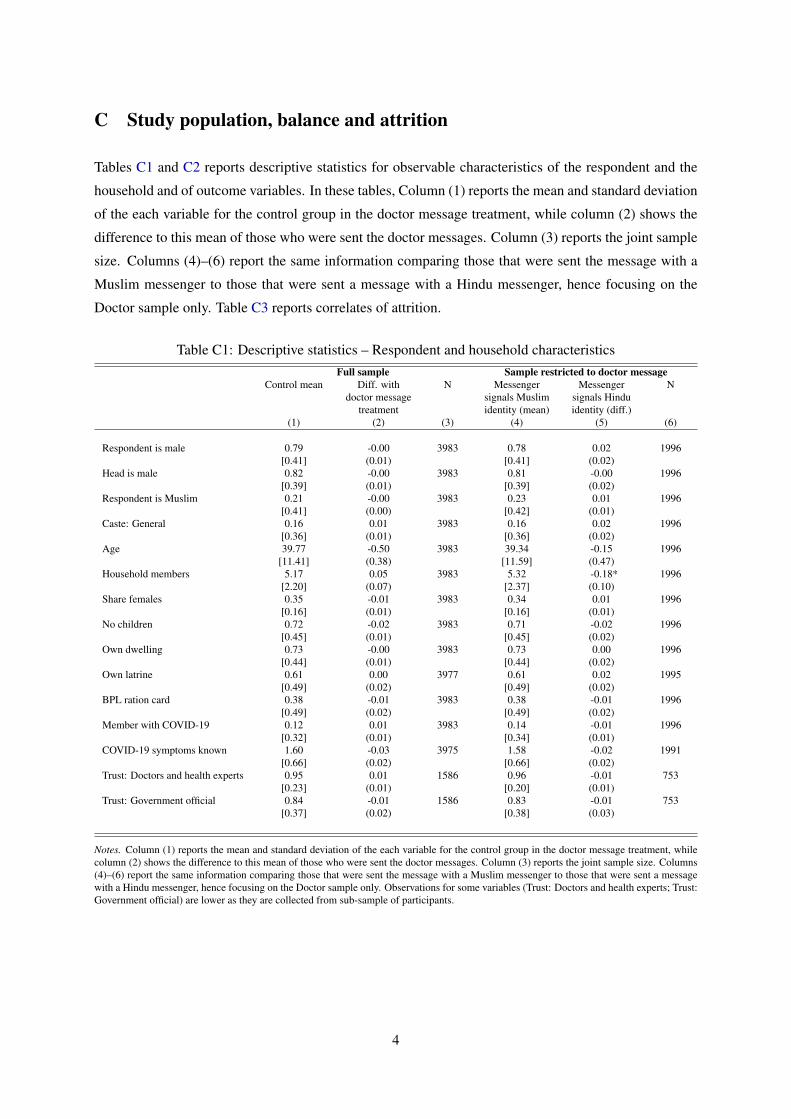
C Study population, balance and attrition
Tables C1 and C2 reports descriptive statistics for observable characteristics of the respondent and the
household and of outcome variables. In these tables, Column (1) reports the mean and standard deviation
of the each variable for the control group in the doctor message treatment, while column (2) shows the
difference to this mean of those who were sent the doctor messages. Column (3) reports the joint sample
size. Columns (4)–(6) report the same information comparing those that were sent the message with a
Muslim messenger to those that were sent a message with a Hindu messenger, hence focusing on the
Doctor sample only. Table C3 reports correlates of attrition.
Table C1: Descriptive statistics – Respondent and household characteristicsFull sample Sample restricted to doctor message
Control mean Diff. withdoctor message
treatment
N Messengersignals Muslimidentity (mean)
Messengersignals Hinduidentity (diff.)
N
(1) (2) (3) (4) (5) (6)
Respondent is male 0.79 -0.00 3983 0.78 0.02 1996[0.41] (0.01) [0.41] (0.02)
Head is male 0.82 -0.00 3983 0.81 -0.00 1996[0.39] (0.01) [0.39] (0.02)
Respondent is Muslim 0.21 -0.00 3983 0.23 0.01 1996[0.41] (0.00) [0.42] (0.01)
Caste: General 0.16 0.01 3983 0.16 0.02 1996[0.36] (0.01) [0.36] (0.02)
Age 39.77 -0.50 3983 39.34 -0.15 1996[11.41] (0.38) [11.59] (0.47)
Household members 5.17 0.05 3983 5.32 -0.18* 1996[2.20] (0.07) [2.37] (0.10)
Share females 0.35 -0.01 3983 0.34 0.01 1996[0.16] (0.01) [0.16] (0.01)
No children 0.72 -0.02 3983 0.71 -0.02 1996[0.45] (0.01) [0.45] (0.02)
Own dwelling 0.73 -0.00 3983 0.73 0.00 1996[0.44] (0.01) [0.44] (0.02)
Own latrine 0.61 0.00 3977 0.61 0.02 1995[0.49] (0.02) [0.49] (0.02)
BPL ration card 0.38 -0.01 3983 0.38 -0.01 1996[0.49] (0.02) [0.49] (0.02)
Member with COVID-19 0.12 0.01 3983 0.14 -0.01 1996[0.32] (0.01) [0.34] (0.01)
COVID-19 symptoms known 1.60 -0.03 3975 1.58 -0.02 1991[0.66] (0.02) [0.66] (0.02)
Trust: Doctors and health experts 0.95 0.01 1586 0.96 -0.01 753[0.23] (0.01) [0.20] (0.01)
Trust: Government official 0.84 -0.01 1586 0.83 -0.01 753[0.37] (0.02) [0.38] (0.03)
Notes. Column (1) reports the mean and standard deviation of the each variable for the control group in the doctor message treatment, whilecolumn (2) shows the difference to this mean of those who were sent the doctor messages. Column (3) reports the joint sample size. Columns(4)–(6) report the same information comparing those that were sent the message with a Muslim messenger to those that were sent a messagewith a Hindu messenger, hence focusing on the Doctor sample only. Observations for some variables (Trust: Doctors and health experts; Trust:Government official) are lower as they are collected from sub-sample of participants.
4
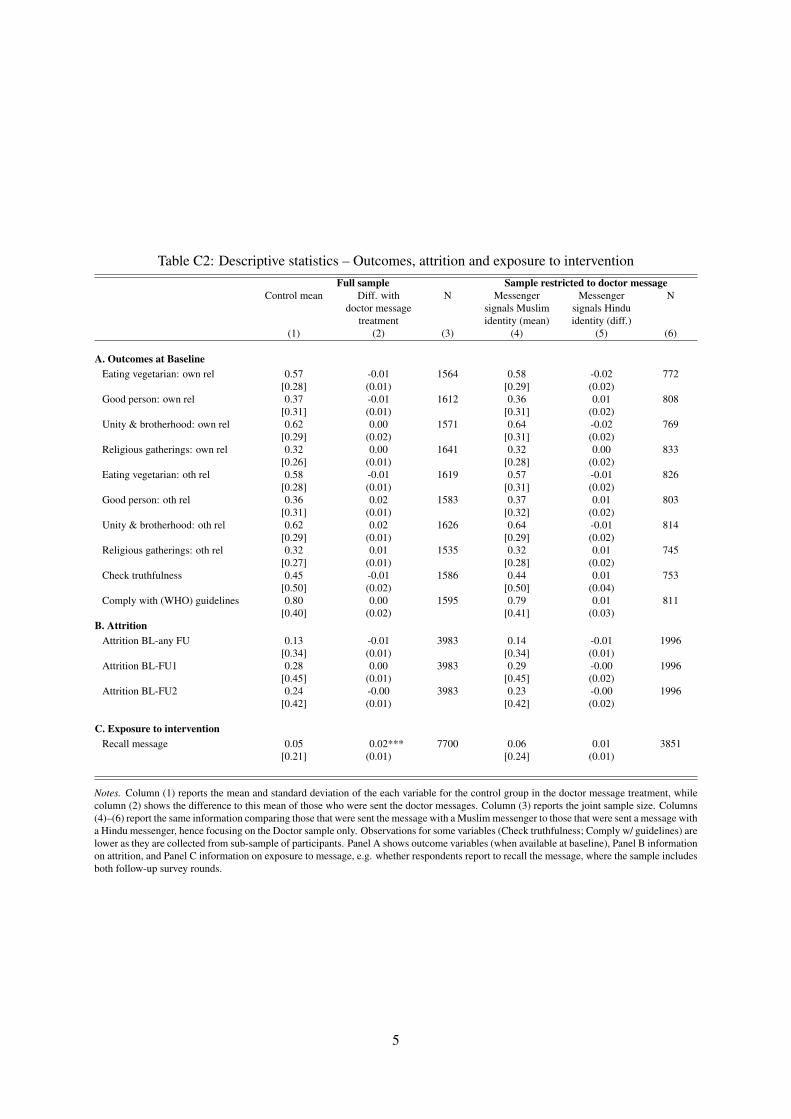
Table C2: Descriptive statistics – Outcomes, attrition and exposure to interventionFull sample Sample restricted to doctor message
Control mean Diff. withdoctor message
treatment
N Messengersignals Muslimidentity (mean)
Messengersignals Hinduidentity (diff.)
N
(1) (2) (3) (4) (5) (6)
A. Outcomes at BaselineEating vegetarian: own rel 0.57 -0.01 1564 0.58 -0.02 772
[0.28] (0.01) [0.29] (0.02)Good person: own rel 0.37 -0.01 1612 0.36 0.01 808
[0.31] (0.01) [0.31] (0.02)Unity & brotherhood: own rel 0.62 0.00 1571 0.64 -0.02 769
[0.29] (0.02) [0.31] (0.02)Religious gatherings: own rel 0.32 0.00 1641 0.32 0.00 833
[0.26] (0.01) [0.28] (0.02)Eating vegetarian: oth rel 0.58 -0.01 1619 0.57 -0.01 826
[0.28] (0.01) [0.31] (0.02)Good person: oth rel 0.36 0.02 1583 0.37 0.01 803
[0.31] (0.01) [0.32] (0.02)Unity & brotherhood: oth rel 0.62 0.02 1626 0.64 -0.01 814
[0.29] (0.01) [0.29] (0.02)Religious gatherings: oth rel 0.32 0.01 1535 0.32 0.01 745
[0.27] (0.01) [0.28] (0.02)Check truthfulness 0.45 -0.01 1586 0.44 0.01 753
[0.50] (0.02) [0.50] (0.04)Comply with (WHO) guidelines 0.80 0.00 1595 0.79 0.01 811
[0.40] (0.02) [0.41] (0.03)B. Attrition
Attrition BL-any FU 0.13 -0.01 3983 0.14 -0.01 1996[0.34] (0.01) [0.34] (0.01)
Attrition BL-FU1 0.28 0.00 3983 0.29 -0.00 1996[0.45] (0.01) [0.45] (0.02)
Attrition BL-FU2 0.24 -0.00 3983 0.23 -0.00 1996[0.42] (0.01) [0.42] (0.02)
C. Exposure to interventionRecall message 0.05 0.02*** 7700 0.06 0.01 3851
[0.21] (0.01) [0.24] (0.01)
Notes. Column (1) reports the mean and standard deviation of the each variable for the control group in the doctor message treatment, whilecolumn (2) shows the difference to this mean of those who were sent the doctor messages. Column (3) reports the joint sample size. Columns(4)–(6) report the same information comparing those that were sent the message with a Muslim messenger to those that were sent a message witha Hindu messenger, hence focusing on the Doctor sample only. Observations for some variables (Check truthfulness; Comply w/ guidelines) arelower as they are collected from sub-sample of participants. Panel A shows outcome variables (when available at baseline), Panel B informationon attrition, and Panel C information on exposure to message, e.g. whether respondents report to recall the message, where the sample includesboth follow-up survey rounds.
5

Table C3: What predicts HH attrition?Attrition
Full sample Sample restricted to doctor message(1) (2) (3) (4)
Doctor message -0.01 -0.01(0.01) (0.01)
Doctor message x Muslim 0.01(0.02)
Religion concordance intro -0.01 -0.02(0.01) (0.02)
Religion concordance intro x Muslim 0.04(0.04)
Respondent is male 0.03** 0.03** 0.04* 0.04*(0.01) (0.01) (0.02) (0.02)
Head is male -0.04** -0.04** -0.04* -0.04*(0.02) (0.02) (0.02) (0.02)
Respondent is Muslim 0.04** 0.03 0.04* 0.02(0.02) (0.02) (0.03) (0.03)
Caste: General -0.02* -0.02* -0.03 -0.03(0.01) (0.01) (0.02) (0.02)
Age 0.00 0.00 0.00 0.00(0.00) (0.00) (0.00) (0.00)
Household members 0.00 0.00 0.00 0.00(0.00) (0.00) (0.00) (0.00)
Share females 0.00 0.00 -0.01 -0.01(0.02) (0.02) (0.02) (0.02)
No children -0.01 -0.01 0.00 0.00(0.01) (0.01) (0.02) (0.02)
Own dwelling -0.04** -0.03** -0.04* -0.04*(0.02) (0.02) (0.02) (0.02)
BPL ration card 0.01 0.01 0.01 0.01(0.01) (0.01) (0.02) (0.02)
Member with COVID-19 -0.02 -0.02 -0.01 -0.01(0.02) (0.02) (0.02) (0.02)
COVID-19 symptoms known 0.02** 0.02** 0.02 0.02*(0.01) (0.01) (0.01) (0.01)
Attrition Rate 0.13 0.13 0.13 0.13Slums 142 142 142 142Households 3,975 3,975 1,991 1,991
Notes. The dependent variable attrition equal to 1 if a households was neither re-interviewed in follow-up 1 or follow-up 2, and 0 otherwise.Standard errors, clustered at the slum level, are presented in parenthesis. Columns (1) and (2) are for the full sample, columns (3) and (4)restrict the analysis to the doctor sample.
6
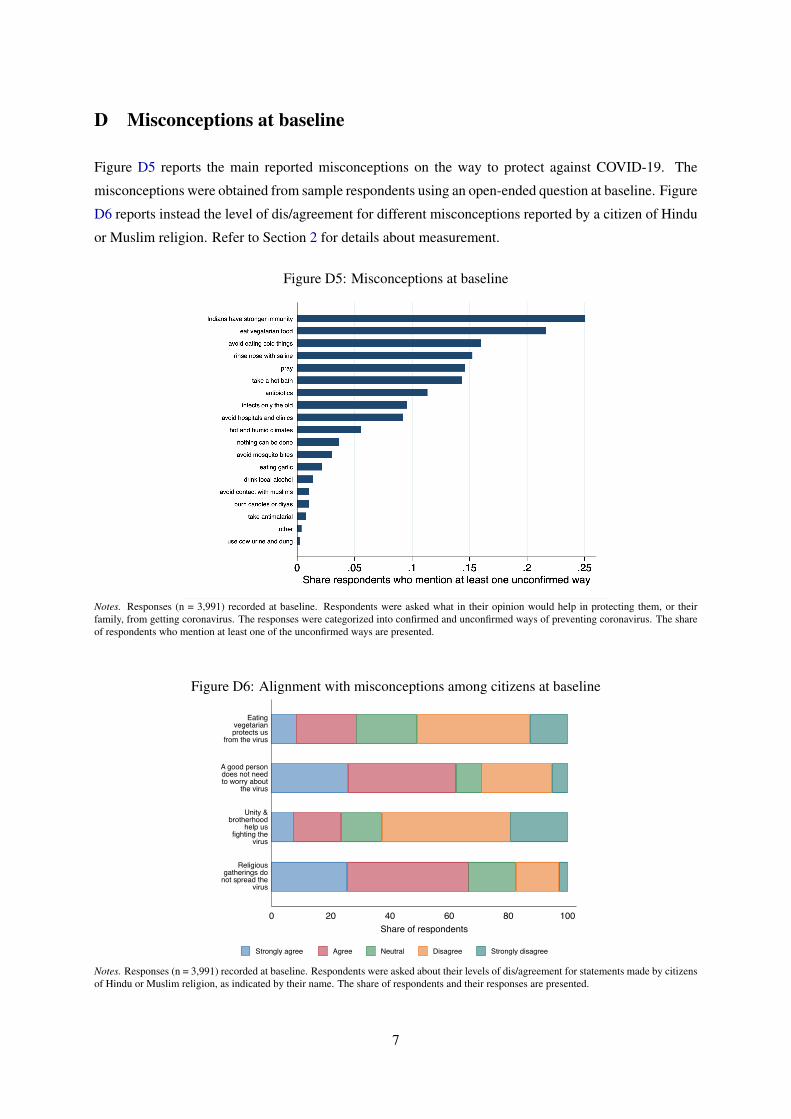
D Misconceptions at baseline
Figure D5 reports the main reported misconceptions on the way to protect against COVID-19. The
misconceptions were obtained from sample respondents using an open-ended question at baseline. Figure
D6 reports instead the level of dis/agreement for different misconceptions reported by a citizen of Hindu
or Muslim religion. Refer to Section 2 for details about measurement.
Figure D5: Misconceptions at baseline
Notes. Responses (n = 3,991) recorded at baseline. Respondents were asked what in their opinion would help in protecting them, or theirfamily, from getting coronavirus. The responses were categorized into confirmed and unconfirmed ways of preventing coronavirus. The shareof respondents who mention at least one of the unconfirmed ways are presented.
Figure D6: Alignment with misconceptions among citizens at baseline
0 20 40 60 80 100Share of respondents
Religiousgatherings do
not spread thevirus
Unity &brotherhood
help usfighting the
virus
A good persondoes not needto worry about
the virus
Eatingvegetarianprotects us
from the virus
Strongly agree Agree Neutral Disagree Strongly disagree
Notes. Responses (n = 3,991) recorded at baseline. Respondents were asked about their levels of dis/agreement for statements made by citizensof Hindu or Muslim religion, as indicated by their name. The share of respondents and their responses are presented.
7

E Intervention content
The doctor message treatment included two messages. The first message was 1 minute and 52 seconds
long and the script reads as follows:
Greetings (Namaste/Salam Walekum)! I am a resident of U.P. and like me, you might also be confused about
various sorts of information shared on social media. If this is the case, then these messages from renowned
doctors regarding coronavirus might be helpful for you. After watching this video, if you answer any of the
questions correctly, then you can get a chance to win the lottery in the form of mobile recharge. So, lets listen
to what the doctors have to say about the question: Is it correct that we Indians need not worry about the
coronavirus because our immune system is quite strong?
Doctor 1: This is a myth. This myth can lead to false beliefs among people that they we will not get the disease.
Please do not live with this false belief. In fact, being Indian, we have contacted many diseases in the past.
Please look at how many people are contacting the virus and even with our immune systems the number of
people who are getting this disease is increasing in the country and the world. Doctor 2: Coronavirus is a threat
to the entire human civilization today. Do not stay under the misconception that we are immune to the virus. We
need to be careful and protect ourselves from the virus. We should follow the guidelines set by the government.
We thank the doctors. Now, things are clear for me and hopefully for you too. Now, you have understood
the truth, please spread this message to others. If each of us makes this contribution at our own level and we
can together save a lot of lives. Now, to enter the lottery, you would have to answer the following questions
correctly, even if the doctor has answered them correctly or not: Can we Indians be carefree and not worry about
coronavirus because our immune system is very strong?
The second message is similar in content of first message except for the question posed to the doctors.
The doctors debunked the myth by emphasizing on how being a vegetarian or eating only a vegetarian
diet does not fully protect from contacting coronavirus. The control message was 30 seconds long
and the informative content included a gossip about popular actresses of Bollywood. For the religionconcordance treatment, Figure E7 shows an example of the variation induced by the different signaled
religious identity of the messenger.
Figure E7: Citizen religious identity in chatbot video
Note. The left panel shows the messenger in the version signaling a religious identity closer to Hindu religion, while the right panel shows theversion signaling a religious identity closer to Muslim religion.
8
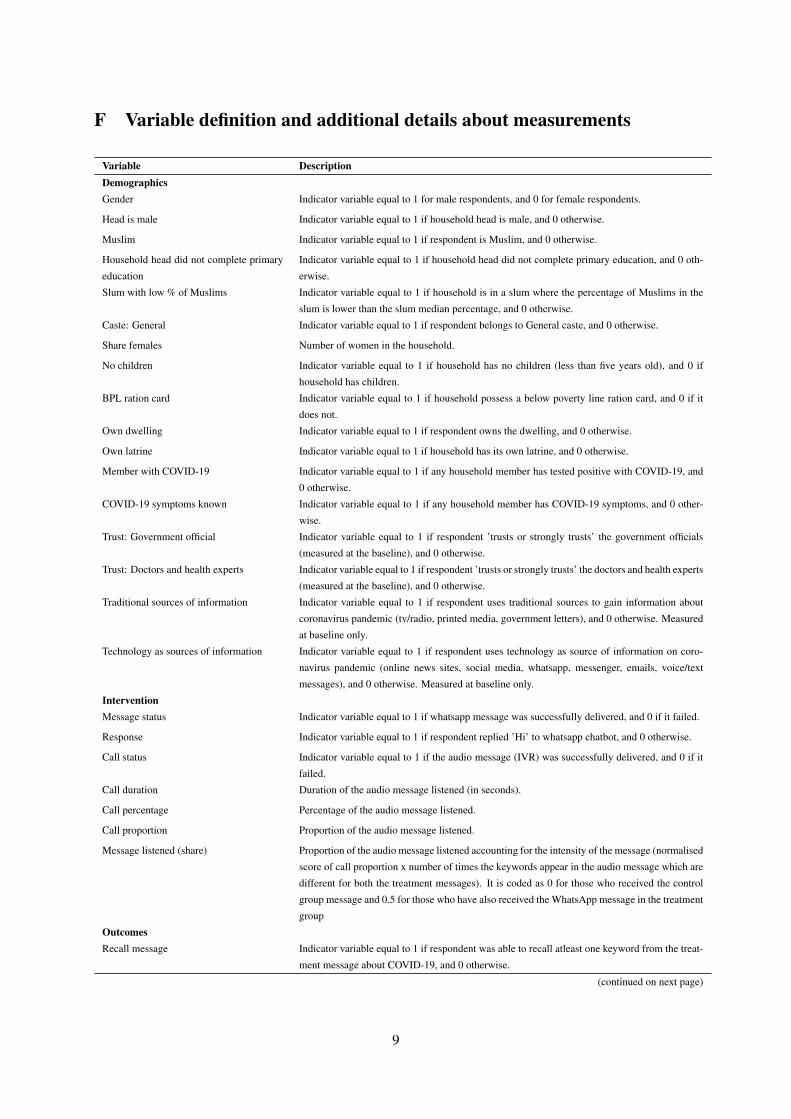
F Variable definition and additional details about measurements
Variable DescriptionDemographicsGender Indicator variable equal to 1 for male respondents, and 0 for female respondents.
Head is male Indicator variable equal to 1 if household head is male, and 0 otherwise.
Muslim Indicator variable equal to 1 if respondent is Muslim, and 0 otherwise.
Household head did not complete primary
education
Indicator variable equal to 1 if household head did not complete primary education, and 0 oth-
erwise.
Slum with low % of Muslims Indicator variable equal to 1 if household is in a slum where the percentage of Muslims in the
slum is lower than the slum median percentage, and 0 otherwise.
Caste: General Indicator variable equal to 1 if respondent belongs to General caste, and 0 otherwise.
Share females Number of women in the household.
No children Indicator variable equal to 1 if household has no children (less than five years old), and 0 if
household has children.
BPL ration card Indicator variable equal to 1 if household possess a below poverty line ration card, and 0 if it
does not.
Own dwelling Indicator variable equal to 1 if respondent owns the dwelling, and 0 otherwise.
Own latrine Indicator variable equal to 1 if household has its own latrine, and 0 otherwise.
Member with COVID-19 Indicator variable equal to 1 if any household member has tested positive with COVID-19, and
0 otherwise.
COVID-19 symptoms known Indicator variable equal to 1 if any household member has COVID-19 symptoms, and 0 other-
wise.
Trust: Government official Indicator variable equal to 1 if respondent ’trusts or strongly trusts’ the government officials
(measured at the baseline), and 0 otherwise.
Trust: Doctors and health experts Indicator variable equal to 1 if respondent ’trusts or strongly trusts’ the doctors and health experts
(measured at the baseline), and 0 otherwise.
Traditional sources of information Indicator variable equal to 1 if respondent uses traditional sources to gain information about
coronavirus pandemic (tv/radio, printed media, government letters), and 0 otherwise. Measured
at baseline only.
Technology as sources of information Indicator variable equal to 1 if respondent uses technology as source of information on coro-
navirus pandemic (online news sites, social media, whatsapp, messenger, emails, voice/text
messages), and 0 otherwise. Measured at baseline only.
InterventionMessage status Indicator variable equal to 1 if whatsapp message was successfully delivered, and 0 if it failed.
Response Indicator variable equal to 1 if respondent replied ’Hi’ to whatsapp chatbot, and 0 otherwise.
Call status Indicator variable equal to 1 if the audio message (IVR) was successfully delivered, and 0 if it
failed.
Call duration Duration of the audio message listened (in seconds).
Call percentage Percentage of the audio message listened.
Call proportion Proportion of the audio message listened.
Message listened (share) Proportion of the audio message listened accounting for the intensity of the message (normalised
score of call proportion x number of times the keywords appear in the audio message which are
different for both the treatment messages). It is coded as 0 for those who received the control
group message and 0.5 for those who have also received the WhatsApp message in the treatment
group
OutcomesRecall message Indicator variable equal to 1 if respondent was able to recall atleast one keyword from the treat-
ment message about COVID-19, and 0 otherwise.
(continued on next page)
9
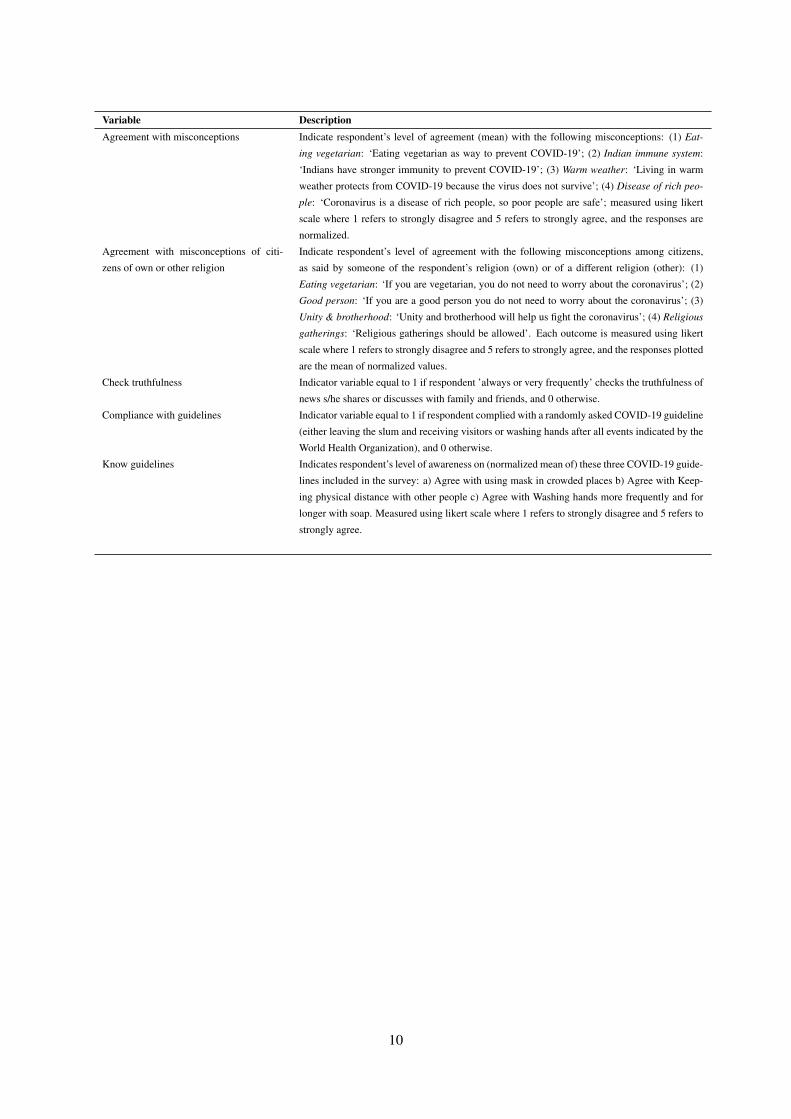
Variable DescriptionAgreement with misconceptions Indicate respondent’s level of agreement (mean) with the following misconceptions: (1) Eat-
ing vegetarian: ‘Eating vegetarian as way to prevent COVID-19’; (2) Indian immune system:
‘Indians have stronger immunity to prevent COVID-19’; (3) Warm weather: ‘Living in warm
weather protects from COVID-19 because the virus does not survive’; (4) Disease of rich peo-
ple: ‘Coronavirus is a disease of rich people, so poor people are safe’; measured using likert
scale where 1 refers to strongly disagree and 5 refers to strongly agree, and the responses are
normalized.
Agreement with misconceptions of citi-
zens of own or other religion
Indicate respondent’s level of agreement with the following misconceptions among citizens,
as said by someone of the respondent’s religion (own) or of a different religion (other): (1)
Eating vegetarian: ‘If you are vegetarian, you do not need to worry about the coronavirus’; (2)
Good person: ‘If you are a good person you do not need to worry about the coronavirus’; (3)
Unity & brotherhood: ‘Unity and brotherhood will help us fight the coronavirus’; (4) Religious
gatherings: ‘Religious gatherings should be allowed’. Each outcome is measured using likert
scale where 1 refers to strongly disagree and 5 refers to strongly agree, and the responses plotted
are the mean of normalized values.
Check truthfulness Indicator variable equal to 1 if respondent ’always or very frequently’ checks the truthfulness of
news s/he shares or discusses with family and friends, and 0 otherwise.
Compliance with guidelines Indicator variable equal to 1 if respondent complied with a randomly asked COVID-19 guideline
(either leaving the slum and receiving visitors or washing hands after all events indicated by the
World Health Organization), and 0 otherwise.
Know guidelines Indicates respondent’s level of awareness on (normalized mean of) these three COVID-19 guide-
lines included in the survey: a) Agree with using mask in crowded places b) Agree with Keep-
ing physical distance with other people c) Agree with Washing hands more frequently and for
longer with soap. Measured using likert scale where 1 refers to strongly disagree and 5 refers to
strongly agree.
10

G Additional analysis
G.1 Estimates of treatment effects using 2SLS
Appendix Tables G1–G3 show treatment on the treated estimates, obtained through an instrumental
variable strategy where the endogenous treatment variable a proxy of treatment intensity, i.e., a variable
that multiplies the amount of time the message is listened with the number of key words mentioned
during this time) is instrumented with the random treatment indicators Ti.
Table G1: Effect on agreement with misconception about ways to prevent COVID-19, 2SLSEating Indian Warm Disease
vegetarian immune system weather of rich people(1) (2) (3) (4)
Panel A: Doctor message
Message listened (share) 0.010 -0.051 -0.028 -0.019(0.041) (0.033) (0.040) (0.040)[0.796] [0.125] [0.482] [0.644]
Mean (Not listened) 0.566 0.658 0.468 0.350Observations 7692 7697 7681 7676Slums 142 142 142 142Observation rounds 2 2 2 2
Panel B: Religion-concordance
Message listened (share) -0.111 -0.009 -0.037 -0.087(0.055) (0.046) (0.058) (0.063)[0.045] [0.849] [0.523] [0.169]
Mean (Other religion) 0.571 0.654 0.470 0.355Observations 3846 3849 3842 3839Slums 142 142 142 142Observation rounds 2 2 2 2
Notes. Estimates based on 2SLS regressions. Panel B restricts the sample to participants allocated to the doctor message. Standard errorsclustered at the slum level are reported in parentheses. Naive p-values are presented in brackets. Dependent variables by column indicaterespondent’s level of agreement with the following misconceptions: (1) Eating vegetarian: ‘Eating vegetarian as way to prevent COVID-19’;(2) Indian immune system: ‘Indians have stronger immunity to prevent COVID-19’; (3) Warm weather: ‘Living in warm weather protects fromCOVID-19 because the virus does not survive’; (4) Disease of rich people: ‘Coronavirus is a disease of rich people, so poor people are safe’.Measured using likert scale where 1 refers to strongly disagree and 5 refers to strongly agree, and the responses are normalized in the analysis.All specifications include indicator variables for data collection rounds, and strata indicators (city and religion of respondent). Differences inobservations across columns are due to unit non-response.
11
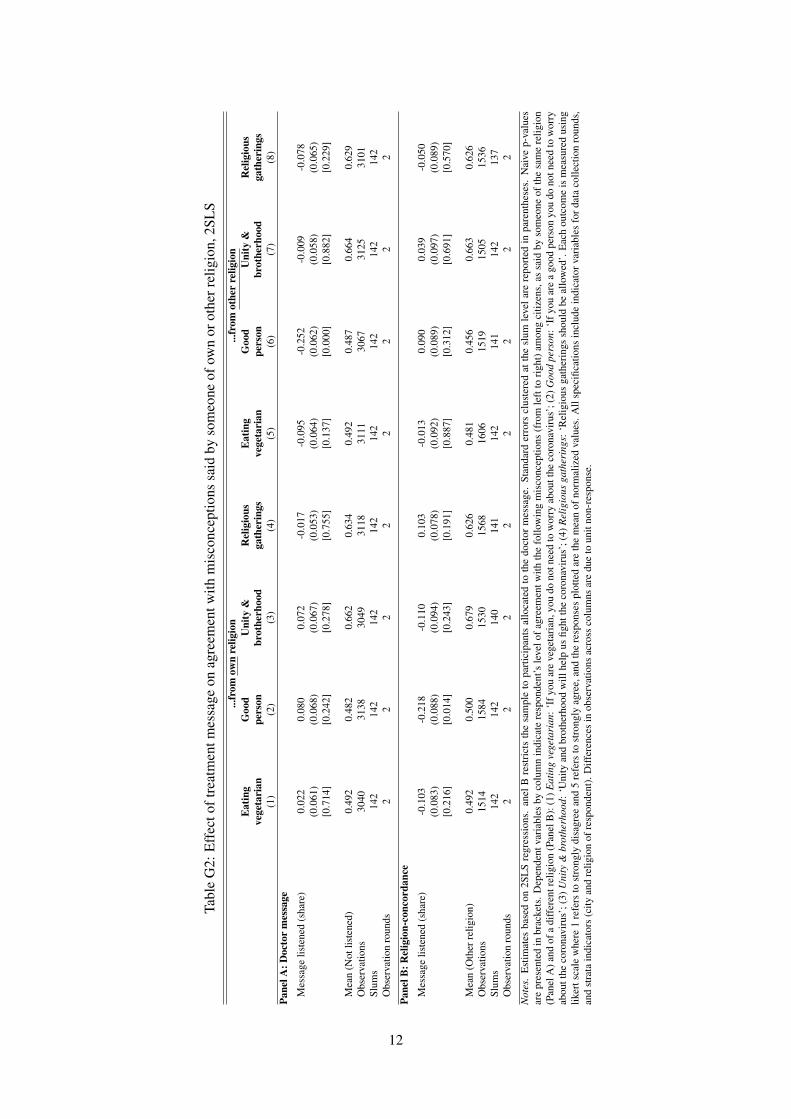
Tabl
eG
2:E
ffec
toft
reat
men
tmes
sage
onag
reem
entw
ithm
isco
ncep
tions
said
byso
meo
neof
own
orot
herr
elig
ion,
2SL
S...
from
own
relig
ion
...fr
omot
her
relig
ion
Eat
ing
Goo
dU
nity
&R
elig
ious
Eat
ing
Goo
dU
nity
&R
elig
ious
vege
tari
anpe
rson
brot
herh
ood
gath
erin
gsve
geta
rian
pers
onbr
othe
rhoo
dga
ther
ings
(1)
(2)
(3)
(4)
(5)
(6)
(7)
(8)
Pane
lA:D
octo
rm
essa
ge
Mes
sage
liste
ned
(sha
re)
0.02
20.
080
0.07
2-0
.017
-0.0
95-0
.252
-0.0
09-0
.078
(0.0
61)
(0.0
68)
(0.0
67)
(0.0
53)
(0.0
64)
(0.0
62)
(0.0
58)
(0.0
65)
[0.7
14]
[0.2
42]
[0.2
78]
[0.7
55]
[0.1
37]
[0.0
00]
[0.8
82]
[0.2
29]
Mea
n(N
otlis
tene
d)0.
492
0.48
20.
662
0.63
40.
492
0.48
70.
664
0.62
9O
bser
vatio
ns30
4031
3830
4931
1831
1130
6731
2531
01Sl
ums
142
142
142
142
142
142
142
142
Obs
erva
tion
roun
ds2
22
22
22
2
Pane
lB:R
elig
ion-
conc
orda
nce
Mes
sage
liste
ned
(sha
re)
-0.1
03-0
.218
-0.1
100.
103
-0.0
130.
090
0.03
9-0
.050
(0.0
83)
(0.0
88)
(0.0
94)
(0.0
78)
(0.0
92)
(0.0
89)
(0.0
97)
(0.0
89)
[0.2
16]
[0.0
14]
[0.2
43]
[0.1
91]
[0.8
87]
[0.3
12]
[0.6
91]
[0.5
70]
Mea
n(O
ther
relig
ion)
0.49
20.
500
0.67
90.
626
0.48
10.
456
0.66
30.
626
Obs
erva
tions
1514
1584
1530
1568
1606
1519
1505
1536
Slum
s14
214
214
014
114
214
114
213
7O
bser
vatio
nro
unds
22
22
22
22
Not
es.
Est
imat
esba
sed
on2S
LS
regr
essi
ons.
anel
Bre
stri
cts
the
sam
ple
topa
rtic
ipan
tsal
loca
ted
toth
edo
ctor
mes
sage
.St
anda
rder
rors
clus
tere
dat
the
slum
leve
lare
repo
rted
inpa
rent
hese
s.N
aive
p-va
lues
are
pres
ente
din
brac
kets
.Dep
ende
ntva
riab
les
byco
lum
nin
dica
tere
spon
dent
’sle
velo
fagr
eem
entw
ithth
efo
llow
ing
mis
conc
eptio
ns(f
rom
left
tori
ght)
amon
gci
tizen
s,as
said
byso
meo
neof
the
sam
ere
ligio
n(P
anel
A)a
ndof
adi
ffer
entr
elig
ion
(Pan
elB
):(1
)Eat
ing
vege
tari
an:‘
Ifyo
uar
eve
geta
rian
,you
dono
tnee
dto
wor
ryab
outt
heco
rona
viru
s’;(
2)G
ood
pers
on:‘
Ifyo
uar
ea
good
pers
onyo
udo
notn
eed
tow
orry
abou
tthe
coro
navi
rus’
;(3)
Uni
ty&
brot
herh
ood:
‘Uni
tyan
dbr
othe
rhoo
dw
illhe
lpus
fight
the
coro
navi
rus’
;(4)
Rel
igio
usga
ther
ings
:‘R
elig
ious
gath
erin
gssh
ould
beal
low
ed’.
Eac
hou
tcom
eis
mea
sure
dus
ing
liker
tsca
lew
here
1re
fers
tost
rong
lydi
sagr
eean
d5
refe
rsto
stro
ngly
agre
e,an
dth
ere
spon
ses
plot
ted
are
the
mea
nof
norm
aliz
edva
lues
.All
spec
ifica
tions
incl
ude
indi
cato
rvar
iabl
esfo
rdat
aco
llect
ion
roun
ds,
and
stra
tain
dica
tors
(city
and
relig
ion
ofre
spon
dent
).D
iffer
ence
sin
obse
rvat
ions
acro
ssco
lum
nsar
edu
eto
unit
non-
resp
onse
.
12

Table G3: Effect of treatment message on behavioral outcomes, 2SLSCheck Knowledge of policy guidelines Compliance with
truthfulness using mask social distancing wash hands guidelines(1) (2) (3) (4) (5)
Panel A: Doctor message
Message listened (share) -0.159 0.044 0.033 0.045 0.282(0.072) (0.020) (0.025) (0.022) (0.101)[0.026] [0.028] [0.193] [0.040] [0.005]
Mean (Not listened) 0.344 0.814 0.800 0.789 0.594Observations 7700 7696 7698 7696 5079Slums 142 142 142 142 142Observation rounds 2 2 2 2 2
Panel B: Religion-concordance
Message listened (share) 0.040 -0.016 -0.038 -0.030 0.175(0.099) (0.032) (0.030) (0.031) (0.148)[0.685] [0.626] [0.201] [0.337] [0.239]
Mean (Other religion) 0.326 0.820 0.806 0.795 0.604Observations 3851 3849 3849 3849 2519Slums 142 142 142 142 142Observation rounds 2 2 2 2 2
Notes. Estimates based on 2SLS regressions. Panel B restricts the sample to participants allocated to the doctor message. Standard errorsclustered at the slum level are reported in parentheses. P-values are presented in brackets, the first from individual testing, the second adjustingfor testing that each treatment is jointly different from zero for all outcomes presented in the table, separate for Panels A and B. Dependentvariables by column: (1) Check truthfulness: indicator variable equal to 1 if the respondent ’always or very frequently’ checks the truthfulnessof news s/he shares or discusses with family and friends, and 0 otherwise; Columns (2) to (4) indicate respondent’s level of agreement with(normalized mean of) COVID-19 guidelines, measured using likert scale where 1 refers to strongly disagree and 5 refers to strongly agree.In particular: (2) Using mask concerns mask-wearing in crowded places; (3) Social distancing concerns keeping physical distance with otherpeople; (4) Wash hands is about washing hands more frequently and for longer with soap. Column Column (5) Compliance with guidelinesis an indicator variable equal to 1 if respondent complied with a randomly asked COVID-19 guideline (either leaving the slum and receivingvisitors or washing hands after all events indicated by the World Health Organization), and 0 otherwise. All specifications include indicatorvariables for data collection rounds, and strata indicators (city and religion of respondent). Differences in observations across columns are dueto unit non-response, as well as some outcomes collected only for a random sub-set of study participants.
13
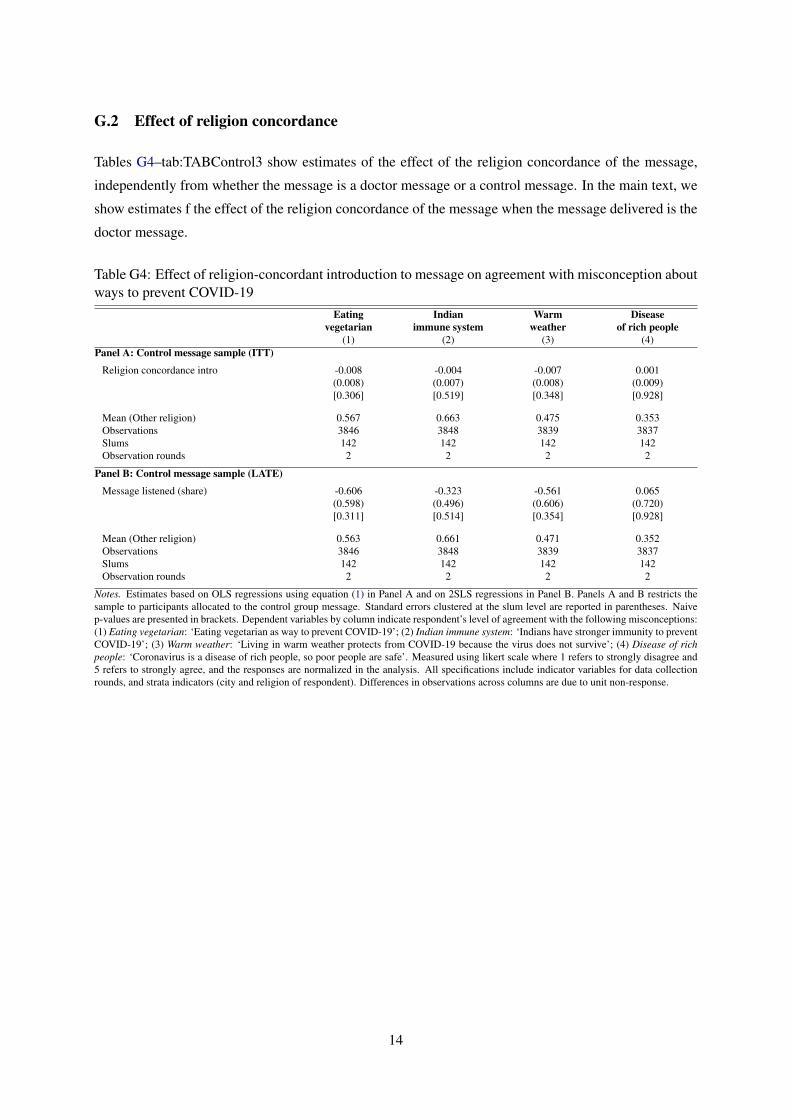
G.2 Effect of religion concordance
Tables G4–tab:TABControl3 show estimates of the effect of the religion concordance of the message,
independently from whether the message is a doctor message or a control message. In the main text, we
show estimates f the effect of the religion concordance of the message when the message delivered is the
doctor message.
Table G4: Effect of religion-concordant introduction to message on agreement with misconception aboutways to prevent COVID-19
Eating Indian Warm Diseasevegetarian immune system weather of rich people
(1) (2) (3) (4)Panel A: Control message sample (ITT)
Religion concordance intro -0.008 -0.004 -0.007 0.001(0.008) (0.007) (0.008) (0.009)[0.306] [0.519] [0.348] [0.928]
Mean (Other religion) 0.567 0.663 0.475 0.353Observations 3846 3848 3839 3837Slums 142 142 142 142Observation rounds 2 2 2 2
Panel B: Control message sample (LATE)
Message listened (share) -0.606 -0.323 -0.561 0.065(0.598) (0.496) (0.606) (0.720)[0.311] [0.514] [0.354] [0.928]
Mean (Other religion) 0.563 0.661 0.471 0.352Observations 3846 3848 3839 3837Slums 142 142 142 142Observation rounds 2 2 2 2
Notes. Estimates based on OLS regressions using equation (1) in Panel A and on 2SLS regressions in Panel B. Panels A and B restricts thesample to participants allocated to the control group message. Standard errors clustered at the slum level are reported in parentheses. Naivep-values are presented in brackets. Dependent variables by column indicate respondent’s level of agreement with the following misconceptions:(1) Eating vegetarian: ‘Eating vegetarian as way to prevent COVID-19’; (2) Indian immune system: ‘Indians have stronger immunity to preventCOVID-19’; (3) Warm weather: ‘Living in warm weather protects from COVID-19 because the virus does not survive’; (4) Disease of richpeople: ‘Coronavirus is a disease of rich people, so poor people are safe’. Measured using likert scale where 1 refers to strongly disagree and5 refers to strongly agree, and the responses are normalized in the analysis. All specifications include indicator variables for data collectionrounds, and strata indicators (city and religion of respondent). Differences in observations across columns are due to unit non-response.
14
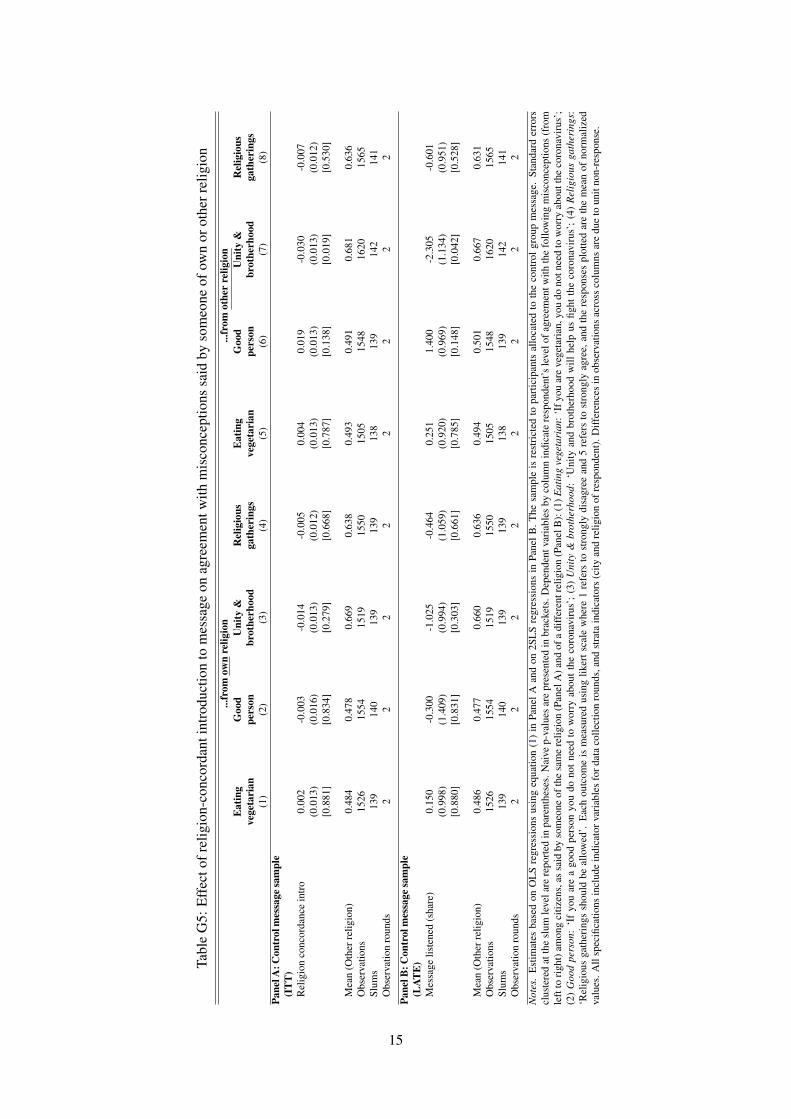
Tabl
eG
5:E
ffec
tofr
elig
ion-
conc
orda
ntin
trod
uctio
nto
mes
sage
onag
reem
entw
ithm
isco
ncep
tions
said
byso
meo
neof
own
orot
herr
elig
ion
...fr
omow
nre
ligio
n...
from
othe
rre
ligio
nE
atin
gG
ood
Uni
ty&
Rel
igio
usE
atin
gG
ood
Uni
ty&
Rel
igio
usve
geta
rian
pers
onbr
othe
rhoo
dga
ther
ings
vege
tari
anpe
rson
brot
herh
ood
gath
erin
gs(1
)(2
)(3
)(4
)(5
)(6
)(7
)(8
)Pa
nelA
:Con
trol
mes
sage
sam
ple
(IT
T)
Rel
igio
nco
ncor
danc
ein
tro
0.00
2-0
.003
-0.0
14-0
.005
0.00
40.
019
-0.0
30-0
.007
(0.0
13)
(0.0
16)
(0.0
13)
(0.0
12)
(0.0
13)
(0.0
13)
(0.0
13)
(0.0
12)
[0.8
81]
[0.8
34]
[0.2
79]
[0.6
68]
[0.7
87]
[0.1
38]
[0.0
19]
[0.5
30]
Mea
n(O
ther
relig
ion)
0.48
40.
478
0.66
90.
638
0.49
30.
491
0.68
10.
636
Obs
erva
tions
1526
1554
1519
1550
1505
1548
1620
1565
Slum
s13
914
013
913
913
813
914
214
1O
bser
vatio
nro
unds
22
22
22
22
Pane
lB:C
ontr
olm
essa
gesa
mpl
e(L
ATE
)M
essa
gelis
tene
d(s
hare
)0.
150
-0.3
00-1
.025
-0.4
640.
251
1.40
0-2
.305
-0.6
01(0
.998
)(1
.409
)(0
.994
)(1
.059
)(0
.920
)(0
.969
)(1
.134
)(0
.951
)[0
.880
][0
.831
][0
.303
][0
.661
][0
.785
][0
.148
][0
.042
][0
.528
]
Mea
n(O
ther
relig
ion)
0.48
60.
477
0.66
00.
636
0.49
40.
501
0.66
70.
631
Obs
erva
tions
1526
1554
1519
1550
1505
1548
1620
1565
Slum
s13
914
013
913
913
813
914
214
1O
bser
vatio
nro
unds
22
22
22
22
Not
es.
Est
imat
esba
sed
onO
LS
regr
essi
ons
usin
geq
uatio
n(1
)in
Pane
lAan
don
2SL
Sre
gres
sion
sin
Pane
lB.T
hesa
mpl
eis
rest
rict
edto
part
icip
ants
allo
cate
dto
the
cont
rolg
roup
mes
sage
.St
anda
rder
rors
clus
tere
dat
the
slum
leve
lare
repo
rted
inpa
rent
hese
s.N
aive
p-va
lues
are
pres
ente
din
brac
kets
.Dep
ende
ntva
riab
les
byco
lum
nin
dica
tere
spon
dent
’sle
velo
fagr
eem
entw
ithth
efo
llow
ing
mis
conc
eptio
ns(f
rom
left
tori
ght)
amon
gci
tizen
s,as
said
byso
meo
neof
the
sam
ere
ligio
n(P
anel
A)a
ndof
adi
ffer
entr
elig
ion
(Pan
elB
):(1
)Eat
ing
vege
tari
an:‘
Ifyo
uar
eve
geta
rian
,you
dono
tnee
dto
wor
ryab
outt
heco
rona
viru
s’;
(2)
Goo
dpe
rson
:‘I
fyo
uar
ea
good
pers
onyo
udo
not
need
tow
orry
abou
tth
eco
rona
viru
s’;
(3)
Uni
ty&
brot
herh
ood:
‘Uni
tyan
dbr
othe
rhoo
dw
illhe
lpus
fight
the
coro
navi
rus’
;(4
)R
elig
ious
gath
erin
gs:
‘Rel
igio
usga
ther
ings
shou
ldbe
allo
wed
’.E
ach
outc
ome
ism
easu
red
usin
glik
erts
cale
whe
re1
refe
rsto
stro
ngly
disa
gree
and
5re
fers
tost
rong
lyag
ree,
and
the
resp
onse
spl
otte
dar
eth
em
ean
ofno
rmal
ized
valu
es.A
llsp
ecifi
catio
nsin
clud
ein
dica
torv
aria
bles
ford
ata
colle
ctio
nro
unds
,and
stra
tain
dica
tors
(city
and
relig
ion
ofre
spon
dent
).D
iffer
ence
sin
obse
rvat
ions
acro
ssco
lum
nsar
edu
eto
unit
non-
resp
onse
.
15

Table G6: Effect of religion-concordant introduction to message on behavioral outcomesCheck Knowledge of policy guidelines Compliance with
truthfulness using mask social distancing wash hands guidelines(1) (2) (3) (4) (5)
Panel A: Control message sample (ITT)
Religion concordance intro 0.017 0.002 -0.007 -0.006 -0.017(0.017) (0.005) (0.004) (0.005) (0.021)[0.321] [0.616] [0.126] [0.217] [0.437]
Mean (Other religion) 0.345 0.812 0.802 0.789 0.586Observations 3849 3847 3849 3847 2560Slums 142 142 142 142 141Observation rounds 2 2 2 2 2
Panel B: Control message sample (LATE)
Message listened (share) 1.296 0.179 -0.513 -0.497 -1.309(1.324) (0.352) (0.336) (0.410) (1.676)[0.327] [0.611] [0.127] [0.225] [0.435]
Mean (Other religion) 0.352 0.813 0.799 0.786 0.578Observations 3849 3847 3849 3847 2560Slums 142 142 142 142 141Observation rounds 2 2 2 2 2
Notes. Estimates based on OLS regressions using equation (1). Panel B restricts the sample to participants allocated to the doctor message.Standard errors clustered at the slum level are reported in parentheses. P-values are presented in brackets, the first from individual testing,the second adjusting for testing that each treatment is jointly different from zero for all outcomes presented in the table, separate for PanelsA and B. Dependent variables by column: (1) Check truthfulness is an indicator variable equal to 1 if respondent ’always or very frequently’checks the truthfulness of news s/he shares or discusses with family and friends, and 0 otherwise; Columns (2) to (4) indicate respondent’s levelof agreement with (normalized mean of) COVID-19 guidelines, measured using likert scale where 1 refers to strongly disagree and 5 refersto strongly agree. In particular: (2) Using mask concerns mask-wearing in crowded places; (3) Social distancing concerns keeping physicaldistance with other people; (4) Wash hands is about washing hands more frequently and for longer with soap. Column (5) Compliance withguidelines is an indicator variable equal to 1 if respondent complied with a randomly asked COVID-19 guideline (either leaving the slum andreceiving visitors or washing hands after all events indicated by the World Health Organization), and 0 otherwise. All specifications includeindicator variables for data collection rounds, and strata indicators (city and religion of respondent). Differences in observations across columnsare due to unit non-response, as well as some outcomes collected only for a random sub-set of study participants.
16
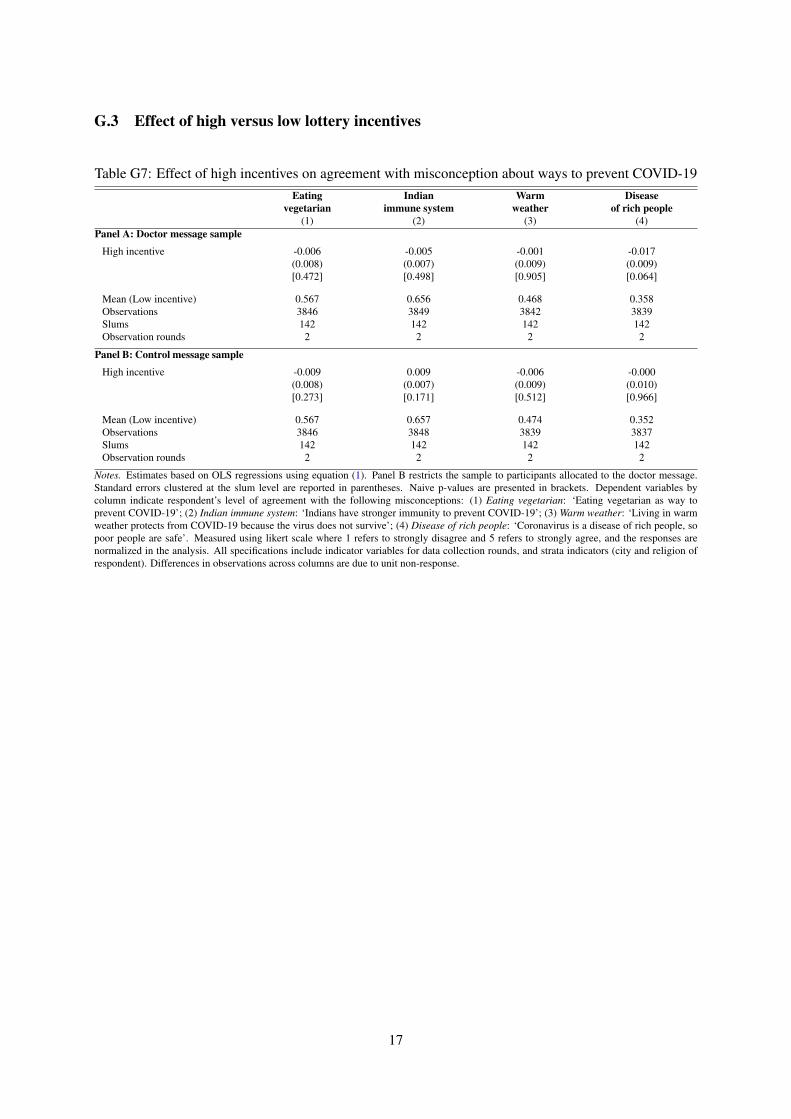
G.3 Effect of high versus low lottery incentives
Table G7: Effect of high incentives on agreement with misconception about ways to prevent COVID-19Eating Indian Warm Disease
vegetarian immune system weather of rich people(1) (2) (3) (4)
Panel A: Doctor message sample
High incentive -0.006 -0.005 -0.001 -0.017(0.008) (0.007) (0.009) (0.009)[0.472] [0.498] [0.905] [0.064]
Mean (Low incentive) 0.567 0.656 0.468 0.358Observations 3846 3849 3842 3839Slums 142 142 142 142Observation rounds 2 2 2 2
Panel B: Control message sample
High incentive -0.009 0.009 -0.006 -0.000(0.008) (0.007) (0.009) (0.010)[0.273] [0.171] [0.512] [0.966]
Mean (Low incentive) 0.567 0.657 0.474 0.352Observations 3846 3848 3839 3837Slums 142 142 142 142Observation rounds 2 2 2 2
Notes. Estimates based on OLS regressions using equation (1). Panel B restricts the sample to participants allocated to the doctor message.Standard errors clustered at the slum level are reported in parentheses. Naive p-values are presented in brackets. Dependent variables bycolumn indicate respondent’s level of agreement with the following misconceptions: (1) Eating vegetarian: ‘Eating vegetarian as way toprevent COVID-19’; (2) Indian immune system: ‘Indians have stronger immunity to prevent COVID-19’; (3) Warm weather: ‘Living in warmweather protects from COVID-19 because the virus does not survive’; (4) Disease of rich people: ‘Coronavirus is a disease of rich people, sopoor people are safe’. Measured using likert scale where 1 refers to strongly disagree and 5 refers to strongly agree, and the responses arenormalized in the analysis. All specifications include indicator variables for data collection rounds, and strata indicators (city and religion ofrespondent). Differences in observations across columns are due to unit non-response.
17
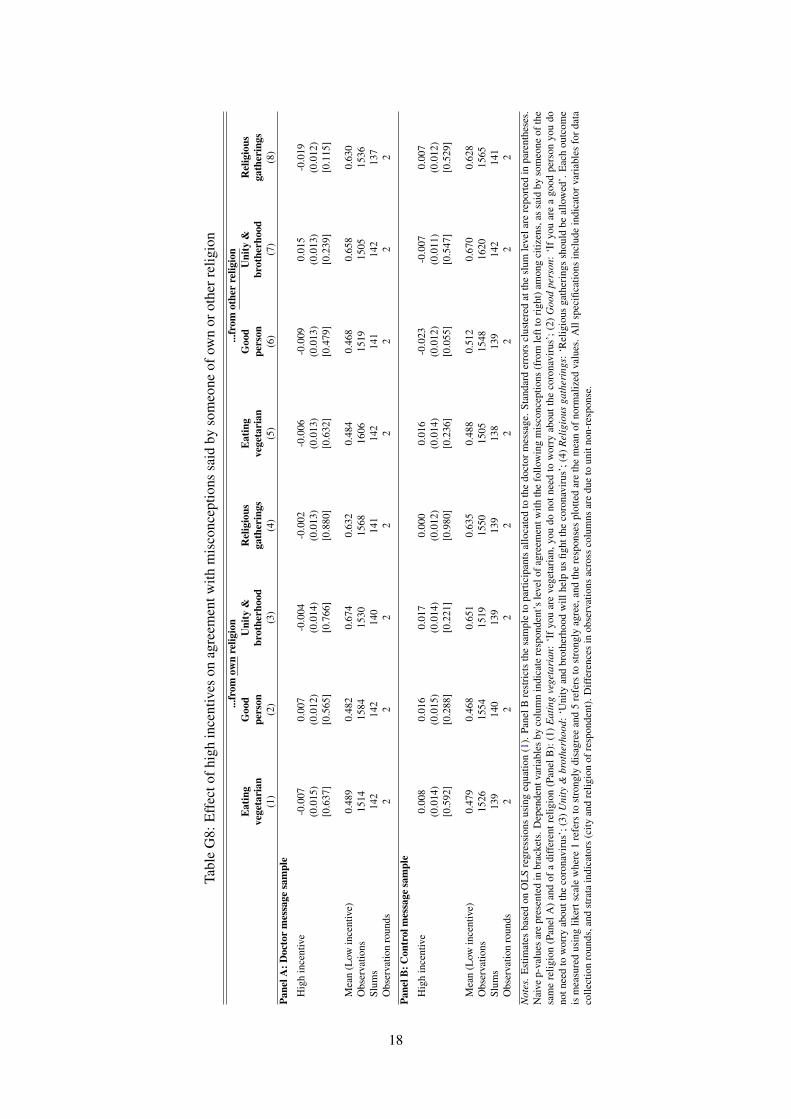
Tabl
eG
8:E
ffec
tofh
igh
ince
ntiv
eson
agre
emen
twith
mis
conc
eptio
nssa
idby
som
eone
ofow
nor
othe
rrel
igio
n...
from
own
relig
ion
...fr
omot
her
relig
ion
Eat
ing
Goo
dU
nity
&R
elig
ious
Eat
ing
Goo
dU
nity
&R
elig
ious
vege
tari
anpe
rson
brot
herh
ood
gath
erin
gsve
geta
rian
pers
onbr
othe
rhoo
dga
ther
ings
(1)
(2)
(3)
(4)
(5)
(6)
(7)
(8)
Pane
lA:D
octo
rm
essa
gesa
mpl
e
Hig
hin
cent
ive
-0.0
070.
007
-0.0
04-0
.002
-0.0
06-0
.009
0.01
5-0
.019
(0.0
15)
(0.0
12)
(0.0
14)
(0.0
13)
(0.0
13)
(0.0
13)
(0.0
13)
(0.0
12)
[0.6
37]
[0.5
65]
[0.7
66]
[0.8
80]
[0.6
32]
[0.4
79]
[0.2
39]
[0.1
15]
Mea
n(L
owin
cent
ive)
0.48
90.
482
0.67
40.
632
0.48
40.
468
0.65
80.
630
Obs
erva
tions
1514
1584
1530
1568
1606
1519
1505
1536
Slum
s14
214
214
014
114
214
114
213
7O
bser
vatio
nro
unds
22
22
22
22
Pane
lB:C
ontr
olm
essa
gesa
mpl
e
Hig
hin
cent
ive
0.00
80.
016
0.01
70.
000
0.01
6-0
.023
-0.0
070.
007
(0.0
14)
(0.0
15)
(0.0
14)
(0.0
12)
(0.0
14)
(0.0
12)
(0.0
11)
(0.0
12)
[0.5
92]
[0.2
88]
[0.2
21]
[0.9
80]
[0.2
36]
[0.0
55]
[0.5
47]
[0.5
29]
Mea
n(L
owin
cent
ive)
0.47
90.
468
0.65
10.
635
0.48
80.
512
0.67
00.
628
Obs
erva
tions
1526
1554
1519
1550
1505
1548
1620
1565
Slum
s13
914
013
913
913
813
914
214
1O
bser
vatio
nro
unds
22
22
22
22
Not
es.E
stim
ates
base
don
OL
Sre
gres
sion
sus
ing
equa
tion
(1).
Pane
lBre
stri
cts
the
sam
ple
topa
rtic
ipan
tsal
loca
ted
toth
edo
ctor
mes
sage
.Sta
ndar
der
rors
clus
tere
dat
the
slum
leve
lare
repo
rted
inpa
rent
hese
s.N
aive
p-va
lues
are
pres
ente
din
brac
kets
.Dep
ende
ntva
riab
les
byco
lum
nin
dica
tere
spon
dent
’sle
velo
fagr
eem
entw
ithth
efo
llow
ing
mis
conc
eptio
ns(f
rom
left
tori
ght)
amon
gci
tizen
s,as
said
byso
meo
neof
the
sam
ere
ligio
n(P
anel
A)
and
ofa
diff
eren
trel
igio
n(P
anel
B):
(1)
Eat
ing
vege
tari
an:
‘If
you
are
vege
tari
an,y
oudo
notn
eed
tow
orry
abou
tthe
coro
navi
rus’
;(2)
Goo
dpe
rson
:‘I
fyo
uar
ea
good
pers
onyo
udo
notn
eed
tow
orry
abou
tthe
coro
navi
rus’
;(3)
Uni
ty&
brot
herh
ood:
‘Uni
tyan
dbr
othe
rhoo
dw
illhe
lpus
fight
the
coro
navi
rus’
;(4)
Rel
igio
usga
ther
ings
:‘R
elig
ious
gath
erin
gssh
ould
beal
low
ed’.
Eac
hou
tcom
eis
mea
sure
dus
ing
liker
tsca
lew
here
1re
fers
tost
rong
lydi
sagr
eean
d5
refe
rsto
stro
ngly
agre
e,an
dth
ere
spon
ses
plot
ted
are
the
mea
nof
norm
aliz
edva
lues
.All
spec
ifica
tions
incl
ude
indi
cato
rvar
iabl
esfo
rdat
aco
llect
ion
roun
ds,a
ndst
rata
indi
cato
rs(c
ityan
dre
ligio
nof
resp
onde
nt).
Diff
eren
ces
inob
serv
atio
nsac
ross
colu
mns
are
due
toun
itno
n-re
spon
se.
18
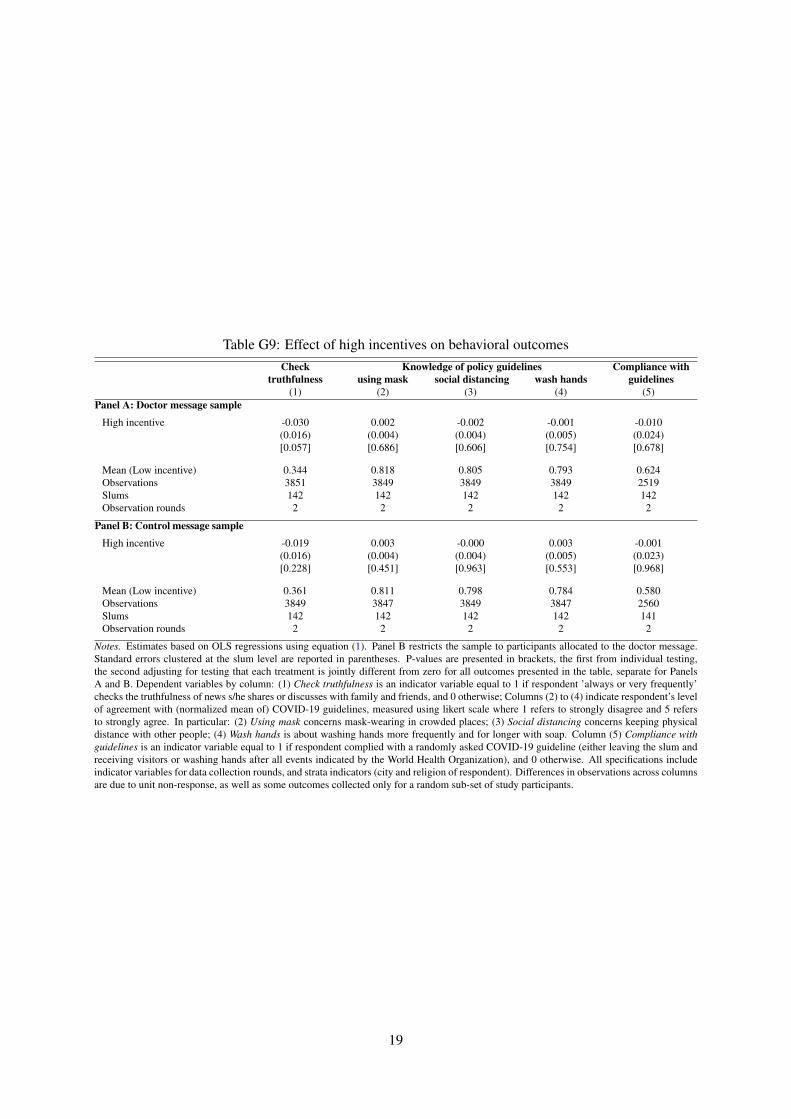
Table G9: Effect of high incentives on behavioral outcomesCheck Knowledge of policy guidelines Compliance with
truthfulness using mask social distancing wash hands guidelines(1) (2) (3) (4) (5)
Panel A: Doctor message sample
High incentive -0.030 0.002 -0.002 -0.001 -0.010(0.016) (0.004) (0.004) (0.005) (0.024)[0.057] [0.686] [0.606] [0.754] [0.678]
Mean (Low incentive) 0.344 0.818 0.805 0.793 0.624Observations 3851 3849 3849 3849 2519Slums 142 142 142 142 142Observation rounds 2 2 2 2 2
Panel B: Control message sample
High incentive -0.019 0.003 -0.000 0.003 -0.001(0.016) (0.004) (0.004) (0.005) (0.023)[0.228] [0.451] [0.963] [0.553] [0.968]
Mean (Low incentive) 0.361 0.811 0.798 0.784 0.580Observations 3849 3847 3849 3847 2560Slums 142 142 142 142 141Observation rounds 2 2 2 2 2
Notes. Estimates based on OLS regressions using equation (1). Panel B restricts the sample to participants allocated to the doctor message.Standard errors clustered at the slum level are reported in parentheses. P-values are presented in brackets, the first from individual testing,the second adjusting for testing that each treatment is jointly different from zero for all outcomes presented in the table, separate for PanelsA and B. Dependent variables by column: (1) Check truthfulness is an indicator variable equal to 1 if respondent ’always or very frequently’checks the truthfulness of news s/he shares or discusses with family and friends, and 0 otherwise; Columns (2) to (4) indicate respondent’s levelof agreement with (normalized mean of) COVID-19 guidelines, measured using likert scale where 1 refers to strongly disagree and 5 refersto strongly agree. In particular: (2) Using mask concerns mask-wearing in crowded places; (3) Social distancing concerns keeping physicaldistance with other people; (4) Wash hands is about washing hands more frequently and for longer with soap. Column (5) Compliance withguidelines is an indicator variable equal to 1 if respondent complied with a randomly asked COVID-19 guideline (either leaving the slum andreceiving visitors or washing hands after all events indicated by the World Health Organization), and 0 otherwise. All specifications includeindicator variables for data collection rounds, and strata indicators (city and religion of respondent). Differences in observations across columnsare due to unit non-response, as well as some outcomes collected only for a random sub-set of study participants.
19
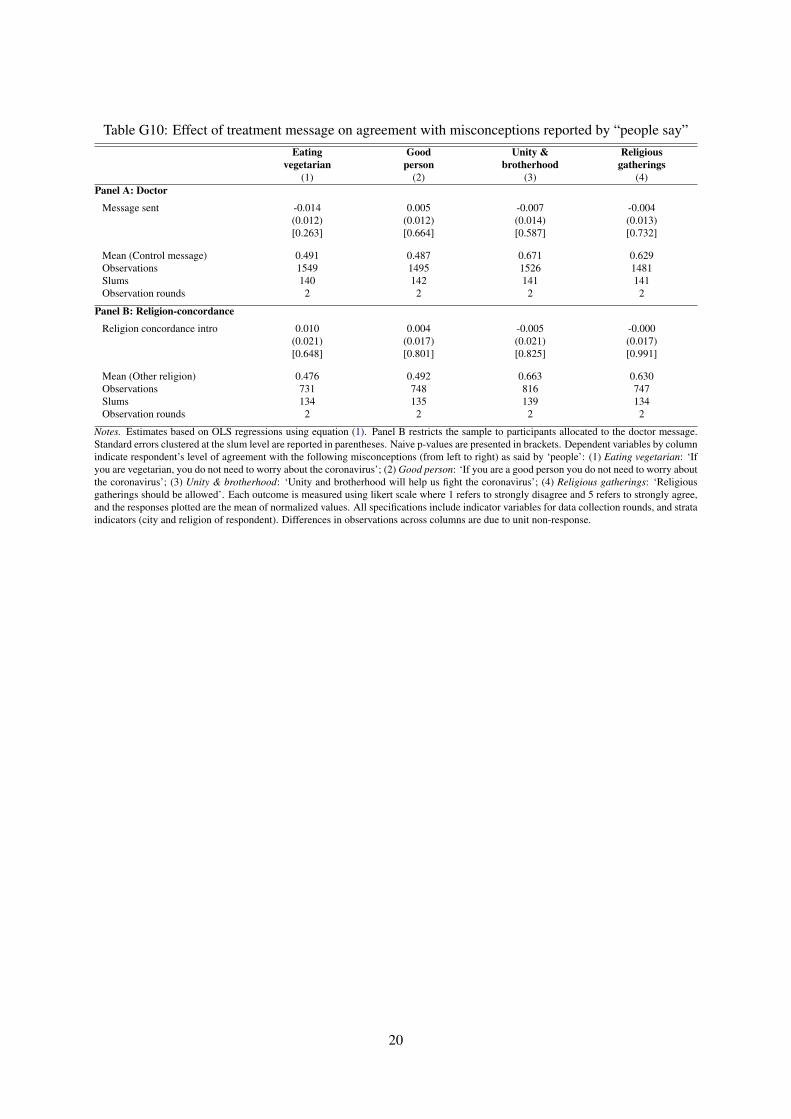
Table G10: Effect of treatment message on agreement with misconceptions reported by “people say”Eating Good Unity & Religious
vegetarian person brotherhood gatherings(1) (2) (3) (4)
Panel A: Doctor
Message sent -0.014 0.005 -0.007 -0.004(0.012) (0.012) (0.014) (0.013)[0.263] [0.664] [0.587] [0.732]
Mean (Control message) 0.491 0.487 0.671 0.629Observations 1549 1495 1526 1481Slums 140 142 141 141Observation rounds 2 2 2 2
Panel B: Religion-concordance
Religion concordance intro 0.010 0.004 -0.005 -0.000(0.021) (0.017) (0.021) (0.017)[0.648] [0.801] [0.825] [0.991]
Mean (Other religion) 0.476 0.492 0.663 0.630Observations 731 748 816 747Slums 134 135 139 134Observation rounds 2 2 2 2
Notes. Estimates based on OLS regressions using equation (1). Panel B restricts the sample to participants allocated to the doctor message.Standard errors clustered at the slum level are reported in parentheses. Naive p-values are presented in brackets. Dependent variables by columnindicate respondent’s level of agreement with the following misconceptions (from left to right) as said by ‘people’: (1) Eating vegetarian: ‘Ifyou are vegetarian, you do not need to worry about the coronavirus’; (2) Good person: ‘If you are a good person you do not need to worry aboutthe coronavirus’; (3) Unity & brotherhood: ‘Unity and brotherhood will help us fight the coronavirus’; (4) Religious gatherings: ‘Religiousgatherings should be allowed’. Each outcome is measured using likert scale where 1 refers to strongly disagree and 5 refers to strongly agree,and the responses plotted are the mean of normalized values. All specifications include indicator variables for data collection rounds, and strataindicators (city and religion of respondent). Differences in observations across columns are due to unit non-response.
20
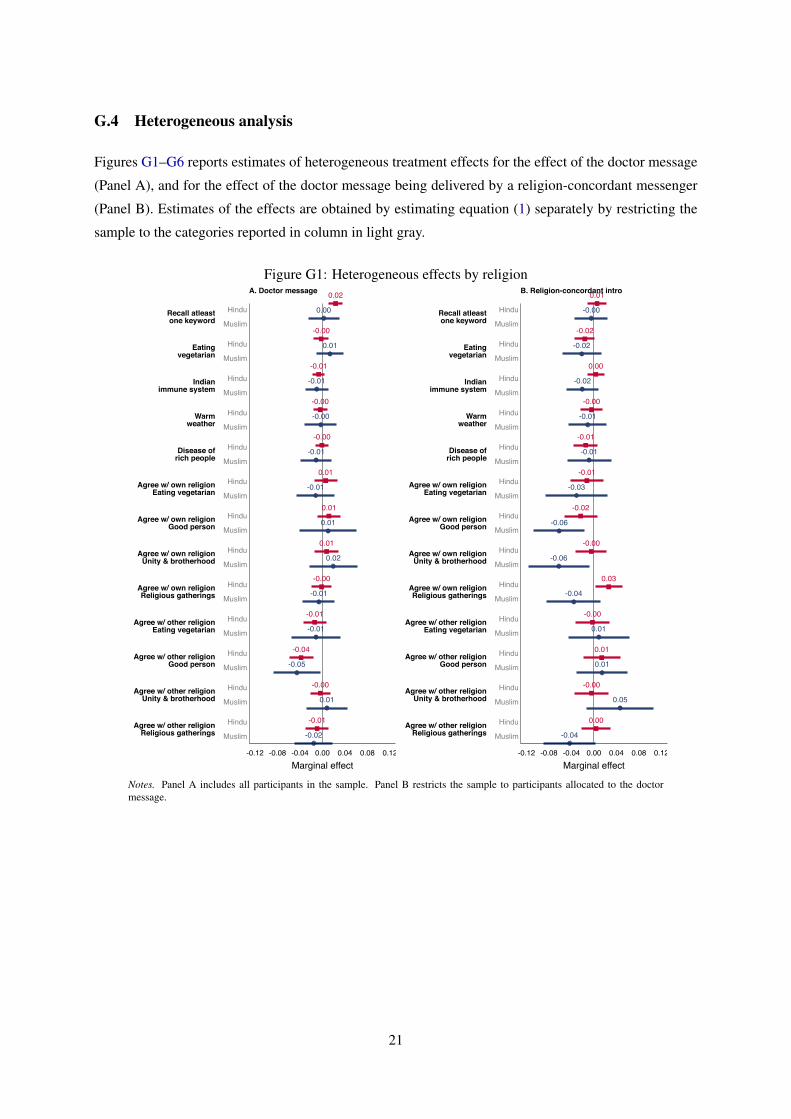
G.4 Heterogeneous analysis
Figures G1–G6 reports estimates of heterogeneous treatment effects for the effect of the doctor message
(Panel A), and for the effect of the doctor message being delivered by a religion-concordant messenger
(Panel B). Estimates of the effects are obtained by estimating equation (1) separately by restricting the
sample to the categories reported in column in light gray.
Figure G1: Heterogeneous effects by religion0.02
0.00
-0.00
0.01
-0.01
-0.01
-0.00
-0.00
-0.00
-0.01
0.01
-0.01
0.01
0.01
0.01
0.02
-0.00
-0.01
-0.01
-0.01
-0.04
-0.05
-0.00
0.01
-0.01
-0.02
Recall atleastone keyword
Eatingvegetarian
Indianimmune system
Warmweather
Disease ofrich people
Agree w/ own religionEating vegetarian
Agree w/ own religionGood person
Agree w/ own religionUnity & brotherhood
Agree w/ own religionReligious gatherings
Agree w/ other religionEating vegetarian
Agree w/ other religionGood person
Agree w/ other religionUnity & brotherhood
Agree w/ other religionReligious gatherings
Hindu
Muslim
Hindu
Muslim
Hindu
Muslim
Hindu
Muslim
Hindu
Muslim
Hindu
Muslim
Hindu
Muslim
Hindu
Muslim
Hindu
Muslim
Hindu
Muslim
Hindu
Muslim
Hindu
Muslim
Hindu
Muslim
-0.12 -0.08 -0.04 0.00 0.04 0.08 0.12Marginal effect
A. Doctor message 0.01
-0.00
-0.02
-0.02
0.00
-0.02
-0.00
-0.01
-0.01
-0.01
-0.01
-0.03
-0.02
-0.06
-0.00
-0.06
0.03
-0.04
-0.00
0.01
0.01
0.01
-0.00
0.05
0.00
-0.04
Recall atleastone keyword
Eatingvegetarian
Indianimmune system
Warmweather
Disease ofrich people
Agree w/ own religionEating vegetarian
Agree w/ own religionGood person
Agree w/ own religionUnity & brotherhood
Agree w/ own religionReligious gatherings
Agree w/ other religionEating vegetarian
Agree w/ other religionGood person
Agree w/ other religionUnity & brotherhood
Agree w/ other religionReligious gatherings
Hindu
Muslim
Hindu
Muslim
Hindu
Muslim
Hindu
Muslim
Hindu
Muslim
Hindu
Muslim
Hindu
Muslim
Hindu
Muslim
Hindu
Muslim
Hindu
Muslim
Hindu
Muslim
Hindu
Muslim
Hindu
Muslim
-0.12 -0.08 -0.04 0.00 0.04 0.08 0.12Marginal effect
B. Religion-concordant intro
Notes. Panel A includes all participants in the sample. Panel B restricts the sample to participants allocated to the doctormessage.
21
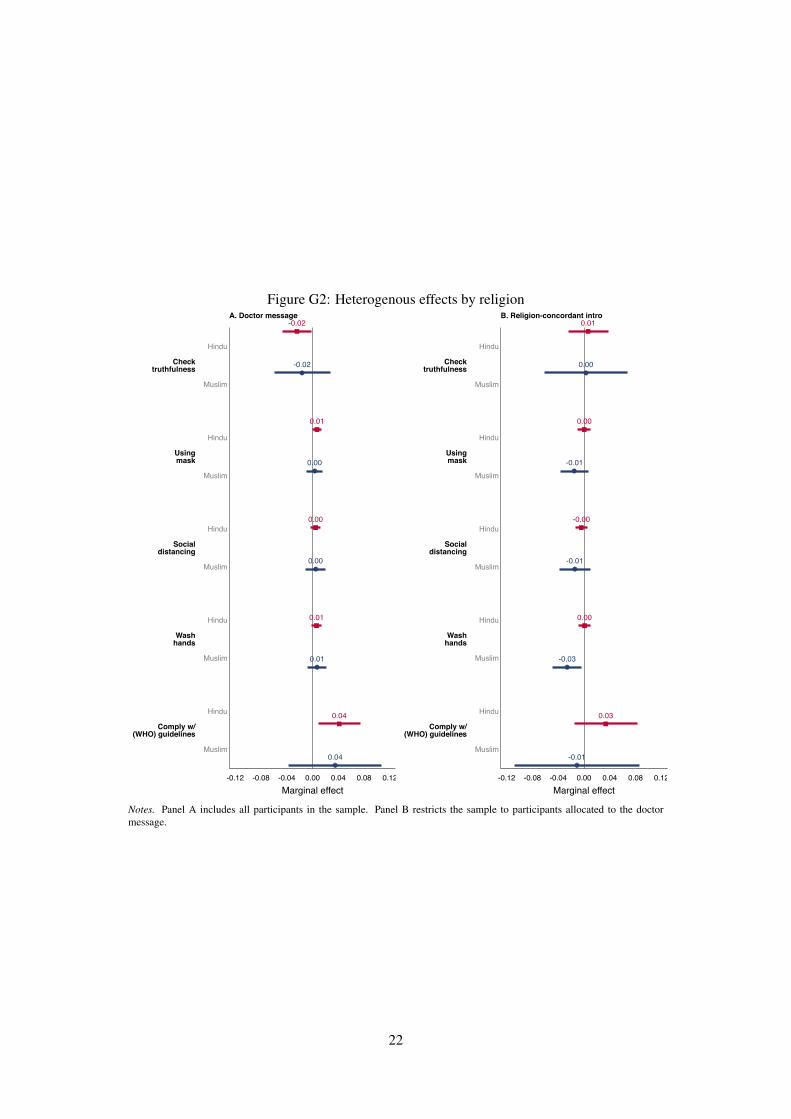
Figure G2: Heterogenous effects by religion-0.02
-0.02
0.01
0.00
0.00
0.00
0.01
0.01
0.04
0.04
Checktruthfulness
Usingmask
Socialdistancing
Washhands
Comply w/(WHO) guidelines
Hindu
Muslim
Hindu
Muslim
Hindu
Muslim
Hindu
Muslim
Hindu
Muslim
-0.12 -0.08 -0.04 0.00 0.04 0.08 0.12Marginal effect
A. Doctor message0.01
0.00
0.00
-0.01
-0.00
-0.01
0.00
-0.03
0.03
-0.01
Checktruthfulness
Usingmask
Socialdistancing
Washhands
Comply w/(WHO) guidelines
Hindu
Muslim
Hindu
Muslim
Hindu
Muslim
Hindu
Muslim
Hindu
Muslim
-0.12 -0.08 -0.04 0.00 0.04 0.08 0.12Marginal effect
B. Religion-concordant intro
Notes. Panel A includes all participants in the sample. Panel B restricts the sample to participants allocated to the doctormessage.
22
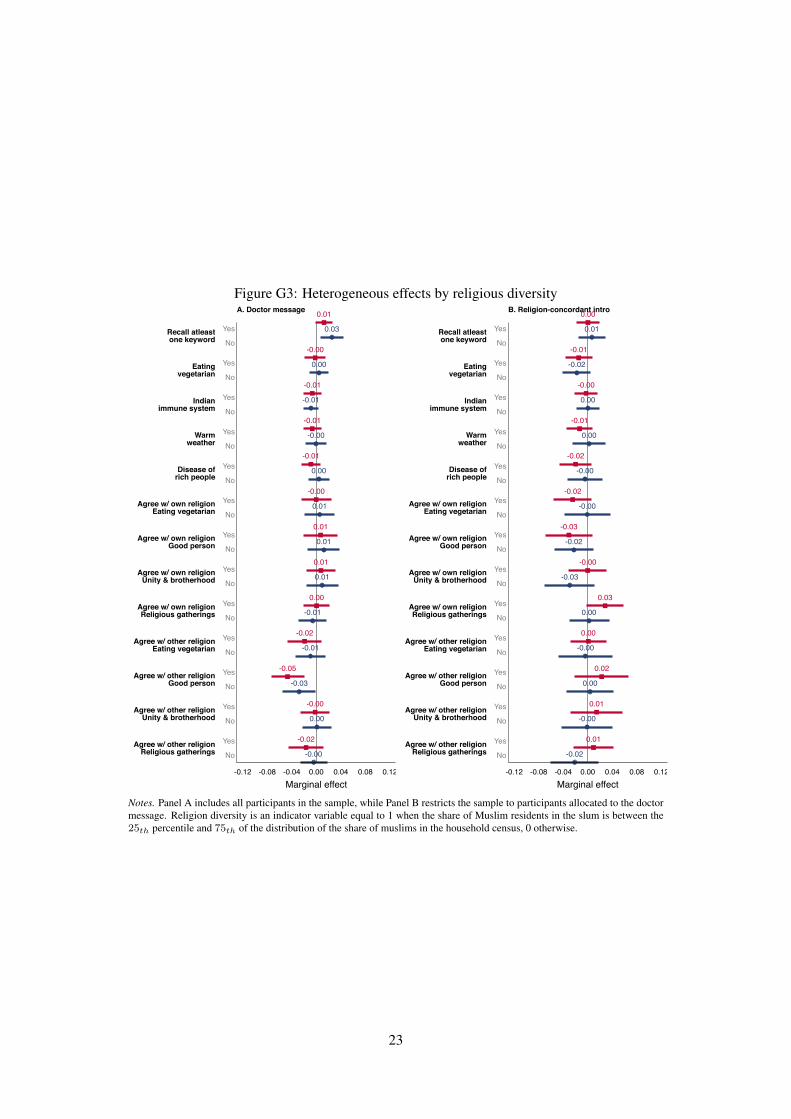
Figure G3: Heterogeneous effects by religious diversity0.01
0.03
-0.00
0.00
-0.01
-0.01
-0.01
-0.00
-0.01
0.00
-0.00
0.01
0.01
0.01
0.01
0.01
0.00
-0.01
-0.02
-0.01
-0.05
-0.03
-0.00
0.00
-0.02
-0.00
Recall atleastone keyword
Eatingvegetarian
Indianimmune system
Warmweather
Disease ofrich people
Agree w/ own religionEating vegetarian
Agree w/ own religionGood person
Agree w/ own religionUnity & brotherhood
Agree w/ own religionReligious gatherings
Agree w/ other religionEating vegetarian
Agree w/ other religionGood person
Agree w/ other religionUnity & brotherhood
Agree w/ other religionReligious gatherings
Yes
No
Yes
No
Yes
No
Yes
No
Yes
No
Yes
No
Yes
No
Yes
No
Yes
No
Yes
No
Yes
No
Yes
No
Yes
No
-0.12 -0.08 -0.04 0.00 0.04 0.08 0.12Marginal effect
A. Doctor message 0.00
0.01
-0.01
-0.02
-0.00
0.00
-0.01
0.00
-0.02
-0.00
-0.02
-0.00
-0.03
-0.02
-0.00
-0.03
0.03
0.00
0.00
-0.00
0.02
0.00
0.01
-0.00
0.01
-0.02
Recall atleastone keyword
Eatingvegetarian
Indianimmune system
Warmweather
Disease ofrich people
Agree w/ own religionEating vegetarian
Agree w/ own religionGood person
Agree w/ own religionUnity & brotherhood
Agree w/ own religionReligious gatherings
Agree w/ other religionEating vegetarian
Agree w/ other religionGood person
Agree w/ other religionUnity & brotherhood
Agree w/ other religionReligious gatherings
Yes
No
Yes
No
Yes
No
Yes
No
Yes
No
Yes
No
Yes
No
Yes
No
Yes
No
Yes
No
Yes
No
Yes
No
Yes
No
-0.12 -0.08 -0.04 0.00 0.04 0.08 0.12Marginal effect
B. Religion-concordant intro
Notes. Panel A includes all participants in the sample, while Panel B restricts the sample to participants allocated to the doctormessage. Religion diversity is an indicator variable equal to 1 when the share of Muslim residents in the slum is between the25th percentile and 75th of the distribution of the share of muslims in the household census, 0 otherwise.
23
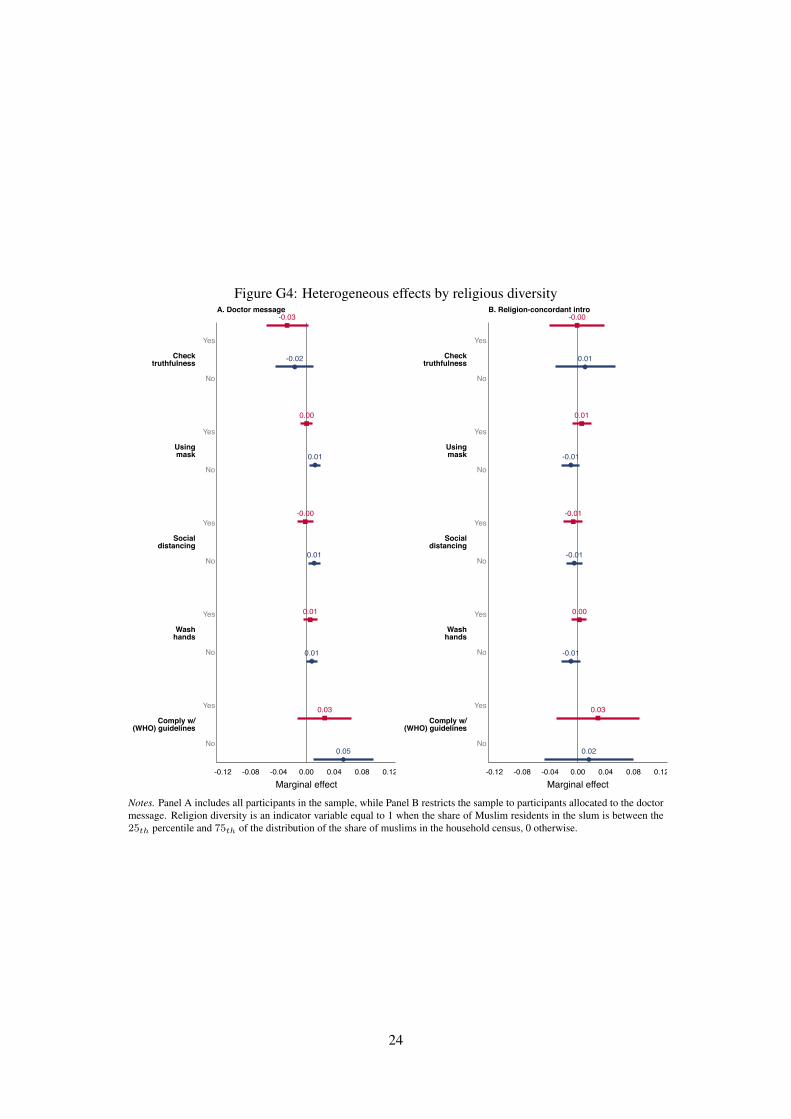
Figure G4: Heterogeneous effects by religious diversity-0.03
-0.02
0.00
0.01
-0.00
0.01
0.01
0.01
0.03
0.05
Checktruthfulness
Usingmask
Socialdistancing
Washhands
Comply w/(WHO) guidelines
Yes
No
Yes
No
Yes
No
Yes
No
Yes
No
-0.12 -0.08 -0.04 0.00 0.04 0.08 0.12Marginal effect
A. Doctor message-0.00
0.01
0.01
-0.01
-0.01
-0.01
0.00
-0.01
0.03
0.02
Checktruthfulness
Usingmask
Socialdistancing
Washhands
Comply w/(WHO) guidelines
Yes
No
Yes
No
Yes
No
Yes
No
Yes
No
-0.12 -0.08 -0.04 0.00 0.04 0.08 0.12Marginal effect
B. Religion-concordant intro
Notes. Panel A includes all participants in the sample, while Panel B restricts the sample to participants allocated to the doctormessage. Religion diversity is an indicator variable equal to 1 when the share of Muslim residents in the slum is between the25th percentile and 75th of the distribution of the share of muslims in the household census, 0 otherwise.
24
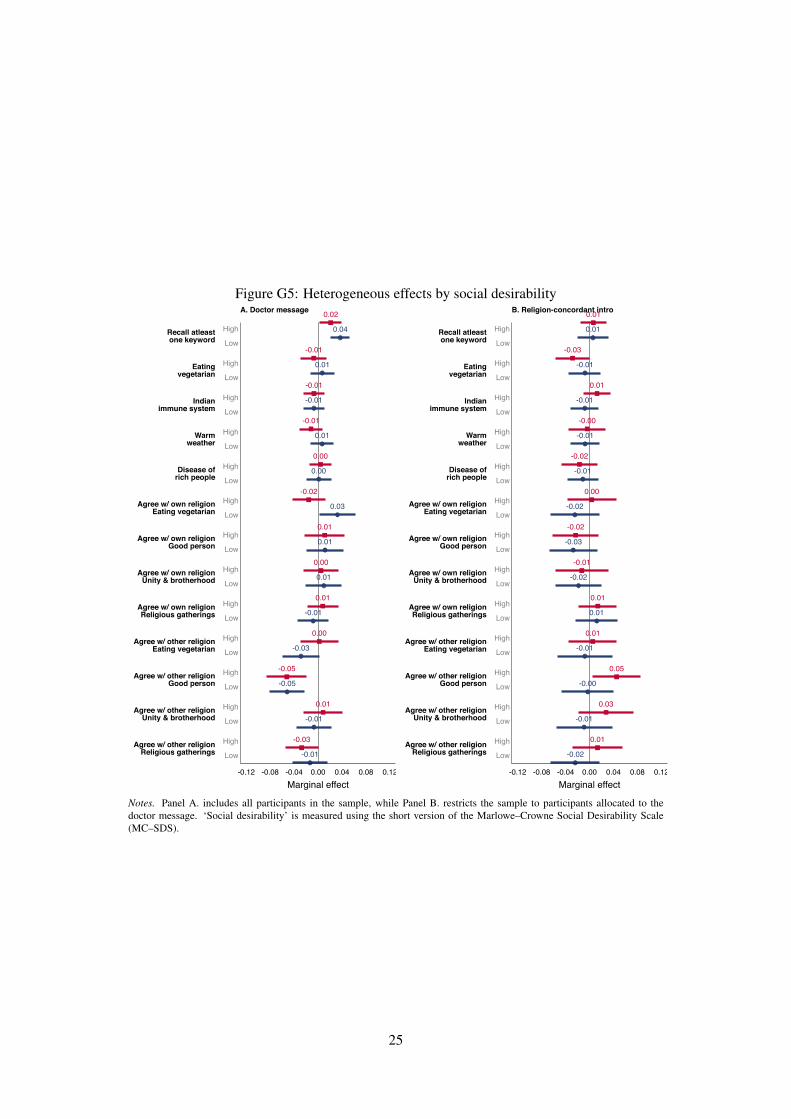
Figure G5: Heterogeneous effects by social desirability0.02
0.04
-0.01
0.01
-0.01
-0.01
-0.01
0.01
0.00
0.00
-0.02
0.03
0.01
0.01
0.00
0.01
0.01
-0.01
0.00
-0.03
-0.05
-0.05
0.01
-0.01
-0.03
-0.01
Recall atleastone keyword
Eatingvegetarian
Indianimmune system
Warmweather
Disease ofrich people
Agree w/ own religionEating vegetarian
Agree w/ own religionGood person
Agree w/ own religionUnity & brotherhood
Agree w/ own religionReligious gatherings
Agree w/ other religionEating vegetarian
Agree w/ other religionGood person
Agree w/ other religionUnity & brotherhood
Agree w/ other religionReligious gatherings
High
Low
High
Low
High
Low
High
Low
High
Low
High
Low
High
Low
High
Low
High
Low
High
Low
High
Low
High
Low
High
Low
-0.12 -0.08 -0.04 0.00 0.04 0.08 0.12Marginal effect
A. Doctor message 0.01
0.01
-0.03
-0.01
0.01
-0.01
-0.00
-0.01
-0.02
-0.01
0.00
-0.02
-0.02
-0.03
-0.01
-0.02
0.01
0.01
0.01
-0.01
0.05
-0.00
0.03
-0.01
0.01
-0.02
Recall atleastone keyword
Eatingvegetarian
Indianimmune system
Warmweather
Disease ofrich people
Agree w/ own religionEating vegetarian
Agree w/ own religionGood person
Agree w/ own religionUnity & brotherhood
Agree w/ own religionReligious gatherings
Agree w/ other religionEating vegetarian
Agree w/ other religionGood person
Agree w/ other religionUnity & brotherhood
Agree w/ other religionReligious gatherings
High
Low
High
Low
High
Low
High
Low
High
Low
High
Low
High
Low
High
Low
High
Low
High
Low
High
Low
High
Low
High
Low
-0.12 -0.08 -0.04 0.00 0.04 0.08 0.12Marginal effect
B. Religion-concordant intro
Notes. Panel A. includes all participants in the sample, while Panel B. restricts the sample to participants allocated to thedoctor message. ‘Social desirability’ is measured using the short version of the Marlowe–Crowne Social Desirability Scale(MC–SDS).
25
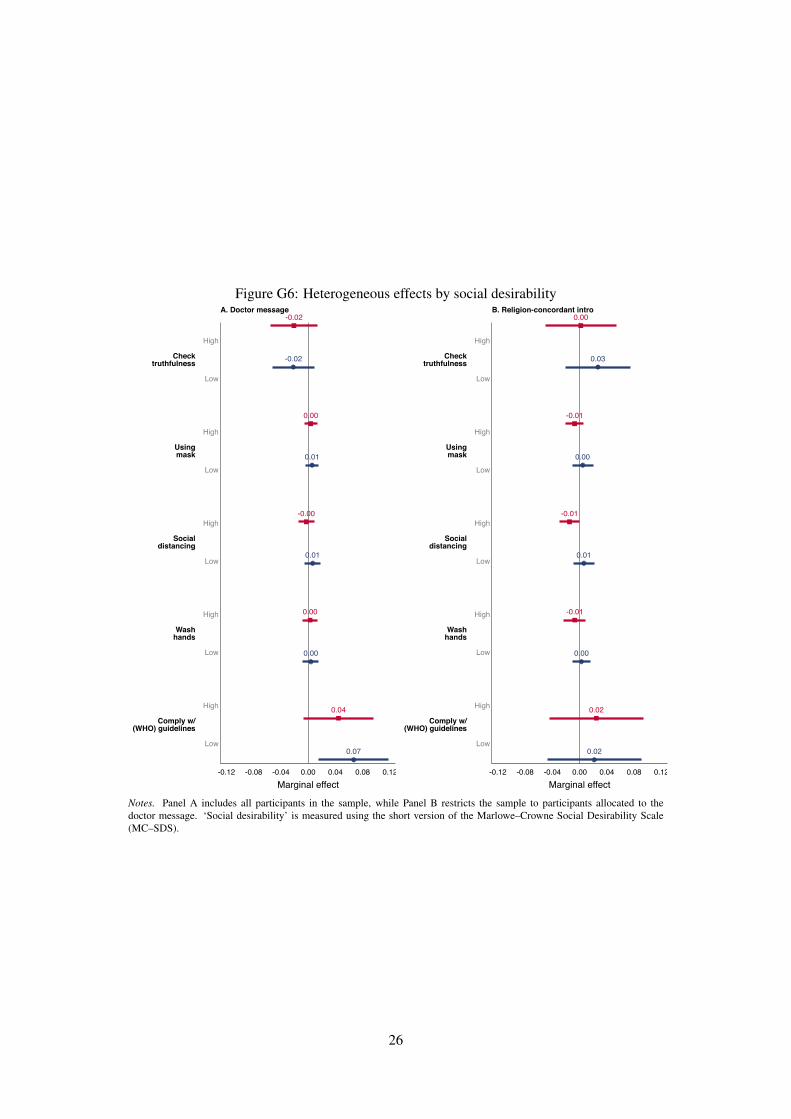
Figure G6: Heterogeneous effects by social desirability-0.02
-0.02
0.00
0.01
-0.00
0.01
0.00
0.00
0.04
0.07
Checktruthfulness
Usingmask
Socialdistancing
Washhands
Comply w/(WHO) guidelines
High
Low
High
Low
High
Low
High
Low
High
Low
-0.12 -0.08 -0.04 0.00 0.04 0.08 0.12Marginal effect
A. Doctor message0.00
0.03
-0.01
0.00
-0.01
0.01
-0.01
0.00
0.02
0.02
Checktruthfulness
Usingmask
Socialdistancing
Washhands
Comply w/(WHO) guidelines
High
Low
High
Low
High
Low
High
Low
High
Low
-0.12 -0.08 -0.04 0.00 0.04 0.08 0.12Marginal effect
B. Religion-concordant intro
Notes. Panel A includes all participants in the sample, while Panel B restricts the sample to participants allocated to thedoctor message. ‘Social desirability’ is measured using the short version of the Marlowe–Crowne Social Desirability Scale(MC–SDS).
26
Appendix Bibliography
Awasthi, P. (2020). UP seals off hotspots in 15 districts, including Lucknow, Noida to contain spread.
The Week.
Facebook’s Crowd Tangle Team (2020). CrowdTangle.
Government of India (2011). Census of India 2011.
Ministry of Home Affairs India (2020a). Continuation of Order No. 40-3/2020-DM-I(A).
Ministry of Home Affairs India (2020b). Government of India issues Orders prescribing lockdown for
containment of COVID-19 Epidemic in the country.
Ministry of Home Affairs India (2020c). Guideline for Phased Re-opening (Unlock 1).
Ministry of Home Affairs India (2020d). Guidelines for Phased Re-opening (Unlock 3).
Ministry of Home Affairs India (2020e). Guidelines for Phased Re-opening (Unlock 4).
Ministry of Home Affairs India (2020f). MHA issues Unlock 3 Guidelines, opens up more activities
outside Containment Zones.
Ministry of Home Affairs India (2020g). Ministry of Home Affairs (MHA) – New Guidelines for Unlock
2.
Reserve Bank of India (2019). State-wise Poverty Rate. Technical report, National Sample Survey
Organisation, NITI Aayog, Delhi, India.
United Nations (2019). World Urbanization Prospects: The 2018 Revision. United Nations, Department
of Economic and Social Affairs, Population Division, New York, US.
27