cost, staffing and quality impact of bedside electronic medical record (emr) in nursing homes
TRANSCRIPT

Cost, Staffing and Quality Impact ofBedside Electronic Medical Record(EMR) in Nursing Homes
SinclaMediManaColumMO ((R.W.MO (Cversitangle
EvaluServicCMS-repre
Addreof Nusity o
Copyr
DOI:1
ORIG
Marilyn J. Rantz, PhD, RN, FAAN, Lanis Hicks, PhD, Gregory F. Petroski, PhD, Richard W. Madsen, PhD,Greg Alexander, PhD, RN, Colleen Galambos, PhD, Vicki Conn, PhD, RN, FAAN, Jill Scott-Cawiezell, PhD, RN, FAAN,Mary Zwygart-Stauffacher, PhD, RN, FAAN, and Leslie Greenwald, PhD
Objective: There is growing political pressure for nurs-ing homes to implement the electronic medical re-cord (EMR) but there is little evidence of its impacton resident care. The purpose of this study was totest the unique and combined contributions of EMRat the bedside and on-site clinical consultation bygerontological expert nurses on cost, staffing, andquality of care in nursing homes.
Methods: Eighteen nursing facilities in 3 states partic-ipated in a 4-group 24-month comparison: Group 1 im-plemented bedside EMR, used nurse consultation;Group 2 implemented bedside EMR only; Group 3used nurse consultation only; Group 4 neither. Inter-vention sites (Groups 1 and 2) received substantial, par-tial financial support from CMS to implement EMR.Costs and staffing were measured from Medicaidcost reports, and staff retention from primary datacollection; resident outcomes were measured byMDS-based quality indicators and quality measures.
Results: Total costs increased in both interventiongroups that implemented technology; staffing and
ir School of Nursing and Family and Community Medicine, School ofcine, University of Missouri, Columbia, MO (M.J.R., G.A., V.C.); Healthgement and Informatics, School of Medicine, University of Missouri,bia, MO (L.H.); School of Medicine, University of Missouri, Columbia,
G.F.P.); Department of Statistics, University of Missouri, Columbia, MOM.); Department of Social Work, University of Missouri, Columbia,.G.); College of Nursing, University of Iowa, Iowa City, IA (J.S.-C.); Uni-
y of Wisconsin, Eau Claire, WI (M.Z.-S.); RTI International, Research Tri-Park, NC (L.G.)
ation activities were supported by the Centers for Medicare & Medicaides (CMS) for work completed for the project funded in response to RFP-03–001/DB. Opinions are those of the authors and do not necessarilysent CMS.
ss correspondence to Marilyn J. Rantz, PhD, RN, FAAN, Sinclair Schoolrsing and Family and Community Medicine, School of Medicine, Univer-f Missouri, Columbia, MO. E-mail: [email protected]
ight �2010 American Medical Directors Association
0.1016/j.jamda.2009.11.010
INAL STUDIES
staff retention remained constant. Improvement trendswere detected in resident outcomes of ADLs, range ofmotion, and high-risk pressure sores for both interven-tion groups but not in comparison groups.
Discussion: Implementation of bedside EMR is notcost neutral. There were increased total costs for allintervention facilities. These costs were not a resultof increased direct care staffing or increased staffturnover.
Conclusions: Nursing home leaders and policy makersneed to be aware of on-going hardware and softwarecosts as well as costs of continual technical support forthe EMR and constant staff orientation to use the sys-tem. EMR can contribute to the quality of nursinghome care and can be enhanced by on-site consulta-tion by nurses with graduate education in nursingand expertise in gerontology. (J Am Med Dir Assoc2010; 11: 485–493)
Keywords: EMR; costs; quality indicators; nursinghomes; advanced practice nurse
Clinical information systems are designed to assist in thedelivery, support, and management of patient care and in
administrative and financial matters.1 Although clinical in-formation systems are not widely used in nursing homes, thereis increasing political pressure to implement such systems.2,3
Bedside electronic medical record (EMR) appears to have po-tential to improve the efficiency and effectiveness of care innursing homes, particularly when it helps collect daily mea-sures and outcomes of resident care.4,5 However, it is not clearif bedside EMR alone is potentially sufficient, or if bedsideEMR should be coupled with other on-site interventions toachieve maximum potential effect.
One state’s initiative to improve quality in nursing homesdemonstrated that on-site clinical consultation by an ad-vanced practice nurse (APN) with clinical expertise in ge-rontological nursing, coupled with quality indicatorfeedback reports, contribute to quality care and improved res-ident outcomes.6 When on-site clinical consultation was ex-panded statewide as the Quality Improvement Program forMissouri (QIPMO), improvements were documented in sev-eral quality indicators, including pressure ulcers, range of
Rantz et al 485
motion or activities of daily living, and others.7 Recently, costanalyses revealed improving resident outcomes also has sub-stantial cost savings for nursing homes that use on-site clini-cal consultation from nurses with graduate education andexpertise in gerontological nursing.8
This study implemented an intervention designed to eval-uate the impact on costs and staffing and test the unique andcombined contributions of bedside EMR and on-site clinicalconsultation by gerontological expert nurses toward improv-ing the care of nursing facility residents. Findings are pre-sented of costs, staffing, and resident outcomes of 18nursing facilities in 3 states that participated in this evalua-tion. This represents the first comprehensive evaluation ofbedside EMR in nursing homes. Researchers who conductedthis evaluation had no commercial interest or relationshipwith the EMR vendor.
BACKGROUND
Bedside EMR Evaluated
This study implemented a bedside EMR developed byOptimus EMR (OEMR, Irvine, CA) that provides access toreal-time information for nursing staffs and management inlong-term care facilities. The OEMR’s goal is to make clinicaldocumentation of care efficient and accurate. The system au-tomates several manual processes, including the preparationof Minimum Data Set (MDS) forms and facilitates accuratereimbursement rates.
The OEMR integrates microchips (iButtons) located oneach resident’s bracelet and on the caregiver’s ID badge, radiofrequency (RF), personal data assistants (PDAs), and wirelesstechnology through the company’s proprietary software. Datathat are collected, either at the point of care with handheldPDAs or entered on a personal computer, automatically pop-ulate all appropriate sections in the EMR and the MDS. TheOEMR offers a total electronic charting system (includingphysician orders, medication administration, and treatmentrecords), which streamlines the assessment and documenta-tion process. The system allows for accountability, verifica-tion of caregiver activities, bi-directional alerts andmessages, and extensive clinical and administrative reports.
Technology in Health Care
Technology has improved computer charting, care plan-ning, information accessibility, decision making, and percep-tions of information security in acute care settings.9–14
Computerized clinical documentation systems make a mea-surable improvement in documentation after implementa-tion of an integrated point-of-care system on hospitalnursing units.15 In one study, there was a 13% increase incompliance with Joint Commission accreditation require-ments and in another study there was 34% improvement.10
Computer use in nursing homes has generally been limitedto business applications and management of the federally re-quired MDS.16,17 There are a few sophisticated systems inlimited numbers of nursing homes. 4,5,18,19 These are highlysophisticated computerized systems to manage care, includingapplications for electronic tracking of resident identification,
486 Rantz et al
electronic systems for discharge and transferring residents,and clinical decision support systems used to create opportu-nities for earlier intervention when resident problems arise.
Clinical Consultation to Improve Quality
The effectiveness of on-site expert nurse clinical consulta-tion to help nursing homes implement changes to improvecare has been demonstrated in a state university–initiatedprogram.6–8 Other studies have similar results. In a randomlyassigned treatment, the use of advanced-practice nurse con-sultation to implement research-based protocols with nursinghome staff resulted in improvement or less decline in incon-tinence, pressure ulcers, and aggressive behavior.20 Severalstudies found that educational programming and resident-centered consultation reduced the use of physical restraintsin nursing homes without subsequent increases in staffing orresident injury.21–26 Similarly, consultation was shown to re-duce falls in nursing homes.27 However, some of these studiesand others have demonstrated that follow-through by nursinghome staff on the recommendations made during consulta-tion and sustained use of the recommended interventionsmay be difficult to achieve over time.28–30
METHODS
This evaluation compared 4 groups—2 intervention groupsand 2 control groups. Group 1 (n 5 4 facilities, 2066 resi-dents) were from Missouri and agreed to implement OEMRand take advantage of the on-site nurse clinical consultationservices of QIPMO. Group 2 (n 5 4 facilities, 3643 residents)were from 2 other states that implemented OEMR and did nothave access to on-site services such as QIPMO. Group 3 (n 5
5 facilities, 1040 residents) were from Missouri that did notimplement OEMR but did use QIPMO. Group 4 (n 5 5 facil-ities, 1417 residents) were control facilities from Missourithat did not use OEMR nor QIPMO.
The 4-group design enabled us to evaluate the impact oncosts, staffing, and staff retention. It also enabled examiningfor evidence if the use of bedside EMR can facilitate improvedquality of care and subsequent resident outcomes, and ifadding on-site clinical consultation can further enhanceimprovements.
Sample
A stratified purposive approach was used to recruit facilitiesfrom urban and rural areas. Facilities had to be willing to im-plement bedside EMR. A mix of for-profit, not-for-profit, andgovernmental facilities were purposefully represented in eachgroup. As an incentive for participation, facilities implement-ing the OEMR (Groups 1 and 2) received substantial, partialfinancial support from the Centers for Medicare and Medicaid(CMS) in purchasing the OEMR hardware, software, and on-going technical support for 2 years of participation in thestudy. Table 1 displays the characteristics of facilities re-cruited for the evaluation. Because facilities were continu-ously enrolled in the study, they have different baselinedata dates.
Group 1 (intervention) facilities were solicited from cur-rent QIPMO service users in Missouri; 4 facilities (668 total
JAMDA – September 2010

Table 1. Characteristics of Study Participant Nursing Homes
Group Facility Bed Size Ownership Baseline Quarter
1 Intervention MO-Tech 1 Quality ImprovementProgram for Missouri (QIPMO)
1A 240 NFP Q4 20031B 180 Gov Q3 20031C 98 FP Q1 20041D 150 NFP Q3 2004
668 total beds
2 Intervention Other States- Tech only 2A 105 FP Q4 20022B 218 FP Q1 20032C 162 NFP Q1 20042D 150 NFP Q2 2004
635 total beds
3 Control MO-QIPMO only 3A 123 Gov Q4 20033B 120 NFP Q4 20033C 120 FP Q4 20033D 90 NFP Q4 20033E 90 NFP Q4 2003
543 total beds
4 Control MO-No Tech, No QIPMO 4A 180 FP Q4 20034B 120 Gov Q4 20034C 154 Gov Q4 20034D 126 NFP Q4 20034E 310 FP Q4 2003
890 total beds
beds) were recruited. Four Group 2 (intervention) facilities(635 total beds) were recruited from 2 other states thatwere users of the OEMR and closely matched to the Group1 facilities. Because they were not in Missouri, they did nothave access to QIPMO services so they acted as a comparisongroup that only implemented bedside EMR. Five Group 3 fa-cilities (bed count 543), were closely matched to Groups 1and 2 for ownership, bedside, and location, and were recruitedfrom current QIPMO users in Missouri to act as a comparisongroup without EMR. Group 4 facilities (bed count 890) wererandomly selected from the Missouri MDS data set from thosefacilities not participating in QIPMO until 5 facilities (bedcount 890) were matched as in other groups.
Research Questions
(1) What is the impact of bedside EMR to collect daily mea-sures of resident care on facility costs, staffing, and staffretention?
(2) Is quality of care provided to nursing home residents im-proved through the use of bedside EMR alone, on-siteclinical consultation alone, or the combined effect ofboth?
Intervention Procedures
All intervention facilities required staff to participate ineducational training to learn to operate the system. Interven-tion facilities appointed a project coordinator, who workedclosely with OEMR staff during planning and implementa-tion. Group 1 facility staff worked with the QIPMO nurses,who helped staff focus on clinical care and improving care sys-tems that can be facilitated by the OEMR technology.QIPMO nurses provided on-site clinical consultation as
ORIGINAL STUDIES
requested by facility staff, but at least every 2 months forthe duration of the evaluation. Most facilities used theQIPMO nurses at least monthly during the evaluation andothers more often. Group 2 facility staff participated in thestandard OEMR educational training required to operatethe system, and did not have access to QIPMO services.
Data Collection Procedures
Medicaid cost reports were obtained for cost and staffinganalyses. Staff retention data were collected for each facilityusing staff dates of hire, job code (registered nurse [RN], li-censed practical nurse [LPN], aides and orderlies, others) atbaseline, year 1, and year 2. Resident outcomes were mea-sured by MDS-derived quality indicators (QIs) and qualitymeasures (QMs). Standardized algorithms31 that have beenextensively used and analyzed6,32–34 were used to calculateQI scores directly from MDS data for all groups to ensureaccurate comparisons.
MDS data captured in the OEMR from each of the partici-pating Group 1 and 2 facilities were used to calculate the QIs.Before data were provided to the research team, all residentidentifying information was removed by OEMR staff, anda fictitious unique resident identifier replaced each resident’sname or numeric identifier. Groups 3 and 4 QI facility com-parisons were made using Missouri MDS data available to theteam with the necessary data use agreement from CMS. Thestudy was reviewed and approved by the University’s HealthSciences Institutional Review Board before the initiation ofthe evaluation.
QMs are variations of the MDS QIs, developed by other re-searchers and reviewed by a CMS-sponsored technical expertpanel in 2000.35 These publicly reported QM scores weredownloaded from the public Web site and used in analyses.
Rantz et al 487

Analysis
Cost and staffing data from Medicaid cost reports were usedto describe and compare the 4 study groups at baseline, year 1,and year 2 at study end. Total costs, total direct care costs,staffing costs, direct care staffing hours per resident per day,and staff mix were compared. These comparisons proved in-sightful in our prior research.34,36,37 Staff retention was mea-sured with each employee’s date of hire, job classification, andfull- or part-time status at the same intervals as cost and staff-ing. Staff satisfaction with the use of technology was mea-sured using focus groups and interviews. Results of thequalitative data analysis are reported elsewhere.38
Baseline measures for Groups 1 and 2 were calculated fol-lowing each facility’s implementation (see Table 1 for the datesof baseline), then year 1 post implementation, and year 2 atstudy end. Baseline dates for QI and QM scores for Groups 3and 4 were matched to the baseline date of Group 1. A descrip-tive approach with absolute and relative change scores wasused to compare the changes in resident outcomes acrossgroups. Descriptive analysis, rather than statistical testing forsignificance, is appropriate for this evaluation, owing to thesmall sample size and nonrandom selection of 3 of the 4 groups.
RESULTS
Cost and Staffing
Total costs from Medicaid cost reports were analyzed for in-dividual nursing facilities and for the aggregate of all nursingfacilities within each group. In Table 2, total costs indicatesall costs per resident day experienced by the nursing facilities.Annual percentage changes in total costs per resident are pre-sented, as well as percentage changes over the study period.Group 1 (bedside EMR 1 QIPMO) experienced the largest
Table 2. Total Costs per Resident per Day
Costs per Resident Total Costs
Year 1 Year 2 Y
1A $144.33 $153.23 $11B 105.98 112.85 11C 118.24 130.28 11D 128.56 143.44 1Group 1 EMR 1 QIPMO $128.29 $140.12 $12A 150.56 147.73 12B 176.60 181.94 12C 213.60 225.64 22D 148.78 155.43 1Group 2 EMR only $175.31 $181.28 $13A 105.98 96.833B 94.16 101.873C 113.93 127.99 13D 86.47 89.883E 108.45 106.41 1Group 3 QIPMO only $103.95 $105.38 $14A 105.37 99.654B 86.17 92.334C 97.12 86.834D 105.37 99.654E 98.74 101.41 1Group 4 no EMR 1 no QIPMO $97.50 $96.43 $
Chg, change; EMR, electronic medical record; QIPMO, Quality Improve
488 Rantz et al
growth in total costs over the study period with 12.6%; Group2 facilities (bedside EMR only) experienced the next-largestgrowth in total costs over the study period with 9.6%. Controlfacilities in Group 3 (QIPMO only) remained relatively con-stant, and Group 4 (no EMR, no QIPMO) experienceda slight decrease in total costs over the study period. Similarresults were found when only the ‘‘direct care costs’’ associ-ated with providing care to residents in the facility wereanalyzed.
Table 3 shows staffing costs per resident day and includesonly nursing staff—RNs, LPNs, and aides and orderlies. Facil-ities in Groups 1, 2, and 3 experienced increases in the costsfor nursing staff per resident day during the study; Group 4 ex-perienced a slight decline in nursing staff costs. Group 1 ex-perienced the largest rate of increase in nursing staff costsper resident day, and Group 2 experienced the second-highestrate. Even with the increases, Group 1 is still substantially be-low the average nursing staff cost per resident day in the facil-ities in Group 2; Group 1 is higher than facilities in Groups 3and 4. At study end, nursing staff, as a percentage of totalcosts per resident day, was similar across groups, rangingfrom 33.5% in Group 3; to 34.9% in Group 4; to 35.0% inGroup 1; to 38.6% in Group 2. Among the individual facili-ties in each of the groups, there were wide variations inchanges in the costs of nursing staff costs per resident day.Within each group, at least one facility experienced a de-crease in nursing staff costs per resident day during the periodof the study.
The use of staff hours per resident enabled the analysis toadjust for the different sizes of the facilities, as well as the dif-ferences in wage rates among facilities and across states. Asindicated in Table 4, total staff hours per resident per daywere stable for each facility, except for one Group 1 facility
ear 3 Chg Y1 - Y2 Chg Y2 – Y3 Chg Y1 - Y3
58.34 6.17% 3.34% 9.71%06.75 6.48 �5.41 0.7234.61 10.18 3.33 13.8451.77 11.58 5.81 18.0544.40 9.22% 3.06% 12.56%54.08 –1.88 4.30 2.3491.66 3.03 5.34 8.5336.98 5.64 5.02 10.9573.02 4.46 11.32 16.2992.20 3.41% 6.02% 9.63%94.51 –8.64 –2.39 –10.8395.83 8.19 –5.93 1.7835.38 12.34 5.78 18.8297.85 3.94 8.87 13.1601.31 –1.88 –4.79 –6.5803.98 1.38% –1.33% 0.03%99.56 –5.43 –0.10 –5.5291.23 7.16 –1.19 5.8881.50 –10.59 –6.14 –16.0899.56 –5.43 –0.10 –5.5206.72 2.70 5.23 8.0797.29 –1.09% 0.89% –0.21%
ment Program for Missouri.
JAMDA – September 2010

Table 3. Nursing Staffing Costs per Resident per Day
Costs per Resident Staffing Costs
Year 1 Year 2 Year 3 Chg Y1-Y2 Chg Y2-Y3 Chg Y1-Y3
1A $59.64 $61.75 $63.76 3.55% 3.25% 6.91%1B 40.21 41.31 37.67 2.75 –8.83 –6.321C 43.07 43.88 45.61 1.88 3.93 5.881D 40.35 43.84 47.60 8.66 8.57 17.97Group 1 EMR 1 QIPMO $46.02 $48.69 $50.55 5.80% 3.81% 9.83%2A 58.21 60.62 61.33 4.15 1.17 5.362B 68.17 65.60 65.75 –3.77 0.23 –3.552C 76.99 79.98 86.70 3.89 8.41 12.622D 76.63 77.34 81.51 0.92 5.40 6.37Group 2 EMR only $71.00 $71.34 $74.21 0.48% 4.03% 4.53%3A 32.01 30.19 27.18 –5.69 –9.95 –15.083B 33.03 34.31 32.49 3.88 –5.30 –1.623C 29.30 35.77 37.14 22.08 3.81 26.743D 26.12 28.45 29.88 8.93 5.05 14.423E 39.43 43.66 44.23 10.72 1.33 12.19Group 3 QIPMO only $34.55 $35.71 $34.83 3.33% –2.46% 0.79%4A 30.66 28.32 26.57 –7.61 –6.18 –13.324B 34.42 36.98 36.85 7.46 –0.36 7.074C 38.51 34.01 31.40 –11.66 –7.70 –18.464D 39.97 41.80 46.48 4.57 11.21 16.294E 34.59 34.61 37.19 0.07 7.45 7.53Group 4 no EMR 1 no QIPMO $34.62 $33.75 $33.96 –2.51% 0.61% –1.92%
EMR, electronic medical record; QIPMO, Quality Improvement Program for Missouri.
that increased total staff from 2.71 to 3.75 hours per residentper day, accounting for a 38.5% increase in staffing. The hoursper resident day were similar and stable for most of the facil-ities in Groups 1 and 2 with bedside EMR implementation; onaverage, all staffed more than 3 hours and some more than 4hours per resident per day. Similarly, most facilities in com-parison Groups 3 and 4 had stable staff hours per resident
Table 4. Total Staff Hours per Resident per Day
Hours per Resident Total Staff Hours
Year 1 Year 2 Ye
1A 4.05 4.09 4.1B 4.33 4.35 4.1C 3.08 3.09 3.1D 2.71 3.40 3.Group 1 EMR 1 QIPMO 3.38 3.71 3.2A 3.95 4.13 3.2B 4.66 4.47 4.2C 4.49 4.59 4.2D*Group 2 EMR only 4.37 4.40 4.3A 3.88 3.81 3.3B 3.34 3.35 2.3C 2.63 3.28 3.3D 2.95 3.06 3.3E 4.58 4.62 4.Group 3 EMR 1 QIPMO 3.74 3.71 3.4A 3.04 2.95 2.4B 3.57 4.06 4.4C 3.50 3.50 3.4D 3.63 2.80 3.4E 2.86 2.93 3.Group 4 no EMR 1 no QIPMO 3.13 3.24 3.
Chg, change; EMR, electronic medical record; QIPMO, Quality Improve* Data not available for home 2D because that state does not require
ORIGINAL STUDIES
per day during the study; on average, all staffed more than 3but not as high as 4 hours per resident per day.
Post Hoc Cost and Acuity Analysis
Post hoc, resident acuity was examined in each of nursinghomes to enlighten the cost and outcome analyses. All resi-dents were counted only once and were cared for sometime
ar 3 Chg Y1 - Y2 Chg Y2 - Y3 Chg Y1 - Y3
06 0.99% –0.57% 0.41%17 0.49 –4.11 –3.6404 0.27 –1.38 –1.1175 25.61 10.25 38.4983 9.89% 3.24% 13.45%98 4.52 –3.60 0.7625 –4.04 –4.89 –8.7378 2.20 4.16 6.46
34 0.68% –1.34% –0.66%37 –1.73 –11.60 –13.1347 0.17 –26.35 –26.2333 24.79 1.56 26.7409 3.60 1.15 4.7875 0.89 2.77 3.6953 –1.78% –3.51% –5.23%86 –2.94 –3.09 –5.9401 13.89 –1.43 12.2624 –0.01 –7.45 –7.4690 –22.73 39.24 7.6020 2.65 9.10 11.9929 3.53% 1.33% 4.91%
ment Program for Missouri.reporting staff hours.
Rantz et al 489

during the time interval from the specific facility’s baselinedate through the third quarter of 2005. Over the evaluationperiod, there were a total of 8166 residents cared for in thestudy facilities.
Resource utilization groups (RUGs) are a method of resi-dent acuity measurement and staff utilization in nursinghomes.39 The RUGs III version was used to compare popula-tions; RUGS scores are measured around the number 1 thatrepresents ‘‘average’’ acuity, so smaller numbers reflect loweracuity, higher numbers higher acuity. Groups 1 and 2 hadthe highest resident acuity (0.94 and 1.10 respectively) andGroups 3 and 4 the lowest (0.90 and 0.86).
Further analysis of the cost reports revealed that the per-centage of Medicare residents served increased throughoutthe study in Groups 1 and 2 (6.25% and 9.50% at the endof year 1, then 8.50% and 14.50% at the end of the study),while Group 4 actually reduced the number of Medicare resi-dents served from 4.6% to 1.8% by the study end. Acuity dif-ferences and fewer Medicare residents may provide someexplanation for the lower total and direct care costs in Group4 as compared with other groups and the higher costs andstaffing of Group 2.
Staff Retention
A retention rate was estimated for each facility using datesof hire for 4 job codes (RN, LPN, aides and orderlies, other),full-time/part-time, and 3 collection dates (baseline, year 1,and year 2). To determine if the rate was increasing or de-creasing over time, a regression line was fitted to the datafrom each facility for each combination.40 There was no evi-dence of an increasing or decreasing trend in staff retentionover time for any of the groups in this evaluation (P 5 .54).The staffing data were descriptively analyzed as well, examin-ing for trends in individual facilities or groups that would in-dicate improved staff retention for nurses, nursing assistants,or other staff. These analyses revealed no trends of higher staffretention; potential links to technology or clinical consulta-tion could not be identified.
Summary of Cost and Staffing Findings
In summary, facilities in Groups 1 and 2 that implementedbedside EMR experienced an increase in total costs per resi-dent per day of $16.11 and $16.89 (12.6% and 9.6%, respec-tively) during the study. The comparison groups did notexperience these increases in total costs. Nursing staffingcosts per resident per day increased in Groups 1 and 2 by$4.53 and $3.12 (9.8% and 4.5%), while the nurse staffingcosts of comparison Group 3 increased slightly by $0.28(0.8%) and declined in Group 4 by $0.66 (–1.9%).
Groups 1 and 2 total costs per resident per day were higher($128.29 and $175.31, respectively) at the beginning of thestudy than in Groups 3 and 4 ($103.95 and $97.50). Thegroup costs for Groups 1 and 2 did increase throughout theduration of the study, to $144.40 and $192.20, respectively;costs for Groups 3 and 4 remained constant. One facility inGroup 1 increased total costs in year 2, but returned to nearlybaseline in year 3. Apparently, that facility was able to imple-ment bedside EMR without large increases in total costs.
490 Rantz et al
Although the sample sizes were small, there appeared to bea self-selection effect of facilities with higher costs being will-ing to embark on the technology challenge. Another expla-nation is that facilities in the technology groups wereserving more acutely ill populations, as suggested by theirhigher RUG scores and increasing number of Medicare cli-ents over the duration of the study. Lower acuity differencesand lower Medicare residents may provide some explanationfor the lower total and direct care costs in Group 4, comparedwith the other groups.
Hours per resident day were similar and stable for most ofthe facilities in Groups 1 and 2 with technology implementa-tion. Similarly, most facilities in comparison Groups 3 and 4had stable staff hours per resident per day throughout thestudy. So, it appears the increased costs for staffing were notfrom facilities increasing direct care staff hours per resident.Increased staffing costs were likely because of wage adjust-ments or additional staff not reported in direct or total staffhours worked. Increased total costs were likely because of in-creased staffing costs, as well as other expenses, such as the ad-dition of technology and inflation of other business expenses.
Resident Outcomes
Resident outcomes were analyzed to evaluate the effect oftechnology on outcomes of care using the QI and QM scores(25 QIs and 20 QMs) for each facility at annual intervals forthe 24-month duration of the study. Given the small samplesizes, QI and QM scores were analyzed for descriptive trendsin absolute and relative change scores across groups. Trendsin improvements in several resident outcomes using QIsand QMs can be seen in Table 5. Note, because QIs andQMs are problem-based scores, negative values indicateimprovement.
First, decline in late-loss ADLs improved as measured 12months post implementation in Groups 1 and 2 that imple-mented bedside EMR. This improvement was sustained,and actually improved more at the 24-month point in Group2; but the improvement was not sustained in Group 1. The 2control groups without bedside EMR both showed increasingproblems with ADL decline in their residents, as indicated bytheir increasing (worse) scores.
Similarly, the decline in range of motion QI improved at12 months in Groups 1 and 2 that implemented bedsideEMR. As with ADL decline, Group 1 did not sustainthat improvement at the 24-month measurement. Theseunsustained improvements for Group 1 could be relatedto some statewide effect, as the control groups withoutbedside EMR showed increasing problems with both QIsat 12 and 24 months.
Behavioral symptoms improved in both Groups 1 and 2with bedside EMR and control Group 3 with QIPMO-onlyservices. The improvements in Missouri groups with QIPMOmay be interpreted as related to the QIPMO service empha-sizing best practices in approaching residents with behavioralsymptoms because the control Group 4 without QIPMO gotworse.
Symptoms of depression with no treatment had a 12-month improvement in Group 1 with technology and
JAMDA – September 2010
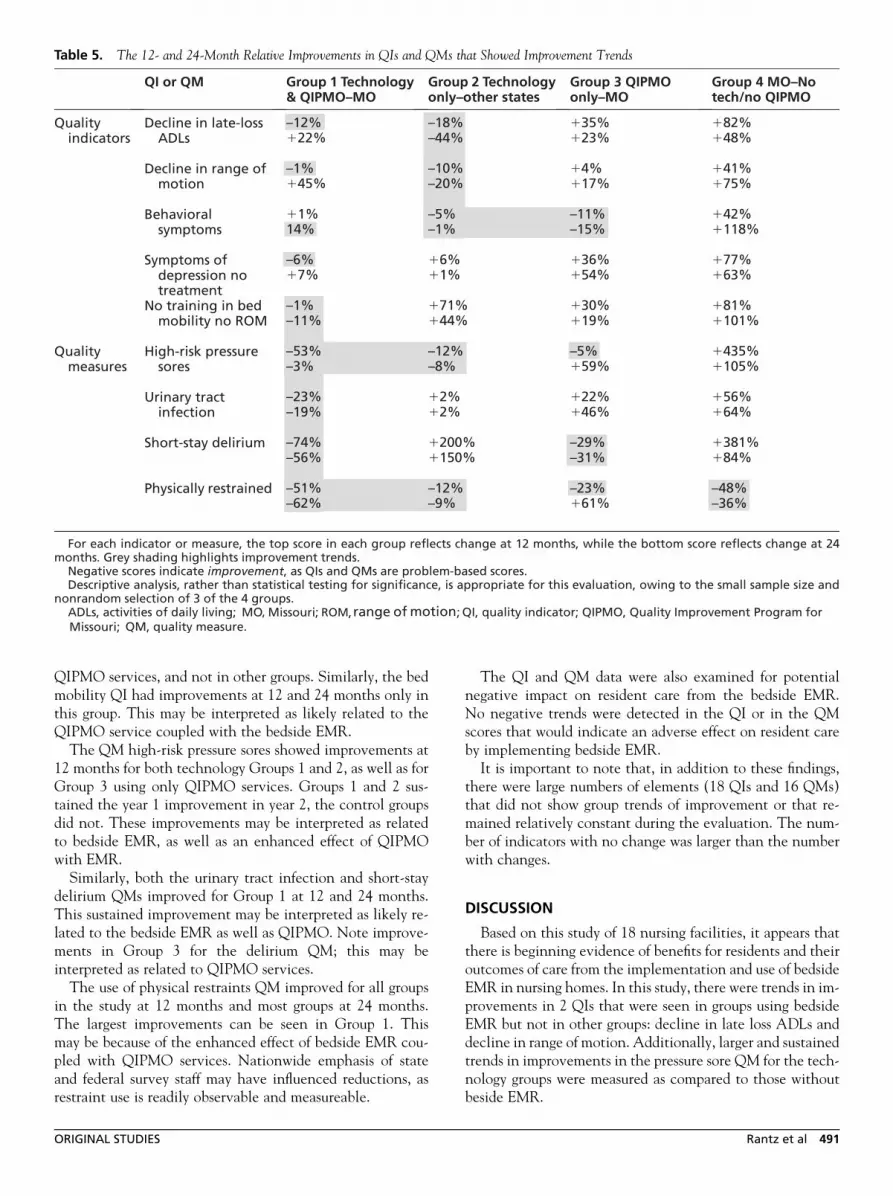
Table 5. The 12- and 24-Month Relative Improvements in QIs and QMs that Showed Improvement Trends
QIPMO services, and not in other groups. Similarly, the bedmobility QI had improvements at 12 and 24 months only inthis group. This may be interpreted as likely related to theQIPMO service coupled with the bedside EMR.
The QM high-risk pressure sores showed improvements at12 months for both technology Groups 1 and 2, as well as forGroup 3 using only QIPMO services. Groups 1 and 2 sus-tained the year 1 improvement in year 2, the control groupsdid not. These improvements may be interpreted as relatedto bedside EMR, as well as an enhanced effect of QIPMOwith EMR.
Similarly, both the urinary tract infection and short-staydelirium QMs improved for Group 1 at 12 and 24 months.This sustained improvement may be interpreted as likely re-lated to the bedside EMR as well as QIPMO. Note improve-ments in Group 3 for the delirium QM; this may beinterpreted as related to QIPMO services.
The use of physical restraints QM improved for all groupsin the study at 12 months and most groups at 24 months.The largest improvements can be seen in Group 1. Thismay be because of the enhanced effect of bedside EMR cou-pled with QIPMO services. Nationwide emphasis of stateand federal survey staff may have influenced reductions, asrestraint use is readily observable and measureable.
ORIGINAL STUDIES
The QI and QM data were also examined for potentialnegative impact on resident care from the bedside EMR.No negative trends were detected in the QI or in the QMscores that would indicate an adverse effect on resident careby implementing bedside EMR.
It is important to note that, in addition to these findings,there were large numbers of elements (18 QIs and 16 QMs)that did not show group trends of improvement or that re-mained relatively constant during the evaluation. The num-ber of indicators with no change was larger than the numberwith changes.
DISCUSSION
Based on this study of 18 nursing facilities, it appears thatthere is beginning evidence of benefits for residents and theiroutcomes of care from the implementation and use of bedsideEMR in nursing homes. In this study, there were trends in im-provements in 2 QIs that were seen in groups using bedsideEMR but not in other groups: decline in late loss ADLs anddecline in range of motion. Additionally, larger and sustainedtrends in improvements in the pressure sore QM for the tech-nology groups were measured as compared to those withoutbeside EMR.
Rantz et al 491
There were improvements in other QIs and QMs whencoupling technology with on-site expert nurse clinical con-sultation QIPMO service; these include symptoms of depres-sion with no treatment, bed mobility for dependent residents,and urinary tract infection. However, no changes were notedin a large number of indicators, suggesting that improvementspossibly attributable to coupling technology with on-site con-sultation may be specific to certain areas of potential residentimprovement.
The OEMR technology prompts and reinforces requiredcare and clinical practice assessment guides that direct nursesand nursing assistants to assess for details of conditions and re-cord care delivered. It is possible that reinforcement from theprompts of the required care and practice guides affected someQIs and QMs that measure resident common conditions. An-other possibility that reinforced required care (and subse-quently some care outcomes improved) is the report featureof the EMR that can easily tabulate common resident condi-tions and list if the required care was completed or not. Staffare able to use the report feature to readily view trends incommon conditions and care delivery that in traditionalpaper charting is difficult and time-consuming to compile.
Facilities without technology also showed improvementtrends with on-site clinical consultation in some areas. Theseimprovements were not observed in facilities that had neitherbedside technology nor on-site clinical consultation. Thesefindings support the effectiveness of on-site consultation bynurses with graduate education and expertise in gerontology,as measured in other QIPMO program evaluations.6–8
Costs and staffing are extremely relevant issues to under-stand as they relate to facilities implementing bedsideEMR. Total costs for the 3-year evaluation for the groups offacilities implementing technology increased $16.11(12.5%) for Group 1 and $16.89 (9.6%) for Group 2, whilethose for the comparison groups did not. These increaseswere not a result of increased direct care staffing or turnover.Most likely they are attributable to the cost of the technology,maintaining and supporting the technology, and on-goingstaff training to use the EMR.
Groups 1 and 2 had higher baseline total costs than com-parison Groups 3 and 4. It appears that higher baseline totalcosts per resident per day in facilities may somehow be relatedto participating facilities’ willingness to undertake technol-ogy-based changes. The facilities in both Group 1 (in Mis-souri) and Group 2 (in other states) that implemented thetechnology had considerably higher average total costs perresident per day throughout the study than facilities inGroups 3 and 4. However, total staff hours across the 4 groupswere very similar (3.83, 4.34, 3.53, and 3.29 on average for therespective groups in year 3; Table 4). There may be someeconomic feature of facilities willing to undertake imple-menting a bedside computing system that we were unableto determine.
It appears that implementing technology is not cost neu-tral—there was an increase in total costs for all facilities inGroups 1 and 2. Although there were increased total costs,these appear to be related to wage adjustments and othercost increases, not increased direct care staffing. This is
492 Rantz et al
a key concern, as facilities face health care worker short-ages.41,42 Nursing home administrators, as well as policymakers, need to be aware of ongoing hardware and softwarecosts, as well as ongoing technology staff support and constantorientation of new direct care staff to the system. These issuesmust be considered by CMS, EMR vendors, and nursing homeowners and staff.
This study has limitations and findings should be inter-preted with caution. Results are based on a small conveniencesample of 18 nursing homes; therefore, results have a tendencyto fluctuate within and between groups. Purposive recruit-ment was necessary for intervention groups to locate facilitieswith administrative and corporate staff willing to undertakebedside EMR implementation and related costs. Althoughsubstantial, partial funding was provided by CMS to defraya portion of the technology costs. There were implementa-tion and on-going costs to using bedside EMR and that wasa challenge for recruiting facilities. Confounding factorssuch as specific facility efforts to improve care processes orchanges to facility admission policies (such as increasing ordecreasing Medicare admissions) must all be considered.Despite limitations, this evaluation provides insight intothe use of a bedside EMR, how it may improve outcomesand resident care, and the implications on cost, staffing,and staff retention.
Technology seems to hold promise for long-term care.Based on this evaluation of 18 facilities, some improvementin resident outcomes of care seems likely. Improvement inresident outcomes could be enhanced with the addition ofon-site consultation by a nurse with graduate nursing educa-tion and expertise in gerontology. Some increase in cost re-lated to the technology, staff to support the technology,and continuous staff education to use the technology shouldbe anticipated and planned for as an on-going expense. Directcare staffing is likely to remain constant, as is staff retention.The downside risks of implementing technology appear to besmaller than the upside advantages for improving care.
REFERENCES
1. Committee on Data Standards for Patient Safety. Institute of Medicine:
Key capabilities of an electronic health record system. National Acade-
mies Press Web site. Available at: http://www.nap.edu/books/NI000427/
html/. Accessed August 1, 2008.
2. Alexander GL, Wakefield DS. Information technology sophistication in
nursing homes. J Am Med Dir Assoc 2009;10:398–407.
3. HITSP Enabling Healthcare Interoperability. American National Stan-
dards Institute Web site. Available at: http://www.hitsp.org. Accessed
August 11, 2009.
4. Alexander GL. Analysis of an integrated clinical decision support system
in nursing home clinical information systems. J Gerontol Nurs 2008;34:
15–20.
5. Alexander GL, Rantz M, Flesner M, et al. Clinical information systems
in nursing homes: An evaluation of initial implementation strategies.
Comput Inform Nurs 2007;25:189–197.
6. Rantz MJ, Popejoy L, Petroski GF, et al. Randomized clinical trial of
a quality improvement intervention in nursing homes. Gerontologist
2001;41:525–538.
7. Rantz MJ, Vogelsmeier A, Manion P, et al. A statewide strategy to
improve quality of care in nursing facilities. Gerontologist 2003;43:
248–258.
JAMDA – September 2010
8. Rantz MJ, Cheshire D, Flesner M, et al. Helping nursing homes ‘‘at risk’’
for quality problems: A statewide evaluation. Geriatr Nurs 2009;30:
238–249.
9. Bates DW, Gawande AA. Improving safety with information technol-
ogy. N Engl J Med 2003;348:2526–2534.
10. Dennis K, Sweeney P, Macdonald L, Morse N. Point of care technology:
Impact on people and paperwork. Nurs Econ 1993;11:229–248.
11. Garg AX, Adhikari NK, McDonald H, et al. Effects of computerized clin-
ical decision support systems on practitioner performance and patient
outcomes. J Am Med Dir Assoc 2005;293:1223–1238.
12. Kawamoto K, Houlihan CA, Balas EA, Lobach DF. Improving clinical
practice using clinical decision support systems: A systematic review of
trials to identify features critical to success. Br Med J 2005;330:765.
13. Mills EM, Staggers N. Nurse computer performance: Considerations for
the nurse administrator. J Nurs Adm 1994;24:30–35.
14. Wozar JA, Worona PC. The use of online information resources by
nurses. J Med Libr Assoc 2003;91:216–221.
15. Nahm R, Poston I. Measurement of the effects of an integrated, point of
care computer system on quality of nursing documentation and patient
satisfaction. Comput Nurs 2000;18:220–229.
16. Abbott PA, Brocht D. Challenges for data management in long-term
care. In: Saba VK, McCormick KA, editors. Essentials of Computers
for Nurses. 3rd ed. New York: McGraw-Hill; 2001. p. 357–364.
17. Ferris N. Long-term care lags in health IT. Government Health IT Web
site. Available at: http://govhealthit.com/article90387–08–24–05-Web.
Accessed August 1, 2008.
18. Alexander GL. Issues of trust and ethics in computerized clinical decision
support systems. Nurs Adm Q 2006;30:21–29.
19. Alexander GL, Madsen D, Herrick S, Russell B. Measuring IT sophisti-
cation in nursing homes. Rockville, MD: Agency for Health Care Re-
search and Quality. AHRQ Publication No. 08–0034-CD; 2008.
20. Ryden MB, Snyder M, Gross CR, et al. Value-added outcomes: The use
of advanced practice nurses in long-term care facilities. Gerontologist
2000;40:654–662.
21. Ejaz FK, Folmar SJ, Kaufmann M, et al. Restraint reduction: Can it be
achieved? Gerontologist 1994;34:694–699.
22. Evans LK, Strumpf NE, Allen-Taylor L, et al. A clinical trial to reduce
restraints in nursing homes. J Am Geriatr Soc 1997;45:675–681.
23. Neufeld RR, Libow LS, Foley WJ, et al. Restraint reduction reduces se-
rious injuries among nursing home residents. J Am Geriatr Soc 1999;
47:1202–1207.
24. Neufeld RR, Libow LS, Foley WJ, White H. Can physically restrained
nursing home residents be untied safely? Intervention and evaluation
design. J Am Geriatr Soc 1995;43:1264–1268.
25. Strumpf NE, Evans LK, Wagner J, Patterson J. Reducing physical
restraints: Developing an educational program. J Gerontol Nurs 1992;
18:21–27.
ORIGINAL STUDIES
26. Werner P, Koroknay V, Braun J, Cohen-Mansfield J. Individualized care
alternatives used in the process of removing physical restraints in nursing
homes. J Am Geriatr Soc 1994;42:321–325.
27. Ray WA, Taylor JA, Meador KG, et al. A randomized trial of a consulta-
tion service to reduce falls in nursing homes. JAMA 1997;278:557–562.
28. Ouslander JG, Schnelle JF, Uman G, et al. Predictors of successful
prompted voiding among incontinent nursing home residents. JAMA
1995;273:1366–1370.
29. Schnelle JF, Newman D, White M, et al. Maintaining continence
in nursing home residents through the application of industrial quality
control. Gerontologist 1993;33:114–121.
30. Schnelle JF, Ouslander JG, Osterweil D, Blumenthal S. Total quality
management: Administrative and clinical applications in nursing homes.
J Am Geriatr Soc 1993;41:1259–1266.
31. Quality Indicators for MDS 2.0: Version 6.3, Optional RUGs III Quar-
terly. Madison, WI: Center for Health System Research and Analysis,
University of Wisconsin-Madison; 1997.
32. Rantz MJ, Mehr DR, Conn V, et al. Assessing quality of nursing home
care: The foundation for improving resident outcomes. J Nurs Care
Qual 1996;10:1–9.
33. Rantz MJ, Popejoy L, Mehr D, et al. Verifying nursing home care quality
using minimum data set quality indicators and other quality measures.
J Nurs Care Qual 1997;12:54–62.
34. Rantz MJ, Hicks L, Grando VT, et al. Nursing home quality, cost,
staffing, and staff-mix. Gerontologist 2004;44:24–38.
35. Nursing home quality initiative overview. Centers for Medicare & Med-
icaid Services Web site. Available at: http://www.cms.hhs.gov/
NursingHomeQualityInits/01_overview.asp. Accessed March 22, 2006.
36. Hicks LL, Rantz MJ, Petroski GF, et al. Assessing contributors to cost of
care in nursing homes. Nurs Econ 1997;15:205–212.
37. Hicks LL, Rantz MJ, Petroski GF, Mukamel DB. Nursing home costs and
quality of care outcomes. Nurs Econ 2004;22:178–192.
38. Rantz MJ, Alexander G, Galambos C, et al. Evaluation of the use of
bedside technology to improve quality of care in nursing facilities:
A qualitative analysis. Comput Inform Nurs 2009. in press.
39. Fries BE, Schneider DP, Foley WJ, et al. Refining a case-mix measure for
nursing homes: Resource utilization groups (RUG-III). Med Care 1994;
32:668–685.
40. Madsen R. Estimation of employee turnover based on tenure-to-date.
In: Proceedings of the American Statistical Association: Section on
Nonparametric Statistics. Alexandria, VA: American Statistical Associ-
ation, 2005, p. 1660–1667.
41. Scanlon WG. Nursing workforce: Recruitment and retention of nurses
and nursing assistants. Washington, DC: Government Accountability
Office (U.S. GAO). May 17, 2001. GAO-01–750 T.
42. Health care workforce status: 2007 Missouri report. Missouri Hospital
Association Web site. Available at: http://web.mhanet.com/. Accessed
August 1, 2008.
Rantz et al 493