cortical changes to experimental sensitization of the human esophagus
TRANSCRIPT
CH
SKMAa
ab
ec
pd
R
Aemtr
shpmsl
(p(afPosicp
etiol
Kt
*aDEAePRa
Neuroscience 140 (2006) 269–279
0d
ORTICAL CHANGES TO EXPERIMENTAL SENSITIZATION OF THE
UMAN ESOPHAGUSMafimstrac
gvopcia2otFlzsh2
caa2ghbcdepdogshpt1pe
. A. K. SAMI,a,b P. RÖSSEL,b G. DIMCEVSKI,b
. DREMSTRUP NIELSEN,a P. FUNCH-JENSEN,c
. VALERIANI,d L. ARENDT-NIELSENa
ND A. M. DREWESa,b*
Center for Sensory-Motor Interactions, Department of Health Sciencend Technology, Aalborg University, Aalborg, Denmark
Center for Visceral Biomechanics and Pain, Department of Gastro-nterology, Aalborg University Hospital, DK-9000 Aalborg, Denmark
Department of Surgical Gastroenterology L, Aarhus University Hos-ital, Aarhus, Denmark
Division of Neurology, Ospedale Pediatrico Bambino Gesù, IRCCS,ome, Italy
bstract—Topographical organization in the neocortex showsxperience-dependent plasticity. We hypothesized that experi-ental sensitization of the esophagus results in changes of the
opographical distribution of the evoked potentials and the cor-esponding dipole source activities to painful stimulation.
An endoscopic method was used to deliver 35 electricaltimuli at the pain threshold to a fixed area of the mucosa in 10ealthy volunteer men and women. The stimulations were re-eated after 30 min (reproducibility experiment), and after 60in following perfusion of 200 ml 0.1 N hydrochloric acid (sen-
itization experiment). During stimulation the electroencepha-ogram was recorded from 64 surface electrodes.
The sensitization resulted in a decrease in the pain thresholdF�6.2; P�0.004). The topographic distribution of the evokedotentials showed reproducible negative (N1, N2) and positiveP1, P2) components. After acid perfusion a reduced latencynd a change in localization was seen for the P1 subdivided intorontal and occipital components (F�29.5, P<0.001; F�53.7,<0.001). Furthermore the sensitization resulted in a reductionf the latency for P2 (F�6.2, P�0.009). The source analysishowed consistent dipolar activity in the bilateral opercular–nsular cortex before and after acid perfusion. For the anterioringulate dipole there was a reduction in latency (P�0.03) and aosterior shift (P�0.0002) following acid perfusion.
The findings indicate that short-term sensitization of thesophagus results in central neuroplastic changes involvinghe cingulate gyrus, which also showed pathological activationn functional diseases of the gut, thus reflecting the importancef this region in visceral pain and hyperalgesia. © 2006 Pub-
ished by Elsevier Ltd on behalf of IBRO.
ey words: esophagus, experimental pain, plasticity, sensi-ization.
Correspondence to: A. M. Drewes, Center for Visceral Biomechanicsnd Pain, Department of Gastroenterology, Aalborg University Hospital,K-9000 Aalborg, Denmark. Tel: �45-99326228; fax: �45-99326507.-mail address: [email protected] (A. M. Drewes).bbreviations: BESA, brain electrical source analysis; EEG, electro-ncephalogram; EP, evoked potential; MEG, magnetoencephalogram;DT, pain detection threshold; PET, positron emission tomography;
nV, residual variance; SII, second somatosensory area; VAS, visualnalog scale.
306-4522/06$30.00�0.00 © 2006 Published by Elsevier Ltd on behalf of IBRO.oi:10.1016/j.neuroscience.2006.02.031
269
any representations of sensory stimuli in the neocortexre arranged topographically. This organization is notxed, but shows experience-dependent plasticity (Buono-ano and Merzenich, 1998; Gilbert, 1998). For instance,
ensory deprivation causes the cortical area representinghe deprived sensory input to shrink, and neighboring rep-esentations to enlarge, in somatosensory (Merzenich etl., 1983), auditory (Robertson and Irvine, 1989) or visualortex (Kaas et al., 1990).
In more recent years, several investigations have sug-ested that somatosensory cortical reorganization can de-elop in response to pain (Knecht et al., 1998). The degreef the somatotopic representation of the extremities in therimary somatosensory cortex has been demonstrated toorrelate with the magnitude of phantom pain in amputees,
n patients with chronic back pain (Flor et al., 1995, 1997)nd in patients with trigeminal neuralgia (Tinazzi et al.,004). Therapeutic interventions that reversed cortical re-rganization, e.g. a prosthetic training in amputees seemo be associated with a pain decrease (Lotze et al., 1999;lor et al., 2001). However, cortical reorganization is not
imited to chronic pain disorders. Rapid functional reorgani-ation of the primary somatosensory cortex has also beenhown in response to experimentally induced somatic pain inealthy subjects (Noppeney et al., 1999; Buchner et al.,000; Soros et al., 2001).
It has been shown from direct electrophysiological re-ordings in animal studies that central sensitization may ben important mechanism in visceral hypersensitivity (Nessnd Gebhart, 1990; Garrison et al., 1992; Buchner et al.,000), but only few studies have addressed cerebral or-anization and reorganization in relation to visceral pain inumans (Rössel et al., 2001). Central reorganization maye important in the understanding of clinical pain, espe-ially where there are no obvious pathological findingsuring routine investigations. Thus, in classical reflux dis-ase an organic cause such as esophagitis or pathologicalH measurement can only be found in 60% of the patientsespite typical symptoms (Fass, 2003). In functional dis-rders of the esophagus with prevalence up to 20% in theeneral population (Eslick et al., 2003), a single causeuch as gastro-esophageal reflux disease is only found inalf of the patients. Hence, many patients have unex-lained chest pain, presumably of esophageal origin, buthe mechanisms are poorly understood (Richter et al.,989). Thus, in humans, unexplained chest pain mayartly be explained by aberrant pain processing from thesophagus due to hypersensitivity and sensitization of spi-
al dorsal horn cells, and possibly by reorganized neuronal
me2etbug
weierwetdc
S
TaaoTaa
S
TitnPttgaaleeh5bs
R
TeNtItrbsmsa
rvwdTb
wdp
D
DadbcbBat6sd(ttecititam
Fas3a
S. A. K. Sami et al. / Neuroscience 140 (2006) 269–279270
atrices in higher brain centers receiving input from thesophagus (Mertz et al., 1998; Rössel et al.,2001; Mertz,003). It is possible to study the central processing ofsophageal afferents by recording cortical evoked poten-ials (EP) in response to esophageal stimulation (Holler-ach et al., 1997), and previously this technique has beensed to study the CNS response to experimental esopha-eal hypersensitivity (Sarkar et al., 2000, 2001).
We hypothesized that sensitization of the esophagusould result in changes in the brain processing to painfullectrical stimulation. The aims of the study were: 1) to
ntroduce a new method for electrical stimulation of thesophagus; 2) to use this method to study the baseline EPesponse to painful stimulation of the human esophagus asell as the reproducibility of this response; 3) to study theffect of acid-induced sensitization of the esophagus on
he pain-evoked EPs; and 4) to model the cerebral currentipole sources of the EPs at the baseline and sensitizedonditions.
EXPERIMENTAL PROCEDURES
ubjects
en healthy, paid volunteers (eight men and two women), mediange 38.6 years (23–49) were studied. None of the subjects hadny symptoms suggestive of gastro-esophageal dysfunction,ther gastrointestinal diseases or disorders associated with pain.he subjects did not use any kind of drugs, and alcohol was notllowed 24 h prior to the study. All subjects gave informed consentnd the investigation was approved by the local ethics committee.
timulating equipment
he subjects were fasting 8 h before the experiment. The exper-ment was performed with the subjects in the supine position withhe head tilted 30° upwards. Intubation was done with a 6 mmasal endoscope (Ultra Slim Gastroscope (Pentax EG-1840),entax Medical Company, Montvale, NJ, USA) without any seda-
ion. A small amount of local lubricant was used. After intubationhrough the nose, the endoscope was inserted into the esopha-us. The subjects were then allowed to rest for two minutes tollow habituation with the endoscope. Apart from a little unpleas-ntness associated with the intubations, all subjects were able to
ie comfortably and none complained of unpleasantness due to thendoscope. A specially designed stainless steel electrode forlectrical stimulation was constructed. The stimulation electrodead a tip of 1 mm in diameter while the inter-electrode interval wasmm (Fig. 1). An electrical stimulator (Aalborg University, Aal-
org, Denmark) was used to deliver the constant current visceraltimuli.
ecordings
he electroencephalogram (EEG) was recorded from 64 surfacelectrodes using a standard EEG cap (Quick-Cap International,euroscan, El Paso, TX, USA) following the extended interna-
ional 10–20 system. The electrode impedance was below 5 k�.n addition, two electrodes were placed at the right upper brow andhe left external canthus to monitor eye movements. A linked-earseference was used. EEG signals were sampled at 1000 Hz, andand-pass filtered between 0.05 and 70 Hz (SynAmps, Neuro-can). The EPs were gathered separately and sampled from 100s before and 500 ms after the onset of the stimulus. The EPs of
eparate runs were appended to one single file for further off-line
nalysis. EEG containing artifacts were removed off-line. Artifact tejection was based on the eye-movement signals, as well asisual inspection of each sweep, and sweeps were removedhenever the potentials exceeded �60 �V. Following this, theata were corrected for linear trends and then baseline corrected.he 100 ms preceding the onset of the stimulus was used foraseline correction.
Amplitudes and latencies were extracted from individualaveforms of the electrodes closest to the features by visualetection. Topographic mapping was carried out by spline-inter-olation (Scan 4.2, Neuroscan) and the main features described.
ipolar source modeling
ipolar source modeling was performed by brain electrical sourcenalysis (BESA) (Sherg et al., 1990). BESA calculates potentialistributions over the scalp from preset voltage dipoles within therain, later it evaluates the agreement between the recorded andalculated field distributions. The percentage of data that cannote explained by the model is expressed as residual variance (RV).ESA uses a spherical three-shell model with an 85 mm radiusnd assumes that the brain surface is at 70 mm from the center ofhe sphere. The thickness/conductivity parameters were: Scalp
mm/0.33 mohm/m, bone 7 mm/0.0042 mohm/m and cerebro-pinal fluid 1 mm/1 mhom/m. The spatial position of each dipole isescribed on the basis of three axes: 1) the line through T3 and T4x axis), 2) the line through Fpz and Oz (y axis) and 3) the linehrough Cz (z axis). The three axes have their intersection point athe center of the sphere. The model calculated by BESA does notxclude other solutions; nevertheless it can be validated whenoherent with the anatomical and physiological knowledge of thedentified source areas (Valeriani et al., 2001). The grand-averageraces were first analyzed, by using a “sequential strategy” whichs described in detail elsewhere (Valeriani et al., 2001). The la-ency interval from 20 to 450 ms was considered, since it includedll the well-shaped potentials. As for the number of dipoles twoain criteria were used: 1) the number of dipoles had to be
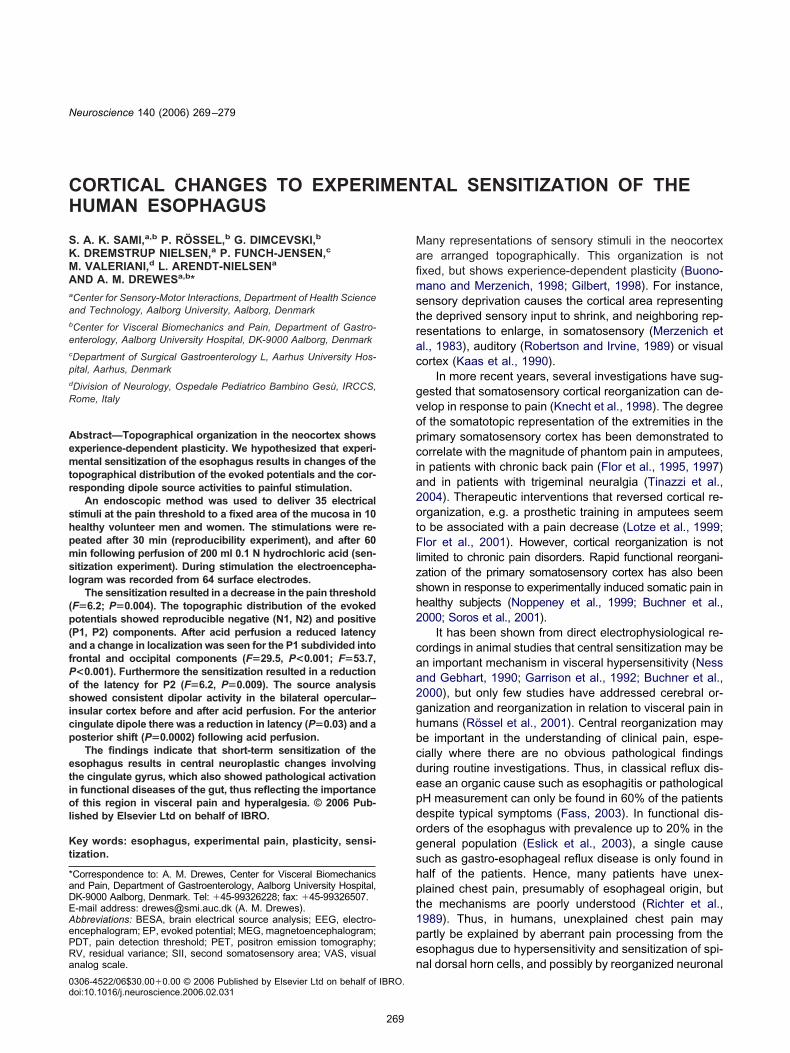
ig. 1. The stimulation electrode located in the distal esophagus. Aftern anatomical landmark was found (arrow, in this case a vessel) thetimuli were given in this position in the experiments at baseline, after0 min (reproducibility), and after additional 30 min where the esoph-gus was perfused with 200 ml 0.1 N hydrochloride acid.
heoretically indicated by the number of sources identifiable in
catlbrva(ebtatnb
P
Spwabo13t(sbbia
P
AlsiitsttpdafiscwoprtirlpAcabc8K
wt
S
AdpteptwFypSsw
Tlbaevsafasa
E
A1tmecTbaTitc(a1ea
T
EEt
S. A. K. Sami et al. / Neuroscience 140 (2006) 269–279 271
urrent source density maps, and 2) the lowest number of dipolesble to explain the EP topography was considered. The scalp EPopography was satisfactorily explained by five dipoles, whoseocations were established by fitting them to EP traces. The num-er of dipoles was not higher than allowed by the number ofecording electrodes. Since each dipole source is defined by sixariables (three for location, two for orientation, one for moment)t least six recording electrodes are needed to describe one dipoleValeriani et al., 2001). Therefore, our recording array including 64lectrodes would allow up to 10 dipoles in a model. The model weuilt was stable, since all the dipole sources did not change theirime courses in the individual subjects. We tried also to check thectivity of dipoles with different locations and, in particular, weested a dipole in the primary somatosensory area. However,one of these further sources did explain the EP topographyetter.
ain assessment
ensory assessment can be problematic in visceral pain, as theain is diffuse and difficult to characterize. Therefore, the subjectsere trained in assessing sensations to deep pain by pressurepplied to the muscles on the right forearm three to four timesefore the electrical stimuli were initiated. The pain was ratedn a 0 –10 visual analog scale (VAS), where 0�no perception;�vague perception; 2�definite perception of mild sensation;�vague perception of moderate sensation; 4�definite percep-ion of moderate sensation; 5�the pain detection thresholdPDT); 6�mild pain; 7�moderate pain; 8�pain of medium inten-ity; 9�intense pain; and 10�unbearable pain. The scale haseen described in detail previously (Drewes et al., 2002) and it haseen shown to be robust and reproducible to describe sensations
n the esophagus (Drewes et al., 2002, 2003a,b,c,d; Pedersen etl., 2004a,b).
rotocol and stimulation procedure
fter the intubation the endoscope was advanced 5 cm above theower esophageal sphincter. The stimulation electrode was in-erted and slightly pressed against the mucosa, resulting in anmpression of 0.5 cm of the mucosa. An anatomical landmark wasdentified to ensure the same position of the electrodes for thehree stimulation sessions (Fig. 1). The subjects could not feel thetimulation electrode. The inter-electrode impedance was moni-ored throughout the experiment and a value �2 k� was main-ained to ensure good mucosal contact. Five constant currentulses rectangular with duration of 1 ms applied at 200 Hz wereefined as a “single stimulus” and used to find the pain thresholdnd elicit the evoked brain potentials. Stimuli were delivered at arequency of 0.2 Hz at intensities between 0 and 80 mA. Thentensity of the current was first increased in steps of 1 mA,tarting at 0.5 mA. Dependent on the subjects’ reaction, the stepsould be reduced to 0.1–0.5 mA. During this procedure the PDTas found. The subjects rested quietly and relaxed with the eyespen and were asked to minimize blinking and focus on a fixedoint. First a baseline was recorded consisting of 35 evokedesponses using electrical stimulation intensities at the PDT. Afterhis stimulation the subject was allowed to rest with the endoscopen situ for 30 min, and then the stimulation was repeated foreproducibility at the same anatomical position guided by theandmarks with the very same VAS level. For acid stimulation aolyethylene catheter (PE 50 0.58 mm id, 0.965 mm od, Claydams, Parsippany, NJ, USA) was introduced into the suctionhannel of the endoscope. The endoscope was slightly redrawnnd the catheter was advanced a few mm from the tip so it coulde clearly seen. Then 200 ml of 0.1 N HCl was infused through theatheter perfusing the distal 7 cm of the esophagus at a rate ofml/min via an infusion pump (Harvard Apparatus, Edenbridge,
ent, UK). Finally, the same sequence of electrical stimulation ras repeated immediately after 30 min of acid perfusion again athe PDT.
tatistics
ll evaluations of the EP components and dipole calculations wereone blindly. The dipoles were compared visually, and in case theosition differed between the groups a supplementary statisticalest was done. The x, y and z coordinates move independently ofach other and the dipole coordinates and strengths were com-ared between the different conditions (baseline and acid sensi-ization) using the Mann-Whitney U test, while the Student’s t-testas used to compare the peak latencies of the dipolar activities.or multiple comparisons, one or two-way repeated measures anal-sis of variance was used, with comparison between baseline, re-roducibility and sensitization experiments confirmed with Holm-idak post hoc analysis. P�0.05 was considered significant. Theoftware package SigmaStat v. 3.0 (SPSS Inc., Chicago, IL, USA)as used for the analysis.
RESULTS
he same anatomic location could be identified and stimu-ated in all sessions. All subjects could feel the acid perfusionut tolerated it, although in two persons small pauses werellowed to sip water due to burning sensations that did notxceed the pain threshold. The acid perfusion resulted in aisible erythema of the mucosa distal to the catheter in allubjects. The mean current intensities at the sensation/PDTst baseline, the reproducibility experiment and after acid per-
usion were 5.7�2.8/10.5�6.2 mA, 6.4�2.2/13.7�3.2 mAnd 4.3�1.7/8.8�1.9 mA respectively. The decrease in thetimulus intensities corresponding to sensation/PDTs aftercid perfusion was significant (F�6.2; P�0.004).
voked vertex potentials
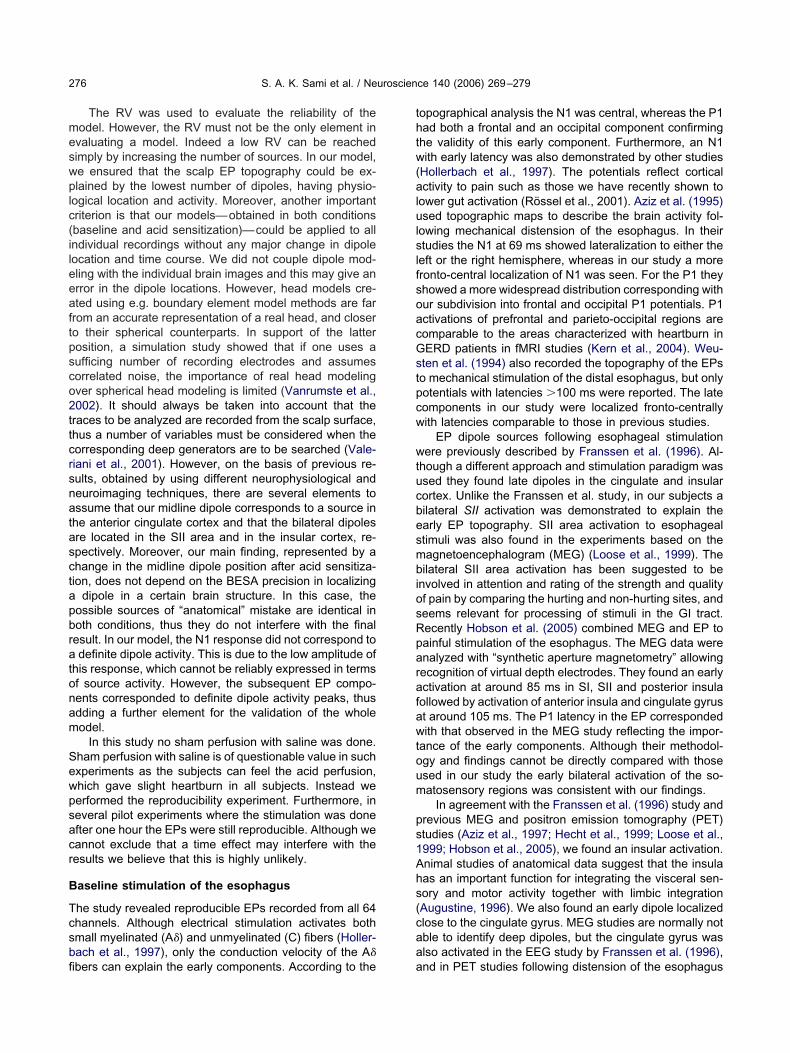
common pattern of the EPs in Cz could be detected in all0 subjects, but with inter-individual differences. Shamrials were obtained by using no electrical stimulation whileaintaining the same trigger sequence as with the abovesophageal stimulations. The sham stimuli did not result inonsistent waveforms. Typical examples are shown in Fig. 2.he latencies and amplitudes of each component at theaseline, reproducibility experiment and the experimentfter perfusion of the esophagus with acid are shown inable 1. Nl, Pl, N2 and P2 components all showed some
nter-subject variation in morphology, latency and ampli-ude. There was a reduction in P2 after acid perfusionompared with the baseline and reproducibility experimentF�7.0; P�0.006). Furthermore, there was a fall in P1–N2nd N2–P2 amplitude, which decreased over time (F�0.9, P�0.001) both from baseline to the reproducibilityxperiment and from the reproducibility experiment to thecid experiment.
opographic representation
Ps were identified over the scalp from all 64 channels.ach component of the EPs varied in its area of represen-
ation as described below. The topographic maps in a
epresentative subject are shown in Fig. 3.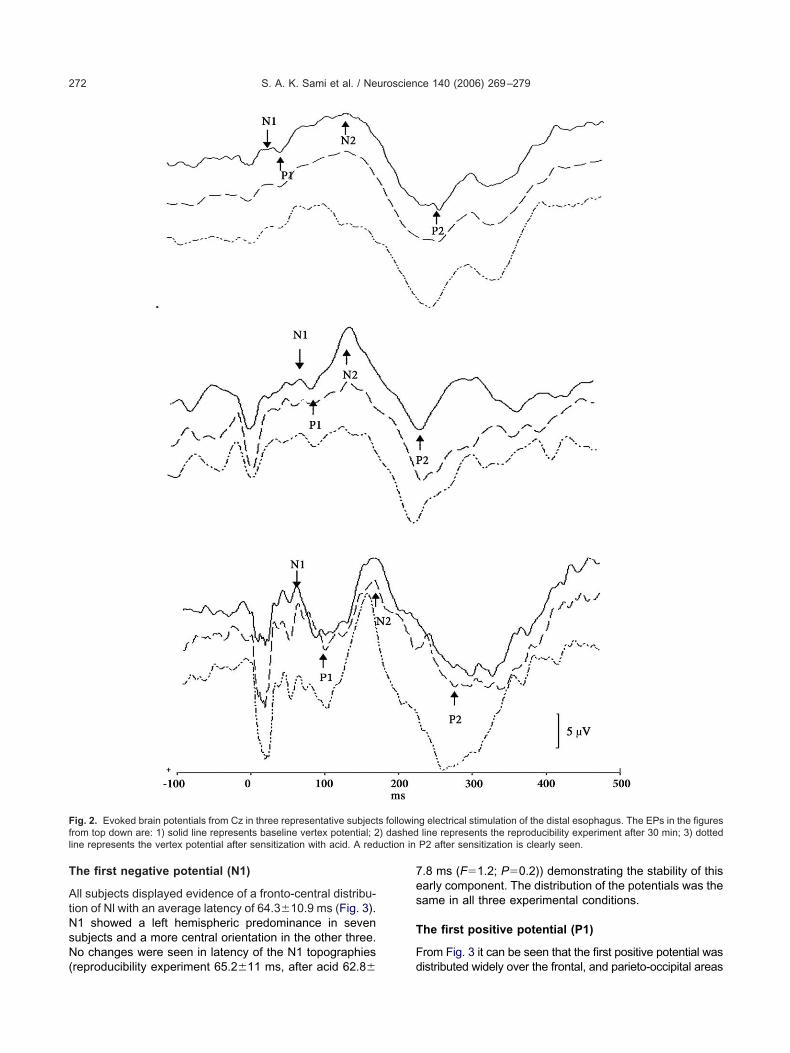
T
AtNsN(
7es
T
F
Ffl uction in
S. A. K. Sami et al. / Neuroscience 140 (2006) 269–279272
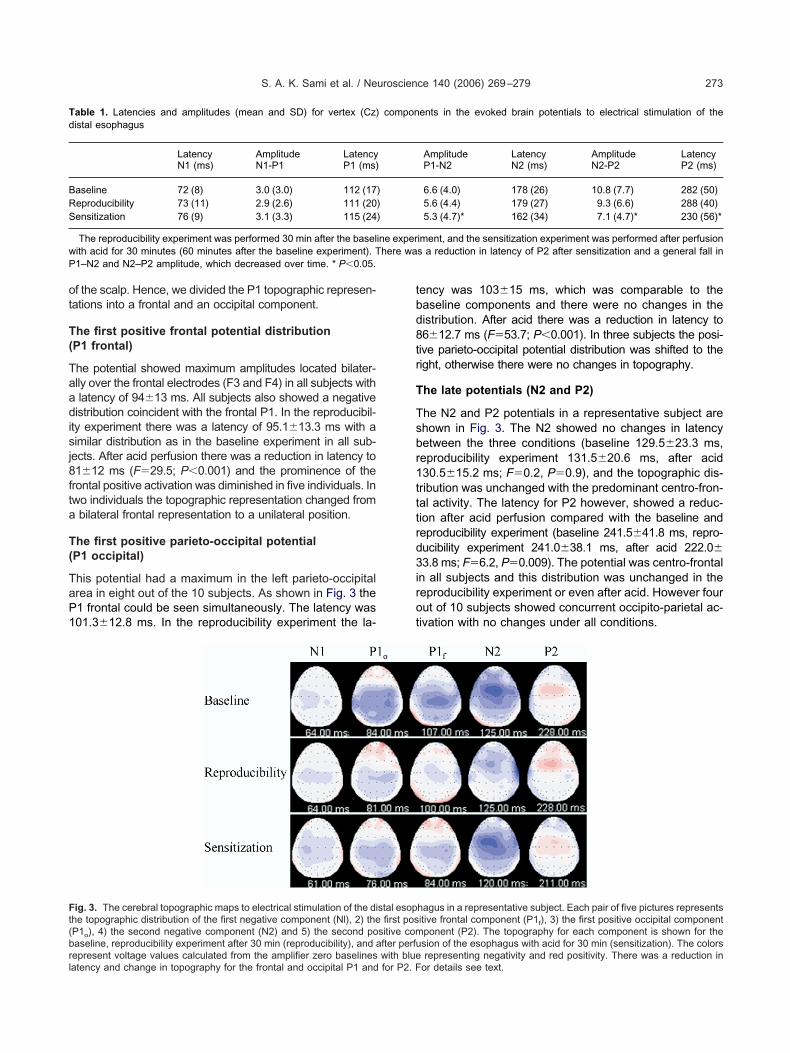
he first negative potential (N1)
ll subjects displayed evidence of a fronto-central distribu-ion of Nl with an average latency of 64.3�10.9 ms (Fig. 3).1 showed a left hemispheric predominance in sevenubjects and a more central orientation in the other three.o changes were seen in latency of the N1 topographies
ig. 2. Evoked brain potentials from Cz in three representative subjectrom top down are: 1) solid line represents baseline vertex potential; 2ine represents the vertex potential after sensitization with acid. A red
reproducibility experiment 65.2�11 ms, after acid 62.8� d
.8 ms (F�1.2; P�0.2)) demonstrating the stability of thisarly component. The distribution of the potentials was theame in all three experimental conditions.
he first positive potential (P1)
rom Fig. 3 it can be seen that the first positive potential was
g electrical stimulation of the distal esophagus. The EPs in the figuresline represents the reproducibility experiment after 30 min; 3) dotted
P2 after sensitization is clearly seen.
s followin) dashed
istributed widely over the frontal, and parieto-occipital areas
ot
T(
Taadisj8fta
T(
TaP1
tbd8tr
T
Tsbr1tttrd3irot
Td
BRS
wP
Ft(brl
S. A. K. Sami et al. / Neuroscience 140 (2006) 269–279 273
f the scalp. Hence, we divided the P1 topographic represen-ations into a frontal and an occipital component.
he first positive frontal potential distributionP1 frontal)
he potential showed maximum amplitudes located bilater-lly over the frontal electrodes (F3 and F4) in all subjects withlatency of 94�13 ms. All subjects also showed a negative
istribution coincident with the frontal P1. In the reproducibil-ty experiment there was a latency of 95.1�13.3 ms with aimilar distribution as in the baseline experiment in all sub-ects. After acid perfusion there was a reduction in latency to1�12 ms (F�29.5; P�0.001) and the prominence of the
rontal positive activation was diminished in five individuals. Inwo individuals the topographic representation changed from
bilateral frontal representation to a unilateral position.
he first positive parieto-occipital potentialP1 occipital)
his potential had a maximum in the left parieto-occipitalrea in eight out of the 10 subjects. As shown in Fig. 3 the1 frontal could be seen simultaneously. The latency was01.3�12.8 ms. In the reproducibility experiment the la-
able 1. Latencies and amplitudes (mean and SD) for vertex (Cz)istal esophagus
LatencyN1 (ms)
AmplitudeN1-P1
LatencyP1 (ms)
aseline 72 (8) 3.0 (3.0) 112 (17eproducibility 73 (11) 2.9 (2.6) 111 (20ensitization 76 (9) 3.1 (3.3) 115 (24
The reproducibility experiment was performed 30 min after the baselith acid for 30 minutes (60 minutes after the baseline experiment). T1–N2 and N2–P2 amplitude, which decreased over time. * P�0.05.
ig. 3. The cerebral topographic maps to electrical stimulation of the dihe topographic distribution of the first negative component (Nl), 2) theP1o), 4) the second negative component (N2) and 5) the second poaseline, reproducibility experiment after 30 min (reproducibility), and a
epresent voltage values calculated from the amplifier zero baselines with blueatency and change in topography for the frontal and occipital P1 and for P2. Fency was 103�15 ms, which was comparable to theaseline components and there were no changes in theistribution. After acid there was a reduction in latency to6�12.7 ms (F�53.7; P�0.001). In three subjects the posi-
ive parieto-occipital potential distribution was shifted to theight, otherwise there were no changes in topography.
he late potentials (N2 and P2)
he N2 and P2 potentials in a representative subject arehown in Fig. 3. The N2 showed no changes in latencyetween the three conditions (baseline 129.5�23.3 ms,eproducibility experiment 131.5�20.6 ms, after acid30.5�15.2 ms; F�0.2, P�0.9), and the topographic dis-ribution was unchanged with the predominant centro-fron-al activity. The latency for P2 however, showed a reduc-ion after acid perfusion compared with the baseline andeproducibility experiment (baseline 241.5�41.8 ms, repro-ucibility experiment 241.0�38.1 ms, after acid 222.0�3.8 ms; F�6.2, P�0.009). The potential was centro-frontal
n all subjects and this distribution was unchanged in theeproducibility experiment or even after acid. However fourut of 10 subjects showed concurrent occipito-parietal ac-ivation with no changes under all conditions.
ents in the evoked brain potentials to electrical stimulation of the
AmplitudeP1-N2
LatencyN2 (ms)
AmplitudeN2-P2
LatencyP2 (ms)
6.6 (4.0) 178 (26) 10.8 (7.7) 282 (50)5.6 (4.4) 179 (27) 9.3 (6.6) 288 (40)5.3 (4.7)* 162 (34) 7.1 (4.7)* 230 (56)*
iment, and the sensitization experiment was performed after perfusions a reduction in latency of P2 after sensitization and a general fall in
hagus in a representative subject. Each pair of five pictures representsitive frontal component (P1f), 3) the first positive occipital componentponent (P2). The topography for each component is shown for thesion of the esophagus with acid for 30 min (sensitization). The colors
compon
)))
ine experhere wa
stal esopfirst pos
sitive comfter perfu
representing negativity and red positivity. There was a reduction inor details see text.
B
Ttrs2aaspaascdisrbWtapdbbcpdtdwto
tpaac
diPid
TuenevagfacgcdiipwHs
T
D
1
2
3
4
5
o(o*
S. A. K. Sami et al. / Neuroscience 140 (2006) 269–279274
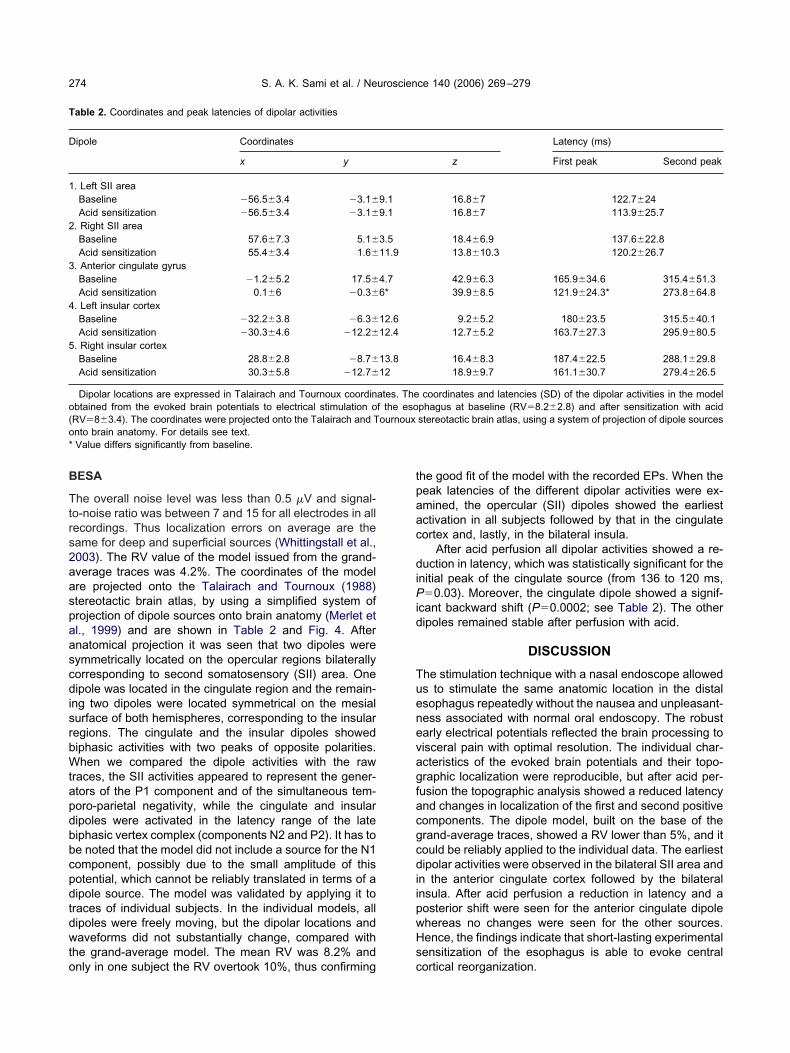
ESA
he overall noise level was less than 0.5 �V and signal-o-noise ratio was between 7 and 15 for all electrodes in allecordings. Thus localization errors on average are theame for deep and superficial sources (Whittingstall et al.,003). The RV value of the model issued from the grand-verage traces was 4.2%. The coordinates of the modelre projected onto the Talairach and Tournoux (1988)tereotactic brain atlas, by using a simplified system ofrojection of dipole sources onto brain anatomy (Merlet etl., 1999) and are shown in Table 2 and Fig. 4. Afternatomical projection it was seen that two dipoles wereymmetrically located on the opercular regions bilaterallyorresponding to second somatosensory (SII) area. Oneipole was located in the cingulate region and the remain-
ng two dipoles were located symmetrical on the mesialurface of both hemispheres, corresponding to the insularegions. The cingulate and the insular dipoles showediphasic activities with two peaks of opposite polarities.hen we compared the dipole activities with the raw
races, the SII activities appeared to represent the gener-tors of the P1 component and of the simultaneous tem-oro-parietal negativity, while the cingulate and insularipoles were activated in the latency range of the lateiphasic vertex complex (components N2 and P2). It has toe noted that the model did not include a source for the N1omponent, possibly due to the small amplitude of thisotential, which cannot be reliably translated in terms of aipole source. The model was validated by applying it toraces of individual subjects. In the individual models, allipoles were freely moving, but the dipolar locations andaveforms did not substantially change, compared with
he grand-average model. The mean RV was 8.2% and
able 2. Coordinates and peak latencies of dipolar activities
ipole Coordinates
x y
. Left SII areaBaseline �56.5�3.4 �3.1�
Acid sensitization �56.5�3.4 �3.1�
. Right SII areaBaseline 57.6�7.3 5.1�
Acid sensitization 55.4�3.4 1.6�
. Anterior cingulate gyrusBaseline �1.2�5.2 17.5�
Acid sensitization 0.1�6 �0.3�
. Left insular cortexBaseline �32.2�3.8 �6.3�
Acid sensitization �30.3�4.6 �12.2�
. Right insular cortexBaseline 28.8�2.8 �8.7�
Acid sensitization 30.3�5.8 �12.7�
Dipolar locations are expressed in Talairach and Tournoux coordinbtained from the evoked brain potentials to electrical stimulation oRV�8�3.4). The coordinates were projected onto the Talairach and Tnto brain anatomy. For details see text.Value differs significantly from baseline.
nly in one subject the RV overtook 10%, thus confirming c
he good fit of the model with the recorded EPs. When theeak latencies of the different dipolar activities were ex-mined, the opercular (SII) dipoles showed the earliestctivation in all subjects followed by that in the cingulateortex and, lastly, in the bilateral insula.
After acid perfusion all dipolar activities showed a re-uction in latency, which was statistically significant for the
nitial peak of the cingulate source (from 136 to 120 ms,�0.03). Moreover, the cingulate dipole showed a signif-
cant backward shift (P�0.0002; see Table 2). The otheripoles remained stable after perfusion with acid.
DISCUSSION
he stimulation technique with a nasal endoscope alloweds to stimulate the same anatomic location in the distalsophagus repeatedly without the nausea and unpleasant-ess associated with normal oral endoscopy. The robustarly electrical potentials reflected the brain processing toisceral pain with optimal resolution. The individual char-cteristics of the evoked brain potentials and their topo-raphic localization were reproducible, but after acid per-usion the topographic analysis showed a reduced latencynd changes in localization of the first and second positiveomponents. The dipole model, built on the base of therand-average traces, showed a RV lower than 5%, and itould be reliably applied to the individual data. The earliestipolar activities were observed in the bilateral SII area and
n the anterior cingulate cortex followed by the bilateralnsula. After acid perfusion a reduction in latency and aosterior shift were seen for the anterior cingulate dipolehereas no changes were seen for the other sources.ence, the findings indicate that short-lasting experimentalensitization of the esophagus is able to evoke central
Latency (ms)
z First peak Second peak
16.8�7 122.7�2416.8�7 113.9�25.7
18.4�6.9 137.6�22.813.8�10.3 120.2�26.7
42.9�6.3 165.9�34.6 315.4�51.339.9�8.5 121.9�24.3* 273.8�64.8
9.2�5.2 180�23.5 315.5�40.112.7�5.2 163.7�27.3 295.9�80.5
16.4�8.3 187.4�22.5 288.1�29.818.9�9.7 161.1�30.7 279.4�26.5
coordinates and latencies (SD) of the dipolar activities in the modelphagus at baseline (RV�8.2�2.8) and after sensitization with acidstereotactic brain atlas, using a system of projection of dipole sources
9.19.1
3.511.9
4.76*
12.612.4
13.812
ates. Thef the esoournoux
ortical reorganization.
S
TutmOaDimcttese
sqts
houoip(mmcEwqsastrsr
Fcsi ter acid p(
S. A. K. Sami et al. / Neuroscience 140 (2006) 269–279 275
timulation and recording techniques
he subjects were intubated via the nasal route with anltrathin endoscope. The technique allowed visual inspec-ion with high resolution and the same landmarks on theucosa could be identified and stimulated repeatedly.ther methods with blinded stimulation of the viscera suchs electrodes mounted on a probe (Hollerbach et al, 1997;rewes et al., 2003a) carry the risk for variable stimulation
n different locations of the esophagus, as contractions canove the probes several centimeters relative to the mu-
osa between the experiments. With the current methodhe impedance was kept low ensuring good contact withhe mucosa, and contractions were not able to move thelectrode position. Furthermore, the method allowed in-pection of mucosa during the acid perfusion ensuring anrythema around the stimulation area.
The EPs were recorded from 64 channels to allow aufficient topographic resolution of the EPs and subse-uent source modeling. In comparison with neuroimaging
echniques the brain mapping of the EPs to time-locked
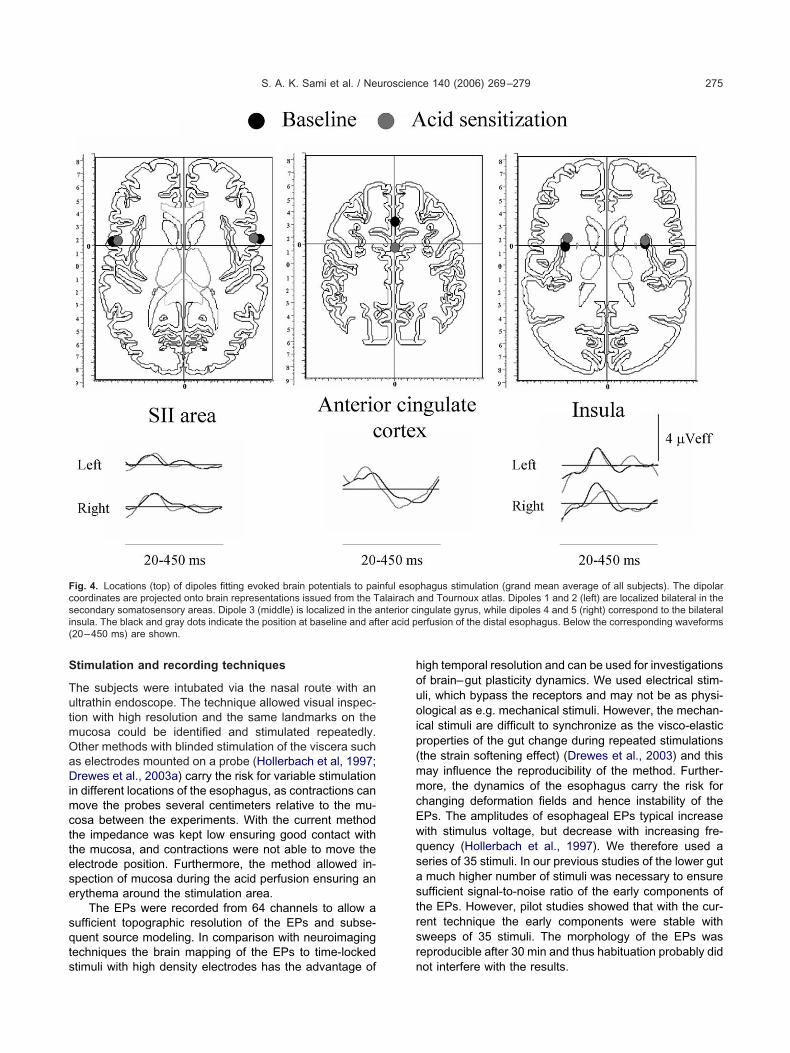
ig. 4. Locations (top) of dipoles fitting evoked brain potentials to paoordinates are projected onto brain representations issued from the Tecondary somatosensory areas. Dipole 3 (middle) is localized in the ansula. The black and gray dots indicate the position at baseline and af20–450 ms) are shown.
timuli with high density electrodes has the advantage of n
igh temporal resolution and can be used for investigationsf brain–gut plasticity dynamics. We used electrical stim-li, which bypass the receptors and may not be as physi-logical as e.g. mechanical stimuli. However, the mechan-
cal stimuli are difficult to synchronize as the visco-elasticroperties of the gut change during repeated stimulationsthe strain softening effect) (Drewes et al., 2003) and thisay influence the reproducibility of the method. Further-ore, the dynamics of the esophagus carry the risk for
hanging deformation fields and hence instability of thePs. The amplitudes of esophageal EPs typical increaseith stimulus voltage, but decrease with increasing fre-uency (Hollerbach et al., 1997). We therefore used aeries of 35 stimuli. In our previous studies of the lower gutmuch higher number of stimuli was necessary to ensure
ufficient signal-to-noise ratio of the early components ofhe EPs. However, pilot studies showed that with the cur-ent technique the early components were stable withweeps of 35 stimuli. The morphology of the EPs waseproducible after 30 min and thus habituation probably did
hagus stimulation (grand mean average of all subjects). The dipolarand Tournoux atlas. Dipoles 1 and 2 (left) are localized bilateral in thengulate gyrus, while dipoles 4 and 5 (right) correspond to the bilateralerfusion of the distal esophagus. Below the corresponding waveforms
inful esopalairachnterior ci
ot interfere with the results.
meswplc(ileeaftpsco2ttcrsnatasctapbratonam
Sewpsacr
B
Tcsbfi
thtw(alulslfsoacGstpcw
wtucbesmbiosRparafawtoum
ps1Ahs(caa
S. A. K. Sami et al. / Neuroscience 140 (2006) 269–279276
The RV was used to evaluate the reliability of theodel. However, the RV must not be the only element invaluating a model. Indeed a low RV can be reachedimply by increasing the number of sources. In our model,e ensured that the scalp EP topography could be ex-lained by the lowest number of dipoles, having physio-
ogical location and activity. Moreover, another importantriterion is that our models—obtained in both conditionsbaseline and acid sensitization)—could be applied to allndividual recordings without any major change in dipoleocation and time course. We did not couple dipole mod-ling with the individual brain images and this may give anrror in the dipole locations. However, head models cre-ted using e.g. boundary element model methods are far
rom an accurate representation of a real head, and closero their spherical counterparts. In support of the latterosition, a simulation study showed that if one uses aufficing number of recording electrodes and assumesorrelated noise, the importance of real head modelingver spherical head modeling is limited (Vanrumste et al.,002). It should always be taken into account that theraces to be analyzed are recorded from the scalp surface,hus a number of variables must be considered when theorresponding deep generators are to be searched (Vale-iani et al., 2001). However, on the basis of previous re-ults, obtained by using different neurophysiological andeuroimaging techniques, there are several elements tossume that our midline dipole corresponds to a source inhe anterior cingulate cortex and that the bilateral dipolesre located in the SII area and in the insular cortex, re-pectively. Moreover, our main finding, represented by ahange in the midline dipole position after acid sensitiza-ion, does not depend on the BESA precision in localizing
dipole in a certain brain structure. In this case, theossible sources of “anatomical” mistake are identical inoth conditions, thus they do not interfere with the finalesult. In our model, the N1 response did not correspond todefinite dipole activity. This is due to the low amplitude of
his response, which cannot be reliably expressed in termsf source activity. However, the subsequent EP compo-ents corresponded to definite dipole activity peaks, thusdding a further element for the validation of the wholeodel.
In this study no sham perfusion with saline was done.ham perfusion with saline is of questionable value in suchxperiments as the subjects can feel the acid perfusion,hich gave slight heartburn in all subjects. Instead weerformed the reproducibility experiment. Furthermore, ineveral pilot experiments where the stimulation was donefter one hour the EPs were still reproducible. Although weannot exclude that a time effect may interfere with theesults we believe that this is highly unlikely.
aseline stimulation of the esophagus
he study revealed reproducible EPs recorded from all 64hannels. Although electrical stimulation activates bothmall myelinated (A�) and unmyelinated (C) fibers (Holler-ach et al., 1997), only the conduction velocity of the A�
bers can explain the early components. According to the aopographical analysis the N1 was central, whereas the P1ad both a frontal and an occipital component confirminghe validity of this early component. Furthermore, an N1ith early latency was also demonstrated by other studies
Hollerbach et al., 1997). The potentials reflect corticalctivity to pain such as those we have recently shown to
ower gut activation (Rössel et al., 2001). Aziz et al. (1995)sed topographic maps to describe the brain activity fol-
owing mechanical distension of the esophagus. In theirtudies the N1 at 69 ms showed lateralization to either the
eft or the right hemisphere, whereas in our study a moreronto-central localization of N1 was seen. For the P1 theyhowed a more widespread distribution corresponding withur subdivision into frontal and occipital P1 potentials. P1ctivations of prefrontal and parieto-occipital regions areomparable to the areas characterized with heartburn inERD patients in fMRI studies (Kern et al., 2004). Weu-
ten et al. (1994) also recorded the topography of the EPso mechanical stimulation of the distal esophagus, but onlyotentials with latencies �100 ms were reported. The lateomponents in our study were localized fronto-centrallyith latencies comparable to those in previous studies.
EP dipole sources following esophageal stimulationere previously described by Franssen et al. (1996). Al-
hough a different approach and stimulation paradigm wassed they found late dipoles in the cingulate and insularortex. Unlike the Franssen et al. study, in our subjects ailateral SII activation was demonstrated to explain thearly EP topography. SII area activation to esophagealtimuli was also found in the experiments based on theagnetoencephalogram (MEG) (Loose et al., 1999). Theilateral SII area activation has been suggested to be
nvolved in attention and rating of the strength and qualityf pain by comparing the hurting and non-hurting sites, andeems relevant for processing of stimuli in the GI tract.ecently Hobson et al. (2005) combined MEG and EP toainful stimulation of the esophagus. The MEG data werenalyzed with “synthetic aperture magnetometry” allowingecognition of virtual depth electrodes. They found an earlyctivation at around 85 ms in SI, SII and posterior insulaollowed by activation of anterior insula and cingulate gyrust around 105 ms. The P1 latency in the EP correspondedith that observed in the MEG study reflecting the impor-
ance of the early components. Although their methodol-gy and findings cannot be directly compared with thosesed in our study the early bilateral activation of the so-atosensory regions was consistent with our findings.
In agreement with the Franssen et al. (1996) study andrevious MEG and positron emission tomography (PET)tudies (Aziz et al., 1997; Hecht et al., 1999; Loose et al.,999; Hobson et al., 2005), we found an insular activation.nimal studies of anatomical data suggest that the insulaas an important function for integrating the visceral sen-ory and motor activity together with limbic integrationAugustine, 1996). We also found an early dipole localizedlose to the cingulate gyrus. MEG studies are normally notble to identify deep dipoles, but the cingulate gyrus waslso activated in the EEG study by Franssen et al. (1996),
nd in PET studies following distension of the esophagus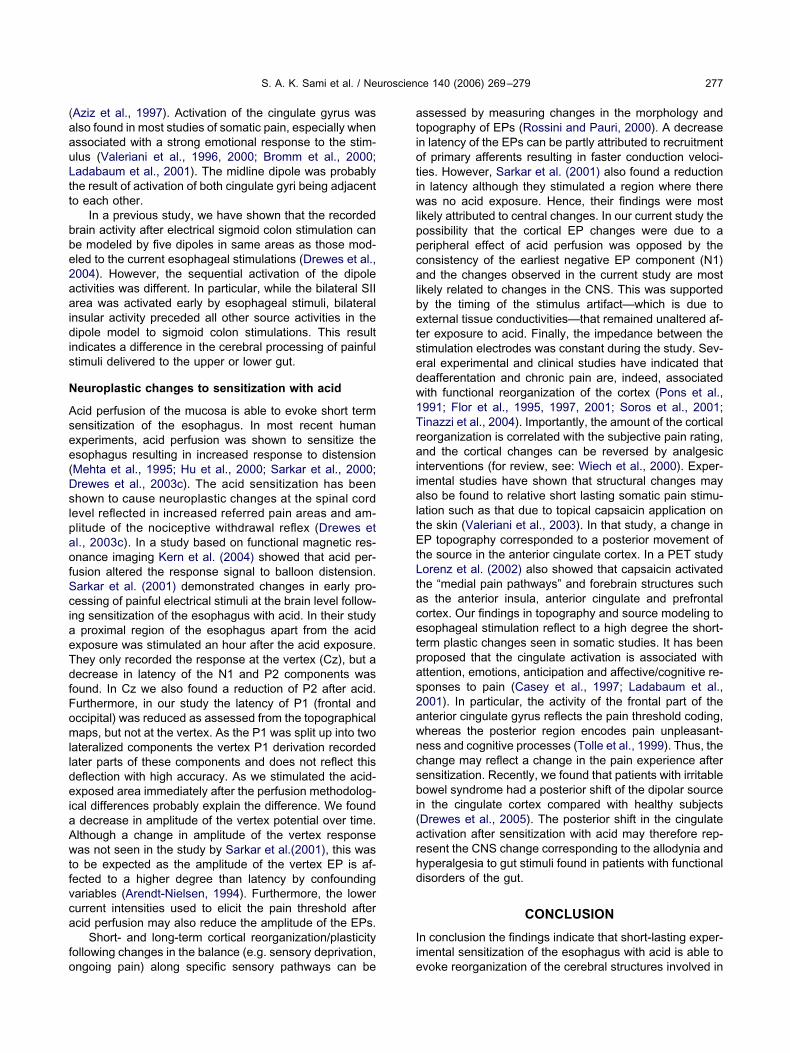
(aauLtt
bbe2aaidis
N
Asee(DslpaofSciaeTdfFomlldeiaAwtfvca
fo
atiotiwlppcalbetsedw1TraiialtEtLtacetpas2awncsbi(arhd
Ii
S. A. K. Sami et al. / Neuroscience 140 (2006) 269–279 277
Aziz et al., 1997). Activation of the cingulate gyrus waslso found in most studies of somatic pain, especially whenssociated with a strong emotional response to the stim-lus (Valeriani et al., 1996, 2000; Bromm et al., 2000;adabaum et al., 2001). The midline dipole was probablyhe result of activation of both cingulate gyri being adjacento each other.
In a previous study, we have shown that the recordedrain activity after electrical sigmoid colon stimulation cane modeled by five dipoles in same areas as those mod-led to the current esophageal stimulations (Drewes et al.,004). However, the sequential activation of the dipolectivities was different. In particular, while the bilateral SIIrea was activated early by esophageal stimuli, bilateral
nsular activity preceded all other source activities in theipole model to sigmoid colon stimulations. This result
ndicates a difference in the cerebral processing of painfultimuli delivered to the upper or lower gut.
europlastic changes to sensitization with acid
cid perfusion of the mucosa is able to evoke short termensitization of the esophagus. In most recent humanxperiments, acid perfusion was shown to sensitize thesophagus resulting in increased response to distensionMehta et al., 1995; Hu et al., 2000; Sarkar et al., 2000;rewes et al., 2003c). The acid sensitization has beenhown to cause neuroplastic changes at the spinal cordevel reflected in increased referred pain areas and am-litude of the nociceptive withdrawal reflex (Drewes etl., 2003c). In a study based on functional magnetic res-nance imaging Kern et al. (2004) showed that acid per-usion altered the response signal to balloon distension.arkar et al. (2001) demonstrated changes in early pro-essing of painful electrical stimuli at the brain level follow-ng sensitization of the esophagus with acid. In their study
proximal region of the esophagus apart from the acidxposure was stimulated an hour after the acid exposure.hey only recorded the response at the vertex (Cz), but aecrease in latency of the N1 and P2 components wasound. In Cz we also found a reduction of P2 after acid.urthermore, in our study the latency of P1 (frontal andccipital) was reduced as assessed from the topographicalaps, but not at the vertex. As the P1 was split up into two
ateralized components the vertex P1 derivation recordedater parts of these components and does not reflect thiseflection with high accuracy. As we stimulated the acid-xposed area immediately after the perfusion methodolog-
cal differences probably explain the difference. We founddecrease in amplitude of the vertex potential over time.lthough a change in amplitude of the vertex responseas not seen in the study by Sarkar et al.(2001), this was
o be expected as the amplitude of the vertex EP is af-ected to a higher degree than latency by confoundingariables (Arendt-Nielsen, 1994). Furthermore, the lowerurrent intensities used to elicit the pain threshold aftercid perfusion may also reduce the amplitude of the EPs.
Short- and long-term cortical reorganization/plasticityollowing changes in the balance (e.g. sensory deprivation,
ngoing pain) along specific sensory pathways can be essessed by measuring changes in the morphology andopography of EPs (Rossini and Pauri, 2000). A decreasen latency of the EPs can be partly attributed to recruitmentf primary afferents resulting in faster conduction veloci-ies. However, Sarkar et al. (2001) also found a reductionn latency although they stimulated a region where thereas no acid exposure. Hence, their findings were most
ikely attributed to central changes. In our current study theossibility that the cortical EP changes were due to aeripheral effect of acid perfusion was opposed by theonsistency of the earliest negative EP component (N1)nd the changes observed in the current study are most
ikely related to changes in the CNS. This was supportedy the timing of the stimulus artifact—which is due toxternal tissue conductivities—that remained unaltered af-er exposure to acid. Finally, the impedance between thetimulation electrodes was constant during the study. Sev-ral experimental and clinical studies have indicated thateafferentation and chronic pain are, indeed, associatedith functional reorganization of the cortex (Pons et al.,991; Flor et al., 1995, 1997, 2001; Soros et al., 2001;inazzi et al., 2004). Importantly, the amount of the corticaleorganization is correlated with the subjective pain rating,nd the cortical changes can be reversed by analgesic
nterventions (for review, see: Wiech et al., 2000). Exper-mental studies have shown that structural changes maylso be found to relative short lasting somatic pain stimu-
ation such as that due to topical capsaicin application onhe skin (Valeriani et al., 2003). In that study, a change inP topography corresponded to a posterior movement of
he source in the anterior cingulate cortex. In a PET studyorenz et al. (2002) also showed that capsaicin activatedhe “medial pain pathways” and forebrain structures suchs the anterior insula, anterior cingulate and prefrontalortex. Our findings in topography and source modeling tosophageal stimulation reflect to a high degree the short-erm plastic changes seen in somatic studies. It has beenroposed that the cingulate activation is associated withttention, emotions, anticipation and affective/cognitive re-ponses to pain (Casey et al., 1997; Ladabaum et al.,001). In particular, the activity of the frontal part of thenterior cingulate gyrus reflects the pain threshold coding,hereas the posterior region encodes pain unpleasant-ess and cognitive processes (Tolle et al., 1999). Thus, thehange may reflect a change in the pain experience afterensitization. Recently, we found that patients with irritableowel syndrome had a posterior shift of the dipolar source
n the cingulate cortex compared with healthy subjectsDrewes et al., 2005). The posterior shift in the cingulatectivation after sensitization with acid may therefore rep-esent the CNS change corresponding to the allodynia andyperalgesia to gut stimuli found in patients with functionalisorders of the gut.
CONCLUSION
n conclusion the findings indicate that short-lasting exper-mental sensitization of the esophagus with acid is able to
voke reorganization of the cerebral structures involved in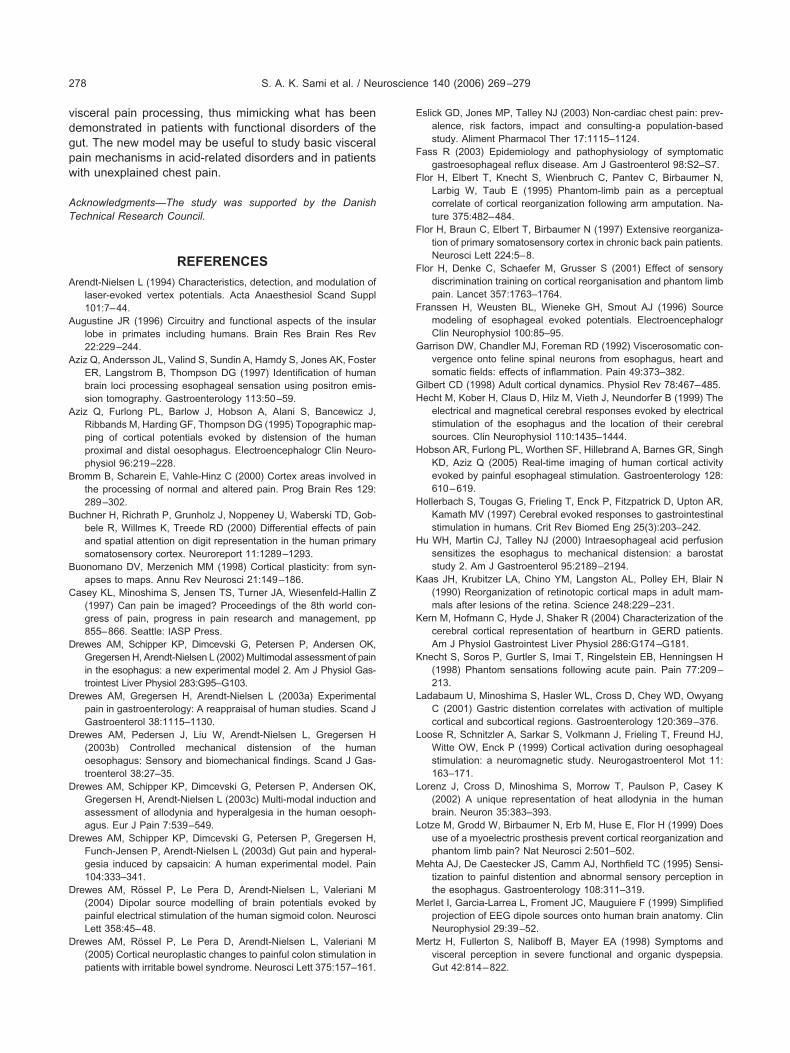
vdgpw
AT
A
A
A
A
B
B
B
C
D
D
D
D
D
D
D
E
F
F
F
F
F
G
GH
H
H
H
K
K
K
L
L
L
L
M
M
M
S. A. K. Sami et al. / Neuroscience 140 (2006) 269–279278
isceral pain processing, thus mimicking what has beenemonstrated in patients with functional disorders of theut. The new model may be useful to study basic visceralain mechanisms in acid-related disorders and in patientsith unexplained chest pain.
cknowledgments—The study was supported by the Danishechnical Research Council.
REFERENCES
rendt-Nielsen L (1994) Characteristics, detection, and modulation oflaser-evoked vertex potentials. Acta Anaesthesiol Scand Suppl101:7–44.
ugustine JR (1996) Circuitry and functional aspects of the insularlobe in primates including humans. Brain Res Brain Res Rev22:229–244.
ziz Q, Andersson JL, Valind S, Sundin A, Hamdy S, Jones AK, FosterER, Langstrom B, Thompson DG (1997) Identification of humanbrain loci processing esophageal sensation using positron emis-sion tomography. Gastroenterology 113:50–59.
ziz Q, Furlong PL, Barlow J, Hobson A, Alani S, Bancewicz J,Ribbands M, Harding GF, Thompson DG (1995) Topographic map-ping of cortical potentials evoked by distension of the humanproximal and distal oesophagus. Electroencephalogr Clin Neuro-physiol 96:219–228.
romm B, Scharein E, Vahle-Hinz C (2000) Cortex areas involved inthe processing of normal and altered pain. Prog Brain Res 129:289–302.
uchner H, Richrath P, Grunholz J, Noppeney U, Waberski TD, Gob-bele R, Willmes K, Treede RD (2000) Differential effects of painand spatial attention on digit representation in the human primarysomatosensory cortex. Neuroreport 11:1289–1293.
uonomano DV, Merzenich MM (1998) Cortical plasticity: from syn-apses to maps. Annu Rev Neurosci 21:149–186.
asey KL, Minoshima S, Jensen TS, Turner JA, Wiesenfeld-Hallin Z(1997) Can pain be imaged? Proceedings of the 8th world con-gress of pain, progress in pain research and management, pp855–866. Seattle: IASP Press.
rewes AM, Schipper KP, Dimcevski G, Petersen P, Andersen OK,Gregersen H, Arendt-Nielsen L (2002) Multimodal assessment of painin the esophagus: a new experimental model 2. Am J Physiol Gas-trointest Liver Physiol 283:G95–G103.
rewes AM, Gregersen H, Arendt-Nielsen L (2003a) Experimentalpain in gastroenterology: A reappraisal of human studies. Scand JGastroenterol 38:1115–1130.
rewes AM, Pedersen J, Liu W, Arendt-Nielsen L, Gregersen H(2003b) Controlled mechanical distension of the humanoesophagus: Sensory and biomechanical findings. Scand J Gas-troenterol 38:27–35.
rewes AM, Schipper KP, Dimcevski G, Petersen P, Andersen OK,Gregersen H, Arendt-Nielsen L (2003c) Multi-modal induction andassessment of allodynia and hyperalgesia in the human oesoph-agus. Eur J Pain 7:539–549.
rewes AM, Schipper KP, Dimcevski G, Petersen P, Gregersen H,Funch-Jensen P, Arendt-Nielsen L (2003d) Gut pain and hyperal-gesia induced by capsaicin: A human experimental model. Pain104:333–341.
rewes AM, Rössel P, Le Pera D, Arendt-Nielsen L, Valeriani M(2004) Dipolar source modelling of brain potentials evoked bypainful electrical stimulation of the human sigmoid colon. NeurosciLett 358:45–48.
rewes AM, Rössel P, Le Pera D, Arendt-Nielsen L, Valeriani M(2005) Cortical neuroplastic changes to painful colon stimulation in
patients with irritable bowel syndrome. Neurosci Lett 375:157–161.slick GD, Jones MP, Talley NJ (2003) Non-cardiac chest pain: prev-alence, risk factors, impact and consulting-a population-basedstudy. Aliment Pharmacol Ther 17:1115–1124.
ass R (2003) Epidemiology and pathophysiology of symptomaticgastroesophageal reflux disease. Am J Gastroenterol 98:S2–S7.
lor H, Elbert T, Knecht S, Wienbruch C, Pantev C, Birbaumer N,Larbig W, Taub E (1995) Phantom-limb pain as a perceptualcorrelate of cortical reorganization following arm amputation. Na-ture 375:482–484.
lor H, Braun C, Elbert T, Birbaumer N (1997) Extensive reorganiza-tion of primary somatosensory cortex in chronic back pain patients.Neurosci Lett 224:5–8.
lor H, Denke C, Schaefer M, Grusser S (2001) Effect of sensorydiscrimination training on cortical reorganisation and phantom limbpain. Lancet 357:1763–1764.
ranssen H, Weusten BL, Wieneke GH, Smout AJ (1996) Sourcemodeling of esophageal evoked potentials. ElectroencephalogrClin Neurophysiol 100:85–95.
arrison DW, Chandler MJ, Foreman RD (1992) Viscerosomatic con-vergence onto feline spinal neurons from esophagus, heart andsomatic fields: effects of inflammation. Pain 49:373–382.
ilbert CD (1998) Adult cortical dynamics. Physiol Rev 78:467–485.echt M, Kober H, Claus D, Hilz M, Vieth J, Neundorfer B (1999) The
electrical and magnetical cerebral responses evoked by electricalstimulation of the esophagus and the location of their cerebralsources. Clin Neurophysiol 110:1435–1444.
obson AR, Furlong PL, Worthen SF, Hillebrand A, Barnes GR, SinghKD, Aziz Q (2005) Real-time imaging of human cortical activityevoked by painful esophageal stimulation. Gastroenterology 128:610–619.
ollerbach S, Tougas G, Frieling T, Enck P, Fitzpatrick D, Upton AR,Kamath MV (1997) Cerebral evoked responses to gastrointestinalstimulation in humans. Crit Rev Biomed Eng 25(3):203–242.
u WH, Martin CJ, Talley NJ (2000) Intraesophageal acid perfusionsensitizes the esophagus to mechanical distension: a barostatstudy 2. Am J Gastroenterol 95:2189–2194.
aas JH, Krubitzer LA, Chino YM, Langston AL, Polley EH, Blair N(1990) Reorganization of retinotopic cortical maps in adult mam-mals after lesions of the retina. Science 248:229–231.
ern M, Hofmann C, Hyde J, Shaker R (2004) Characterization of thecerebral cortical representation of heartburn in GERD patients.Am J Physiol Gastrointest Liver Physiol 286:G174–G181.
necht S, Soros P, Gurtler S, Imai T, Ringelstein EB, Henningsen H(1998) Phantom sensations following acute pain. Pain 77:209–213.
adabaum U, Minoshima S, Hasler WL, Cross D, Chey WD, OwyangC (2001) Gastric distention correlates with activation of multiplecortical and subcortical regions. Gastroenterology 120:369–376.
oose R, Schnitzler A, Sarkar S, Volkmann J, Frieling T, Freund HJ,Witte OW, Enck P (1999) Cortical activation during oesophagealstimulation: a neuromagnetic study. Neurogastroenterol Mot 11:163–171.
orenz J, Cross D, Minoshima S, Morrow T, Paulson P, Casey K(2002) A unique representation of heat allodynia in the humanbrain. Neuron 35:383–393.
otze M, Grodd W, Birbaumer N, Erb M, Huse E, Flor H (1999) Doesuse of a myoelectric prosthesis prevent cortical reorganization andphantom limb pain? Nat Neurosci 2:501–502.
ehta AJ, De Caestecker JS, Camm AJ, Northfield TC (1995) Sensi-tization to painful distention and abnormal sensory perception inthe esophagus. Gastroenterology 108:311–319.
erlet I, Garcia-Larrea L, Froment JC, Mauguiere F (1999) Simplifiedprojection of EEG dipole sources onto human brain anatomy. ClinNeurophysiol 29:39–52.
ertz H, Fullerton S, Naliboff B, Mayer EA (1998) Symptoms andvisceral perception in severe functional and organic dyspepsia.
Gut 42:814–822.
M
M
N
N
P
P
P
R
R
R
R
S
S
S
S
T
T
T
V
V
V
V
V
W
W
W
S. A. K. Sami et al. / Neuroscience 140 (2006) 269–279 279
ertz H (2003) Review article: visceral hypersensitivity. Aliment Phar-macol Ther 17:623–633.
erzenich MM, Kaas JH, Wall JT, Sur M, Nelson RJ, Felleman DJ(1983) Progression of change following median nerve section inthe cortical representation of the hand in areas 3b and 1 in adultowl and squirrel monkeys. Neuroscience 10:639–665.
ess TJ, Gebhart GF (1990) Visceral pain: a review of experimentalstudies. Pain 41:167–234.
oppeney U, Waberski TD, Gobbele R, Buchner H (1999) Spatialattention modulates the cortical somatosensory representation ofthe digits in humans. Neuroreport 10:3137–3141.
edersen J, Reddy H, Funch-Jensen P, Arendt-Nielsen L, GregersenH, Drewes A (2004a) Differences between male and female re-sponses to painful thermal and mechanical stimulation of the hu-man esophagus. Dig Dis Sci 49:1065–1074.
edersen J, Reddy H, Funch-Jensen P, Arendt-Nielsen L, GregersenH, Drewes AM (2004b) Cold and heat pain assessment of thehuman oesophagus after experimental sensitisation with acid. Pain110:393–399.
ons TP, Garraghty PE, Ommaya AK, Kaas JH, Taub E, Mishkin M(1991) Massive cortical reorganization after sensory deafferenta-tion in adult macaques. Science 252:1857–1860.
ichter JE, Bradley LA, Castell DO (1989) Esophageal chest pain:current controversies in pathogenesis, diagnosis, and therapy. AnnIntern Med 110:66–78.
obertson D, Irvine DR (1989) Plasticity of frequency organization inauditory cortex of guinea pigs with partial unilateral deafness.J Comp Neurol 282:456–471.
össel P, Petersen P, Niddam D, Arendt-Nielsen L, Chen AC, DrewesAM (2001) Cerebral response to electric stimulation of the colonand abdominal skin in healthy subjects and patients with irritablebowel syndrome 1. Scand J Gastroenterol 36:1259–1266.
ossini PM, Pauri F (2000) Neuromagnetic integrated methods track-ing human brain mechanisms of sensorimotor areas “plastic” reor-ganisation. Brain Res Brain Res Rev 33:131–154.
arkar S, Aziz Q, Woolf CJ, Hobson AR, Thompson DG (2000) Con-tribution of central sensitisation to the development of non-cardiacchest pain. Lancet 356:1154–1159.
arkar S, Hobson AR, Furlong PL, Woolf CJ, Thompson DG, Aziz Q(2001) Central neural mechanisms mediating human visceral hy-persensitivity 1. Am J Physiol Gastrointest Liver Physiol 281:G1196–G1202.
herg M, Grandone F, Hoke M, Romani GL (1990) Fundamentals ofdipole source potential analysis. Auditory evoked magnetic fieldsand electric potentials: Advances in audiology, pp 40–69. Basel:
Karger.oros P, Knecht S, Bantel C, Imai T, Wusten R, Pantev C, Lutken-honer B, Burkle H, Henningsen H (2001) Functional reorganizationof the human primary somatosensory cortex after acute pain dem-onstrated by magnetoencephalography. Neurosci Lett 298:195–198.
alaraich J, Tounoux P (1988) Co-planar stereotaxic atlas of thehuman brain. Stuttgart–New York: Thieme.
inazzi M, Valeriani M, Moretto G, Rosso T, Nicolato A, Fiaschi A,Aglioti SM (2004) Plastic interactions between hand and facecortical representations in patients with trigeminal neuralgia: asomatosensory-evoked potentials study. Neuroscience 127:769–776.
olle TR, Kaufmann T, Siessmeier T, Lautenbacher S, Berthele A,Munz F, Zieglgansberger W, Willoch F, Schwaiger M, Conrad B, etal (1999) Region-specific encoding of sensory and affective com-ponents of pain in the human brain: A positron emission tomogra-phy correlation analysis. Ann Neurol 45:40–47.
aleriani M, Rambaud L, Mauguiere F (1996) Scalp topography anddipolar source modelling of potentials evoked by CO2 laser stim-ulation of the hand. Encephalograph Clin Neurophysiol 100:343–353.
aleriani M, Restuccia D, Le Pera D, Fiaschetti L, Tonali P, Arendt-Nielsen L (2000) Unmasking of an early laser evoked potential bya point localization task. Clin Neurophysiol 111:1927–1933.
aleriani M, Le Pera D, Tonali P (2001) Characterizing somatosensoryevoked potential sources with dipole models: Advantages andlimitations. Muscle Nerve 24:325–339.
aleriani M, Arendt-Nielsen L, Le Pera D, Restuccia D, Rosso T, DeArmas L, Maiese T, Fiaschi A, Tonali P, Tinazzi M (2003) Short-term plastic changes of the human nociceptive system followingacute pain induced by capsaicin. Clin Neurophysiol 114:1879–1890.
anrumste B, Van Hoey G, Van de Walle R, D’Have MR, Lemahieu IA,Boon PA (2002) Comparison of performance of spherical andrealistic head models in dipole localization from noisy EEG. MedEng Phys 24(6):403–418.
eusten BL, Franssen H, Wieneke GH, Smout AJ (1994) Multichan-nel recording of cerebral potentials evoked by esophageal balloondistension in humans. Dig Dis Sci 39:2074–2083.
hittingstall K, Stroink G, Gates L, Connolly JF, Finley A (2003)Effects of dipole position, orientation and noise on the accuracy ofEEG source localization. Biomed Eng Online 2:14.
iech K, Preissl H, Birbaumer N (2000) Neuroimaging of chronic pain:phantom limb and musculoskeletal pain. Scand J Rheumatol Suppl
113:13–18.(Accepted 5 February 2006)(Available online 21 April 2006)