corrosion behavior of titania films coated by liquid-phase deposition on aisi304 stainless steel...
TRANSCRIPT

Corrosion Behavior of Titania Films Coated by Liquid-PhaseDeposition on AISI304 Stainless Steel Substrates
Yongwei CaiDept. of Chemical Engineering, School of Chemical Engineering and Technology,
Tianjin University, Tianjin 300072, China
Mingyan LiuDept. of Chemical Engineering, School of Chemical Engineering and Technology,
Tianjin University, Tianjin 300072, China
State Key Laboratory of Chemical Engineering, Tianjin 300072, China
DOI 10.1002/aic.12701Published online July 20, 2011 in Wiley Online Library (wileyonlinelibrary.com).
Fouling deposition and localized corrosion on the heat-transfer surfaces of the stainless steel equipments oftensimultaneously exist, which can introduce additional thermal resistance to heat-transfer and damage heat-transfer surfaces.It is a good anticorrosion way to coat a barrier layer of certain materials on the metal surface. In this article, the TiO2
coatings with nanoscale thicknesses were obtained by liquid-phase deposition method on the substrates of AISI304 stainlesssteel (ASS). The coating thickness, surface roughness, surface morphology, crystal phase, and chemical element werecharacterized with the film thickness measuring instrument, roughmeter, atomic force microscopy, field emission scanningelectron microscopy, X-ray diffraction, and energy-dispersive X-ray spectroscopy analyzer, respectively. Corrosionbehavior of the TiO2 coatings was evaluated by potentiodynamic polarization, cyclic voltammograms scanning, andelectrochemical impedance spectroscopy tests with the mixed corrosion solution composed of 3.5 wt. % NaCl and 0.05 MNaOH. It is shown that the TiO2 coating is composed of the nanoparticles with smooth, crack-free, dense, and uniformsurface topography; the roughness of coating surface increases slightly compared with that of the polished ASS substrate.The anatase-phase TiO2 coatings are obtained when sintering temperature being varied from 573.15 to 923.15 K andexhibit better anticorrosion behavior compared with ASS surfaces. The corrosion current density decreases and thepolarization resistance increases with the increase of the coating thickness. The corrosion resistance of the TiO2 coatingsdeteriorates with the increase of the corrosion time. The capacitance and the resistance of the corrosion product layerbetween the interface of the ASS substrate and the TiO2 coating are found after the corrosion time of 240 h. A corrosionmodel was introduced, and a possible new explanation on the anticorrosion mechanisms of the TiO2 coating was alsoanalyzed. The corrosion mechanism of the TiO2 coating might comply with the multistage corrosion process. VVC 2011
American Institute of Chemical Engineers AIChE J, 58: 1907–1920, 2012
Keywords: coating, corrosion, titania, liquid-phase deposition, electrochemical impedance spectroscopy, Tafel curves,cyclic voltammetry, AISI304 stainless steel
Introduction
Fouling deposition and corrosion on heat-transfer surfacesof metal materials often exist simultaneously.1,2 Therefore,investigations on the anticorrosion characteristics of theheat-transfer surfaces are as important as those on the anti-fouling properties. Stainless steel materials are susceptible tolocalized corrosion3 in the solution with dissolved oxygenand the chloride or other aggressive ions4 although they arefamous for their good corrosion resistance. The corrosion ofstainless steel damages the heat-transfer surface. In addition,the corrosion products (i.e., in situ corrosion fouling5)
formed on the heat-transfer surface can introduce a thermalresistance to heat transfer, and provide nooks and crannies inwhich the precipitation of calcium carbonate or calcium sul-fate fouling is promoted. So, the corrosion of the stainlesssteel has attracted much attention from heat-transferdomains.
The surface coating technology is an alternative to corro-sion protection of stainless steel due to the formation of bar-rier over the metal surface to block the interaction betweenmetal substrate and electrochemical environment.5 Titaniacoating has been paid widespread attention due to its uniquephotocatalytic properties6 as well as its antifouling func-tions.7–9 The TiO2 coatings have low electronic conductance,good insulating properties, and low anodic dissolution rate,so it was also widely used for protection against metalcorrosion.10–13
AIChE Journal 1907June 2012 Vol. 58, No. 6
Correspondence concerning this article should be addressed to M. Y. Liu [email protected].
VVC 2011 American Institute of Chemical Engineers

Titanium dioxide coatings have been prepared by reactivepulse magnetron sputtering,6 cathodic vacuum arc deposi-tion,14 chemical vapor deposition (CVD),15,16 self-assembledmonolayers (SAMs),17 sol–gel18, and liquid-phase deposition(LPD) methods.7,9,19,20 The LPD method was reported earlierfor depositing SiO2
21 coatings and subsequently for TiO2
coatings20 on a variety of substrates, such as glass,22,23
mica,23 carbon fiber,24 and metals25 near room temperature.The LPD method has many advantages. It requires simpleequipment and lower deposition temperature, and it is appli-cable to substrates that cannot withstand high temperature aswell as is able to deposit on the large size and complexshape substrates. Generally, the TiO2 coatings can be heatedat different temperature to obtain various crystal forms.26,27
The electrochemical method to evaluate the anticorrosionproperty of the TiO2 coatings was widely used in the pub-lished articles. Głuzek et al.28 studied the corrosion behaviorof the TiO2 coating on 316L stainless steel by the plasma-assisted CVD method in Ringer solution using the imped-ance spectroscopy and polarization examinations. The resultsshow that the TiO2 coating increases the resistivity of the316L type stainless steel to pitting corrosion and general cor-rosion. Szalkowska et al.10 obtained the TiO2 coating bysol–gel technique on the AISI403 type steel surface to exam-ine the corrosion protecting properties with polarization andimpedance measurements in the solution of 0.5 mol L�1
Na2SO4 acidified down to pH of 3. The results demonstratethat the TiO2 coating inhibits both the cathodic and anodiccorrosion processes, and the corrosion rate is by two ordersof magnitude lower than that of the bare steel surface. Shenet al.11 prepared the TiO2 nanoparticle coating on 316Lstainless steel using sol–gel method and used the Tafelpolarization curves and electrochemical impedance spectros-copy (EIS) to measure the anticorrosion performance of theTiO2 coatings in 0.5 mol L�1 NaCl solution with pH of 4.6.The results indicate that the TiO2 nanoparticle coating exhib-its an excellent corrosion resistance due to ceramic protec-tive barrier on metal surface. Hu et al.25 prepared the TiO2
coating for AZ31 magnesium alloy by LPD method andevaluated the corrosion protection performance in 3.5 wt. %NaCl solution with Tafel polarization technique. The resultsdisplay that the anatase-type phase TiO2 coating shows evi-dent corrosion resistance and with the increase of the anneal-ing temperature and prolongation of annealing time, the anti-corrosion property is improved. However, the coating thick-ness is about 1.0 � 10�5 m and the annealed temperature is�653.15 K. Such a thick coating is easily cracked and des-quamated when it is dried and annealed. Meanwhile, thecoating might have high-additional thermal resistance whenit is coated onto the heat-transfer surface. The durability ofthe coating in the corrosion solution with the increase of thecorrosion time and the corrosion mechanism of the coatingneed to be explored. Zeng et al.19 prepared the anatase-typeTiO2 coating on the 304 stainless steel substrate by the LPDmethod with film thickness of greater than 4.5 � 10�7 munder annealing temperature of 673.15 K. The coating isthick and cracked. Recently, Padhy et al.5 studied the corro-sion performance of the sputter deposited TiO2 coating onthe 304L type stainless steel in the oxidizing medium of 1mol L�1 and 8 mol L�1 nitric acid. Their results show anincrease in the corrosion resistance in the test solutions anda surface dissolution at higher concentrations of nitric acidfor TiO2-coated specimens. Wang and Liu9 qualitativelycarried out the dipping experiments of the amorphous TiO2-
coated surface on the red copper substrate in the corrosionmedia at room temperature. The experimental resultsindicate that the TiO2 coating can resist corrosion until900 h (1 h ¼ 3600 s) in 25 wt. % NaCl solution, and thecoating shows better anticorrosion behavior than the coppermetal in 30 wt. % NaOH solution. However, the coating iseasily corroded in 30 wt. % HCl solution. The corrosionmechanism needs further extensive and quantitative investi-gations.
In corrosion studies, the 316L stainless steel as well asother more costly metal alloy was often selected as the sub-strates. It is known that the austenitic AISI304 stainless steel(ASS) is the major constructional material for the fabricationof vessels, pipes, tanks, and equipments in heat-transfer fieldbecause of its relatively low price. However, little systemati-cal and qualitative work is available in the literature on thecorrosion performance of the anatase phase of the TiO2 coat-ings with nanoscale thickness prepared by LPD method onthe ASS substrates.
In this study, the uniform anatase-phase TiO2 nanoparticlecoatings on the ASS substrates were fabricated by LPDmethod, and their corrosion behavior was investigated. Thecrystallinity and nanostructural features of the TiO2 coatingwere characterized by X-ray diffraction (XRD) and fieldemission scanning electron microscopy (FE-SEM), respec-tively. The elemental distribution of the TiO2 coatings wasanalyzed by the energy-dispersive X-ray spectroscopy (EDS)analyzer. The surface roughness of the coatings was meas-ured by the roughmeter and atomic force microscopy(AFM). The coating thickness was gauged with the measure-ment instrument of thin film thickness. The potentiodynamic(Tafel) polarization (PP), cyclic voltammetry (CV), and EIStechnique were used to measure the corrosion performanceof the TiO2 coating in 3.5 wt. % NaCl corrosion solution,and 0.05 mol L�1 NaOH was added in the solution toenhance the corrosion process.29,30 Meanwhile, the morphol-ogy of the specimen surface after corrosion was observed byFE-SEM, and a corrosion model was proposed to help ana-lyze the corrosion mechanism of the TiO2 coating surface.
Methods of TiO2 Coating Preparation,Characterization, and Tests of CorrosionBehavior
Preparation of TiO2 coatings
Hexafluorotitanate ammonium ((NH4)2TiF6, Shanghai SSSReagent, China) and boric acid (H3BO3, Tianjin KemiouChemical Reagent, China) were dissolved, respectively, indeionized water. (NH4)2TiF6 and H3BO3 solutions weremixed at various compositions and used as the solution fordeposition of the TiO2 coatings. The ASS substrate wasgrinded with different size of SiC abrasive papers and pol-ished with the polishing machine (MINITOR, Japan)smeared with the polishing paste. Then, the substrates weredegreased and washed ultrasonically with acetone and etha-nol. After that, they were rinsed by deionized water. Thetreated substrates were immersed into the deposition solutionfor coating. The temperature of the solution was kept at acertain temperature. After the appropriate reaction time, thesample was taken out from the deposition solution andgently rinsed with deionized water and dried at room tem-perature. These samples were calcined in the resistance fur-nace (KSXQ-6-14, Yixing Feida Electric Resistance Furnace,
1908 DOI 10.1002/aic Published on behalf of the AIChE June 2012 Vol. 58, No. 6 AIChE Journal

China) at various temperatures with fixed heating rate undernitrogen flow.
For the hydrolysis (ligand-exchange) reaction of [TiF6]2�
ion in aqueous solution, the following equilibrium schemehas been proposed by Schmitt et al.31
½TiF6�2� þ nH2O Ð ½TiF6�nðOHÞn�2� þ nHF (1)
H3BO3 was added into the treatment solution as F� scavenger.H3BO3 easily reacts with F� ion and forms more stablecomplex as the following reaction equation.32
H3BO3 þ 4HF Ð HBF4 þ 3H2O (2)
Consequently, titanium dioxide coatings are formed on thesubstrates of [Ti(OH)6]
2� species generated by the hydrolysisreaction of [TiF6]
2�.20,33
Thickness measurement of coatings
The thickness of TiO2 coating was gauged with the filmthickness measuring instrument (SGC-10, Tianjin GangdongScientific and Technical Development, China), which uses anoncontact optical evaluation measurement technology fromthe New Span Opto-Technology.34 It is worth noting that thefilm and the substrate surface should have smaller roughness
and only the transparent or translucent film is available formeasurement of the film parameters. The film thickness andits optical constants (refractive index and extinctioncoefficient) are measured by fitting the interferometryspectrum formed by two beams of the reflected light, thatone is from the outer surface of the film, and the other isfrom the interface between the film and the substrate. Whenthe shape of the measurement curve is similar to that of thefitting curve, the measurement result of the coating thicknessis accurate.
Surface roughness, topography measurementsand chemical element analyses
The surface roughness was measured with the roughmeter(JB-8C, Guangzhou Guangjing Precision Instrument, China).The instrument has a natural diamond skid type stylus withtip radius of 5 � 10�6 m and tip angle of 90�. The styluslinks with free lead head type sensors, which change thevertical displacement of the stylus into an electrical signal.
Figure 1. Three-dimensional AFM image of the TiO2
coating surface.
[Color figure can be viewed in the online issue, which is
available at wileyonlinelibrary.com.]
Figure 2. Effect of the annealing temperature on thecrystalline phases of the TiO2 coatings.
[Color figure can be viewed in the online issue, which is
available at wileyonlinelibrary.com.] Figure 3. Plan view FE-SEM images of the ASS.
AIChE Journal June 2012 Vol. 58, No. 6 Published on behalf of the AIChE DOI 10.1002/aic 1909
The vertical and horizontal displacement signals of the styluscan be obtained and converted to datum graphs. The parame-ters of cut-off wavelength were set to 8 � 10�4 m, scanlength 4.0 � 10�3 m, and scan speed 3.2 � 10�4 m s�1. Toensure the accuracy of the measurement results, no less thanfive different locations of the same sample surface wereselected randomly, and the average of the measurementresults was calculated. The maximum height of profile Rz issum of the height of the largest profile peak and the largestprofile valley depth within one sampling length lr.
35 The ar-ithmetical mean deviation Ra is defined as the arithmeticmean of the ordinate Z(x) absolute value within one lr.
35 Theroot mean square deviation Rq is defined as the root meansquare value of the ordinate Z(x) within one lr.
35
The surface topography of the coating was checked byAFM (D3100M MMAFM/STM, USA). The AFM images
were taken in a tapping mode with a Si3N4 tip. AFM topo-graphic images were recorded over scan areas of 4 � 10�4 m2,each with a resolution of 256 �256 data points, and the scanrate is 0.9766 Hz.
The morphology and the elemental distribution of theTiO2 coatings were analyzed by the FE-SEM (Nanosem 430,FEI, USA) coupled with EDS analyzer.
Confirmations of crystal patterns of TiO2 coatings
The crystallinity of the heat-treated TiO2 thin coatingswas analyzed with XRD (Tokyo Rigaku D/max 2500v/pc,Japan) using CuKa1 (4.0 � 104 V, 0.2 A) radiation and agraphite monochrometer for the diffracted beam. The 2yvalues were scanned from 10 to 90�. The step width was0.02�, and the sample time was 0.15 s.
Electrochemical tests
Three electrochemical analysis methods, PP (Tafelcurves), CV, and EIS measurements were performed using
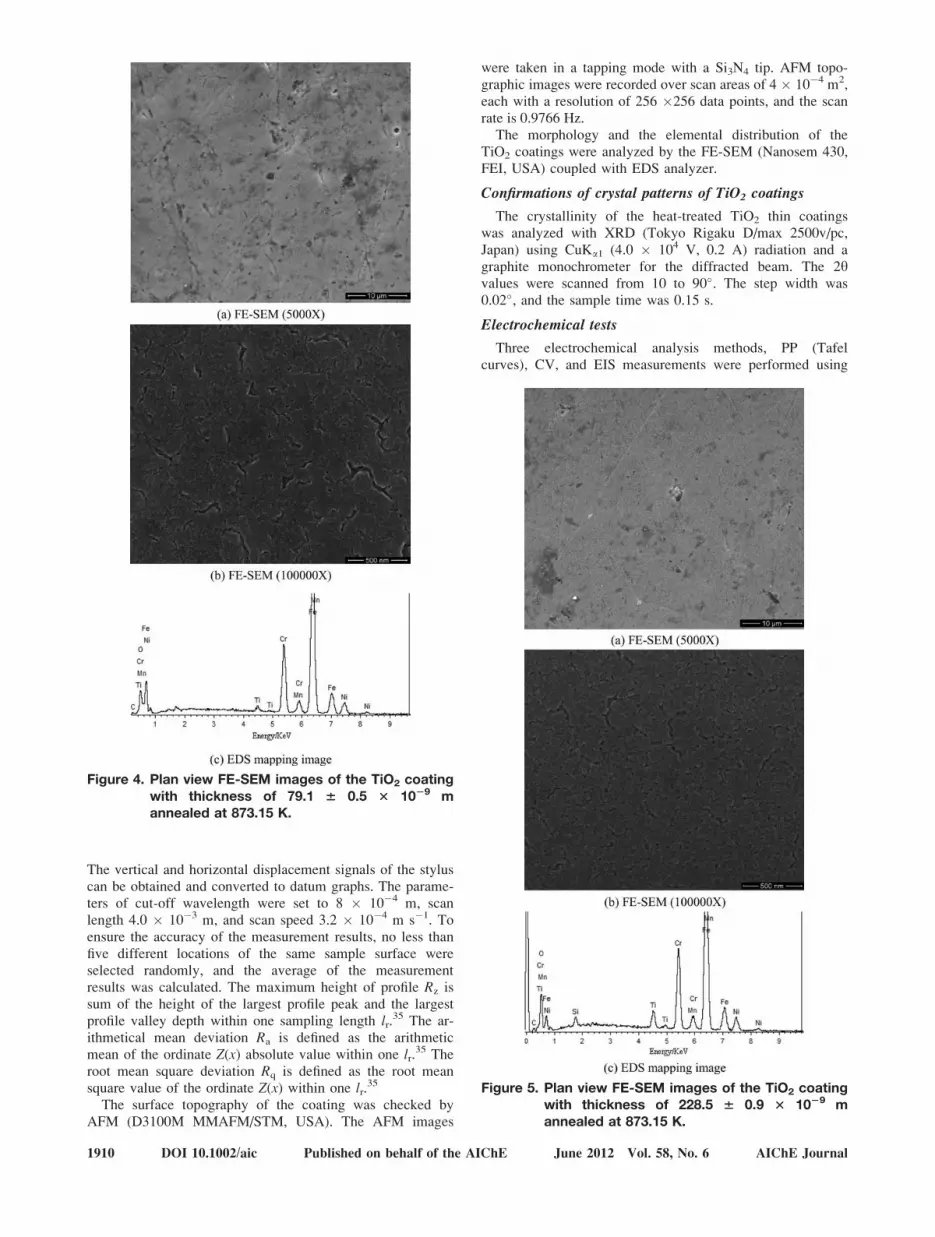
Figure 4. Plan view FE-SEM images of the TiO2 coatingwith thickness of 79.1 6 0.5 3 1029 mannealed at 873.15 K.
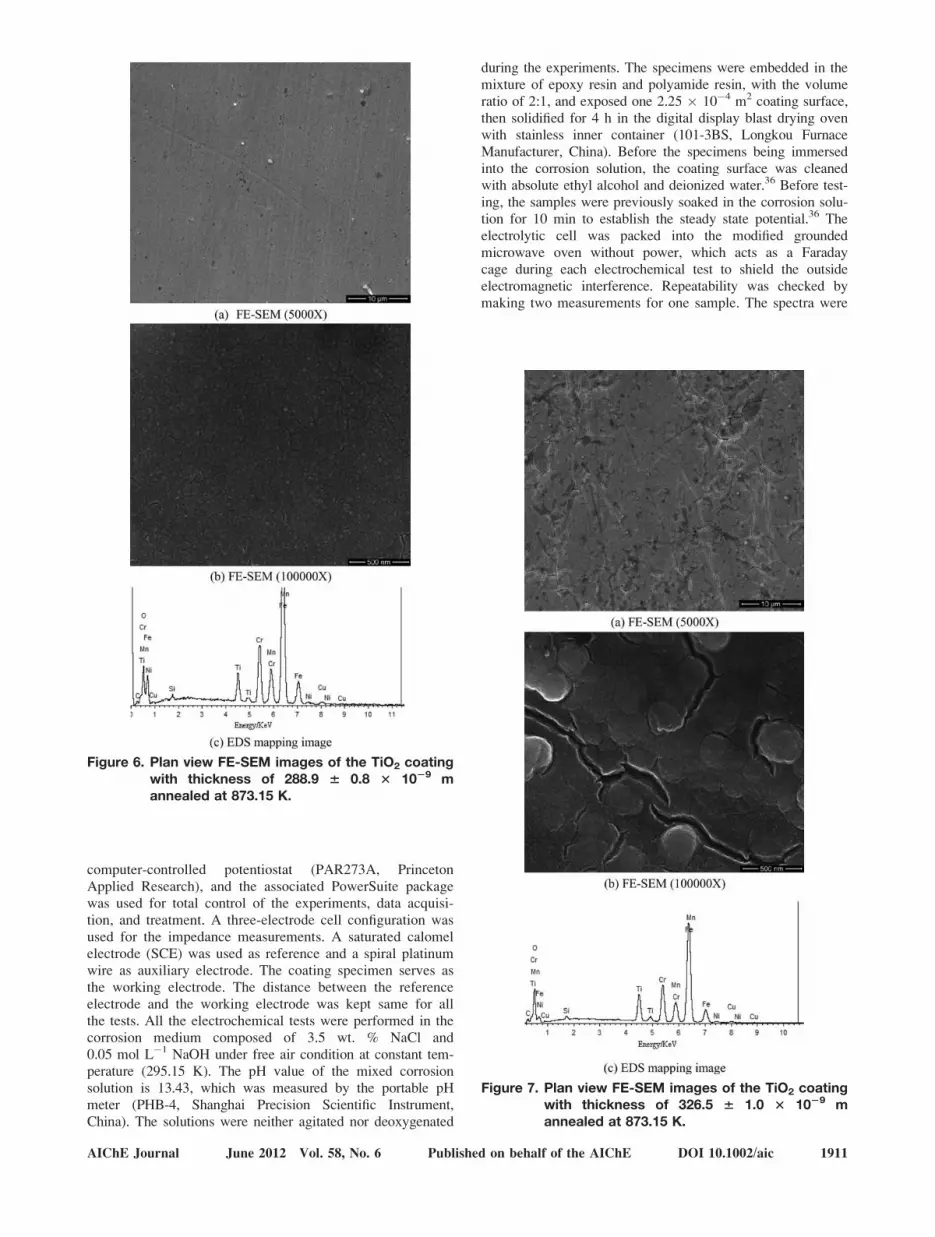
Figure 5. Plan view FE-SEM images of the TiO2 coatingwith thickness of 228.5 6 0.9 3 1029 mannealed at 873.15 K.
1910 DOI 10.1002/aic Published on behalf of the AIChE June 2012 Vol. 58, No. 6 AIChE Journal
computer-controlled potentiostat (PAR273A, PrincetonApplied Research), and the associated PowerSuite packagewas used for total control of the experiments, data acquisi-tion, and treatment. A three-electrode cell configuration wasused for the impedance measurements. A saturated calomelelectrode (SCE) was used as reference and a spiral platinumwire as auxiliary electrode. The coating specimen serves asthe working electrode. The distance between the referenceelectrode and the working electrode was kept same for allthe tests. All the electrochemical tests were performed in thecorrosion medium composed of 3.5 wt. % NaCl and0.05 mol L�1 NaOH under free air condition at constant tem-perature (295.15 K). The pH value of the mixed corrosionsolution is 13.43, which was measured by the portable pHmeter (PHB-4, Shanghai Precision Scientific Instrument,China). The solutions were neither agitated nor deoxygenated
during the experiments. The specimens were embedded in themixture of epoxy resin and polyamide resin, with the volumeratio of 2:1, and exposed one 2.25 � 10�4 m2 coating surface,then solidified for 4 h in the digital display blast drying ovenwith stainless inner container (101-3BS, Longkou FurnaceManufacturer, China). Before the specimens being immersedinto the corrosion solution, the coating surface was cleanedwith absolute ethyl alcohol and deionized water.36 Before test-ing, the samples were previously soaked in the corrosion solu-tion for 10 min to establish the steady state potential.36 Theelectrolytic cell was packed into the modified groundedmicrowave oven without power, which acts as a Faradaycage during each electrochemical test to shield the outsideelectromagnetic interference. Repeatability was checked bymaking two measurements for one sample. The spectra were
Figure 6. Plan view FE-SEM images of the TiO2 coatingwith thickness of 288.9 6 0.8 3 1029 mannealed at 873.15 K.
Figure 7. Plan view FE-SEM images of the TiO2 coatingwith thickness of 326.5 6 1.0 3 1029 mannealed at 873.15 K.
AIChE Journal June 2012 Vol. 58, No. 6 Published on behalf of the AIChE DOI 10.1002/aic 1911

almost identical, it can be concluded that the measuring sys-tems did not change during the electrochemical tests.
Two electrical equivalent circuits (ECs) were introducedto analyze the impedance data. The constant phase element(CPE), Q, was used to replace the capacitance, because ithas hardly pure capacitance in real electrochemical pro-cess.37 The CPE is expressed in the form of admittance as,38
Y xð Þ ¼ Y0 jxð Þn (3)
where j ¼ ffiffiffiffiffiffiffi�1p
. n relates to a non-uniform current distributiondue to surface roughness or inhomogeneity.39 If n ¼ 1, CPE isan idea capacitor. If n ¼ 0, CPE is a resistor.10
The software program, ZSimpWin 3.10, was used to fitthe impedance data with the basis of an EC. The program isbased on nonlinear least squares, which is available to thesimulation of a multivariable function.38
Results and Discussion
Coating characterization
Surface Roughness and Topography of TiO2
Coatings. The untreated surface has a maximum surfaceroughness with Ra of 3.6 � 0.2 � 10�6 m and Rz of 224.7� 2.22 � 10�6 m. However, the surface roughness of thepolished ASS substrate decreased significantly with Ra of 1.9� 0.1 � 10�8 m and Rz of 4.4 � 0.2 � 10�5 m. When the
Figure 8. Determination of Ecorr (vs. SCE) and Icorr by Tafel’s extrapolation method.
(a) 0 h; (b) 24 h; (c) 158 h.
Figure 9. Tafel curves of the TiO2 coating with thick-ness of 228.5 6 0.9 3 1029 m at different cor-rosion time.
[Color figure can be viewed in the online issue, which is
available at wileyonlinelibrary.com.]
Table 1. Different Electrochemical Parameters Obtained byTafel Extrapolation
CorrosionTime (h)
Ecorr
(vs. SCE; V)Icorr
(A m�2)ba
(V dec�1)bc
(V dec�1)Rp
(X m2)
0 �0.183 0.00272 0.237 0.204 17.51924 �0.222 0.0143 0.496 0.252 5.066158 �0.322 0.0212 0.408 0.236 3.061
The data are normalized by apparent surface area.
1912 DOI 10.1002/aic Published on behalf of the AIChE June 2012 Vol. 58, No. 6 AIChE Journal

TiO2 nanoparticles were deposited on the ASS substrate, theroughness is increased (Ra ¼ 3.7 � 0.3 � 10�8 m and Rz ¼7.2 � 0.8 � 10�7 m).
Figure 1 presents a typical surface topography image ofthe TiO2 coatings with three-dimensional AFM measure-ment. The TiO2 coating consists of many particle peaks andvalleys, which distribute randomly on the surface. The val-
ues of Ra, Rq, and Rz are 3.6 � 10�8 m, 4.6 � 10�8 m, and3.7 � 10�7 m, respectively.
Coating Crystal Structure Confirmation. Figure 2 showsthe XRD patterns of coatings calcined at different tempera-tures in nitrogen atmosphere. The amorphous TiO2 wasobtained at temperature of 573.15 K. At 673.15 K, thereflection characteristic peak, 2y, at 25.28� belongs to the(101) face of the anatase-phase crystal according to JCPDSPDF card 21-1272. However, the width of the diffractionpeak shows wider, which indicates the formation of finecrystallites in the coating. From 673.15 to 923.15 K, thepeak intensity of anatase phase increases and the peak widthbecomes narrower, which is due to the coatings graduallycrystallized. Up to 923.15 K, only the anatase-phase TiO2 isfound. All samples display only the largest characteristicpeak of anatase-phase crystal (101 face). It is mainlybecause that the TiO2 coating is very thin and the strengthof other characteristic peaks is very weak and those peaksdo not appear on the figure. The anatase phase is trans-formed into stable rutile-phase TiO2 at 973.15 K (2y ¼27.45�) according to JCPDS PDF card 21-1276. In short, theheat treatment temperature of higher than 573.15 K isrequired to obtain anatase-phase crystalline of the TiO2 coat-ing. The temperature equaling to or higher than 973.15 K isneeded to obtain the thermodynamically stable rutile phaseof the TiO2 coating. The average particle diameter of theTiO2 nanoparticle coatings annealed at 873.15 K is about1.69 � 10�8 m, which was estimated with the Scherrer equa-tion40 from the full width at half maximum (FWHM) of thediffraction peak 2y at 25.28�. Anatase phase has good stabil-ity and corrosion protective characteristic on metal.13
Figure 10. Tafel curves of different samples after thecorrosion time of 158 h.
A-79.1 � 0.5 � 10�9
m; B-134.7 � 0.7 � 10�9
m; C-
228.5 � 0.9 � 10�9
m; D-288.9 � 0.8 � 10�9
m; E-
326.5 � 1.0 � 10�9
m; F-ASS. [Color figure can be
viewed in the online issue, which is available at
wileyonlinelibrary.com.]
Figure 11. Icorr, Rp, and Ecorr (vs. SCE) plots of differentsamples after the corrosion time of 158 h.(a) Icorr and Rp plots; (b) Ecorr (vs. SCE) plot.
[Color figure can be viewed in the online issue, which
is available at wileyonlinelibrary.com.]
Figure 12. CV curves of the ASS and the TiO2 coatingwith thickness of 288.9 6 0.8 3 1029 m.
(a) ASS; (b) TiO2 coating.
AIChE Journal June 2012 Vol. 58, No. 6 Published on behalf of the AIChE DOI 10.1002/aic 1913

Therefore, the TiO2 coating with the anatase phase was cho-sen here as the protective coating layer. The 2y angles at43.58, 44.46, 50.68, 64.38, 74.62, and 81.90� shown in Fig-ure 2 are the characteristic diffraction peaks of the ASS sub-strate.
Morphology and Confirmation of Chemical Elements ofTiO2 Coatings. The morphology of the polished ASS canbe observed with the FE-SEM images, as shown in Figure 3.The surface of the polished ASS substrate is very smoothwith few sandpaper scratches.
The FE-SEM images (Figures 4–6) reveal that the surfacetopography of the TiO2 coating is smooth, crack-free, dense,and uniform. The coating is composed of the accumulationof TiO2 nanoparticles with diameters of several nanometers.The TiO2 coatings are transparent and bright. They appearlight blue, yellow, blue, purple, yellow green, and greenwith the increase of deposition time when observed with thenaked eyes under natural light.
The thickness of TiO2 coating increases when prolongingthe deposition time. However, the coating with larger thick-ness is easily ruptured. Figure 7 shows the TiO2 surfaceexhibits ‘‘muddy cracks’’ structure. This cracked morphologyis due to difference of the thermal expansion coefficientsbetween the TiO2 coatings and the ASS substrate when theywere dried, heated, or cooled in the sintering process.41,42
The EDS mapping images confirm the existence of Tiand O elements in the coatings as shown in Figures 4–7.
Figures 4–7 show that the TiO2 coating surfaces become morecompact, and the content of Ti element increases with theincrease of the deposition time. The mass percentages of Ti(wt. %) are 1.02, 2.93, 4.67, and 6.77%, respectively, and theatom percentages (at. %) are 1.00, 2.67, 4.17, and 5.38%,sequentially. Fe, Cr, Mn, and Ni elements from the ASS sub-strate are also observed because the depth of electron beamirradiation is several microns, which is far greater than thethickness of TiO2 coating in EDS analysis. Trace Al and Sielements in the coating surfaces might come from the polish-ing paste because the polished ASS substrate used for coatingpreparation might not be completely cleaned. The raw materi-als of Al and Si elements are Al2O3 and SiO2 compounds,which are the main components of the polishing paste. Tracelevel of Cu element is also found in Figures 6c and 7c, becausethe wool polishing wheel was also formerly used to polishcopper substrate for other preparation of coatings. The tracecopper might have been left into the wool wheel and thenentered into the micropores of metal substrates.
Electrochemical corrosion characteristics
PP Curves. PP curves were measured with a scan rate of1.0 � 10�3 V s�1 from �1.50 to 0.60 V. To evaluate thecorrosion resistance of the TiO2 coating, the corrosion poten-tial Ecorr (vs. SCE) is directly determined on the figure, andthe corrosion current density Icorr is determined by Tafel’sextrapolation method,43 as shown in Figure 8. Polarizationresistance Rp was obtained from Ecorr (vs. SCE), Icorr, andthe anodic–cathodic Tafel slopes. The value of polarizationresistance Rp was determined from the relationship,3,13,44
Rp ¼ babc2:303Icorr ba þ bcð Þ (4)
Figure 9 shows the scan results of Tafel curves for the TiO2
coating with thickness of 228.5 � 0.9 � 10�9 m at differentcorrosion time. Table 1 lists the electrochemical parametersobtained from the Tafel curves.
Figure 9 shows that the shape of Tafel curves is similar atall corrosion time, which indicates that the corrosion mecha-nism of the coating has no significant change in the corrosionsolution. The results show that Ecorr shifts toward the negativeside from �0.183 to �0.322 V, meanwhile Icorr toward thepositive side from 0.00272 to 0.0212 A m�2 with the increaseof the corrosion time as shown in Table 1. The value of Rp atthe corrosion time of 158 h is about one sixth of that at 0 h.The results above indicate that the corrosion resistance of thecoating deteriorates with the increase of the corrosion time. Itis worth mentioning that the coating retained original lusterand color although it is corroded for 158 h. However, the cor-roded ASS surface becomes dull and loses metallic luster.
The Tafel plots obtained for the TiO2 coatings with differ-ent thickness at the corrosion time of 158 h in corrosion so-lution were also compared with that of the ASS substrate, asshown in Figure 10.
The value of Ecorr (vs. SCE), Icorr, and Rp of the ASS is�0.454 V, 0.161 A m�2, and 0.209 X cm2, respectively. TheEcorr values of all the coatings shift to positive direction, andthe Icorr values migrate simultaneously to the smaller corro-sion current direction compared with those of the ASS. Thepotential curves show that the TiO2 coating inhibits both thecathodic and anodic corrosion processes. It results in thereduction of both the cathodic and anodic current densities
Figure 13. Surface morphology of the pitting corrosionof the ASS substrate in the corrosion media.
(a) �200; (b) �2000.
1914 DOI 10.1002/aic Published on behalf of the AIChE June 2012 Vol. 58, No. 6 AIChE Journal

accompanied by the migration of the corrosion potentialtowards positive values. These results mean that the TiO2
coatings demonstrate better anticorrosion behavior under thecorrosion solution.
Figure 11 shows the corrosion current density, polarizationresistance, and corrosion potential plots of different samplesafter the corrosion time of 158 h. The corrosion current den-sity decreases and the polarization resistance increases withthe increase in the coating thickness until the TiO2 coatingthickness is 288.9 � 0.8 � 10�9 m, as shown in Figure 11a. Itis probably related to eliminating or decreasing defects of theTiO2 nanoparticle coating with the increase of depositiontime. So, increasing thickness of coating will lead to decreas-ing of electron transition and rate of electrochemical reac-tions. The value of Rp decreases sharply when the thicknessof the coating increases to 326.5 � 1.0 � 10�9 m. However,the Rp is still higher than that of the ASS, as shown in Figure11a. According to FE-SEM images as shown in Figure 7, thecoating with thickness of 326.5 � 1.0 � 10�9 m is cracked.These coating crevices might cause localized corrosion sites.3
The densest TiO2 coating with thickness of 288.9 � 0.8 �10�9 m has the most noble Ecorr, the lowest corrosion currentIcorr, and the highest value of Rp. These values are �0.332 Vand 0.017 A m�2, and 3.508 X m2, respectively. Hence, adense and crack-free coating is available to inhibit the reactionof the corrosion process. Figure 11b shows that corrosionpotentials of different coatings vary inconspicuously.
There are two main reasons for the TiO2 nanoparticlecoatings significantly increasing the corrosion resistancecompared with the ASS. First, the dense TiO2 nanoparticlesact as inert physical barriers45 to the pitting corrosion andoptimize the nanostructure of the ASS substrate, hence,improve the corrosion resistance of the coating system.Another reason is that the TiO2 nanoparticles are embeddedin the ASS substrate surface layer to generate the interfacelayer by atomic diffusion in the high-temperature sinteringcondition. When the corrosion electrolyte diffuses to theinterface layer, the TiO2 coating forms many microgalvaniccouples with the ASS substrate that are less noble than theTiO2 particles.28,30 So, the TiO2 coating undergoes strongcathode polarization, which means that any damage or par-tial removal of the coating does not cause an increased gal-vanic corrosion of the ASS substrate.
CV Curves. CV is a potential-controlled ‘‘reversal’’ elec-trochemical experiment. A cyclic potential sweep is imposedon an electrode, and the current response is observed. Analy-sis of the current response can give information about thethermodynamics and kinetics of electron transfer at the elec-trode–solution interface, as well as the kinetics and mecha-nisms of solution chemical reactions initiated by the hetero-geneous electron transfer.46
Figure 12 shows the CV curves of the ASS and the TiO2
coating. Peak-shaped cyclic voltammograms for the ASS andthe TiO2 coating with thickness of 288.9 � 0.8 � 10�9 m
Figure 14. Nyquist and Bode plot of EIS data obtained from the TiO2 coating with thickness of 228.5 6 0.9 3 1029 mat different corrosion time (msd, measured data; cal, simulated data).
[Color figure can be viewed in the online issue, which is available at wileyonlinelibrary.com.]
AIChE Journal June 2012 Vol. 58, No. 6 Published on behalf of the AIChE DOI 10.1002/aic 1915

were recorded for two cycles by sweeping the working elec-trode potential from �1.5 to 0.6 V at a scan rate of 0.05 Vs�1 in the mixed corrosion solution. All electrode potentialsare reported with respect to SCE.
The CV curves for the ASS in the corrosion solution areshown in Figure 12a. The results show that the oxidationpeak at potential Eo, �0.63 V, and reduction peak at poten-tial Er, �1.01 V, are the characteristic peaks of the ASS.This means that the redox reaction on the steel surfaceoccurs during the CV scanning process. However, little cor-rosion occurs in the TiO2/ASS system (Figure 12b). By com-parison with the scan results, it indicates that the TiO2 coat-ing has a preservative effect.
In general, the localized corrosion of the ASS in a sodiumchloride and hydroxide environment is classified in pittingcorrosion, which causes destructive pits in very small surfaceholes due to the extremely localized anodic reaction sites.Figure 13 shows FE-SEM morphology of the pitting corro-sion of the ASS in the mixed corrosion solution. The diame-ter distribution of the corroded pitting holes is from a fewmicrons to tens of microns. Generally, the ignition of pitsoccurs at localized sites on a metal surface defects, whichmay be due to coating failure, mechanical discontinuities, ormicrostructural phase heterogeneities. In corrosion solutioncontaining chlorine Cl� and oxygen molecules (O2), FeCl2aqueous compound is produced, the initial governing reac-tions are as follows,3
Fe Ð Fe2þ þ 2e� (5)
O2 þ 2H2Oþ 4e� Ð 4ðOHÞ� (6)
Fe2þ þ 2Cl� Ð Fe2þCl�2 (7)
Fe2þCl�2 þ 2H2O Ð FeðOHÞ2 þ 2HþCl� (8)
where HþCl� is the free hydrochloric acid that forms at thebottom of the pits. At the same time, hydroxyl ions, OH�, inthe bulk solution diffuse into the pinholes and react with thehydrogen ions.
OH� þ Hþ Ð H2O (9)
Equation 9 promotes the Eq. 8 to the right, which acceleratesformation of the metal hydroxide Fe(OH)2 compound. Thiscompound is unstable and reacts further with oxygen andwater to form the final corrosion product, iron (III) hydroxide.3
Hence,
2FeðOHÞ2 þ 0:5O2 þ H2O Ð 2FeðOHÞ3 (10)
Electrochemical Impedance Spectroscopy. It is wellknown that EIS testing technique is a powerful tool to inves-tigate the corrosion behavior of the coatings without deterio-ration of the coating system. To obtain further informationabout the influence of the corrosion time on the corrosionbehavior of the TiO2 coating, the EIS experiments were car-ried out at the open-circuit potential (OCP) by applying sinu-soidal signal amplitude of �0.010 V. The electrode responsewas analyzed in the frequency range from 105 to 0.01 Hz.
Figure 14 shows the Nyquist and Bode plots of EIS spec-tra for the TiO2 coating with thickness of 228.5 � 0.9 �10�9 m as the corrosion time increases. The electrical ECwith two time constants is used for the corrosion time of 0and 24 h, which is expressed with the circuit descriptioncode (CDC) of R(Q(R(QR))),5,47 as shown in Figure 15a.This EC is generally used to describe the localized corrosionprocess of coated metals. The EC with three time constantsis used for the EIS test of the TiO2 coating with the corro-sion time of 240 h, and the CDC of R(Q(R(QR)(QR)))10,48
is shown in Figure 15b. The EIS measurement results areplotted as scattered points, and the simulation data are dis-played as fine curves, as shown in Figure 14. The simulationresults of the EIS spectra are summarized in Table 2. Goodagreement between the simulated and experimental data, asevident from a comparison of the experimental and simu-lated data, is shown in Figure 16.
One semicircle in the Nyquist plot or one phase angle inthe Bode plot generally indicates one time constant of theEIS spectrum as well as corresponds to one parallel circuitin the EC diagram. The smaller semicircle (Figure 14a to theleft) in the Nyquist plot or the phase angle in the Bode plots(Figure 14b to the right) at high frequency represents thedielectric characteristic of the TiO2 coatings.49 This timeconstant is expressed with the parallel circuit (Qc, Rpore), inthe EC diagram as shown in Figure 15. Rpore dependsstrongly on the conductivity of the electrolyte in the pinholes
Figure 15. ECmodel for the EIS analysis of the TiO2 coat-ing with thickness of 228.5 6 0.9 3 1029 mat different corrosion time.
(a) 0 and 24 h; (b) 240 h.
Table 2. Optimum Fit Parameters of the TiO2 Coating with Thickness of 228.5 6 0.9 3 1029
m at Different Corrosion Time
CorrosionTime (h)
Rs � 104
(X m2)Qc
(X�1 sn m�2) nc
Rpore � 104
(X m2)Qcp
(X�1 sn m�2) ncp
Rcp �104 (X m2)
Qdl
(X�1 sn m�2) ndl
Rct �104 (X m2)
0 4.51 0.0245 0.85 651.1 – – – 0.574 0.51 3.93E424 4.52 0.0838 0.74 632.2 – – – 1.91 0.54 2.92E4240 4.20 0.266 0.61 414.7 1.46 0.91 297.2 4.45 0.41 2.57E4
1916 DOI 10.1002/aic Published on behalf of the AIChE June 2012 Vol. 58, No. 6 AIChE Journal
of the TiO2 coating.50 The schematic diagram of the pinholeand the corrosion model of the ASS substrate are presentedin Figure 17. The semicircle at lower frequency in theNyquist plot is expressed with the parallel subcircuit (Qdl,Rct), which is adopted to describe the charge transfer processat coating/substrate interface at pinholes.49,51 At the corro-sion time of 240 h, the phase angle in the Bode plot at theintermediate frequency might associate with the developmentof the porous corrosion product layer between the interfaceof the ASS substrate and the TiO2 coating. This timeconstant is expressed with the parallels subcircuit (Qcp, Rcp),as shown in Figure 17b.
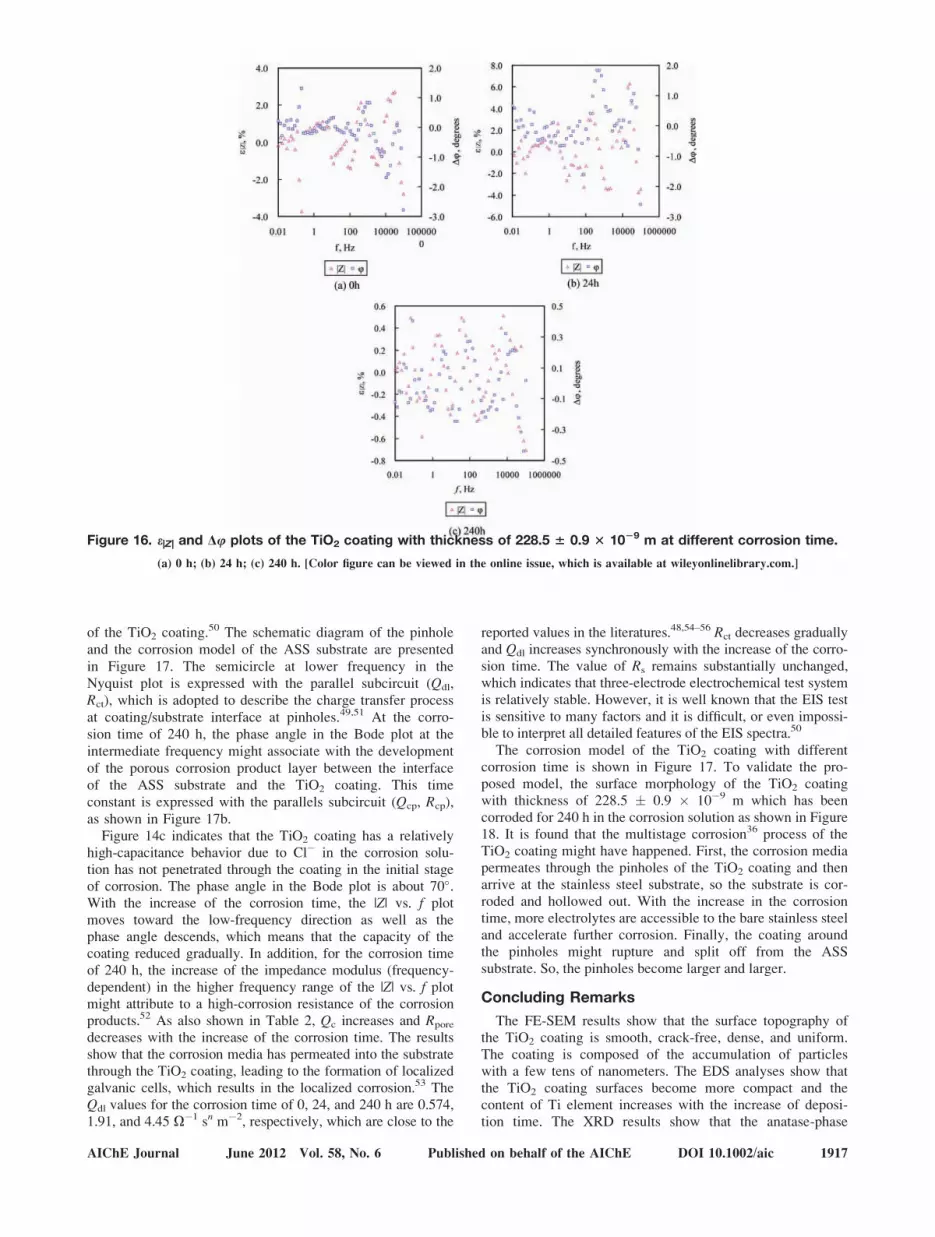
Figure 14c indicates that the TiO2 coating has a relativelyhigh-capacitance behavior due to Cl� in the corrosion solu-tion has not penetrated through the coating in the initial stageof corrosion. The phase angle in the Bode plot is about 70�.With the increase of the corrosion time, the |Z| vs. f plotmoves toward the low-frequency direction as well as thephase angle descends, which means that the capacity of thecoating reduced gradually. In addition, for the corrosion timeof 240 h, the increase of the impedance modulus (frequency-dependent) in the higher frequency range of the |Z| vs. f plotmight attribute to a high-corrosion resistance of the corrosionproducts.52 As also shown in Table 2, Qc increases and Rpore
decreases with the increase of the corrosion time. The resultsshow that the corrosion media has permeated into the substratethrough the TiO2 coating, leading to the formation of localizedgalvanic cells, which results in the localized corrosion.53 TheQdl values for the corrosion time of 0, 24, and 240 h are 0.574,1.91, and 4.45 X�1 sn m�2, respectively, which are close to the
reported values in the literatures.48,54–56 Rct decreases graduallyand Qdl increases synchronously with the increase of the corro-sion time. The value of Rs remains substantially unchanged,which indicates that three-electrode electrochemical test systemis relatively stable. However, it is well known that the EIS testis sensitive to many factors and it is difficult, or even impossi-ble to interpret all detailed features of the EIS spectra.50
The corrosion model of the TiO2 coating with differentcorrosion time is shown in Figure 17. To validate the pro-posed model, the surface morphology of the TiO2 coatingwith thickness of 228.5 � 0.9 � 10�9 m which has beencorroded for 240 h in the corrosion solution as shown in Figure18. It is found that the multistage corrosion36 process of theTiO2 coating might have happened. First, the corrosion mediapermeates through the pinholes of the TiO2 coating and thenarrive at the stainless steel substrate, so the substrate is cor-roded and hollowed out. With the increase in the corrosiontime, more electrolytes are accessible to the bare stainless steeland accelerate further corrosion. Finally, the coating aroundthe pinholes might rupture and split off from the ASSsubstrate. So, the pinholes become larger and larger.
Concluding Remarks
The FE-SEM results show that the surface topography ofthe TiO2 coating is smooth, crack-free, dense, and uniform.The coating is composed of the accumulation of particleswith a few tens of nanometers. The EDS analyses show thatthe TiO2 coating surfaces become more compact and thecontent of Ti element increases with the increase of deposi-tion time. The XRD results show that the anatase-phase
Figure 16. e|Z| and Du plots of the TiO2 coating with thickness of 228.5 6 0.9 3 1029 m at different corrosion time.
(a) 0 h; (b) 24 h; (c) 240 h. [Color figure can be viewed in the online issue, which is available at wileyonlinelibrary.com.]
AIChE Journal June 2012 Vol. 58, No. 6 Published on behalf of the AIChE DOI 10.1002/aic 1917

structure coatings are available when the sintering tempera-ture is between 673.15 and 923.15 K. The peak intensity ofanatase phase increases and the peak width becomes nar-rower with the increase of the calcined temperature.
The PP and two circles of the CV scanning tests both showthat the coatings demonstrate better anticorrosion behaviorcompared with the ASS substrate. The corrosion current den-sity decreases and the polarization resistance increases in PPwith the increase of the coating thickness until the thicknessreaches to 288.9 � 0.8 � 10�9 m. The corrosion resistance ofthe TiO2 coatings deteriorates with the increase of the corro-sion time. The anticorrosion performance of the TiO2 coatingis due to two aspects: first, the dense, compact TiO2 nanopar-ticles act as the inert physical barriers to prohibit the pittingcorrosion and optimize the nanostructure of the ASS sub-strate; second, the TiO2 nanoparticles are embedded in theASS substrate surface layer to generate the interface layer byatomic diffusion in the high-temperature sintering condition.When the corrosion electrolyte diffuses to the interface layer,the TiO2 coating undergoes strong cathode polarization,which means that any damage or partial removal of the coat-ing does not cause an increased galvanic corrosion of theASS substrate.
The EIS tests indicate that the TiO2 coating has a rela-tively high-capacitance behavior in the initial stage of corro-sion process. The capacity of the TiO2 coating has reducedslightly, and the corrosion electrolyte has penetrated to theASS substrate through the pinholes and led to the localizedcorrosion with the increase of the corrosion time. The capac-itance and the resistance of the corrosion product layerbetween the interface of the ASS substrate and the TiO2
coating are found after the corrosion time of 240 h. The sur-face morphology of the TiO2 coating after corrosion bothshow that the multistage corrosion process might have hap-pened. Because the TiO2 nanoparticles coating has a con-spicuous corrosion resistance, further work will focus on theheat transfer and the antifouling performance of the coatingon the ASS in the pool boiling conditions.
Acknowledgments
The authors are grateful to the National Natural Science Foundation ofChina (grant numbers: 20876106) and Tianjin Research Program of Appli-cation Foundation and Advanced Technology (no. 09JCZDJC24100) forthe financial support. The authors also wish to thank Professor JixiaoWang for his kindly help in the electrochemical studies.
Notation
DI ¼ diffraction intensity of X-ray/countsEcorr ¼ corrosion potential, VEo ¼ potential of oxidation peak, VEr ¼ potential of reduction peak, Vf ¼ frequency, Hz
Icorr ¼ corrosion current density, A m�2
lr ¼ sampling length, mn ¼ empirical exponent between 0 and 1
Qc ¼ capacitance at the solution/coating interface, X�1 sn m�2
Qcp ¼ capacitance properties of the corrosion layer, X�1 sn m�2
Qdl ¼ capacitance at the solution/substrate interface, X�1 sn m�2
Ra ¼ arithmetical mean deviation, mRcp ¼ resistance properties of the interface layer, X m2
Rct ¼ charge transfer resistance at the solution/substrate interface,X m2
Rp ¼ polarization resistance, X m2
Rpore ¼ resistance resulted from the coating pores, channels orcracks, X m2
Rq ¼ root mean square deviation, mRs ¼ resistance of the electrolyte between working electrode and
reference electrode, X m2
Rz ¼ the maximum height of profile, m
Figure 18. Surface morphology of the TiO2 coating withthickness of 228.5 6 0.9 3 1029 m after thecorrosion time of 240 h.
Figure 17. The schematic diagram of the pinhole andthe corrosion model of the ASS substrate.
(a) 0 and 24 h; (b) 240 h. [Color figure can be viewed
in the online issue, which is available at wileyonline
library.com.]
1918 DOI 10.1002/aic Published on behalf of the AIChE June 2012 Vol. 58, No. 6 AIChE Journal

Y0 ¼ admittance constantZ ¼ impedance in Nyquist plot, X m2
Zim ¼ imaginary part of impedance of EIS, X m2
Zre ¼ real part of impedance of EIS, X m2
|Z| ¼ modulus of Z, X m2
Greek letters
ba ¼ anodic polarization constant or Tafel anodic slope, V dec�1
bc ¼ cathodic polarization constant or Tafel cathodic slope, Vdec�1
y ¼ Bragg X-ray diffraction angle of the crystal, �u ¼ phase angle in Bode plot, �x ¼ angle frequency, Hze|Z| ¼ relative fitting errors of |Z|, %Du ¼ deviation of u, �
Abbreviations
AFM ¼ atomic force microscopyASS ¼ AISI304 stainless steelCDC ¼ circuit description codeCPE ¼ constant phase elementCV ¼ cyclic voltammetry
CVD ¼ chemical vapor depositionEC ¼ equivalent circuit
EDS ¼ energy-dispersive X-ray spectroscopyEIS ¼ electrochemical impedance spectroscopy
FE-SEM ¼ field emission scanning electron microscopyFWHM ¼ full width at half maximum
LPD ¼ liquid-phase depositionOCP ¼ open-circuit potentialPP ¼ potentiodynamic polarizationRE ¼ reference electrode
SAM ¼ self-assembled monolayerSCE ¼ saturated calomel electrodeWE ¼ working electrode
XRD ¼ X-ray diffraction
Literature Cited
1. Somerscales EFC, Kassemi M. Fouling due to corrosion productsformed on a heat transfer surface. J Heat Trans. 1987;109:267–271.
2. Somerscales EFC. Fundamentals of corrosion fouling. Exp ThermFluid Sci. 1997;14:335–355.
3. Perez N. Electrochemistry and Corrosion Science. Boston: KluwerAcademic Publishers, 2004.
4. Maier B, Frankel GS. Pitting corrosion of bare stainless steel 304under chloride solution droplets. J Electrochem Soc. 2010;157:C302–C312.
5. Padhy N, Kamal S, Chandra R, Kamachi Mudali U, Raj B. Corro-sion performance of TiO2 coated type 304L stainless steel in nitricacid medium. Surf Coat Technol. 2010;204:2782–2788.
6. Glob D, Frach P, Zywitzki O, Modes T, Klinkenberg S, Gottfried C.Photocatalytic titanium dioxide thin films prepared by reactive pulsemagnetron sputtering at low temperature. Surf Coat Technol.2005;200:967–971.
7. Liu MY, Wang H, Wang Y. Enhancing flow boiling and antifoulingwith nanometer titanium dioxide coating surfaces. AIChE J. 2007;53:1075–1085.
8. Wang Y, Wang LL, Liu MY. Antifouling and enhancing pool boil-ing by TiO2 coating surface in nanometer scale thickness. AIChE J.2007;53:3062–3076.
9. Wang LL, Liu MY. Pool boiling fouling and corrosion properties onliquid-phase-deposition TiO2 coatings with copper substrate. AIChEJ. 2011;57:1710–1718.
10. Szalkowska E, Gluszek J, Masalski J, Tylus W. Structure and pro-tective properties of TiO2 coatings obtained using the sol–gel tech-nique. J Mater Sci Lett. 2001;20:495–497.
11. Shen GX, Chen YC, Lin CJ. Corrosion protection of 316 L stainlesssteel by a TiO2 nanoparticle coating prepared by sol–gel method.Thin Solid Films. 2005;489:130–136.
12. Shanaghi A, Sabour Rouhaghdam A, Shahrabi T, Aliofkhazraei M.Study of TiO2 nanoparticle coatings by the sol–gel method for cor-rosion protection. Mater Sci. 2008;44:233–247.
13. Shanaghi A, Sabour AR, Shahrabi T, Aliofkhazraee M. Corrosionprotection of mild steel by applying TiO2 nanoparticle coating viasol–gel method. Prot Met Phys Chem Surf. 2009;45:305–311.
14. Bendavid A, Martin PJ, Preston EW. The effect of pulsed direct cur-rent substrate bias on the properties of titanium dioxide thin filmsdeposited by filtered cathodic vacuum arc deposition. Thin SolidFilms. 2008;517:494–499.
15. Rausch N, Burte EP. Thin TiO2 films prepared by lowpressure chemical vapor deposition. J Electrochem Soc. 1993;140:146–149.
16. Ahn KH, Park YB, Park DW. Kinetic and mechanistic studyon the chemical vapor deposition of titanium dioxide thin filmsby in situ FT-IR using TTIP. Surf Coat Technol. 2002;171:198–204.
17. Masuda Y, Sugiyama T, Lin H, Seo WS, Koumoto K. Selec-tive deposition and micropatterning of titanium dioxide thin filmon self-assembled monolayers. Thin Solid Films. 2001;382:153–157.
18. Zoppi RA, Trasferetti BC, Davanzo CU. Sol–gel titanium dioxidethin films on platinum substrates: preparation and characterization.J Electroanal Chem. 2003;544:47–57.
19. Zeng ZO, Xiao ZW, Zhao GP. Titanium dioxide coating preparedon 304 stainless steel by liquid phase deposition method. J Electro-plating Finishing (China). 2008;27:45–51.
20. Deki S, Aoi Y, Hiroi O, Kajinami A. Titanium (IV) oxide thin filmsprepared from aqueous solution. Chem Lett. 1996;25:433–434.
21. Nagayama H, Honda H, Kawahara H. A new process for silica coat-ing. J Electrochem Soc. 1988;135:2013–2016.
22. Yu JG, Yu HG, Cheng B, Zhao XJ, Yu JC, Ho WK. The effect ofcalcination temperature on the surface microstructure and photocata-lytic activity of TiO2 thin films prepared by liquid phase deposition.J Phys Chem B. 2003;107:13871–13879.
23. Pourmand M, Taghavinia N. TiO2 nanostructured films onmica using liquid phase deposition. Mater Chem Phys. 2008;107:449–455.
24. Herbig B, Lobmann P. TiO2 photocatalysts deposited on fiber sub-strates by liquid phase deposition. J Photochem Photobiol A. 2004;163:359–365.
25. Hu J, Shaokang G, Zhang C, Ren C, Wen C, Zeng Z, Peng L.Corrosion protection of AZ31 magnesium alloy by a TiO2
coating prepared by LPD method. Surf Coat Technol. 2009;203:2017–2020.
26. Yuan JN, Tsujikawa S. Charaterization of sol–gel-derived TiO2 coat-ings and their photoeffects on copper substrates. J Electrochem Soc.1995;142:3444–3450.
27. Ovenstone J, Yanagisawa K. Effect of hydrothermal treatment ofamorphous titania on the phase change from anatase to rutile duringcalcination. Chem Mater. 1999;11:2770–2774.
28. Głuzek J, Masalski J, Furman P, Nitsch K. Structural and electro-chemical examinations of PACVD TiO2 films in Ringer solution.Biomaterials. 1997;18:789–794.
29. Xiao QF. Preparation of TiO2 Films by Electrochemical DepositionMethod and its Anticorrosion Performance Study. Zhengzhou,China: Zhengzhou University, 2007.
30. Baghery P, Farzam M, Mousavi AB, Hosseini M. Ni–TiO2 nano-composite coating with high resistance to corrosion and wear. SurfCoat Technol. 2010;204:3804–3810.
31. Schmitt RH, Grove EL, Brown RD. The equivalent conductance ofthe hexafluorocomplexes of group IV (Si, Ge, Sn, Ti, Zr, Hf). J AmChem Soc. 1960;82:5292–5295.
32. Wamser CA. Equilibria in the system boron trifluoride–water at 25�C. J Am Chem Soc. 1951;73:409–416.
33. Deki S, Aoi Y, Asaoka Y, Kajinami A, Mizuhata M. Monitoring thegrowth of titanium oxide thin films by the liquid-phase depositionmethod with a quartz crystal microbalance. J Mater Chem.1997;7:733–736.
34. http://www.new-span.com/products/optinstr/thinfilm.php.35. International Organization for Standardization. Geometrical product
specifications (GPS)-surface texture: profile method-terms, defini-tions and surface texture parameter, 1997. ISO 4287–1997.
36. Li M, Luo S, Zeng C, Shen J, Lin H, Cao C. Corrosion behavior ofTiN coated type 316 stainless steel in simulated PEMFC environ-ments. Corros Sci. 2004;46:1369–1380.
37. Loveday D, Peterson P, Rodgers B. Evaluation of organic coatingswith electrochemical impedance spectroscopy. Part 3: Protocols fortesting coatings with EIS. J Coat Technol. 2005;2:22–27.
38. Liu C, Bi Q, Leyland A, Matthews A. An electrochemical imped-ance spectroscopy study of the corrosion behavior of PVD coatedsteels in 0.5 N NaCl aqueous solution: Part I. Establishment ofequivalent circuits for EIS data modeling. Corros Sci. 2003;45:1243–1256.
AIChE Journal June 2012 Vol. 58, No. 6 Published on behalf of the AIChE DOI 10.1002/aic 1919

39. Aziz-Kerrzo M, Conroy KG, Fenelon AM, Farrell ST, Breslin CB.Electrochemical studies on the stability and corrosion resistance oftitanium-based implant materials. Biomaterials. 2001;22:1531–1539.
40. Patterson AL. The Scherrer formula for X-ray particle size determi-nation. Phys Rev. 1939;56:978–982.
41. Ma B, Goh GKL, Ma J, White TJ. Growth kinetics and cracking ofliquid-phase-deposited anatase films. J Electrochem Soc. 2007;154:D557–D561.
42. Yamabi S, Imai H. Crystal phase control for titanium dioxide filmsby direct deposition in aqueous solutions. Chem Mater. 2002;14:609–614.
43. Depenyou FJ, Doubla A, Laminsi S, Moussa D, Brisset JL, LeBreton JM. Corrosion resistance of AISI 1018 carbon steel in NaClsolution by plasma–chemical formation of a barrier layer. CorrosSci. 2008;50:1422–1432.
44. Stern M, Geary AL. Electrochemical polarization I. A theoreticalanalysis of the shape of polarization curve. J Electrochem Soc.1957;104:56–63.
45. Chen XH, Chen CS, Xiao HN, Cheng FQ, Zhang G, Yi GJ. Corro-sion behavior of carbon nanotubes–Ni composite coating. Surf CoatTechnol. 2005;191:351–356.
46. Gosser DK. Cyclic voltammetry: simulation and analysis of reactionmechanisms. New York: VCH Publishers, Inc., 1993.
47. Pan J, Thierry D, Leygraf C. Electrochemical impedance spectros-copy study of the passive oxide film on titanium for implant applica-tion. Electrochim Acta. 1996;41:1143–1153.
48. Cheng YL, Zhang Z, Cao FH, Li JF, Zhang JQ, Wang JM, Cao CN.A study of the corrosion of aluminum alloy 2024-T3 under thinelectrolyte layers. Corros Sci. 2004;46:1649–1667.
49. Liu C, Bi Q, Matthews A. EIS comparison on corrosion perform-ance of PVD TiN and CrN coated mild steel in 0.5 N NaCl aqueoussolution. Corros Sci. 2001;43:1953–1961.
50. Pan J, Leygraf C, Jargelius-Pettersson RFA, Linden J. Characteri-zation of high-temperature oxide films on stainless steels byelectrochemical-impedance spectroscopy. Oxid Met. 1998;50:431–455.
51. Loveday D, Peterson P, Rodgers B. Evaluation of organic coatingswith electrochemical impedance spectroscopy. Part 2: Application ofEIS to coatings. J Coat Technol. 2004;1:88–93.
52. Rosborg B, Pan JS. An electrochemical impedance spectroscopystudy of copper in a bentonite/saline groundwater environment.Electrochim Acta. 2008;53:7556–7564.
53. William Grips VK, Barshilia HC, Selvi VE, Kalavati, Rajam KS.Electrochemical behavior of single layer CrN, TiN, TiAlN coatingsand nanolayered TiAlN/CrN multilayer coatings prepared by reac-tive direct current magnetron sputtering. Thin Solid Films.2006;514:204–211.
54. Castro EB, Gervasi CA. Electrodeposited Ni–Co-oxide electrodes:characterization and kinetics of the oxygen evolution reaction. Int JHydrogen Energy. 2000;25:1163–1170.
55. Rahsepar M, Bahrololoom ME. Corrosion study of Ni/Zn composi-tionally modulated multilayer coatings using electrochemical imped-ance spectroscopy. Corros Sci. 2009;51:2537–2543.
56. Lin CH, Duh JG. Electrochemical impedance spectroscopy (EIS)study on corrosion performance of CrAlSiN coated steels in 3.5 wt.% NaCl solution. Surf Coat Technol. 2009;204:784–787.
Manuscript received Dec. 29, 2010, and revision received May 3, 2011.
1920 DOI 10.1002/aic Published on behalf of the AIChE June 2012 Vol. 58, No. 6 AIChE Journal