redox behaviour of ceria–titania mixed oxides
TRANSCRIPT
Applied Catalysis A: General 203 (2000) 335–348
Redox behaviour of ceria–titania mixed oxides
J. Rynkowskia, J. Farbotkoa, R. Touroudeb, L. Hilaireb,∗a Politechnika Lodzka, Instytut Chemi Ogolnej i Ekologicznej, ul. Zwirki 36, Lodz, Poland
b Laboratoire d’Etudes de la Réactivité Catalytique, des Surfaces et Interfaces (LERCSI), UMR 7515 du CNRS, ECPM-Université LouisPasteur, 25 rue Becquerel 67087, Strasbourg Cedex 02, France
Received 27 September 1999; received in revised form 24 February 2000; accepted 25 February 2000
Abstract
The reducibility of the supports is one of the properties influencing the catalytic behaviour of platinum catalysts in theselective hydrogenation ofa,b-unsaturated aldehydes. Platinum on reducible supports has shown higher selectivities incarbonyl hydrogenation compared to Pt/Al2O3 and Pt/SiO2 catalysts. We report here a study on the redox properties ofmixtures of titania and ceria, precursors of Pt/TiO2–CeO2 catalysts. Two samples, with atomic compositions Ti/Ce 8/2and 5/5, were prepared using a sol–gel process. They were treated under hydrogen and air in a wide range of temperatures.Surface compositions and the percentage of reduced ceria were determined by X-ray photoelectron spectroscopy. Temperatureprogrammed reduction (TPR) profiles, and X-ray diffraction patterns were interpreted in terms of the formation and stabilityof several mixed compounds. © 2000 Elsevier Science B.V. All rights reserved.
Keywords:Titania; Ceria; Mixed oxides; X-ray photoelectron spectroscopy; X-ray diffraction; Temperature programmed reduction
1. Introduction
The interaction of transition metals with various ox-ides has been studied for many years, especially for itsrelevance to heterogeneous catalysis. While an oxidelike alumina exhibits little interaction with palladium,platinum or rhodium (but not nickel, cobalt,. . . ), itwas shown about 20 years ago [1] that on titania un-der specific conditions of reduction, chemisorption ofhydrogen or carbon monoxide could be strongly in-hibited. Ceria has also largely been studied in that re-spect but it seems to interact differently with transitionmetals [2].
Mixing two different oxides adds another parametersince they are liable to form stable compounds, whichmay lead to a different catalytic behaviour. For ex-
∗ Corresponding author.
ample particular structures were found when studyingmixtures of ceria and zirconia [3]. It was also shownthat ceria and alumina, important supports in the auto-motive depollution catalysis, can easily form inactivecerium aluminate CeAlO3 after calcination and reduc-tion at moderate temperatures [4,5]. In previous stud-ies [6,7], we have shown that such compounds couldalso be formed when mixing ceria and titania, using asol–gel process at room temperature and pH basic con-ditions. From X-ray diffraction (XRD) studies it wassupposed that CeTiO3 was formed. X-ray photoelec-tron spectra confirmed the existence of Ce3+ species,stable under air up to 400◦C and, therefore, not due toCe2O3 or CeO2−x but very little Ti3+ was evidenced,which was very puzzling. The addition of platinumseemed to favour the formation of mixed compounds[6]. Such systems were active catalysts for the skeletalrearrangements of saturated hydrocarbons [8].
0926-860X/00/$ – see front matter © 2000 Elsevier Science B.V. All rights reserved.PII: S0926-860X(00)00497-X
336 J. Rynkowski et al. / Applied Catalysis A: General 203 (2000) 335–348
It has been known for a long time that mixing ceriaand titania at high temperatures under various condi-tions can lead to a wealth of mixed compounds [9–11].For example, Preuss and Gruehn [11] published thepreparation and XRD studies of mixed oxides ofceria and titania which they identified as Ce2TiO5,Ce2Ti2O7 and Ce4Ti9O24. In all three oxides, ceriumis in the +3 oxidation state while titanium is in the+4.
In this paper we report on temperature programmedreduction and oxidation (TPR–TPO), XRD and X-rayphotoelectron spectroscopy (XPS) studies of ceria andtitania mixed oxides prepared by a sol–gel processand treated under hydrogen and air in a wide rangeof temperatures. A subsequent paper will be devotedto the influence of the addition of a transition metal(platinum) and to the catalytic properties of suchsystems.
2. Experimental
2.1. Preparation
To the ethanolic solution of cerium nitrate, titaniumisopropoxide was added dropwise while stirring vig-orously. Appropriate quantities of the reagents werechosen so that two different supports were preparedwith atomic ratios Ti/Ce 8/2 and 5/5, respectively. Assoon as the alkoxide was added the solution becameyellow and slightly opalescent. An aqueous solutionof ammonia was then added dropwise until pH=9 wasreached. During ammonia addition an intensive pre-cipitation occurred. The precipitate was placed on ahot plate and the solvent was evaporated under agi-tation at ca. 80◦C. The supports were dried at 105◦Cfor 8 h and then calcined in a stream of air at varioustemperatures for 4 h.
Due to their atomic compositions the samples willbe hereafter referred to as TiO2–CeO2 8/2 and 5/5,respectively.
2.2. Temperature programmed reduction andoxidation
All TPR profiles were obtained on an Altamira ap-paratus using an Ar–H2 mixture (10 vol.% H2) and a
flow rate of 50 cm3/min. The temperature increase was20◦C/min. Temperature programmed oxidations wereperformed with pure oxygen under the same experi-mental conditions.
2.3. X-ray diffraction
XRD measurements were carried out in a SiemensD 5000 polycrystalline diffractometer using Cu Karadiation (λ=0.15406 nm). To obtain the highest ac-curacy in the measurements of the reflections a highquality scanning (counting rate 10 s per step, step scanmode with the small step size. 0.02◦ 22, 22 range24–81◦) was employed.
2.4. X-ray photoelectron spectroscopy
XPS experiments were performed in a VG ESCAIII apparatus. We used the Mg Ka radiation with theTiO2–CeO2 5/5 oxide but we switched to the Al Kaanode when dealing with the other sample, less con-centrated in cerium, in order to avoid overlapping ofthe first Ce 3d peak with the broad TiL2M2,3M2,3Auger peak. The samples, pressed into pellets, wereattached to a nickel sample holder.
Unless otherwise specified, reductions under hydro-gen and low temperature calcinations (<500◦C) wereperformed at atmospheric pressure in a chamber di-rectly connected to the analysis chamber of the spec-trometer. High temperature treatments were performedin a different apparatus.
When recording the spectra, particular attentionwas paid to a possible apparent reduction of the Cespecies under the X-ray beam [6,12,13]. For thisreason the energy of the anode was limited to lessthan 100 W, in order to decrease the X-ray flux im-pinging onto the sample and one quick spectrumwas recorded before and after accumulating on theCe 3d transitions. Under such conditions we neverobserved any evolution in the shape of the spec-tra.
The binding energies were referred to the C 1s peakat 284.8 eV. Relative surface compositions were cal-culated from the photoelectron peak areas after cor-rection from the photoionisation cross-sections [14]and differences in escape depths, using a square rootapproximation.

J. Rynkowski et al. / Applied Catalysis A: General 203 (2000) 335–348 337
3. Results and interpretation
3.1. TiO2–CeO2 8/2
3.1.1. Temperature programmed reduction andoxidation
Fig. 1 shows the various TPR–TPO profiles ob-tained with the TiO2-rich oxide mixture. The samplewas first calcined at 400◦C under air and then a TPRexperiment was performed (Fig. 1a). A hydrogen con-sumption peak starting at 400◦C with a maximum at530◦C was observed. Reduction was carried out up to900◦C and no further peak was detected except a tailfollowing the main peak, between 600 and 800◦C.
The sample was then calcined at 300◦C and anotherTPR experiment was performed (Fig. 1b). No hydro-gen consumption was detected, even when the tem-perature was raised up to 900◦C.
Another calcination, at 500◦C, was then performed.Fig. 1c shows the TPR profile obtained after such atreatment. A small, very broad peak was observed be-tween 800 and 900◦C.
Fig. 1. TPR profile of TiO2–CeO2 8/2.
Again the sample was calcined at a higher temper-ature (700◦C) and a subsequent TPR profile revealeda peak at 700◦C (Fig. 1d).
A last calcination at 900◦C led to two TPR peaks(Fig. 1e), at 700 and 900◦C.
3.1.2. X-ray photoelectron spectroscopyXPS analyses were performed to get a better un-
derstanding of what was going on in the TPR exper-iments. The conditions of calcination and reductionwere, therefore, chosen accordingly.
Ce 3d spectra are very complicated and since thefirst really well resolved peaks published by Burroughset al. [15] a lot of efforts have been devoted to their in-terpretation, both qualitative and quantitative [16–18].The assignment of the various structures is given inFig. 2. Structures v, v′′ and v′′′ can be attributed toCeO2; hybridisation between the O 2p level and theCe 4f screening level results in v and v′′ which are amixture of (5d 6s)0 4f2 O 2p4 and (5d 6s)0 4f1 O 2p5
configurations while v′′′ is a pure (5d 6s)0 4f0 O 2p6

338 J. Rynkowski et al. / Applied Catalysis A: General 203 (2000) 335–348
Fig. 2. XPS spectrum in the Ce 3d region, example of fit.
final state. Structures v0 and v′ are due to a mixtureof (5d 6s)0 4f2 O 2p4 and (5d 6s)0 4f1 O 2p5 config-urations in Ce2O3; u structures, due to the Ce 3d 3/2levels, can be explained in the same way. Practicallya progressive reduction of Ce4+ into Ce3+ oxidationstate will result in the decrease in the structures due to4f0 (v′′′ and u′′′) and an increase in v′ and u′ at the ex-pense of v′′ and u′′; v0 and u0 will be very difficult toresolve from v and u because their energy separationis small. It has been shown [17] that measuring the de-crease in u′′′, which is purely Ce4+ and well separatedfrom the other peaks, leads to erroneous quantitativeresults and, therefore, a complete curve fitting analy-sis of the whole Ce 3d spectrum has been developedin our laboratory [18]. We give in Fig. 2 an exampleof such an analysis. As stated in a previous study [18],the accuracy of such an analysis can be estimated toabout±5%.
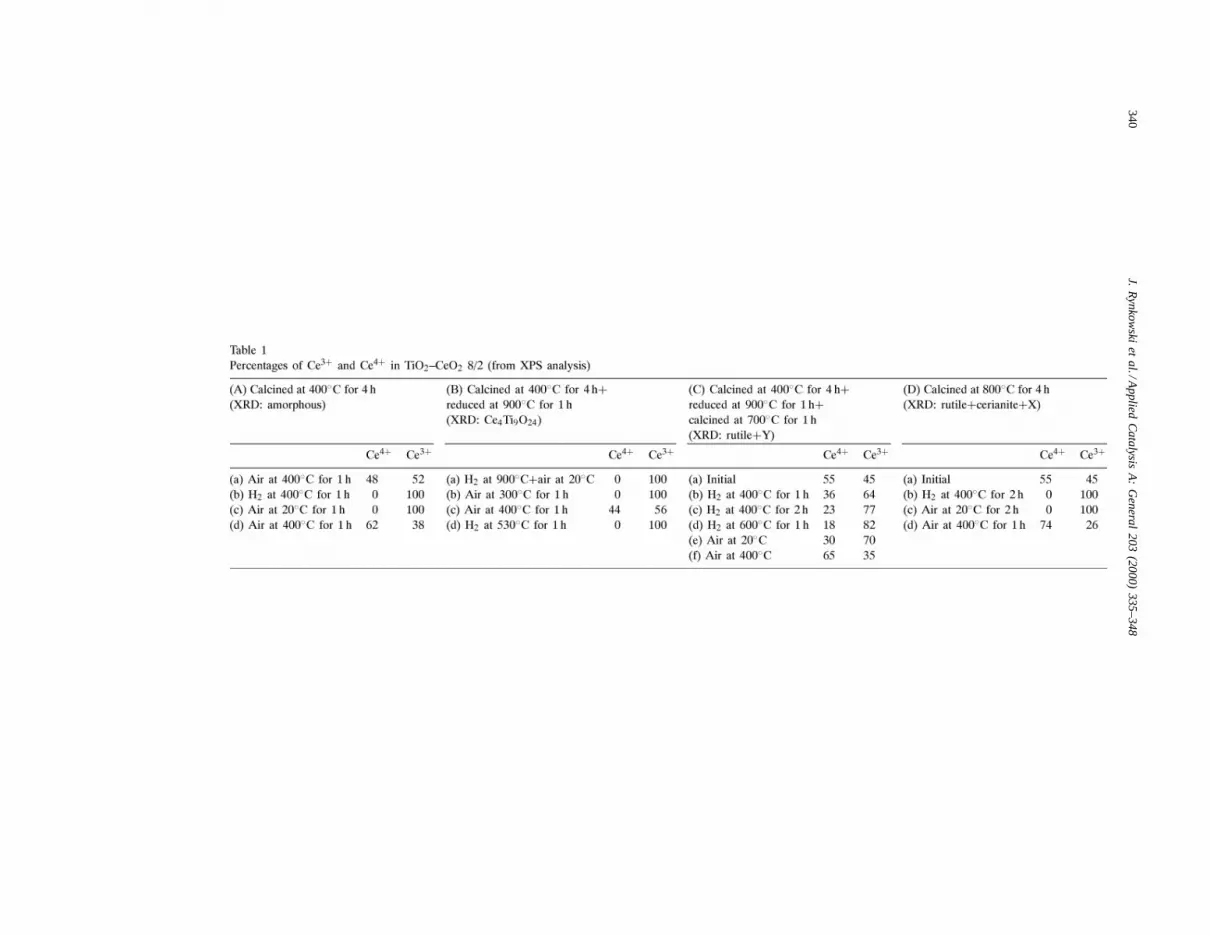
In a first series of experiments we studied a samplecalcined at 400◦C which we calcined again at the sametemperature in the XPS apparatus to get rid of wateror other impurities which might have contaminatedthe surface. The raw spectrum is shown in Fig. 3a.It exhibits features characteristic of Ce4+ and Ce3+species in approximately equal amounts. The result ofthe quantitative analysis is given in Table 1(A, a). Itmeans that the sol–gel preparation, followed by a cal-cination at 400◦C, leads to the involvement of abouthalf of the cerium in a mixed oxide in which the oxi-dation degree of cerium is+3.
A reduction under hydrogen at 400◦C was then per-formed. The temperature was chosen because it coin-
cides with the beginning of the peak observed in TPR(Fig. 1a). It resulted in the complete transformationof Ce4+ into Ce3+ (Fig. 3b). This can be interpretedin two ways: (i) either the remaining CeO2 which didnot take part in the mixed compound has been reducedinto Ce2O3, (ii) or some more mixed oxide was formedduring the reduction. To check this point air was ad-mitted in the apparatus at room temperature. It is wellknown that Ce2O3 is not stable even under such mildconditions. Another spectrum was recorded (Fig. 3c),which looked very much the same as that of Fig. 3b.However, further treatment under air at 400◦C led toa spectrum (Fig. 3d) very similar to that of Fig. 3a butslightly more oxidised (62% of Ce4+ instead of 48%as shown in Table 1(A)). These results show that twodifferent mixed compounds were formed, one whichis stable under air at 400◦C and one formed during thereduction, which is stable under air at room tempera-ture but unstable at 400◦C. However, the higher Ce4+content after the second calcination suggests that someof the first mixed compound has been transformed intothe second one during the reduction. In neither casewere the Ti 2p spectra modified, which means that Tiremained in the+4 oxidation state.
One may then wonder why in Fig. 1b no hydrogenconsumption was observed since after the first TPRthe sample was calcined at 300◦C. Perhaps this tem-perature was too low for the decomposition of thesecond mixed oxide to occur. However, this may alsobe the result of the high reduction temperature reachedat the end of the TPR experiments (900◦C). To checkthis point we reduced another sample at 900◦C (in a

J. Rynkowski et al. / Applied Catalysis A: General 203 (2000) 335–348 339
Fig. 3. XPS spectra in the Ce 3d region for TiO2–CeO2 8/2 after different treatments.
separate apparatus), we calcined it at 300◦C and weobtained an XPS spectrum (not shown) identical tospectrum b and c of Fig. 3, that is no Ce4+(Table 1(B,a and b)). The same experiment performed on yet an-other sample, also reduced at 900◦C but calcined af-terwards at 400◦C gave the spectrum of Fig. 2, whichwe chose as an example of curve fitting analysis,where 56% of cerium was in the+3 oxidation state(Table 1(B, c)), very similar to the initial situation,
that of Fig. 3a. These experiments show that our firsthypothesis was correct, that is the second mixed oxideformed during the reduction treatment is stable up to atemperature lower than 400◦C but higher than 300◦C.
In another set of experiments (in a different ap-paratus) the sample was calcined at 400◦C, reducedunder hydrogen at 900◦C and then calcined again at700◦C, in order to reproduce the same situation as atthe beginning of the fourth TPR experiment (Fig. 1d).
340J.
Ryn
kow
skie
ta
l./Ap
plie
dC
ata
lysisA
:G
en
era
l2
03
(20
00
)3
35
–3
48

J. Rynkowski et al. / Applied Catalysis A: General 203 (2000) 335–348 341
For brevity’s sake the resulting XPS spectra of thisseries of experiments are not shown but the resultsof the quantitative analysis are given in Table 1(C).The amount of Ce3+ species was quite high althoughslightly lower than after calcination at 400◦C. Re-duction under hydrogen at 400◦C did increase thepercentage of Ce3+ but much less than in Fig. 3 andTable 1(A, b). Even after reduction at higher a tem-perature (600◦C) 18% of Ce4+ were still present onthe surface. These results are consistent with the hy-drogen consumption peak observed in Fig. 1d. Theyclearly show that calcination at 700◦C leads to alesser tendency to form a mixed compound.
Mixed oxides formed after calcination at highertemperatures seemed to be less stable than those de-tected after calcination at 400◦C. The XPS spectrumrecorded on a sample previously calcined at 800◦C(Table 1(D, a)) exhibited a proportion of cerium+3 and +4 similar to those of Table 1(A, a andC, a). Reduction under hydrogen at 400◦C led to acomplete disappearance of Ce4+ as in Fig. 3b (andTable 1(A, b)). Air admission at room temperaturedid not change the surface composition, which provesthat the reduction did not result in the formation ofCeO2−x species but rather in a more stable com-
Fig. 4. XRD spectra for TiO2–CeO2 8/2 after different treatments.
pound. However, air at 400◦C resulted in a surfacevery poor in Ce3+. Here again, as in the experimentsof Fig. 3, the reduction seemed to favour a partialdecomposition of the mixed oxide when the samplewas subsequently treated under air at 400◦C (compareTable 1(D, a and d)).
3.1.3. X-ray diffractionXRD studies were performed on the same sample
after calcination at various temperatures. Before calci-nation and after calcination at 200 and 400◦C the spec-trum exhibited two very broad peaks due to amorphouscompounds (Fig. 4). Calcination at 600◦C resulted insome crystallisation of the sample and at 800◦C thespectrum exhibited a well defined pattern with severalnarrow peaks. The presence of rutile could be clearlyidentified together with some cerianite. New, well de-fined lines, were also evidenced but they could be at-tributed to none of the many mixed oxides publishedin the literature. A similar pattern was observed whenwe analysed the sample calcined at 800◦C and reducedat 400◦C in the XPS apparatus but cerianite (CeO2)has disappeared. This is consistent with XPS spectrawhich showed that all the cerium was in the+3 oxi-dation state (Table 1(D, b and c)).
342 J. Rynkowski et al. / Applied Catalysis A: General 203 (2000) 335–348
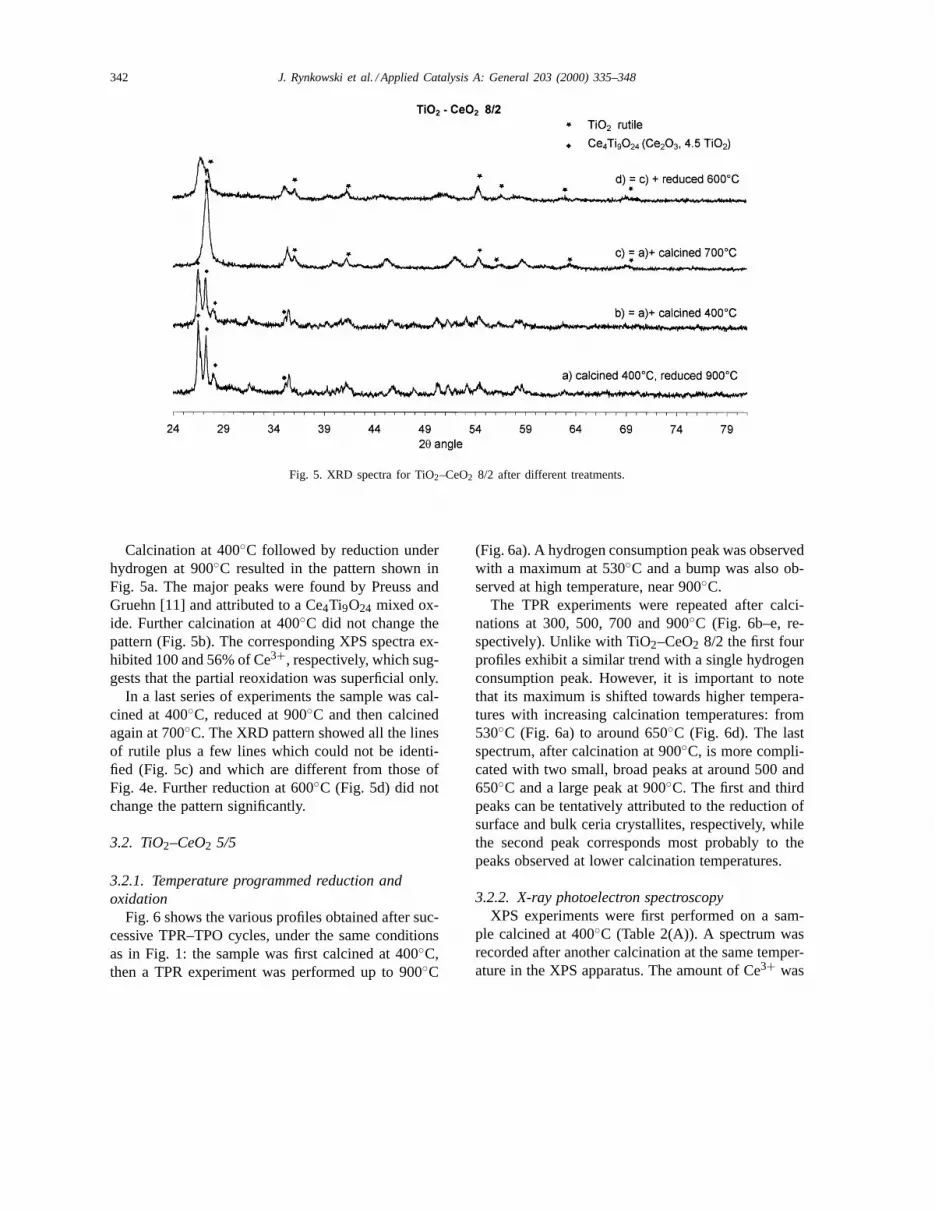
Fig. 5. XRD spectra for TiO2–CeO2 8/2 after different treatments.
Calcination at 400◦C followed by reduction underhydrogen at 900◦C resulted in the pattern shown inFig. 5a. The major peaks were found by Preuss andGruehn [11] and attributed to a Ce4Ti9O24 mixed ox-ide. Further calcination at 400◦C did not change thepattern (Fig. 5b). The corresponding XPS spectra ex-hibited 100 and 56% of Ce3+, respectively, which sug-gests that the partial reoxidation was superficial only.
In a last series of experiments the sample was cal-cined at 400◦C, reduced at 900◦C and then calcinedagain at 700◦C. The XRD pattern showed all the linesof rutile plus a few lines which could not be identi-fied (Fig. 5c) and which are different from those ofFig. 4e. Further reduction at 600◦C (Fig. 5d) did notchange the pattern significantly.
3.2. TiO2–CeO2 5/5
3.2.1. Temperature programmed reduction andoxidation
Fig. 6 shows the various profiles obtained after suc-cessive TPR–TPO cycles, under the same conditionsas in Fig. 1: the sample was first calcined at 400◦C,then a TPR experiment was performed up to 900◦C
(Fig. 6a). A hydrogen consumption peak was observedwith a maximum at 530◦C and a bump was also ob-served at high temperature, near 900◦C.
The TPR experiments were repeated after calci-nations at 300, 500, 700 and 900◦C (Fig. 6b–e, re-spectively). Unlike with TiO2–CeO2 8/2 the first fourprofiles exhibit a similar trend with a single hydrogenconsumption peak. However, it is important to notethat its maximum is shifted towards higher tempera-tures with increasing calcination temperatures: from530◦C (Fig. 6a) to around 650◦C (Fig. 6d). The lastspectrum, after calcination at 900◦C, is more compli-cated with two small, broad peaks at around 500 and650◦C and a large peak at 900◦C. The first and thirdpeaks can be tentatively attributed to the reduction ofsurface and bulk ceria crystallites, respectively, whilethe second peak corresponds most probably to thepeaks observed at lower calcination temperatures.
3.2.2. X-ray photoelectron spectroscopyXPS experiments were first performed on a sam-
ple calcined at 400◦C (Table 2(A)). A spectrum wasrecorded after another calcination at the same temper-ature in the XPS apparatus. The amount of Ce3+ was

J. Rynkowski et al. / Applied Catalysis A: General 203 (2000) 335–348 343
Fig. 6. TPR profile of TiO2–CeO2 5/5.
very low (Table 2(A, a)). It increased after reductionunder hydrogen at 400 and 530◦C but even in the lat-ter case, Ce3+ species were less abundant than in theprevious case. Air at room temperature did modify thesurface towards higher Ce4+ content, which means
Table 2Percentages of Ce3+ and Ce4+ in TiO2–CeO2 5/5 (from XPS analysis)
(A) Calcined at 400◦C for 4 h(XRD: cerianite)
(B) Calcined at 400◦C for 4 h+reducedat 900◦C for 1 h (XRD: Ti2Ce2O7)
(C) Calcined at 800◦C for 4 h(XRD: cerianite+X)
Ce4+ Ce3+ Ce4+ Ce3+ Ce4+ Ce3+
(a) Air at 400◦C for 1 h 71 29 (a) Air at 20◦C 33 67 (a) Initial 75 25(b) H2 at 400◦C for 1 h 42 58 (b) Air at 300◦C for 1 h 82 18 (b) H2 at 400◦C for 2 h 67 33(c) H2 at 530◦C for 2 h 32 68 (c) Air at 400◦C for 1 h 85 15 (c) H2 at 530◦C for 2 h 44 56(d) Air at 20◦C for 0.5 h 53 47 (d) H2 at 530◦C for 1 h 41 59 (d) H2 at 700◦C for 2 h 30 70(e) Air at 400◦C for 1 h 82 18 (e) Air at 20◦C for 3 h 55 45
(f) Air at 400◦C for 2 h 85 15
that both CeO2 crystallites had been reduced and amixed compound was formed but the latter was notvery stable since it decomposed under calcination at400◦C (Table 2(A, e)). Reduction at 900◦C followedby calcination at 400◦C (Table 2(B, c)) and another
344 J. Rynkowski et al. / Applied Catalysis A: General 203 (2000) 335–348
reduction at 530◦C gave results quite close to what wasobserved before high temperature reduction (compareTable 2(A and B)).
These results show that initially, just after calcina-tion at 400◦C, little mixed compound is formed. Re-duction under hydrogen results in an increase in thepercentage of mixed compound but it is destroyed afterfurther calcination at 400◦C (XPS) and even at 300◦Csince in TPR–TPO experiments a hydrogen consump-tion peak was observed after reoxidation at 300◦C(Fig. 6 and Table 2(B, b)).
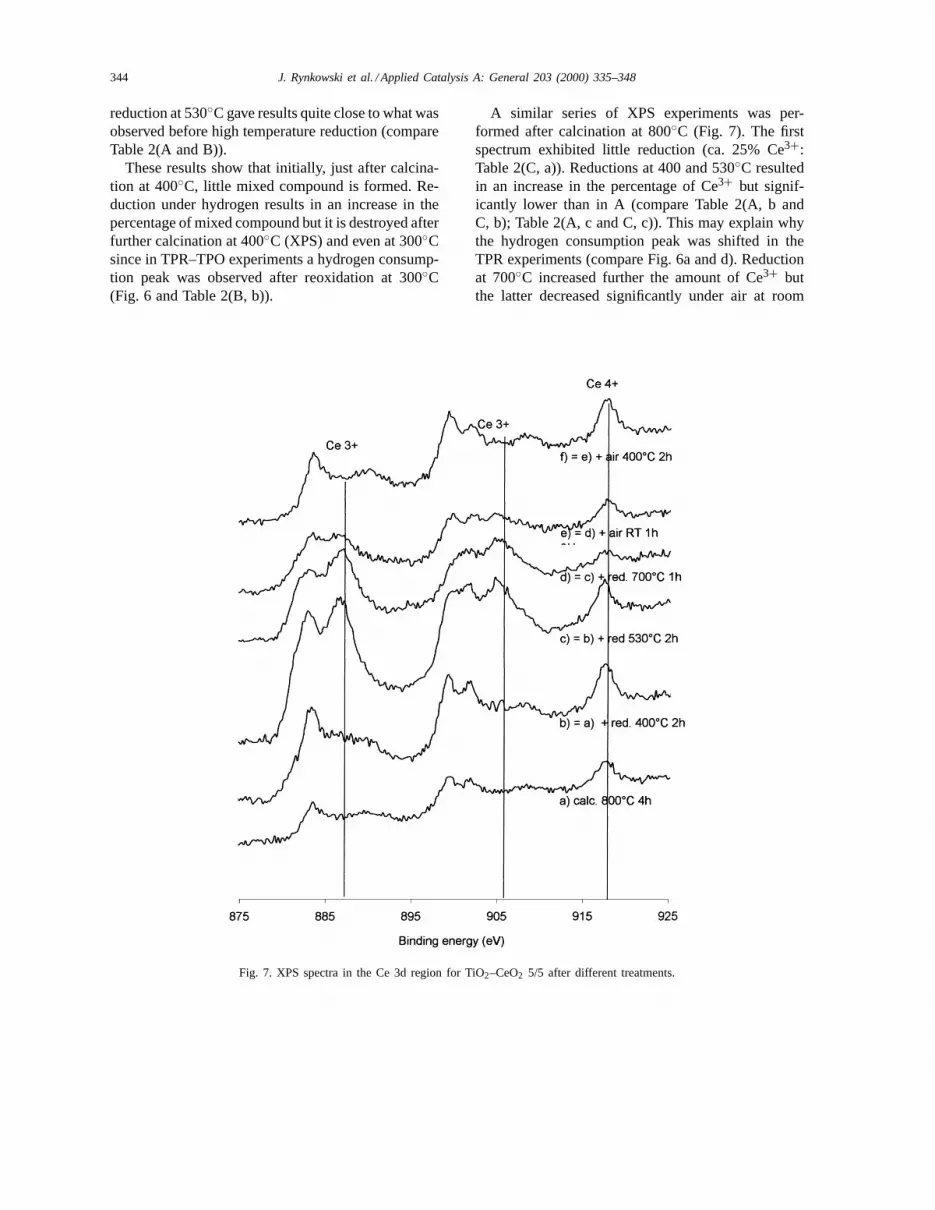
Fig. 7. XPS spectra in the Ce 3d region for TiO2–CeO2 5/5 after different treatments.
A similar series of XPS experiments was per-formed after calcination at 800◦C (Fig. 7). The firstspectrum exhibited little reduction (ca. 25% Ce3+:Table 2(C, a)). Reductions at 400 and 530◦C resultedin an increase in the percentage of Ce3+ but signif-icantly lower than in A (compare Table 2(A, b andC, b); Table 2(A, c and C, c)). This may explain whythe hydrogen consumption peak was shifted in theTPR experiments (compare Fig. 6a and d). Reductionat 700◦C increased further the amount of Ce3+ butthe latter decreased significantly under air at room
J. Rynkowski et al. / Applied Catalysis A: General 203 (2000) 335–348 345
temperature, which means that some of the Ce3+was not due to the formation of a mixed compound,but due to some reduction of CeO2 crystallites. Cal-cination at 400◦C (Table 2(C, f)) resulted in strongreoxidation of Ce3+ species.
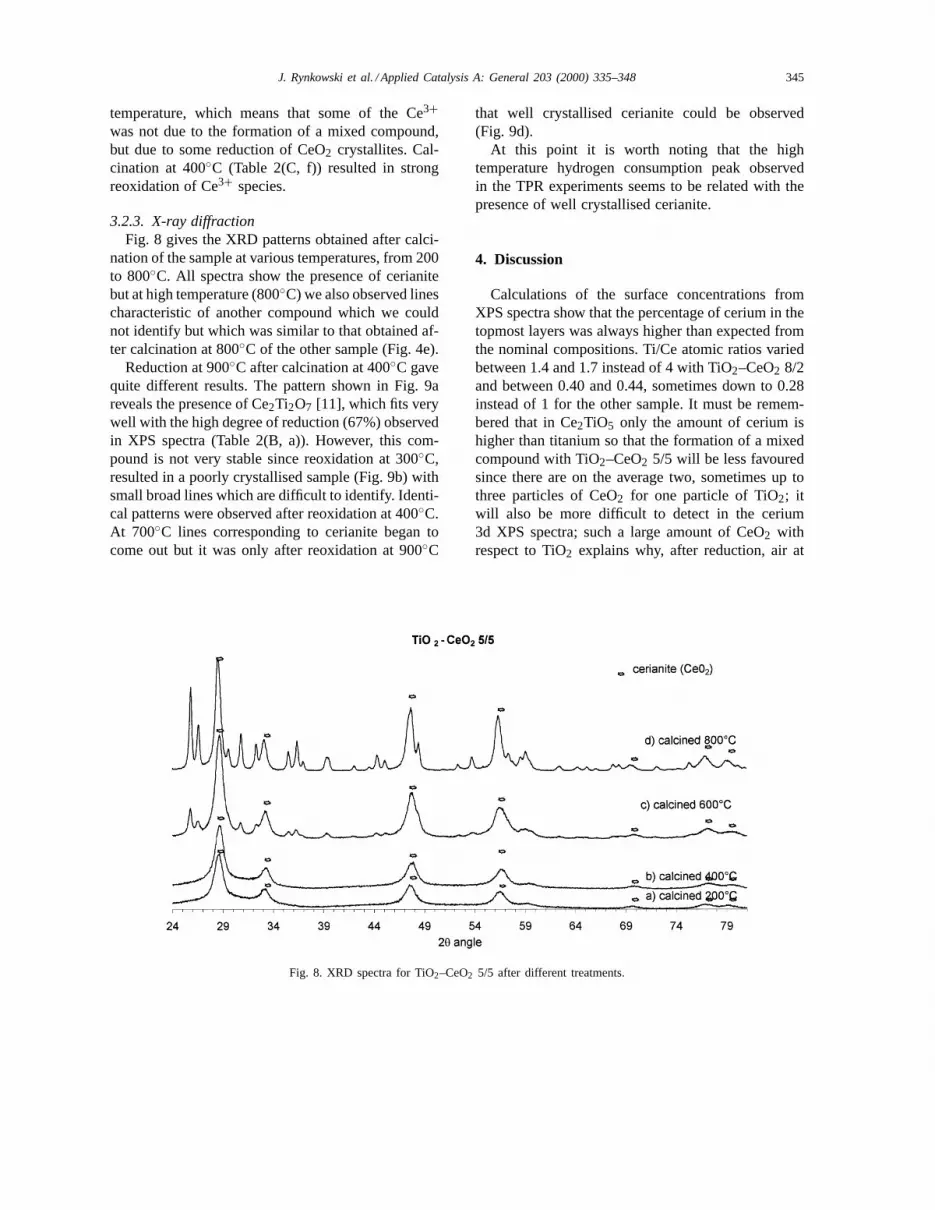
3.2.3. X-ray diffractionFig. 8 gives the XRD patterns obtained after calci-
nation of the sample at various temperatures, from 200to 800◦C. All spectra show the presence of cerianitebut at high temperature (800◦C) we also observed linescharacteristic of another compound which we couldnot identify but which was similar to that obtained af-ter calcination at 800◦C of the other sample (Fig. 4e).
Reduction at 900◦C after calcination at 400◦C gavequite different results. The pattern shown in Fig. 9areveals the presence of Ce2Ti2O7 [11], which fits verywell with the high degree of reduction (67%) observedin XPS spectra (Table 2(B, a)). However, this com-pound is not very stable since reoxidation at 300◦C,resulted in a poorly crystallised sample (Fig. 9b) withsmall broad lines which are difficult to identify. Identi-cal patterns were observed after reoxidation at 400◦C.At 700◦C lines corresponding to cerianite began tocome out but it was only after reoxidation at 900◦C
Fig. 8. XRD spectra for TiO2–CeO2 5/5 after different treatments.
that well crystallised cerianite could be observed(Fig. 9d).
At this point it is worth noting that the hightemperature hydrogen consumption peak observedin the TPR experiments seems to be related with thepresence of well crystallised cerianite.
4. Discussion
Calculations of the surface concentrations fromXPS spectra show that the percentage of cerium in thetopmost layers was always higher than expected fromthe nominal compositions. Ti/Ce atomic ratios variedbetween 1.4 and 1.7 instead of 4 with TiO2–CeO2 8/2and between 0.40 and 0.44, sometimes down to 0.28instead of 1 for the other sample. It must be remem-bered that in Ce2TiO5 only the amount of cerium ishigher than titanium so that the formation of a mixedcompound with TiO2–CeO2 5/5 will be less favouredsince there are on the average two, sometimes up tothree particles of CeO2 for one particle of TiO2; itwill also be more difficult to detect in the cerium3d XPS spectra; such a large amount of CeO2 withrespect to TiO2 explains why, after reduction, air at

346 J. Rynkowski et al. / Applied Catalysis A: General 203 (2000) 335–348
Fig. 9. XRD spectra for TiO2–CeO2 5/5 after different treatments.
room temperature reoxidises partly the surface: a sig-nificant proportion of Ce3+ is due to the reductionof CeO2 crystallites; the initial amount of Ce3+ (ca.25%) detected after calcination at 400 and 800◦C canbe attributed to some mixed oxide but perhaps notentirely if one considers that the detection of pureCeO2 by XPS is difficult: some oxygen atoms at thesurface are very labile in ultra high vacuum and un-der the X-ray beam and this effect can lead to about5–8% of apparent reduction [13].
Our TPR, XRD and XPS observations are fairlyconsistent, if we keep in mind that the probing depthin XPS is much smaller than with the other twotechniques. On TiO2–CeO2 8/2 the first TPR peak(Fig. 1a) is due to the fact that approximately halfof the cerium is involved in a mixed, although amor-phous, compound and the other half can be reducedat a relatively moderate temperature, as observed byXPS (Fig. 3b). A new mixed compound is formed,which is stable at 300◦C under air and it is the reasonwhy no hydrogen consumption was observed aftercalcination at 300◦C (Fig. 1b). One may wonder whyafter calcination at 500◦C (Fig. 1c) the hydrogen con-sumption is very small, much smaller than in Fig. 1a,since XPS revealed that the second mixed compound
is decomposed at 400◦C. However, one must keep inmind that all TPR experiments were performed upto 900◦C. XRD performed after calcination at 400◦Cand reduction at 900◦C revealed the formation ofCe4Ti9O24 which was not decomposed under air at400◦C (Fig. 5b). However, XPS showed that sucha treatment resulted in the reoxidation of approxi-mately half of the cerium (compare Table 1(B, a andc)), which means that such a reoxidation takes placeonly in the first few layers of the sample. The TPRspectrum observed after reoxidation at 500◦C can beinterpreted if one considers that the mixed compoundis still stable under such conditions and the very smallhydrogen consumption is due to the presence of somefree ceria on the surface. At higher temperatures (700and 900◦C) the mixed oxide is largely decomposed(Fig. 5c) and the last two TPR profiles (Fig. 1d ande) are typical of the reduction of large cerium dioxidecrystallites since it is well known that cerium diox-ide particles grow very quickly under hydrogen from500◦C upwards and become much less reducible [19].
The situation was somewhat different withTiO2–CeO2 5/5 since in that case the proportion offree cerium dioxide was much larger, at least on thesurface, as revealed by XPS. This means that, suppos-

J. Rynkowski et al. / Applied Catalysis A: General 203 (2000) 335–348 347
ing a situation where all the titania would be used forthe formation of a mixed compound with ceria, therewould remain quite a few particles of ceria, with nointeraction with titania. This may explain why ini-tially, after the first calcination at 400◦C (Fig. 6a andTable 2(A, a)), the proportion of Ce3+ was not so largeas with the other sample. After reduction at 900◦Cwe observed the formation of Ce2Ti2O7 by XRD.The proportion of Ce3+ was still very high under airat room temperature (in that case the ratio Ti/Ce was0.44) but the mixed oxide was easily destroyed evenat 300◦C under air (Table 2(B, b)) so that successiveTPR–TPO cycles gave a hydrogen consumption peakafter each calcination, which was to a large extentdue to the reduction and reoxidation of free ceriaparticles. The shift of that peak towards higher tem-peratures is most probably due to the growth of ceriaparticles and after calcination at 900◦C the main peak(Fig. 6e) reveals the reduction of bulk ceria.
The interpretation of XRD analyses in terms of theidentification of definite phases is much more difficultbecause many mixed oxides have been evidenced inthe literature but they were all prepared in quite differ-ent ways, at very high temperature, and we have ob-served on a few occasions XRD patterns which havenot been reported so far. In a previous study ([7] andreferences therein) we reported on ceria–titania sam-ples prepared exactly in the same way as in the presentpaper and we focused our attention on XRD spectrarecorded before calcination (while here all our spectrawere recorded after calcination at 400◦C or higher).We could observe a well crystallised phase which weidentified as CeTiO3 although little Ti3+ was observedby XPS, which was very puzzling. Another possibilitywould have been Ce2/3TiO3. This compound exhibitsan XRD spectrum very similar to CeTiO3 but with anadditional weak feature at lowθ angle which we didnot detect.
We can classify such mixed oxides as a function ofthe oxidation state of the metal. CeTi2O6 is the onlyknown compound where both Ce and Ti are tetrava-lent. Its diffraction pattern has been published and wenever observed such a pattern in our studies. Thereare several examples of mixed oxides in which Tiis tetravalent and Ce is trivalent. Preuss and Gruehn[11] published a study on Ce2TiO5, Ce2Ti2O7 andCe4Ti9O24, which are formally equivalent to Ce2O3TiO2, Ce2O3 2TiO2 and Ce2O3 4.5TiO2, respec-
tively. Bamberger et al. [10] also prepared Ce2Ti4O11,equivalent to Ce2O3 4TiO2. We did observe the py-rochlore Ce2Ti2O7 after calcination of TiO2–CeO25/5 followed by reduction at 900◦C (Fig. 9) but it wasdestroyed under air at 300◦C, resulting in poorly crys-tallised, rather amorphous ceria and titania. Leonov etal. [9] and Bamberger et al. [10] reported the forma-tion of compounds like Ce2O3.2 4TiO2 and Ce2TiO8.7where either cerium or titanium exhibit the two oxi-dation states+3 and+4. We did not observe any ofsuch phases. Moreover, it must be stressed that we didnot find any indication for the reduction of titaniuminto Ti3+, whatever the sample and the treatment.
Altogether, apart from rutile and cerianite, weclearly identified Ce4Ti9O24 and Ce2Ti2O7 after cal-cination at 400◦C followed by reduction at 900◦Cof TiO2–CeO2 8/2 and TiO2–CeO2 5/5, respectively.However, these two phases were destroyed on thesurface under air at moderate temperatures (around400◦C), exhibiting a lower stability than similar com-pounds prepared in a more classical way, especiallyCe2Ti2O7 since it was also destroyed in the bulk. Twoother phases were detected: after calcination at 400◦C,reduction at 900◦C and further calcination at 700◦Cof TiO2–CeO2 8/2 and after calcination of the samecompound at 800◦C. The latter phase was also ob-served after calcination at 800◦C of TiO2–CeO2 5/5.However, the diffraction patterns of these two phasescould not be related to any spectrum published so far.Another mixed compound was certainly present inour studies, at least on the surface, after calcinationat 400◦C of CeO2–TiO2 8/2, but it was amorphous.
5. Conclusion
In this study we reported on the reducibility and re-oxidation, in a wide range of temperatures, of mixturesof titania and ceria, prepared by a sol–gel process,with two different compositions: Ti/Ce 8/2 and 5/5.We evidenced the complexity of the problem, due tothe formation of several mixed oxides, which were de-tected by XRD. Surface compositions, calculated fromXPS, showed that the surface was always enriched incerium, whatever the treatment. The oxidation state ofcerium was also quantitatively determined and relatedeither to partial reduction of cerium dioxide crystal-lites or to the formation of mixed oxides.
348 J. Rynkowski et al. / Applied Catalysis A: General 203 (2000) 335–348
The purpose of such studies was to get a goodknowledge of the behaviour of such mixtures of ox-ides with the aim of using them as supports in catal-ysis. The next step consists of the impregnation of aplatinum salt. We know from previous studies [6] thatplatinum will enhance the reducibility of the mixtureof oxides but we do not expect drastic changes to oc-cur in that respect. The catalysts will then be usedfor the selective hydrogenation of unsaturated aldehy-des as a continuation of promising studies which havebeen undertaken on Pt/TiO2 and Pt/CeO2 [20].
Acknowledgements
We gratefully acknowledge the participation of Mrs.A. Meens, Ms. I. Rzeznicka and Ms. E. Szubiakiewiczin these studies.
References
[1] S.J. Tauster, S.C. Fung, R.L. Garten, J. Am. Chem. Soc. 100(1978) 170.
[2] S. Bernal, F.J. Botana, J.J. Calvino, M.A. Cauqui, G.A.Cifredo, A. Jobacho, J.M. Pintado, J.M. Rodriguez-Izquierdo,J. Phys. Chem. 97 (1993) 4118.
[3] P. Fornasiero, R. di Monte, G. Ganga Rao, J. Kaspar, S.Meriani, A. Trovarelli, M. Graziani, J. Catal. 151 (1995)168.
[4] J.Z. Shyu, W.H. Weber, H.S. Gandhi, J. Phys. Chem. 92(1988) 4964.
[5] K. Bak, L. Hilaire, Appl. Surf. Sci. 70 (1993) 191.[6] A. Dauscher, L. Hilaire, F. Le Normand, W. Muller, G. Maire,
A. Vasquez, Surf. Interface Anal. 16 (1990) 341.[7] A. Dauscher, P. Wehrer, L. Hilaire, Catal. Lett. 14 (1992) 171.[8] A. Dauscher, G. Maire, J. Mol. Catal. 69 (1991) 259.[9] A.I. Leonov, M.M. Piryutko, E.K. Keler, Bull. Acad. Sci.
USSR (Div. Chem. Sci.) 5 (1966) 755.[10] C.E. Bamberger, T.J. Haverlock, S.S. Shoup, O.C. Kopp, N.A.
Stump, J. Alloys Comp. 204 (1994) 101.[11] A. Preuss, R. Gruehn, J. Solid State Chem. 110 (1994) 363.[12] E. Paparazzo, Surf. Sci. Lett. 234 (1990) L253.[13] J. El Fallah, L. Hilaire, F. Le Normand, J. Electron Spectrosc.
Relat. Phen. 73 (1995) 89.[14] J.H. Scofield, J. Electron Spectrosc. Relat. Phen. 8 (1976)
129.[15] P. Burroughs, A. Hammett, A.F. Orchard, G.J. Thornton, J.
Chem. Soc. Dalton Trans. 17 (1976) 1686.[16] A. Fujimori, Phys. Rev. B 28 (1983) 4489.[17] A. Kotani, J.C. Parlebas, Adv. Phys. 37 (1988) 37.[18] M. Romeo, K. Bak, J. El Fallah, F. Le Normand, L. Hilaire,
Surf. Interface Anal. 20 (1993) 508.[19] A. Laachir, V. Perrichon, A. Badri, J. Lamotte, E. Catherine,
J.C. Lavalley, J. El Fallah, L. Hilaire, F. Le Normand, E.Quéméré, G.N. Sauvion, O. Touret, J. Chem. Soc., FaradayTrans. 87 (1991) 1601.
[20] R. Touroude, unpublished results.