zirconia and ceria based ceramics and and
TRANSCRIPT
188 N.N. Novik, V.G. Konakov and I. Yu. Archakov
© 2015 Advanced Study Center Co. Ltd.
Rev. Adv. Mater. Sci. 40 (2015) 188-207
Corresponding author: V.G. Konakov, e-mail: [email protected]
ZIRCONIA AND CERIA BASED CERAMICS ANDNANOCERAMICS – A REVIEW ON ELECTROCHEMICAL
AND MECHANICAL PROPERTIES
N.N. Novik1,2, V.G. Konakov1,2 and I. Yu. Archakov1,3
1Research Laboratory for Mechanics of New Nanomaterials, St. Petersburg State Polytechnical University,St. Petersburg 195251, Russia
2Insitute of Chemistry, St. Petersburg State University, St. Petersburg 198504, Russia3Institute of Problems of Mechanical Engineering, Russian Academy of Sciences, Bolshoj 61,
Vasilievskii Ostrov, St. Petersburg 199178, Russia
Received: November 26, 2014
Abstract. Zirconia (ZrO2) and ceria (CeO
2) based ceramics is widely applied in electrochemical
devices due to its high ionic conductivity coupled with high mechanical properties. Nowadays,the task of the decrease in the working temperature of such devices is of current interest, thereare a lot of papers dealing with this problem. The present paper considers the conductivity vscomposition dependencies for such ceramics, it is shown that triple systems are very perspec-tive compositions, especially with hafnium oxide additions. The effect of ceramics microstructureon the conductivity is discussed, in particular the dependence of the grain size on the electro-chemical properties, a special attention is paid to nanosized ceramics. Experimental resultsobtained in this field are compared with those computed using BLM model for microsized caseand n-GCM model for nanosized one. The data on the grain size effect on the ceramics mechani-cal properties are summarized, it is shown that the decrease in the grain size usually results inthe ceramics hardening.
1. INTRODUCTION
Zirconia and ceria based solid solutions are widelyapplied in industry as solid electrolytes for fuel cells[1-3] and electrochemical sensors [4] due to thehigh ionic conductivity of these materials. At thesame time, it is possible to use them in the exploi-tation regimes under the conditions that eliminateelectronic conductivity harmful for fuel cells and elec-trochemical sensors application. The conventionaltemperature range for the above materia]s is 1000 –1200 °C, however, most of solid oxide fuel cell(SOFC) advantages - the use of non-hydrogen fuelsand non-platinum catalysts can be achieved at lowertemperatures of 600-800 °C. However, the membrane
conductivity in this temperature range is insufficientfor the effective SOFC work and it is necessary toincrease the working temperature up to 1000-1200°C to achieve reasonable membrane conductivityvalues. Since the work at such a high temperaturesrequires complex technical decisions and needs theapplication of refractory materials, the task of theSOFC working temperature decrease is very actual,because it will result in significant simplification inthe devise construction and increase in their costefficiency.
One of the possible decisions of this problem isto increase the conductivity of zirconia- and ceria-based materials by their doping as well as by the
189Zirconia and ceria based ceramics and nanoceramics – a review on electrochemical
grain size decrease down to nanoscale region [5].In order to formulate the approach for this task, theclear understanding of the conducting mechanismstructure and the peculiarities of the application ofthe conventional zirconia and ceria materials is nec-essary. This paper reviews three major factors de-termining the oxide ceramics conductivity:(1) The composition of zirconia- and ceria-basedsolid solutions and the dopant content in them;(2) The structure of the polycrystalline electrolyte;(3) The particle size of the initial precursor powdersand the grain size in the electrolytes (final ceram-ics).
In addition, some general information on the solidelectrolytes conductivity will be considered. It shouldbe noted that this review deals with bulk ceramics;data on thin films which are also widely used in awide range of electrochemical devices can be foundelsewhere, see, e.g. [6].
2. SOLID ELECTROLYTESCONUCTIVITY
Perfect ion crystals based on oxide systems donot possess electroconductivity. Ion transitions (ionicconductivity) in solid crystalline electrolytes arepossible due to the existence of the crystal latticedefects. These defects could be subdivided into threegroups:(1) Point defects, i.e. defects in the crystal struc-ture with the size comparable to interatomoc dis-tance;2) Linear defects (dislocations) which are typicallycharacterized by a shift of the periodic structure insome direction;(3) Planar defects including stacking faults as wellas inner and outer surfaces.
Point defects provide the transport properties ofsolid electrolytes, i.e. their ionic conductivity. Ac-cording to one of the mechanisms (Frenke]’s disor-dering mechanism), disordering appears due to thefact that a number of atoms is transferred into theinterstices with the simultaneous formation of thesame number of vacancies. This mechanism, inparticular, can be realized due some thermal fluc-tuations. Another mechanism (Schottky disorder-ing) assumes the formation of the equal number ofanion and cation vacancies. At that, the correspond-ing ions move to the crystal surface.Frenke]’s defects are typica] for pure meta] ox-
ides considered in this review [7]. Electricity trans-fer in a solid electrolyte with oxygen vacancies isdue to the defects which formation can be describedwithin the frames of Kröger-Vink notation (used hereand below) by the reaction
0 iO O + Vo. (1)
Note that the complete ionization is assumed here,i.e. electrons are absent on the outer electron shellof the atom. According to thermodynamics, the re-action constant here is
K1 i
[Vo][O ], (1a)
where [Vö] is the oxygen vacancies content and
i[O ] - is the oxygen content in the intercites.
Depending on the oxygen partial pressure, zir-conia and ceria could be both oxygen depleted oroxygen enriched oxides, the equation for oxygenbalance here can be written as:
-
0 2O 1/ 2O + Vo+ 2 e , (2)
K n p2
2 1/ 2
2 O[Vo] , (2a)
where n is the electron concentration and pO2
is theoxygen partial pressure. To perform the completemathematical description, the equation for the holes/electrons balance should be added:
O e + h (3)
with the equilibrium constant
K np3
. (3a)
where p is the hole concentration.The total current density is
I E, (4)
where is the conductivity and E is the intensity ofthe electric field in which these particles are mov-ing.
The current density due to charged particlestransfer will be equal to:
i iI E, (5)
where I is the conductivity of consistuent “I”
When both electronic and ionic conductivity arepresent, the total electroconductivity is given by theirsum. For the single ion type, it can be written as:
t tion el ion el
, (6)
where ion
and el – the inputs of ionic and e]ectronic
conductivities and tion
and tel are ion and electron
transport numbers. It is known that
i i i i i i iI c q u c z eu , (7)
where zi is the valence, c
i – partic]e content, u
i-
particle mobility, and qi – partic]e charge.
190 N.N. Novik, V.G. Konakov and I. Yu. Archakov
Basing on the above equations, three types ofthe dependencies of the vacation concentration andconductivity on the oxygen partial pressure can beconsidered for zirconia and ceria. In case of stoichi-ometry
K 1 / 2
i 1[Vo] [O ] .
The vacancy content here is independent from thepartial oxygen pressure.
The input of n-type electronic conductivity, i.e.the conductivity caused by electron transfer, is ratherhigh at low values of the oxygen partial pressure.
ni
If [Vo] 1/ 2 [O ], then
n K p2
1/ 3 1 / 6
2 O(2 ) , (8)
e u u K p2
1/ 3 1/ 6
ion el 2 O2 . (9)
As a result
p2
1/ 6
O.
p-type conductivity, i.e. hole conductivity, usuallymanifests itself at high oxygen partial pressures.
pi
If [O ] 1/ 2 [Vo], then
2 i1 / 2 O O + 2 h , (10)
iK p p
2
2 1/ 2
4 O[O ] , (11)
p K p2
1 / 3 1 / 6
4 O2 / 4 . (12)
As a result
p p2
1/ 6
O,
Accounting for Eq. (6) and with regard to the factthat electronic conductivity prevails at the high oxy-gen partial pressures, one can conclude that
p2
1/ 6
O.
The content of defects in pure zirconia is very low,usually this value is about a few tenths of a percent.It should be also noted that pure zirconia possessmonoclinic (baddeleyite) structure at normal condi-tions [8]. The transition to tetragonal structure takesplace at temperatures ~ 1100 °C and the fluorite-like cubic structure forms at 2371 °C with the melt-ing temperature of 2715 °C. Fluorite-like structuresare face-centered cubic lattices in which all tetra-hedral sites are occupied by the ions; such struc-tures are characterized by high values of ionic con-
ductivity, this is possibly due to the presence of alarge number of octahedral voids. Pure ceria pos-sess fluorite-like structure at a room temperature,however, it does not have enough amount of vacan-cies to provide high ionic conductivity.
The addition of some oxide with a lower cationcharge as a dopant gives rise to the significant in-crease of the oxygen vacancies content. Yttriumoxide (Y
2O
3) is a widely used dopant to zirconia,
yttrium stabilized zirconia (a range of ZrO2-Y
2O
3
system compositions) is usually named as YSZ.Such additions give an opportunity to stabilize fa-vorable for ionic conductivity fluorite-like cubic modi-fication of zirconium oxide. Let us consider the ther-modynamics of the ionic conductivity formation us-ing the following case. The process of the vacancyformation can be described by the equation below.
X X
2 3 Zr O Zr 2Y O + 2 Zr + O 2 Y + Vo+ 2 ZrO . (13)
Consideration of this equilibrium, Eq. (13), shouldbe performed taking into account the electrical neu-trality condition. For moderate oxygen partial pres-sures, it can be with a sufficient precision writtenas:
Zr2[Vo] [Y ], (14)
Thus, the amount of oxygen vacations is deter-mined by the dopant content. The exact form of theelectrical neutrality equation is:
p nZr i
2[Vo] [Y ] + 2[O ]. (15)
The temperature dependence of the electrolyte con-ductivity can be expressed by Arrhenius equation.
AE
kT0
exp , (16)
where 0 is the preexponential factor, E
A is conduc-
tivity activation energy, T is the absolute tempera-ture, and is the Boltzmann constant.
Dopants existence provide to possibility for thesignificant change in the defect content. Doping ionsoften form a wide range of solid solutions with thebasic component, this means that the doping ionsare completely integrated in the crystal lattice ofthe basic component. However, the heterogeneousstructure formation due to incomplete dopant solu-tion or the case of the complete dopant insolubilitycan be also considered, this consideration will begiven below. Generally, the existence of solid solu-tions with dopants having the ion charge both higherand lower than that of the basic component ion ispossible. But the conventional practice for zirconiaand ceria based materials is the use of the oxides
191Zirconia and ceria based ceramics and nanoceramics – a review on electrochemical
with the metal valence lower than that of zirconiumand cerium. Hence, doubly (Ca and Mg) and triply(Y,Sc,Yb, Sm, Gd, etc.) charged metals are applied,this review will consider these dopants application.
Electronic conductivity, as a rule, is undesirablein most of solid electrolyte applications, the excep-tion is solid electrolytes for fuel cells, the mixedelectronic-ionic conductivity is an advantage for them[9]. Note that n-type conductivity is typical for thestabilized zirconia at the oxygen partial pressureslower than 10-30 atm.
Summarizing the above consideration, we cabstate that ionic conductivity prevails in zirconia andceria based electrolytes in a wide range of oxygenpartial pressures. However, the determination of theconductivity type is necessary for each certain com-position, the study of the electrolyte conductivity vsoxygen partial pressure dependence should be car-ried out for such determination. Doping by differentoxides could provide high ionic conductivity. Con-ventionally used doped electrolytes possess opti-mal conductivities at rather high temperature, forthis reason, the attempt of the alternative dopantsapplication providing the decrease of the workingtemperature and the increase of the oxygen partialpressure range is a point of essential interest.
3. THE EFFECT OF SYNTHERINGAPPROACHES AND THEPRECURSOR POWDERS POSTTREATMENT PROCEDURES ONTHE OXIDE SOLIDELECTROLYTES PROPERTIES
The process of ceramic (including nanoceramic)electrolytes manufacturing is well developed, it in-cludes the following steps.1) Precursor powders synthesis;2) Post treatment of the precursor powders (includ-ing thermal and mechanical treatment) in order toobtain required particle properties and structure;3) Precursor powders compactification into the finalunit;4) Thermal treatment of the final units manufacturedfrom solid metal oxide electrolytes (if necessary).
Precursor powders synthesis approaches mayaffect on such properties of solid electrolytes asgrain size, density, uniformity of dopant distributionin a solid solution, etc. At present, a lot of physicaland chemical methods are used for this task, solidphase ceramic synthesis and different modificationsof sol-gel synthesis are widely used here. Let usconsider these two approaches in more detail.
Solid phase synthesis was conventionally usedfor solid electrolyte manufacturing; the idea of thisapproach is the calcination of the oxide powdersmixture, sometimes pretreatment of the powders(mechanical activation) is applied before the calci-nations step. The main advantage of this method isits simplicity; however, small particle size cannotbe obtained here. In addition, problems with theuniform components distribution in the final mate-rial were reported [10]. Another disadvantage of themethod is a necessity of high temperature calcina-tion in order to provide mutual diffusion of the com-ponents.
Sol-gel synthesis is widely used nowadays forthe task of solid electrolyte manufacturing. Thisapproach provides the uniform distribution of the solidsolution components due to their homogeneous dis-tribution in the precursor powders.
The following versions of sol-gel synthesis areusually used:· partial neutralization of the metal salt with the for-mation of a stable hydrosol that is the mixture ofhigh-dispersed hydroxides;· complete neutralization of the metal salt with fol-lowing washing and precipitate peptization result-ing in stable hydrosol formation;· metal salt hydrolysis at high temperatures;· metal organic compound hydrolysis.
The process can be generally described by thefollowing steps: initial components homogenization,their conversion into a sol, then into a stable sol,and final drying.
The most important versions of sol-gel approachare alkoxide hydrolysis and reverse precipitation ofthe metal salts.
The first approach includes water addition to thealcohol solutions of metal and non-metal alkoxideswith the general formula M(OR)
n (M = Si, Al, Ti, V,
Cr, W, Zr; R = CH3-, C
2H
5-, C
3H
7-, etc.). This path-
way results in hydrolysis with further polyconden-sation at low temperatures according the followingreactions:
n 2 n-1M(OR) H O M(OR) (OH) ROH, (17)
M-OH M-OX M-O-M XOH(X=H or M). (18)
As a result, hydroxilated M-OH groups and hy-droxide monomers are formed; they manifest them-selves as the active centers in the polycrystallizationreaction that likely occurs according to thealkoxylation mechanism.
The reverse copresipitation approach in basedon particle precipitation from the solution by a third
192 N.N. Novik, V.G. Konakov and I. Yu. Archakov
component. Usually, aqueous ammonia is used assuch a third component. The approach providing theprecipitation conditions optimization was reportedin [11], the authors of [12] proved the possibility ofthe nanosized particles production. The obtainedgel is purified from undesirable additions and dried.It is known that gel thermal treatment affect the sizeand morphology of the final particles. Such ap-proaches as drying under pressure and azeotropicdrying provide the opportunity to control particlemorphology and to decrease the average particlesize down to nanoscale region. Decreasing the av-erage particle size, these drying procedures alsodecrease the mechanical strength of agglomerates;however, their use is associated with significant la-bor costs. Modern freeze-drying approach is lessstudied. This method bases on water removal fromthe gel due to its sublimation at low temperatures.Freeze-drying provides an opportunity to control theparticle size and agglomerate structure; however, itrequires proper equipment.
Comparing the electroconductivity of YSZsamples manufactured by conventional ceramicmethod and synthesized by reverse co-precipita-tion approach, the authors of [13] conclude that theconductivity of ceramics is similar for both produc-tion approaches at a same thermal treatment. Onthe other hand, ceramics produced from the sol-gelpowders possesses lower density, this fact can beconsidered as some additional possibility to increasethe conductivity of the ceramics produced by sol-gel approach. The increase in the calcination tem-perature results in the increase in the ceramic den-sity of the samples synthesized by reverse co-pre-cipitation approach; in turn, this increases itselectroconductivity, such an increase is impossiblein case of ceramics produced via conventional ce-ramic approach.
Authors of [14] demonstrated that, under cer-tain conditions, nanocrystalline zirconia could in-herit the structure of the initial amorphous xerogels,this fact should be taken into account during thesynthesis of nanopowders with required structures.This idea seems to be reasonable, however it is notwidely used for today.
Powder compactification method could also af-fect the ceramics conductivity, in addition, it alsoaffects on such important for electrochemical appli-cations properties as ceramics density and its gaspermeability. Most electrochemical devices requireceramics with maximal density and minimal poros-ity, thus, the increase in the final ceramics densityis the principal task. The conventional approach topowders compactification is an isostatic pressing
followed by calcination. In doing so, one can pro-duce ceramics with the density up to 97-98% oftheoretical density calculated for the ideal ceram-ics [15-16]. Hot pressing is the perspective approachproviding the significant increase in zirconia and ceriabased ceramics density. This method was inten-sively studied in 1980th, the details on the technol-ogy could be found in [17], the results of its applica-tion are summarized in [18]. One should distinguishusual hot pressing, i.e. simultaneous pressing intwo directions during the ceramics calcination fromhot isostatic pressing which considers the use ofincompact media (in particular, gases) for uniformpressure application in all directions. Regretfully, theworks comparing the effect of compactification ap-proach on the ceramics conductivity are practicallyabsent; the comparison of the results of differentauthors is very difficult due to the impossibility tocontrol all pressing parameters. Let us briefly con-sider some of a few papers in this field. Masaki etal. [16] compared the structure and mechanical prop-erties of partly stabilized zirconia with yttria con-tent from 1.5 to 5 mol.%. Here and further the com-position is given in mole percent unless the other ismentioned. Comparing such approaches as coldisostatic pressing, conventional hot pressing, andhot isostatic pressing, the authors demonstratedthat hot isostatic pressing results in the ceramicsdensity close to theoretical limit. At that, the in-crease in other mechanical properties is registered,for example, the bending stress increases by one-third. To our regret, the data on electroconductivityare not discussed, some conclusions could be doneusing indirect data. One of the alternative pressingapproaches is the electric field application, paper[19] compares ceramics electroconductivity in thesamples produced by hot pressing and electric fieldapplication. It is concluded that the Arrhenius de-pendencies and the activation energies values arequite similar for samples manufactured by both ap-proaches. An interesting conclusion is done on theeffect of the use of micro- and nanosized precur-sors on the final ceramics density. The authors claimthat the ceramic density higher than 99% of theo-retical limit can be obtained only at a final grainsize exceeding 1 m. The problems of densenanoceramics (ceramics with the nanosized grains)production is mentioned in some other works, seeSection 7 below. Arguing with the above concept,we can state that the application of moderncompactification approaches coupled with the in-crease in the thermal treatment temperature pro-vides the possibility to produce dense ceramics withthe grain size close to nanosized.
193Zirconia and ceria based ceramics and nanoceramics – a review on electrochemical
It is known that higher pressure application lim-its the face growth, for this reason such modernmethods as magnetic pulse pressing [20] and sparkplasma (HIP) pressing [21] are used to producedense nanosized ceramics.
The usual requirement for electrochemical de-vices based on solid oxides (primarily, fuel cells) isthe possibility of their exploitation at temperatureshigher that 800 °C. Therefore, the careful study ofthe further calcinations of the alreadycompactificated ceramics is necessary. It is knownthat such additional heat treatment (at higher tem-peratures or at greater calcination durations) couldboth increase and decrease electrical properties ofthe ceramics. The most critical factor here is theeffect of calcination on the grain boundaries struc-ture, this effect will be considered in detail below inthe section discussing the dependence of the con-ductivity on the electrolyte structure.
4. APPROAHES FORELECTROCONDUCTIVITYMEASUREMENTS
Let us briefly discuss the approaches for the solidelectrolytes conductivity measurements.
Obviously, the method of electroconductivitymeasurements should provide an opportunity toeliminate the effect of electrode resistance as wellas the effect of the electrode/electrolyte boundaryresistance. As an alternative, it should be possibleto subdivide the input of these resistances. Nowa-days, two- or four-point measurements at a directcurrent (DC), two- or four-point measurements atalternating current (AC), and electrochemical im-pedance spectroscopy are used. 3-point and multi-point measurements are also mentioned in litera-ture [22], however, the application of these ap-proaches in practice is very limited.
The idea of 2-point measurement is the voltageapplication to a sample placed between two elec-trodes and the determination of the sample resis-tance. DC usage provides the measurements of theconductivity due to the long distance ion migrationinstead of the losses due to ion oscillations in coor-dination polyhedral. In addition, DC measurementsrequire simpler equipment. However, DC measure-ments need reverse electrodes compatible with thesolid electrolytes in the system under investigation.When these conditions are not met, the problem ofelectrode/electrolyte boundary polarization appears,in this case, the boundary works as a capacitor.
Separation of the different sources inputs is im-possible in 2-point DC measurements. However,
there is the possibility to evaluate the input of inter-phase resistance measuring the resistance depen-dence on the electrolyte thickness with further cal-culations based on the assumptions that polariza-tion resistance does not depend on the electrolytethickness. More often, 2-point AC measurementsat a certain frequency are used, the frequency isselected regarding for ceramic structure and experi-mental conditions. These measurements are per-formed using the Wheatstone bridge, see the cir-cuitry in [23]. In theory, AC measurements give theopportunity to separate electronic and ionic con-ductivities and to obtain some more important infor-mation. However, the disadvantage of these mea-surements at a fixed frequency is the fact that theequivalent electrical circuit of the cell is unknownhere, there is no assurance that the measured re-sistance R and capacity C will be equal to the realresistance and capacity of the sample. Thus, thepreliminary study aiming in the frequency choice isnecessary.
Application of 4-point methods allows to elimi-nate the effect of electrodes and heterogeneousboundary resistances, so, there is an opportunityto overcome all disadvantages of 2-point ap-proaches. 4-point measurements are usually per-formed in a DC regime due to simpler equipmentrequired; in addition, more accurate data could beregistered here. Some minimal current passes be-tween two “current” e]ectrodes, whi]e the vo]tage ismeasured by two “inner” e]ectrodes. The compari-son of 2-point and 4-point measurements was re-ported in [24], it was shown that the Arrhenius curvesobtained in 4-point measurements look like morereasonable. The disadvantage of the 4-point approachis a high sensitivity to a sample shape. Another prob-lem is the difficulty of the determining of the dis-tance between the electrodes in case when theextended electrodes are used instead of point ones,however, some approaches give an opportunity toperform 4-point measurements at different electrodeshapes.
4-point approach is an express method and it iswidely used to obtain the Arrhenius curves for differ-ent materials, but it is impossible to separate theinputs of grains, grain boundaries, and electrodesin a polycrystalline sample using this method. Tosolve this problem, one should use the impedancespectroscopy as an additional investigation proce-dure.
Impedance spectroscopy gives the detailed dataabout the ceramics electroconductivity for the caseof solid electrolytes based on complex oxide sys-tems. However, some disadvantages of this approach
194 N.N. Novik, V.G. Konakov and I. Yu. Archakov
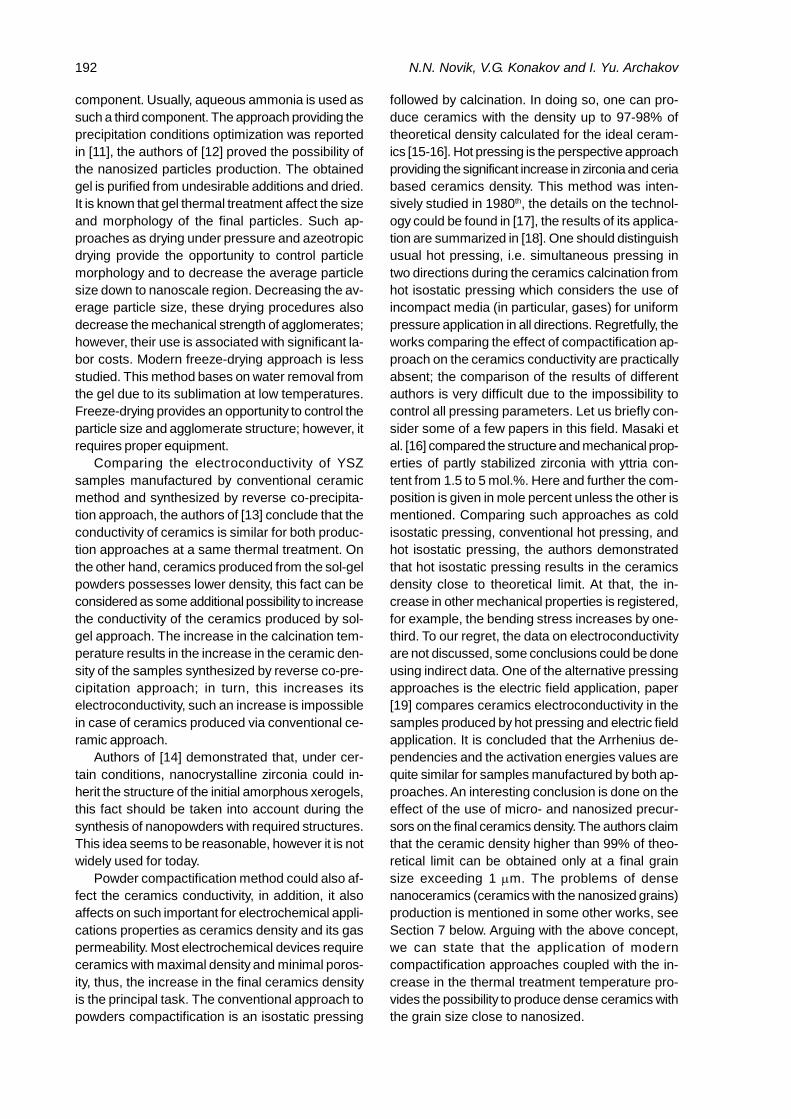
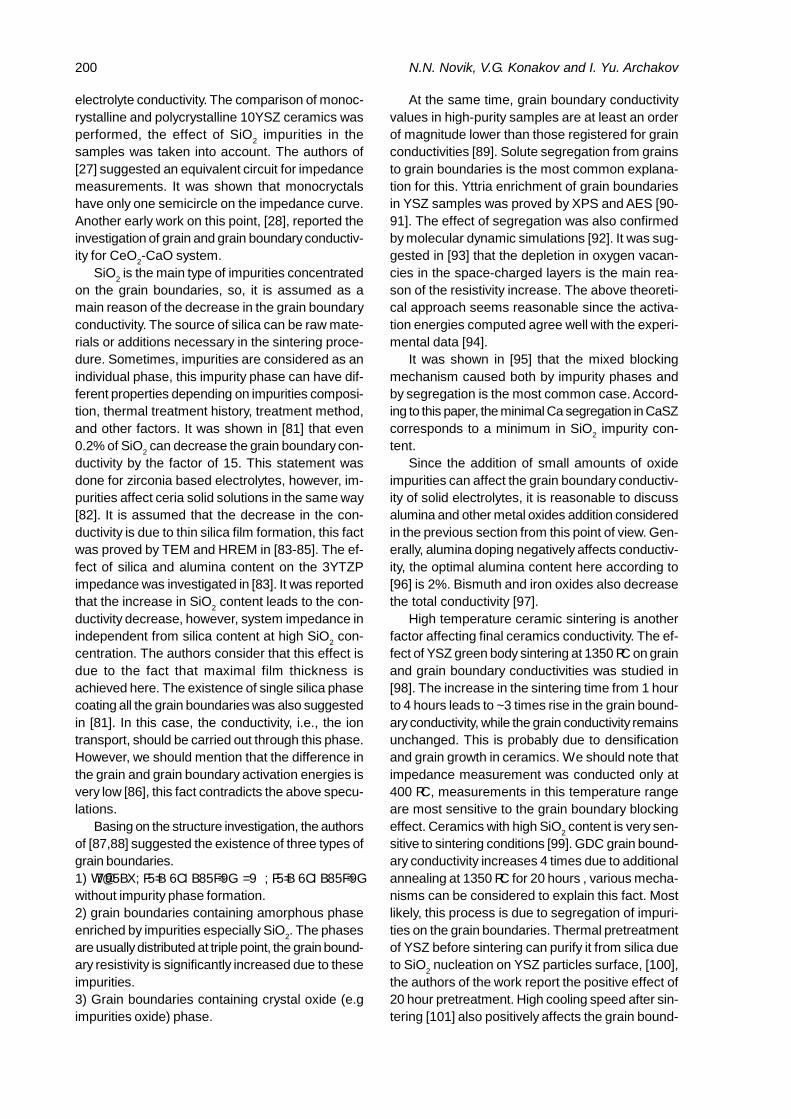
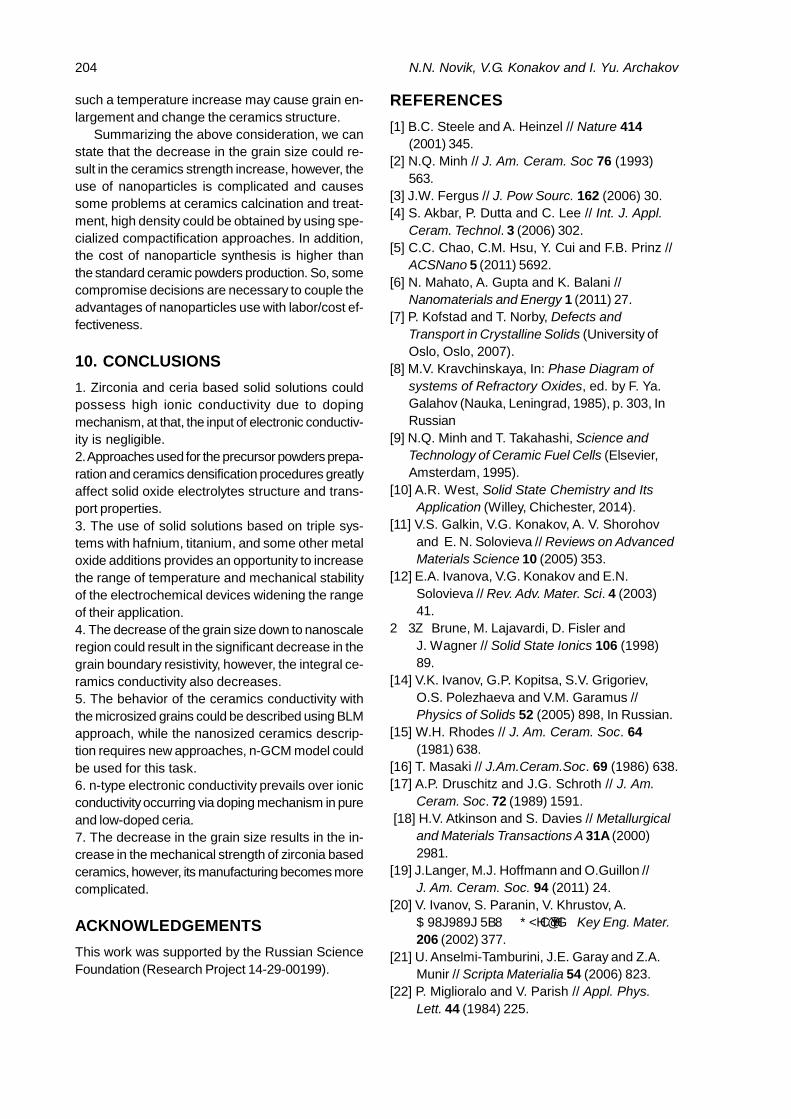
should be mentioned. Impedance spectroscopy re-quires more complex and expensive equipment thanDC measurements. In addition, AC measurementsat a fixed frequency provide more rapid measure-ment results. The idea of the impedance spectros-copy method is the study of the system reaction onthe applied perturbing pulse, this pulse is sinusoi-dal and possesses low amplitude [25]. There are anumber of approaches for the measurements pro-cedure, the following is the most frequently used.AC of a fixed frequency is applied to a sample andthe amplitude and the phase shift or the real andimaginary parts of the resulting current are mea-sured. 2-point approach is used here. To describethe electrochemical circuit behavior, the obtainedresults are compared with those computed for thephysical model of the processes occurring in thecircuit designed from elementary units having thesame reaction on the perturbing pulse [26]. Elec-trochemical impedance is a vector value, the totalsystem impedance could be presented in the Car-tesian coordinate system (Fig. 1) according the fol-lowing equations.
Z Z jZ
Z Z Z
Z Z Z
,
Re cos ,
Im sin . (19)
Sometime, some characteristics connected withthe impedance are measured instead of the imped-ance itself, the most important among them are:· Addmitance, which is reciprocal impedance.Addmitance is also called a complex conductivitysimilarly to conductivity that is a reciprocal resistiv-ity. The combination of impedance and admittanceis immittance.
j-1Y Z Y Y , (20)
· Permittivity, a characterization of the electric in-duction dependence on the electric field intensity.
j . (21)
· The reciprocal of the permittivity is an electricmodule
M 1/ M M . (22)
Fig. 1. Typical impedance plot for polycrystallineceramic.
Note that the accurate impedance measurementsrequire thorough elimination of the exterior responsesand well as accurate system linearity.
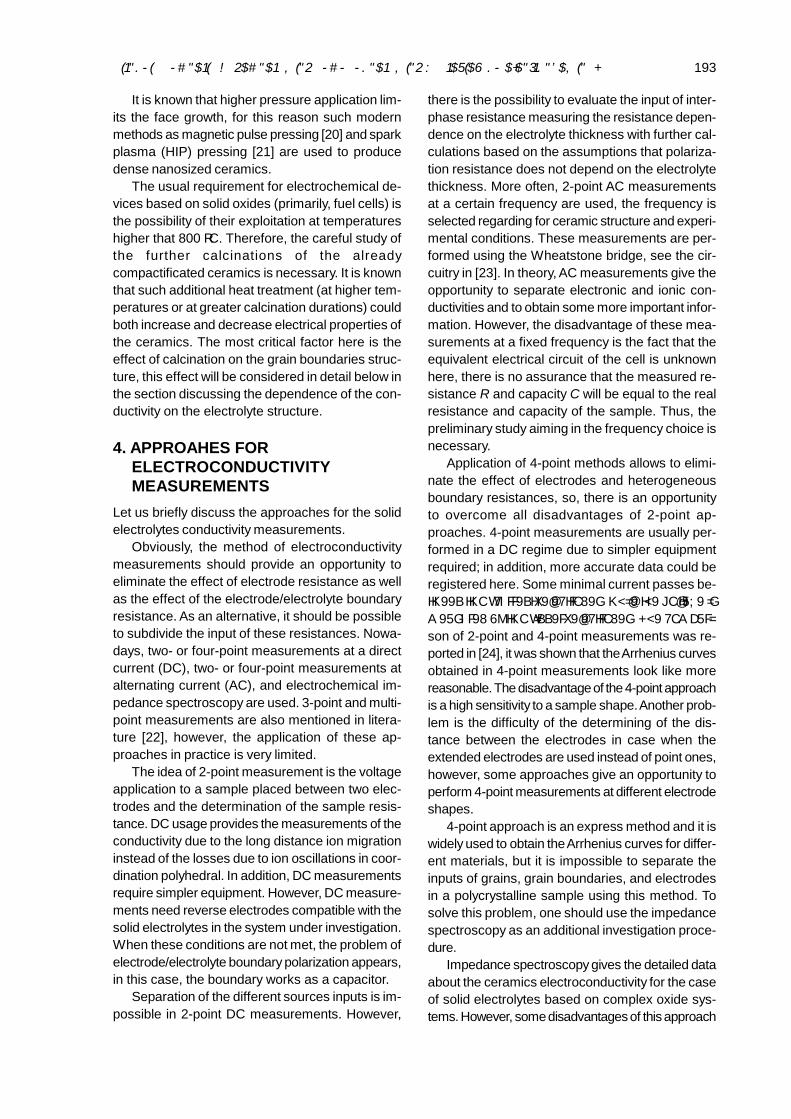
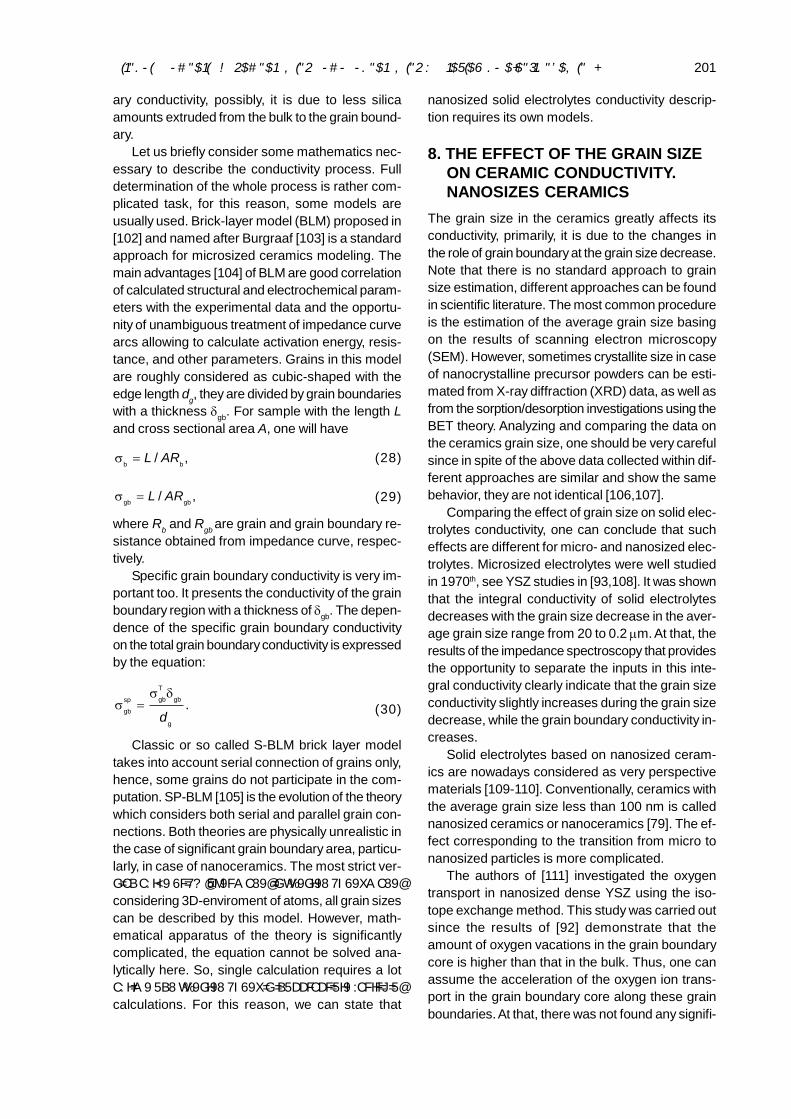
The first works performed in this field were [27]and [28], the latter one considered the separationof the location inputs. The study of solid electro-lytes manufactured within different approachesshould be mentioned as an essential point of theBaurle works [27]. The study of monocrystals al-lows to identify the correlation of grain and grainboundary conductivities with the specific regions inthe locus plot, see the typical impedance locus andequivalent circuit in Fig. 1 and typical equivalent cir-cuit in Fig. 2
5. SHORT NAMES FOR SOLIDSOLUTIONS
The complete list of all solid solution componentsalong with its composition is rather cumbersome,sometimes it hinders the information perception. Toavoid this problem, the short names system for solidsolutions based on zirconia and ceria was sug-gested, at present, it is in a general use. It providesthe exact description of the solid solution composi-tion as well, as its structure. Generally, some ab-breviations are used; let us consider them in partdealing with zirconia modifications used in electro-chemical devices.
Stabilized cubic solid solution is the most fre-quently used substance, it is marked as SZ (stabi-lized zirconia) with the indication of the stabilizingelement in front, e.g. YSZ – yttrium stabilized zir-conia. Abbreviation TZP (tetragonal zirconia poly-crystals) is used to denote zirconia based solidsolutions in the tetragonal modification, the exampleof such a system is 97ZrO
2-3Y
2O
3 composition. The
third type of zirconia based ceramics applied in theelectrochemical devices is partly stabilized zirco-nia which contains cubic phase ZrO
2 (c-ZrO
2) with
tetragonal t-ZrO2 additions, it is denoted as PSZ.
The name of the doping element according to peri-odic table is placed before the abbreviation describ-ing the zirconia structure. There is no necessity toconsider such a wide range of structure variationsfor ceria based polycrystalline systems, the gen-eral abbreviation used here is DC (doped ceria). Notethat doping elements in this case are denoted us-
Fig. 2. Equivalent circuit for polycrystalline ceramic.
195Zirconia and ceria based ceramics and nanoceramics – a review on electrochemical
Oxide system Short name
ZrO2-Y
2O
3YSZ
(cubic modification)ZrO
2-Y
2O
3YTPZ
(tetragonal modification)ZrO
2-Sc
2O
3ScSZ
ZrO2-CaO CaSZ
ZrO2-Yb
2O
3YbSZ
CeO2-Sm
2O
3SDC
CeO2-Gd
2O
3GDC
Table 1. Short names used to denote zirconia andceria based systems.
ing the first letter in their name (e.g., Y for yttrium)instead of the complete element name, seeTable 1.
In order to specify the dopant content, the propernumeral is added in front of the abbreviation (e.g.8YSZ denoted 92%ZrO
2-8%Y
2O
3 composition).
Table 1 lists the abbreviations widely used for zirco-nia and ceria based systems.
6. THE EFFECT OF SOLIDELECTROLYTE COMPOSITION ONITS IONIC CONDUCTIVITY
It was Nernst’s idea to app]y e]ectrica] conductivityof zirconia-based materials in practice [29], the at-tempt to use 15YSZ composition for light bulbs pro-duction was performed. In the future, YSZ systemhas become the basis of electrochemical devicesdue to reasonable conductivity at high temperature,easy sintering, and relatively low cost. It is wellknown that maximal YSZ system ionic composi-tion is obtained at minimal content of the dopingelement necessary for system stabilization [30].Note that such stabilization is the prerequisite pro-viding ionic conductivity. 8% of the dopant wasshown to be such a minimal yttrium content in YSZsystem. The decrease in the ionic conductivity athigher dopant concentrations is due to oxygen va-cations and dopant ions association in some low-mobile complexes. The mechanism of such asso-ciation can be written as [31]:
Zr ZrY Vo Y Vo .
.(23)
Note that nanoscaled YSZ under some specificconditions could possess protonic conductivity (thediscussion on the application of the term“nanosca]ed” to the oxide so]id so]utions wi]] be givenbelow). Basically, protonic conductivity manifests
itself when YSZ material is placed into some wetatmosphere [32], [33], the result is the significantincrease in the sample conductivity in contrast tothe values typical for non-hydrated samples. Indeed,proton mobility exceeds the mobility of oxygen ions.Guo et al. [34] suggested the following mechanismfor this type of conductivity:
X
2 O OH O Vo O 2(OH) , . (24)
At the same time, theoretical computations per-formed within Atomic Simulation approach [34]showed that the proton transport mechanism is pri-marily associated with the grain boundary conduc-tivity, while the input of the bulk conductivity is low.This is due to the fact that the hydratation energy ofgrain boundaries is significantly lower than that forgrains, for this reason, the proton concentration hereis high. This statement is partly proved by the dataon thermogravimetry of hydrated zirconia samplesand their grain boundary conductivities [33].
8YSZ and 10YSZ degradation at calcination isdescribed in [35]. XRD and neutron diffraction re-sults for calcined samples were compared with thosefor non-calcined ones in order to study this degra-dation. It was shown that the ionic conductivity nearlyhalved after 700 hour calcination. At further calcina-tion, this effect is not so significant. The authors of[35] considers these ionic conductivity behavior asbeing due to the changes in the vacancy structuresand variations in the ion nearest environment.Go]dschmidt’s ru]e is usua]]y used in the case
of other dopant application. This rule states that thecomplete isomorphism is possible only for the at-oms with the radii difference lower than 10-15% [36].It should be noted that the above statement is stillunder discussion. The authors of [37] suggestedthe alternative approach - to compare the cubic lat-tice parameter a of the base oxide with the sameparameter of the pseudo-cubic lattice of the dopingoxide.
For a long time, calcium oxide was used as abasic dopant [38], it was widely used in 1970th.However, stabilization into cubic fluorite-like struc-ture using calcium oxide faces a number of prob-lems. For this reason, nowadays ZrO
2-CaO system
is used as a model system only [39] in order to testnew synthesis approaches; it is not used now inthe electrochemical devices. Similarly, the use ofmagnesium oxide (MgO) is also ineffective [40] dueto the problematic stabilization into cubic fluorite-like structure with divalent alkali-earth cation.
As seen from Table 2, scandium oxide can beconsidered as one of the effective dopants for zirco-
196 N.N. Novik, V.G. Konakov and I. Yu. Archakov
nia compositions. The conductivity of 8ScSz wasstudied in [41]. It was shown that cubic structure inScSZ system is stabilized at dopant content of ~9%[42], while well-ordered -phase Sc
2Zr
2O
17 is formed
at a dopant content of 11-13%. Synthesis condi-tions as well as precursor and final ceramics treat-ment strongly affects phase composition in the sys-tem. The authors of [43] reported that the optimalconductivity in the system is reached at ~ 9.3% ofSc
2O
3. The hysteresis on the Arrhenius plot was
found for the solid solutions with the scandium ox-ide content higher than 10% at 500-600 °C, it isconsidered as being due to the b-phase transitioninto the cubic phase. On the other hand, such atransition does not produce significant changes inthe sample volume, [44] estimated this change asless than 0.15%. So, one can conclude that thisphase transition does not lead to intensive ceramicsamples destruction, for this reason, cubic phasestabilization is not necessary for the electrolyteapplication in electrochemical devices.
It should be noted that the application of ZrO2-
Sc2O
3 solid electrolytes is restricted by the signifi-
cant degradation of the compositions with low dopantconcentration (< 9%) at long lasting calcination orhigh temperature exploitation. But the high cost ofscandium oxide is a reason to use ZrO
2-Sc
2O
3 solid
electrolytes with low scandium oxide content inspite of the fact that these compositions are notoptimal regarding for their conductivity. There is nocommon explanation of the above mentioned deg-radation mechanism, segregation of the doping ox-ide along with the cubic phase stabilization or the
Oxide Ionic radius of the metal ion, nm
ZrO2
0.072HfO
20.078
CeO2
0.053CaO 0.099MgO 0.066Y
2O
30.092
Sc2O
30.081
Yb2O
30.086
In2O
30.081
Sm2O
30.100
Gd2O
30.097
Al2O
30.051
Er2O
30.089
Nd2O
30.104
Dy2O
30.092
Table 2. Ionic radii for some metal ions accordingto Ahrens.
well-ordered phase formation were considered assuch mechanisms . The problem of thermal degra-dation of ScSZ is discussed in detail in [44,45].Summarizing the existing data, we can state thatthe practical use of zirconia doped by scandiumoxide compositions with the dopant content lessthan 9% is impossible.
ZrO2-Yb
2O
3 system does not have this disadvan-
tage [45]. The optimal dopant content here is 8%.The conductivity of 8YbSZ sample decreases by0.1 S/cm after the 2000 hour calcination at 1000°C, while no conductivity change was registered for10YbSZ composition even for 6000 hour calcinationat the same temperature. However, the industrialuse of YbSZ is limited due to the high cost of ytter-bium oxide.
Indium oxide can be treated as a very perspec-tive dopant since its ionic radius is quite similar tothat for scandium oxide (see Table 2). Some com-positions of ZrO
2-In
2O
3 system were investigated in
[46-47]. It was shown that this system is character-ized by complex phase composition and a signifi-cant number of phase transitions. Cubic fluorite-likesolid solutions are formed at indium oxide contentin the range from 23.5 to 50%, tetragonal phase isformed at lower dopant content. Maximal conduc-tivity was registered for the composition with 25%of the dopant, this composition is also character-ized by maximal activation energy.
Pure ceria possesses fluorite-like structure.Samarium and gadolinium oxides, Sm
2O
3 and
Gd2O
3, respectively, are usually used as the dopants
for ceria [48]. The ionic conductivity of ceria solidelectrolytes at a dopant content of 10% is 2 10-2
S/cm in case of samarium oxide and 5.4 10-2
S/cm for Gd2O
3.
The general problem for ceria solid electrolyteapplication is the partial reduction of Ce4+ to Ce3+
[11,30] in the reduction ambience. In particular, suchconditions are typical for the fuel cell anode, some-times they are also possible at chemical sensorsexploitation. Such a transition gives rise to a num-ber of problems due to the n-type electronic con-ductivity that negatively affects electrochemical de-vices. An addition, possible deviations from stoichi-ometry and lattice expansion could cause materialembrittlement and be a reason of sample destruc-tion. The reaction of such transition following [49]can be written as:
X
Ce O 2 Ce2Ce O Vo 2O (g) 2Ce . (25)
According to [48], an increase in rare-earth ele-ment content facilitates Ce4+ Ce3+ transition.
197Zirconia and ceria based ceramics and nanoceramics – a review on electrochemical
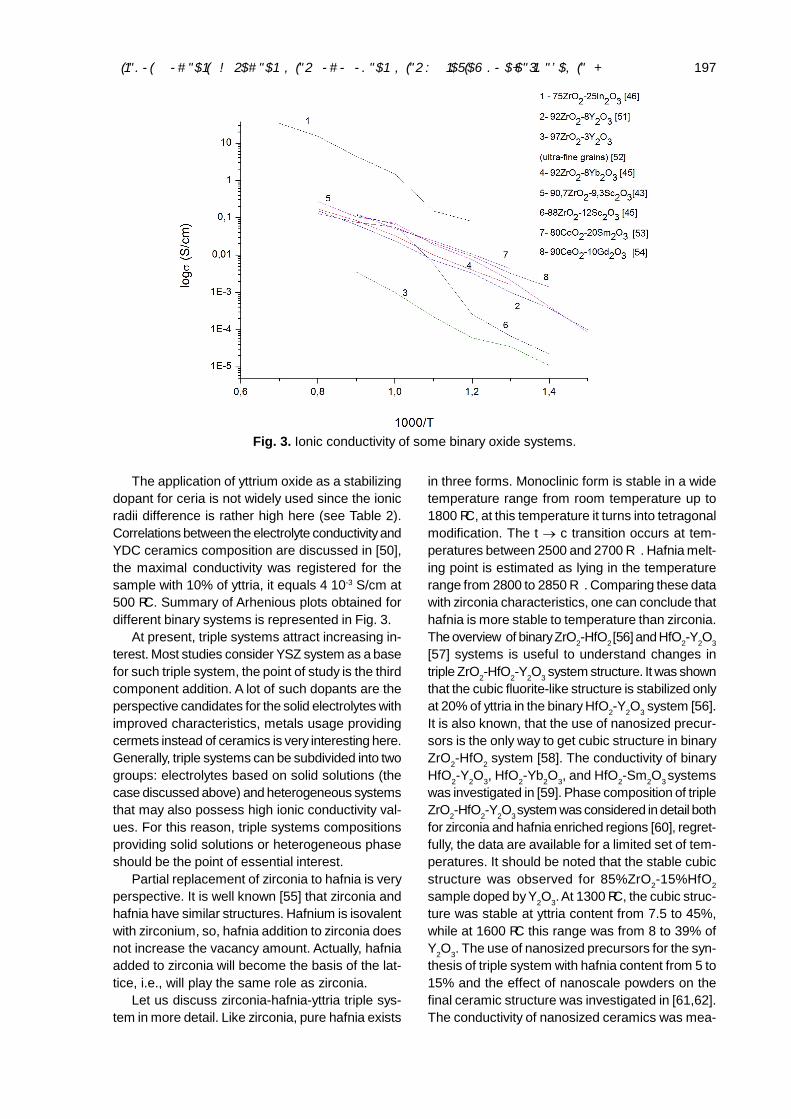
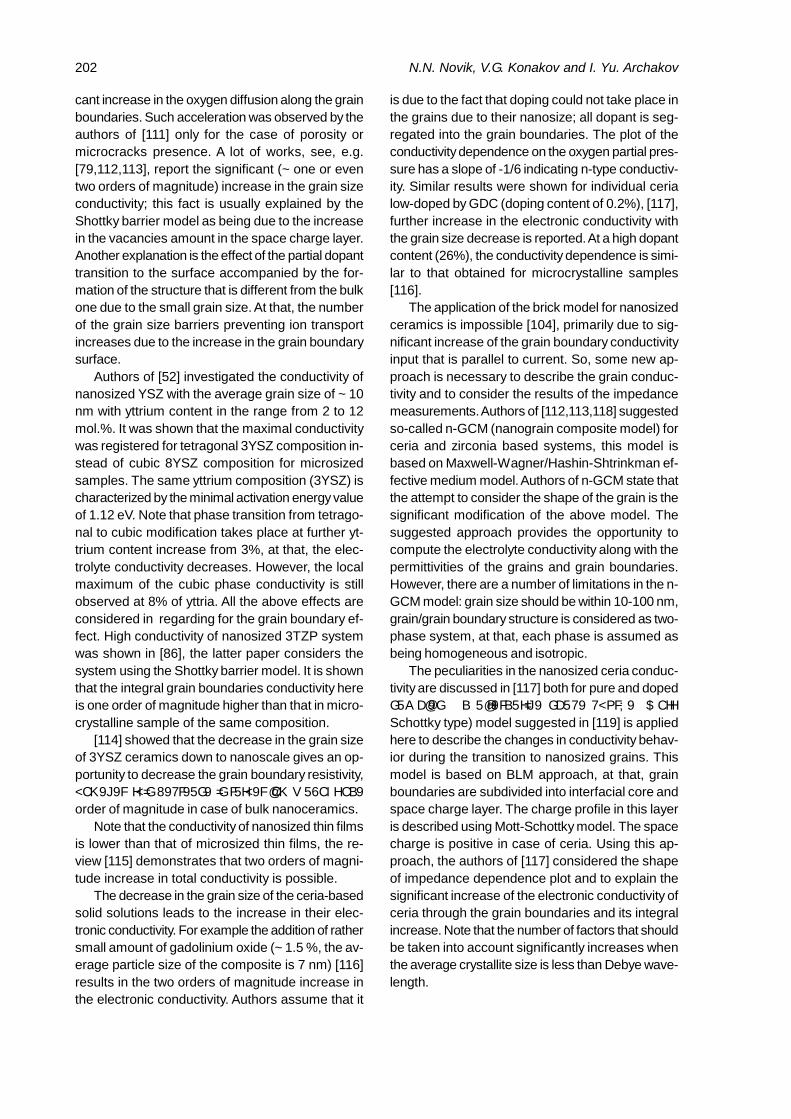
The application of yttrium oxide as a stabilizingdopant for ceria is not widely used since the ionicradii difference is rather high here (see Table 2).Correlations between the electrolyte conductivity andYDC ceramics composition are discussed in [50],the maximal conductivity was registered for thesample with 10% of yttria, it equals 4 10-3 S/cm at500 °C. Summary of Arhenious plots obtained fordifferent binary systems is represented in Fig. 3.
At present, triple systems attract increasing in-terest. Most studies consider YSZ system as a basefor such triple system, the point of study is the thirdcomponent addition. A lot of such dopants are theperspective candidates for the solid electrolytes withimproved characteristics, metals usage providingcermets instead of ceramics is very interesting here.Generally, triple systems can be subdivided into twogroups: electrolytes based on solid solutions (thecase discussed above) and heterogeneous systemsthat may also possess high ionic conductivity val-ues. For this reason, triple systems compositionsproviding solid solutions or heterogeneous phaseshould be the point of essential interest.
Partial replacement of zirconia to hafnia is veryperspective. It is well known [55] that zirconia andhafnia have similar structures. Hafnium is isovalentwith zirconium, so, hafnia addition to zirconia doesnot increase the vacancy amount. Actually, hafniaadded to zirconia will become the basis of the lat-tice, i.e., will play the same role as zirconia.
Let us discuss zirconia-hafnia-yttria triple sys-tem in more detail. Like zirconia, pure hafnia exists
Fig. 3. Ionic conductivity of some binary oxide systems.
in three forms. Monoclinic form is stable in a widetemperature range from room temperature up to1800 °C, at this temperature it turns into tetragonalmodification. The t c transition occurs at tem-peratures between 2500 and 2700 °C. Hafnia melt-ing point is estimated as lying in the temperaturerange from 2800 to 2850 °C. Comparing these datawith zirconia characteristics, one can conclude thathafnia is more stable to temperature than zirconia.The overview of binary ZrO
2-HfO
2 [56] and HfO
2-Y
2O
3
[57] systems is useful to understand changes intriple ZrO
2-HfO
2-Y
2O
3 system structure. It was shown
that the cubic fluorite-like structure is stabilized onlyat 20% of yttria in the binary HfO
2-Y
2O
3 system [56].
It is also known, that the use of nanosized precur-sors is the only way to get cubic structure in binaryZrO
2-HfO
2 system [58]. The conductivity of binary
HfO2-Y
2O
3, HfO
2-Yb
2O
3, and HfO
2-Sm
2O
3 systems
was investigated in [59]. Phase composition of tripleZrO
2-HfO
2-Y
2O
3 system was considered in detail both
for zirconia and hafnia enriched regions [60], regret-fully, the data are available for a limited set of tem-peratures. It should be noted that the stable cubicstructure was observed for 85%ZrO
2-15%HfO
2
sample doped by Y2O
3. At 1300 °C, the cubic struc-
ture was stable at yttria content from 7.5 to 45%,while at 1600 °C this range was from 8 to 39% ofY
2O
3. The use of nanosized precursors for the syn-
thesis of triple system with hafnia content from 5 to15% and the effect of nanoscale powders on thefinal ceramic structure was investigated in [61,62].The conductivity of nanosized ceramics was mea-
198 N.N. Novik, V.G. Konakov and I. Yu. Archakov
sured by the authors of [62]. Comparing the con-ductivity of binary YSZ electrolyte with the triplesystem sample containing 5% of hafnia, the authorsof [62] showed that the ionic conductivity of triplesystem sample at 1000 °C is ~10-4 S/cm, this valueis two order of magnitude lower than that of pure8YSZ at the same temperature. The higher is thehafnia content in the triple system, the higher is theionic conductivity. Authors suggested monoclinichafnia film formation on the sample surface to bethe factor that prevents crystal growth and blocksthe ionic transport. In turn, an increase in hafniacontent is a reason of blocking effect weakening.This assumption can be supported by the fact thatthe conductivity of triple system sample with 20%of hafnia is quite similar to that measured for 10YSZsample [63], i.e. the hafnia content increase elimi-nate the above discussed losses in conductivity. Allauthors agreed that conductivity of solid solutionswith hafnia addition is less dependent from thermaltreatment history. Moreover, triple system has lowerelectronic conductivity at low oxygen pressure (be-low 10-13 Pa) than binary YSZ samples; this char-acteristic is good for fuel cells and electrochemicalsensors.
Another oxide with a metal isovalent to zirco-nium in zirconia is titania (TiO
2). Comparing to
hafnium, titania possesses low solubility in zirco-nia due to significant difference in crystal structure.TiO
2 has a rutile structure. Hardening of zirconia
based materials is considered as the most expectedeffect of titania addition to zirconia and YSZ. An-other expected effect is an increase in electronicconductivity, that suggestion was confirmed in [64-65] for YSZ with 5% addition of titania. Authors of[66] investigated titania solubility mechanism in12YSZ. It was shown that TiO
2 addition up to 12%
leads to the lattice parameter a decrease; it is dueto the fact that titanium ions with ionic radii lowerthan zirconium ones (see Table 2) replace zirco-nium ions in the crystal lattice according the reac-tion
X
2 Zr OTiO Ti 2O , (26)
instead of interstitial dissolution mechanism
4+
2 Zr 2TiO Ti 2O (g) 4 e. (27)
Further increase of titania content does not af-fect lattice parameter, therefore, second phase for-mation takes place.Paper [67] discusses the investigation of phase tran-sitions in 2YSZ system with titania addition (from 2to 60%). Tetragonal and monoclinic solid solution
formation are reported at titania content up to 15%,this formation leads to the ionic conductivity mecha-nism appearance. Mixed electronic and ionic con-ductivity are present in case of ZrTiO
4 formation that
takes place at titania content from 40 to 50%.Triple ZrO
2-CeO
2-Y
2O
3 system is also interest-
ing [11]. The conductivity of this system has mixedmechanism at 800 °C and oxygen pressure rangefrom 1 to 10-18 atm. The value of the triple samplesconductivity is lower than that for YSZ samples [68].
Addition of 4 at.% and 10 at.% of Mn to YSZwas investigated in [69] and [70], respectively. Thetransport numbers of ~ 0.99 was reported for 4at.%Mn ceramics in p
2O
region from 10-15 to 105 Pa.It was shown that ionic conductivity prevails at thesame oxygen partial pressures in case of 10 at.%Mnsamples; p
2O
increase results in the conductivitydecrease.
ZnO can be also treated as a possible dopant toYSZ . Addition of zinc oxide to YSZ matrix with thedopant concentration from 0.5 to 10% was investi-gated in [71]. The samples were sintered at 1300°C for 2 hours. According to XRD data, cubic fluo-rite-like solid solutions were formed in all studiedsamples. ZnO addition positively affects various zir-conia properties. For example, the addition of 5%of zinc oxide results in the ceramic density increaseup to 96% at cold pressing against 89% for undopedsystem. Also it leads to significant decrease in grainboundary conductivity that was confirmed by im-pedance measurements at 300 °C. Probably, it isdue to oxide interaction with SiO
2 impurities, see
next section for detail. Total conductivity of the ce-ramics also increases at a small dopant addition.Maximal conductivity was observed at 0.5% of ZnO,it equals 2.89 10-2 S/cm against 1.31 10-2 S/cm inpure YSZ (data for 800 °C). Authors explain thisincrease as being due to an increase in the vacancyamount, however, further ZnO addition leads to va-cancy association.
Bi2O
3 is known as a good ionic conductor, in or-
der to combine the advantages of YSZ and Bi2O
3,
authors of [72] synthesized ZrO2-Y
2O
3-Bi
2O
3 system
samples and studied their conductivity. 21YSZ waschosen as a basic composition for Bi
2O
3-containing
compositions. Note that the above YSZ systemconsideration indicates that this composition is notvery perspective for manufacturing of solid electro-lytes with high ionic conductivity, the authors of [72]are not explaining this choice. It is reported thatBi
2O
3 addition of 1.5% provides system homogene-
ity. It should be mentioned that the sintering tem-perature for the samples of the discussed triple sys-tem was rather low (~1200 °C), this is due to rela-
199Zirconia and ceria based ceramics and nanoceramics – a review on electrochemical
tively low melting point of bismuth oxide. TEM analy-sis was performed to investigate grain boundaries,it was shown that these boundaries are enriched bybismuth oxide. Regretfully, the data on conductivityof bismuth oxide containing YSZ reported in [72]should be carefully checked since they are quitesimilar to that obtained for binary 21YSZ, the agree-ment is up to three decimal places.
The use of heterogeneous systems instead ofsolid solutions, i.e. the use of composite materials,is another way to increase solid electrolytes con-ductivity. Within such approach, alumina is the mostcommon addition to YSZ. Solubility of Al
2O
3 in zir-
conia is fairly low. According to [73], alumina solu-bility in 8YSZ is about 0.5-0.8% depending on sin-tering condition. The effect of this addition is con-tradictory.
Authors of [73] report that alumina addition withinsolubility limit increases the grain boundary resis-tance due to space-charge effect and decreasesthis resistance at alumina content exceeding thesolubility limit due to the interaction with SiO
2 im-
purities. Total conductivity slightly increases afterthe addition of 1% of Al
2O
3 and then decreases due
to vacancies association.Addition of small amount of other oxides to YSZ
and CGO is also perspective. Authors of [74] stud-ied the effect of 1.5% Fe
2O
3 addition to YSZ and
CGO, paper [75] reports positive results of0.5% Fe
2O
3 addition to CGO. It was stated that such
additions decrease electrolyte sintering temperatureand simplify their densification. In addition, grainboundary resistance decreases, this effect is moreperceptible for samples containing some impurities.Since the main impurity here is SiO
2, this result
can be due to the change of wetting nature of SiO2
phase. The discussed system behavior is evidentlyseen in case of CGO since the presence of rela-tively small amounts of Fe ions that possess smallersize than those of cerium and gadolinium ions in-creases the ion transport.
Since the synthesis of multicomponent systemsis rather complicated, there are only few papers onthese objects. Zr
0.88Sc
0.1Ce
0.01Y
0.01O
1.955 synthesized
by mechanochemical method is discussed in [76].This compound has an orthorhombic structure; itsconductivity is lower than that of binary ScSZ bythe factor of 4. Authors explained this fact by in-complete stabilization of cubic phase and by impu-rities in raw materials. Addition of 50% of alumna toZrO
2-HfO
2-Y
2O
3 system is discussed in [63]. Two
phase system was obtained, it was reported asbeing stable. The authors of [63] consider this com-position as a perspective one for electrochemical
sensors due to the fact that this system combinesfavorable for electrochemical sensors Nernst depen-dence typical for ZrO
2-HfO
2-Y
2O
3 with high mechani-
cal properties typical for alumina.Synthesis of YSZ- and GDC-based composites
by solid state method is reported in [77], the ex-tremely low components diffusion is mentioned.Sintering at 1300 °C for 3 days is necessary to pro-vide a slight diffusion resulting in formation of CeO
2
based cubic structure. Since the sintering proce-dure requires high temperature and long duration,its practical application seems to be ineffective.
7. THE EFFECT OFMICROSTRUCTURE ONE THEIONIC CONDUCTIVITY OF SOLIDELECTROLYTES
Solid electrolytes are polycrystalline materials, forthis reason, material microstructure greatly affectstheir properties. Since nanosized materials are thepoint of essential interest today, the effect of thegrain size on the final ceramics properties is one ofthe problems of current interest.
The brief review of the conductivity theory pre-sented above is certainly correct for monocrystals. The behavior of monocrystalline YSZ in a widerange of yttria concentration (from 6 to 16%) can befound in [78]. Analyzing the results of this work,one can conclude that there is only one semicircleon impedance curve in case of monocrystallinesample (see Fig. 1 as an example of the imped-ance curve).
Solid oxide materials synthesized by one of themethods described in Section 3 that are used inreal devices are usually polycrystalline materialswith different grain orientation. Internal structure ofpolycrystalline solid electrolytes greatly affects theirtransport properties. In the case of ceramics, onecan consider the conductivity as being due to grainswith the conductivity similar to that typical for monoc-rystals in the temperature range up to 700 °C [79]and due to grain boundaries. Generally, grain bound-ary ionic transport can proceed both faster than ingrain bulk as well as slower, sometimes, the typi-cal values can be some orders of magnitude lowerthan those for grain conductivity [80]. Thus, grainboundary conductivity could be considered as a criti-cal input to the total conductivity, this statement isevident in case of the grain size decrease leadingto the increase in the grain boundary input in thewhole structure.
Paper [27] written in 1969 was one of the firstworks discussing the structure influence on solid
200 N.N. Novik, V.G. Konakov and I. Yu. Archakov
electrolyte conductivity. The comparison of monoc-rystalline and polycrystalline 10YSZ ceramics wasperformed, the effect of SiO
2 impurities in the
samples was taken into account. The authors of[27] suggested an equivalent circuit for impedancemeasurements. It was shown that monocryctalshave only one semicircle on the impedance curve.Another early work on this point, [28], reported theinvestigation of grain and grain boundary conductiv-ity for CeO
2-CaO system.
SiO2 is the main type of impurities concentrated
on the grain boundaries, so, it is assumed as amain reason of the decrease in the grain boundaryconductivity. The source of silica can be raw mate-rials or additions necessary in the sintering proce-dure. Sometimes, impurities are considered as anindividual phase, this impurity phase can have dif-ferent properties depending on impurities composi-tion, thermal treatment history, treatment method,and other factors. It was shown in [81] that even0.2% of SiO
2 can decrease the grain boundary con-
ductivity by the factor of 15. This statement wasdone for zirconia based electrolytes, however, im-purities affect ceria solid solutions in the same way[82]. It is assumed that the decrease in the con-ductivity is due to thin silica film formation, this factwas proved by TEM and HREM in [83-85]. The ef-fect of silica and alumina content on the 3YTZPimpedance was investigated in [83]. It was reportedthat the increase in SiO
2 content leads to the con-
ductivity decrease, however, system impedance inindependent from silica content at high SiO
2 con-
centration. The authors consider that this effect isdue to the fact that maximal film thickness isachieved here. The existence of single silica phasecoating all the grain boundaries was also suggestedin [81]. In this case, the conductivity, i.e., the iontransport, should be carried out through this phase.However, we should mention that the difference inthe grain and grain boundary activation energies isvery low [86], this fact contradicts the above specu-lations.
Basing on the structure investigation, the authorsof [87,88] suggested the existence of three types ofgrain boundaries.1) “c]ean” grain boundaries, i.e. grain boundarieswithout impurity phase formation.2) grain boundaries containing amorphous phaseenriched by impurities especially SiO
2. The phases
are usually distributed at triple point, the grain bound-ary resistivity is significantly increased due to theseimpurities.3) Grain boundaries containing crystal oxide (e.gimpurities oxide) phase.
At the same time, grain boundary conductivityvalues in high-purity samples are at least an orderof magnitude lower than those registered for grainconductivities [89]. Solute segregation from grainsto grain boundaries is the most common explana-tion for this. Yttria enrichment of grain boundariesin YSZ samples was proved by XPS and AES [90-91]. The effect of segregation was also confirmedby molecular dynamic simulations [92]. It was sug-gested in [93] that the depletion in oxygen vacan-cies in the space-charged layers is the main rea-son of the resistivity increase. The above theoreti-cal approach seems reasonable since the activa-tion energies computed agree well with the experi-mental data [94].
It was shown in [95] that the mixed blockingmechanism caused both by impurity phases andby segregation is the most common case. Accord-ing to this paper, the minimal Ca segregation in CaSZcorresponds to a minimum in SiO
2 impurity con-
tent.Since the addition of small amounts of oxide
impurities can affect the grain boundary conductiv-ity of solid electrolytes, it is reasonable to discussalumina and other metal oxides addition consideredin the previous section from this point of view. Gen-erally, alumina doping negatively affects conductiv-ity, the optimal alumina content here according to[96] is 2%. Bismuth and iron oxides also decreasethe total conductivity [97].
High temperature ceramic sintering is anotherfactor affecting final ceramics conductivity. The ef-fect of YSZ green body sintering at 1350 °C on grainand grain boundary conductivities was studied in[98]. The increase in the sintering time from 1 hourto 4 hours leads to ~3 times rise in the grain bound-ary conductivity, while the grain conductivity remainsunchanged. This is probably due to densificationand grain growth in ceramics. We should note thatimpedance measurement was conducted only at400 °C, measurements in this temperature rangeare most sensitive to the grain boundary blockingeffect. Ceramics with high SiO
2 content is very sen-
sitive to sintering conditions [99]. GDC grain bound-ary conductivity increases 4 times due to additionalannealing at 1350 °C for 20 hours , various mecha-nisms can be considered to explain this fact. Mostlikely, this process is due to segregation of impuri-ties on the grain boundaries. Thermal pretreatmentof YSZ before sintering can purify it from silica dueto SiO
2 nucleation on YSZ particles surface, [100],
the authors of the work report the positive effect of20 hour pretreatment. High cooling speed after sin-tering [101] also positively affects the grain bound-
201Zirconia and ceria based ceramics and nanoceramics – a review on electrochemical
ary conductivity, possibly, it is due to less silicaamounts extruded from the bulk to the grain bound-ary.
Let us briefly consider some mathematics nec-essary to describe the conductivity process. Fulldetermination of the whole process is rather com-plicated task, for this reason, some models areusually used. Brick-layer model (BLM) proposed in[102] and named after Burgraaf [103] is a standardapproach for microsized ceramics modeling. Themain advantages [104] of BLM are good correlationof calculated structural and electrochemical param-eters with the experimental data and the opportu-nity of unambiguous treatment of impedance curvearcs allowing to calculate activation energy, resis-tance, and other parameters. Grains in this modelare roughly considered as cubic-shaped with theedge length d
g, they are divided by grain boundaries
with a thickness gb
. For sample with the length Land cross sectional area A, one will have
L ARb b
/ , (28)
L ARgb gb
/ , (29)
where Rb and R
gbare grain and grain boundary re-
sistance obtained from impedance curve, respec-tively.
Specific grain boundary conductivity is very im-portant too. It presents the conductivity of the grainboundary region with a thickness of
gb. The depen-
dence of the specific grain boundary conductivityon the total grain boundary conductivity is expressedby the equation:
d
T
gb gbsp
gb
g
. (30)
Classic or so called S-BLM brick layer modeltakes into account serial connection of grains only,hence, some grains do not participate in the com-putation. SP-BLM [105] is the evolution of the theorywhich considers both serial and parallel grain con-nections. Both theories are physically unrealistic inthe case of significant grain boundary area, particu-larly, in case of nanoceramics. The most strict ver-sion of the brick-]ayer mode] is “Nested cube” mode]considering 3D-enviroment of atoms, all grain sizescan be described by this model. However, math-ematical apparatus of the theory is significantlycomplicated, the equation cannot be solved ana-lytically here. So, single calculation requires a lotof time and “Nested cube” is inappropriate for trivia]calculations. For this reason, we can state that
nanosized solid electrolytes conductivity descrip-tion requires its own models.
8. THE EFFECT OF THE GRAIN SIZEON CERAMIC CONDUCTIVITY.NANOSIZES CERAMICS
The grain size in the ceramics greatly affects itsconductivity, primarily, it is due to the changes inthe role of grain boundary at the grain size decrease.Note that there is no standard approach to grainsize estimation, different approaches can be foundin scientific literature. The most common procedureis the estimation of the average grain size basingon the results of scanning electron microscopy(SEM). However, sometimes crystallite size in caseof nanocrystalline precursor powders can be esti-mated from X-ray diffraction (XRD) data, as well asfrom the sorption/desorption investigations using theBET theory. Analyzing and comparing the data onthe ceramics grain size, one should be very carefulsince in spite of the above data collected within dif-ferent approaches are similar and show the samebehavior, they are not identical [106,107].
Comparing the effect of grain size on solid elec-trolytes conductivity, one can conclude that sucheffects are different for micro- and nanosized elec-trolytes. Microsized electrolytes were well studiedin 1970th, see YSZ studies in [93,108]. It was shownthat the integral conductivity of solid electrolytesdecreases with the grain size decrease in the aver-age grain size range from 20 to 0.2 m. At that, theresults of the impedance spectroscopy that providesthe opportunity to separate the inputs in this inte-gral conductivity clearly indicate that the grain sizeconductivity slightly increases during the grain sizedecrease, while the grain boundary conductivity in-creases.
Solid electrolytes based on nanosized ceram-ics are nowadays considered as very perspectivematerials [109-110]. Conventionally, ceramics withthe average grain size less than 100 nm is callednanosized ceramics or nanoceramics [79]. The ef-fect corresponding to the transition from micro tonanosized particles is more complicated.
The authors of [111] investigated the oxygentransport in nanosized dense YSZ using the iso-tope exchange method. This study was carried outsince the results of [92] demonstrate that theamount of oxygen vacations in the grain boundarycore is higher than that in the bulk. Thus, one canassume the acceleration of the oxygen ion trans-port in the grain boundary core along these grainboundaries. At that, there was not found any signifi-
202 N.N. Novik, V.G. Konakov and I. Yu. Archakov
cant increase in the oxygen diffusion along the grainboundaries. Such acceleration was observed by theauthors of [111] only for the case of porosity ormicrocracks presence. A lot of works, see, e.g.[79,112,113], report the significant (~ one or eventwo orders of magnitude) increase in the grain sizeconductivity; this fact is usually explained by theShottky barrier model as being due to the increasein the vacancies amount in the space charge layer.Another explanation is the effect of the partial dopanttransition to the surface accompanied by the for-mation of the structure that is different from the bulkone due to the small grain size. At that, the numberof the grain size barriers preventing ion transportincreases due to the increase in the grain boundarysurface.
Authors of [52] investigated the conductivity ofnanosized YSZ with the average grain size of ~ 10nm with yttrium content in the range from 2 to 12mol.%. It was shown that the maximal conductivitywas registered for tetragonal 3YSZ composition in-stead of cubic 8YSZ composition for microsizedsamples. The same yttrium composition (3YSZ) ischaracterized by the minimal activation energy valueof 1.12 eV. Note that phase transition from tetrago-nal to cubic modification takes place at further yt-trium content increase from 3%, at that, the elec-trolyte conductivity decreases. However, the localmaximum of the cubic phase conductivity is stillobserved at 8% of yttria. All the above effects areconsidered in regarding for the grain boundary ef-fect. High conductivity of nanosized 3TZP systemwas shown in [86], the latter paper considers thesystem using the Shottky barrier model. It is shownthat the integral grain boundaries conductivity hereis one order of magnitude higher than that in micro-crystalline sample of the same composition.
[114] showed that the decrease in the grain sizeof 3YSZ ceramics down to nanoscale gives an op-portunity to decrease the grain boundary resistivity,however, this decrease is rather ]ow – about oneorder of magnitude in case of bulk nanoceramics.
Note that the conductivity of nanosized thin filmsis lower than that of microsized thin films, the re-view [115] demonstrates that two orders of magni-tude increase in total conductivity is possible.
The decrease in the grain size of the ceria-basedsolid solutions leads to the increase in their elec-tronic conductivity. For example the addition of rathersmall amount of gadolinium oxide (~ 1.5 %, the av-erage particle size of the composite is 7 nm) [116]results in the two orders of magnitude increase inthe electronic conductivity. Authors assume that it
is due to the fact that doping could not take place inthe grains due to their nanosize; all dopant is seg-regated into the grain boundaries. The plot of theconductivity dependence on the oxygen partial pres-sure has a slope of -1/6 indicating n-type conductiv-ity. Similar results were shown for individual cerialow-doped by GDC (doping content of 0.2%), [117],further increase in the electronic conductivity withthe grain size decrease is reported. At a high dopantcontent (26%), the conductivity dependence is simi-lar to that obtained for microcrystalline samples[116].
The application of the brick model for nanosizedceramics is impossible [104], primarily due to sig-nificant increase of the grain boundary conductivityinput that is parallel to current. So, some new ap-proach is necessary to describe the grain conduc-tivity and to consider the results of the impedancemeasurements. Authors of [112,113,118] suggestedso-called n-GCM (nanograin composite model) forceria and zirconia based systems, this model isbased on Maxwell-Wagner/Hashin-Shtrinkman ef-fective medium model. Authors of n-GCM state thatthe attempt to consider the shape of the grain is thesignificant modification of the above model. Thesuggested approach provides the opportunity tocompute the electrolyte conductivity along with thepermittivities of the grains and grain boundaries.However, there are a number of limitations in the n-GCM model: grain size should be within 10-100 nm,grain/grain boundary structure is considered as two-phase system, at that, each phase is assumed asbeing homogeneous and isotropic.
The peculiarities in the nanosized ceria conduc-tivity are discussed in [117] both for pure and dopedsamp]es. An a]ternative space-chàrge (Mott-Schottky type) model suggested in [119] is appliedhere to describe the changes in conductivity behav-ior during the transition to nanosized grains. Thismodel is based on BLM approach, at that, grainboundaries are subdivided into interfacial core andspace charge layer. The charge profile in this layeris described using Mott-Schottky model. The spacecharge is positive in case of ceria. Using this ap-proach, the authors of [117] considered the shapeof impedance dependence plot and to explain thesignificant increase of the electronic conductivity ofceria through the grain boundaries and its integralincrease. Note that the number of factors that shouldbe taken into account significantly increases whenthe average crystallite size is less than Debye wave-length.
203Zirconia and ceria based ceramics and nanoceramics – a review on electrochemical
9. THE EFFECT OF GRAIN SIZE ONCERAMICS STRENGTH
In addition to electrochemical properties of solidelectrolytes, the mechanical strength of the ceram-ics should be accounted for at their application inelectrochemical devices. This strength is especiallyimportant for the fuel cell anodes manufactured fromzirconia based ceramics, because such anodes arewidely used as a supporting unit for the whole fuelcell [120], this statement is also valid for the caseof electrochemical sensors [121]. Complex approachis required to provide the proper value of the ceram-ics mechanical strength. Factors affecting the me-chanical strength of the materials and, in particular,zirconia based ceramics, are considered in [122-124]. Note that the mechanical strength of zirconiabased ceramics is much better studied that ceriabased ceramics strength. This is due to the factthat ZrO
2-based compositions are widely used as
barrier coatings, refractory materials, and implantsin dentistry and traumatology. As was mentionedabove, nanosized ceramics, including bulknanosized ceramics, is a point of essential interestfor modern applications. For this reason, the effectof the grain size on the mechanical strength of theceramics will be considered in this section, thisconsideration will be an important addition to theabove given review of the grain size effect of thesolid electrolytes conductivity.
There are a lot of zirconia based ceramics com-positions possessing high mechanical strength. Anumber of tetragonal (TZP) modification composi-tions, cubic ones (SZ), and cubic with some tet-ragonal additions into the ceramic matrix composi-tions of the standard ZrO
2 –Y
2O
3 system are char-
acterized by rather high mechanical strength. Itshould be also mentioned that ziconia is sometimesused as an addition increasing the mechanicalstrength of the wide range of oxide ceramics. How-ever, high mechanical strength coupled with highionic conductively is typical for 8YSZ and 3YTZPcompositions only, see the previous Section.
The dependence of the solid electrolyte mechani-cal strength on the grains size was registered andaveraged in [125] for tetragonal zirconia low-dopedby yttria. The existence of some critical grain size(300 nm in case of discussed system) is stated.The significant decrease in the ceramics strengthtakes place at the grain size higher than this criti-cal value, authors of [125] consider this decreaseas being due to significant increase in the contentof monoclinic phase and the decrease in matrixability to withstand destruction of the matrix con-
taining metastable tetragonal modification. At thesame time, fracture toughness of YTZP with yttriacontent from 2 to 5% is independent from the grainsize [126] for all compactification approaches.
Authors of [127-128] performed the experimen-tal study of 8YSZ, 9CeSZ, and some triple Y
2O
3-
CeO2-ZrO
2 system compositions at 1000 °C. Note
that authors are discussing the size of initial ag-glomerates instead of the grain size, so, it is ratherdifficult to compare their results with reported in otherworks. The significant increase in the ceramicsmechanical strength is reported for the investigatedcompositions at the agglomerate size lower than 1m. Generally, strength dependence agree with the
above mentioned results obtained for metastabletetragonal zirconia modification, however, the resultsreported in [127-128] cannot be explained by simi-lar mechanisms. The strength of 8YSZ composi-tion is shown to be higher than that for triple sys-tem samples (~450 and ~350 MPa, respectively)for the samples with the average agglomerate size~ 100 nm. CeSZ shows some extremum on thestrength vs agglomerate size dependence with amaximum value corresponding to 100 nm. Thismaximum can be explained by the change in thecerium ion valence proved by ESCA analysis, prob-ably it is due to the increasing cerium reductionresulting from the increase in the grain surface area.The strength of ceria doped solid solutions is re-ported to be higher than that for yttria dopedsamples.
There is some gap in the data on the ceria basedceramics mechanical strength, it is mainly due toits lower strength causing impossibility of wide ap-plication in devices and as implants. For example,SDC bending strength is 4.5 times lower than thatof YSZ ceramics [129]. However, [130] reported thatfracture toughness of 20GDC is quite independentfrom the grain size, it was measured as ~ 1.5MPa m1/2 for the grain sizes ranging from 0.5 to 9.5mm. The addition of CoO as a sintering agent alsodoes not lead to some strength vs grain size de-pendence [131].
It should be also noted that there are a lot prob-lems dealing with dense ceramics manufacturingfrom nanosized precursor powders, these problemsalso negatively affect ceramic density [132]. Higherpressure should be applied here, an alternative ishot isostatic pressing. For this reason, the cost ofceramics synthesized using nanosized precursorpowders is rather high. Authors of [133] suggestedto increase the calcination temperature, however,this complicates the treatment process, in addition,
204 N.N. Novik, V.G. Konakov and I. Yu. Archakov
such a temperature increase may cause grain en-largement and change the ceramics structure.
Summarizing the above consideration, we canstate that the decrease in the grain size could re-sult in the ceramics strength increase, however, theuse of nanoparticles is complicated and causessome problems at ceramics calcination and treat-ment, high density could be obtained by using spe-cialized compactification approaches. In addition,the cost of nanoparticle synthesis is higher thanthe standard ceramic powders production. So, somecompromise decisions are necessary to couple theadvantages of nanoparticles use with labor/cost ef-fectiveness.
10. CONCLUSIONS
1. Zirconia and ceria based solid solutions couldpossess high ionic conductivity due to dopingmechanism, at that, the input of electronic conductiv-ity is negligible.2. Approaches used for the precursor powders prepa-ration and ceramics densification procedures greatlyaffect solid oxide electrolytes structure and trans-port properties.3. The use of solid solutions based on triple sys-tems with hafnium, titanium, and some other metaloxide additions provides an opportunity to increasethe range of temperature and mechanical stabilityof the electrochemical devices widening the rangeof their application.4. The decrease of the grain size down to nanoscaleregion could result in the significant decrease in thegrain boundary resistivity, however, the integral ce-ramics conductivity also decreases.5. The behavior of the ceramics conductivity withthe microsized grains could be described using BLMapproach, while the nanosized ceramics descrip-tion requires new approaches, n-GCM model couldbe used for this task.6. n-type electronic conductivity prevails over ionicconductivity occurring via doping mechanism in pureand low-doped ceria.7. The decrease in the grain size results in the in-crease in the mechanical strength of zirconia basedceramics, however, its manufacturing becomes morecomplicated.
ACKNOWLEDGEMENTS
This work was supported by the Russian ScienceFoundation (Research Project 14-29-00199).
REFERENCES
[1] B.C. Steele and A. Heinzel // Nature 414(2001) 345.
[2] N.Q. Minh // J. Am. Ceram. Soc 76 (1993)563.
[3] J.W. Fergus // J. Pow Sourc. 162 (2006) 30.[4] S. Akbar, P. Dutta and C. Lee // Int. J. Appl.
Ceram. Technol. 3 (2006) 302.[5] C.C. Chao, C.M. Hsu, Y. Cui and F.B. Prinz //
ACSNano 5 (2011) 5692.[6] N. Mahato, A. Gupta and K. Balani //
Nanomaterials and Energy 1 (2011) 27.[7] P. Kofstad and T. Norby, Defects and
Transport in Crystalline Solids (University ofOslo, Oslo, 2007).
[8] M.V. Kravchinskaya, In: Phase Diagram ofsystems of Refractory Oxides, ed. by F. Ya.Galahov (Nauka, Leningrad, 1985), p. 303, InRussian
[9] N.Q. Minh and T. Takahashi, Science andTechnology of Ceramic Fuel Cells (Elsevier,Amsterdam, 1995).
[10] A.R. West, Solid State Chemistry and ItsApplication (Willey, Chichester, 2014).
[11] V.S. Galkin, V.G. Konakov, A. V. Shorohovand E. N. Solovieva // Reviews on AdvancedMaterials Science 10 (2005) 353.
[12] E.A. Ivanova, V.G. Konakov and E.N.Solovieva // Rev. Adv. Mater. Sci. 4 (2003)41.
[13] Ŕ. Brune, M. Lajavardi, D. Fisler andJ. Wagner // Solid State Ionics 106 (1998)89.
[14] V.K. Ivanov, G.P. Kopitsa, S.V. Grigoriev,O.S. Polezhaeva and V.M. Garamus //Physics of Solids 52 (2005) 898, In Russian.
[15] W.H. Rhodes // J. Am. Ceram. Soc. 64(1981) 638.
[16] T. Masaki // J.Am.Ceram.Soc. 69 (1986) 638.[17] A.P. Druschitz and J.G. Schroth // J. Am.
Ceram. Soc. 72 (1989) 1591. [18] H.V. Atkinson and S. Davies // Metallurgical
and Materials Transactions A 31A (2000)2981.
[19] J.Langer, M.J. Hoffmann and O.Guillon //J. Am. Ceram. Soc. 94 (2011) 24.
[20] V. Ivanov, S. Paranin, V. Khrustov, A.Medvedev and A. Shto]’ts %% Key Eng. Mater.206 (2002) 377.
[21] U. Anselmi-Tamburini, J.E. Garay and Z.A.Munir // Scripta Materialia 54 (2006) 823.
[22] P. Miglioralo and V. Parish // Appl. Phys.Lett. 44 (1984) 225.
205Zirconia and ceria based ceramics and nanoceramics – a review on electrochemical
[23] S. Ekelof // Eng. Sci and Educ. J. 10 (2001)37.
[24] W.L. Fielder, H.E. Kautz, J.S. Fordyce andJ. Synger // J. Electrochem. Soc. 122 (1975)528.
[25] Z.B. Stoinov, B.M. Graphov, B. Savova-Stoinova and V.V. Elkin, ElecrtrochemicalImpedance (Nauka, Moscow, 1991), InRussian.
[26] H. Inaba and H.Tagava // Solid State Ionics83 (1996) 1.
[27] J.E. Bauerle // J. Phis. Chem. Solids30(1969) 2657.
[28] K.E. Adham and A. Hammou // Solid StateIonics 9 (1983) 905.
[29] W. Nernst // Z. Elektrochem. 6 (1899) 41.[30] V.V. Kharton, F.M.B. Marques and
A.Atkinson // Solid State Ionics 174 (2004)135.
[31] J.A. Kilner and R.J. Brook // Solid StateIonics 6 (1982) 237.
[32] U.Anselmi-Tamburini, F.Maglia, G. Chiodelli,P. Riello and S. Buchella // Appl. Phys. Lett.89 (2006) 163116.
[33] J.A. Dawson and I.Tanaka // Langmuir 30(2014) 10456.
[34] X. Guo and R.Yuan // Solid State Ionics 80(1995) 159.
[35] C. Haering, A. Roosen and H.Schichl // SolidState Ionics 176 (2005) 253.
[36] V. Goldschmidt // Zeit. Krist. 28 (1987) 1, InGerman.
[37] Solid State Chemistry, ed. by J.A. Kilner in:R.Metselaar, H.J.M. Heijinger and J.Schoonman (Elseiver Science Ltd.,Amsterdam, 1982).
[38] T.H. Etsell and S.N. Flengas // ChemicalReviews 70 (1970) 339.
[39] O.Yu Kurapova, V.G. Konakov, S.N. Golubev,V.M. Ushakov and I.Yu. Archakov // Rev. Adv.Mater. Sc. 32 (2012) 112.
[40] T. Settu // Ceramics International 26 (2000)517.
[41] M. Angeles-Rosas, M. A. Camacho-Lopezand E. Ruiz-Trejo // Solid State Ionics 181(2010) 1349.
[42] S.P.S. Badwall, F.T. Chiacchi, S. Rajedranand J. Drennan // Solid State Ionics 109(1998) 167.
[43] S.P.S. Badwall, F.T. Chiacchi andD. Milosevic // Solid State Ionics 136 (2000)91.
[44] C. Haering, A. Roosen, H. Schichl andM.Schnoller // Solid State Ionics 176 (2005)261.
[45] O. Yamamoto, Y. Arati, Y. Takeda,N. Imanishi, Y. Mizutani, M. Kawai andY. Nakamura // Solid State Ionics 79 (1995)137.
[46] L.J. Gauckler and K.Sasaki // Solid StateIonics 75 (1995) 203.
[47] D.K. Hohnke // J. Phys. Chem. Solids. 41(1980) 777.
[48] B.C.H. Steele // Solid State Ionics 129(2000) 95.
[49] M. Mogensen, N.M. Sammes and G.A.Tompsett // Solid State Ionics 129 (2000) 63.
[50] D.R. Ou, T. Mori, F. Ye, M. Takahashi, J.Zouand J. Drennan // Acta Materialia 54 (2006)3737.
[51] M. Mori, T.Abe, H. Itoh, O.Yamamoto,Y.Takeda and T.Kawahara // Solid StateIonics 74 (1994) 157.
[52] R. Ramamoorthy, D. Sundararaman andS. Ramasamy // Solid State Ionics 123(1999) 271.
[53] J. Van Herle,T. Horita, T. Kawada, N. Sakai,H. Yokokawa and M. Dokiya // Solid StateIonics 86-88 (1996) 1255.
[54] T. Kudo and H. Obayashi // J. Electrochem.Soc. 123 (1976) 415.
[55] V. B. Glushkova, M.V. Kravchinskaya, A. K.Kuznetsov and P.A. Tikhonov, HafniumDioxide and Its Compounds with Rare-earthElements (Nauka, Leningrad, 1984), InRussian.
[56] C. Wang, M. Zinkevich and F. Aldinger //J. Amer. Ceramic Soc. 89 (2006) 3751.
[57] B. Matovic, D. Bucevac, M. Prekajski,V. Maksimovic, D. Gautam, K. Yoshida andT. Yano // J. of European Ceram. Soc. 32(2012) 1971.
[58] C. Lu, J.V. Raitano, S. Khalid, L. Zhang andS. Chan // Journal of Applied Physics 103(2008) 124303.
[59] M.F. Trubelja and V.S. Stubican // Journal ofAmer. Ceram. Soc 74 (1991) 2489.
[60] M.F. Trubelja and V.S. Stubican // Journal ofAmer. Ceram. Soc 71 (1988) 662.
[61] E.A. Ivanova, V.G. Konakov and E.N.Solovieva // Rev. Adv. Mater. Sci.10 (2005)357.
[62] T.I. Panova, V.B. Glushkova, A.V. Lapshinand V.P. Popov // Glass Physics andChemistry 29 (2003) 93.
[63] S. Zhuiykov // Journal Of European Ceram.Soc. 20 (2000) 967.
[64] W.L. Worell // Solid State Ionics 52 (1992)147.
206 N.N. Novik, V.G. Konakov and I. Yu. Archakov
[65] K. Kobayashi, Y. Kai, S. Yamaguchi, N.Fukatsu, T. Kawashima and Y. Iguchi // SolidState Ionics 93 (1997) 193.
[66] S.S. Liou and W.L. Worell // Appl. Phys. 49(1989) 25.
[67] G. Rog and G. Borchardt // CeramicsInternational 22 (1996) 149.
[68] T.H. Kimpton, J. Randle and Drennan // SolidState Ionics 149 (2002) 89.
[69] T. Kawada, N. Sakai, H.Yokoawa andM. Dokiya // Solid State Ionics 53-56 (1992)418.
[70] M.K. Mahapatra, N. Li, A. Verma andP. Singh // Solid State Ionics 253 (2013) 223.
[71] Y. Lio and L.E. Lao // Solid State Ionics 177(2006) 159.
[72] A.J.A Winnubst and A.J. Burgraaf // Mat.Res. Bull 19 (1984) 613.
[73] X. Guo // J. Am. Ceram. Soc. 86 (2003)1867.
[74] Q. Dong, Z.H. Du, T.S. Zhang, J. Lu, X.C.Song and J. Ma // International Journal ofHydrogen Energy 34 (2009) 7903.
[75] T.S. Zhang, J. Ma, L.B. Kong, S.H. Chan,P. Hing and J. Kilner // Solid State Ionics 167(2004) 203.
[76] V.V Zyryanov, N.F. Uvarov, V.A Sadykov, A.S.Ulihin, V.G Kostrovskii, V.P. Ivanov, A.T. Titovand K.S. Paichadze // Journal of Alloys andCompounds 483 (2009) 535.
[77]. G.A. Tompsett and N.M. Sammes // Journalof Amer. Ceram. Soc. 80 (1997) 3181.
[78] S. Ikeda, O. Sakurai, K. Uematsu,N. Mizutani and M. Kato // Journal ofMaterials Science 20 (1985) 4593.
[79] V. Ivanov, S. Shkerin, A. Lipilin, A. Nikonov,V. Khrustov and Al. Rempel //Electrochemical Energy 10 (2010) 3, InRussian.
[80] X. Guo and R. Waser // Progress in MaterialScience 51 (206) 151.
[81] S.P.S. Badwal and S. Rajendran // SolidState Ionics 70/71 (1994) 83.
[82] R. Gerhardt and A.S. Nowick // Journal ofAmer. Ceram. Soc. 69 (1986) 641.
[83] M. Godickemeier, B. Michel, A. Oriukas,P. Bohac, K.Sasaki, L. Gauckler,H. Heinrich, P. Schwander, G. Kostorz,H. Hofmann and O. Frei // J. Mater. Res.9 (1994) 1228.
[84] M.L. Mecartney // Journal of Amer. Ceram.Soc. 70 (1987) 54.
[85] E.P. Butler // J. Microsc. 140 (1985) 171.
[86] X. Guo and Z. Zhang // Acta Mat. 51 (2003)2539.
[87] X. Guo, C.Q. Tang and R.Z. Yuan // J. Eur.Ceram. Soc. 15 (1995) 25.
[88] X. Guo and R.Z. Yuan // J. Mater. ScienceLett. 14 (1995) 25.
[89] G.M. Christie and F.P.F. van Berkel // SolidState Ionics 83 (1996) 17.
[90] A.E. Hugnes and B.A. Sexton // J. Mater.Sci. 24 (1989) 1057.
[91] G.S.A.M. Teunissen, A.J.A. Winnubst andA.J. Burggraaf // J. Mater. Sci. 29 (1992)5057.
[92] C.A.J. Fisher and S. Matsuraba // J. Europ.Ceram. Soc. 19 (1999) 703.
[93] X. Guo and Y. Ding // J. Electrochem. Soc.151 (2003) J1.
[94] D. Bingham, P.W. Tasker and A.N. Cormack// Philos. Mag. A 60 (1989) 1.
[95] M. Aoki, Y. Chiang, I. Kosacki, L. J. Lee,H. Tuller and Y. Liu // J. Amer. Ceram. Soc.79 (1996) 1169.
[96] M. Filal, C. Petot, M. Mokchah, C. Chateauand J.L. Carpentier // Solid State Ionics 80(1995) 27.
[97] M.J. Verkerk, A.J.A. Winnubst and A.J.Burgraaf // J. Mater. Sci. 17 (1982) 3113.
[98] D.Z. de Florio and R. Muccillo // Solid StateIonics 123 (1999) 301.
[99] D. Kim, P. Cho, J. Lee, D. Kim and S.B. Lee// Solid State Ionics 177 (2006) 2125.
[100] J. Lee, T. Mori, J. Li, T. Ikegami, M.Komatsu and H. Haneda // J. Electrochem.Soc. 147 (2000) 2822.
[101] A. Rizea, C. Petot, G. Petot-Ervas, M.J.Graham and G.I. Sproule // Ionics 7 (2001)72.
[102] N.M. Beekmans and L. Heyne //Electrochim. Acta 21 (1976) 23.
[103] T. van Dijk and A.J. Burgraaf // Phys. Stat.Solidi A. 63 (1981) 229.
[104] N.J. Kidner, N.H. Perry and T.O. Mason //J. Amer. Ceram. Soc. 91 (2008) 1733.
[105] H. Nafe // Solid State Ionics 13 (1984) 255.[106] J. Khare, M.P. Joshi, S. Satapathi,
H. Srivastava and L.M. Kukreja // Ceram.Int. 40 (2014) 14677.
[107] A. Heel, A. Vital, P. Holtappels andT. Graule // J. Electroceram. 22 (2009) 40.
[108] A.I. Ioffe, M.V. Inozemtsev, A.S. Lipilin, M.V.Perfilev and S.V. Karpachov // Phys. Stat.Sol. 30 (1975) 87.
207Zirconia and ceria based ceramics and nanoceramics – a review on electrochemical
[109] H.L. Tuller // Solid State Ionics 131 (2000)143.
[110] J. Schoonman // Solid State Ionics 135(2000) 5.
[111] R.A. De Souza, M.J. Pietrowski,U. Anselmi-Tamburini, S. Kim, Z.A. Munirand M. Martin // Phys. Chem Chem Phys.10 (2008) 2067.
[112] N.H. Perry, S. Kim and T.O.Mason //J. Mater. Sci. 43 (2008) 4684.
[113] N.H. Perry and T.O. Mason // Solid StateIonics 181 (2010) 276.
[114] X. Guo // Scripta Mat. 65 (2011) 96.[115] S. Hui, J. Roller, S. Yick, X. Zhang,
C. Deces-Petit, Y. Xie, R. Maric andD. Ghosh. // J. Pow. Sources 172 (2007)493.
[116] Y.M. Chiang, E.B. Lavik and D.A. Bloom //Nanostructured Mater. 9 (1997) 633.
[117] S. Kim and J. Maier // J. Electrochem. Soc.149 (2002) J73.
[118] T.C.Yeh, N.H. Perry and T.O. Mason //J. Am. Ceram. Soc. 94 (2011) 1073.
[119] A. Tshope, E. Sommer and R. Birringer //Solid State Ionics 139 (2001) 255.
[120] S.C. Singhal and K. Kendal, HighTemperature Solid Oxide Fuel Cells:Fundamentals, Design and Applications(Elsevier, Oxford, 2003).
[121] S. Zhuiykov, Electrochemistry of ZirconiaGas Sensors (CRC Press, Boca Raton,2008).
[122] I. Birkby and R. Stevens // Key EngineeringMaterials 122-124 (1996) 527.
[123] J.R.Kelly and I. Denry // Dental Materials 24(2008) 289.
[124] P. Bosh and J.C. Niepce, CeramicMaterials: Processing, Properties andApplication (Antony Rowe ltd., Chippenham,2007).
[125] T.K. Gupta, F.F. Lange and J.H. Bechtold //J. Mater. Sci. 13 (1978) 1464.
[126] T. Masaki // J. Amer. Chem.Soc. 69 (1986)638.
[127] V.G. Konakov, S. Seal, E.N. Solovieva,M.M.Pivovarov, S.N. Golubev and A.V.Shorochov // Rev. Adv. Mater. Sci. 13 (2006)71.
[128] V.G. Konakov, S. Seal, E.N. Solovieva, D.A.Ivanov-Pavlov, M.M.Pivovarov, S.N. Golubevand A.V. Shorochov // Rev. Adv. Mater. Sci.16 (2007) 96.
[129] J.W.Adams, R. Ruh and K.S. Mazdiyasni //J. Amer. Ceram. Soc. 80 (1997) 903.
[130] T.S. Zhang, J. Ma, L.B. Kong, P. Hing andJ. A. Kilner // Solid State Ionics 167 (2004)191.
[131] C. Kleinlogel and L.J. Gauckler // SolidState Ionics 135 (2000) 567.
[132] M. Cain and R. Morell // Appl.Organometallic Chem. 15 (2001) 321.
[133] J. Ma, T.S. Zhang, L.B. Kong, P. Hing, Y.J.Leng and S.H. Chan // J. Eur. Ceram. Soc.24 (2004) 2641.
[134] L.H. Ahrens // Geochimica andCosmochimica Acta 2 (1952) 155.