corporate presentation - vistin pharma
TRANSCRIPT
Vistin Pharma – Corporate Presentation
October 2016
Content
Introduction to Vistin Pharma
Operational and financial update
Summary & outlook
Appendix
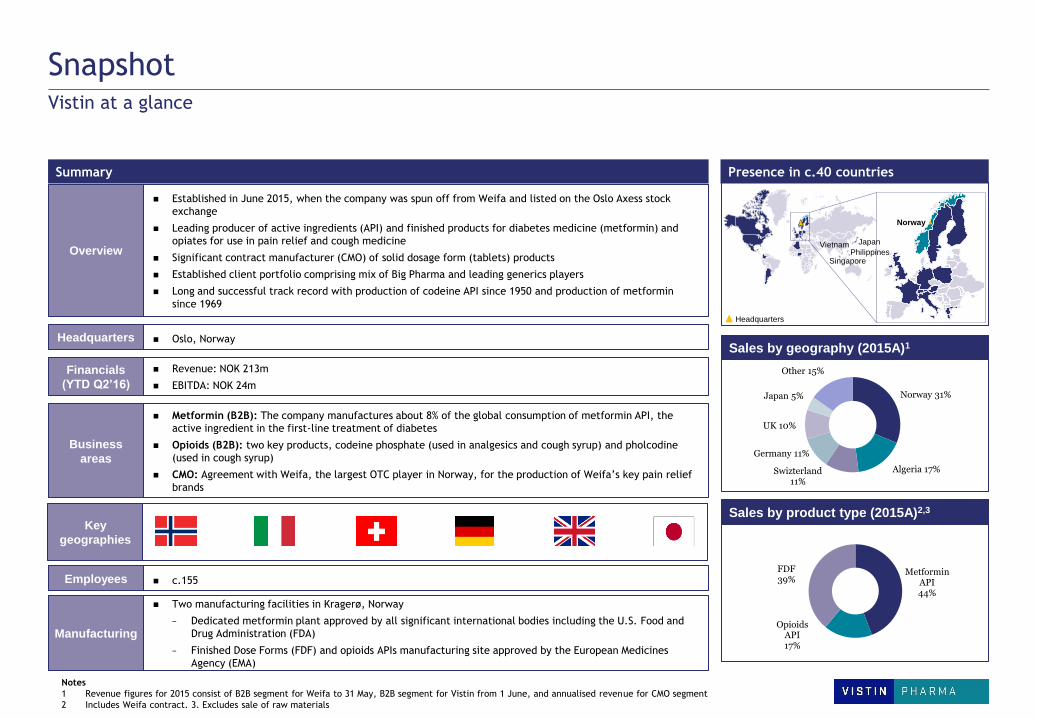
Snapshot
Summary Presence in c.40 countries
Vistin at a glance
Established in June 2015, when the company was spun off from Weifa and listed on the Oslo Axess stock
exchange
Leading producer of active ingredients (API) and finished products for diabetes medicine (metformin) and
opiates for use in pain relief and cough medicine
Significant contract manufacturer (CMO) of solid dosage form (tablets) products
Established client portfolio comprising mix of Big Pharma and leading generics players
Long and successful track record with production of codeine API since 1950 and production of metformin
since 1969
Overview
Business
areas
Metformin (B2B): The company manufactures about 8% of the global consumption of metformin API, the
active ingredient in the first-line treatment of diabetes
Opioids (B2B): two key products, codeine phosphate (used in analgesics and cough syrup) and pholcodine
(used in cough syrup)
CMO: Agreement with Weifa, the largest OTC player in Norway, for the production of Weifa’s key pain relief
brands
Manufacturing
Two manufacturing facilities in Kragerø, Norway
− Dedicated metformin plant approved by all significant international bodies including the U.S. Food and
Drug Administration (FDA)
− Finished Dose Forms (FDF) and opioids APIs manufacturing site approved by the European Medicines
Agency (EMA)
Employees c.155
Headquarters Oslo, Norway
Financials
(YTD Q2’16)
Revenue: NOK 213m
EBITDA: NOK 24m
Sales by product type (2015A)2,3
Sales by geography (2015A)1
Headquarters
Norway
Japan
Key
geographies
Notes
1 Revenue figures for 2015 consist of B2B segment for Weifa to 31 May, B2B segment for Vistin from 1 June, and annualised revenue for CMO segment
2 Includes Weifa contract. 3. Excludes sale of raw materials
Vietnam
Singapore Philippines
Norway 31%
Algeria 17%Swizterland 11%
Germany 11%
UK 10%
Japan 5%
Other 15%
Metformin API44%
Opioids API17%
FDF39%
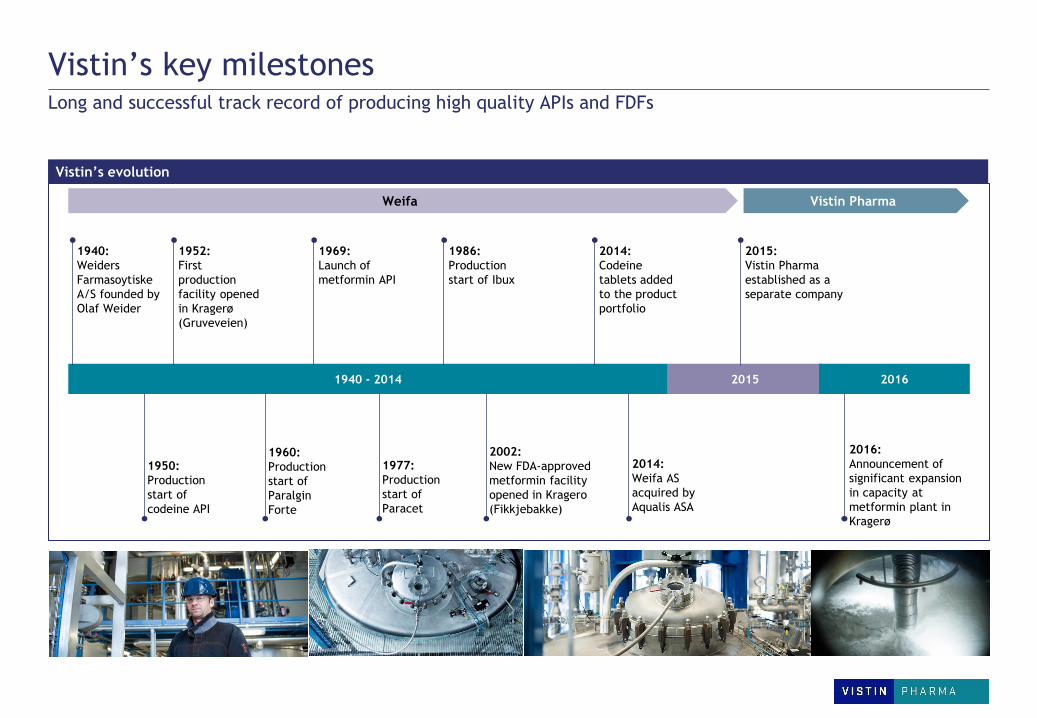
Vistin’s key milestones Long and successful track record of producing high quality APIs and FDFs
Vistin’s evolution
2015 2016 1940 - 2014
1940:
Weiders
Farmasoytiske
A/S founded by
Olaf Weider
Weifa
1950:
Production
start of
codeine API
1952:
First
production
facility opened
in Kragerø
(Gruveveien)
1960:
Production
start of
Paralgin
Forte
1969:
Launch of
metformin API
2014:
Weifa AS
acquired by
Aqualis ASA
2014:
Codeine
tablets added
to the product
portfolio
2002:
New FDA-approved
metformin facility
opened in Kragero
(Fikkjebakke)
1977:
Production
start of
Paracet
1986:
Production
start of Ibux
2015:
Vistin Pharma
established as a
separate company
Vistin Pharma
2016:
Announcement of
significant expansion
in capacity at
metformin plant in
Kragerø
Content
Introduction to Vistin Pharma
Operational and financial update
Summary & outlook
Appendix
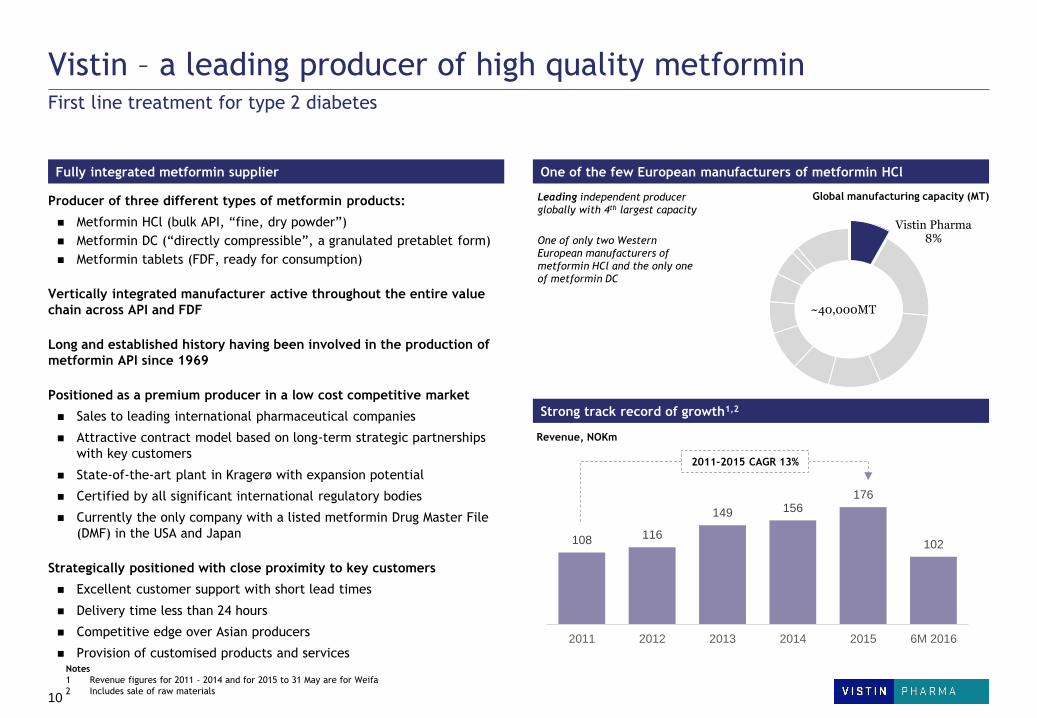
108 116
149 156 176
102
2011 2012 2013 2014 2015 6M 2016
Vistin – a leading producer of high quality metformin First line treatment for type 2 diabetes
Fully integrated metformin supplier One of the few European manufacturers of metformin HCl
Strong track record of growth1,2
Producer of three different types of metformin products:
Metformin HCl (bulk API, “fine, dry powder”)
Metformin DC (“directly compressible”, a granulated pretablet form)
Metformin tablets (FDF, ready for consumption)
Vertically integrated manufacturer active throughout the entire value
chain across API and FDF
Long and established history having been involved in the production of
metformin API since 1969
Positioned as a premium producer in a low cost competitive market
Sales to leading international pharmaceutical companies
Attractive contract model based on long-term strategic partnerships
with key customers
State-of-the-art plant in Kragerø with expansion potential
Certified by all significant international regulatory bodies
Currently the only company with a listed metformin Drug Master File
(DMF) in the USA and Japan
Strategically positioned with close proximity to key customers
Excellent customer support with short lead times
Delivery time less than 24 hours
Competitive edge over Asian producers
Provision of customised products and services
Revenue, NOKm
Global manufacturing capacity (MT)
2011-2015 CAGR 13%
Leading independent producer
globally with 4th largest capacity
One of only two Western
European manufacturers of
metformin HCl and the only one
of metformin DC
Vistin Pharma8%
~40,000MT
10
Notes
1 Revenue figures for 2011 – 2014 and for 2015 to 31 May are for Weifa
2 Includes sale of raw materials
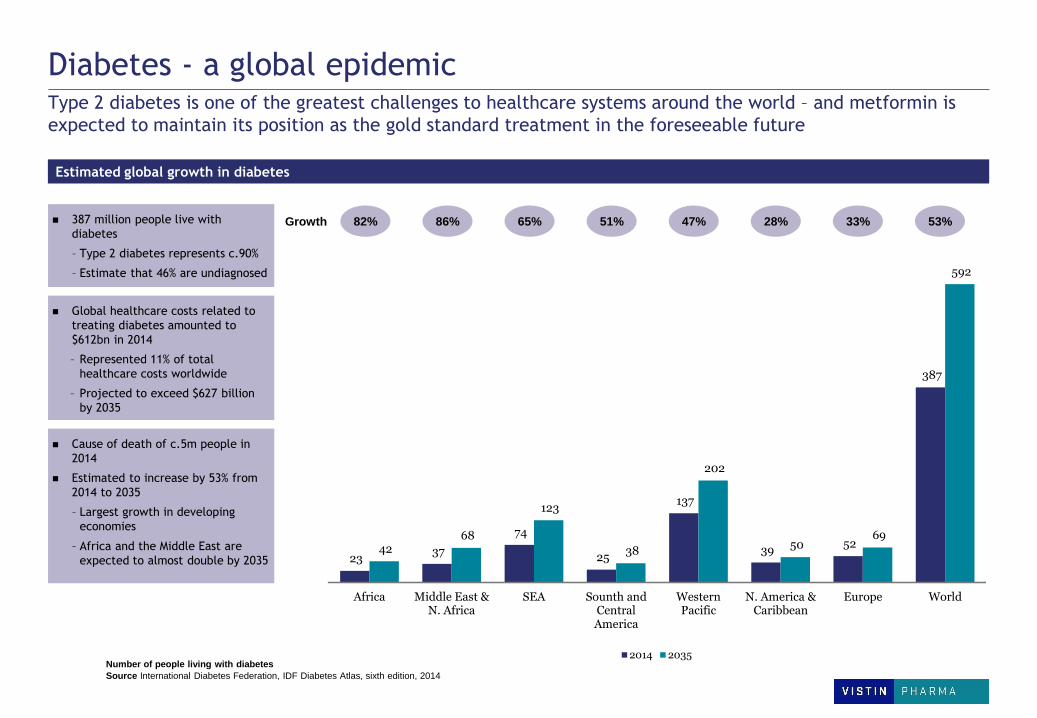
Diabetes - a global epidemic Type 2 diabetes is one of the greatest challenges to healthcare systems around the world – and metformin is
expected to maintain its position as the gold standard treatment in the foreseeable future
387 million people live with
diabetes
– Type 2 diabetes represents c.90%
– Estimate that 46% are undiagnosed
Estimated global growth in diabetes
Number of people living with diabetes
Source International Diabetes Federation, IDF Diabetes Atlas, sixth edition, 2014
82% 86% 65% 51% 47% 28% 33% 53%
Global healthcare costs related to
treating diabetes amounted to
$612bn in 2014
– Represented 11% of total
healthcare costs worldwide
– Projected to exceed $627 billion
by 2035
Cause of death of c.5m people in
2014
Estimated to increase by 53% from
2014 to 2035
– Largest growth in developing
economies
– Africa and the Middle East are
expected to almost double by 2035
Growth
23 37
74
25
137
39 52
387
42 68
123
38
202
50 69
592
Africa Middle East &N. Africa
SEA Sounth andCentralAmerica
WesternPacific
N. America &Caribbean
Europe World
2014 2035
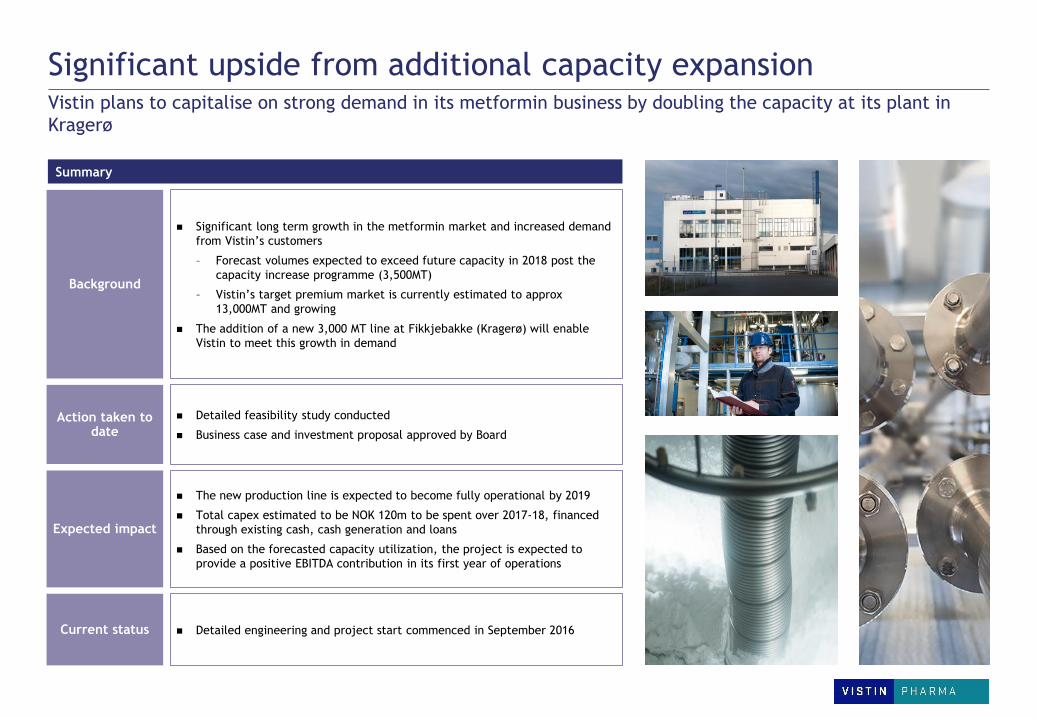
Significant upside from additional capacity expansion Vistin plans to capitalise on strong demand in its metformin business by doubling the capacity at its plant in
Kragerø
Background
Action taken to date
Expected impact
Current status
Significant long term growth in the metformin market and increased demand
from Vistin’s customers
– Forecast volumes expected to exceed future capacity in 2018 post the
capacity increase programme (3,500MT)
– Vistin’s target premium market is currently estimated to approx
13,000MT and growing
The addition of a new 3,000 MT line at Fikkjebakke (Kragerø) will enable
Vistin to meet this growth in demand
Detailed feasibility study conducted
Business case and investment proposal approved by Board
The new production line is expected to become fully operational by 2019
Total capex estimated to be NOK 120m to be spent over 2017-18, financed
through existing cash, cash generation and loans
Based on the forecasted capacity utilization, the project is expected to
provide a positive EBITDA contribution in its first year of operations
Detailed engineering and project start commenced in September 2016
Summary
58
75 71
82 81
50
2011 2012 2013 2014 2015 6M 2016
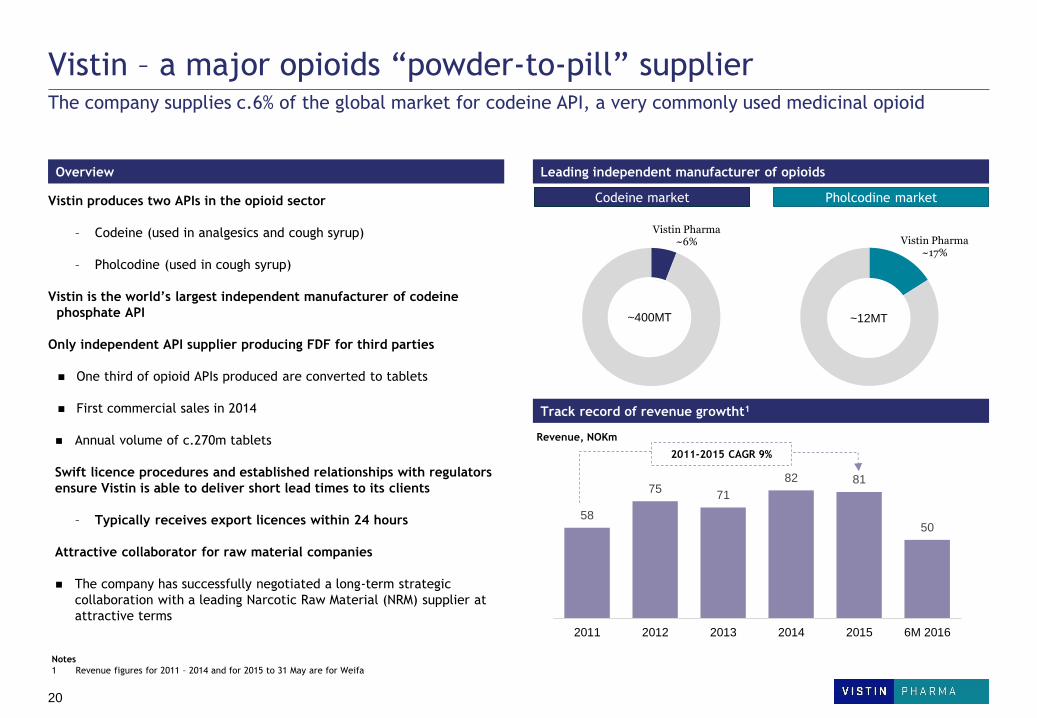
Vistin – a major opioids “powder-to-pill” supplier The company supplies c.6% of the global market for codeine API, a very commonly used medicinal opioid
Overview Leading independent manufacturer of opioids
Vistin produces two APIs in the opioid sector
– Codeine (used in analgesics and cough syrup)
– Pholcodine (used in cough syrup)
Vistin is the world’s largest independent manufacturer of codeine
phosphate API
Only independent API supplier producing FDF for third parties
One third of opioid APIs produced are converted to tablets
First commercial sales in 2014
Annual volume of c.270m tablets
Swift licence procedures and established relationships with regulators
ensure Vistin is able to deliver short lead times to its clients
– Typically receives export licences within 24 hours
Attractive collaborator for raw material companies
The company has successfully negotiated a long-term strategic
collaboration with a leading Narcotic Raw Material (NRM) supplier at
attractive terms
Codeine market Pholcodine market
Revenue, NOKm
2011-2015 CAGR 9%
Vistin Pharma~17%
~12MT
Vistin Pharma~6%
~400MT
20
Notes
1 Revenue figures for 2011 – 2014 and for 2015 to 31 May are for Weifa
Track record of revenue growtht1
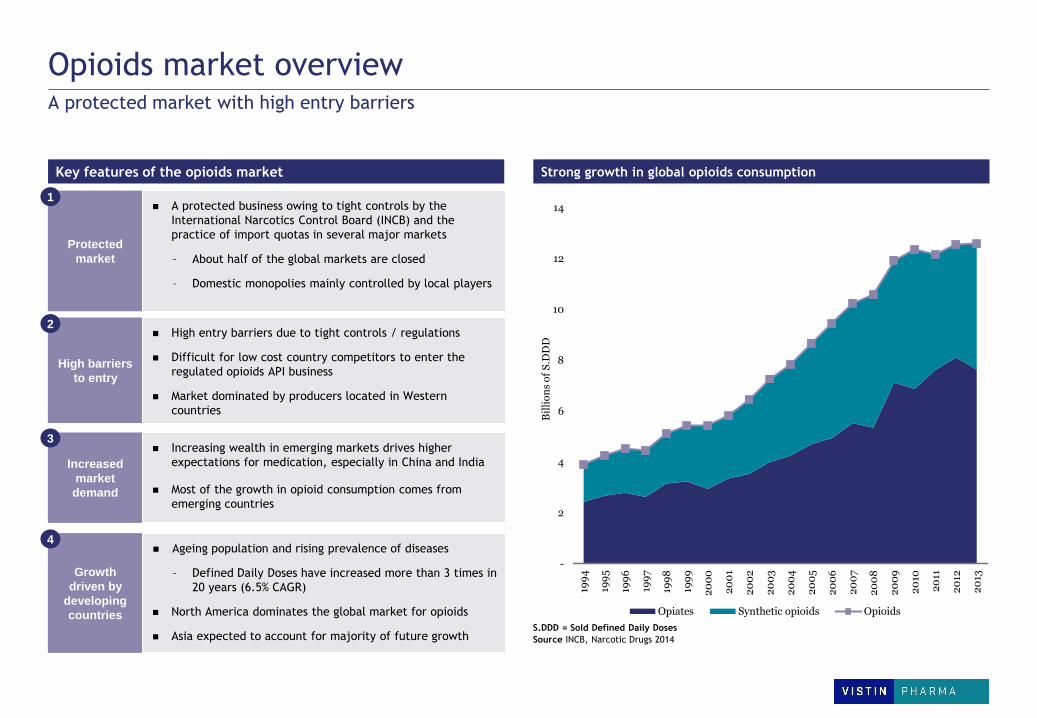
Opioids market overview
Key features of the opioids market Strong growth in global opioids consumption
Strong growth in global opioids consumption
A protected market with high entry barriers
S.DDD = Sold Defined Daily Doses
Source INCB, Narcotic Drugs 2014
Protected
market
A protected business owing to tight controls by the
International Narcotics Control Board (INCB) and the
practice of import quotas in several major markets
– About half of the global markets are closed
– Domestic monopolies mainly controlled by local players
Increased
market
demand
Increasing wealth in emerging markets drives higher
expectations for medication, especially in China and India
Most of the growth in opioid consumption comes from
emerging countries
Growth
driven by
developing
countries
Ageing population and rising prevalence of diseases
– Defined Daily Doses have increased more than 3 times in
20 years (6.5% CAGR)
North America dominates the global market for opioids
Asia expected to account for majority of future growth
-
2
4
6
8
10
12
14
199
4
199
5
199
6
199
7
199
8
199
9
20
00
20
01
20
02
20
03
20
04
20
05
20
06
20
07
20
08
20
09
20
10
20
11
20
12
20
13
Bil
lio
ns
of
S.D
DD
Opiates Synthetic opioids Opioids
1
3
4
High barriers
to entry
High entry barriers due to tight controls / regulations
Difficult for low cost country competitors to enter the
regulated opioids API business
Market dominated by producers located in Western
countries
2
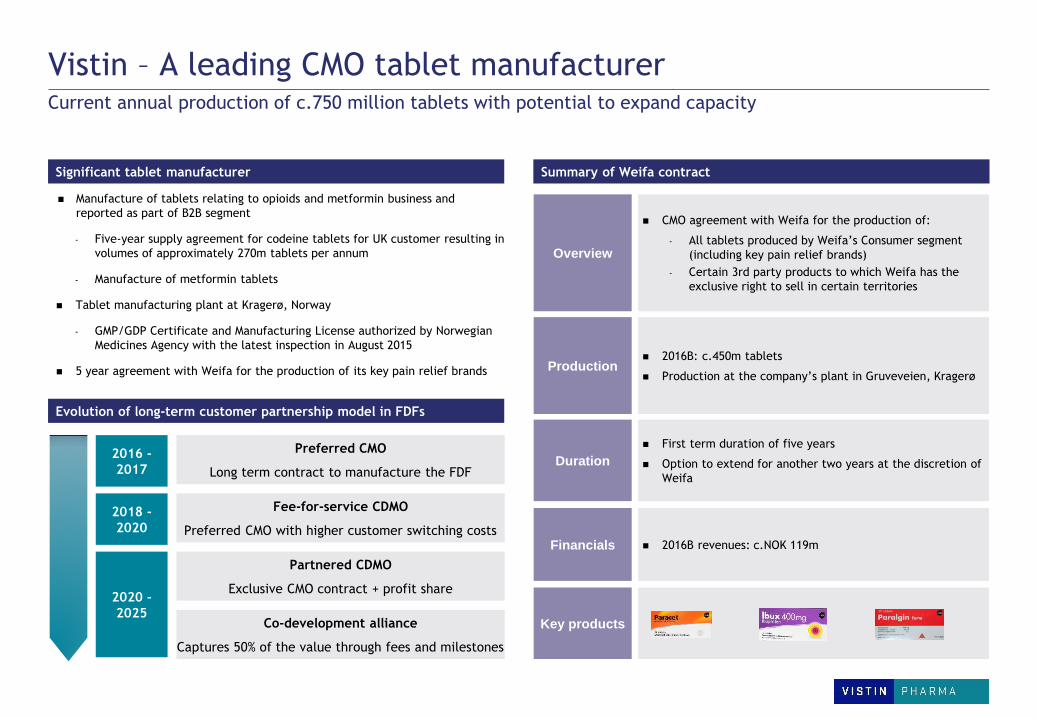
Vistin – A leading CMO tablet manufacturer Current annual production of c.750 million tablets with potential to expand capacity
Significant tablet manufacturer Summary of Weifa contract
Manufacture of tablets relating to opioids and metformin business and
reported as part of B2B segment
- Five-year supply agreement for codeine tablets for UK customer resulting in
volumes of approximately 270m tablets per annum
- Manufacture of metformin tablets
Tablet manufacturing plant at Kragerø, Norway
- GMP/GDP Certificate and Manufacturing License authorized by Norwegian
Medicines Agency with the latest inspection in August 2015
5 year agreement with Weifa for the production of its key pain relief brands
Overview
CMO agreement with Weifa for the production of:
- All tablets produced by Weifa’s Consumer segment
(including key pain relief brands)
- Certain 3rd party products to which Weifa has the
exclusive right to sell in certain territories
Duration
First term duration of five years
Option to extend for another two years at the discretion of
Weifa
Key products
Financials 2016B revenues: c.NOK 119m
Production 2016B: c.450m tablets
Production at the company’s plant in Gruveveien, Kragerø
Evolution of long-term customer partnership model in FDFs
2016 -
2017
2018 -
2020
2020 -
2025
Preferred CMO
Long term contract to manufacture the FDF
Fee-for-service CDMO
Preferred CMO with higher customer switching costs
Partnered CDMO
Exclusive CMO contract + profit share
Co-development alliance
Captures 50% of the value through fees and milestones
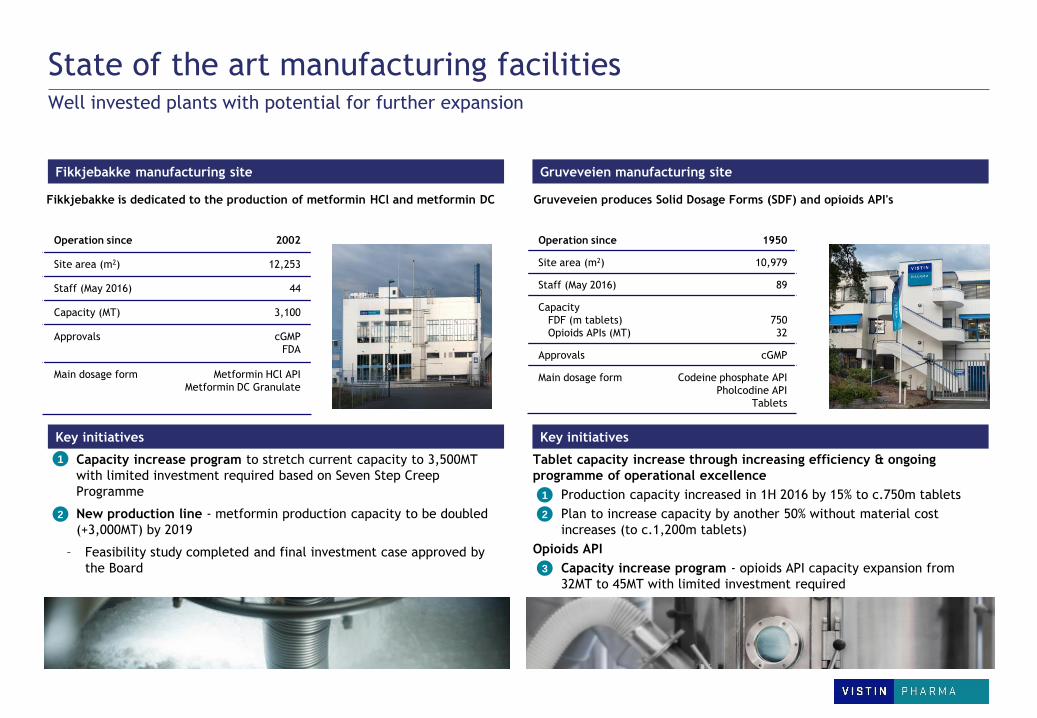
State of the art manufacturing facilities Well invested plants with potential for further expansion
Gruveveien produces Solid Dosage Forms (SDF) and opioids API's
Fikkjebakke manufacturing site Gruveveien manufacturing site
Operation since 1950
Site area (m2) 10,979
Staff (May 2016) 89
Capacity
FDF (m tablets)
Opioids APIs (MT)
750
32
Approvals cGMP
Main dosage form Codeine phosphate API
Pholcodine API
Tablets
Operation since 2002
Site area (m2) 12,253
Staff (May 2016) 44
Capacity (MT) 3,100
Approvals cGMP
FDA
Main dosage form Metformin HCl API
Metformin DC Granulate
Key initiatives Key initiatives
Capacity increase program to stretch current capacity to 3,500MT
with limited investment required based on Seven Step Creep
Programme
New production line - metformin production capacity to be doubled
(+3,000MT) by 2019
– Feasibility study completed and final investment case approved by
the Board
Fikkjebakke is dedicated to the production of metformin HCl and metformin DC
Tablet capacity increase through increasing efficiency & ongoing
programme of operational excellence
Production capacity increased in 1H 2016 by 15% to c.750m tablets
Plan to increase capacity by another 50% without material cost
increases (to c.1,200m tablets)
Opioids API
Capacity increase program - opioids API capacity expansion from
32MT to 45MT with limited investment required
2
1
3
1
2
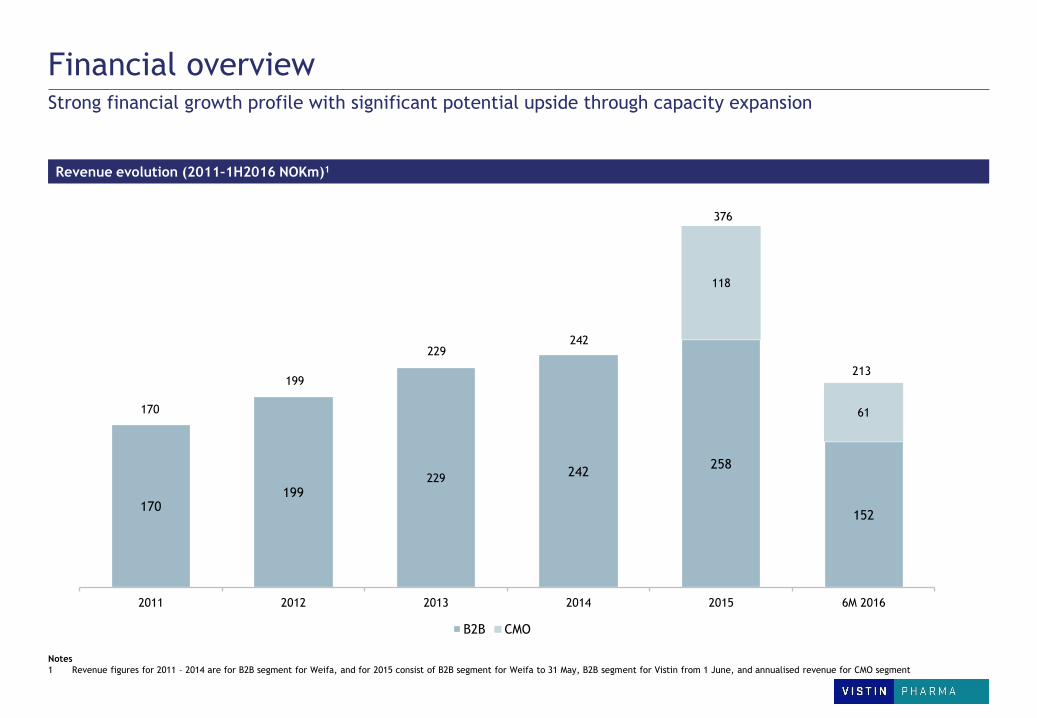
Financial overview Strong financial growth profile with significant potential upside through capacity expansion
Revenue evolution (2011–1H2016 NOKm)1
Notes
1 Revenue figures for 2011 – 2014 are for B2B segment for Weifa, and for 2015 consist of B2B segment for Weifa to 31 May, B2B segment for Vistin from 1 June, and annualised revenue for CMO segment
170 199
229 242
258
152
118
61
2011 2012 2013 2014 2015 6M 2016
B2B CMO
170
229 242
376
199 213
Content
Introduction to Vistin Pharma
Operational and financial update
Summary & outlook
Appendix
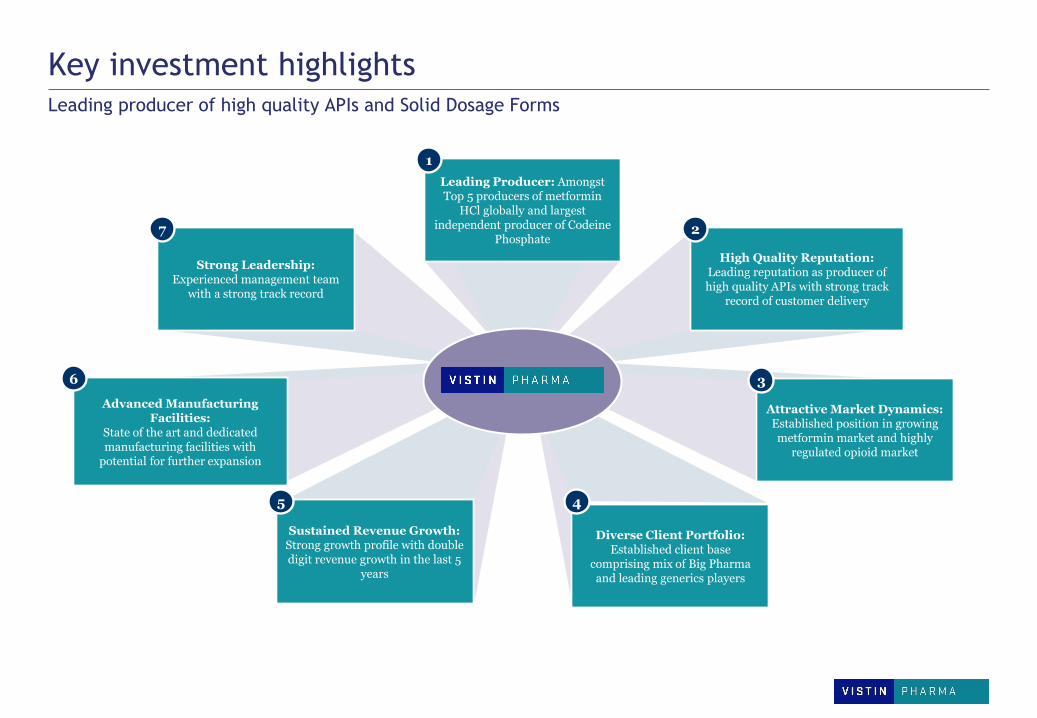
Key investment highlights Leading producer of high quality APIs and Solid Dosage Forms
High Quality Reputation: Leading reputation as producer of high quality APIs with strong track
record of customer delivery
Attractive Market Dynamics: Established position in growing metformin market and highly
regulated opioid market
Sustained Revenue Growth: Strong growth profile with double digit revenue growth in the last 5
years
Strong Leadership: Experienced management team
with a strong track record
Diverse Client Portfolio: Established client base
comprising mix of Big Pharma and leading generics players
Advanced Manufacturing Facilities:
State of the art and dedicated manufacturing facilities with
potential for further expansion
2
3
5 4
6
7
Leading Producer: Amongst Top 5 producers of metformin
HCl globally and largest independent producer of Codeine
Phosphate
1
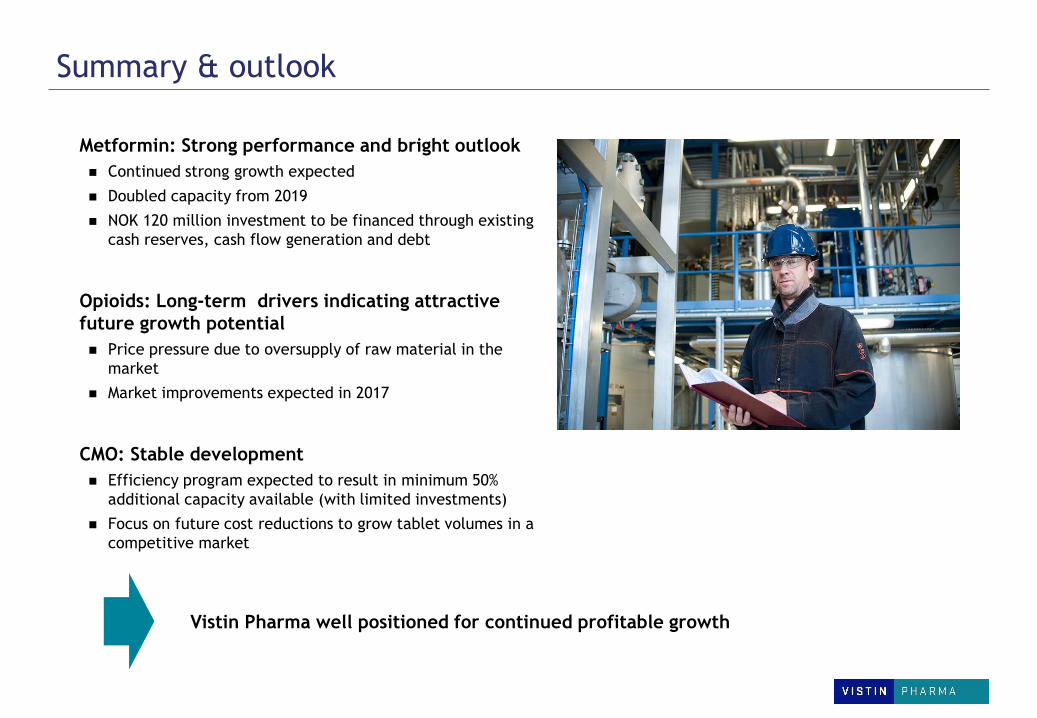
Metformin: Strong performance and bright outlook
Continued strong growth expected
Doubled capacity from 2019
NOK 120 million investment to be financed through existing
cash reserves, cash flow generation and debt
Opioids: Long-term drivers indicating attractive
future growth potential
Price pressure due to oversupply of raw material in the
market
Market improvements expected in 2017
CMO: Stable development
Efficiency program expected to result in minimum 50%
additional capacity available (with limited investments)
Focus on future cost reductions to grow tablet volumes in a
competitive market
Summary & outlook
Vistin Pharma well positioned for continued profitable growth
Content
Introduction to Vistin Pharma
Operational and financial update
Summary & outlook
Appendix
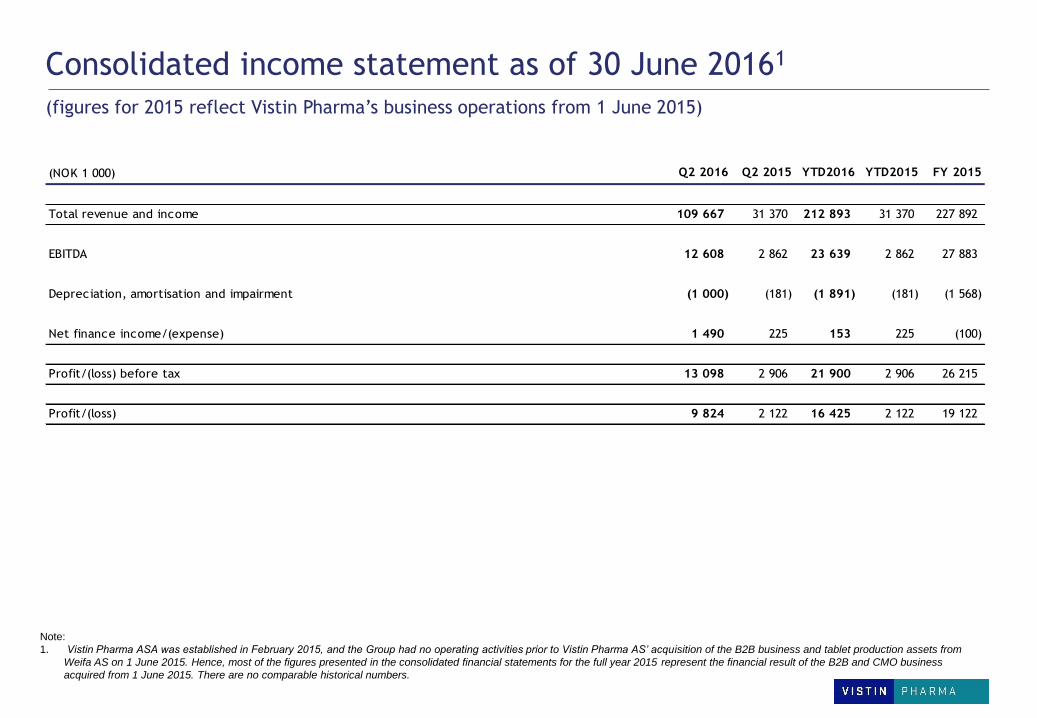
Consolidated income statement as of 30 June 20161
Note:
1. Vistin Pharma ASA was established in February 2015, and the Group had no operating activities prior to Vistin Pharma AS’ acquisition of the B2B business and tablet production assets from
Weifa AS on 1 June 2015. Hence, most of the figures presented in the consolidated financial statements for the full year 2015 represent the financial result of the B2B and CMO business
acquired from 1 June 2015. There are no comparable historical numbers.
(NOK 1 000) Q2 2016 Q2 2015 YTD2016 YTD2015 FY 2015
Total revenue and income 109 667 31 370 212 893 31 370 227 892
EBITDA 12 608 2 862 23 639 2 862 27 883
Depreciation, amortisation and impairment (1 000) (181) (1 891) (181) (1 568)
Net finance income/(expense) 1 490 225 153 225 (100)
Profit/(loss) before tax 13 098 2 906 21 900 2 906 26 215
Profit/(loss) 9 824 2 122 16 425 2 122 19 122
(figures for 2015 reflect Vistin Pharma’s business operations from 1 June 2015)
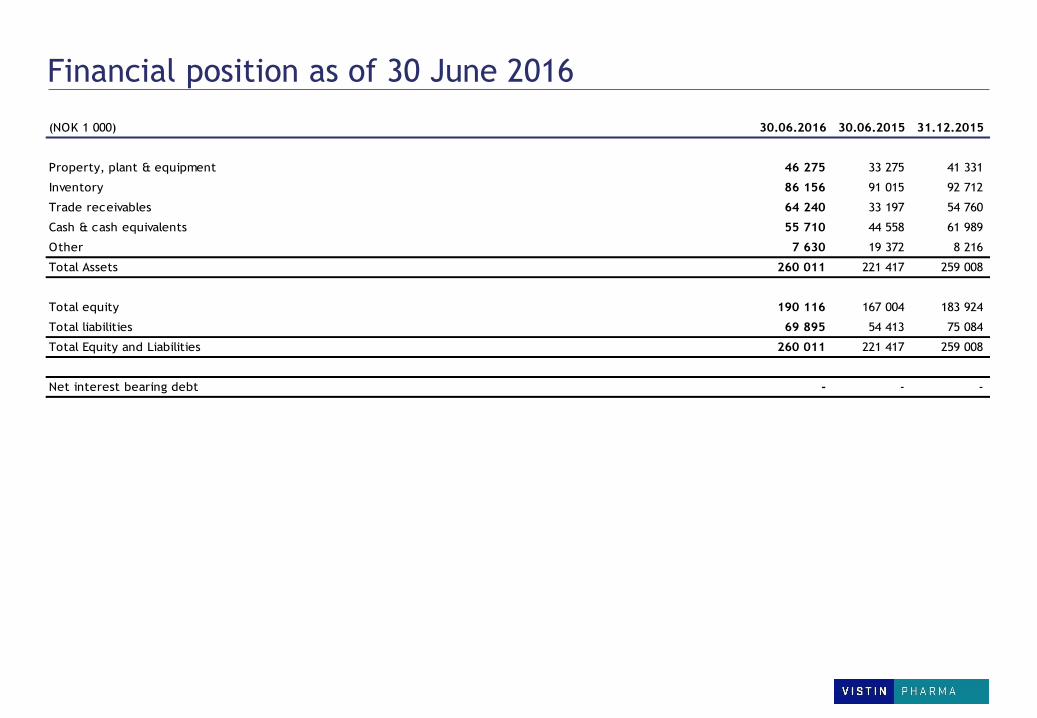
Financial position as of 30 June 2016
(NOK 1 000) 30.06.2016 30.06.2015 31.12.2015
Property, plant & equipment 46 275 33 275 41 331
Inventory 86 156 91 015 92 712
Trade receivables 64 240 33 197 54 760
Cash & cash equivalents 55 710 44 558 61 989
Other 7 630 19 372 8 216
Total Assets 260 011 221 417 259 008
Total equity 190 116 167 004 183 924
Total liabilities 69 895 54 413 75 084
Total Equity and Liabilities 260 011 221 417 259 008
Net interest bearing debt - - -
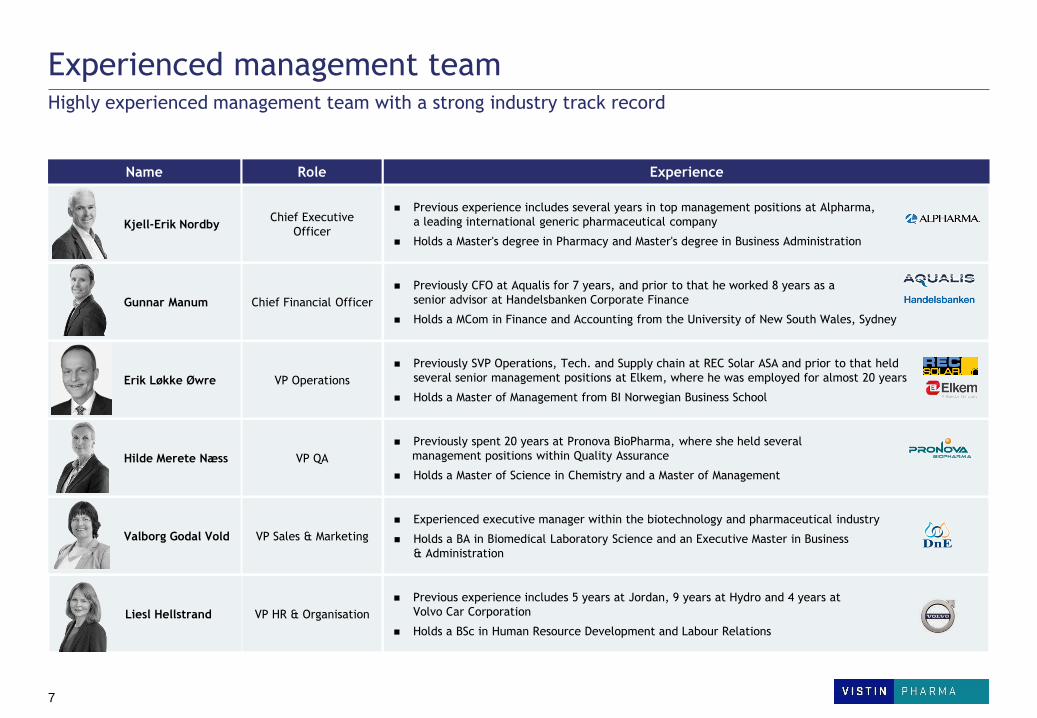
Experienced management team Highly experienced management team with a strong industry track record
Role Experience Name
Previous experience includes several years in top management positions at Alpharma,
a leading international generic pharmaceutical company
Holds a Master's degree in Pharmacy and Master's degree in Business Administration
Chief Executive
Officer Kjell-Erik Nordby
Previously SVP Operations, Tech. and Supply chain at REC Solar ASA and prior to that held
several senior management positions at Elkem, where he was employed for almost 20 years
Holds a Master of Management from BI Norwegian Business School
VP Operations Erik Løkke Øwre
Previously CFO at Aqualis for 7 years, and prior to that he worked 8 years as a
senior advisor at Handelsbanken Corporate Finance
Holds a MCom in Finance and Accounting from the University of New South Wales, Sydney
Chief Financial Officer Gunnar Manum
Previously spent 20 years at Pronova BioPharma, where she held several
management positions within Quality Assurance
Holds a Master of Science in Chemistry and a Master of Management
VP QA Hilde Merete Næss
Experienced executive manager within the biotechnology and pharmaceutical industry
Holds a BA in Biomedical Laboratory Science and an Executive Master in Business
& Administration
VP Sales & Marketing Valborg Godal Vold
Previous experience includes 5 years at Jordan, 9 years at Hydro and 4 years at
Volvo Car Corporation
Holds a BSc in Human Resource Development and Labour Relations
VP HR & Organisation Liesl Hellstrand
7
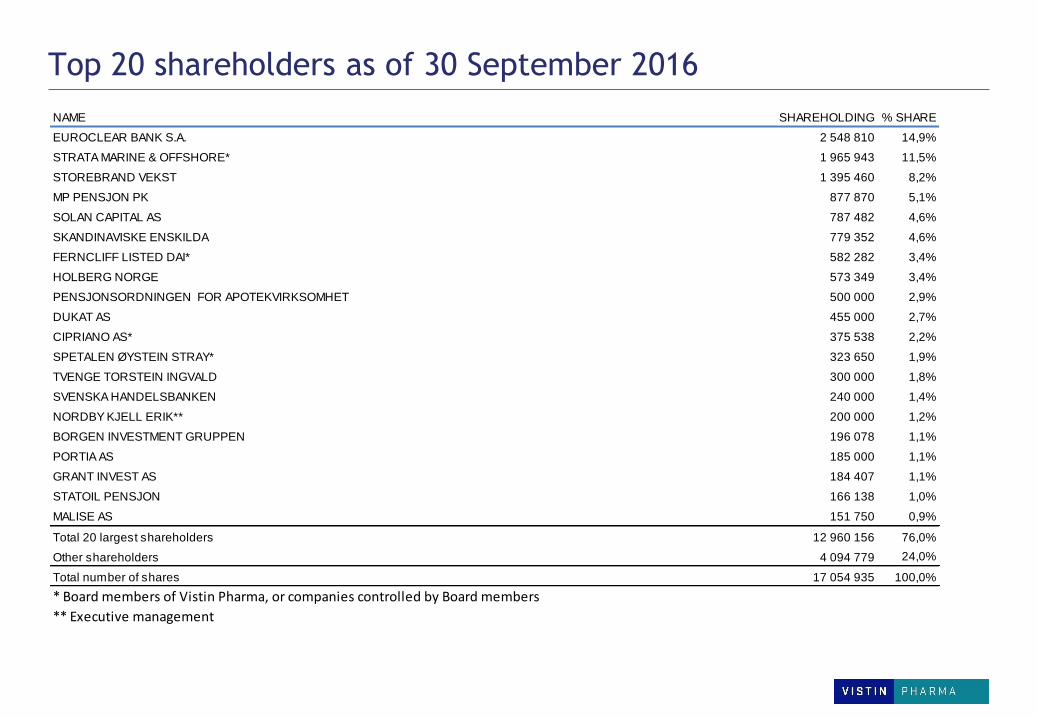
Top 20 shareholders as of 30 September 2016
NAME SHAREHOLDING % SHARE
EUROCLEAR BANK S.A. 2 548 810 14,9%
STRATA MARINE & OFFSHORE* 1 965 943 11,5%
STOREBRAND VEKST 1 395 460 8,2%
MP PENSJON PK 877 870 5,1%
SOLAN CAPITAL AS 787 482 4,6%
SKANDINAVISKE ENSKILDA 779 352 4,6%
FERNCLIFF LISTED DAI* 582 282 3,4%
HOLBERG NORGE 573 349 3,4%
PENSJONSORDNINGEN FOR APOTEKVIRKSOMHET 500 000 2,9%
DUKAT AS 455 000 2,7%
CIPRIANO AS* 375 538 2,2%
SPETALEN ØYSTEIN STRAY* 323 650 1,9%
TVENGE TORSTEIN INGVALD 300 000 1,8%
SVENSKA HANDELSBANKEN 240 000 1,4%
NORDBY KJELL ERIK** 200 000 1,2%
BORGEN INVESTMENT GRUPPEN 196 078 1,1%
PORTIA AS 185 000 1,1%
GRANT INVEST AS 184 407 1,1%
STATOIL PENSJON 166 138 1,0%
MALISE AS 151 750 0,9%
Total 20 largest shareholders 12 960 156 76,0%
Other shareholders 4 094 779 24,0%
Total number of shares 17 054 935 100,0%
* Board members of Vistin Pharma, or companies controlled by Board members
** Executive management
Disclaimer
This Presentation has been produced by Vistin Pharma ASA (the “Company” or “Vistin Pharma ”) solely for use at the presentation to investors and other stake holders and may not be reproduced or redistributed, in whole or in part, to any other person. This presentation has not been reviewed or registered with any public authority or stock exchange, and may not be reproduced or redistributed, in whole or in part, to any other person. To the best of the knowledge of the Company, the information contained in this Presentation is in all material respect in accordance with the facts as of the date hereof, and contains no material omissions likely to affect its importance. However, no representation or warranty (express or implied) is made as to, and no reliance should be placed on, any information, including projections, estimates, targets and opinions, contained herein, and no liability whatsoever is accepted as to any errors, omissions or misstatements contained herein, and, accordingly, neither the Company nor any of its subsidiary companies or any such person’s officers or employees accepts any liability whatsoever arising directly or indirectly from the use of this Presentation. This Presentation contains information obtained from third parties. Such information has been accurately reproduced and, as far as the Company is aware and able to ascertain from the information published by that third party, no facts have been omitted that would render the reproduced information to be inaccurate or misleading.
This Presentation contains certain forward-looking statements relating to the business, financial performance and results of the Company and/or the industry in which it operates. Forward-looking statements concern future circumstances and results and other statements that are not historical facts, sometimes identified by the words “believes”, expects”, “predicts”, “intends”, “projects”, “plans”, “estimates”, “aims”, “foresees”, “anticipates”, “targets”, and similar expressions. The forward-looking statements contained in this Presentation, including assumptions, opinions and views of the Company or cited from third party sources are solely opinions and forecasts which are subject to risks, uncertainties and other factors that may cause actual events to differ materially from any anticipated development. None of the Company or any of its parent or subsidiary undertakings or any such person’s officers or employees provides any assurance that the assumptions underlying such forward-looking statements are free from errors nor does any of them accept any responsibility for the future accuracy of the opinions expressed in this Presentation or the actual occurrence of the forecasted developments. The Company assumes no obligation, except as required by law, to update any forward-looking statements or to conform these forward-looking statements to our actual results.
AN INVESTMENT IN THE COMPANY INVOLVES RISK, AND SEVERAL FACTORS COULD CAUSE THE ACTUAL RESULTS, PERFORMANCE OR ACHIEVEMENTS OF THE COMPANY TO BE MATERIALLY DIFFERENT FROM ANY FUTURE RESULTS, PERFORMANCE OR ACHIEVEMENTS THAT MAY BE EXPRESSED OR IMPLIED BY STATEMENTS AND INFORMATION IN THIS PRESENTATION, INCLUDING, AMONG OTHERS, RISKS OR UNCERTAINTIES ASSOCIATED WITH THE COMPANY’S BUSINESS, SEGMENTS, DEVELOPMENT, GROWTH MANAGEMENT, FINANCING, MARKET ACCEPTANCE AND RELATIONS WITH CUSTOMERS, AND, MORE GENERALLY, GENERAL ECONOMIC AND BUSINESS CONDITIONS, CHANGES IN DOMESTIC AND FOREIGN LAWS AND REGULATIONS, TAXES, CHANGES IN COMPETITION AND PRICING ENVIRONMENTS, FLUCTUATIONS IN CURRENCY EXCHANGE RATES AND INTEREST RATES AND OTHER FACTORS.
SHOULD ONE OR MORE OF THESE RISKS OR UNCERTAINTIES MATERIALISE, OR SHOULD UNDERLYING ASSUMPTIONS PROVE INCORRECT, ACTUAL RESULTS MAY VARY MATERIALLY FROM THOSE DESCRIBED IN THIS PRESENTATION. THE COMPANY DOES NOT INTEND, AND DOES NOT ASSUME ANY OBLIGATION, TO UPDATE OR CORRECT THE INFORMATION INCLUDED IN THIS PRESENTATION.
By attending or receiving this Presentation you acknowledge that you will be solely responsible for your own assessment of the market and the market position of the Company and that you will conduct your own analysis and be solely responsible for forming your own view of the potential future performance of the Company’s business. This Presentation does not constitute an offer to sell or a solicitation of an offer to buy any securities in any jurisdiction to any person to whom it is unlawful to make such an offer or solicitation in such jurisdiction.