copy horticultural subsector survey afghanistan - world
TRANSCRIPT
Report No. 1324-AF R1`3 IL;E COPYHorticultural Subsector Survey Afghanistan(In Two Volumes)
Volume il.May 5, 1977
Agricultural Credit and Agroindustries DivisionProjects DepartmentEurope, Middle East and North Africa
FOR OFFICIAL USE ONLY
Document of the World Bank
This document has a restricted distribution and may be used by recipientsonly in the performance of their official duties. Its contents may nototherwise be disclosed without World Bank authorization.
Pub
lic D
iscl
osur
e A
utho
rized
Pub
lic D
iscl
osur
e A
utho
rized
Pub
lic D
iscl
osur
e A
utho
rized
Pub
lic D
iscl
osur
e A
utho
rized
Pub
lic D
iscl
osur
e A
utho
rized
Pub
lic D
iscl
osur
e A
utho
rized
Pub
lic D
iscl
osur
e A
utho
rized
Pub
lic D
iscl
osur
e A
utho
rized
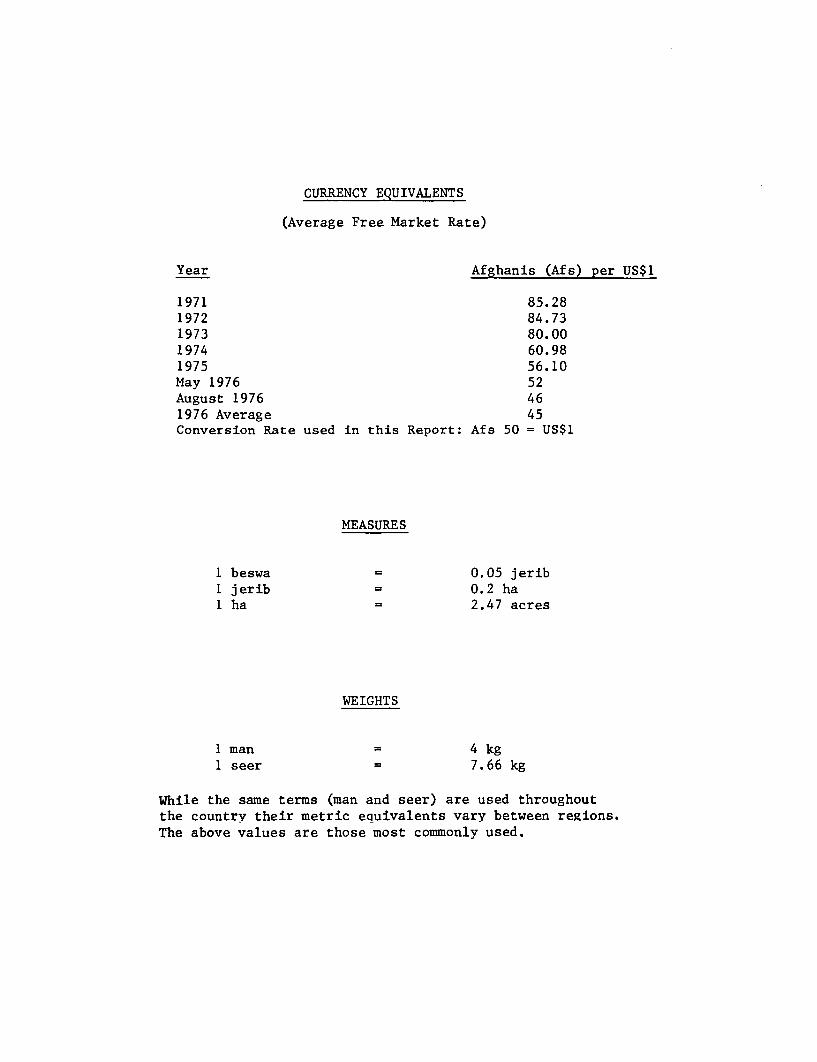
CURRENCY EQUIVALENTS
(Average Free Market Rate)
Year Afghanis (Afs) per US$1
1971 85.281972 84.731973 80.001974 60.981975 56.10May 1976 52August 1976 461976 Average 45Conversion Rate used in this Report: Afs 50 = US$1
MEASURES
1 beswa 0.05 jerib1 jerib 0.2 ha1 ha 2.47 acres
WEIGHTS
1 man 4 kg1 seer 7.66 kg
While the same terms (man and seer) are used throughoutthe countrv their metric equivalents vary between regions.The above values are those most commonly used.
FOR OFFICIAL USE ONLY
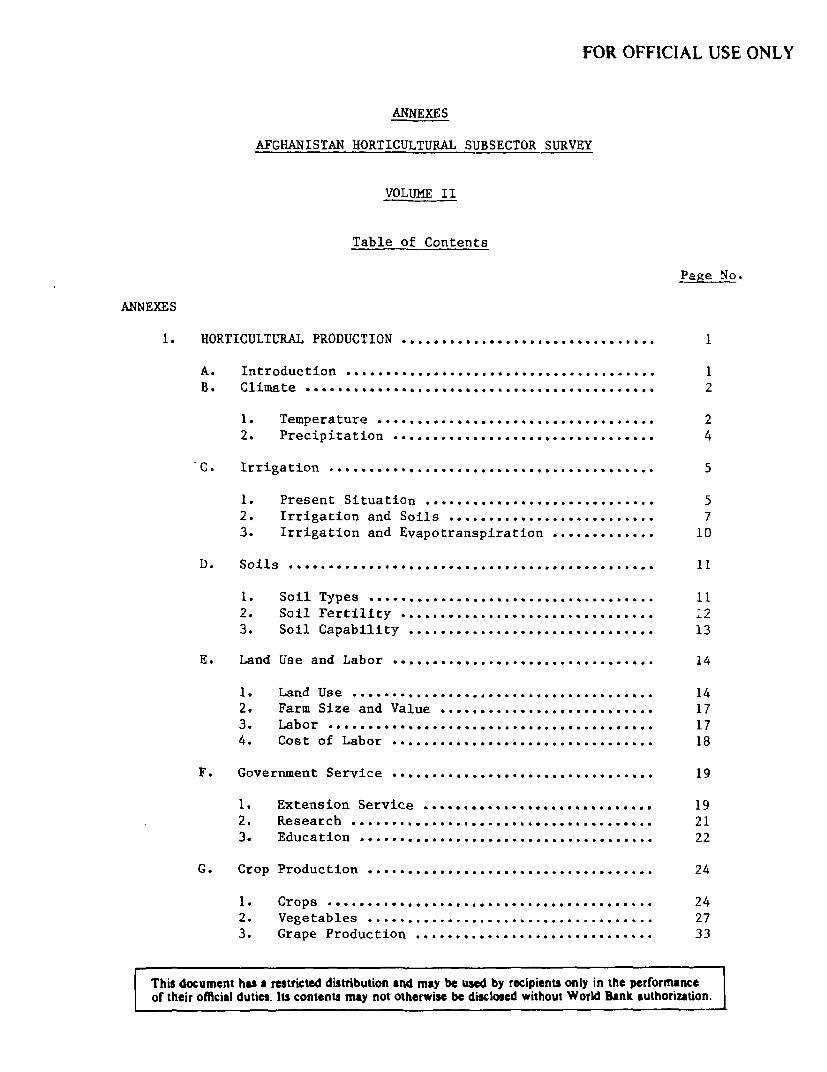
ANNEXES
AFGHANISTAN HORTICULTURAL SUBSECTOR SURVEY
VOLUME II
Table of Contents
Page No.
ANNEXES
1. HORTICULTURAL PRODUCTION . ............... . ....... ...... I
A. Introduction. 1
B. Climate .. . . . . . . .# . 4 . . . . . . . . . .* .2
1. Temperature . ............... . ...... 2
2. Precipitation. . . 4
C. Irrigation. 5
1. Present Situation. 5
2. Irrigation and Soils. . . 7
3. Irrigation and Evapotranspiration .10
D. Soils .. 11
1. Soil Types. . . 11
2. Soil Fertility . . .12
3. Soil Capability..... 13
E. Land Use and Labor .14
1. Land Use ... 14
2. Farm Size and Value..... 17
3. Labor *...17
4. Cost of Labor . . .18
F. Government Service .19
1. Extension Service .......*...... ..*. 19
2. Research.... 21
3. Education . .22
G. Crop Production .24
1. Crops .. . 24
2. Vegetables . . .273. Grape Production . . .33
i This document has a restricted distribution and may be used by recipients only in the performanceof their official duties. Its contents may not otherwise be disclosed without World Bank authorization.
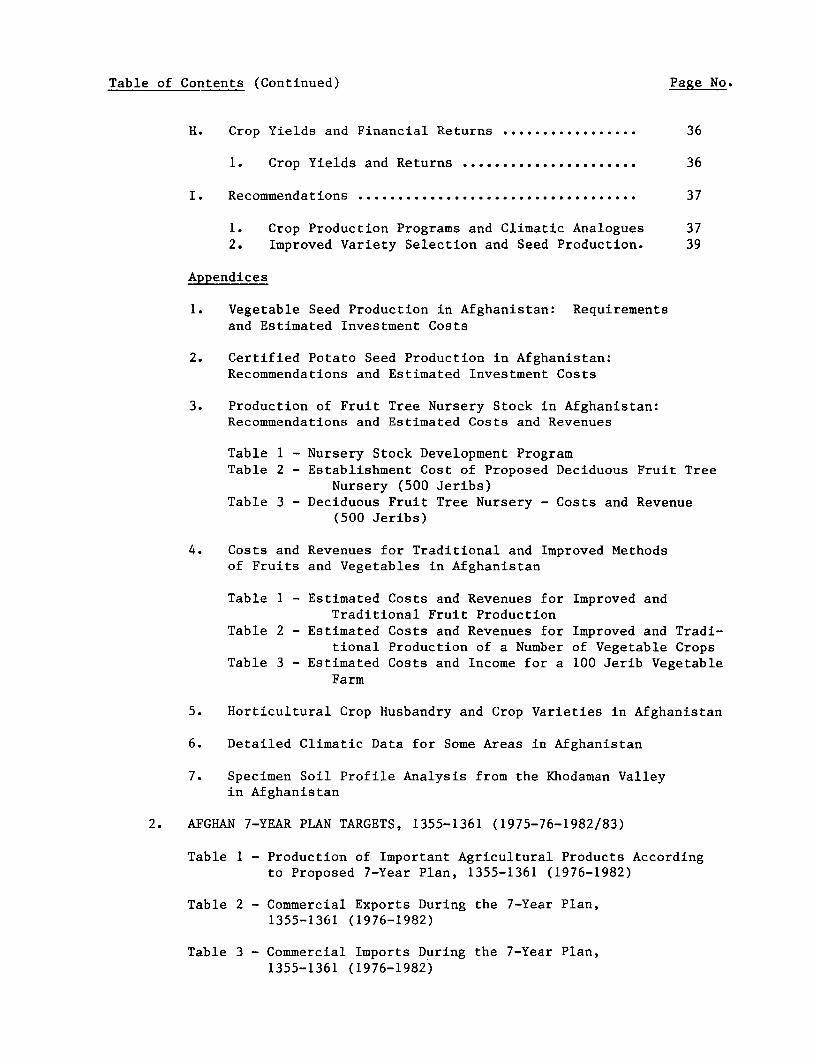
Table of Contents (Continued) Page No.
H. Crop Yields and Financial Returns .... ............. 36
1. Crop Yields and Returns ...................... 36
I. Recommendations .................. .................. 37
1. Crop Production Programs and Climatic Analogues 372. Improved Variety Selection and Seed Production. 39
Appendices
1. Vegetable Seed Production in Afghanistan: Requirementsand Estimated Investment Costs
2. Certified Potato Seed Production in Afghanistan:Recommendations and Estimated Investment Costs
3. Production of Fruit Tree Nursery Stock in Afghanistan:Recommendations and Estimated Costs and Revenues
Table 1 - Nursery Stock Development ProgramTable 2 - Establishment Cost of Proposed Deciduous Fruit Tree
Nursery (500 Jeribs)Table 3 - Deciduous Fruit Tree Nursery - Costs and Revenue
(500 Jeribs)
4. Costs and Revenues for Traditional and Improved Methodsof Fruits and Vegetables in Afghanistan
Table 1 - Estimated Costs and Revenues for Improved andTraditional Fruit Production
Table 2 - Estimated Costs and Revenues for Improved and Tradi-tional Production of a Number of Vegetable Crops
Table 3 - Estimated Costs and Income for a 100 Jerib VegetableFarm
5. Horticultural Crop Husbandry and Crop Varieties in Afghanistan
6. Detailed Climatic Data for Some Areas in Afghanistan
7. Specimen Soil Profile Analysis from the Khodaman Valleyin Afghanistan
2. AFGHAN 7-YEAR PLAN TARGETS, 1355-1361 (1975-76-1982/83)
Table 1 - Production of Important Agricultural Products Accordingto Proposed 7-Year Plan, 1355-1361 (1976-1982)
Table 2 - Commercial Exports During the 7-Year Plan,1355-1361 (1976-1982)
Table 3 - Commercial Imports During the 7-Year Plan,1355-1361 (1976-1982)
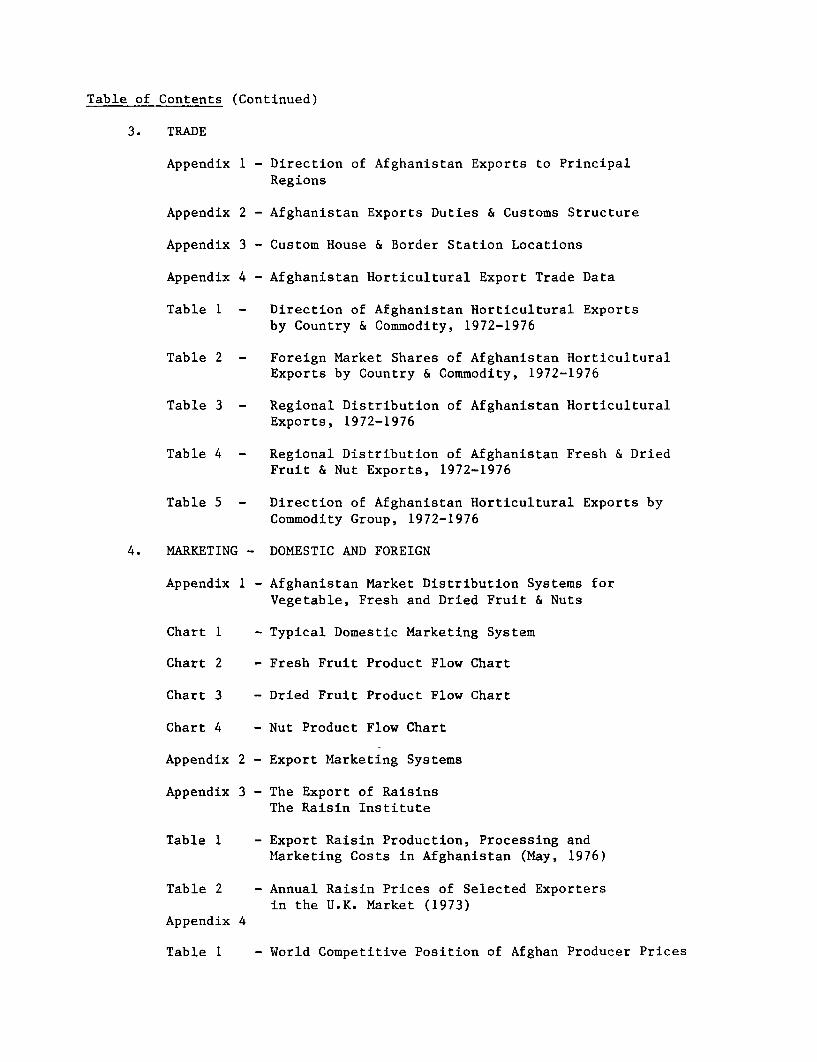
Table of Contents (Continued)
3. TRADE
Appendix 1 - Direction of Afghanistan Exports to PrincipalRegions
Appendix 2 - Afghanistan Exports Duties & Customs Structure
Appendix 3 - Custom House & Border Station Locations
Appendix 4 - Afghanistan Horticultural Export Trade Data
Table 1 - Direction of Afghanistan Horticultural Exportsby Country & Commodity, 1972-1976
Table 2 - Foreign Market Shares of Afghanistan HorticulturalExports by Country & Commodity, 1972-1976
Table 3 - Regional Distribution of Afghanistan HorticulturalExports, 1972-1976
Table 4 - Regional Distribution of Afghanistan Fresh & DriedFruit & Nut Exports, 1972-1976
Table 5 - Direction of Afghanistan Horticultural Exports byCommodity Group, 1972-1976
4. MARKETING - DOMESTIC AND FOREIGN
Appendix 1 - Afghanistan Market Distribution Systems forVegetable, Fresh and Dried Fruit & Nuts
Chart 1 - Typical Domestic Marketing System
Chart 2 - Fresh Fruit Product Flow Chart
Chart 3 - Dried Fruit Product Flow Chart
Chart 4 - Nut Product Flow Chart
Appendix 2 - Export Marketing Systems
Appendix 3 - The Export of RaisinsThe Raisin Institute
Table I - Export Raisin Production, Processing andMarketing Costs in Afghanistan (May, 1976)
Table 2 - Annual Raisin Prices of Selected Exportersin the U.K. Market (1973)
Appendix 4
Table 1 - World Competitive Position of Afghan Producer Prices
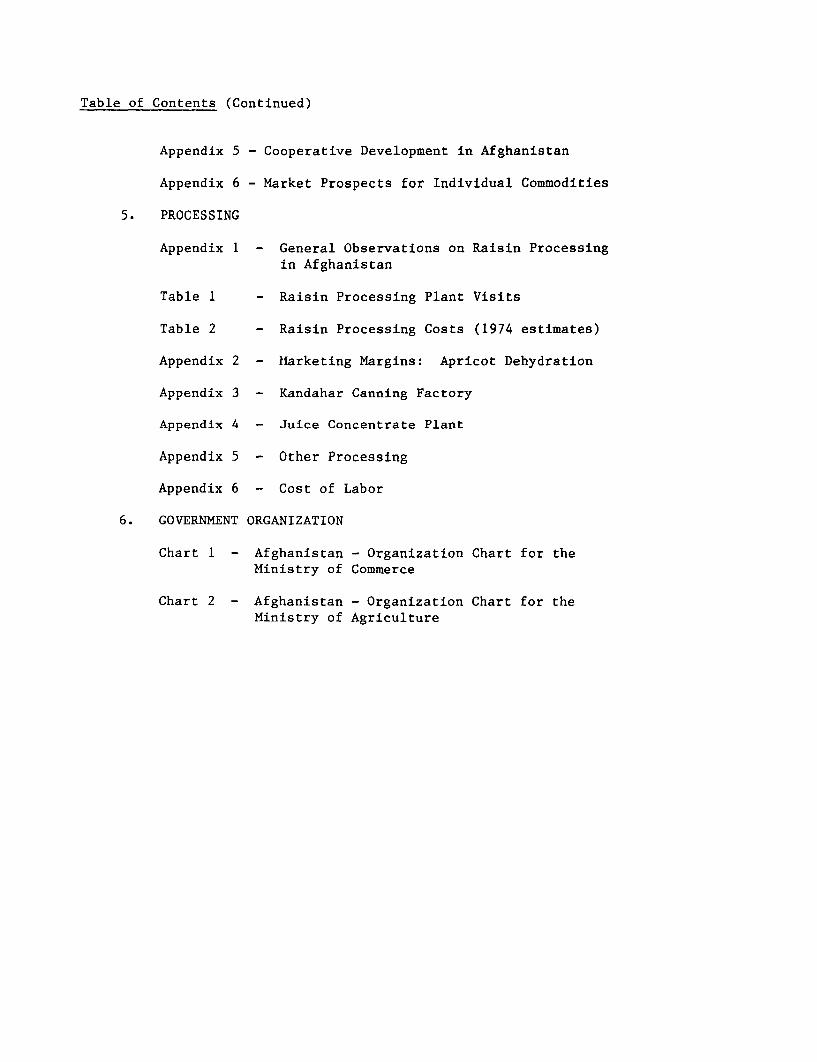
Table of Contents (Continued)
Appendix 5 - Cooperative Development in Afghanistan
Appendix 6 - Market Prospects for Individual Commodities
5. PROCESSING
Appendix 1 - General Observations on Raisin Processingin Afghanistan
Table 1 - Raisin Processing Plant Visits
Table 2 - Raisin Processing Costs (1974 estimates)
Appendix 2 - Marketing Margins: Apricot Dehydration
Appendix 3 - Kandahar Canning Factory
Appendix 4 - Juice Concentrate Plant
Appendix 5 - Other Processing
Appendix 6 - Cost of Labor
6. GOVERNMENT ORGANIZATION
Chart 1 - Afghanistan - Organization Chart for theMinistry of Commerce
Chart 2 - Afghanistan - Organization Chart for theMinistry of Agriculture
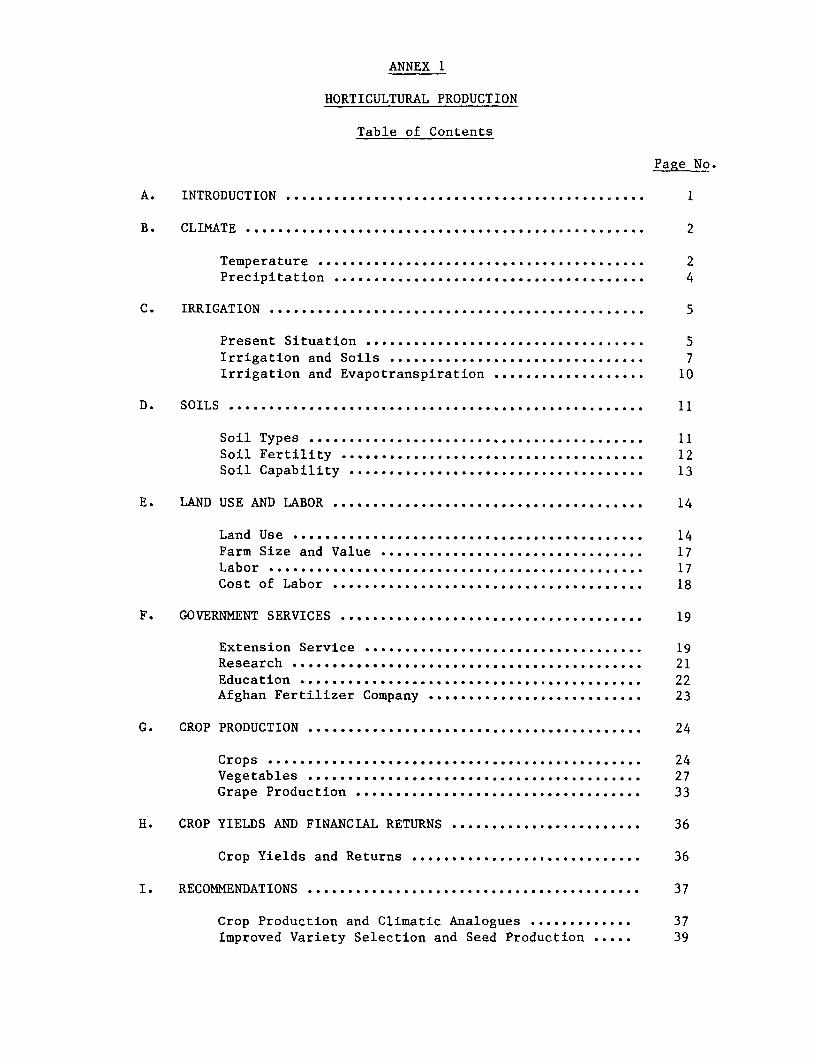
ANNEX 1
HORTICULTURAL PRODUCTION
Table of Contents
Page No.
A. INTRODUCTION ............................................. I
B. CLIMATE .................................... 2
Temperature ........................ 2Precipitation ...... ................. 4
C. IRRIGATION ................................... . 5
Present Situation .. ...................... . 5
Irrigation and Soils ............................... . 7Irrigation and Evapotranspiration ........ .. ......... 10
D. SOILS .................................................... 11
Soil Types .......................................... 11Soil Fertility ...... ........... ..................... 12Soil Capability .. .................. ................. 13
E. LAND USE AND LABOR ...... .............. ................... 14
Land Use ...................... ...................... 14Farm Size and Value .............. .. ................. 17Labor ........................ ....................... 17Cost of Labor ....... ............. ................... 18
F. GOVERNMENT SERVICES ...................................... 19
Extension Service ............... .. .................. 19Research ........................................... . 21
Education ................ ........................... 22Afghan Fertilizer Company ............. .. ............ 23
G. CROP PRODUCTION ....... .............. ..................... 24
Crops ........................ ....................... 24Vegetables ....... .............. ..................... 27Grape Production .................................... 33
H. CROP YIELDS AND FINANCIAL RETURNS ........................ 36
Crop Yields and Returns ............................. 36
I. RECOMMENDATIONS .......................................... 37
Crop Production and Climatic Analogues .... ......... 37Improved Variety Selection and Seed Production ..... 39
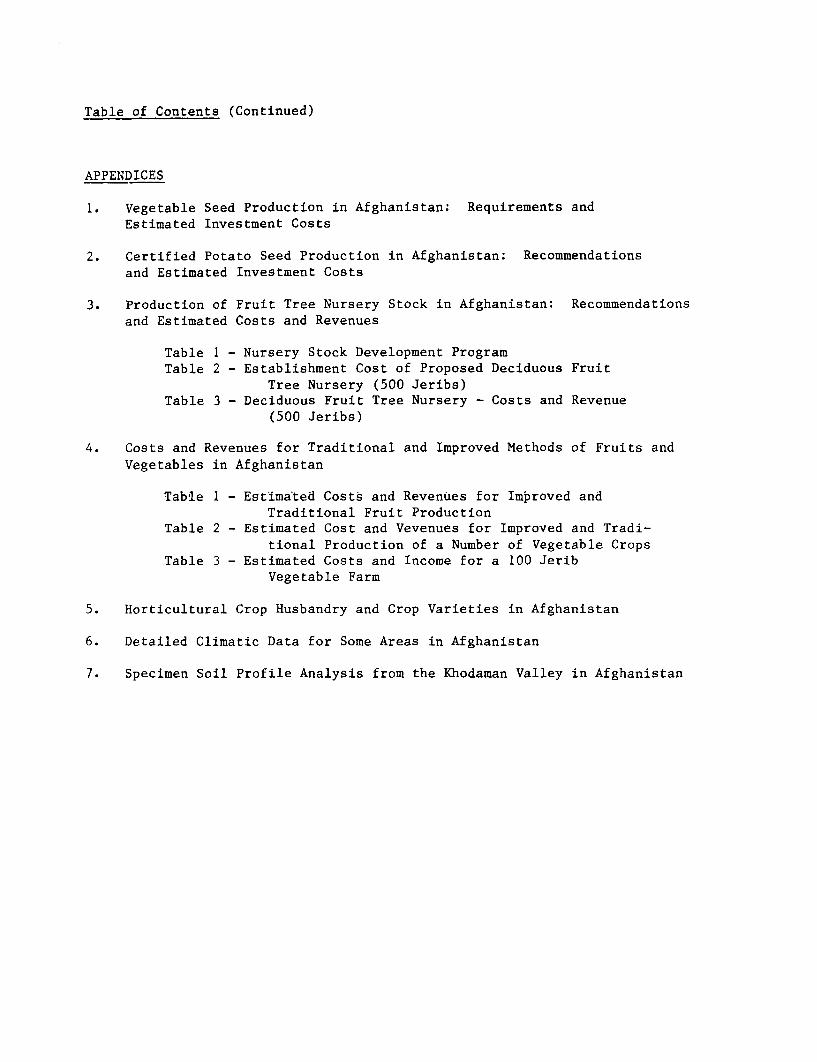
Table of Contents (Continued)
APPENDICES
1. Vegetable Seed Production in Afghanistan: Requirements andEstimated Investment Costs
2. Certified Potato Seed Production in Afghanistan: Recommendations
and Estimated Investment Costs
3. Production of Fruit Tree Nursery Stock in Afghanistan: Recommendationsand Estimated Costs and Revenues
Table 1 - Nursery Stock Development ProgramTable 2 - Establishment Cost of Proposed Deciduous Fruit
Tree Nursery (500 Jeribs)Table 3 - Deciduous Fruit Tree Nursery - Costs and Revenue
(500 Jeribs)
4. Costs and Revenues for Traditional and Improved Methods of Fruits andVegetables in Afghanistan
Table 1 - Estimated Costs and Revenues for Improved andTraditional Fruit Production
Table 2 - Estimated Cost and Vevenues for Improved and Tradi-tional Production of a Number of Vegetable Crops
Table 3 - Estimated Costs and Income for a 100 JeribVegetable Farm
5. Horticultural Crop Husbandry and Crop Varieties in Afghanistan
6. Detailed Climatic Data for Some Areas in Afghanistan
7. Specimen Soil Profile Analysis from the Khodaman Valley in Afghanistan
ANNEX 1Page 1
HORTICULTURAL PRODUCTION
A. INTRODUCTION
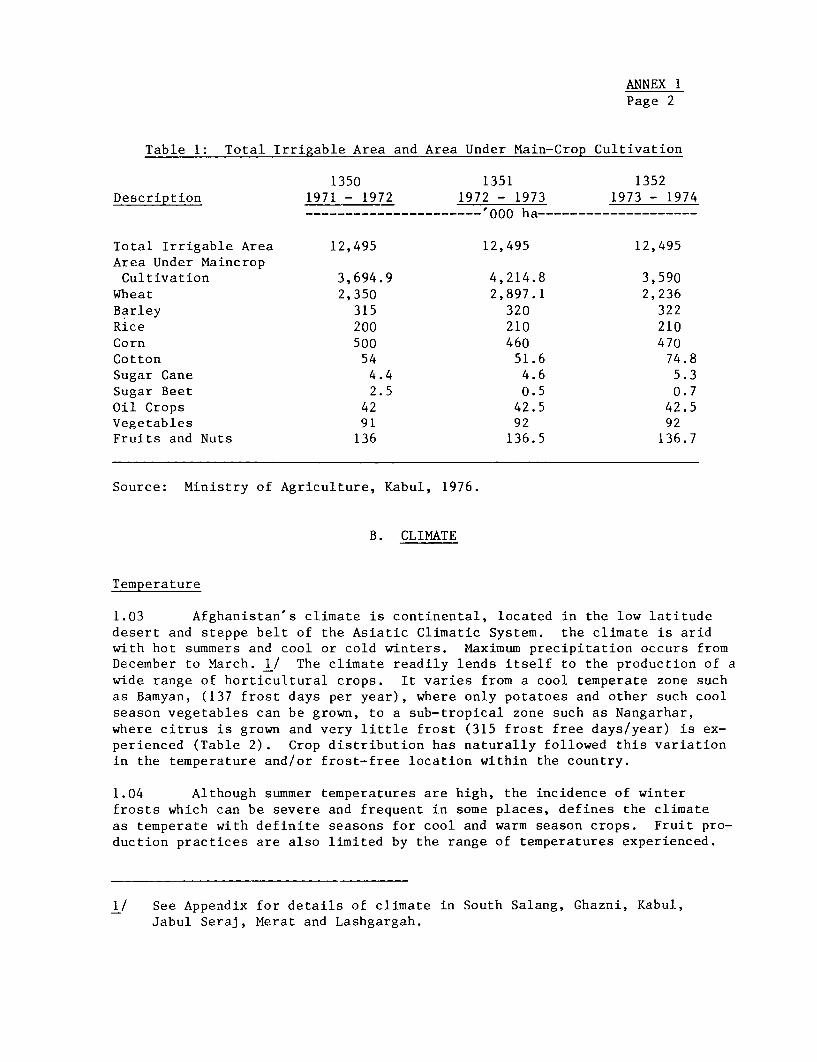
1.01 Horticulture is a major farm enterprise in Afghanistan. Horticul-
tural crops are produced on 6% of the total irrigated area in Afghanistan
(Table 1). The total area of horticultural crops is 231,600 ha, of which
140,300 ha are used for fruit and nut production and 91,300 ha are used for
vegetable crop production. Grape production is the most important single
enterprise (70,300 ha). The importance of horticulture in Afghanistan's
agricultural economy is also evidenced by its high contribution to the value
of agricultural exports. In 1975 (IBRD Agricultural and Rural Development
Sector Report, 1975), the value of horticultural products amounted to $79.0
million (50%) out of a total agricultural export trade of $159 million. Even
by world standards, horticulture is an important industry. The size of the
industry and its distribution in small-scale production units, provides the
basis for a widespread indigenous horticultural expertise which should be
a valuable asset in achieving the future potential for horticulture in the
area.
1.02 The high value of horticultural crops provides for a better per
unit area farm income and also ensures that high value fully irrigated lands
are used to their full potential. Wheat has an approximate gross value of
3,000-4,500 Afs/jerib, depending on the region of the country. Some formof double cropping could increase the gross return to 6,000-8,000 Afs/jerib.
However, most orchards crops or vegetable rotations have a gross return of
20,000-30,000 Afs/jerib. Costs of production of horticultural crops would
be higher but even so net return from these crops can at a minimum be double
those based on wheat as a major component in the crop rotation.
ANNEX 1Page 2
Table 1: Total Irrigable Area and Area Under Main-Crop Cultivation
1350 1351 1352Description 1971 - 1972 1972 - 1973 1973 - 1974
…'000_____________---- 000 ha--------------------
Total Irrigable Area 12,495 12,495 12,495Area Under MaincropCultivation 3,694.9 4,214.8 3,590
Wheat 2,350 2,897.1 2,236Barley 315 320 322Rice 200 210 210Corn 500 460 470Cotton 54 51.6 74.8Sugar Cane 4.4 4.6 5.3Sugar Beet 2.5 0.5 0.7Oil Crops 42 42.5 42.5Vegetables 91 92 92Fruits and Nuts 136 136.5 136.7
Source: Ministry of Agriculture, Kabul, 1976.
B. CLIMATE
Temperature
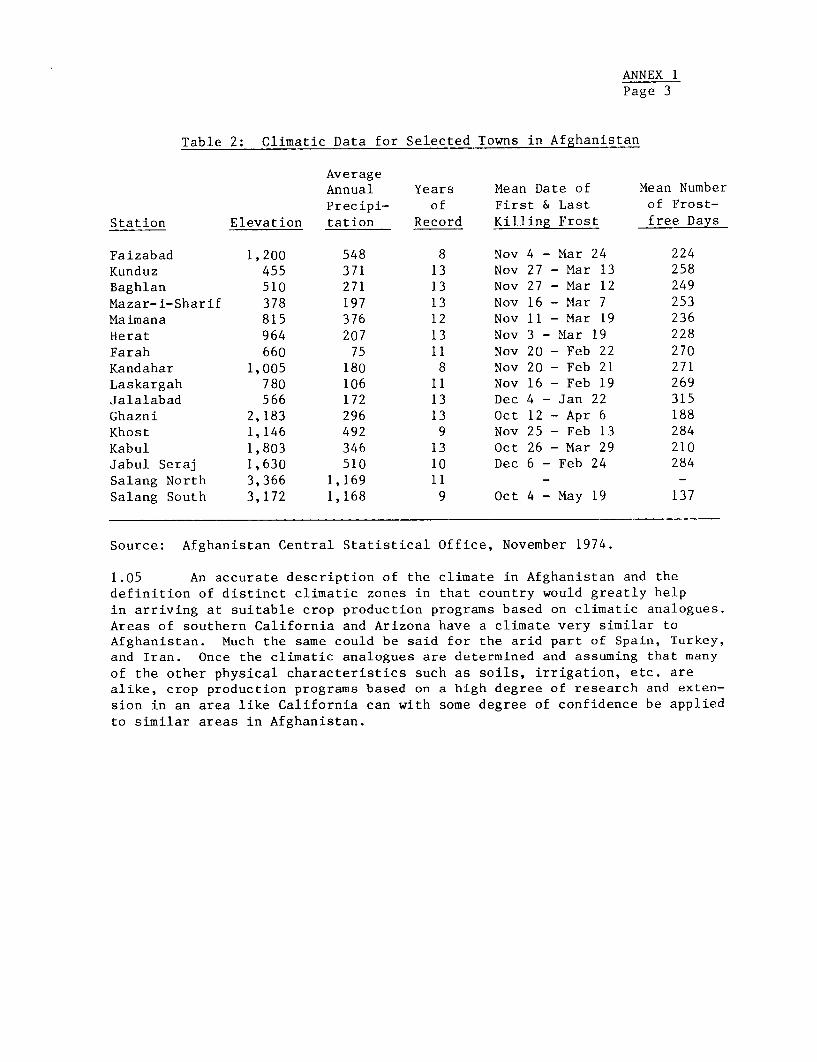
1.03 Afghanistan's climate is continental, located in the low latitudedesert and steppe belt of the Asiatic Climatic System. the climate is aridwith hot summers and cool or cold winters. Maximum precipitation occurs fromDecember to March. 1/ The climate readily lends itself to the production of awide range of horticultural crops. It varies from a cool temperate zone suchas Bamyan, (137 frost days per year), where only potatoes and other such coolseason vegetables can be grown, to a sub-tropical zone such as Nangarhar,where citrus is grown and very little frost (315 frost free days/year) is ex-perienced (Table 2). Crop distribution has naturally followed this variationin the temperature and/or frost-free location within the country.
1.04 Although summer temperatures are high, the incidence of winterfrosts which can be severe and frequent in some places, defines the climateas temperate with definite seasons for cool and warm season crops. Fruit pro-duction practices are also limited by the range of temperatures experienced.
1/ See Appendix for details of climate in South Salang, Ghazni, Kabul,Jabul Seraj, Merat and Lashgargah.
ANNEX 1Page 3
Table 2: Climatic Data for Selected Towns in Afghanistan
AverageAnnual Years Mean Date of Mean NumberPrecipi- of First & Last of Frost-
Station Elevation tation Record Killing Frost free Days
Faizabad 1,200 548 8 Nov 4 - Mar 24 224Kunduz 455 371 13 Nov 27 - Mar 13 258Baghlan 510 271 13 Nov 27 - Mar 12 249
Mazar-i-Sharif 378 197 13 Nov 16 - Mar 7 253Maimana 815 376 12 Nov 11 - Mar 19 236Herat 964 207 13 Nov 3 - Mar 19 228Farah 660 75 11 Nov 20 - Feb 22 270
Kandahar 1,005 180 8 Nov 20 - Feb 21 271Laskargah 780 106 11 Nov 16 - Feb 19 269Jalalabad 566 172 13 Dec 4 - Jan 22 315Ghazni 2,183 296 13 Oct 12 - Apr 6 188Khost 1,146 492 9 Nov 25 - Feb 13 284Kabul 1,803 346 13 Oct 26 - Mar 29 210Jabul Seraj 1,630 510 10 Dec 6 - Feb 24 284Salang North 3,366 1,169 11 - -Salang South 3,172 1,168 9 Oct 4 - May 19 137
Source: Afghanistan Central Statistical Office, November 1974.
1.05 An accurate description of the climate in Afghanistan and thedefinition of distinct climatic zones in that country would greatly help
in arriving at suitable crop production programs based on climatic analogues.
Areas of southern California and Arizona have a climate very similar toAfghanistan. Much the same could be said for the arid part of Spain, Turkey,and Iran. Once the climatic analogues are determined and assuming that many
of the other physical characteristics such as soils, irrigation, etc. arealike, crop production programs based on a high degree of research and exten-
sion in an area like California can with some degree of confidence be appliedto similar areas in Afghanistan.
ANNEX 1Page 4
Table 3: Mean Monthly Temperature and Degree Days (April to October) for aNumber of Locations in Afghanistan and Elsewhere
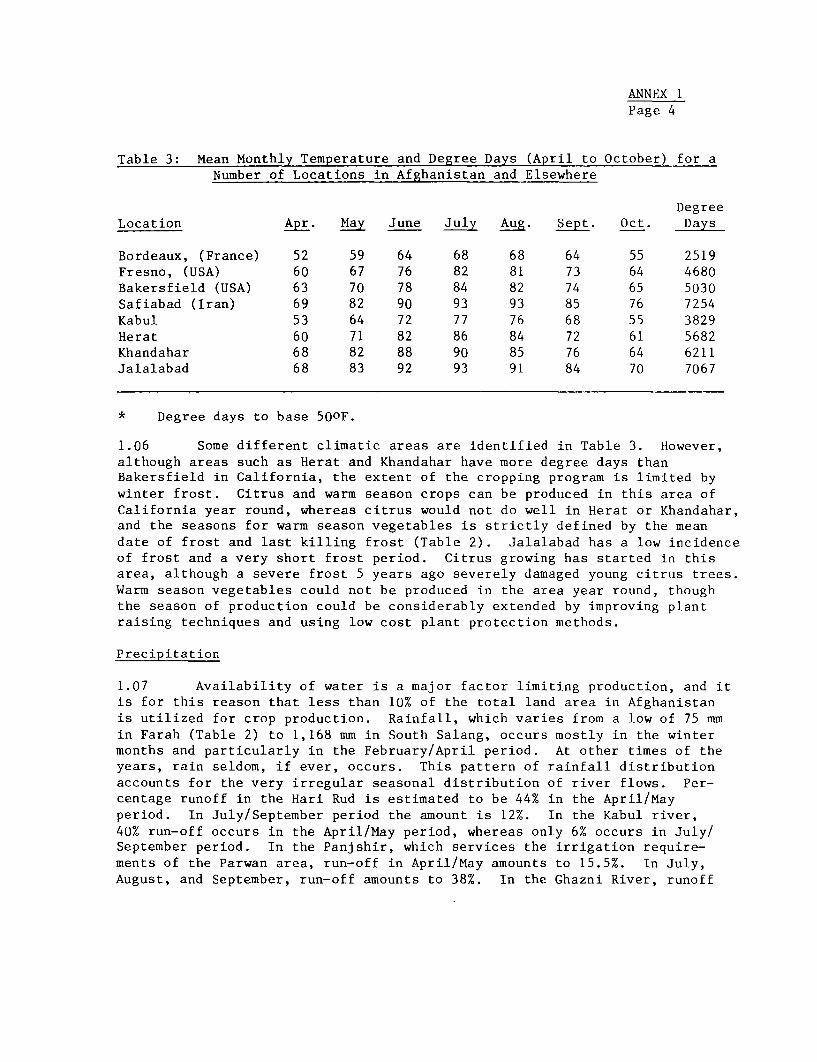
DegreeLocation Apr. May June July Ag. Sept. Oct. Days
Bordeaux, (France) 52 59 64 68 68 64 55 2519Fresno, (USA) 60 67 76 82 81 73 64 4680Bakersfield (USA) 63 70 78 84 82 74 65 5030Safiabad (Iran) 69 82 90 93 93 85 76 7254Kabul 53 64 72 77 76 68 55 3829Herat 60 71 82 86 84 72 61 5682Khandahar 68 82 88 90 85 76 64 6211Jalalabad 68 83 92 93 91 84 70 7067
* Degree days to base 500F.
1.06 Some different climatic areas are identified in Table 3. However,although areas such as Herat and Khandahar have more degree days thanBakersfield in California, the extent of the cropping program is limited bywinter frost. Citrus and warm season crops can be produced in this area ofCalifornia year round, whereas citrus would not do well in Herat or Khandahar,and the seasons for warm season vegetables is strictly defined by the meandate of frost and last killing frost (Table 2). Jalalabad has a low incidenceof frost and a very short frost period. Citrus growing has started in thisarea, although a severe frost 5 years ago severely damaged young citrus trees.Warm season vegetables could not be produced in the area year round, thoughthe season of production could be considerably extended by improving plantraising techniques and using low cost plant protection methods.
Precipitation
1.07 Availability of water is a major factor limiting production, and itis for this reason that less than 10% of the total land area in Afghanistanis utilized for crop production. Rainfall, which varies from a low of 75 mmin Farah (Table 2) to 1,168 mm in South Salang, occurs mostly in the wintermonths and particularly in the February/April period. At other times of theyears, rain seldom, if ever, occurs. This pattern of rainfall distributionaccounts for the very irregular seasonal distribution of river flows. Per-centage runoff in the Hari Rud is estimated to be 44% in the April/Mayperiod. In July/September period the amount is 12%. In the Kabul river,40% run-off occurs in the April/May period, whereas only 6% occurs in July/September period. In the Panjshir, which services the irrigation require-ments of the Parwan area, run-off in April/May amounts to 15.5%. In July,August, and September, run-off amounts to 38%. In the Ghazni River, runoff
ANNEX 1Page 5
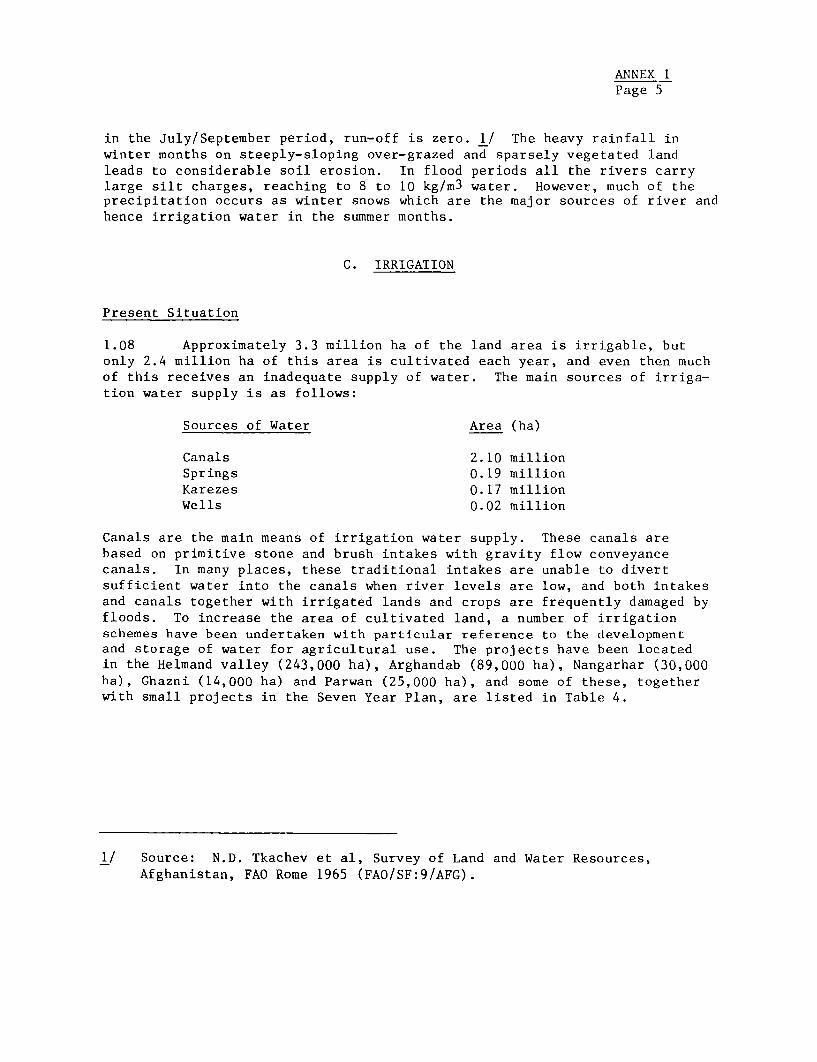
in the July/September period, run-off is zero. 1/ The heavy rainfall inwinter months on steeply-sloping over-grazed and sparsely vegetated landleads to considerable soil erosion. In flood periods all the rivers carrylarge silt charges, reaching to 8 to 10 kg/m3 water. However, much of theprecipitation occurs as winter snows which are the major sources of river andhence irrigation water in the summer months.
C. IRRIGATION
Present Situation
1.08 Approximately 3.3 million ha of the land area is irrigable, butonly 2.4 million ha of this area is cultivated each year, and even then muchof this receives an inadequate supply of water. The main sources of irriga-tion water supply is as follows:
Sources of Water Area (ha)
Canals 2.10 millionSprings 0.19 millionKarezes 0.17 millionWells 0.02 million
Canals are the main means of irrigation water supply. These canals arebased on primitive stone and brush intakes with gravity flow conveyancecanals. In many places, these traditional intakes are unable to divertsufficient water into the canals when river levels are low, and both intakesand canals together with irrigated lands and crops are frequently damaged byfloods. To increase the area of cultivated land, a number of irrigationschemes have been undertaken with particular reference to the developmentand storage of water for agricultural use. The projects have been locatedin the Helmand valley (243,000 ha), Arghandab (89,000 ha), Nangarhar (30,000ha), Ghazni (14,000 ha) and Parwan (25,000 ha), and some of these, togetherwith small projects in the Seven Year Plan, are listed in Table 4.
1/ Source: N.D. Tkachev et al, Survey of Land and Water Resources,Afghanistan, FAO Rome 1965 (FAO/SF:9/AFG).
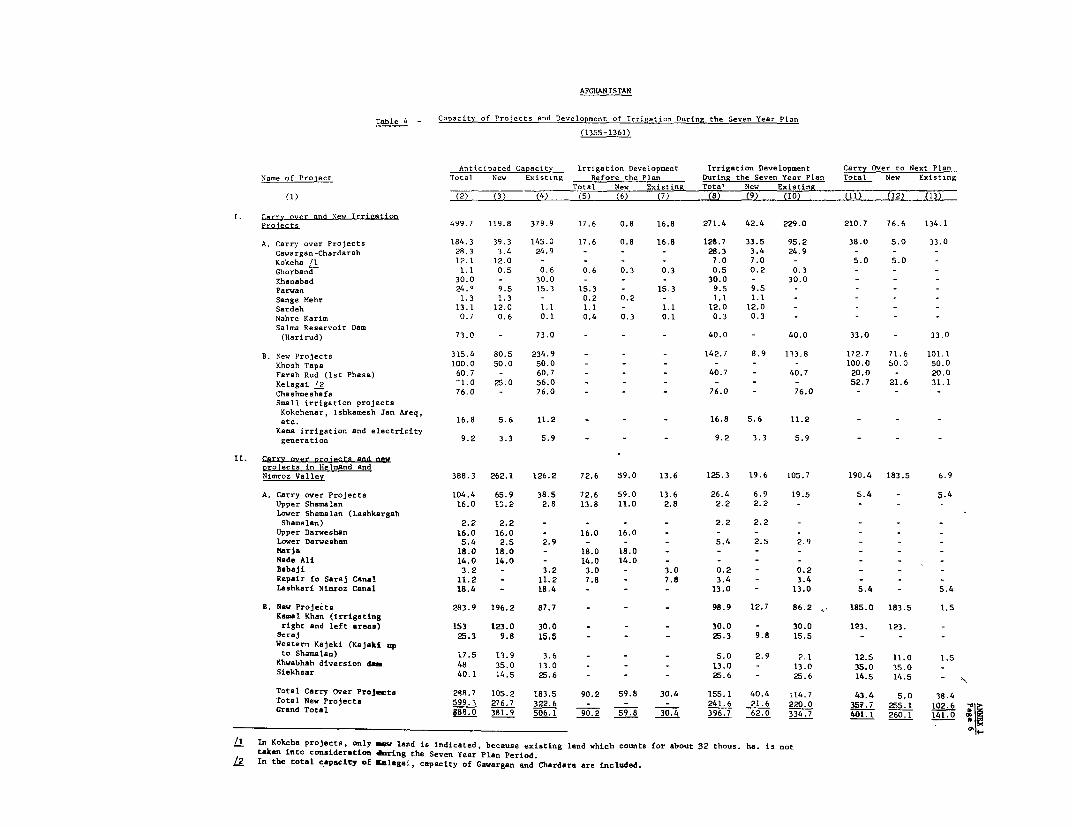
AFGHANTISTAN
Table 4 - Capacity of Projects and Development of Irrigation During the Seven Year Plan(1355-1361)
Anticipated Capacitv Irrigation Development Irrigation Development Carry Over to Next PlanName of Proiect Total New Existing Before the Plan During the Seven Year Plan Total New Existing
Total New Existing Total New Existing(1) (2) (3) (4) (5) (6) (7) (8) (9) (10) (11) (12) (13)
1. ferry over and New IrripationProie ts 499.7 119.8 379.9 17.6 0.8 16.8 271.4 42.4 229.0 210.7 76.6 134.1
A. Carry over Projects 184.3 39.3 145.0 17.6 0.8 16.8 128.7 33.5 95.2 38.0 5.0 33.0Gawargan-Chardarah 28.3 3.4 24.9 - - - 28.3 3.4 24.9 - - -Kokcha '1 12.1 12.0 - - - - 7.0 7.0 - 5.0 5.0Ghorband 1.1 0.5 0.6 0.6 0.3 0.3 0.5 0.2 0.3 - - --Khanabad 30.0 - 30.0 - - - 30.0 - 30 0Parwan 24.Q 9.5 15.3 15.3 - 15.3 9.5 9.5Sange Mehr 1.3 1.3 - 0.2 0.2 - 1.1 1.1Sardeh 13.1 12.0 1.1 1.1 - 1.1 12.0 12.0Nahre Karim 0.7 0.6 0.1 0.4 0.3 0.1 0.3 0.3 - - _ _Salma Reservoir Dam
(Harirud) 73.0 - 73.0 - - - 40.0 - 40.0 33.0 - 33.0
B. New Projects 315.4 80.5 234.9 - _ - 142.7 8.9 133.8 172.7 71.6 101.1Khosh Tapa 100.0 50.0 50.0 - - - - 100.0 50.0 50.0Farah Rud (Ist Phase) 60.7 - 60.7 - - - 40.7 - 40.7 20.0 - 20.0Kelagai '2 ' 25.0 56.0 _ _ _ - - - 52.7 21.6 31.1Chashmeshafa 76.0 - 76.0 - _ _ 76.0 - 76.0 - - -Small irrigation projects
Kokchenar, lshkamesh Jan Areq,etc. 16.8 5.6 11.2 - - - 16.8 5.6 11.2
Kama irrigation and electricitygeneration 9.2 3.3 5.9 _ - - 9.2 3.3 5.9
II. Carry over nroiects and newproiects in Helmand andNimroz Valley 388.3 262.1 126.2 72.6 59.0 13.6 125.3 19.6 105.7 190.4 183.5 6.9
A. Carry over Projects 104.4 65.9 38.5 72.6 59.0 13.6 26.4 6.9 19.5 5.4 - 5.4Upper Shamalan 16.0 13.2 2.8 13.8 11.0 2.8 2.2 2.2 - -Lower Shamalan (Lashkargah
Shamalan) 2.2 2.2 - - - - 2.2 2.2 -Upper Darweshan 16.0 16.0 _ 16.0 16.0 - - - -Lower Darweshan 5.4 2.5 2.9 - - - 5.4 2.5 2.9Marja 18.0 18.0 - 18.0 18.0 - - - - _ _ _Nade Ali 14.0 14.0 - 14.0 14.0 - - - -Babaji 3.2 - 3.2 3.0 - 3.0 0.2 - 0.2 - - -Repair fo Saraj Canal 11.2 - 11.2 7.8 - 7.8 3.4 - 3.4Lashkari Nimroz Canal 18.4 - 18.4 - - - 13.0 - 13.0 5.4 - 5.4
B. New Projects 283.9 196.2 87.7 - - - 98.9 12.7 86.2 . 185.0 183.5 1.5Kasial Khan (irrigatingright and left areas) 153 123.0 30.0 - - - 30.0 - 30.0 123. 123. -Ser9 j 25.3 9.8 15.5 - - - 25.3 9.8 15.5 - - -Western Kajaki (Kajaki upto Shamalan) 17.5 13.9 3.6 - - - 5.0 2.9 2.1 12.5 11.0 1,5Khwabhah diversion das 48 35.0 13.0 - - - 13.0 - 13.0 35.0 35.0 -Siekhsar 40.1 14.5 25.6 - - _ 25.6 - 25.6 14.5 14.5 - -
Total Carry Over Projects 29A.7 105.2 183.5 90.2 59.8 30.4 155.1 40.4 114.7 43.4 5.0 38.4Total New Projects 599.3 276.7 322.6 _ _ _ 241.6 21.6 220.0 35i.7 255.1 102.6Grand Total 588.0 381.9 506.1 90.2 59.8 30.4 396.7 62.0 334.7 401.1 260.1 141.0
L In Kokeha projects, only _ve land is indicated, because existing land which counts for about 32 thous. ha. is nottaken into consideration during the Seven Year Plan Period.12 In the total capacity of Kniagai, capacity of Gawargan and Chardare are included.
ANNEX IPage 7
1.09 Groundwater has been traditionally utilized through springs andthrough the kareze system of irrigation. However, many growers have showninterest in shallow and deep wells as sources of irrigation water. Thegroundwater potential has not been fully identified. Much of the surfacewater readily percolates into the coarse tallus deposits on the mountain
slopes and the importance of groundwater as a source of water is evidencedby the fact that many rivers are fed by groundwater and by the extensive useof the karese irrigation system. The use of pumped well water through modernirrigation systems could materially affect the efficiency of water use.Such systems can be integrated into efficiently organized fruit and vegetableprojects in areas not previously sufficiently well irrigated by traditionalmeans.
Irrigation and Soils
1.10 Classification of soils on the basis of their suitability for ir-rigation were based on the following six classes:
Class I Very suitable for irrigationClass II : Moderately suitable for irrigationClass III : Marginally suitable for irrigationClass IV Non-arable land; not suitable for irrigation,
except under special conditions for irrigatedpasture
Class V Non-arable land; undetermined suitability forirrigation
Class VI : Non-irrigable land
Data on the present land use in each area is given in Tables 5 and 6. Thesetables show the extent of the different classes of soils present in the sur-vey areas, and the extent they were utilized at the time of the survey andcould be in the future. These limited surveys showed that although therewere no Class I soils in the survey area, there was considerable potential todevelop Class II and III soils. Class I soils are deep, medium texture andwater-holding capacity, moderate percolation with no salts. The topographyis favorable with a uniform gentle slope, the soil fertility status is high.Class II are suitable for irrigation but fail to reach Class I soils in pro-duction capacity. Special practices that may be required included, levelling,special tillage requirements, low fertility etc. Class III soils require spe-cial treatments to overcome major problems, e.g. extensive levelling drainage,contour irrigation, etc.
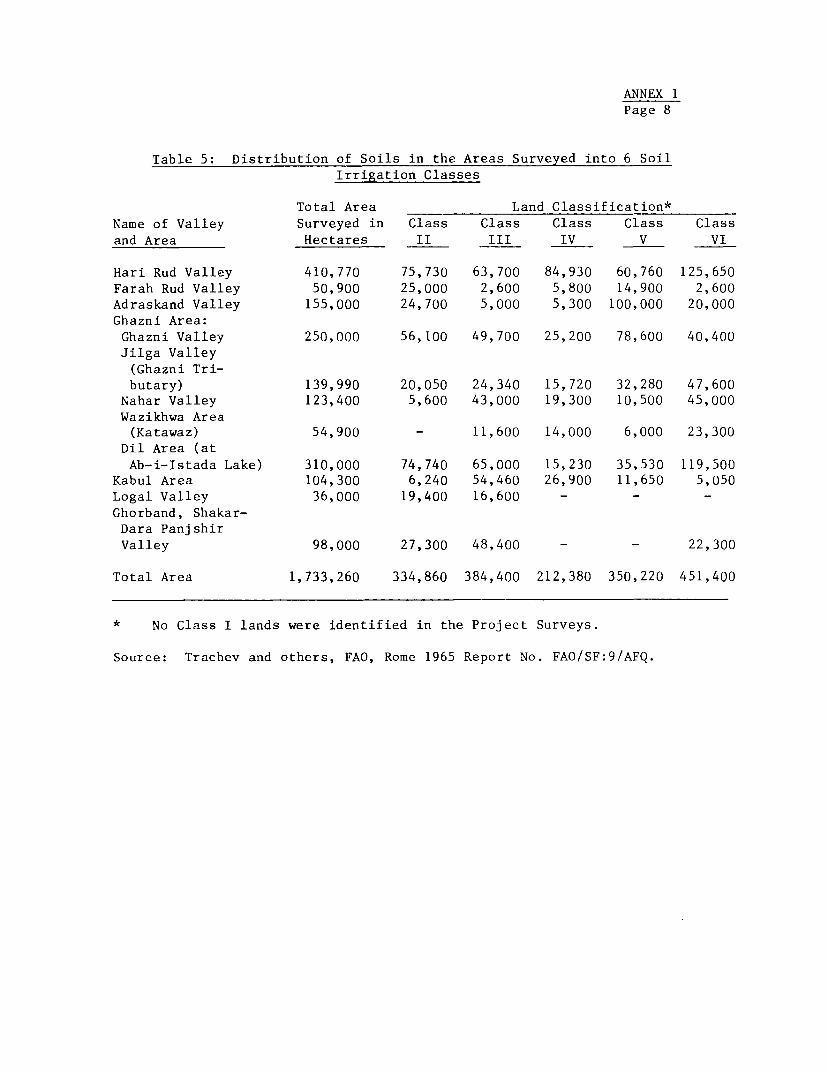
ANNEX 1Page 8
Table 5: Distribution of Soils in the Areas Surveyed into 6 SoilIrrigation Classes
Total Area Land Classification*Name of Valley Surveyed in Class Class Class Class Classand Area Hectares II III IV V VI
Hari Rud Valley 410,770 75,730 63,700 84,930 60,760 125,650Farah Rud Valley 50,900 25,000 2,600 5,800 14,900 2,600Adraskand Valley 155,000 24,700 5,000 5,300 100,000 20,000Ghazni Area:Ghazni Valley 250,000 56,100 49,700 25,200 78,600 40,400Jilga Valley(Ghazni Tri-butary) 139,990 20,050 24,340 15,720 32,280 47,600
Nahar Valley 123,400 5,600 43,000 19,300 10,500 45,000Wazikhwa Area(Katawaz) 54,900 - 11,600 14,000 6,000 23,300
Dil Area (atAb-i-Istada Lake) 310,000 74,740 65,000 15,230 35,530 119,500
Kabul Area 104,300 6,240 54,460 26,900 11,650 5,050Logal Valley 36,000 19,400 16,600 - - -Ghorband, Shakar-Dara PanjshirValley 98,000 27,300 48,400 - - 22,300
Total Area 1,733,260 334,860 384,400 212,380 350,220 451,400
* No Class I lands were identified in the Project Surveys.
Source: Trachev and others, FAO, Rome 1965 Report No. FAO/SF:9/AFQ.
ANNEX 1Page 9
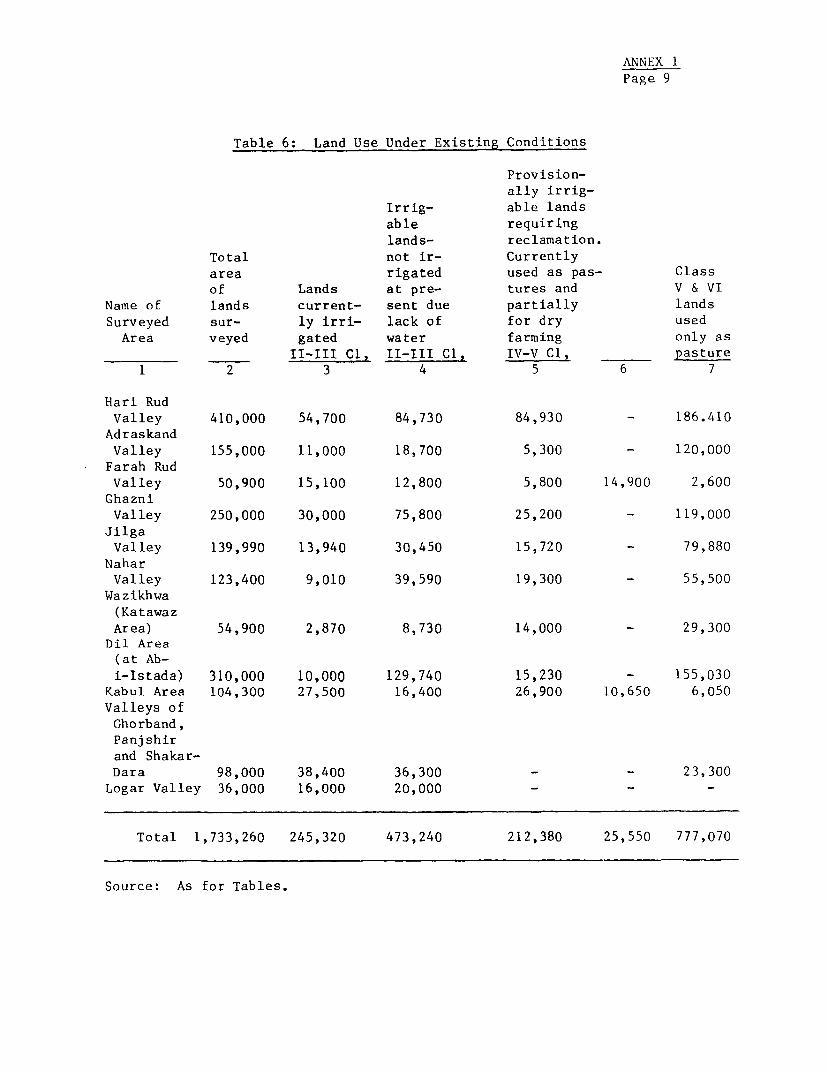
Table 6: Land Use Under Existing Conditions
Provision-ally irrig-
Irrig- able landsable requiringlands- reclamation.
Total not ir- Currentlyarea rigated used as pas- Classof Lands at pre- tures and V & VI
Name of lands current- sent due partially landsSurveyed sur- ly irri- lack of for dry usedArea veyed gated water farming only as
II-III C1, II-III C1, IV-V C1, pasture1 2 3 4 5 6 7
Hari RudValley 410,000 54,700 84,730 84,930 - 186.410
AdraskandValley 155,000 11,000 18,700 5,300 - 120,000
Farah RudValley 50,900 15,100 12,800 5,800 14,900 2,600
GhazniValley 250,000 30,000 75,800 25,200 - 119,000
JilgaValley 139,990 13,940 30,450 15,720 - 79,880
NaharValley 123,400 9,010 39,590 19,300 - 55,500Wazikhwa(KatawazArea) 54,900 2,870 8,730 14,000 - 29,300
Dil Area(at Ab-i-Istada) 310,000 10,000 129,740 15,230 - 155,030
Kabul Area 104,300 27,500 16,400 26,900 10,650 6,050Valleys ofGhorband,Panjshirand Shakar-Dara 98,000 38,400 36,300 - _ 23,300
Logar Valley 36,000 16,000 20,000 - - -
Total 1,733,260 245,320 473,240 212,380 25,550 777,070
Source: As for Tables.
ANNEX IPage 10
1.11 The cultivated soils are mostly formed on alluvial, colluvial andloess deposits. The flat alluvial plain soils can be easily irrigated andare mostly suitable for mechanical crop production. The loess and colluvialdeposits occur in a rolling topography. To make these soils suitable for ir-rigation, many of them have been terraced, the amount of terracing undertakenbeing a function of the extent of land slope. However, in most cases, terrac-ing has resulted in the formation of a large number of very small fields,mostly unsuitable for any form of mechanization. Extensive levelling as seenin the Nangahar project does add substantially to the cost of an irrigationproject. In such circumstances, and where groundwater reserves are high, theuse of shallow or deep wells should prove to be a much more efficient way ofintroducing irrigation.
Irrigation and Evapotranspiration
1.12 The quantity of water required by crops depends on temperature,humidity, solar radiation and the effects of these on leaf temperature andevapotranspiration. For instance, water requirements for grapes have beenshown to vary from 16-20 acre inches of water in areas with less than 2,500 1/degree days to 42-54 acre inches of water in areas with over 6,000 degree days.
In Khandahar, summation of degree days over a base of 500 F amounts to 6,590degree days and hence crops in the area have a high water requirement. Waterrequirements can also be estimated from other factors, such as measurement ofsolar radiation and its effect on evapotranspiration. Estimates of this canbe obtained from evaporation from an open water surface. In Jalalabad thisis estimated to be 79.6 inches per year, in Kabul 63.4 inches, and in Ghazni55.9 inches.
1.13 The amount of available water in soil in relation to these veryhigh requirements is very small. Water capacity varies according to thephysical characteristics of the soil. In some soils in the Khodaman Valley,water capacity amounts to 3-4 inches of water per acre foot of soil. Sandysoils contain considerably less. In general the amount retained by soilsin relation to water requirements is small. However, water holding charac-teristics do have an important effect in influencing the way and number oftimes a soil needs to be irrigated. In general, water holding capacity ofAfghan soils is reasonably good, percolation is not excessive and thereforegravity irrigation can be once every I to 3 weeks, depending on location andtime of year.
1.14 The availability of well irrigated land should not limit horticul-tural crop production. One reason for expanding horticultural crop growingis to make better use of highly valued well irrigated land by growing valua-able cash crops on them. Horticultural crops should then be grown on landpreviously used for low value crops such as wheat. They should also be in-cluded as an important component of the farm rotation in newly developed andirrigated areas such as has been done in the Nangarha project. In othercircumstances, smaller irrigation developments based on pump well could bedeveloped as the cost of these is acceptable in horticultural crop produc-tion.
ANNEX 1Page 11
D. SOILS
Soil Types
1.15 The soils of Afghanistan are zonal soils (order Aridisoils of the7th Approximation), developed under the dominating influence of climate andliving organisms. The soils of the country have been developed under dry con-ditions. Since moisture is low, chemical weathering and soil formation takesplace at a slow rate and most of the weathering products are retained withinthe soil body itself. Calcification is the dominant soil forming factor.Because of the lack of moisture, very little leaching takes place, salts ofcalcium and magnesium accumulate within the soil profile and the soil becomesbase saturated. In many areas, due to continued use of irrigation waterladen with silt, etc., and the combined application of a mixture of farmyardmanure and soil has led to the formation of man-made agro-irrigation soilsoften up to 1 m. deep.
1.16 The soils are generally light in texture since physical disintegra-tion dominates over chemical weatherage. In many areas, the texture remainsmore or less uniform throughout the soil profile. Organic matter levels arevery low with less than 1% organic matter in them. Consequently soils, par-ticularly those intensively cultivated, have a poor structure or no structureat all. Soils with a cloddy structure are friable when moist, but hard tovery hard when dry. As a result, the formation of hard crusts could have aserious effect on germination and seedling emergence of small seeded vegetablecrops.
1.17 The soils are highly calcareous 1/. Most soils have an 8-10%calcium carbonate in them; some of the soils in the Panjsher Valley haveless than 1% calcium carbonate in them, while some soils have up to 20% inthem. Extreme cases show calcium carbonate levels of 30-40%. pH valuespredominate in the 8.0-8.5 zone, though some have values of 10, showing theincidence of excess sodium in the solum. The incidence of high calcium levelsand high pH leads to situations where many of the minor elements will not beavailable. Thus deficiency symptoms of iron and manganese are endemic, andthe possibility of copper, zinc and boron deficiency is extremely high.
1.18 Since organic matter is low, nitrogen levels are also low, being0.05% or less nitrogen on average. Phosphorus levels are also low. Thewater-soluble phosphorus content of the soils varies from trace to 1 part permillion. As the soils are highly calcareous, a large part of the appliedphosphorus will be fixed by the soil, leading to some ineffficiency in phos-phorus fertilizer use. Potassium levels are low. The water-soluble potassiumranges from 5 to 20 parts per million (ppm), whereas exchangeable potassiumlevels vary between 500 to 1,000 ppm ordinarily present. However, withincreased use of phosphorus and nitrogen fertilizers, more and more potassiumwill also be taken up from the soil, and the need for potassium fertilizer islikely to develop.
1/ Analyses of some specimen profiles from the Khodaman Valley are givenin the Appendix 2.
ANNEX 1Page 12
1.19 Moisture-holding characteristics of the Afghan soils vary accord-ing to texture. In general, they have 30-35 moisture capacity, or 3 50 4inches of water per acre foot of the soil. The moisture-holding charac-teristics are important in determining the frequency of irrigation requiredto maintain sufficient soil moisture required for maximum plant growth.
Soil Fertility
1.20 One of the major factors limiting Afghan agriculture is the lack offertilizer use. Soils are deficient in all plant nutrients, and especiallynitrogen in view of the very low organic matter levels. Nutrient depletingcrops such as wheat, corn, rice and barley have been grown for many yearswithout replenishing the nutrients removed. Some farmyard manure has beenused, but the nutrient inputs obtained in this way are insufficient to meetcrop demands and maintain nutrient levels in soils at a satisfactory level.
1.21 Fertilizer use is relatively new in Afghan agriculture (Table 7).Fertilizer consumption since 1966 has increased tremendously from 8,500 tonsin 1966 to an estimated 60,000 tons in 1975. This is equivalent to 9.6 kg(N, P205) per ha in 1975. Indications are that optimum fertilizer use for
for wheat and corn varies between 60 and 150 kg/ha. 1/ The use of 9.6 kg(N, P205) at present highlights the need for a much greater use of fertilizers
in Afghan agriculture.
1.22 Fertilizer use in horticultural crops is generally much greater asnutrient requirements for vegetable crops are much higher. Ministry of Agri-culture recommendations for vines indicate the need for 470 kgha N, P205 and
K20. In vegetable crop production approximately 500 kg/ha N, P205 and K20
would be needed to maximize production, especially in view of the present lowfertility of Afghan soils.
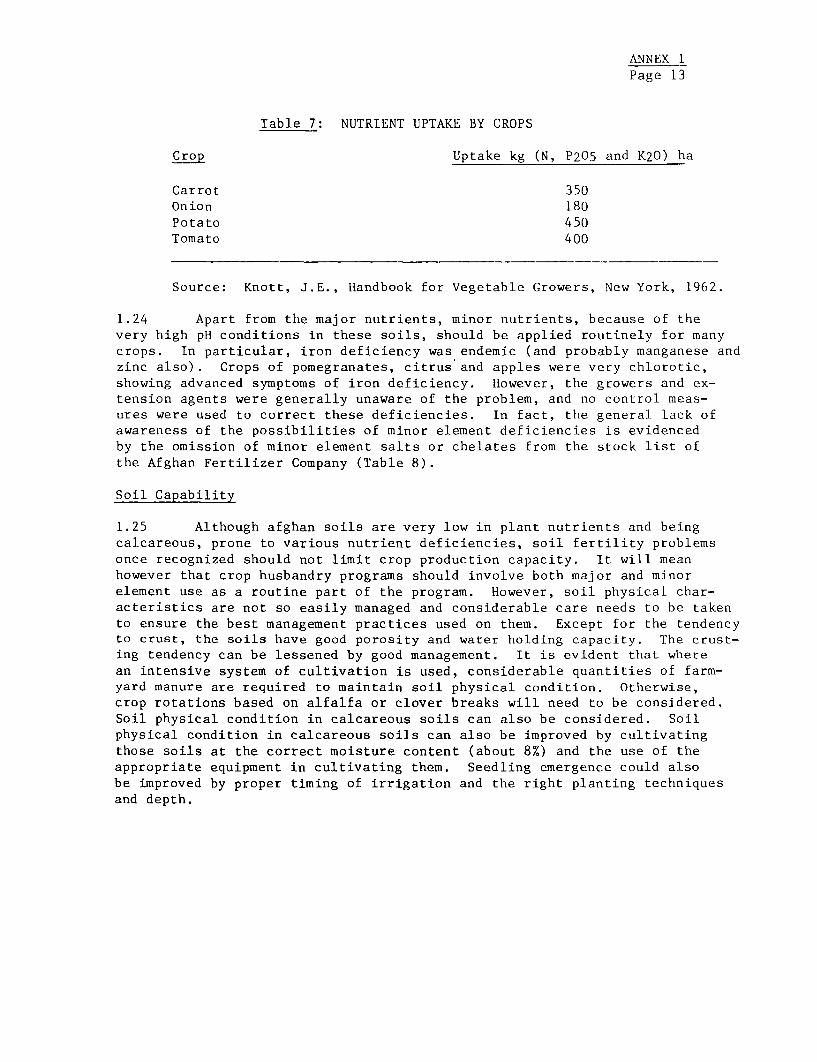
1.23 In fruit and vegetable production farmyard manure is used on mostcrops. In vegetable crop production, 50-100 tons of farmyard manure per haare often used. In vine growing, 100 tons of farmyard manure are appliedevery second or third year. Fertilizer use tended to be quite low, namely25-50 kg N, P205 ha for vegetables and 90 to 120 kg N, P205/ha in vineyards.
These rates of fertilizer application and use of farmyard manure are obviouslymuch higher than the general average but again far short of the optimum ratesrecommended. The need for higher rates of fertilizer in horticulture isevidenced by the high level of nutrient uptake some high-yielding vegetablescrops (Table 7).
1/ Tamboli, P.M. Soil Fertility and Fertilizer Use in Afghanistan.FAO, Rome, 1971. Report FAO No. TA 3016.
ANNEX 1Page 13
Table 7: NUTRIENT UPTAKE BY CROPS
Crop Uptake kg (N, P205 and K20) ha
Carrot 350Onion 180Potato 450Tomato 400
Source: Knott, J.E., Handbook for Vegetable Growers, New York, 1962.
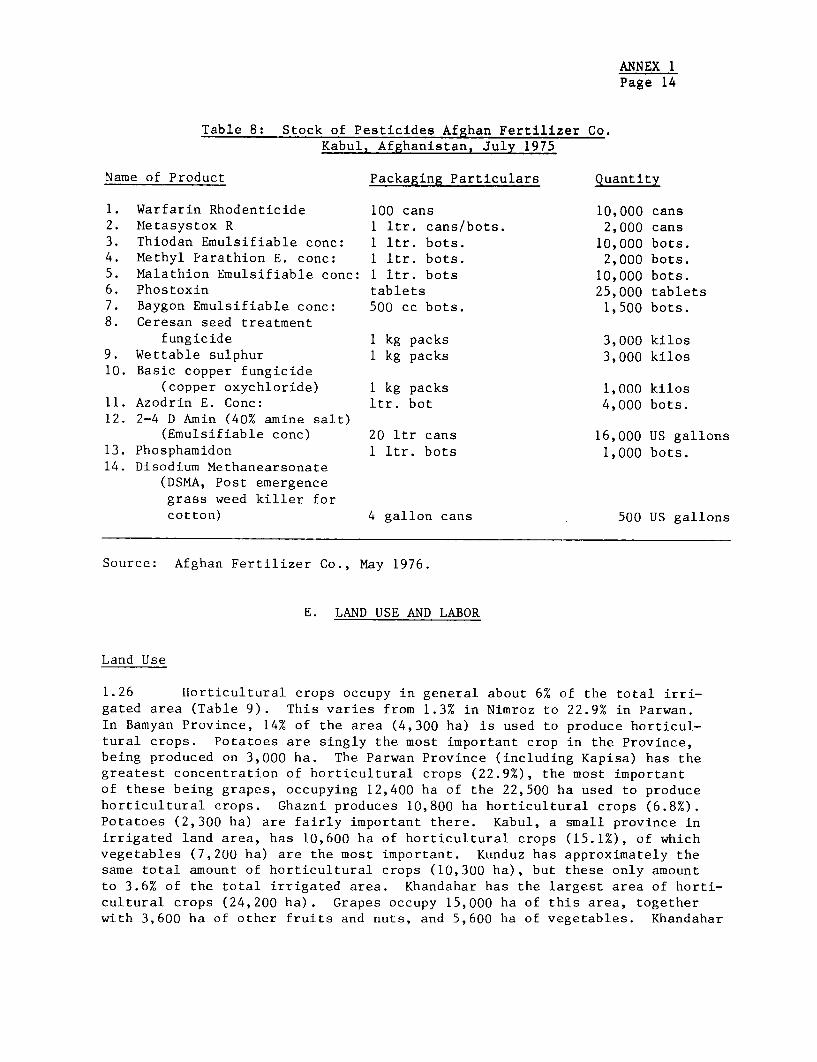
1.24 Apart from the major nutrients, minor nutrients, because of thevery high pH conditions in these soils, should be applied routinely for manycrops. In particular, iron deficiency was endemic (and probably manganese andzinc also). Crops of pomegranates, citrus and apples were very chlorotic,showing advanced symptoms of iron deficiency. However, the growers and ex-tension agents were generally unaware of the problem, and no control meas-ures were used to correct these deficiencies. In fact, the general lack ofawareness of the possibilities of minor element deficiencies is evidencedby the omission of minor element salts or chelates from the stock list ofthe Afghan Fertilizer Company (Table 8).
Soil Capability
1.25 Although afghan soils are very low in plant nutrients and beingcalcareous, prone to various nutrient deficiencies, soil fertility problemsonce recognized should not limit crop production capacity. It will meanhowever that crop husbandry programs should involve both major and minorelement use as a routine part of the program. However, soil physical char-acteristics are not so easily managed and considerable care needs to be takento ensure the best management practices used on them. Except for the tendencyto crust, the soils have good porosity and water holding capacity. The crust-ing tendency can be lessened by good management. It is evident that wherean intensive system of cultivation is used, considerable quantities of farm-yard manure are required to maintain soil physical condition. Otherwise,crop rotations based on alfalfa or clover breaks will need to be considered.Soil physical condition in calcareous soils can also be considered. Soilphysical condition in calcareous soils can also be improved by cultivatingthose soils at the correct moisture content (about 8%) and the use of theappropriate equipment in cultivating them. Seedling emergence could alsobe improved by proper timing of irrigation and the right planting techniquesand depth.
ANNEX 1Page 14
Table 8: Stock of Pesticides Afghan Fertilizer Co.Kabul, Afghanistan, July 1975
Name of Product Packaging Particulars Quantity
1. Warfarin Rhodenticide 100 cans 10,000 cans2. Metasystox R 1 ltr. cans/bots. 2,000 cans3. Thiodan Emulsifiable conc: 1 ltr. bots. 10,000 bots.4. Methyl Parathion E. conc: 1 ltr. bots. 2,000 bots.5. Malathion Emulsifiable conc: 1 ltr. bots 10,000 bots.6. Phostoxin tablets 25,000 tablets7. Baygon Emulsifiable conc: 500 cc bots. 1,500 bots.8. Ceresan seed treatment
fungicide 1 kg packs 3,000 kilos9. Wettable sulphur 1 kg packs 3,000 kilos10. Basic copper fungicide
(copper oxychloride) 1 kg packs 1,000 kilos11. Azodrin E. Conc: ltr. bot 4,000 bots.12. 2-4 D Amin (40% amine salt)
(Emulsifiable conc) 20 ltr cans 16,000 US gallons13. Phosphamidon 1 ltr. bots 1,000 bots.14. Disodium Methanearsonate
(DSMA, Post emergencegrass weed killer forcotton) 4 gallon cans 500 US gallons
Source: Afghan Fertilizer Co., May 1976.
E. LAND USE AND LABOR
Land Use
1.26 Horticultural crops occupy in general about 6% of the total irri-gated area (Table 9). This varies from 1.3% in Nimroz to 22.9% in Parwan.In Bamyan Province, 14% of the area (4,300 ha) is used to produce horticul-tural crops. Potatoes are singly the most important crop in the Province,being produced on 3,000 ha. The Parwan Province (including Kapisa) has thegreatest concentration of horticultural crops (22.9%), the most importantof these being grapes, occupying 12,400 ha of the 22,500 ha used to producehorticultural crops. Ghazni produces 10,800 ha horticultural crops (6.8%).Potatoes (2,300 ha) are fairly important there. Kabul, a small province inirrigated land area, has 10,600 ha of horticultural crops (15.1%), of whichvegetables (7,200 ha) are the most important. Kunduz has approximately thesame total amount of horticultural crops (10,300 ha), but these only amountto 3.6% of the total irrigated area. Khandahar has the largest area of horti-cultural crops (24,200 ha). Grapes occupy 15,000 ha of this area, togetherwith 3,600 ha of other fruits and nuts, and 5,600 ha of vegetables. Khandahar
ANNEX 1
Page 15
has a fairly large total irrigated area, and horticultural crops occupy 14.7%of this. Nangarhar, including Kunar Province, is also an important provincein terms of horticultural crop production. Nearly 12% of its irrigated area
is used for horticultural crops, comprising 16,100 ha in all. Grapes repre-sent a small proportion of this (2,900 ha), whereas other fruits and nuts are
produced on 7,000 ha there. Nangarhar has a large area of vegetables, 6,200ha as compared to 7,400 ha in Parwan and 7,200 ha in Kabul. However, the
area used for vegetable crop production in Nangahar has a greater signifi-cance in terms of total production as mostly 3 crops can be produced therein one year as against approximately 2 crops in Kabul and Parwan. Horti-cultural crops in Laghman, Lohgar and Wardak, though not large in size
(4,000-6,400 ha), occupy a significant percentage of the total irrigatedarea (12.5%-13.9%). Herat Province has the greatest total irrigated area(363,000 ha), and though 12,200 ha of horticultural crops are producedthre, the percentage contribution to crop production is much smaller thanthe national average (3.4%).
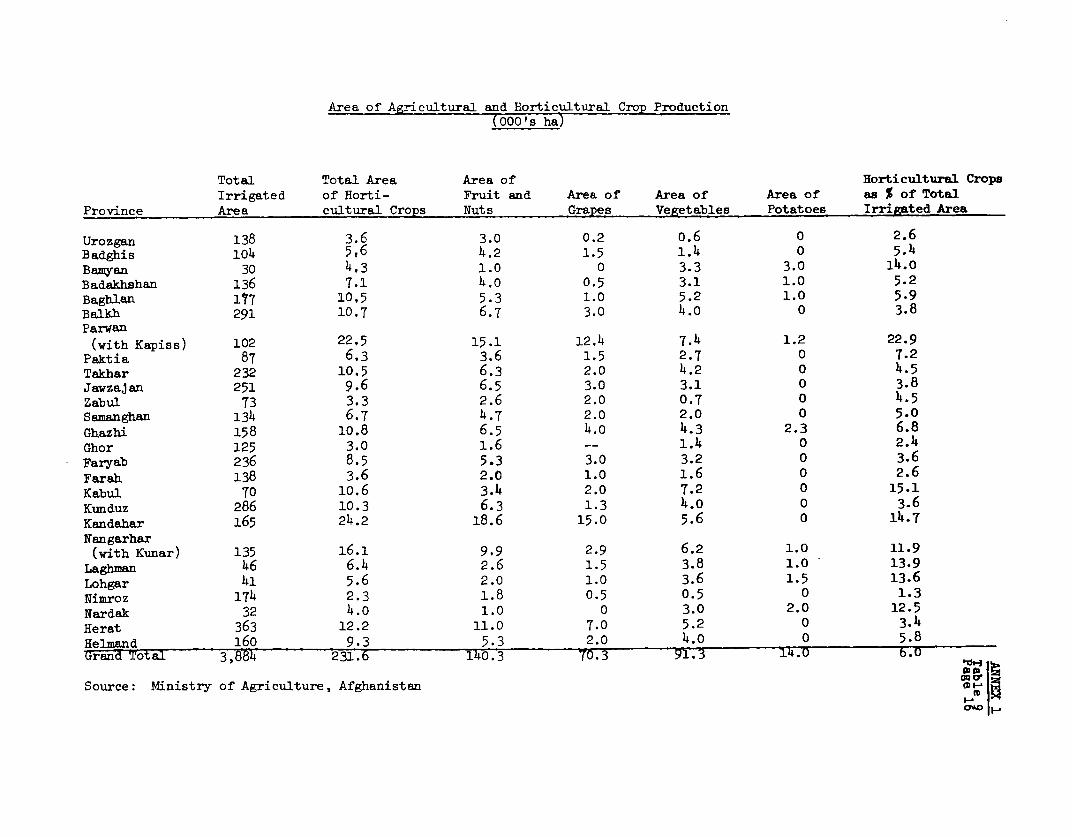
Area of Agricultural and Horticultural Crop Production(000's ha)
Total Total Area Area of Horticultural CropsIrrigated of Horti- Fruit and Area of Area of Area of as % of Total
Province Area cultural Crops Nuts Grapes Vegetables Potatoes Irrigated Area
Urozgan 138 3.6 3.0 0.2 o.6 0 2.6Badghis 104 5,6 4.2 1.5 1.4 0 5.4Bamyan 30 4,3 1.0 0 3.3 3.0 14.0Badakhshan 136 7.1 4.0 0.5 3.1 1.0 5.2Baghalan 17 10,5 5.3 1.0 5.2 1.0 5.9Balkh 291 10.7 6.7 3.0 4.0 0 3.8Parwan(with Kapiss) 102 22.5 15.1 12.4 7.4 1.2 22.9
Paktia 87 6.3 3.6 1.5 2.7 0 7.2Takhar 232 10.5 6.3 2.0 4.2 0 4.5Jawzajan 251 9.6 6.5 3.0 3.1 0 3.8Zabul 73 3.3 2.6 2.0 0.7 0 4.5Senanghan 134 6.7 4.7 2.0 2.0 0 5.0Ghazhi 158 10.8 6.5 4.0 4.3 2.3 6.8Ghor 125 3.0 1.6 -- 1.4 0 2.4Faryab 236 8.5 5.3 3.0 3.2 0 3.6Farah 138 3.6 2.0 1.0 1.6 0 2.6Kabul 70 lO.6 3.4 2.0 7.2 0 15.1Kunduz 286 10.3 6.3 1.3 4.0 0 3.6Kandahar 165 24.2 18.6 15.0 5.6 0 14.7Nangarhar(with Kunar) 135 16.1 9.9 2.9 6.2 1.0 11.9
Lagbman 46 6.4 2.6 1.5 3.8 1.0 13.9Lohgar 41 5.6 2.0 1.0 3.6 1.5 13.6Nimroz 174 2.3 1.8 0.5 0.5 0 1.3Nardak 32 4.0 1.0 0 3.0 2.0 12.5Herat 363 12.2 11.0 7.0 5.2 0 3.4Helmand 160 9.3 5.3 2.0 14.0 0 .Gran-d Total 3,8164 231.6 140.3 T0.3 91.3 1°4.0 °. 0
Source: Ministry of Agriculture, Afghanistan OQ 1
ANNEX 1Page 17
Farm Size and Value
1.27 The average farm size is generally low. The average for the coun-try is 17.5 jeribs, though many holdings are smaller. A high proportion ofthe total cultivated area is owned by a small number of large landowners. InKhandahar, average farm size is estimated to be 20-25 jeribs. In Herat, 30jeribs is estimated to be the average farm size. In Parwan Province, averagefarm size was much smaller, viz 4-6 jeribs. In Parwan, horticultural cropsare a major component of the total cropped area, but full use of this areais restricted by a lack of water for irrigation. In terms of vineyards,60% of them were less than 3 jeribs, and 88% were less than 10 jeribs. Only2% of these were greater than 23 jeribs in size. Estimated land values wereextremely high. They varied from 60,000 Af/jerib in Bamyan, 100,000 Af/jeribin Khandahar and Herat, and up to 200,000 Af/jerib of vineyard in Parwan.
Labor
1.28 Vegetables are highly labor-intensive and require one man/jerib.Vineyards and orchards are less labor-intensive, and in general one man couldmanage 3-5 jeribs of crops such as these. The system of payment and theterminology used varies from one region to another. Common arrangements areas follows:
Buzgar: share-cropper, paid 20%-50% of crop value.Note: the term "buzgar" can also be usedto denote an area of wheat, namely 20 jeribs.
Kustagar: the landlord's agent on larger farms. He isresponsible for employing labor (buzgars) andreceives a percentage of the crop value (about25%).
Agaradar: A person who rents land and is entireLy respon-sible for employing labor (usually at a dailyrate) and arranging crop production. Rent amountedto approximately 2,500 Af/jerib.
1.29 In Herat, labor costs are said to have considerably increased dueto increased demand for labor in Iran and the Gulf states and the higherwages paid there. In the Herat region, the buzgar share-cropping system wasused as well as labor hired on the basis of a regular income per year, viz.15,000 Afs.
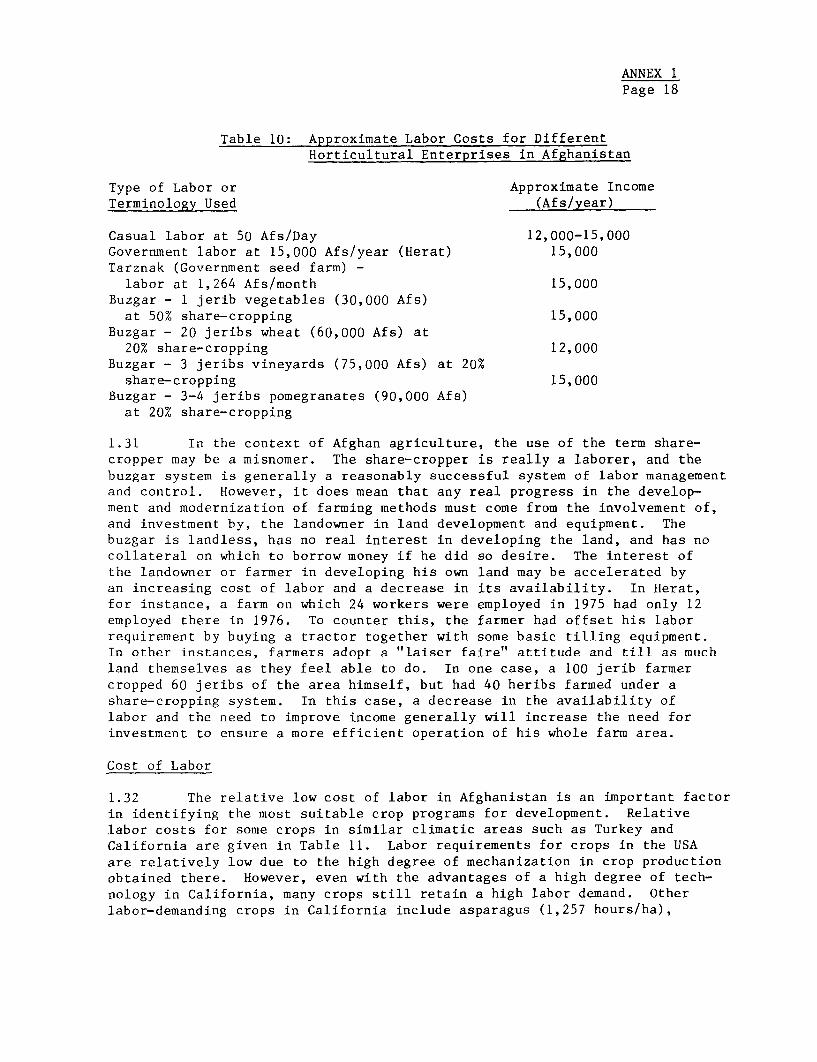
1.30 In Parwan, gardeners were employed at 1,000 Afs per month and wereexpected to take care of 3 jeribs of vineyard. However, in all circumstancesthe overall labor costs were similar regardless of the system used, as indi-cated in Table 10.
ANNEX 1Page 18
Table 10: Approximate Labor Costs for DifferentHorticultural Enterprises in Afghanistan
Type of Labor or Approximate IncomeTerminology Used (Afs/year)
Casual labor at 50 Afs/Day 12,000-15,000Government labor at 15,000 Afs/year (Herat) 15,000Tarznak (Government seed farm) -
labor at 1,264 Afs/month 15,000Buzgar - 1 jerib vegetables (30,000 Afs)
at 50% share-cropping 15,000Buzgar - 20 jeribs wheat (60,000 Afs) at
20% share-cropping 12,000Buzgar - 3 jeribs vineyards (75,000 Afs) at 20%
share-cropping 15,000Buzgar - 3-4 jeribs pomegranates (90,000 Afs)
at 20% share-cropping
1.31 In the context of Afghan agriculture, the use of the term share-cropper may be a misnomer. The share-cropper is really a laborer, and thebuzgar system is generally a reasonably successful system of labor managementand control. However, it does mean that any real progress in the develop-ment and modernization of farming methods must come from the involvement of,and investment by, the landowner in land development and equipment. Thebuzgar is landless, has no real interest in developing the land, and has nocollateral on which to borrow money if he did so desire. The interest ofthe landowner or farmer in developing his own land may be accelerated byan increasing cost of labor and a decrease in its availability. In Herat,for instance, a farm on which 24 workers were employed in 1975 had only 12employed there in 1976. To counter this, the farmer had offset his laborrequirement by buying a tractor together with some basic tilling equipment.In other instances, farmers adopt a "laiser faire" attitude and till as muchland themselves as they feel able to do. In one case, a 100 jerib farmercropped 60 jeribs of the area himself, but had 40 heribs farmed under ashare-cropping system. In this case, a decrease in the availability oflabor and the need to improve income generally will increase the need forinvestment to ensure a more efficient operation of his whole farm area.
Cost of Labor
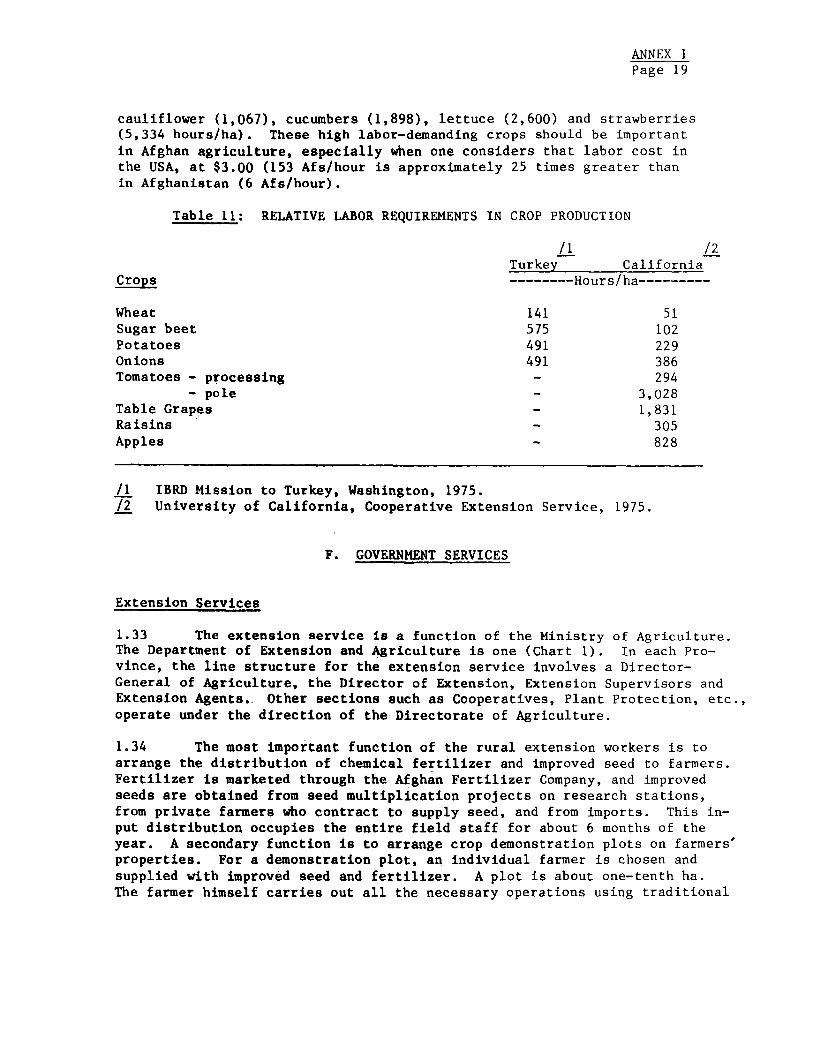
1.32 The relative low cost of labor in Afghanistan is an important factorin identifying the most suitable crop programs for development. Relativelabor costs for some crops in similar climatic areas such as Turkey andCalifornia are given in Table 11. Labor requirements for crops in the USAare relatively low due to the high degree of mechanization in crop productionobtained there. However, even with the advantages of a high degree of tech-nology in California, many crops still retain a high labor demand. Otherlabor-demanding crops in California include asparagus (1,257 hours/ha),
ANNEX 1Page 19
cauliflower (1,067), cucumbers (1,898), lettuce (2,600) and strawberries(5,334 hours/ha). These high labor-demanding crops should be importantin Afghan agriculture, especially when one considers that labor cost inthe USA, at $3.00 (153 Afs/hour is approximately 25 times greater thanin Afghanistan (6 Afs/hour).
Table 11: RELATIVE LABOR REQUIREMENTS IN CROP PRODUCTION
/1 /2Turkey California
Crops --------Hours/ha---------
Wheat 141 51Sugar beet 575 102Potatoes 491 229Onions 491 386Tomatoes - processing - 294
- pole - 3,028Table Grapes - 1,831Raisins - 305Apples - 828
/1 IBRD Mission to Turkey, Washington, 1975./2 University of California, Cooperative Extension Service, 1975.
F. GOVERNMENT SERVICES
Extension Services
1.33 The extension service is a function of the Ministry of Agriculture.The Department of Extension and Agriculture is one (Chart 1). In each Pro-vince, the line structure for the extension service involves a Director-General of Agriculture, the Director of Extension, Extension Supervisors andExtension Agents. Other sections such as Cooperatives, Plant Protection, etc.,operate under the direction of the Directorate of Agriculture.
1.34 The most important function of the rural extension workers is toarrange the distribution of chemical fertilizer and improved seed to farmers.Fertilizer is marketed through the Afghan Fertilizer Company, and improvedseeds are obtained from seed multiplication projects on research stations,from private farmers who contract to supply seed, and from imports. This in-put distribution occupies the entire field staff for about 6 months of theyear. A secondary function is to arrange crop demonstration plots on farmers'properties. For a demonstration plot, an individual farmer is chosen andsupplied with improved seed and fertilizer. A plot is about one-tenth ha.The farmer himself carries out all the necessary operations using traditional
ANNEX 1Page 20
methods and receives the product after the yield has been measured by anextension agent. These yields are recorded, but in many cases their accuracyis questionable.
1.35 Seed distribution is one of the Extension Service's major responsi-bility. Seed is presently produced at seed multiplication farms at Tarnak(Khandahar), Ghazni, Helmand Valley and Gourgan, and also at some of theMinistry of Agriculture research farms. This responsibility is soon likelyto be passed on to a Government-sponsored seed company which would produceseed in its own right, and also contract with farmers to produce certifiedseed from foundation stocks. By 1980 it is planned that the company wouldsupply 20% of the wheat seed requirements, and 100% of cotton seed require-ments. No provision has been made for the multiplication of vegetable seedstocks by this company in the initial years of its development. The proposedcompany would incorporate a research and development section. Other extensionactivities include the regular radio broadcasts for farmers by the InformationDirectorate of the Extension Department, which also produces large numbers ofsimple, illustrated pamphlets dealing with crop production.
1.36 Plant protection activities asre the responsibility of the Ministryof Agriculture, Department of Plant Protection and Quarantine. In each ofthe provinces the Director-General of Agriculture supervises a small staffof 5 to 10 people concerned with plant protection activities, but there areno village-level workers equivalent to the extension agents of the ExtensionDepartment.
1.37 The total staff of the Department of Extension and AgriculturalDevelopment comes to 2,550 people. The total number of field extensionworkers comes to 1,600, each of whom services over 450 farmers, or 1,000 ha.In more developed areas, one extension agent usually services about 200farmers. The extension service only operates in approximately 40% of theagricultural areas of the country. The total staff required is estimated tobe 7,200 field workers with the same number of back-up workers in otheraspects of agriculture. The total staff in the Headquarters of the ExtensionDepartment is 170. In Herat, there is a total staff of 250, of which only140 operate as extension agents. In the Herat area, there are 11 districtswith 16 extension supervisors, and 7-8 extension agents per extension super-visor. In Parwan, there are 85 extension agents with 10 extension super-visors. In Khandahar there are 85 extension agents covering less than 20%of the agricultural area and each extension agent advises 400-500 farmers.
1.38 Apart from the lack of extension staff, a major drawback is thetechnical training and ability of the staff presently in the extension service.Allied to this is the level of literacy generally in the country, which isgiven as 5%. In the younger one-third of the population, literacy amountsto 20-30%. Out of the total 2,550 employed in the Extension Department only179 have had a university education, and most of these are located in admin-istrative type positions. Of these, 27 have Masters degrees, and 2 haveobtained PhD. Of the remainder, 1,140 have reached the equivalent of 12thgrade education, and 1,710 have obtained up to but generally less than 9th
ANNEX 1Page 21
grade education. The 9th grade graduates have received no school trainingin Agriculture. In-service training is offered, but the general lack ofsuitably qualified personnel offers limited scope to the efficacy of thesetraining courses.
1.39 Even though horticulture represents a major value component ofAfghan agriculture, there are no specialist horticultural extension agents.In fact, only five professional staff with a horticultural training areemployed by the Extension Department. In the Faculty of Agriculture, horti-culture is taken as a subject in other options. In the Plant Science andExtension Cooperative Programs in the University of Kabul, horticulturalcrops are given 11 and 8 hours respectively. This corresponds to 7% and5% of the respective course loads. This lack of properly trained horti-cultural staff is a serious constraint to the Development of horticulturein Afghanistan.
1.40 In-service training is offered. Extension agents attend short(2-3 day) and long (10-15 day) annual courses at provincial level. The exten-sion supervisor also discusses on-going problems with the extension agents atweekly meetings. Extension supervisors attend annual meetings organized bythe Ministry of Agriculture in conjunction with a number (5-6) of other Pro-vinces. Extension directors, and General Director of Agriculture attendannual meetings in Kabul. There are no staff presently in external trainingcourses, due to a shortage of funds. In-service training for horticulturalcrop production is extremely restricted due to:
i) lack of suitability trained horticulturists, particularlyat Provincial level
ii) the low level of research development on horticulturalcrops
Research
1.41 Research is mainly the responsibility of the Ministry of Agriculture.The Faculty of Agriculture has a research farm in Kabul in which differentaspects of agricultural research are carried out. Included in its programis work on agricultural crops, vegetable crops and orchard fruits planted in1966. In the Ministry of Agriculture, research is carried out by the ResearchDepartment, supported by the Soil and Plant Services Unit. In addition, theWater and Power Authority (WAPA) has a research unit covering hydrology andsoil survey and classification.
1.42 The Ministry of Agriculture has research farms in a number ofprovinces. The main research stations are located as follows:
Kabul, with six farms covering all aspects of agriculturaland horticultural work;
ANNEX 1Page 22
Khandahar, the research station at Kocharan (45 ha) doeswork on wheat, fruit and vegetable crops;
Parwan, the Kohpica station works on vegetables and wheatfor seed increase;
Kunduz (55 ha), cotton, wheat and horticultural crops;
Balkh (75 ha), cotton, wheat and horticultural crops;
Bamyan (6 ha), potatoes, cereals and vegetables;
Herat (220 ha), cereals, vegetables and vineyards.
1.43 Research is a relatively new development in Afghanistan. The re-search farms visited had poor facilities, were inadequately staffed and therewas a constant staff turnover. For instance at the Shism Bagh, ResearchStation, Jalalabad, plant raising facilities were inadequate in an area wherethis aspect of crop production should be important. In Herat, much of machi-nary and equipment was out of use due to difficulties in obtaining serviceand spare parts. At the Badam Bagh fruit station outside of Kabul, thefarm manager (M.S. graduate from Idaho) had just been appointed and only 250jeribs of the 500 jeribs farm were irrigated. Much of the work of the re-search farms is devoted to raising of foundation seed and fruit tree stocksand to seed multiplication. In 1974/75 some 30% of the total area was devotedto this. In 1975, there were 117 graduation employed in the Research Depart-ment, some of them with training at foreign universities. About 25 graduateswork at the Darulaman Research Station in Kabul, but in the provinces and someof the farms in the Kabul area staff in general were limited to 1 or 2 grad-uates at each research station.
Education
1,45 University of Kabul, Faculty of Agriculture. The faculty of Agri-culture offers a four year course with four basic options:
- crop science with 25% participation- animal science with 5% participation- extension with 70% participation- education with 1% participation
There are 194 students in the final year class. The first two years of thecourse are devoted to such basic subjects as chemistry, botany, zoology, math-ematics, etc., whereas in the final two years students concentrate on theappropriate subject in the option of their choice.
1.46 There are 70 staff members, 20 of whom are away in in-service train-ing courses. The University of Wyoming (USA) has operated a cooperative pro-ject with the faculty of Agriculture in Kabul. At one time there were up to15 visiting professors on the staff, now only two. The staff is organized
ANNEX 1Page 23
under a Dean, Assistant Dean into ten departments, namely Soil Science, PlantProtection, Horticulture, Agricultural Engineering, Education, Extension andCooperative, Economics, Crop Science, Animal Science, and General Science(chemistry, zoology and botany). The staff is well trained, and most have upto Phd training obtained at various American universities and the AmericanUniversity in Lebanon. This work has been supported mostly by USAID program.
1.47 There are no tuition fees and accomodation with a small amount ofspending money is supplied out of government funds. Most of the studentsgain employment in the Ministry of Agriculture (90-95%) some (2-3%) are em-ployed by the University, the remainder by mostly government agencies.There are a total of 750 students and enrollment is increasing annually by10-15%.
1.48 It is apparent that the Faculty of Agriculture has been a verysuccessful institution and obviously has an important role in the future insupplying the core of well qualified personnel required by the various govern-ment agencies. The Faculty to date has a poor record in carrying out researchdue primarily to lack of funds and facilities. This same constraint, i.e.,funds, will also affect the way in which the Faculty can provide the properconditions for teaching and demonstration when student members continue toincrease by 10-15% each year. There are 7 staff members involved in horti-culture teaching and research. It is planned that horticulture will beoffered as an option from 1979 onwards.
1.49 Three secondary schools graduate about 300 students per year up tothe equivalent of a 12 grade standard. Some new agricultural schools areplanned at Jalalabad, Darvashan, Farah, Herat, Quisaar, Mazar-i-Sharif, andBaghlan. Each school will offer courses in four specialities - extensionand cooperation, plant science, animal science and mechanization. Eachschool, located on a 40-60 ha farm, will inc lude fully operative fruit andvegetable units. Foundation plantings of fruit trees and vines will beundertaken. In vegetable production good facilities e.g. cold frames, etc.,will be supplied. Over the next seven years, 6280 students will graduate,of whom 1560 will have a crop science (and some horticulture) speciality.
Afghan Fertilizer Company
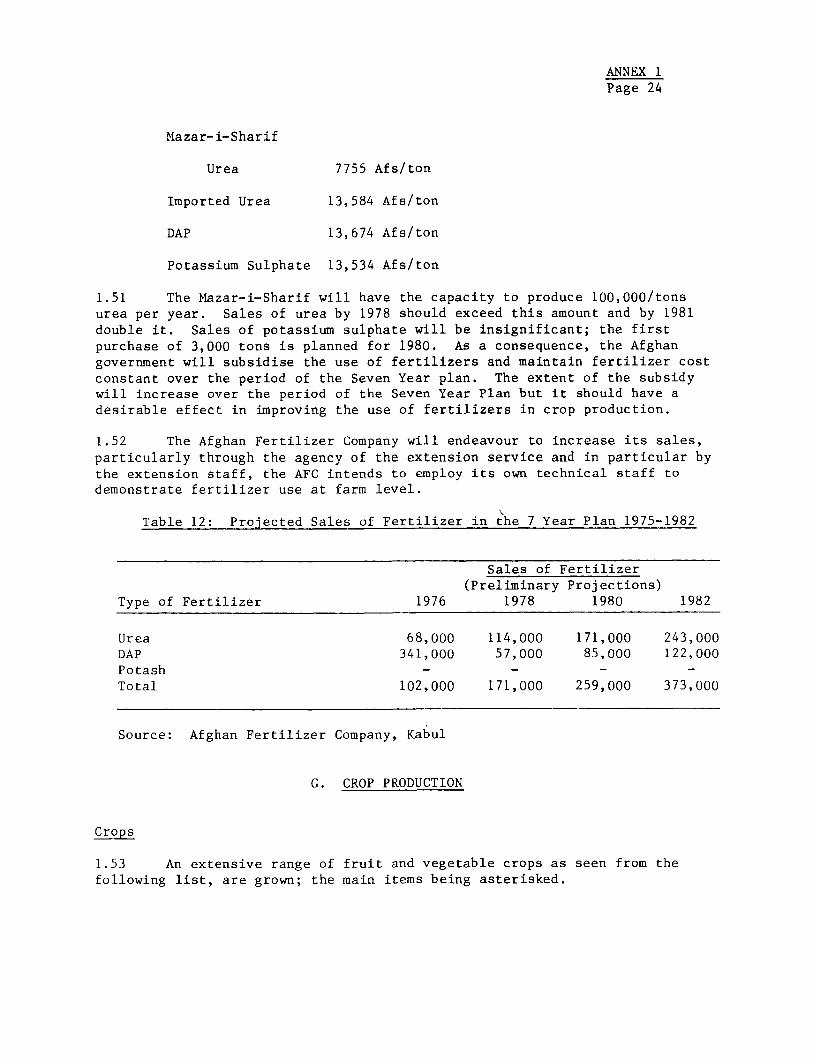
1.50 Sales of fertilizer are expected to increase from 60,000 tons in1975 to 373,000 tons at the end of the seven year plan in 1982 (Table 12).This will amount to the equivalent of approximately 60 kg (N,P205 and K20)ha. The cost of fertilizer has been established by the Supreme Council asfollows:
Urea - 9,600 Afs/ton
Diammonium phosphate - 11,000 Afs/tonPotassium sulphate - 11,000 Afs/ton
and these prices will not be changed during the period of the seven year plan.Purchase costs of these fertilizers at present are:
ANNEX IPage 24
Mazar-i-Sharif
Urea 7755 Afs/ton
Imported Urea 13,584 Afs/ton
DAP 13,674 Afs/ton
Potassium Sulphate 13,534 Afs/ton
1.51 The Mazar-i-Sharif will have the capacity to produce 100,000/tonsurea per year. Sales of urea by 1978 should exceed this amount and by 1981double it. Sales of potassium sulphate will be insignificant; the firstpurchase of 3,000 tons is planned for 1980. As a consequence, the Afghangovernment will subsidise the use of fertilizers and maintain fertilizer costconstant over the period of the Seven Year plan. The extent of the subsidywill increase over the period of the Seven Year Plan but it should have adesirable effect in improving the use of fertilizers in crop production.
1.52 The Afghan Fertilizer Company will endeavour to increase its sales,particularly through the agency of the extension service and in particular bythe extension staff, the AFC intends to employ its own technical staff todemonstrate fertilizer use at farm level.
Table 12: Projected Sales of Fertilizer in the 7 Year Plan 1975-1982
Sales of Fertilizer(Preliminary Projections)
Type of Fertilizer 1976 1978 1980 1982
Urea 68,000 114,000 171,000 243,000DAP 341,000 57,000 85,000 122,000Potash - _ _Total 102,000 171,000 259,000 373,000
Source: Afghan Fertilizer Company, Kabul
G. CROP PRODUCTION
Crops
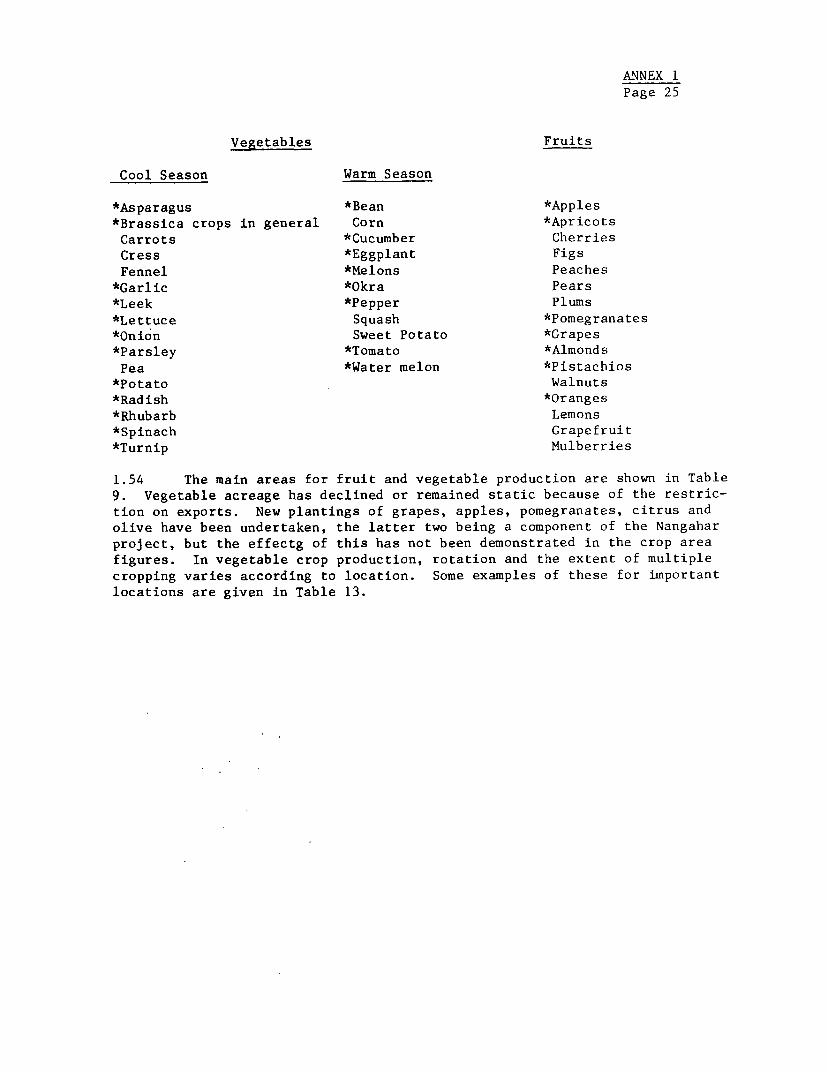
1.53 An extensive range of fruit and vegetable crops as seen from thefollowing list, are grown; the main items being asterisked.
ANNEX 1Page 25
Vegetables Fruits
Cool Season Warm Season
*Asparagus *Bean *Apples*Brassica crops in general Corn *ApricotsCarrots *Cucumber CherriesCress *Eggplant FigsFennel *Melons Peaches
*Garlic *Okra Pears*Leek *Pepper Plums*Lettuce Squash *Pomegranates*Onion Sweet Potato *Grapes*Parsley *Tomato *AlmondsPea *Water melon *Pistachios
*Potato Walnuts*Radish *Oranges*Rhubarb Lemons*Spinach Grapefruit*Turnip Mulberries
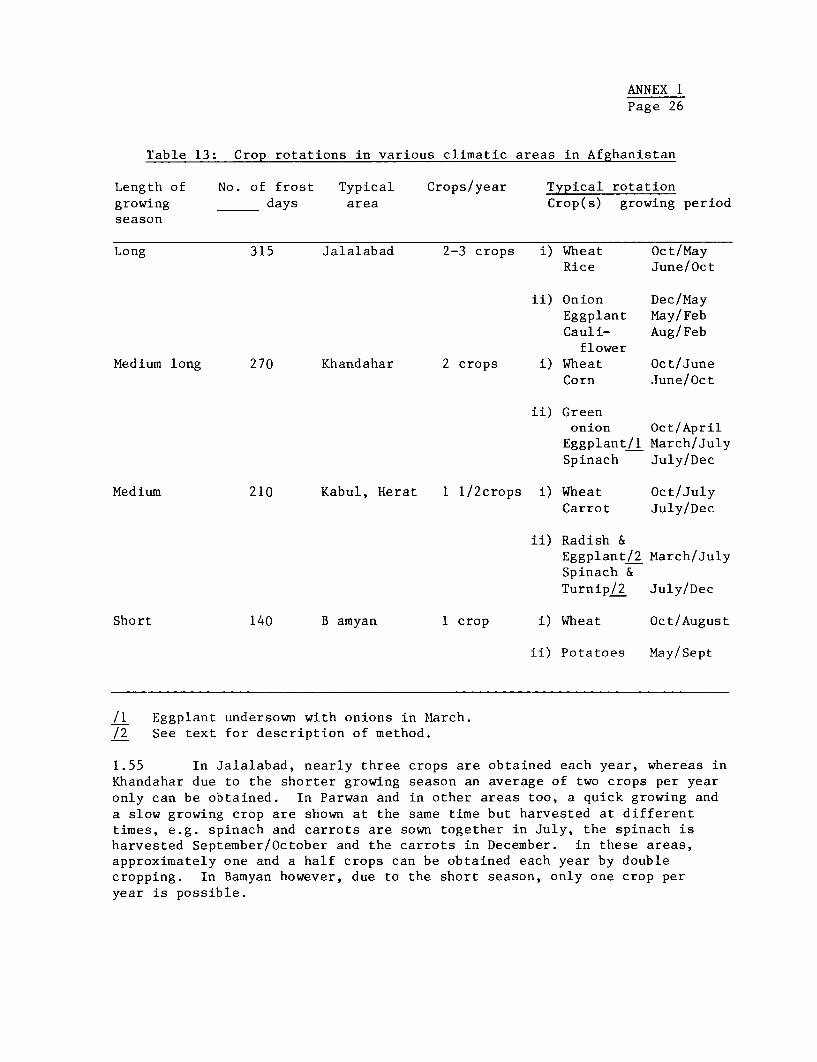
1.54 The main areas for fruit and vegetable production are shown in Table9. Vegetable acreage has declined or remained static because of the restric-tion on exports. New plantings of grapes, apples, pomegranates, citrus andolive have been undertaken, the latter two being a component of the Nangaharproject, but the effectg of this has not been demonstrated in the crop areafigures. In vegetable crop production, rotation and the extent of multiplecropping varies according to location. Some examples of these for importantlocations are given in Table 13.
ANNEX IPage 26
Table 13: Crop rotations in various climatic areas in Afghanistan
Length of No. of frost Typical Crops/year Typical rotationgrowing days area Crop(s) growing periodseason
Long 315 Jalalabad 2-3 crops i) Wheat Oct/MayRice June/Oct
ii) Onion Dec/MayEggplant May/FebCauli- Aug/Feb
flowerMedium long 270 Khandahar 2 crops i) Wheat Oct/June
Corn June/Oct
ii) Greenonion Oct/April
Eggplant/i March/JulySpinach July/Dec
Medium 210 Kabul, Herat 1 1/2crops i) Wheat Oct/JulyCarrot July/Dec
ii) Radish &Eggplant/2 March/JulySpinach &Turnip/2 July/Dec
Short 140 B amyan 1 crop i) Wheat Oct/August
ii) Potatoes May/Sept
/1 Eggplant undersown with onions in March./2 See text for description of method.
1.55 In Jalalabad, nearly three crops are obtained each year, whereas inKhandahar due to the shorter growing season an average of two crops per yearonly can be obtained. In Parwan and in other areas too, a quick growing anda slow growing crop are shown at the same time but harvested at differenttimes, e.g. spinach and carrots are sown together in July, the spinach isharvested September/October and the carrots in December. in these areas,approximately one and a half crops can be obtained each year by doublecropping. In Bamyan however, due to the short season, only one crop peryear is possible.
ANNEX IPage 27
1.56 In fruit and nut production timing of production depends on localityand variety. For instance, in grape production, the first grapes are availablein June in Kandahar from Khalchini and Rancha varieties, while the varietyKatta of Kohdaman matures in late October. Thus fresh grapes are available inmajor markets from June to November.
Vegetables
1.57 Potatoes are one of the main vegetables produced in Afghanistan,being produced over an area of 14,000 ha. Yields, at 6 - 10 tons/acre, arequite low. The main cultivars used are two local selections, Garma and Sarda.Sarda is small with good flavor. Garma, the most widely grown variety, is ahigher yielder and has better storage qualities. New Indian introductions,Chandermochi and Kafarilooker, have better characteristics such as yield,quality and storage, and are being more widely grown.
1.58 Farmyard manure is used at 8 - 10 tons/jerib. Fertilizer is beingused to a limited extent at low rates, namely 22 kg DAP and 14 kg urea perjerib. Potassium fertilizers are not available in Afghanistan. However,potatoes have a high potassium requirement and on high pH Afghan soils, zincdeficiency could be a problem. Cultivation and weed control is mostly doneby hand. Insecticides or fungicides are seldom used; sprout-inhibitingchemicals are not used on ware crop potatoes prior to storing in I m. widesoil made pits. Storage losses can amount to 30% - 50%.
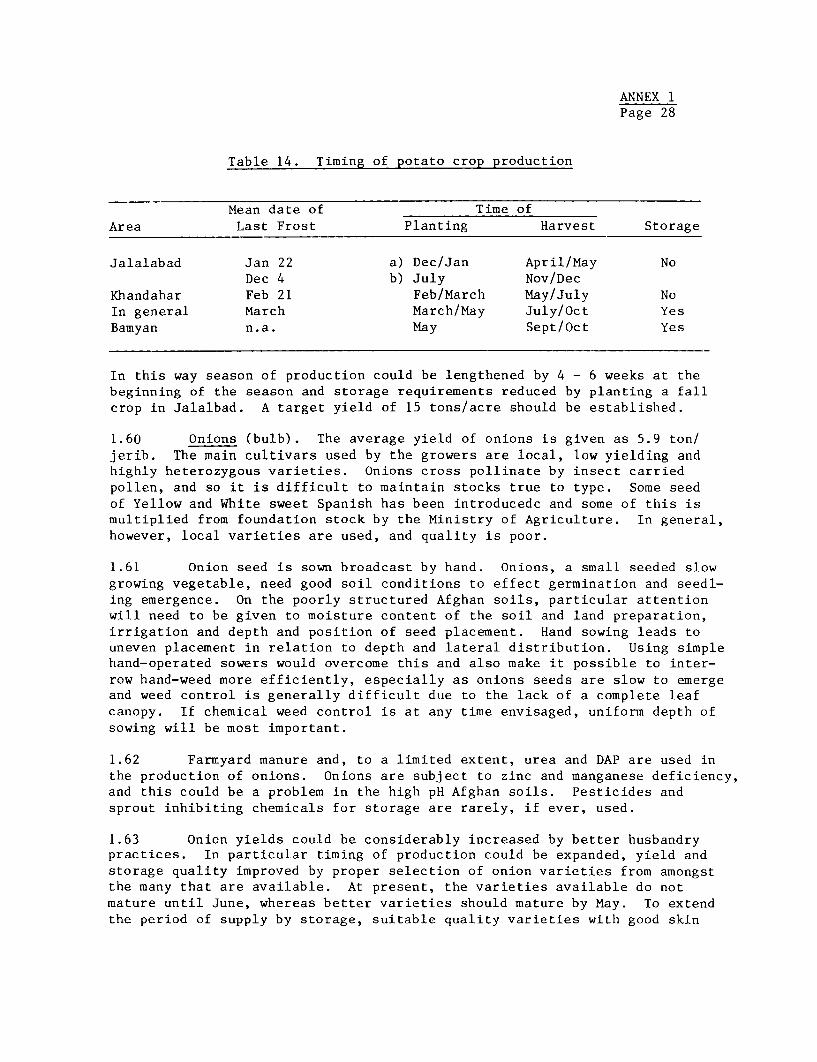
1.59 Yields could be considerably improved but one of the main obstaclesis the lack of certified (disease-free) seed. Growers use their own produceas a source of seed and as a result contribute to spread of diseases, parti-cularly virus disease. Consequently, vigor and yield potential are seriouslyreduced. The use of clean seed, fertilizers and better weed control, etc.,could lead to higher yields. Varieties could also be selected to improvethe timing of production; better storage conditions could effect a significantreduction in storage losses. Season of production could be extended consider-ably by planting potatoes earlier and later in Jalalabad. Frost risks shouldbe minimal. At present, early production is not obtained primarily due to theuse of unsuitable varieties. Winter supply could be improved by using goodstorage varieties for main crop production and supplementing this with alate Summer planted crop in Jalalabad. Timing of production for potatoescould follow that outlined in Table 14.
ANNEX 1Page 28
Table 14. Timing of potato crop production
Mean date of Time ofArea Last Frost Planting Harvest Storage
Jalalabad Jan 22 a) Dec/Jan April/May NoDec 4 b) July Nov/Dec
Khandahar Feb 21 Feb/March May/July NoIn general March March/May July/Oct YesBamyan n.a. May Sept/Oct Yes
In this way season of production could be lengthened by 4 - 6 weeks at thebeginning of the season and storage requirements reduced by planting a fallcrop in Jalalbad. A target yield of 15 tons/acre should be established.
1.60 Onions (bulb). The average yield of onions is given as 5.9 ton/jerib. The main cultivars used by the growers are local, low yielding andhighly heterozygous varieties. Onions cross pollinate by insect carriedpollen, and so it is difficult to maintain stocks true to type. Some seedof Yellow and White sweet Spanish has been introducedc and some of this ismultiplied from foundation stock by the Ministry of Agriculture. In general,however, local varieties are used, and quality is poor.
1.61 Onion seed is sown broadcast by hand. Onions, a small seeded slowgrowing vegetable, need good soil conditions to effect germination and seedl-ing emergence. On the poorly structured Afghan soils, particular attentionwill need to be given to moisture content of the soil and land preparation,irrigation and depth and position of seed placement. Hand sowing leads touneven placement in relation to depth and lateral distribution. Using simplehand-operated sowers would overcome this and also make it possible to inter-row hand-weed more efficiently, especially as onions seeds are slow to emergeand weed control is generally difficult due to the lack of a complete leafcanopy. If chemical weed control is at any time envisaged, uniform depth ofsowing will be most important.
1.62 Farmyard manure and, to a limited extent, urea and DAP are used inthe production of onions. Onions are subject to zinc and manganese deficiency,and this could be a problem in the high pH Afghan soils. Pesticides andsprout inhibiting chemicals for storage are rarely, if ever, used.
1.63 Onion yields could be considerably increased by better husbandrypractices. In particular timing of production could be expanded, yield andstorage quality improved by proper selection of onion varieties from amongstthe many that are available. At present, the varieties available do notmature until June, whereas better varieties should mature by May. To extendthe period of supply by storage, suitable quality varieties with good skin
ANNEX 1Page 29
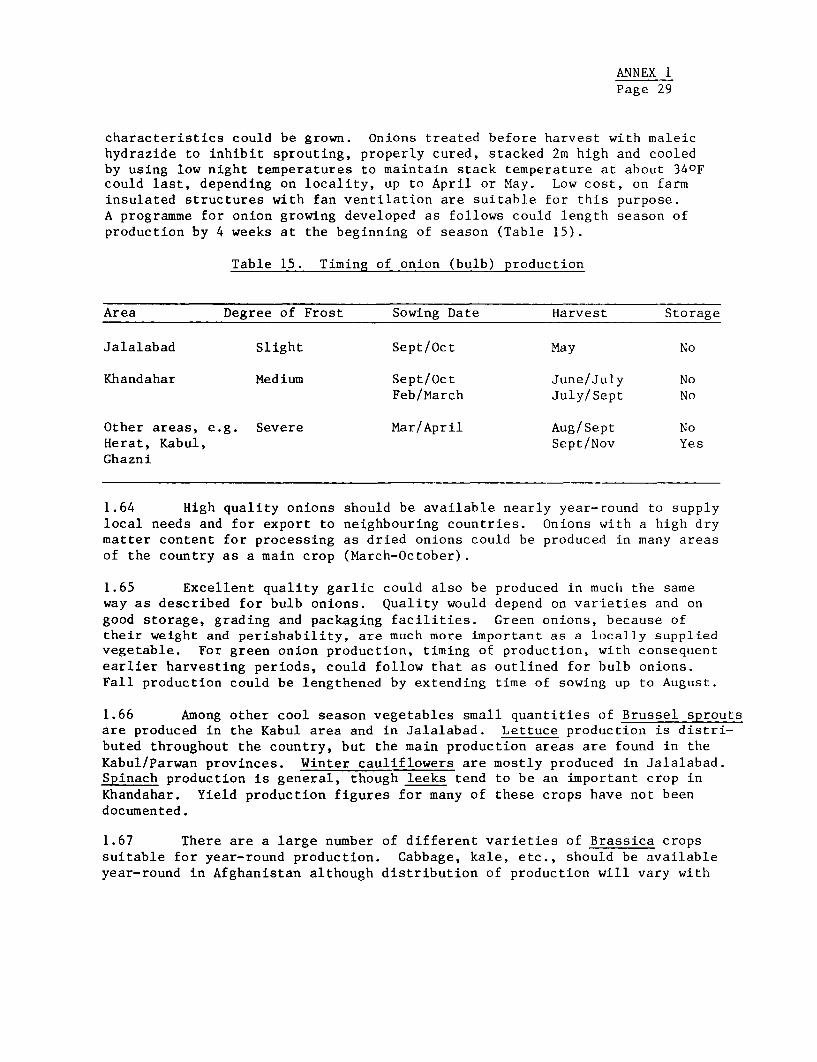
characteristics could be grown. Onions treated before harvest with maleichydrazide to inhibit sprouting, properly cured, stacked 2m high and cooledby using low night temperatures to maintain stack temperature at about 34°Fcould last, depending on locality, up to April or May. Low cost, on farminsulated structures with fan ventilation are suitable for this purpose.A programme for onion growing developed as follows could length season ofproduction by 4 weeks at the beginning of season (Table 15).
Table 15. Timing of onion (bulb) production
Area Degree of Frost Sowing Date Harvest Storage
Jalalabad Slight Sept/Oct May No
Khandahar Medium Sept/Oct June/July NoFeb/March July/Sept No
Other areas, e.g. Severe Mar/April Aug/Sept NoHerat, Kabul, Sept/Nov YesGhazni
1.64 High quality onions should be available nearly year-round to supplylocal needs and for export to neighbouring countries. Onions with a high drymatter content for processing as dried onions could be produced in many areasof the country as a main crop (March-October).
1.65 Excellent quality garlic could also be produced in much the sameway as described for bulb onions. Quality would depend on varieties and ongood storage, grading and packaging facilities. Green onions, because oftheir weight and perishability, are much more important as a locally suppliedvegetable. For green onion production, timing of production, with consequentearlier harvesting periods, could follow that as outlined for bulb onions.Fall production could be lengthened by extending time of sowing up to August.
1.66 Among other cool season vegetables small quantities of Brussel sproutsare produced in the Kabul area and in Jalalabad. Lettuce production is distri-buted throughout the country, but the main production areas are found in theKabul/Parwan provinces. Winter cauliflowers are mostly produced in Jalalabad.Spinach production is general, though leeks tend to be an important crop inKhandahar. Yield production figures for many of these crops have not beendocumented.
1.67 There are a large number of different varieties of Brassica cropssuitable for year-round production. Cabbage, kale, etc., should be availableyear-round in Afghanistan although distribution of production will vary with
ANNEX 1Page 30
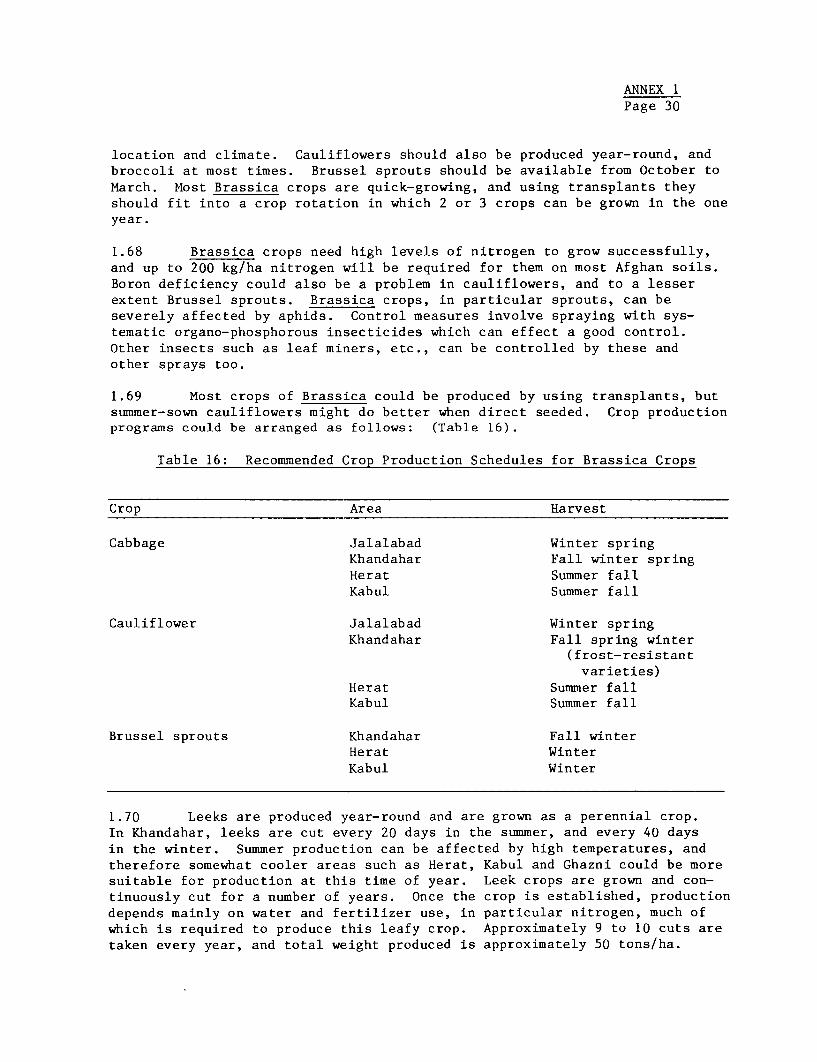
location and climate. Cauliflowers should also be produced year-round, andbroccoli at most times. Brussel sprouts should be available from October toMarch. Most Brassica crops are quick-growing, and using transplants theyshould fit into a crop rotation in which 2 or 3 crops can be grown in the oneyear.
1.68 Brassica crops need high levels of nitrogen to grow successfully,and up to 200 kg/ha nitrogen will be required for them on most Afghan soils.Boron deficiency could also be a problem in cauliflowers, and to a lesserextent Brussel sprouts. Brassica crops, in particular sprouts, can beseverely affected by aphids. Control measures involve spraying with sys-tematic organo-phosphorous insecticides which can effect a good control.Other insects such as leaf miners, etc., can be controlled by these andother sprays too.
1.69 Most crops of Brassica could be produced by using transplants, butsummer-sown cauliflowers might do better when direct seeded. Crop productionprograms could be arranged as follows: (Table 16).
Table 16: Recommended Crop Production Schedules for Brassica Crops
Crop Area Harvest
Cabbage Jalalabad Winter springKhandahar Fall winter springHerat Summer fallKabul Summer fall
Cauliflower Jalalabad Winter springKhandahar Fall spring winter
(frost-resistantvarieties)
Herat Summer fallKabul Summer fall
Brussel sprouts Khandahar Fall winterHerat WinterKabul Winter
1.70 Leeks are produced year-round and are grown as a perennial crop.In Khandahar, leeks are cut every 20 days in the summer, and every 40 daysin the winter. Summer production can be affected by high temperatures, andtherefore somewhat cooler areas such as Herat, Kabul and Ghazni could be moresuitable for production at this time of year. Leek crops are grown and con-tinuously cut for a number of years. Once the crop is established, productiondepends mainly on water and fertilizer use, in particular nitrogen, much ofwhich is required to produce this leafy crop. Approximately 9 to 10 cuts aretaken every year, and total weight produced is approximately 50 tons/ha.
ANNEX IPage 31
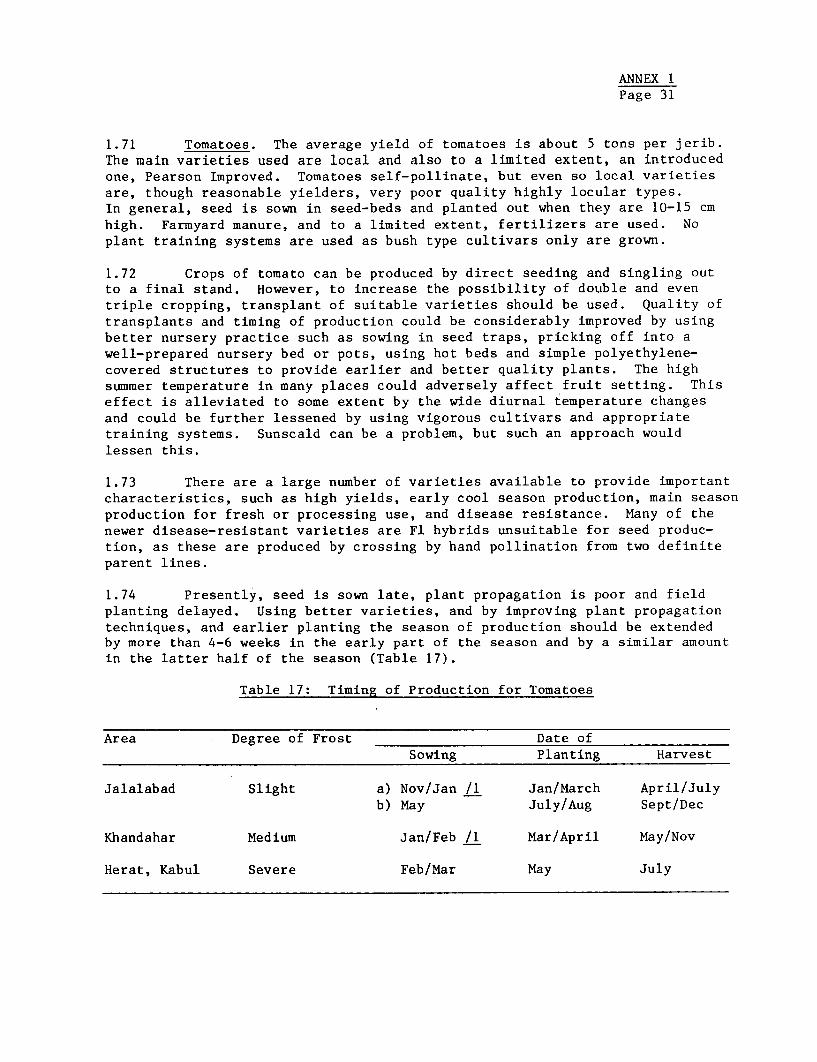
1.71 Tomatoes. The average yield of tomatoes is about 5 tons per jerib.The main varieties used are local and also to a limited extent, an introducedone, Pearson Improved. Tomatoes self-pollinate, but even so local varietiesare, though reasonable yielders, very poor quality highly locular types.In general, seed is sown in seed-beds and planted out when they are 10-15 cmhigh. Farmyard manure, and to a limited extent, fertilizers are used. Noplant training systems are used as bush type cultivars only are grown.
1.72 Crops of tomato can be produced by direct seeding and singling outto a final stand. However, to increase the possibility of double and eventriple cropping, transplant of suitable varieties should be used. Quality oftransplants and timing of production could be considerably improved by usingbetter nursery practice such as sowing in seed traps, pricking off into awell-prepared nursery bed or pots, using hot beds and simple polyethylene-covered structures to provide earlier and better quality plants. The highsummer temperature in many places could adversely affect fruit setting. Thiseffect is alleviated to some extent by the wide diurnal temperature changesand could be further lessened by using vigorous cultivars and appropriatetraining systems. Sunscald can be a problem, but such an approach wouldlessen this.
1.73 There are a large number of varieties available to provide importantcharacteristics, such as high yields, early cool season production, main seasonproduction for fresh or processing use, and disease resistance. Many of thenewer disease-resistant varieties are Fl hybrids unsuitable for seed produc-tion, as these are produced by crossing by hand pollination from two definiteparent lines.
1.74 Presently, seed is sown late, plant propagation is poor and fieldplanting delayed. Using better varieties, and by improving plant propagationtechniques, and earlier planting the season of production should be extendedby more than 4-6 weeks in the early part of the season and by a similar amountin the latter half of the season (Table 17).
Table 17: Timing of Production for Tomatoes
Area Degree of Frost Date of
Sowing Planting Harvest
Jalalabad Slight a) Nov/Jan /1 Jan/March April/Julyb) May July/Aug Sept/Dec
Khandahar Medium Jan/Feb /1 Mar/April May/Nov
Herat, Kabul Severe Feb/Mar May July
ANNEX IPage 32
1.75 Prior to planting, soils should be properly prepared and much higherrates of fertilizer should be used. Potassium fertilizer use on tomatoesshould be high in order to maintain yield, but more particularly, as thequality of the fruit produced depends on high levels of potassium in thesoil. Training systems, pole or wire trellis, together with plant tying,training, deleafing, picking, etc., are largely labor intensive (Table 11),a fact which makes this method of crop production attractive in Afghanistan.Using this production system, yields of 20 tons per acre should be obtained,and even higher yields expected.
1.76 Other warm season vegetables. The other main warm season vegetablesproduced include cucumber, eggplant and melons, and to a limited extent,peppers. In cucumber, eggplant and muskmelon production, mostly local varie-ties are used. Some introduced varieties are used in pepper and watermelonproduction. All of these are insect pollinated and consequently seed stocksare probably highly heterozygous. Cucumber, especially early season ones,are produced in Jalalabad. Melons are one of the main crops in the Heratarea. They are also extensively produced in the Northern regions. Eggplantis widely produced in all regions and is one of the most important vegetablesgrown in Afghanistan.
1.77 These crops are mostly produced from seed and singled out to thedesired plant density. In some instances, eggplant seeds are sown in a covercrop such as early spring green onions, in which cases subsequent plant standmay be extremely unsatisfactory. Where a number of seeds are sown per posi-tion, they can be singled out to one or two plants as required with resultantgood plant density. The general cultural practices for these crops followthose outlined for tomatoes. Land preparation is poor, varieties need properevaluation and fertilizer use is quite low. Crop protection techniques arerarely used.
1.78 Yields could be increased by both soil preparation and increasedfertilizer use, plant protection and the use of improved varieties. Timingof production could be improved by raising a proportion of the crop in thenursery area, protecting it from frost and planting out as soon as dangerof frost has been mostly eliminated. Season of production could be extendedby better plant care. In pepper and eggplant production sun scold could bereduced by growing a good vigorous variety that would provide a good leafcover for the developing fruit. Improved cropping patterns for cucumbers,eggplant and peppers could be developed as follows: (Table 18).
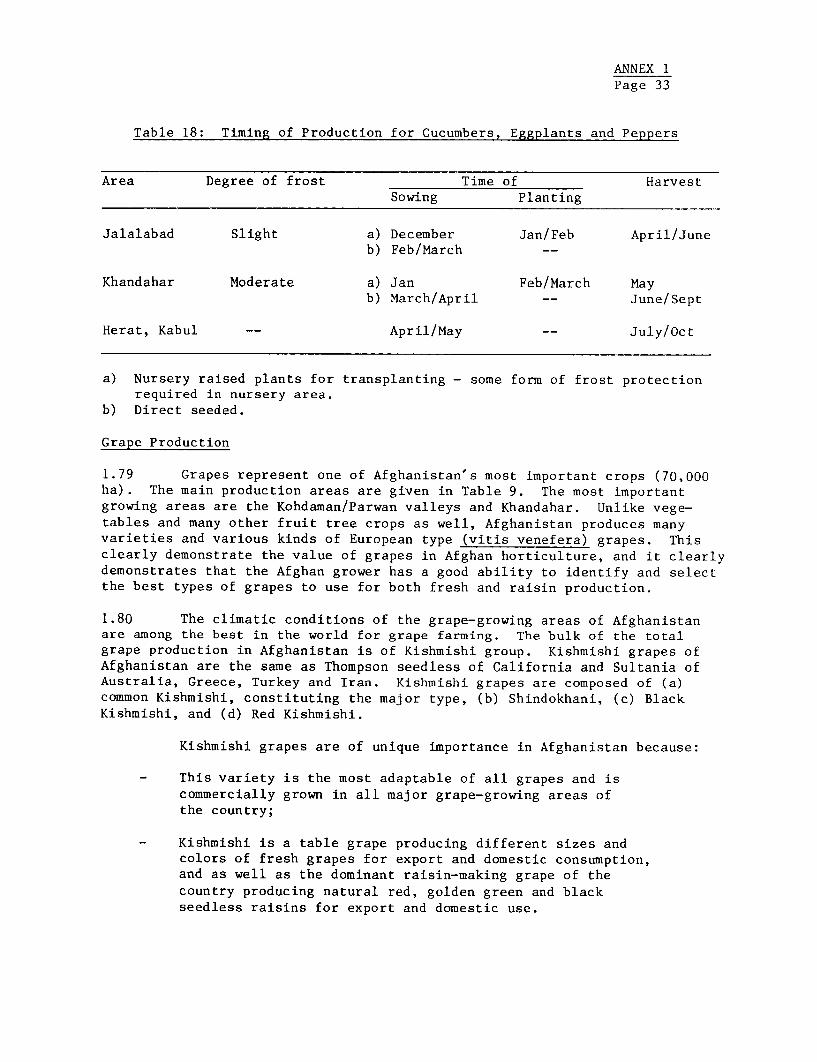
ANNEX 1Page 33
Table 18: Timing of Production for Cucumbers, Eggplants and Peppers
Area Degree of frost Time of HarvestSowing Planting
Jalalabad Slight a) December Jan/Feb April/Juneb) Feb/March --
Khandahar Moderate a) Jan Feb/March Mayb) March/April -- June/Sept
Herat, Kabul -- April/May -- July/Oct
a) Nursery raised plants for transplanting - some form of frost protectionrequired in nursery area.
b) Direct seeded.
Grape Production
1.79 Grapes represent one of Afghanistan's most important crops (70,000ha). The main production areas are given in Table 9. The most importantgrowing areas are the Kohdaman/Parwan valleys and Khandahar. Unlike vege-tables and many other fruit tree crops as well, Afghanistan produces manyvarieties and various kinds of European type (vitis venefera) grapes. Thisclearly demonstrate the value of grapes in Afghan horticulture, and it clearlydemonstrates that the Afghan grower has a good ability to identify and selectthe best types of grapes to use for both fresh and raisin production.
1.80 The climatic conditions of the grape-growing areas of Afghanistanare among the best in the world for grape farming. The bulk of the totalgrape production in Afghanistan is of Kishmishi group. Kishmishi grapes ofAfghanistan are the same as Thompson seedless of California and Sultania ofAustralia, Greece, Turkey and Iran. Kishmishi grapes are composed of (a)common Kishmishi, constituting the major type, (b) Shindokhani, (c) BlackKishmishi, and (d) Red Kishmishi.
Kishmishi grapes are of unique importance in Afghanistan because:
- This variety is the most adaptable of all grapes and iscommercially grown in all major grape-growing areas ofthe country;
- Kishmishi is a table grape producing different sizes andcolors of fresh grapes for export and domestic consumption,and as well as the dominant raisin-making grape of thecountry producing natural red, golden green and blackseedless raisins for export and domestic use.
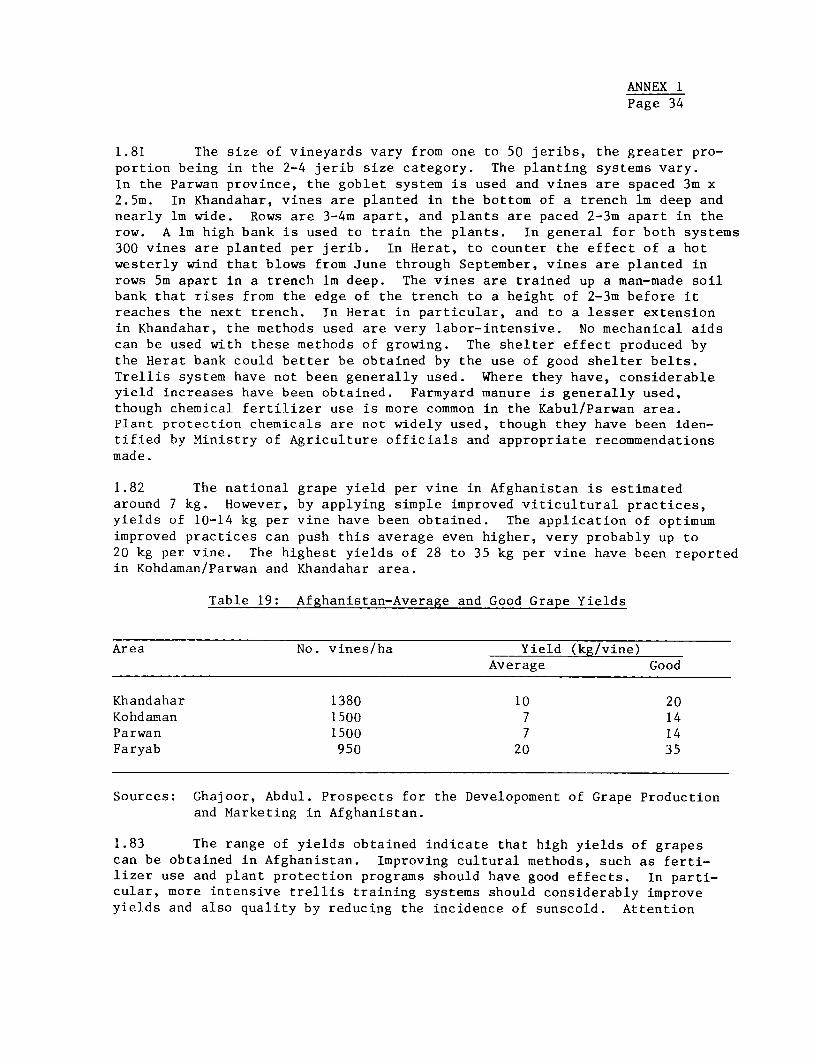
ANNEX 1Page 34
1.81 The size of vineyards vary from one to 50 jeribs, the greater pro-portion being in the 2-4 jerib size category. The planting systems vary.In the Parwan province, the goblet system is used and vines are spaced 3m x2.5m. In Khandahar, vines are planted in the bottom of a trench lm deep andnearly lm wide. Rows are 3-4m apart, and plants are paced 2-3m apart in therow. A lm high bank is used to train the plants. In general for both systems300 vines are planted per jerib. In Herat, to counter the effect of a hotwesterly wind that blows from June through September, vines are planted inrows 5m apart in a trench Im deep. The vines are trained up a man-made soilbank that rises from the edge of the trench to a height of 2-3m before itreaches the next trench. In Herat in particular, and to a lesser extensionin Khandahar, the methods used are very labor-intensive. No mechanical aidscan be used with these methods of growing. The shelter effect produced bythe Herat bank could better be obtained by the use of good shelter belts.Trellis system have not been generally used. Where they have, considerableyield increases have been obtained. Farmyard manure is generally used,though chemical fertilizer use is more common in the Kabul/Parwan area.Plant protection chemicals are not widely used, though they have been iden-tified by Ministry of Agriculture officials and appropriate recommendationsmade.
1.82 The national grape yield per vine in Afghanistan is estimatedaround 7 kg. However, by applying simple improved viticultural practices,yields of 10-14 kg per vine have been obtained. The application of optimumimproved practices can push this average even higher, very probably up to20 kg per vine. The highest yields of 28 to 35 kg per vine have been reportedin Kohdaman/Parwan and Khandahar area.
Table 19: Afghanistan-Average and Good Grape Yields
Area No. vines/ha Yield (kg/vine)Average Good
Khandahar 1380 10 20Kohdaman 1500 7 14Parwan 1500 7 14Faryab 950 20 35
Sources: Ghajoor, Abdul. Prospects for the Developoment of Grape Productionand Marketing in Afghanistan.
1.83 The range of yields obtained indicate that high yields of grapescan be obtained in Afghanistan. Improving cultural methods, such as ferti-lizer use and plant protection programs should have good effects. In parti-cular, more intensive trellis training systems should considerably improveyields and also quality by reducing the incidence of sunscold. Attention
ANNEX 1Page 35
should be given to developing the proportion of grapes sold fresh as thismethod of production is highly labor intensive and gives Afghan growers adistinct advantage in view of the low labor costs there.
1.84 Pomegranates. Pomegranates are a commercially important fruitand the production area increases annually. The main production areas areTagau in Kapisa (Parwan), Kandahar and Nangarhar. Pomegranates are alsoproduced in Samangan and Balkh.
1.85 Pomegranates need warm dry summers and cool winters with wintertemperatures not less tha -9.50C. In some years, pomegrantes in Tagau andNangarhar are damaged by winter frost. Spring frosts can sometimes affectflower development and fruit set. Pomegranates are propagated by cuttings.The spacing system varies from 3m x 3m to 7m x 7m. The cuttings are sometimesrooted in a nursery but are usually direct planted; 2 or 3 cuttings being putinto each planting hole. Wide spacing is required to give large trees withgood light extinction in order to protect fruit from sunscold. However, withthese wide spacing, it means that, as it takes 8-10 years to reach full produc-tion yields, income is very low during the years the orchard is being estab-lished. But, as stock material is cheap, higher than required initial plantdensities could substantially increase production in the early years of anorchard's development. Optimum plant density could be attained by thinningout as required. Trees begin to bear fruit after 3-4 years. Maximum produc-tion is obtained after 8-10 years and an orchard lasts for 30-50 years.Yields vary for 5-10 tons/acre. Culls due to cracking of fruit, can beserious and amount to 25% of production. Cull fruit sells at 50% of firstquality fruit. The cracking problem is most serious in Kandahar and may beassociated with a variety defect. The Bedana variety grown mostly in Tagauis less liable to crack and is a sweet, juicy, soft seeded high qualityvariety. The Bedana variety is presently produced in Kapisa and Nangarharbut in view of its fruit quality, plantings of it should be made in Khandaharand other pomegranates areas as well.
1.87 Farmyard manure and fertilizers are used alternate years. Cropprotection systems are sometimes used but aphids can be a serious problem.Iron deficiency was endemic in many of the orchards visited yet no controlmeasures to correct iron deficiency had been used.
1.88 Better use of cropped area could be attained by producing plantsfrom cuttings in a nursery area and as stated by using a higher than requiredinitial plant density to increase early production. This problem is presentlyattacked by intercropping vegetables, alfalfa, and wheat with the pomegranates.The variety Bedana should be used in Khandahar and other areas too. Cropprotection programmes should be enocuraged and the use of iron chelate tocorrect chlorosis demonstrated to growers by the extension service. Ferti-lizer use should also be increased to ensure maximum protection.
ANNEX IPage 36
H. CROP YIELDS AND FINANCIAL RETURNS
Crop Yields and Returns
1.89 Details of crop yields are given in Table 20. They were obtainedduring the Fruit and Vegetables Survey Mission from discussion with farmers,extension agents, Ministry of Agriculture officials and AgBank staff. AverageCalifornia yields are included for comparison. The yields of wheat and sugarbeet at 0.7 and 11.6 tons/acres respectively are extremely low and reflect thelow level of production technology used, i.e. little or no fertilizer, poorseed and poor crop husbandry. The yield estimates for wheat and sugar beetbased on a large wheat area and on a contracted sugar beet crop are accurateyield estimates. As against this, the yield returns for horticultural crop,are relatively higher especially when they are compared to crop yields obtainedin generally similar climatic areas. As an example, Afghan yields of somevegetables are higher than those obtained in Egypt, Spain and Israel (Table21). As mentioned the yield figures were obtained from interviews with localgrowers who it appears were among the better producers and from estimates ofthe Extension Agents and Ministry of Agriculture. There appeared to be atendency to exaggerate and give high "average" yield figures. Thus theseAfghan yield figures are high and should be interpreted accordingly. Theyare, however, much lower than the yields obtained in California.
1.90 High horticultural crop yields are a very practical possibility inAfghanistan. The climate is suitable, the labor plentiful with a consider-able amount of experience in horticultural crop production and this, togetherwith good husbandry, can produce high crop yields. As an example, it hasbeen shown that grape yields can be considerably increased.
1.91 Farmgate prices in Afs/kg are also given in Table 20 together withexpected gross return per jerib. It is evident that income for horticulturalcrops is significantly greater than that obtained from wheat and sugar beet.In most areas, two or three vegetables crops can be produced in one year givinga gross return of 20,000 to 30,000 Afs/jerib. Farmgate prices are estimatedbased upon a number of values and range of values obtained in different partsof the country. For instance, early cucumbers in Jalalabad made 2 Afs each inearly part of the season as against 0.2 Afs per cucumber at full production.Onions may vary in price from 1.5 to 6 Afgs/kg. Tomatoes vary in price from2.4 to 27.0 Afs/kg on the Kabul retail market. Farmgate prices (Table 20) aremostly indicative of high production relatively.
1.92 The great range in prices for produce also indicate the potentialthat exists for allowing time of production to increase production in thesehigh price periods.
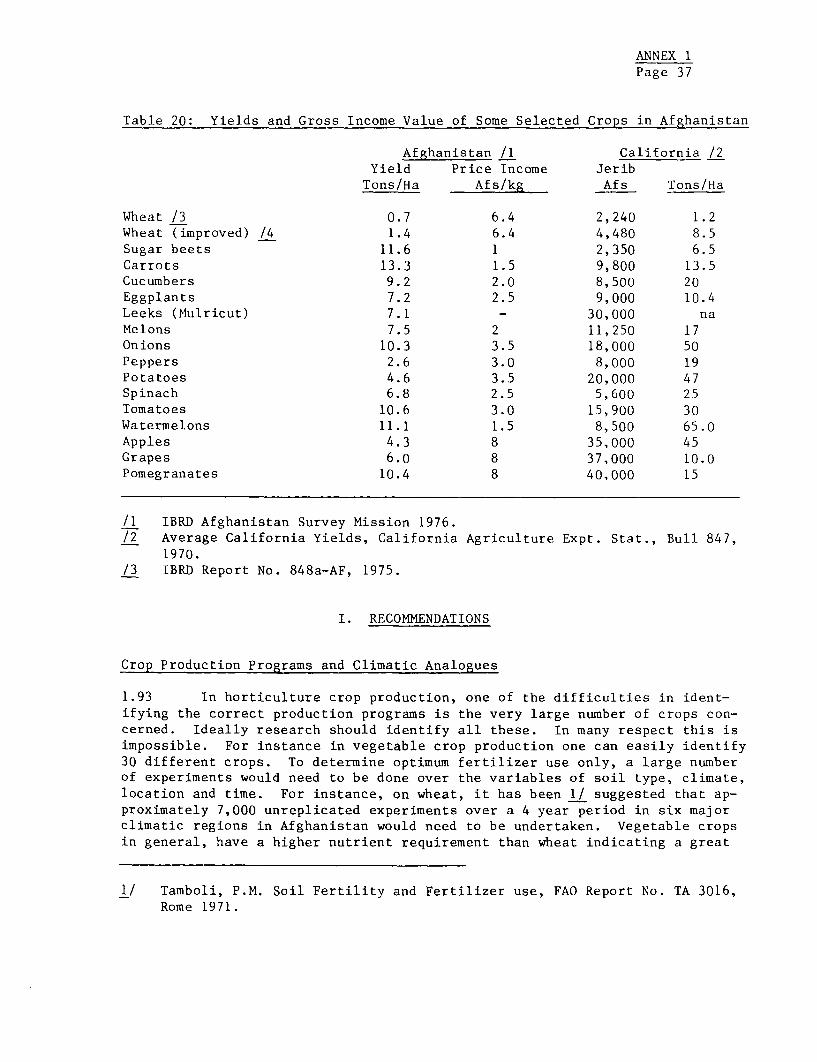
ANNEX 1Page 37
Table 20: Yields and Gross Income Value of Some Selected Crops in Afghanistan
Afghanistan /1 California /2Yield Price Income JeribTons/Ha Afs/kg Afs Tons/Ha
W4heat /3 0.7 6.4 2,240 1.2Wheat (improved) /4 1.4 6.4 4,480 8.5Sugar beets 11.6 1 2,350 6.5Carrots 13.3 1.5 9,800 13.5Cucumbers 9.2 2.0 8,500 20Eggplants 7.2 2.5 9,000 10.4Leeks (Mulricut) 7.1 - 30,000 naMelons 7.5 2 11,250 17Onions 10.3 3.5 18,000 50Peppers 2.6 3.0 8,000 19Potatoes 4.6 3.5 20,000 47Spinach 6.8 2.5 5,600 25Tomatoes 10.6 3.0 15,900 30Watermelons 11.1 1.5 8,500 65.0Apples 4.3 8 35,000 45Grapes 6.0 8 37,000 10.0Pomegranates 10.4 8 40,000 15
/1 IBRD Afghanistan Survey Mission 1976./2 Average California Yields, California Agriculture Expt. Stat., Bull 847,
1970./3 IBRD Report No. 848a-AF, 1975.
I. RECOMMENDATIONS
Crop Production Programs and Climatic Analogues
1.93 In horticulture crop production, one of the difficulties in ident-ifying the correct production programs is the very large number of crops con-cerned. Ideally research should identify all these. In many respect this isimpossible. For instance in vegetable crop production one can easily identify30 different crops. To determine optimum fertilizer use only, a large numberof experiments would need to be done over the variables of soil type, climate,location and time. For instance, on wheat, it has been 1/ suggested that ap-proximately 7,000 unreplicated experiments over a 4 year period in six majorclimatic regions in Afghanistan would need to be undertaken. Vegetable cropsin general, have a higher nutrient requirement than wheat indicating a great
1/ Tamboli, P.M. Soil Fertility and Fertilizer use, FAO Report No. TA 3016,Rome 1971.
ANNEX 1Page 38
need for a high degree of precision in determining their fertilizer require-ments. If grapes, tree fruits and nuts are considered, the problem becomes
even larger. Under these circumstances, therefore, a considerable amount ofextrapolation needs to be done to arrive at fertilizer recommendations suit-
able for a range of vegetable crops.
1.94 Fertilizer use only refers to one aspect of crop husbandry. Inform-ation is also required on suitable varieties, time of planting schedules, etc.Research has only started in Afghanistan and as this information is not avail-able there, it must be sought elsewhere. This can be done on the basis ofclimatic analogues.
1.95 Areas of similar climatic conditions can be identified and theresearch and general husbandry information obtained there can be applied toAfghanistan. For instance the National Research Council of Israel commissioneda study of the irrigated regions in the deserts of California and Arizonawhich are climatic analogues of the Negev 1/ before undertaking work there.These same areas have a climate very similar to that in Afghanistan. Aconsiderable amount of research has been done in California and Arizona andhigh crop yields obtained from the crop production practices that have beensuggested as a result of this work. Information can also be obtained forsimilar climatic specific crop production systems. Crop production programscovering only fairly specific recommendations on major aspects of crop hus-
bandry should be developed. For instance:
Varieties. A short list of suitable varieties for each cropmust be established. In terms of fruit and nuts varieties,the most suitable type of root-stock must also be indicated.
Fertilizer. Fertilizer recommendations for each crop must bemade, including provision for application of minor elementsas a soil or as a foliar treatment.
Plant Propagation - Timing of Production. Simple method of plantpropagation, together with recommendation of systems of plantprotection from frost, etc., must be made. The time of sowing(with suitable variety) and planting as well as expected timeof harvest must be indicated within each climatic zone.
1.96 It is recommended, therefore, that an international horticulturalexpert, with provision for consultative support, and an Afghan counterpartbe appointed for a 6-12 month term to:.
1/ Nuttenson, N.Y., 1962. American Institute Crop. Ecol., Washington, D.C.
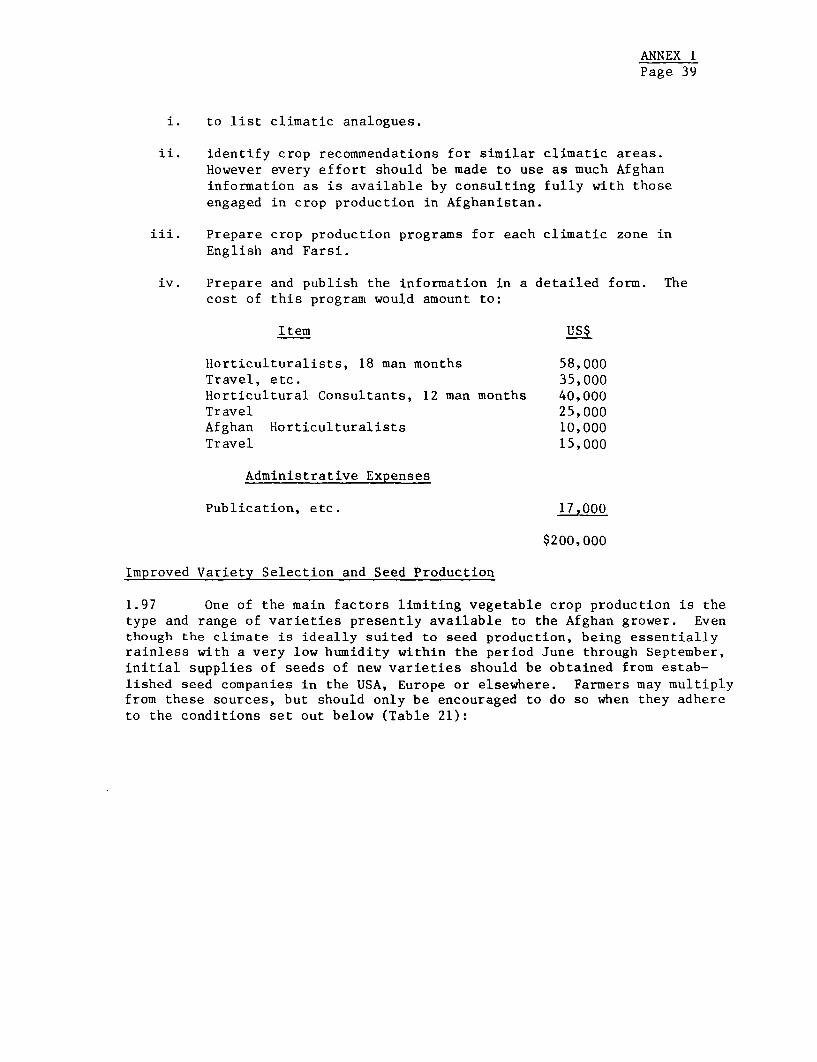
ANNEX 1Page 39
i. to list climatic analogues.
ii. identify crop recommendations for similar climatic areas.However every effort should be made to use as much Afghaninformation as is available by consulting fully with thoseengaged in crop production in Afghanistan.
iii. Prepare crop production programs for each climatic zone inEnglish and Farsi.
iv. Prepare and publish the information in a detailed form. Thecost of this progranm would amount to:
Item US$
Horticulturalists, 18 man months 58,000Travel, etc. 35,000Horticultural Consultants, 12 man months 40,000Travel 25,000Afghan Horticulturalists 10,000Travel 15,000
Administrative Expenses
Publication, etc. 17,000
$200,000
Improved Variety Selection and Seed Production
1.97 One of the main factors limiting vegetable crop production is thetype and range of varieties presently available to the Afghan grower. Eventhough the climate is ideally suited to seed production, being essentiallyrainless with a very low humidity within the period June through September,initial supplies of seeds of new varieties should be obtained from estab-lished seed companies in the USA, Europe or elsewhere. Farmers may multiplyfrom these sources, but should only be encouraged to do so when they adhereto the conditions set out below (Table 21):
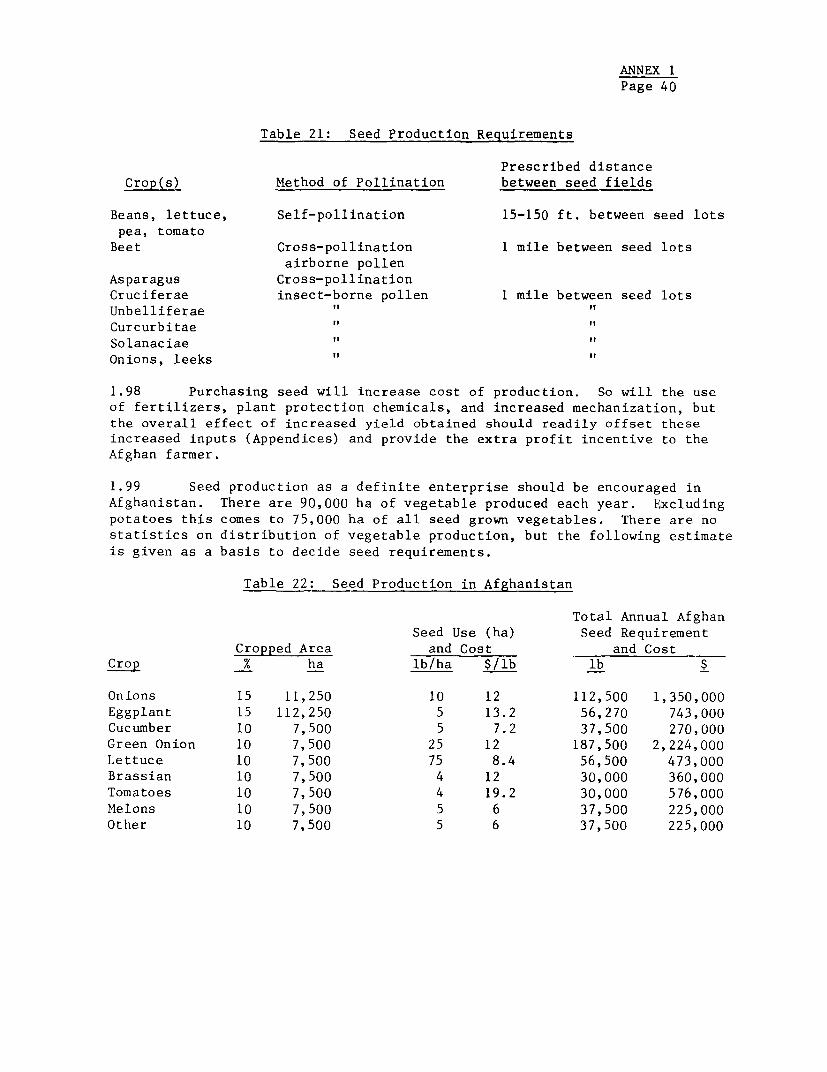
ANNEX 1Page 40
Table 21: Seed Production Requirements
Prescribed distanceCrop(s) Method of Pollination between seed fields
Beans, lettuce, Self-pollination 15-150 ft. between seed lots
pea, tomatoBeet Cross-pollination 1 mile between seed lots
airborne pollenAsparagus Cross-pollinationCruciferae insect-borne pollen 1 mile between seed lotsUnbelliferae " "Curcurbitae itSolanaciae itOnions, leeks it
1.98 Purchasing seed will increase cost of production. So will the useof fertilizers, plant protection chemicals, and increased mechanization, butthe overall effect of increased yield obtained should readily offset theseincreased inputs (Appendices) and provide the extra profit incentive to the
Afghan farmer.
1.99 Seed production as a definite enterprise should be encouraged in
Afghanistan. There are 90,000 ha of vegetable produced each year. Excludingpotatoes this comes to 75,000 ha of all seed grown vegetables. There are nostatistics on distribution of vegetable production, but the following estimate
is given as a basis to decide seed requirements.
Table 22: Seed Production in Afghanistan
Total Annual AfghanSeed Use (ha) Seed Requirement
Cropped Area and Cost and Costo% ha lb/ha $/lb lb $
Onions 15 11,250 10 12 112,500 1,350,000Eggplant 15 112,250 5 13.2 56,270 743,000Cucumber 10 7,500 5 7.2 37,500 270,000Green Onion 10 7,500 25 12 187,500 2,224,000Lettuce 10 7,500 75 8.4 56,500 473,000Brassian 10 7,500 4 12 30,000 360,000Tomatoes 10 7,500 4 19.2 30,000 576,000
Melons 10 7,500 5 6 37,500 225,000Other 10 7,500 5 6 37,500 225,000
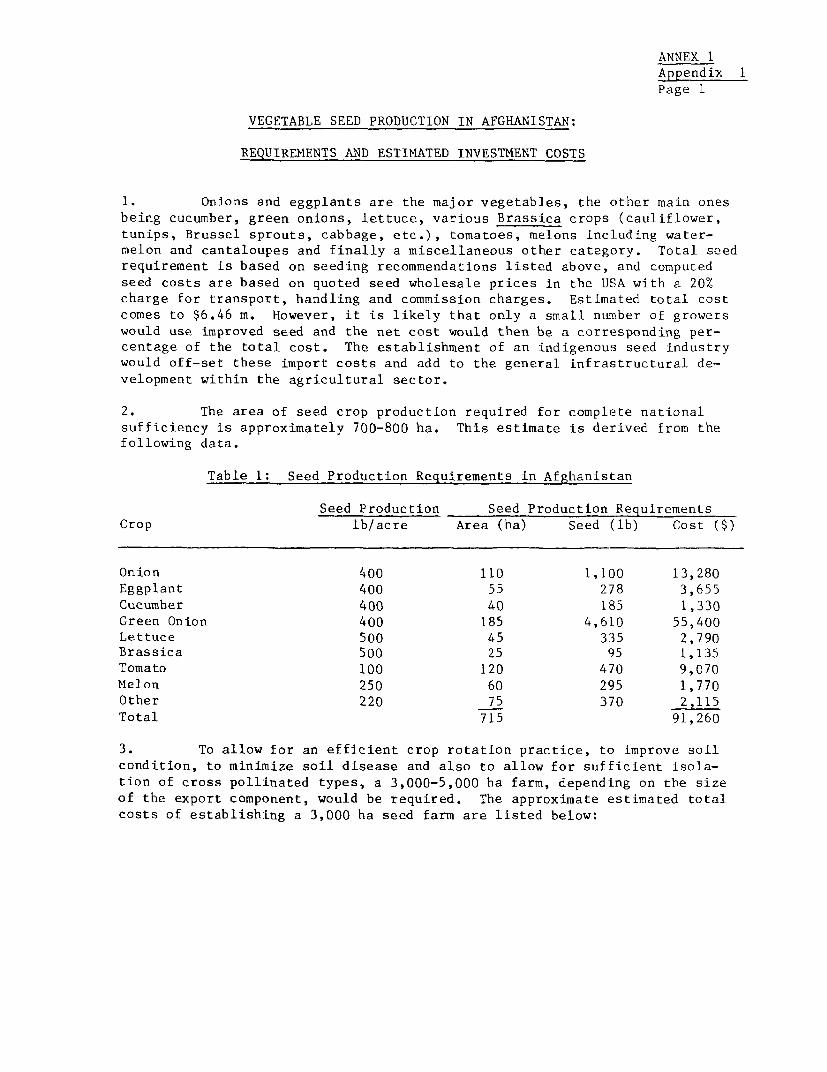
ANNEX IAppendix 1Page 1
VEGETABLE SEED PRODUCTION IN AFGHANISTAN:
REQUIREMENTS AND ESTIMATED INVESTMENT COSTS
1. Onions and eggplants are the major vegetables, the other main ones
being cucumber, green onions, lettuce, various Brassica crops (cauliflower,tunips, Brussel sprouts, cabbage, etc.), tomatoes, melons including water-melon and cantaloupes and finally a miscellaneous other category. Total seedrequirement is based on seeding recommendations listed above, and computedseed costs are based on quoted seed wholesale prices in the USA with a 20%charge for transport, handling and commission charges. Estimated total cost
comes to $6.46 m. However, it is likely that only a small number of growers
would use improved seed and the net cost would then be a corresponding per-centage of the total cost. The establishment of an indigenous seed industrywould off-set these import costs and add to the general infrastructural de-
velopment within the agricultural sector.
2. The area of seed crop production required for complete nationalsufficiency is approximately 700-800 ha. This estimate is derived from thefollowing data.
Table 1: Seed Production Requirements in Afghanistan
Seed Production Seed Production RequirementsCrop lb/acre Area (ha) Seed (lb) Cost ($)
Onion 400 110 1,100 13,280Eggplant 400 55 278 3,655Cucumber 400 40 185 1,330Green Onion 400 185 4,610 55,400Lettuce 500 45 335 2,790Brassica 500 25 95 1,135Tomato 100 120 470 9,070Melon 250 60 295 1,770Other 220 75 370 2,115Total 715 91,260
3. To allow for an efficient crop rotation practice, to improve soilcondition, to minimize soil disease and also to allow for sufficient isola-tion of cross pollinated types, a 3,000-5,000 ha farm, depending on the size
of the export component, would be required. The approximate estimated totalcosts of establishing a 3,000 ha seed farm are listed below:
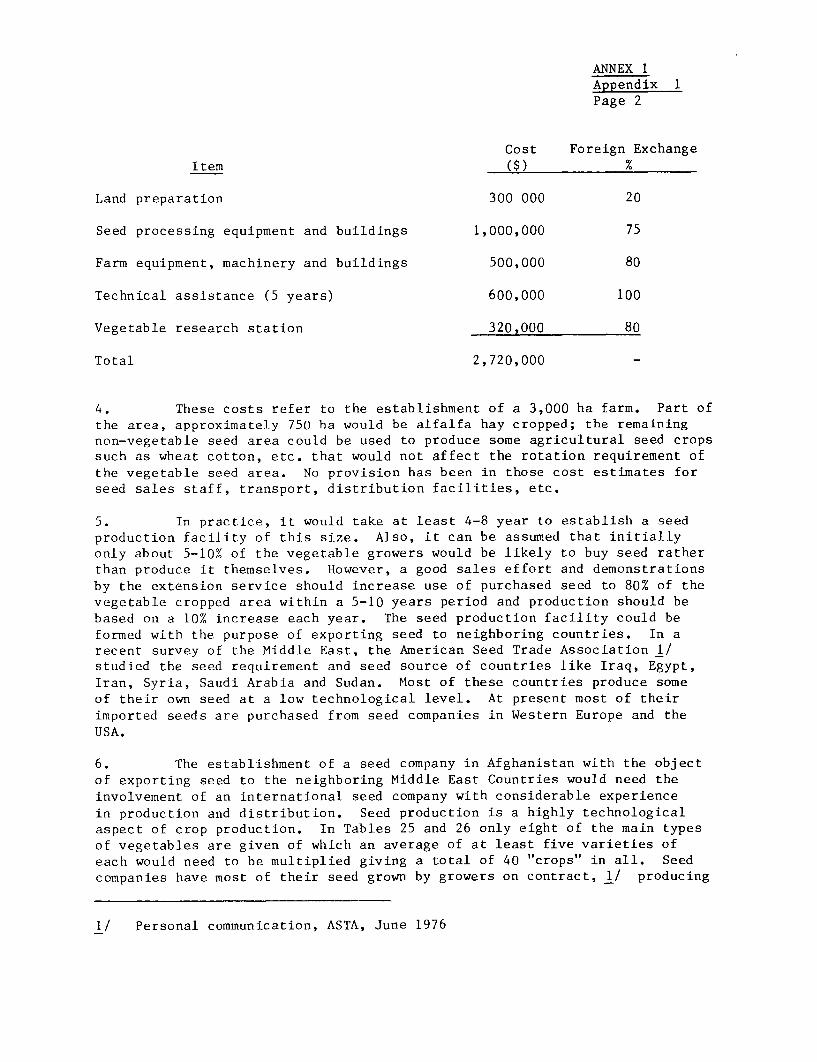
ANNEX 1Appendix 1Page 2
Cost Foreign Exchange
Item ($)%
Land preparation 300 000 20
Seed processing equipment and buildings 1,000,000 75
Farm equipment, machinery and buildings 500,000 80
Technical assistance (5 years) 600,000 100
Vegetable research station 320,000 80
Total 2,720,000 -
4. These costs refer to the establishment of a 3,000 ha farm. Part ofthe area, approximately 750 ha would be alfalfa hay cropped; the remainingnon-vegetable seed area could be used to produce some agricultural seed cropssuch as wheat cotton, etc. that would not affect the rotation requirement ofthe vegetable seed area. No provision has been in those cost estimates forseed sales staff, transport, distribution facilities, etc.
5. In practice, it would take at least 4-8 year to establish a seedproduction facility of this size. Also, it can be assumed that initiallyonly about 5-10% of the vegetable growers would be likely to buy seed ratherthan produce it themselves. However, a good sales effort and demonstrationsby the extension service should increase use of purchased seed to 80% of thevegetable cropped area within a 5-10 years period and production should bebased on a 10% increase each year. The seed production facility could beformed with the purpose of exporting seed to neighboring countries. In arecent survey of the Middle East, the American Seed Trade Association 1/studied the seed requirement and seed source of countries like Iraq, Egypt,Iran, Syria, Saudi Arabia and Sudan. Most of these countries produce someof their own seed at a low technological level. At present most of theirimported seeds are purchased from seed companies in Western Europe and theUSA.
6. The establishment of a seed company in Afghanistan with the objectof exporting seed to the neighboring Middle East Countries would need theinvolvement of an international seed company with considerable experiencein production and distribution. Seed production is a highly technologicalaspect of crop production. In Tables 25 and 26 only eight of the main typesof vegetables are given of which an average of at least five varieties ofeach would need to be multiplied giving a total of 40 "crops" in all. Seedcompanies have most of their seed grown by growers on contract, 1/ producing
1/ Personal communication, ASTA, June 1976
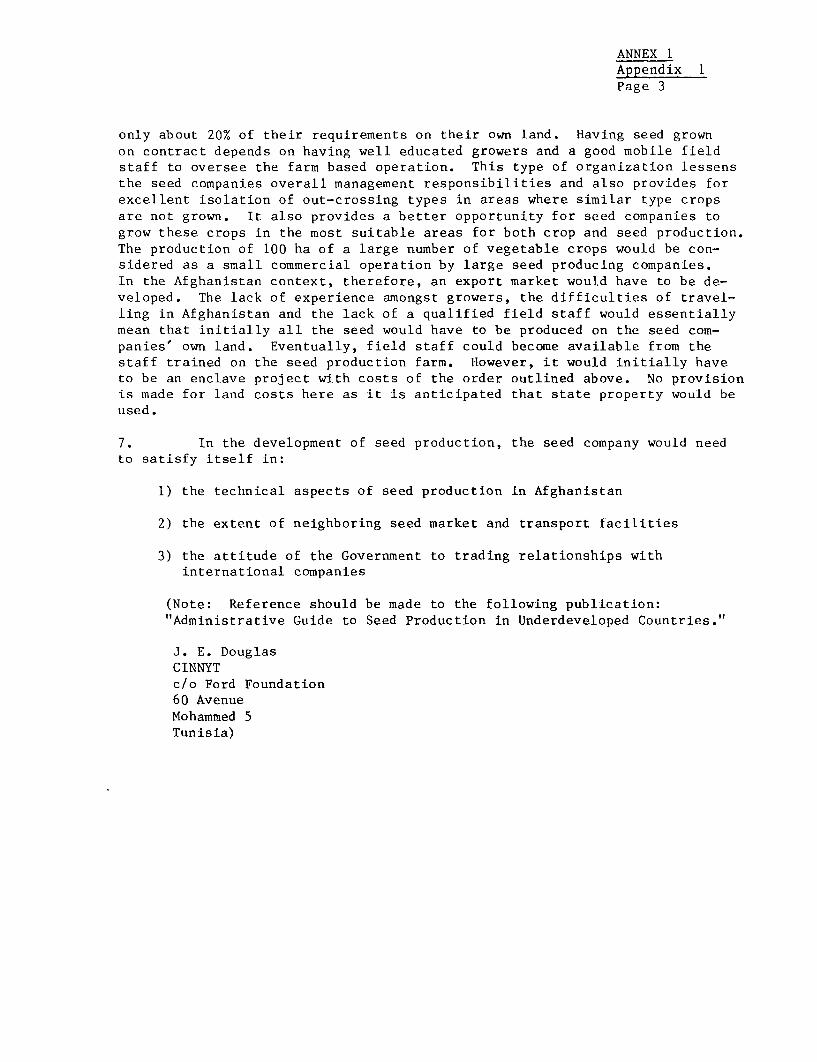
ANNEX 1Appendix IPage 3
only about 20% of their requirements on their own land. Having seed grownon contract depends on having well educated growers and a good mobile fieldstaff to oversee the farm based operation. This type of organization lessensthe seed companies overall management responsibilities and also provides forexcellent isolation of out-crossing types in areas where similar type cropsare not grown. It also provides a better opportunity for seed companies togrow these crops in the most suitable areas for both crop and seed production.The production of 100 ha of a large number of vegetable crops would be con-sidered as a small commercial operation by large seed producing companies.In the Afghanistan context, therefore, an export market would have to be de-veloped. The lack of experience amongst growers, the difficulties of travel-ling in Afghanistan and the lack of a qualified field staff would essentiallymean that initially all the seed would have to be produced on the seed com-panies' own land. Eventually, field staff could become available from thestaff trained on the seed production farm. However, it would initially haveto be an enclave project with costs of the order outlined above. No provisionis made for land costs here as it is anticipated that state property would beused.
7. In the development of seed production, the seed company would needto satisfy itself in:
1) the technical aspects of seed production in Afghanistan
2) the extent of neighboring seed market and transport facilities
3) the attitude of the Government to trading relationships withinternational companies
(Note: Reference should be made to the following publication:"Administrative Guide to Seed Production in Underdeveloped Countries."
J. E. DouglasCINNYTc/o Ford Foundation60 AvenueMohammed 5Tunisia)
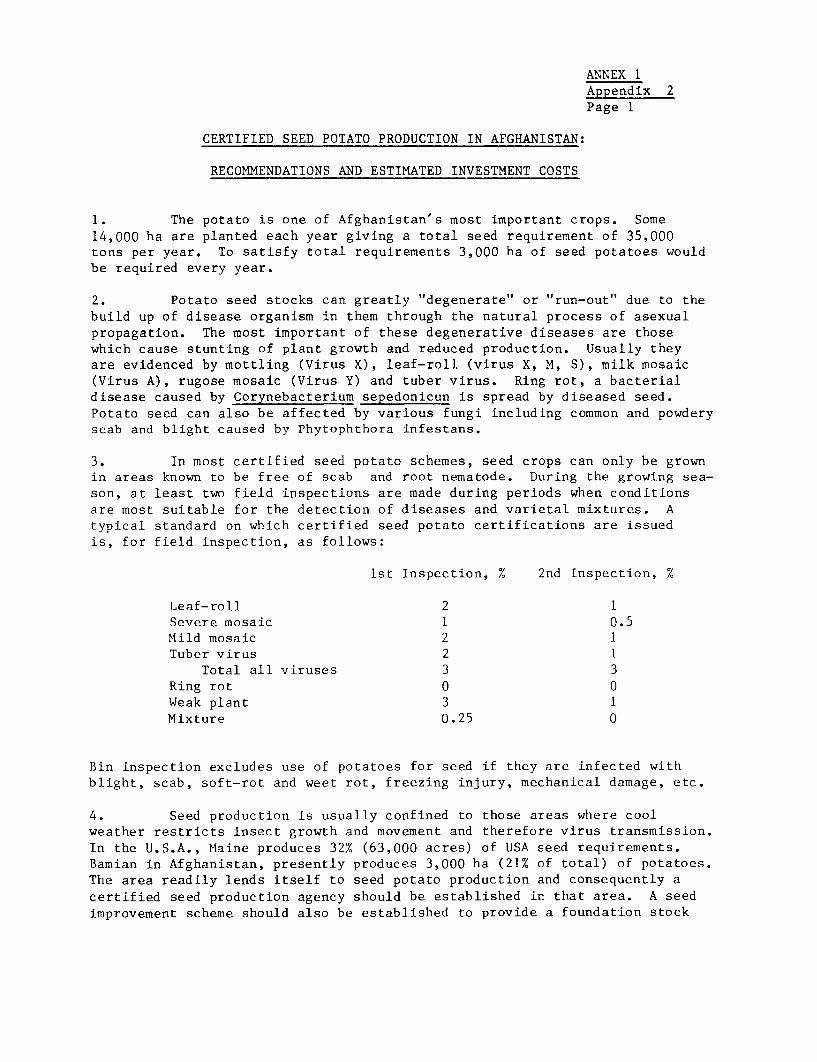
ANNEX 1Appendix 2Page 1
CERTIFIED SEED POTATO PRODUCTION IN AFGHANISTAN:
RECOMMENDATIONS AND ESTIMATED INVESTMENT COSTS
1. The potato is one of Afghanistan's most important crops. Some14,000 ha are planted each year giving a total seed requirement of 35,000tons per year. To satisfy total requirements 3,000 ha of seed potatoes wouldbe required every year.
2. Potato seed stocks can greatly "degenerate" or "run-out" due to thebuild up of disease organism in them through the natural process of asexualpropagation. The most important of these degenerative diseases are thosewhich cause stunting of plant growth and reduced production. Usually theyare evidenced by mottling (Virus X), leaf-roll (virus X, M, S), milk mosaic(Virus A), rugose mosaic (Virus Y) and tuber virus. Ring rot, a bacterialdisease caused by Corynebacterium sepedonicun is spread by diseased seed.Potato seed can also be affected by various fungi including common and powderyscab and blight caused by Phytophthora infestans.
3. In most certified seed potato schemes, seed crops can only be grownin areas known to be free of scab and root nematode. During the growing sea-son, at least two field inspections are made during periods when conditionsare most suitable for the detection of diseases and varietal mixtures. Atypical standard on which certified seed potato certifications are issuedis, for field inspection, as follows:
1st Inspection, % 2nd Inspection, %
Leaf-roll 2 1Severe mosaic 1 0.5Mild mosaic 2 1Tuber virus 2 1
Total all viruses 3 3Ring rot 0 0Weak plant 3 1Mixture 0.25 0
Bin inspection excludes use of potatoes for seed if they are infected withblight, scab, soft-rot and weet rot, freezing injury, mechanical damage, etc.
4. Seed production is usually confined to those areas where coolweather restricts insect growth and movement and therefore virus transmission.In the U.S.A., Maine produces 32% (63,000 acres) of USA seed requirements.Bamian in Afghanistan, presently produces 3,000 ha (21% of total) of potatoes.The area readily lends itself to seed potato production and consequently acertified seed production agency should be established in that area. A seedimprovement scheme should also be established to provide a foundation stock
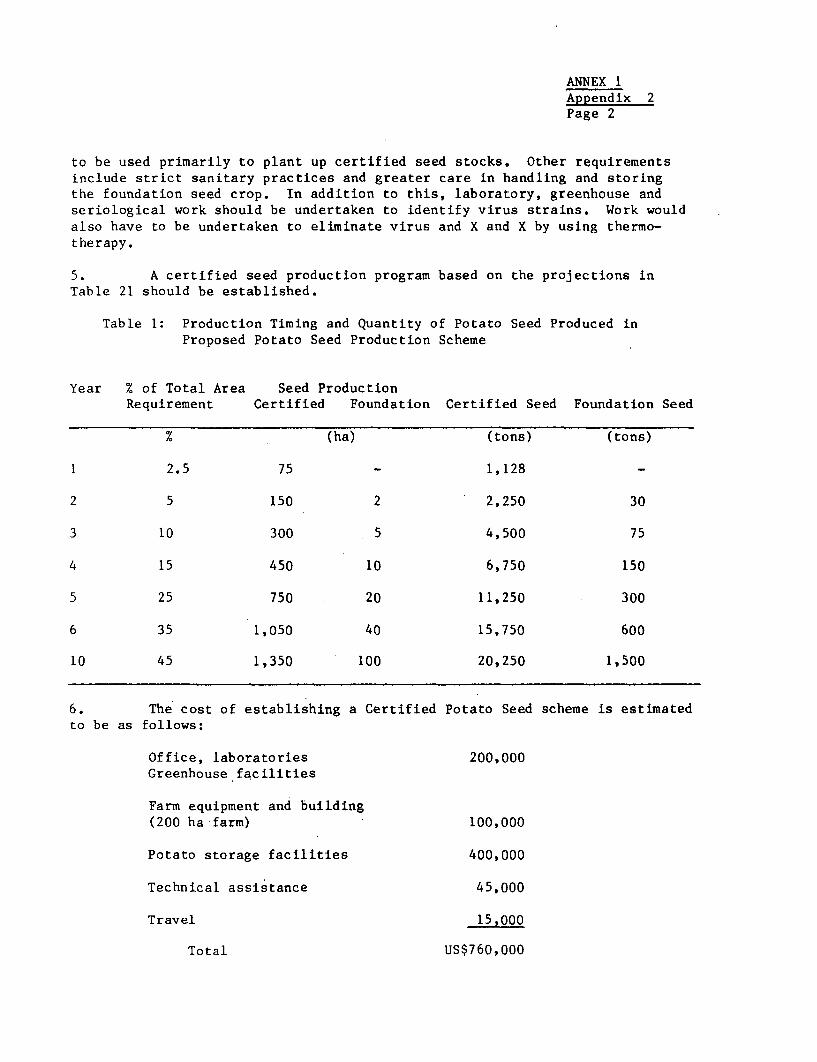
ANNEX 1Appendix 2Page 2
to be used primarily to plant up certified seed stocks. Other requirementsinclude strict sanitary practices and greater care in handling and storingthe foundation seed crop. In addition to this, laboratory, greenhouse andseriological work should be undertaken to identify virus strains. Work wouldalso have to be undertaken to eliminate virus and X and X by using thermo-therapy.
5. A certified seed production program based on the projections inTable 21 should be established.
Table 1: Production Timing and Quantity of Potato Seed Produced inProposed Potato Seed Production Scheme
Year % of Total Area Seed ProductionRequirement Certified Foundation Certified Seed Foundation Seed
% (ha) (tons) (tons)
1 2.5 75 - 1,128 -
2 5 150 2 2,250 30
3 10 300 5 4,500 75
4 15 450 10 6,750 150
5 25 750 20 11,250 300
6 35 1,050 40 15,750 600
10 45 1,350 100 20,250 1,500
6. The cost of establishing a Certified Potato Seed scheme Ls estimatedto be as follows:
Office, laboratories 200,000Greenhouse facilities
Farm equipment and building(200 ha farm) 100,000
Potato storage facilities 400,000
Technical assistance 45,000
Travel 15,000
Total US$760,000
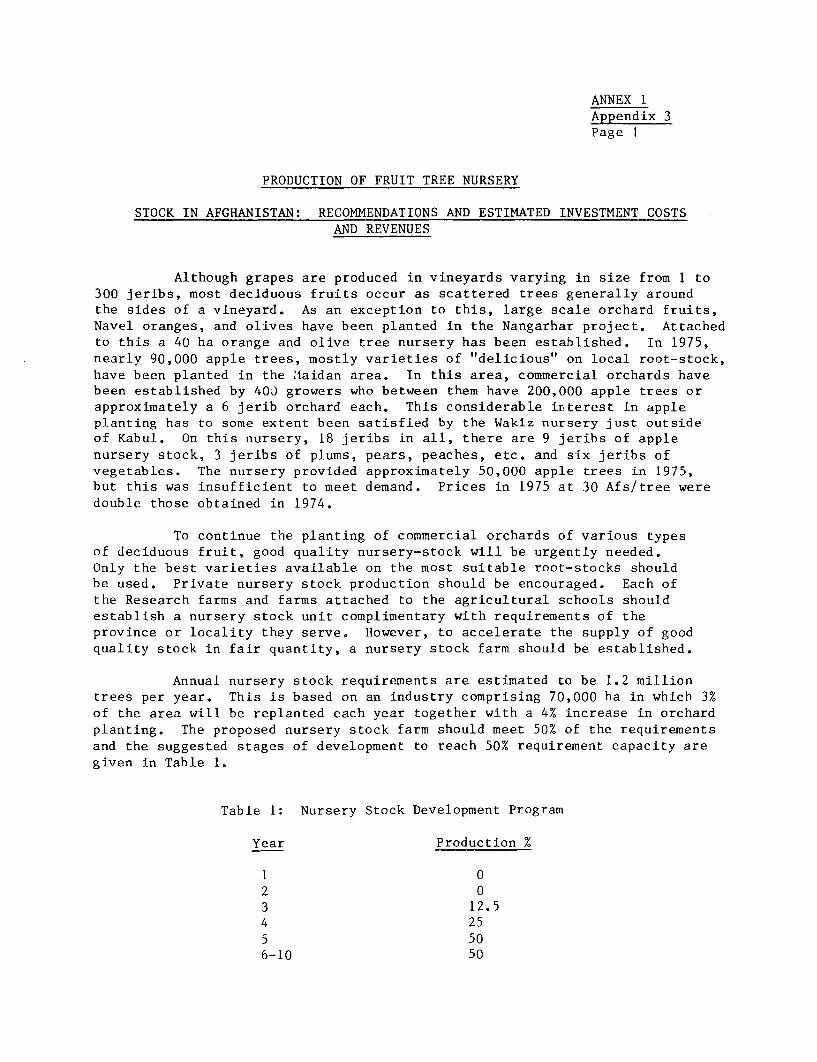
ANNEX 1Appendix 3Page 1
PRODUCTION OF FRUIT TREE NURSERY
STOCK IN AFGHANISTAN: RECOMENDATIONS AND ESTIMATED INVESTMENT COSTSAND REVENUES
Although grapes are produced in vineyards varying in size from 1 to300 jeribs, most deciduous fruits occur as scattered trees generally aroundthe sides of a vineyard. As an exception to this, large scale orchard fruits,Navel oranges, and olives have been planted in the Nangarhar project. Attachedto this a 40 ha orange and olive tree nursery has been established. In 1975,nearly 90,000 apple trees, mostly varieties of "delicious" on local root-stock,have been planted in the '1aidan area. In this area, commercial orchards havebeen established by 400 growers who between them have 200,000 apple trees orapproximately a 6 jerib orchard each. This considerable irterest in appleplanting has to some extent been satisfied by the Wakiz nursery just outsideof Kabul. On this nursery, 18 jeribs in all, there are 9 jeribs of applenursery stock, 3 jeribs of plums, pears, peaches, etc. and six jeribs ofvegetables. The nursery provided approximately 50,000 apple trees in 1975,but this was insufficient to meet demand. Prices in 1975 at 30 Afs/tree weredouble those obtained in 1974.
To continue the planting of commercial orchards of various typesof deciduous fruit, good quality nursery-stock will be urgently needed.Only the best varieties available on the most suitable root-stocks shouldbe used. Private nursery stock production should be encouraged. Each ofthe Research farms and farms attached to the agricultural schools shouldestablish a nursery stock unit complimentary with requirements of theprovince or locality they serve. However, to accelerate the supply of goodquality stock in fair quantity, a nursery stock farm should be established.
Annual nursery stock requirements are estimated to be 1.2 milliontrees per year. This is based on an industry comprising 70,000 ha in which 3%of the area will be replanted each year together with a 4% increase in orchardplanting. The proposed nursery stock farm should meet 50% of the requirementsand the suggested stages of development to reach 50% requirement capacity aregiven in Table 1.
Table 1: Nursery Stock Development Program
Year Production %
1 02 03 12.54 255 506-10 50
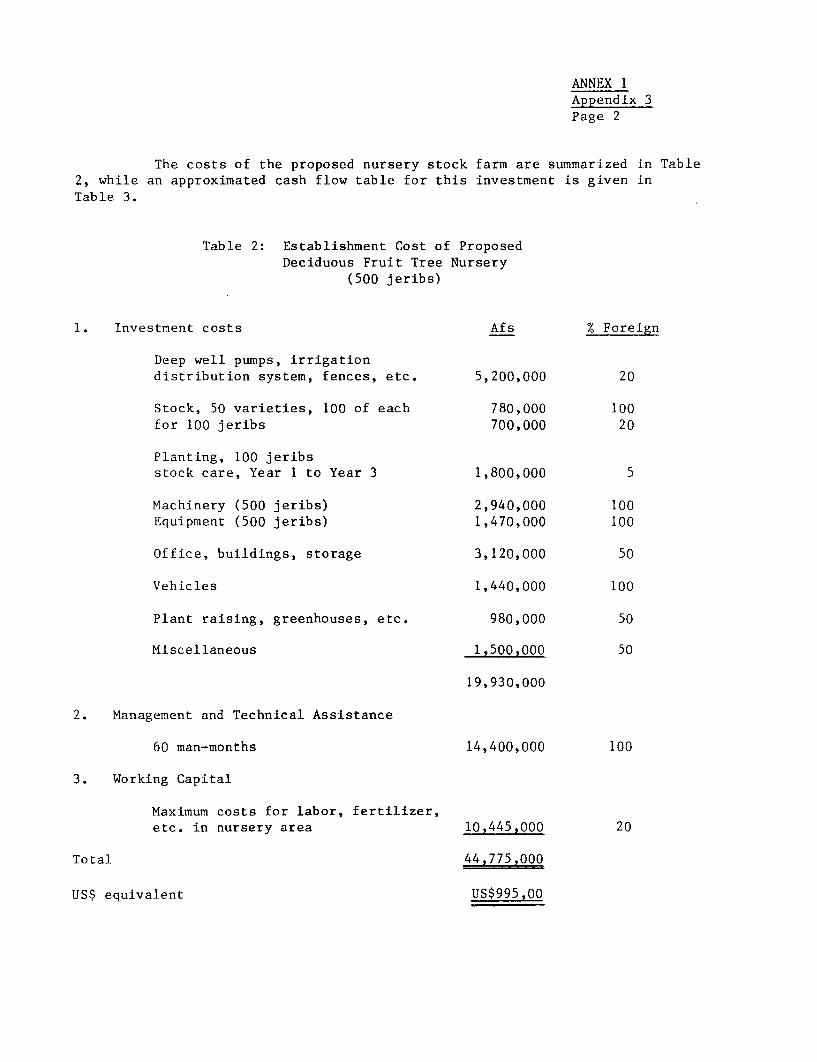
ANNEX 1Appendix 3Page 2
The costs of the proposed nursery stock farm are summarized in Table2, while an approximated cash flow table for this investment is given inTable 3.
Table 2: Establishment Cost of ProposedDeciduous Fruit Tree Nursery
(500 jeribs)
1. Investment costs Afs % Foreign
Deep well pumps, irrigationdistribution system, fences, etc. 5,200,000 20
Stock, 50 varieties, 100 of each 780,000 100for 100 jeribs 700,000 20
Planting, 100 jeribsstock care, Year 1 to Year 3 1,800,000 5
Machinery (500 jeribs) 2,940,000 100Equipment (500 jeribs) 1,470,000 100
Office, buildings, storage 3,120,000 50
Vehicles 1,440,000 100
Plant raising, greenhouses, etc. 980,000 50
Miscellaneous 1,500,000 50
19,930,000
2. Management and Technical Assistance
60 man-months 14,400,000 100
3. Working Capital
Maximum costs for labor, fertilizer,etc. in nursery area 10,445,000 20
Total 44,775,000
US$ equivalent US$995,00
ANNEX 1Appendix 3Page 3
At full capacity production, approximately 600,000 fruit trees wouldbe required each year. A 100 jerib stock area composed of 100 trees of eachof 50 different varieties would supply the bond-wood material for this nursery.Nursery plantings would be established on 240 jeribs each planting takingtwo years to reach full size (5,000 nursery trees/jerib). The rest of thenursery would be planted with alfalfa, to improve soil condition, and somevegetable crops, to supply out of season work for the nursery labor and staff.
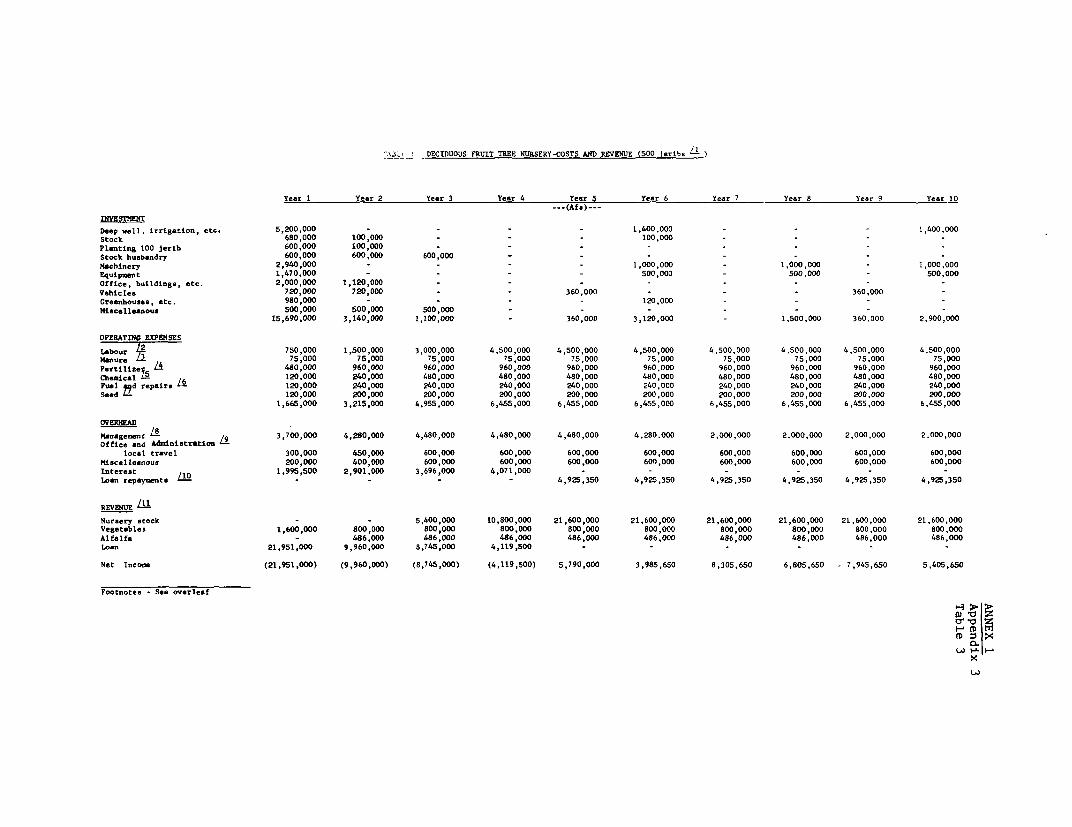
DECIDUOUS FRUIT TREE NURSERY-COSTS AND REVENUE (500 ieribs Li.
Year I Year 2 Year 3 Year 4 Year 5 Year 6 Year 7 Year B Year 9 Year 10
rNVES>ENT
Deep well, irrigation, etc. 5,200,000 - _ _ _ 1,400,000 - _ 1,400,000Stock 680,000 100,000 - - _ 100,000 - _ -Planting 100 Jerib 600,000 100,000 - -Stock husbandry 600,000 600,000 600,000 - - -Machinery 2,940,000 _ 1,000,000 _ 1,000,000 - 1,000,000Equipment 1,470,000 - 500,000 500,000 500,000Office, buildings, etc. 2,000,000 1,120,000 - - - - - -Vehicles 720,000 720,000 - - 360,000 - _ _ 360,000Greenhouses, etc. 980,000 - - - 120,000 - - - -Miscalleanous 500,000 500,000 500,000 - - - - - - -
15,690,000 3,140,000 1,100,000 - 360,000 3,120,000 - 1,500.000 360,000 2,900,000
OPERATINO EXPENSES
Labour 2750,000 1,500,000 3,000,000 4,500,000 4,500,000 4,500,000 4,500,000 4,500,000 4,500,000 4,500,000Manure 75,000 75,000 75,000 75,000 75,000 75,000 75,000 75,000 75,000 75,000Pertiliae9 4 480,000 960,000 960,000 960,000 960,000 960.000 960,000 960.000 960,000 960,000Chemical '5 120,000 240,000 480,000 480,000 480,000 480,000 480,000 480,000 480,000 480,000Fuel ?qd repairs L6 120,000 240,000 240,000 240,000 240,000 240,000 240,000 240,000 240,000 240,000Seed ' 120,000 200,000 200,000 200,000 200,000 200,000 200,000 200,000 200,000 200,000
1,665,000 3,215,000 4,955,000 6,455,000 6,455,000 6,455,000 6,455,000 6,455,000 6,455,000 6,455,000
OVERHEAD
Ofnage nt miti 3,700,000 4,280,000 4,480,000 4,480,000 4,480,000 4,280.000 2,000,000 2,000,000 2,000,000 2.000,000Office tnd Adein0strati00,0
local treoel 300,000 450,000 600,000 600,000 600,000 600,000 600,000 600,000 600,000 600,000lqiscelleanous 200,000 400,000 600,000 6'00 000 600,000 600,000 600,000 600,000 600,000 600,000Interest /1 1,995,500 2,901,000 3,696,000 4,071,000 - - - - - -Loan repayments - - - - 4,925,350 4,925,350 4,925,350 4,925,350 4,925,350 4,925,350
REVENUE 11
Nursery stock - _ 5,400,000 10,800,000 21,600,000 21,600,000 21,600,000 21,600,000 21,600,000 21,600,000Vegetables 1,600,000 800,000 800,000 800,000 800,000 800,000 800,000 800,000 800,000 800,000Alfalfa - 486,000 486,000 486,000 486,000 486,000 486,000 486,000 486,000 486,000Loan 21,951,000 9,960,000 8,745,000 4,119,500 - - - - - -
Net Income (21,951,000) (9,960,000) (8,745,000) (4,119,500) 5,790,000 3,985,650 8,305,650 6,805,650 7,945,650 5,405,650
Footnotes - See overleaf
A,) la. rD > t
xLi5
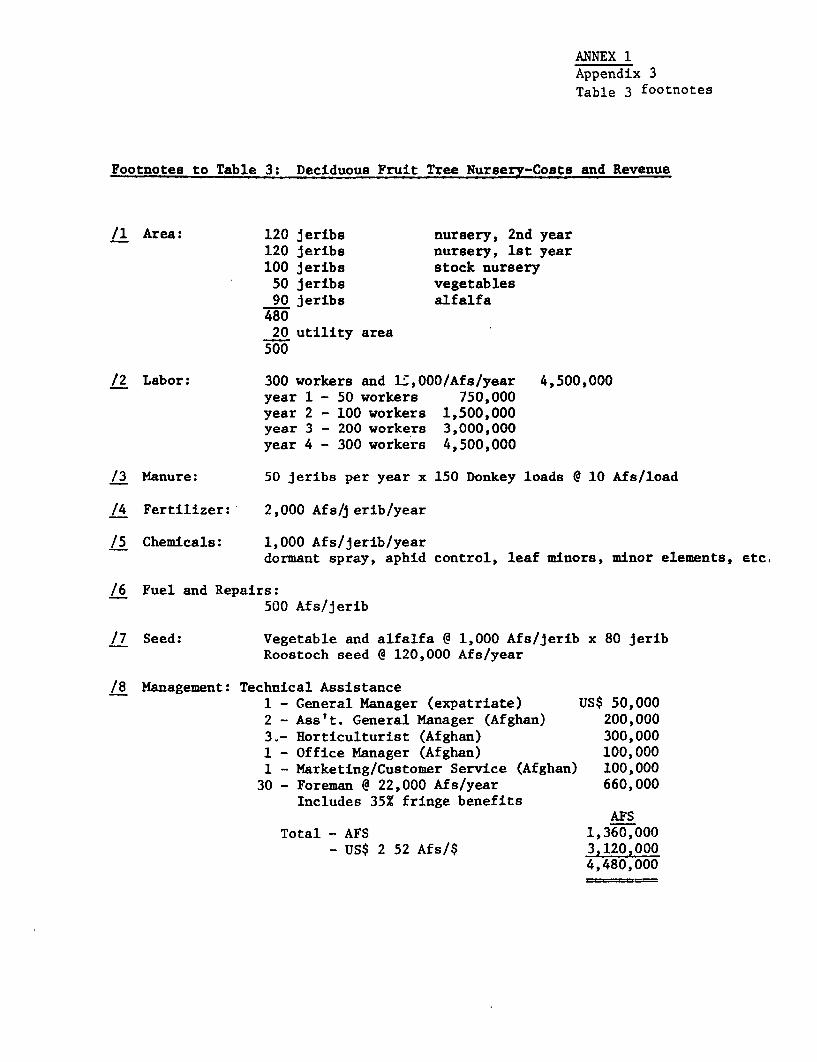
ANNEX 1Appendix 3Table 3 footnotes
Footnotes to Table 3: Deciduous Fruit Tree Nursery-Costs and Revenue
Ll Area: 120 jeribs nursery, 2nd year120 jeribs nursery, 1st year100 Jeribs stock nursery50 jeribs vegetables90 jeribs alfalfa
48020 utility area
500
/2 Labor: 300 workers and 1_,000/Afs/year 4,500,000year 1 - 50 workers 750,000year 2 - 100 workers 1,500,000year 3 - 200 workers 3,000,000year 4 - 300 workers 4,500,000
/3 Manure: 50 jeribs per year x 150 Donkey loads @ 10 Afs/load
/4 Fertilizer: 2,000 Afs/; erib/year
/5 Chemicals: 1,000 Afs/jerib/yeardormant spray, aphid control, leaf minors, minor elements, etc.
/6 Fuel and Repairs:500 Afs/jerib
/7 Seed: Vegetable and alfalfa @ 1,000 Afs/jerib x 80 jeribRoostoch seed @ 120,000 Afs/year
/8 Management: Technical Assistance1 - General Manager (expatriate) US$ 50,0002 - Ass't. General Manager (Afghan) 200,0003.- Horticulturist (Afghan) 300,0001 - Office Manager (Afghan) 100,0001 - Marketing/Customer Service (Afghan) 100,00030 - Foreman @ 22,000 Afs/year 660,000
Includes 35% fringe benefitsAFS
Total - AFS 1,360,000- US$ 2 52 Afs/$ 3,120,000
4,480,000
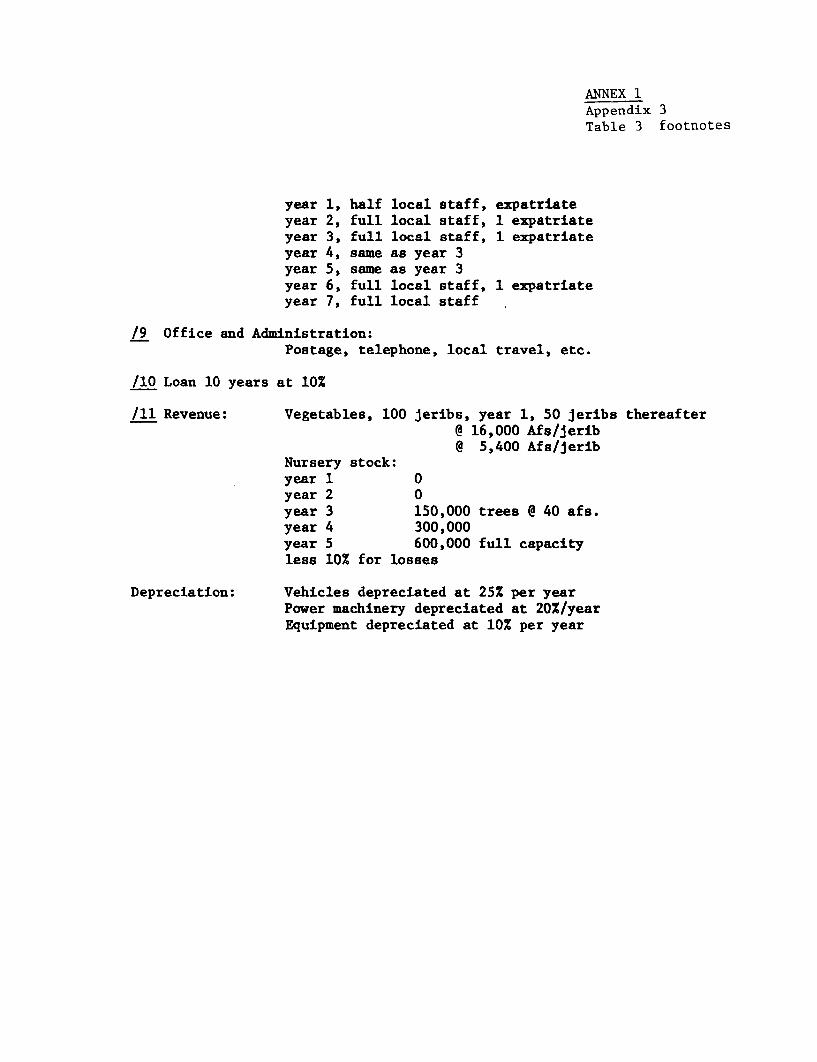
ANNEX 1Appendix 3Table 3 footnotes
year 1, half local staff, expatriateyear 2, full local staff, 1 expatriateyear 3, full local staff, 1 expatriateyear 4, same as year 3year 5, same as year 3year 6, full local staff, 1 expatriateyear 7, full local staff
19 Office and Administration:Postage, telephone, local travel, etc.
/10 Loan 10 years at 10%
/11 Revenue: Vegetables, 100 jeribs, year 1, 50 jeribs thereafter@ 16,000 Afs/jerib@ 5,400 Afs/jerib
Nursery stock:year 1 0year 2 0year 3 150,000 trees @ 40 afs.year 4 300,000year 5 600,000 full capacityless 10% for losses
Depreciation: Vehicles depreciated at 25% per yearPower machinery depreciated at 20%/yearEquipment depreciated at 10% per year
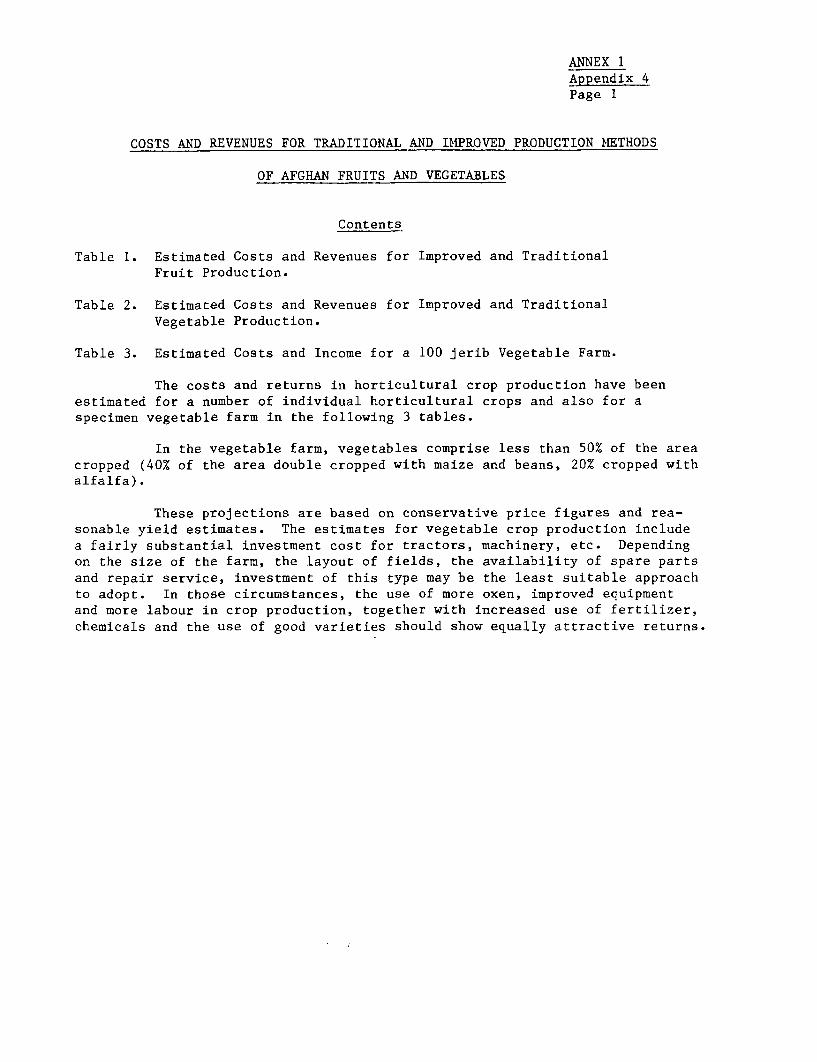
ANNEX 1Appendix 4Page 1
COSTS AND REVENUES FOR TRADITIONAL AND IMPROVED PRODUCTION IETHODS
OF AFGHAN FRUITS AND VEGETABLES
Contents
Table 1. Estimated Costs and Revenues for Improved and TraditionalFruit Production.
Table 2. Estimated Costs and Revenues for Improved and TraditionalVegetable Production.
Table 3. Estimated Costs and Income for a 100 jerib Vegetable Farm.
The costs and returns in horticultural crop production have beenestimated for a number of individual horticultural crops and also for aspecimen vegetable farm in the following 3 tables.
In the vegetable farm, vegetables comprise less than 50% of the areacropped (40% of the area double cropped with maize and beans, 20% cropped withalfalfa).
These projections are based on conservative price figures and rea-sonable yield estimates. The estimates for vegetable crop production includea fairly substantial investment cost for tractors, machinery, etc. Dependingon the size of the farm, the layout of fields, the availability of spare partsand repair service, investment of this type may be the least suitable approachto adopt. In those circumstances, the use of more oxen, improved equipmentand more labour in crop production, together with increased use of fertilizer,chemicals and the use of good varieties should show equally attractive returns.
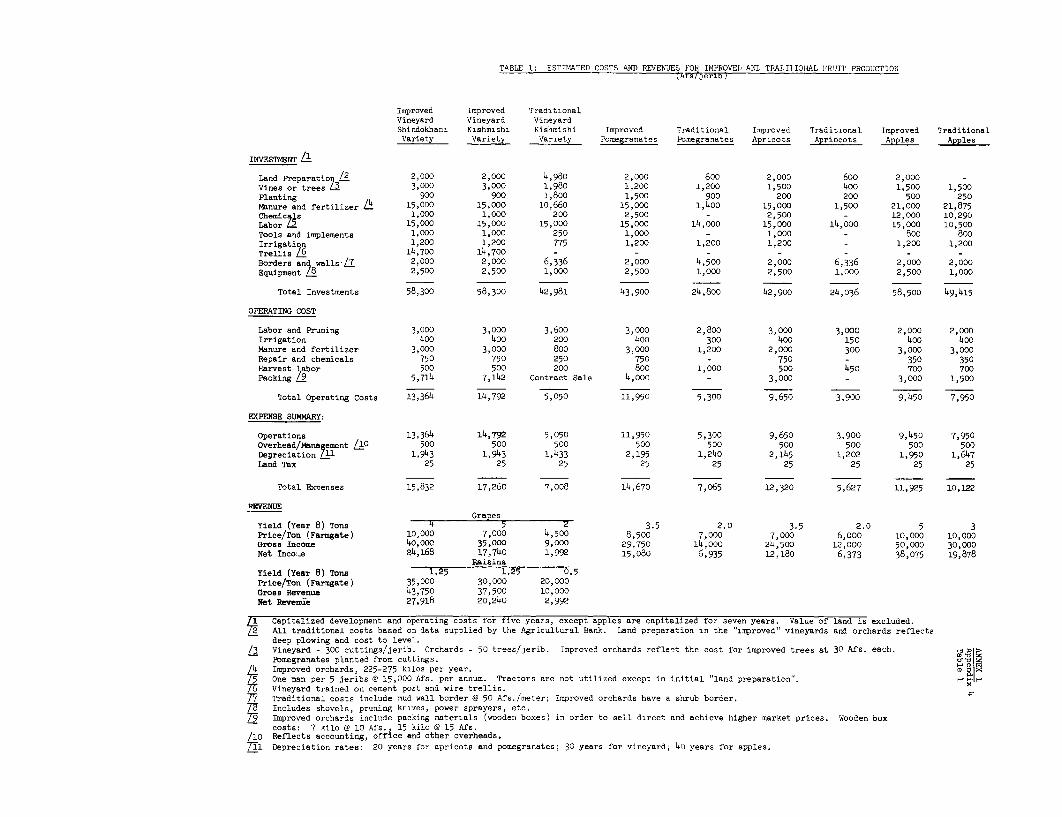
TABLE 1: ESTIMATED COSTS AND REVENUES FOE IMPROVED AND TRALITIOIAL FRT1IT PRODUCTION;Ads/jerlb i
Improved Improved TraditionalVineyard Vineyard VineyardShindokhani Kishmishi Kishmishi Improved Traditional Improved Traditional Improved TraditionalVariety Variety Variety Pomegranates Pomegranates Apricots Apriocots Apples Apples
INVESTMENT /
Land Preparatio 2 2,000 2,000 4,980 2,000 600 2,000 600 2,000 -Vines or trees oL 3,000 3,000 1,980 1,200 1,200 1,500 400 1,500 1,500Planting 9go 900 1,800 1,500 900 200 200 500 250Manure and fertilizer 4 15,000 15,000 10,660 15,000 1,400 15,000 1,500 21,000 21,875Chemicss 1,000 1,000 200 2,500 - 2,500 - 12,000 10,290Labor L2 15,000 15,000 15,000 15,000 14,000 15,000 14,000 15,000 10,500Tools and implements 1,000 1,000 250 1,000 - 1,000 800 800Irrigatiog 1,200 1,200 775 1,200 1,200 1,200 - 1,200 1,200Trellis 14,700 14,700 - - - - - - -Borders and walls L 2,000 2,000 6,336 2,000 4,500 2,000 6,336 2,000 2,000Equipment /8 2,500 2,500 1,000 2,500 1,000 2,500 1,000 2,500 1,000
Total Investments 58,300 58,300 42,981 43,900 24,800 42,900 24,036 58,500 49,415
OPERATING COST
Labor and Pruning 3,000 3,000 3,600 3,000 2,800 3,000 3,000 2,000 2,000Irrigation 400 400 200 400 300 400 150 400 400Manure and fertilizer 3,000 3,000 800 3,000 1,200 2,000 300 3,000 3,000Repair and chemicals 750 750 250 750 - 750 - 350 350Harvest 3,abor 500 500 200 800 1,000 500 450 700 700Packing 19 5,714 7,142 Contract Sale 4,000 - 3,000 - 3,000 1,500
Total Operating Costs 13,364 14,792 5,050 11,950 5,300 9,650 3,900 9,450 7,950
EXPENSE SUMMARY:
Operations 13,364 14,792 5,050 11,950 5,300 9,650 3,900 9,450 7,950Overhead/Management Llo 500 500 500 500 500 500 500 500 500Depreciation L_1 1,943 1,943 1,433 2,195 1,240 2,145 1,202 1,950 1,647Land Tax 25 25 25 25 25 25 25 25 25
Total Excoenses 15,832 17,260 7,008 14,670 7,065 12,320 5,627 11,925 10,122
RKVENUEGrape s
Yield (Year 8) Tons 4 5 2 3.5 2.0 3.5 2.0 5 3Price/Ton (Farmgate) 10,000 7,000 4,500 8,500 7,000 7,000 6,oo0 10,000 10,000Gross Income 40,000 35,000 9,000 29,750 14,000 24,500 12,000 50,000 30,000Net Tnco:.e 24,168 17,740 1,992 15,080 6,935 12,180 6,373 38,075 19,878
RaisinsYield (Year 8) Tons 1.25 1.25 0.5Price/Ton (Farmgate) 35,000 30,000 20,000Gross Revenue 43,750 37,500 10,000Net Reverrie 27,918 20,240 2,992
E Capitalized development and operating costs for five years, except apples are capitalized for seven years. Value of land is excluded.2 All traditional costs based on data supplied by the Agricultural Bank. Land preparation in the "improved" vineyards and orchards reflects
deep plowing and cost to level./3 Vineyard - 300 cuttings/jerib. Orchards - 50 trees/jerib. Improved orchards refleot the cost for improved trees at 30 Afs. each.
Pomegranates planted from cuttings.4 Improved orchards, 225-275 kilos per year. m;P
One man per 5 jeribs @ 15,000 Afs. per annum. Tractors are not utilized except in initial "land preparation". Hx
Vineyard trained on cement post and wire trellis.Traditional costs include mud wall border @ 50 Afs./meter; Improved orchards have a shrub border.Includes shovels, pruning knives, power sprayers, etc.Improved orchards include packing materials (wooden boxes ) in order to sell direct and achieve higher market prices. Wooden boxcosts: 7 kilo @ 10 Afs., 15 kilo @ 15 Afs.
/10 Reflects accounting, office and other overheads.711 Depreciation rates: 20 years for apricots and pomegranates; 30 years for vineyard; 40 years for apples.
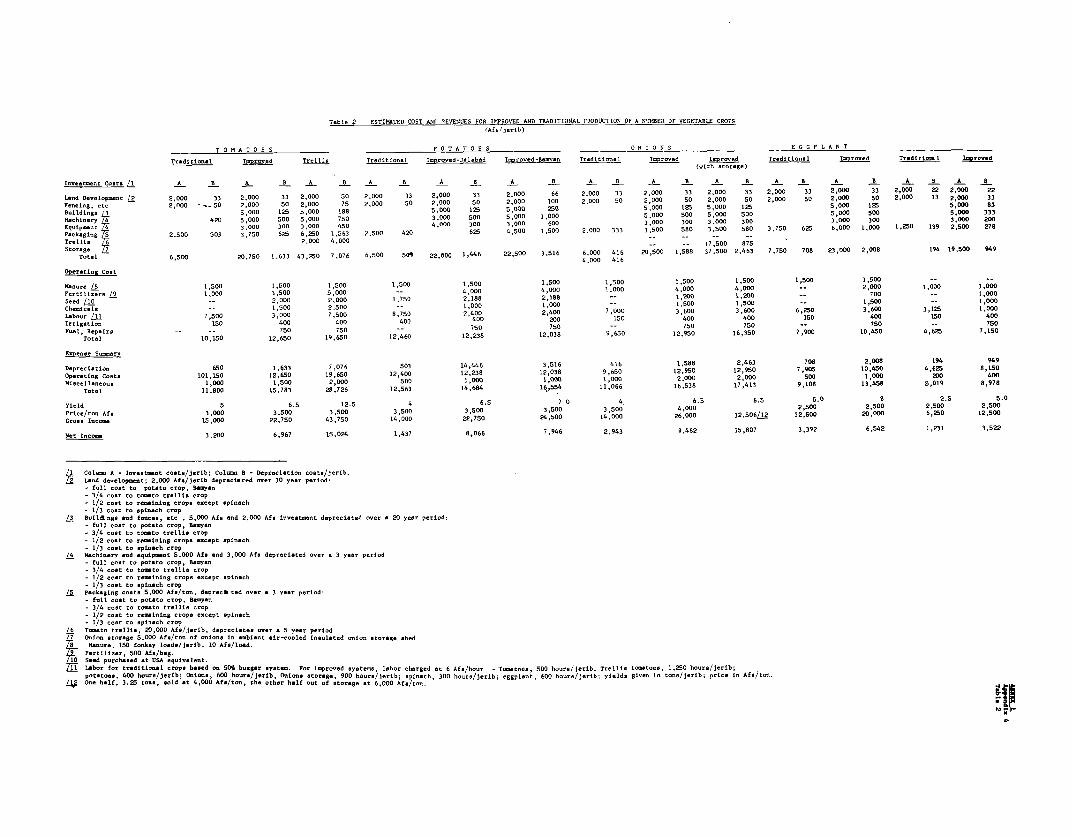
T.blo 2 ESTIMATED COST ANT' REVENUES FOR IROROVEO AND TRLADITIOOAL. PRODUCTION OF A NUMRBER OF VEGETABLE CROPS.(Afo/j-rlb)
TO0M A TOE S PO0T A TOE S O N ION S E G GI'L AN T ________Traditime.l 1morovd Trellis Tr-diti-Ia IoorNvd-J.l.b.d IeFVdONVN T-aditio ... I ced lmprovd Traditional lptrovd T-aditlNN I lm--vd
(.ith strage)
I-.e.tmntNCostBL AI B A B -A -B A B A B A B A B A B A B A B A B A 0 A BLaNd Dne-lpeent 12 2000B 33 0,000 33 2,000 50 2,000 33 0,000 33 2,000 AA 2,000 33 2,000 33 0,000 33 2,000 33 2,000 33 2,000 22 2,000 22FeONINO, eON ~~~~2,nDO ~D ,0 0 200 7 ,0 0 200 D .0 100 2.000 50 2,000 50 2,000 Do 2,000 DO 2,000 50 2,000 33 2,000 33Bonidigs t~ - 0. P000 000 5,007S 2,INN 05,000 ,00 0 00 00 ,002,000 00 0 ,000 125 0,000 83Mahoey4 40 5,000 NOR 0,00 7I0 3.000 150 5,000 1,00 50.00 100 0,000 DOD 5,000 So 50 ,ODO 333Kq.!.ip.neg44 420 3,0 300 3,0000 0 00000 00 3,00 AO 3000 3000 3.0000 300 3,000 300 3,000 200POkSn 1OO 0 ,5 0 ,0 .6 .0 0 0 4,500 1,500 0.0 3 300 00 3.500 580 3.750 625 6,080 0,000 1.000 139 2.500 278Trelis L. 2000 53.00 2 6 0 4.320004062 - - -- -STorag00 4 D -- -- 10,500 875
lot. 6,5000 200750 1,633 43.050 7,076 6,500 509 22,000 1,446 22,500 3,516 6,000 416 00,5000 150 3,0D4A 770 70 2,00 ,0894 950 994.000 4lAOoon.tieg Cost
INso.. -/0 1505 00 00 1000001001,000 1,500 1,100 0,500 0,000 1,000 -- -ForElSIsere /9 1000 3,~~~~~~~~~1:00 0,000 .-50 4000 4,000 I'.000 4,000 4,000 -- 2,000 10003,0S..d /10 -- 2,0DO 2,000 1,750 2,100 2,000 - 1,200 15,00 -- 7,00 -- 1,000Che,ol.le - 1,50 250-- 1,000 ,0 -10 1 1,00 3 ,600 -- 1,0L. r ll7,003,0 7,500 8,750 2, 400 2,400 7,000 3,600 3,600 6,25 360 3,025 1,000Ircb- /io 70SO 43 00 0 47, 00 4010 000 110 400 400 100 400 150 400Fool, Rpirs -- 750 700 700 750 -- 7500 7050 -- 750 -- 750F NESI 00,0-- 50 7260 1.50 1246 12,20 12038 9,650 12,950 16,350 7,900 10,650 4625 7,150ENP.... S,ary
D.precl.tOon 650 1,633 7,076 503 04,446 3,506 416 1,080 2,463 708 2,008 194 949OperatiNg Costs 101,050 12.650 ~~~~~~~~~19,50024O 12,38 12,038 9,650 12.900 12,900 7,905 10,450 4,625 8,150Mlecellaceoc 1,000 1,00 2,000 5L0 ,000 0,000 5,000 2,000 200 500 0,000 200 400TOR1 11.800 15.783 28.726 02,063 04,684 06,5411066 16,538 7,413 9,08 13,658 5,019 8,978YIeld 0 ~~~~ ~~~~~~~~~~~~~~6.5 12.5 4 6,5 704 6.5 6.0 0.0 B 2.5 5.0Yrice/too Af. 3,000 3.500 3,000 3,500 3,50 3,500 ,0 ,0 ,0 ,0 .0 ,0Ero.. LotoNe 15,000 22,750 43,700 14,000 20,000 24,000 14,000 26,000 32,506/12 1,0 0006001,0
Net loc- 3,200 6,967 150.04 1,437 8,066 7,946 2,943 9,462 15,807 3,392 6,042 1,231 3,522
~ 1 Col- A - Nnetssee co-te/jerib; Col1oe B D Bpo'ei.tioo -ot./j-ib.2 lAd deelop-et; 2,000 Afs/J.cib d.p-cia rd o-e 30 y-S priod-
-foOl Ico.t to potato crp, BanYan-3/4 coo c tto t0500. crp
1 /2 cot to rsiaieg crpB -Opt *pi ...h1 /3 coBt to spi ..o orop
/3 Noildng. Sod f...... et. , 0,000 Af. Sod 2,000 Af. Ei.-t-st depretosted o Io 2 0 year period-Rol ROSt to potato crop, S.W..-3/4 Roo:t to. tofto t-llis crop
1 /2ot to -OOiBi.g erops eeoept opin...b1 /3cot to epio.ch crop
/4 Vth0leey Sod sqipinet 5,000 Af. Sod 3,000 ARe depreciated oe 3 yea period-foil cost to potto crop, Bao.Yan*3/4 cost to to-sto trellis crp
I/ /2 cos t to roriei.g crops excePt epin...b-1/3 coat to spioScA croj~PohkNieg .. ts 5,000 Af0./too, deprnck ted ors3 Year perIod-fo1l cos t to pot.to crp, B.xy.n
4 / ot to t eto trllis crp-/2 cot to . .iEgco ecp poc-1/3 c..t to spin..ch crp/r6T_eto trellis, 00,000 Af./j.rib, dep-ei.tes ove I 5 year period
7 OI-o s.cego 5,000 Af./too of ooioos Ln .,,bi.t Sic-eoolnd iBSol.t.d ovion a1crgo shed..or, 0 dookey 1ads/jerib, 00 Af./Ooad.
/,, etilisor, 500 ARs/bag.S.QOed p-rh .. d It 000 sqoi-olst.
/ Iobor Ror tradities1 crops b ...d -n 500,% Icgo sysl ,Fo ioprovd systee, labor hS.eg,d It 6 Af5/oorh To-0os, 000 h-.r/ierib, Trellis t-etoe,100hoaIrbpot.tos, 400 h-or/iscib; OniSoS 600 Sor/jrb, tZb_o StOtags, 900 hoore/jrthb; spinach, 300 h. ro/3sib; .9gpIS.t, 600 h..re/j.rib; yi.1de gIIe Ic oo/jocib; price Jc ARe/too/02 he .10, 3.00 toes, soldIst 4,000 Afq/to, ich. other 5.00 oct oR storage st 6,000 ARe/to.- .Si
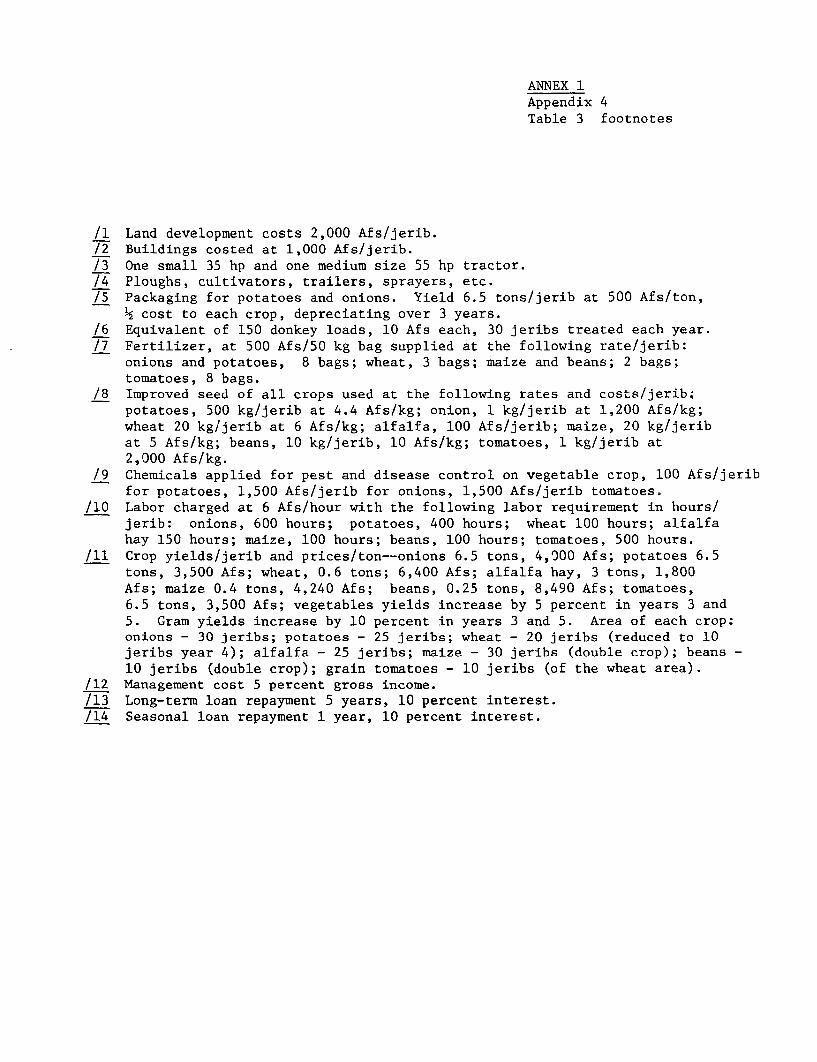
ANNEX 1Appendix 4Table 3 footnotes
/1 Land development costs 2,000 Afs/jerib./2 Buildings costed at 1,000 Afs/jerib./3 One small 35 hp and one medium size 55 hp tractor./4 Ploughs, cultivators, trailers, sprayers, etc./5 Packaging for potatoes and onions. Yield 6.5 tons/jerib at 500 Afs/ton,
½ cost to each crop, depreciating over 3 years./6 Equivalent of 150 donkey loads, 10 Afs each, 30 jeribs treated each year./7 Fertilizer, at 500 Afs/50 kg bag supplied at the following rate/jerib:
onions and potatoes, 8 bags; wheat, 3 bags; maize and beans; 2 bags;tomatoes, 8 bags.
/8 Improved seed of all crops used at the following rates and costs/jerib;potatoes, 500 kg/jerib at 4.4 Afs/kg; onion, 1 kg/jerib at 1,200 Afs/kg;wheat 20 kg/jerib at 6 Afs/kg; alfalfa, 100 Afs/jerib; maize, 20 kg/jeribat 5 Afs/kg; beans, 10 kg/jerib, 10 Afs/kg; tomatoes, 1 kg/jerib at2,000 Afs/kg.
/9 Chemicals applied for pest and disease control on vegetable crop, 100 Afs/jeribfor potatoes, 1,500 Afs/jerib for onions, 1,500 Afs/jerib tomatoes.
/10 Labor charged at 6 Afs/hour with the following labor requirement in hours/jerib: onions, 600 hours; potatoes, 400 hours; wheat 100 hours; alfalfahay 150 hours; maize, 100 hours; beans, 100 hours; tomatoes, 500 hours.
/11 Crop yields/jerib and prices/ton--onions 6.5 tons, 4,000 Afs; potatoes 6.5tons, 3,500 Afs; wheat, 0.6 tons; 6,400 Afs; alfalfa hay, 3 tons, 1,800Afs; maize 0.4 tons, 4,240 Afs; beans, 0.25 tons, 8,490 Afs; tomatoes,6.5 tons, 3,500 Afs; vegetables yields increase by 5 percent in years 3 and5. Gram yields increase by 10 percent in years 3 and 5. Area of each crop:onions - 30 jeribs; potatoes - 25 jeribs; wheat - 20 jeribs (reduced to 10jeribs year 4); alfalfa - 25 jeribs; maize - 30 jeribs (double crop); beans -
10 jeribs (double crop); grain tomatoes - 10 jeribs (of the wheat area)./12 Management cost 5 percent gross income./13 Long-term loan repayment 5 years, 10 percent interest./14 Seasonal loan repayment 1 year, 10 percent interest.
ANNEX 1Appendix 5Page 1
HORTICULTURAL CROP HUSBANDRY ANDCROP VARIETIES IN AFGHANISTAN
Some details of current general crop husbandry practices are givenin Tables 1-6. The number of vegetable varieties used in Afghanistan is verylimited; most of them are of local origin and are poor yielders with low qual-ity. Seed stocks must be improved and the only reasonable way to do this ini-tially is to purchase them from abroad and eventually arrange for their multi-plication in Afghanistan. Fl hybrids, even though they represent excellentvarieties, should be avoided in view of their cost and unsuitability formultiplication by the farmer. However, in vine production, a large number ofexcellent grape varieties have been recognized and their value appreciated bythe grower (Table 2). A large number of apple varieties have been listed inAfghanistan (Table 3), although present day plantings are practically entirelyDelicious types on native rootstocks. Recommendations for vegetable cropsgeneral indicate a high seed rate and fairly close plant spacing. Tree fruitplants on the other hand are fairly widely spaced (Table 5). Production ofsome of these, e.g. apples and pomegranates especially, could be hastened byincreasing plant density at planting and decreasing it as the individual treesize increased. Higher yields, especially in the earlier years of a orchard'slife, could be increased in this way.
Details on medicinal herbs available in Afghanistan are given inTable 6.
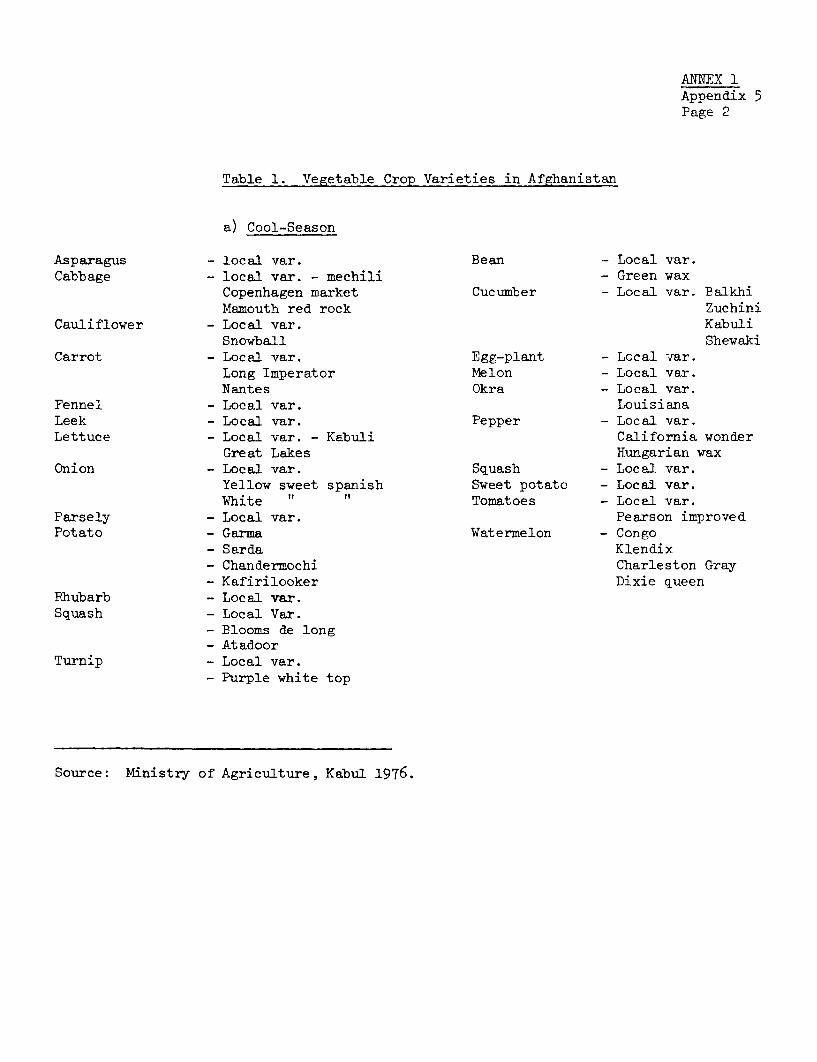
ANNEX 1Appendix 5Page 2
Table 1. Vegetable Crop Varieties in Afghanistan
a) Cool-Season
Asparagus - local var. Bean Local var.Cabbage - local var. - mechili Green wax
Copenhagen market Cucumber Local var. BalkhiMamouth red rock Zuchini
Cauliflower - Local var. KabuliSnowball Shewaki
Carrot - Local var. Egg-plant - Local var.Long Imperator Melon - Local var.Nantes Okra - Local var.
Fennel - Local var. LouisianaLeek - Local var. Pepper - Local var.Lettuce - Local var. - Kabuli California wonder
Great Lakes Hungarian waxOnion - Local var. Squash - Local var.
Yellow sweet spanish Sweet potato - Local var.White " " Tomatoes - Local var.
Parsely - Local var. Pearson improvedPotato - Garma Watermelon - Congo
- Sarda Klendix- Chandermochi Charleston Gray- Kafirilooker Dixie queen
Rhubarb - Local var.Squash - Local Var.
- Blooms de long- Atadoor
Turnip - Local var.- Purple white top
Source: Ministry of Agriculture, Kabul 1976.
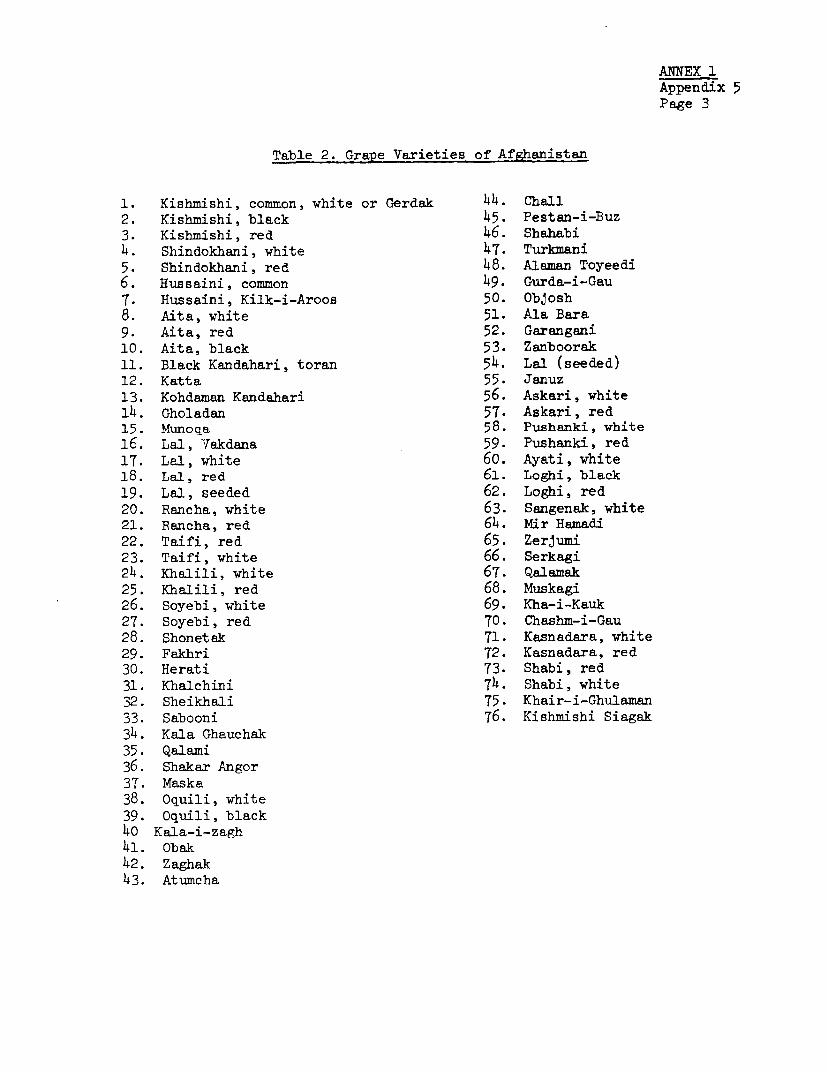
ANNEX 1Appendix 5Page 3
Table 2. Grape Varieties of Afghanistan
1. Kishmishi, common, white or Gerdak 44. Chall2. Kishmishi, black 45. Pestan-i-Buz3. Kishmishi, red 46. Shahabi4. Shindokhani, white 47. Turkmani5. Shindokhani, red 48. Alamnan Toyeedi6. Hussaini, common 49. Gurda-i-Gau7. Hussaini, Kilk-i-Aroos 50. Objosh8. Aita, white 51. Ala Bara9. Aita, red 52. Garangani10. Aita, black 53. Zanboorak11. Black Kandahari, toran 54. Lal (seeded)12. Katta 55. Januz13. Kohdamnan Kandahari 56. Askari, white14. Gholadan 57. Askari, red15. Munoqa 58. Pushanki, white16. Lal, Vakdana 59. Pushanki, red17. Lal, white 60. Ayati, white18. Lal, red 61. Loghi, black19. Lal, seeded 62. Loghi, red20. Rancha, white 63. Sangenak, white21. Rancha, red 64. Mir Hamadi22. Taifi, red 65. Zerjumi23. Taifi, white 66. Serkagi24. Khalili, white 67. Qalama.k25. Khalili, red 68. Muskagi26. Soyebi, white 69. Kha-i-Kauk27. Soyebi, red 70. Chashm-i-Gau28. Shonetak 71. Kasnadara, white29. Fakhri 72. Kasnadara, red30. Herati 73. Shabi, red31. Khalchini 74. Shabi, white32. Sheikhali 75. Khair-i-Ghulaman33. Sabooni 76. Kishmishi Siagak34. Kala Ghauchak35. Qalami36. Shakar Angor37. Maska38. Oquili, white39. Oquili, black40 Kala-i-zagh41. Obak42. Zaghak43. Atumcha
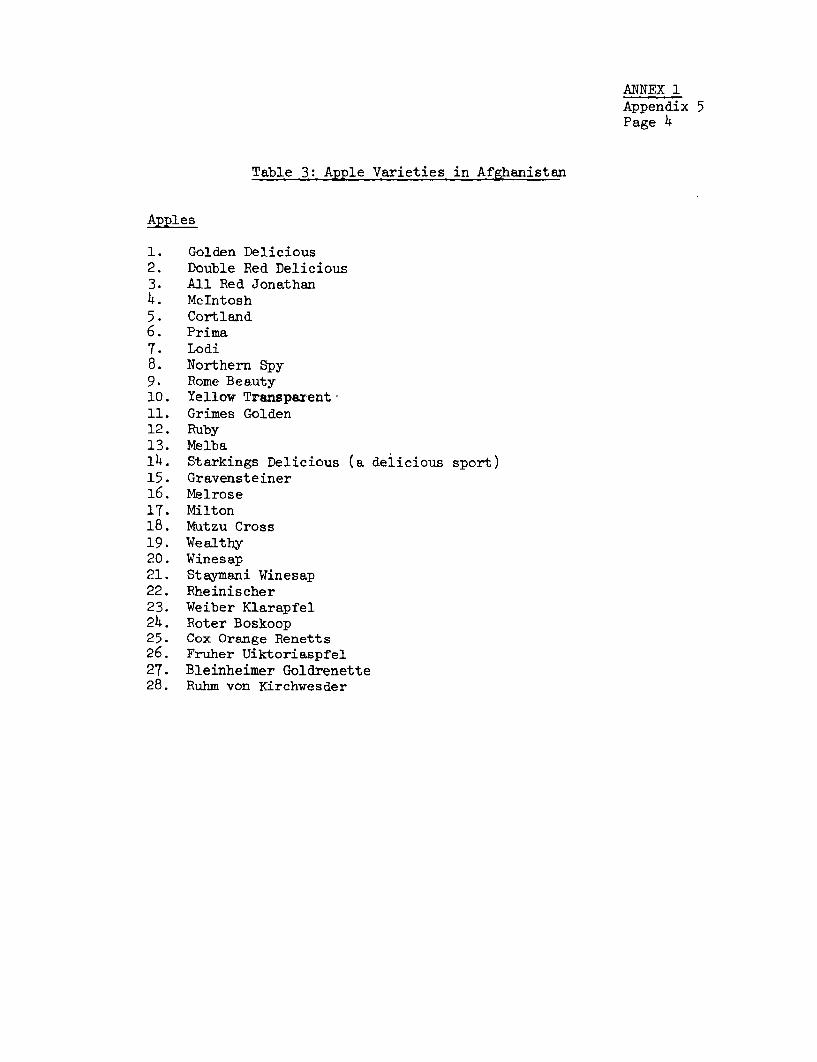
ANNEX 1Appendix 5Page 4
Table 3: Apple Varieties in Afghanistan
Apples
1. Golden Delicious2. Double Red Delicious3. All Red Jonathan4. McIntosh5. Cortland6. Prima7. Lodi8. Northern Spy9. Rome Beauty10. Yellow Transparent11. Grimes Golden12. Ruby13. Melba14. Starkings Delicious (a delicious sport)15. Gravensteiner16. Melrose17. Milton18. Mutzu Cross19. Wealthy20. Winesap21. Staymani Winesap22. Rheinischer23. Weiber Klarapfel24. Roter Boskoop25. Cox Orange Renetts26. Fruher Uiktoriaspfel27. Bleinheimer Goldrenette28. Ruhm von Kirchwesder
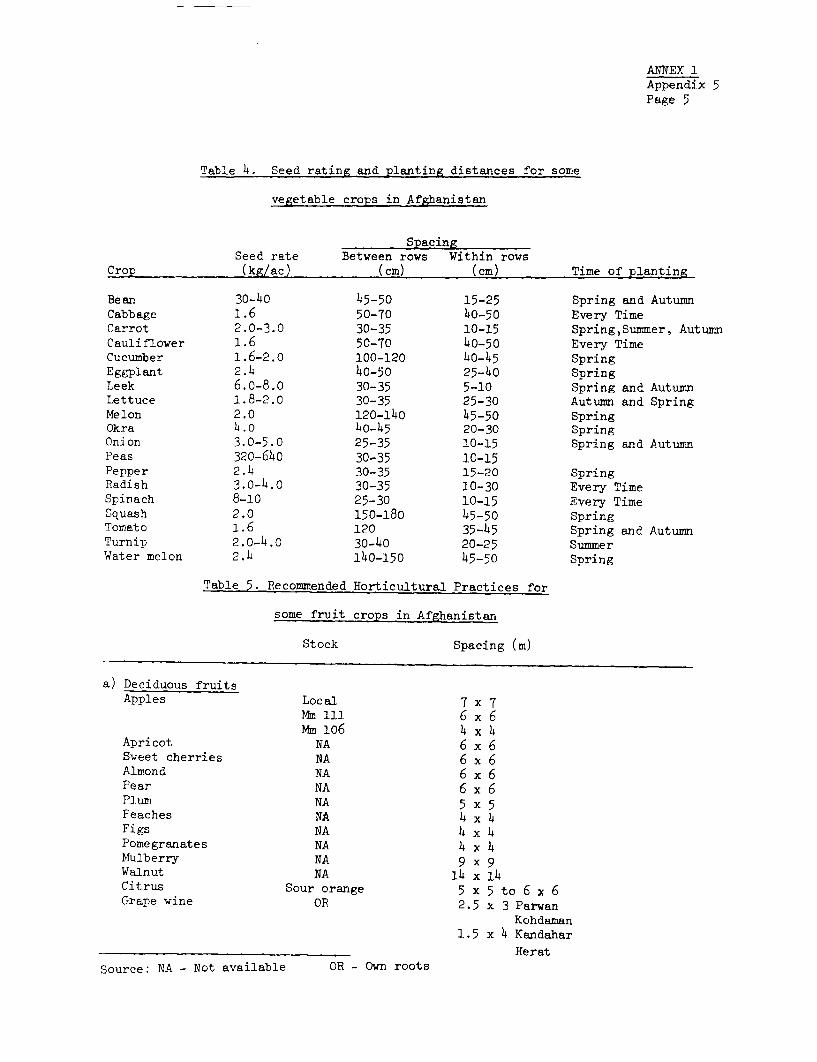
ANNEX 1Appendix 5Page 5
Table 4. Seed rating and planting distances for some
vegetable crops in Afghanistan
SpacingSeed rate Between rows Within rows
Crop -(kg/ac) (cm) (cm) Time of planting
Bean 30-40 45-50 15-25 Spring and AutumnCabbage 1.6 50-70 40-50 Every TimeCarrot 2.0-3.0 30-35 10-15 Spring,Summer, AutumnCauliflower 1.6 50-70 40-50 Every TimeCucumber 1.6-2.0 100-120 40-45 SpringEggplant 2.4 40-50 25-40 SpringLeek 6.o-8.o 30-35 5-10 Spring and AutumnLettuce 1.8-2.0 30-35 25-30 Autumn and SpringMelon 2.0 120-140 45-50 SpringOkra 4.O 40-45 20-30 SpringOnion 3.0-5.0 25-35 10-15 Spring and AutumnPeas 320-640 30-35 10-15Pepper 2.4 30-35 15-20 SpringRadish 3.0-4.0 30-35 10-30 Every TimeSpinach 8-10 25-30 10-15 Every TimeSquash 2.0 150-180 45-50 SpringTomato 1.6 120 35-45 Spring and AutumnTurnip 2.0-4.0 30-40 20-25 SummerWater melon 2.4 140-150 45-50 Spring
Table 5. Recommended Horticultural Practices for
some fruit crops in Afghanistan
Stock Spacing (m)
a) Deciduous fruitsApples Local 7 x 7
Mm l11 6 x 6Mm 106 4 x 4
Apricot NA 6 x 6Sweet cherries NA 6 x 6Almond NA 6 x 6Pear NA 6 x 6Plum NA 5 x 5Peaches NA 4 x 4Figs NA 4 x 4Pomegranates NA 4 x 4Mulberry NA 9 x 9Walnut NA 14 x 14Citrus Sour orange 5 x 5 to 6 x 6Grape wine OR 2.5 x 3 Parwan
Kohdaman1.5 x 4 Kandahar
Herat
Source: NA - Not available OR - Own roots
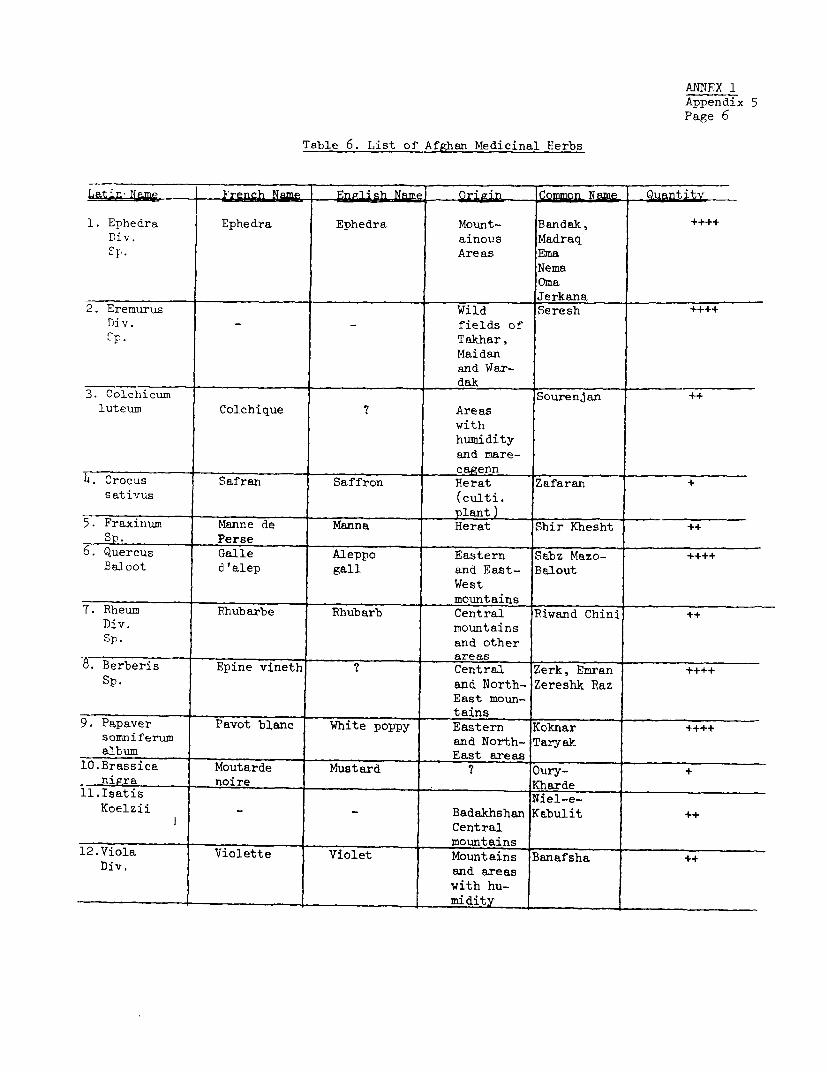
ANMTEX 1Appendix 5Page 6
Table 6. List of Afghan Medicinal Herbs
nampr game O in CommonNae uantity
1. Ephedra Ephedra Ephedra Mount- Bandak, ....Div. ainous MadraqST. Areas Ema
Nema
OmnaJerkana
2. Eremurus Wild SereshDiv. fields of
Takhar,Maidanand War-dak
3. Colchicum SourenJan ++luteum Colchique ? Areas
withhumidityand mare-cagenn n_ .
4. Crocus Safran Saffron Herat Zafaran +sativus (culti.
_______ ______ p lan t)_ _ _ _ _ __ _ _ _ _ _
5. Fraxinum Manne de Manna Herat Shir KheshtSP. Perse
6. Quercus Galle Aleppo Eastern Sabz Mazo- ....Baloot d'alep gall and East- Balout
Westmountains _
7. Rheum Rhubarbe Rhubarb Central Riwand Chini t+Div. mountainsSp. and other
____ ____ ____ ___ a re as _ _ _ _ _ _ _ _ _ _ _
8. Berberis Epine vineth ? Central Zerk, Emran ....Sp. and North- Zereshk Raz
East moun-_______________ ~tains
9. Papaver Pavot blanc White poppy Eastern Koknarsomniferum and North- Taryakalbum East areas _
lO.Brassica Moutarde Mustard ? Oury- +nizra noire Kharde _
11.Isatis Niel-e-
Koelzii Badakhshan Kabulit ++Central
mountains12.Viola Violette Violet Mountains Bannafsha ++
Div. and areas
with hu-_ _ _ ~~~~~~~midity __ ____ ________
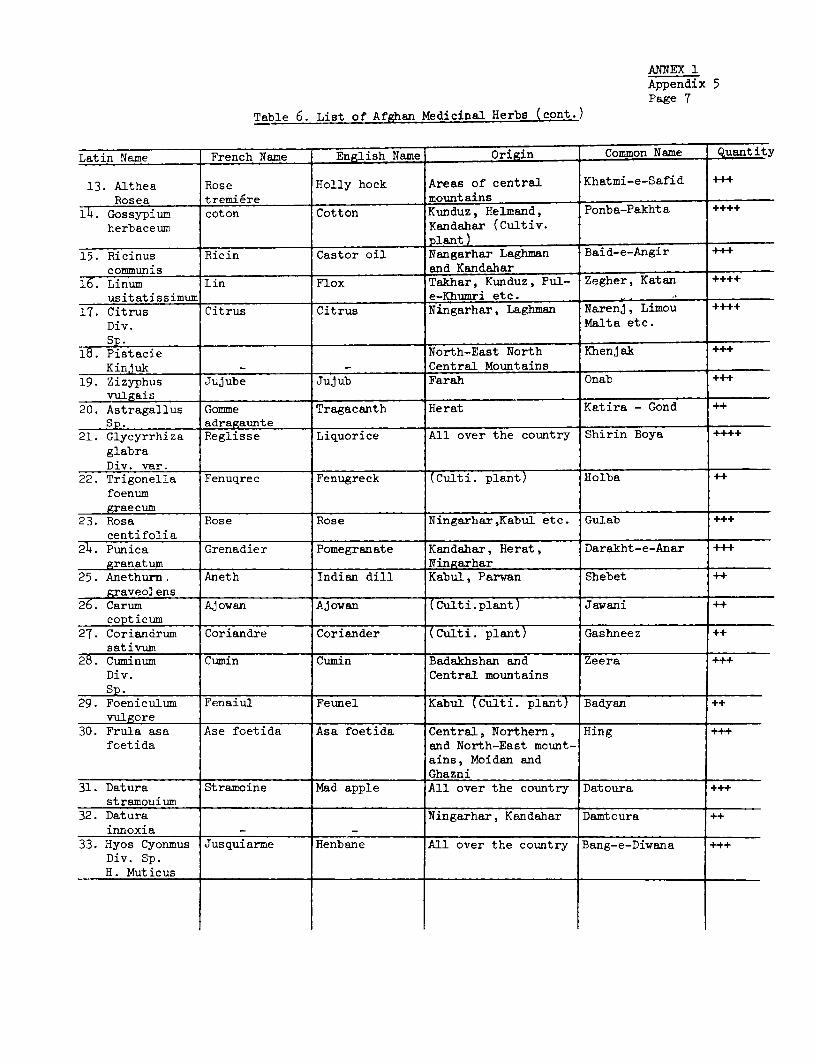
ANNEX 1Appendix 5Page 7
Table 6. List of Afghan Medicinal Herbs (cont.)
Latin Name French Name English Name Origin Common Name Quantity
13. Althea Rose Holly hock Areas of central Khatmi-e-Safid ..Rosea tremiere mountains
14. Gossypium coton Cotton Kunduz, Helmand, Ponba-Pakhta +..+herbaceum Kandahar (Cultiv.
plant)15. Ricinus Ricin Castor oil Nangarhar Laghman Baid-e-Angir ..
communis and Kandahar16. Linum Lin Flox Takhar, Kunduz, Pul- Zegher, Katan ....
usitatissimum e-Khumri etc.17. Citrus Citrus Citrus Ningarhar, Laghman NarenJ, Limou +..+
Div. Malta etc.SP.
18. Pistacie North-East North Khenjak ..Kinjuk _ _ Central Mountains
19. Zizyphus Jujube Jujub Farah Onab ww
vulgais20. Astragallus Gomme Tragacanth Herat Katira - Gond ++
Sp. adragaunte21. Glycyrrhiza Reglisse Liquorice All over the country Shirin Boya +4w+
glabraDiv. var.
22. Trigonella Fenuqrec Fenugreck (Culti. plant) Holba w4foenumgraecum
23. Rosa Rose Rose Ningarhar,Kabul etc. Gulab ..centifolia
24. Punica Grenadier Pomegranate Kandahar, Herat, Darakht-e-Anar +.w
granatum Ninearhar25. Anethurn. Aneth Indian dill Kabul, Parwan Shebet w4
graveolens_26. Carum Ajowan Ajowan (Culti.plant) Jawani ++
copticum27. Coriandrum Coriandre Coriander (Culti. plant) Gashneez ++
sativum28. Cuminum Cumin Cumin Badakhshan and Zeera ...
Div. Central mountainsSp .
29. Foeniculum Fenaiul Feunel Kabul (Culti. plant) Badyan ++vul gore__ _ _ _ _ _ _ _ _ _ _ _ _ _ _ _ _ _ _
30. Frula asa Ase foetida Asa foetida Central, Northern, Hing +4wfoetida and North-East mount-
ains, Moidan and__________________ ________________ G h a zn i31. Datura Stramoine Mad apple All over the country Datoura +++
stramouium32. Datura Ningarhar, Kandahar Dantoura ++
innoxia _33. Hyos Cyonmus Jusquiarme Henbane All over the country Bang-e-Diwana ...
Div. Sp.H. Muticus
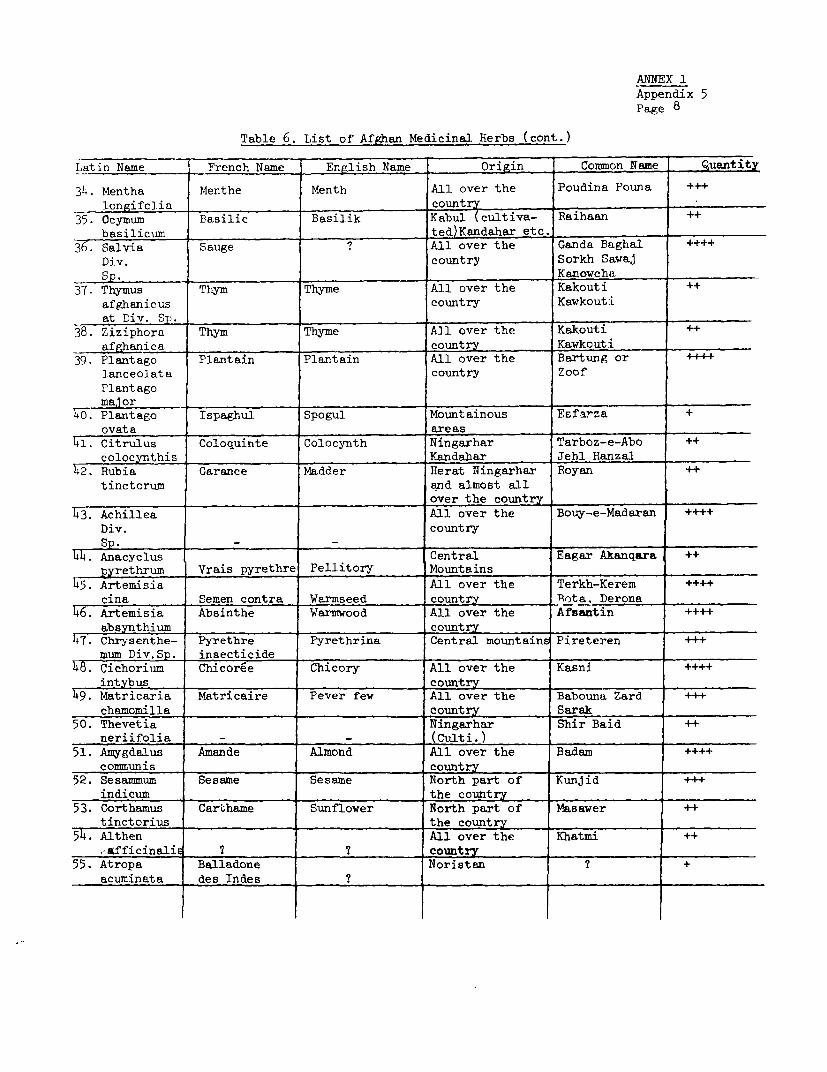
ANNEX 1Appendix 5Page 8
Table 6. List of Afghan Medicinal Herbs (cont.)
Latin Name French Name English Name Origin Common Name Quantity
34. Mentha Menthe Menth All over the Poudina Pouna +++longifolia count a_
35. Ocymum Basilic Basilik Kabul (cultiva- Raihaan ++basilicum ted)Kandahar etc.
36. Salvia Sauge ? All over the Ganda Baghal ++Div. country Sorkh SawajSp. Kanowcha
37. Thymus Thym Thyme All over the Kakouti ++afghanicus country Kawkoutiat Div. Sp.
38. Ziziphora Thym Thyme All over the Kakouti ++afghanica _ country Kawkouti _
39. Plantago Plantain Plantain All over the Bartung orlanceolata country ZoofPlantagomajor
40. Plantago Ispaghul Spogul Mountainous Esfa-za +ovata areas
1. Citrulus Coloquinte Colocynth Ningarhar Tarboz-e-Abo ++colocynthis Kandahar Jehl Hanzal
42. Rubia Garance Madder Herat Ningarhar Boyan ++tinctorum and almost all
over the country _
43. Achillea All over the Bouy-e-Madaran ++++Div. country
s.4.AnacYclus Central Eagar Akanqara ++
pyrethrum Vrais pyrethre Pellitory Mountains45. Artemisia All over the Terkh-Kerem +.+.
cina Semen contra Warmseed country 'Rota. Derona46. Artemisia Absinthe Warxmwood All over the Afsantin ....
absynthium country47. Chrysenthe- Pyrethre Pyrethrina Central mountain Pireteren +++
mum Div.Sp. insecticide48. Cichorium Chicoree Chicory All over the Kasni .+.+
intybus c__ ountry_49. Matricaria Matricaire Pever few All over the Babouna Zard +++
chamomilla country Sarak50. Thevetia Ningarhar Shir Baid ++
neriifolia _ _ (Culti.)51. Amygdalus Amande Almond All over the Badam ....
communis country52. Sesammum Sesame Sesame North part of Kunjid +.+
indicum_ the country53. Corthamus CarLhame Sunflower North part of Masawer ++
tinctorius the country54. Althen All over the Khatmi ++
a-fficinaliE ?_? country55. Atropa Balladone Noristan 7 +
acuminata des Indes 7.
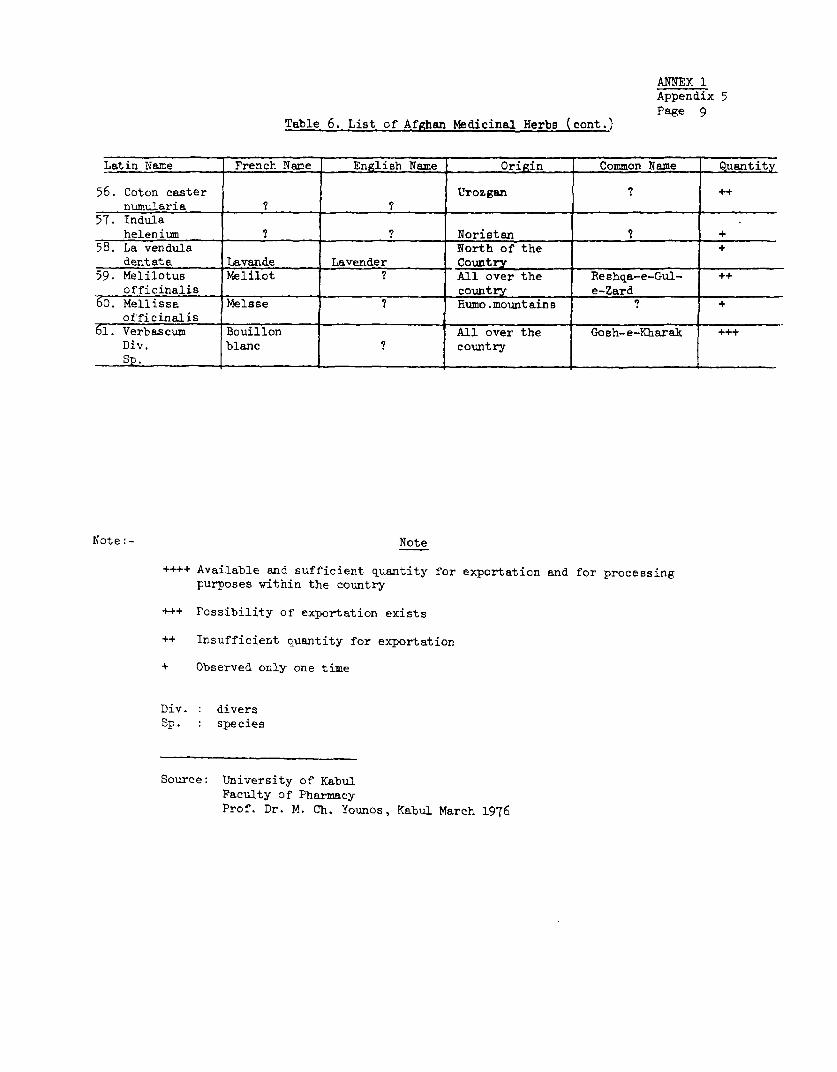
ANNEX 1Appendix 5Page 9
Table 6. List of Afghan Medicinal Herbs (cont.)
Latin Name French Name English Name Origin Common Name Quantity
56. Coton caster Urozgan ? ++
numularia ? _ ?57. Indula
helenium ? ? Noristan ? +58. La vendula North of the +
dentate. Lavande Lavender Country59. Melilotus Melilot ? All over the Reshqa-e-Gul- ++
officinalis country e-Zard
60. Mellissa Melsse ? Humo.mountains ? +
officinalis61. Verbascum Bouillon All over the Gosh-e-Kharak ...
Div. blanc _ country
Note:- Note
++++ Available and sufficient quantity for exportation and for processingpurposes within the country
+++ Fossibility of exportation exists
++ Insufficient quantity for exportation
+ Observed only one time
Div. : diversSp. species
Source: University of KabulFaculty of PharmacyProf. Dr. M. Ch. Younos, Kabul March 1976
ANNEX 1Appendix 6Page 1
DETAILED CLIMATIC DATA FOR SOME AREAS IN AFGHANISTAN
Table 1 - South Salang
Table 2 - Ghazni
Table 3 - Herat
Table 4 - Kabul
Table 5 - Jabul Seraj
Table 6 - Lashgargah
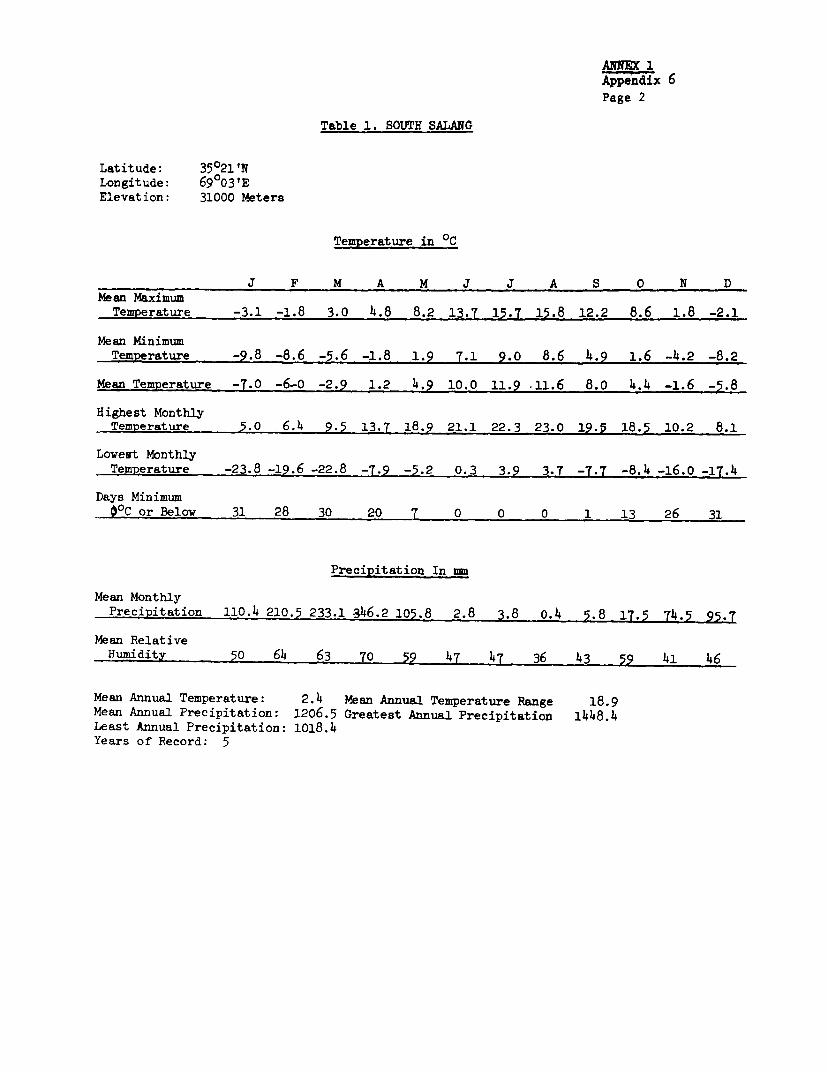
ANX 1Appeinix 6Page 2
Table 1. SOUTH SALANG
Latitude: 35021'NLongitude: 6903 OEElevation: 31000 Meters
Temperature in OC
J F M A M J J A S 0 N DMean Maximum
Temperature -3.1 -1.8 3.0 4.8 8.2 13.7 15.7 15.8 12.2 8.6 1.8 -2.1
Mean MinimumTemperature -9.8 -8.6 -5.6 -1.8 1.9 7.1 9.0 8.6 4.9 1.6 -4.2 -8.2
Mean Temperature -7.0 -6-o -2.9 1.2 4.9 10.0 11.9 .11.6 8.0 4.4 -1.6 -5.8
Highest MonthlyTemperature 5.0 6.4 9.5 13.7 18.9 21.1 22.3 23.0 19.5 18.5 10.2 8.1
Lowest MonthlyTemperature -23.8 -19.6 -22.8 -7.9 -5.2 0.3 3.9 3.7 -7.7 -8.4 -16.0 -17.4
Days Minimum0°C or Below 31 28 30 20 7 0 0 0 1 13 26 31
Precipitation In mm
Mean MonthlyPrecipitation 110.4 210.5 233.1 346.2 105.8 2.8 3.8 0.4 5.8 17.5 74.5 95.7
Mean RelativeHumidity 50 64 63 70 59 47 47 36 43 59 41 46
Mean Annual Temperature: 2.4 Mean Annual Temperature Range 18.9Mean Annual Precipitation: 1206.5 Greatest Annual Precipitation 1448.4Least Annual Precipitation: 1018.4Years of Record: 5
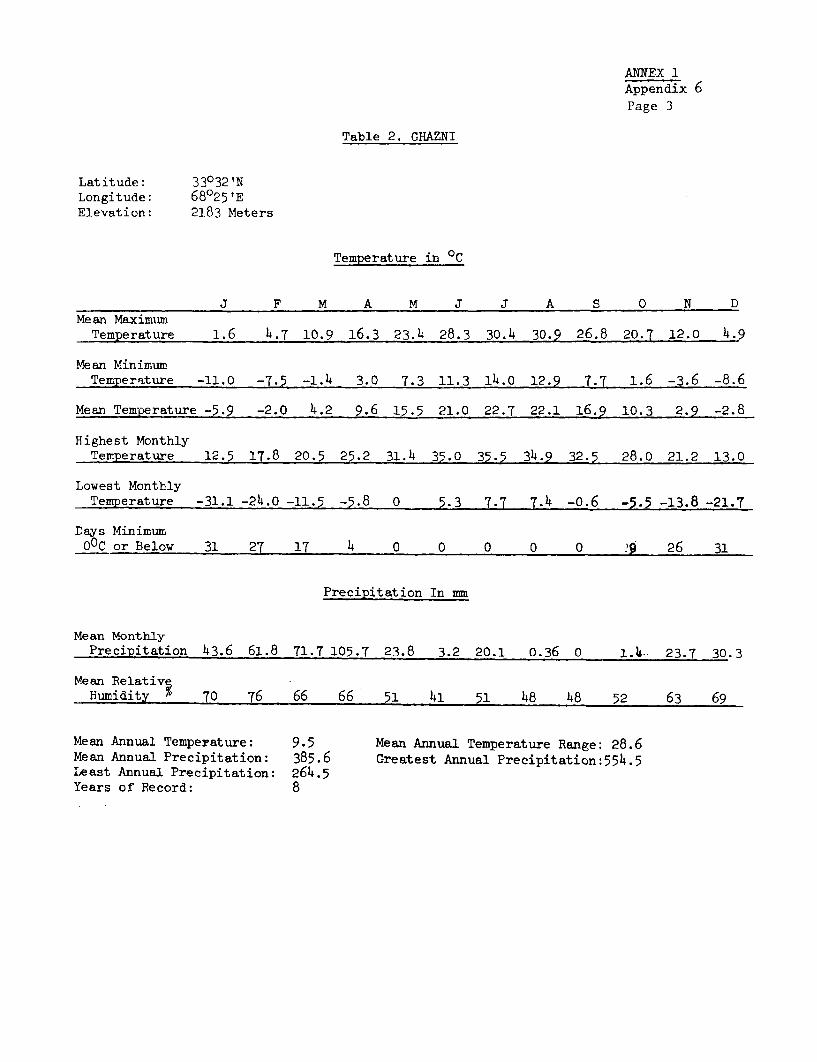
ANNEX 1Appendix 6Page 3
Table 2. GHAZNI
Latitude: 33032'NLongitude: 68025'EElevation: 2183 Meters
Temperature in OC
J F M A M J J A S 0 N DMean MaximumTemperature 1.6 4.7 10.9 16.3 23.4 28.3 30.4 30.9 26.8 20.7 12.0 4.9
Mean MinimumTemperature -11.0 -7.5 -1.4 3.0 7.3 11.3 14.0 12.9 7.7 1.6 -3.6 -8.6
Mean Temperature -5.9 -2.0 4.2 9.6 15.5 21.0 22.7 22.1 16.9 10.3 2.9 -2.8
Highest MonthlyTemperature 12.5 17.8 20.5 25.2 31.4 35.0 35.5 34.9 32.5 28.0 21.2 13.0
Lowest MonthlyTemperature -31.1 -24.0 -11.5 -5.8 0 5.3 7.7 7.4 -0.6 -5.5 -13.8 -21.7
Days Minimum0°C or Below 31 27 17 4 0 0 0 0 0 ?9 26 31
Precipitation In mm
Mean MonthlyPrecipitation 43.6 61.8 71.7 105.7 23.8 3.2 20.1 0.36 0 1.4- 23.7 30.3
Mean RelativeHumidity % 70 76 66 66 51 41 51 48 48 52 63 69
Mean Annual Temperature: 9.5 Mean Annual Temperature Range: 28.6Mean Annual Precipitation: 385.6 Greatest Annual Precipitation:554.5Least Annual Precipitation: 264.5Years of Record: 8
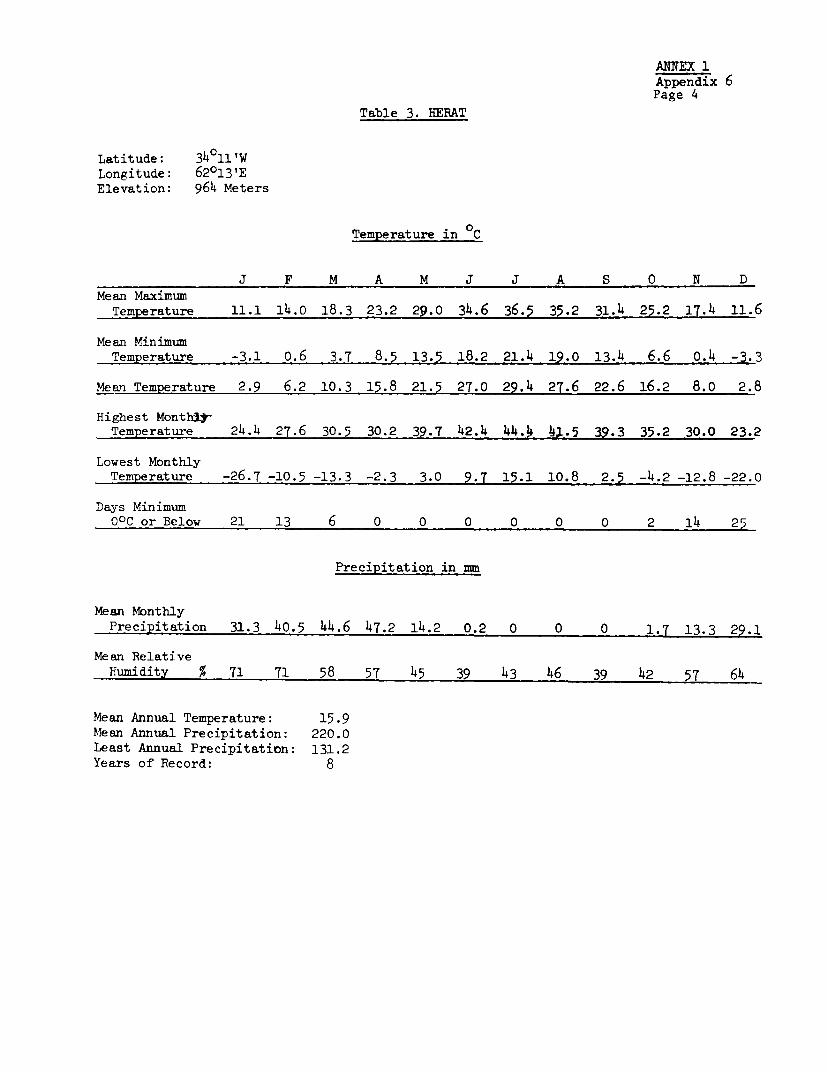
ANNEX 1Appendix 6Page 4
Table 3. HERAT
Latitude: 34011°wLongitude: 62013'EElevation: 964 Meters
Temperature in 0C
J F M A M J J A S 0 N DMean Maximum
Temperature 11.1 14.0 18.3 23.2 29.0 34.6 36.5 35.2 31.4 25.2 17.4 11.6
Mean MinimumTemperature -3.1 o.6 3.7 8.5 13.5 18.2 21.4 19.o 13.4 6.6 o.4 -3.3
Mean Temperature 2.9 6.2 10.3 15.8 21.5 27.0 29.4 27.6 22.6 16.2 8.0 2.8
Highest Month-jrTemperature 24.4 27.6 30.5 30.2 39.7 42.4 44.l 41.5 39.3 35.2 30.0 23.2
Lowest MonthlyTemperature -26.7 -10.5 -13.3 -2.3 3.0 9.7 15.1 10.8 2.5 -4.2 -12.8 -22.0
Days MinimumO0 C or Below 21 13 6 0 0 0 0 0 0 2 14 25
Precipitation in mm
Mean MonthlyPrecipitation 31.3 40.5 44.6 47.2 14.2 0.2 0 0 0 1.7 13.3 29.1
Mean RelativeHumidity % 71 71 58 57 45 39 43 46 39 42 57 64
Mean Annual Temperature: 15.9Mean Annual Precipitation: 220.0Least Annual Precipitation: 131.2Years of Record: 8
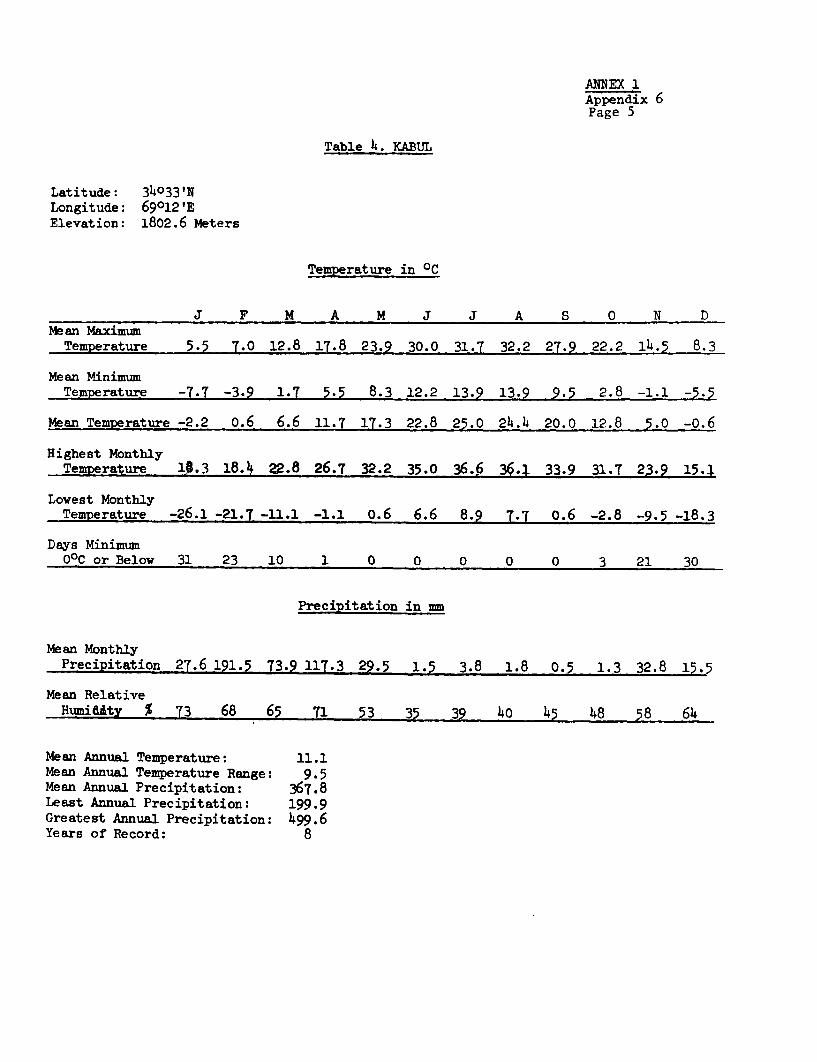
ANNEX 1Appendix 6Page 5
Table 4. KABUL
Latitude: 34033'NLongitude: 69012'EElevation: 1802.6 Meters
Temperature in °C
J F M A M J J A S 0 N DMean MaximumTemperature 5.5 7.0 12.8 17.8 23.9 30.0 31.7 32.2 27.9 22.2 14.5 8.3
Mean MinimumTemperature -7.7 -3.9 1.7 5.5 8.3 12.2 13.9 13.9 9.5 2.8 -1.1 -5.5
Mean Temperature -2.2 o.6 6.6 11.7 17.3 22.8 25.0 24.4 20.0 12.8 5.0 -o.6
Highest MonthlyTemperature 10.3 18.4 22.8 26.7 32.2 35.0 36.6 36.1 33.9 31.7 23.9 15.4
Lowest MonthlyTemperature -26.1 -21.7 -11.1 -1.1 0.6 6.6 8.9 7.7 o.6 -2.8 -9.5 -18.3
Days MinimumO0 C or Below 31 23 10 1 0 0 0 0 0 3 21 30
Precipitation in mm
Mean MonthlyPrecipitation 27.6 191.5 73.9 117.3 29.5 1.5 3.8 1.8 0.5 1.3 32.8 15.5
Mean RelativeHumidity % 73 68 65 71 53 35 39 40 45 48 58 64
Mean Annual Temperature: 11.1Mean Annual Temperature Range: 9.5Mean Annual Precipitation: 367.8Least Annual Precipitation: 199.9Greatest Annual Precipitation: 499.6Years of Record: 8
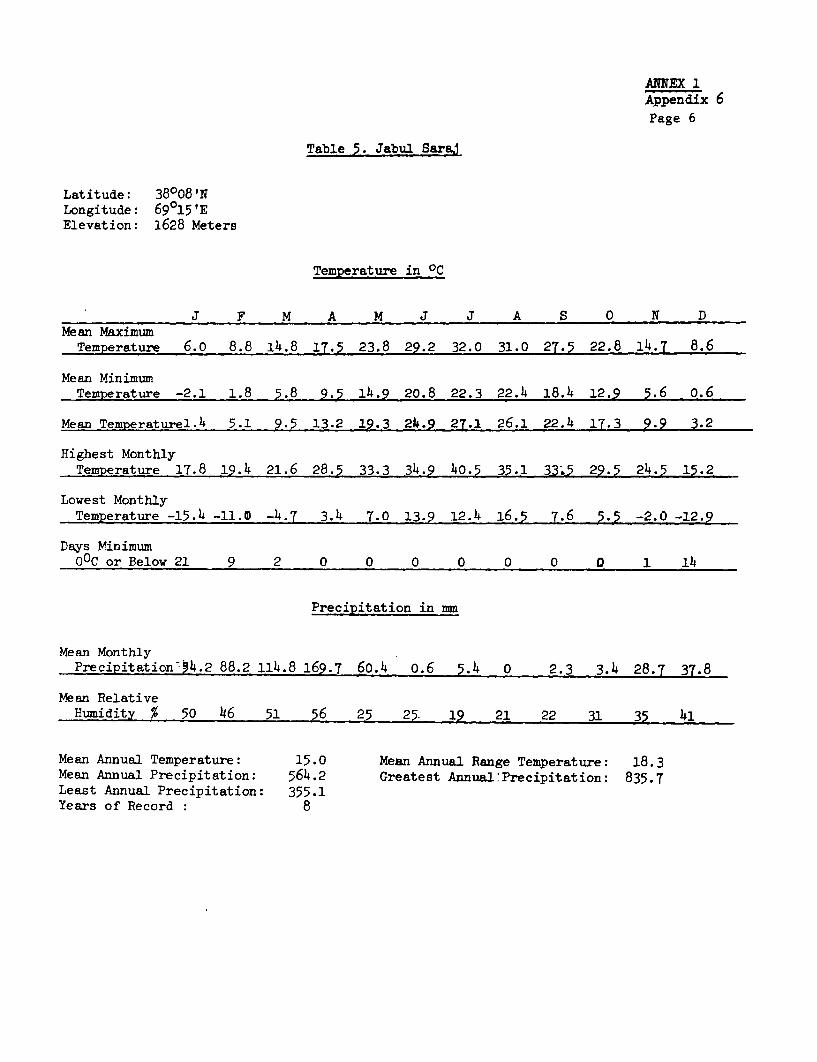
ANNEX 1Appendix 6Page 6
Table 5. Jabul SaraJ
Latitude: 380 08'NLongitude: 69015'EElevation: 1628 Meters
Temperature in OC
J F M A M J J A S 0 N DMean MaximumTemperature 6.0 8.8 14.8 17.5 23.8 29.2 32.0 31.0 27.5 22.8 14.7 8.6
Mean MinimumTemperature -2.1 1.8 5.8 9.5 14.9 20.8 22.3 22.4 18.4 12.9 5.6 o.6
Mean Temperaturel.4 5.1 9.5 13.2 19.3 24.9 2T.1 26.1 22.4 17.3 2 9 3.2
Highest MonthlyTemperature 17.8 19.4 21.6 28.5 33.3 34.9 40.5 35.1 33.5 29.5 24.5 15.2
Lowest MonthlyTemperature -15.4 -11.0 -4.7 3.4 7.0 13.9 12.4 16.5 7.6 5.5 -2.0 -12.9
Days MinimumO0 C or Below 21 9 2 0 0 0 0 0 0 0 1 14
Precipitation in mm
Mean MonthlyPrecipitation754.2 88.2 114.8 169.7 60.4 o.6 5.4 0 2.3 3.4 28.7 37.8
Mean RelativeHumidity % 50 46 51 56 25 25. 19 21 22 31 35 41
Mean Annual Temperature: 15.0 Mean Annual Range Temperature: 18.3Mean Annual Precipitation: 564.2 Greatest Annual'Precipitation: 835.7Least Annual Precipitation: 355.1Years of Record : 8
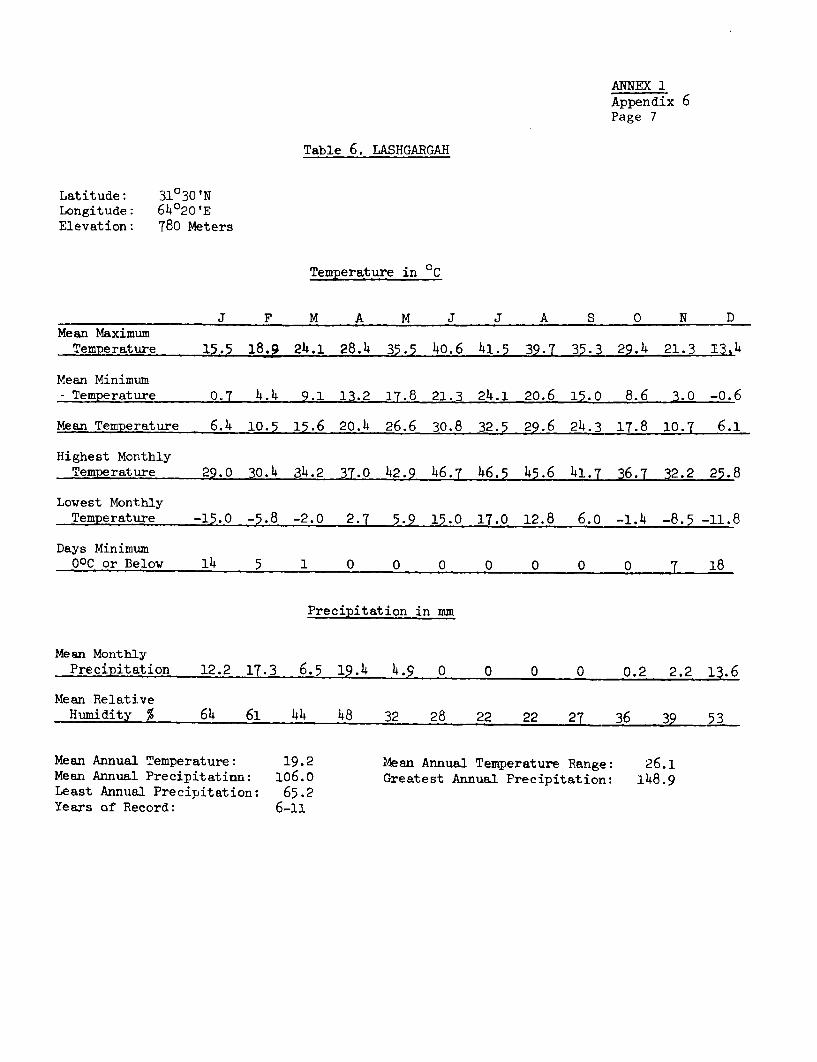
ANNEX 1Appendix 6Page 7
Table 6. LASHGARGAH
Latitude: 31°30'NLongitude: 64020'EElevation: 780 Meters
Temperature in °C
J F M A M J J A S 0 N DMean MaximumTemperature 15.5 18,9 24.1 28.4 35.5 40.6 41.5 39.7 35.3 29.4 21.3 13L4
Mean Minimum- Temperature 0o7 4.4 9.1 13.2 17.8 21.3 24.1 20.6 15.0 8.6 3.0 -o.6
Mean Temperature 6.4 10.5 15.6 20.4 26.6 30.8 32.5 29.6 24.3 17.8 10.7 6.1
Highest MonthlyTemperature 29.0 30.4 34.2 37.0 42.9 46.7 46.5 45.6 41.7 36.7 32.2 25.8
Lowest MonthlyTemperature -15.0 -5.8 -2.0 2.7 5.9 15.0 17.0 12.8 6.o -1.4 -8.5 -11.8
Days MinimumO0 C or Below 14 5 1 0 0 0 0 0 0 0 7 18
Precipitation in mm
Mean MonthlyPrecipitation 12.2 17.3 6.5 19.4 4.9 0 0 0 0 0.2 2.2 13.6
Mean RelativeHumidity % 64 61 44 48 32 28 22 22 27 36 39 53
Mean Annual Temperature: 19.2 Mean Annual Temperature Range: 26.1Mean Annual Precipitatinn: 106.0 Greatest Annual Precipitation: 148.9Least Annual Precipitation: 65.2Years of Record: 6-11
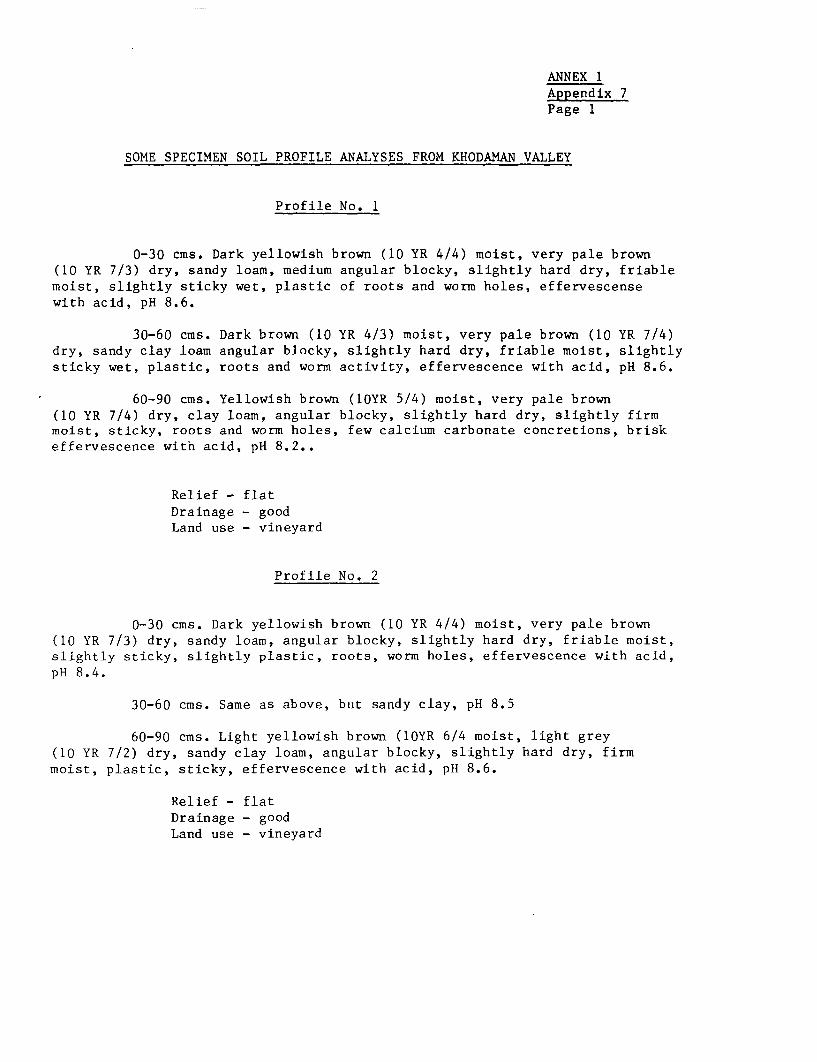
ANNEX 1Appendix 7Page 1
SOME SPECIMEN SOIL PROFILE ANALYSES FROM KHODAMAN VALLEY
Profile No. 1
0-30 cms. Dark yellowish brown (10 YR 4/4) moist, very pale brown(10 YR 7/3) dry, sandy loam, medium angular blocky, slightly hard dry, friablemoist, slightly sticky wet, plastic of roots and worm holes, effervescensewith acid, pH 8.6.
30-60 cms. Dark brown (10 YR 4/3) moist, very pale brown (10 YR 7/4)dry, sandy clay loam angular blocky, slightly hard dry, friable moist, slightlysticky wet, plastic, roots and worm activity, effervescence with acid, pH 8.6.
60-90 cms. Yellowish brown (IOYR 5/4) moist, very pale brown(10 YR 7/4) dry, clay loam, angular blocky, slightly hard dry, slightly firmmoist, sticky, roots and worm holes, few calcium carbonate concretions, briskeffervescence with acid, pH 8.2..
Relief - flat
Drainage - good
Land use - vineyard
Profile No. 2
0-30 cms. Dark yellowish brown (10 YR 4/4) moist, very pale brown(10 YR 7/3) dry, sandy loam, angular blocky, slightly hard dry, friable moist,slightly sticky, slightly plastic, roots, worm holes, effervescence with acid,pH 8.4.
30-60 cms. Same as above, but sandy clay, pH 8.5
60-90 cms. Light yellowish brown (10YR 6/4 moist, light grey(10 YR 7/2) dry, sandy clay loam, angular blocky, slightly hard dry, firmmoist, plastic, sticky, effervescence with acid, pH 8.6.
Relief - flat
Drainage - good
Land use - vineyard
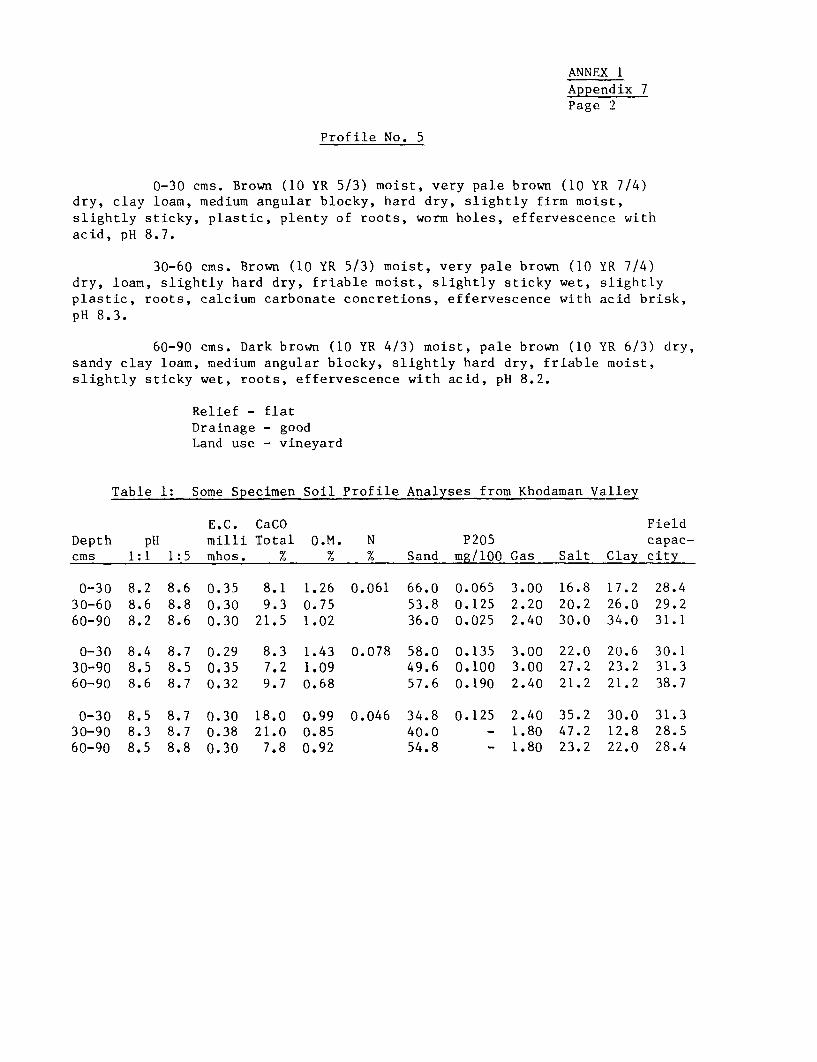
ANNEX 1
Appendix 7Page 2
Profile No. 5
0-30 cms. Brown (10 YR 5/3) moist, very pale brown (10 YR 7/4)dry, clay loam, medium angular blocky, hard dry, slightly firm moist,slightly sticky, plastic, plenty of roots, worm holes, effervescence with
acid, pH 8.7.
30-60 cms. Brown (10 YR 5/3) moist, very pale brown (10 YR 7/4)dry, loam, slightly hard dry, friable moist, slightly sticky wet, slightlyplastic, roots, calcium carbonate concretions, effervescence with acid brisk,pH 8.3.
60-90 cms. Dark brown (10 YR 4/3) moist, pale brown (10 YR 6/3) dry,sandy clay loam, medium angular blocky, slightly hard dry, friable moist,slightly sticky wet, roots, effervescence with acid, pH 8.2.
Relief - flat
Drainage - goodLand use - vineyard
Table 1: Some Specimen Soil Profile Analyses from Khodaman Valley
E.C. CaCO FieldDepth pH milli Total O.M. N P205 capac-cms 1:1 1:5 mhos. % % % Sand mg/100 Gas Salt Clay city
0-30 8.2 8.6 0.35 8.1 1.26 0.061 66.0 0.065 3.00 16.8 17.2 28.430-60 8.6 8.8 0.30 9.3 0.75 53.8 0.125 2.20 20.2 26.0 29.260-90 8.2 8.6 0.30 21.5 1.02 36.0 0.025 2.40 30.0 34.0 31.1
0-30 8.4 8.7 0.29 8.3 1.43 0.078 58.0 0.135 3.00 22.0 20.6 30.130-90 8.5 8.5 0.35 7.2 1.09 49.6 0.100 3.00 27.2 23.2 31.360-90 8.6 8.7 0.32 9.7 0.68 57.6 0.190 2.40 21.2 21.2 38.7
0-30 8.5 8.7 0.30 18.0 0.99 0.046 34.8 0.125 2.40 35.2 30.0 31.330-90 8.3 8.7 0.38 21.0 0.85 40.0 - 1.80 47.2 12.8 28.560-90 8.5 8.8 0.30 7.8 0.92 54.8 - 1.80 23.2 22.0 28.4

ANNEX 2
Table of Contents
Afghanistan Projections in 7-Year Plan 1355-1362 (1975/76-1982/83)
Annex 2 contains the following production and trade tables uponwhich 7-year projections in Chapter 2 are based.
Table 1 Production of Important Agricultural Products According toProposed 7-Year Plan, 1355-1361
Table 2 Commercial Exports During the 7-Year Plan, 1355-1361
Table 3 Commercial Imports During the 7-Year Plan, 1355-1361

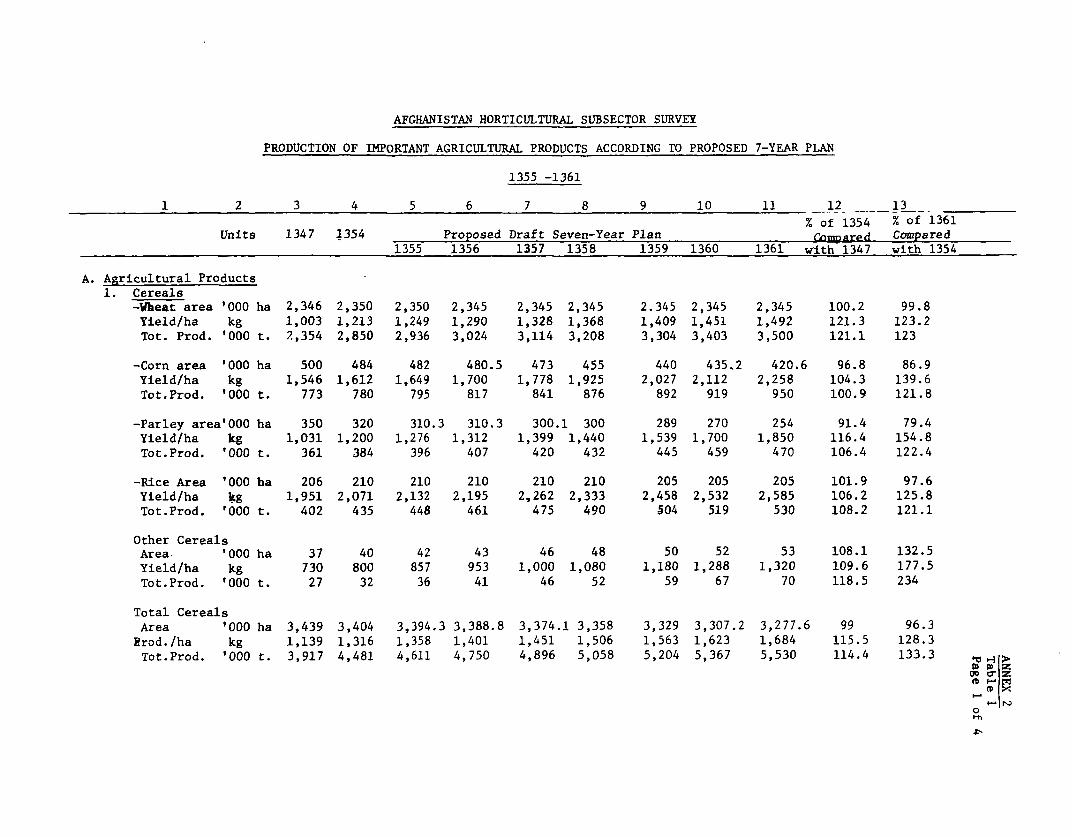
AFGHANISTAN HORTICULTURAL SUBSECTOR SURVEY
PRODUCTION OF IMPORTANT AGRICULTURAL PRODUCTS ACCORDING TO PROPOSED 7-YEAR PLAN
1355 -1361
1 2 3 4 5 6 7 8 9 10 11 12 13% of 1354 % of 1361Units 1347 1354 Proposed Draft Seven-Year Plan mpared Compared
1355 1356 1357 1358 1359 1360 1361 with 1347 with 1354
A. Agricultural Products -1. Cereals
-Wheat area '000 ha 2,346 2,350 2,350 2,345 2,345 2,345 2.345 2,345 2,345 100.2 99.8Yield/ha kg 1,003 1,213 1,249 1,290 1,328 1,368 1,409 1,451 1,492 121.3 123.2Tot. Prod. '000 t. 2,354 2,850 2,936 3,024 3,114 3,208 3,304 3,403 3,500 121.1 123
-Corn area '000 ha 500 484 482 480.5 473 455 440 435.2 420.6 96.8 86.9Yield/ha kg 1,546 1,612 1,649 1,700 1,778 1,925 2,027 2,112 2,258 104.3 139.6Tot.Prod. '000 t. 773 780 795 817 841 876 892 919 950 100.9 121.8
-Parley area'000 ha 350 320 310.3 310.3 300.1 300 289 270 254 91.4 79.4Yield/ha kg 1,031 1,200 1,276 1,312 1,399 1,440 1,539 1,700 1,850 116.4 154.8Tot.Prod. '000 t. 361 384 396 407 420 432 445 459 470 106.4 122.4
-Rice Area '000 ha 206 210 210 210 210 210 205 205 205 101.9 97.6Yield/ha kg 1,951 2,071 2,132 2,195 2,262 2,333 2,458 2,532 2,585 106.2 125.8Tot.Prod. '000 t. 402 435 448 461 475 490 504 519 530 108.2 121.1
Other CerealsArea. '000 ha 37 40 42 43 46 48 50 52 53 108.1 132.5Yield/ha kg 730 800 857 953 1,000 1,080 1,180 1,288 1,320 109.6 177.5Tot.Prod. '000 t. 27 32 36 41 46 52 59 67 70 118.5 234
Total CerealsArea '000 ha 3,439 3,404 3,394.3 3,388.8 3,374.1 3,358 3,329 3,307.2 3,277.6 99 96.3
Prod./ha kg 1,139 1,316 1,358 1,401 1,451 1,506 1,563 1,623 1,684 115.5 128.3Tot.Prod. '000 t. 3,917 4,481 4,611 4,750 4,896 5,058 5,204 5,367 5,530 114.4 133.3
0
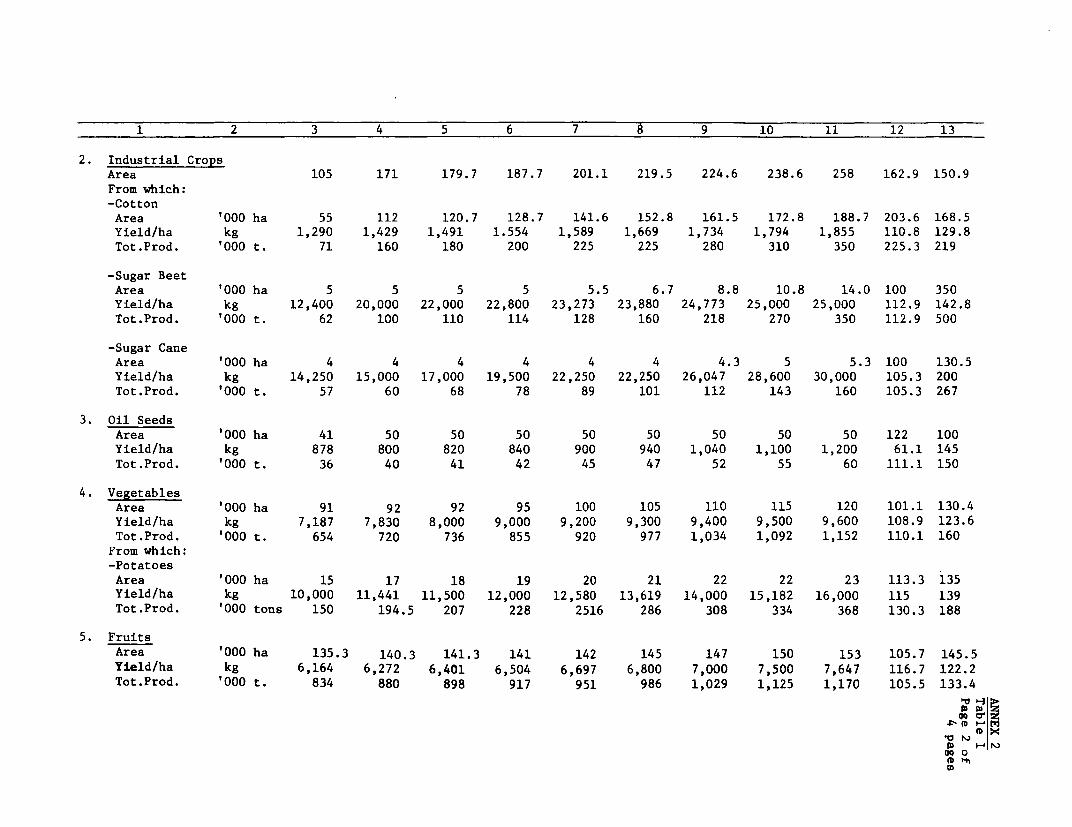
1 2 3 4 5 6 7 9 10 11 12 13
2. Industrial CropsArea 105 171 179.7 187.7 201.1 219.5 224.6 238.6 258 162.9 150.9From which:-CottonArea '000 ha 55 112 120.7 128.7 141.6 152.8 161.5 172.8 188.7 203.6 168.5Yield/ha kg 1,290 1,429 1,491 1.554 1,589 1,669 1,734 1,794 1,855 110.8 129.8Tot.Prod. '000 t. 71 160 180 200 225 225 280 310 350 225.3 219
-Sugar BeetArea '000 ha 5 5 5 5 5.5 6.7 8.8 10.8 14.0 100 350Yield/ha kg 12,400 20,000 22,000 22,800 23,273 23,880 24,773 25,000 25,000 112.9 142.8Tot.Prod. '000 t. 62 100 110 114 128 160 218 270 350 112.9 500
-Sugar CaneArea '000 ha 4 4 4 4 4 4 4.3 5 5.3 100 130.5Yield/ha kg 14,250 15,000 17,000 19,500 22,250 22,250 26,047 28,600 30,000 105.3 200Tot.Prod. '000 t. 57 60 68 78 89 101 112 143 160 105.3 267
3. Oil SeedsArea '000 ha 41 50 50 50 50 50 50 50 50 122 100Yield/ha kg 878 800 820 840 900 940 1,040 1,100 1,200 61.1 145Tot.Prod. '000 t. 36 40 41 42 45 47 52 55 60 111.1 150
4. VegetablesArea '000 ha 91 92 92 95 100 105 110 115 120 101.1 130.4Yield/ha kg 7,187 7,830 8,000 9,000 9,200 9,300 9,400 9,500 9,600 108.9 123.6Tot.Prod. '000 t. 654 720 736 855 920 977 1,034 1,092 1,152 110.1 160From which:-PotatoesArea '000 ha 15 17 18 19 20 21 22 22 23 113.3 135Yield/ha kg 10,000 11,441 11,500 12,000 12,580 13,619 14,000 15,182 16,000 115 139Tot.Prod. '000 tons 150 194.5 207 228 2516 286 308 334 368 130.3 188
5. FruitsArea '000 ha 135.3 140.3 141.3 141 142 145 147 150 153 105.7 145.5Yield/ha kg 6,164 6,272 6,401 6,504 6,697 6,800 7,000 7,500 7,647 116.7 122.2Tot.Prod. '000 t. 834 880 898 917 951 986 1,029 1,125 1,170 105.5 133.4
0 >4
OQOmtt
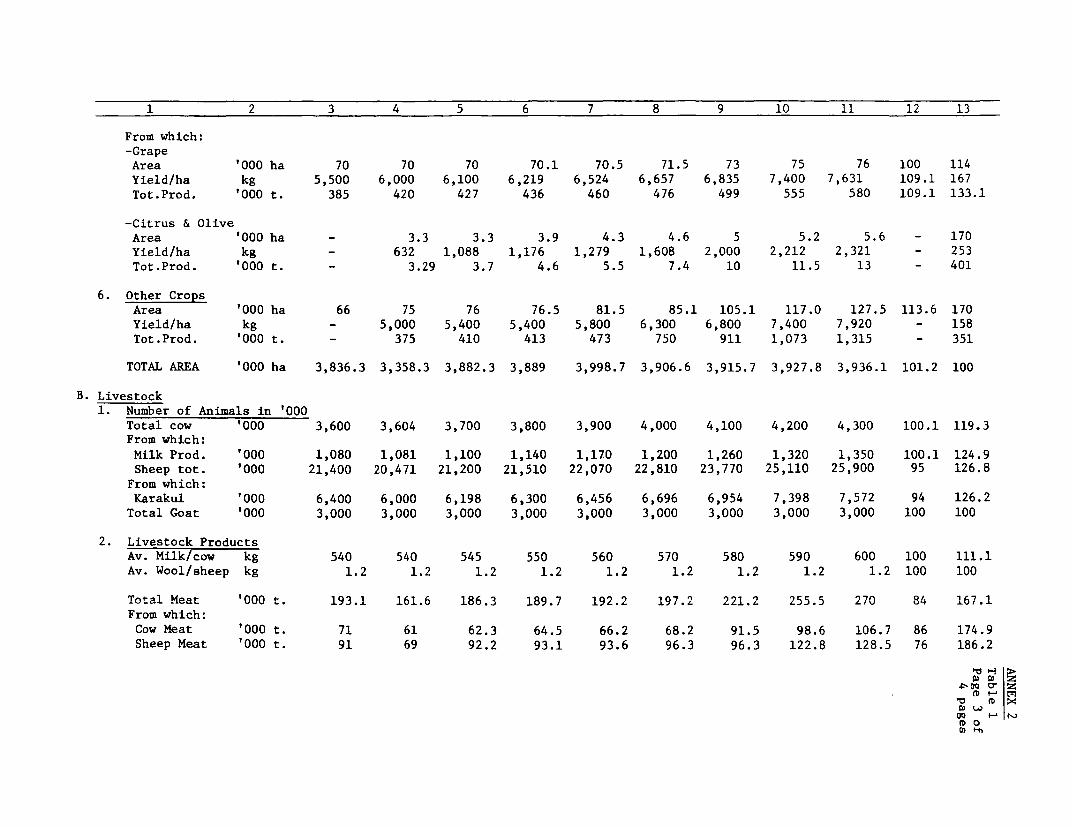
1 2 3 4 5 6 7 8 9 10 11 12 13
From which:-GrapeArea '000 ha 70 70 70 70.1 70.5 71.5 73 75 76 100 114Yield/ha kg 5,500 6,000 6,100 6,219 6,524 6,657 6,835 7,400 7,631 109.1 167Tot.Prod. '000 t. 385 420 427 436 460 476 499 555 580 109.1 133.1
-Citrus & OliveArea '000 ha - 3.3 3.3 3.9 4.3 4.6 5 5.2 5.6 - 170Yield/ha kg - 632 1,088 1,176 1,279 1,608 2,000 2,212 2,321 - 253Tot.Prod. '000 t. - 3.29 3.7 4.6 5.5 7.4 10 11.5 13 - 401
6. Other CropsArea '000 ha 66 75 76 76.5 81.5 85.1 105.1 117.0 127.5 113.6 170Yield/ha kg - 5,000 5,400 5,400 5,800 6,300 6,800 7,400 7,920 - 158Tot.Prod. '000 t. - 375 410 413 473 750 911 1,073 1,315 - 351
TOTAL AREA '000 ha 3,836.3 3,358.3 3,882.3 3,889 3,998.7 3,906.6 3,915.7 3,927.8 3,936.1 101.2 100
B. Livestock1. Number of Animals in '000
Total cow '000 3,600 3,604 3,700 3,800 3,900 4,000 4,100 4,200 4,300 100.1 119.3From which:Milk Prod. '000 1,080 1,081 1,100 1,140 1,170 1,200 1,260 1,320 1,350 100.1 124.9Sheep tot. '000 21,400 20,471 21,200 21,510 22,070 22,810 23,770 25,110 25,900 95 126.8
From which:Karakul '000 6,400 6,000 6,198 6,300 6,456 6,696 6,954 7,398 7,572 94 126.2
Total Goat '000 3,000 3,000 3,000 3,000 3,000 3,000 3,000 3,000 3,000 100 100
2. Livestock ProductsAv. Milk/cow kg 540 540 545 550 560 570 580 590 600 100 111.1Av. Wool/sheep kg 1.2 1.2 1.2 1.2 1.2 1.2 1.2 1.2 1.2 100 100
Total Meat '000 t. 193.1 161.6 186.3 189.7 192.2 197.2 221.2 255.5 270 84 167.1From which:Cow Meat '000 t. 71 61 62.3 64.5 66.2 68.2 91.5 98.6 106.7 86 174.9Sheep Meat '000 t. 91 69 92.2 93.1 93.6 96.3 96.3 122.8 128.5 76 186.2
0 a
0c~o t
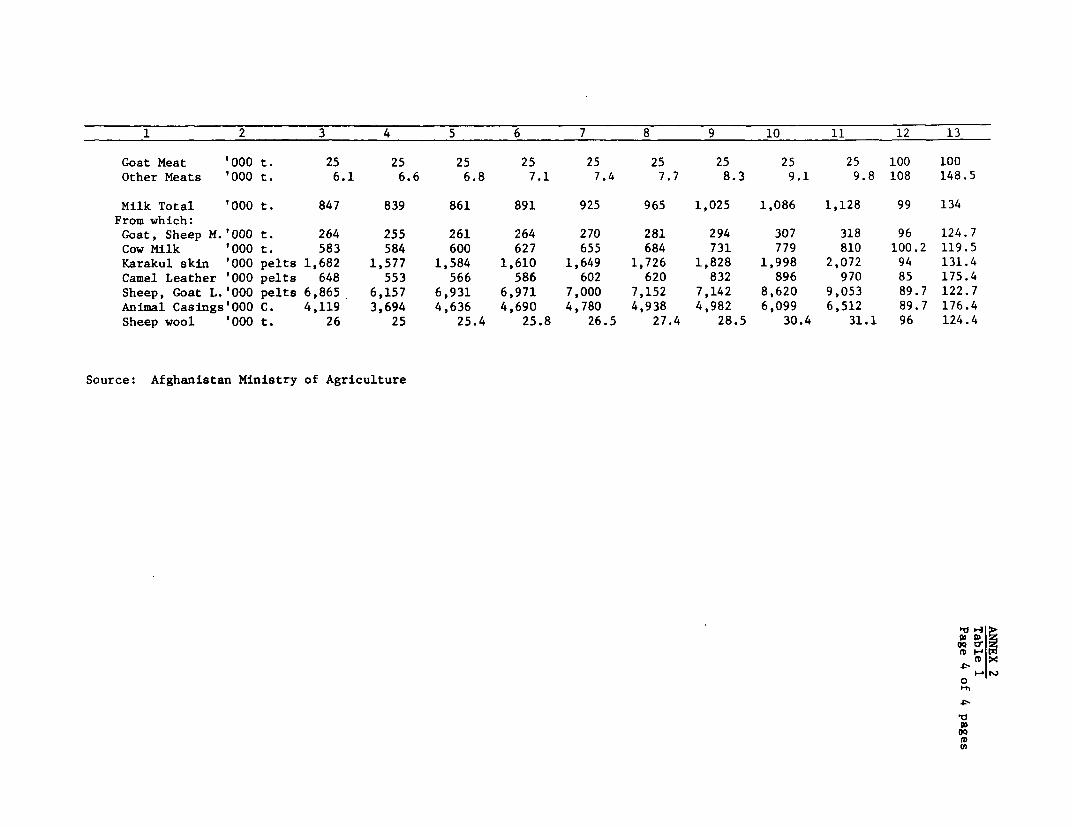
1 2 3 4 5 6 7 8 9 10 11 12 13
Goat Meat '000 t. 25 25 25 25 25 25 25 25 25 100 100Other Meats '000 t. 6.1 6.6 6.8 7.1 7.4 7.7 8.3 9.1 9.8 108 148.5
Milk Total '000 t. 847 839 861 891 925 965 1,025 1,086 1,128 99 134From which:Goat, Sheep M.'000 t. 264 255 261 264 270 281 294 307 318 96 124.7Cow Milk '000 t. 583 584 600 627 655 684 731 779 810 100.2 119.5Karakul skin '000 pelts 1,682 1,577 1,584 1,610 1,649 1,726 1,828 1,998 2,072 94 131.4Camel Leather '000 pelts 648 553 566 586 602 620 832 896 970 85 175.4Sheep, Goat L.'000 pelts 6,865. 6,157 6,931 6,971 7,000 7,152 7,142 8,620 9,053 89.7 122.7Animal Casings'000 C. 4,119 3,694 4,636 4,690 4,780 4,938 4,982 6,099 6,512 89.7 176.4Sheep wool '000 t. 26 25 25.4 25.8 26.5 27.4 28.5 30.4 31.1 96 124.4
Source: Afghanistan Ministry of Agriculture
CD X
0
CD(A
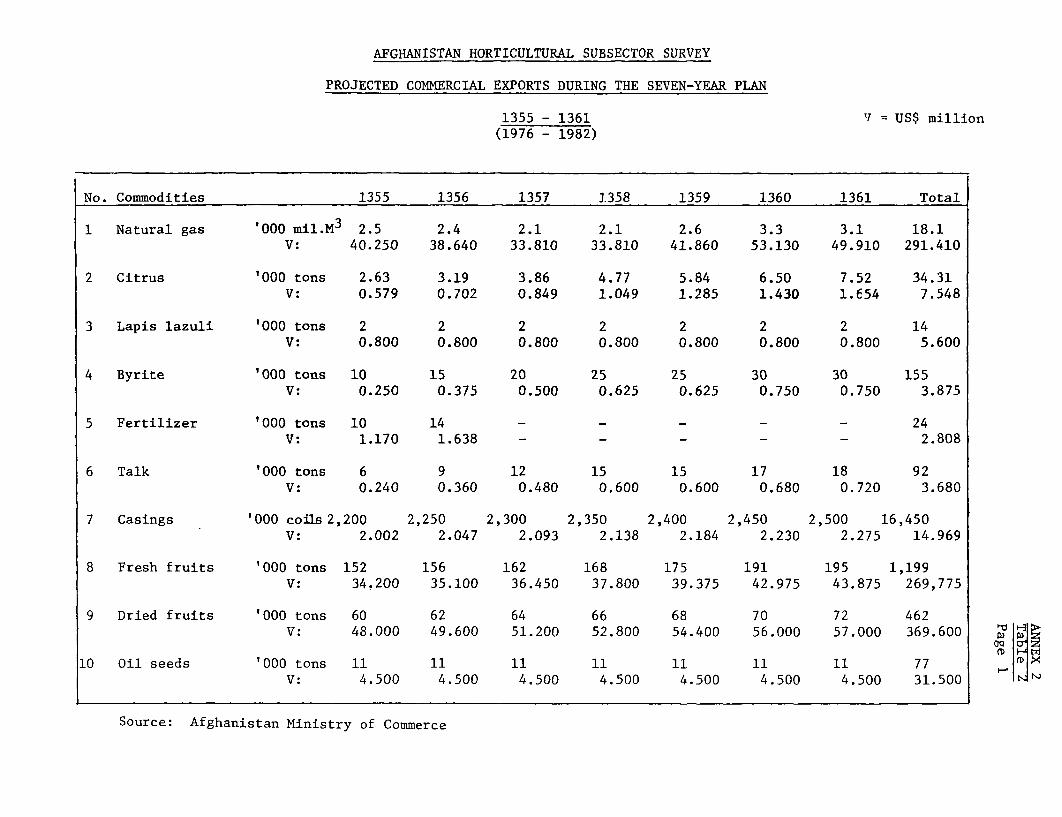
AFGHANISTAN HORTICULTURAL SUBSECTOR SURVEY
PROJECTED COMMERCIAL EXPORTS DURING THE SEVEN-YEAR PLAN
1355 - 1361 'I = US$ million(1976 - 1982)
No. Commodities 1355 1356 1357 1.358 1359 1360 1361 Total
1 Natural gas '000 mil.M3 2.5 2.4 2.1 2.1 2.6 3.3 3.1 18.1V: 40.250 38.640 33.810 33.810 41.860 53.130 49.910 291.410
2 Citrus '000 tons 2.63 3.19 3.86 4.77 5.84 6.50 7.52 34.31V: 0.579 0.702 0.849 1.049 1.285 1.430 1.654 7.548
3 Lapis lazuli '000 tons 2 2 2 2 2 2 2 14V: 0.800 0.800 0.800 0.800 0.800 0.800 0.800 5.600
4 Byrite '000 tons 10 15 20 25 25 30 30 155V: 0.250 0.375 0.500 0.625 0.625 0.750 0.750 3.875
5 Fertilizer '000 tons 10 14 - - - - - 24V: 1.170 1.638 - - - - - 2.808
6 Talk '000 tons 6 9 12 15 15 17 18 92V: 0.240 0.360 0.480 0.600 0.600 0.680 0.720 3.680
7 Casings '000 coils 2,200 2,250 2,300 2,350 2,400 2,450 2,500 16,450V: 2.002 2.047 2.093 2.138 2.184 2.230 2.275 14.969
8 Fresh fruits '000 tons 152 156 162 168 175 191 195 1,199V: 34.200 35.100 36.450 37.800 39.375 42.975 43.875 269,775
9 Dried fruits '000 tons 60 62 64 66 68 70 72 462V: 48.000 49.600 51.200 52.800 54.400 56.000 57.000 369.600 e
10 Oil seeds '000 tons 11 11 11 11 11 11 11 77V: 4.500 4.500 4.500 4.500 4.500 4.500 4.500 31.500
Source: Afghanistan Ministry of Commerce
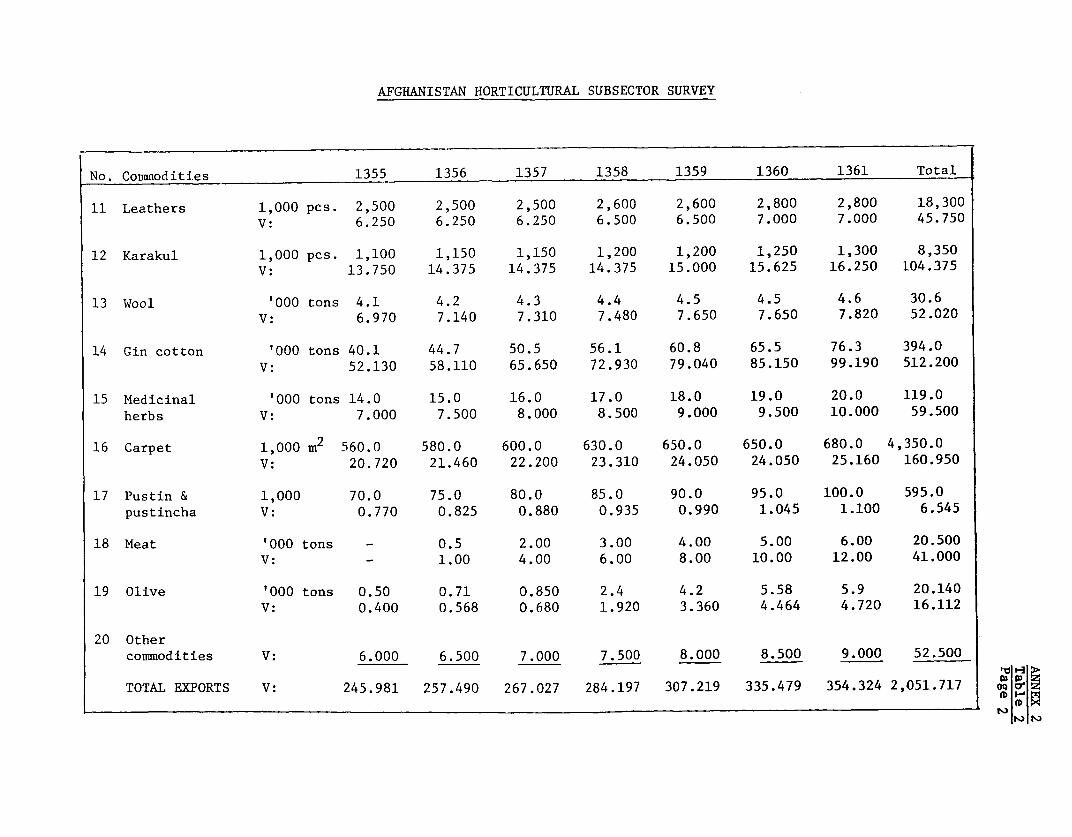
AFGHANISTAN HORTICULTURAL SUBSECTOR SURVEY
No. Commodities 1355 1356 1357 1358 1359 1360 1361 Total
11 Leathers 1,000 pcs. 2,500 2,500 2,500 2,600 2,600 2,800 2,800 18,300V: 6.250 6.250 6.250 6.500 6.500 7.000 7.000 45.750
12 Karakul 1,000 pcs. 1,100 1,150 1,150 1,200 1,200 1,250 1,300 8,350V: 13.750 14.375 14.375 14.375 15.000 15.625 16.250 104.375
13 Wool '000 tons 4.1 4.2 4.3 4.4 4.5 4.5 4.6 30.6V: 6.970 7.140 7.310 7.480 7.650 7.650 7.820 52.020
14 Gin cotton '000 tons 40.1 44.7 50.5 56.1 60.8 65.5 76.3 394.0V: 52.130 58.110 65.650 72.930 79.040 85.150 99.190 512.200
15 Medicinal '000 tons 14.0 15.0 16.0 17.0 18.0 19.0 20.0 119.0herbs V: 7.000 7.500 8.000 8.500 9.000 9.500 10.000 59.500
16 Carpet 1,000 m2 560.0 580.0 600.0 630.0 650.0 650.0 680.0 4,350.0V: 20.720 21.460 22.200 23.310 24.050 24.050 25.160 160.950
17 Pustin & 1,000 70.0 75.0 80.0 85.0 90.0 95.0 100.0 595.0pustincha V: 0.770 0.825 0.880 0.935 0.990 1.045 1.100 6.545
18 Meat '000 tons - 0.5 2.00 3.00 4.00 5.00 6.00 20.500V: - 1.00 4.00 6.00 8.00 10.00 12.00 41.000
19 Olive '000 tons 0.50 0.71 0.850 2.4 4.2 5.58 5.9 20.140V: 0.400 0.568 0.680 1.920 3.360 4.464 4.720 16.112
20 Othercommodities V: 6.000 6.500 7.000 7.500 8.000 8.500 9.000 52.500
TOTAL EXPORTS V: 245.981 257.490 267.027 284.197 307.219 335.479 354.324 2,051.717
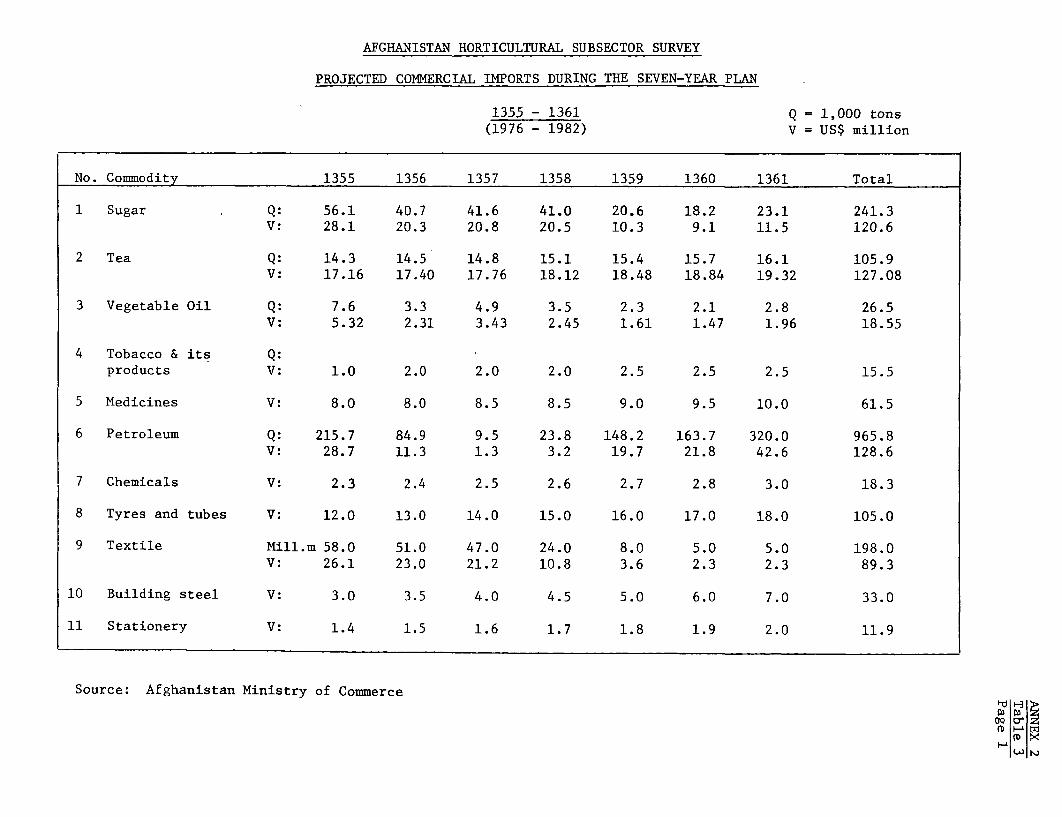
AFGHANISTAN HORTICULTURAL SUBSECTOR SURVEY
PROJECTED COMMERCIAL IMPORTS DURING THE SEVEN-YEAR PLAN
1355 - 1361 Q - 1,000 tons(1976 - 1982) V = US$ million
No. Commodity 1355 1356 1357 1358 1359 1360 1361 Total
1 Sugar Q: 56.1 40.7 41.6 41.0 20.6 18.2 23.1 241.3V: 28.1 20.3 20.8 20.5 10.3 9.1 11.5 120.6
2 Tea Q 14.3 14.5 14.8 15.1 15.4 15.7 16.1 105.9V: 17.16 17.40 17.76 18.12 18.48 18.84 19.32 127.08
3 Vegetable Oil Q: 7.6 3.3 4.9 3.5 2.3 2.1 2.8 26.5V: 5.32 2.31 3.43 2.45 1.61 1.47 1.96 18.55
4 Tobacco & its Q:products V: 1.0 2.0 2.0 2.0 2.5 2.5 2.5 15.5
5 Medicines V: 8.0 8.0 8.5 8.5 9.0 9.5 10.0 61.5
6 Petroleum Q: 215.7 84.9 9.5 23.8 148.2 163.7 320.0 965.8V: 28.7 11.3 1.3 3.2 19.7 21.8 42.6 128.6
7 Chemicals V: 2.3 2.4 2.5 2.6 2.7 2.8 3.0 18.3
8 Tyres and tubes V: 12.0 13.0 14.0 15.0 16.0 17.0 18.0 105.0
9 Textile Mill.m 58.0 51.0 47.0 24.0 8.0 5.0 5.0 198.0V: 26.1 23.0 21.2 10.8 3.6 2.3 2.3 89.3
10 Building steel V: 3.0 3.5 4.0 4.5 5.0 6.0 7.0 33.0
11 Stationery V: 1.4 1.5 1.6 1.7 1.8 1.9 2.0 11.9
Source: Afghanistan Ministry of Commerce
PXJ c 3Z w
U.)
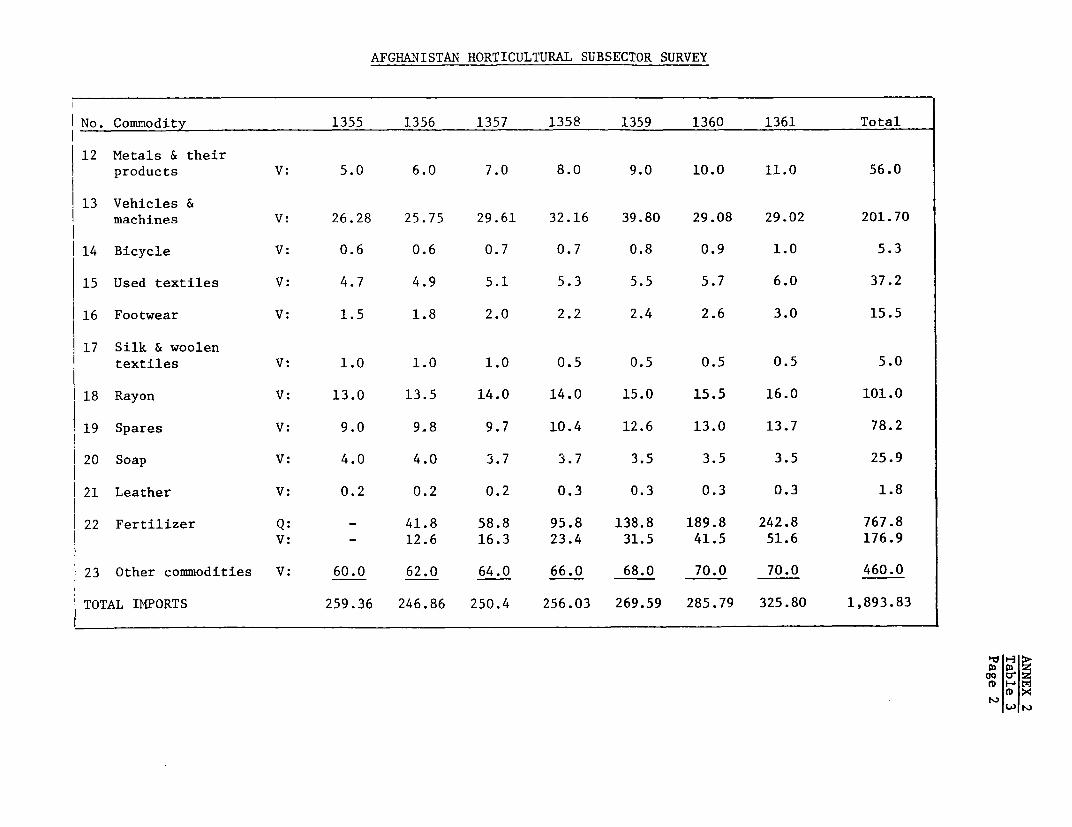
AFGHANISTAN HORTICULTURAL SUBSECTOR SURVEY
No. Commodity 1355 1356 1357 1358 1359 1360 1361 Total
12 Metals & theirproducts V: 5.0 6.0 7.0 8.0 9.0 10.0 11.0 56.0
13 Vehicles &machines V: 26.28 25.75 29.61 32.16 39.80 29.08 29.02 201.70
14 Bicycle V: 0.6 0.6 0.7 0.7 0.8 0.9 1.0 5.3
15 Used textiles V: 4.7 4.9 5.1 5.3 5.5 5.7 6.0 37.2
16 Footwear V: 1.5 1.8 2.0 2.2 2.4 2.6 3.0 15.5
17 Silk & woolentextiles V: 1.0 1.0 1.0 0.5 0.5 0.5 0.5 5.0
18 Rayon V: 13.0 13.5 14.0 14.0 15.0 15.5 16.0 101.0
19 Spares V: 9.0 9.8 9.7 10.4 12.6 13.0 13.7 78.2
20 Soap V: 4.0 4.0 3.7 3.7 3.5 3.5 3.5 25.9
I 21 Leather V: 0.2 0.2 0.2 0.3 0.3 0.3 0.3 1.8
22 Fertilizer Q: - 41.8 58.8 95.8 138.8 189.8 242.8 767.8V: - 12.6 16.3 23.4 31.5 41.5 51.6 176.9
23 Other commodities V: 60.0 62.0 64.0 66.0 68.0 70.0 70.0 460.0
TOTAL IMPORTS 259.36 246.86 250.4 256.03 269.59 285.79 325.80 1,893.83
e 3 D( PX oq a
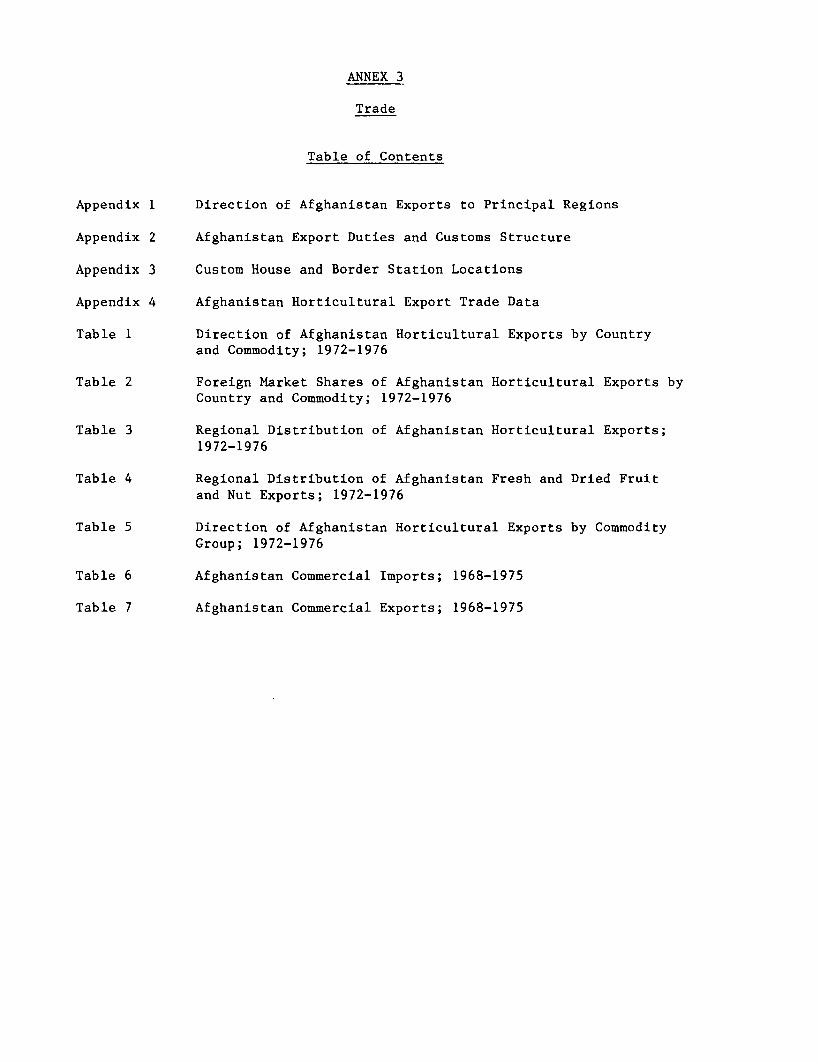
ANNEX 3
Trade
Table of Contents
Appendix 1 Direction of Afghanistan Exports to Principal Regions
Appendix 2 Afghanistan Export Duties and Customs Structure
Appendix 3 Custom House and Border Station Locations
Appendix 4 Afghanistan Horticultural Export Trade Data
Table 1 Direction of Afghanistan Horticultural Exports by Countryand Commodity; 1972-1976
Table 2 Foreign Market Shares of Afghanistan Horticultural Exports byCountry and Commodity; 1972-1976
Table 3 Regional Distribution of Afghanistan Horticultural Exports;1972-1976
Table 4 Regional Distribution of Afghanistan Fresh and Dried Fruitand Nut Exports; 1972-1976
Table 5 Direction of Afghanistan Horticultural Exports by CommodityGroup; 1972-1976
Table 6 Afghanistan Commercial Imports; 1968-1975
Table 7 Afghanistan Commercial Exports; 1968-1975

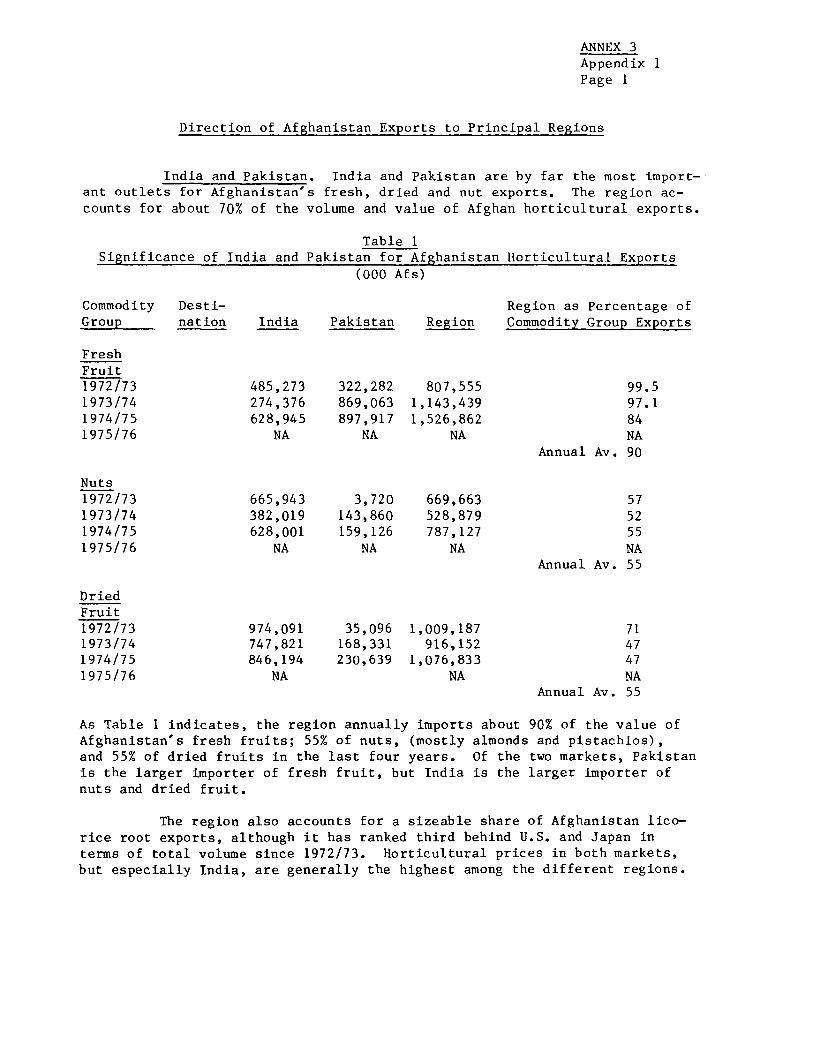
ANNEX 3Appendix 1Page 1
Direction of Afghanistan Exports to Principal Regions
India and Pakistan. India and Pakistan are by far the most import-ant outlets for Afghanistan's fresh, dried and nut exports. The region ac-counts for about 70% of the volume and value of Afghan horticultural exports.
Table ISignificance of India and Pakistan for Afghanistan Horticultural Exports
(000 Afs)
Commodity Desti- Region as Percentage ofGroup nation India Pakistan Region Commodity Group Exports
FreshFruit1972/73 485,273 322,282 807,555 99.51973/74 274,376 869,063 1,143,439 97.11974/75 628,945 897,917 1,526,862 841975/76 NA NA NA NA
Annual Av. 90
Nuts1972/73 665,943 3,720 669,663 571973/74 382,019 143,860 528,879 521974/75 628,001 159,126 787,127 551975/76 NA NA NA NA
Annual Av. 55
DriedFruit1972/73 974,091 35,096 1,009,187 711973/74 747,821 168,331 916,152 471974/75 846,194 230,639 1,076,833 471975/76 NA NA NA
Annual Av. 55
As Table 1 indicates, the region annually imports about 90% of the value ofAfghanistan's fresh fruits; 55% of nuts, (mostly almonds and pistachios),and 55% of dried fruits in the last four years. Of the two markets, Pakistanis the larger importer of fresh fruit, but India is the larger importer ofnuts and dried fruit.
The region also accounts for a sizeable share of Afghanistan lico-rice root exports, although it has ranked third behind U.S. and Japan interms of total volume since 1972/73. Horticultural prices in both markets,but especially India, are generally the highest among the different regions.
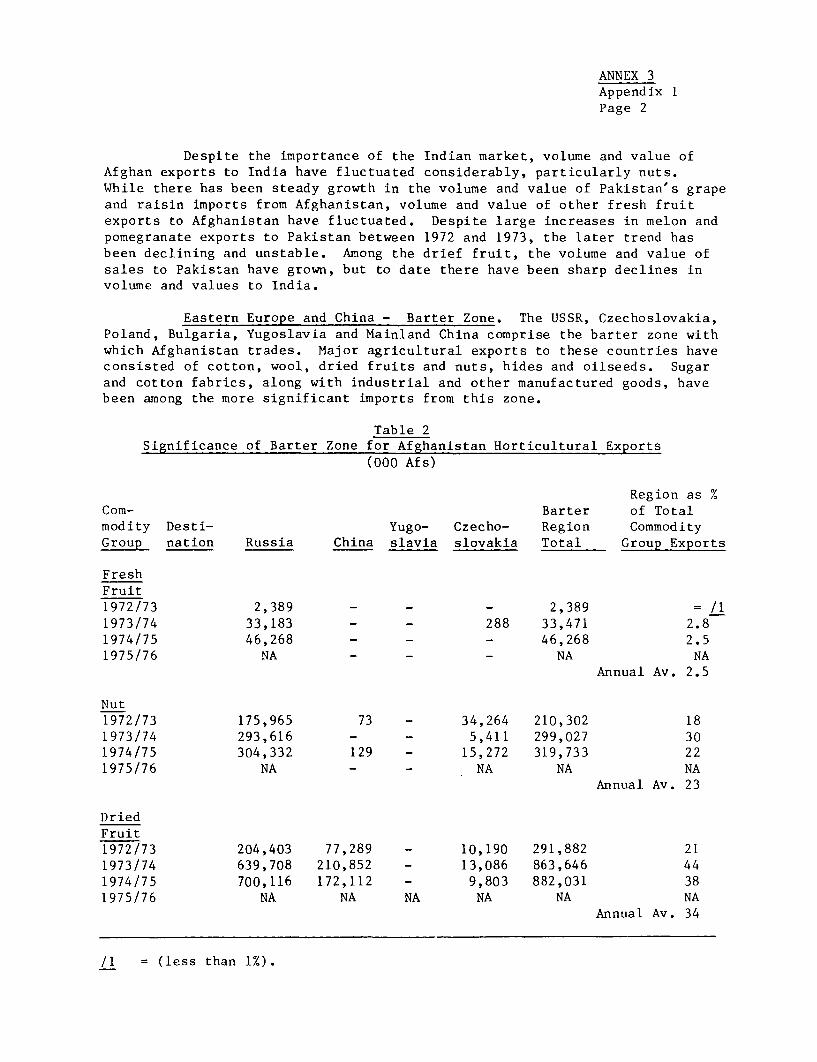
ANNEX 3Appendix 1Page 2
Despite the importance of the Indian market, volume and value ofAfghan exports to India have fluctuated considerably, particularly nuts.While there has been steady growth in the volume and value of Pakistan's grapeand raisin imports from Afghanistan, volume and value of other fresh fruitexports to Afghanistan have fluctuated. Despite large increases in melon andpomegranate exports to Pakistan between 1972 and 1973, the later trend hasbeen declining and unstable. Among the drief fruit, the volume and value ofsales to Pakistan have grown, but to date there have been sharp declines involume and values to India.
Eastern Europe and China - Barter Zone. The USSR, Czechoslovakia,Poland, Bulgaria, Yugoslavia and Mainland China comprise the barter zone withwhich Afghanistan trades. Major agricultural exports to these countries haveconsisted of cotton, wool, dried fruits and nuts, hides and oilseeds. Sugarand cotton fabrics, along with industrial and other manufactured goods, havebeen among the more significant imports from this zone.
Table 2Significance of Barter Zone for Afghanistan Horticultural Exports
(000 Afs)
Region as %Com- Barter of Totalmodity Desti- Yugo- Czecho- Region CommodityGroup nation Russia China slavia slovakia Total Group Exports
FreshFruit1972/73 2,389 - - - 2,389 / I1973/74 33,183 - - 288 33,471 2.81974/75 46,268 - - - 46,268 2.51975/76 NA - - - NA NA
Annual Av. 2.5
Nut1972/73 175,965 73 - 34,264 210,302 181973/74 293,616 - - 5,411 299,027 301974/75 304,332 129 - 15,272 319,733 221975/76 NA - - NA NA NA
Annual Av. 23
DriedFruit1972/73 204,403 77,289 - 10,190 291,882 211973/74 639,708 210,852 - 13,086 863,646 441974/75 700,116 172,112 - 9,803 882,031 381975/76 NA NA NA NA NA NA
Annual Av. 34
/1 = (less than 1%).
ANNEX 3Appendix IPage 3
As Table 2 indicates, the barter region accounts for 2 percent of the valueof Afghanistan fresh fruit exports, 23% of the value of nut exports, and 34%of the value of dried fruit exports. Prices in barter zone countries (not-ably Russia, Czechoslovakia and China) are generally lower than in India andPakistan but so are quality standards. While barter zone share of Afghan-istan nut exports has been relatively constant in the last four years (1972/73-1975/76), the volume of raisin and dried apricot exports to Russia doubledfrom 1972/73 to 1973/74 while raisin prices also increased about 68%. Since1973/74, value and volume of Afghan raisin exports to Russia have been con-stant or declining.
Czechoslovakia and China are the two other major dried fruit im-porters in the barter zone. Although Czechoslovakia imports both raisins andapricot kernels, the total value of dried fruit imports from Afghanistan hasbeen relatively constant. Volume of raisin imports from Afghanistan hassteadily fallen while raisin prices have almost doubled over the four yearperiod. Apricot nut volume and prices have fluctuated. China imports onlyraisins from the dried fruit category. Volume of raisin imports, slightlylower than quota levels, has been rather constant but prices, and thereforevalue, have fluctuated considerably.
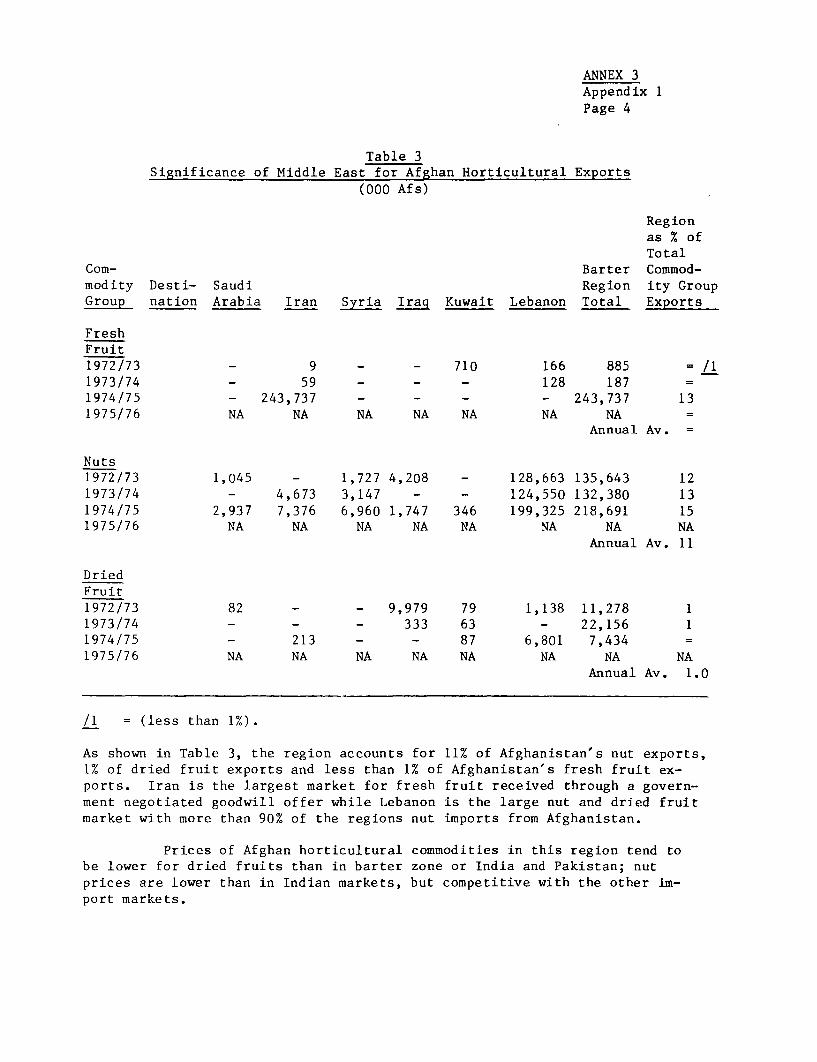
ANNEX 3Appendix 1Page 4
Table 3Significance of Middle East for Afghan Horticultural Exports
(000 Afs)
Regionas % ofTotal
Com- Barter Commod-modity Desti- Saudi Region ity GroupGroup nation Arabia Iran Syria Iraq Kuwait Lebanon Total Exports
FreshFruit1972/73 - 9 - - 710 166 885 = /1973/74 - 59 - - - 128 187 =1974/75 - 243,737 - - - - 243,737 131975/76 NA NA NA NA NA NA NA =
Annual Av. =
Nuts1972/73 1,045 - 1,727 4,208 - 128,663 135,643 121973/74 - 4,673 3,147 - - 124,550 132,380 131974/75 2,937 7,376 6,960 1,747 346 199,325 218,691 151975/76 NA NA NA NA NA NA NA NA
Annual Av. 11
DriedFruit1972/73 82 - - 9,979 79 1,138 11,278 11973/74 - - - 333 63 - 22,156 11974/75 - 213 - - 87 6,801 7,434 =1975/76 NA NA NA NA NA NA NA NA
Annual Av. 1.0
/1 = (less than 1%).
As shown in Table 3, the region accounts for 11% of Afghanistan's nut exports,1% of dried fruit exports and less than 1% of Afghanistan's fresh fruit ex-ports. Iran is the largest market for fresh fruit received through a govern-ment negotiated goodwill offer while Lebanon is the large nut and dried fruitmarket with more than 90% of the regions nut imports from Afghanistan.
Prices of Afghan horticultural commodities in this region tend tobe lower for dried fruits than in barter zone or India and Pakistan; nutprices are lower than in Indian markets, but competitive with the other im-port markets.
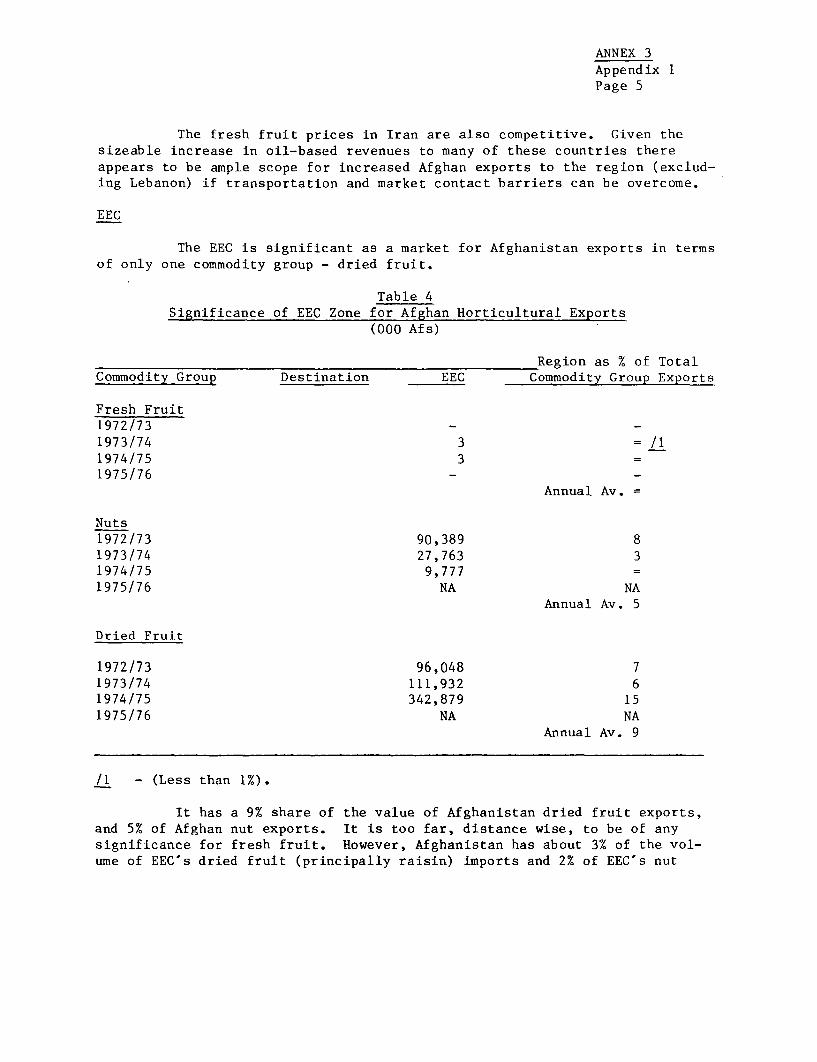
ANNEX 3Appendix 1Page 5
The fresh fruit prices in Iran are also competitive. Given thesizeable increase in oil-based revenues to many of these countries thereappears to be ample scope for increased Afghan exports to the region (exclud-ing Lebanon) if transportation and market contact barriers can be overcome.
EEC
The EEC is significant as a market for Afghanistan exports in termsof only one commodity group - dried fruit.
Table 4Significance of EEC Zone for Afghan Horticultural Exports
(000 Afs)
__________________________ eRegion as % of TotalCommodity Group Destination EEC Commodity Group Exports
Fresh Fruit1972/731973/74 3 =/
1974/75 31975/76 -
Annual Av. =
Nuts1972/73 90,389 81973/74 27,763 31974/75 9,7771975/76 NA NA
Annual Av. 5
Dried Fruit
1972/73 96,048 71973/74 111,932 61974/75 342,879 151975/76 NA NA
Annual Av. 9
/1 - (Less than 1%).
It has a 9% share of the value of Afghanistan dried fruit exports,and 5% of Afghan nut exports. It is too far, distance wise, to be of anysignificance for fresh fruit. However, Afghanistan has about 3% of the vol-ume of EEC's dried fruit (principally raisin) imports and 2% of EEC's nut
ANNEX 3Appendix 1Page 6
imports. 1/ Its trade with the EEC appears to be stagnant or declining be-cause it must compete with Turkey, Greece and Iran, also major sources of EECimports who all have tariff concessions and are closer geographic locations tothese markets. Prices of Afghan produce in these markets, however, appearto be competitive with the other regions.
Other Regions. Afghanistan exports sizeable quantities of lico-rice roots to US and Japan which account annually for about 46% and 15% ofthe share of the volume of Afghanistan's licorice root exports respectively.Other horticultural exports to these countries are negligible. Afghanistanalso exports raisins to other Western European countries, but their share ofAfghanistan exports is not determined.
Summary Trends in Afghanistan Exports to Major Markets. In sum-mary, there is a marked contrast in recent trends of Afghanistan horticul-tural exports to principal import markets. Volumes and values of fresh anddried fruit and nuts to India have all experienced considerable fluctuationswhich merit further investigation. However, there has been a steady growthof exports to Pakistan despite political problems between it and Afghanistanand the absence of a bilateral trade agreement. Exports to Russia increasedconsiderably from 1972/73 to 1973/74 stimulated by higher quotas in the 1974agreement, but have stabilized thereafter. The volume of raisins, the prin-ciple export to China, has stabilized around the quota levels, but valuehas fluctuated considerably. Exports of nuts and dried fruit to the EEC havealso fluctuated or declined. Sales to the Middle East have exhibited sharpvariations. With the problems in Lebanon no doubt further declines will beexperienced this year which could hurt revenues from Afghanistan nut exports.
The mission examined the question of whether changes in domesticproduction and consumption might have contributed to fluctuations in exportsto India and Russia.
1/ 1% of Belgian imports, 5% of Netherlands, and 5% of United Kingdom asreported in 1973 EEC trade statistics.
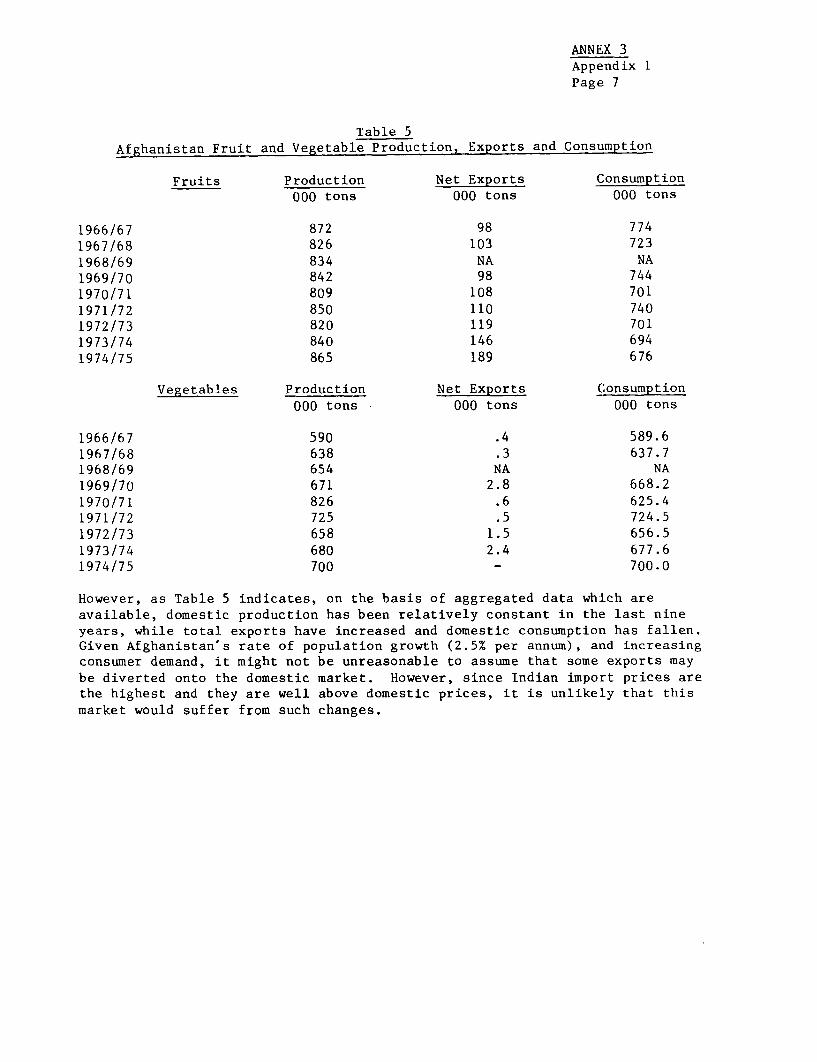
ANNEX 3Appendix 1Page 7
Table 5
Afghanistan Fruit and Vegetable Production, Exports and Consumption
Fruits Production Net Exports Consumption000 tons 000 tons 000 tons
1966/67 872 98 774
1967/68 826 103 7231968/69 834 NA NA1969/70 842 98 744
1970/71 809 108 701
1971/72 850 110 7401972/73 820 119 701
1973/74 840 146 6941974/75 865 189 676
Vegetables Production Net Exports Consumption000 tons - 000 tons 000 tons
1966/67 590 .4 589.61967/68 638 .3 637.71968/69 654 NA NA
1969/70 671 2.8 668.21970/71 826 .6 625.41971/72 725 .5 724.51972/73 658 1.5 656.5
1973/74 680 2.4 677.61974/75 700 - 700.0
However, as Table 5 indicates, on the basis of aggregated data which areavailable, domestic production has been relatively constant in the last nineyears, while total exports have increased and domestic consumption has fallen.Given Afghanistan's rate of population growth (2.5% per annum), and increasingconsumer demand, it might not be unreasonable to assume that some exports may
be diverted onto the domestic market. However, since Indian import prices arethe highest and they are well above domestic prices, it is unlikely that this
market would suffer from such changes.
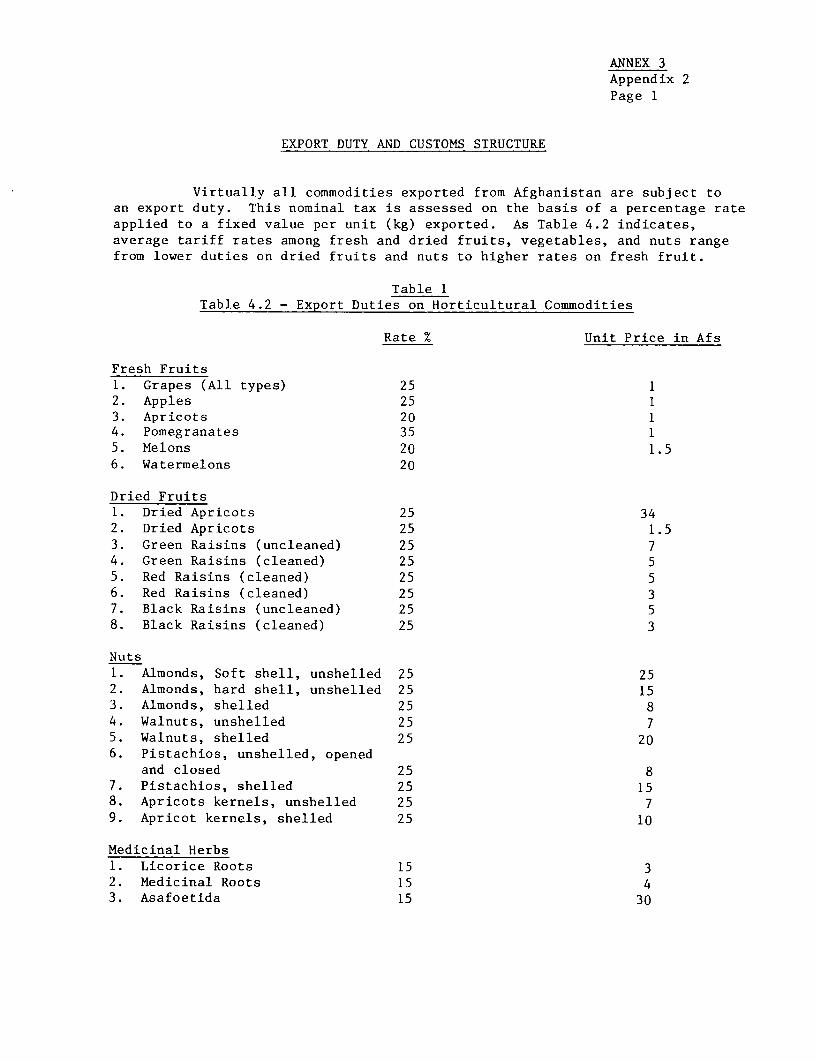
ANNEX 3Appendix 2Page 1
EXPORT DUTY AND CUSTOMS STRUCTURE
Virtually all commodities exported from Afghanistan are subject toan export duty. This nominal tax is assessed on the basis of a percentage rateapplied to a fixed value per unit (kg) exported. As Table 4.2 indicates,average tariff rates among fresh and dried fruits, vegetables, and nuts rangefrom lower duties on dried fruits and nuts to higher rates on fresh fruit.
Table 1Table 4.2 - Export Duties on Horticultural Commodities
Rate % Unit Price in Afs
Fresh Fruits1. Grapes (All types) 25 12. Apples 25 13. Apricots 20 14. Pomegranates 35 15. Melons 20 1.56. Watermelons 20
Dried Fruits1. Dried Apricots 25 342. Dried Apricots 25 1.53. Green Raisins (uncleaned) 25 74. Green Raisins (cleaned) 25 55. Red Raisins (cleaned) 25 56. Red Raisins (cleaned) 25 37. Black Raisins (uncleaned) 25 58. Black Raisins (cleaned) 25 3
Nuts1. Almonds, Soft shell, unshelled 25 252. Almonds, hard shell, unshelled 25 153. Almonds, shelled 25 84. Walnuts, unshelled 25 75. Walnuts, shelled 25 206. Pistachios, unshelled, opened
and closed 25 87. Pistachios, shelled 25 158. Apricots kernels, unshelled 25 79. Apricot kernels, shelled 25 10
Medicinal Herbs1. Licorice Roots 15 32. Medicinal Roots 15 43. Asafoetida 15 30
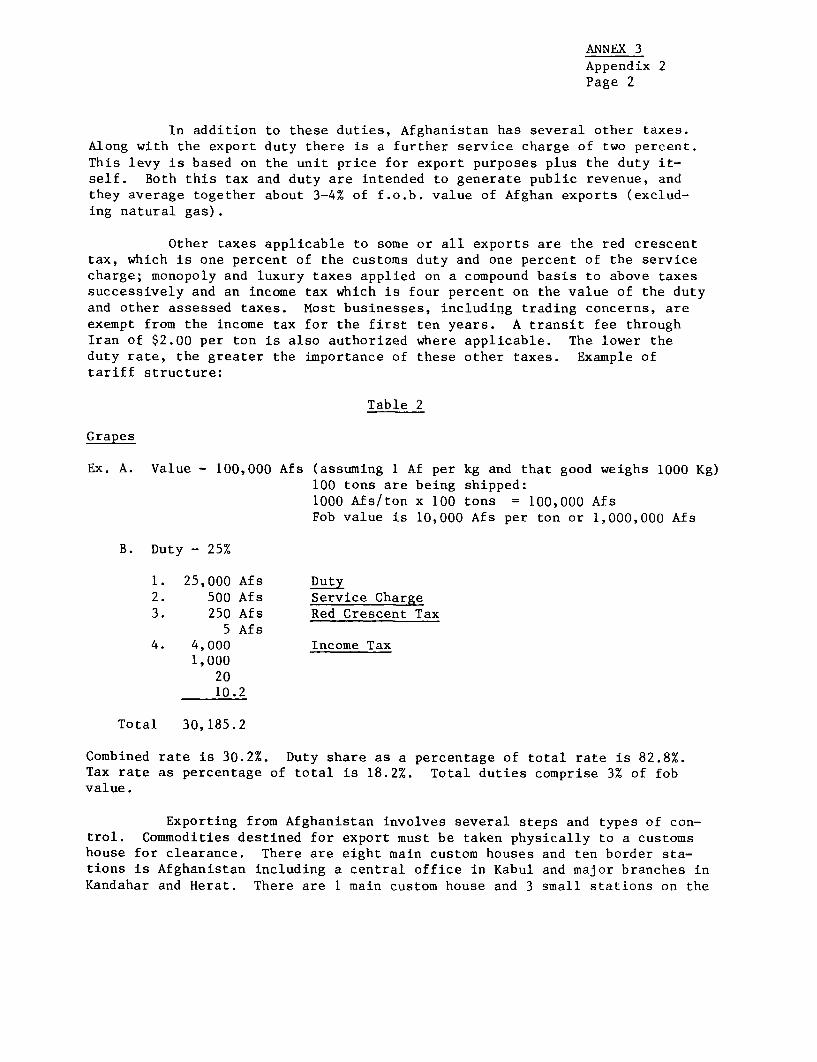
ANNEX 3Appendix 2Page 2
In addition to these duties, Afghanistan has several other taxes.Along with the export duty there is a further service charge of two percent.This levy is based on the unit price for export purposes plus the duty it-self. Both this tax and duty are intended to generate public revenue, andthey average together about 3-4% of f.o.b. value of Afghan exports (exclud-ing natural gas).
Other taxes applicable to some or all exports are the red crescenttax, which is one percent of the customs duty and one percent of the servicecharge; monopoly and luxury taxes applied on a compound basis to above taxessuccessively and an income tax which is four percent on the value of the dutyand other assessed taxes. Most businesses, including trading concerns, areexempt from the income tax for the first ten years. A transit fee throughIran of $2.00 per ton is also authorized where applicable. The lower theduty rate, the greater the importance of these other taxes. Example oftariff structure:
Table 2
Grapes
Ex. A. Value - 100,000 Afs (assuming 1 Af per kg and that good weighs 1000 Kg)100 tons are being shipped:1000 Afs/ton x 100 tons = 100,000 AfsFob value is 10,000 Afs per ton or 1,000,000 Afs
B. Duty - 25%
1. 25,000 Afs Duty2. 500 Afs Service Charge3. 250 Afs Red Crescent Tax
5 Afs4. 4,000 Income Tax
1,0002010.2
Total 30,185.2
Combined rate is 30.2%. Duty share as a percentage of total rate is 82.8%.Tax rate as percentage of total is 18.2%. Total duties comprise 3% of fobvalue.
Exporting from Afghanistan involves several steps and types of con-trol. Commodities destined for export must be taken physically to a customshouse for clearance. There are eight main custom houses and ten border sta-tions is Afghanistan including a central office in Kabul and major branches inKandahar and Herat. There are 1 main custom house and 3 small stations on the
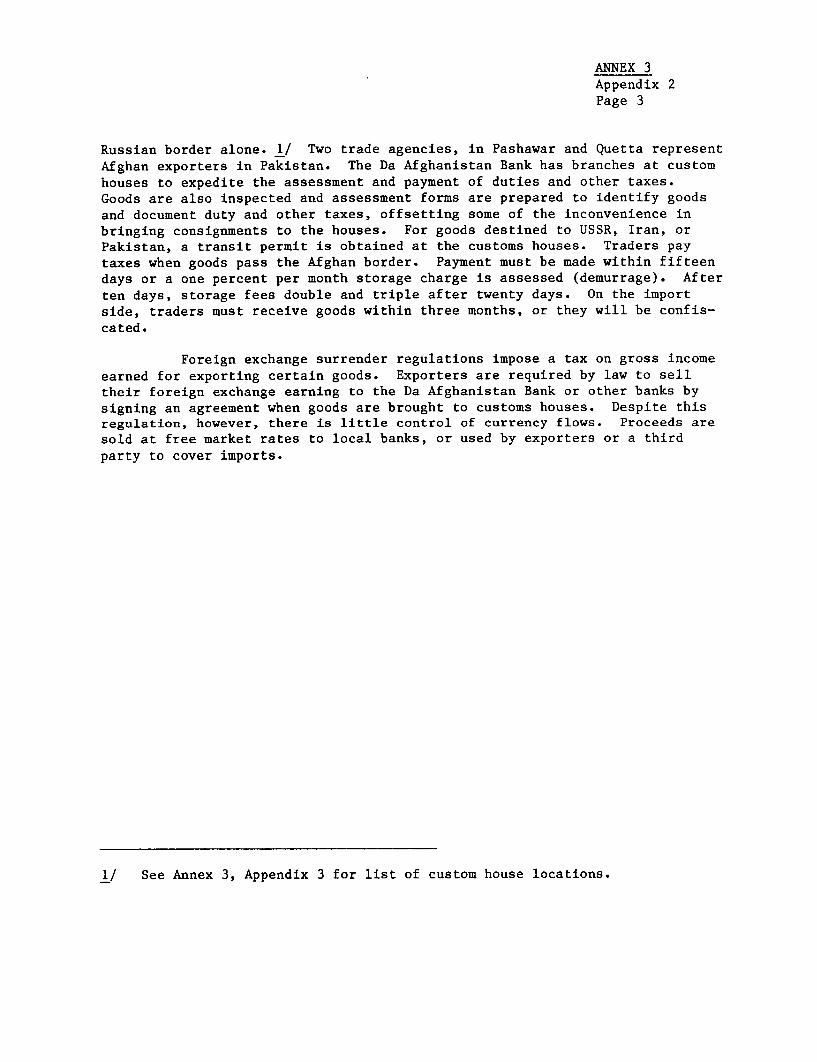
ANNEX 3Appendix 2Page 3
Russian border alone. 1/ Two trade agencies, in Pashawar and Quetta represent
Afghan exporters in Pakistan. The Da Afghanistan Bank has branches at custom
houses to expedite the assessment and payment of duties and other taxes.Goods are also inspected and assessment forms are prepared to identify goods
and document duty and other taxes, offsetting some of the inconvenience inbringing consignments to the houses. For goods destined to USSR, Iran, orPakistan, a transit permit is obtained at the customs houses. Traders pay
taxes when goods pass the Afghan border. Payment must be made within fifteendays or a one percent per month storage charge is assessed (demurrage). After
ten days, storage fees double and triple after twenty days. On the import
side, traders must receive goods within three months, or they will be confis-cated.
Foreign exchange surrender regulations impose a tax on gross income
earned for exporting certain goods. Exporters are required by law to sell
their foreign exchange earning to the Da Afghanistan Bank or other banks bysigning an agreement when goods are brought to customs houses. Despite thisregulation, however, there is little control of currency flows. Proceeds aresold at free market rates to local banks, or used by exporters or a thirdparty to cover imports.
1/ See Annex 3, Appendix 3 for list of custom house locations.
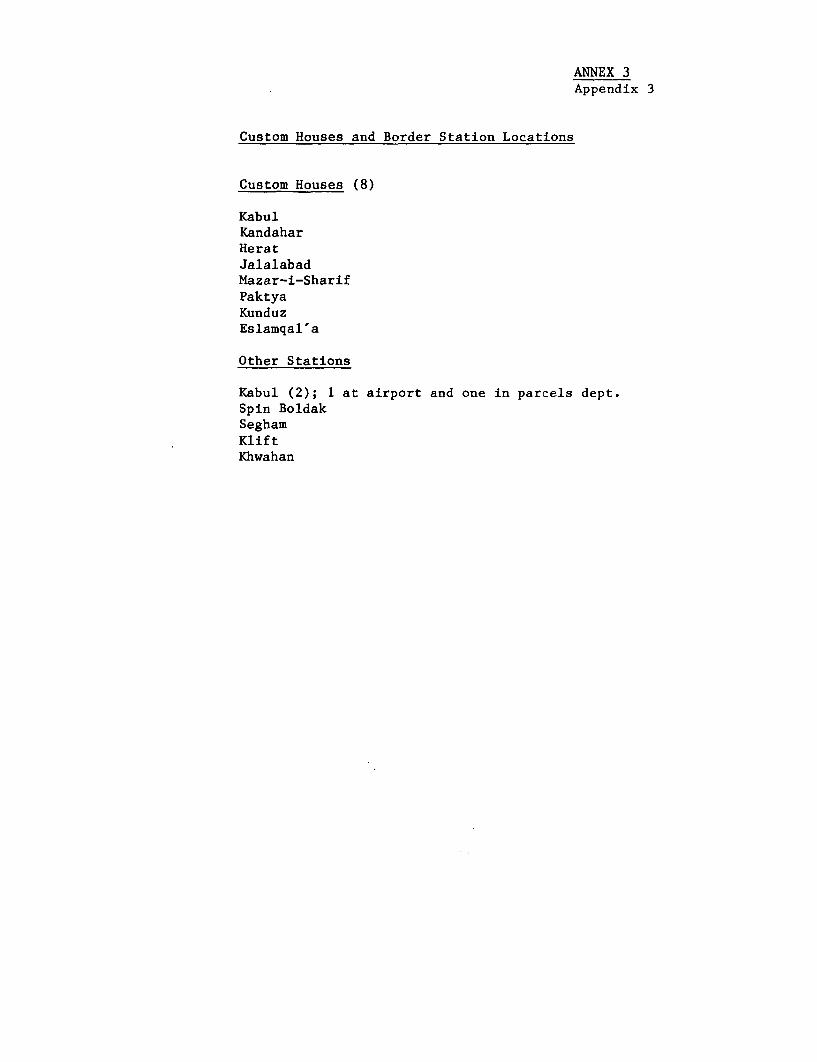
ANNEX 3Appendix 3
Custom Houses and Border Station Locations
Custom Houses (8)
KabulKandaharHeratJalalabadMazar-i-SharifPaktyaKunduzEslamqal'a
Other Stations
Kabul (2); 1 at airport and one in parcels dept.Spin BoldakSeghamKliftKhwahan
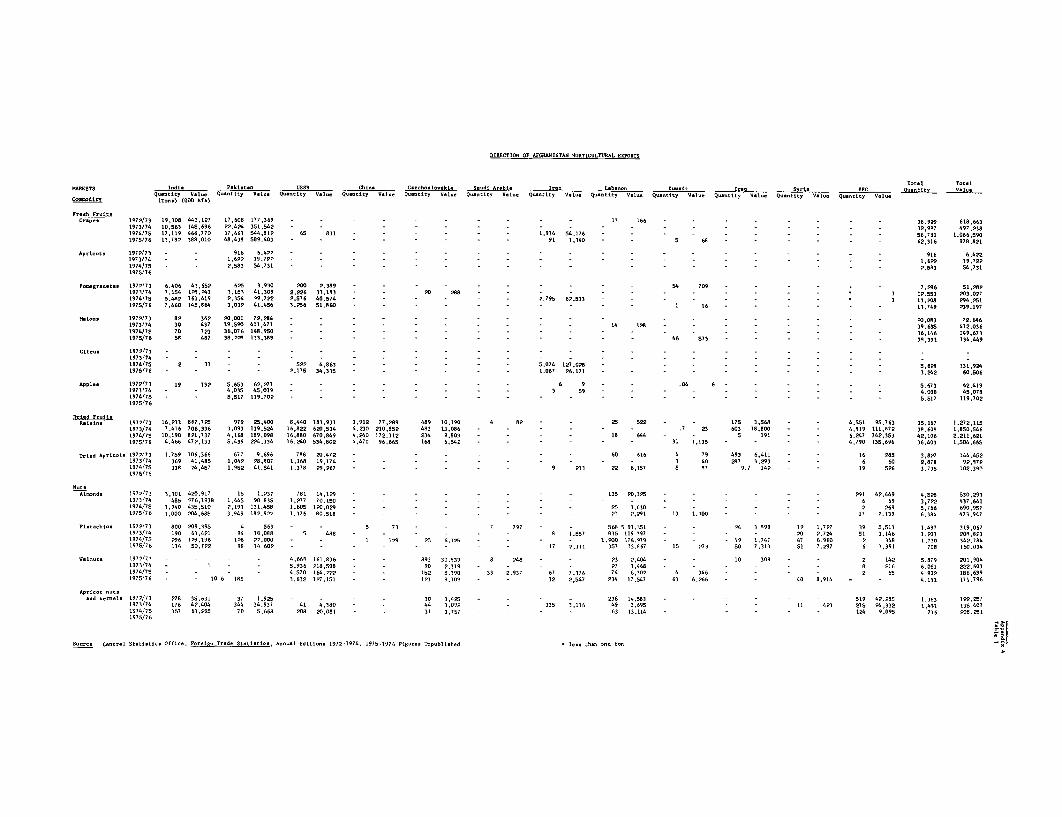
DIRECTION IF AF0RANISTAN_L0ORTICOITORA EMRTRS
MARKE0TS india Pakiena USSR - -China Cneo.thalnnakia Saudi Arabia ir- _Leb-o Kwjait Ira S-ria E Q-nte Total
4o,edit. ~~~~~~~Quant ity Value Quantit Value Quatity Value Quan.tity Value Quanity Value Quatity Value Quatity V.Iut Qu-nity Value Qunity Value Quanity Value Quantty Value Quan.tity Value
F-ah E-tuttira-pta 197P7/73 19.308 441,127 17,608 17 7369 - - - -- - - - -13 166 - - - - - -36.929 618.663
1973/7 10,563 14:9,89 22,424 351,54 - - - - - - - 12,917 497.238194/75 17,19 466,770 37,663 544.812 60 031 - - - - 1,934 54,176 - - - - - - -56,791 1.066,59R
1975/76 13,797 389,010 49,438 589.403 - - - -- -91 1,940 - -5 68 62,316 979.821
Atrinote 1972/73 - - 916 6,427 -- - - - - - - - - - - - - - - - - - - 816 6.622~~~~~~~~~~~~~~~~~~~~~~~~~~~~~~~~~~~~~~~~~~~~~~~~~~~~~~~~~~~~~~~~~~~~~~~~~~~~~~~~~~~~~~~~~~~~166 21973/74 - - 1622 19.7P2 - - - -- - - 1622 19.721976/75 - - 2,583 54.731 - - - - - - - -2593 54.7311875/76
Petagrna... 1972773 6,406 43,662 62 9.3 _ - - - - - 54 709 - - - - 796 531 29219771/74 7,5 V,t 313 41.9309 2. 2060 35.31493 - 2 19 --- - 3 12.503 PO3.O219747S 5,482 181,419 2.35 28,722 2,576 40.574 -- - 2.795 62.533 3 11,289s 294,251
197576 7,460 145,964 3,032 41.456 3.256 51.968 . - .1 1 13,749 219.197
9~na 1977/73 87 367 20,001 72.294 - - -- 0-2893 72.6461973//74 38 437 39,598 611,471 -- - . - . - -14 196 --- 3.1 1,1
5974(75 70 723 5~~~~~6,076 148,9580 36,146 149,6731975/76 58 697 38,VV8 133,389 -- -- -46 33 - - . . -3,3 1449
197/7 2 33 - - 52 4,963 1 5,874 12708- 3 2 13 1 9241957A/,7 3,3 1,067 28,6:171 - -3242 8.0
Applca 1972/73 19 132 5,653 67,~77 - - - . 6 9 -. 04 6 -563 '8 62, 4191973/4 . 4035 40,819 - - - - - -3 59 -- - -- - -408 45,878
194/75 - 5,517 119.702 - -- - - -- --- - -5.517 119.7021975/7 6
tried F-initRaicina 1977/73 ~~~16,033 186772 97 5,0 9,640 1839311 3,912 77,289 488 t0,190 4 82 -25 522 -175 3,568 4,501 95.763 35,167 1.272.115
I93/4 7,416 716336 3,0939 139.524 1682 2054 4,23 210,85 493 53,5086 . - - - .7 23 603 19,85 - - 4,919 111,972 38,638 1 ,t0,41974/75 10,190 921,737 4,168 189,098 16,880 670,84 420 172 .112 234 9,01 R 64 - .5 11 - . 627 34233 4,0 ,1,21975/7 6 4.466 47 2.133 5,439 224,334 1620 534.802 4,470 96.65 168 6,542 - - -31 1,135 - -4,790 15,696 36,403 1,554,i65
Dried Apriont 1977/73 1.759 106,366 67 7 9,696 788 20.470 - . - - -. 60 t16 4 79 493 6,411 - -66 285 3,827 16:4,5197374 369 41,485 1,042 28,907 1.168 19,174 . - . . - . . - 3 40 287 3,293 . 6 68 2.,979 92,972
19747 33I447 1952 4.4 1,37 2927 , . . . . .9 213 22 6,157 1 97 9.7 142 - .19 526 3.3 102,3t71975/176
Al-tda 1970/31, 3,301 420,917 15 1.237 79,1 14,127-. - 135 28,325 - 91 47.449 4,528 530,273193/4 485 276,138 1,44 90 3 1,777 70.150 - - -6 69 3,722 137,6411974/75 1,940 435,610 2.19 131,45 165 2809 - 25 Ib63D -P 269 5,76i 690,907
17/6 1,000 28,65 3 a4 19,aO36 8.518 -Pi -7 7,291 13 1.350 17 7.139 6.3A4 47 3.947
pian-rbta 1932173 800 289,395 4 563 - - 5 73 . 7 7 97 . 568 V 91.351 - 3 3 R99 12 1,777 39 5,513 1,487 319,067197 3/74 190 63,421 94 18. 098 I 49R A 1.557 835 119 397 . 28 2.72 51 3,146 1,283 280.8231974/75 296 1y9,196 126 2V.0 - . 29 2 6.525 . , I.28 17.7 - . . 1,747 47 6.960 P 34 3710 340,3041975/76 14 5,7 990 1 602 . - 17 2,111 3~57 103,9A6q7 i5 2773 50 7.311 51 7, 297 6 7,391 709 168.034
WalutB 97/3- 4.669 161.936 8 93 30,939 9 248E 23 244 - -10 309 -2 142 5,879 281,90419737 1 I 5,936 218,598 . V 2.1 77 1.6 - 216 6,0761 222.603
1974/75 .. . - ~~~~~~~~~~~~~4,570 164,2212 - . 12 5.390 33 2 .937 67 7.0376 74 63V 4 46 . -2 5 4,7 18631975'76 . - 19 6 185 3.630 127151 . , 13 019, . 2 2,547 34 7,540 63 6.260 . 4 ,914 -4,155 171.9
ed trta 19771/73 278 35.631 37 1,920 - . . . 30 3,425 - . - 236 14.58,3 - . . . - 519 42.205 1 1 63 122.25717/4 176 47,404 344 34,937 41 4,380 - . 44 302 - - 335 3,116 49 3,695 11 423 275 24,332 1.494 135.407
134/5 157 63,095 70 5.6 8 801 - - 31 3,757 - .63 13.114 - - - - 124 905 7910 2089.281197376
Source Contra S-aiioi- 0f0i-, F-rito Trede Snai-aite - .na Eidltinna 1972.1974. 1975.1976 Floure t/ntbltehed I...aeh-nOt o
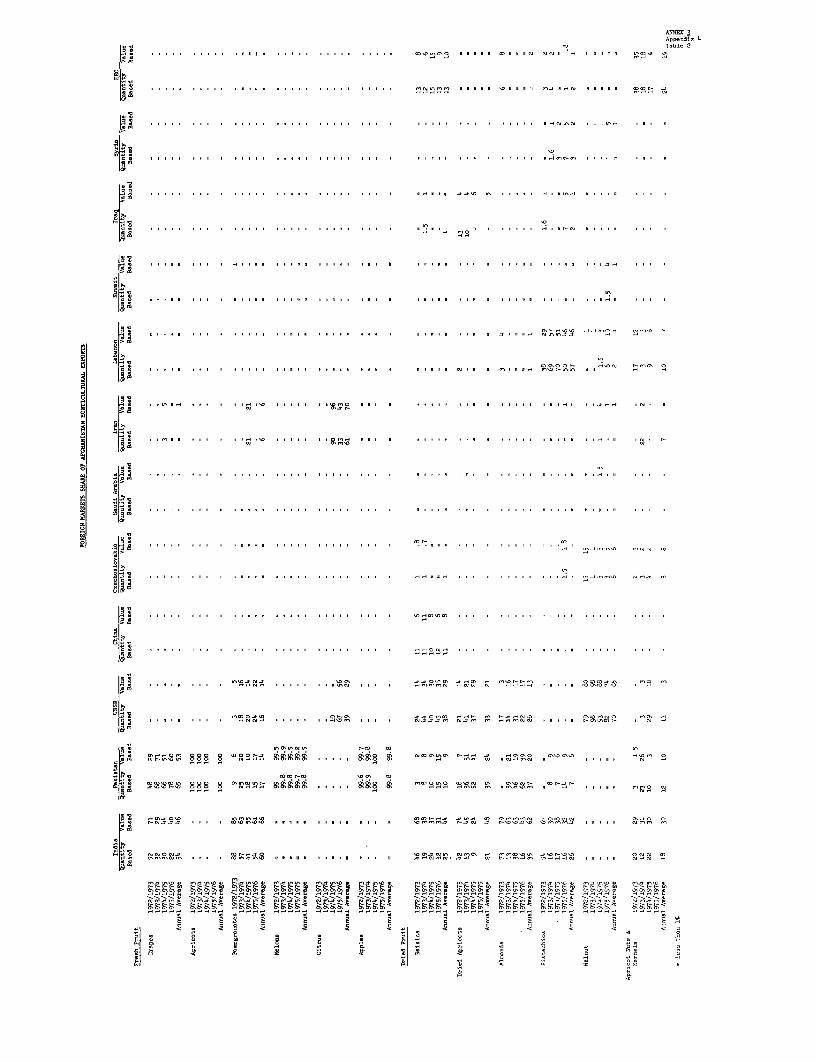
ANwEn 3Appendix A
CC en ~~~~~~~~~~~~~~~~~~~~~~~~~~~~~~~~~~~~~Table 2
. . . . .' . . . .I.V h. . . .I. . H *I - * I*.. . . 0
. . . . . . .. . . . . . . . . . . . . . . . .O rO .o n .r rr.
Ct ~ ~ ~ ~ ~ ~ ~ . .
I~~~~
8~~~~~~~~~~~~~~~~~~~~..
.''' . ..Ho-. ... ..' . . . . . ee . . .H.
TT~R888 8 g& b-HoH. . .non' .oe
9 Kll 11 .1 . . .. . . . H. . . . . . . . .0 '' "I, H.
F3 88 rH n & AhI en
ICC HOtO O'C 'HUNenH 'C H Hb-H4 OW'4 Ci o'enennHb-OHHCO o'HH H~~~~~~~~~~~~~~~~~~~~~~~~~~~~~~~~~~~~~~~~~~~~~~~~S7
MaOHMO4. ' HC n 'C ale- at, U MUneen MSH r~'. OH'rHt r,rHHn
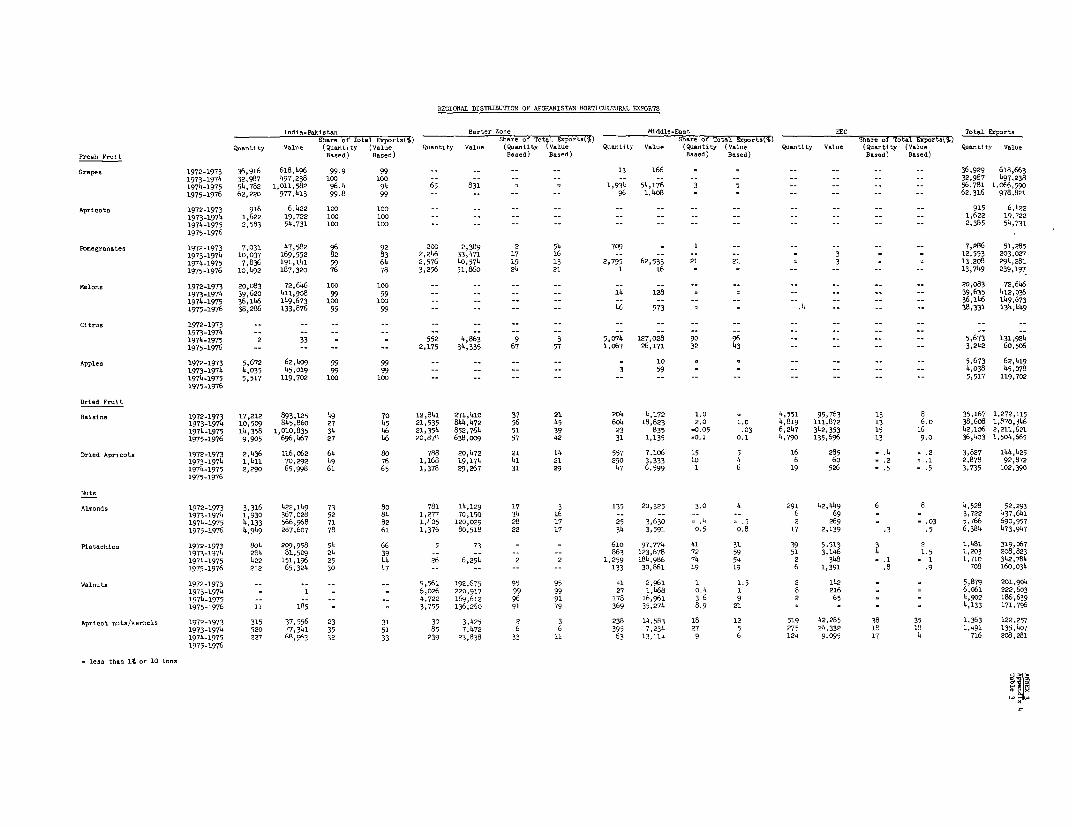
VISIONiAL DI STRIBUTI0S OF AF("IASITANI HORTI055T¶I1L fKPGRTS.
Iodia-Pakistao Barter Zone Middle-East EEC Total ExportsShar or Total Ebp-rte(%) Share 0 f Total §Frurts(%) Share of Total ENPnrt($(SaeoTotl)pra%
QuantIty Value (Qua.ntuty (Value Qua.ntuty Value (Quantity (Value Quantity aloe (Quan.tity (Value Quantity Value (Quantity (Value Quantity ValueB'reh Fruit Base d) Baoed( Based) Based) Booed) Based) Based) Based)
Grapes 1972-1973 36,916 618,496 99.9 99 - - - - 13 166 -- - -- 36,929 61f],6631973-1974 32,987 497,238 150 1500- - - - - - --- -- -- -- 32,987 497,2381974-1975 54,782 1,011,582 96.4 94 65 831 1,934 54,176 3 5 - -- - -- 56,781 1,066,5901975-1976 62,220 977,413 99.8 99 -- -- - 96 1,408 -- - - -- 62,3i6 978,821
Aprtnots 1972-1973 916 6,422 too 100 - -- - - - -- - --- - --- 915 6,4221973-1974 i,622 19,722 100 100 - -- - - - - - --- - - - 1,622 19.7221974-1975 2,583 54.731 100 100 2- - - - - - - - - - - - ,385 34,7311975-1976
Poaegr.a.at-s 1972-1973 7,031 47,582 96 92 2200 2,389 2 54 709 = 1 --- - - -7,286 51,2851973-1974 10,037 169,552 82 83 2246 33,4.71 17 16 -- - - -- = 3 = - 12,553 203,0271974-1975 7,836 191,141 59 64 2,576 40,574 19 13 2,795 62,53-3 21 21 = 3 -13,208 294,2811975-1976 lo,492 187,320 76 78 3,256 51,8660 24 21 1 i6 -- - - 13,749 239,197
Me1..s 1972-1973 20.083 72,646 100 100 -- -- -- 20- - -- - - --- -o,083 72,6461973-1974 39,620 411,908 99 99 - - - 14 128 =- - - 39,635 412,0361974-1979 36.146 149,673 100 100 -- - - - - - - - - - --- 36,146 149,6731975-1976 38,286 133,876 99- - - -46 573 = 4 -- - - 38,331 134,449
Citru 1972-1973 -- -- -- -- - - - - - -- -- -- -- -- --1973-1974 -- -- ---- - -- --- - ------ -- -1974-1975 2 33 - - 552 4,863 9 3 5,0C74 127.028 910 96 - - - 5,673 131,9241975-1976 -- -- -- -- 3,175 3433 67 57 1,067 26,171 32 43 - - - - 3,242 6o,5o6
Apples 1972-1973 5,672 62,409 99 99 -- -- -- -- = 10 - - - 5,673 62,4191973-1974 4,o35 45,019 99 99 - - - - 3 59 = - - - - 4,038 45,9781974-1975 5,517 119,702 100 100 - - - - - - - - - --- -- 5,517 119,70221975-1976
Soled Fruit
RaSsies 1972-1973 17,212 893,1253 149 70 12,841 271,410 37 21 204 4,172 i.S 4,551 95,763 13 8 35,167 1,272,1151973-1974 10,509 845,86o 27 45 21,535 844,472 56 45 6,04 18,823 2.0 1.2 4,819 111,872 13 6.o 38,6o8 1,$t'0,5461974-1975 14,358 1,010.835 34 46 21,354 852,764 51 39 23 835 -0.05 .03 6,247 342,353 15 i6 42,108 2,211,6211975-1.976 9,905 696,467 27 46 20,8713 638,009 57 42 31 1,135 -0.1 0.1 4,790 135,696 13 9.0 36,403 1,504,665
Dried Aproonts 1972-1973 2,436 116,0o6 64 8o 788 20,472 21 14 557 7,108 15 5 16 285 .4 -. 2 3,827 144,4251973-1974 1,4i1 70,292 49 76 i,168 19,174 41 21 290 3.333 10 4 6 6o -. 2 =.i 2,878 92,8721974-1975 2,290 65,998 6i 65 1,378 29,267 31 29 47 6,599 1 6 19 526 -. 5 =.5 3,735 102,3901975-1976
Huts
Al.onds 1972-1973 3,316 422,149 73 So 781 14,129 17 3 135 20,325 3.0 4 291 42,469 6 8 4,528 52,2931973-1974 1,930 367,028 52 84. 1,277 70,150 34 16 -- -- -- -- 6 69 -3,722 437,6411974-1975 4,133 566,968 71 82 1,f~05 120,029 28 17 25 3,63o - .4 .5 2 269 - 03 5,7616 690,9571975-1976 4,949 287,607 78 6i 1,376 8o,5i8 22 17 34 3,591 0.5 0.8 17 2,139 .3 .5 6,364 473,947
Pistanhios 1972-1973 Sot 209,958 54 66 5 73 = 6io 97,774 4i 31 39 5,515 3 2 i,48i 319,4671973-1974 28t 81,509 24 39 -- -- -- -- 63 1273,678 712 59 51 3,146 4 1.5 1,203 208,8231974-1975 422 151,196 25 44 26 6,254 2 2 1,259 184,986 74 54 2 348 .1 -1 1,710 342,7841975-1976 012 65,324 30 47 -- -- -- -- 133 30,861 19 19 6 1,391 .8 .9 708 160,034
Walnuts 1972-1973 -- -- -- -- 5,561 192,675 95 95 41 2,96i 1 1.5 2 142 =-5,879 201,9041973-1974 = 1 -6,o26 220,917 99 99 27 1,468 o.4 1 8 216 -6,261 222,6031974-1975 -- -- --- 4,722 169,612 96 91 178 16,961 3.6 9 2 65 4,902 186,6391975-1976 11 1i85 3 5755 136,26o 91 79 369 35,274 8.9 21 - - -4,133 171,796
Ajoln-t nuotres 1972-1973 315 37,556 23 31 30 3,425 2 3 238 14,583 18 12 519 42,285 38 35 1,363 122,2571973-1974 520 77,341 35 51 85 7.472 6 6 395 7,234 27 5 275 21,332 18 12 1,491 135,4011974-1975 027 68,963 32 33 239 23,838 33 11 63 13,114 9 6 124 9,095 17 4 716 208,2811975-1976
- less than 1% or10 ton
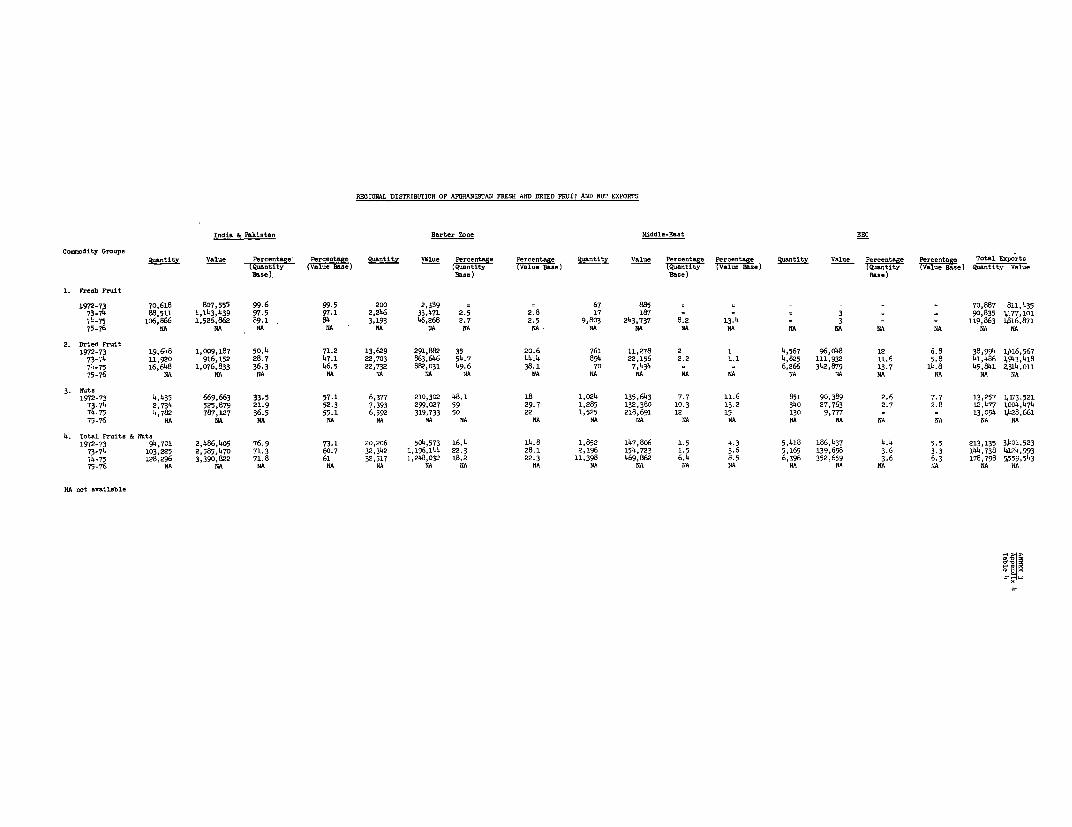
REGIONAL DISTRIBUTION OF AFGRANISTAN FRESH AND DRIED FRUIT AND RUT EXPORTS
India & Pakistan Barter Zone Middle-East EEC
Coodity GroupsRuantity Value Percentage PercentaBe Quantity VIlue P tge Percentage Quantity Value Percent Percentage Quantity Value Percentage Percenta Total Enporta
tRuartItf (9
IaIi8 6
se, ) (Ruantity (V agu 4aste) VtTleaitt ue 2ase) -u( ntity E ease) Quantity Valuemae) Sse) Bgse) Base)
1. Fresh Fruit
1972_ 70,618 807,555 99.6 99.5 200 2,389 = 67 885 . - _ _ 70,887 811,43513-77 8,:511 1,143,439 97.5 97.1 2 2ll6 33,471 2.5 2. 17 7S 0,887 81,435104 7 87 ~~~~~~~~~~~~~~~~~~~~~~~~~~~~~~-3 = 90,835 1,77,10174-75 106,S66 1,526,862 39.1 84 3,193 46,268 2.7 2.5 9,803 243,737 8.? 13.4 = 3 = = l9,S63 tL.86,8775_76 NA NA NA Na - NA NA NA NA MNA NA NA NA N4A NA NA NA NA NA
2. Dried Fruit1972-73 19,648 1,009,187 50.4 71.2 13,629 291,882 35 20.6 761 11,278 2 1 4,567 96,048 12 6.8 38,994 1416,567
73-',4 11,920 916,152 28.7 47.1 22,703 863,646 54.7 44.4 894 22,156 2.2 1.1 4,825 111.932 11.6 5.8 41,486 1943,4187i_75 16,648 1,076,833 36.3 46.5 22,732 882,031 49.6 38.1 70 7,434 = 6,266 342,879 13.7 14.8 45,841 z314,o1175-76 NA NA NA NA NA NA NA NA NA NA NA NA NA NA NA NA NA NA
3. Nute1972-73 4,435 669,663 33.5 57.1 6,377 210,302 48.1 18 1,024 135,643 7.7 11.6 851 90,389 2.6 7.7 13,257 1,173.521
73.74 22,734 525,879 21.9 52.3 7,393 299,027 59 29.7 1,285 132,380 10.3 13.2 340 27,763 2.7 2.8 12,477 1004,47474-75 4,782 787,127 36.5 55.1 6,592 319,733 50 22 1,525 218,691 12 15 130 9,777 = = 13,094 1,428,66175_76 NA NA NA NA NA NA NA NA NA NA NA NA NA NA NA NA NA NA
4. Total Fruits & Nuts1972-73 94,701 2,486,405 76.9 73.1 20,206 504,573 16.4 14.8 1,852 147,8o6 1.5 4.3 5,418 186,437 4.4 5.5 213,135 3,401,523
73-74 103,225 2,585,470 71.3 60.7 32,342 1,196,144 22.3 28.1 2,196 154,723 1.5 3.6 5,165 139,698 3.6 3.3 144,738 4.14,993(4-75 128,296 3,390,822 71.8 61 32,517 1,248,032 18.2 22.3 11,398 469,862 6.4 8.5 6,396 352,659 3.6 6.3 178,798 5,559,54375-76 NA NA NlA NA NA NA NA NA NA NA NA NA NA NA NA NA NA NA
NA not aailable
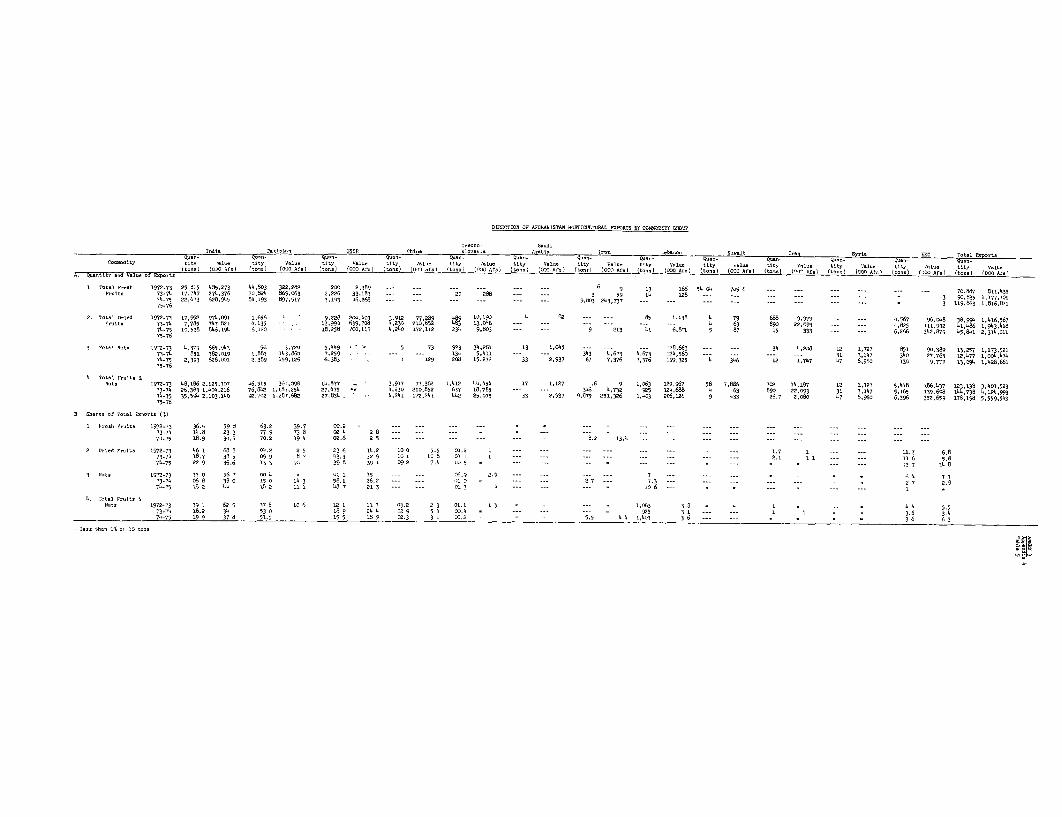
00IR10TIOl F1 AF0A ISTA O 1101C -A91EE93 to 11C080011y GM,
Creche- SaudI~~~~~~~~~~~~~~~~~~b-~
(ton) (AlIf.) (nn) (1r r) (os) (01M) (ton) 10"I -.1) (tnl (00 Aft) (tn) (009 Afs1
(non-1 07 Arl. (in-) P.AAa tn) (1 Pl (oo trt) (no OtAl tn) (1 Ala) (tr)(I0OaA. Q .. tilt a-d Value or -oI(o-rt
AI na oth 1711 25,015 635,2173 .o.o,A3 3112182 2--9--3119 6 9 I3 AA6 54.l~ 7096 A---.89---
P,15 73-71 17.747 271,376 71.1121 869,5 11221 33183 --- 60- 53 Al 128 3 9,63 1,77,1)7 -75 22,673 628,9415 3u,013 897,917 3.103 46,269 - -- -- - 9q,003 243,73 -- -- -- . 19.063 1.016,75-76
2. Total onlrd 1972-73 17,992 97A.019 1,6561 912 -14 9,22 1,0 .12 173,211 4309 11~1,10 1 02 85 1.13B 4 79 606 9,979--- -- 4.567 96.3018 311,996 1.416.5677ot 3-74 7,711 7u7 02A 1, 35 - . 17,993 689,30 1230 211.,.12 Itt 13,3211 4 63 890 22.093-1--- ,025 tA.932 41,486 1,91.3,418717 10,58208 816,194 6,12 . . 18,250 103,119 4.2111 172, 112 231, 9.803 9 23 1 ,' 5 07 15 333--- -- 6.266 312,019 050841 2. 31.011173-76
3 --- 'Nt ~ 1972-73 1,37,9 869.0'3 06 tl 72 5,109 , 4 5 73 90 31,204 13 1,0458 7-- -- '8,663 3 4,0 12 1,737 851 90.389 13,257 1,173,52173-71 Osi 382.1119 1,0113 143t,860 7,259 - -- - 131.5,111- 33 1,73 1,-312,3331 3.0147 310 27,763 12,477 1,001,17174-73 2,393 620.901 2,3119 159, 126 6,303 I 19 208 15,277 33 2,937 67 7,376 7,376 190,325 4 316 12 1,717 47 6,390o 133 9T773 13,1191 1,429,166175-76
Iota 1932-73 40, A0 2.12 5.301 1655 3,9 I83 - 397 7,0 ,1 141 1 ,2 6 9 ,33 129,967 50 7,886 732 11,107 12 1,727 5,018 186,137 123,138 3,181,52373-74 26,303 4,16216 76,042 1.161,251 27.175 1,230 2t08,52 637 10,785 -- 316 1,332 903 L24.600 . 63 393 22,093 31 3.167 5.165 139, 690 111,738 41,124, 993"75-o 35.594 2,113,118 90,71 11,207,682 27,031 . 4,201 17 2,21 442 25.075 33 2,937 .8,79 251,326 1.403 296,126 9 433 26.7 7,60o 47 6,96o 6.396 357,659 170,196 5,559,51315-76
A lora 7,-lt 17273 311.1 5908 63.2 39,7 0. 73-71 14.0 23 3 779 730 02 28B74-75 18.9 34.6 703,2 491 32.6 2 5 -- 0- - - - .2 13.11 -- -- -- ---- -- -- --
2 rIeid r,-olt 1972-7,3 10.1 60 01 ~ .2 2.5 2361 11.2 131 8 .5 01.7 1 -- 1.7 1 11,7 6.87374 t8.7 30 5 09 9 8.7 13.3 32 9 10 1 10 8 1 11 9. II lt.6 s.074-75 22 9 36.6 13 00 3911 30 1 D992 7.4 705 - -- -- ----- ----- S--137 11 8
7 ca 19731-73 33 0 567 till - 41l 15 06.9 2.9 7 .- Sa44 773-71 00 11 38 81 15 I 11 320. 62 01 0 7 . - 57 2
74-75 1)2 4.. 12 411 4137 21 3 01L3 4I - - --- io 6 ---- S………… I-
4. Total Froina ione 1972-73 39 1 02 9 37 3 126 12 1 11 3 03.2 2 3 01.1 1 3 - a 1.63 3 8
73-74 10.2 31 539 13 114 1 5 1 971 9253 31 A 1 -3.6 3471-75 1909 370 51.5 155 189 00.3 3I 00.2 -- 5.5 1 4 1,403 3 86 --- 3 6 6 3
es hen A or10on
ANNEX 4
Marketing - Domestic and Foreign
Table of Contents
Appendix 1 Afghanistan Market Distribution Systems for Vegetables, Freshand Dried Fruit and Nuts
Chart 1 Typical Domestic Marketing System
Chart 2 Fresh Fruit Product Flow Chart
Chart 3 Dried Fruit Product Flow Chart
Chart 4 Nut Product Flow Chart
Appendix 2 Three Principal Export Marketing Systems
Appendix 3 Raisin Institute
.Table 1 Export Raisin Production, Processing and Marketing Costs inAfghanistan (May, 1976)
Table 2 Annual Raisin Prices of Selected Exporters in the U.K. Market(1973)
Appendix 4
Table 1 World Competitive Position of Afghan Producer Prices
Appendix 5 Cooperative Development in Afghanistan
Appendix 6 Market Prospects for Individual Commodities

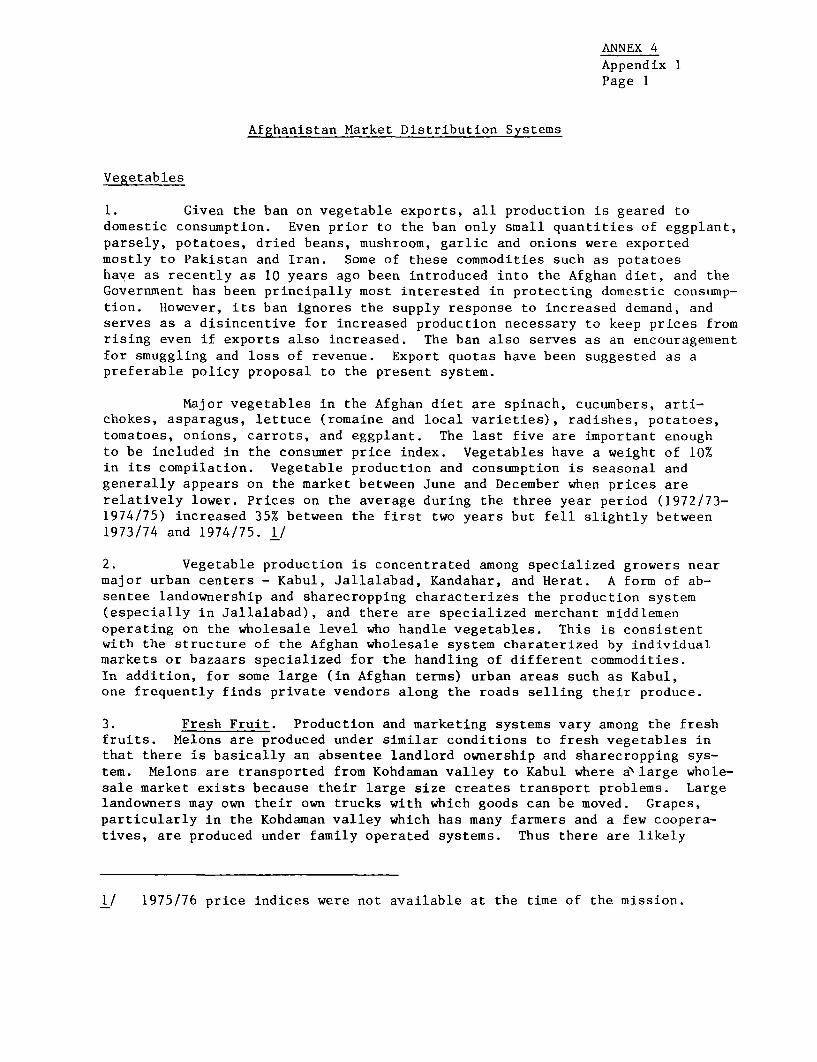
ANNEX 4Appendix IPage 1
Afghanistan Market Distribution Systems
Vegetables
1. Given the ban on vegetable exports, all production is geared todomestic consumption. Even prior to the ban only small quantities of eggplant,parsely, potatoes, dried beans, mushroom, garlic and onions were exportedmostly to Pakistan and Iran. Some of these commodities such as potatoeshave as recently as 10 years ago been introduced into the Afghan diet, and theGovernment has been principally most interested in protecting domestic consump-tion. However, its ban ignores the supply response to increased demand, andserves as a disincentive for increased production necessary to keep prices fromrising even if exports also increased. The ban also serves as an encouragementfor smuggling and loss of revenue. Export quotas have been suggested as apreferable policy proposal to the present system.
Major vegetables in the Afghan diet are spinach, cucumbers, arti-chokes, asparagus, lettuce (romaine and local varieties), radishes, potatoes,tomatoes, onions, carrots, and eggplant. The last five are important enoughto be included in the consumer price index. Vegetables have a weight of 10%in its compilation. Vegetable production and consumption is seasonal andgenerally appears on the market between June and December when prices arerelatively lower. Prices on the average during the three year period (1972/73-1974/75) increased 35% between the first two years but fell slightly between1973/74 and 1974/75. 1/
2. Vegetable production is concentrated among specialized growers nearmajor urban centers - Kabul, Jallalabad, Kandahar, and Herat. A form of ab-sentee landownership and sharecropping characterizes the production system(especially in Jallalabad), and there are specialized merchant middlemenoperating on the wholesale level who handle vegetables. This is consistentwith the structure of the Afghan wholesale system charaterized by individualmarkets or bazaars specialized for the handling of different commodities.In addition, for some large (in Afghan terms) urban areas such as Kabul,one frequently finds private vendors along the roads selling their produce.
3. Fresh Fruit. Production and marketing systems vary among the freshfruits. Melons are produced under similar conditions to fresh vegetables inthat there is basically an absentee landlord ownership and sharecropping sys-tem. Melons are transported from Kohdaman valley to Kabul where a'large whole-sale market exists because their large size creates transport problems. Largelandowners may own their own trucks with which goods can be moved. Grapes,particularly in the Kohdaman valley which has many farmers and a few coopera-tives, are produced under family operated systems. Thus there are likely
1/ 1975/76 price indices were not available at the time of the mission.
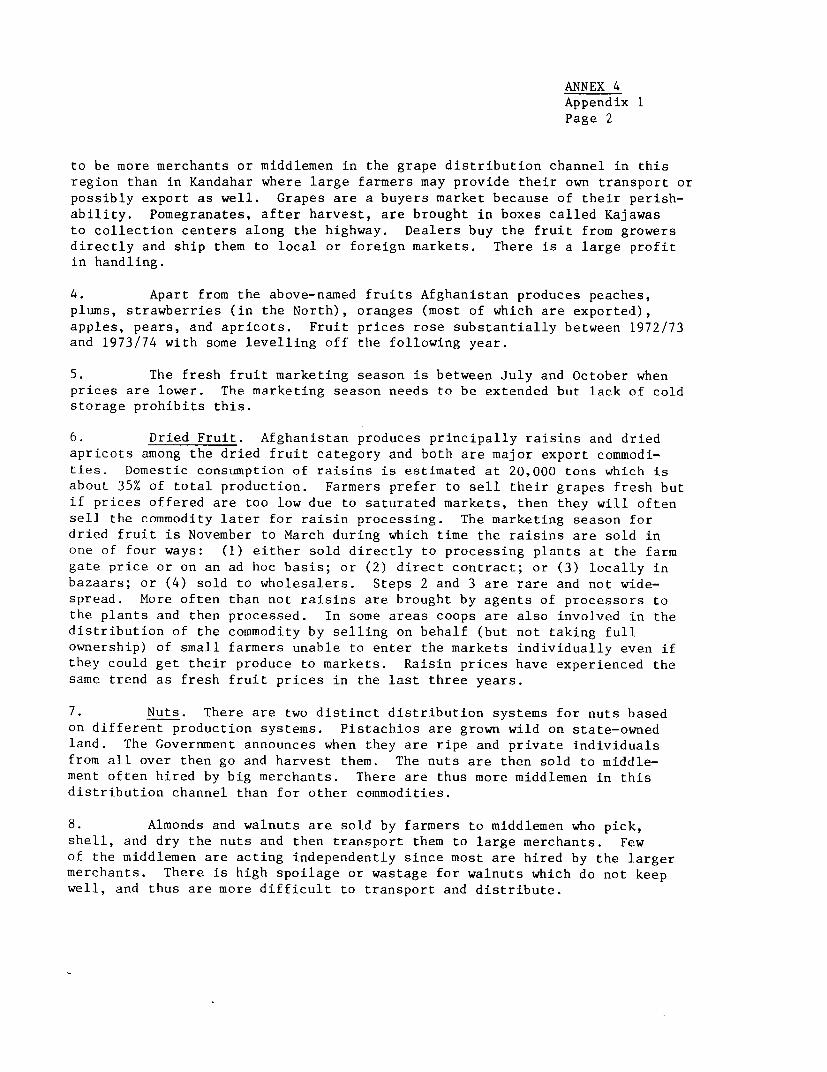
ANNEX 4Appendix 1Page 2
to be more merchants or middlemen in the grape distribution channel in thisregion than in Kandahar where large farmers may provide their own transport orpossibly export as well. Grapes are a buyers market because of their perish-ability. Pomegranates, after harvest, are brought in boxes called Kajawasto collection centers along the highway. Dealers buy the fruit from growersdirectly and ship them to local or foreign markets. There is a large profitin handling.
4. Apart from the above-named fruits Afghanistan produces peaches,plums, strawberries (in the North), oranges (most of which are exported),apples, pears, and apricots. Fruit prices rose substantially between 1972/73and 1973/74 with some levelling off the following year.
5. The fresh fruit marketing season is between July and October whenprices are lower. The marketing season needs to be extended but lack of coldstorage prohibits this.
6. Dried Fruit. Afghanistan produces principally raisins and driedapricots among the dried fruit category and both are major export commodi-ties. Domestic consumption of raisins is estimated at 20,000 tons which isabout 35% of total production. Farmers prefer to sell their grapes fresh butif prices offered are too low due to saturated markets, then they will oftensell the commodity later for raisin processing. The marketing season fordried fruit is November to March during which time the raisins are sold inone of four ways: (1) either sold directly to processing plants at the farmgate price or on an ad hoc basis; or (2) direct contract; or (3) locally inbazaars; or (4) sold to wholesalers. Steps 2 and 3 are rare and not wide-spread. More often than not raisins are brought by agents of processors tothe plants and then processed. In some areas coops are also involved in thedistribution of the commodity by selling on behalf (but not taking fullownership) of small farmers unable to enter the markets individually even ifthey could get their produce to markets. Raisin prices have experienced thesame trend as fresh fruit prices in the last three years.
7. Nuts. There are two distinct distribution systems for nuts basedon different production systems. Pistachios are grown wild on state-ownedland. The Government announces when they are ripe and private individualsfrom all over then go and harvest them. The nuts are then sold to middle-ment often hired by big merchants. There are thus more middlemen in thisdistribution channel than for other commodities.
8. Almonds and walnuts are sold by farmers to middlemen who pick,shell, and dry the nuts and then transport them to large merchants. Fewof the middlemen are acting independently since most are hired by the largermerchants. There is high spoilage or wastage for walnuts which do not keepwell, and thus are more difficult to transport and distribute.
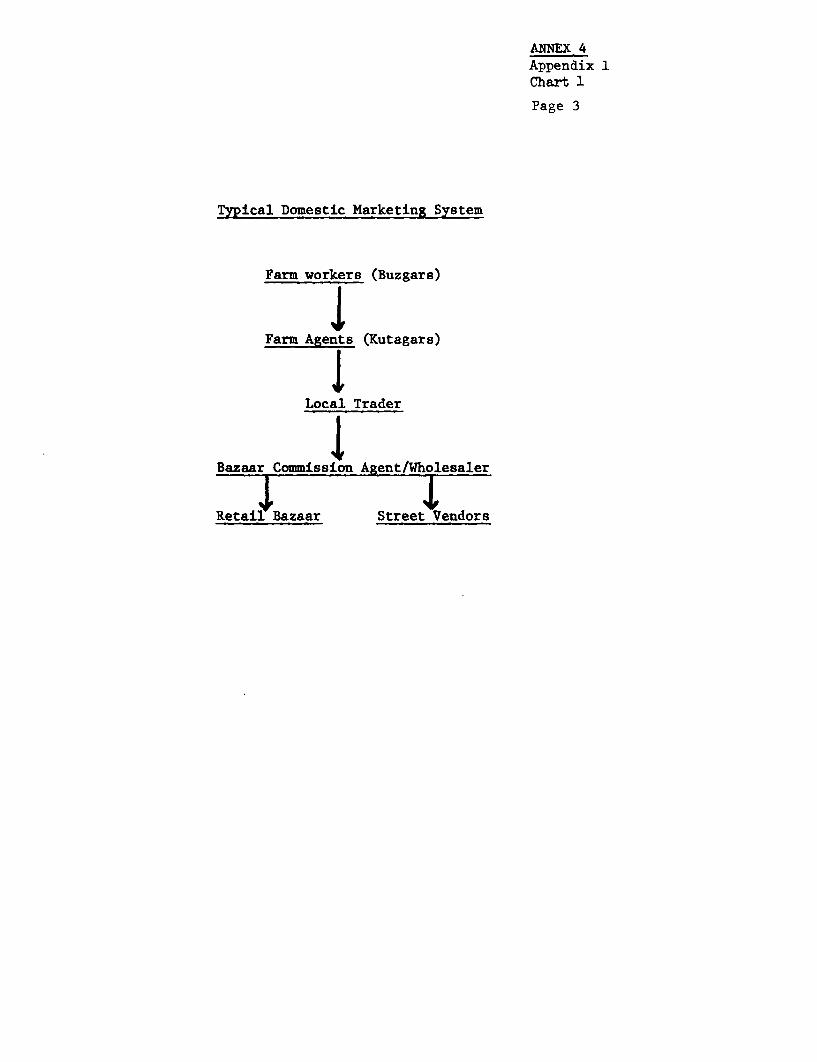
ANNEX 4Appendix 1Chart 1
Page 3
Typical Domestic Marketing System
Farm workers (Buzgars)
Farm Agents (Kutagars)
Local Trader
Bazaar Commission Agent/Wholesaler
Retai Bazaar Street Vendors
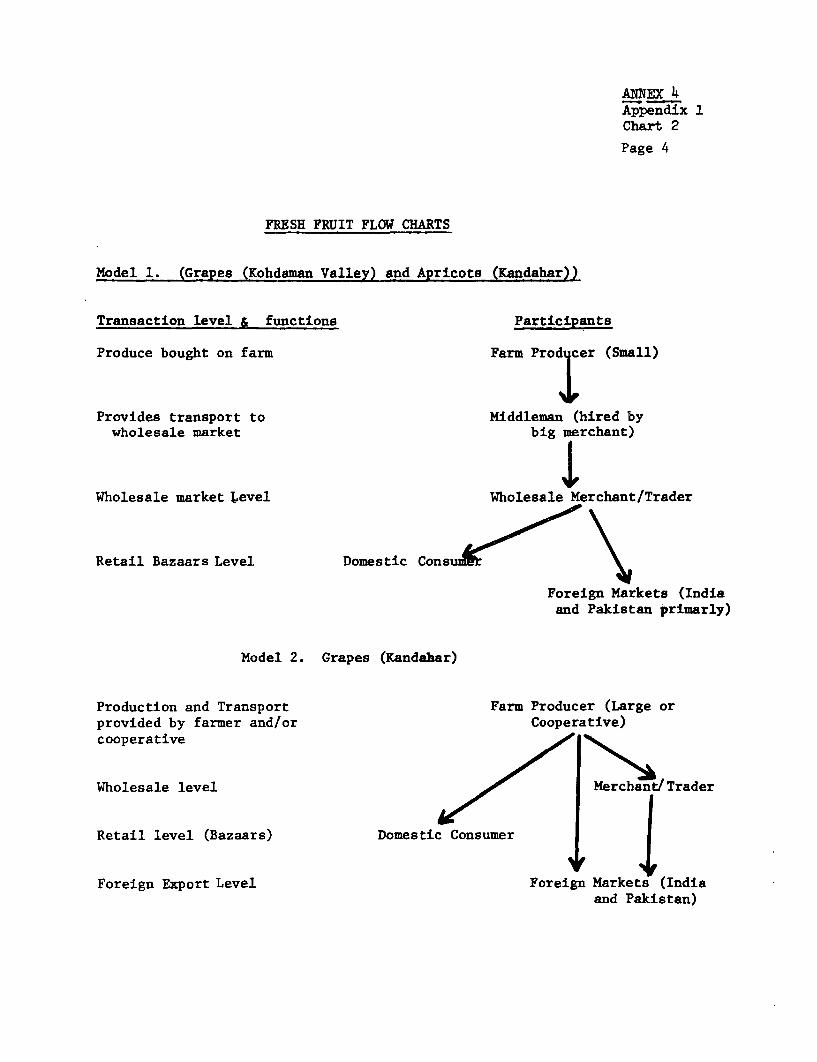
ANNEX 4Appe;ndix 1Chart 2
Page 4
FRESH FRUIT FLOW CHARTS
Model 1. (Grapes (Kohdaman Valley) and Apricots (Kandahar))
Transaction level & functions Participants
Produce bought on farm Farm Prod cer (Small)
Provides transport to Middleman (hired bywholesale market big merchant)
Wholesale market Level Wholesale Merchant/Trader
Retail Bazaars Level Domestic Cons
Foreign Markets (Indiaand Pakistan primarly)
Model 2. Grapes (Kandahar)
Production and Transport Farm Producer (Large orprovided by farmer and/or Cooperative)cooperative *44
Wholesale level Merchant/Trader
Retail level (Bazaars) Domestic Consumer
Foreign Export Level Foreign Markets (Indiaand Pakistan)
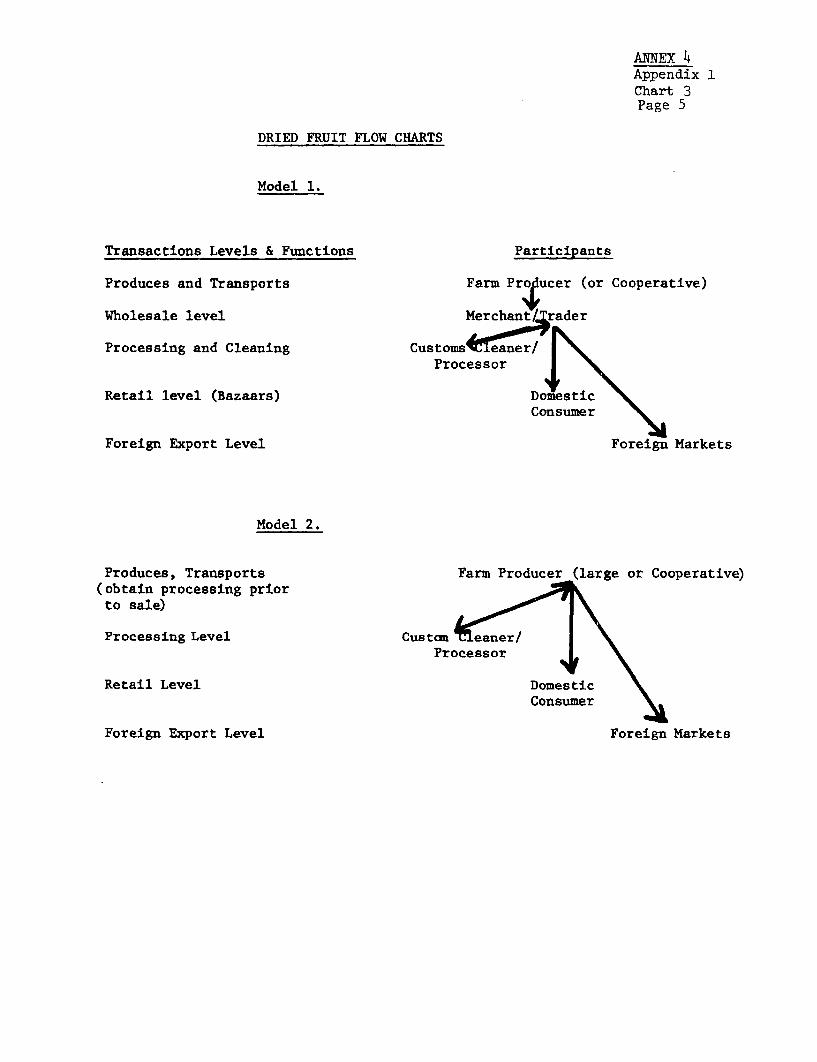
ANNEX 4Appendix 1Chart 3Page 5
DRIED FRUIT FLOW CHARTS
Model 1.
Transactions Levels & Functions Participants
Produces and Transports Farm Prz ucer (or Cooperative)
Wholesale level Merchant! rader
Processing and Cleaning Customs \nrProcessor
Retail level (Bazaars) Do esticConsumer
Foreign Export Level Foreign Markets
Model 2.
Produces, Transports Farm Producer (large or Cooperative)(obtain processing priorto sale)
Processing Level Custam eaner!Processor
Retail Level DomesticConsumer
Foreign Export Level Foreign Markets
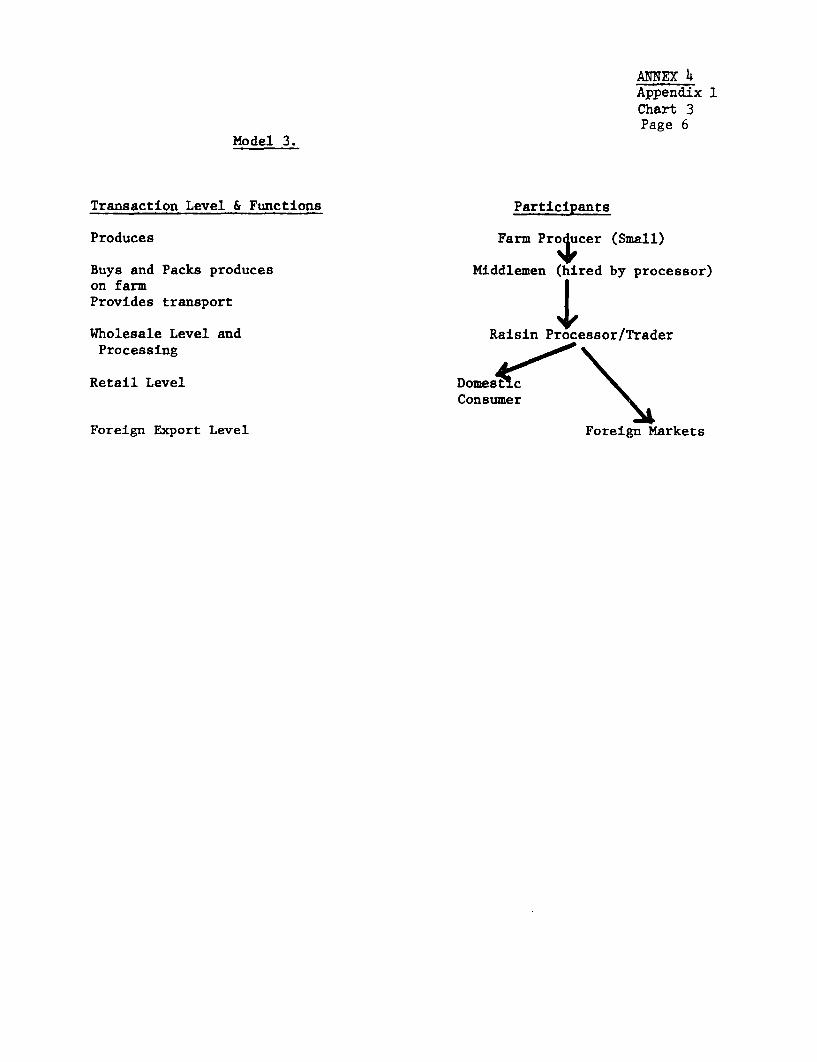
ANNEX 4Appendix 1Chart 3Page 6
Model 3.
Transaction Level & Functions Participants
Produces Farm Pro cer (Small)
Buys and Packs produces Middlemen (hired by processor)on farmProvides transport
Wholesale Level and Raisin Pr cessor/TraderProcessing
Retail Level Domes tConsumer
Foreign Export Level Foreign Markets
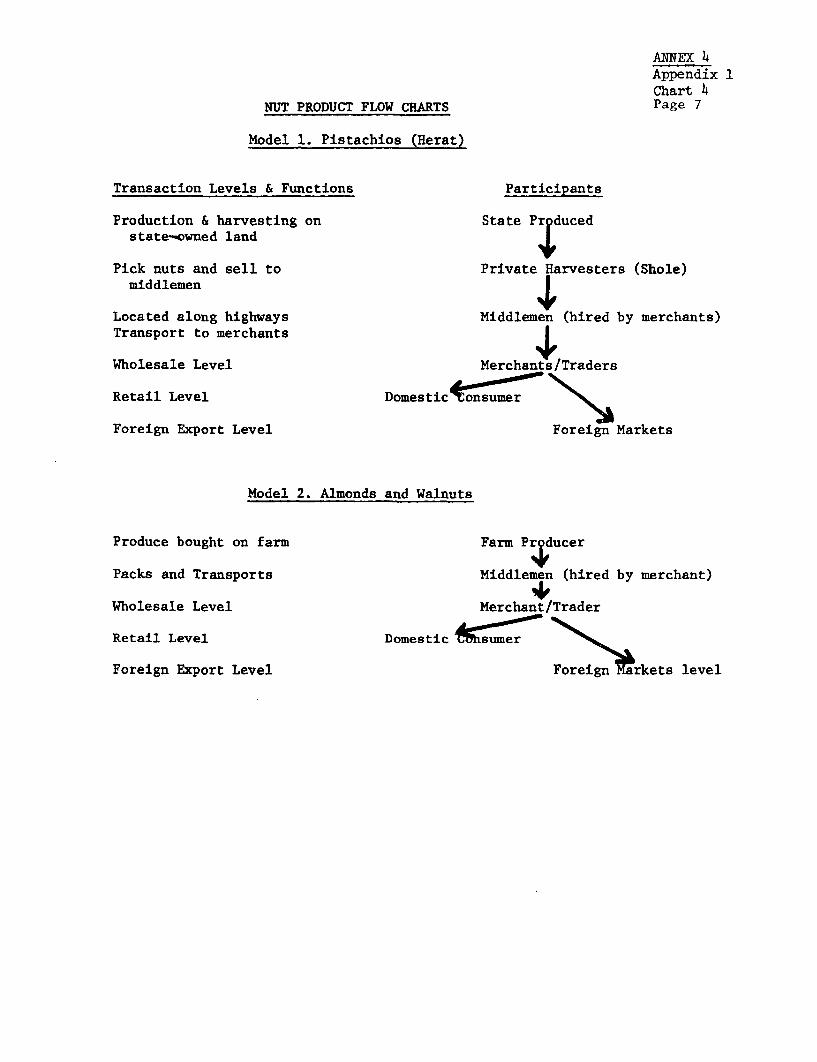
ANNEX 4Appendix 1Chart 4
NUT PRODUCT FLOW CHARTS Page 7
Model 1. Pistachios (Herat)
Transaction Levels & Functions Participants
Production & harvesting on State Pr ducedstate-owned land
Pick nuts and sell to Private Harvesters (Shole)middlemen
Located along highways Middlemen (hired by merchants)Transport to merchants
Wholesale Level Merchants/Traders
Retail Level Domestic'onsumer
Foreign Export Level Foreign Markets
Model 2. Almonds and Walnuts
Produce bought on farm Farm Pr ducer
Packs and Transports Middlemen (hired by merchant)
Wholesale Level Merchant/Trader
Retail Level Domestic *rsumer
Foreign Export Level Foreign ets level
ANNEX 4Appendix 2Page 1
Export Marketing Systems
There are three basic exporting systems depending on the region towhich Afghan exports are directed.
Trade with barter zone countries (USSR, Mainland China andCzechoslovakia) is conducted between private Afghan traders and designatedofficial organizations in the partner countries. Trade with Russia is handledby private Afghan traders either selected by the Afghan Government from a listsubmitted by the Chamber of Commerce or chosen by the Russian Resident TradeMission. Private Czechoslovakian organizations act as authorized independentjuridical persons and handle trade on behalf of their government.
Volume of Afghan exports are allocated among the selected traderswho then negotiate an equivalently valued import list. Lists can be modifieddepending on the class of traders. Goods are taken to customs house for pay-ment of duty and taxes and then shipped to barter zone destinations.. Financialinstitutions in the partner countries report prices to the Da Afghan Bank -agent of Afghan Government which then pays the traders. Final payments maydeviate from international prices depending on the quality of varied produce.Payments are made in clearing currency although China does allow for paymentin convertible currency as well. In the aggregate, if balances are greaterthan debts after a certain specified period (six months to a year) settlementsare required by restricting imports or delivery of added goods. Excesses areallowed to build up to a specified maximum, without interest charged. Fortrade with China, when net imports from Afghanistan exceed a specified levelthe excess is subject to a 2-5% overdraft charge.
A second major system applies to trade with India and Pakistan.It has been termed a "liberalized barter system". All transactions arehandled on a consignment basis. Goods are valued in rupees in the Indiancustoms houses. The State Bank of India, upon receipt of a certificate fromIndian customs, credits the account of Afghan traders or local agents workingon their behalf for the net value of the shipment. Rupees so credited areavailable for purchase of Indian products within one year. Trading associatescharge a 1% commission fee for their service. There are two such agencies inPakistan.
There is an important defect in this system. In each transaction,the exporter determines the quantity of goods involved in the consignment butvalue is determined by Indian customs such that price is ultimately based onan Indian offer usually subject to Afghan acceptance after the fact. Pricesare then reported back to Da Afghan Bank. The system is generally slow andcomplicated by lack of Afghan presence in the Indian customs.

ANNEX 4Appendix 2Page 2
Trade with other regions is conducted on a private/to private basiswith most terms of sale and purchase agreed upon prior to shipment. There arelong lags in payments to traders extending to as much as 6 months for driedfruit destined for more distant EEC markets. Trade payments are made inconvertible currency.
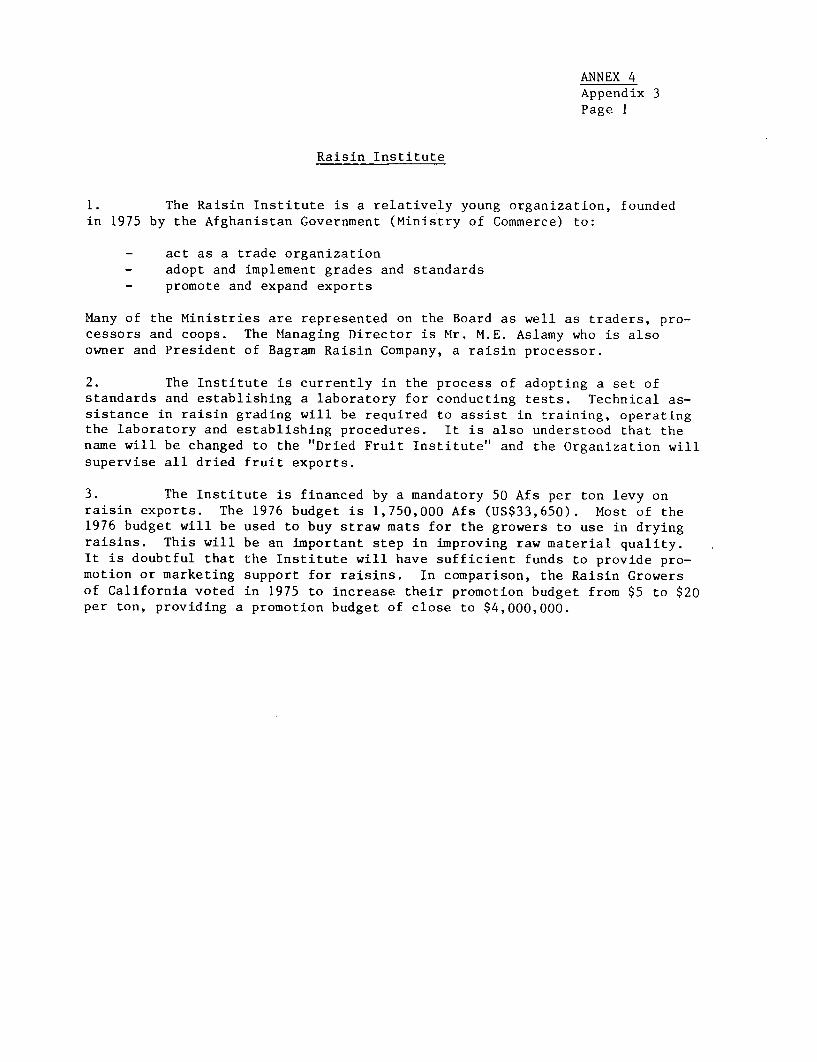
ANNEX 4Appendix 3Page I
Raisin Institute
1. The Raisin Institute is a relatively young organization, foundedin 1975 by the Afghanistan Government (Ministry of Commerce) to:
- act as a trade organization- adopt and implement grades and standards- promote and expand exports
Many of the Ministries are represented on the Board as well as traders, pro-cessors and coops. The Managing Director is Mr. M.E. Aslamy who is alsoowner and President of Bagram Raisin Company, a raisin processor.
2. The Institute is currently in the process of adopting a set ofstandards and establishing a laboratory for conducting tests. Technical as-sistance in raisin grading will be required to assist in training, operatingthe laboratory and establishing procedures. It is also understood that thename will be changed to the "Dried Fruit Institute" and the Organization willsupervise all dried fruit exports.
3. The Institute is financed by a mandatory 50 Afs per ton levy onraisin exports. The 1976 budget is 1,750,000 Afs (US$33,650). Most of the1976 budget will be used to buy straw mats for the growers to use in dryingraisins. This will be an important step in improving raw material quality.It is doubtful that the Institute will have sufficient funds to provide pro-motion or marketing support for raisins. In comparison, the Raisin Growersof California voted in 1975 to increase their promotion budget from $5 to $20per ton, providing a promotion budget of close to $4,000,000.
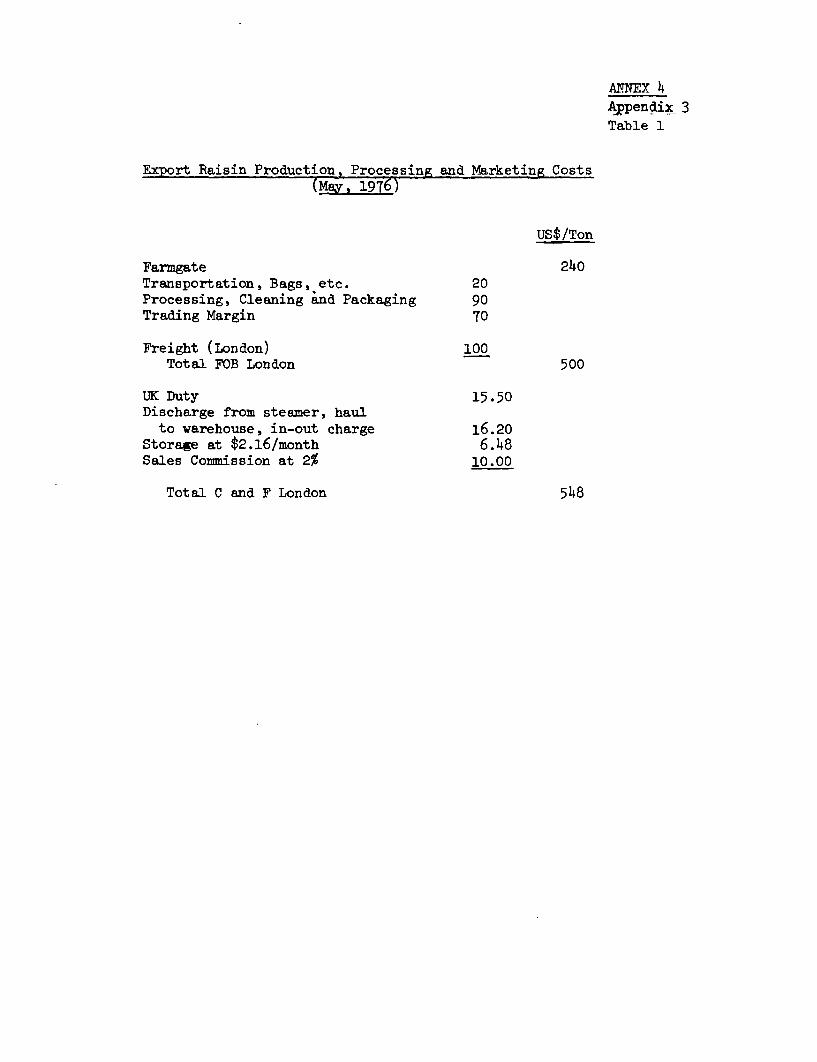
A.YNEX 4Appendix 3
Table 1
Export Raisin Production, Processing and Marketing Costs(May, 1976)
US$/Ton
Farmgate 240Transportation, Bags, etc. 20Processing, Cleaning and Packaging 90Trading Margin 70
Freight (London) 100Total FOB London 500
UK Duty 15.50Discharge from steamer, haulto warehouse, in-out charge 16.20
Storage at $2.16/month 6.48Sales Commission at 2% 10.00
Total C and F London 548
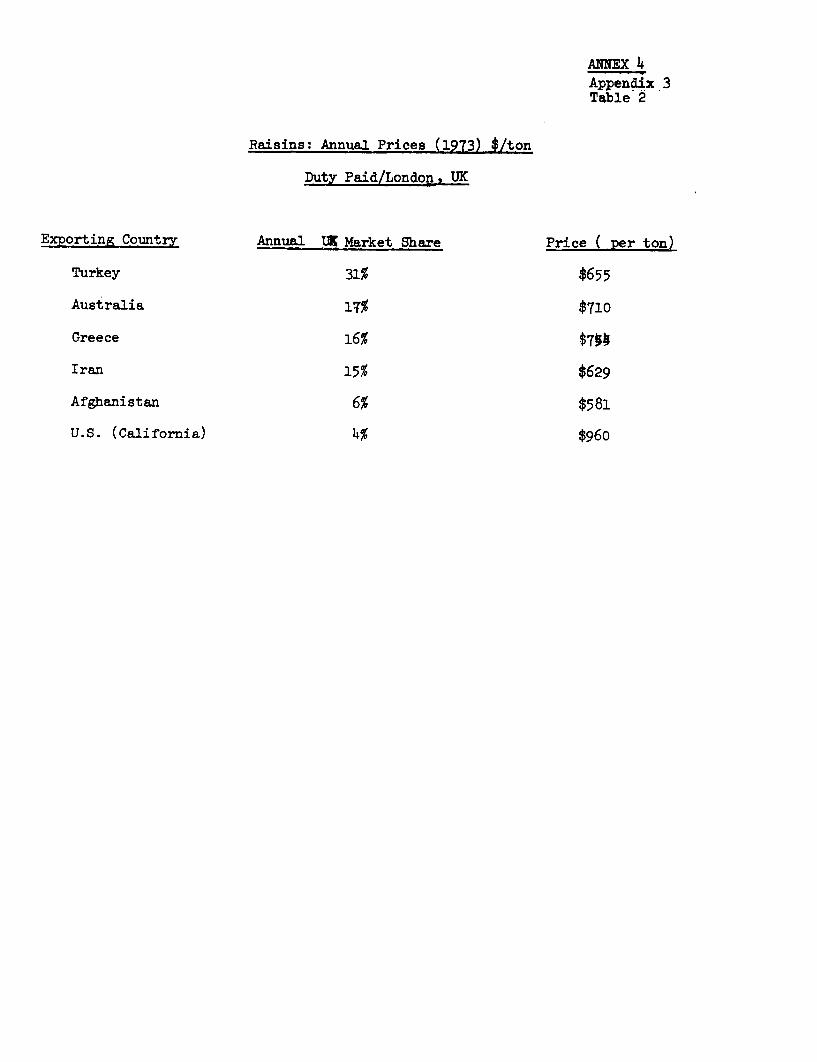
ANNEX 4Appendix 3Table 2
Raisins: Annual Prices (1973) $/ton
Duty Paid/London, UK
Exporting Country Annual tX Market Share Price ( Per ton)
Turkey 31% $655
Australia 17% $710
Greece 16% $704
Iran 15% $629
Afghanistan 6% $581
U.S. (California) 4% $960
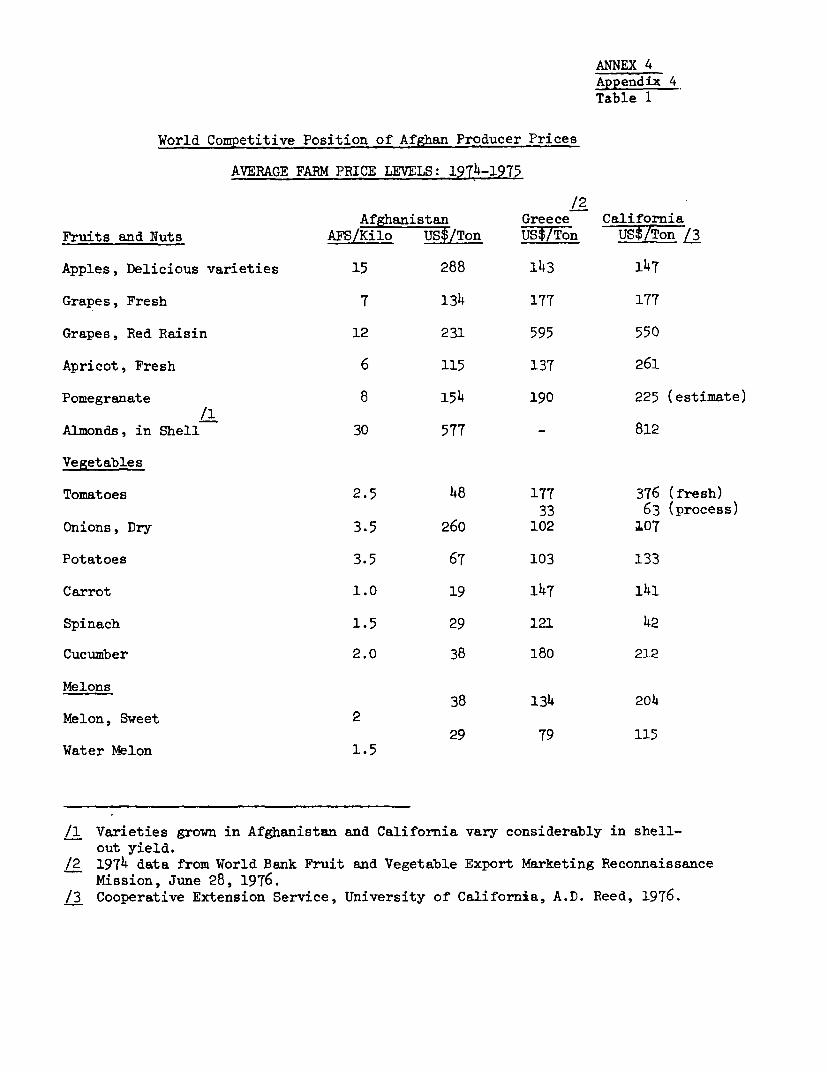
ANNEX 4Appendix 4Table 1
World Competitive Position of Afghan Producer Prices
AVERAGE FARM PRICE LEVELS: 1974-1975
/2Afghanistan Greece California
Fruits and Nuts AFS/Kilo US$/Ton US$/Ton US$/Ton /3
Apples, Delicious varieties 15 288 143 147
Grapes, Fresh 7 134 177 177
Grapes, Red Raisin 12 231 595 550
Apricot, Fresh 6 115 137 261
Pomegranate 8 154 190 225 (estimate)/1
Almonds, in Shell 30 577 - 812
Vegetables
Tomatoes 2.5 48 177 376 (fresh)33 63 (process)
Onions, Dry 3.5 260 102 107
Potatoes 3.5 67 103 133
Carrot 1.0 19 147 141
Spinach 1.5 29 121 42
Cucumber 2.0 38 180 212
Melons38 134 204
Melon, Sweet 229 79 115
Water Melon 1.5
/1 Varieties grown in Afghanistan and California vary considerably in shell-out yield.
/2 1974 data from World Bank Fruit and Vegetable Export Marketing ReconnaissanceMission, June 28, 1976.
/3 Cooperative Extension Service, University of California, A.D. Reed, 1976.
ANNEX 4Appendix 5Page 1
Cooperative Development in Afghanistan
Background
1. About 1964 the Ministry of Agriculture decided farmer associationsneeded to be organized in rural areas and therefore took steps to establishsilkworm and Karakul coops. Between 1964 and 1968, 13 coops were establishedmostly in the North, but basically they behaved as joint stock companies inaccordance with commercial laws since at the time there was no cooperativelaw. Landlords were members in addition to farmers and the Ministry of Agri-culture had no special organization to guide and supervise these societies.There were also no professional cooperative personnel and most coops were selffinancing in the absence of government shares. Ultimately they all dissolvedafter shortages of irrigation and bad climate led to large animal losses suchthat the farmers could no longer compete worldwide.
2. In 1968 an FAO mission was sent to Afghanistan to study the situa-tion and future of a cooperative movement. They undertook two surveys - onein Kohdaman area and one in Baglan province and then decided to establish apilot project in the Ministry of Agriculture & Irrigation (MAI). A Coopera-tive Training Institute was also founded in Kabul. The purpose of the pro-gram was to train government employees to provide technical cooperative serv-ices and then spread the idea and practice of cooperatives throughout theprovinces. An Agricultural Development Center was also founded in Kohdamanwherein cooperative practices were taught to area farmers.
3. Between 1968 and 1973 a government project was financed by SwedishInternational Development Agency (SIDA) through FAO with MAI as executingagent. Functional literacy programs were included for members of the project.Trainees were deemed to be sufficiently knowledgeable in an evaluation by FAO,SIDA, and MAI in 1971/72 such that they began establishing actual cooperativeorganizations, and steps were taken to establish a cooperative law which wasenacted in 1974. A special cooperative department in MAI was organized toapply the law.
Geographic Distribution
4. The early coops begun about 1969 were located in Baghlan Provincein the North and involved farmers engaged in vegetable (onions and potatoes),cotton, sugar, rice, and sugarbeet production. The program was graduallyextended to other provinces including Kandahar, Logar, and Balkh. ILO had al-ready established 4-5 coops in the Logar province so that the PACCA projectcould take advantage of this early experience. Coops in Logar are orientedaround grape, tobacco, wheat, barley, and vegetables (tomatoes and potatoes)while in Kandahar the emphasis is on grape, almond, and apricot production.In addition to the expansion of coops in the above provinces, coops wereintroduced in the Kohdaman valley area oriented around grape, and raisin,
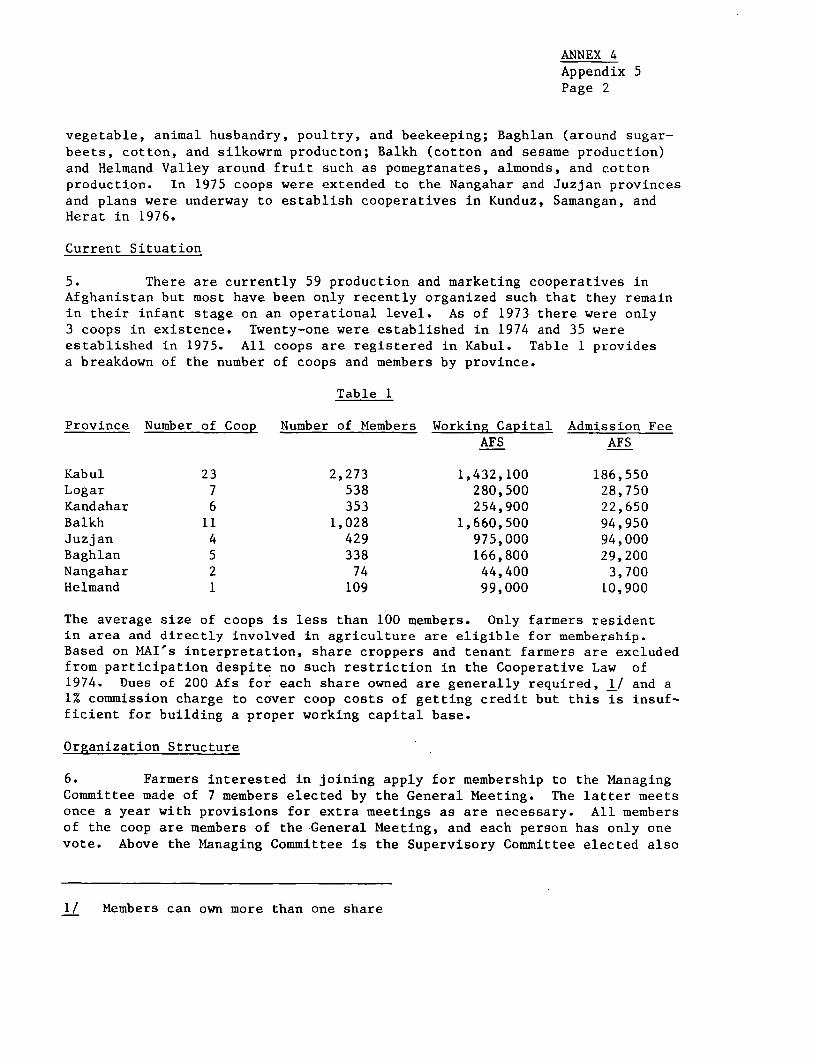
ANNEX 4Appendix 5Page 2
vegetable, animal husbandry, poultry, and beekeeping; Baghlan (around sugar-beets, cotton, and silkowrm producton; Balkh (cotton and sesame production)and Helmand Valley around fruit such as pomegranates, almonds, and cottonproduction. In 1975 coops were extended to the Nangahar and Juzjan provincesand plans were underway to establish cooperatives in Kunduz, Samangan, andHerat in 1976.
Current Situation
5. There are currently 59 production and marketing cooperatives inAfghanistan but most have been only recently organized such that they remainin their infant stage on an operational level. As of 1973 there were only3 coops in existence. Twenty-one were established in 1974 and 35 wereestablished in 1975. All coops are registered in Kabul. Table 1 providesa breakdown of the number of coops and members by province.
Table 1
Province Number of Coop Number of Members Working Capital Admission FeeAFS AFS
Kabul 23 2,273 1,432,100 186,550Logar 7 538 280,500 28,750Kandahar 6 353 254,900 22,650Balkh 11 1,028 1,660,500 94,950Juzjan 4 429 975,000 94,000Baghlan 5 338 166,800 29,200Nangahar 2 74 44,400 3,700Helmand 1 109 99,000 10,900
The average size of coops is less than 100 members. Only farmers residentin area and directly involved in agriculture are eligible for membership.Based on MAI's interpretation, share croppers and tenant farmers are excludedfrom participation despite no such restriction in the Cooperative Law of1974. Dues of 200 Afs for each share owned are generally required, 1/ and a1% commission charge to cover coop costs of getting credit but this is insuf-ficient for building a proper working capital base.
Organization Structure
6. Farmers interested in joining apply for membership to the ManagingCommittee made of 7 members elected by the General Meeting. The latter meetsonce a year with provisions for extra meetings as are necessary. All membersof the coop are members of the General Meeting, and each person has only onevote. Above the Managing Committee is the Supervisory Committee elected also
1/ Members can own more than one share
ANNEX 4Appendix 5Page 3
by the General Meeting. This committee, of which there are three members, hasresponsibility for overseeing operations. Finally a manager, who currentlyis more often than not a government official, works under and provides adviceto the Managing Committee. He may also have recruitment and extension respon-sibilities as well. As the coops become more established in the future, thecharacter and role of this positon will change. There is also usually asecond government officer assigned to take care of all bookkeeping activitiesin each coop.
7. In the Kohdaman valley where some of the older grape coops exist,steps have already been taken to create cooperation among the cooperativesocieties. Each coop selects a representative as temporary managing commit-tee member for secondary level cooperative. Those selected are the mostexperienced.
General Description of Cooperatives
8. Primary agricultural coops in Afghanistan are multipurpose. Co-operatives in Afghanistan are designed to fulfill four basic functions: (1)provide agricultural credit; (2) provide technical advice and extensionservices; (3) find suitable domestic and foreign markets for members produce;and (4) provide literacy programs. The early coops provided supervisedcredit in kind rather than cash as well as provided inputs, but recent nego-tiations with AG Bank have led to the extension of some cash credit to paylabor wages (for pruning, dusting, and harvesting of grapes), extension, andtechnical marketing services.
Facilitating Credit
9. Plans for credit needs of each cooperative are prepared by themanager, approved by General Meeting, and then sent through the ManagingCommittee to the MAI where the application is analyzed. It is then sent tothe AG Bank for approval, and the Bank then transfers the approved amount tothe cooperative account and the Managing Committee allocates it among variousmembers. There are generally two types of credit requested; Seasonal (inkind), and Marketing (in cash). Most borrowing for grape and raisin coopscovers transportation and processing needs since the coop collects the raisinsfor the members, processes them through representatives, and rents trucks toget them to market. Some coops also have their own storage facilities, butthey are generally inadequate. For these purposes, they borrow approximately50% of the total price of the good at interest rates of 8% per annum. A majorproblem, however, is the long 3-6 month lag before money is received due tobureaucratic red tape requirements.
10. Ag Bank is basically the only official institution designated toprovide credit, and the vast majority of its loans are not directed to smallfarmers. The problem appears to be the inability of the farmers to establishcollateral because of the land ownership system. Land ownership is passed onfrom family to family such that an individual farmer cannot use his onemajor asset as collateral for bank credit.
ANNEX 4Appendix 5Page 4
11. Ag Bank also provides mainly long-term credit while small farmersneed seasonal and medium-term credit for production purposes. Therefore,most farmers are reliant on the money bazaars for critical investment financ-ing. A continuous shortage of working capital is maintained. Suggested waysto improve the situation are better borrowing terms, increased shares of cur-rent members, improved processing and storage facilities, and greater re-cruitment efforts to increase membership. The coops lack sufficient capitalbecause of their self-financing status and low incomes of members. Staff isnot able to resolve these difficulties as the coops are presently organized.
Cooperative Marketing
12. Coops do not actually buy members' produce. Rather, consistent withthe individuali~tic style of Afghan economic life, coops merely sell produceon behalf of members, hoping such joint efforts will enable them to have amore favorable impact on price negotiations by eliminating other middlemenroles. A marketing section under the cooperative department of the MAI isalso supposed to assist the coops in finding national and internationalmarkets for their produce. For domestic marketing the cooperatives, in theabsence of professional full-time staff, are unable to provide the necessarymarket information which would improve farmer bargaining power vis-a-vis thedominant merchant groups. Coops generally include no more than five percentof farmers in an area such that their joint efforts often have little impacton local economic negotiations.
13. Farmers complain that one of their major problems in marketingtheir produce is the absence of storage and transport facilities. Thisforces them to be dependent on middlemen both for the receipt of inputs andthe distribution of their products. For example, it takes two to three daysfor farmers in Kohdaman valley to obtain fertilizer and the transport costis often more than the final price of the goods. Although a few cooperativeshave storage and transport services (trucks), this has to date not been asufficient area of focus.
14. On the export side, the cooperatives are at an even greater dis-advantage than the experienced traders and their participation in exportsales to date has come mostly from government initiatives. The basic con-straint appears to be the lack of cold stores to collect the produce such thatthey can take advantage of increases in foreign demand at higher prices.
15. Among the positive aspects of the cooperative movement has been theintroduction of improved technical methods allowing farmers to increase thequantity of produce and receive better prices. Greater efforts are now re-quired, however, to increase quality of produce. In some cases, particularlyin Kohdaman Valley area which is one of the more advanced areas for coopera-tive development, they have been able to market directly to buyers or bigmerchant at prices sometimes two to three times higher than sales prior tojoining. Yields in the area have also increased, but these increases areprobably non-existent in lesser developed provinces.
Annex 4Appendix 6Page 1
Market Prospects for Individual Commodities
Fresh Fruit
1.01 Grapes. Afghanistan has annually exported between 30,000 and 60,000
tons of grapes in the last four years. Grapes are a principal export, account-
ting for 60% of the value of Afghan fresh fruit exports. The export season is
between July and October with those produced in Kandahar having an earlier
ripening season than those produced in Kohdaman valley.
1.02 Neighboring Indian and Pakistan markets account for about all of the
exports (34% and 65% respectively) because lack of storage does not enable
fresh produce to reach more distant markets. The Pakistan market has con-
tinued to absorb larger quantities while exports to India have exhibited ex-
treme fluctuations. Further development of existing markets will depend on
reducing spoilage through improved handling (including refrigeration wherefeasible). To improve opportunities in the Indian market, negotiations are
required for transit rights through Pakistan and India for Afghan trucks.
1.03 Distant markets are unlikely to be tapped because of high trans-
port costs, but there appear to be ample prospects for exports to Russia,
where Afghan grapes would enjoy a small seasonal advantage vis a vis those
from Bulgaria, if refrigerated storage and transport were introduced. Al-
though the Kishmishi variety dominates Afghan exports, it does not store
well, and experiments should be tried with the Shindahami variety, which
does offer storage potential.
1.04 Pomegranates. The pomegranate is an exotic fruit little known in
world markets, but it is the second most valuable Afghan fresh fruit export.
The commodity has one of the highest growth of sales among Afghanistan fresh
fruit exports but quality standards need to be improved. Afghanistan exports
about 13,000 tons annually; principally to India, Pakistan and USSR. For
the period between 1972-1975 these markets accounted for 60%, 17% and 16% of
volume and of Afghan pomegranate exports. Indian import prices are slightly
higher than prices in other markets and Afghan prices are well below its major
competitors.
1.05 Further export expansion is facilitated by the disease free character
of the Afghan variety. Although Afghanistan exports a large share of its do-
mestic production, there is incentive to increase production and export of
this profitable fruit, especially if processing outlets are developed for
supply fruits. Sales to Pakistan and India could be expanded by lengthening
the market season two to four months through the introduction of cold storage
facilities.
1.06 Apples. Apples are a relatively new export crop with production
concentrated on the Golden Delicious and Red Delicious varieties which have
been highly regarded in major European import markets.
Annex 4Appendix 6Page 2
1.07 With production estimated to triple in the next 7-10 years, theforeign market potential needs to be assessed. To date Pakistan is the onlymarket, importing annually about 5,000 tons or almost 100% of Afghanistan'sapples. Pakistan import prices are sufficiently attractive to provide anincentive for increased export supplies. Fortunately, apples store welland should find favorable market opportunities in the early spring in nearbyexport markets. With production already well organized the primary elementsfor increased exports are improved grading and cold storage facilities toprolong the marketing period.
1.08 Oranges. Approximately 2,800 tons of oranges are produced eachyear with most being exported. Exports are negotiated on a Government-to-Government contract basis to Iran through a good will gesture. The fewtraders involved buy the oranges from farmers using agents or import fromPakistan and then sell directly to Iran. These same traders have dealersoperating in the Pakistan market who work on their behalf.
1.09 Melons. Afghanistan exports about 35,000 tons of melons annually,99% of which go to Pakistan. Melons have exhibited one of the highest freshfruit growth rates since 1972. Were appropriate storage facilities in exist-ence, prospects in other markets would be quite favorable because the qualityof varieties unique to Afghanistan is quite excellent. Afghan production andexport costs are relatively low so that its melons are price competitive.Tests should be made on storage duration and market opportunities for off-season melons in December and January.
1.10 Apricots. Annual Afghan exports of fresh apricots average about1,500 tons. All apricot exports go to Pakistan where market opportunitieshave been good because of ease in reaching market and satisfactory varieties.Further export expansion will be constrained by lack of cold storage packingand refrigerated transport facilities to increase the shelf life and marketseason. Lack of a domestic canning system which is a normal market outletin most countries is due to high transport costs and a limited domesticdemand.
Dried Fruit
1.11 Raisins. Afghanistan accounts for about 15% of world raisin ex-ports - approximately 40,000 tons out of 260,000 tons. Major world exportersare Greece, Turkey, US, Iran, Australia and Afghanistan. Afghanistan exportsred, green and black raisins of which red and green account for similar re-venues ($16 million) even though volume of green raisin exports is less thanred (14,000 tons compared to 23,000 tons). However, the higher price of thegreen raisins is offset by higher production costs for drying sheds. Greenraisins, which represent 30% of value of raisin exports, are exported prin-cipally to India, USSR and Pakistan while red raisin (56% of raisin exports)to to EEC, USSR, China, India and Pakistan.
Annex 4Appendix 6Page 3
1.12 Afghan raisins are price competitive. India and Pakistan offer thehighest prices of Afghan raisins ($700 to $800) followed by the EEC and thenthe barter zone countries. In the U.K. market (as Annex 4, Table 6 indicates),despite long uncertain travelling distances through Russia, its raisins sellsignificantly below its principal competitors. This is due to lack of uniformquality and grades, unguaranteed delivery and less aggressive marketing of theAfghan produce.
1.13 Production costs in Afghanistan, about 45% of London cif price, arebelow costs in competing countries, but expansion of raisins exports fromAfghanistan can only be done within a framework of improved quality standardenforcement and better market organization. To this end in 1975, Afghanistancreated a Raisin Institute to (i) act as a trade organization; and (ii) adoptand implement grades and standards with the ultimate aim of promoting and ex-panding exports. Many of the ministries are represented on the Board as wellas traders, processors and coops. Eventually, the scope of the Institutewill be extended to cover the supervision of all dried fruit exports. But,currently it is in the process of adopting a set of standards and establishinga laboratory for conducting tests.
1.14 The Institute is now financed by a mandatory 50 Afs per ton levy onraisin exports and is operating with a $37,000 budget most of which will beused to buy straw mats necessary for improving the quality of raw material inthe raisin drying process. It is doubtful that current funds are sufficientto cover promotion or marketing efforts.
1.15 Dried Apricots. Afghanistan accounts for about 20% of worlddried apricot exports with neighbor Iran being the leading world exporter.Chakapara is the principal Afghan export variety. It has a light yellowcolor and is allowed to dry on the tree. The major markets are Pakistan,USSR and India. Afghan production costs and prices are low relative to itscompetitors but quality in terms of color and taste are not acceptable inEuropean markets; sulphur treatment would remedy this condition.
Nuts
1.16 Almonds. Afghanistan annually exports about 5,000 tons of almondsrepresenting about 8% of world exports. Leading world almond exporters areUSA and Spain. Major import markets are West Germany, France, Japan and theU.K. but Afghanistan exports go principally to India, Pakistan and USSR.Afghan thin shelled almonds go almost exclusively to USSR while India importsonly the hard shelled varieties and Pakistan imports both hard shell and un-shelled varieties.
1.17 One of the major impediments to expanded Afghan exports is theexistence of strong international competition in a world market where exportshave not shown any significant growth in the last 10 years. Almond produc-tion in the US, the largest world producer has been profitable and expanding
Annex 4Appendix 6Page 4
while Spain has increased its production significantly as well. Iran andTurkey are also major sources of EEC almond exports. Thus, for the Europeanmarket, competition for Afghanistan is likely to be intense and successfulexports would require an active marketing program.
1.18 Afghanistan does have good markets in the closer Indian, Pakistan,USSR and Persian Gulf areas, but it still must compete with Iran and Turkey.However, Afghanistan has the advantage of being able to develop barter salesarrangements and receive higher prices for premium almond varieties (longkernel types) prized in these countries. Further investigation of futuremarket prospects is required before additional plantings are warranted buteconomic analysis indicates that given low production costs, promotion ofalmond exports could be a highly profitable venture. Export prospects foralmond do seem to be more favorable than for other nuts.
1.19 Pistachios. Afghanistan has a small share of world pistachio ex-ports compared to neighbors Turkey and Iran. It exports about 1,200 tonsannually most of which go to Lebanon and India. Iran exports about 15,000tons mostly to US and Europe but also to Asian markets. There is thus strongcompetition in existing pistachio import markets. Because pistachios require10-14 years to come into full production and given non-commercial productionmethods now utilized in Afghanistan, there are serious constraints to expand-ed exports even if markets prospects were more favorable.
1.20 Walnuts. World walnut exports averaged about 55,000 tons a yearbetween 1962-1971 and then rose to 71,000 tons in 1973 and 1974. Afghanistanexports about 5,000 tons annually or about 7% of world exports. Leading worldexporters are US, China, France and Italy while leading importers are WestGermany, U.K. and Canada. Most of Afghanistan's exports go to USSR (70%),Czechoslavakia (6%) and Lebanon (2%). Constraints on expanded Afghan walnutexports are similar to those for pistachios.
1.21 Apricot Nuts and Kernels. Afghanistan annually exports about 1,000tons of apricot nuts and kernels with principal markets being Sweden, India,Pakistan, USSR and Lebanon. It faces stiff competition however from China,Turkey, Australia, South Africa and Spain in the major West European marketswhere demand is said to be growing.
Fresh Vegetables
1.22 The production and trade in fresh vegetables is oriented to supply-ing urban domestic markets such as Kabul, Kandahar, Herat, and Jalalabad. Aban on the export of vegetables has prevailed for the past five years. It isreported that vegetables were exported, prior to the law, particularly fromHerat to Iran. Many vegetables are too perishable for export, but cropssuch as potatoes, onions, cucumbers, okra and tomatoes, could be exportedto markets in neighboring countries. The Iranian Army is buying onions and
Annex 4Appendix 6Page 5
potatoes in Northern India during the off season and hauling the raw produce,without a back haul, to Iran in 20-ton trucks. The Ministry of Commerceindicated that Iran would like to purchase in Afghanistan, particularly inthe Herat region to reduce transport costs.
1.23 In addition to low labor costs, Afghanistan's diverse climates pro-vide opportunities for long production seasons for vegetables, although mostof the different climatic areas are too dispersed for central processing.Indications are that for most vegetables, a combination of perishability andlocal competition will restrict immediate vegetable export opportunities.Exceptions are less perishable products such as:
OnionsGarlicPotatoesDry beans
ANNEX 5
PROCESSING
Table of Contents
Appendix 1 - General Observations on Raisin Processing in Afghanistan
Table 1 - Raisin Processing Plant Visits
Table 2 - Raisin Processing Costs (1974 estimates)
Appendix 2 - Marketing Margins: Apricot Dehydration
Appendix 3 - Kandahar Canning Factory
Appendix 4 - Juice Concentrate Plant
Appendix 5 - Other Processing
Appendix 6 - Cost of Labor

ANNEX 5Appendix 1Page 1
General Observations on Raisin Processing in Afghanistan
Processing operations consist of removing stems and other foreignmatter, sizing, washing, sorting, inspecting and packaging. Uneven quality,poor storage conditions, both at the farm and at the processing plant, plusan abnormal amount of field trash, dirt and dust limit what can be accomplish-ed at the processing plant to produce a quality pack. Raisins destined toUSSR require very little hand grading, but raisins for Europe and the UnitedKingdom require separate hand grading. Several hand grading operationswere observed that required approximately 200 additional man hours per ton topick out off-color, off-size and trash. The additional hand grading increasedprocessing costs by 1,040 Afs (US$20) per ton, but as the product sells foran additional US$50-100 per ton in European markets, the extra cost of finalgrading is considered worth the effort.
Raisin Plant Visits
Bagram Raisin Company. Located in Charakar, it is owned and operatedby the manager of the Raisin Institute. The plant is oriented to sell into theUK market, and plant modernization and additional storage facilities wereunder construction. The plant follows the practice of a two-stage grading forexport to London.
Afghan Processing Company. Located in Kandahar in a rented building,it appears to be working well below its annual capacity of 2,000-3,000 tons.In 1975 it processed less than 1,000 tons. Plant hygiene was poor and qualityof the raw material was below average. Approximately 20 hand graders earning30-35 Afs per day were grading 10 tons per day.
The plant has raisin cleaning equipment imported from Californiacosting 7,500,000 Afs. No storage facilities were available and raisinswere stacked outside the building. Many of the raisins were observed tobe in poor condition due to water damage during farm storage.
All the business is contract processing, the major customers beingfive traders and one cooperative.
Wahid Raisin Company. Located in Kandahar, all sales are to USSR.The plant has complete line of California raisin grading equipment capable of24 tons/8 hour shift; the plant was currently utilizing two shifts. Planthygiene was poor.
Last year it processed 1,300 tons; considerably below capacity.Grading losses can range from 7-25 percent, but average 12 percent. The raisinsales to USSR present a problem; payment is in barter dollars, and managementclaims the $80 per ton profit on sales to USSR is reduced to $40 per ton netincome due to a loss sustained in the sale of barter goods.
ANNEX 5Appendix 1Page 2
Samoan Company. Located in Kabul, Samoan is managed by Mr. AbdulHadi. This is the largest raisin processing and best equipped raisin plantin Afghanistan. The plant also has facilities for almond and walnut processingat the rate of one ton per hour, and a fruit dehydrator. The nut line anddehydrator were not operating.
The original capital structure was:
Afs.
Fixed assets 32,000,000Working capital 8,000,000
Total: 40,000,000
Ownership is 48 percent Ministry of Finance and 52 percent private. Mostof the working capital is currently tied up in inventory or barter goodsfrom the USSR. The Agricultural Credit Bank has extended an Afs.20 millionrevolving line of credit to finance inventory, but shortage of working capitallimits expansion.
The plant is equipped with two complete Elliott (California) pro-cessing lines. The plant has storage facilities for bags but bin storage wouldbe the best system. Samoan was the only plant observed to have a fork lifttruck. Also the plant had a continuous quality control program.
The firm has long-term relationships with foreign buyers in Canadaand London and, if strengthened with additional marketing, management andfinancing, could expand operations.
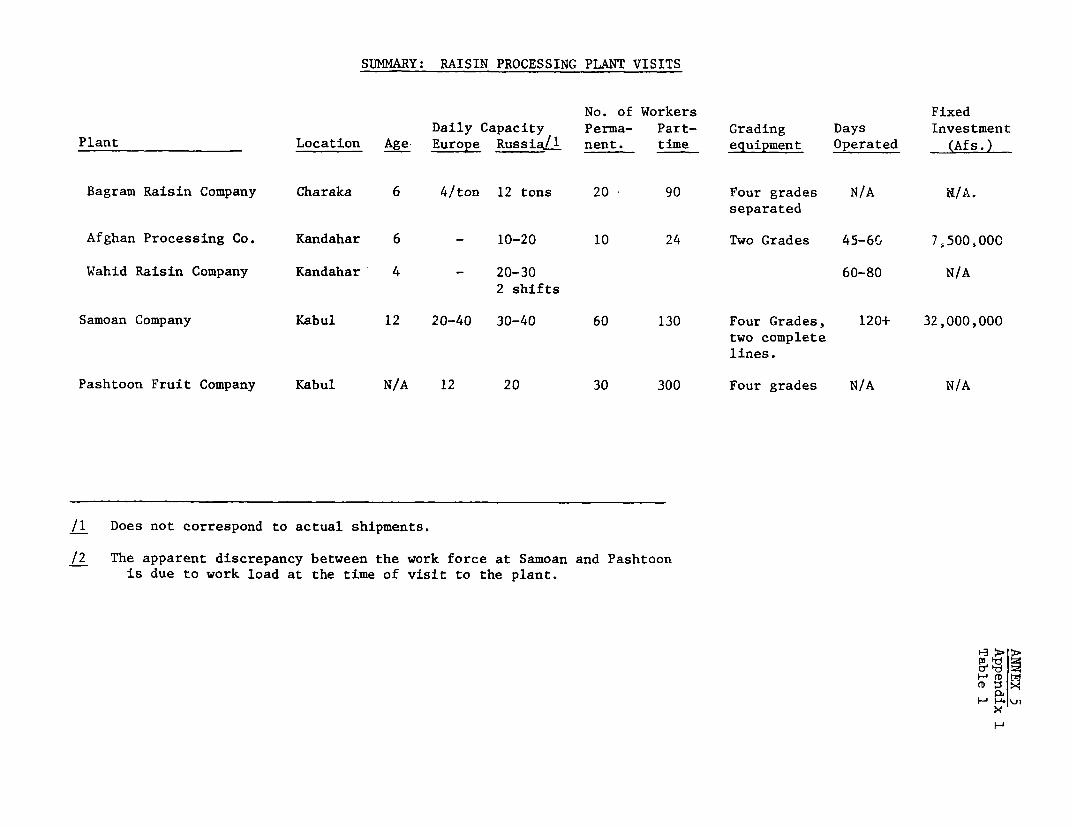
SUMMARY: RAISIN PROCESSING PLANT VISITS
No. of Workers FixedDaily Capacity Perma- Part- Grading Days Investment
Plant Location Age- Europe Russia/I nent. time equipment Operated (Afs.)
Bagram Raisin Company Charaka 6 4/ton 12 tons 20 90 Four grades N/A N/A.separated
Afghan Processing Co. Kandahar 6 - 10-20 10 24 Two Grades 45-60 7,500,000
Wahid Raisin Company Kandahar 4 - 20-30 60-80 N/A
2 shifts
Samoan Company Kabul 12 20-40 30-40 60 130 Four Grades, 120+ 32,000,000
two completelines.
Pashtoon Fruit Company Kabul N/A 12 20 30 300 Four grades N/A N/A
/1 Does not correspond to actual shipments.
/2 The apparent discrepancy between the work force at Samoan and Pashtoonis due to work load at the time of visit to the plant.
H PN >
1-Hx
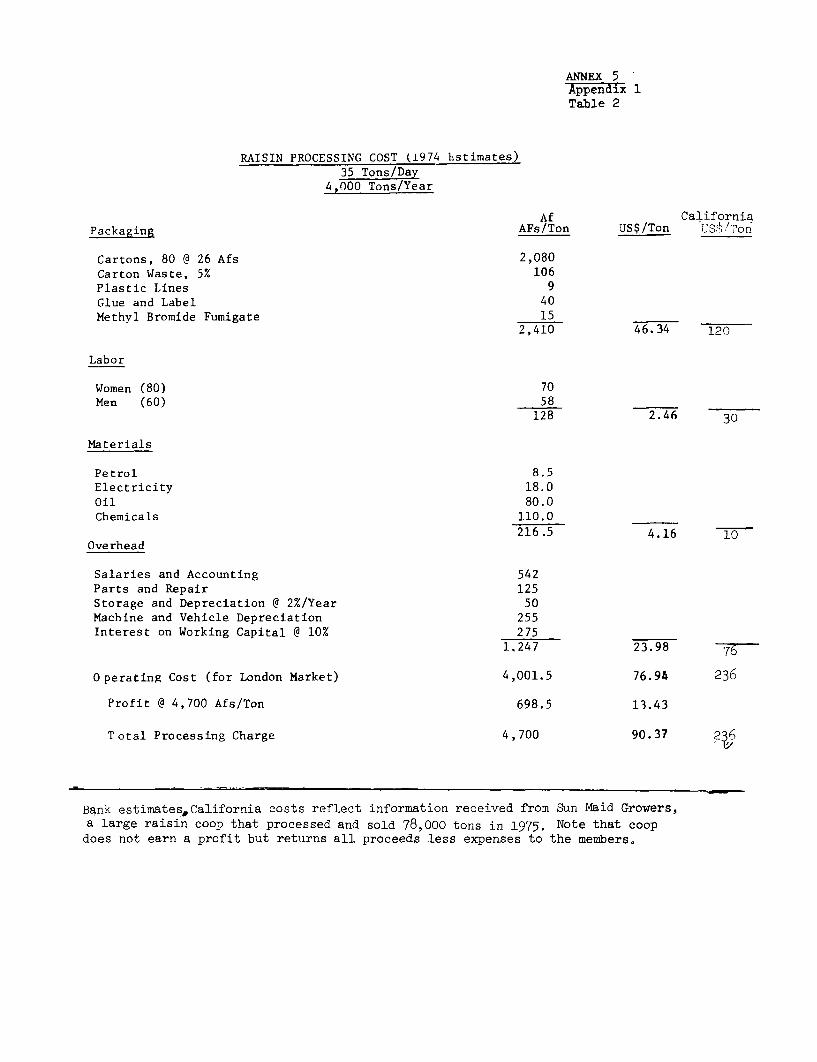
ANNEX 5Appendix 1Table 2
RAISIN PROCESSING COST (1974 Lstimates)35 Tons/Day
4,000 Tons/Year
Af California
Packaging AFs/Ton US$/Ton UST/Tnorni
Cartons, 80 @ 26 Afs 2,080Carton Waste, 5% 106Plastic Lines 9Glue and Label 40Methyl Bromide Fumigate 15
2,410 46.34 120
Labor
Women (80) 70Men (60) 58
128 2.46 30
Materials
Petrol 8.5Electricity 18.0Oil 80.0Chemicals 110.0
216.5 4.16 10Overhead
Salaries and Accounting 542Parts and Repair 125Storage and Depreciation @ 2%/Year 50Machine and Vehicle Depreciation 255Interest on Working Capital @ 10% 275
1.247 23.98 7
Operating Cost (for London Market) 4,001.5 76.94 236
Profit @ 4,700 Afs/Ton 698.5 13.43
Total Processing Charge 4,700 90.37 236
Bank estimates,California costs reflect information received from Sun Maid Growers,a large raisin coop that processed and sold 78,000 tons in 1975. Note that coop
does not earn a profit but returns all proceeds less expenses to the members.
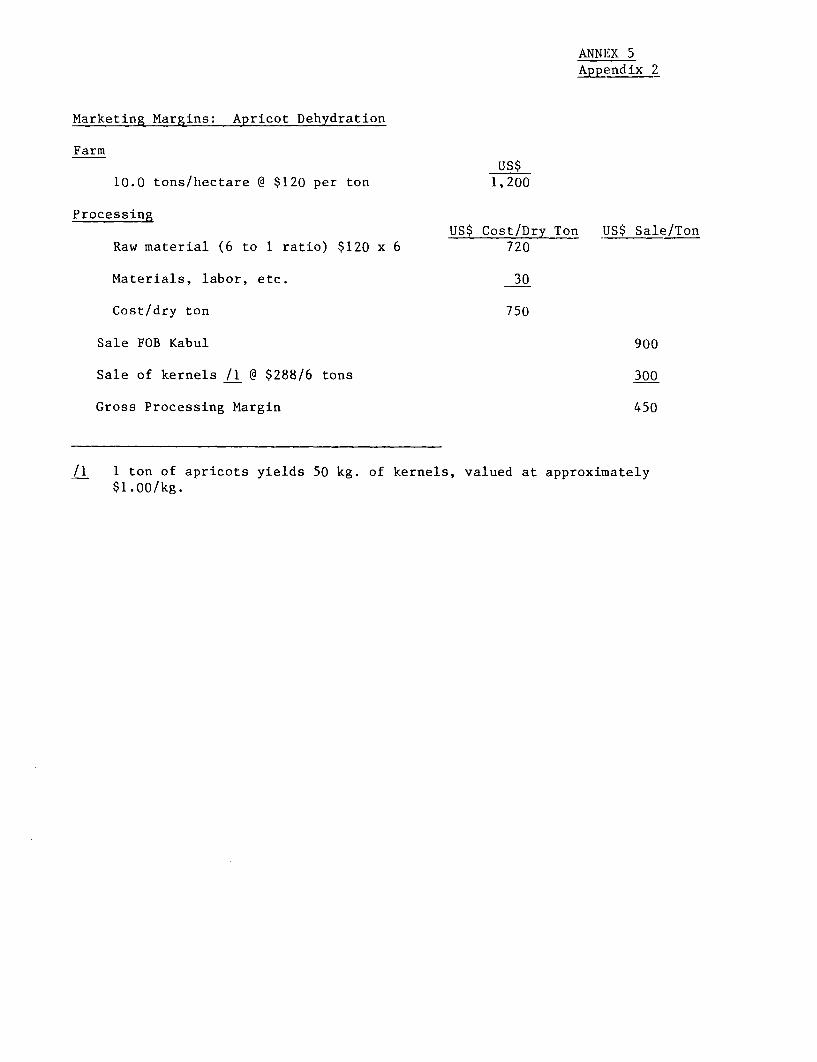
ANNEX 5Appendix 2
Marketing Margins: Apricot Dehydration
FarmUS$
10.0 tons/hectare @ $120 per ton 1,200
ProcessingUS$ Cost/Dry Ton US$ Sale/Ton
Raw material (6 to 1 ratio) $120 x 6 720
Materials, labor, etc. 30
Cost/dry ton 750
Sale FOB Kabul 900
Sale of kernels /1 @ $288/6 tons 300
Gross Processing Margin 450
/1 1 ton of apricots yields 50 kg. of kernels, valued at approximately$1.00/kg.
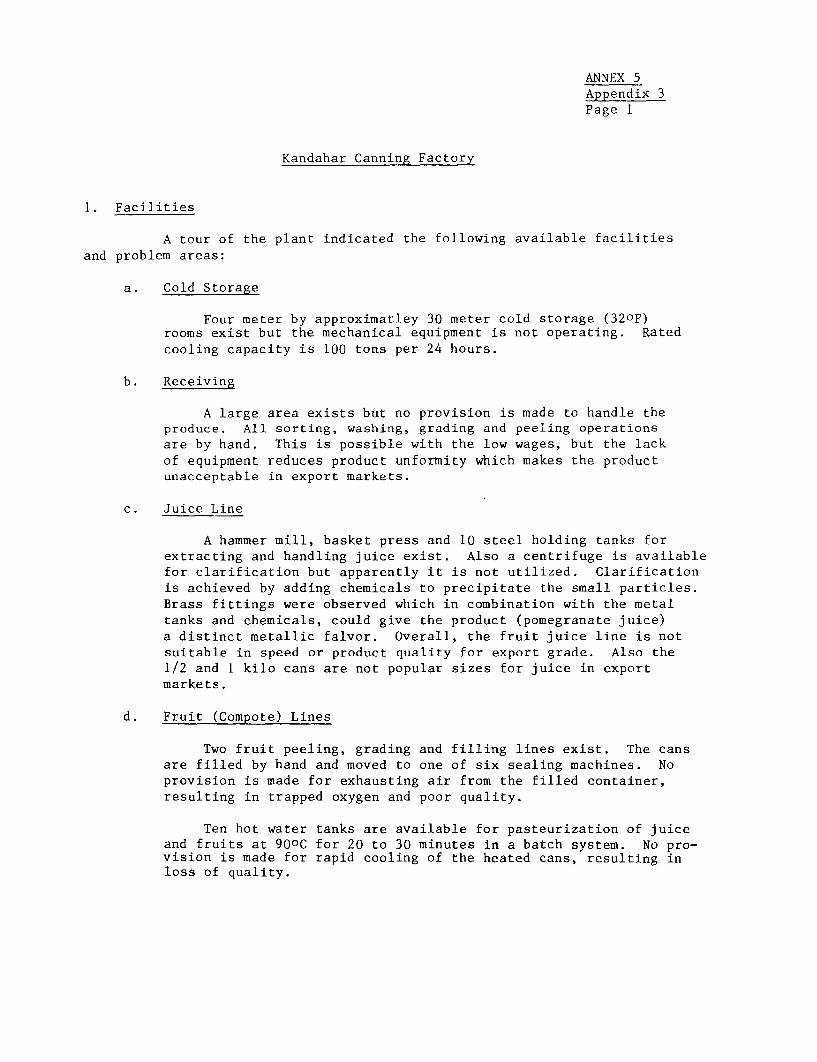
ANNEX 5Appendix 3Page 1
Kandahar Canning Factory
1. Facilities
A tour of the plant indicated the following available facilitiesand problem areas:
a. Cold Storage
Four meter by approximatley 30 meter cold storage (320F)rooms exist but the mechanical equipment is not operating. Ratedcooling capacity is 100 tons per 24 hours.
b. Receiving
A large area exists but no provision is made to handle theproduce. All sorting, washing, grading and peeling operationsare by hand. This is possible with the low wages, but the lackof equipment reduces product unformity which makes the productunacceptable in export markets.
c. Juice Line
A hammer mill, basket press and 10 steel holding tanks forextracting and handling juice exist. Also a centrifuge is availablefor clarification but apparently it is not utilized. Clarificationis achieved by adding chemicals to precipitate the small particles.Brass fittings were observed which in combination with the metaltanks and chemicals, could give the product (pomegranate juice)a distinct metallic falvor. Overall, the fruit juice line is notsuitable in speed or product quality for export grade. Also the1/2 and 1 kilo cans are not popular sizes for juice in exportmarkets.
d. Fruit (Compote) Lines
Two fruit peeling, grading and filling lines exist. The cansare filled by hand and moved to one of six sealing machines. Noprovision is made for exhausting air from the filled container,resulting in trapped oxygen and poor quality.
Ten hot water tanks are available for pasteurization of juiceand fruits at 900C for 20 to 30 minutes in a batch system. No pro-vision is made for rapid cooling of the heated cans, resulting inloss of quality.
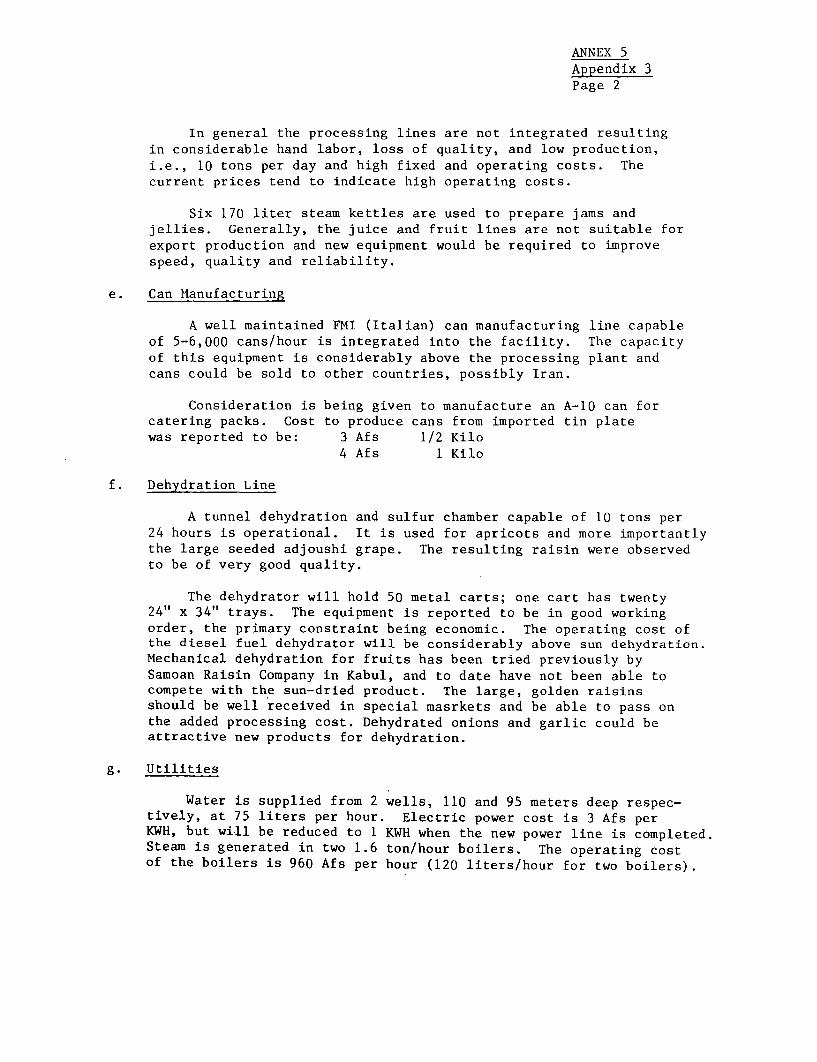
ANNEX 5Appendix 3Page 2
In general the processing lines are not integrated resultingin considerable hand labor, loss of quality, and low production,i.e., 10 tons per day and high fixed and operating costs. Thecurrent prices tend to indicate high operating costs.
Six 170 liter steam kettles are used to prepare jams andjellies. Generally, the juice and fruit lines are not suitable forexport production and new equipment would be required to improvespeed, quality and reliability.
e. Can Manufacturing
A well maintained FMI (Italian) can manufacturing line capableof 5-6,000 cans/hour is integrated into the facility. The capacityof this equipment is considerably above the processing plant andcans could be sold to other countries, possibly Iran.
Consideration is being given to manufacture an A-10 can forcatering packs. Cost to produce cans from imported tin platewas reported to be: 3 Afs 1/2 Kilo
4 Afs 1 Kilo
f. Dehydration Line
A tunnel dehydration and sulfur chamber capable of 10 tons per24 hours is operational. It is used for apricots and more importantlythe large seeded adjoushi grape. The resulting raisin were observedto be of very good quality.
The dehydrator will hold 50 metal carts; one cart has twenty24" x 34" trays. The equipment is reported to be in good workingorder, the primary constraint being economic. The operating cost ofthe diesel fuel dehydrator will be considerably above sun dehydration.Mechanical dehydration for fruits has been tried previously bySamoan Raisin Company in Kabul, and to date have not been able tocompete with the sun-dried product. The large, golden raisinsshould be well received in special masrkets and be able to pass onthe added processing cost. Dehydrated onions and garlic could beattractive new products for dehydration.
g. Utilities
Water is supplied from 2 wells, 110 and 95 meters deep respec-tively, at 75 liters per hour. Electric power cost is 3 Afs perKWH, but will be reduced to 1 KWH when the new power line is completed.Steam is generated in two 1.6 ton/hour boilers. The operating costof the boilers is 960 Afs per hour (120 liters/hour for two boilers).
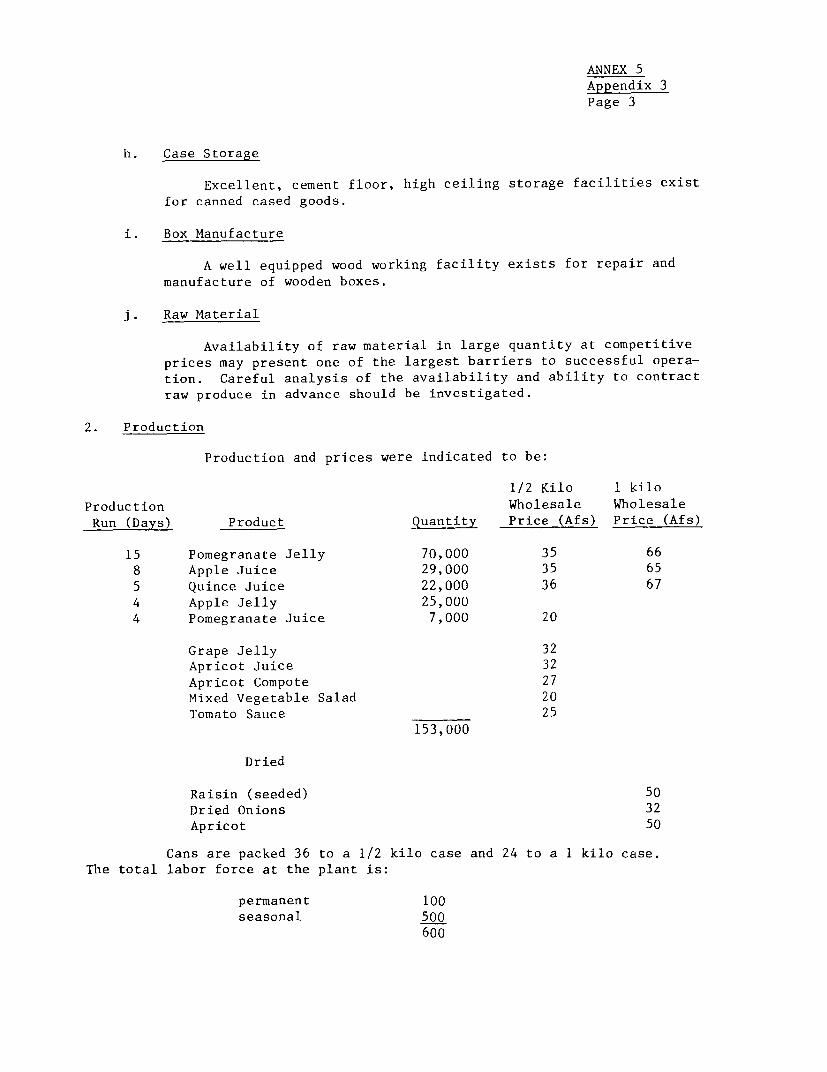
ANNEX 5Appendix 3Page 3
h. Case Storage
Excellent, cement floor, high ceiling storage facilities existfor canned cased goods.
i. Box Manufacture
A well equipped wood working facility exists for repair andmanufacture of wooden boxes.
j. Raw Material
Availability of raw material in large quantity at competitiveprices may present one of the largest barriers to successful opera-tion. Careful analysis of the availability and ability to contractraw produce in advance should be investigated.
2. Production
Production and prices were indicated to be:
1/2 Kilo 1 kiloProduction Wholesale WholesaleRun (Days) Product Quantity Price (Afs) Price (Afs)
15 Pomegranate Jelly 70,000 35 668 Apple Juice 29,000 35 655 Quince Juice 22,000 36 674 Apple Jelly 25,0004 Pomegranate Juice 7,000 20
Grape Jelly 32Apricot Juice 32Apricot Compote 27Mixed Vegetable Salad 20Tomato Sauce 25
153,000
Dried
Raisin (seeded) 50Dried Onions 32Apricot 50
Cans are packed 36 to a 1/2 kilo case and 24 to a 1 kilo case.The total labor force at the plant is:
permanent 100seasonal 500
600
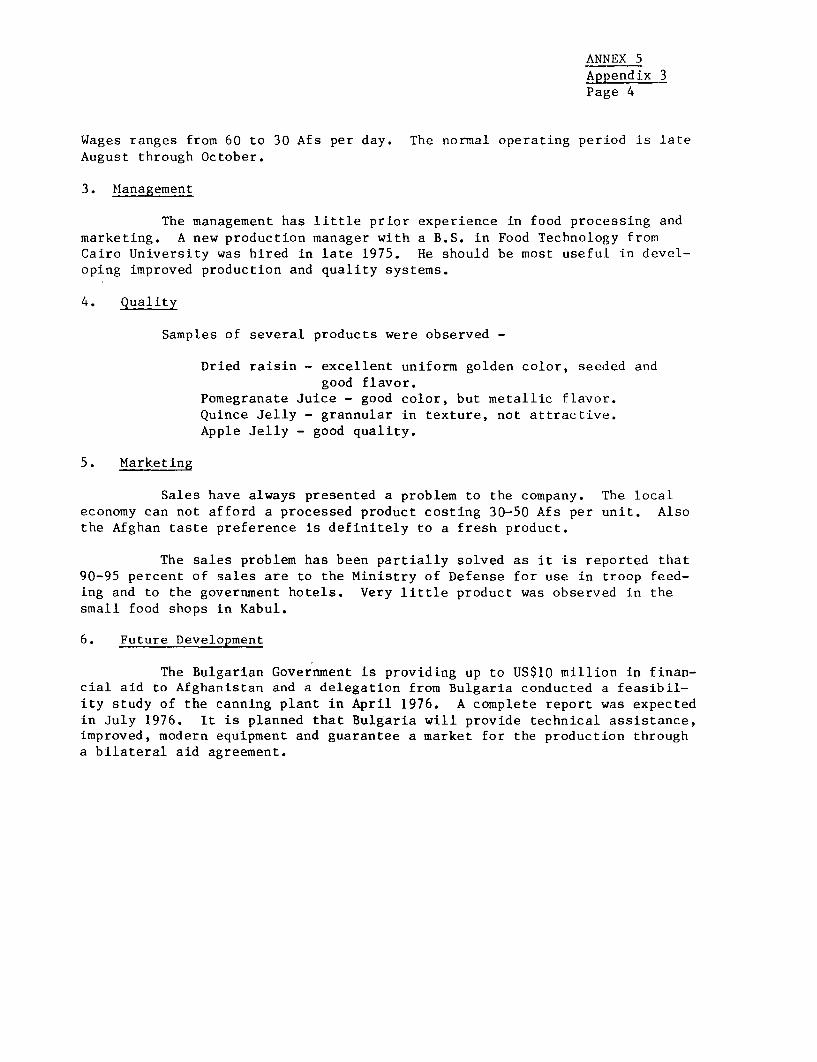
ANNEX 5Appendix 3Page 4
Wages ranges from 60 to 30 Afs per day. The normal operating period is lateAugust through October.
3. Management
The management has little prior experience in food processing andmarketing. A new production manager with a B.S. in Food Technology fromCairo University was hired in late 1975. He should be most useful in devel-oping improved production and quality systems.
4. Quality
Samples of several products were observed -
Dried raisin - excellent uniform golden color, seeded andgood flavor.
Pomegranate Juice - good color, but metallic flavor.Quince Jelly - grannular in texture, not attractive.Apple Jelly - good quality.
5. Marketing
Sales have always presented a problem to the company. The localeconomy can not afford a processed product costing 30-50 Afs per unit. Alsothe Afghan taste preference is definitely to a fresh product.
The sales problem has been partially solved as it is reported that90-95 percent of sales are to the Ministry of Defense for use in troop feed-ing and to the government hotels. Very little product was observed in thesmall food shops in Kabul.
6. Future Development
The Bulgarian Government is providing up to US$10 million in finan-cial aid to Afghanistan and a delegation from Bulgaria conducted a feasibil-ity study of the canning plant in April 1976. A complete report was expectedin July 1976. It is planned that Bulgaria will provide technical assistance,improved, modern equipment and guarantee a market for the production througha bilateral aid agreement.
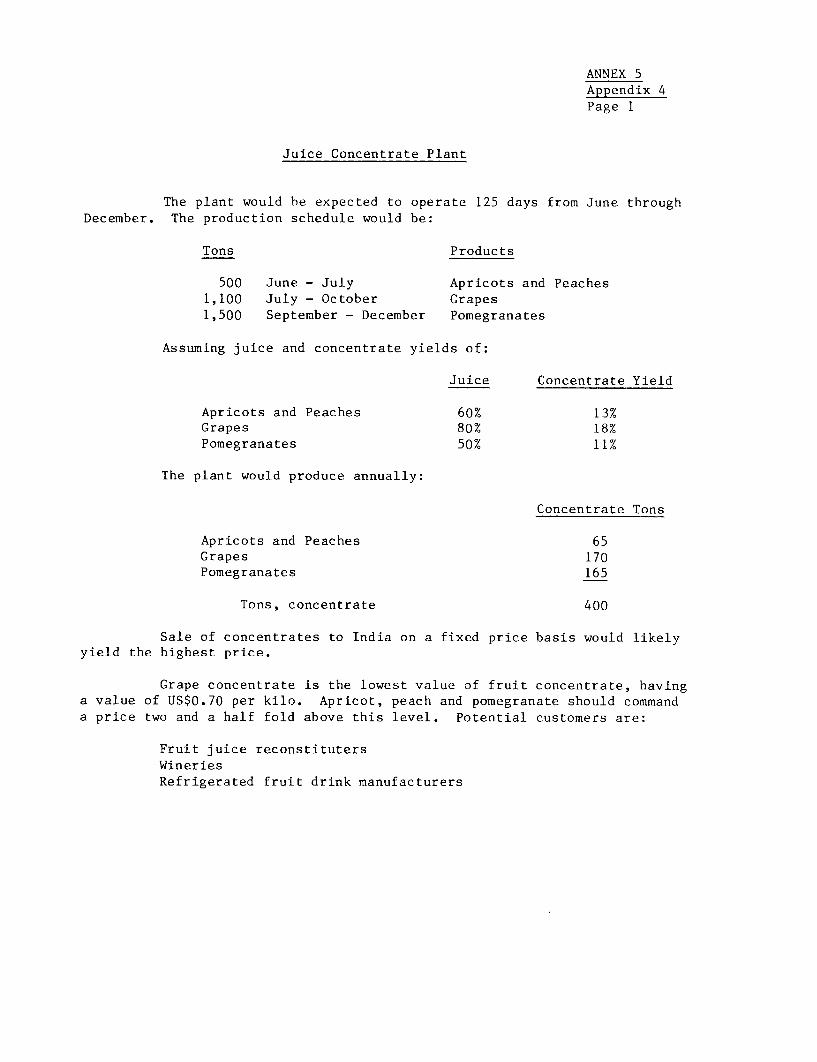
ANNEX 5Appendix 4Page 1
Juice Concentrate Plant
The plant would be expected to operate 125 days from June throughDecember. The production schedule would be:
Tons Products
500 June - July Apricots and Peaches1,100 July - October Grapes1,500 September - December Pomegranates
Assuming juice and concentrate yields of:
Juice Concentrate Yield
Apricots and Peaches 60% 13%Grapes 80% 18%Pomegranates 50% 11%
The plant would produce annually:
Concentrate Tons
Apricots and Peaches 65Grapes 170Pomegranates 165
Tons, concentrate 400
Sale of concentrates to India on a fixed price basis would likelyyield the highest price.
Grape concentrate is the lowest value of fruit concentrate, havinga value of US$0.70 per kilo. Apricot, peach and pomegranate should commanda price two and a half fold above this level. Potential customers are:
Fruit juice reconstitutersWineriesRefrigerated fruit drink manufacturers
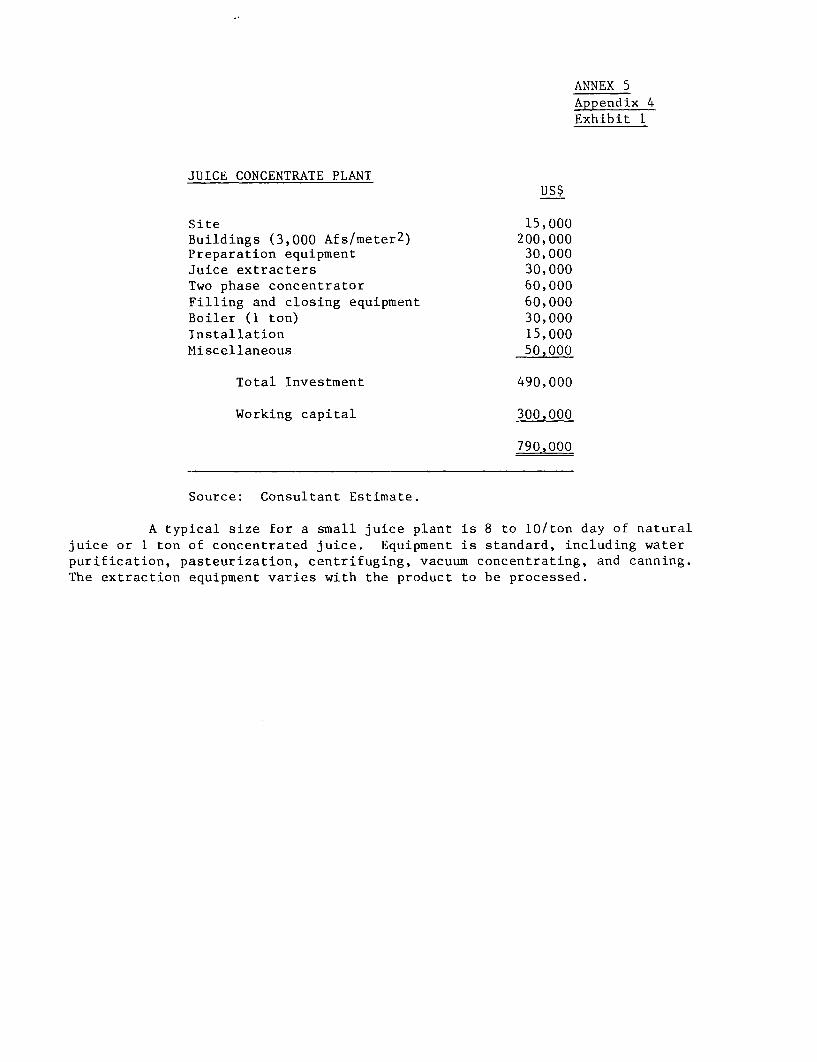
ANNEX 5Appendix 4Exhibit I
JUICE CONCENTRATE PLANTus$
Site 15,000Buildings (3,000 Afs/meter2) 200,000Preparation equipment 30,000
Juice extracters 30,000Two phase concentrator 60,000Filling and closing equipment 60,000Boiler (1 ton) 30,000Installation 15,000Miscellaneous 50,000
Total Investment 490,000
Working capital 300,000
790,000
Source: Consultant Estimate.
A typical size for a small juice plant is 8 to 10/ton day of natural
juice or 1 ton of concentrated juice. Equipment is standard, including water
purification, pasteurization, centrifuging, vacuum concentrating, and canning.
The extraction equipment varies with the product to be processed.
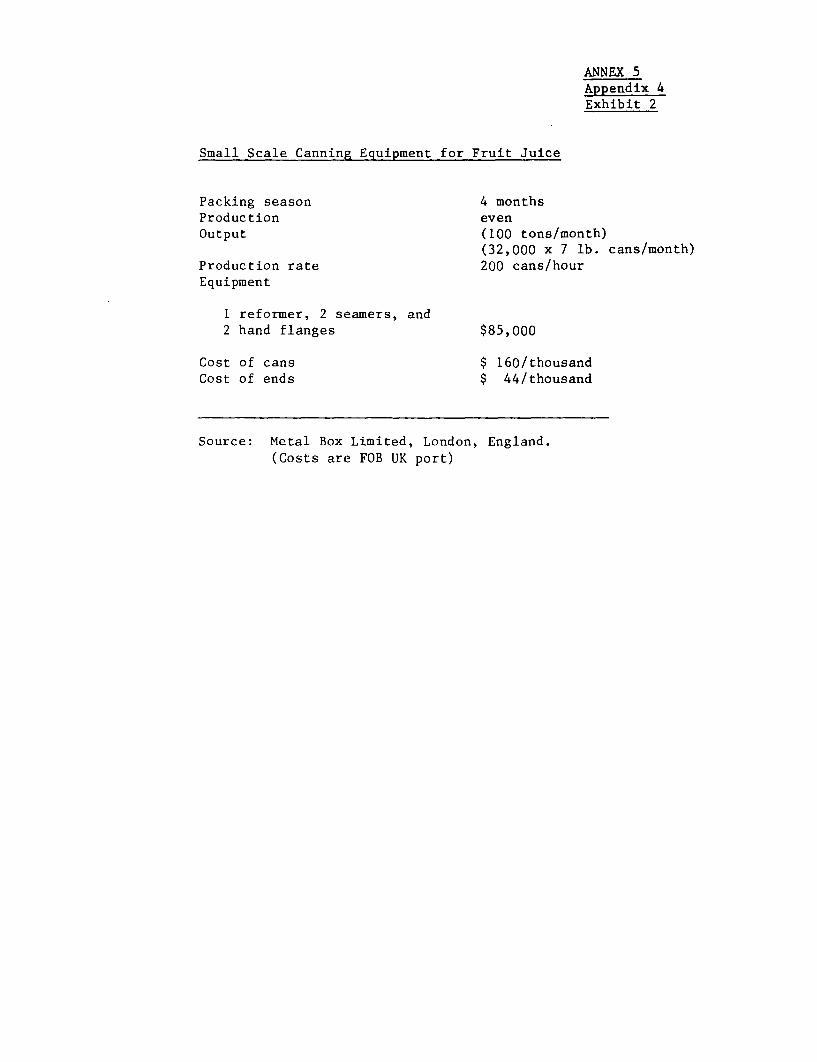
ANNEX 5Appendix 4Exhibit 2
Small Scale Canning Equipment for Fruit Juice
Packing season 4 monthsProduction evenOutput (100 tons/month)
(32,000 x 7 lb. cans/month)Production rate 200 cans/hourEquipment
1 reformer, 2 seamers, and2 hand flanges $85,000
Cost of cans $ 160/thousandCost of ends $ 44/thousand
Source: Metal Box Limited, London, England.(Costs are FOB UK port)
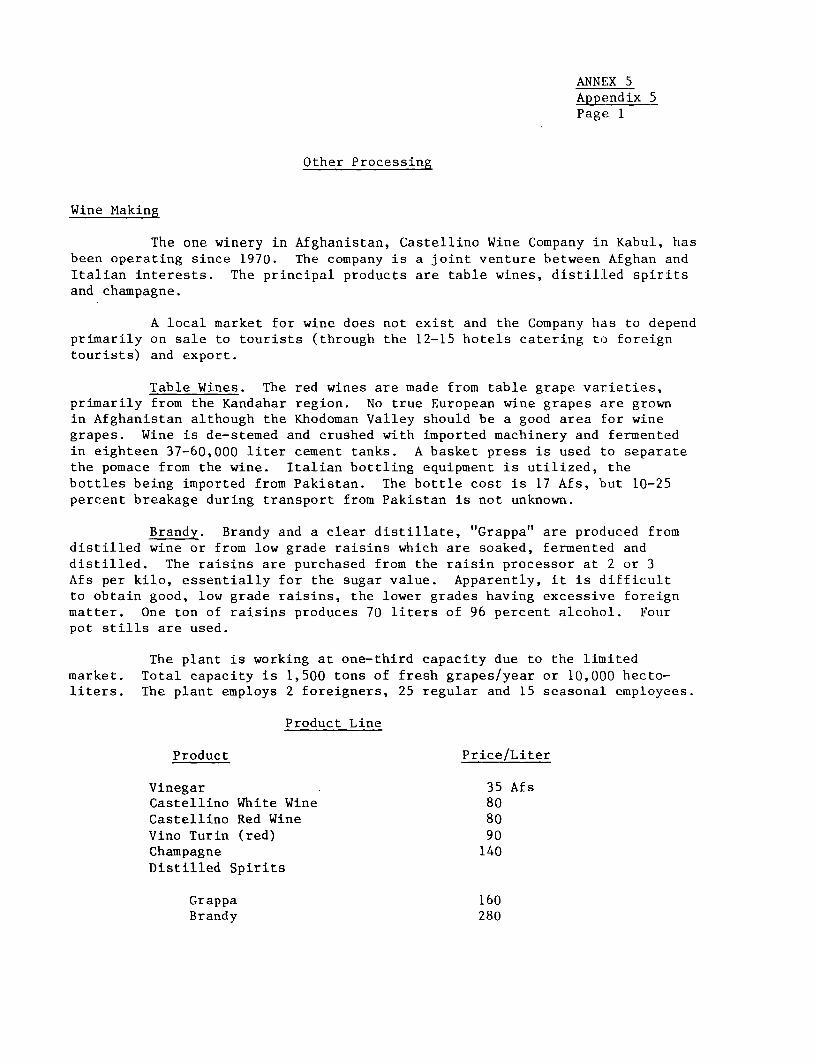
ANNEX 5Appendix 5Page 1
Other Processing
Wine Making
The one winery in Afghanistan, Castellino Wine Company in Kabul, hasbeen operating since 1970. The company is a joint venture between Afghan andItalian interests. The principal products are table wines, distilled spiritsand champagne.
A local market for wine does not exist and the Company has to dependprimarily on sale to tourists (through the 12-15 hotels catering to foreigntourists) and export.
Table Wines. The red wines are made from table grape varieties,primarily from the Kandahar region. No true European wine grapes are grownin Afghanistan although the Khodoman Valley should be a good area for winegrapes. Wine is de-stemed and crushed with imported machinery and fermentedin eighteen 37-60,000 liter cement tanks. A basket press is used to separatethe pomace from the wine. Italian bottling equipment is utilized, thebottles being imported from Pakistan. The bottle cost is 17 Afs, but 10-25percent breakage during transport from Pakistan is not unknown.
Brandy. Brandy and a clear distillate, "Grappa" are produced fromdistilled wine or from low grade raisins which are soaked, fermented anddistilled. The raisins are purchased from the raisin processor at 2 or 3Afs per kilo, essentially for the sugar value. Apparently, it is difficultto obtain good, low grade raisins, the lower grades having excessive foreignmatter. One ton of raisins produces 70 liters of 96 percent alcohol. Fourpot stills are used.
The plant is working at one-third capacity due to the limitedmarket. Total capacity is 1,500 tons of fresh grapes/year or 10,000 hecto-liters. The plant employs 2 foreigners, 25 regular and 15 seasonal employees.
Product Line
Product Price/Liter
Vinegar 35 AfsCastellino White Wine 80Castellino Red Wine 80Vino Turin (red) 90Champagne 140Distilled Spirits
Grappa 160Brandy 280
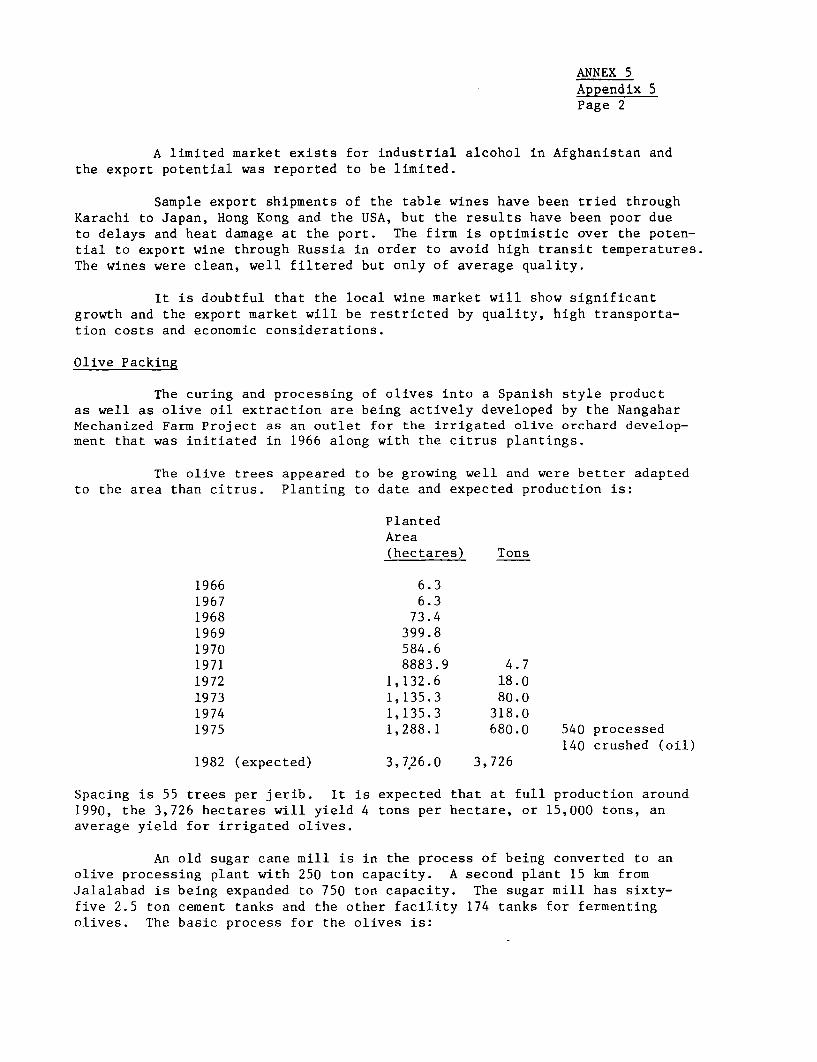
ANNEX 5
Appendix 5Page 2
A limited market exists for industrial alcohol in Afghanistan andthe export potential was reported to be limited.
Sample export shipments of the table wines have been tried throughKarachi to Japan, Hong Kong and the USA, but the results have been poor dueto delays and heat damage at the port. The firm is optimistic over the poten-tial to export wine through Russia in order to avoid high transit temperatures.The wines were clean, well filtered but only of average quality.
It is doubtful that the local wine market will show significantgrowth and the export market will be restricted by quality, high transporta-tion costs and economic considerations.
Olive Packing
The curing and processing of olives into a Spanish style productas well as olive oil extraction are being actively developed by the NangaharMechanized Farm Project as an outlet for the irrigated olive orchard develop-ment that was initiated in 1966 along with the citrus plantings.
The olive trees appeared to be growing well and were better adaptedto the area than citrus. Planting to date and expected production is:
PlantedArea(hectares) Tons
1966 6.31967 6.31968 73.41969 399.81970 584.61971 8883.9 4.71972 1,132.6 18.01973 1,135.3 80.01974 1,135.3 318.01975 1,288.1 680.0 540 processed
140 crushed (oil)1982 (expected) 3,726.0 3,726
Spacing is 55 trees per jerib. It is expected that at full production around1990, the 3,726 hectares will yield 4 tons per hectare, or 15,000 tons, anaverage yield for irrigated olives.
An old sugar cane mill is in the process of being converted to anolive processing plant with 250 ton capacity. A second plant 15 km fromJalalabad is being expanded to 750 ton capacity. The sugar mill has sixty-five 2.5 ton cement tanks and the other facility 174 tanks for fermentingolives. The basic process for the olives is:
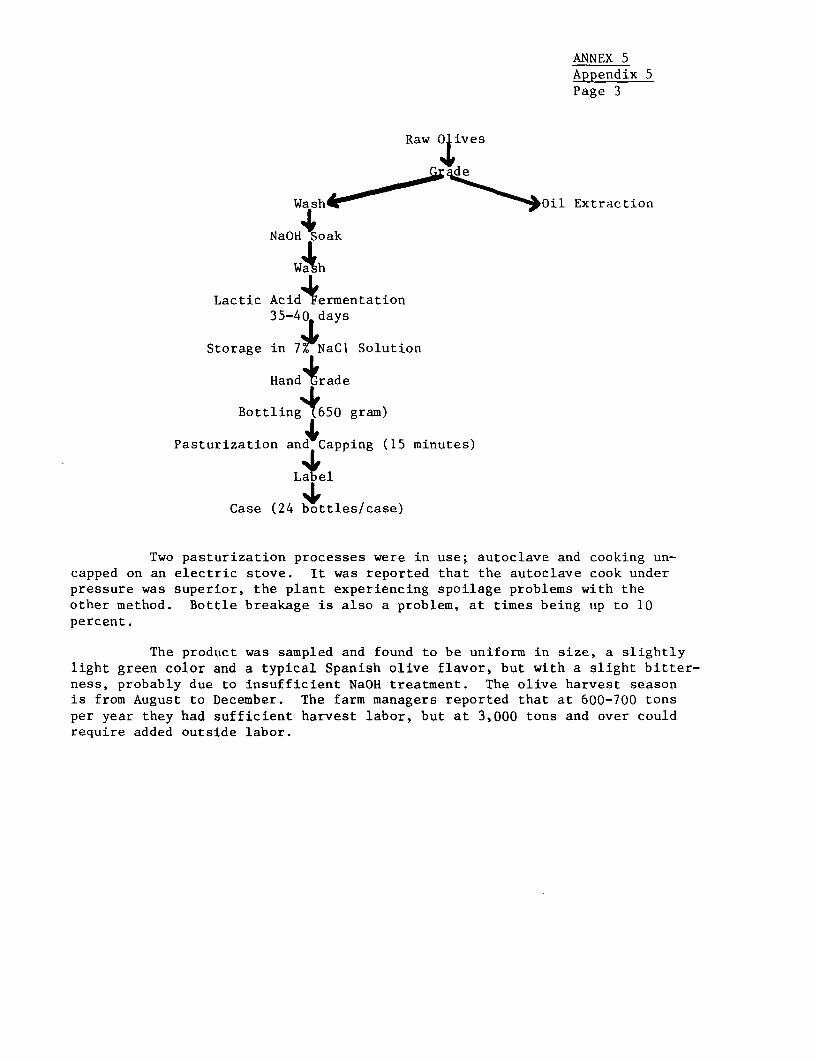
ANNEX 5Appendix 5Page 3
Raw 0jives
Wash Oil Extraction
NaOH Soak
Wash
Lactic Acid*ermentation35-40 days
Storage in 7#NaC1 Solution
Hand+rade
Bottling*650 gram)
Pasturization and Capping (15 minutes)
Label
Case (24 bottles/case)
Two pasturization processes were in use; autoclave and cooking un-capped on an electric stove. It was reported that the autoclave cook underpressure was superior, the plant experiencing spoilage problems with theother method. Bottle breakage is also a problem, at times being up to 10percent.
The product was sampled and found to be uniform in size, a slightlylight green color and a typical Spanish olive flavor, but with a slight bitter-ness, probably due to insufficient NaOH treatment. The olive harvest seasonis from August to December. The farm managers reported that at 600-700 tonsper year they had sufficient harvest labor, but at 3,000 tons and over couldrequire added outside labor.
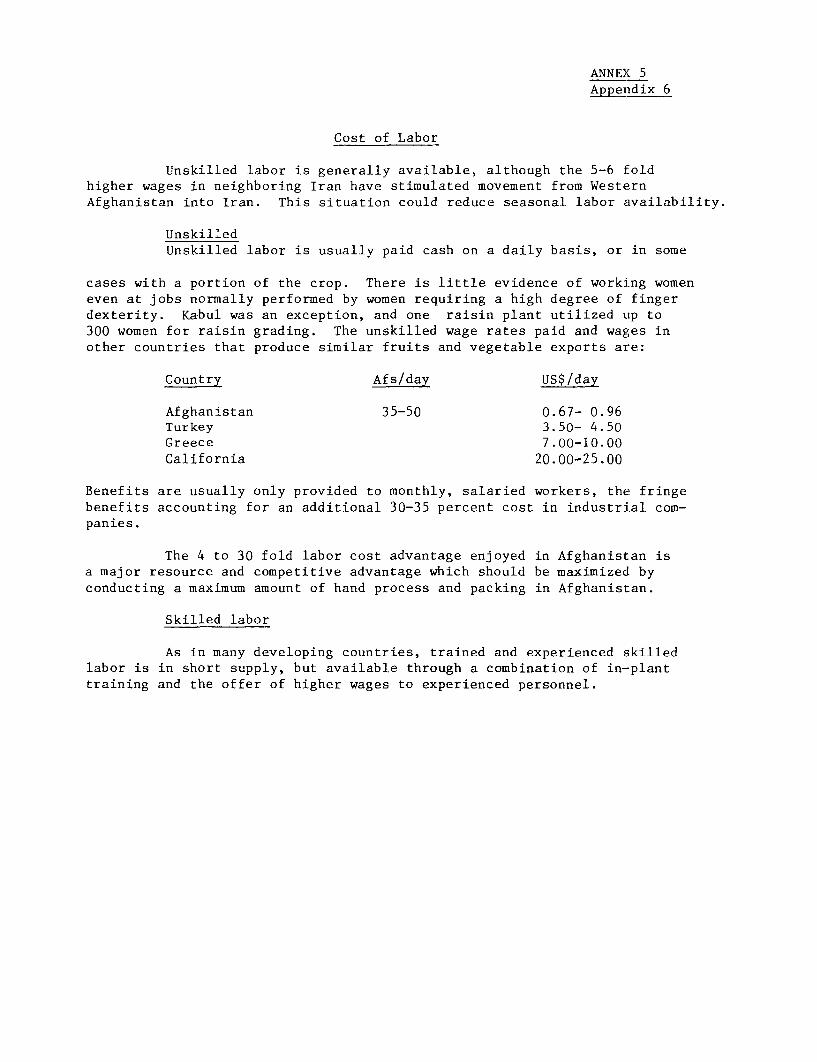
ANNEX 5Appendix 6
Cost of Labor
Unskilled labor is generally available, although the 5-6 i-oldhigher wages in neighboring Iran have stimulated movement from WesternAfghanistan into Iran. This situation could reduce seasonal labor availability.
UnskilledUnskilled labor is usually paid cash on a daily basis, or in some
cases with a portion of the crop. There is little evidence of working womeneven at jobs normally performed by women requiring a high degree of fingerdexterity. Kabul was an exception, and one raisin plant utilized up to300 women for raisin grading. The unskilled wage rates paid and wages inother countries that produce similar fruits and vegetable exports are:
Country Afs/day US$/day
Afghanistan 35-50 0.67- 0.96Turkey 3.50- 4.50Greece 7.00-10.00California 20.00-25.00
Benefits are usually only provided to monthly, salaried workers, the fringebenefits accounting for an additional 30-35 percent cost in industrial com-panies.
The 4 to 30 fold labor cost advantage enjoyed in Afghanistan isa major resource and competitive advantage which should be maximized byconducting a maximum amount of hand process and packing in Afghanistan.
Skilled labor
As in many developing countries, trained and experienced skilledlabor is in short supply, but available through a combination of in-planttraining and the offer of higher wages to experienced personnel.
ANNEX 6
GOVERNMENT ORGANIZATTON
Table of Contents
Chart 1 - Afghanistan - Organization Chart for theMinistry of Commerce
Chart 2 - Afghanistan - Organization Chart for theMinistry of Agriculture

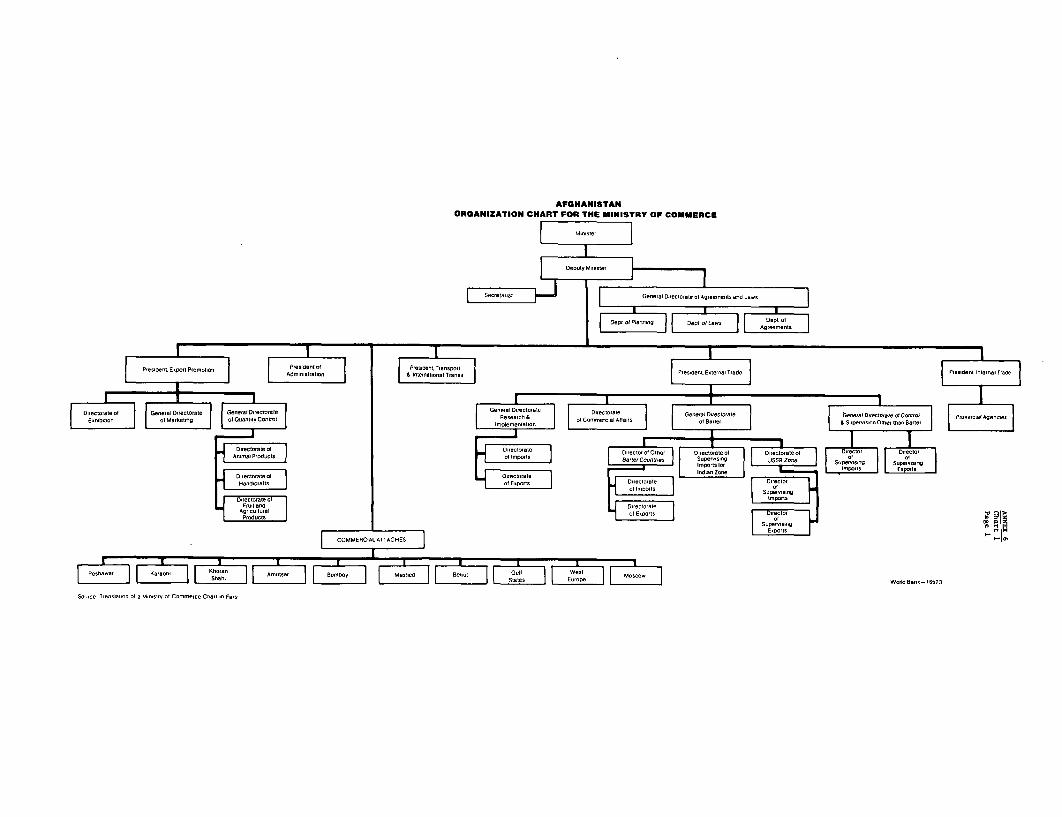
AFHANISTANORGANIZATION CHART FOR THE MINISTRY OF COMMERCE
T-Ifltittatl I Iransit
Geea ietrt Direcorat Gec oeateol Agrectroten andra Dirctost orCorl PocnaAec
| ol Ouantlty Contros t |~~~~~~~~~~o Imp ormetsto ll Barte Oveia o riin | S Zone Sceeror ona D Goeereiarngv
-| Hendicrrtts 1 -| Delectorate l ,,1 Dllectolste 1 | of P~~~~~~~~~~~~~~~~~~~~~~~~~~Imair Pa st
J~~~~~~~~~~~~~~~~~~~~~~~o Eaportns1 DirectorareI
A...) ProcIs C."I.G u MoscOw
< | Kadohr l l ~~Sh.h l mlsr ll Bms rhd ll Bl_ u0 ll E- W| |-Moscow
So.rce Tr-nsla-on or a Mi-stro or Commerce Chdrt o F-ars

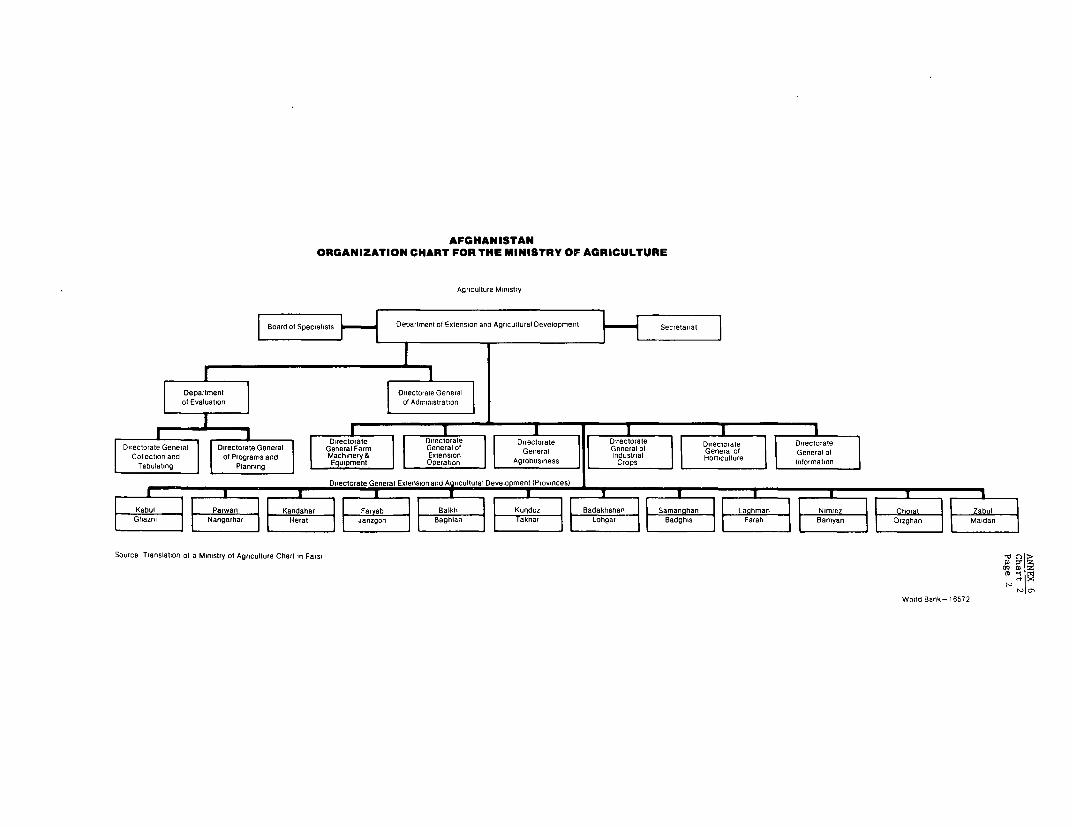
AFGHANISTANORGANIZATION CHART FOR THE MINISTRY OF AGRICULTURE
Agriculture Ministry
| eprment | Directorate General |Source Tranl uation of AdmMnistrarteon
Direct rate Directorate De te D,tee c tro rla t l DlrecoaWe B 52rectorateD| e orabteGnera ir c Gog2sad ahen y8 erraoall AgFarms l| IcrOpra of 'oreiutr l Gnrlo
rate ~ ~ ~ ~ rrcort eneraa Gxeso eand ogiutua Develpmen (PG e,e
Source~~~ ~ ~~~~ Machineryo ot Exeso Imsr nCd alcltr Horticulturel
Co~~~~~~~~~~~~~~~lectwn ~ ~ ~ ~ ~ ~ ~ ~ ~ ~ ~ ~ ~ ~ ~ ~ ~ ~ ~ ~~~~~~wn andnk-16572l o