contrast affects the strength of synesthetic colors
TRANSCRIPT
INTRODUCTION
Grapheme-color synesthesia is an automatic,involuntary experience of seeing colors whenviewing numbers, letters or words on a printed page(see, e.g., Cytowic, 1989, 2002; Ramachandran andHubbard, 2001b; Rich and Mattingley, 2002 forreviews). For example, looking at the letter E willelicit the experience of a red overlay for oursynesthete JC, while viewing an O elicits a bluepercept. A number of recent studies (Dixon et al.,2000; Mattingley et al., 2001; Mills et al., 1999)have used modified versions of the Stroopinterference paradigm to demonstrate thatgrapheme-color synesthesia is automatic, andperhaps obligatory. However, because Stroopinterference can arise from either perceptual orconceptual processes (MacLeod, 1991), it providesonly a coarse-grained tool for exploring the neuralsubstrates of synesthetic experience.
The application of perceptual paradigms to thestudy of synesthesia can begin to dissociateperceptual and cognitive factors in synesthesia. Ourprevious research compliments the results fromStroop paradigms and suggests that grapheme-colorsynesthesia is a truly perceptual experience, asopposed to a conceptual or metaphorical process(Ramachandran and Hubbard, 2001a, 2001b). First,
we found that synesthetic subjects performsignificantly better than controls in identifyingwhich of four shapes composed of graphemes wasembedded in a display containing other distractinggraphemes (Ramachandran and Hubbard, 2001a),in a manner akin to color “pop-out” or texturesegregation. Subjects were presented with screensfilled with distracter letters or numbers and targetgraphemes arranged into a shape. When thedisplays were presented for a brief time (onesecond), control subjects found it difficult to searchthe entire display, resulting in poor performance onthis task. For synesthetes, however, who report thatthey perceive colored shapes against a coloredbackground, this presentation time allowed forsignificantly better identification of the embeddedfigure. Control experiments with a subset ofsynesthetic subjects using typographical symbolssuch as “&” and “$” that did not evoke colorsshowed no such difference between synesthetes andnon-synesthetes.
Second, we have tested synesthetic subjects ona “crowding” paradigm in which their synestheticcolors were expected to aid them in identifying acentral target grapheme. In non-synestheticsubjects, numbers or letters presented in theperiphery were difficult to identify if presented inthe presence of flanking graphemes (crowding).
Cortex, (2006) 42, 184-194
PERCEPTION
CONTRAST AFFECTS THE STRENGTH OF SYNESTHETIC COLORS
Edward M. Hubbard1,3, Sanjay Manohar2 and Vilayanur S. Ramachandran1
(1Center for Brain and Cognition, University of California, San Diego, La Jolla, CA, USA; 2National Hospital of Neurology and Neurosurgery, Queen Square, London, UK; 3INSERM Unité 562-Neuroimagerie Cognitive,
Service Hospitalier Frédéric Joliot CEA, Orsay, France)
ABSTRACT
Grapheme-color synesthesia is an automatic, involuntary experience of seeing colors when viewing numbers, letters orwords on a printed page. Previous research has demonstrated that synesthesia is a genuine perceptual phenomenon, butcrucially, all of these experiments have used high-contrast letters and numbers. Our synesthete, JC, anecdotally reportedthat the strength of his synesthetic colors varied depending on whether the graphemes were presented in high or lowcontrast. To test this, we asked JC to rate the strength of his experiences to letters of different contrasts on three differentdates. JC’s ratings of the strength of his synesthetic colors consistently declined monotonically with contrast, suggestingthat his synesthetic colors were reduced or absent at low contrasts. To more precisely quantify the impact of this, we thentested JC on modified versions of our embedded figures task (Ramachandran and Hubbard, 2001a) and crowding task(Ramachandran and Hubbard, 2001b) by presenting displays with varying contrast between the graphemes and thebackground. Behavioral data in the contrast variant of our embedded figures task showed that JC performed significantlybetter than controls at high contrast, replicating our previous findings. However, at low contrast this advantage waseliminated, consistent with his reports of weaker or absent colors. A similar, but weaker pattern of results was found in themodified version of our crowding task. These results suggest that JC’s synesthetic colors may be elicited at contrastdependent stages of visual processing. We propose that regions of the fusiform gyrus specialized for letter and numbergrapheme recognition that have been shown to respond in a contrast dependent manner mediate JC’s synesthetic colors.However, whether this is true for all grapheme-color synesthetes or is only true of the group we refer to as lowersynesthetes, remains to be seen.
Key words: synaesthesia, contrast, VWFA, cross-activation
This effect is attenuated by presenting the targetgraphemes in a different color than the flankinggraphemes (Kooi et al., 1994). We find thatsynesthetic subjects were significantly better atidentifying the target grapheme than controls(Ramachandran and Hubbard, 2001b), suggestingthat synesthetic colors act in a manner similar toreal colors to reduce the magnitude of thecrowding effect.
Whereas we have used synesthetic colordifferences to facilitate performance on perceptualtasks, Smilek et al. (2001) manipulated colorcongruency to show that a number grapheme washarder to identify when the background color wascongruent with the synesthetic color than when itwas incongruent. For example, a 4, which theirsynesthete C experienced as blue, was harder toidentify when presented against a blue backgroundthan against a red background. Subsequent resultsby Palmeri et al. (2002) have shown that synestheticcolors can aid in the detection of a singleton in avisual search task. Palmeri et al. showed that, whenthe target and distracter elicited similar colors(searching for a 6 among 8 sec), search was difficult(search slopes were about 28 msec/item). However,when synesthetic colors differed between target anddistracter (searching for a 2 among 5 sec), theirsynesthetic subject WO was more efficient in hisvisual search (search slopes were about 15msec/item). In control subjects, no such differencewas observed.
Crucially, in all of these experiments, targetgraphemes were presented at high contrast againstthe background [the only exception being theSmilek et al. (2001) study, but contrast was notvaried systematically]. In discussions with oursynesthete, JC, he reported that the strength ofsynesthetic colors varied as a function of contrast.That is, when presented with a black grapheme on awhite background or a white grapheme on a blackbackground, JC reported that his synesthetic colorswere substantially stronger than when presentedwith a dark gray grapheme on a light graybackground. He commented, “It’s really strange,I’m not getting my colors as strongly”, “The colorseems detached,” and “It feels a bit like neon”.
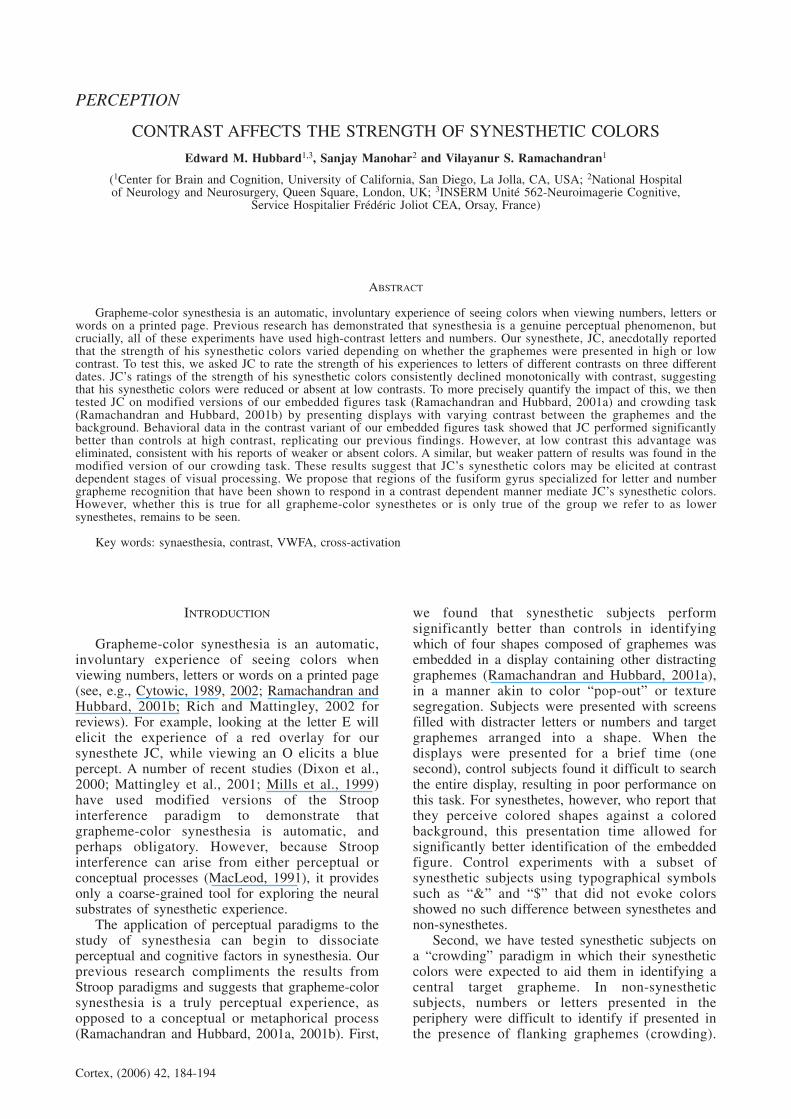
Interestingly, JC noted that his synestheticcolors were not eliminated equally strongly allacross the letter, but rather that the synestheticcolors were perceived at low intensity for certaincritical portions of the letter, but not for others(Figure 1). For example, JC noted that at 30%contrast the usual yellow color of “F” was weakerbut present for the two horizontal bars, and absentfor the vertical bar. At 5% contrast, he reportedthat only the tips and junctions of the “F” werecolored. When “H” was presented at 5% contrast,he perceived his usual green color, but unequallyover the letter. The upper left portion of the “H”was colored with an intermediate strength, but thelower right portion was barely colored at all.
Contrast and synesthesia 185
These observations may provide a novel toolfor identifying the representational level at whichsynesthetic colors arise. To understand this issue, abit of terminology is in order. Inducer refers to thestimulus that elicits synesthetic colors, whileconcurrent refers to the extra synestheticexperience (Grossenbacher and Lovelace, 2001). Ingrapheme-color synesthesia, the grapheme wouldbe the inducer and the colors the concurrents. Todate, synesthesia research has focused on thequestion of whether the synesthetic concurrents areperceptual. However, very little work has beendone to address the question of whether thesynesthetic inducer is perceptual or conceptual (butsee Ward and Simner, 2003 for a discussion ofsimilar issues in lexical-gustatory synesthesia).Simply showing that synesthetic colors are elicitedwhen subjects view letters or numbers is notadequate to resolve these questions. In addition toperceptual processes, visual presentation of agrapheme (for example ‘F’) automatically elicits ahost of cognitive processes, including phonemicrepresentations of the letter name (‘eff’), andhigher-level representations, such as that ‘F’ is thesixth letter of the alphabet.
Some preliminary evidence suggests that, atleast for some synesthetes, the inducer is thepercept of the grapheme, rather than other higher-order cognitive processes. We have previouslyreported that Roman numerals and clusters of dotsare not effective in eliciting synesthetic colors(Ramachandran and Hubbard, 2001a, 2001b) and that manipulation of font modulates the exact quality of the synesthetic experience(Ramachandran and Hubbard, 2003). Both of thesefindings suggested that the form of the graphemewas critical for the experience of colors. Our newfindings that JC’s synesthetic colors can bemodulated by contrast further argues against thepossibility that his synesthetic colors are elicited byconceptual representations, which should becontrast-invariant. Instead, our results suggest that
Fig. 1 – Images depicting which regions of letters that JCreported to be colored, when presented at low contrasts. Letter‘F’ at 40%, 30%, 10%, 10% (on a second occasion), 5%, 4%and 2% contrast levels; ‘H’ at 30% and 5%; ‘B’ at 30%.Percentages are nominal black levels.
JC’s synesthetic colors arise from contrast sensitivestages of perceptual processing, most likely in thefusiform gyrus (although there may be othersynesthetes for whom this is not true, seeRamachandran and Hubbard, 2001b; Hubbard etal., 2005).
Similarly, the finding that only edges, bars orsegments are synesthetically colored when viewinglow-contrast graphemes is consistent with certainfeature-based models of letter recognition (e.g.,Boles and Clifford, 1989) which emphasize theimportance of lines, junctions and free ends,although the precise correspondence depends onwhich feature model is employed. For example, inthe case of the “F”, the most important featureswould be the two horizontal lines (vs. three for an‘E’), the presence of the one L-junction and one T-junction, and the three free ends. Thesecomponents were the ones that were most likely toretain their color for JC, which further suggeststhat the percept of the grapheme is critical foreliciting his synesthetic colors.
In the following experiments, we sought todemonstrate this effect more clearly and to measurethe exact dependency of synesthetic colors oncontrast. We will return to the implications of thesefindings for the representational level, andespecially the neural basis, of the synestheticinducer in the discussion.
EXPERIMENT 1
Subjective Rating Data
In order to assess the effect of contrast on thestrength of JC’s synesthetic colors, we wanted totest as wide a range of synesthetic experiences aspossible. We therefore asked JC to identify whatcolors he experienced and how strongly heexperienced those colors for high contrast (blackon white) graphemes. We then chose graphemesthat elicited the strongest and weakest experiencesof red, green, yellow and blue. JC reported strongcolor experiences for E, H, F and O (red, green,yellow and blue, respectively) and weakexperiences for D, S and J (red, yellow and blue;no letter was reported as eliciting a weak greenexperience). To test the effect of contrast on thestrength of synesthetic colors, we randomlypresented one of these letters at fixation for twoseconds at various levels of contrast, and asked JCto rate the strength of his experiences.
Methods
Subjects
We tested synesthetic subject JC at three timepoints separated by approximately one month(February 20, March 7 and May 2, 2002). Because
186 Edward M. Hubbard and Others
of the subjective nature of these experiments,collection of control subjects data was notappropriate.
Apparatus
Stimuli were presented on a 17" IiyamaVisionMaster Monitor (1024 × 768, 75 Hz) usingMacromedia Director 7.0 (Macromedia, San Jose,CA, USA).
Stimuli and Methods
Letters were presented at fixation for twoseconds in varying contrasts. Letters wereapproximately 3.8 cm (1.5") tall at a viewingdistance of 60 cm (24"), subtending a visual angleof 2.3° × 3.6° (width × height) so thatdiscriminability would not be a limiting factor. Wetested 11 contrasts (nominally 100%, 80%, 60%,40%, 20%, 10%, 5%, 4%, 3%, 2% and 1%) inboth black and white. Letters were presented on aneutral gray background (18.4 cd/m2). Luminancevalues were collected using a Tektronix J18photometer and ranged from 0 cd/m2 (black) to 90cd/m2 (white). Weber contrast therefore variedbetween – 1.0 and 3.89. We also included catchtrials where no letter was presented (0% contrast).We presented a total of 161 trials per block (7letters × 2 colors × 11 contrasts + 7 catch trials),and tested JC on 4 blocks per session for a total of644 trials1. JC was asked to rate his subjectivecolor experience on a scale from 0 to 5, with 0being no color experience and 5 being as strong asa color in the real world. Each session lastedapproximately 1 hour.
Results
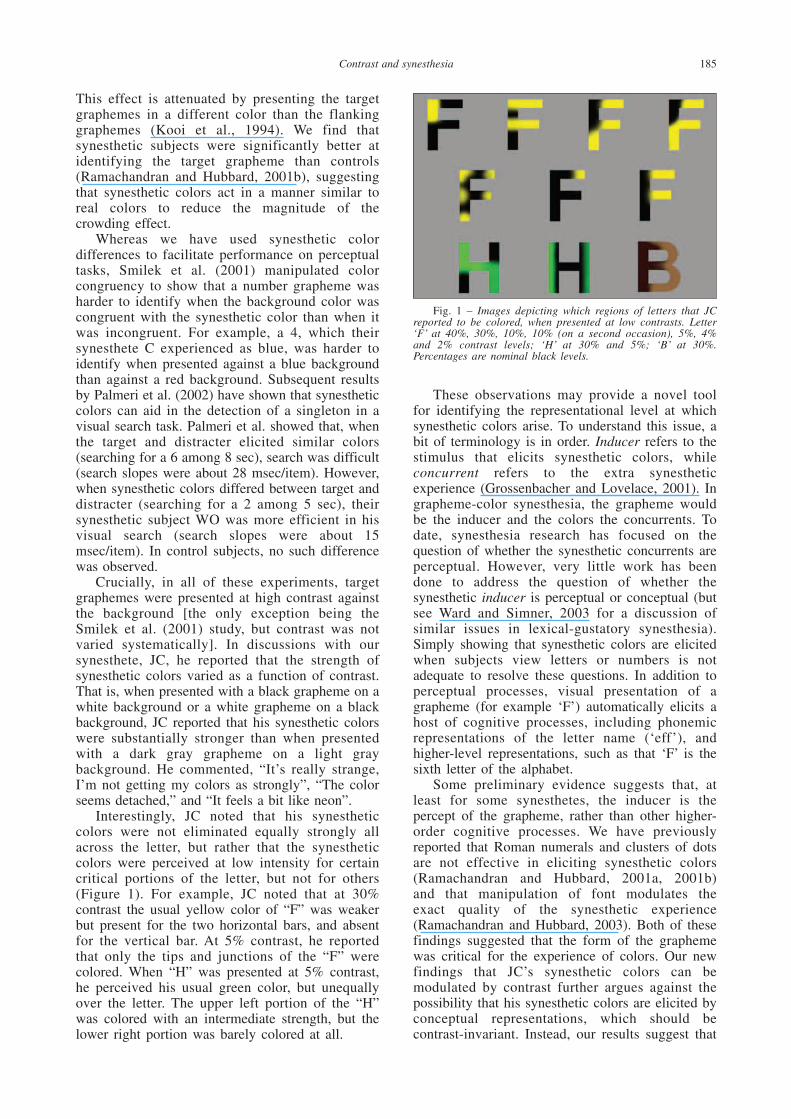
Mean subjective rating data for each letteraveraged over all three testing sessions as afunction of contrast is presented in Figure 2.Subjective color strength decreases monotonicallywith decreasing contrast for each letter. Thismonotonic decrease was consistent over differentletters, though the maximum rating for each letterwas different, consistent with JC’s early reportsthat some letters elicited stronger color experiencesthan others. JC accurately reported the identity ofthe letter at all contrasts. We find that JC showshighly significant effects of contrast [all Fs (10,462) > 140, p < .0001] and letter [all Fs (5, 462) >13, p < .0001] in each session, and a marginalcontrast by letter interaction [session 1, F (50, 462)= 1.56, p < .05; session 2, F (50, 462) = 1.31, p =.08; session 3, F (50, 462) = 1.34, p = .07]. Thelack of a clear interaction is probably due to the
1Due to a programming error, the letter F was not presented in the first twosessions, except for the black 100% contrast condition. Since these wereidentical to the catch trials, we analyze these trials with the catch trials.
fact that black and white letters show differentpatterns of contrast responses. When we block bycolor (black or white), this interaction is significantin all three sessions for black letters [all Fs (50,198) > 2, p < .001] but not white letters [all Fs(50, 198) < 1.35, p > .05]. Blocking by coloraffected neither the highly significant effect ofcontrast nor letter. Analyses grouped over all threesessions revealed that the main effects of contrast[F (10, 1518) = 477.19, p < .0001], and letter [F(5, 1518) = 49.41, p < .0001] and the contrast byletter interaction [F (50, 1518) = 2.91, p < .0001]were all significant. Overall, these data demonstratethat JC’s colors vary with contrast, and that thoseletters reported as having higher strength in thehigh-contrast condition showed a greater increasein their subjective strength than did those rated ashaving lower strength.
JC’s subjective reports were relativelyconsistent, despite the considerable delay betweentesting sessions. An overall ANOVA for the ratings(pooled over all letters and contrasts) showed atrend towards lower ratings from the first to thethird session [F (2, 1580) = 2.85, p = .058].However, further analyses of this trend showed thatit was probably driven by some inconsistency in theuse of the rating scale at the lowest contrasts(perhaps due to a shift in criterion). Ratings forcontrasts of 2%-5% decreased significantly fromthe first to the third session [all Fs (2, 141) > 4.5, p< .05]. At the 5% contrast level, five out of sixletters showed a significantly lower rating or atrend in this direction. At 2% and 3% contrast, onlyone data point showed a significant effect ofsession (J and H, respectively) and at 4%, twopoints showed non-significant trends towards lowercontrast (E and O). On the other hand, an ANOVArun on the rating data with these lowest contrasts
Contrast and synesthesia 187
excluded finds no effect of session [F (2, 860) =.69, p > .45]. For contrasts between 10% and100%, only one data point shows a significanteffect of session [20% O, F (2, 21) = 5.50, p < .05].These data suggest that, despite some variability atthe very lowest contrasts, JC consistently reportedthe same color strengths across sessions.
On 252 catch trials over three sessions, JCreported experiencing a color (of strength 1) ononly one trial. Similarly, he reported experiencingcolors on 0 out of 76 trials at 1% contrast and 2out of 76 trials (both of strength 1) at – 1% contrastsuggesting that JC was veridically reporting hisexperience of not experiencing colors at very lowcontrast. The fact that the reported strength of theexperience increases with contrast, both for blackand white text on a gray background also arguesagainst the possibility that JC was confabulating.Black text on a gray background was rated aseliciting stronger color experiences at maximumcontrast that white text on a gray background,despite the fact that 100% white text was highercontrast than 100% black text (Weber contrast 3.89for white, – 1.00 for black).
Overall, these data suggest that JC is veridicallyreporting a decline in the subjective strength of hissynesthetic colors with contrast. We thereforeturned to the question of whether these subjectiveeffects could be quantified behaviorally.
EXPERIMENT 2
Contrast Embedded Figures
To more precisely quantify the dependence ofsynesthetic colors on contrast, we modified ourprevious embedded figures task (Ramachandranand Hubbard, 2001a) to present displays at varyingcontrasts. In this task, subjects were presented withdisplays containing a large number of randomlyplaced graphemes. Embedded among theserandomly placed graphemes were a number ofother graphemes (e.g., 5 sec among 2 sec), whichmade up an embedded figure, such as a square ortriangle. Because of the visual similarity betweenthe graphemes, non-synesthetic subjects found itdifficult to identify the embedded figure. On theother hand, synesthetes, who experienced the 5 secand 2 sec as different colors were better able todetect the embedded figure (Ramachandran andHubbard, 2001a; see also Hubbard et al., 2005).
We used a modified version of this experiment,using three contrasts (3%, 10% and 100% black ona neutral gray background). Because his reportedcolor experiences were strong at 100% and nearlynon-existent at 3% contrast, we predicted that JCwould show better performance than controls athigh contrast, but not at low contrast. Because JCrated his color experience at 10% contrast to beweaker, but still present, we predicted a moderate
Fig. 2 – Subjective strength ratings for JC’s colors atdifferent contrasts (nominally -100% to 100%, where black isindicated by numbers less than 0 and white by numbers greaterthan 0) averaged over all three testing sessions. Each lineindicates JC’s subjective strength rating for one letter where thecolor indicates the color experienced. Squares indicategraphemes that elicit strong experiences (E, O and H) anddiamonds graphemes that elicit weak color experiences (D, Jand S).
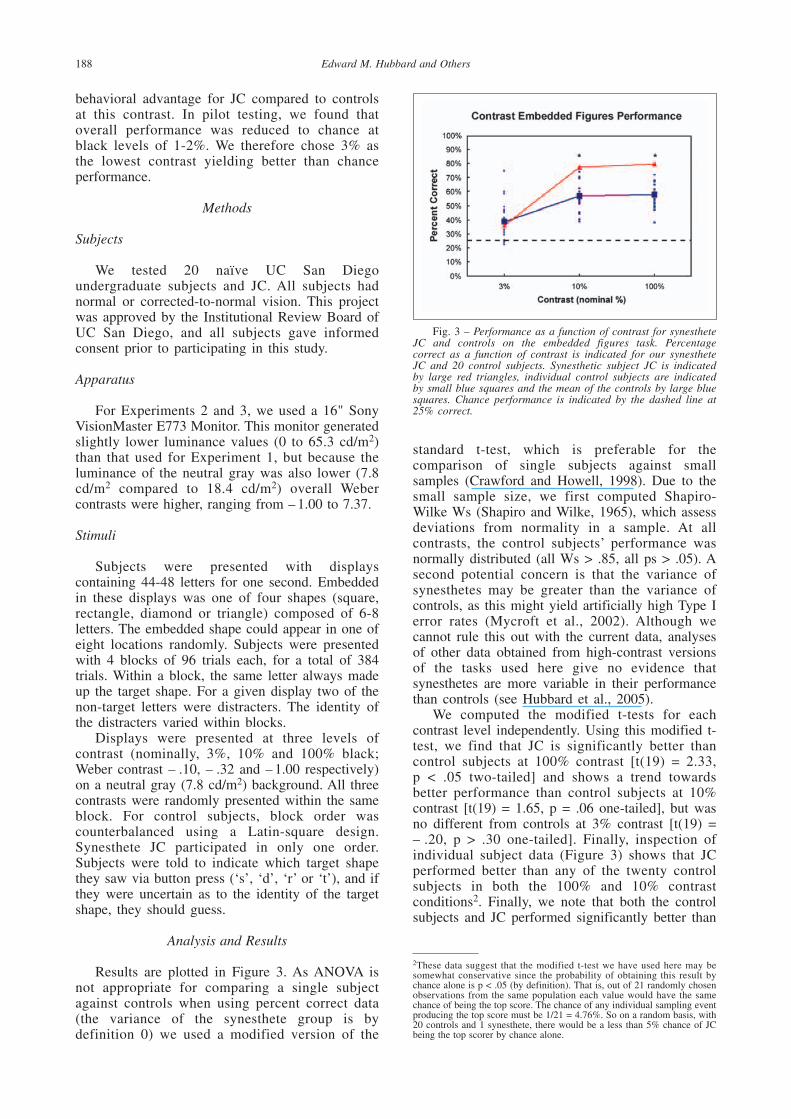
behavioral advantage for JC compared to controlsat this contrast. In pilot testing, we found thatoverall performance was reduced to chance atblack levels of 1-2%. We therefore chose 3% asthe lowest contrast yielding better than chanceperformance.
Methods
Subjects
We tested 20 naïve UC San Diegoundergraduate subjects and JC. All subjects hadnormal or corrected-to-normal vision. This projectwas approved by the Institutional Review Board ofUC San Diego, and all subjects gave informedconsent prior to participating in this study.
Apparatus
For Experiments 2 and 3, we used a 16" SonyVisionMaster E773 Monitor. This monitor generatedslightly lower luminance values (0 to 65.3 cd/m2)than that used for Experiment 1, but because theluminance of the neutral gray was also lower (7.8cd/m2 compared to 18.4 cd/m2) overall Webercontrasts were higher, ranging from – 1.00 to 7.37.
Stimuli
Subjects were presented with displayscontaining 44-48 letters for one second. Embeddedin these displays was one of four shapes (square,rectangle, diamond or triangle) composed of 6-8letters. The embedded shape could appear in one ofeight locations randomly. Subjects were presentedwith 4 blocks of 96 trials each, for a total of 384trials. Within a block, the same letter always madeup the target shape. For a given display two of thenon-target letters were distracters. The identity ofthe distracters varied within blocks.
Displays were presented at three levels ofcontrast (nominally, 3%, 10% and 100% black;Weber contrast – .10, – .32 and – 1.00 respectively)on a neutral gray (7.8 cd/m2) background. All threecontrasts were randomly presented within the sameblock. For control subjects, block order wascounterbalanced using a Latin-square design.Synesthete JC participated in only one order.Subjects were told to indicate which target shapethey saw via button press (‘s’, ‘d’, ‘r’ or ‘t’), and ifthey were uncertain as to the identity of the targetshape, they should guess.
Analysis and Results
Results are plotted in Figure 3. As ANOVA isnot appropriate for comparing a single subjectagainst controls when using percent correct data(the variance of the synesthete group is bydefinition 0) we used a modified version of the
188 Edward M. Hubbard and Others
standard t-test, which is preferable for thecomparison of single subjects against smallsamples (Crawford and Howell, 1998). Due to thesmall sample size, we first computed Shapiro-Wilke Ws (Shapiro and Wilke, 1965), which assessdeviations from normality in a sample. At allcontrasts, the control subjects’ performance wasnormally distributed (all Ws > .85, all ps > .05). Asecond potential concern is that the variance ofsynesthetes may be greater than the variance ofcontrols, as this might yield artificially high Type Ierror rates (Mycroft et al., 2002). Although wecannot rule this out with the current data, analysesof other data obtained from high-contrast versionsof the tasks used here give no evidence thatsynesthetes are more variable in their performancethan controls (see Hubbard et al., 2005).
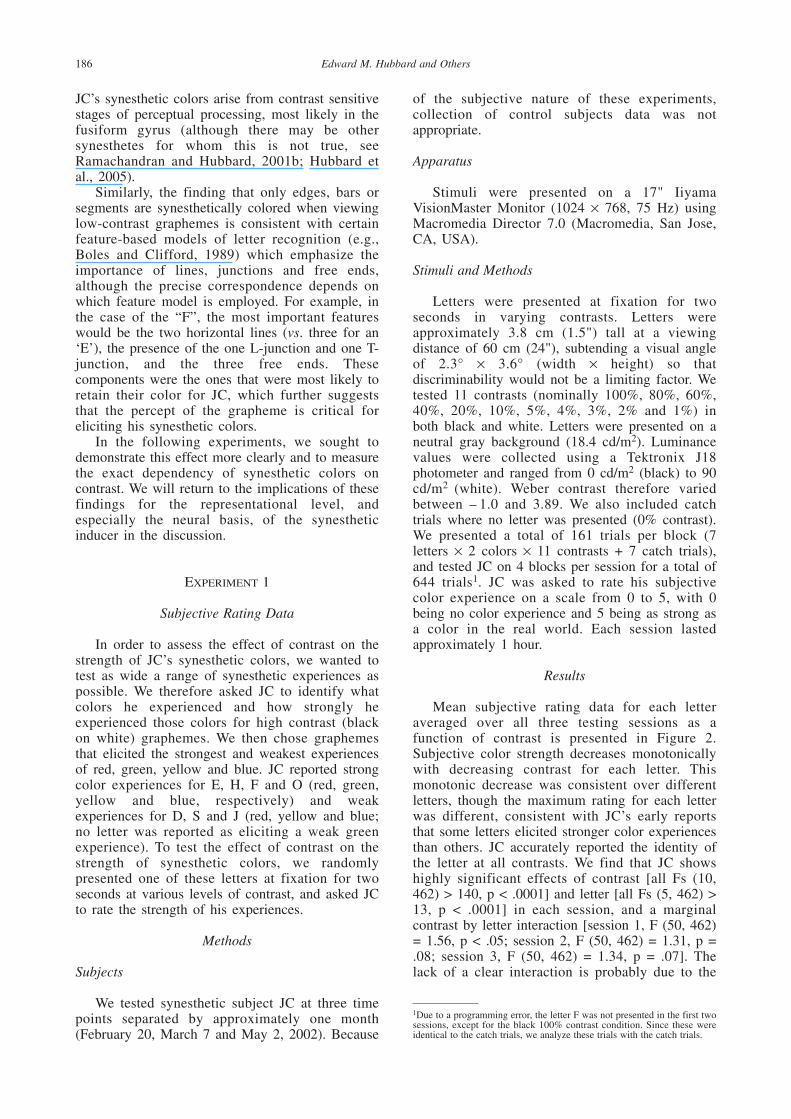
We computed the modified t-tests for eachcontrast level independently. Using this modified t-test, we find that JC is significantly better thancontrol subjects at 100% contrast [t(19) = 2.33, p < .05 two-tailed] and shows a trend towardsbetter performance than control subjects at 10%contrast [t(19) = 1.65, p = .06 one-tailed], but wasno different from controls at 3% contrast [t(19) =– .20, p > .30 one-tailed]. Finally, inspection ofindividual subject data (Figure 3) shows that JCperformed better than any of the twenty controlsubjects in both the 100% and 10% contrastconditions2. Finally, we note that both the controlsubjects and JC performed significantly better than
Fig. 3 – Performance as a function of contrast for synestheteJC and controls on the embedded figures task. Percentagecorrect as a function of contrast is indicated for our synestheteJC and 20 control subjects. Synesthetic subject JC is indicatedby large red triangles, individual control subjects are indicatedby small blue squares and the mean of the controls by large bluesquares. Chance performance is indicated by the dashed line at25% correct.
2These data suggest that the modified t-test we have used here may besomewhat conservative since the probability of obtaining this result bychance alone is p < .05 (by definition). That is, out of 21 randomly chosenobservations from the same population each value would have the samechance of being the top score. The chance of any individual sampling eventproducing the top score must be 1/21 = 4.76%. So on a random basis, with20 controls and 1 synesthete, there would be a less than 5% chance of JCbeing the top scorer by chance alone.
chance (38.87% and 35.94% correct, respectively)in the 3% contrast condition, arguing against thepossibility that this effect is simply due to flooreffects in the 3% contrast condition.
The fact that JC performed better than controlsubjects at high contrast, but not at low contrast,where he reports that his synesthetic colors werenot experienced, demonstrates a tight couplingbetween the subjective measures of color strengthin Experiment 1 and the objective data obtainedhere in Experiment 2. These results suggest, at leastfor JC, that the presence or absence of synestheticcolors can be modulated by contrast and that theseeffects mediate behavioral performance on theembedded figures task.
EXPERIMENT 3
Contrast Crowding
In our third experiment, we examined the effectof contrast on behavioral performance in ourcrowding task (Ramachandran and Hubbard,2001b). Briefly, crowding occurs when a singletarget item is surrounded by other flanking items,such as when a target letter is surrounded by otherflanking letters in reading (Bouma, 1970). Thiseffect is relatively small in the fovea, but increasesdramatically in the periphery, far more quickly thanperipheral factors such as optics, retinal sampling,or cortical magnification in V1 can account for(Strasburger et al., 1991), leading some to suggestthat the mechanisms of peripheral and fovealcrowding are different (compare Levi et al., 2002a,2002b).
A large body of research has examined theeffects of contrast and similarity on detection ofletters in the periphery, and the magnitude of thecrowding effect. For example, Strasburger et al.(1991) examined the effects of contrast, target sizeand crowding on number identification at variouseccentricities. Overall, at greater eccentricities,numbers had to be larger and higher contrast to beaccurately identified (67% threshold, 10-AFC).These two factors traded off, so that with largersize stimuli (for a given eccentricity) the contrastrequired to identify the number was reduced. In thepresence of flankers, the contrast threshold wasslightly increased for the smallest size stimuli, butnot for larger stimuli. Under the conditions used inour experiment (a 1.2° tall letter presented at about8° eccentricity) the presence of crowders had noimpact on the contrast threshold to identify thenumber. Similarly, Chung et al. (2001), usingspatially filtered letters showed that contrast hasonly a marginal effect on threshold elevation in thecrowded condition compared to the uncrowdedcondition.
Crucially for our experiments, it has beenshown that the magnitude of the crowding effect
Contrast and synesthesia 189
significantly modulated by target-flanker similarity(Kooi et al., 1994). Subjects were better able toreport the orientation of the target (the letter ‘T’)when the flankers were presented in either oppositeachromatic contrast polarity (black vs. white) ordifferent colors. For example, if a red target issurrounded by green flankers, the magnitude ofcrowding is reduced relative to if both the targetand flanker were red. In addition, Chung et al.(2001) have provided data showing that as the ratioof the contrast between the flankers and targetsincreases, the effect of crowding (measured asthreshold elevation) increases. This suggests thatthe Kooi et al. (1994) results are not simply due tolow-level grouping by contrast, but instead may bedue to higher-level interactions.
In our earlier experiments, we have demonstratedthat synesthetic colors lead to a similar reduction inthe magnitude of the crowding effect (Ramachandranand Hubbard, 2001b). JC reported that heexperienced his colors, despite not being able toactually identify the target letter, and that he inferredthe identity of the target letter based on hissynesthetic colors. One way to make sense of theseresults is in terms of attentional theories of crowding(He et al., 1996; Strasburger et al., 1991), whichsuggest that spatial uncertainty may make it difficultto integrate stimulus features into a coherent whole.These attentional limitations may have decreasedJC’s ability to appropriately bind features, therebyleading to his inability to recognize the graphemedespite substantial processing. However, thisprocessing may have been sufficient to elicit asynesthetic color, and since chromatic differences donot depend on attention or spatial positioninformation, crowding would have left color pop-outunaffected.
In the current experiment, we predicted thatbecause JC reports experiencing colors whenpresented with high-contrast letters, he should showa behavioral advantage on this crowding taskcompared to control subjects, replicating ourprevious findings with black letters on a whitebackground (Ramachandran and Hubbard, 2001b).However, because JC no longer experiencessynesthetic colors when presented with low-contrastletters his behavioral advantage would be reducedor eliminated at low contrasts. We should makeclear that our prediction here is not that aninteraction between crowding and contrast willeliminate synesthetic colors. As we have alreadydemonstrated, synesthetic colors can be eliminatedeven in free foveal viewing with no flankers(Experiment 1). Rather, we predict that since JCexperiences colors at high contrast, he shouldperform better than controls due a synestheticallyinduced contrast between the target and the flankers.In the absence of those colors at low contrast, thisbehavioral advantage should be eliminated. In orderto better compare psychophysical performance withJC’s phenomenological reports, we tested a wider
range of contrasts, from –100% contrast (white ongray) to 100% contrast (black on gray).
Methods
Subjects
Subjects were 12 naïve UC San Diegoundergraduates and synesthete JC. All subjects hadnormal or corrected-to-normal vision. This projectwas approved by the Institutional Review Board ofUC San Diego, and all subjects gave informedconsent prior to participating in this study.
Apparatus
All stimuli were generated by a PC running aJava program and were displayed on a 16"ViewSonic E773 monitor (1024-768 pixels, refreshrate 70 Hz). Stimuli were presented in a dimly litroom at a viewing distance of 60 cm (24"). Thedisplay area of the screen measured 320 × 243 mm,corresponding to 30 × 22 degrees. The appearanceof stimuli was timed to an accuracy of ± 7 ms.
Stimuli
Subjects initiated each trial with a button press,after which a central fixation cross appeared for1000 msec. They were then presented with one offour different target letters (E, F, H or O, whichelicit strong experiences of red, yellow, green andblue respectively for JC) flanked on all four sides(above, below and to the left and right) by one ofthe four letters for 100 msec, after which thescreen was blanked for 250 msec to avoid anymasking effects. Subjects were then prompted torespond by making a 4-alternative forced choiceresponse by key press on the computer keyboard.Subjects were not given feedback.
Target and crowder letters varied in a full 4 × 4factorial design (that is, the target letter and crowderletters varied independently on any given trial for atotal of 16 possible combinations), so that theidentity of the crowders presented no informationabout the identity of the target letter. The letterswere in presented Arial font and subtended a visualangle of 1.2-1.6 degrees. The central stimulus letterappeared at an eccentricity of 7.1 degrees. Thespacing from the edge of one letter to the next was.2 degrees, and center-to-center spacing of theletters averaged 1.4 degrees. Chung et al. (2001)have shown that at 5° eccentricity, crowding ismaximal within a critical letter spacing ofapproximately 2°, irrespective of spatial frequency.Given that our stimuli were presented moreperipherally, we would expect this window to beeven larger for our stimuli, so we can be relativelycertain the target grapheme was strongly crowded.
These 16 combinations were presentedrandomly to the left or right of fixation, at five
190 Edward M. Hubbard and Others
levels of contrast (nominally 100%, 60%, 40%,10%, 2%) in two colors (black and white) for atotal of 320 displays (16 × 5 × 2 × 2). Subjectswere presented with 8 blocks of 160 trials (the triallist was shuffled and a break inserted midwaythrough the 320 trials), in random order, totaling1280 trials. Background screen luminance was 7.8cd/m2 and Weber contrast ranged from – 1 to +7.37. All the shades of gray had CIE chromaticitycoordinates x = .27-.30, y = .30.
Analysis and Results
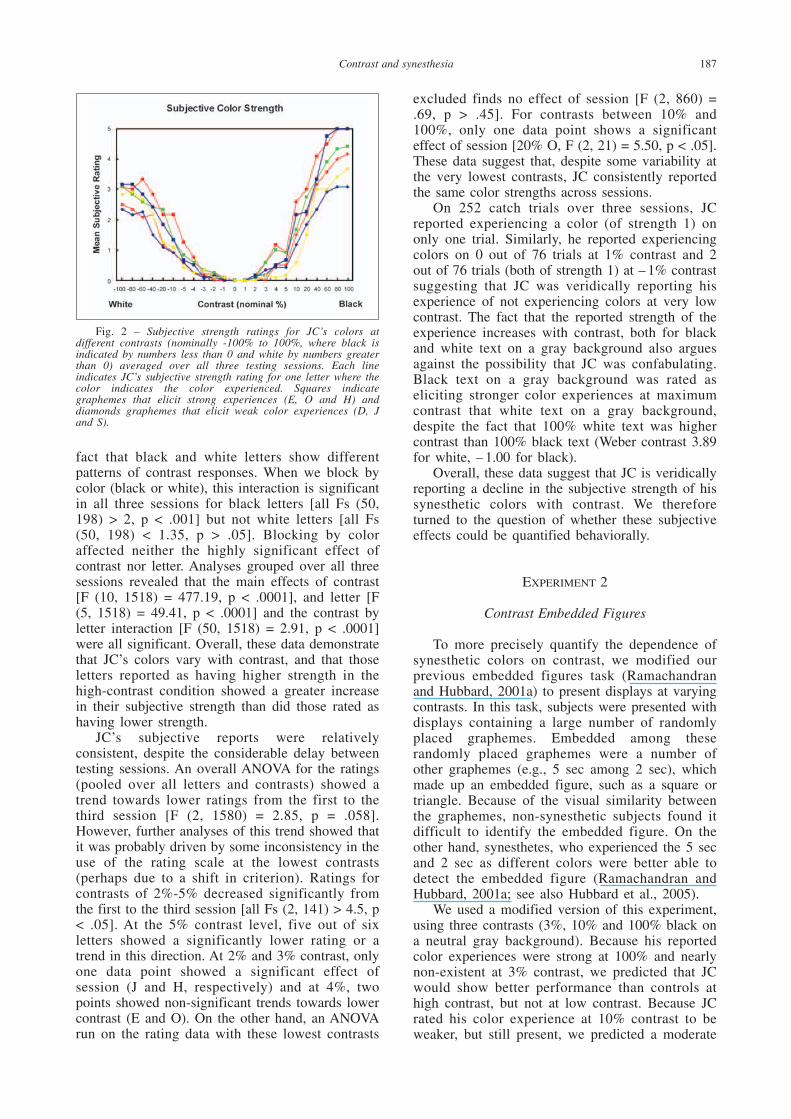
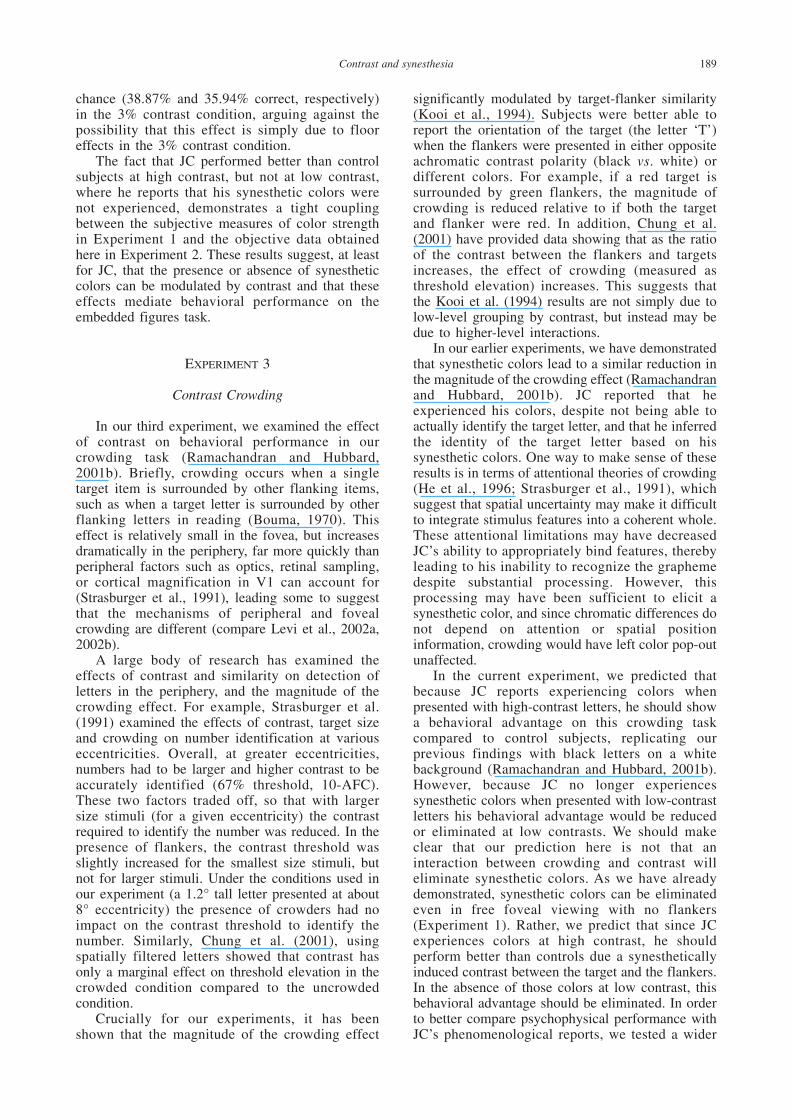
As shown in Figure 4, performance varied as afunction of contrast for both synesthetes andcontrols, with the worst performance beingobserved at the lowest contrasts. Additionally,Figure 4 shows that JC performed better thancontrols at high contrast, but not at low-contrast.To compare performance between JC and controlsubjects, we again used the modified t-test used forthe embedded figures task, and tested the sameassumptions of normality in controls, andhomogeneity of variance between synesthetes andcontrols. Control subjects’ performance wasnormally distributed at all three contrast levels (allWs > .90, all ps > .05). There was a trend towardspositive skew at the 3% contrast level (W = .91, p = .06) suggesting that performance wasapproaching floor. However, the medianperformance (37.5%) and range of the sample(23%-75%) suggest that performance was notlimited by chance performance. Additionally,analysis of data from a high-contrast version of thistask, again suggests that there is no difference inthe variability of synesthetes and controls (Hubbardet al., 2005).
When we compute the modified t-statistic, wefind that JC’s performance exceeds that of controlsat only 100% white [t(11) = 2.437, p < .05 two-
Fig. 4 – Performance as a function of contrast for synestheteJC and controls on the crowding task. Percentage correct as afunction of contrast is indicated for our synesthete JC and 12control subjects. Synesthetic subject JC is indicated in red andcontrols in blue. Chance performance is indicated by the dashedline at 25% correct.
tailed], replicating our previous finding of abehavioral advantage in the crowding task for JC athigh contrast. However, given that the sample sizeis relatively small, an examination of the individualsubjects data may be more informative.Examination of the individual subject data at eachcontrast shows that JC performs better than any ofthe controls at 40%, 60% and 100% contrast(white), and better than all but two controls at 10%and – 10%, – 40%, – 60% and – 100% (black)contrast. However, there is no single controlsubject that consistently performed better than JC.Instead, several subjects consistently performedwell, sometimes better than JC, and sometimesworse than JC.
Interestingly, at the lowest contrast JC’sperformance was markedly impaired (29.7%),consistent with his introspective report that whenhe did not experience his colors, he “didn’t knowwhat to do.” In our previous study using high-contrast targets and crowders JC had reported thathe often was unable to identify the target letter, butexperienced his colors, and was able to infer theidentity of the target letter on the basis of thecorrespondence between his colors and the identifyof the graphemes (Ramachandran and Hubbard,2001b). It seems that, in the absence of thisstrategy, JC was unable to infer the identity of thetarget letter and therefore had to resort to moretraditional routes of letter recognition in thecrowded condition.
DISCUSSION
A growing body of evidence suggests, at leastfor some synesthetes, that their synestheticconcurrents are real and that they have verifiableperceptual consequences (Palmeri et al., 2002;Ramachandran and Hubbard, 2001a; Smilek et al.,2001). Imaging studies further suggest thatsynesthetes’ brains respond differently than non-synesthetes brains when hearing words (Nunn etal., 2002; Paulesu et al., 1995) or when viewinggraphemes (Hubbard et al., 2005). The finding thatthe subjective strength of synesthetic colors (and toa lesser extent, the behavioral advantage seen inour embedded figures and crowding paradigms)decreases with contrast suggests that, not only aresynesthetic concurrents perceptual, but so too aresynesthetic inducers. Specifically, our resultssuggest that it is the percept, rather than theabstract concept of the grapheme, or any associatedhigher level processing, that elicits synestheticcolors in subject JC, consistent with our priorobservations that clusters of dots and Romannumerals were ineffective in eliciting synestheticcolors (Ramachandran and Hubbard, 2001b).
An examination of the known properties ofsynesthetic experience and the known properties offusiform responses to letters and other classes of
Contrast and synesthesia 191
object stimuli suggests that this region may be theneural level at which synesthetic experience iselicited. Numerous imaging studies have identifieda region of the fusiform gyrus (especially in theleft hemisphere) that responds more strongly tovisually presented letters and words than to falsefonts with equivalent visual complexity (Petersen etal., 1988, 1990) dubbed the visual word form area(VWFA) (Cohen et al., 2000, 2002; for a reviewsee Cohen and Dehaene, 2004). Previous studiesusing visually presented numbers have also foundactivation in roughly this same region (Pesenti etal., 2000; Rickard et al., 2000). Recordings fromcortical surface electrodes find distinct populationsthat respond to letters and numbers (Allison et al.,1994), suggesting an extremely fine-grainedorganization (perhaps too fine to be observed withfunctional imaging). Finally, the VWFA respondsonly to written, but not spoken words (Dehaene etal., 2002) and damage to this area results in asevere impairment in word identification, purealexia, which is restricted to the visual modality(Leff et al., 2001). Both of these results suggestthat the VWFA that is specialized for the visualperceptual identification of these stimuli, ratherthan representing higher order conceptualprocesses.
One prediction we would therefore make is thatresponses in the VWFA should be modulated bycontrast, as are the strength of synesthetic colors.Mechelli et al. (2000) measured rCBF in sixsubjects while they viewed either short or longwords (3, 6 or 9 letters) at either high or lowcontrast. They find that (1) responses in the boththe fusiform and lingual gyri are larger for longwords than short words (2) increased contrast leadsto an increased response in the fusiform gyrus, buta decreased response in the lingual gyrus and (3)contrast linearly shifts the rCBF upward ordownward in these regions (i.e., there is nointeraction between word length and contrast).Avidan et al. (2002) measured contrast responsesalong the ventral visual pathway from V1 toinferior temporal regions LOC and pFs usingfMRI. They found that although contrastdependency decreased at higher levels of the visualpathway, even object selective regions in theinferior temporal lobe were still substantiallymodulated by contrast. Intriguingly, measuredfMRI responses in LOC and pFs increase from 0%to 10%, and then level off between 10 and 100%contrast, mirroring the pattern of behavioralperformance we observed here (Figures 3 and 4).Together, these results suggest that similarmodulations of neural responses in the VWFAunderlie the modulations in the strength of thesynesthetic colors that we observe here.
Additional comparisons between what is knownabout the response properties of the VWFA andwhat is known about synesthesia further suggeststhat this area is the neural substrate of the
synesthetic inducer. This region is activated byletters that are defined both by standard luminanceedges and by motion defined edges (Noguchi et al.,2004), suggesting a certain degree of invarianceover the specific features used to define the letter(for converging single unit data with other classesof objects, see Kovács et al., 2003). Palmeri et al.(2002), report that their synesthete WO experiencessynesthetic colors for luminance defined, disparitydefined and motion defined letters, and we findthat presentation of letters defined by illusorycontours and amodally completed forms elicits theusual colors, although the exact quality of thesecolors is mildly affected (Ramachandran andHubbard, 2003). This suggests that the activationof same letter selective neurons in the VWFA isoccurring independent of whether the letter isdefined by traditional luminance boundaries,motion boundaries or illusory contours.
The proposal that the VWFA is the neuralcorrelate of the synesthetic inducer is alsoconsistent with phenomenological observations wehave previously reported indicating that variationsof font affect the exact strength of the synestheticcolors (Ramachandran and Hubbard, 2003). Wesuggest that the letter and number selective neuronsin the VWFA may respond most strongly toprototypical examples of these graphemes, and thatwhen they are presented in less typical fonts, theamount of activation should change, too, in thesame way manipulating a face will cause the firingproperties of face selective neurons to change. Thiswould then lead to a different pattern of cross-activation between the VWFA and hV4.Consequently, the exact nature of the synestheticcolors should vary depending on low-levelperceptual factors such as contrast and font, butmight be invariant over the lower-level visualfeatures used to define these letters.
Numerous studies have demonstrated that theVWFA responds in a case and location invariantmanner, consistent with the common observationthat synesthetic colors are the same for lettersirrespective of case (e.g., ‘a’ and ‘A’ are bothexperienced as red) and that they are experiencedas having the same color no matter where in thevisual field the letter is presented. Polk and Farah(2002) report that responses do not differdepending on whether a word is presented in amixed case (such as hOuSe) or in one consistentcase. Dehaene et al. (2001, 2004) report that theVWFA shows reduced responses when the sameword is presented in a different case (e.g., RAGEfollowed by rage) even if the visual features of theletters are highly dissimilar (e.g., ‘A’ and ‘a’).These neuroimaging findings are consistent withprevious behavioral reports of case-invariantpriming on letter and word naming tasks (Arguinand Bub, 1995; Bowers et al., 1998; Humphreys etal., 1990) and suggest that the VWFA is the neurallocus of these effects. More detailed analysis of the
192 Edward M. Hubbard and Others
VWFA repetition suppression demonstrates thatthere may be two distinct regions, a posteriorregion, which shows no repetition suppressionwhen letters are presented in different locations,and an anterior region, which shows positionallyinvariant repetition suppression (Dehaene et al.,2004; c.f., Ito et al., 1995).
Based on the observation that synesthetic colorscan be affected by context and meaning, Merikleand collegues have argued that synesthetic colorsmay be mediated by feedback between conceptualrepresentations in the anterior inferior temporal(AIT) and color selective regions, rather than thedirect cross-activation between adjacent VWFA andhV4 (Myles et al., 2003; Dixon et al., 2004).However, the presence of contextual modulationsdoes not rule out the possibility of direct cross-activation between the VWFA and hV4 insynesthesia. Instead, neurons in the VWFA may bemodulated by top-down influences from AIT. Ifdifferent populations of neurons in the VWFA wereactive due to this modulatory influence, this wouldlead to cross-activation of different color selectiveneurons in hV4. Given the coarse resolution ofboth psychophysical and functional neuroimaging,the resolution of these debates will probablydepend on the use of techniques that permit morefine-grained temporal resolution, such as EEG orMEG.
Finally, it has been suggested that the visualgrapheme does not need to be physically presented,but that a conceptual representation may besufficient for the experience of synesthetic colors(Dixon et al., 2000; Smilek et al., 2002). Dixon etal. presented their synesthetic subject, C, withaddition problems by presenting a digit, an operator,second digit and a color patch (e.g., 5 + 2, green). Cwas required to report the color of the patch andthen the solution to the addition problem. Reactiontimes were slower when the color patch wasincongruent with the color that C experienced forthe solution of the addition problem. In thisexample, if the addition problem was followed by agreen color patch (C experiences 7 sec as yellow)then reaction time was longer than if a yellow colorpatch was presented.
However, these results do not provideunambiguous proof for the conclusion that C wasusing only a conceptual representation of thenumber. If C were to have imagined thegraphemes, she would have activated categoryselective regions in the fusiform gyrus (e.g.,O’Craven and Kanwisher, 2000), leading to theactivation of the synesthetic color. Although Smileket al. (2002) recognize that imagery might be afactor, they suggest that, “for C, digits qualify ashigher level concepts” (p. 573). We instead suggesttop-down activation of the VWFA through mentalimagery as an alternative explanation of theirresults, although behavioral data cannot distinguishbetween these two accounts.
Finally, it should be noted that whether thesynesthetic color is elicited at a perceptual orconceptual stage might vary significantly betweensynesthetes. We have previously suggested thatgrapheme-color synesthesia may be composed of(at least) two subtypes, which we refer to as“higher” and “lower” synesthetes (Ramachandranand Hubbard, 2001b; for similar distinctions seeDixon et al., 2004; Grossenbacher and Lovelace,2001; Smilek and Dixon, 2002). One piece ofevidence for this heterogeneity comes from ourrecent behavioral and neuroimaging studies ofsynesthetic concurrents (Hubbard et al., 2005). Wetested six grapheme-color synesthetes, who allreported seeing colors for letters and numbers, onour embedded figures task (Ramachandran andHubbard, 2001a) and our crowding task(Ramachandran and Hubbard, 2001b). We find thatoverall, synesthetes perform better than controls onthe embedded figures task, replicating our previousfinding. However, in the crowding task, only threeof our synesthetes perform better than theirrespective control populations. Analysis ofindividual subject’s data, however, shows that thosesynesthetes who showed the best behavioralperformance in the embedded figures task alsoshowed the best performance in the crowding task.
Subsequent fMRI studies of hV4 activation inthese same subjects showed that hV4 was moreactive in synesthetes than controls. Crucially, wealso find that the magnitude of the activationcorrelates with psychophysical performance on thecrowding task. Those synesthetes who showed thegreatest behavioral advantage on the crowding taskalso showed the greatest about amount of fMRIactivation in hV4. We suggest that thesedifferences at individual level indicate that,although group level studies can uncoversignificant differences between synesthetes andnon-synesthetes, that there may also be importantdifferences between individual synesthetes.
Future studies of grapheme-color synesthesiawill have to carefully evaluate the level ofprocessing at which both the synesthetic inducerand concurrent are elicited. If we are correct in ourhypothesis about higher and lower synesthetes, wewould predict that those synesthetes who experiencethe strongest concurrents would have perceptuallevel inducers, while those who experience weakerconcurrents would have conceptual level inducers.
Acknowledgements. This research was funded bygrants NIH grants F31 MH63585 to EMH and RO1 MH60474 to VSR. We thank Geoffrey M. Boynton, Lisa E.Williams and two anonymous reviewers for comments onthis manuscript.
REFERENCES
ALLISON T, MCCHARTY G, NOBRE A, PUCE A and BELGER A.Human extrastriate visual cortex and the perception of faces,words, numbers and colors. Cerebral Cortex, 4: 544-554,1994.
Contrast and synesthesia 193
ARGUIN M and BUB D. Priming and response selection processesin letter classification and identification tasks. Journal ofExperimental Psychology: Human Perception andPerformance, 21: 1199-1219, 1995.
AVIDAN G, HAREL M, HENDLER T, BEN-BASHAT D, ZOHARY E andMALACH R. Contrast sensitivity in human visual areas and itsrelationship to object recognition. Journal of Neurophysiology,87: 3102-3116, 2002.
BOLES DB and CLIFFORD JE. An upper- and lowercase alphabeticsimilarity matrix, with derived generation similarity values.Behavior Research Methods, Instruments and Computers, 21:579-586, 1989.
BOUMA H. Interaction effects in parafoveal letter recognition.Nature, 226: 177-178, 1970.
BOWERS JS, VIGLIOCCO G and HAAN R. Orthographic,phonological and articulatory contributions to masked letterand word priming. Journal of Experimental Psychology:Human Perception and Performance, 24: 1705-1719, 1998.
CHUNG STL, LEVI DM and LEGGE GE. Spatial-frequency andcontrast properties of crowding. Vision Research, 41: 1833-1850, 2001.
COHEN L and DEHAENE S. Specialization within the ventral stream:The case for the visual word form area. NeuroImage, 22: 466-476, 2004.
COHEN L, DEHAENE S, NACCACHE L, LEHERICY S, DEHANE-LAMBERTZ G, HENAFF M-A and MICHEL F. The visual wordform area: Spatial and temporal characterization of an initialstage of reading in normal subjects and posterior split-brainpatients. Brain, 123: 291-307 2000.
COHEN L, LEHERICY S, CHOCHON F, LEMER C, RIVAUD S andDEHAENE S. Language-specific tuning of visual cortex?Functional properties of the Visual Word Form Area. Brain,125: 1054-1069, 2002.
CRAWFORD JR and HOWELL DC. Comparing an individual’s testscore against norms derived from small samples. ClinicalNeuropsychologist, 12: 482-486, 1998.
CYTOWIC RE. Synaesthesia: A Union of the Senses (1st ed/2nd ed).New York: Springer-Verlag 1989/2002.
DEHAENE S, JOBERT A, NACCACHE L, CIUCIO P, POLINE J-B,LEBIHAN D and COHEN L. Letter binding and invariantrecognition of masked words: Behavioral and neuroimagingevidence. Psychological Science, 15: 307-313, 2004.
DEHAENE S, LECLEC’H G, POLINE J-B, LEBIHAN D and COHEN L.The visual word form area: A prelexical representation ofvisual words in the fusiform gyrus. NeuroReport, 13: 321-325,2002.
DEHAENE S, NACCACHE L, COHEN L, LEBIHAN D, MANGIN J-F,POLINE J-B and RIVIERE D. Cerebral mechanisms of wordmasking and unconscious repetition priming. NatureNeuroscience, 4: 752-758, 2001.
DIXON MJ, SMILEK D, CUDAHAY C and MERIKLE PM. Five plustwo equals yellow. Nature, 406: 365, 2000.
DIXON MJ, SMILEK D and MERIKLE PM. Not all synaesthetes arecreated equal: Projector vs. associator synaesthetes. Cognitive,Affective and Behavioral Neuroscience, 4: 335-343, 2004.
GROSSENBACHER PG and LOVELACE CT. Mechanisms ofsynesthesia: Cognitive and physiological constraints. Trendsin Cognitive Sciences, 5: 36-41, 2001.
HE S, CAVANAGH P and INTRILLIGATOR J. Attentional resolution andthe locus of visual awareness. Nature, 383: 334-337, 1996.
HUBBARD EM, ARMAN AC, RAMACHANDRAN VS and BOYTON GM.Individual differences among grapheme-color synesthetes:Brain behavior correlations. Neuron, 45: 975-985, 2005.
HUMPHREYS GW, EVETT LJ and QUINLAN PT. Orthographicprocessing in visual word identification. Cognitive Psychology,22: 517-560, 1990.
ITO M, TAMIRA H, FUJITA I and TANAKA K. Size and positioninvariance of neuronal responses in monkey inferior temporalneurons. Journal of Neurophysiology, 73: 218-226, 1995.
KOOI FL, TOET A, TRIPATHY SP and LEVI DM. The effect ofsimilarity and duration on spatial interaction in peripheralvision. Spatial Vision, 8: 255-279, 1994.
KOVÁCS G, SARY G, KÖTELES K, CHADAIDE Z, TOMPA T, VOGELS Rand BENEDEK G. Effects of surface cues on macaque inferiortemporal cortical responses. Cerebral Cortex, 13: 178-188,2003.
LEFF AP, CREWES H, PLANT GT, SCOTT SK, KENNARD C and WISERJS. The functional anatomy of single-word reading inpatients with hemianopic and pure alexia. Brain, 124: 510-521, 2001.
LEVI DM, HARIHARAN S and KLEIN SA. Suppressive andfacilitatory spatial interactions in peripheral vision: Peripheralcrowding is neither size invariant nor simple contrast masking.
194 Edward M. Hubbard and Others
Journal of Vision, 2: 167-177, http://journalofvision.org/2/2/3/,doi:10.1167/2.2.3 2002a.
LEVI DM, KLEIN SA and HARIHARAN S. Suppressive andfacilitatory spatial interactions in foveal vision: Fovealcrowding is simple contrast masking. Journal of Vision, 2:140-166, http://journalofvision.org/2/2/2/, doi:10.1167/2.2.2,2002b.
MACLEOD CM. Half a century of research on the Stroop effect: Anintegrative review. Psychological Bulletin, 109: 163-203,1991.
MATTINGLEY JB, RICH AN, YELLAND G and BRADSHAW JL.Unconscious priming eliminates automatic binding of colourand alphanumeric form in synaesthesia. Nature, 410: 580-582,2001.
MECHELLI A, HUMPHREYS GW, MAYALL K, OLSON A and PRICE CJ.Differential effects of word length and visual contrast in thefusiform and lingual gyri during reading. Proceedings of theRoyal Society of London B, 267: 1909-1913, 2000.
MILLS CB, BOTELER EH and OLIVER GK. Digit synaesthesia: A casestudy using a Stroop-type test. Cognitive Neuropsychology, 16:181-191, 1999.
MYCROFT RH, MITCHELL DC and KAY J. An evaluation ofstatistical procedures for comparing an individual’sperformance with that of a group of controls. CognitiveNeuropsychology, 19: 291-300, 2002.
MYLES KM, DIXON MJ, SMILEK D and MERIKLE PM. Seeingdouble: The role of meaning in alphanumeric-coloursynaesthesia. Brain and Cognition, 53: 342-345, 2003.
NOGUCHI Y, INUI K and KAKIGI R. Temporal dynamics of neuraladaptation effect in the human visual ventral stream. Journalof Neuroscience, 24: 6283-6290, 2004.
NUNN JA, GREGORY LJ, BRAMMER M, WILLIAMS SCR, PARSLOWDM, MORGAN MJ, MORRIS RG, BULLMORE ET, BARON-COHENS and GRAY JA. Functional magnetic resonance imaging ofsynesthesia: Activation of V4/V8 by spoken words. NatureNeuroscience, 5: 371-375, 2002.
O’CRAVEN KM and KANWISHER N. Mental imagery of faces andplaces activates corresponding stiimulus-specific brainregions. Journal of Cognitive Neuroscience, 12: 1013-1023,2000.
PALMERI TJ, BLAKE RB, MAROIS R, FLANERY MA and WHETSELLWO. The perceptual reality of synesthetic color. Proceedingsof the National Academy of Sciences, 99: 4127-4131, 2002.
PAULESU E, HARRISON J, BARON-COHEN S, WATSON JDG,GOLDSTEIN L, HEATHER J, FRACKOWIAK RSJ and FRITH CD.The physiology of coloured hearing: A PET activation studyof colour-word synaesthesia. Brain, 118: 661-676, 1995.
PESENTI M, THIOUX M, SERON X and DEVOLDER A.Neuroanatomical substrates of Arabic number processing,
numerical comparison and simple addition: A PET study.Journal of Cognitive Neuroscience, 12: 461-479, 2000.
PETERSEN SE, FOX PT, POSNER MI, MINTUN M and RAICHLE ME.Positron emission tomographic studies of the cortical anatomyof single-word processing. Nature, 331: 585-589, 1988.
PETERSEN SE, FOX PT, SNYDER AZ and RAICHLE ME. Activation ofextrastriate and frontal cortical areas by visual words andword-like stimuli. Science, 249: 1041-1044, 1990.
POLK TA and FARAH MJ. Functional MRI evidence for an abstract,not perceptual, word-form area. Journal of ExperimentalPsychology: General, 13: 65-72, 2002.
RAMACHANDRAN VS and HUBBARD EM. Psychophysicalinvestigations into the neural basis of synaesthesia.Proceedings of the Royal Society of London, 268: 979-983,2001a.
RAMACHANDRAN VS and HUBBARD EM. Synaesthesia: A windowinto perception, thought and language. Journal ofConsciousness Studies, 8: 3-34, 2001b.
RAMACHANDRAN VS and HUBBARD EM. The phenomenology ofsynaesthesia. Journal of Consciousness Studies, 10: 49-57,2003.
RICH AN and MATTINGLEY JB. Anomalous perception insynaesthesia. Nature Reviews Neuroscience, 3: 43-52, 2002.
RICKARD TC, ROMERO SG, BASSO G, WHARTON C, FLITMAN S andGRAFMAN J. The calculating brain: An fMRI study.Neuropsychologia, 38: 325-335, 2000.
SHAPIRO SS and WILK MB. An analysis of variance test fornormality (complete samples). Biometrika, 52: 591-611, 1965.
SMILEK D and DIXON MJ. Towards a synergistic understanding of synaesthesia: Combining current experimental findingswith synaesthetes’ subjective descriptions. Psyche, 8:http://psyche.cs.monash.edu.au/v8/psyche-8-01-smilek.html,2002.
SMILEK D, DIXON MJ, CUDAHAY C and MERIKLE PM. Synaestheticphotisms influence visual perception. Journal of CognitiveNeuroscience, 13: 930-936, 2001.
SMILEK D, DIXON MJ, CUDAHAY C and MERIKLE PM. Conceptdriven color experiences in digit-color synesthesia. Brain andCognition, 48: 570-573, 2002.
STRASBURGER H, HARVEY LO and RENTSCHLER I. Contrastthresholds for identification of numeric characters in directand eccentric view. Perception and Psychophysics, 49: 495-508, 1991.
WARD J and SIMNER J. Lexical-gustatory synaesthesia: Linguisticand conceptual factors. Cognition, 89: 237-261, 2003.
Edward M. Hubbard, INSERM Unité 562, SHFJ/CEA, 4 place du Général Leclerc,Orsay F91401, France. e-mail: [email protected]