continuous greenhouse gas monitoring on south atlantic islands
TRANSCRIPT

Continuous greenhouse gas monitoring on
South Atlantic Islands
Dave Lowry1, Rebecca Fisher1, Mathias Lanoisellé1, Euan Nisbet1, Ed Dlugokencky2, Andrew Manning3
1 Department of Earth Sciences, Royal Holloway, University of London, Egham, Surrey, United Kingdom
2 NOAA ESRL, Boulder, CO, USA3 School of Environmental Sciences, Univ. East Anglia, Norwich, UK
Presented on 2 Dec 2011 at:GEOmon Final Meeting, Brussels
QuickTime™ and aTIFF (Uncompressed) decompressor
are needed to see this picture.
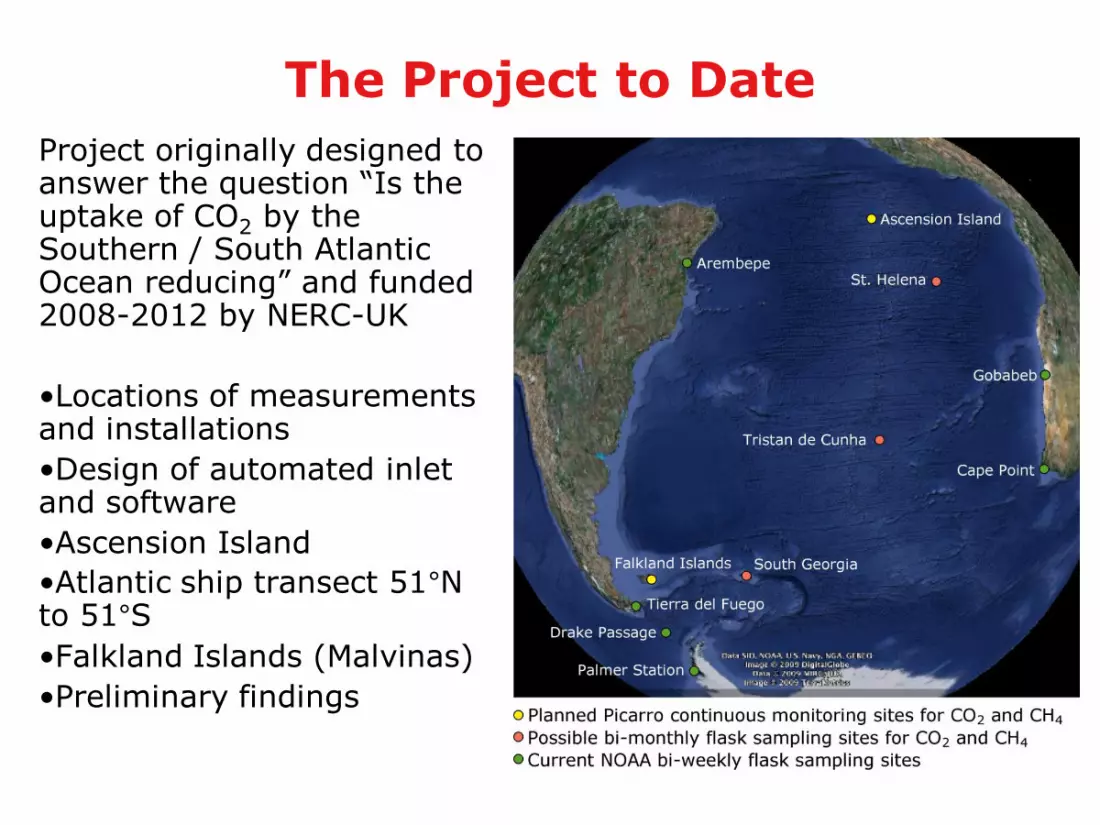
The Project to Date
Project originally designed to answer the question “Is the uptake of CO2 by the Southern / South Atlantic Ocean reducing” and funded 2008-2012 by NERC-UK
•Locations of measurements and installations
•Design of automated inlet and software
•Ascension Island
•Atlantic ship transect 51°N to 51°S
•Falkland Islands (Malvinas)
•Preliminary findings

Ascension Island Installation
• Installed June 2010
• Has an automated inlet and software for running calibration routines and creating results files

Calibration and Target Gas DataCO2 - MPI-Jena calibration, CH4 - RHUL calibration using 7 NOAA cylinders
-0.20
-0.16
-0.12
-0.08
-0.04
0.00
0.04
0.08
0.12
0.16
0.20
20-Jun-10 18-Jul-10 15-Aug-10 12-Sep-10 10-Oct-10 7-Nov-10 5-Dec-10 2-Jan-11
CO
2 in
calibrati
on
gases (
ppm
) -
Devia
tion
from
kn
ow
n v
alu
e
IMECC TA-RHU-2009-1 (409.15 ppm)
IMECC TA-RHU-2009-2 (377.52 ppm)
IMECC TA-RHU-2009-3 (391.53 ppm)
-0.0020
-0.0016
-0.0012
-0.0008
-0.0004
0.0000
0.0004
0.0008
0.0012
0.0016
0.0020
20-Jun-10 18-Jul-10 15-Aug-10 12-Sep-10 10-Oct-10 7-Nov-10 5-Dec-10 2-Jan-11
CH
4 in
calibrati
on
gases (
ppm
) -
Devia
tion
from
kn
ow
n v
alu
e
IMECC TA-RHU-2009-1 (1.80665 ppm)
IMECC TA-RHU-2009-2 (1.84155 ppm)
IMECC TA-RHU-2009-3 (1.88743 ppm)
-0.0024
-0.0020
-0.0016
-0.0012
-0.0008
-0.0004
0.0000
0.0004
0.0008
0.0012
0.0016
20-Jun-10 18-Jul-10 15-Aug-10 12-Sep-10 10-Oct-10 7-Nov-10 5-Dec-10 2-Jan-11
CH
4 T
arget
(ppm
) D
evia
tion
from
kn
ow
n v
alu
e
-0.240
-0.200
-0.160
-0.120
-0.080
-0.040
0.000
0.040
0.080
0.120
0.160
CO
2 T
arget
(ppm
) D
evia
tion
from
kn
ow
n v
alu
e
Raw CH4, TGT offset from known
Raw CO2, TGT offset from known
-0.0020
-0.0016
-0.0012
-0.0008
-0.0004
0.0000
0.0004
0.0008
0.0012
0.0016
0.0020
20-Jun-10 18-Jul-10 15-Aug-10 12-Sep-10 10-Oct-10 7-Nov-10 5-Dec-10 2-Jan-11
CH
4 T
arget
(ppm
) D
evia
tion
from
kn
ow
n v
alu
e
-0.200
-0.160
-0.120
-0.080
-0.040
0.000
0.040
0.080
0.120
0.160
0.200
CO
2 T
arget
(ppm
) D
evia
tion
from
kn
ow
n v
alu
e
Calibrated CH4, TGT offset from known
Calibrated CO2, TGT offset from known
CO2 380.794 ± 0.036 ppm (Averaged calibration run precision ± 0.025 ppm)
CH4 1.81908 ± 0.00020 ppm (Averaged calibration run precision ± 0.00022 ppm)

Ascension - Daily Record (Deliverable 1.1.8)
385
390
395
400
405
410
415
420
425
00:00:00 02:00:00 04:00:00 06:00:00 08:00:00 10:00:00 12:00:00 14:00:00 16:00:00 18:00:00 20:00:00 22:00:00 00:00:00
CO
2 (
pp
m)
Flight arrival from the Falkland Islands
(Malvinas)
Filtering out peaks reduces monthly average by less than 0.03 ppm

Monthly One-Minute Averaged DataPicarro CRDS delivers one line of data to a second computer via the
serial port approximately every 10 seconds
385
390
395
400
405
410
415
420
425
1/8/10 00:00 6/8/10 00:00 11/8/10 00:00 16/8/10 00:00 21/8/10 00:00 26/8/10 00:00 31/8/10 00:00
CO
2 (
ppm
)
Filtered Peaks (2.3%)
1-min SD >0.2 ppm
Background CO2
1-min SD <0.2 ppm
NOAA flasks
Background range of 2.5 ppm
1.76
1.765
1.77
1.775
1.78
1.785
1.79
1.795
1.8
1/8/10 0:00 6/8/10 0:00 11/8/10 0:00 16/8/10 0:00 21/8/10 0:00 26/8/10 0:00 31/8/10 0:00
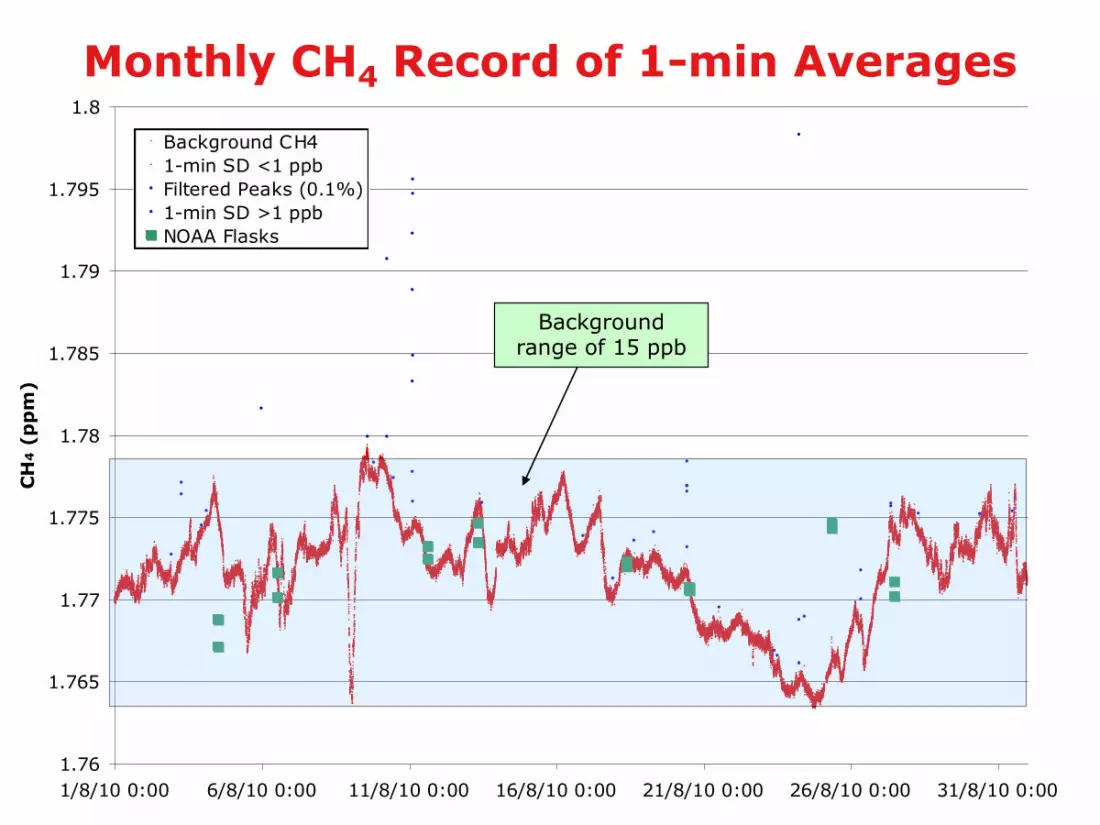
CH
4 (
pp
m)
Background CH4
1-min SD <1 ppb
Filtered Peaks (0.1%)
1-min SD >1 ppb
NOAA Flasks
Monthly CH4 Record of 1-min Averages
Background range of 15 ppb

Ascension CH4 sources / sinks?
1.756
1.758
1.76
1.762
1.764
1.766
1.768
1.77
1.772
1.774
1.776
1.778
1.78
1.782
1.784
26/11/10 00:00 27/11/10 00:00 28/11/10 00:00 29/11/10 00:00 30/11/10 00:00 1/12/10 00:00
CH
4 (ppm
)
1.756
1.758
1.76
1.762
1.764
1.766
1.768
1.77
1.772
1.774
00:00:00 04:00:00 08:00:00 12:00:00 16:00:00 20:00:00 00:00:00
CH
4 (ppm
)
Long-term gas
Calibration and zero gases
Target gas
387.5
388
388.5
389
389.5
390
390.5
391
8/8/10 00:00 8/8/10 08:00 8/8/10 16:00 9/8/10 00:00 9/8/10 08:00 9/8/10 16:00 10/8/10 00:00
CO
2 (
ppm
)
1.762
1.764
1.766
1.768
1.77
1.772
1.774
1.776
1.778
1.78
1.782
8/8/10 00:00 8/8/10 08:00 8/8/10 16:00 9/8/10 00:00 9/8/10 08:00 9/8/10 16:00 10/8/10 00:00
CH
4 (
ppm
)Rain Shower�
Significant Rainfall
Methane only peaks CO2 and CH4 co-vary

Comparison with NOAA
flask samples
• Background CO2
range of 2.5 ppm
• Background CH4
range of 15 ppb
• Both CO2 and CH4
tend toward co-variation during winter
• Shifts between one end of the range and the other can occur in as little as 6 hours
387.0
387.5
388.0
388.5
389.0
389.5
390.0
390.5
391.0
18/6/10 2/7/10 16/7/10 30/7/10 13/8/10 27/8/10 10/9/10 24/9/10 8/10/10 22/10/10 5/11/10 19/11/10 3/12/10 17/12/10 31/12/10
CO
2
CO2 00:00-06:00
CO2 Daily Mean
CO2 Daily Minimum
CO2 Daily Median
NOAA flasks - averaged
1.751
1.754
1.757
1.760
1.763
1.766
1.769
1.772
1.775
1.778
1.781
18/6/10 2/7/10 16/7/10 30/7/10 13/8/10 27/8/10 10/9/10 24/9/10 8/10/10 22/10/10 5/11/10 19/11/10 3/12/10 17/12/10 31/12/10
CH
4
CH4 00:00-06:00
CH4 Daily Mean
CH4 Daily Minimum
CH4 Daily Median
NOAA flasks - averaged

Six months of Daily Means
CO2 and CH4 showed co-variation until the end of October (mid-Spring)
Since then CH4 has declined rapidly but CO2 continues to rise
1.753
1.755
1.757
1.759
1.761
1.763
1.765
1.767
1.769
1.771
1.773
1.775
1.777
18/6/10 2/7/10 16/7/10 30/7/10 13/8/10 27/8/10 10/9/10 24/9/10 8/10/10 22/10/10 5/11/10 19/11/10 3/12/10 17/12/10 31/12/10
CH
4
386.2
386.6
387.0
387.4
387.8
388.2
388.6
389.0
389.4
389.8
390.2
390.6
CO
2
CH4 Daily Mean
CO2 Daily Mean

Ascension Island - 13C of Methane• Both sets of data still to be validated for last 12 months
• Small seasonality of 0.3‰ only distinguished by high precision analysis
-47.6
-47.5
-47.4
-47.3
-47.2
-47.1
-47
-46.9
-46.8
-46.7
-46.6
4/1/00 3/1/01 3/1/02 3/1/03 3/1/04 2/1/05 2/1/06 2/1/07 2/1/08 1/1/09 1/1/10
1
3C
of
meth
an
e
NOAA INSTAAR Background only (filtered)
RHUL - 60 litres duplicates (All)
RHUL - 100 ml triplicates (All)

RRS James Clark Ross Cruise (Deliverable 1.1.9)
• Equipment installed 17-18 Sept 2010
• Ship sailed from Immingham, UK (53°N) to Port Stanley, Falkland Islands (51°S) between Sept 28 and Oct 24

The North Atlantic Transect (2-13 Oct)• CO2 and CH4 of similar trend from
23 to 8°N (SE Trades)
• Methane sources from 37-50°N -Canadian wetland or European methane dome?
NOAA HYSPLIT 120 hr back trajectories arriving at 500 masl
-20
-15
-10
-5
0
5
10
15
20
25
30
35
40
45
50
382 386 390 394 398 402CO2
Latit
ude
-20
-15
-10
-5
0
5
10
15
20
25
30
35
40
45
50
1.76 1.78 1.8 1.82 1.84 1.86 1.88CH4

The South Atlantic Transect (13-24 Oct)
• CO2 and CH4 of similar trend only from 0 to 15°S (SE Trades)
• Spring in South America - sink of CO2, source of CH4?
NOAA HYSPLIT 120 hr back trajectories arriving at 500 masl
-50
-45
-40
-35
-30
-25
-20
-15
-10
-5
0
5
10
15
20
382 386 390 394 398 402CO2 (ppm)
La
tit
ud
e
-50
-45
-40
-35
-30
-25
-20
-15
-10
-5
0
5
10
15
20
1.76 1.78 1.8 1.82 1.84 1.86 1.88CH4 (ppm)

Twice Daily Bag sampling for 13CCH4Fossil Fuel / Biomass Burning source (25°N) - NW Africa / CanariesBiogenic Source (25°S) - Brazil
13C - mean precision on triplicates ±0.036 ‰
13C source -67 ±10 ‰

Falkland Islands (Malvinas) Installation
• Installed at the top of Sapper Hill, 2.5 km SW of Port Stanley, 25-29 Oct 2010
• Inlet at top of 12m communications mast
• WiFi link to the coast
• Gusts in excess of 15 m/s common during the installation and throughout the year

382
384
386
388
390
392
394
396
398
400
27/10/10 06/11/10 16/11/10 26/11/10 06/12/10 16/12/10 26/12/10
CO
2 (
pp
m)
ASC CO2
FLK CO2
Ascension - Falklands Hourly-Averaged CO2 Comparison (The first 2 months)
388.87 ± 0.38 ppm
387.32 ± 1.47 ppm
Very strong
Northerly
winds on
Falklands
Strong
Southerly
winds on
Falklands

1.745
1.75
1.755
1.76
1.765
1.77
1.775
1.78
1.785
27/10/10 06/11/10 16/11/10 26/11/10 06/12/10 16/12/10 26/12/10
CH
4 (
pp
m)
ASC CH4
FLK CH4
Ascension - Falklands Hourly-Averaged CH4 Comparison (The first 2 months)
1.7627 ± 0.0043 ppm
1.7596 ± 0.0045 ppm
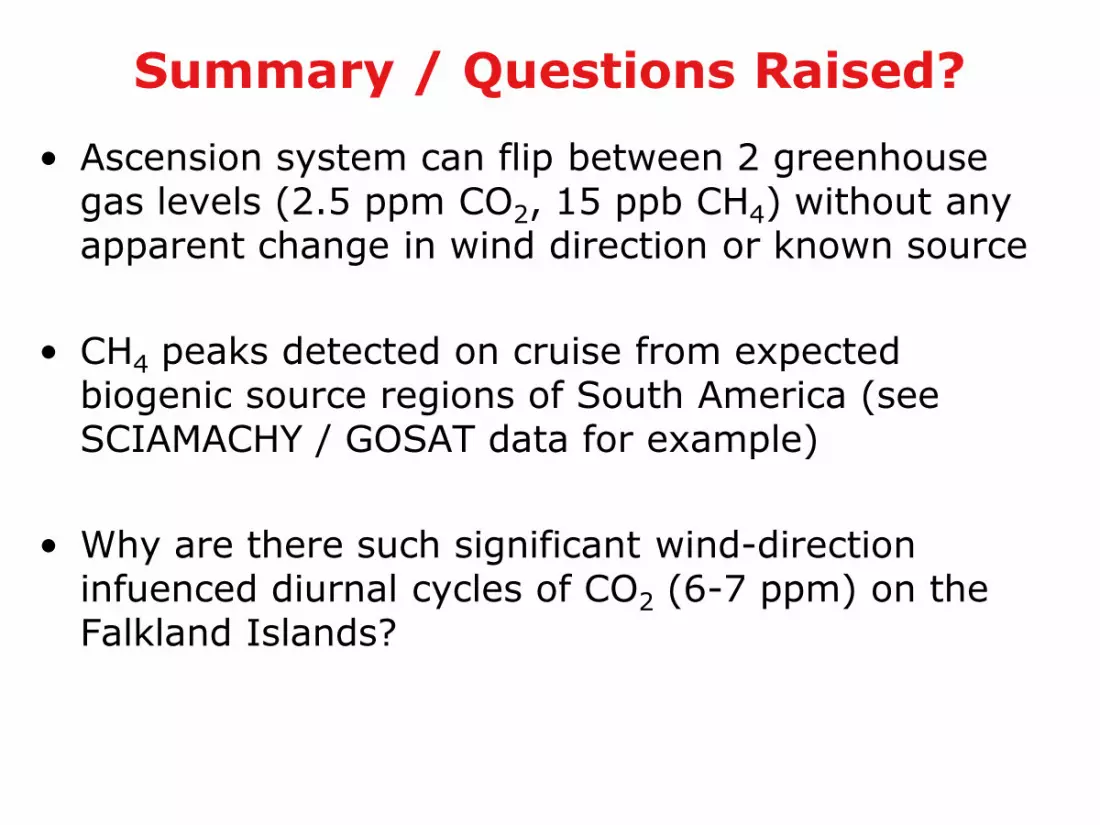
Summary / Questions Raised?
• Ascension system can flip between 2 greenhouse gas levels (2.5 ppm CO2, 15 ppb CH4) without any apparent change in wind direction or known source
• CH4 peaks detected on cruise from expected biogenic source regions of South America (see SCIAMACHY / GOSAT data for example)
• Why are there such significant wind-direction infuenced diurnal cycles of CO2 (6-7 ppm) on the Falkland Islands?

Acknowledgements• UEA - Alex Etchells and Dave Blomfield for software and power
supply development respectively. Andy Macdonald for cylinder valving and filling
• Ascension Island - Vicky Huntly, Karl Shepherdson and their teams at the Met Office Hut for sample collection and data transfer
• BAS - Kath Nicholson and team for logistics of getting our equipment onto the James Clark Ross
• Falkland Islands (Malvinas) - Mario Zuvic for hut, electricity and wireless network, Louise Taylor for sample collection
• MPI Jena - Armin Jordan, Burt Steinberg - tank filling and calibration