contaminated sites in europe: review of the current situation based on data collected through a...
TRANSCRIPT

Hindawi Publishing CorporationJournal of Environmental and Public HealthVolume 2013, Article ID 158764, 11 pageshttp://dx.doi.org/10.1155/2013/158764
Review ArticleContaminated Sites in Europe: Review of the Current SituationBased on Data Collected through a European Network
Panos Panagos, Marc Van Liedekerke, Yusuf Yigini, and Luca Montanarella
European Commission, Joint Research Centre, Institute for Environment and Sustainability, Via E. Fermi 2749,21027 Ispra, Italy
Correspondence should be addressed to Panos Panagos; [email protected]
Received 21 March 2013; Revised 13 May 2013; Accepted 23 May 2013
Academic Editor: Piedad Martin-Olmedo
Copyright © 2013 Panos Panagos et al. This is an open access article distributed under the Creative Commons Attribution License,which permits unrestricted use, distribution, and reproduction in any medium, provided the original work is properly cited.
Under the EuropeanUnion (EU)Thematic Strategy for Soil Protection, the EuropeanCommission has identified soil contaminationas a priority for the collection of policy-relevant soil data at European scale. In order to support EU soil management policies, soil-related indicators need to be developed which requires appropriate data collection and establishment of harmonized datasets forthe EU Member States. In 2011-12, the European Soil Data Centre of the European Commission conducted a project to collectdata on contaminated sites from national institutions in Europe using the European Environment Information and ObservationNetwork for soil (EIONET-SOIL).This paper presents the results obtained fromanalysing the soil contaminated sites data submittedby participating countries. According to the received data, the number of estimated potential contaminated sites is more than2.5 million and the identified contaminated sites around 342 thousand. Municipal and industrial wastes contribute most to soilcontamination (38%), followed by the industrial/commercial sector (34%).Mineral oil and heavymetals are themain contaminantscontributing around 60% to soil contamination. In terms of budget, the management of contaminated sites is estimated to costaround 6 billion Euros (C) annually.
1. Introduction
Soil contamination creates a significant risk to human health.For instance, heavymetals from industrial waste contaminatedrinking water, soil, fodder, and food [1]. Also, the largevolume of waste and the intense use of chemicals during pastdecades have resulted in numerous contaminated sites acrossEurope. Contaminated sites could pose significant environ-mental hazards for terrestrial and aquatic ecosystems asthey are important sources of pollution which may result inecotoxicological effects [2].
Emissions of hazardous substances from local sourcescould deteriorate soil and groundwater quality. Managementof contaminated sites aims at assessing the adverse effectscaused and taking measures to satisfy environmental stan-dards according to current legal requirements. Additionally,the impact of soil contamination to health and more specif-ically the main epidemiological findings relevant to CS arebriefly presented below.
The implication of soils to human health is direct suchas ingestion, inhalation, skin contact, and dermal absorption.Some epidemiological examples include geohelminth infec-tion and potentially harmful elements via soil ingestion, can-cers caused by the inhalation of fibrous minerals, hookwormdisease, and podoconiosis caused by skin contact with soils[3]. Elliott et al. (2001) [4] have found small excess risks ofcongenital anomalies and low and very low birth weights inpopulations living near landfill sites.
Soil contamination is mainly located close to waste land-fills, industrial/commercial activities diffusing heavy metals,oil industry, military camps, and nuclear power plants. AsEuropean society has grown wealthier, it has created moreand more rubbish. Each year in the EU, 3 billion tonnes ofsolidwastes are thrown away (some 90million tonnes of themare hazardous).This amounts to about 6 tonnes of solid wastefor every man, woman, and child (Eurostat, EnvironmentalData Centre on Waste [5]).

2 Journal of Environmental and Public Health
The main anthropogenic sources of heavy metals exist invarious industrial point sources, for example, present and for-mermining activities, foundries, smelters, anddiffuse sourcessuch as piping, constituents of products, combustion of byproducts, and traffic related to industrial andhuman activities[6].
In the US, the army alone has estimated that over 1.2 mil-lion tons of soils have been contaminatedwith explosives, andthe impact of explosives contamination in other countries inthe world is of similarmagnitude [7]. In recent years, growingconcerns about the health and ecological threats posed bymanmade chemicals have led to studies of the toxicology ofexplosives, which have identified toxic and mutagenic effectsof the common military explosives and their transformationproducts [8]. Papp et al. (2002) [9] have studied the significantradioactive contamination of soil around a coal-fired thermalpower plant.
Different contaminants have different effects on humanhealth and the environment depending on their properties.The contaminant effect depends on its potential for disper-sion, solubility in water or fat, bioavailability, carcinogenicity,and so forth. Chlorinated hydrocarbons (CHCs) are usedmainly for themanufacturing of synthetic solvents and insec-ticides. They are environmental contaminants that bioaccu-mulate and hence are detected in human tissues. Epidemi-ological evidence suggests that the increased incidence of avariety of human cancers, such as lymphoma, leukemia, andliver and breast cancers, might be attributed to exposure tothese agents [10].
Mineral oil large-scale use and various applications leadin many cases to environmental contamination [11]. Suchcontaminationmay be a consequence of petroleum transport,storage and refining, or accidents [12]. From a quantitativeperspective,mineral oil is probably the largest contaminant inour body.That humans can tolerate this contaminant withouthealth concerns has not been proven convincingly. The cur-rent Editorial of the European Journal of Lipid Science andTechnology concludes that this proof either has to be pro-vided or we have to take measures to reduce our exposure(from all sources, including cosmetics and pharmaceuticals)and the environmental contamination.
Polycyclic aromatic hydrocarbons (PAHs) are semi-volatile, chemically stable, and hydrophobic organic com-pounds which are ubiquitous in the environment and goodmarkers of urban activities. PAHs are related with anthro-pogenic toxic element contamination [13].
Heavymetals have been used by humans for thousands ofyears. Although several adverse health effects of heavymetalshave been known for a long time, exposure to heavy metalscontinues and is even increasing in some parts of theworld, inparticular in less developed countries, though emissions havedeclined in most developed countries over the last 100 years[14]. Any metal (or metalloid) species may be considereda “contaminant” if it occurs where it is unwanted, or in aform or concentration that causes a detrimental human orenvironmental effect. Metals/metalloids include lead (Pb),cadmium (Cd), mercury (Hg), arsenic (As), chromium (Cr),copper (Cu), selenium (Se), nickel (Ni), silver (Ag), andzinc (Zn). Other less commonmetallic contaminants include
aluminium (Al), cesium (Cs), cobalt (Co), manganese (Mn),molybdenum (Mo), strontium (Sr), and uranium (U) [15].
According to WHO, priority should be given to thepollutants on the basis of toxicity, environmental persistence,mobility, and bioaccumulation [16].Many of the heavymetalssuch as cadmium, arsenic, chromium, nickel, dioxins, andPAHs are considered to be carcinogenic, based on animalstudies or studies of people exposed to high levels [17]. Inaddition to carcinogenicity, many of these substances canproduce other toxic effects (depending on exposure level andduration) on the central nervous system, liver, kidneys, heart,lungs, skin, reproduction, and so forth.
The toxicity and fate of phenolic pollutants in the con-taminated soils are associated with the oil-shale industry [18].Phenol has been shown to cause liver and kidney damage,neurotoxic effects, and developmental toxicity in laboratoryanimals (Environment Agency, 2009).
The most common source of cyanide contamination isformer gas work sites. However, cyanide contamination isalso associated with electroplating factories, road salt storagefacilities, and gold mining tailings [19]. Cyanide toxicityresults from inhibition of cytochrome oxidase thereby lim-iting the absorption of oxygen at the cellular level. Thecentral nervous system is a major target of acute cyanidetoxicity, with a short period of stimulation evidenced by rapidbreathing, followed by depression, convulsions, paralysis, andpossibly death [20].
Benzene, toluene, ethylbenzene, and xylene (BTEX) areclassified as hazardous air pollutants (HAPs) [21]. Exposureto HAPs can cause a variety of health problems such as can-cerous illnesses, respiratory irritation, and central nervoussystem damage [22].
Theobjective of relevant EUpolicies is to achieve a qualityof the environment where the levels of manmade contami-nants on sites do not give rise to significant impacts or risks tohumanhealth and ecosystems.Themost recent developmentsin soil policy at European level are the introduction of thethematic strategy for the protection of soils [23] and theproposed soil framework directive [24]. Soil contaminationis recognised as one of the eight soil threats expressed in thethematic strategy and the proposed directive. As there wasnot a consensus for the establishment of the soil frameworkdirective, legal requirements for the general protection of soilhave not been agreed at EU level and only exist individually inmost Member States. However, the integrated pollution andprevention control directive [25] requires that operationsfalling under its scope do not create new soil contamination.Other EU directives such as the water framework directive[26] and the waste directive [27], not aimed directly at soilprotection, provide indirect controls on soil contamination[28]. Notwithstanding these controls, some significant newsite contamination still occurs as a result of accidents [29]and illegal actions. While the creation of new contaminatedsites is constrained by regulation, a very large number of sitesexist with historical contamination that may present unac-ceptable risks and these sites require management. Oneexample is the environmental disaster following flooding byred sludge in the Ajka region in Hungary [30]. However, theresearch and political arena regarding land contamination no

Journal of Environmental and Public Health 3
longer consider only a few incidents that lead to severe soilcontamination, but rather look at it as a wide spread environ-mental problem.
In 2001, the European Environment Agency (EEA) incooperationwith EEA affiliated countries started to develop acore set of policy relevant indicators, among which the indi-cator “Progress in the Management of Contaminated Sites”(CSI015) was the only one related to soil. Since then, datacollections in relation to this indicator were launched fourtimes by EEA [31], the last one in 2006, with contributionfrommember countries of the European Environment Infor-mation and Observation Network (EIONET) [32]. In theperiod 2011-2012, the European Soil Data Centre (ESDAC)[33] organized a similar campaign in order to update theCSI015. This indicator quantifies the progress in the man-agement of local contamination, identifies sectors with majorcontribution to soil contamination, classifies the major con-taminants, and finally addresses issues of budgets spentfor remediation. The indicator is very important for policymakers as it tracks progress in the management of contam-inated sites and the provision of public and private moneyfor remediation. With this indicator, a number of activitiescausing soil pollution can be clearly identified across Europe.The indicator also supports the implementation of existinglegislative and regulatory frameworks (integrated pollutionprevention and control directive, landfill directive, waterframework directive) as they should result in less newcontamination of soil.
The present study presents an overall picture in Europeconcerning contaminated sites and does not focus on individ-ual countries. Instead, there are many other studies, such asthe one of Ferguson (1999) [34], that present the inventoriesof contaminated sites for individual countries. The overallobjective of this paper is to make an overview of the currentsituation of contaminated sites in Europe. Specifically, thestudy intends to
(i) focus on contaminated sites caused by industrial ac-tivities;
(ii) review the type of sources;(iii) respond to themain policy questions addressed in the
indicator CSI015.
2. Materials and Methods
The study makes an assessment of the data collected throughEIONET and then focuses on the data related to contamina-tion as a consequence of industrial activities.
2.1. EIONET-CSIData. Thecontaminated sites data (denotedas EIONET-CSI from now on) were collected and managedby the European Soil Data Centre (ESDAC). The data werecollected in 2011-2012 through the EIONET network whichconsists of representative organizations from 38 Europeancountries for a number of environmental themes [35]. Theappointed organisations for the theme “soil” are lead institu-tions in the soil domain at national level, and they provideofficial country data on specific requests related to soil byESDAC.
The geographical coverage of EIONET includes 27 Mem-ber States of the European Union together with Iceland,Liechtenstein, Norway, Switzerland, Turkey, and the WestBalkan cooperating countries: Albania, Bosnia, Herzegovina,Croatia, the former Yugoslav Republic of Macedonia, Mon-tenegro, and Serbia as well as Kosovo under the UN SecurityCouncil Resolution 1244/99. Similar data on contaminatedsites have been collected in 2001, 2002, 2003, and 2006. Thedata were collected through a standard questionnaire andthen compiled in a centralized database. The questionnairewas designed such that received data could feed the compi-lation of the indicator, the CSI015 indicator. There is no legalobligation for the EIONETmember countries to submit data,and their contribution is on a voluntary basis.
2.2. Terms and Definitions. In order to minimize the dif-ferences in interpretation by individual countries of certainterms used in the questionnaire, ESDAC provided the follow-ing definitions according to EEA [31].
(i) “Contaminated site” (CS) refers to a well-defined areawhere the presence of soil contamination has beenconfirmed and this presents a potential risk tohumans, water, ecosystems, or other receptors. Riskmanagement measures (e.g., remediation) may beneeded depending on the severity of the risk ofadverse impacts to receptors under the current orplanned use of the site.
(ii) “Potentially contaminated site” (PCS) refers to siteswhere unacceptable soil contamination is suspectedbut not verified, and detailed investigations need tobe carried out to verify whether there is unacceptablerisk of adverse impacts on receptors.
(iii) “Management of contaminated sites” aims to accessand,where necessary, reduce to an acceptable level therisk of adverse impacts on receptors (remediate). Theprogress in management of CS is traced in 4 manage-ment steps starting with preliminary study, contin-uing with preliminary investigation, followed by siteinvestigation, and concludingwith implementation ofsite remediation (reduction of risk).
There is an important definition in terminology which allowsthe readers of the article to distinguish between “estimated”and “identified” sites. The questionnaire asked the countriesto provide estimations on how many CSs and PCSs may besituated in their territory. Data on estimated CS and PCS isbased on studies or expert judgment. The questionnaire alsoasked for identified number of CS and PCS. In this case, thecountries report data for which they actually posses availableinformation about local soil properties and hydrology.
2.3. Other Datasets. For a more comprehensive assessment, anumber of auxiliary official Eurostat datasets [35] were usedsuch as the countries’ populations, the surface area, the grossdomestic product (GDP), and the number of enterprises inthe industrial/services sectors. Those datasets are used fordeveloping statistics with parameters that include the sur-veyed population, the surveyed area, the density of CS and

4 Journal of Environmental and Public Health
PCS, the contribution (%) of various industrial sectors tocontamination, and the proportion of budget spent formanagement of CS.
2.4. Methodology. The study is based on the received datafrom the countries that participated in the survey, replying tothe questionnaire available in the European Soil Portal [36].The questionnaire has a user-friendly format as a MicrosoftExcel file and contains 5 main sections: “management ofcontaminated sites,” “contribution of polluting activities tolocal soil contamination,” “environmental impacts,” “expen-ditures,” “remediation targets and technologies.” Each sectionincludes between 1 and 5 questions requesting the “user”to submit the data for each of the available options. Thequestionnaire was requesting numerical values (not classesor vague responses) which allowed making aggregationsdepending on the policy question that was to be addressed.Two example questions are the following: percentage (%) ofsites, where risk reduction measures are completed; expen-ditures in million euro per capita per year. As a support, aguidelines document was available with detailed explanationfor each of the questions and the possible options plus exam-ple responses based on previous data collection exercises.
Each country represented by its designated EIONETNational Reference Centre for soil provided its best assess-ment based on available data. The data collection campaignwas launched in October 2011 and ended in February 2012.
3. Results
Even if the questionnaire included other data and infor-mation, this paper mainly focuses on the local contamina-tion analysis, the type of contamination (which sectors arecontributing the most), the distribution of the main contam-inants, and the budget spent for remediation. The manage-ment of CS will not be analysed in detail as each country fol-lows a different approach concerning the management steps.The analysis is performed in the study area as a whole andnot at country level. It should be noted that quite differentinterpretations of the abovementioned definitions have beenapplied by individual countries.
3.1. Extent of Local Contamination in Europe. Data on soilcontamination per country is a necessary input in order toestimate the scale of soil contamination in Europe.Themajor-ity of the addressed countries (33 out of 38 countries), corre-sponding to 80% of the total population, have respondedwithdata on the identified number of PCS and CS (Figure 1(a)).Themissing five countries were Bosnia, Herzegovina, Poland,Portugal, Slovenia, and Turkey. According to Figure 1(a),around 1,170,000 PCSs have been identified in Europe till2011. More than 10% of them or around 127,000 have beenidentified or confirmed as CSs. The ratio of remediated sites(RSs) to CSs is around 45% as more than 58,000CSs havealready been remediated (Figure 1(a)). The data gap for the5 missing countries can be covered by employing the densityof PCS (2.4 PCS/1,000 capita) and CS (2.62 CS/10,000 capita)(Table 1). Applying the average of 2.4 identified PCS per 1,000capita for the 5 missing countries, the identified PCS for
the whole Europe (38 countries) is estimated to be around1,470,000. Applying the average of 2.62 identified CS per10,000 capita (Table 1, column (a)) for themissing 5 countries,the identified CS can be raised to 160,000.
Apart from the identified PCS and CS, countries havebeen asked to provide their estimations for those 2 figures.A subset of 12 countries out of the 33 participating ones hasprovided estimations about the PCS (Table 1, column (b)).As a rule of thumb, the estimations are greater than theidentified ones. According to their estimations, 740,000 PCSsmay exist in their territory with a density of 4.2 PCS/1,000capita. Those 12 countries have reported 520,000 PCSs whichresult that the ratio “identification to estimation” for PCS isaround 70%. Two types of extrapolations can be performedin order to estimate the total number of PCS. In the firstone, the average value of 4.2 PCS/1,000 capita is applied tothe total population of the 38 countries, and the total numberof estimated PCS is then around 2,553,000 (Figure 1(b)). Inthe second extrapolation method, the ratio “identification toestimation” for PCS (70%) is applied to the countries whichwere unable to provide estimations; then the approximatenumber of PCS can be estimated to be 2,087,000.
Another subset of 11 countries (not a sub group of theprevious 12) covering 10% of total population has providedestimations about CS. They estimated more than 32,000CSswith a density of 5.7 CS/10,000 capita (Table 1, column (c)).Those 11 countries have reported 10,036 identified CSs whichresult that the ratio “identification to estimation” for CS is30.7%. The first method of extrapolation is to apply theaverage density to the rest of the population (90%), wheredata does not exist. According to this estimation, the numberof CS in Europe is estimated to be around 342,000 whichaccounts for 14% of the total estimated PCS (Figure 1(b)). Inthe second extrapolation method, the ratio “identification toestimation” for CS (30.7%) is applied to the whole population,and the estimated number of CS becomes more than 516,000.When comparing to the last survey of 2006, the estimatednumber of PCS was around 3 million, and the estimatednumber of CS was around 250,000.
The high variability of the data reported can be seenin Figure 2. The huge differences in the density rates rep-resent the situation of PCS per country and how countriesinterpret the term of “potential contamination.” Interpretingthe metadata that come with the received data, PCSs areunderstood in a different way. For instance, Luxemburg,Belgium, Netherlands, and France include potentially pol-luting activities in their PCS figures, and this is the reasonfor high density of PCS in those countries (Figure 2). Othercountries such as Austria, Hungary, and Norway include intheir PCS figures only the sites where there is an evidence ofpotential contamination. Another factor contributing to thishigh variability is the granularity of a site. Some countriesreport sites which are important at national level, while othersinclude also small sites such as storage tanks.
3.2. Sectors Contributing Most to Soil Contamination. Soilcontamination is the result of various sectors and activities.The countries were asked to allocate a percentage of contri-bution of each sector to local soil contamination based on

Journal of Environmental and Public Health 5
Table 1: Estimated and identified PCS and CS.
Identified PCS and CS(a)
Estimated PCS(b)
Estimated CS(c)
Total(d)
Countries 33 12 11 38Surveyed population 487,152,449 177,412,672 57,568,148 612,117,243Surveyed surface area (km2) 4,460,305 1,552,984 833,188 5,772,075Surveyed of total population 79.6% 29.0% 9.4%Surveyed of total area 77.3% 26.9% 14.4%PCS 1,169,649 739,968 2,553,000∗
PCS/1000 capita 2.4 4.2CS 127,475 32,601 342,000∗
CS/10,000 capita 2.62 5.7Remediated sites (RSs) 58,336RS/10,000 capita 1.20∗Based on extrapolated data.
1170
127
58
0 200 400 600 800 1000 1200 1400
Potentiallycontaminated
Contaminated
Remediated
Identified remediated, contaminated, andpotentially contaminated sites
Sites ×1.000
(a)
2553
342
0 500 1000 1500 2000 2500 3000
Potentiallycontaminated
Contaminated
Estimated contaminated andpotentially contaminated sites
Sites ×1.000
(b)
Figure 1: (a) Number of identified remediated (RS), potentially (PCS), and contaminated Sites (CS) reported by 33 countries. (b) Number ofestimated potentially (PCS) and contaminated sites (CS) extrapolated to 38 countries.
the occurrence of incidents.The following seven categories ofactivities were proposed:
(i) waste disposal (municipal waste disposal and indus-trial waste disposal).
(ii) industrial and commercial activities (mining, oilextraction and production, and power plants).
(iii) military (military sites and war affected zones).(iv) storages (oil storage, obsolete chemicals storage, and
other storages).(v) transport spills on land (oil spill sites and other
hazardous substance spills sites).(vi) nuclear.(vii) other sources.
Responses related to contributing sectors were received from22 countries which correspond to circa 53% of the total studypopulation.Waste disposal and treatment contribute to morethan 37% of soil contamination. Inside this category, munic-ipal waste and industrial waste contribute to similar shares.The industrial and commercial activities contribute to 33.3%
share, followed by storage (10.5%), while of the rest havea contribution of 19.1%. Nuclear operations contribute only0.1%, but contamination from major nuclear players (e.g.,scores from nuclear power stations) was not taken intoaccount by some countries. The data cannot be compared to2006 survey as the sample of countries that responded isdissimilar.
A special focus is given to the industrial and commercialsectors causing soil contamination.The countries were askedto assign percentages in each specific industrial sector whichcontributes to soil contamination. The responses of 17 coun-tries covering 44% of the total study population suggestedthat the production sector contributes to around 60% of soilcontamination,while the service sector has a share of 33% andthe mining sector contributes to around 7% (Figure 3).
A closer look at the production sector reveals that thetextiles, leather, wood, and paper industries are of minorimportance for local soil contamination (circa 5%), whilemetal industries aremost frequently reported to be importantsources of contamination (13%) followed by chemical indus-try (8%), oil industry (7%), and energy production (7%) thatsum up the 35% of the production sector, while all of the rest

6 Journal of Environmental and Public Health
0.00 5.00 10.00 15.00 20.00 25.00Luxembourg
Czech RepublicNetherlands
Belgium (Flanders)Denmark
FranceGermany
FinlandUnited Kingdom
AverageSpain
LithuaniaSwitzerland
LatviaSweden
LiechtensteinIrelandCroatia
MaltaAustria
ItalyRomaniaSlovakiaBulgariaNorwayGreeceEstonia
SerbiaFYR of Macedonia
HungaryMontenegro
KosovoIcelandCyprus
PCS identified per 1000 habitantsAverage
Aver
age:
2.46
Figure 2: Density (identified PCS/1,000 capita) in 33 countries.
(25%) are distributed in 6 categories. For the service sector,gasoline stations are the most frequently reported sources ofcontamination (15%) followed by the car service stations(around 6%).
The Eurostat data on sectoral breakdown of manufactur-ing (NACE [37]) sums up the total number of enterprises inthe EU to 2.041million.TheEurostat industrial sectors do notcorrespond one-to-one with the industrial production sec-tors considered in the EIONET-CSI questionnaire (Table 2,column (a)). Some grouping of the Eurostat sectors (plus signin column (c)) has taken place to make the correspondence.Note that the Eurostat data for the mining sector wasembedded in the Eurostat category “other manufacturing.”From the values in columns d and b, a new value (column (e))is computed that expresses howmany enterprises of an indus-trial sector contribute to 1 percent of the local contaminationcoming from that sector. The smaller the number, the moreone site contributes to industrial contamination. The result-ing figures show for instance thatmining sites are individuallyheavier polluters compared to other sectors. Instead, theelectronic industry enterprises pollute less compared to theshown sectors (Table 2).
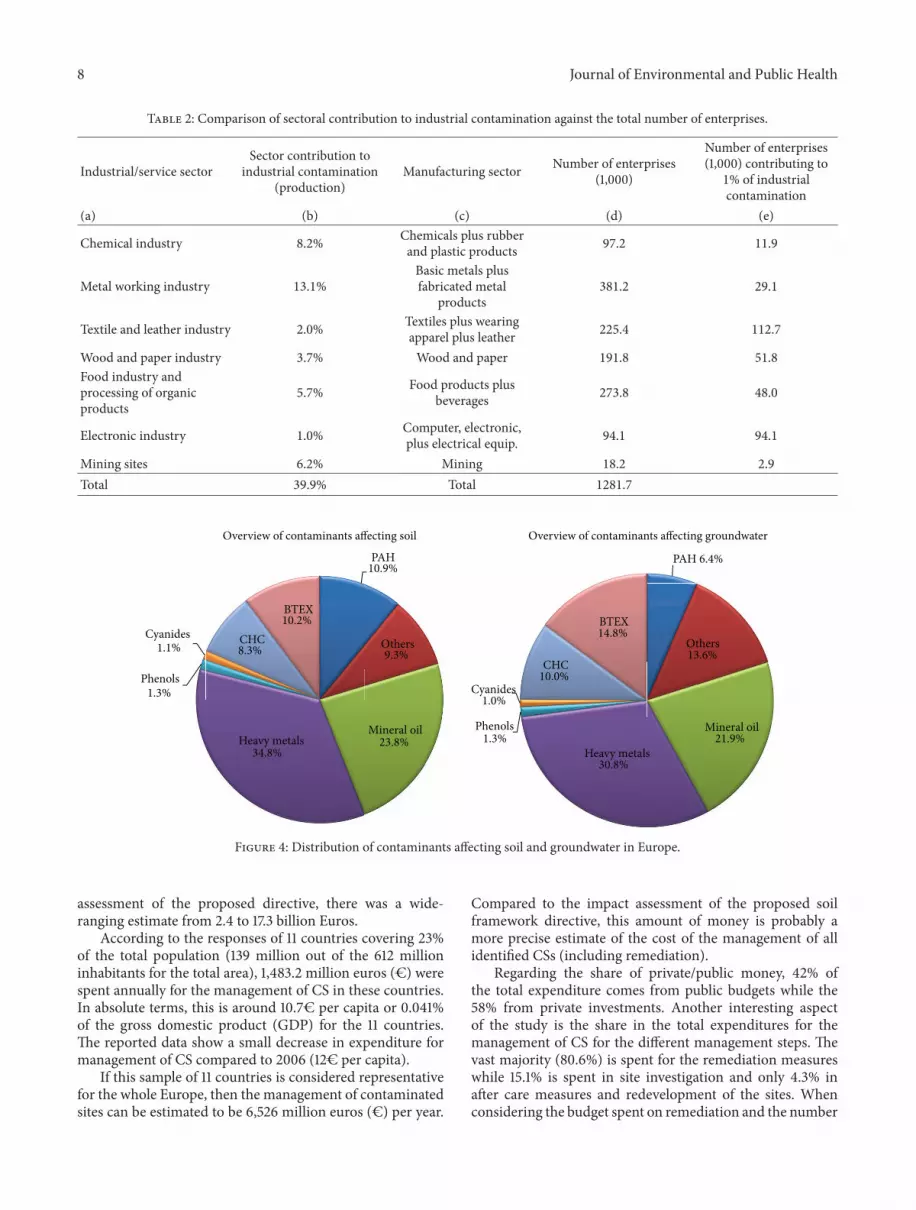
3.3.MainContaminants. Thecountrieswere asked to allocatea percentage for the proposed contaminant categories basedon the occurrence of soil contamination. Distinctions weremade between contaminants affecting the solid matrix (soil,sludge, and sediments) and the liquid matrix (groundwater,
surface waters, and leachate). The following eight categoriesof contaminants were proposed both for solid and liquid ma-trices:
(i) chlorinated hydrocarbons (CHCs).(ii) mineral oil.(iii) polycyclic aromatic hydrocarbons (PAHs).(iv) heavy metals.(v) phenols.(vi) cyanides.(vii) aromatic hydrocarbons (BTEX: benzene, toluene,
ethyl benzene, and xylene).(viii) others.
The responses were received from 16 countries which corre-spond to about 40%of the total study population.The analysisbased on these responses is of key importance for researchand development, the remediation market, and relatedindustries. For instance, if a specific compound is known to bea major soil contaminant, it may be worthwhile to developnew detection methods (i.e., in situ detection) and moreefficient remediation techniques.
The distribution of the contaminants affecting soil issimilar to the one of groundwater.Themain contaminant cat-egories are heavy metals and mineral oil contributing jointlyto around 60% in soil contamination and 53% of the ground-water contamination (Figure 4). On the contrary, the phenols

Journal of Environmental and Public Health 7
Storage 10.5%
Others 7.9%
Transport spills on land 7.9%
Military 3.4%
Nuclear operations0.1%
Industrial andcommercial activities 33.3%
Waste disposal andtreatment 37.2%
Industrial and commercial activities
0
2
4
6
8
10
12
14
16
Ener
gy p
rodu
ctio
n
Oil
indu
stry
Chem
ical
indu
stry
Met
al w
orki
ng in
dustr
y
Elec
troni
c ind
ustr
y
Gla
ss, c
eram
ics,
stone
and
soil
indu
stry
Text
ile an
d le
athe
r ind
ustr
y
Woo
d an
d pa
per i
ndus
try
Food
indu
stry
and
proc
essin
g of
org
anic
pro
duct
s
Oth
ers (
prod
uctio
n se
ctor
)
Gas
olin
e sta
tions
Car s
ervi
ce st
atio
ns
Dry
clea
ning
Prin
ters
Shoo
ting
rang
es
Oth
ers (
serv
ice s
ecto
r)
Min
ing
sites
Production sector Service sector Mining
(%)
Figure 3: Distribution of sectors contributing to soil contamination in Europe with special focus to industrial/commercial activities.
and cyanides have an insignificant contribution to totalcontamination. The remaining four categories (BTEX, CHC,PAH, and others) have similar contributions to soil contami-nation varying between 8 and 11% and summing up to 40%. Inthe groundwater contamination, their contribution is around45% ranging from 6% for PAH to 15% for BTEX.The currentdistribution is similar to the one proposed after the analysisof the 2006 surveyed results.
3.4. Budget Allocated. The cost of managing the CS is animportant element taken into account by policy makers. Thequestionnaire included parts to investigate annual estimationof expenditures, share of private/public money, and shareof total expenditure. This is a very important aspect as oneof the most criticised issues in the proposed Europeansoil framework directive [24] was the required estimate ofannual cost for management of CS. According to the impact
8 Journal of Environmental and Public Health
Table 2: Comparison of sectoral contribution to industrial contamination against the total number of enterprises.
Industrial/service sectorSector contribution to
industrial contamination(production)
Manufacturing sector Number of enterprises(1,000)
Number of enterprises(1,000) contributing to1% of industrialcontamination
(a) (b) (c) (d) (e)
Chemical industry 8.2% Chemicals plus rubberand plastic products 97.2 11.9
Metal working industry 13.1%Basic metals plusfabricated metal
products381.2 29.1
Textile and leather industry 2.0% Textiles plus wearingapparel plus leather 225.4 112.7
Wood and paper industry 3.7% Wood and paper 191.8 51.8
Food industry andprocessing of organicproducts
5.7% Food products plusbeverages 273.8 48.0
Electronic industry 1.0% Computer, electronic,plus electrical equip. 94.1 94.1
Mining sites 6.2% Mining 18.2 2.9
Total 39.9% Total 1281.7
PAH10.9%
Others 9.3%
Mineral oil23.8%Heavy metals
34.8%
Phenols1.3%
Cyanides1.1% CHC
8.3%
BTEX10.2%
Overview of contaminants affecting soil
PAH 6.4%
Others 13.6%
Mineral oil21.9%
Heavy metals 30.8%
Phenols1.3%
Cyanides1.0%
CHC 10.0%
BTEX14.8%
Overview of contaminants affecting groundwater
Figure 4: Distribution of contaminants affecting soil and groundwater in Europe.
assessment of the proposed directive, there was a wide-ranging estimate from 2.4 to 17.3 billion Euros.
According to the responses of 11 countries covering 23%of the total population (139 million out of the 612 millioninhabitants for the total area), 1,483.2 million euros (C) werespent annually for the management of CS in these countries.In absolute terms, this is around 10.7C per capita or 0.041%of the gross domestic product (GDP) for the 11 countries.The reported data show a small decrease in expenditure formanagement of CS compared to 2006 (12C per capita).
If this sample of 11 countries is considered representativefor the whole Europe, then the management of contaminatedsites can be estimated to be 6,526 million euros (C) per year.
Compared to the impact assessment of the proposed soilframework directive, this amount of money is probably amore precise estimate of the cost of the management of allidentified CSs (including remediation).
Regarding the share of private/public money, 42% ofthe total expenditure comes from public budgets while the58% from private investments. Another interesting aspectof the study is the share in the total expenditures for themanagement of CS for the different management steps. Thevast majority (80.6%) is spent for the remediation measureswhile 15.1% is spent in site investigation and only 4.3% inafter care measures and redevelopment of the sites. Whenconsidering the budget spent on remediation and the number

Journal of Environmental and Public Health 9
or remediated sites (RSs) in the 11 reported countries, it iscalculated that the average amount spent per RS annually isaround 37.1 thousand euros (C) in a range varying from 7.5thousand C to 232 thousand C annually. As the remediationof sites has a duration of more than 1 year, the majority (40%)of the reported remediation projects fall in the range 50,000to 500,000C, while a considerable 26.5% of the reported casesfall in the range between 5,000 and 50,000C.
4. Discussion and Conclusions
In terms of estimations, around 1,170,000 PCSs have beenidentified which are circa 45% of the total estimated PCSs.Also, around 127,000CSs have been already identified whichare circa 27% of the total estimated 342,000CSs. Moreover,around 46% of the total identified CSs have been remediated(58,300 RSs). The identified figures for CS, PCSs and RS arebased on reported data from 33 countries, while the estimatedCSs and PCSs have been extrapolated based on data from alimited sample (11 or 12 countries).
Notwithstanding the positive outcomes of the EIONET-CSI data collection, it could be noted that the data submittedwere not homogeneous since there are differences in the waythat countries interpret the terms of contaminated sites. Asshown in Figure 2, there is a high variability between the datasubmitted by countries. This variability is explained by thelarge uncertainty both in terms of methodology and data.Some countries run their own CSmanagement system whichmay not fit perfectly to the definition of the CSI015 indicator,and this contributes to methodology uncertainty. Moreover,the reported data are usually based on expert judgementwhich includes a high degree of uncertainly. The countriesmay interpret the data specifications in different ways, andthis increases the heterogeneity in the data reported. Thereported data on CSI015 indicator are based on the exceedof limits in concentrations of hazardous chemicals. However,common limits are unlikely to be established at the Europeanlevel since they may be strongly influenced by local soil andgeological properties.
An adequate response to the high data variability could betomake a pan-European training event with the participationof competent national EIONETauthorities, with the objectiveto apply the same terminology in all countries in subsequentdata collections. The heterogeneity of responses can also bedecreased if the provided documentation is taken intoaccount.
In general, there are difficulties in getting the data on soilcontamination, but improvement in data availability and dataquality over the years can be observed. At this moment, theresulting dataset is the best “picture” that can be achievedbased on national data. The EIONET-CSI data collection hastaken place 5 years after the previous one of 2006.This 5-yearperiod between data collections seems to bemore appropriatethan the 2-year period applied in the past, since the data onCS are not changing considerably in such a relative short time.
The direct and indirect costs to a country for dealing withthe problem of CS depend on the amount and characteristicsof CS in its territory. Generally, the presence of CS can affectcompany profits, business confidence, and attractiveness to
investors. It may also affect aspects of public health andecosystem protection. The remediation cost of CS, even ifonly a very little percentage of GDP, seems to be amajor issue,and investments to improve the land quality through remedi-ation are not readily made. Countries should weigh the costsof dealing with local land contamination against benefits topublic health, improvement of the environment (e.g., waterquality), land regeneration, and sustainable use of soil.
Restrictions set by privacy law in Europe are a majorobstacle to identification and management of land con-tamination. Status and data on private land are not easilyaccessible to public authorities as this may have some impli-cations for the land owner. However, the situation of his landis affecting public health, water quality, and ecosystem ser-vices. In cases of proven soil contamination, public author-ities could be allowed for intervention or even raise publicawareness. The conflicts between public interest and pri-vacy regarding land and in general environmental problemsshould be resolved at a legal basis.
The EIONET-CSI dataset will be supplemented withheavy metals data at European level. In 2009, 22,000 soilsamples were taken in European Union countries during asoil survey named LUCAS [38].Those soil samples have beenanalysed for some of the most important soil attributes suchas soil organic carbon, and the results assist to estimate betterthe overall situation in Europe [39]. Currently, these soilsamples are analysed for heavy metals, and the expectedoutput results will facilitate better assessment of soil contami-nation in European Union.The LUCAS heavy metals datasetwill face the issue of privacy which can overcome with theapplication of digital soil mapping for the development ofinterpolated maps.The combination of LUCAS heavy metalswith EIONET-CSI will be an important step in assessing soilcontamination in Europe.
The proposed datasets and the current study can beconsidered by public health professionals for epidemiologicalassessments. The study of human exposure pathways is a keyissue on contaminated sites, and certainly the integration ofEIONET-CSI datasets with epidemiological data would be avery important step forward in this direction. Moreover, asthe majority of food is growing in soil, biomonitoring andother research should investigate the pathways and routesfrom producers to consumers.
Conflict of Interests
The authors confirm and sign that there is no conflictof interests with networks, organisations, and data centresreferred in the paper. In specific, ESDAC is the European SoilData Centre and is an integral part of the Joint ResearchCentre of the European Commission, to which the authorsare affiliated.Moreover, the ESDAC is operated by the authorsthemselves, so there cannot be any conflict of interests what-soever. Also, the authors have published the paper relevantto ESDAC [33]. European Environment Information andObservationNetwork for soil (EIONET-SOIL) is the networkof soil organizations officially designated by the Europeancountries that deliver, on request by ESDAC and on avoluntary basis, data on soil related topics, in this case,

10 Journal of Environmental and Public Health
contaminated sites. Therefore, there cannot be any conflictof interests. Note that the contributing organizations of theEIONET-SOIL are explicitly acknowledged in the paper.Also, the authors have published a paper relevant to anotherdata collection (soil organic carbon) in the past [32].
Acknowledgments
The authors would like to acknowledge the countries (per-sons and organizations) that contributed to data in theEIONET study: Albania (Loreta Sulovari of the Agency ofEnvironment and Forestry; Erinda Misho of AEF); Austria(Stefan Weihs, Dietmar Mueller, and Sabine Rabl-Berger ofthe Umweltbundesamt GmbH Environment Agency Austria;Franz Buchebnerof the Bundesministerium fur Land-undForstwirtschaft, Umwelt und Wasserwirtschaft; SebastianHolub of the Kommunalkredit Public Consulting GmbH);Belgium (Flanders) (Marijke Cardon and Els Gommeren ofOVAM); Bosnia and Herzegovina (Hamid Custovic of theUniversity of Sarajevo, Faculty of Agriculture and Food Sci-ences); Croatia (Andreja Steinberger and Zeljko Crnojevic ofthe Croatian Environment Agency (CEA)); Cyprus (Chrys-talla Stylianou and Neoclis Antoniou of the Departmentof Environment; Andreas Zissimos of the Geological Sur-vey Department); Estonia (Peep Siim of the Ministry ofEnvironment Water Department Project Bureau); Finland(Teija Haavisto of the Finnish Environment Institute);France (VeroniqueAntoni,DelphineMaurice, Farid Bouagal,Philippe Bodenez, and Claudine CHOQUET of the FrenchMinistry in charge of ecology; Jean-Francois Brunet ofBRGM; Antonio Bispo of ADEME); Germany (Joerg Frauen-stein of the Umweltbundesamt); Hungary (Gabor Hasznos ofthe Ministry for Rural Development); Ireland (David Smithof the Environmental Protection Agency); Italy (LauraD’Aprile of ISPRA); Kosovo (Republic of Kosova) (GaniBerisha of theMinistry of Environment and Spatial Planning,Soil Protection Sector; Shkumbin Shala of the Hydrom-eteorological Institute, Kosova’s Environmental ProtectionAgency); Lithuania (Virgilija Gregorauskiene of the Lithua-nian Geological Survey); Former Yugoslav Republic of Mace-donia (Margareta Cvetkovska of the Macedonian Envi-ronmental Information Center, Ministry of Environmentand Physical Planning); Malta (Christina Mallia of theEnvironmental Permitting and Industry Unit of the MaltaEnvironment and Planning Authority); Montenegro (VesnaNovakovic of the Environmental Protection Agency of Mon-tenegro); Netherlands (Versluijs C. W. and Bogte J. J. ofthe RIVM); Norway (Per Erik Johansen of the Klima- ogforurensningsdirektoratet); Poland (Joanna Czajka of theChief Inspectorate for Environmental Protection); Slovakia(Katarina Paluchova of the Slovak Environmental Agency;Vlasta Janova of the Ministry of the Environment of theSlovak Republic); Serbia (Dragana Vidojevic of the Ministryof Environment, Mining, and Spatial Planning, Environ-mental Protection Agency); Spain (Begona Fabrellas of theMinisterio de Agricultura, Alimentacion yMedioAmbiente);Switzerland (Christoph Reusser of the Federal Office forthe Environment (FOEN)); United Kingdom (Mark Kibble-white and Caroline Keay of Cranfield University). Special
thanks should be expressed to Gondula Prokop (Environ-ment Agency Austria) who conducted the operation of datacollection and analysis on behalf of ESDAC.
References
[1] V. Rajaganapathy, F. Xavier, D. Sreekumar, and P. K. Mandal,“Heavy metal contamination in soil, water and fodder andtheir presence in livestock and products: a review,” Journal ofEnvironmental Science and Technology, vol. 4, no. 3, pp. 234–249, 2011.
[2] K. Fent, “Ecotoxicological effects at contaminated sites,” Toxi-cology, vol. 205, no. 3, pp. 223–240, 2004.
[3] P. W. Abrahams, “Soils: their implications to human health,”Science of the Total Environment, vol. 291, no. 1–3, pp. 1–32, 2002.
[4] P. Elliott, D. Briggs, S. Morris et al., “Risk of adverse birthoutcomes in populations living near landfill sites,” BritishMedical Journal, vol. 323, no. 7309, pp. 363–368, 2001.
[5] Eurostat, “Environmental Data Centre on waste,” http://epp.eu-rostat.ec.europa.eu/portal/page/portal/waste/introduction.
[6] N. Guvenc, O. Alagha, and G. Tuncel, “Investigation of soilmulti-element composition in Antalya, Turkey,” EnvironmentInternational, vol. 29, no. 5, pp. 631–640, 2003.
[7] T. A. Lewis, D. A. Newcombe, and R. L. Crawford, “Biore-mediation of soils contaminated with explosives,” Journal ofEnvironmental Management, vol. 70, no. 4, pp. 291–307, 2004.
[8] J. S. Fuchs, M. L. Oneto, N. B. Casabe et al., “Ecotoxicologicalcharacterization of a disposal lagoon from a munition plant,”Bulletin of Environmental Contamination andToxicology, vol. 67,no. 5, pp. 696–703, 2001.
[9] Z. Papp, Z. Dezso, and S. Daroczy, “Significant radioactivecontamination of soil around a coal-fired thermal power plant,”Journal of Environmental Radioactivity, vol. 59, no. 2, pp. 191–205, 2002.
[10] A. F. Badawi, E. L. Cavalieri, and E. G. Rogan, “Effect ofchlorinated hydrocarbons on expression of cytochrome P4501A1, 1A2 and 1B1 and 2- and 4-hydroxylation of 17𝛽-estradiolin female Sprague-Dawley rats,” Carcinogenesis, vol. 21, no. 8,pp. 1593–1599, 2000.
[11] J. L. R. Gallego, J. Loredo, J. F. Llamas, F. Vazquez, and J.Sanchez, “Bioremediation of diesel-contaminated soils: eval-uation of potential in situ techniques by study of bacterialdegradation,” Biodegradation, vol. 12, no. 5, pp. 325–335, 2001.
[12] P. Juteau, J.-G. Bisaillon, F. Lepine, V. Ratheau, R. Beaudet,and R. Villemur, “Improving the biotreatment of hydrocarbons-contaminated soils by addition of activated sludge taken fromthe wastewater treatment facilities of an oil refinery,” Biodegra-dation, vol. 14, no. 1, pp. 31–40, 2003.
[13] X. L. Zhang, S. Tao, W. X. Liu, Y. Yang, Q. Zuo, and S. Z.Liu, “Source diagnostics of polycyclic aromatic hydrocarbonsbased on species ratios: a multimedia approach,” EnvironmentalScience and Technology, vol. 39, no. 23, pp. 9109–9114, 2005.
[14] L. Jarup, “Hazards of heavy metal contamination,” BritishMedical Bulletin, vol. 68, pp. 167–182, 2003.
[15] T. McIntyre, “Phytoremediation of heavy metals from soils,”Advances in Biochemical Engineering/Biotechnology, vol. 78, pp.97–123, 2003.
[16] WHO European Centre for Environment and Health,Methodsof Assessing Risk to Health from Exposure to Hazards Releasedfrom Waste Landfills, WHO Regional Office for Europe, Lodz,Poland, 2000.

Journal of Environmental and Public Health 11
[17] B. L. Johnson, “Hazardous waste: human health effects,” Toxi-cology and Industrial Health, vol. 13, no. 2-3, pp. 121–143, 1997.
[18] A. Kahru, A. Maloverjan, H. Sillak, and L. Pollumaa, “Thetoxicity and fate of phenolic pollutants in the contaminated soilsassociated with the oil-shale industry,” Environmental scienceand pollution research international, vol. 1, pp. 27–33, 2002.
[19] P. Kjeldsen, “Behaviour of cyanides in soil and groundwater: areview,”Water, Air, and Soil Pollution, vol. 115, no. 1–4, pp. 279–307, 1999.
[20] T. A. Gossel, Principles of Clinical Toxicology, Raven Press , NewYork, Ny, USA, 1984.
[21] US EPA, “National emissions standards for hazardous air pol-lutants: municipal solid waste landfills,” Tech. Rep. 68/FR/2227,U.S. Environmental Protection Agency (US EPA), Office of AirQuality Planning and Standards, Washington, DC, USA, 2003.
[22] E. Durmusoglu, F. Taspinar, and A. Karademir, “Health riskassessment of BTEX emissions in the landfill environment,”Journal of Hazardous Materials, vol. 176, no. 1–3, pp. 870–877,2010.
[23] EC, “Communication from the Commission to the Council, theEuropeanParliament, the EuropeanEconomic and Social Com-mittee of the Regions, Thematic Strategy for Soil Protection,”COM(2006) 231 final, 2006.
[24] EC, “Proposal for a Directive of the European Parliament and ofthe Council establishing a framework for the protection of soiland amending Directive 2004/35/EC,” Brussels, COM (2006)232 final, 2006.
[25] IPPC, “Directive 2008/1/EC of the European Parliament andof the Council of 15 January 2008 concerning integratedpollution prevention and control,” http://europa.eu/legislationsummaries/environment/waste management/l28045 en.htm,2008.
[26] WFD, Directive 2000/60/EC of the European Parliament and ofthe Council Establishing a framework for the Community Actionin the Field of Water Policy, 2000.
[27] Waste, “Waste Framework Directive, or Directive 2008/98/ECof the European Parliament and of the Council of 19 November2008 on waste,” http://eur-lex.europa.eu/LexUriServ/LexUriS-erv.do?uri=CELEX:32008L0098:EN:NOT, 2008.
[28] K. Hinsby, M. T. Condesso de Melo, and M. Dahl, “Europeancase studies supporting the derivation of natural backgroundlevels and groundwater threshold values for the protection ofdependent ecosystems and human health,” Science of the TotalEnvironment, vol. 401, no. 1–3, pp. 1–20, 2008.
[29] J. Koarashi, M. Atarashi-Andoh, T. Matsunaga, T. Sato, S.Nagao, and H. Nagai, “Factors affecting vertical distributionof Fukushima accident-derived radiocesium in soil underdifferent land-use conditions,” Science of the Total Environment,vol. 431, pp. 392–401, 2012.
[30] D. Czovek, Z. Novak, C. Somlai et al., “Respiratory conse-quences of red sludge dust inhalation in rats,”Toxicology Letters,vol. 209, no. 2, pp. 113–120, 2012.
[31] European Environment Agency (EEA), http://www.eea.europa.eu/data-and-maps/indicators/progress-in-management-of-con-taminated-sites/progress-in-management-of-contaminated,2011.
[32] P. Panagos, R. Hiederer, M. Van Liedekerke, and F. Bampa,“Estimating soil organic carbon in Europe based on datacollected through an European network,” Ecological Indicators,vol. 24, pp. 439–450, 2013.
[33] P. Panagos, M. Van Liedekerke, A. Jones, and L. Montanarella,“European Soil Data Centre: response to European policysupport and public data requirements,” Land Use Policy, vol. 29,no. 2, pp. 329–338, 2012.
[34] C. C. Ferguson, “Assessing risks from contaminated sites: policyand practice in 16 European Countries,” Land Contaminationand Reclamation, vol. 7, no. 2, pp. 87–108, 1999.
[35] Eurostat, “Directorate-General of the European Commission,”http://epp.eurostat.ec.europa.eu/portal/page/portal/eurostat/home, 2013.
[36] Eusoils, “Data Collection on Contaminated Sites 2011,” http://eusoils.jrc.ec.europa.eu/library/data/eionet/2011 Contaminat-ed Sites.htm, 2012.
[37] NACE Section, “Manufacturing statistics—NACE ver.2,”http://epp.eurostat.ec.europa.eu/statistics explained/index.php/Manufacturing statistics - NACE Rev. 2, 2012.
[38] G. Toth, A. Jones, and L. Montanarella, “The LUCAS topsoildatabase and derived information on the regional variability ofcropland topsoil properties in the European Union,” Environ-mental Monitoring and Assessment, 2013.
[39] P. Panagos, C. Ballabio, Y. Yigini, andM. B.Dunbar, “Estimatingthe soil organic carbon content for European NUTS2 regionsbased on LUCAS data collection,” Science of the Total Environ-ment, vol. 442, pp. 235–246, 2013.