constant spread of feature-based attention across the visual field
TRANSCRIPT
Vision Research 51 (2011) 26–33
Contents lists available at ScienceDirect
Vision Research
journal homepage: www.elsevier .com/locate /v isres
Constant spread of feature-based attention across the visual field
Taosheng Liu a,b,⇑, Irida Mance a
a Department of Psychology, Michigan State University, East Lansing, MI 48824, United Statesb Neuroscience Program, Michigan State University, East Lansing, MI 48824, United States
a r t i c l e i n f o
Article history:Received 9 November 2009Received in revised form 16 September2010
Keywords:AttentionFeatureAdaptationMotion
0042-6989/$ - see front matter � 2010 Elsevier Ltd. Adoi:10.1016/j.visres.2010.09.023
⇑ Corresponding author at: Department of PsycholoEast Lansing, MI 48824, United States.
E-mail address: [email protected] (T. Liu).
a b s t r a c t
Attending to a feature in one location can produce feature-specific modulation in a different location. Thisglobal feature-based attention effect has been demonstrated using two stimulus locations. Although thespread of feature-based attention is presumed to be constant across spatial locations, it has not beentested empirically. We examined the spread of feature-based attention by measuring attentional modu-lation of the motion aftereffect (MAE) at remote locations. Observers attended to one of two directions ina compound motion stimulus (adapter) and performed a speed-increment task. MAE was measured via aspeed nulling procedure for a test stimulus at different distances from the adapter. In Experiment 1, theadapter was at fixation, while the test stimulus was located at different eccentricities. We also measuredthe magnitude of baseline MAE for each location in two control conditions that did not require feature-based selection necessitated by a compound stimulus. In Experiment 2, the adapter and test stimuli wereall located in the periphery at the same eccentricity. Our results showed that attention induced MAEspread completely across the visual field, indicating a genuine global effect. These results add to ourunderstanding of the deployment of feature-based attention and provide empirical constraints on theo-ries of visual attention.
� 2010 Elsevier Ltd. All rights reserved.
0. Introduction
Our environment contains much more sensory informationthan we can process at any given time. Attention allows us to selectrelevant attributes of sensory stimuli for prioritized processing. Animportant question in attention research is ‘‘what is selected?”(Kahneman & Henik, 1981). For visual attention, it is known thatattention can select locations, features, and objects (Maunsell &Treue, 2006; Yantis, 2000). Such flexibility is crucial for efficientlyprocessing sensory information in order to guide adaptivebehavior.
While attending to a location induces spatially-restrictedchanges in performance and neuronal activity (Carrasco, 2006;Reynolds & Chelazzi, 2004), attending to a feature leads to a globalmodulation. For example, in a seminal study, Treue and Martinez-Trujillo (1999) showed monkey subjects two apertures of movingdots, one in each hemifield. They instructed monkeys to attendto a moving dot field in the first aperture, and recorded single-unitresponses from MT neurons whose receptive fields fell on thesecond aperture, where the dots moved in the preferred directionof the neuron. The MT neurons fired at a higher rate when dotsin the first aperture moved in the neuron’s preferred direction than
ll rights reserved.
gy, Michigan State University,
when they moved in the non-preferred direction. Such an effect ispurely feature-based, since spatial attention was held constant(always directed to the first aperture). Importantly, the secondaperture was always in the opposite hemifield to the first aperture.Hence, attentional modulation is global; it spread from the firstaperture to the second.
Subsequent human fMRI and psychophysical studies have ob-tained similar results, demonstrating the global nature of fea-ture-based attention (Saenz, Buracas, & Boynton, 2002, 2003). Animplicit assumption in the literature seems to be that such spreadis all-or-none, i.e., independent of spatial distance. A constant levelof feature-based effect has indeed been assumed in some compu-tational models of attention (Boynton, 2005; Reynolds & Heeger,2009). However, in all studies so far, feature-based modulationhas been evaluated at one location (typically in the opposite hemi-field) distant from the focus of spatial attention. Thus, although it isclear that feature-based attention does transfer to distant loca-tions, the degree of such transfer remains an open question. Thegoal of the present work is to characterize the spatial gradient ofthe spread of feature-based attention.
Here we use an adaptation protocol to measure the spread offeature-based attention. If attending to a specific feature selec-tively increases the activity of neurons preferring that feature,those neurons will become more adapted, as neural adaptationtends to increase with stronger neuronal response (e.g., Gardneret al., 2005; Sclar, Lennie, & DePriest, 1989). Consistent with this
T. Liu, I. Mance / Vision Research 51 (2011) 26–33 27
idea, attending to one motion direction in a compound stimulusproduces a motion aftereffect (MAE) similar to adapting to thatdirection alone (Lankheet & Verstraten, 1995). Similar effects havebeen observed for orientation (Liu, Larsson, & Carrasco, 2007;Spivey & Spirn, 2000).
Interestingly, attention-induced adaptation can occur in a re-mote location which was never stimulated (Arman, Ciaramitaro,& Boynton, 2006), in accordance with the idea that feature-basedattention increases gain of neuronal subpopulations across thevisual field, even without sensory stimulation. Here we used asimilar protocol to examine the spatial spread of such attention-induced adaptation. We presented a compound stimulus (adapter)that contained two directions of motion, and cued our observers toattend to one direction in the adapter. We then measured MAE inremote locations that were never directly stimulated, at differentdistances from the adapter. The adapting stimulus was held con-stant for different test locations, thus eliminating any differentialsensory effects due to processing of the adapter. We conductedtwo experiments, in which the adapter was presented either at fix-ation (Experiment 1) or at a peripheral location (Experiment 2).
1. Experiment 1
Previous studies on global feature-based attention always in-structed participants to attend to a peripheral location. However,during normal viewing conditions, humans tend to foveate objectsthey are attending to. To further explore the generalizability of fea-ture-based attentional spread, and to mimic more ecological situa-tions, we examined the spread of feature-based attention from thecenter of the visual field by presenting the adapter at fixation. Onecomplexity for this protocol concerns possible variations in basicadaptation effects across retinal eccentricities. Such variationscould reflect different motion sensitivities across retinal locations(Finlay, 1982). To assess such baseline variability, we conductedtwo control experiments. The first control was identical to theattention condition except that the adapter contained only a singlemotion direction. This control essentially measured the spread of‘‘phantom MAE” – MAE produced at un-stimulated locations. Inthe second control, a single-direction adapter was presented inthe same remote location as the test stimulus, which measuredthe magnitude of the traditional (or concrete) MAE. In order toevaluate the spatial profile of global feature-based attention, wecompared the magnitude of MAE in an attention condition relativeto the magnitude of MAE in two control conditions.
2. Methods
2.1. Participants
Four observers participated in the experiment; all had normalor corrected-to-normal vision. Two of the observers were authors;the other two were undergraduate students at Michigan StateUniversity. All participants gave informed consent according tothe study protocol that was approved by the Institutional ReviewBoard at Michigan State University. Observers were paid $10/hfor their participation.
2.2. Stimulus and display
Visual stimuli consisted of white moving dot patterns (dot size:0.1�, density: 8 dots/deg2, luminance: 24 cd/m2) in a circular aper-ture, presented on a dark background (0.01 cd/m2). Stimuli weregenerated using MGL (http://www.gru.brain.riken.jp/doku.php?id=mgl:overview), a set of custom OpenGL libraries running inMatlab (Mathworks, Natick, MA). A 21 in. CRT monitor was used
to present stimuli (resolution: 1024 � 768, 100 Hz refresh rate),and observers viewed the screen at a distance of 57 cm; their headswere stabilized by a chinrest.
2.3. Task and procedure
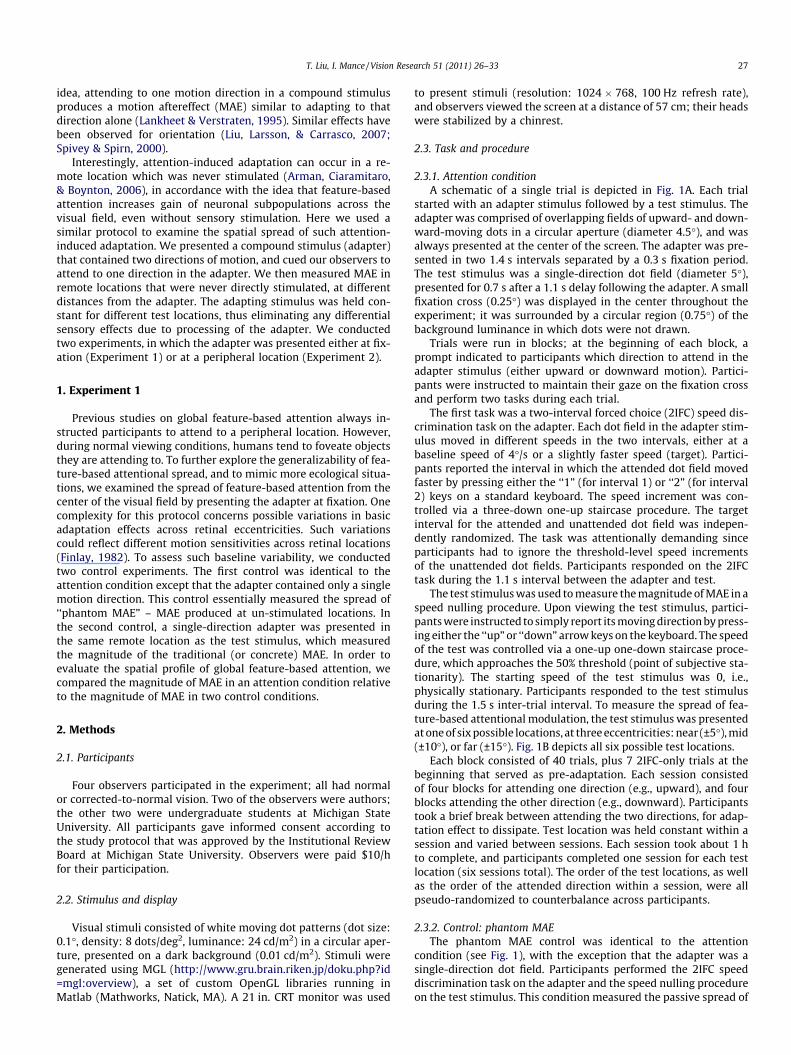
2.3.1. Attention conditionA schematic of a single trial is depicted in Fig. 1A. Each trial
started with an adapter stimulus followed by a test stimulus. Theadapter was comprised of overlapping fields of upward- and down-ward-moving dots in a circular aperture (diameter 4.5�), and wasalways presented at the center of the screen. The adapter was pre-sented in two 1.4 s intervals separated by a 0.3 s fixation period.The test stimulus was a single-direction dot field (diameter 5�),presented for 0.7 s after a 1.1 s delay following the adapter. A smallfixation cross (0.25�) was displayed in the center throughout theexperiment; it was surrounded by a circular region (0.75�) of thebackground luminance in which dots were not drawn.
Trials were run in blocks; at the beginning of each block, aprompt indicated to participants which direction to attend in theadapter stimulus (either upward or downward motion). Partici-pants were instructed to maintain their gaze on the fixation crossand perform two tasks during each trial.
The first task was a two-interval forced choice (2IFC) speed dis-crimination task on the adapter. Each dot field in the adapter stim-ulus moved in different speeds in the two intervals, either at abaseline speed of 4�/s or a slightly faster speed (target). Partici-pants reported the interval in which the attended dot field movedfaster by pressing either the ‘‘1” (for interval 1) or ‘‘2” (for interval2) keys on a standard keyboard. The speed increment was con-trolled via a three-down one-up staircase procedure. The targetinterval for the attended and unattended dot field was indepen-dently randomized. The task was attentionally demanding sinceparticipants had to ignore the threshold-level speed incrementsof the unattended dot fields. Participants responded on the 2IFCtask during the 1.1 s interval between the adapter and test.
The test stimulus was used to measure the magnitude of MAE in aspeed nulling procedure. Upon viewing the test stimulus, partici-pants were instructed to simply report its moving direction by press-ing either the ‘‘up” or ‘‘down” arrow keys on the keyboard. The speedof the test was controlled via a one-up one-down staircase proce-dure, which approaches the 50% threshold (point of subjective sta-tionarity). The starting speed of the test stimulus was 0, i.e.,physically stationary. Participants responded to the test stimulusduring the 1.5 s inter-trial interval. To measure the spread of fea-ture-based attentional modulation, the test stimulus was presentedat one of six possible locations, at three eccentricities: near (±5�), mid(±10�), or far (±15�). Fig. 1B depicts all six possible test locations.
Each block consisted of 40 trials, plus 7 2IFC-only trials at thebeginning that served as pre-adaptation. Each session consistedof four blocks for attending one direction (e.g., upward), and fourblocks attending the other direction (e.g., downward). Participantstook a brief break between attending the two directions, for adap-tation effect to dissipate. Test location was held constant within asession and varied between sessions. Each session took about 1 hto complete, and participants completed one session for each testlocation (six sessions total). The order of the test locations, as wellas the order of the attended direction within a session, were allpseudo-randomized to counterbalance across participants.
2.3.2. Control: phantom MAEThe phantom MAE control was identical to the attention
condition (see Fig. 1), with the exception that the adapter was asingle-direction dot field. Participants performed the 2IFC speeddiscrimination task on the adapter and the speed nulling procedureon the test stimulus. This condition measured the passive spread of
adapter: interval 1 adapter: interval 2 test
Time
adapter: interval 1 adapter: interval 2 test response and ITI
1.4 s 1.4 s 1.1 s 0.7 s 1.5 s0.3 s
12
3 410º
Adapter
Mid ±0ºFar ±15º
Near ±5º
A
B C
Fig. 1. Experimental protocol. (A) Example trial sequence. Two adapter stimuli were presented in two intervals followed by the test stimulus. (B) Schematic of the stimuluslocations in Experiment 1. The size of the adapter and test was 4.5� and 5� (diameter), respectively. (C) Schematic of the stimulus locations in Experiment 2. The size of thestimulus is 5� (diameter).
28 T. Liu, I. Mance / Vision Research 51 (2011) 26–33
the motion adaptation effect without the need to select a specificfeature from the compound stimulus.
2.3.3. Control: concrete MAEThe concrete MAE control was identical to the phantom MAE
control except that the adapter was presented in one of the six pos-sible locations occupied by the test stimulus (see Fig. 1B). Theadapter was always presented in the same location as the test ineach session. This condition measured the baseline adaptation ofdirection-selective mechanisms without the need to select a spe-cific feature from the compound stimulus. The order of the twocontrol conditions and the attention condition was randomizedfor each participant.
2.4. Data analysis
No systematic differences were found between the left andright hemifield when data were analyzed separately for each testlocation. Hence data from the iso-eccentric locations were com-bined to produce near (±5�), mid (±10�), and far (±15�) locations.Psychometric functions were fit separately for the upward anddownward conditions using a cumulative Gaussian function. Fitswere performed using maximum likelihood estimation as imple-mented in psignifit (Wichmann & Hill, 2001). The strength of adap-tation, or motion aftereffect (MAE), was measured as the change inthe point of perceived stationarity, calculated as the difference inthe nulling speed between adapting (in the control conditions)and attending (in the attention condition) to the two directions.
The magnitude of the attentional effect was indexed by the ratioof the MAE in the attention vs. that in the control conditions. Toevaluate the statistical reliability within subject, a non-parametricbootstrap method was used to estimate the variability of the ratios(Efron & Tibshirani, 1993). The data points (proportions) wereregenerated via resampling (sampling with replacement of raw re-sponses), and were fitted with psychometric functions in the same
manner as with the real data. Ratios were then calculated from thebootstrapped threshold estimates. This procedure was repeated1000 times to yield a distribution for each ratio estimates. The95% confidence intervals were determined as the range from 2.5to 97.5 percentile values in the distribution and were plotted as er-ror bars in data graphs.
2.5. Eyetracking
In a subset of runs, we monitored participants’ eye positionwith a video-based eyetracker (Eyelink II, SR Research, Ontario,Canada). Eye position data were analyzed offline using customMatlab code. All participants were able to maintain stable fixationthroughout a trial, with the mean eye position less than 0.5� fromfixation.
3. Results
3.1. Basic MAE measurement
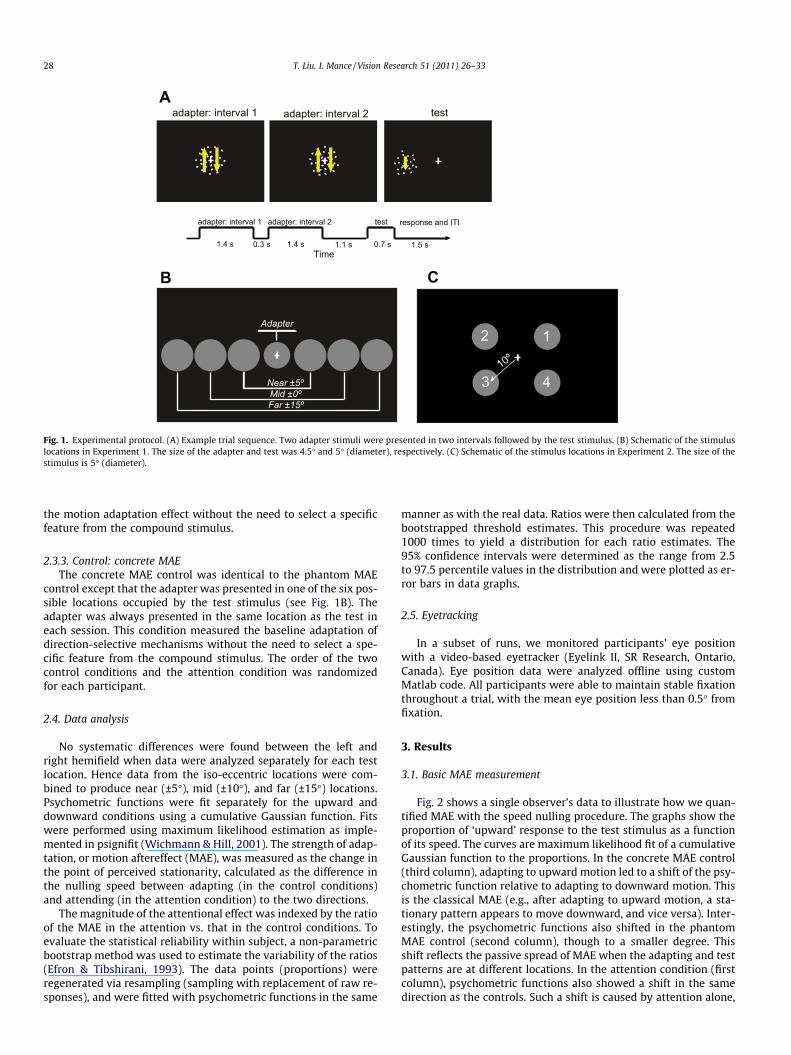
Fig. 2 shows a single observer’s data to illustrate how we quan-tified MAE with the speed nulling procedure. The graphs show theproportion of ‘upward’ response to the test stimulus as a functionof its speed. The curves are maximum likelihood fit of a cumulativeGaussian function to the proportions. In the concrete MAE control(third column), adapting to upward motion led to a shift of the psy-chometric function relative to adapting to downward motion. Thisis the classical MAE (e.g., after adapting to upward motion, a sta-tionary pattern appears to move downward, and vice versa). Inter-estingly, the psychometric functions also shifted in the phantomMAE control (second column), though to a smaller degree. Thisshift reflects the passive spread of MAE when the adapting and testpatterns are at different locations. In the attention condition (firstcolumn), psychometric functions also showed a shift in the samedirection as the controls. Such a shift is caused by attention alone,
0
0.2
0.4
0.6
0.81
0
0.2
0.4
0.6
0.81
-0.5 0 0.50
0.2
0.4
0.6
0.8
1
AttentionAttend DownAttend Up
-1 0 1
Adapt DownAdapt Up
-0.5 0 0.5
Far
Mid
Nea
r
Adapt DownAdapt Up
Phantom MAE Concrete MAE
Speed (deg/s)
Fig. 2. Data from the motion nulling procedure in a single participant in Experiment 1, plotting the proportion of reporting upward motion for the test stimulus as a functionof its speed (left column: attention condition, middle column: phantom MAE control, right column: concrete MAE control). Positive speed indicates upward motion; negativespeed indicates downward motion. Note the horizontal axis range is larger in the concrete MAE condition, reflecting a larger adaptation effect.
T. Liu, I. Mance / Vision Research 51 (2011) 26–33 29
as the adapter stimulus was held constant; only the attentionalstate of the observer varied (attend upward vs. attend downward).We defined the magnitude of the MAE as the difference in nullingspeed (50% threshold) between the upward and downward condi-tions (i.e., the amount of shift between the two psychometricfunctions).
3.2. Attention induced MAE varies across locations
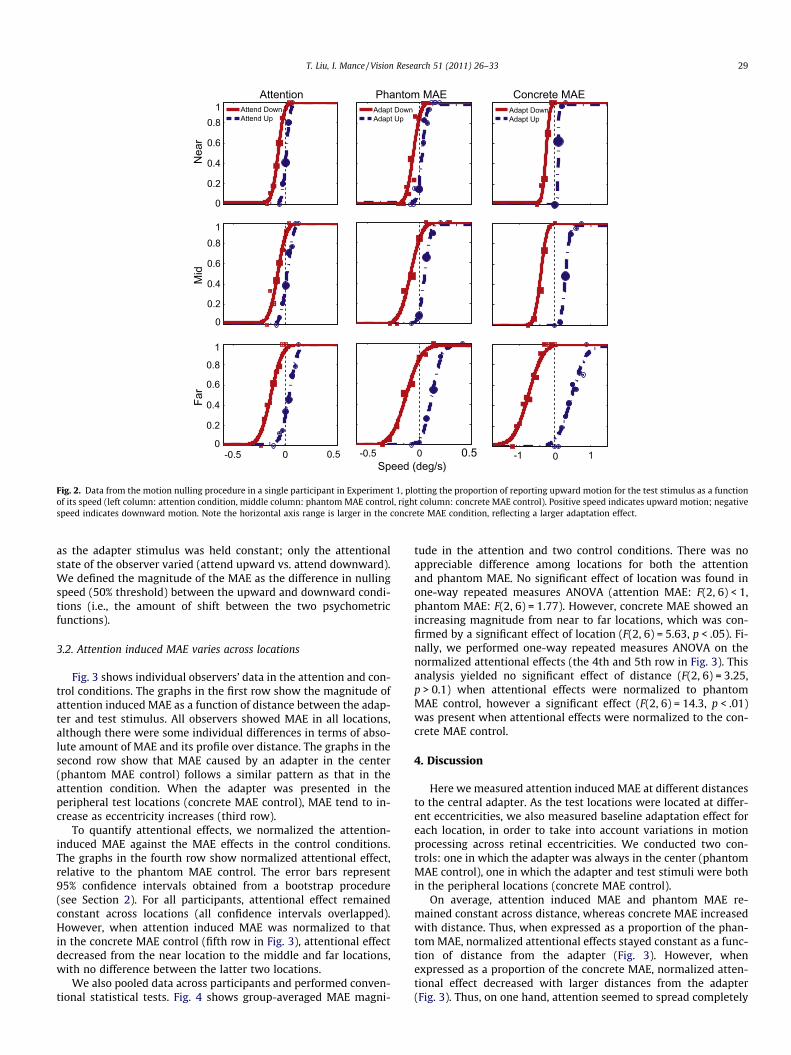
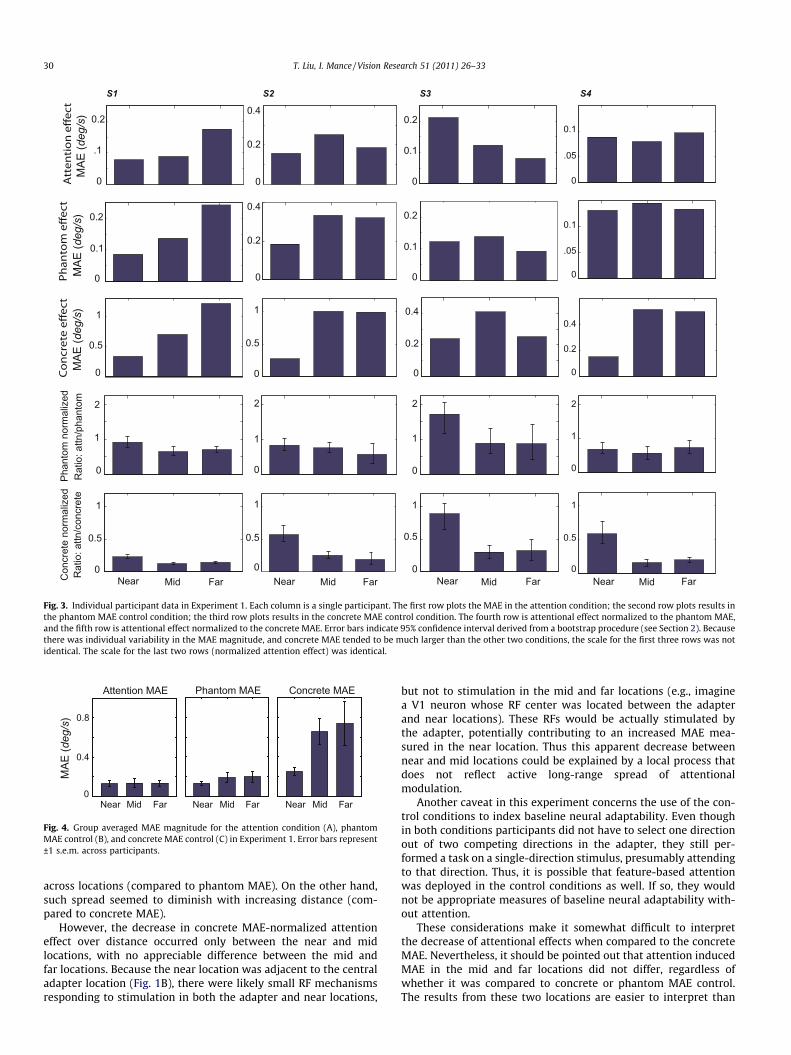
Fig. 3 shows individual observers’ data in the attention and con-trol conditions. The graphs in the first row show the magnitude ofattention induced MAE as a function of distance between the adap-ter and test stimulus. All observers showed MAE in all locations,although there were some individual differences in terms of abso-lute amount of MAE and its profile over distance. The graphs in thesecond row show that MAE caused by an adapter in the center(phantom MAE control) follows a similar pattern as that in theattention condition. When the adapter was presented in theperipheral test locations (concrete MAE control), MAE tend to in-crease as eccentricity increases (third row).
To quantify attentional effects, we normalized the attention-induced MAE against the MAE effects in the control conditions.The graphs in the fourth row show normalized attentional effect,relative to the phantom MAE control. The error bars represent95% confidence intervals obtained from a bootstrap procedure(see Section 2). For all participants, attentional effect remainedconstant across locations (all confidence intervals overlapped).However, when attention induced MAE was normalized to thatin the concrete MAE control (fifth row in Fig. 3), attentional effectdecreased from the near location to the middle and far locations,with no difference between the latter two locations.
We also pooled data across participants and performed conven-tional statistical tests. Fig. 4 shows group-averaged MAE magni-
tude in the attention and two control conditions. There was noappreciable difference among locations for both the attentionand phantom MAE. No significant effect of location was found inone-way repeated measures ANOVA (attention MAE: F(2, 6) < 1,phantom MAE: F(2, 6) = 1.77). However, concrete MAE showed anincreasing magnitude from near to far locations, which was con-firmed by a significant effect of location (F(2, 6) = 5.63, p < .05). Fi-nally, we performed one-way repeated measures ANOVA on thenormalized attentional effects (the 4th and 5th row in Fig. 3). Thisanalysis yielded no significant effect of distance (F(2, 6) = 3.25,p > 0.1) when attentional effects were normalized to phantomMAE control, however a significant effect (F(2, 6) = 14.3, p < .01)was present when attentional effects were normalized to the con-crete MAE control.
4. Discussion
Here we measured attention induced MAE at different distancesto the central adapter. As the test locations were located at differ-ent eccentricities, we also measured baseline adaptation effect foreach location, in order to take into account variations in motionprocessing across retinal eccentricities. We conducted two con-trols: one in which the adapter was always in the center (phantomMAE control), one in which the adapter and test stimuli were bothin the peripheral locations (concrete MAE control).
On average, attention induced MAE and phantom MAE re-mained constant across distance, whereas concrete MAE increasedwith distance. Thus, when expressed as a proportion of the phan-tom MAE, normalized attentional effects stayed constant as a func-tion of distance from the adapter (Fig. 3). However, whenexpressed as a proportion of the concrete MAE, normalized atten-tional effect decreased with larger distances from the adapter(Fig. 3). Thus, on one hand, attention seemed to spread completely
0.2
0
.1
MAE
(deg
/s)
S2S1
0.1
0.2
0 MAE
(deg
/s)
0.5
1
0 MAE
(deg
/s)
0
1
2
Rat
io: a
ttn/p
hant
om
Phan
tom
nor
mal
ized
Rat
io: a
ttn/c
oncr
ete
Con
cret
e no
rmal
ized
0
0.5
1
0
0.2
0.4
0.2
0
0.4
0
0.5
1
2
1
0
0.5
1
0
0
0.1
0.2
0
0.1
0.2
0
0.2
0.4
1
2
0
0
0.5
1
0
.05
0.1
0
.05
0.1
0
0.2
0.4
0
1
2
0
0.5
1
S4S3
Near Mid Far Near Mid Far FarFar MidMidNear Near
Fig. 3. Individual participant data in Experiment 1. Each column is a single participant. The first row plots the MAE in the attention condition; the second row plots results inthe phantom MAE control condition; the third row plots results in the concrete MAE control condition. The fourth row is attentional effect normalized to the phantom MAE,and the fifth row is attentional effect normalized to the concrete MAE. Error bars indicate 95% confidence interval derived from a bootstrap procedure (see Section 2). Becausethere was individual variability in the MAE magnitude, and concrete MAE tended to be much larger than the other two conditions, the scale for the first three rows was notidentical. The scale for the last two rows (normalized attention effect) was identical.
Near Mid Far0
0.4
0.8
Attention MAE
MAE
(deg
/s)
Near Mid Far
Phantom MAE
Near Mid Far
Concrete MAE
Fig. 4. Group averaged MAE magnitude for the attention condition (A), phantomMAE control (B), and concrete MAE control (C) in Experiment 1. Error bars represent±1 s.e.m. across participants.
30 T. Liu, I. Mance / Vision Research 51 (2011) 26–33
across locations (compared to phantom MAE). On the other hand,such spread seemed to diminish with increasing distance (com-pared to concrete MAE).
However, the decrease in concrete MAE-normalized attentioneffect over distance occurred only between the near and midlocations, with no appreciable difference between the mid andfar locations. Because the near location was adjacent to the centraladapter location (Fig. 1B), there were likely small RF mechanismsresponding to stimulation in both the adapter and near locations,
but not to stimulation in the mid and far locations (e.g., imaginea V1 neuron whose RF center was located between the adapterand near locations). These RFs would be actually stimulated bythe adapter, potentially contributing to an increased MAE mea-sured in the near location. Thus this apparent decrease betweennear and mid locations could be explained by a local process thatdoes not reflect active long-range spread of attentionalmodulation.
Another caveat in this experiment concerns the use of the con-trol conditions to index baseline neural adaptability. Even thoughin both conditions participants did not have to select one directionout of two competing directions in the adapter, they still per-formed a task on a single-direction stimulus, presumably attendingto that direction. Thus, it is possible that feature-based attentionwas deployed in the control conditions as well. If so, they wouldnot be appropriate measures of baseline neural adaptability with-out attention.
These considerations make it somewhat difficult to interpretthe decrease of attentional effects when compared to the concreteMAE. Nevertheless, it should be pointed out that attention inducedMAE in the mid and far locations did not differ, regardless ofwhether it was compared to concrete or phantom MAE control.The results from these two locations are easier to interpret than
T. Liu, I. Mance / Vision Research 51 (2011) 26–33 31
results from the near location, given the above considerations. Thisobservation suggests a constant spread of feature-based attention.The extent of such spread was further tested in Experiment 2.
5. Experiment 2
In this experiment, we measured the spread of attention in-duced MAE when all stimuli were presented in the periphery, atiso-eccentric locations. This avoided the complexity of measuringeffects at different eccentricities in Experiment 1. Furthermore,putting the adapter in the periphery allowed us to test how fea-ture-based attention spread within and across hemifields. Giventhat early visual cortical areas receive input from the contralateralhemifield, adaptation effect needs to spread across the two hemi-spheres of the brain when the adapter and test are located in oppo-site hemifields, whereas it only needs to spread within ahemisphere when they are located in the same hemifield. Thusone might expect that such spread is more complete within ahemifield than between hemifields. This possibility remains un-tested as previous studies on feature-based attention have alwayspresented the test stimulus in the opposite hemifield to the at-tended stimulus (e.g., Saenz et al., 2003; Treue & Martinez-Trujillo,1999). Here we explicitly test how feature-based attention spreadwithin vs. across hemifields.
6. Methods
6.1. Participants
The two authors, plus four additional observers participated inthe experiment; all had normal or corrected-to-normal vision. Allparticipants gave informed consent according to the study protocolthat was approved by the Institutional Review Board at MichiganState University. Observers were paid $10/h for their participation.
6.2. Stimulus and display
The stimuli were identical to those in Experiment 1, except thatthe dot density was reduced to 4 dots/deg2, to accommodate re-duced visual acuity in the periphery.
6.3. Task and procedure
The task and trial timing was identical to Experiment 1 (Fig. 1A).Again, participants viewed an adapter stimulus containing two dotfields moving in opposite directions and performed a 2IFC speeddiscrimination task on the attended direction. They then set theirsubjective stationary point on a test stimulus via a one-up one-down staircase procedure.
Unlike Experiment 1, stimuli were presented at one of four pos-sible locations on the intercardinal axes at 10� of eccentricity(Fig. 1C). The adapter was presented in two possible locations:the upper right quadrant (location 1) and the lower right quadrant(location 4). For each adapter location, the test stimulus was pre-sented at one of the three remaining locations. There were six pos-sible adapter-test pairs (two adapter locations � three testlocations), which were run in separate sessions in a random orderfor each participant. Within each session of an adapter-test pair,participants completed two blocks of trials attending to one direc-tion and another two blocks of trials attending to the other direc-tion, with a brief break in between. The order of attended direction(upward followed by downward or vice versa) was randomized.Each block contained seven adapter-only (pre-adaptation) trialsand 40 adapter plus test trials.
To test for possible differences in baseline adaptability amongtest locations, we also ran a control condition. The procedure was
identical to the attention condition above, except that the adapterwas a single-direction dot stimulus (i.e., similar to the concreteMAE control in Experiment 1).
7. Results and discussion
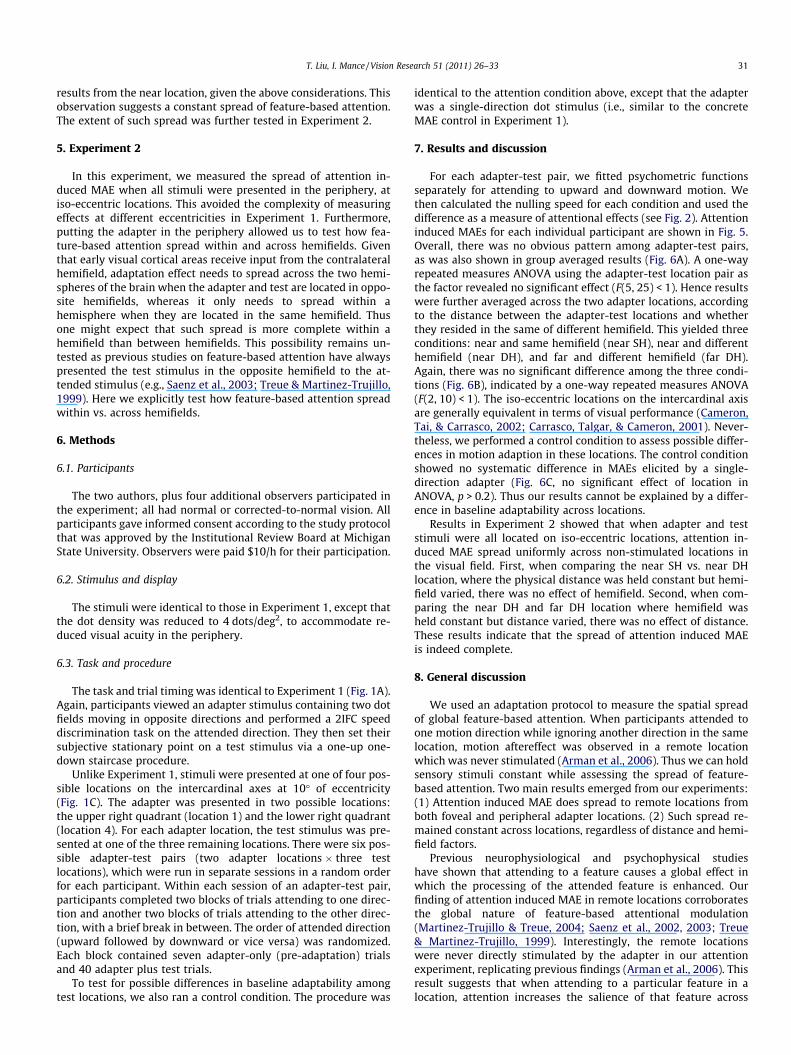
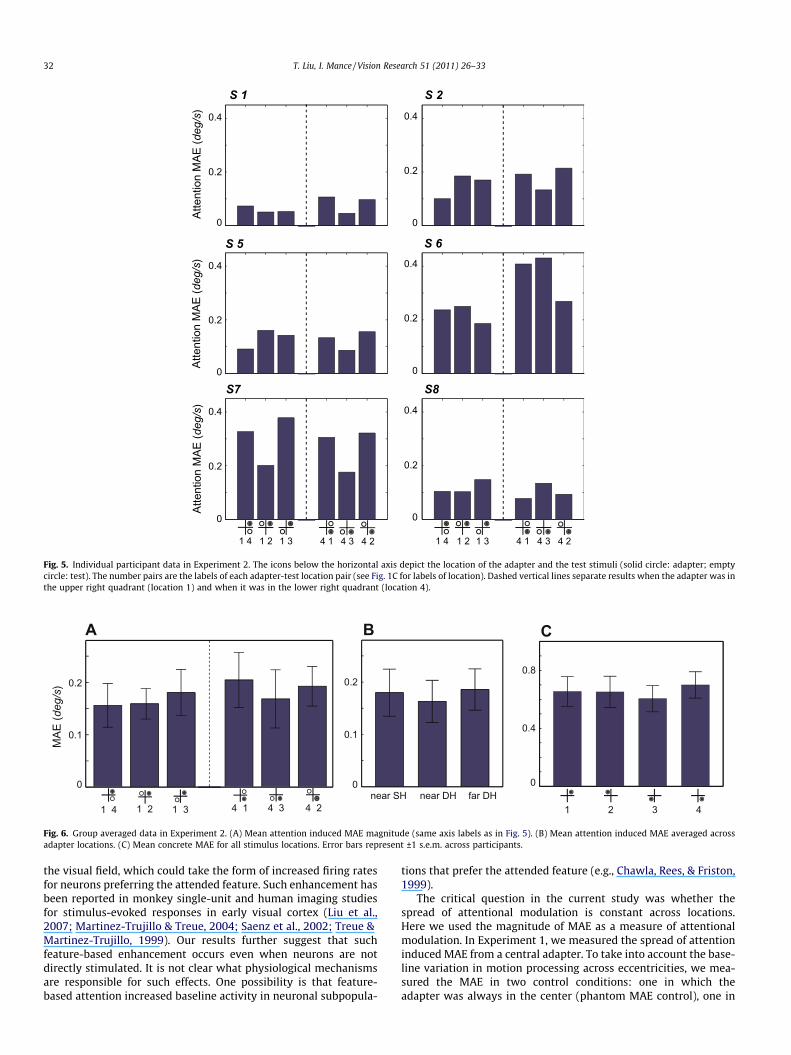
For each adapter-test pair, we fitted psychometric functionsseparately for attending to upward and downward motion. Wethen calculated the nulling speed for each condition and used thedifference as a measure of attentional effects (see Fig. 2). Attentioninduced MAEs for each individual participant are shown in Fig. 5.Overall, there was no obvious pattern among adapter-test pairs,as was also shown in group averaged results (Fig. 6A). A one-wayrepeated measures ANOVA using the adapter-test location pair asthe factor revealed no significant effect (F(5, 25) < 1). Hence resultswere further averaged across the two adapter locations, accordingto the distance between the adapter-test locations and whetherthey resided in the same of different hemifield. This yielded threeconditions: near and same hemifield (near SH), near and differenthemifield (near DH), and far and different hemifield (far DH).Again, there was no significant difference among the three condi-tions (Fig. 6B), indicated by a one-way repeated measures ANOVA(F(2, 10) < 1). The iso-eccentric locations on the intercardinal axisare generally equivalent in terms of visual performance (Cameron,Tai, & Carrasco, 2002; Carrasco, Talgar, & Cameron, 2001). Never-theless, we performed a control condition to assess possible differ-ences in motion adaption in these locations. The control conditionshowed no systematic difference in MAEs elicited by a single-direction adapter (Fig. 6C, no significant effect of location inANOVA, p > 0.2). Thus our results cannot be explained by a differ-ence in baseline adaptability across locations.
Results in Experiment 2 showed that when adapter and teststimuli were all located on iso-eccentric locations, attention in-duced MAE spread uniformly across non-stimulated locations inthe visual field. First, when comparing the near SH vs. near DHlocation, where the physical distance was held constant but hemi-field varied, there was no effect of hemifield. Second, when com-paring the near DH and far DH location where hemifield washeld constant but distance varied, there was no effect of distance.These results indicate that the spread of attention induced MAEis indeed complete.
8. General discussion
We used an adaptation protocol to measure the spatial spreadof global feature-based attention. When participants attended toone motion direction while ignoring another direction in the samelocation, motion aftereffect was observed in a remote locationwhich was never stimulated (Arman et al., 2006). Thus we can holdsensory stimuli constant while assessing the spread of feature-based attention. Two main results emerged from our experiments:(1) Attention induced MAE does spread to remote locations fromboth foveal and peripheral adapter locations. (2) Such spread re-mained constant across locations, regardless of distance and hemi-field factors.
Previous neurophysiological and psychophysical studieshave shown that attending to a feature causes a global effect inwhich the processing of the attended feature is enhanced. Ourfinding of attention induced MAE in remote locations corroboratesthe global nature of feature-based attentional modulation(Martinez-Trujillo & Treue, 2004; Saenz et al., 2002, 2003; Treue& Martinez-Trujillo, 1999). Interestingly, the remote locationswere never directly stimulated by the adapter in our attentionexperiment, replicating previous findings (Arman et al., 2006). Thisresult suggests that when attending to a particular feature in alocation, attention increases the salience of that feature across
0.4
Atte
ntio
n M
AE (d
eg/s
)
0.2
0 0
0.2
0.4
00
0.2 0.2
0.4 0.4
Atte
ntio
n M
AE (d
eg/s
)
00
0.20.2
0.40.4
Atte
ntio
n M
AE (d
eg/s
)
1 4 1 2 1 3 1 4 1 2 1 34 1 4 3 4 2 4 1 4 3 4 2
S 1 S 2
S 5 S 6
S8S7
Fig. 5. Individual participant data in Experiment 2. The icons below the horizontal axis depict the location of the adapter and the test stimuli (solid circle: adapter; emptycircle: test). The number pairs are the labels of each adapter-test location pair (see Fig. 1C for labels of location). Dashed vertical lines separate results when the adapter was inthe upper right quadrant (location 1) and when it was in the lower right quadrant (location 4).
4 3 4 21 4 1 2 1 3 1
MAE
(deg
/s)
0
0.1
0.2
4 1 2 3 4
BA
0.1
0.2
near SH near DH far DH0 0
0.4
0.8
C
Fig. 6. Group averaged data in Experiment 2. (A) Mean attention induced MAE magnitude (same axis labels as in Fig. 5). (B) Mean attention induced MAE averaged acrossadapter locations. (C) Mean concrete MAE for all stimulus locations. Error bars represent ±1 s.e.m. across participants.
32 T. Liu, I. Mance / Vision Research 51 (2011) 26–33
the visual field, which could take the form of increased firing ratesfor neurons preferring the attended feature. Such enhancement hasbeen reported in monkey single-unit and human imaging studiesfor stimulus-evoked responses in early visual cortex (Liu et al.,2007; Martinez-Trujillo & Treue, 2004; Saenz et al., 2002; Treue &Martinez-Trujillo, 1999). Our results further suggest that suchfeature-based enhancement occurs even when neurons are notdirectly stimulated. It is not clear what physiological mechanismsare responsible for such effects. One possibility is that feature-based attention increased baseline activity in neuronal subpopula-
tions that prefer the attended feature (e.g., Chawla, Rees, & Friston,1999).
The critical question in the current study was whether thespread of attentional modulation is constant across locations.Here we used the magnitude of MAE as a measure of attentionalmodulation. In Experiment 1, we measured the spread of attentioninduced MAE from a central adapter. To take into account the base-line variation in motion processing across eccentricities, we mea-sured the MAE in two control conditions: one in which theadapter was always in the center (phantom MAE control), one in

T. Liu, I. Mance / Vision Research 51 (2011) 26–33 33
which the adapter and test stimuli were both in the peripherallocation (concrete MAE control). Compared to the phantom MAE,attention induced MAE remained constant across locations,whereas it showed a decrease from near to mid location whencompared to concrete MAE. This latter result could be caused by lo-cal RF mechanisms receiving input from both the adapter and teststimulus, and hence might reflect a different phenomenon than theglobal spread of feature-based attention. Beyond this local effect,attention spread constantly through the mid and far locations, sug-gesting a true global effect. However, the interpretation of resultsfrom Experiment 1 is complicated by the fact that the control con-ditions might also involve feature-based attention.
By placing the stimuli on iso-eccentric locations in Experiment2, we avoided complications associated with measuring attentionaleffects across varying eccentricities. Results showed that attentionspread evenly for near and far locations in the visual field. Thedistance effect was also consistent with the constant level of atten-tional spread from the mid to far location in Experiment 1. Resultsfrom Experiment 2 further showed that when distance was heldconstant, attention spread evenly within and across hemifields.Assuming that MAE occurred due to adaptation of direction-selec-tive mechanisms in retinotopic visual areas (e.g., V1-MT), this re-sult suggests that top-down modulation is equally applied to thetwo hemispheres. Thus the attended feature is enhanced to a sim-ilar degree across the visual field.
Computational models of attention, such as the feature-similarity gain model (Martinez-Trujillo & Treue, 2004; Treue &Martinez-Trujillo, 1999) or the normalization model (Reynolds &Heeger, 2009), generally consider space and feature as indepen-dent dimensions. Thus spatial attention is thought to modulateretinotopically specific RF mechanisms regardless of their featureselectivity, whereas feature-based attention is thought to engenderfeature selective modulations regardless of the location of the RFmechanisms. While there is ample evidence for location-specificmodulation of spatial attention, the present study represents thefirst systematic investigation of the spread of feature-based atten-tion in space. Our results are consistent with a true global feature-based attention that modulates feature-selective mechanisms inthe visual cortex to the same extent regardless of their RF location,lending empirical support to the computational models of atten-tion. Such a mechanism would be useful in applying top-down fea-ture-based biasing to facilitate visual processing of task relevantfeatures.
Acknowledgments
We thank Dr. Mark Becker for helpful comments on an earlierversion of the manuscript. This research was supported in part
by a grant from the Provost Undergraduate Research Initiative atMichigan State University (IM).
References
Arman, A. C., Ciaramitaro, V. M., & Boynton, G. M. (2006). Effects of feature-basedattention on the motion aftereffect at remote locations. Vision Research, 46(18),2968–2976.
Boynton, G. M. (2005). Attention and visual perception. Current Opinion inNeurobiology, 15(4), 465–469.
Cameron, E. L., Tai, J. C., & Carrasco, M. (2002). Covert attention affects thepsychometric function of contrast sensitivity. Vision Research, 42(8), 949–967.
Carrasco, M. (2006). Covert attention increases contrast sensitivity: Psychophysical,neurophysiological, and neuroimaging studies. In S. Martinez-Conde, S. L.Macknik, L. M. Martinez, J. M. Alonso, & P. U. Tse (Eds.), Visual perception.Amsterdam: Elsevier.
Carrasco, M., Talgar, C. P., & Cameron, E. L. (2001). Characterizing visualperformance fields: Effects of transient covert attention, spatial frequency,eccentricity, task and set size. Spatial Vision, 15(1), 61–75.
Chawla, D., Rees, G., & Friston, K. J. (1999). The physiological basis of attentionalmodulation in extrastriate visual areas. Nature Neuroscience, 2(7), 671–676.
Efron, B., & Tibshirani, R. J. (1993). An introduction to the bootstrap. London:Chapman and Hall.
Finlay, D. (1982). Motion perception in the peripheral visual field. Perception, 11(4),457–462.
Gardner, J. L., Sun, P., Waggoner, R. A., Ueno, K., Tanaka, K., & Cheng, K. (2005).Contrast adaptation and representation in human early visual cortex. Neuron,47(4), 607–620.
Kahneman, D., & Henik, A. (1981). Perceptual organization and attention. In M.Kubovy & J. R. Pomerantz (Eds.), Perceptual organization (pp. 181–211).Hillsdale, NJ: Erlbaum.
Lankheet, M. J., & Verstraten, F. A. (1995). Attentional modulation of adaptation totwo-component transparent motion. Vision Research, 35(10), 1401–1412.
Liu, T., Larsson, J., & Carrasco, M. (2007). Feature-based attention modulatesorientation-selective responses in human visual cortex. Neuron, 55(2), 313–323.
Martinez-Trujillo, J. C., & Treue, S. (2004). Feature-based attention increases theselectivity of population responses in primate visual cortex. Current Biology,14(9), 744–751.
Maunsell, J. H., & Treue, S. (2006). Feature-based attention in visual cortex. Trends inNeurosciences, 29(6), 317–322.
Reynolds, J. H., & Chelazzi, L. (2004). Attentional modulation of visual processing.Annual Review of Neuroscience, 27, 611–647.
Reynolds, J. H., & Heeger, D. J. (2009). The normalization model of attention. Neuron,61(2), 168–185.
Saenz, M., Buracas, G. T., & Boynton, G. M. (2002). Global effects of feature-basedattention in human visual cortex. Nature Neuroscience, 5(7), 631–632.
Saenz, M., Buracas, G. T., & Boynton, G. M. (2003). Global feature-based attention formotion and color. Vision Research, 43(6), 629–637.
Sclar, G., Lennie, P., & DePriest, D. D. (1989). Contrast adaptation in striate cortex ofmacaque. Vision Research, 29(7), 747–755.
Spivey, M. J., & Spirn, M. J. (2000). Selective visual attention modulates the direct tiltaftereffect. Perception and Psychophysics, 62(8), 1525–1533.
Treue, S., & Martinez-Trujillo, J. C. (1999). Feature-based attention influencesmotion processing gain in macaque visual cortex. Nature, 399(6736), 575–579.
Wichmann, F. A., & Hill, N. J. (2001). The psychometric function: I. Fitting, sampling,and goodness of fit. Perception and Psychophysics, 63(8), 1293–1313.
Yantis, S. (2000). Goal-directed and stimulus-driven determinants of attentionalcontrol. In S. Monsell & J. Driver (Eds.), Attention and performance XVIII.Cambridge, MA: MIT Press.