metamodels and feature models
TRANSCRIPT
HAL Id: tel-01416129https://tel.archives-ouvertes.fr/tel-01416129v2
Submitted on 29 May 2017
HAL is a multi-disciplinary open accessarchive for the deposit and dissemination of sci-entific research documents, whether they are pub-lished or not. The documents may come fromteaching and research institutions in France orabroad, or from public or private research centers.
L’archive ouverte pluridisciplinaire HAL, estdestinée au dépôt et à la diffusion de documentsscientifiques de niveau recherche, publiés ou non,émanant des établissements d’enseignement et derecherche français ou étrangers, des laboratoirespublics ou privés.
Metamodels and feature models : complementaryapproaches to formalize product comparison matrices
Guillaume Bécan
To cite this version:Guillaume Bécan. Metamodels and feature models : complementary approaches to formalize productcomparison matrices. Software Engineering [cs.SE]. Université Rennes 1, 2016. English. �NNT :2016REN1S116�. �tel-01416129v2�

ANNÉE 2016
THÈSE / UNIVERSITÉ DE RENNES 1sous le sceau de l’Université Bretagne Loire
pour le grade de
DOCTEUR DE L’UNIVERSITÉ DE RENNES 1
Mention : informatique
École doctorale MATISSE
présentée par
Guillaume Bécan
préparée à l’unité de recherche IRISA (UMR 6074)
Institut de Recherche en Informatique et Systèmes AléatoiresISTIC
Metamodels and
Feature Models:
Complementary
Approaches to
Formalize Product
Comparison Matrices
Thèse soutenue à Rennesle 23 septembre 2016
devant le jury composé de :
Laurence DUCHIENProfesseur, Université de Lille 1 / rapporteur
Andrzej WĄSOWSKIAssociate Professor, IT University / rapporteur
Felienne HERMANSAssistant Professor, Delft University of Technology/ examinateur
Olivier RIDOUXProfesseur, Université de Rennes 1 / examinateur
Mathieu ACHERMaître de conférence, Université de Rennes 1 /examinateur
Benoit BAUDRYChargé de recherche, Inria / directeur de thèse


Résumé en français
J’ai testé toutes les langues, j’ai une faiblesse pour lefrançais. C’est une langue merveilleuse.
Le Mérovingien
Contexte
À l’horizon 2020, on estime la quantité de données utiles dans le monde à 16 zettaoctets [55]. Laplupart de cette information n’est pas structurée et est disponible dans divers formats (p. ex.tableurs, JSON, XML, texte). Elle est souvent créée par de nombreux contributeurs sans qu’ilsutilisent de standards ou suivent de règles. De nombreux exemples existent sur le web tels queles wikis (p. ex. Wikipedia), les fichiers vidéos et audios ou les interfaces de programmation desservices web [53,55].
Toutes ces données non structurées complexifient l’ingénierie de logiciels pouvant traiter ces in-formations. La diversité des formats impose le développement de logiciels suffisamment génériquespour être facilement adaptés à ceux-ci. Un premier défi est donc de gérer l’hétérogénéité des for-mats. En plus de leurs formats, les données recèlent des informations importantes que nous devonscomprendre afin de pouvoir les traiter. Cependant, le manque de structure cache la sémantique desinformations. Un deuxième défi est d’extraire la sémantique des données. Les problèmes causéspar l’hétérogénéité des formats et le manque de structures sont exacerbés par l’incroyable quantitéde données disponibles sur le web. Un troisième défi est de devélopper des logiciels qui passent àl’échelle et peuvent donc gérer une grande quantité de données. Enfin, pour exploiter toutes cesinformations, les utilisateurs ont besoin de visualiser, transformer, comparer, explorer, chercher etéditer ces données. Par conséquent, nous devons traiter les mêmes données dans des services var-iés. Un quatrième défi est de développer des abstractions et des algorithmes qui peuvent supporterl’hétérogénéité des services.
Dans cette thèse, nous étudions le cas de ce que l’on appelle les Matrices de Comparaisonde Produits (MCP). Les MCP sont largement utilisés pour documenter et comparer un ensemblede produits. Leur objectif est de modéliser la variabilité contenue dans ces produits, c’est à direcomment les produits diffèrent les uns des autres. Les MCP abondent sur le web et sont disponiblesdans plusieurs formats (p. ex. HTML ou CSV). Cependant, le support des MCP dans les logicielsest très limité. Ce sont donc des données utiles, non structurées mais rarement exploitées. Ellesforment un cas d’étude intéressant pour les défis mentionnés précédemment. Nous présentonsà présent ce que sont les MCP, pourquoi elles défient l’ingénierie logicielle et quelles sont noscontributions pour répondre à ces défis.
Matrices de comparaison de produits
Tous les jours, nous faisons des choix. Que ce soit pour l’achat d’une voiture, d’une veste, pourchoisir une destination pour les vacances de cet été ou bien juste pour décider quoi cuisiner pource soir, à un moment, nous devons prendre une décision. Pour nous aider à prendre des décisions,nous définissons habituellement un ensmble de critères et nous recueillons les informations relatives
iii

iv RÉSUMÉ EN FRANÇAIS
à chaque solution possible à la question. Ensuite, nous comparons les solutions d’après ces informa-tions et finalement nous prenons notre décision. Quand le nombre et la complexité des solutions descritères augmentent, la quantité d’information devient plus difficile à traiter. Par exemple, choisirun téléphone parmis tous les téléphones existants en comparant toutes leurs caractéristiques estune tâche particulièrement difficile et longue. Nous finissons souvent par ignorer certaines marqueset nous basons notre choix sur des caractéristiques extravagantes. Cela peut aboutir à un mauvaischoix.
Pour éviter d’être submergé, une solution courante est d’organiser et résumer ces informationsdans ce que l’on appelle une MCP. Une MCP documente un ensemble de produits (les solutionspossibles à la question) par rapport à un ensemble de caractéristiques (critères). La MCP1 du hautde la Figure 1.1 documente 5 téléphones (représentés par les lignes) par rapport à 4 caractéristiques(représentées par les colonnes). Par exemple, elle indique que le poids du premier téléphone a unevaleur de 178g. La représentation matricielle d’une MCP fournit un format simple, générique etconsis pour documenter une ligne de produit, c’est à dire un ensemble de produits partageant despoints communs et présentant de la variabilité.
Une MCP n’est pas un artefact contemplatif. Son potentiel principal se révèle être la capacitéde comparer, configurer ou recommender des produits. Une activité indisociable est la créationet la maintenance de la MCP elle même. Afin de supporter ces activités, nous avons besoin devisualiser, requêter, raisonner, traiter, importer et éditer des MCP. De plus, les MCP abondentsur le web. Ainsi, elles forment une grande source d’informations à propos de nombreux sujets,attendants d’être exploitées.
Énoncé du problème
Malgré sa simplicité apparente, il peut être difficile de créer ou exploiter une MCP. Le manquede formalisation provoque la présence d’informations ambigües, hétérogènes et incertaines dans lesMCP. La situation est exacerbée par la présence de nombreuses MCP disponibles sur le web. Unexemple typique d’ambiguité dans les MCP est la cellule vide. Une cellule sans aucun contenu peutêtre interprétée de diverses façons. Une première interprétation possible est l’absence d’information.Une autre est la non pertinence d’une caractéristique pour un produit particulier (p. ex. si untéléphone n’a pas d’appareil photo, la résolution de l’appareil photo n’est pas pertinente et aucunevaleur ne peut être fournie). Une cellule vide peut aussi montrer l’absence d’une caractéristiqueen contraste avec une marque distinctive (p. ex. une croix) montrant la présence de celle-ci dansd’autres cellules.
Pour illustrer l’hétérogénéité, nous pouvons penser au prix d’un produit. Le prix peut êtrereprésenté dans différentes monnaies, dans différentes échelles ou via des représentation symbol-iques. Dans tous les cas, le prix est clairement indiqué mais comparer ou traiter ces représentationshétérogènes peut être difficile.
Enfin, un créateur de MCP peut ne pas spécifier toutes les informations d’une manière précise.Par exemple, une application pour partager des photos peut supporter la communication Bluetoothuniquement pour recevoir des photos. Si cette information est représentée comme "partiellementsupportée" pour la caractéristique Bluetooth d’une MCP, alors l’information est incertaine.
En outre, la nature des cellules des MCP et leurs relations sont souvent implicites. Dans lesformats usuellement utilisés pour les MCP (p. ex. HTML, CSV ou Excel), il n’y a pas de notationspéciale pour spécifier si une cellule est un produit, une caractéristique ou simplement des données.De plus, la relation entre une cellule et le produit et la caractéristique correspondante est réaliséepar la position de la cellule. Cela veut dire que la sémantique de la MCP est liée à sa syntaxe.
Tous ces éléments créent un fossé syntaxique et sémantique entre la représentation concrèted’une MCP et son interprétation humaine. Ce fossé impacte 3 catégories d’utilisateurs. Les édi-teurs de MCP ne manipulent pas les concepts qui sont les plus proches de leur travail mais descellules génériques qui ne portent pas de sémantique particulière. Les développeurs qui souhait-ent implémenter un service ou dériver des analyses de données à partir d’une MCP sont impactéspar l’ambiguité et l’incertitude de la matrice. Cette complexité rend difficile le développement
1C’est un extrait d’une MCP de Wikipedia disponible sur https://en.wikipedia.org/wiki/Comparison_of_
smartphones

v
de capacités de requête et de raisonnement. De plus, le manque de concepts explicites requiertl’inférence des produits et des caractéristiques à chaque fois qu’ils sont nécessaires. Enfin, les util-isateurs finaux doivent comprendre et extraire des informations utiles depuis des MCP ambigües,incertaines et hétérogènes. La comparaison d’un petit ensemble de produits peut vite devenir unetâche difficile.
En conséquence, les services fournis avec les MCP en lignes sont plutôt limités. Les sites webn’offrent pas toujours des opérations basiques de filtrage et de tri. Les MCP qui viennent avec desservices innovants sont rares et abordent des types de produits spécifiques tels que les téléphonesou les drones. Pour surmonter ces problèmes, la formalisation des MCP est cruciale. Ainsi, laquestion principale de cette thèse est:
Comment formaliser les matrices de comparaison de produits?
Nous envisageons deux solutions pour répondre à notre question. La première consiste à for-maliser directement les MCP via une approche basée sur les modèles (cf. partie gauche de laFigure 1.1). La seconde projette les MCP vers un autre formalisme : la modélisation de carac-téristiques (cf. partie droite de la Figure 1.1). Les publications associées à nos contributions sontlistées à la page 145.
Formalisation de MCP via méta-modélisation
Approche
Avec leurs représentations matricielles, les MCP peuvent être perçues comme une forme spécialede tableaux. De nombreux modèles de tableaux [85,175,184] et techniques de formalisation ont étéproposés [24,51,57,95,167,183,192]. De même, les MCP peuvent aussi être considérées comme destableurs spécifiques. De considérables efforts de recherche ont été dédiés à l’étude des tableurs [15,56,68,69,86,94]. À la fois dans le domaine du traitement de tableaux et celui des tableurs, l’analysede l’état de l’art montre qu’il n’existe aucun formalisme dédié aux MCP. Les modèles de tableauxou de tableurs sont trop génériques (p. ex. le modèle de Wang [184]) ou manquent d’expressivité(p. ex. le modèle relationnel [64]). De plus, ils ne parviennent pas à représenter exactement lasémantique des cellules présentes dans les MCP, qui constitue un important aspect de ces matrices.
Pour répondre à ce manque de formalisme, nous étudions l’utilisation d’une approche basée surles modèles pour notre première solution (cf. partie gauche de la Figure 1.1). Avec une approchebasée sur les modèles, nous pouvons précisemment définir la structure et la sémantique d’une MCP.Nous pouvons aussi définir ou dériver des structures appropriées pour requêter, raisonner et editerdes modèles de MCP. C’est particulièrement intéressant pour faciliter les différentes activités liéesaux MCP.
L’élément central de notre première solution est un méta-modèle du domaine des MCP (cf.partie gauche de la Figure 1.1). Ce méta-modèle de domaine définit la structure et la sémantiquedes MCP. Un modèle qui est conforme à ce méta-modèle représente une formalisation d’une MCPparticulière. Afin de faciliter la formalisation, nous développons des techniques automatiques quitransforment une MCP en un modèle de MCP [9].
Défis
L’élaboration d’une approche basée sur les modèles pour les MCP est une tâche difficile. Il n’y apas d’expert mais plutôt une multitude de contributeurs qui créent des MCP sans suivre de règlesgénérales. Il n’existe pas non plus de format commun sur lequel nous pouvons nous baser pourconstruire notre méta-modèle. Par conséquent, il y a un manque d’oracle pour nous assurer quenotre formalisation est correcte.
En outre, le web contient au moins des milliards de tableaux qui sont potentiellement desMCP [51]. Construire un oracle manuellement semble donc non réaliste. Ce serait un travail trèslong et nous n’avons aucun moyen pour nous assurer que l’oracle couvre toute la complexité etdiversité des MCP.
Pour construire notre approche, nous avons besoin d’explorer manuellement des exemplesreprésentatifs de MCP. Un premier défi est de choisir un ensemble de MCP qui est intéressant
vi RÉSUMÉ EN FRANÇAIS
pour la conception de notre méta-modèle et assez petit pour être gérable par un humain. Undeuxième défi est de tester notre approche sur de nombreuses MCP afin de vérifier sa précision etsa robustesse. Un troisième défi est de concevoir un méta-modèle qui peut à la fois représenterprécisemment le domaine des MCP et être la base pour le développement de services. Relever cesdéfis est essentiel pour construire une formalisation des MCP qui est précise et appropriée pour lesutilisateurs finaux.
Contribution : une approche basée sur les modèles pour la formalisationde MCP
Un processus itératif guidé par les données, les utilisateurs et les services
Afin de relever les défis précédents, nous proposons un processus itératif guidé par les données,les utilisateurs et les services afin de concevoir notre meta-modèle et notre transformation. Leprocessus se base sur la transformation automatique d’un grand ensemble de MCP en modèlesde MCP. Nous utilisons Wikipedia comme source de MCP. L’encyclopédie contient plus de 1 500000 tableaux qui sont potentiellement des MCP. La diversité des domaines et des contributeursimpliqués dans Wikipedia fait de l’encyclopédie un cas d’étude intéressant.
Pour initier notre processus, nous analysons manuellement des dizaines de MCP venant deWikipedia afin de construire une première version de notre méta-modèle et de notre transformation.Ensuite, les modèles obtenus via cette transformation sont évalués selon :
• des analyses automatiques basées sur des statistiques et des tests métamorphiques [59]
• une vérification manuelle par des utilisateurs finaux
• les commentaires de développeurs de services basés sur notre méta-modèle
À partir de cette évaluation, nous affinons notre meta-modèle et notre transformation. Finale-ment, nous appliquons la nouvelle transformation sur notre ensemble de MCP et donc nous itéronsnotre processus.
Notre processus permet d’explorer automatiquement un grand ensemble d’exemples de MCP.L’évaluation des modèles de MCP nous permet d’identifier des MCP qui ne sont pas encore sup-portées par notre approche. Ainsi, cela guide la sélection de MCP à analyser manuellement. Enrésumé, notre processus itératif facilite la conception d’une approche basée sur les modèles pourun grand ensemble d’exemples de données.
Une solution de modélisation appropriée et précise pour les MCP
En suivant notre processus itératif, nous développons un ensemble de meta-modèles et de transfor-mations pour la formalisation des MCP. L’élément central de notre approche est un meta-modèledu domaine des MCP [9]. Ses concepts principaux sont les caractéristiques, les produits et lescellules. Cela correspond à l’aspect ligne de produits d’une MCP. De plus, il contient un ensemblede concepts pour définir précisemment la sémantique des cellules.
Afin de transformer des MCP en modèles de MCP, nous développons des algorithmes génériquespour détecter les types de cellules, l’orientation d’une MCP et extraire les différent concepts denotre meta-modèle. Ces algorithmes se basent sur un ensemble d’heuristiques inspirées des travauxdu domaine du traitement de tableaux [57,183].
En complément du meta-modèle du domaine, nous proposons un ensemble de meta-modèlesspécifiques à une tâche. Ils permettent de réduire l’effort pour développer des services concer-nant la manipulation, l’édition, l’import et l’export de MCP. À partir de ces meta-modèles, nousimplémentons de nombreux services dédiés aux MCP tels qu’un éditeur, un comparateur, un con-figurateur et des visualisations [10]. Nous développons aussi des importeurs et des exporteurs deMCP dans les formats HTML, CSV et Wikipedia.
Toutes nos contributions sont intégrées dans OpenCompare, un projet dédié à la formalisationet l’exploitation de MCP. OpenCompare est fournit sous license logicielle libre et disponible suropencompare.org.
vii
Les commentaires donnés par 20 chercheurs et ingénieurs montrent que notre meta-modèle dudomaine contient les concepts nécessaires pour la formalisation des MCP. L’évaluation de notretransformation sur 75 MCP venant de Wikipedia montre que nous sommes capable de formaliserautomatiquement plus de 90% de leurs cellules. De plus, nous sommes capables de traiter la totalitéde la version anglaise de Wikipedia et d’en extraire 1,5 millions de modèles de MCP. À partir de cetensemble de données, nous pouvons importer et exporter 91% de modèles de MCP dans les formatsHTML, CSV et Wikipedia. Cela montre que nos techniques supportent une grande diversité deMCP.
Finalement, les commentaires encourageants recueillis pendant nos nombreuses expériences dedéveloppement montrent la capacité de nos meta-modèles à fournir les concepts appropriés pourle développement d’analyses génériques de support outillé pour les MCP.
En résumé, la conception de notre approche est guidée par les données, le développement deservices et les commentaires de divers utilisateurs. Par conséquent, notre formalisation est précise,exploitable par des services et appropriée pour les utilisateurs finaux.
Formalisation de MCP via la synthèse de modèles de carac-téristiques
Approche
Comme expliqué précédemment, une MCP est une représentation d’une ligne de produit. Plusieurslangages peuvent être utilisés pour documenter une ligne de produits (p. ex. les modèles decaractéristiques, les modèles de décision ou les tableurs). La norme de facto est le modélisation decaractéristiques [46]. La sémantique claire des Modèles de Caractéristiques (MC) est appropriéepour atteindre notre objectif de formaliser les MCP. De plus, avoir un MC permet l’utilisation detechniques existantes et avancées pour le raisonnement sur les lignes de produits ou la générationde nouveaux artefacts. Par exemple, les MC peuvent être utilisés pour la vérification de modèlesappliquée à une ligne de produits logiciels [172], la configuration automatique de produits [98],le calcul d’informations pertinentes [43], la communication avec des parties prenantes [45] ou lagénération d’artefacts [31]. Par conséquent, nous étudions la synthèse de MC à partir de MCPpour notre seconde solution à l’objectif de cette thèse (cf. partie droite de la Figure 1.1).
Défis
Nous observons que la grande majorité des travaux sont consacrés à la synthèse de MC booléensà partir d’artefacts variés (p. ex. formules propositionnelles, descriptions de produits textuellesou code source) [18, 29, 77, 78, 100, 101, 115, 125, 126, 165] Une limite importante des algorithmesde synthèse de MC est le fait qu’ils privilégient souvent la précison plutôt que la qualité ou viceversa. Ainsi, le MC synthétisé ne représente pas exactement la ligne de produit et en même tempsprésente une hiérarchie appropriée. Le manque de précision aboutit à des produits non explorés ounon existants. Une hiérarchie approximative impacte négativement la lisibilité et l’exploitation d’unMC. De plus, les MC booléens ne parviennent pas à représenter le contenu des MCP qui se basentsouvent sur des informations numériques ou textuelles (cf. partie supérieure de la Figure 1.1).
La précision, qualité et expressivité des MC synthétisés via les techniques existantes ne sontpas suffisantes pour la formalisation des MCP. Il y a un fossé syntactique et sémantique clair entreles MCP et les MC. Un premier défi est de caractériser ce fossé et identifier un formalisme demodélisation de caractéristiques approprié qui est capable d’encoder les MCP. Un deuxième défiest de développer une technique de synthèse de MC précise, efficace et automatique capable decombler ce fossé. Enfin, un troisième défi est de tenir compte de la connaissance du domaine et del’utilisateur afin d’obtenir un MC compréhensible.
viii RÉSUMÉ EN FRANÇAIS
Contribution : un algorithme de synthèse pour les modèles de caractéris-tiques attribués
Pour réduire le fossé entre les MC et les MCP, nous identifions une classe de MCP que nousappellons les matrices de configurations. Les matrices de configurations présentent une structuresimple. Les caractéristiques sont représentées dans la première ligne et les produits le sont dansles lignes suivantes. Chaque cellule contient une seule valeur dont la sémantique est non ambigüe.Parmi les millions de MCP que nous analysons pendant cette thèse, 86.4% présentent la mêmestructure simple. De plus, une grande part des cellules que nous avons observées contiennent unevaleur booléenne, numérique ou textuelle précise qui pourrait être encodée dans une matrice deconfigurations. Ainsi, nous considérons les matrices de configurations comme étant l’entrée denotre algorithme de synthèse.
L’expressivité des matrices de configurations est supérieure à l’expressivité des MC. Pour com-plètement supporter ces matrices, nous étudions la synthèse de MC Attributés (MCA), une exten-sion des MC qui peut exprimer des informations booléennes et numériques ainsi que des énuméra-tions.
Pour répondre aux défis précédents, nous proposons la première technique pour synthétiserun MCA à partir de matrices de configurations [5]. Nous développons un ensemble d’algorithmespour raisonner sur les matrices de configurations afin de synthétiser les éléments qui composent unMCA. Nous présentons en particulier un algorithme pour extraire des contraintes sur les attributsà partir de la matrice.
Pour améliorer la qualité des MCA résultants, nous développons un ensemble d’heuristiqueslogiques et ontologiques afin de guider la sélection de la hiérarchie du MCA [3]. Un algorithme debranchement optimal assure que la hiérarchie est légale par rapport à la matrice prise en entrée.Nous proposons aussi un environnement intéractif pour compléter l’information sur les heuristiquesgrâce à l’utilisateur [7].
Notre évaluation sur 126 MC venant de domaines variés et 30 MC extrait à partir de MCP,démontre qu’une approche hybride, mélangeant des techniques ontologiques et logiques, fournitle meilleur support pour synthétiser un MC. Nous faisons aussi une évaluation empirique afin detester le passage à l’échelle de notre approche en utilisant à la fois des matrices de configurationsaléatoires et des exemples réels. Les résultats de notre évaluation montrent que notre approchepeut gérer des matrices de configurations contenant jusqu’à 2 000 caractéristiques attribuées et200 000 configurations distinctes en quelques minutes. En résumé, notre algorithme permet deproduire efficacement un MCA précis et de haute qualité à partir d’une matrice de configurations.
Deux approches complémentaires
Avec nos contributions, nous donnons une description claire du domaine et des méthodes pré-cises pour la formalisation de MCP existantes. Notre première solution constitue une approchegénérique et efficace pour la formalization des MCP. La structure logique représentée par notreméta-modèle du domaine est proche de la représentation matricielle habituelle des MCP. De plus,notre méta-modèle fournit les concepts nécessaires pour formaliser la sémantique variée des cellules.Ainsi, notre première solution facilite le développement de techniques fondamentales d’édition, demanipulation et de visualisation.
Notre seconde solution adopte une structure complètement différente qui met l’accent sur lescaractéristiques et leurs relations plutôt que sur les produits. Cela permet de passer à des tech-niques d’ingénierie de lignes de produits. La sémantique formelle des MCA ouvre à l’utilisation detechniques avancées existantes pour le raisonnement. Cependant, notre seconde solution ne peutêtre appliquée uniquement sur une classe de MCP. De plus, la transition d’un modèle de MCP àun MCA peut potentiellement demandé un effort important à la fois de calcul et pour l’utilisateur.Nos solutions fournissent deux vues différentes sur le même MCP et peuvent supporter différentsservices. Ce sont deux approches complémentaires pour la formalisation de MCP.
En créant deux approches pour le même problème, nous pouvons mettre en avant le compromisentre les deux solutions. Notre travail ouvre de nouvelles perspectives pour le développement deservices innovants à partir de MCP extrait de sources variées. Nous fournissons aussi les abstrac-

ix
tions et les algorithmes nécessaires au développement de transformations vers d’autres formalismestels que les MC, les ontologies et les tableurs. En résumé, nous fournissons une approche génériqueet extensible pour la formalisation et l’exploitation de MCP.


Abstract
Product Comparison Matrices (PCMs) are widely used for documenting or comparing a set ofproducts. They provide a compact representation of the characteristics or features of the productsin the form of a product by feature matrix. The expected benefits of such simple format are theease of use and definition. However, there exist no standard, guidelines or specific tool supportfor creating PCMs. The various domains addressed in PCMs and the numerous contributors leadsto a large diversity in the structure and content of these matrices. This creates a syntactic andsemantic gap between the concrete representation of a PCM and its human interpretation. Toaddress this problem, the objective of this thesis is to develop techniques for formalizing PCMs.We explore two possible solutions to reach our objective.
Our first solution is to directly model PCMs through the use of a model-based approach. Thecentral element of our approach is a domain metamodel that defines the structure and semanticsof PCMs. It is completed by a set of transformations for automatically formalizing existing PCMsinto PCM models. In our context, the elaboration of a model-based approach is a challenging task.The lack of standard or oracle hinders the evaluation of our approach. The presence of potentiallymillions of PCMs on the Web makes the manual building of an oracle unrealistic. To addressthese challenges, we propose an iterative process driven by data, end-users and services. It helpsto evaluate our approach on a large number of PCMs while guiding the selection of a few PCMsto manually analyze. To ease the development of services on top of PCM models, we also createtask-specific metamodels in relation to the edition, manipulation, import and export of PCMs.
Our second solution is the synthesis of Feature Models (FMs) from PCMs. Similarly to PCMs,FMs represent product lines which are sets of products sharing commonalities and presentingvariabilities. FMs are the most widespread formalism for modeling product lines. They allowto develop reasoning capabilities and numerous applications such as generating comparators orconfigurators which can be beneficial for PCMs. Yet FMs provide a different view on a product linethan PCMs. PCMs also contain types of data that cannot be represented by FMs. To address thisproblem, we consider as input of our algorithm, a class of PCMs that we call configuration matrices.Such matrices present a simple structure and contain data that can be represented by FMs. Wealso target an extension of FMs called Attributed FMs (AFMs) as output of our algorithm. AFMsallow the modeling of common types of data in PCMs such as booleans, numbers and enumerations.The analysis of the state of the art reveals that there exist no algorithm for synthesizing AFMs.Moreover, existing synthesis techniques often foster precision over quality of the resulting FM orvice versa. This hinders the exploitation of the generated FM. We improve state of the art of FMsynthesis with techniques that produce FMs that both exactly represent the information containedin the input and exhibit a meaningful hierarchy. Then, we extend this technique to produce AFMsfrom configuration matrices. These improvements contribute to allow a qualitative and preciseformalization and exploitation of a class of PCMs through the use of AFMs.
With our contributions, we provide two generic, extensible and complementary approaches forthe formalization and exploitation of PCMs. This is a first step towards the creation of a communityof users and contributors of PCMs. It opens new perspectives for the development of innovativeservices on top of PCMs coming from various sources.
xi

Contents
Résumé en français iii
Abstract xi
1 Introduction 1
1.1 Context . . . . . . . . . . . . . . . . . . . . . . . . . . . . . . . . . . . . . . . . . . 11.2 Product Comparison Matrices . . . . . . . . . . . . . . . . . . . . . . . . . . . . . . 11.3 Problem Statement . . . . . . . . . . . . . . . . . . . . . . . . . . . . . . . . . . . . 21.4 Formalizing PCMs Via Metamodeling . . . . . . . . . . . . . . . . . . . . . . . . . 3
1.4.1 Approach . . . . . . . . . . . . . . . . . . . . . . . . . . . . . . . . . . . . . 31.4.2 Challenges . . . . . . . . . . . . . . . . . . . . . . . . . . . . . . . . . . . . 41.4.3 Contribution: A Model-Based Approach for the Formalization of PCMs . . 4
1.5 Formalizing PCMs Via the Synthesis of Feature Models . . . . . . . . . . . . . . . 51.5.1 Approach . . . . . . . . . . . . . . . . . . . . . . . . . . . . . . . . . . . . . 51.5.2 Challenges . . . . . . . . . . . . . . . . . . . . . . . . . . . . . . . . . . . . 51.5.3 Contribution: A Synthesis Algorithm for Attributed Feature Models . . . . 6
1.6 Two Complementary Approaches . . . . . . . . . . . . . . . . . . . . . . . . . . . . 61.7 Outline . . . . . . . . . . . . . . . . . . . . . . . . . . . . . . . . . . . . . . . . . . 6
I State of the Art 9
2 Product Comparison Matrices 11
2.1 Product lines . . . . . . . . . . . . . . . . . . . . . . . . . . . . . . . . . . . . . . . 112.2 Product Comparison Matrices . . . . . . . . . . . . . . . . . . . . . . . . . . . . . . 122.3 Table Processing . . . . . . . . . . . . . . . . . . . . . . . . . . . . . . . . . . . . . 13
2.3.1 Models of Tables . . . . . . . . . . . . . . . . . . . . . . . . . . . . . . . . . 142.3.2 Extracting Table Models . . . . . . . . . . . . . . . . . . . . . . . . . . . . . 142.3.3 Large Scale Extraction of Table Models . . . . . . . . . . . . . . . . . . . . 15
2.4 Spreadsheets . . . . . . . . . . . . . . . . . . . . . . . . . . . . . . . . . . . . . . . 162.4.1 Reverse Engineering Spreadhseets . . . . . . . . . . . . . . . . . . . . . . . 162.4.2 Model-based Spreadsheets . . . . . . . . . . . . . . . . . . . . . . . . . . . . 16
2.5 Exploitation of PCMs . . . . . . . . . . . . . . . . . . . . . . . . . . . . . . . . . . 172.5.1 Main Services . . . . . . . . . . . . . . . . . . . . . . . . . . . . . . . . . . . 172.5.2 Noteworthy Implementations . . . . . . . . . . . . . . . . . . . . . . . . . . 18
2.6 Modeling PCMs . . . . . . . . . . . . . . . . . . . . . . . . . . . . . . . . . . . . . 192.6.1 Model-Driven Engineering . . . . . . . . . . . . . . . . . . . . . . . . . . . . 192.6.2 Metamodeling . . . . . . . . . . . . . . . . . . . . . . . . . . . . . . . . . . . 192.6.3 Designing a metamodel . . . . . . . . . . . . . . . . . . . . . . . . . . . . . 20
2.7 Conclusion . . . . . . . . . . . . . . . . . . . . . . . . . . . . . . . . . . . . . . . . 20
xiii
xiv CONTENTS
3 Feature Modeling 233.1 Variability Modeling . . . . . . . . . . . . . . . . . . . . . . . . . . . . . . . . . . . 23
3.1.1 Feature Models . . . . . . . . . . . . . . . . . . . . . . . . . . . . . . . . . . 233.1.2 Configuration and Ontological Semantics . . . . . . . . . . . . . . . . . . . 253.1.3 Extended Feature Models . . . . . . . . . . . . . . . . . . . . . . . . . . . . 25
3.2 Synthesis of Feature Models . . . . . . . . . . . . . . . . . . . . . . . . . . . . . . . 263.2.1 Definition and Properties . . . . . . . . . . . . . . . . . . . . . . . . . . . . 263.2.2 Synthesizing Feature Models . . . . . . . . . . . . . . . . . . . . . . . . . . 283.2.3 Reverse Engineering Feature Models . . . . . . . . . . . . . . . . . . . . . . 293.2.4 Tool support . . . . . . . . . . . . . . . . . . . . . . . . . . . . . . . . . . . 30
3.3 Conclusion . . . . . . . . . . . . . . . . . . . . . . . . . . . . . . . . . . . . . . . . 30
II OpenCompare: a Framework for Product Comparison Matrices 33
4 A Model-Based Approach Driven By Data, Users and Services 354.1 The Wikipedia Case Study . . . . . . . . . . . . . . . . . . . . . . . . . . . . . . . 354.2 Problem Statement . . . . . . . . . . . . . . . . . . . . . . . . . . . . . . . . . . . . 374.3 Challenges . . . . . . . . . . . . . . . . . . . . . . . . . . . . . . . . . . . . . . . . . 384.4 An Iterative Process Driven by Data, Users and Services . . . . . . . . . . . . . . . 38
4.4.1 Initialization . . . . . . . . . . . . . . . . . . . . . . . . . . . . . . . . . . . 394.4.2 Evaluating Our Metamodel and Transformation . . . . . . . . . . . . . . . . 394.4.3 Bootstraping . . . . . . . . . . . . . . . . . . . . . . . . . . . . . . . . . . . 40
4.5 Conclusion . . . . . . . . . . . . . . . . . . . . . . . . . . . . . . . . . . . . . . . . 40
5 Automating the Formalization of PCMs 415.1 The PCM Metamodel . . . . . . . . . . . . . . . . . . . . . . . . . . . . . . . . . . 415.2 The Transformation Chain . . . . . . . . . . . . . . . . . . . . . . . . . . . . . . . . 42
5.2.1 Parsing . . . . . . . . . . . . . . . . . . . . . . . . . . . . . . . . . . . . . . 425.2.2 Preprocessing . . . . . . . . . . . . . . . . . . . . . . . . . . . . . . . . . . . 435.2.3 Extracting Information . . . . . . . . . . . . . . . . . . . . . . . . . . . . . 44
5.3 Evaluation . . . . . . . . . . . . . . . . . . . . . . . . . . . . . . . . . . . . . . . . . 455.3.1 Experimental Settings for RQ1 and RQ2 . . . . . . . . . . . . . . . . . . . . 455.3.2 RQ1: Is our metamodel complete and relevant to the formalization of PCMs? 465.3.3 RQ2: What is the precision of our transformation of raw PCMs to PCM
models? . . . . . . . . . . . . . . . . . . . . . . . . . . . . . . . . . . . . . . 475.3.4 RQ3: Is our metamodel suited for engineering automated analyses and ser-
vices dedictated to PCMs? . . . . . . . . . . . . . . . . . . . . . . . . . . . 495.4 Threats to Validity . . . . . . . . . . . . . . . . . . . . . . . . . . . . . . . . . . . . 51
5.4.1 Internal Validity . . . . . . . . . . . . . . . . . . . . . . . . . . . . . . . . . 515.4.2 External Validity . . . . . . . . . . . . . . . . . . . . . . . . . . . . . . . . . 51
5.5 Conclusion . . . . . . . . . . . . . . . . . . . . . . . . . . . . . . . . . . . . . . . . 51
6 A Multi-Metamodel Approach 536.1 Going From One Metamodel to Multiple Metamodels . . . . . . . . . . . . . . . . 536.2 Manipulation and analysis of PCMs . . . . . . . . . . . . . . . . . . . . . . . . . . 546.3 Edition of PCMs . . . . . . . . . . . . . . . . . . . . . . . . . . . . . . . . . . . . . 556.4 Importing and Exporting PCMs . . . . . . . . . . . . . . . . . . . . . . . . . . . . 56
6.4.1 A Unified Format . . . . . . . . . . . . . . . . . . . . . . . . . . . . . . . . . 566.4.2 Importing PCMs . . . . . . . . . . . . . . . . . . . . . . . . . . . . . . . . . 576.4.3 Exporting PCMs . . . . . . . . . . . . . . . . . . . . . . . . . . . . . . . . . 58
6.5 Evaluation . . . . . . . . . . . . . . . . . . . . . . . . . . . . . . . . . . . . . . . . . 596.5.1 Experimental settings for RQ1 and RQ2 . . . . . . . . . . . . . . . . . . . . 596.5.2 RQ1: Is our metamodel complete and relevant to the formalization of PCMs? 596.5.3 RQ2: What is the precision of our transformation of raw PCMs to PCM
models? . . . . . . . . . . . . . . . . . . . . . . . . . . . . . . . . . . . . . . 61

CONTENTS xv
6.5.4 RQ3: Is our metamodel suited for engineering automated analyses and ser-vices dedictated to PCMs? . . . . . . . . . . . . . . . . . . . . . . . . . . . 62
6.6 Threats to Validity . . . . . . . . . . . . . . . . . . . . . . . . . . . . . . . . . . . . 636.6.1 Internal Validity . . . . . . . . . . . . . . . . . . . . . . . . . . . . . . . . . 636.6.2 External Validity . . . . . . . . . . . . . . . . . . . . . . . . . . . . . . . . . 65
6.7 OpenCompare: An Initiative around PCMs . . . . . . . . . . . . . . . . . . . . . . 656.8 Conclusion . . . . . . . . . . . . . . . . . . . . . . . . . . . . . . . . . . . . . . . . 65
III From Product Comparison Matrices to Feature Models 67
7 Breathing Ontological Knowledge into Feature Model Synthesis 697.1 From PCM to FM . . . . . . . . . . . . . . . . . . . . . . . . . . . . . . . . . . . . 697.2 Ontologic-aware Synthesis . . . . . . . . . . . . . . . . . . . . . . . . . . . . . . . . 71
7.2.1 The Importance of Ontological Semantics . . . . . . . . . . . . . . . . . . . 737.2.2 Ontologic-aware FM Synthesis Problem . . . . . . . . . . . . . . . . . . . . 74
7.3 Automated Techniques for Feature Hierarchy Selection . . . . . . . . . . . . . . . . 747.3.1 Sound Selection of a Hierarchy . . . . . . . . . . . . . . . . . . . . . . . . . 757.3.2 Logical Heuristics . . . . . . . . . . . . . . . . . . . . . . . . . . . . . . . . . 757.3.3 Ontological Heuristics . . . . . . . . . . . . . . . . . . . . . . . . . . . . . . 787.3.4 Logic + Ontologic = Hybrid . . . . . . . . . . . . . . . . . . . . . . . . . . 81
7.4 Tool Support . . . . . . . . . . . . . . . . . . . . . . . . . . . . . . . . . . . . . . . 817.4.1 Implementation of Ontological Heuristics . . . . . . . . . . . . . . . . . . . 827.4.2 Features of the environment . . . . . . . . . . . . . . . . . . . . . . . . . . . 827.4.3 Interactive edits of parent candidates and clusters . . . . . . . . . . . . . . 84
7.5 Evaluation . . . . . . . . . . . . . . . . . . . . . . . . . . . . . . . . . . . . . . . . . 847.5.1 Experimental Settings . . . . . . . . . . . . . . . . . . . . . . . . . . . . . . 847.5.2 RQ1: Fully Automated Synthesis . . . . . . . . . . . . . . . . . . . . . . . . 867.5.3 RQ2: Quality of ranking lists and clusters . . . . . . . . . . . . . . . . . . . 887.5.4 Summary and Discussion . . . . . . . . . . . . . . . . . . . . . . . . . . . . 94
7.6 Threats to Validity . . . . . . . . . . . . . . . . . . . . . . . . . . . . . . . . . . . . 957.6.1 External Validity . . . . . . . . . . . . . . . . . . . . . . . . . . . . . . . . . 957.6.2 Internal Validity . . . . . . . . . . . . . . . . . . . . . . . . . . . . . . . . . 95
7.7 Conclusion . . . . . . . . . . . . . . . . . . . . . . . . . . . . . . . . . . . . . . . . 96
8 Synthesis of Attributed Feature Models from Product Descriptions 998.1 From PCM to AFM . . . . . . . . . . . . . . . . . . . . . . . . . . . . . . . . . . . 99
8.1.1 Product Comparison Matrices and Feature Models . . . . . . . . . . . . . . 998.1.2 Attributed Feature Models . . . . . . . . . . . . . . . . . . . . . . . . . . . 101
8.2 Synthesis Formalization . . . . . . . . . . . . . . . . . . . . . . . . . . . . . . . . . 1028.2.1 Synthesis Parametrization . . . . . . . . . . . . . . . . . . . . . . . . . . . . 1038.2.2 Over-approximation of the Attributed Feature Diagram . . . . . . . . . . . 105
8.3 Synthesis Algorithm . . . . . . . . . . . . . . . . . . . . . . . . . . . . . . . . . . . 1058.3.1 Extracting Features and Attributes . . . . . . . . . . . . . . . . . . . . . . . 1058.3.2 Extracting Binary Implications . . . . . . . . . . . . . . . . . . . . . . . . . 1068.3.3 Defining the Hierarchy . . . . . . . . . . . . . . . . . . . . . . . . . . . . . . 1078.3.4 Computing the Variability Information . . . . . . . . . . . . . . . . . . . . . 1078.3.5 Computing Cross Tree Constraints . . . . . . . . . . . . . . . . . . . . . . . 107
8.4 Evaluation on Random Matrices . . . . . . . . . . . . . . . . . . . . . . . . . . . . 1088.4.1 Initial Experiments with Or-groups . . . . . . . . . . . . . . . . . . . . . . . 1098.4.2 Scalability with respect to the number of variables . . . . . . . . . . . . . . 1098.4.3 Scalability with respect to the number of configurations . . . . . . . . . . . 1108.4.4 Scalability with respect to the maximum domain size . . . . . . . . . . . . . 1108.4.5 Time Complexity Distribution . . . . . . . . . . . . . . . . . . . . . . . . . 111
8.5 Evaluation on Real Matrices . . . . . . . . . . . . . . . . . . . . . . . . . . . . . . . 1118.5.1 Experimental Settings . . . . . . . . . . . . . . . . . . . . . . . . . . . . . . 111

xvi CONTENTS
8.5.2 Scalability . . . . . . . . . . . . . . . . . . . . . . . . . . . . . . . . . . . . . 1128.6 Threats to Validity . . . . . . . . . . . . . . . . . . . . . . . . . . . . . . . . . . . . 1128.7 Discussion . . . . . . . . . . . . . . . . . . . . . . . . . . . . . . . . . . . . . . . . . 1138.8 Conclusion . . . . . . . . . . . . . . . . . . . . . . . . . . . . . . . . . . . . . . . . 114
IV Conclusion and Perspectives 117
9 Conclusion 1199.1 Formalizing PCMs Via Metamodeling . . . . . . . . . . . . . . . . . . . . . . . . . 1199.2 Formalizing PCMs Via the Synthesis of Feature Models . . . . . . . . . . . . . . . 1209.3 How to Formalize Product Comparison Matrices? . . . . . . . . . . . . . . . . . . . 1229.4 Towards the Formalization of Unstructured Data . . . . . . . . . . . . . . . . . . . 122
10 Perspectives 12510.1 From PCMs to FMs . . . . . . . . . . . . . . . . . . . . . . . . . . . . . . . . . . . 125
10.1.1 User Effort . . . . . . . . . . . . . . . . . . . . . . . . . . . . . . . . . . . . 12510.1.2 Extended Support of PCMs . . . . . . . . . . . . . . . . . . . . . . . . . . . 125
10.2 Metamodeling . . . . . . . . . . . . . . . . . . . . . . . . . . . . . . . . . . . . . . . 12610.2.1 Machine Learning for Metamodeling . . . . . . . . . . . . . . . . . . . . . . 12610.2.2 Comparison of Model-Based Approaches . . . . . . . . . . . . . . . . . . . . 126
10.3 Wikipedia Case Study . . . . . . . . . . . . . . . . . . . . . . . . . . . . . . . . . . 12710.4 OpenCompare . . . . . . . . . . . . . . . . . . . . . . . . . . . . . . . . . . . . . . . 127
V Appendices 129
A Detailed Results of Statistical Tests 131
B Theoretical Analysis of AFM Synthesis Algorithm 135B.1 Soundness and Completeness . . . . . . . . . . . . . . . . . . . . . . . . . . . . . . 135
B.1.1 Valid and Comprehensive Computation of Binary Implications . . . . . . . 135B.1.2 Proof of Soundness of the Synthesis Algorithm . . . . . . . . . . . . . . . . 136B.1.3 Proof of Completeness of the Synthesis Algorithm . . . . . . . . . . . . . . 136
B.2 Maximality . . . . . . . . . . . . . . . . . . . . . . . . . . . . . . . . . . . . . . . . 136B.3 Complexity analysis . . . . . . . . . . . . . . . . . . . . . . . . . . . . . . . . . . . 138
B.3.1 Extracting Features and Attributes . . . . . . . . . . . . . . . . . . . . . . . 138B.3.2 Extracting Binary Implications . . . . . . . . . . . . . . . . . . . . . . . . . 138B.3.3 Defining the Hierarchy . . . . . . . . . . . . . . . . . . . . . . . . . . . . . . 138B.3.4 Computing the Variability Information . . . . . . . . . . . . . . . . . . . . . 139B.3.5 Computing Cross Tree Constraints . . . . . . . . . . . . . . . . . . . . . . . 139B.3.6 Overall Complexity . . . . . . . . . . . . . . . . . . . . . . . . . . . . . . . . 140
List of Figures 141
List of Tables 143
Author’s publications 145
Bibliography 147
Chapter 1
Introduction
"Choice. The problem is choice."
Neo
1.1 Context
The amount of useful data in the world is estimated to be 16 zettabytes in 2020 [55]. Most of thisinformation is unstructured and comes in a variety of formats (e.g. spreadsheets, JSON, XML,text). It is often created by numerous contributors without using standards or following guidelines.Examples abound on the Web such as wikis (e.g. Wikipedia), video and audio files or web servicesAPIs [53,55].
All this unstructured data challenges the engineering of software that can process this informa-tion. The variety of formats requires to develop software that is generic enough to be easily adaptedto new formats. A first challenge is thus to handle the heterogeneity of formats. In addition toits format, the data holds important information that we need to understand in order to be ableto process it. However, the lack of structure hides the semantics of the information. A secondchallenge is to extract the semantics of the data. The problems caused by the heterogeneity offormats and the lack of structure are exacerbated by the incredible amount of data available onthe Web. A third challenge is to develop scalable software that can manage a large amount ofdata. Finally, to exploit all this information, users need to visualize, transform, compare, explore,search and edit the data. Therefore, we need to process the same data in various services. A fourthchallenge is to develop abstractions and algorithms that can support the heterogeneity of services.
In this thesis, we study the case of what we call Product Comparison Matrices (PCMs). PCMsare widely used for documenting and comparing a set of products. Their objective is to modelthe variability contained in these products, i.e. how the products differ from each other. Theyabound on the Web and come in a variety of formats (e.g. HTML or CSV). Yet, the support ofPCMs in software is extremely limited. As such, they are useful and unstructured data but rarelyexploited. They form an interesting use case for the challenges mentioned previously. We nowpresent what are PCMs, why they challenge software engineering and what are our contributionsto address these challenges.
1.2 Product Comparison Matrices
Everyday, we make choices. Whether we want to buy a car or a jacket, choose a destination forthis summer’s holidays or just decide what to cook for tonight, at some point, we need to takea decision. To help us taking decisions, we usually define a set of criteria and gather the relatedinformation for each possible solution of the question. Then, we compare the solutions based onthis information and finally we take our decision. As the number and complexity of solutions and
1

2 CHAPTER 1. INTRODUCTION
criteria increase, the amount of information becomes harder to process. For instance, choosingthe appropriate smartphone among all the existing ones by comparing all their characteristics is aparticularly difficult and time-consuming task. We often end up ignoring some arbitrary brandsand base our choice on fancy features. This may lead us to the wrong choice.
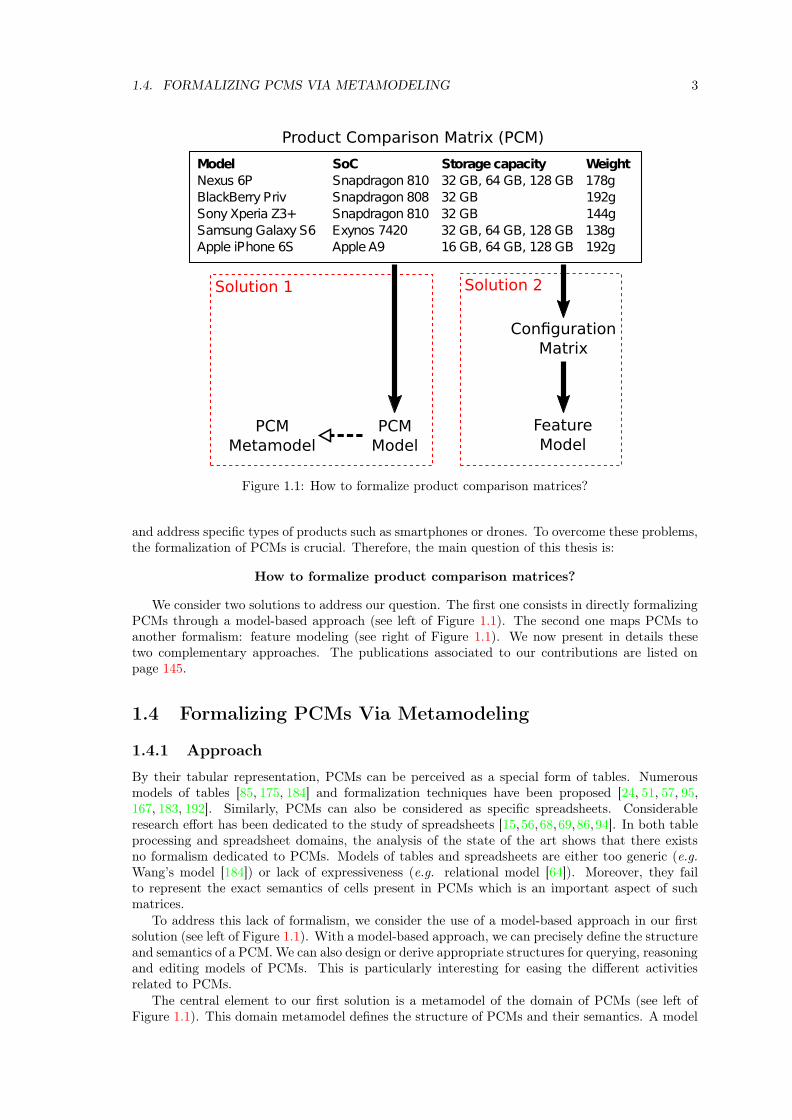
To avoid being overwhelmed, a common solution is to organize and summarize this informationin what we call a PCM. A PCM documents a set of products (possible solutions to the question)regarding a set of features (criteria). The PCM1 at the top of Figure 1.1 documents 5 smartphones(represented as rows) according to 4 features (represented as columns). For example, it indicatesthat the weight of the first smartphone has a value of 178g. The tabular representation of a PCMprovides a simple, generic and concise format for documenting a product line, i.e. a set of productssharing commonalities and presenting variabilities.
A PCM is not a contemplative artifact. Its main potential lies in the ability to compare,configure or recommend products. A related and inevitable activity is the creation and maintenanceof the PCM itself. In order to support all these activities, we need to visualize, query, reason,process, import and edit PCMs. Moreover, PCMs abound on the Web. As such, they form a greatsource of information about numerous subjects, waiting to be exploited.
1.3 Problem Statement
Despite their apparent simplicity, it can be cumbersome to create or exploit PCMs. The lack offormalization causes PCMs to contain ambiguous, heterogeneous and uncertain information. Thesituation is exacerbated by the presence of numerous PCMs available on the Web. A typical exam-ple of ambiguity in PCMs is the empty cell. A cell with absolutely no content can be interpretedin various ways. A first possible interpretation is the absence of information. Another one is theirrelevance of the feature for a particular product (e.g. if a smartphone has no camera, the reso-lution of the camera is irrelevant and no value can be provided). An empty cell can also denotethe absence of a feature in contrast to a distinctive mark (e.g. a cross) noting the presence of thisfeature in other cells.
To illustrate heterogeneity, we can think about the price of a product. The price can berepresented in different currencies, in different scales or with symbolic representations. In allcases, the price is clearly stated but comparing or processing heterogeneous representations can bedifficult.
Finally, a creator of a PCM may not specify all the information in a precise manner. Forinstance, an application for sharing pictures may support Bluetooth communication only for re-ceiving pictures. If this information is represented as "partially supported" for the feature Bluetooth
communication of a PCM, then the information is uncertain.In addition, the nature of cells in PCMs and their relations are often implicit. In common
formats used for PCMs (e.g. HTML, CSV or Excel), there is no special notation to specify if a cellis a product, a feature or simple data. Moreover, the relation between a cell and its correspondingproduct and feature is realized by the position of the cell. It means that the semantics of the PCMis based on its syntax.
All these elements create both a syntactic and semantic gap between the concrete representationof a PCM and its human interpretation. This gap impacts 3 kinds of users. Editors of PCMs donot manipulate the concepts that are the closest to their task but generic cells that carry no specificsemantics. Developers that want to implement a service or derive data analysis from a PCM areimpacted by its ambiguity and uncertainty. This complexity hinders the development of queryingand reasoning capabilities. Moreover, the lack of explicit concepts requires to infer products andfeatures each time they are needed. Finally, end-users have to understand and extract usefulinformation from an ambiguous, uncertain and heterogeneous PCM. The comparison of a small setof products can quickly become a tedious task.
As a result, the services provided with online PCMs are rather limited. Websites do not alwaysoffer basic filtering and sorting capabilities. The PCMs that come with innovative services are rare
1This is an excerpt of a PCM from Wikipedia available at https://en.wikipedia.org/wiki/Comparison_of_
smartphones
1.4. FORMALIZING PCMS VIA METAMODELING 3
Feature
ModelPCM
Model
Model SoC Storage capacity Weight
Nexus 6P Snapdragon 810 32 GB, 64 GB, 128 GB 178g
BlackBerry Priv Snapdragon 808 32 GB 192g
Sony Xperia Z3+ Snapdragon 810 32 GB 144g
Samsung Galaxy S6 Exynos 7420 32 GB, 64 GB, 128 GB 138g
Apple iPhone 6S Apple A9 16 GB, 64 GB, 128 GB 192g
Configuration
Matrix
Solution 1 Solution 2
PCM
Metamodel
Product Comparison Matrix (PCM)
Figure 1.1: How to formalize product comparison matrices?
and address specific types of products such as smartphones or drones. To overcome these problems,the formalization of PCMs is crucial. Therefore, the main question of this thesis is:
How to formalize product comparison matrices?
We consider two solutions to address our question. The first one consists in directly formalizingPCMs through a model-based approach (see left of Figure 1.1). The second one maps PCMs toanother formalism: feature modeling (see right of Figure 1.1). We now present in details thesetwo complementary approaches. The publications associated to our contributions are listed onpage 145.
1.4 Formalizing PCMs Via Metamodeling
1.4.1 Approach
By their tabular representation, PCMs can be perceived as a special form of tables. Numerousmodels of tables [85, 175, 184] and formalization techniques have been proposed [24, 51, 57, 95,167, 183, 192]. Similarly, PCMs can also be considered as specific spreadsheets. Considerableresearch effort has been dedicated to the study of spreadsheets [15,56,68,69,86,94]. In both tableprocessing and spreadsheet domains, the analysis of the state of the art shows that there existsno formalism dedicated to PCMs. Models of tables and spreadsheets are either too generic (e.g.Wang’s model [184]) or lack of expressiveness (e.g. relational model [64]). Moreover, they failto represent the exact semantics of cells present in PCMs which is an important aspect of suchmatrices.
To address this lack of formalism, we consider the use of a model-based approach in our firstsolution (see left of Figure 1.1). With a model-based approach, we can precisely define the structureand semantics of a PCM. We can also design or derive appropriate structures for querying, reasoningand editing models of PCMs. This is particularly interesting for easing the different activitiesrelated to PCMs.
The central element to our first solution is a metamodel of the domain of PCMs (see left ofFigure 1.1). This domain metamodel defines the structure of PCMs and their semantics. A model

4 CHAPTER 1. INTRODUCTION
which conforms to this metamodel represents a formalization of a particular PCM. To ease theformalization, we develop automated techniques that transform a raw PCM into a PCM model [9].
1.4.2 Challenges
The elaboration of a model-based approach for PCMs is a challenging task. There is no identifiedexpert but rather a multitude of contributors creating PCMs without following general guidelines.Neither does a common format exist on which we can rely to base our metamodel. Therefore, thereis a lack of oracle to assess that our formalization is correct.
In addition, the Web contains at least billions of tables that are potentially PCMs [51]. There-fore, manually building an oracle seems unrealistic. It would be a very time-consuming task andwe have no way to ensure that the oracle covers all the complexity and diversity of PCMs.
To build our approach, we need to manually explore representative examples of PCMs. A firstchallenge is to choose a set of PCMs that is interesting for the design of our metamodel and smallenough to be manageable by a human. A second challenge is to test our approach on numerousPCMs in order to assess its precision and robustness. A third challenge is to design a metamodelthat both accurately represents the domain of PCMs and can be the basis for the developmentof services. Addressing these challenges is essential for building a formalization of PCMs that isprecise and relevant to end-users.
1.4.3 Contribution: A Model-Based Approach for the Formalization ofPCMs
An Iterative Process Driven by Data, Users and Services
To address the previous challenges, we propose an iterative process driven by data, users andservices in order to design our metamodel and transformation. The process relies on the automatedtransformation of a large dataset of PCMs into PCM models. We consider Wikipedia as a source ofPCMs for our dataset. The encyclopedia contains more than 1,500,000 tables that are potentiallyPCMs. The diversity of domains and contributors involved in Wikipedia makes it an interestingcase study.
To initiate our process, we manually analyze tens of PCMs from Wikipedia in order to build afirst version of our metamodel and transformation. Then, the models obtained with this transfor-mation are evaluated according to:
• automated analyses based on statistics and metamorphic testing [59]
• manual checking by end-users
• feedback from developers of services based on the metamodel
Based on this evaluation, we refine our metamodel and transformation. Finally, we apply thenew transformation on the dataset of PCMs and thus iterate our process.
Our process allows to automatically explore a large set of examples of PCMs. The evaluation ofthe PCM models helps us to identify PCMs that are not yet supported by our approach. Therefore,it guides the selection of PCMs to analyze manually. Overall, our iterative process eases the designof a model-based approach for a large dataset of examples of data.
A Relevant and Accurate Modeling Solution for PCMs
Following our iterative process, we develop a set of metamodels and transformations for the for-malization of PCMs. The central element of our approach is a domain metamodel for PCMs [9].Its main concepts are features, products and cells which correspond to the product line view of aPCM. In addition, it contains a set of concepts for defining the precise semantics of cells.
To transform raw PCMs into PCM models, we develop generic algorithms for detecting typesof cells, the orientation of a PCM and extracting the different concepts of our metamodel. Thesealgorithms rely on a set of heuristics inspired from works in the domain of table processing [57,183].
1.5. FORMALIZING PCMS VIA THE SYNTHESIS OF FEATURE MODELS 5
In complement to the domain metamodel, we propose a set of task-specific metamodels. Theyallow to reduce the effort for developing services regarding the manipulation, edition, import andexport of PCMs. Based on these metamodels, we implement numerous services dedicated to PCMssuch an editor, a comparator, a configurator, visualizations [10]. We also develop importers andexporters of PCMs in HTML, CSV and Wikipedia formats.
All our contributions are integrated in OpenCompare, a framework dedicated to the formaliza-tion and exploitation of PCMs. OpenCompare is released under free software license and availableonline at opencompare.org
The feedback gathered on 20 researchers and engineers shows that our domain metamodel con-tains the necessary concepts for the formalization of PCMs. The evaluation of our transformationon 75 PCMs from Wikipedia show that we are able to automatically formalize more than 90% oftheir cells. In addition, we are able to process the totality of the English version of Wikipedia andextract 1.5 million PCM models. From this dataset, we can correctly import and export 91% ofthe PCM models in HTML, CSV and Wikipedia formats. This shows that our techniques supporta large diversity of PCMs.
Finally, the encouraging feedback gathered during our numerous development experimentsshows the ability of our metamodels to provide the appropriate concepts for the developmentof generic analyses and tool support for PCMs.
Overall, the design of our approach is driven by the data, the development of services and thefeedback of our various users. As a result, our formalization of PCMs is accurate, exploitable byservices and relevant to end-users.
1.5 Formalizing PCMs Via the Synthesis of Feature Models
1.5.1 Approach
As we explained, a PCM is a representation of a product line. Multiple languages can be usedto document a product line (e.g. feature models, decision models or spreadsheets). The de factostandard is feature modeling [46]. The clear semantics of Feature Models (FMs) is appropriatefor addressing our objective of formalizing PCMs. Moreover, having an FM enable the use ofexisting advanced techniques for reasoning on the product line or generating new artifacts. Forinstance, FMs can be used for model checking a software product line [172], automating productconfiguration [98], computing relevant information [43], communicating with stakeholders [45] orgenerating artifacts [31]. Therefore, we consider the synthesis of FMs from PCMs for our secondsolution to the objective of this thesis (see right of Figure 1.1).
1.5.2 Challenges
We observe that, the large majority of work is focused on the synthesis of Boolean FMs from avariety of artifacts (e.g. propositional formulas, textual product descriptions or source code) [18,29,77,78,100,101,115,125,126,165]. An important limitation is that existing FM synthesis algorithmsoften foster precision over quality or vice versa. As a consequence, the resulting FM does not bothexactly represent the input product line and exhibit a meaningful hierarchy. The lack of precisionleads to unexplored or non existing products. An approximate hierarchy negatively impacts thereadability and further exploitation of an FM. Moreover, Boolean FMs fail to represent the contentof PCMs which often rely on numerical or textual information (see top of Figure 1.1 for an example).
The precision, quality and expressiveness of FMs synthesized with existing techniques are notsufficient for the formalization of PCMs. There is a clear syntactic and semantic gap betweenPCMs and FMs. A first challenge is to characterize this gap and identify an appropriate featuremodeling formalism capable of encoding PCMs. A second challenge is to develop a precise, efficientand automated FM synthesis technique capable of bridging this gap. Finally, a third challenge isto take into account domain knowledge and user input in order to obtain a meaningful FM.
6 CHAPTER 1. INTRODUCTION
1.5.3 Contribution: A Synthesis Algorithm for Attributed Feature Mod-els
To reduce the gap between FMs and PCMs, we identify a class of PCMs that we call configurationmatrices. Configuration matrices present a simple structure. Features are represented in the firstrow and products in the subsequent rows. Each cell contains a single value whose semantics isunambiguous. Among the millions of PCMs that we analyzed during this thesis, 86.4% presentsthe same simple structure. Moreover, a large part of the cells that we observed contain a preciseBoolean, numerical or textual value which could be encoded in a configuration matrix. As such,we consider configuration matrices as input of our synthesis algorithm.
The expressiveness of configuration matrices exceeds the expressiveness of FMs. To fully supportsuch matrices, we explore the synthesis of Attributed FMs (AFMs), an extension of FMs that cansupport Boolean or numerical information and enumerations.
To address the previous challenges, we propose the first technique for synthesizing AFMs fromconfiguration matrices [5]. We develop a set of algorithms to reason on the configuration matrixin order to synthesize the elements that compose an AFM. In particular, we present an algorithmfor extracting constraints on attributes from the input matrix.
To improve the quality of the resulting AFM, we develop a set of logical and ontological heuris-tics in order to guide the selection of the hierarchy of the AFM [3]. An optimum branchingalgorithm ensures that the hierarchy is legal with respects to the input matrix. We also proposean interactive environment to complement the information of the heuristics with user input [7].
Our empirical evaluation on 126 FMs coming from various domains and 30 FMs extracted fromPCMs, demonstrates that a hybrid approach, mixing ontological and logical techniques, providesthe best support for fully synthesizing FMs. We also perform an empirical evaluation to testthe scalability of our approach by using both randomized configuration matrices and real-worldexamples. The results of our evaluation show that our approach can scale up to configurationmatrices containing 2,000 attributed features, and 200,000 distinct configurations in a couple ofminutes. Overall, our algorithm allows to efficiently produce a precise and high quality AFM froma configuration matrix.
1.6 Two Complementary Approaches
With our contributions, we provide a clear description of the domain and accurate methods forformalizing existing PCMs. Our first solution provides a generic and efficient approach to theformalization of PCMs. The logical structure represented by our domain metamodel is close to theusual matrix representation of PCMs. Moreover, our metamodel provides the necessary conceptsto formalize the various semantics of cells. As such, our first solution eases the development ofbasic edition, manipulation and visualization techniques.
Our second solution present a completely different structure that focuses on the features andtheir relations instead of the products. It allows to switch to product line engineering techniques.The formal semantics of AFMs enables the use of existing advanced reasoning techniques. However,our second solution can only be applied on a class of PCMs. Moreover, the transition from aPCM model to an AFM can potentially require high computational or user effort. Our solutionsprovide two different views on the same PCM and can support different services. They are twocomplementary approaches to the formalization of PCMs.
By creating two approaches for the same problem, we can highlight the trade-off between thetwo solutions. Our work opens new perspectives for the development of innovative services on topof PCMs extracted from various sources. We also offer the necessary abstractions and algorithmsto develop transformations to other formalisms such as FMs, ontologies and spreadsheets. Overall,we provide a generic and extensible approach for the formalization and exploitation of PCMs.
1.7 Outline
The thesis is organized as follows:
1.7. OUTLINE 7
Part I describes the basic notions and background for the next parts. It also analyze existingwork related to the formalization of PCMs.
Chapter 2 presents PCMs in details and related work on spreadsheets and tabular data.
Chapter 3 presents existing techniques for modeling product lines and precisely defines whatis an FM. It also explains the properties of FM synthesis techniques and discusses thelimitations of existing techniques.
Part II presents our model-based approach for formalizing PCMs.
Chapter 4 introduces the case study of Wikipedia and identify challenges for the elaborationof a model-based approach for PCMs. It also details our iterative process for addressingthese challenges.
Chapter 5 presents a metamodel and transformation for automatically formalizing PCMswhich results from a first iteration of our process. The metamodel and the techniquesare evaluated on hundreds of PCMs from Wikipedia.
Chapter 6 presents in detail a second iteration of our process focusing on the developmentof services for editing, manipulating and exploiting PCMs. It also evaluates these tech-niques on millions of PCMs coming from Wikipedia.
Part III presents techniques to synthesize AFMs from PCMs.
Chapter 7 presents a new technique for integrating user knowledge and heuristics in FMsynthesis. The technique is evaluated on 126 FMs coming from the SPLOT repositoryand 30 FMs extracted from Wikipedia PCMs.
Chapter 8 presents a new technique for synthesizing attributed FMs from a class of PCMs.The evaluation is focused on the scalability by measuring execution time on randomlygenerated matrices and realistic PCMs from the BestBuy website.
Part IV concludes the thesis and presents new perspectives.
Chapter 9 highlights our main contributions and discuss the benefits and limits of the twopresented solutions regarding our main objective.
Chapter 10 opens new perspectives for improving the support of PCMs and presents thefuture of OpenCompare.


Part I
State of the Art
9

Chapter 2
Product Comparison Matrices
"Unfortunately, no one can be told what the Matrix is.You have to see it for yourself."
Morpheus
In this chapter, we first explain what is a product line and how it is related to Product Compar-ison Matrices (PCMs) (see Section 2.1). Then, we define what is a PCM and give insights aboutthe complexity that lies behind (see Section 2.2). In Section 2.3, we explore the state of the art forformalizing PCMs and tabular data in general. Then, we continue this exploration by focusing onspreadsheets which can be considered as a generalization of PCMs (see Section 2.4). Finally, wedescribe the services and activities that can be derived from a PCM and highlights the limits ofcurrent implementations (see Section 2.5). In these sections, we identify a lack of specific formalismfor PCMs and significant limits in existing tool support. Therefore, we discuss how metamodelingtechniques can be used to formalize PCMs and propose a basis for developing tool support (seeSection 2.6).
2.1 Product lines
Customers increasingly want products specifically tailored to their needs. The "one size fits all"product introduced by the development of mass production is no longer desired. The well knownFord model T has been replaced by numerous different car models that propose thousands ofconfiguration options. To adapt to this situation, companies shift from mass production to masscustomization. Mass customization still consists in the production of a large amount of productsbut each product is personalized for a particular customer. To keep a low unit cost and reducetime to market, the products are not developed individually but as a product line [145].
The same idea has been applied to software. For instance, the Linux kernel is managed asa single project from which an immeasurable number of variants are derived [140]. The kernelcontains thousands of configuration options. Many other examples of software product lines areused everyday (e.g. Firefox, Windows or ffmpeg).
The idea is to build a set of products from a common platform and introduce variability to beable to derive customized products. Weiss et al. defines variability as "an assumption about howmembers of a family may differ from each other" [186]. Therefore, each product is composed of aset of features that can be shared with other products. Multiple definitions of a feature exist [61].For example, a feature can be "a prominent or distinctive user-visible aspect, quality or charac-teristic" [117] or "an increment in product functionality" [42]. It also can be "an elaboration oraugmentation of an entity that introduces a new service, capability or relationship" [41]. A featurecan cover every aspect of a product from user requirements to technical details. The composi-tion of features can be constrained to avoid defective or unrealistic products or meet commercialrequirements.
11
12 CHAPTER 2. PRODUCT COMPARISON MATRICES
Model SoC Storage capacity Weight
Nexus 6P Snapdragon 810 32 GB, 64 GB, 128 GB 178g
BlackBerry Priv Snapdragon 808 32 GB 192g
Sony Xperia Z3+ Snapdragon 810 32 GB 144g
Samsung Galaxy S6 Exynos 7420 32 GB, 64 GB, 128 GB 138g
Apple iPhone 6S Apple A9 16 GB, 64 GB, 128 GB 192g
Features
Products
Cell
Figure 2.1: Description of a PCM
Product lines are often designed by a single company in order to create a set of personalizedproducts. A common practice is to use either a top-down or a bottom-up approach. The top-downapproach consists in first creating a model (e.g. a feature model as we will describe in Chapter 3)of the product line describing the different features of the product line and their constraints. Then,we implement each feature separately. Finally, for each valid combination of feature of the model,a product is generated.
The bottom-up approach consists in starting from existing products that are managed indi-vidually. Then, we model the variability contained in the considered products. If necessary, werefactor the products into a single product line.
In this thesis, we adopt a broader view of products lines. We consider that any set of relatedproducts is a product line even if no product line engineering techniques has been used for theirdevelopment. For example, the products of Figure 2.1 are manufactured by different companiesbut present similar characteristics.
In this context, both vendors and customers need a precise documentation of a product line.Creators use such documentation to foresee and master the variability contained in the productline that they are building. For users, the documentation is essential to fully explore the productsof the product line. This becomes critical as the number of products and features increase. Forthat matter, a widespread and simple solution is to document a product line with a PCM [46].Another solution is to use feature models as we will detail in Chapter 3.
2.2 Product Comparison Matrices
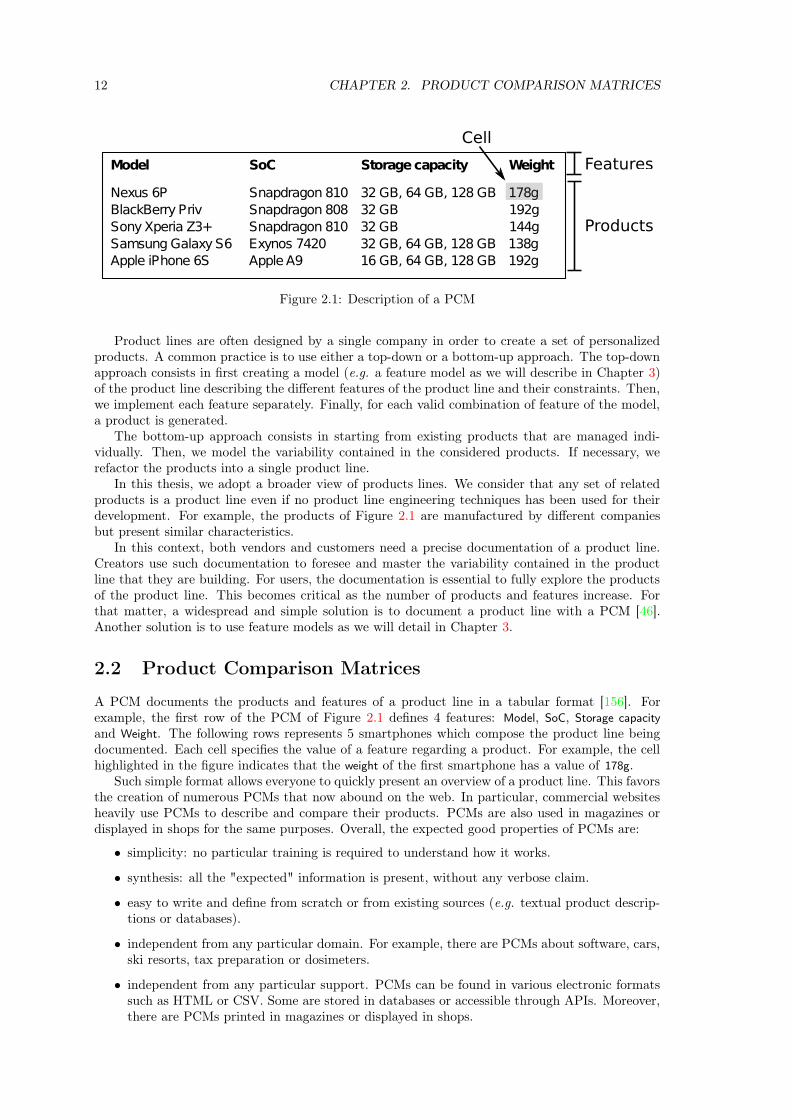
A PCM documents the products and features of a product line in a tabular format [156]. Forexample, the first row of the PCM of Figure 2.1 defines 4 features: Model, SoC, Storage capacity
and Weight. The following rows represents 5 smartphones which compose the product line beingdocumented. Each cell specifies the value of a feature regarding a product. For example, the cellhighlighted in the figure indicates that the weight of the first smartphone has a value of 178g.
Such simple format allows everyone to quickly present an overview of a product line. This favorsthe creation of numerous PCMs that now abound on the web. In particular, commercial websitesheavily use PCMs to describe and compare their products. PCMs are also used in magazines ordisplayed in shops for the same purposes. Overall, the expected good properties of PCMs are:
• simplicity: no particular training is required to understand how it works.
• synthesis: all the "expected" information is present, without any verbose claim.
• easy to write and define from scratch or from existing sources (e.g. textual product descrip-tions or databases).
• independent from any particular domain. For example, there are PCMs about software, cars,ski resorts, tax preparation or dosimeters.
• independent from any particular support. PCMs can be found in various electronic formatssuch as HTML or CSV. Some are stored in databases or accessible through APIs. Moreover,there are PCMs printed in magazines or displayed in shops.
2.3. TABLE PROCESSING 13
• universal: the simplicity and profusion of PCMs makes them accessible to everyone. Readingor writing a PCM do not require any particular training.
Yet, the massive use of PCMs and the lack of standard lead to a great diversity in existingPCMs [12]. A first source of diversity is the format used to store and distribute PCMs. PCMscan be found in classic HTML pages but also in a variety of file formats (e.g. CSV, PDF or imagefiles). PCMs can also be stored in databases or accessed through APIs.
A second source of diversity is the way the information is organized in a PCM. The exampleof Figure 2.1 presents a simple structure. However, PCMs may be organized in different andsometimes more complex representations. For instance, products and features can be inverted, i.e.products are depicted as columns and features as rows. Features can be decomposed in sub-featuresin order to further organize the PCM. Some PCMs further structure their information with cellsspanning the total width of the matrix. Usually, such cells represent a feature that can be used toseparate products in categories.
A third source of diversity lies in the content of the cells. Without guidelines or standard, theeditors of PCMs may introduce complex or ambiguous information. This goes from empty cellsthat may have different meanings depending on the situation to large pieces of text that detailseverything that the editor could not organize in other features. In addition, the type of informationthat a cell contain may vary. For instance, in Figure 2.1 we observe textual information for thefeatures Model and SoC. The feature Storage capacity contain lists of numerical information expressedin gigabytes. Finally, the feature Weight contain numerical information expressed in grams.
In this diversity of structure and cell content, we can identify patterns of variability infor-mation [54, 156]. The objective of the thesis is to explore how we can formalize the variabilitycontained in PCMs.
Bibliographic Study The natural representation of a PCM is a table. For instance, the <table>tag of HTML is often used to represent PCMs. Another practice is to use CSV files or spreadsheets.PCMs can thus be considered as a special case of table or spreadsheet. Therefore, we organize ourbibliographic study as follows. First, we study the state of the art of table processing. In particular,we present existing models of tables and techniques to automatically extract these models from rawtables (see Section 2.3). Then, we present various works on the modeling of spreadsheets and discusstheir adequacy to the domain of PCMs(see Section 2.4). In Section 2.5), we show how PCMs canbe exploited to provide numerous services. We also list examples of noteworthy implementationsof services for PCMs and highlight their limits. Finally, we discuss existing modeling techniquesfor helping in the elaboration a metamodel for formalizing PCMs (see Section 2.6).
2.3 Table Processing
By their matrix representation, PCMs can be considered as a special form of table. Numerouswork have been devoted to processing table [85, 192]. Table processing consists in transforming araw table into a table model which is in direct relation to our main objective.
Raw tables can be represented in multiple medias (e.g. images, scanned documents or electronicdocuments) and formats (e.g. HTML or CSV). In their survey, Embley et al. describe differentparadigms of table processing [85]. In particular, they highlight the significant amount of workfocusing on the processing of images or scanned documents based on image processing and OCRtechniques. PCMs can be found in these kinds of documents. However, the formalization of PCMsis not related to a particular format. In addition, the Web represents a large source of unexploitedPCMs. This is why in this thesis, we focus on electronic formats with a clear structure for tablessuch as HTML, CSV or Wikitext. As such, the works mentioned by Embley et al. could be usedto provide further inputs to our algorithms.
Table processing techniques allows the development of various applications such as tabularbrowsing, manipulation or database creation. Depending on the intended application, differentmodels or formalisms can be used as output [85, 192]. In the following, we explore existing tablemodels and table processing techniques that could be used for formalizing PCMs.
14 CHAPTER 2. PRODUCT COMPARISON MATRICES
2.3.1 Models of Tables
Precisely defining what is a table is a difficult task [127]. Table models can greatly differ dependingon the format of the table, its domain and the expected application. A widespread formalism fortables is the relational model introduced by Codd [64]. It consists in a set of n attributes and acollection of n-tuples. Each attribute has a fixed position, a label and is defined on a domain.
Wang et al. propose a table model with a clear separation of logical and presentational as-pects [184]. This model accepts a wide range of tables with for example the support of multidi-mensional tables. Its separation of concerns and genericity makes it a good model for formalizingtables in general.
Ontologies can also be used for formalizing tables [175,183]. As defined by Gruber, "an ontologyis an explicit specification of a conceptualization" [96]. It precisely defines a set of concepts andtheir relations [97]. Tijerino et al. aim to extract the semantics of the information contained ina table and encode them into ontologies [175]. Wang et al. address a similar problem in orderto enrich the existing Probase ontology [183]. Compared to previous table models, ontologies aremore focused on the semantics of the information contained in a table. In particular, this favorsthe development of reasoning techniques.
Regarding the main objective of this thesis, the simplicity of the relational model prevents aprecise formalization of PCMs. For example, the hierarchy of features cannot be represented aswell as the complex semantics of cells. Moreover, the fixed positions of attributes may hinder thedevelopment of services for PCMs which are sometimes based on the reorganization of productsand features. Contrary to the relational model, the expressiveness of the Wang’s model [184] issufficient for representing the complex structures in PCMs. However, the model is too generic forPCMs and would result in unused concepts or relations. Moreover, the precise semantics of thecontent of the cells cannot be represented and is restricted to a domain. Finally, we are not awareof an ontology dedicated to PCMs.
Overall, the problem of formalizing PCMs with a table model has not been addressed in thefield of table processing. Existing models are too generic (e.g. Wang’s model [184]) or lack ofexpressiveness (e.g. relational model [64]) to precisely represent the logical structure and semanticsof PCMs. Yet some interesting properties (e.g. separation of concerns) or organization (e.g.structure as n-tuples) could be reused or adapted in our context.
2.3.2 Extracting Table Models
According to Hurst et al., table processing can be separated in 4 steps: "table location; tablerecognition; functional and structural analysis; and interpretation" [111, 112]. Table location andrecognition respectively consists in discovering tables in documents and deciding if a table matchesa given table model or not. Significant research effort have been dedicated to these two steps basedon various properties, transformations (e.g. image processing algorithms or tree transformations)and inferences (e.g. classifiers or parsers) [192].
For instance, Wang et al. exploits machine learning techniques such as decision trees andsupport vector machines made for detecting tables in HTML documents [185]. Their classificationis mainly based on the layout and content of the table. Such techniques could be adapted toPCMs by exploiting their specific properties. However, decisions made by location and recognitiontechniques are relative to a table model. As we are investigating the formalization of PCMs, thesetwo operations are not yet possible. This is why, we will assume in the thesis that the locationand recognition of PCMs are performed by a human or are made trivial by the format and contextof the matrix. Therefore, we will focus on the functional and structural analysis as well as theinterpretation of tables which consist in extracting the logical structure and semantics of a table.
As we mentioned previously, the Web forms a great source of tables and PCMs. HTML isthe standard format on the Web. Processing HTML tables is a difficult challenge that has beenaddressed by several works [24,51,57,95,167,183]. The HTML language offer a set of dedicated tagsfor tables that are focused on the structural representation with low level elements such as rowsand cells. The tag th allows to differentiate a normal cell from a head cell. The tag thead allows togroup these headers and further separate the content of the table from its headers. Despite theirexistence, th and thead tags are not always used. Moreover, the lack of constraints or guidelines

2.3. TABLE PROCESSING 15
leads to misuses such as using th tags for defining all the cells. Overall, the expressiveness of theHTML language is very limited to define the semantics of a table and its elements and the fewexisting concepts cannot be trusted in general.
To extract the logical structure of an HTML table, Chen et al. use specific algorithms andheuristics [57]. They are based on both the structure of the table (e.g. number of cells) and itscontent (e.g. type of data or similarity between cells). The algorithm outputs a list of attribute-value pairs and is evaluated on tables about airline information.
Wang et al. uses similar heuristics to extract information from tables [183]. For example, theyrely on syntactic clues (e.g. bold font) and differences in data types to extract the schema ofa table. The originality of this work comes from the use of the Probase ontology to guide theextraction of the table. In particular, if a schema cannot be found, the ontology is used to findthe most likely concepts for each column and infer a schema. Probase is also used to detect thecolumn that defines the different entities that are compared or specified in the table. At the end,the extracted information is injected in Probase in order to enrich the ontology. A limit of thistechnique is the hypothesis that the attributes (or features) are always depicted as columns andentities (or products) as rows.
Tijerino et al. also target an ontology as output for their extraction technique [175]. To buildtheir ontology they first encode the tables in the relational model. Similarly, in our formalizationprocess, we use an intermediary format to ease the transition between a raw table and its finalformalism.
To avoid the complexity of the HTML language and the diversity of implementations of tables,Gatterbauer et al. base their technique on the visual representation used by browsers [95]. Theirabstraction allows to focus on the actual positions of the cells rather than the structure imposedby HTML.
In addition to HTML tables, some works extended their extraction process to spreadsheets. Aswe will see in detail in Section 2.4, spreadsheets can also represent PCMs. For instance, Shigarovet al. use a set of rules based on the structure of the table or the graphical format of the cells [167].From this information, a rule engine infer the logical structure of the table. In addition, a dictionaryof synonyms is used to further refine the extracted table model.
Another type of technique is presented by Adelfio et al. that uses machine learning techniquesto extract a schema of a table [24]. More specifically, they use conditional random fields to classifythe rows of a table. From this classification, they extract a schema which can be exploited to storethe table in a relational database. We note that their technique is focused on rows only and donot infer the semantics of the content of the cells.
2.3.3 Large Scale Extraction of Table Models
The Web constitutes a great source of PCMs and tables in general. Cafarella et al. extracted14.1 billion of raw HTML tables with Google’s web crawler [51]. Among them, 154 million wererecognized as relational tables. Their analysis of the dataset shows that relational tables are smallin general with 2 to 9 columns for 93% of the dataset. Their work is the basis for the developmentof the WebTables project.
The project consists in a set of algorithms and services for exploiting tables on the Web.They use classification techniques and hand-written heuristics to detect tables and recover theirmetadata. The output of their algorithms is a relational table. The formalization and exploitationof a large corpus of tables ease the development of search engines or auto-complete capabilitiesfor tables [50]. We note that WebTables assumes that the headers of a table are represented in asingle row. This represents a limit for the formalization of PCMs which may contain several rowsof headers to represent the features to compare.
In this thesis, we are also facing the challenge of processing and formalizing a large amountof tables. For instance, in Part II, we focus our study on PCMs coming Wikipedia website. Weestimate that the English version of the encyclopedia contains more than one million tables.
16 CHAPTER 2. PRODUCT COMPARISON MATRICES
2.4 Spreadsheets
In addition to their tabular nature, PCMs can also be seen as a special form of spreadsheet withspecific characteristics and objectives. Considerable research effort has been devoted to the studyof spreadsheets [103,143]. All studies have the same observation: errors in spreadsheet are commonbut non trivial.
Due to the profusion of errors, catalogs of smells in spreadsheets have been proposed to char-acterize the practices that may introduce maintanability or comprehension issues [69, 104]. Forinstance, Cunha et al. elaborated a catalog of smells based on the analysis of numerous spread-sheets from the EUSES corpus [90]. Based on this catalog, they developed a tool called SmellSheetDetective that automatically detects these smells [69]. Similarly, Hermans et al. transposed smellsof object-oriented development [91] to spreadsheets [104]. In addition, they propose metrics todetect the presence of a smell. The detected smells are presented with data flow diagrams that areautomatically extracted from the spreadsheet [107].
2.4.1 Reverse Engineering Spreadhseets
As spreadsheets are subject to errors and ambiguity, some works propose to synthesize high-levelabstractions or to infer some information. For instance, Chambers et al. describe a mechanismto infer dimensions (i.e. units of measures) [56]. They start by statically analyzing the structureof a spreadsheet in order infer cells that are headers. Then, they use lexical analysis to extractdimensions from the headers. Finally, they propagate the information on dimensions throughformulas.
Abraham et al. define a type system for spreadsheets [16]. They use heuristics to classify cellsand to infer headers from the layout of the spreadsheet. The headers are used as units for cells.Then, their type system exploits these units to check if the different references and formulas areconsistent. To further detect errors, they also propose a fine-grained type system that analyzeseach formula and cell in a spreadsheet [15]. The starting point of this type system is the primitivetypes of cells: numerical, string, Boolean and undefined. Their type systems can automaticallydetect inconsistencies in formulas regarding the nature of the data that are manipulated.
Another research direction is to elicitate the domain information stored in spreadsheets. Forinstance, Hermans et al. proposed to synthesize class diagrams based on the analysis of a spread-sheet [106]. They assembled a library of common patterns in spreadsheets. They use differentparsing and pattern matching algorithms to identify these patterns. Finally, they map each lo-cated pattern to an equivalent class diagram fragment.
Hermans et al. propose to use data flow diagrams as another possible representation of theinformation contained in spreadsheets [107]. They describe an algorithm for extraction such dia-grams based on a set of heuristics on the nature of cells and their structure. They also developeda user interface in order to ease the navigation and analysis of the data flow. To evaluate theirapproach, they interviewed 27 employees of a financial company. A majority of employees indicatedthat using such high-level abstraction could be beneficial for their work.
2.4.2 Model-based Spreadsheets
Constructive approaches for ensuring that spreadsheets are correct by construction have beendeveloped in order to prevent typical errors associated with spreadsheets. For instance, Franciset al. [94] develop tools to consider spreadsheets as first-class models and thus enable the reuse ofstate of the art model management support (e.g., for querying a model).
ClassSheet [86] introduces a formal object-oriented model of a spreadsheet which can be usedto automatically synthesize spreadsheets. It allows to define composable blocks of cells that usesattribute names instead of cell references in formulas. Moreover, it explicitly represent the verticalor horizontal expansions of data and formulas in a spreadsheet. To keep a familiar view, ClassSheetrelies on an underlying grid layout. Typing rules ensures that ClassSheet models do not violatethis layout. Finally, these models are translated to ViTSL [17]. ViTSL is a language for definingspreasheet templates. From the template, a concrete spreadsheet can be generated.

2.5. EXPLOITATION OF PCMS 17
To ease the definition of ClassSheet models, Cunha et al. propose an algorithm to automaticallyinfer them from spreadsheets [68]. This can be used to refactor the existing spreadsheet and adopta model-driven approach. Basically, they adapt methods to relational models to spreadsheets.In particular, they analyze the dependencies between cells to determine relational schemas in aspreadsheet. Then, they build a relation graph that explicit the relations between the schemas.Finally, they translate the graph into a ClassSheet model.
MDSheet propose to directly integrate ClassSheet models into spreadsheets [70]. The benefit isto offer a familiar view for defining ClassSheet models. MDSheet relies on a bi-directional transfor-mation framework in order to maintain spreadsheet models and their instances synchronized. Forinstance, if a row is added in the model, the instances are automatically updated and their formulasare modified to take into account this new row. This avoids common errors when refactoring aspreadsheet.
In Part II of this thesis, we follow a similar model-based approach and the benefits also applyto our work. A notable difference is that we consider the specific nature of PCMs, i.e., we targeta specific class of spreadsheets. The expressiveness of our formalization is not suited for dealingwith many aspects of spreadsheets (e.g., worksheets, formulas, references).
2.5 Exploitation of PCMs
Despite their inherent complexity, PCMs can be the basis for numerous activities and services [12].An objective of formalizing PCMs is to provide the necessary concepts and algorithms to supportthese activities. In the following, we list the main services that could be provided on top of PCMs.Then, we list some noteworthy implementations and highlight their limits.
2.5.1 Main Services
Compare. The main activity based on PCMs is the comparison of products. A user exploresthe information contained in the matrix and extract the important part for its objective (e.g. buya particular product or discover a lack in the documented products). To ease the comparison, wecould allow to sort and filter features according to a set of constraints. For example in Figure 2.1,one may filter out smartphones with a Weight superior to 180g and sort the Storage capacity indescending order. This allows to find a smartphone with a large storage capacity and a limitedweight. Another functionality that can be interesting when comparing products in a PCM is toreorganize the features and products in order to reflect the preferences of the user.
Configure. An other activity closely related to comparison is configuration. Instead of exploringthe entire PCM, we ask questions to the user in order to progressively reduce the configurationspace. That way, the user is not overwhelmed by the mass of information that a PCM can contain.
Visualize. Specific vizualizations can be derived to further explore a PCM. For example, statis-tics and plots can be used to have a quick glimpse at the data.
Recommend. Databases, ontologies, informal textual documents or even other PCMs may con-tain complementary information that can enrich a PCM. A recommendation system could be builtin order to detect and search related sources of information.
Edit. Creating or modifying a PCM can be difficult without tool support. A dedicated editor canease these operations by allowing the user to manipulate the appropriate concepts (e.g. productsand features instead of cells). Moreover, an editor could highlight inconsistent or ambiguousinformation. As a PCM grows or evolve over time, multiple persons may contribute to a singlePCM. An editor with the support of collaborative edition and versioning system could ease thecollaboration of different actors.

18 CHAPTER 2. PRODUCT COMPARISON MATRICES
Import. Creating a PCM from scratch can be time-consuming. In some cases, the informationthat we want to include can be found in a file or accessible through an API. An import servicecan ease the integration of such information in a PCM. It consists in transforming the file format(e.g. CSV or PDF) or making the appropriate requests of the API to adapt the information to thePCM.
Export. To store or share a PCM, an export service can be necessary. It consists in transformingthe information contained in the PCM to another format (e.g. an HTML file to be embedded in awebsite).
Generate. To go further than exporting a PCM, we can generate multifarious artifacts. Forexample, we can generate the source code of a configurator dedicated to a particular PCM.
Manipulate. To build all these services, we need to manipulate and operate on one or severalPCMs. Operations such are merging, slicing or exposing a PCM through a dedicated API can easetheir development.
2.5.2 Noteworthy Implementations
Considering the previous activities, we can observe that most of websites and software offer verylimited abstractions, algorithms or services. Most of the time, the only possible operation consistsin sorting the products according to one feature. We note some exceptions such as graphiq.comwhich allows to create visualizations and offer a comparator with advanced sorting and filteringcapabilities. The website also offers a simple configurator to quickly filter the products accordingto a predefined set of features.
The objective of socialcompare.com is to create a community around PCMs. The website offersan editor dedicated to PCMs with specialized types of data and focused on the concepts of productsand features. An interesting functionality is the recommendation of features and auto-completion ofcells based on other PCMs from the website. Moreover, each PCM can be shared on social networksor embedded in other websites. A review system allows the members of the community to rateand comment PCMs. These sharing capabilities foster the collaboration between contributors. Tocompare products, the website offers a simple matrix view where we can move and remove featuresand products. The matrix can be sorted according to one feature. We note that the products arealways represented as columns and that it is impossible to filter products based on the values of afeature. Moreover, the formalism or format used internally is not accessible.
The djangopackages1 project offers a web interface for generating PCMs of packages for theDjango web framework2. The resulting PCM is purely static and none of the services mentionedpreviously are implemented.
Regarding the visualization of a product line, the website productchart.com propose an innova-tive graphical representation for comparing products. It displays the products in a 2D environmentaccording to two criteria selected by the user. This allows to quickly detect the best product orfind a compromise between the criteria. However, the product lines that are presented are definedby the creator of the website and concern only 7 different domains (e.g. laptops or 3D printers).
In another context, spreadsheet applications (e.g. Microsoft Excel, LibreOffice or Tableau) canprovide ad hoc support for PCMs. For instance, it is quite easy to sort rows according to the valuein one or several columns. It is also possible to generate charts and statistics based on the valuesin a spreadsheet. However, there is no special support for PCMs. They provide operations formanipulating rows and columns. They have no notion of products or features and the semanticsof cells is usually implicit. In our context, spreadsheets can be considered as a general purposelanguage for manipulating tables and thus PCMs. The expressiveness of spreadsheets allow thedevelopment of various services that would not be possible with a language dedicated to PCMs.However, the abstractions that they offer is not always appropriate for the formalization andmanipulation of PCMs.
1https://github.com/pydanny/djangopackages2https://www.djangoproject.com/
2.6. MODELING PCMS 19
In the same vein as spreadsheets, CSV libraries provide generic operations that are interestingfor the manipulation of PCMs. For example, the F# Data library3 automatically detect typesof columns such as booleans, integers, floats, dates or units of measure. It also supports missingvalues. Regarding operations, it provides advanced filtering capabilities and is able to handle largeCSV files. Yet, these CSV libraries do not cover all the complexity of PCMs such as the presence ofmultiple values in a cell (see the column Storage capacity of Figure 2.1). Moreover, the CSV formatis simple and do not reflect the logical structure or semantics of PCMs.
As we observe, existing services for PCMs are often very limited. They do not provide abstrac-tions or formalisms that are adapted to the formalization or exploitation of the comprehensivediversity and complexity of PCMs. The underlying formalism of the few projects that are ex-plicitly dealing with PCMs is often not available. In addition, they do not support or ease thedevelopment of new services. This further motivates our main objective.
2.6 Modeling PCMs
Whether considering the field of table processing or spreadsheets, existing formalisms fail to pre-cisely define PCMs. A major contribution of this thesis is the elaboration and evaluation of ametamodel of PCMs (see Part II). In this section, we define what is a metamodel and studyrelated work that could help us to design a metamodel for PCMs.
2.6.1 Model-Driven Engineering
Model-Driven Engineering (MDE) is a development paradigm that uses models as primary artifactsto describe the different concerns and aspects of a software system [93]. A model acts as anabstraction of a part of the system for a given purpose [137]. There can be multiple purposes to amodel such as documenting, analyzing, testing or driving the implementation of the system.
Schmidt describes MDE as a combination of Domain-Specific Modeling Languages (DSML) andtransformations [159]. Contrary to general-purpose languages (e.g. Java or C++) which aim tobe generic enough to cover any domain, DSMLs precisely capture the concepts and constraints ofone particular domain [180]. DSMLs are used to define the different models that support MDE.Models are not contemplative artifacts but are the basis for supporting the whole life-cycle of asystem [93]. For that purpose, transformations are developed in order to derive new artifacts (e.g.source code, documentation, test cases or other models) from a model.
To address our objective, we consider the use of MDE approaches. In particular, we design aDSML for the domain of PCMs and use different transformations to import and export PCMs,implement an editor, provide an API and create visualizations (see Part II).
2.6.2 Metamodeling
A common way to describe a DSML is to use a metamodel. A metamodel defines the conceptsof the domain of the DSML and their relations. It describes the structure of the language, alsocalled abstract syntax [152, 180]. Additional constraints can be provided to further restricts theabstract syntax. A model is conformant to a metamodel if the model instantiates the concepts ofthe metamodel and respects its constraints.
In Chapter 5, we design a metamodel for PCMs which defines the abstract syntax of a PCM.A model that conforms to this metamodel corresponds to a representation of a particular PCM.In our context, we face the challenge of supporting the large number of preexisting PCMs on theWeb. Therefore, the metamodel should be expressive enough to cover the diversity of this dataset(see Section 2.2). For that matter, we now study techniques and guidelines that could help us todesign our metamodel while taking into account the specificities of our context.
3http://fsharp.github.io/FSharp.Data/library/CsvProvider.html

20 CHAPTER 2. PRODUCT COMPARISON MATRICES
2.6.3 Designing a metamodel
Numerous formalisms, techniques, or guidelines have been proposed to design a metamodel andDSMLs in general. For instance, Karsai et al. describe 26 guidelines for the development ofDSMLs [119]. They indicate that some of these guidelines may conflict. This highlights thedifficulty to design an appropriate DSML. It also shows the need to adapt the design to contextof the DSML. Voelter et al. give a comprehensive view of how to design, implement and test suchlanguages [179]. They also provide examples of DSMLs in three language workbenches: Xtext,MPS and Spoofax. Defining how to make a good metamodel or language can be difficult. Instead,Kelly et al. focuses on defining common errors or bad practices in the design of DSMLs [121]. Tocharacterize these smells, they analyzed 76 DSMLs from various domains, technological space andcreators.
In our context, the presence of numerous existing PCMs is an essential source of data to takeinto account during the design of our metamodel. For that purpose, example-driven approacheshave been developed to ease the elaboration and improve the quality of metamodels [40]. Forinstance, De Lara et al. [67,124] propose an interactive approach in which domain experts specifyexample model fragments that are then exploited for constructing a metamodel. Model fragmentscan be annotated by the experts to further guide the generation of the metamodel. The advantageof their approach is that domain experts can define what the metamodel should support withoutbeing a modeling expert. Moreover, the metamodel can be easily corrected by adding new modelfragments.
Faunes et al. propose to complement a metamodel with well-formedness rules extracted fromexamples and counter-examples [88]. Their technique relies on genetic programming to infer OCLrules. Their evaluation on 2 metamodels (state machine and feature diagram) shows that they canretrieve relevant rules with a high precision and recall.
MARS is a semi-automatic system for retrieving a metamodel from a set of models expressedin XML [116]. The system uses a grammar inference engine to analyze the models and eventuallyinfer a metamodel. To ease the work of the inference engine, the different metamodel elements areextracted from the XML files and represented into a specific DSML.
In another context, Cánovas et al. describe a model-based process to discover schemas inJSON data produced by web services [53]. They first convert JSON documents to low-level JSONmodels. Then, from a set of JSON models, they extract a schema in form of a metamodel. Thisextraction is based on a set of transformation rules from JSON models to metamodel fragments.Their approach supports the discovering of a metamodel for multiple web services by merging theresulting metamodels of each service.
The design of a metamodel is often performed by several modeling experts in concert with end-users. To ease this activity, Cabot et al. [113] propose a collaborative process to ease the definitionof DSMLs. They define a DSML, called Collaboro, to support this activity. Collaboro providesthe necessary abstractions to gather the annotations and modifications of a community during thedesign of a DSML. In particular, it allows to reference elements in the abstract and concrete syntaxof the language. It also embeds a decision engine to automatically take design decision based onthe votes of the community and multiple resolution strategies. Lanubile et al. highlights that moreand more collaboration tools are emerging in global software engineering [123].
2.7 Conclusion
PCMs abound the Web. They are simple and compact representations of a product line. They forma great source of information that could be exploited for comparing, configuring, visualizing andrecommending products. Other services such as editors or importers can facilitate the creation ofPCMs. Despite their expected good properties, PCMs are subject to a lot of diversity that hinderthe development of such services. We also observe the lack of websites or tools to manipulatePCMs. This further motivates the design of a formalism dedicated to PCMs.
PCMs can be seen as specific tables or spreadsheets. In both domains, considerable researcheffort have been devoted to define a formalism and automate the extraction of such formalism fromraw data. Overall, our analysis of the state of the art does not reveal the existence of a formalism

2.7. CONCLUSION 21
dedicated to PCMs. However, we note that existing models or ontologies have interesting propertiesor concepts that could be reused in our context.
An important motivation of our work is to enable the exploitation of the millions of PCMspresent on the Web by developing a set of generic algorithms and services. We aim to create aformalism that can act as a basis for such development. Metamodeling techniques are speciallycrafted for both defining a domain or language and build associated tool support. This is why weare investigating the design of a metamodel for PCMs. Our context forces us to take into accounta large existing dataset. The problem of designing a metamodel from such large dataset has notbeen addressed yet. The lack of specific guidelines or techniques prompted us to manually analyzehundreds of PCMs and automatically process millions of tables in order to understand the PCMdomain and finally design our metamodel. Part II explain in details our journey into the design ofa metamodel for PCMs.

Chapter 3
Feature Modeling
"What happened, happened and could not have hap-pened any other way."
Morpheus
As we explained previously, a PCM is a view on a product line. A product line is composedof a set of products presenting commonalities and variabilities. Its complexity can quickly becomeunmanageable and thus there is a need to model the product line. This is what we call variabilitymodeling. Section 3.1 explains what variability modeling is and what are its possible benefitsand applications. Then, it focuses on the most widespread formalism for variability modeling:feature models. The activity of modeling variability can be error-prone and time-consuming. Inaddition, the domain of PCMs represents millions of unexploited matrices. Section 3.2 investigatesthe synthesis of FMs from various artifacts. In particular, we define what is the problem ofsynthesizing an FM and what are the expected properties of the output FM. Finally, we exploreexisting approaches and identify their limits for our problem of formalizing PCMs.
3.1 Variability Modeling
Variability modeling consists in delimiting the scope of a product line and formally documentingits common and variable parts. This is a crucial activity in product line engineering and severalformalisms have been proposed to model variability (e.g. orthogonal variability modeling [145],decision modeling [158] or feature modeling [117]). Among them, the most widespread and stud-ied formalism is feature modeling [31, 43, 47, 110]. Once specified, Feature Models (FMs) can beused for model checking an SPL [172], automating product configuration [98], computing relevantinformation [43] or communicating with stakeholders [45]. In many generative or feature-orientedapproaches, FMs are central for deriving software-intensive products [31]. For instance, the workof Murashkin et al. is close to the context of PCMs [138]. From an FM, they generate a graphicalrepresentation of a set of products in a 2 dimensions space. Each point represents a product. Theposition and the characteristic of the points provide an intuitive way to compare the products.Given the popularity of FMs and their extensive applications and tool support, we choose to focuson this particular formalism for the rest of the thesis.
3.1.1 Feature Models
Introduced by Kang et al. [117], FMs aim at characterizing the valid combinations of features(a.k.a. configurations) of a system under study. The main part of an FM is the feature diagram(see Definition 1). In this diagram, a feature hierarchy (a tree) is used to facilitate the organiza-tion and understanding of a potentially large number of features. In addition, different syntacticconstructions are offered to attach variability information to features organized in the hierarchy.
23
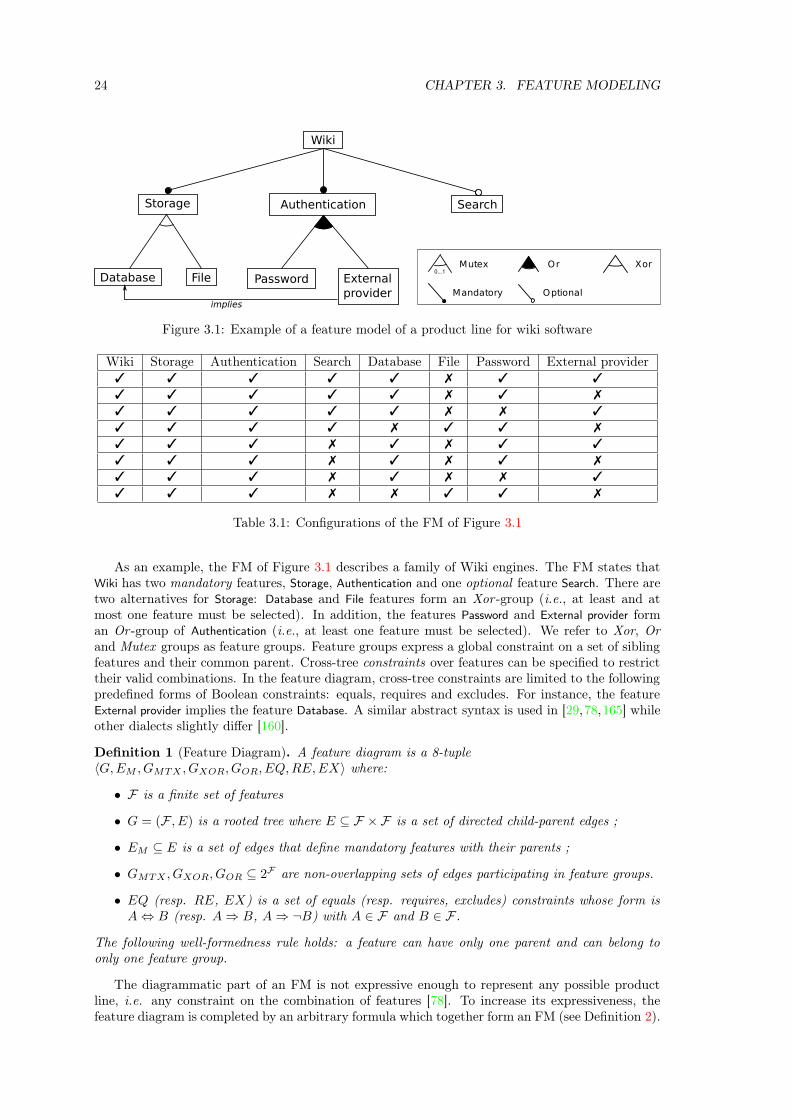
24 CHAPTER 3. FEATURE MODELING
Or Xor
Mandatory Optional
Mutex0...1
Wiki
Storage Authentication
Database File Password External
provider
Search
implies
Figure 3.1: Example of a feature model of a product line for wiki software
Wiki Storage Authentication Search Database File Password External provider✓ ✓ ✓ ✓ ✓ ✗ ✓ ✓
✓ ✓ ✓ ✓ ✓ ✗ ✓ ✗
✓ ✓ ✓ ✓ ✓ ✗ ✗ ✓
✓ ✓ ✓ ✓ ✗ ✓ ✓ ✗
✓ ✓ ✓ ✗ ✓ ✗ ✓ ✓
✓ ✓ ✓ ✗ ✓ ✗ ✓ ✗
✓ ✓ ✓ ✗ ✓ ✗ ✗ ✓
✓ ✓ ✓ ✗ ✗ ✓ ✓ ✗
Table 3.1: Configurations of the FM of Figure 3.1
As an example, the FM of Figure 3.1 describes a family of Wiki engines. The FM states thatWiki has two mandatory features, Storage, Authentication and one optional feature Search. There aretwo alternatives for Storage: Database and File features form an Xor -group (i.e., at least and atmost one feature must be selected). In addition, the features Password and External provider forman Or -group of Authentication (i.e., at least one feature must be selected). We refer to Xor, Orand Mutex groups as feature groups. Feature groups express a global constraint on a set of siblingfeatures and their common parent. Cross-tree constraints over features can be specified to restricttheir valid combinations. In the feature diagram, cross-tree constraints are limited to the followingpredefined forms of Boolean constraints: equals, requires and excludes. For instance, the featureExternal provider implies the feature Database. A similar abstract syntax is used in [29,78,165] whileother dialects slightly differ [160].
Definition 1 (Feature Diagram). A feature diagram is a 8-tuple�G,EM , GMTX , GXOR, GOR, EQ,RE,EX� where:
• F is a finite set of features
• G = (F , E) is a rooted tree where E ⊆ F × F is a set of directed child-parent edges ;
• EM ⊆ E is a set of edges that define mandatory features with their parents ;
• GMTX , GXOR, GOR ⊆ 2F are non-overlapping sets of edges participating in feature groups.
• EQ (resp. RE, EX) is a set of equals (resp. requires, excludes) constraints whose form isA ⇔ B (resp. A ⇒ B, A ⇒ ¬B) with A ∈ F and B ∈ F .
The following well-formedness rule holds: a feature can have only one parent and can belong toonly one feature group.
The diagrammatic part of an FM is not expressive enough to represent any possible productline, i.e. any constraint on the combination of features [78]. To increase its expressiveness, thefeature diagram is completed by an arbitrary formula which together form an FM (see Definition 2).

3.1. VARIABILITY MODELING 25
For example, let consider the fictive constraint: Search ∧ Password ⇒ Database. The feature diagramof Figure 3.1 cannot be modified such that it integrates the additional constraint. We must relyon an external constraint and thus we obtain an FM.
Definition 2 (Feature Model). A feature model is a pair �FD,φ� where FD is a feature diagram,and φ is a Boolean formula over F .
3.1.2 Configuration and Ontological Semantics
The essence of an FM is its configuration semantics (see Definition 3). For instance, the config-uration semantics of the FM of Figure 3.1 can be represented as the PCM of Figure 3.1. Thesyntactical constructs of a FM are used to restrict the combinations of features authorised by anFM. For example, at most one feature can be selected in a Mutex-group. As such Mutex-groupssemantically differ from optional relations. Mutex-groups also semantically differ from Xor-group– none of the features can be selected if the parent of a Mutex-group is selected. Formally, thecardinality of a feature group is a pair (i, j) (with i ≤ j) and denotes that at least i and at most j ofits k arguments are true. GMTX (resp. GXOR, GOR) are sets of Mutex-groups (resp. Xor-groups,Or-groups) whose cardinality is (0, 1) (resp. (1, 1), (1,m): m being the number of features in theOr-group).
The configuration semantics can be specified via translation to Boolean logic [78]. In particular,the configuration semantics states that a feature cannot be selected without its parent, i.e., allfeatures, except the root, logically imply their parent. As a consequence, the feature hierarchy alsocontributes to the definition of the configuration semantics.
Definition 3 (Configuration Semantics). A configuration of a feature model g is defined as a setof selected features. �g� denotes the set of valid configurations of g.
Another crucial and dual aspect of an FM is its ontological semantics (see Definition 4). In-tuitively the ontological semantics of an FM defines the way features are conceptually related.Obviously, the feature hierarchy is part of the ontological definition. The parent-child relationshipsare typically used to decompose a concept into sub-concepts or to specialize a concept. Thereare also other kinds of implicit semantics of the parent-child relationships, e.g., to denote thata feature is implemented by another feature [118]. Looking at Figure 3.1, the concept of Wiki iscomposed of different properties: Storage, Authentication and Search. Storage can be further refinedin Database or File, etc. Feature groups are part of the ontological semantics (see Definition 4) sincethere exists FMs with the same configuration semantics, the same hierarchy but having differentgroups [18,165]. For example, the FMs of Figure 3.1 and 3.4 have the same configuration semanticsbut present different ontological semantics.
Definition 4 (Ontological Semantics). The hierarchy G = (F , E) and feature groups (GMTX , GXOR,GOR) of a feature model define the semantics of features’ relationships including their structuralrelationships and conceptual proximity.
We use the term ontological semantics in line with the terminology employed in previous pa-pers [75,165]. In knowledge engineering, an ontology represents the semantics of concepts and theirrelationships using some description language (e.g., based on description logic) [36, 96]. Featuremodeling shares the same goal and is also a concept description technique – less rich and powerfulthan ontology languages. We share the view of Czarnecki et al. stating that "feature models areviews on ontologies" [75], the hierarchy and feature groups being central to the conceptualizationof a domain.
3.1.3 Extended Feature Models
The FMs described previously are what we call Boolean FMs. Their syntax (see Definition 2) andsemantics (see Definition 3) rely only on Boolean constructs. As we can observe in PCMs (seeSection 2.2), other types of data or constraints can be used to describe product lines. To increasethe expressiveness of FMs, several extensions have been proposed for the formalism.
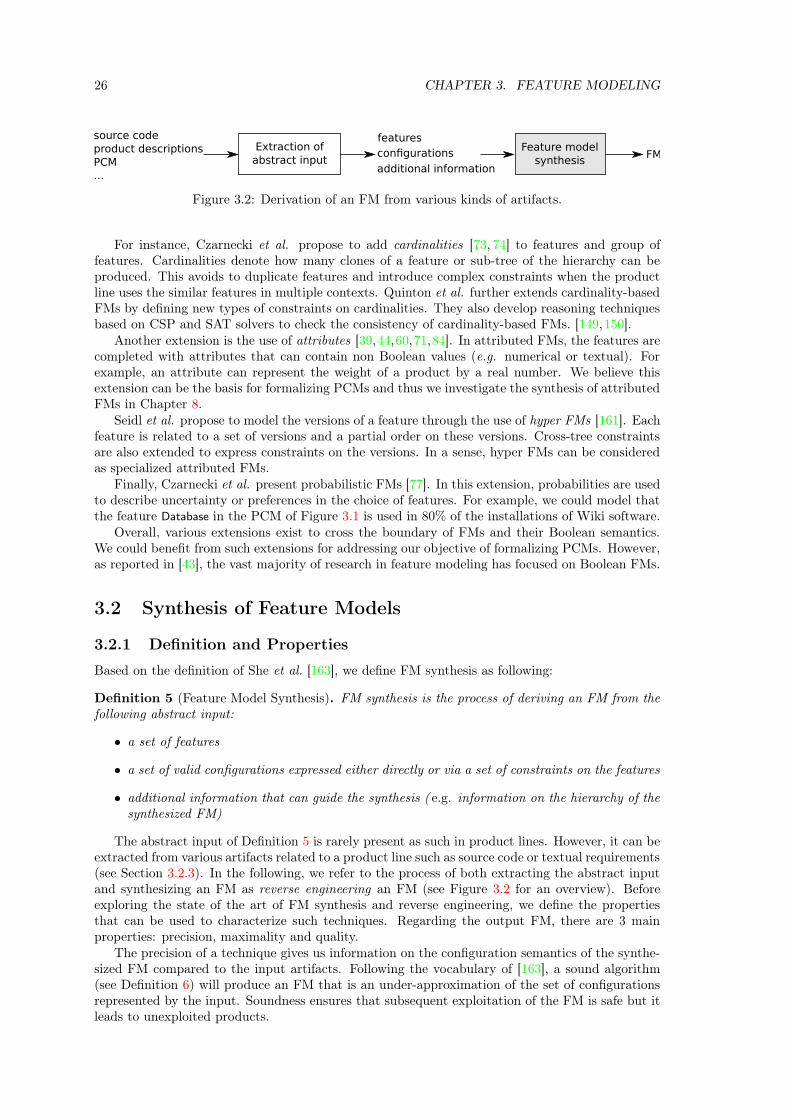
26 CHAPTER 3. FEATURE MODELING
Feature model
synthesis
features
configurations
additional information
FMExtraction of
abstract input
source code
product descriptions
PCM
...
Figure 3.2: Derivation of an FM from various kinds of artifacts.
For instance, Czarnecki et al. propose to add cardinalities [73, 74] to features and group offeatures. Cardinalities denote how many clones of a feature or sub-tree of the hierarchy can beproduced. This avoids to duplicate features and introduce complex constraints when the productline uses the similar features in multiple contexts. Quinton et al. further extends cardinality-basedFMs by defining new types of constraints on cardinalities. They also develop reasoning techniquesbased on CSP and SAT solvers to check the consistency of cardinality-based FMs. [149,150].
Another extension is the use of attributes [39,44,60,71,84]. In attributed FMs, the features arecompleted with attributes that can contain non Boolean values (e.g. numerical or textual). Forexample, an attribute can represent the weight of a product by a real number. We believe thisextension can be the basis for formalizing PCMs and thus we investigate the synthesis of attributedFMs in Chapter 8.
Seidl et al. propose to model the versions of a feature through the use of hyper FMs [161]. Eachfeature is related to a set of versions and a partial order on these versions. Cross-tree constraintsare also extended to express constraints on the versions. In a sense, hyper FMs can be consideredas specialized attributed FMs.
Finally, Czarnecki et al. present probabilistic FMs [77]. In this extension, probabilities are usedto describe uncertainty or preferences in the choice of features. For example, we could model thatthe feature Database in the PCM of Figure 3.1 is used in 80% of the installations of Wiki software.
Overall, various extensions exist to cross the boundary of FMs and their Boolean semantics.We could benefit from such extensions for addressing our objective of formalizing PCMs. However,as reported in [43], the vast majority of research in feature modeling has focused on Boolean FMs.
3.2 Synthesis of Feature Models
3.2.1 Definition and Properties
Based on the definition of She et al. [163], we define FM synthesis as following:
Definition 5 (Feature Model Synthesis). FM synthesis is the process of deriving an FM from thefollowing abstract input:
• a set of features
• a set of valid configurations expressed either directly or via a set of constraints on the features
• additional information that can guide the synthesis ( e.g. information on the hierarchy of thesynthesized FM)
The abstract input of Definition 5 is rarely present as such in product lines. However, it can beextracted from various artifacts related to a product line such as source code or textual requirements(see Section 3.2.3). In the following, we refer to the process of both extracting the abstract inputand synthesizing an FM as reverse engineering an FM (see Figure 3.2 for an overview). Beforeexploring the state of the art of FM synthesis and reverse engineering, we define the propertiesthat can be used to characterize such techniques. Regarding the output FM, there are 3 mainproperties: precision, maximality and quality.
The precision of a technique gives us information on the configuration semantics of the synthe-sized FM compared to the input artifacts. Following the vocabulary of [163], a sound algorithm(see Definition 6) will produce an FM that is an under-approximation of the set of configurationsrepresented by the input. Soundness ensures that subsequent exploitation of the FM is safe but itleads to unexploited products.

3.2. SYNTHESIS OF FEATURE MODELS 27
Arbitrary
Sound
Complete
Exact
Configurations represented
by the input
Figure 3.3: Precision of an FM synthesis algorithm according to the input configurations (adaptedfrom Figure 5 of [163])
Definition 6 (Soundness of Feature Model Synthesis). A synthesis algorithm is sound if theresulting FM (fm) represents only configurations that exist in the input (in), i.e. �fm� ⊆ �in�.
On the contrary, a complete algorithm (see Definition 7) will produce an FM that is an over-approximation of the input. Completeness ensures that the full capacity of the product line canbe exploited. However, users of the FM may be exposed to non existing products. A sound andcomplete algorithm will produce an FM that exactly represents the input configurations. If analgorithm is neither sound or complete, we consider that it has an arbitrary precision. Figure 3.3resumes the different levels of precision of an FM synthesis algorithm.
Definition 7 (Completeness of Feature Model Synthesis). A synthesis algorithm is complete if theresulting FM (fm) represents at least all the configurations of the input(in), i.e. �in� ⊆ �fm�.
The maximality of a synthesis algorithm (see Definition 8) ensures that the output FM is nottrivial (e.g. an FM with the input configurations encoded in the constraint Φ and no hierarchy, i.e.E = ∅). Intuitively, maximality enforces that the feature diagram contains as much information aspossible.
For example, the FM of Figure 3.4 has the same configuration semantics as the FM of Figure 3.1.However, it is not maximal. The mandatory relations of Storage and Authentication are representedin the constraint φ of the FM (see right of Figure 3.4). The Xor-group of Database and File and theimplies constraint between External provider and Database are also expressed in φ. To be maximal,these constructs must be represented in the diagrammatic part of the FM.
A consequence of the lack of maximality is the presence of counter-intuitive information in theFM. For instance, the Storage is mandatory but it is represented as an optional. To understandthat the feature is mandatory, one must carefully analyze all the constraints.
Definition 8 (Maximal Feature Model). An FM is maximal if its hierarchy H connects everyfeature in F and if none of the following operations are possible without modifying the configurationsemantics of the FM:
• add an edge to EM
• add a group to GMTX , GXOR or GOR
• move a group from GMTX or GOR to GXOR
• add a constraint to the feature diagram that is not redundant with other constraints of thefeature diagram or the constraints induced by the hierarchy and feature groups.
Finally, the quality of the FM represents the quality of its ontological semantics. As we willsee in Chapter 7, the ontological semantics of an FM impacts its exploitation. For instance, ifthe features are organized in a natural way for the expert of the domain, its readability is greatly
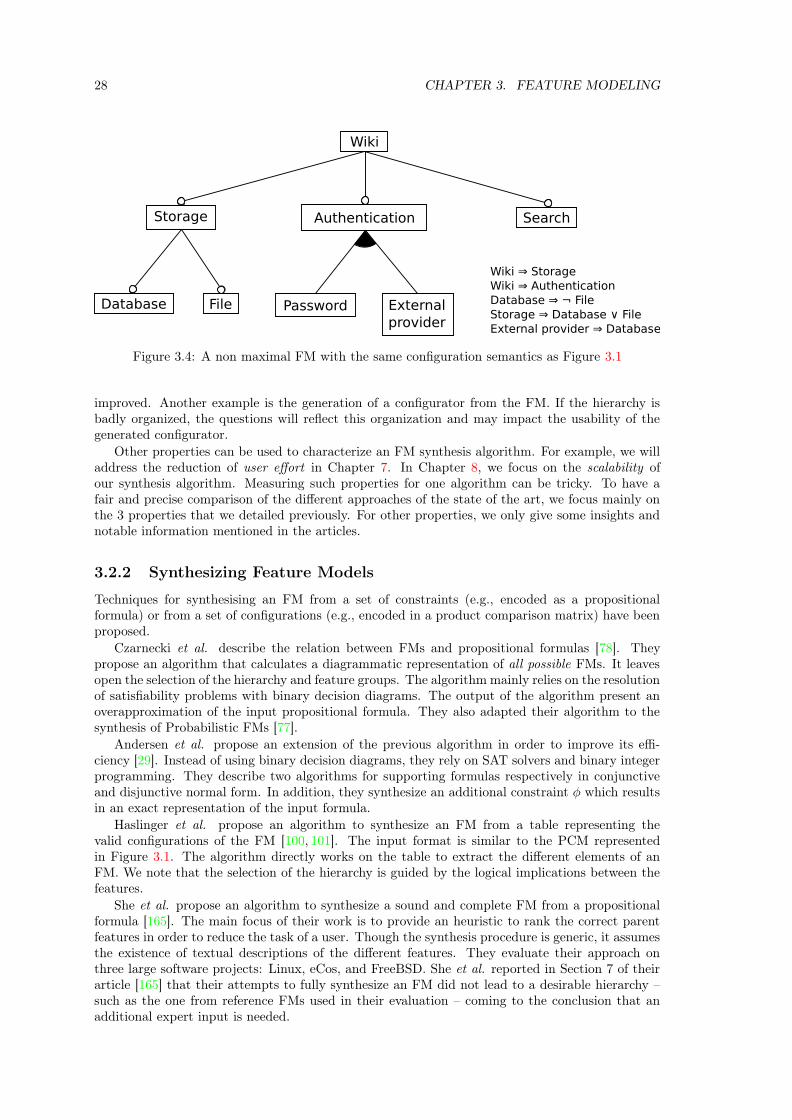
28 CHAPTER 3. FEATURE MODELING
Wiki
Storage Authentication
Database File Password External
provider
Search
Wiki ⇒ Storage
Wiki ⇒ Authentication
Database ⇒ ¬ File
Storage ⇒ Database ∨ File
External provider ⇒ Database
Figure 3.4: A non maximal FM with the same configuration semantics as Figure 3.1
improved. Another example is the generation of a configurator from the FM. If the hierarchy isbadly organized, the questions will reflect this organization and may impact the usability of thegenerated configurator.
Other properties can be used to characterize an FM synthesis algorithm. For example, we willaddress the reduction of user effort in Chapter 7. In Chapter 8, we focus on the scalability ofour synthesis algorithm. Measuring such properties for one algorithm can be tricky. To have afair and precise comparison of the different approaches of the state of the art, we focus mainly onthe 3 properties that we detailed previously. For other properties, we only give some insights andnotable information mentioned in the articles.
3.2.2 Synthesizing Feature Models
Techniques for synthesising an FM from a set of constraints (e.g., encoded as a propositionalformula) or from a set of configurations (e.g., encoded in a product comparison matrix) have beenproposed.
Czarnecki et al. describe the relation between FMs and propositional formulas [78]. Theypropose an algorithm that calculates a diagrammatic representation of all possible FMs. It leavesopen the selection of the hierarchy and feature groups. The algorithm mainly relies on the resolutionof satisfiability problems with binary decision diagrams. The output of the algorithm present anoverapproximation of the input propositional formula. They also adapted their algorithm to thesynthesis of Probabilistic FMs [77].
Andersen et al. propose an extension of the previous algorithm in order to improve its effi-ciency [29]. Instead of using binary decision diagrams, they rely on SAT solvers and binary integerprogramming. They describe two algorithms for supporting formulas respectively in conjunctiveand disjunctive normal form. In addition, they synthesize an additional constraint φ which resultsin an exact representation of the input formula.
Haslinger et al. propose an algorithm to synthesize an FM from a table representing thevalid configurations of the FM [100, 101]. The input format is similar to the PCM representedin Figure 3.1. The algorithm directly works on the table to extract the different elements of anFM. We note that the selection of the hierarchy is guided by the logical implications between thefeatures.
She et al. propose an algorithm to synthesize a sound and complete FM from a propositionalformula [165]. The main focus of their work is to provide an heuristic to rank the correct parentfeatures in order to reduce the task of a user. Though the synthesis procedure is generic, it assumesthe existence of textual descriptions of the different features. They evaluate their approach onthree large software projects: Linux, eCos, and FreeBSD. She et al. reported in Section 7 of theirarticle [165] that their attempts to fully synthesize an FM did not lead to a desirable hierarchy –such as the one from reference FMs used in their evaluation – coming to the conclusion that anadditional expert input is needed.
3.2. SYNTHESIS OF FEATURE MODELS 29
Similarly, Acher et al. describe an algorithm to synthesize an FM from a propositional for-mula [18]. Instead of relying on a heuristic, their procedure processes user-specified knowledge fororganizing the hierarchy of features. The provided knowledge is a subset of the different elementsof the desired FM. If the knowledge is sufficient and consistent with the formula, the algorithmresults in an FM that exactly represent the formula and exhibit the desired hierarchy.
Previous works mainly rely on computing the satisfiability of a set of configurations or con-straints in order to build an FM. Lopez-Herrejon et al. propose a different approach with the useof search-based algorithms [125, 126]. The input of their synthesis algorithm is a table similar tothe one of Figure 3.1 that represents a set of configurations. In their procedure, candidate FMs areencoded in two arrays, one for representing the hierarchy and one for the cross-tree constraints.They propose two fitness functions for their evolutionary algorithm. The first one is based on thenumber of configurations from the generated FM that are valid with respect to the input configu-rations. The second one focuses on the difference between the configurations of the generated FMand the input configurations.
Janota et al. [115] developed an interactive editor to guide users in synthesizing an FM. Itpresents to the user the possible edit operations that respect the input proposition formula. Eachtime the user takes a decision, the next possible operations are computed. This allows to producea high quality hierarchy for the FM while ensuring its consistency with the formula. The editorrelies on binary decision diagrams to query the formula for possible edit operations.
3.2.3 Reverse Engineering Feature Models
Considering a broader view, reverse engineering techniques have been proposed to extract FMsfrom various artefacts (e.g. product descriptions [37, 80, 89, 155], architectural information [20] orsource code [139]).
Davril et al. [80] present a fully automated approach, based on prior work [99], for constructingFMs from publicly available product descriptions found in online product repositories and mar-keting websites such as SoftPedia and CNET. The proposal is evaluated in the anti-virus domain.The product descriptions on such sites are generally incomplete, lack of a unifying structure, apartfrom the product header, and propose informal descriptions using uncontrolled natural language.PCMs also aim to describe products. Contrary to informal product descriptions considered in [80],PCMs are semi-structured. We think there is an opportunity to exploit this structure to guide FMsynthesis.
Nadi et al. developed a comprehensive infrastructure to automatically extract configurationconstraints from C code [139]. In the work of Acher et al., architectural knowledge, plugins depen-dencies and the slicing operator are combined to obtain an exploitable and maintainable FM [20].In particular the feature hierarchy reflects the hierarchical structure of the system. Ryssel et al.developed methods based on Formal Concept Analysis and analyzed incidence matrices containingmatching relations [155].
Yi et al. [191] propose to apply support vector machine and genetic techniques to mine binaryconstraints (requires and excludes) from Wikipedia. This scenario is particularly relevant whendealing with incomplete dependencies. They evaluated their approach on two FMs of SPLOT.
Vacchi et al. [177] propose an approach to automatically infer a feature model from a collectionof already implemented language components. The goal is to automate the configuration of fami-lies of (domain-specific) programming languages. The evaluation showed that a substantial effortis needed to incorporate domain or ontological knowledge. Bagheri et al. [37] propose a collabo-rative process to mine and organize features using a combination of natural language processingtechniques and Wordnet. Ferrari et al. [89] apply natural language processing techniques to minecommonalities and variabilities from brochures.
Alves et al. [28], Niu et al. [141], Weston et al. [187], and Chen et al. [58] applied informationretrieval techniques to abstract requirements from existing specifications, typically expressed innatural language. These works do not consider precise logical dependencies and solely focus onontological semantics. As a result users have to manually set the variability information. Moreovera risk is to build an FM in contradiction with the actual dependencies of a system.
The techniques exposed in this section are considering other kinds of inputs than PCMs. Anotable exception is the work of Acher et al. who propose a semi-automated procedure to support

30 CHAPTER 3. FEATURE MODELING
the transition from product descriptions expressed in a tabular format to FMs [21]. Similar to ourapproach in Part II, the procedure uses a metamodel to normalize the PCM. The authors created alanguage called VariCell that allows to specify directives and parameters for the transformation of aCSV file into this metamodel. In particular, the user can define the semantics of the content of thecells regarding variability information (e.g. the keyword "optional" defines an optional feature).Then, the procedure consists in deriving an FM for each product of the PCM and finally merge allthese PCMs into a single one. This work acts as a preliminary step towards the techniques exposedin this thesis.
3.2.4 Tool support
There are numerous existing academic or industrial tools for specifying and reasoning about FMs.FeatureIDE [173,174] is an Eclipse-based IDE that supports all phases of feature-oriented softwaredevelopment for the development of product lines (domain analysis, domain implementation, re-quirements analysis and software generation). FAMA (Feature Model Analyser) [43] is a frameworkfor the automated analysis of FMs integrating some of the most commonly used logic represen-tations and solvers. SPLOT [131] provides a Web-based environment for editing and configuringFMs. S2T2 [144] is a tool for the configuration of large FMs. Weston et al. [187] provided a toolframework ArborCraft which automatically processes natural-language requirements documentsinto a candidate FM, which can be refined by the requirements engineers. Commercial solutions(pure::variants [148] and Gears [122]) also provide a comprehensive support for product lines (fromFMs to model/source code derivation).
3.3 Conclusion
As PCMs are views on product lines, feature modeling is a good candidate for the formalizationof PCMs. Yet the design of an FM is an error-prone and tedious task. Numerous works addressthe synthesis or reverse engineering of FMs from various artifacts. Table 3.2 is a PCM that givesan overview of the state of the art synthesis techniques that produce FMs. The products arethe techniques and the features are the input artifacts as well as the precision, the maximalityand quality of the resulting FM. From this table and previous discussions, we observe two mainlimitations of current practice.
A first limitation is the lack of support for synthesizing FMs that exactly represents the inputartifacts and exhibit a meaningful hierarchy. In other words, prior works often foster configurationsemantics over ontological semantics or vice versa. In Chapter 7, we develop heuristics and aninteractive environment for guiding the construction of the hierarchy of the FM. Our techniquesimprove the ontological semantics of the resulting FM while preserving a sound and completesynthesis.
A second limitation is the focus on Boolean FMs. The formalization of PCMs with Boolean FMsis unlikely due to the presence of numerical and textual values. As we have seen in Section 3.1.3,attributed FMs address the problem by capturing these kinds of information in attributes. Despitethe availability of some tools and languages supporting attributes [39, 44, 60, 84], no prior workconsider the synthesis of attributed FMs. In Chapter 8, we present the first algorithm for synthe-sizing attributed FMs. We consider a special class of PCMs as input that we call configurationmatrices. Intuitively, these are PCMs that are well structured and defined in order to easily derivethe underlying configuration semantics.
Overall, the only work on the synthesis of FMs from PCMs is [21] and act as a basis for thisthesis. Our challenge is to investigate the possible semantic and syntactic gap between PCMs andFMs and develop FM synthesis techniques for this new kind of input.
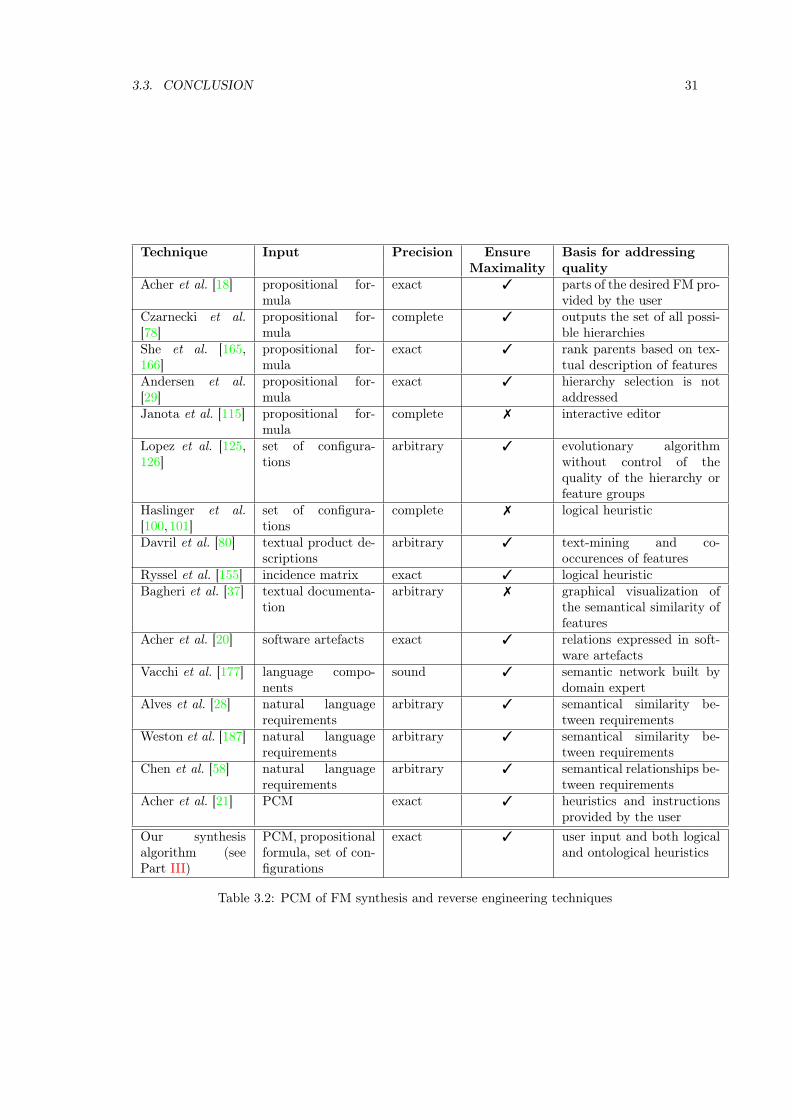
3.3. CONCLUSION 31
Technique Input Precision Ensure Basis for addressingMaximality quality
Acher et al. [18] propositional for-mula
exact ✓ parts of the desired FM pro-vided by the user
Czarnecki et al.[78]
propositional for-mula
complete ✓ outputs the set of all possi-ble hierarchies
She et al. [165,166]
propositional for-mula
exact ✓ rank parents based on tex-tual description of features
Andersen et al.[29]
propositional for-mula
exact ✓ hierarchy selection is notaddressed
Janota et al. [115] propositional for-mula
complete ✗ interactive editor
Lopez et al. [125,126]
set of configura-tions
arbitrary ✓ evolutionary algorithmwithout control of thequality of the hierarchy orfeature groups
Haslinger et al.[100,101]
set of configura-tions
complete ✗ logical heuristic
Davril et al. [80] textual product de-scriptions
arbitrary ✓ text-mining and co-occurences of features
Ryssel et al. [155] incidence matrix exact ✓ logical heuristicBagheri et al. [37] textual documenta-
tionarbitrary ✗ graphical visualization of
the semantical similarity offeatures
Acher et al. [20] software artefacts exact ✓ relations expressed in soft-ware artefacts
Vacchi et al. [177] language compo-nents
sound ✓ semantic network built bydomain expert
Alves et al. [28] natural languagerequirements
arbitrary ✓ semantical similarity be-tween requirements
Weston et al. [187] natural languagerequirements
arbitrary ✓ semantical similarity be-tween requirements
Chen et al. [58] natural languagerequirements
arbitrary ✓ semantical relationships be-tween requirements
Acher et al. [21] PCM exact ✓ heuristics and instructionsprovided by the user
Our synthesisalgorithm (seePart III)
PCM, propositionalformula, set of con-figurations
exact ✓ user input and both logicaland ontological heuristics
Table 3.2: PCM of FM synthesis and reverse engineering techniques

Part II
OpenCompare: a Framework for
Product Comparison Matrices
33


Chapter 4
A Model-Based Approach Driven By Data, Users
and Services
"Welcome...to the desert of the real."
Morpheus
As we explained in Chapter 2, there is no exisiting formalism dedictated to PCMs. To addressthe problem, we consider the development of a model-based approach. With a model-based ap-proach, we can precisely define the structure and semantics of a PCM with a metamodel. Moreover,a metamodel is approriate for querying, reasoning or editing a model. We can also develop a setof transformations in order to derive PCM models from raw PCMs. In case the metamodel is notapproriate for a specific task, we can derive other formalisms such as ontologies, spreadsheets orother metamodels.
In this chapter, we first present the case study of Wikipedia which will be the center of theevaluation of our approach (see Section 4.1). Then, we describe three objectives of designinga model-based approach for PCMs (see Section 4.2). For each objective, we identify a relatedresearch question to evaluate the effectiveness of our approach. In Section 4.3, we highlight thechallenges of developing a model-based approach in the context of PCMs. Finally, we present ourmethodology for addressing these challenges (see Section 4.4). It is based on an iterative processdriven by data, end-users and services. This methodology will be used in both Chapter 5 andChapter 6.
4.1 The Wikipedia Case Study
Wikipedia is an online encyclopedia based on the MediaWiki wiki engine. Wikipedia is separatedby languages. The English version reached a total of 5,000,000 articles on 1st November, 2015 whichrepresents the largest corpus of articles in Wikipedia. We estimate that this version contains atleast 1,500,000 tables. During our various experiments, we observed hundreds of PCMs. Therefore,Wikipedia represents a large dataset of publicly available PCMs. For example, Figure 4.1 shows aPCM comparing Web conferencing software.
The basis of Wikipedia is to allow anyone to contribute to the encyclopedia. For that purpose,it offers a built-in textual editor for modifying the so called wikitext which is the internal repre-sentation of an article. The wikitext syntax is derived from markdown languages and aim to besimple to read and edit. Yet, when it comes to the creation of tables, the syntax quickly showsits limits. For example, Figure 4.2 shows an excerpt of the wikitext code extracted from the PCMof Figure 4.1. The documentation of MediaWiki even states that "as a general rule, it is best toavoid using a table unless you need one. Table markup often complicates page editing" [130].
Concerning tables, the capabilities of the language are very limited and close to what we canobserve in HTML or CSV. It is based on 3 main operators in order to create new tables ({|), rows
35

36CHAPTER 4. A MODEL-BASED APPROACH DRIVEN BY DATA, USERS AND SERVICES
Figure 4.1: Example of a PCM in Wikipedia [65]
{ | c en te r ; " c l a s s="w ik i t ab l e s o r t ab l e "|−! Program! L icense! Simultaneous User Capacity! Linux[ [ Image :Tux . svg |25 px | Linux ] ]! Mac OS X. . .! Recording c a p a b i l i t i e s|−| {{ rh }} | [ http ://www . . . ]| [ [ Propr i e ta ry so f tware l i c e n s e | Propr i e ta ry ] ]| {{ Sort |0000500|1−1500 (80 ,000 w/webcast )}}| {{Yes | ?}}| . . .| {{Yes |?}}< r e f name="ReferenceA">Supports two−way . . . i n t e g r a t i on </re f >| {{Yes | }}VGA, HQ, HD<re f >[ http ://www. ad . . . ]Retr i eved on 2014−02−27.</ re f >| {{Yes | ?}}. . .| {{No |X}}|−
Figure 4.2: Code snippet in wikitext of the table of Figure 4.1
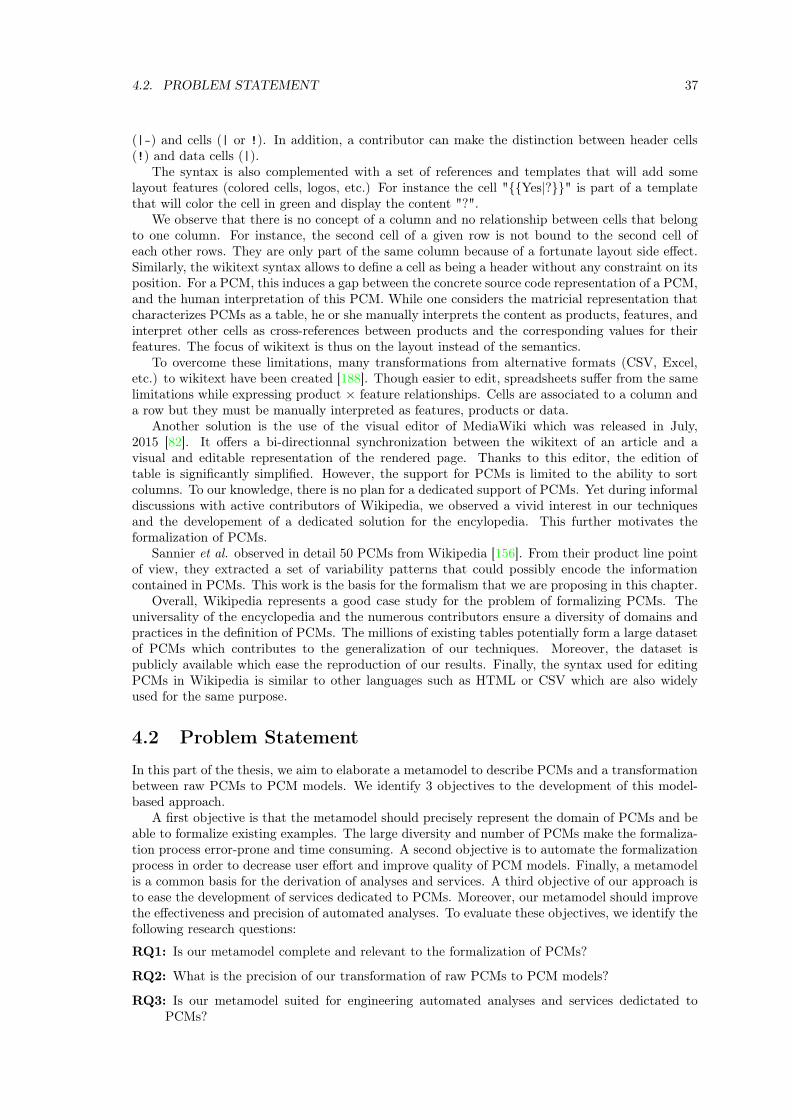
4.2. PROBLEM STATEMENT 37
(|-) and cells (| or !). In addition, a contributor can make the distinction between header cells(!) and data cells (|).
The syntax is also complemented with a set of references and templates that will add somelayout features (colored cells, logos, etc.) For instance the cell "{{Yes|?}}" is part of a templatethat will color the cell in green and display the content "?".
We observe that there is no concept of a column and no relationship between cells that belongto one column. For instance, the second cell of a given row is not bound to the second cell ofeach other rows. They are only part of the same column because of a fortunate layout side effect.Similarly, the wikitext syntax allows to define a cell as being a header without any constraint on itsposition. For a PCM, this induces a gap between the concrete source code representation of a PCM,and the human interpretation of this PCM. While one considers the matricial representation thatcharacterizes PCMs as a table, he or she manually interprets the content as products, features, andinterpret other cells as cross-references between products and the corresponding values for theirfeatures. The focus of wikitext is thus on the layout instead of the semantics.
To overcome these limitations, many transformations from alternative formats (CSV, Excel,etc.) to wikitext have been created [188]. Though easier to edit, spreadsheets suffer from the samelimitations while expressing product × feature relationships. Cells are associated to a column anda row but they must be manually interpreted as features, products or data.
Another solution is the use of the visual editor of MediaWiki which was released in July,2015 [82]. It offers a bi-directionnal synchronization between the wikitext of an article and avisual and editable representation of the rendered page. Thanks to this editor, the edition oftable is significantly simplified. However, the support for PCMs is limited to the ability to sortcolumns. To our knowledge, there is no plan for a dedicated support of PCMs. Yet during informaldiscussions with active contributors of Wikipedia, we observed a vivid interest in our techniquesand the developement of a dedicated solution for the encylopedia. This further motivates theformalization of PCMs.
Sannier et al. observed in detail 50 PCMs from Wikipedia [156]. From their product line pointof view, they extracted a set of variability patterns that could possibly encode the informationcontained in PCMs. This work is the basis for the formalism that we are proposing in this chapter.
Overall, Wikipedia represents a good case study for the problem of formalizing PCMs. Theuniversality of the encyclopedia and the numerous contributors ensure a diversity of domains andpractices in the definition of PCMs. The millions of existing tables potentially form a large datasetof PCMs which contributes to the generalization of our techniques. Moreover, the dataset ispublicly available which ease the reproduction of our results. Finally, the syntax used for editingPCMs in Wikipedia is similar to other languages such as HTML or CSV which are also widelyused for the same purpose.
4.2 Problem Statement
In this part of the thesis, we aim to elaborate a metamodel to describe PCMs and a transformationbetween raw PCMs to PCM models. We identify 3 objectives to the development of this model-based approach.
A first objective is that the metamodel should precisely represent the domain of PCMs and beable to formalize existing examples. The large diversity and number of PCMs make the formaliza-tion process error-prone and time consuming. A second objective is to automate the formalizationprocess in order to decrease user effort and improve quality of PCM models. Finally, a metamodelis a common basis for the derivation of analyses and services. A third objective of our approach isto ease the development of services dedicated to PCMs. Moreover, our metamodel should improvethe effectiveness and precision of automated analyses. To evaluate these objectives, we identify thefollowing research questions:
RQ1: Is our metamodel complete and relevant to the formalization of PCMs?
RQ2: What is the precision of our transformation of raw PCMs to PCM models?
RQ3: Is our metamodel suited for engineering automated analyses and services dedictated toPCMs?
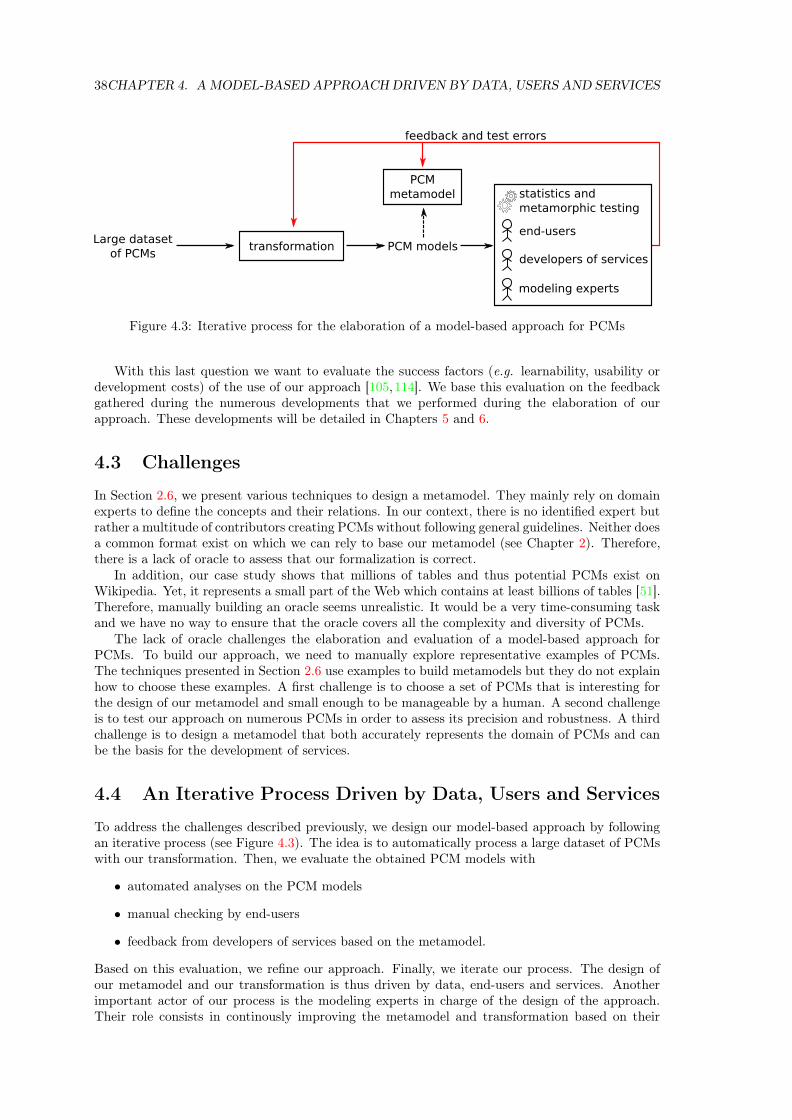
38CHAPTER 4. A MODEL-BASED APPROACH DRIVEN BY DATA, USERS AND SERVICES
transformationLarge dataset
of PCMsPCM models
PCM
metamodel
feedback and test errors
end-users
developers of services
modeling experts
statistics and
metamorphic testing
Figure 4.3: Iterative process for the elaboration of a model-based approach for PCMs
With this last question we want to evaluate the success factors (e.g. learnability, usability ordevelopment costs) of the use of our approach [105,114]. We base this evaluation on the feedbackgathered during the numerous developments that we performed during the elaboration of ourapproach. These developments will be detailed in Chapters 5 and 6.
4.3 Challenges
In Section 2.6, we present various techniques to design a metamodel. They mainly rely on domainexperts to define the concepts and their relations. In our context, there is no identified expert butrather a multitude of contributors creating PCMs without following general guidelines. Neither doesa common format exist on which we can rely to base our metamodel (see Chapter 2). Therefore,there is a lack of oracle to assess that our formalization is correct.
In addition, our case study shows that millions of tables and thus potential PCMs exist onWikipedia. Yet, it represents a small part of the Web which contains at least billions of tables [51].Therefore, manually building an oracle seems unrealistic. It would be a very time-consuming taskand we have no way to ensure that the oracle covers all the complexity and diversity of PCMs.
The lack of oracle challenges the elaboration and evaluation of a model-based approach forPCMs. To build our approach, we need to manually explore representative examples of PCMs.The techniques presented in Section 2.6 use examples to build metamodels but they do not explainhow to choose these examples. A first challenge is to choose a set of PCMs that is interesting forthe design of our metamodel and small enough to be manageable by a human. A second challengeis to test our approach on numerous PCMs in order to assess its precision and robustness. A thirdchallenge is to design a metamodel that both accurately represents the domain of PCMs and canbe the basis for the development of services.
4.4 An Iterative Process Driven by Data, Users and Services
To address the challenges described previously, we design our model-based approach by followingan iterative process (see Figure 4.3). The idea is to automatically process a large dataset of PCMswith our transformation. Then, we evaluate the obtained PCM models with
• automated analyses on the PCM models
• manual checking by end-users
• feedback from developers of services based on the metamodel.
Based on this evaluation, we refine our approach. Finally, we iterate our process. The design ofour metamodel and our transformation is thus driven by data, end-users and services. Anotherimportant actor of our process is the modeling experts in charge of the design of the approach.Their role consists in continously improving the metamodel and transformation based on their

4.4. AN ITERATIVE PROCESS DRIVEN BY DATA, USERS AND SERVICES 39
evaluation. They ensures the idea behind the metamodel is preserved throughout the iterations.In the case of PCMs, we ensure that the metamodel reflects the idea that a PCM is a representationof a product line. We also check that we do not get influenced too much by the dataset of PCMsthat we analyze. Otherwise, we could introduce too much complexity in the metamodel in orderto represent the dataset.
In Chapters 5 and 6, we elaborate two versions of our approach based on this iterative process.The resulting metamodels and transformations as well as their evaluation are presented in detailsin these chapters.
4.4.1 Initialization
To initiate our process, we need to build a first version of the metamodel and transformation.This step requires a manual analysis of examples of PCMs. The base of our analysis is the studyrealized by Sannier et al. [156]. They studied more than 300 PCMs from Wikipedia. Moreover,they adopted a product line point of view that we also find in our approach. We also perform adetailed analysis of tens of PCMs also from Wikipedia.
4.4.2 Evaluating Our Metamodel and Transformation
Once we have a metamodel and a transformation, we must evaluate them according to our 3research questions. For that purpose, we have 3 sources of feedback: data, end-users and services.
Data. To gather feedback from the data, we perform two analyses. First, we compute statisticson all the PCM models that we extract from raw PCMs. In particular, we analyze the usage ofconcepts in our metamodel. If a concept is never used, it may indicate that the concept is notrelevant for PCMs can be removed from the metamodel. Another possibility is the presence ofa bug in our transformation that fails to extract such concept from our dataset of PCMs. If aconcept is very often used, we may want to separate it in sub-concepts in order to increase theexpressiveness and precision of our metamodel.
The second analysis consists in testing the robustness and precision of our transformation byusing metamorphic testing [59]. Metamorphic testing uses properties of the software under testingto assess its correctness without relying on an oracle. In our case, we exploit the property thatgiven a PCM model m and a format f , the following equality holds: importf (exportf (m)) = m. Inother words, exporting a PCM in a particular format (e.g. CSV, HTML or wikitext) and importingit back should result in the exact same PCM. In Chapter 6, we implemented 4 couples of importersand exporters: HTML, CSV, wikitext and JSON. Thanks to metamorphic testing, we can testour importing and exporting capabilities on millions of PCMs from Wikipedia. Therefore, we canautomatically explore a large diversity of PCMs. Moreover, the failing metamorphic tests give usimportant feedback for improving our transformation of raw PCMs to PCM models.
Users. To gather feedback from end-users, we use an editor dedicated to PCMs and built ontop of our metamodel. The editor allows to present the concrete syntax of the PCM models tothe evaluator instead of directly presenting the metamodel or a model in graph notation (e.g. theobject diagram notation of UML). The main advantage of using the concrete syntax is to displaya familiar view of a PCM. As such, there is no need for modeling knowledge to check that ourformalization is correct. The participants evaluate the metamodel as end-users.
Services. To gather feedback from the developers of services, we conduct several experimentsin order to create services based on our metamodel (see Chapters 5 and 6 for more details). Thedevelopment of the editor used by end-users is part of these experiments. We developed also otherservices such as a comparator, a configuration and visualizations. By having a significant number ofservices and developers involved we can gather valuable feedback on the usability, expressivenessand learnability of the metamodel. This allows us to check that our approach is suited for thedevelopment of services.

40CHAPTER 4. A MODEL-BASED APPROACH DRIVEN BY DATA, USERS AND SERVICES
4.4.3 Bootstraping
Based on the feedback gathered during the evaluation of our approach, we refine our metamodeland transformation. Then, we can bootstrap our iterative process by executing the new versionof the transformation in order to get a new set of PCM models to evaluate. At each iteration, weimprove our formalization technique. As a consequence, we improve the quality of the generatedPCM models. As we base our evaluation on these models, we can gather new feedback. Thiscreates a virtuous circle.
4.5 Conclusion
To address the formalization of PCMs, we adopt a model-based approach. It consists in a creating ametamodel for PCMs and a transformation from raw PCMs to PCM models. The lack of identifiedexpert and existing oracle challenges the elaboration and evaluation of our approach. Moreover, thelarge number and diversity of existing PCMs hinders the manual design of an oracle. To addressthese challenges, we propose an iterative process driven by data, end-users and services. Wikipediacontains numerous PCMs created by various contributors on multiple domains. We think that itconstitutes a representative dataset of PCMs on which we can base our evaluation.
In Chapter 5, we present the result of a first batch of iterations of our process. It results in ametamodel and a transformation that allows a precise formalization of PCMs. Yet, the feedbackgathered during the development of multiple services shows that the metamodel is not satisfactoryfor addressing all requirements and tasks (related to interoperability, edition, and manipulation).In Chapter 6, we address this problem by separating the different concerns of our metamodel intomultiple metamodels. We present the result of a second of iteration in which we consider thecomprehensive dataset of Wikipedia PCMs for our evaluation.

Chapter 5
Automating the Formalization of PCMs
"Neo, sooner or later you’re going to realize just as I didthat there’s a difference between knowing the path andwalking the path."
Morpheus
In this chapter, we explore a first approach to address the problem of formalizing PCMs.Figure 5.1 presents an overview of our automated model-based approach for formalizing PCMs.The central element of our approach is a metamodel defining the structure and semantics of a PCM(see 1 of Figure 5.1 and Section 5.1). Based on this metamodel, we develop a transformationchain for automatically transforming raw PCMs into PCM models. It consists in three phases:parsing, processing and extracting information (see 2 , 3 , and 4 of Figure 5.1 and Section 5.2 fordetails). We empirically evaluate our approach according to the three research questions defined inChapter 4. We base our evaluation on the analysis of 75 PCMs from Wikipedia by 20 participants(see Section 5.3). To support the different tasks of our evaluation, we developed a Web-based editorfor PCMs. We also asked 20 Master students from the University of Rennes 1 to develop anothereditor and an API for the manipulation of PCMs (see 5 of Figure 5.1). These two developmentexperiences are also part of our evaluation. Finally, we discuss threats to validity (see Section 5.4)and conclude the chapter (see Section 5.5).
5.1 The PCM Metamodel
Figure 5.2 presents the PCM metamodel obtained by following the iterative process described inChapter 4.This metamodel describes both the structure and the semantics of the PCM domain.In this metamodel, PCMs are not individual matrices but a set of different matrices that containcells. This separation usually happens when comparing a large set of products or features. In orderto preserve readability, PCM writers can split the PCM content into several matrices. Cells canbe of 3 types: Header, ValuedCell, and Extra. Header cells identify products or features.
preprocessing extracting
information
exploitingparsing
conforms to
PCM metamodel
Automated formalization
configuration file
Wikipedia code
HTML file
CSV file
...
PCM
PCM editor
comparator
...
Applications
PCM
modelPCM
modelPCM
model
2
RQ1
RQ2
3
1
4
5
RQ3
Figure 5.1: Global View of our Automated Formalization of PCMs
41
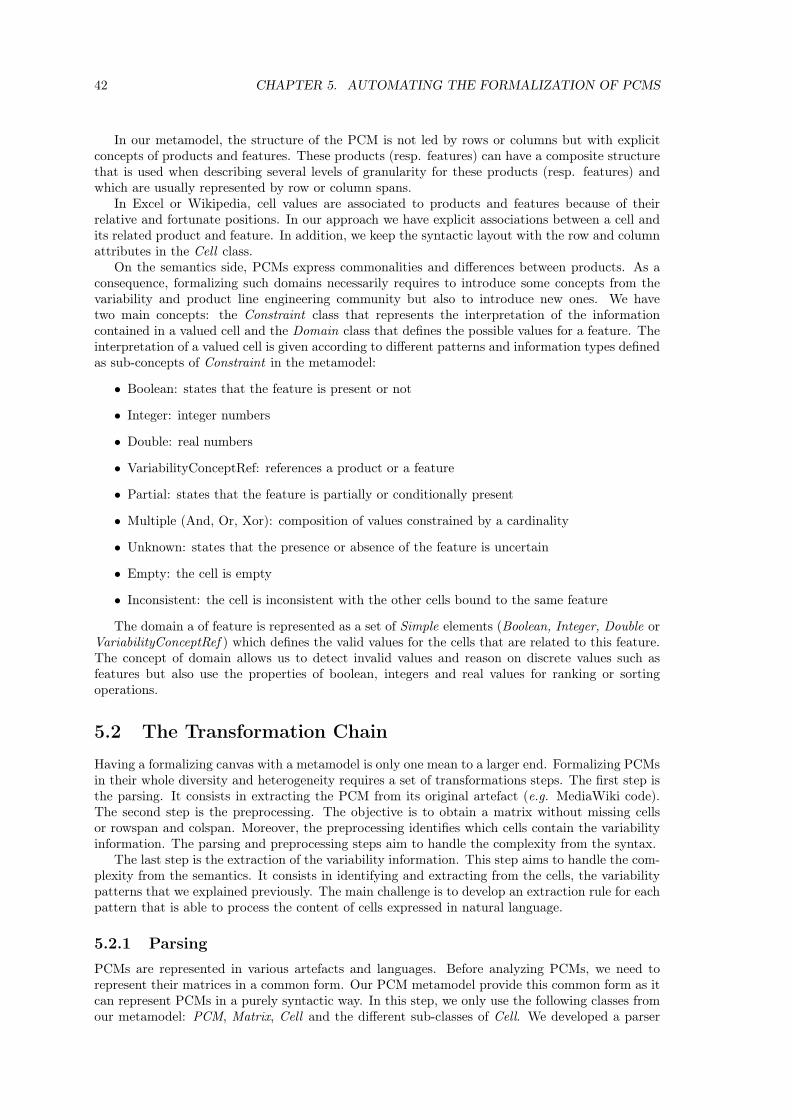
42 CHAPTER 5. AUTOMATING THE FORMALIZATION OF PCMS
In our metamodel, the structure of the PCM is not led by rows or columns but with explicitconcepts of products and features. These products (resp. features) can have a composite structurethat is used when describing several levels of granularity for these products (resp. features) andwhich are usually represented by row or column spans.
In Excel or Wikipedia, cell values are associated to products and features because of theirrelative and fortunate positions. In our approach we have explicit associations between a cell andits related product and feature. In addition, we keep the syntactic layout with the row and columnattributes in the Cell class.
On the semantics side, PCMs express commonalities and differences between products. As aconsequence, formalizing such domains necessarily requires to introduce some concepts from thevariability and product line engineering community but also to introduce new ones. We havetwo main concepts: the Constraint class that represents the interpretation of the informationcontained in a valued cell and the Domain class that defines the possible values for a feature. Theinterpretation of a valued cell is given according to different patterns and information types definedas sub-concepts of Constraint in the metamodel:
• Boolean: states that the feature is present or not
• Integer: integer numbers
• Double: real numbers
• VariabilityConceptRef: references a product or a feature
• Partial: states that the feature is partially or conditionally present
• Multiple (And, Or, Xor): composition of values constrained by a cardinality
• Unknown: states that the presence or absence of the feature is uncertain
• Empty: the cell is empty
• Inconsistent: the cell is inconsistent with the other cells bound to the same feature
The domain a of feature is represented as a set of Simple elements (Boolean, Integer, Double orVariabilityConceptRef ) which defines the valid values for the cells that are related to this feature.The concept of domain allows us to detect invalid values and reason on discrete values such asfeatures but also use the properties of boolean, integers and real values for ranking or sortingoperations.
5.2 The Transformation Chain
Having a formalizing canvas with a metamodel is only one mean to a larger end. Formalizing PCMsin their whole diversity and heterogeneity requires a set of transformations steps. The first step isthe parsing. It consists in extracting the PCM from its original artefact (e.g. MediaWiki code).The second step is the preprocessing. The objective is to obtain a matrix without missing cellsor rowspan and colspan. Moreover, the preprocessing identifies which cells contain the variabilityinformation. The parsing and preprocessing steps aim to handle the complexity from the syntax.
The last step is the extraction of the variability information. This step aims to handle the com-plexity from the semantics. It consists in identifying and extracting from the cells, the variabilitypatterns that we explained previously. The main challenge is to develop an extraction rule for eachpattern that is able to process the content of cells expressed in natural language.
5.2.1 Parsing
PCMs are represented in various artefacts and languages. Before analyzing PCMs, we need torepresent their matrices in a common form. Our PCM metamodel provide this common form as itcan represent PCMs in a purely syntactic way. In this step, we only use the following classes fromour metamodel: PCM, Matrix, Cell and the different sub-classes of Cell. We developed a parser
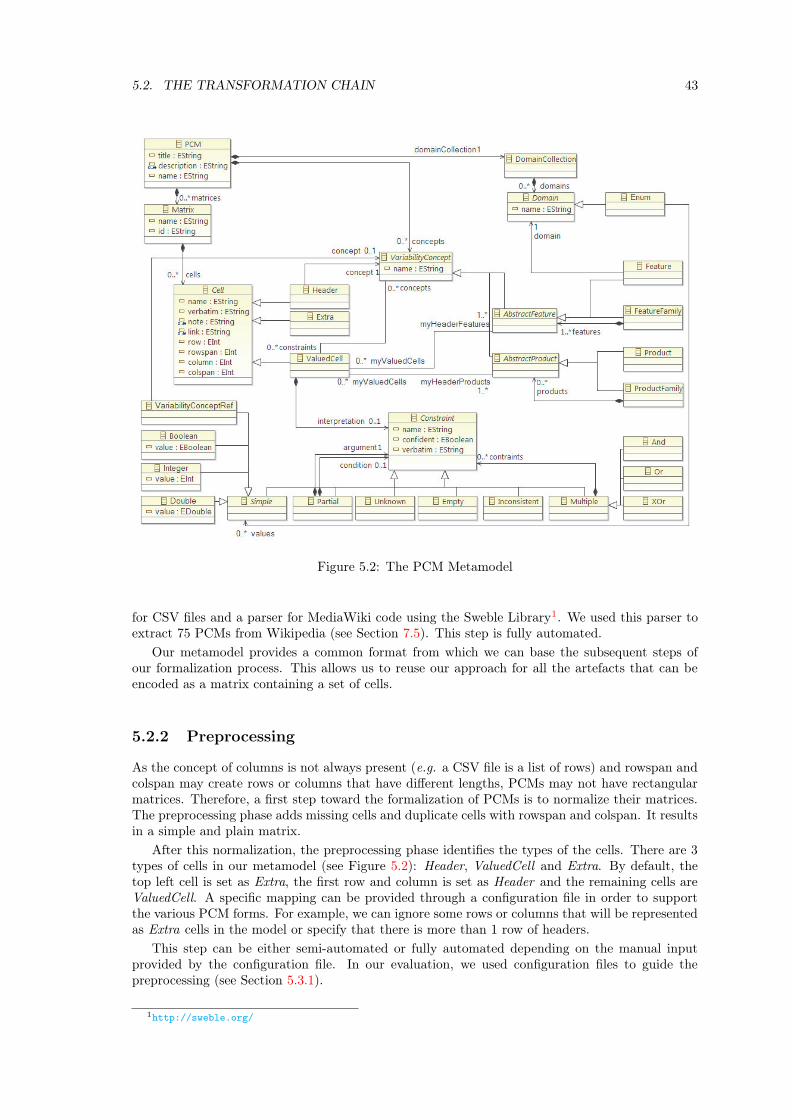
5.2. THE TRANSFORMATION CHAIN 43
Figure 5.2: The PCM Metamodel
for CSV files and a parser for MediaWiki code using the Sweble Library1. We used this parser toextract 75 PCMs from Wikipedia (see Section 7.5). This step is fully automated.
Our metamodel provides a common format from which we can base the subsequent steps ofour formalization process. This allows us to reuse our approach for all the artefacts that can beencoded as a matrix containing a set of cells.
5.2.2 Preprocessing
As the concept of columns is not always present (e.g. a CSV file is a list of rows) and rowspan andcolspan may create rows or columns that have different lengths, PCMs may not have rectangularmatrices. Therefore, a first step toward the formalization of PCMs is to normalize their matrices.The preprocessing phase adds missing cells and duplicate cells with rowspan and colspan. It resultsin a simple and plain matrix.
After this normalization, the preprocessing phase identifies the types of the cells. There are 3types of cells in our metamodel (see Figure 5.2): Header, ValuedCell and Extra. By default, thetop left cell is set as Extra, the first row and column is set as Header and the remaining cells areValuedCell. A specific mapping can be provided through a configuration file in order to supportthe various PCM forms. For example, we can ignore some rows or columns that will be representedas Extra cells in the model or specify that there is more than 1 row of headers.
This step can be either semi-automated or fully automated depending on the manual inputprovided by the configuration file. In our evaluation, we used configuration files to guide thepreprocessing (see Section 5.3.1).
1http://sweble.org/
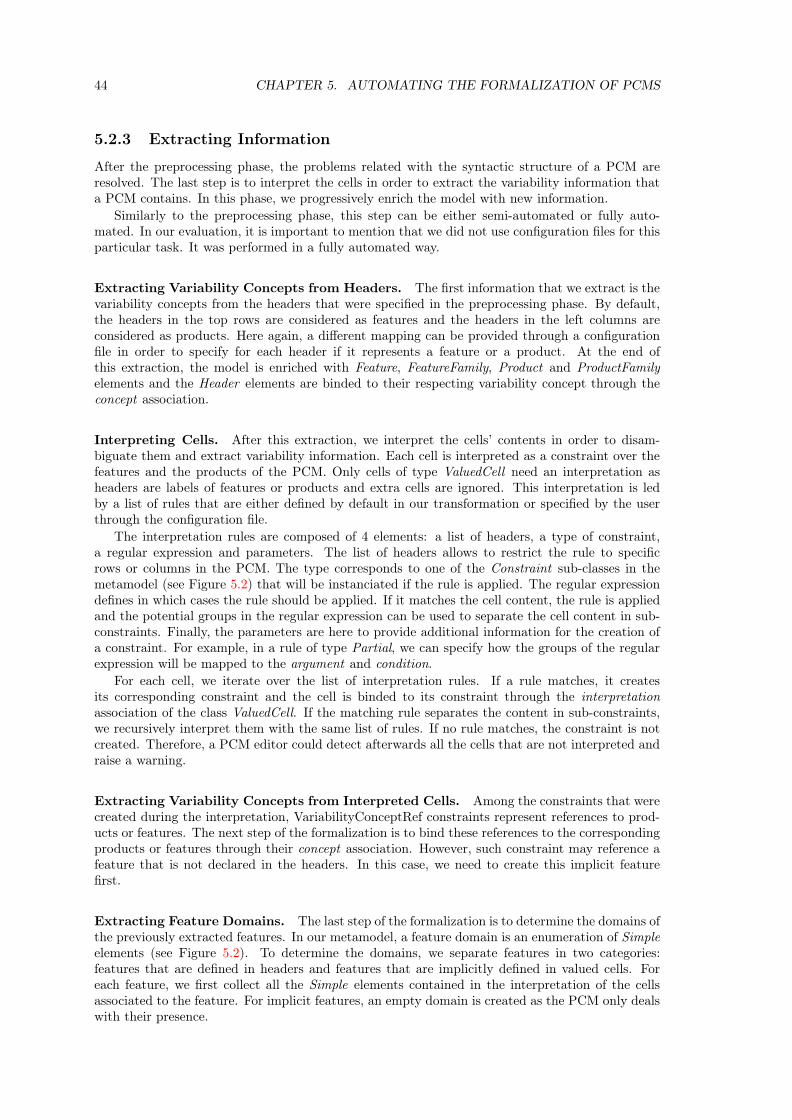
44 CHAPTER 5. AUTOMATING THE FORMALIZATION OF PCMS
5.2.3 Extracting Information
After the preprocessing phase, the problems related with the syntactic structure of a PCM areresolved. The last step is to interpret the cells in order to extract the variability information thata PCM contains. In this phase, we progressively enrich the model with new information.
Similarly to the preprocessing phase, this step can be either semi-automated or fully auto-mated. In our evaluation, it is important to mention that we did not use configuration files for thisparticular task. It was performed in a fully automated way.
Extracting Variability Concepts from Headers. The first information that we extract is thevariability concepts from the headers that were specified in the preprocessing phase. By default,the headers in the top rows are considered as features and the headers in the left columns areconsidered as products. Here again, a different mapping can be provided through a configurationfile in order to specify for each header if it represents a feature or a product. At the end ofthis extraction, the model is enriched with Feature, FeatureFamily, Product and ProductFamilyelements and the Header elements are binded to their respecting variability concept through theconcept association.
Interpreting Cells. After this extraction, we interpret the cells’ contents in order to disam-biguate them and extract variability information. Each cell is interpreted as a constraint over thefeatures and the products of the PCM. Only cells of type ValuedCell need an interpretation asheaders are labels of features or products and extra cells are ignored. This interpretation is ledby a list of rules that are either defined by default in our transformation or specified by the userthrough the configuration file.
The interpretation rules are composed of 4 elements: a list of headers, a type of constraint,a regular expression and parameters. The list of headers allows to restrict the rule to specificrows or columns in the PCM. The type corresponds to one of the Constraint sub-classes in themetamodel (see Figure 5.2) that will be instanciated if the rule is applied. The regular expressiondefines in which cases the rule should be applied. If it matches the cell content, the rule is appliedand the potential groups in the regular expression can be used to separate the cell content in sub-constraints. Finally, the parameters are here to provide additional information for the creation ofa constraint. For example, in a rule of type Partial, we can specify how the groups of the regularexpression will be mapped to the argument and condition.
For each cell, we iterate over the list of interpretation rules. If a rule matches, it createsits corresponding constraint and the cell is binded to its constraint through the interpretationassociation of the class ValuedCell. If the matching rule separates the content in sub-constraints,we recursively interpret them with the same list of rules. If no rule matches, the constraint is notcreated. Therefore, a PCM editor could detect afterwards all the cells that are not interpreted andraise a warning.
Extracting Variability Concepts from Interpreted Cells. Among the constraints that werecreated during the interpretation, VariabilityConceptRef constraints represent references to prod-ucts or features. The next step of the formalization is to bind these references to the correspondingproducts or features through their concept association. However, such constraint may reference afeature that is not declared in the headers. In this case, we need to create this implicit featurefirst.
Extracting Feature Domains. The last step of the formalization is to determine the domains ofthe previously extracted features. In our metamodel, a feature domain is an enumeration of Simpleelements (see Figure 5.2). To determine the domains, we separate features in two categories:features that are defined in headers and features that are implicitly defined in valued cells. Foreach feature, we first collect all the Simple elements contained in the interpretation of the cellsassociated to the feature. For implicit features, an empty domain is created as the PCM only dealswith their presence.

5.3. EVALUATION 45
For features in headers, we group their domain elements according to their types (Integer andDouble elements are grouped together as they both represent numbers). We select the group withthe maximum size as it represents, potentially, the most correct type of values regarding the feature.
If it is a boolean or number group, we directly add its values in the domain of the feature.However, if it is a group with VariabilityConceptRef elements, we perform hierarchical clusteringon it to remove rare values. This selection of valid values for a feature, allow to highlight the cellsthat are possibility inconsistent with respect to the majority.
5.3 Evaluation
In this section, we evaluate our solution for automatically formalizing PCMs with respect tothe three research questions of Chapter 4. First, we present the dataset and conditions of ourexperiments for RQ1 and RQ2. Then, we discuss our results for all the research questions.Our dataset, empirical results, and the set of tools used in the evaluation are available online:http://tinyurl.com/PCMFormalization.
5.3.1 Experimental Settings for RQ1 and RQ2
Dataset. We selected 75 PCMs from Wikipedia. Though most of them are related to software(audio player software, browser synchronizers, application launchers, disc images, etc) our samplealso covers a very large spectrum of domains. This includes domains such as photography andtechnology (digital SLRs, embedded computer systems), sport and hobbies (ski resorts, videogames), economy (tax preparation, enterprise bookmarking), electronics and hardware (fanlessswitches, chipsets, radio modules), history (world war II), healthcare (dental practice management,dosimeters) among others. The 75 PCMs are made of a total of 211 matrices from various sizes,going from 2 to 241 rows, and 3 to 51 columns for a total of 47267 cells.
Formalization of PCMs. Following our automated process depicted by Figure 5.1, the 75selected PCMs were first parsed into models that conform our PCM metamodel described in Section5.1. Then, we manually configured the preprocessing step in order to specify the headers and Extracells of each matrix. Among the 47267 cells of our dataset, 6800 (14.39%) are Headers, describingeither products or features. Another 992 (2.10%) are Extra cells that do not carry any valuableinformation. Finally, 39475 (83.51%) cells are considered as ValuedCells. Finally, we executed theextracting information step without configuration and only with default interpretation rules.
Metrics. To answer RQ1, we measure the distribution of the concepts of the metamodel. Wealso gather informal feedback on the relevance of each concept and check if we missed conceptsduring the design of the metamodel. To answer RQ2, we measure, for each concept, the precisionof our transformation chain.
Participants. To evaluate our research questions, each PCM was evaluated by at least one personamong a panel of 20 persons (mainly researchers and engineers) that were not aware of our work.They never saw the metamodel, neither its tooling before the experiment.
Evaluation Sessions. We organized two evaluation sessions. During these sessions we explainedto the evaluators that they will check the formalization of cells of a set of PCMs. We provideda tutorial describing the tool they will have to use, as well as the concepts they were about toevaluate and related illustrative examples.
The checking process consists of looking at each cell of a PCM and its associated formalization,i.e. the class in the metamodel. The evaluators check if the formalization corresponds to their owninterpretation of the cell. For each cell, they can:
• validate the formalization
• propose another formalization using the concepts of the metamodel

46 CHAPTER 5. AUTOMATING THE FORMALIZATION OF PCMS
• propose a new concept
• claim that there is no possible interpretation
• declare that he/she does not know at all how to analyze the cell
In addition to the validation task using the interface, evaluators were allowed to leave commentson an additional menu and to exchange with us. The feedback gathered during the different sessionsgives us the metrics to answer our research questions.
As the evaluation tool is a web application, the participants were also able to continue theevaluation on their own at a different time, though they were encouraged to complete the PCMevaluation before submitting the results. Depending of the size of the PCM (number of matrices,complexity of cells, syntactic wellformedness), evaluating a PCM takes between 5 to 20 minutes.
Evaluation Scenario. The tool proposes a randomly chosen PCM to ensure the global coverageof the 75 PCMs. Consequently, during the group session, no evaluator has the same PCM toevaluate.
Right clicking on a cell displays options to validate or not its proposed formalization. Toavoid painful individual validation, evaluators are allowed to make multiple selections for collectivevalidation or corrections. Once evaluated, the cells are colored in green, but it is still possible tomodify the evaluation. At the end, they submit their evaluation to a database and possibly startagain a new evaluation.
Evaluated Cells. Among the 39475 cells of the 75 PCMs, 20.83% were ignored (the evaluatordeclared that he/she does not know how to analyze the cell) or omitted (no results) by our eval-uators. 3.02% were subject to conflicts between evaluators (difference in the correction). As aconsequence, 30061 cells are evaluated and present analyzable results. In the following, we willanswer the research questions according to these evaluated cells.
5.3.2 RQ1: Is our metamodel complete and relevant to the formalizationof PCMs?
In this section, we aim at answering our first research question (RQ1), which is related to thedefinition of our metamodel, its soundness and completeness. We define soundness as the effectiveuse of the different metamodel concepts. We evaluate it with the number of occurrences of eachconcept of the metamodel. We define completeness as the fact that there is no missing importantconcepts in the metamodel. We evaluate it with the analysis of new concepts that our evaluatorsproposed during the evaluation.
Use of the Metamodel Concepts. During the experiment, 95.72% of the evaluated cells werevalidated or corrected with concepts of the metamodel. Only 4.28% of cells were not validatedand the evaluators proposed a new concept. In Table 5.1, we present the use of each metamodelconcept after the correction by our evaluators. In this table Multiple represents the constraintsthat were not specialized as And, Or or XOr.
First, we observe that all the concepts are used in our metamodel. The most used conceptsare Boolean, VariabilityConceptRef and Unknown. Some concepts are rarely represented such asInconsistent or XOr but our evaluators considered them as important for some cells. Yet, we stillneed to know the quality of the proposed concepts in the metamodel as well as the quality of ourclassification that we will detail in the following.
New Concepts. As stated previously, 4,28% of the cells were not validated by our evaluatorsand were corrected with a new concept. The rest of the cells were either validated or corrected withelements of the metamodel. We manually analyzed the new concepts and cluster the answers toform a new set of concepts. We provide the following observations. The very large majority of newconcepts occur less than 20 times. A lot of provided concepts are in fact noisy and unexploitable

5.3. EVALUATION 47
Table 5.1: Use of the metamodel concepts
Boolean 43.96%VariabilityConceptRef 20.21%Unknown 12.25%Empty 8.62%And 8.04%Integer 3.20%Partial 2.69%Double 0.64%Or 0.29%Inconsistent 0.07%XOr 0.02%Multiple 0.01%
elements as some evaluators provided a concept that is a variant (or a composition) of one alreadyexisting concept.
Three new concepts are clearly emerging with more than 200 occurrences: dates, dimensions -units and versions. Dimensions and units of measure are two concepts that can overlap from timeto time. Dates and versions are easier to distinguish though versions can be tagged using dates.
Our classification considers dates as integer numbers, and variability concepts when the datedescription expresses multiple concepts such as months, days, or trimesters. Our evaluators considerthat dates deserve a dedicated concept that allow to handle such expanded expressions. These 3extensions can be easily applied in our metamodel as they will be considered as specializations ofthe "Simple" metaclass.
Composing Concepts and Wellformedness. For the sake of concision, PCM authors mayalso mix different information such as versions and release dates in the same cell. If the distinctionbetween multiple concepts and their interpretation requires little effort for a human analyst, itrequires a specific operation from an automatic point of view. Our approach promotes separationof concerns, which can be translated in our example as creating two columns: one for the versionand one for the release date.
"Multiple" Specialization. While exchanging with our evaluators, one difficulty that emergedwas related to the semantics of the Multiple cell that expresses a composition with an AND, ORor XOR operator. Their semantics are simple but not intuitive and hard to determine at the PCMlevel. These operators are basic operators from a variability modeling point of view. They representimportant actors for configuration and for managing combination issues. Yet, their semantics arestill to determine from a PCM perspective.
Answer to RQ1. Regarding our research question, our metamodel proposes a set of necessaryconcepts that will have to be complemented by the three new concepts that have emerged. However,the semantics of the composition of Multiple values with AND, OR, and XOR have to be clarified.
5.3.3 RQ2: What is the precision of our transformation of raw PCMsto PCM models?
In this section, we aim at answering our second research question (RQ2), which is related to thedegree and the quality of the automation of the transformation toward a PCM model. We willhere evaluate the precision of our automated classification with respect to the empirical evaluationof our 20 evaluators and investigate on the errors made by the classifier. The precision will be theratio of valid cells among all evaluated cells.
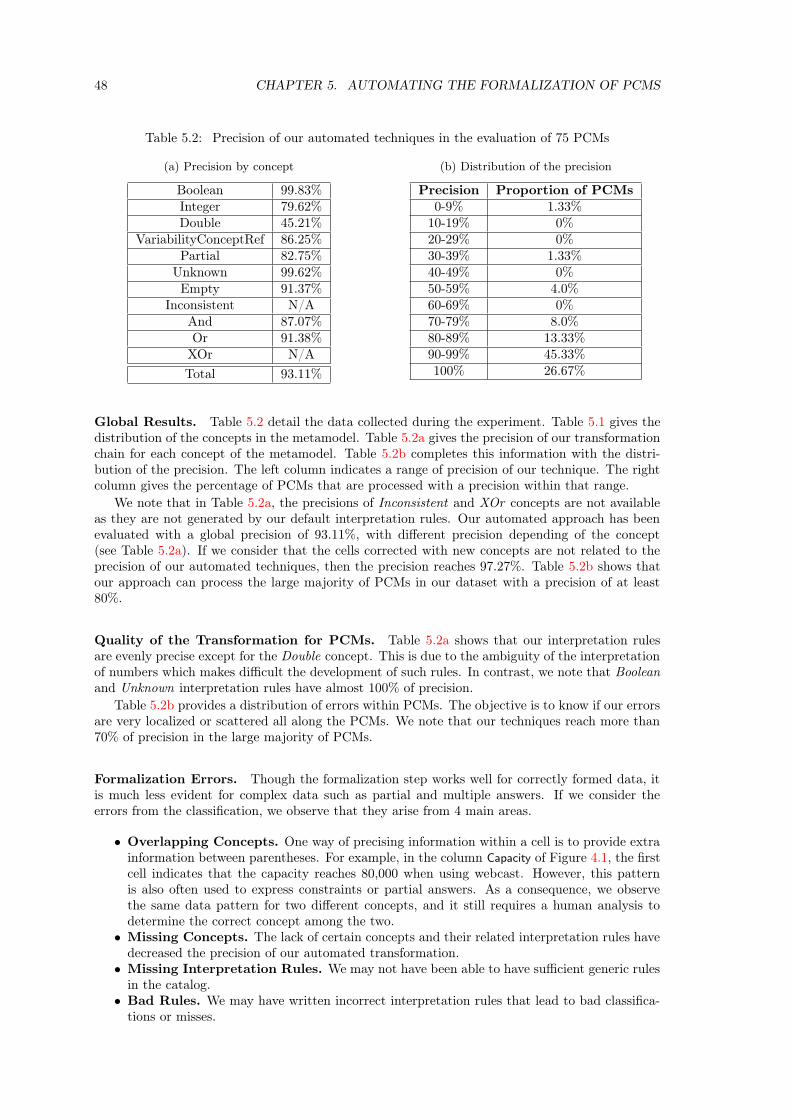
48 CHAPTER 5. AUTOMATING THE FORMALIZATION OF PCMS
Table 5.2: Precision of our automated techniques in the evaluation of 75 PCMs
(a) Precision by concept
Boolean 99.83%Integer 79.62%Double 45.21%
VariabilityConceptRef 86.25%Partial 82.75%
Unknown 99.62%Empty 91.37%
Inconsistent N/AAnd 87.07%Or 91.38%
XOr N/A
Total 93.11%
(b) Distribution of the precision
Precision Proportion of PCMs0-9% 1.33%
10-19% 0%20-29% 0%30-39% 1.33%40-49% 0%50-59% 4.0%60-69% 0%70-79% 8.0%80-89% 13.33%90-99% 45.33%100% 26.67%
Global Results. Table 5.2 detail the data collected during the experiment. Table 5.1 gives thedistribution of the concepts in the metamodel. Table 5.2a gives the precision of our transformationchain for each concept of the metamodel. Table 5.2b completes this information with the distri-bution of the precision. The left column indicates a range of precision of our technique. The rightcolumn gives the percentage of PCMs that are processed with a precision within that range.
We note that in Table 5.2a, the precisions of Inconsistent and XOr concepts are not availableas they are not generated by our default interpretation rules. Our automated approach has beenevaluated with a global precision of 93.11%, with different precision depending of the concept(see Table 5.2a). If we consider that the cells corrected with new concepts are not related to theprecision of our automated techniques, then the precision reaches 97.27%. Table 5.2b shows thatour approach can process the large majority of PCMs in our dataset with a precision of at least80%.
Quality of the Transformation for PCMs. Table 5.2a shows that our interpretation rulesare evenly precise except for the Double concept. This is due to the ambiguity of the interpretationof numbers which makes difficult the development of such rules. In contrast, we note that Booleanand Unknown interpretation rules have almost 100% of precision.
Table 5.2b provides a distribution of errors within PCMs. The objective is to know if our errorsare very localized or scattered all along the PCMs. We note that our techniques reach more than70% of precision in the large majority of PCMs.
Formalization Errors. Though the formalization step works well for correctly formed data, itis much less evident for complex data such as partial and multiple answers. If we consider theerrors from the classification, we observe that they arise from 4 main areas.
• Overlapping Concepts. One way of precising information within a cell is to provide extrainformation between parentheses. For example, in the column Capacity of Figure 4.1, the firstcell indicates that the capacity reaches 80,000 when using webcast. However, this patternis also often used to express constraints or partial answers. As a consequence, we observethe same data pattern for two different concepts, and it still requires a human analysis todetermine the correct concept among the two.
• Missing Concepts. The lack of certain concepts and their related interpretation rules havedecreased the precision of our automated transformation.
• Missing Interpretation Rules. We may not have been able to have sufficient generic rulesin the catalog.
• Bad Rules. We may have written incorrect interpretation rules that lead to bad classifica-tions or misses.

5.3. EVALUATION 49
Data Patterns and Specific Transformations. We recall that our transformation rules pro-vide a catalog of generic data patterns but also allows the customization with PCM-specific datapatterns. For instance, the Yes/No Boolean pattern can be replaced for a particular column withthe pattern X/"", where the empty cell would stand for a "No" in one specific column.
For the experiment, we did not used specific patterns for our evaluation of 75 Wikipedia PCMs,considering a full degree of automation. Customizing with PCM-specific rules can be very usefulfor re-engineering specific PCMs we want to model as part of managing legacy data, though itlowers the automation degree but increases the precision. Further work is required to determinewhen specific rules can be generic enough to be incorporated into our generic catalog. Anotherfurther work will be to assess the necessary effort to provide these specific rules.
Answer to RQ2. Regarding a fully automated approach (excepting the very first preprocessingsteps described in the protocol), our automated approach has been able to qualify our data setwith a precision of 93.11%. Though the precision differs depending on the kind of information inthe cell (as reported in table 5.2a), it is worth noticing that these results are obtained withoutany customization with PCM specific rules. Using such rules would have increased the precision.However, it requires the manual development of rules specific to a particular PCM or a particulardomain. Thus, it decreases the degree of automation of our approach.
5.3.4 RQ3: Is our metamodel suited for engineering automated analysesand services dedictated to PCMs?
One of the objectives of our model-based approach is to ease the development of automated analysesand services in comparison to the use of classic applications supporting PCMs (e.g. spreadsheets,databases and websites).
To gather feedback on the development of services based on our metamodel, we performed twodevelopment experiments. The first one is the development of the editor used in our evaluation.The second development was performed by 20 Master students from the University of Rennes 1.The students were enrolled in the object-oriented design and development course. They can beconsidered as beginners in modeling. We asked them to also develop an editor and an API for themanipulation of PCMs.
Editing and Formalizing PCMs. A first application of our metamodel is to help the userin editing and formalizing a PCM. Our metamodel offers the concepts of Feature, Product andCell which allow to focus on the edition of these concepts instead of the particularities of concreteformats (e.g. CSV, HTML or wikitext). For instance, the editor that we developed for ourevaluation allows to check that the formalization of a PCM is as expected in order to ensure itsfurther exploitation (see Figure 5.3, A). In case the formalization is incorrect, the user can directlyedit the cell content or its interpretation on a familiar tabular view while conserving a modelconformant to the PCM metamodel.
Providing Guidance. Guidance capabilities can be developed thanks to the Inconsistent con-cept in our metamodel and the computation of a domain for each feature (see Section 5.1 forfurther details). For example, an editor can warn the user that a cell content is considered asinconsistent or is not existing in its corresponding feature’s domain (see orange cells in Figure 5.3,B). These warnings can be used by a user during the edition of a PCM from scratch or during arefactoring scenario to speed up the detection of incorrect cells. For instance, spell errors can beeasily detected in a PCM without carefully reading thousands of cells.
Comparing Products. A first advantage of our metamodel over spreadsheet applications (e.g.Excel), databases or websites is that it contains explicit notions of products and features. Withour metamodel, a comparator can directly reason in terms of these variability concepts. It doesnot have to care about the structural information (rows and columns) and thus it can reorganizeproducts and features in order to visualize only the most important ones according to a user. Thecomparator can also use user-defined constraints (see Figure 5.3, C) to filter the products.
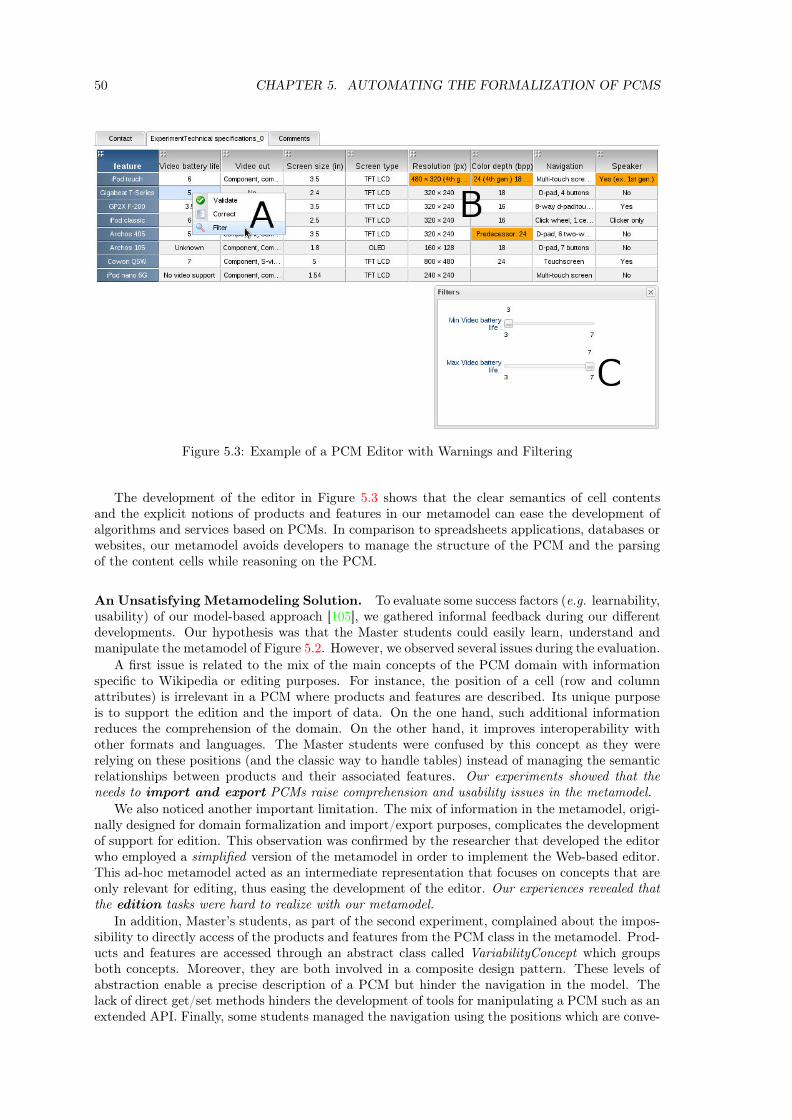
50 CHAPTER 5. AUTOMATING THE FORMALIZATION OF PCMS
Figure 5.3: Example of a PCM Editor with Warnings and Filtering
The development of the editor in Figure 5.3 shows that the clear semantics of cell contentsand the explicit notions of products and features in our metamodel can ease the development ofalgorithms and services based on PCMs. In comparison to spreadsheets applications, databases orwebsites, our metamodel avoids developers to manage the structure of the PCM and the parsingof the content cells while reasoning on the PCM.
An Unsatisfying Metamodeling Solution. To evaluate some success factors (e.g. learnability,usability) of our model-based approach [105], we gathered informal feedback during our differentdevelopments. Our hypothesis was that the Master students could easily learn, understand andmanipulate the metamodel of Figure 5.2. However, we observed several issues during the evaluation.
A first issue is related to the mix of the main concepts of the PCM domain with informationspecific to Wikipedia or editing purposes. For instance, the position of a cell (row and columnattributes) is irrelevant in a PCM where products and features are described. Its unique purposeis to support the edition and the import of data. On the one hand, such additional informationreduces the comprehension of the domain. On the other hand, it improves interoperability withother formats and languages. The Master students were confused by this concept as they wererelying on these positions (and the classic way to handle tables) instead of managing the semanticrelationships between products and their associated features. Our experiments showed that theneeds to import and export PCMs raise comprehension and usability issues in the metamodel.
We also noticed another important limitation. The mix of information in the metamodel, origi-nally designed for domain formalization and import/export purposes, complicates the developmentof support for edition. This observation was confirmed by the researcher that developed the editorwho employed a simplified version of the metamodel in order to implement the Web-based editor.This ad-hoc metamodel acted as an intermediate representation that focuses on concepts that areonly relevant for editing, thus easing the development of the editor. Our experiences revealed thatthe edition tasks were hard to realize with our metamodel.
In addition, Master’s students, as part of the second experiment, complained about the impos-sibility to directly access of the products and features from the PCM class in the metamodel. Prod-ucts and features are accessed through an abstract class called VariabilityConcept which groupsboth concepts. Moreover, they are both involved in a composite design pattern. These levels ofabstraction enable a precise description of a PCM but hinder the navigation in the model. Thelack of direct get/set methods hinders the development of tools for manipulating a PCM such as anextended API. Finally, some students managed the navigation using the positions which are conve-
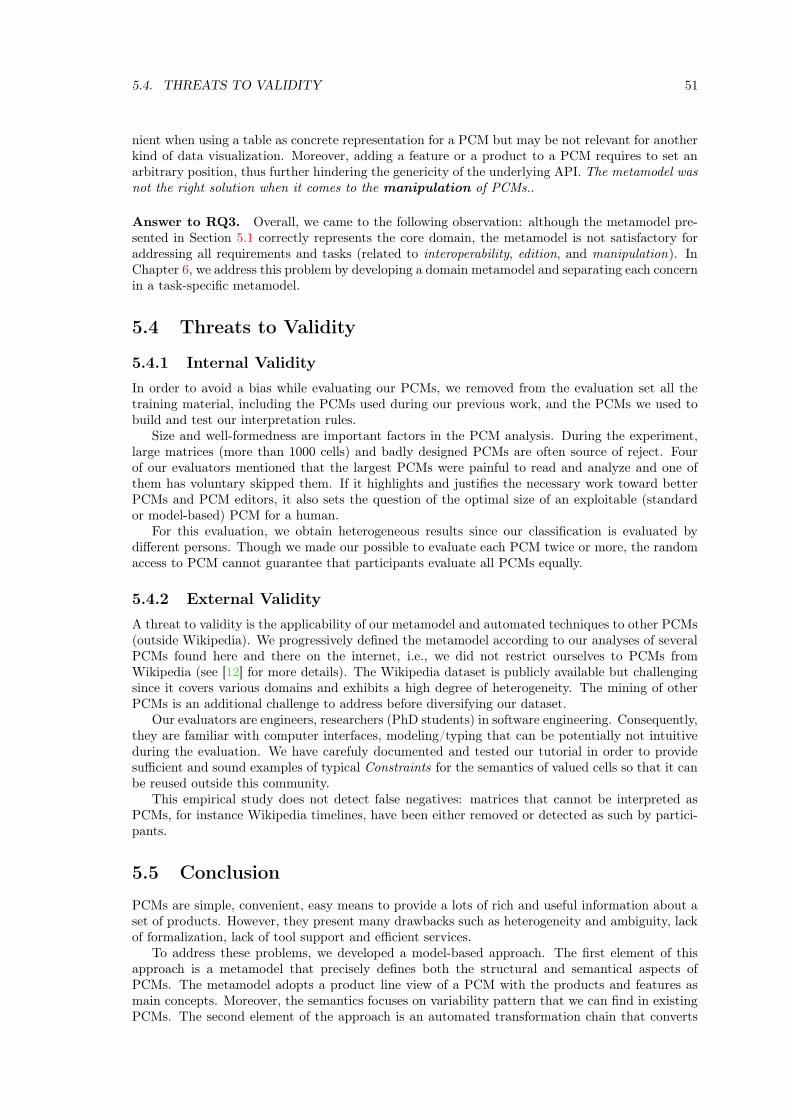
5.4. THREATS TO VALIDITY 51
nient when using a table as concrete representation for a PCM but may be not relevant for anotherkind of data visualization. Moreover, adding a feature or a product to a PCM requires to set anarbitrary position, thus further hindering the genericity of the underlying API. The metamodel wasnot the right solution when it comes to the manipulation of PCMs..
Answer to RQ3. Overall, we came to the following observation: although the metamodel pre-sented in Section 5.1 correctly represents the core domain, the metamodel is not satisfactory foraddressing all requirements and tasks (related to interoperability, edition, and manipulation). InChapter 6, we address this problem by developing a domain metamodel and separating each concernin a task-specific metamodel.
5.4 Threats to Validity
5.4.1 Internal Validity
In order to avoid a bias while evaluating our PCMs, we removed from the evaluation set all thetraining material, including the PCMs used during our previous work, and the PCMs we used tobuild and test our interpretation rules.
Size and well-formedness are important factors in the PCM analysis. During the experiment,large matrices (more than 1000 cells) and badly designed PCMs are often source of reject. Fourof our evaluators mentioned that the largest PCMs were painful to read and analyze and one ofthem has voluntary skipped them. If it highlights and justifies the necessary work toward betterPCMs and PCM editors, it also sets the question of the optimal size of an exploitable (standardor model-based) PCM for a human.
For this evaluation, we obtain heterogeneous results since our classification is evaluated bydifferent persons. Though we made our possible to evaluate each PCM twice or more, the randomaccess to PCM cannot guarantee that participants evaluate all PCMs equally.
5.4.2 External Validity
A threat to validity is the applicability of our metamodel and automated techniques to other PCMs(outside Wikipedia). We progressively defined the metamodel according to our analyses of severalPCMs found here and there on the internet, i.e., we did not restrict ourselves to PCMs fromWikipedia (see [12] for more details). The Wikipedia dataset is publicly available but challengingsince it covers various domains and exhibits a high degree of heterogeneity. The mining of otherPCMs is an additional challenge to address before diversifying our dataset.
Our evaluators are engineers, researchers (PhD students) in software engineering. Consequently,they are familiar with computer interfaces, modeling/typing that can be potentially not intuitiveduring the evaluation. We have carefuly documented and tested our tutorial in order to providesufficient and sound examples of typical Constraints for the semantics of valued cells so that it canbe reused outside this community.
This empirical study does not detect false negatives: matrices that cannot be interpreted asPCMs, for instance Wikipedia timelines, have been either removed or detected as such by partici-pants.
5.5 Conclusion
PCMs are simple, convenient, easy means to provide a lots of rich and useful information about aset of products. However, they present many drawbacks such as heterogeneity and ambiguity, lackof formalization, lack of tool support and efficient services.
To address these problems, we developed a model-based approach. The first element of thisapproach is a metamodel that precisely defines both the structural and semantical aspects ofPCMs. The metamodel adopts a product line view of a PCM with the products and features asmain concepts. Moreover, the semantics focuses on variability pattern that we can find in existingPCMs. The second element of the approach is an automated transformation chain that converts
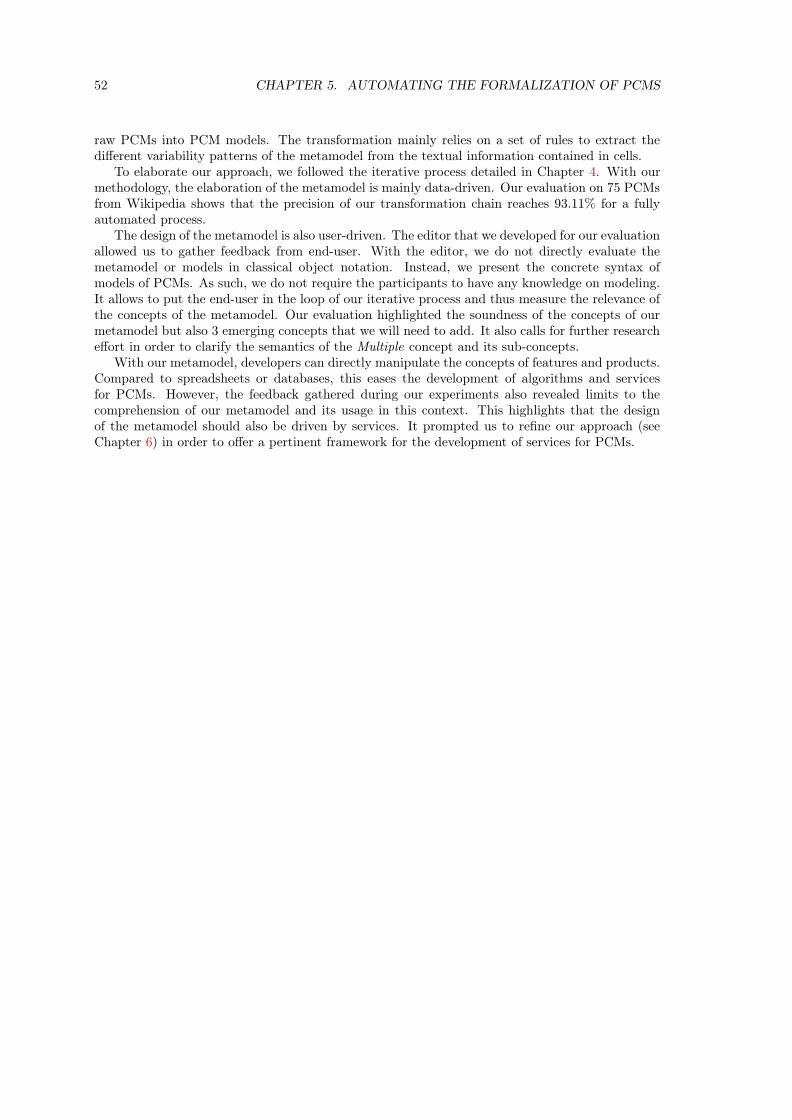
52 CHAPTER 5. AUTOMATING THE FORMALIZATION OF PCMS
raw PCMs into PCM models. The transformation mainly relies on a set of rules to extract thedifferent variability patterns of the metamodel from the textual information contained in cells.
To elaborate our approach, we followed the iterative process detailed in Chapter 4. With ourmethodology, the elaboration of the metamodel is mainly data-driven. Our evaluation on 75 PCMsfrom Wikipedia shows that the precision of our transformation chain reaches 93.11% for a fullyautomated process.
The design of the metamodel is also user-driven. The editor that we developed for our evaluationallowed us to gather feedback from end-user. With the editor, we do not directly evaluate themetamodel or models in classical object notation. Instead, we present the concrete syntax ofmodels of PCMs. As such, we do not require the participants to have any knowledge on modeling.It allows to put the end-user in the loop of our iterative process and thus measure the relevance ofthe concepts of the metamodel. Our evaluation highlighted the soundness of the concepts of ourmetamodel but also 3 emerging concepts that we will need to add. It also calls for further researcheffort in order to clarify the semantics of the Multiple concept and its sub-concepts.
With our metamodel, developers can directly manipulate the concepts of features and products.Compared to spreadsheets or databases, this eases the development of algorithms and servicesfor PCMs. However, the feedback gathered during our experiments also revealed limits to thecomprehension of our metamodel and its usage in this context. This highlights that the designof the metamodel should also be driven by services. It prompted us to refine our approach (seeChapter 6) in order to offer a pertinent framework for the development of services for PCMs.

Chapter 6
A Multi-Metamodel Approach
"The first Matrix I designed was quite naturally perfect,it was a work of art, flawless, sublime. A triumph equaledonly by its monumental failure."
The Architect
In Chapter 5, we presented a model-based approach for automatically formalizing PCMs. Thecore of this approach is a metamodel describing the structure and semantics of PCMs. Our eval-uation showed that the formalization was precise and ease the development of services on top ofPCMs in comparison to general table edition tools (e.g. spreadsheets or databases). However, wealso noticed that the metamodel presents comprehension and usability issues. This hinders theexploitation of the PCM models. In this chapter we refine this first approach to further ease thedevelopment of services for PCMs. The idea is to separate each concern in a specialized metamodel(see Section 6.1). The design of this new approach follows the same iterative process as previously(see Chapter 4 for details). In comparison to the previous approach, we base our evaluation on alarger dataset of more than 1,500,000 PCMs and the feedback gathered during numerous develop-ments of services. Section 6.2 presents a metamodel dedicated to the manipulation of PCMs andhow it can be used to compare, configure and analyze product lines through a PCM. Section 6.3focuses on the elaboration of a metamodel for the development of an editor. Section 6.4 presentsthe importing and exporting capabilities of our new approach. Section 6.5 evaluates the new ap-proach with respect to the three research questions defined in Chapter 4. All these techniques andservices are integrated in a project called OpenCompare (see Section 6.7).
6.1 Going From One Metamodel to Multiple Metamodels
The evaluation of the metamodel of Chapter 5 shows that a unique metamodel is not a satisfyingsolution. To improve our first approach, we propose to separate each concern in a specializedmetamodel (see Figure 6.1). The central element of our new approach is a metamodel that preciselyand solely represents the domain of PCMs (see Figure 6.2). In particular, we focused on thecomprehension the metamodel during its design. This domain metamodel refines the metamodelof Chapter 5 (see Figure 5.2) by eliminating several concepts and information that are not necessaryfor describing the PCM domain. For instance, the cell’s relative position, the domain of a featureand the subclasses of a cell. The concepts for defining the semantics of the cells are refined andcompleted according to the results of our evaluation (see Section 5.3). In addition, we implemented3 rules to further constraint the metamodel and thus refine what is a PCM model:
• no duplicated features
• no duplicated products
• each couple of feature and product must bind to a cell
53

54 CHAPTER 6. A MULTI-METAMODEL APPROACH
domain
metamodel
domain
metamodel
edition import
export
manipulation ...
Figure 6.1: Overview of our new approach: task-specific metamodels gathered around a centraldomain metamodel
PCM
ProductCell
[0..*] products
[0..*] values
AbstractFeature
FeatureGroupFeature
Value
[1..1] featurename : EString
[0..*] interpretation
content : EString
[0..*] features
[0..*] subfeaturesname : EString name : EString
Figure 6.2: Excerpt of the domain metamodel
With these modifications, we remove the information related to other concerns (e.g. import oredition of PCMs). As such, the domain metamodel has the right expressiveness level and does notcontain any redundant or unnecessary information. This simple metamodel can be easily used tounderstand and communicate on what is a PCM. However, this simplicity hinders the developmentof services. Task-specific metamodels must be designed to ease this development. The domainmetamodel acts a central formalism in order to enable the communication between the differenttask-specific metamodels.
In comparison to a solution with a single metamodel, this approach leads to well known syn-chronization problems between the models. However, these problems are only related to the im-plementation of a task-specific metamodel. For the user of this metamodel, there is no overhead.We shifted the complexity of the metamodel from the user to the developer. Therefore, it can po-tentially ease the development of services. In the following sections, we will show how we were ableto implement several services (editor, comparator, statistics, etc.) on top of this new approach.
6.2 Manipulation and analysis of PCMs
A first objective of our model-based approach is to provide generic algorithms for exploring andexploiting PCMs. The ability to manipulate a PCM is thus crucial. We observe that the domainmetamodel offer only basic getters and setters and thus it is not suitable for the development ofsuch tools. Therefore, we enriched the domain metamodel with generic operations, leading to themetamodel of Figure 6.3. In particular, we provide a built-in visitor design pattern that ease thetraversal of a PCM. Common operations such as getting the set of Feature and normalizing a PCM
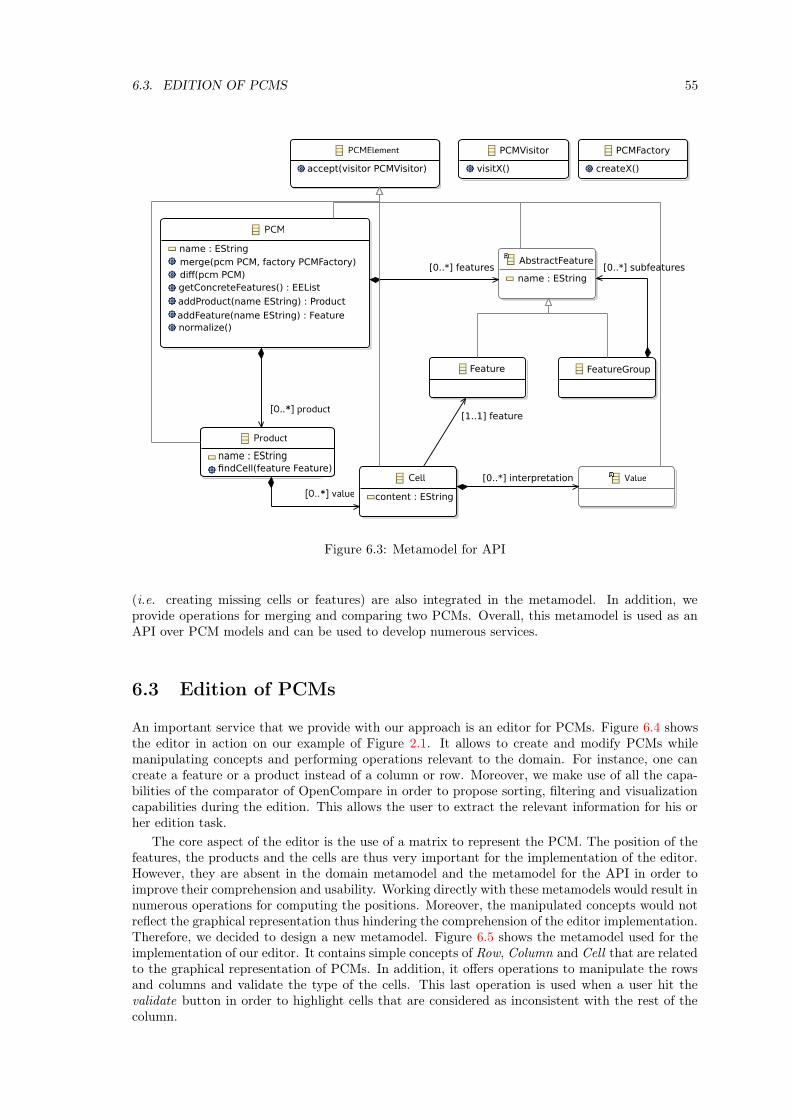
6.3. EDITION OF PCMS 55
Cell
PCM
Product
Value
PCMElement
[0..*] products
[0..*] value
merge(pcm PCM, factory PCMFactory)
diff(pcm PCM)
getConcreteFeatures() : EEList
addProduct(name EString) : Product
addFeature(name EString) : Feature
normalize()
accept(visitor PCMVisitor) visitX() createX()
name : EString
FeatureGroup
content : EString
name : EStringfindCell(feature Feature)
name : EString
[0..*] subfeatures[0..*] features
Feature
[0..*] interpretation
[1..1] feature
PCMVisitor PCMFactory
AbstractFeature
Figure 6.3: Metamodel for API
(i.e. creating missing cells or features) are also integrated in the metamodel. In addition, weprovide operations for merging and comparing two PCMs. Overall, this metamodel is used as anAPI over PCM models and can be used to develop numerous services.
6.3 Edition of PCMs
An important service that we provide with our approach is an editor for PCMs. Figure 6.4 showsthe editor in action on our example of Figure 2.1. It allows to create and modify PCMs whilemanipulating concepts and performing operations relevant to the domain. For instance, one cancreate a feature or a product instead of a column or row. Moreover, we make use of all the capa-bilities of the comparator of OpenCompare in order to propose sorting, filtering and visualizationcapabilities during the edition. This allows the user to extract the relevant information for his orher edition task.
The core aspect of the editor is the use of a matrix to represent the PCM. The position of thefeatures, the products and the cells are thus very important for the implementation of the editor.However, they are absent in the domain metamodel and the metamodel for the API in order toimprove their comprehension and usability. Working directly with these metamodels would result innumerous operations for computing the positions. Moreover, the manipulated concepts would notreflect the graphical representation thus hindering the comprehension of the editor implementation.Therefore, we decided to design a new metamodel. Figure 6.5 shows the metamodel used for theimplementation of our editor. It contains simple concepts of Row, Column and Cell that are relatedto the graphical representation of PCMs. In addition, it offers operations to manipulate the rowsand columns and validate the type of the cells. This last operation is used when a user hit thevalidate button in order to highlight cells that are considered as inconsistent with the rest of thecolumn.
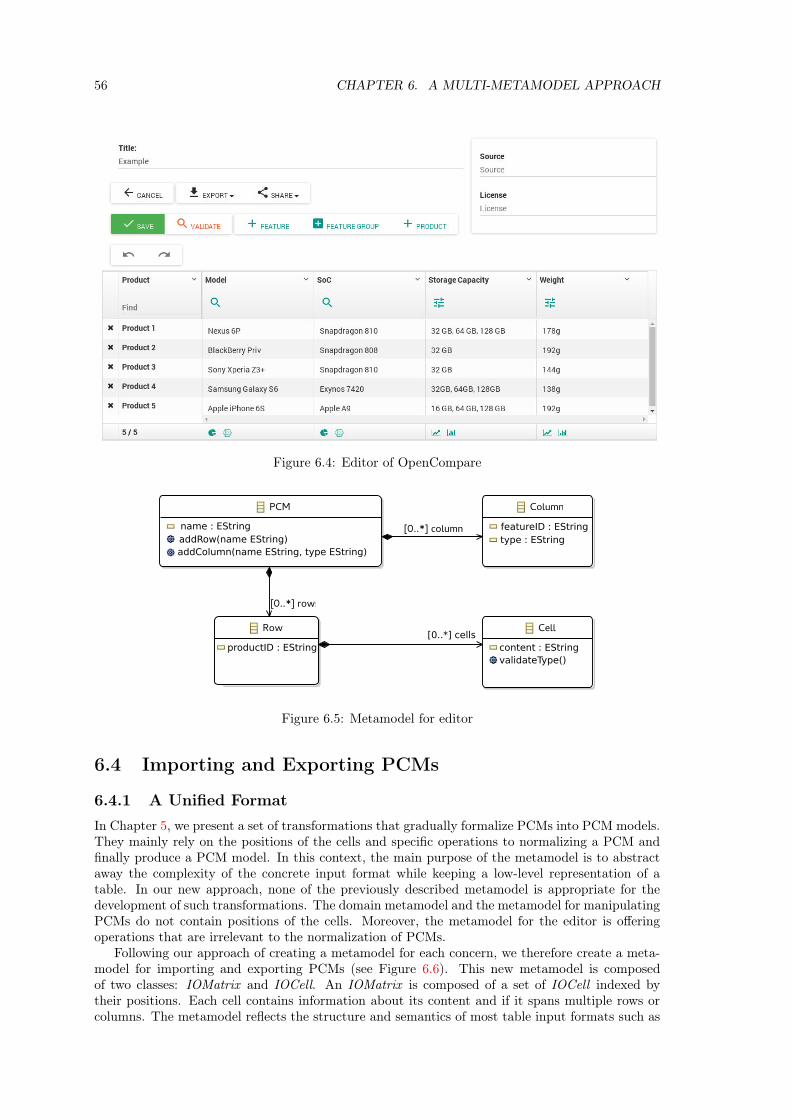
56 CHAPTER 6. A MULTI-METAMODEL APPROACH
Figure 6.4: Editor of OpenCompare
Cell
PCM
Row
Column
[0..*] rows
[0..*] columnsname : EString
addRow(name EString)
addColumn(name EString, type EString)
featureID : EString
type : EString
productID : EString content : EString
validateType()
[0..*] cells
Figure 6.5: Metamodel for editor
6.4 Importing and Exporting PCMs
6.4.1 A Unified Format
In Chapter 5, we present a set of transformations that gradually formalize PCMs into PCM models.They mainly rely on the positions of the cells and specific operations to normalizing a PCM andfinally produce a PCM model. In this context, the main purpose of the metamodel is to abstractaway the complexity of the concrete input format while keeping a low-level representation of atable. In our new approach, none of the previously described metamodel is appropriate for thedevelopment of such transformations. The domain metamodel and the metamodel for manipulatingPCMs do not contain positions of the cells. Moreover, the metamodel for the editor is offeringoperations that are irrelevant to the normalization of PCMs.
Following our approach of creating a metamodel for each concern, we therefore create a meta-model for importing and exporting PCMs (see Figure 6.6). This new metamodel is composedof two classes: IOMatrix and IOCell. An IOMatrix is composed of a set of IOCell indexed bytheir positions. Each cell contains information about its content and if it spans multiple rows orcolumns. The metamodel reflects the structure and semantics of most table input formats such as
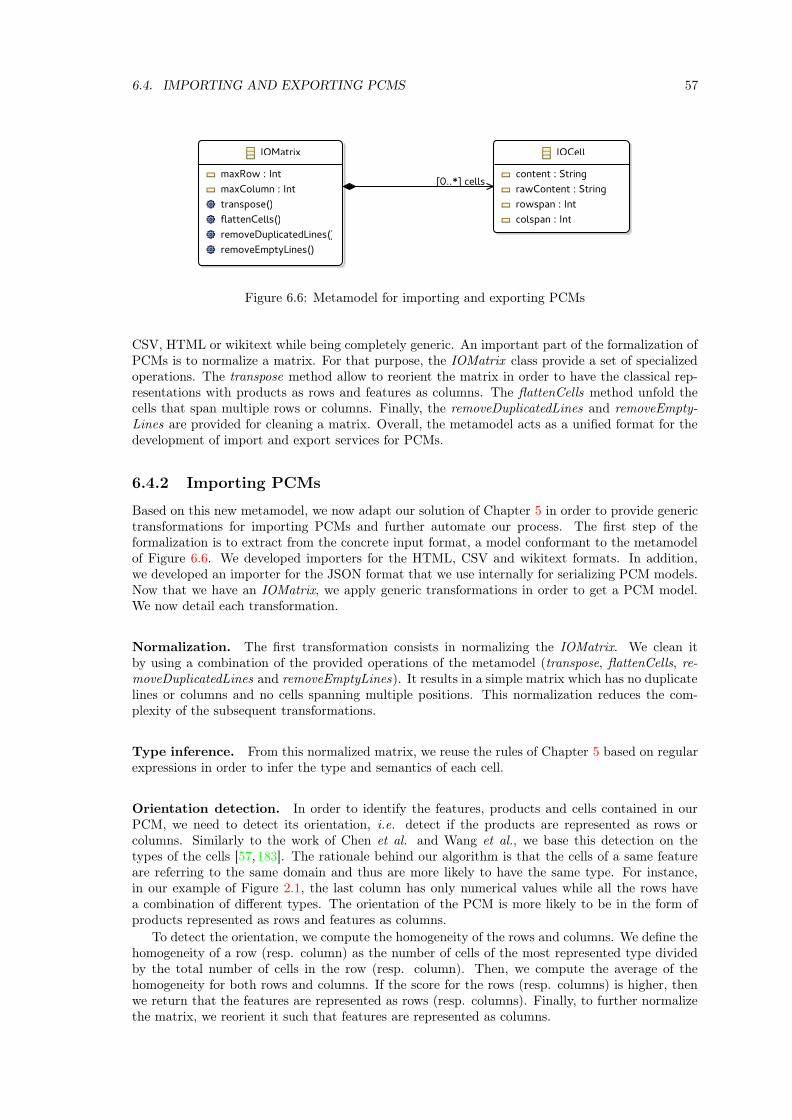
6.4. IMPORTING AND EXPORTING PCMS 57
IOMatrix
maxRow : Int
maxColumn : Int
transpose()
flattenCells()
removeDuplicatedLines()
removeEmptyLines()
IOCell
content : String
rawContent : String
rowspan : Int
colspan : Int
[0..*] cells
Figure 6.6: Metamodel for importing and exporting PCMs
CSV, HTML or wikitext while being completely generic. An important part of the formalization ofPCMs is to normalize a matrix. For that purpose, the IOMatrix class provide a set of specializedoperations. The transpose method allow to reorient the matrix in order to have the classical rep-resentations with products as rows and features as columns. The flattenCells method unfold thecells that span multiple rows or columns. Finally, the removeDuplicatedLines and removeEmpty-Lines are provided for cleaning a matrix. Overall, the metamodel acts as a unified format for thedevelopment of import and export services for PCMs.
6.4.2 Importing PCMs
Based on this new metamodel, we now adapt our solution of Chapter 5 in order to provide generictransformations for importing PCMs and further automate our process. The first step of theformalization is to extract from the concrete input format, a model conformant to the metamodelof Figure 6.6. We developed importers for the HTML, CSV and wikitext formats. In addition,we developed an importer for the JSON format that we use internally for serializing PCM models.Now that we have an IOMatrix, we apply generic transformations in order to get a PCM model.We now detail each transformation.
Normalization. The first transformation consists in normalizing the IOMatrix. We clean itby using a combination of the provided operations of the metamodel (transpose, flattenCells, re-moveDuplicatedLines and removeEmptyLines). It results in a simple matrix which has no duplicatelines or columns and no cells spanning multiple positions. This normalization reduces the com-plexity of the subsequent transformations.
Type inference. From this normalized matrix, we reuse the rules of Chapter 5 based on regularexpressions in order to infer the type and semantics of each cell.
Orientation detection. In order to identify the features, products and cells contained in ourPCM, we need to detect its orientation, i.e. detect if the products are represented as rows orcolumns. Similarly to the work of Chen et al. and Wang et al., we base this detection on thetypes of the cells [57, 183]. The rationale behind our algorithm is that the cells of a same featureare referring to the same domain and thus are more likely to have the same type. For instance,in our example of Figure 2.1, the last column has only numerical values while all the rows havea combination of different types. The orientation of the PCM is more likely to be in the form ofproducts represented as rows and features as columns.
To detect the orientation, we compute the homogeneity of the rows and columns. We define thehomogeneity of a row (resp. column) as the number of cells of the most represented type dividedby the total number of cells in the row (resp. column). Then, we compute the average of thehomogeneity for both rows and columns. If the score for the rows (resp. columns) is higher, thenwe return that the features are represented as rows (resp. columns). Finally, to further normalizethe matrix, we reorient it such that features are represented as columns.

58 CHAPTER 6. A MULTI-METAMODEL APPROACH
Figure 6.7: Excerpt of the model resulting from the import of the PCM of Figure 2.1, page 12
Feature hierarchy extraction. At this point, the input matrix is normalized and the semanticsof the cells are known. We can now focus on the extraction of the logical structure of the PCMand in particular the hierarchy of features. As the matrix is normalized, we can consider that thefeatures are located in the first rows of the matrix. Our algorithm for extracting the hierarchy offeatures starts at the first row. If there is consecutive cells that contain the same value, then theyform a feature group. Otherwise, the cell is considered as a feature. The algorithm iterates on therows until a unique feature is found for each column, i.e. no more feature group is detected.
Product extraction. Once we have the hierarchy of features, the remaining rows of the matrixcorrespond to the products of the PCM. The extraction of the product is thus straightforward.It results in a complete PCM model that represents a formalization of the original input matrix.Figure 6.7 shows an excerpt of the model obtained when importing the PCM of Figure 2.1. Moreprecisely, it shows the formalization of the cell containing the value "178g", highlighted in Fig-ure 2.1. We observe that the cell is linked to the feature named "Weight". Moreover, the cellis interpreted as value with a unit named "g". This value is the integer 178. This PCM modelprecisely captures the semantics of the cell "178g" and its place in the logical structure of the PCM.
Comparison with Chapter 5. By creating a new metamodel dedicated to the import andexport of PCMs, we are able develop generic operations for formalizing PCMs. We also furtherautomate the entire process and in particular the normalization and the detection of the orientationof the PCM. Moreover, as we reuse the rules of Chapter 5 for inferring the semantics of cells, weconserve the precision of the first approach.
6.4.3 Exporting PCMs
An important property of PCMs is that they are easy to read and understand. They are suitablefor displaying information about a set of products in a compact way. It is natural to publish aPCM on a Web page or print it in order to share its information. Moreover, if one import andedit a PCM with OpenCompare, it can be interesting to propagate the modifications back in itsoriginal format. To extend the functionalities of OpenCompare, we can also need to interoperatewith external tools. For instance, we could create statistics about a PCM or a set of PCMs withthe R programming language. All these scenarios require to export a PCM model into anotherformat.
To increase the interoperability of PCM models, we developed a generic transformation chainthat export an IOMatrix from a PCM model. In addition to the PCM model, the procedure takesas input the positions of the cells and the desired orientation of the PCM. The procedure consists
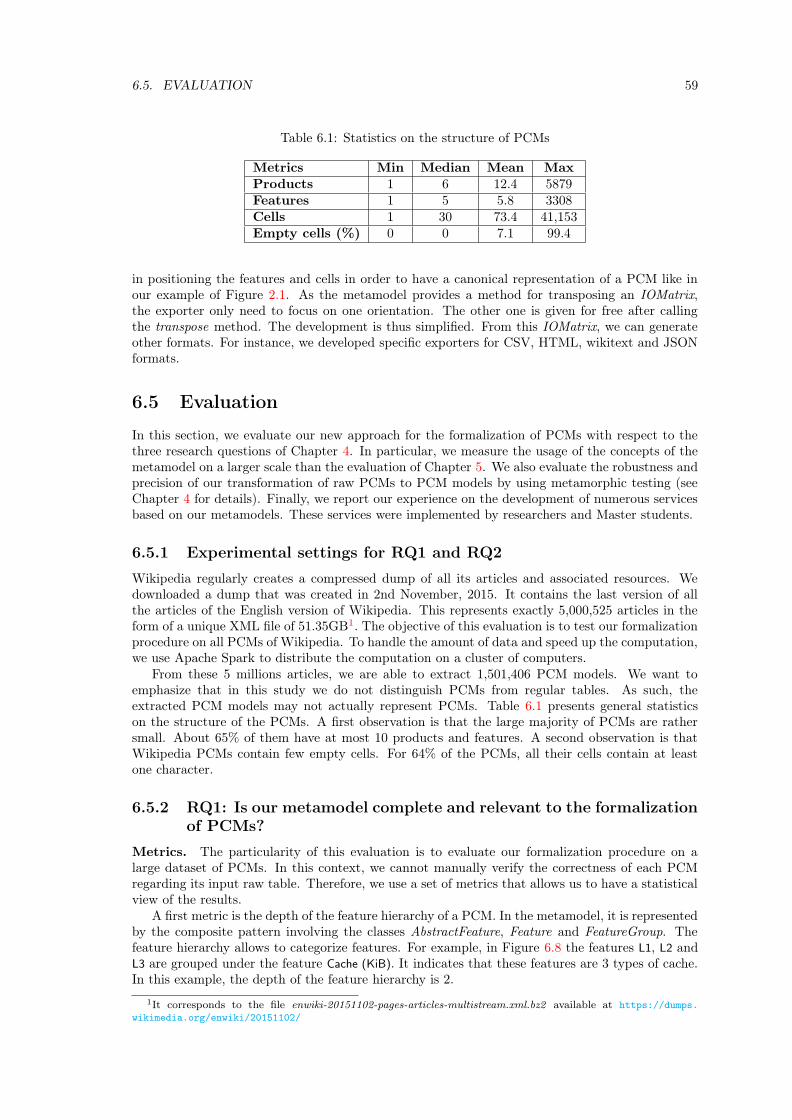
6.5. EVALUATION 59
Table 6.1: Statistics on the structure of PCMs
Metrics Min Median Mean MaxProducts 1 6 12.4 5879Features 1 5 5.8 3308Cells 1 30 73.4 41,153Empty cells (%) 0 0 7.1 99.4
in positioning the features and cells in order to have a canonical representation of a PCM like inour example of Figure 2.1. As the metamodel provides a method for transposing an IOMatrix,the exporter only need to focus on one orientation. The other one is given for free after callingthe transpose method. The development is thus simplified. From this IOMatrix, we can generateother formats. For instance, we developed specific exporters for CSV, HTML, wikitext and JSONformats.
6.5 Evaluation
In this section, we evaluate our new approach for the formalization of PCMs with respect to thethree research questions of Chapter 4. In particular, we measure the usage of the concepts of themetamodel on a larger scale than the evaluation of Chapter 5. We also evaluate the robustness andprecision of our transformation of raw PCMs to PCM models by using metamorphic testing (seeChapter 4 for details). Finally, we report our experience on the development of numerous servicesbased on our metamodels. These services were implemented by researchers and Master students.
6.5.1 Experimental settings for RQ1 and RQ2
Wikipedia regularly creates a compressed dump of all its articles and associated resources. Wedownloaded a dump that was created in 2nd November, 2015. It contains the last version of allthe articles of the English version of Wikipedia. This represents exactly 5,000,525 articles in theform of a unique XML file of 51.35GB1. The objective of this evaluation is to test our formalizationprocedure on all PCMs of Wikipedia. To handle the amount of data and speed up the computation,we use Apache Spark to distribute the computation on a cluster of computers.
From these 5 millions articles, we are able to extract 1,501,406 PCM models. We want toemphasize that in this study we do not distinguish PCMs from regular tables. As such, theextracted PCM models may not actually represent PCMs. Table 6.1 presents general statisticson the structure of the PCMs. A first observation is that the large majority of PCMs are rathersmall. About 65% of them have at most 10 products and features. A second observation is thatWikipedia PCMs contain few empty cells. For 64% of the PCMs, all their cells contain at leastone character.
6.5.2 RQ1: Is our metamodel complete and relevant to the formalizationof PCMs?
Metrics. The particularity of this evaluation is to evaluate our formalization procedure on alarge dataset of PCMs. In this context, we cannot manually verify the correctness of each PCMregarding its input raw table. Therefore, we use a set of metrics that allows us to have a statisticalview of the results.
A first metric is the depth of the feature hierarchy of a PCM. In the metamodel, it is representedby the composite pattern involving the classes AbstractFeature, Feature and FeatureGroup. Thefeature hierarchy allows to categorize features. For example, in Figure 6.8 the features L1, L2 andL3 are grouped under the feature Cache (KiB). It indicates that these features are 3 types of cache.In this example, the depth of the feature hierarchy is 2.
1It corresponds to the file enwiki-20151102-pages-articles-multistream.xml.bz2 available at https://dumps.
wikimedia.org/enwiki/20151102/
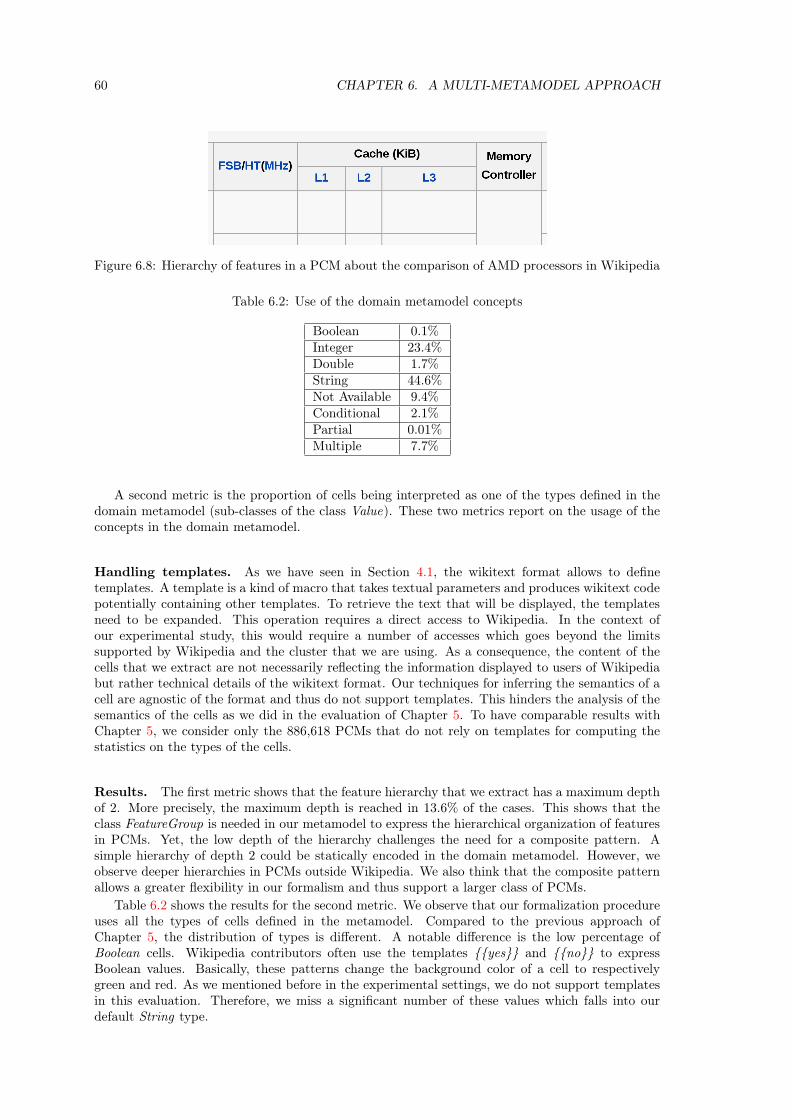
60 CHAPTER 6. A MULTI-METAMODEL APPROACH
Figure 6.8: Hierarchy of features in a PCM about the comparison of AMD processors in Wikipedia
Table 6.2: Use of the domain metamodel concepts
Boolean 0.1%Integer 23.4%Double 1.7%String 44.6%Not Available 9.4%Conditional 2.1%Partial 0.01%Multiple 7.7%
A second metric is the proportion of cells being interpreted as one of the types defined in thedomain metamodel (sub-classes of the class Value). These two metrics report on the usage of theconcepts in the domain metamodel.
Handling templates. As we have seen in Section 4.1, the wikitext format allows to definetemplates. A template is a kind of macro that takes textual parameters and produces wikitext codepotentially containing other templates. To retrieve the text that will be displayed, the templatesneed to be expanded. This operation requires a direct access to Wikipedia. In the context ofour experimental study, this would require a number of accesses which goes beyond the limitssupported by Wikipedia and the cluster that we are using. As a consequence, the content of thecells that we extract are not necessarily reflecting the information displayed to users of Wikipediabut rather technical details of the wikitext format. Our techniques for inferring the semantics of acell are agnostic of the format and thus do not support templates. This hinders the analysis of thesemantics of the cells as we did in the evaluation of Chapter 5. To have comparable results withChapter 5, we consider only the 886,618 PCMs that do not rely on templates for computing thestatistics on the types of the cells.
Results. The first metric shows that the feature hierarchy that we extract has a maximum depthof 2. More precisely, the maximum depth is reached in 13.6% of the cases. This shows that theclass FeatureGroup is needed in our metamodel to express the hierarchical organization of featuresin PCMs. Yet, the low depth of the hierarchy challenges the need for a composite pattern. Asimple hierarchy of depth 2 could be statically encoded in the domain metamodel. However, weobserve deeper hierarchies in PCMs outside Wikipedia. We also think that the composite patternallows a greater flexibility in our formalism and thus support a larger class of PCMs.
Table 6.2 shows the results for the second metric. We observe that our formalization procedureuses all the types of cells defined in the metamodel. Compared to the previous approach ofChapter 5, the distribution of types is different. A notable difference is the low percentage ofBoolean cells. Wikipedia contributors often use the templates {{yes}} and {{no}} to expressBoolean values. Basically, these patterns change the background color of a cell to respectivelygreen and red. As we mentioned before in the experimental settings, we do not support templatesin this evaluation. Therefore, we miss a significant number of these values which falls into ourdefault String type.

6.5. EVALUATION 61
Answer to RQ1. Overall, these metrics show that the concepts in our domain metamodel areused in the context of modeling PCMs. Compared to the metamodel of Chapter 5, our domainmetamodel is simpler but still provides the necessary concepts for the domain of PCMs.
6.5.3 RQ2: What is the precision of our transformation of raw PCMsto PCM models?
Metrics. To test the precision of our transformation, we rely on metamorphic testing [59] (seeChapter 4 for more details). In our context, we use metamorphic testing to check if exporting aPCM model and importing it back results in the exact same PCM model. In this evaluation, wetest this property on our 4 couples of importers and exporters: HTML, CSV, wikitext and JSON.The metric that we use for evaluating RQ2 is the percentage of PCMs that pass the metamorphictests.
Results. As we mentioned in the experimental settings, we are able to extract about a millionand half PCMs from our dataset. Only one error occurred during the import of all these PCMs.This error is due to the library that we use for parsing wikitext code and thus is not caused by theimplementation of our procedure. It shows that our wikitext importer and our generic formalizationprocedure support a large variety of PCMs.
Our metric on metamorphic testing indicates that out of the 1,501,406 PCMs in the dataset,we are able to correctly export in all formats and import back 91% of the PCMs. In particular,the import and export of our JSON internal format works in all the cases. For CSV and HTMLformats, the precision reaches 92.8%. For the wikitext format, the precision is a bit lower with91.9%. This can be explained by the increased complexity of the wikitext format compared to CSVand HTML.
During these experiments, we discovered several bugs in our importers and exporters. Forinstance, we detected that the parsing of parameters of templates expressed in wikitext was some-times incorrect. It shows the interest of performing metamorphic testing (or other testing tech-niques without oracle) when modeling a large dataset of raw data. It also helps us to improve ourprocedure and specify new unit test with an associated oracle.
The results show that the precision of our importers and exporters is not maximal. To qualifythe sources of errors, we randomly selected 25 failing metamorphic tests and manually analyzedthe results.
A first source of error is the presence of tables that are not PCMs in our dataset. As weexplained in our experimental settings, we do not distinguish between PCMs and regular tables.Our importers are not designed to support other types of tables than PCMs. Thus, they fail toproduce a PCM model that is supported by our tool chain.
A second source of error is the incorrect detection of the orientation of the PCM (productsrepresented either as rows or columns). Our algorithm for detecting the orientation of a PCM relyon the homogeneity of the types of the cells. We noticed that the presence of unknown values maydisturb the computation of the homogeneity which results in an incorrect orientation of the PCM.
A third source of error is the incorrect support of some characters (e.g. line breaks, # or ||).For line breaks, it usually affects the presentation of the content of the cell and not its essentialinformation. However, Wikipedia contributors use the double pipe (||) to separate cells. If it is notinterpreted correctly, it changes the structure of the analyzed table and thus the PCM model.
Other sources of errors may be discovered with a more thorough analysis of the results. Toavoid the errors that we detected, we need to be able to detect tables that are not supported byour tool chain. We also need to improve the precision of our algorithm for detecting the orientationof a PCM. However, these errors arise only in an automated setting. When performing a manualimport and export of a PCM, a user can manually check if a table fits our definition of a PCM.
Answer to RQ2. Our importing and exporting capabilities are able to handle a large variety ofPCMs with a important precision of 91%. The formalization errors mainly come from the presenceof table that are not PCMs in our dataset and the incorrect detection of the orientation of the

62 CHAPTER 6. A MULTI-METAMODEL APPROACH
PCMs. This evaluation also calls for further development effort to reach a precision of 100% forour metamorphic tests.
6.5.4 RQ3: Is our metamodel suited for engineering automated analysesand services dedictated to PCMs?
The design of the new approach presented in this chapter led to numerous and various experimentsand developments. We now present the services resulting from these experiments and the feedbackthat we gathered from the developers. The following list shows what was developed and who wasinvolved:
• Web editor, comparator, configurator and visualizations for PCMs (1 Master student and 1researcher)
• MatrixMiner, a tool for extracting a PCM from informal product descriptions [10]. Theresulting PCM is displayed and refined by an editor derived from the one of OpenCompare.(4 researchers)
• Importer and exporter for HTML, CSV and wikitext formats (1 Master student and 1 re-searcher)
• Browser extensions for Chrome and Firefox in order to replace a PCM in a website by oureditor (1 Master student and 1 researcher)
• Configurable HTML exporter. The color of the cells and the representation of certain typesof data can be customized. (15 Master students)
• Visualization of the products in a 2D space. It is inspired from the website productchart.com.(1 researcher and 20 Master students)
• Machine learning techniques for finding new types of data contained in cells of PCMs fromWikipedia (3 Master students)
• Statistics on the types of data contained in cells (45 Master students)
• Extraction of information that stands out in a PCM. The information is presented as text.(45 Master students)
Manipulation. During the last 2 years, we implemented a comparator, a configurator and sta-tistical visualizations that are all integrated in a same website.
The comparator (see Figure 6.9a) was developed by one researcher and two students. It sharesthe same graphical representation as the editor presented in Section 6.3. Thanks to the clearsemantics of our PCM models, the comparator can offer sorting and filtering capabilities specializedfor the kind of data contained in a feature. For instance, the Weight feature contain only numericalinformation. Using this information, we present a range of integers that the user can specify inorder to filter the products (see Figure 6.9b). For the SoC feature, we have no specific information.In that case, we present a simple list of unique values that can be selected or deselected.
As a complement to our comparator, the configurator of Figure 6.9d offers a different viewfocused on our filtering capabilities. As we a PCM model is not linked to a particular graphicalrepresentation, we can easily switch from one view to the other.
To further explore a PCM, we provide simple charts such as bar charts, pie charts or linecharts. They offer a global view on the data and are particularly useful to detect products thatstand out. For instance, the bar chart of Figure 6.9c could be used to detect very light or heavysmartphones. An additional innovative visualization2 was implemented by Master students fromthe University of Rennes 1. It is inspired from the website http://www.productchart.com/. Itconsists in displaying the products in a two dimension space. Each dimension represents a feature ofthe PCM. The complete information about a product is displayed when hovering over its graphicalrepresentation in the space.
2The visualization is still experimental at the moment and thus it is not integrated in OpenCompare yet.
6.6. THREATS TO VALIDITY 63
By offering an easy traversal of the PCM, the the metamodel for manipulating PCMs allows toextract statistics about the data contained in PCM. In particular, different promotions of Masterstudents from the University of Rennes 1 and ENSAI performed statistical analyses on the numberof products and features contained in PCMs in Wikipedia. They also analyzed the distribution oftypes of data as we did in Chapter 5. Contrary to our previous approach, the students did nothave any difficulties to understand and use the metamodel.
In addition, a preliminary study was performed by a Master student that took part in thedevelopment of our import and export services. It consists in analyzing the evolution of WikipediaPCMs over time. For that purpose, the student used the diff operation of the API. His feedbackwas also encouraging concerning the usability of the API. We plan to continue this study in orderto understand the creation of PCMs and thus further motivate our work and guide the developmentof OpenCompare.
Edition. Compared to the editor developed in Chapter 5, we find the same core features inour new editor (see Section 6.3). The difference is that its implementation is greatly simplifiedthanks to the reduced complexity of the metamodel and the relevance of his concepts regardingthe edition task. The students that participated in the development confirmed that having aspecialized metamodel simplified their tasks. In addition, before the development of this editor, 4Master students worked on another implementation with a different Web technology. Despite theinitial wrong choice of technology, the feedback on the metamodel was also encouraging.
Import and export. The import and export capabilities described in Section 6.4 offers a genericway to transform raw PCMs into PCM models. With this new transformation, the integration ofan importer for a different format requires to transform the format into a model conformant tothe metamodel of Figure 6.6. As our metamodel is close to the structure of the formats thatwe are considering, the implementation of this last step is straightforward. If the metamodel forimporting PCMs is not appropriate for a specific format, the developer can also directly producea PCM model. Overall, by providing a specific metamodel and generic transformations, we easethe development of importers of PCMs and our approach becomes more generic and automated.Similarly to importers, our dedicated metamodel eases the development of exporters of PCMs.
Answer to RQ3. The informal feedback gathered during our development experiments showsthat despite tiny problems due to the lack of maturity of the implementation, the global impressionwas good. The domain metamodel was easy to present and the different students and researchersdid not have difficulties to understand it. In a few lines of code, they were able to manipulatea PCM and extract relevant information. For more complex development (e.g. the Web editor,MatrixMiner and the importers and exporters), the participants really benefited from the task-specific metamodels. This feedback shows that the new approach with multiple metamodels greatlyeases the implementation of services in comparison to the first approach with a unique metamodel.
6.6 Threats to Validity
6.6.1 Internal Validity
During this chapter, we evaluated our new approach regarding its capacity to provide a basis forthe developments of services for PCMs. A first threat to internal validity is that this evaluationis based on informal feedback which are by nature subjective. To mitigate the bias, we tried toperform numerous experiments with researchers, engineers and students.
A second threat to validity is the absence of filter for non PCMs in our study of Wikipedia.On the one hand, mixing PCMs and other kinds of tables may significantly impact the resultsof our metrics. On the other hand, it makes the problem harder and show the robustness andcompleteness of our approach in various situations.
A third threat is the inherent limits of metamorphic testing. The property that we are testingrequires a PCM model. To obtain the initial models, we perform a first import with our wikitext

64 CHAPTER 6. A MULTI-METAMODEL APPROACH
(a) Comparator of OpenCompare
(b) Filter
(c) Bar chart of the Weight feature
(d) Configurator
Figure 6.9: Services for exploring a PCM in OpenCompare
6.7. OPENCOMPARE: AN INITIATIVE AROUND PCMS 65
importer. The presence of bugs in this importer may not be revealed by the subsequent meta-morphic testing. However, this technique is necessary for testing the OpenCompare on the entiredataset. Moreover, each bug discovered by metamorphic testing improves the accuracy of the initialimport and thus reduces the bias.
A fourth threat is that our evaluation procedure may present implementation errors. To avoidany bias, we thoroughly tested our procedure on a smaller scale and compared our results withprevious experiments. In addition, we execute OpenCompare tools and observe the resulting PCMs.To compute the different statistics, we rely on the R programming language.
6.6.2 External Validity
The main threat to external validity is that we evaluate OpenCompare only on the English versionof Wikipedia. Testing OpenCompare on a different version of the encyclopedia or on another sourceof PCMs may result in different results. We chose Wikipedia because it offers a great diversity ofdomains. Moreover, there are no guidelines for the edition of tables which also leads to diversepractices in the definition of PCMs.
6.7 OpenCompare: An Initiative around PCMs
The new approach presented in this chapter and the related services are integrated in an initiativecalled OpenCompare. The objective of OpenCompare is to create a community of PCM contribu-tors and users. For that purpose, OpenCompare provide innovative services for PCMs in the formof a website and an API. The facade of the initiative is the website https://opencompare.org
which groups all our services such as an editor, a comparator, a configurator and importing andexporting facilities (see the following sections for more details).
On the community aspect, we propose to our visitors to create new PCMs or modify existingones. In both cases, the resulting matrix is visible to everyone. By encouraging a collaborativeedition, we hope to increase the quality and relevance of PCMs. In addition, the importing andexporting capabilities of OpenCompare allow to modify PCMs in other websites or formats. Forexample, one can import a PCM from Wikipedia, modify its content with our appropriate toolsand export it back to Wikipedia. In this scenario, at no time the user has to handle the complexityof the wikitext syntax. Finally, we provide a simple way to share a PCM by email, social networksor by directly embedding the PCM in a website.
6.8 Conclusion
In Chapter 5, we present a first approach for the formalization of PCMs. However, our evaluationreveals comprehension and usability issues due to the mix of concerns in its design. To improvethe situation we develop, a new approach based on a set task-specific metamodels. The advantageis that we isolate the information relevant to a particular task in a dedicated metamodel. Thenew approach is integrated in an initiative called OpenCompare. OpenCompare provides an APIand innovative services dedicated to PCMs. All these tools are integrated in a Website. Based onthis solution, we performed numerous experiments with Master students and researchers. Theyconfirm that OpenCompare eases the development of services while conserving the quality of ourinitial formalization techniques.
In particular, our import and export facilities allow us to continue our exploration of the PCMdomain and in particular in Wikipedia. The large scale analysis of the English version of Wikipediarevealed bugs in our implementation that would be difficult to spot without a realistic dataset. Itshows that the iterative process that we used to elaborate our approach (see Chapter 4) is efficientfor exploring the diversity of PCMs. Our evaluation also shows that our services are central in thisprocess. They actively contribute to the improvement of the initiative by bringing new data anduse cases.
We also want to emphasize that our solution is one possibility among others. Our evaluationshows that our choice of separating the initial metamodel in several ones significantly eases our

66 CHAPTER 6. A MULTI-METAMODEL APPROACH
tasks. Yet, other techniques could be employed to reduce the complexity of the metamodel andimprove its comprehension and usability. For example, aspect-oriented methods [92] could be usedto inject task-specific information in the domain metamodel. Another possibility is to maintain aproduct line of metamodels [39].
Part III
From Product Comparison Matrices
to Feature Models
67


Chapter 7
Breathing Ontological Knowledge into Feature
Model Synthesis
"Never send a human to do a machine’s job."
Agent Smith
The main objective of this thesis is to formalize PCMs. In Part II, we investigated a firstapproach based on the definition of a domain specific modeling language. By specifying a setof metamodels and transformations, we showed that we are able to model numerous and variousPCMs and provide dedicated services. In this chapter, we investigate another approach based onthe synthesis of Feature Models (FMs) (see Section 7.1).
PCMs and FMs share a same goal: describing a product line. For example, the PCM ofFigure 7.1a and the FM of Figure 7.1b represent the same product line. Feature modeling is thusa good candidate for the formalization of PCMs. However, we observe a syntactic and semanticgap between PCMs and FMs. On the one hand, PCMs are product-oriented. They describe thecomprehensive list of products of a product line. On the other hand, FMs are feature-oriented.They express constraints on a set of features in order to represent the same set of products. Thesemantics of an FM is defined by a propositional formula. However, PCMs can express more thanBoolean information (e.g. numerical, textual or uncertain information). Therefore, we investigatethe synthesis of FMs from a class of PCMs that we call Boolean configuration matrices. Intuitively,Boolean configuration matrices are all the PCMs that can be directly encoded as a propositionalformula.
We motivate the importance of the quality of the resulting FM as defined by its configurationand ontological semantics (see Section 7.2). Then, we present generic, automated techniques forbreathing ontological knowledge into FM synthesis (see Section 7.3). Our procedure takes a propo-sitional formula as input. A class of PCMs encodable in this formalism are thus supported byour techniques. We also consider various kinds of artifacts that contain or document variability inproduct lines. In Section 7.4, we describe and illustrate the integration of the synthesis techniquesinto the WebFML environment. We then perform an empirical evaluation on hundreds of FMs,coming from the SPLOT repository and Wikipedia (see Section 7.5). Finally, we discuss threatsto validity and conclude the paper in Section 7.6 and 7.7.
7.1 From PCM to FM
The main objective of a PCM is to represent a set of products in a compact and simple way. APCM can be considered as a view on a product line. Therefore, to formalize a PCM we need tomodel its underlying product line. FMs are by far the most popular notation for modeling andreasoning about a product line [46, 110]. FMs offer a simple yet expressive way to define a set oflegal configurations (i.e., combinations of features) each corresponding to a product of a product
69
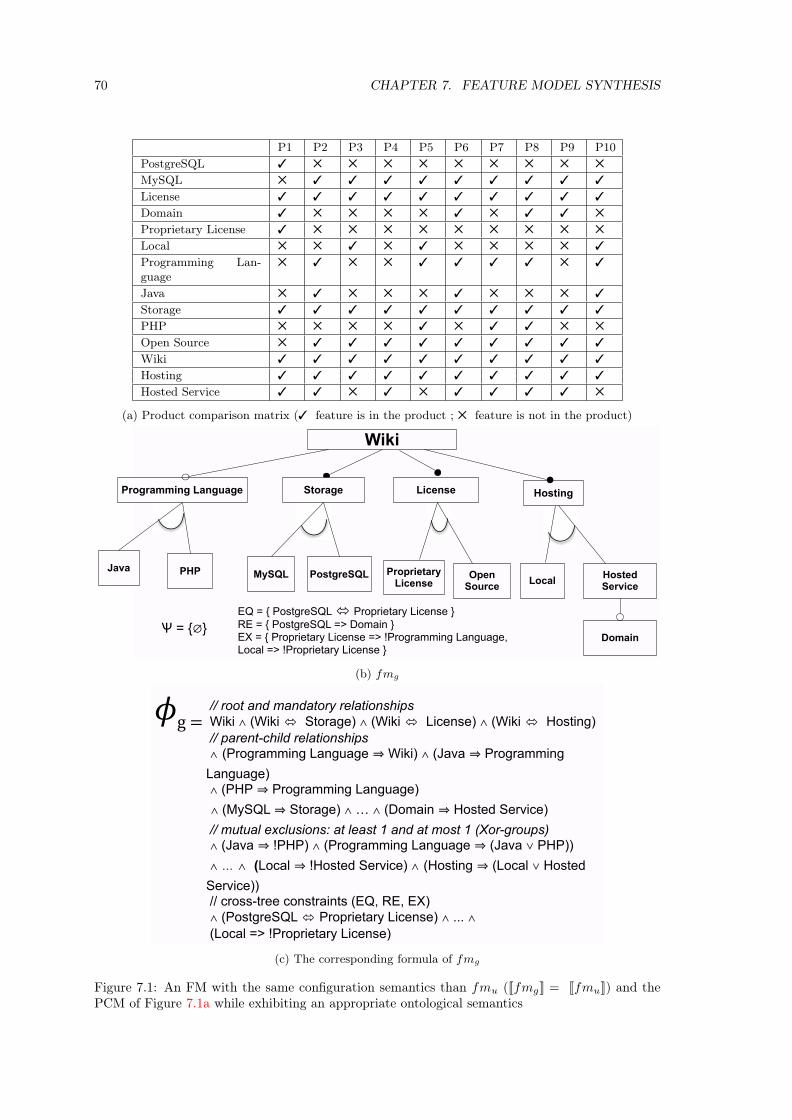
70 CHAPTER 7. FEATURE MODEL SYNTHESIS
P1 P2 P3 P4 P5 P6 P7 P8 P9 P10
PostgreSQL ✓ ✕ ✕ ✕ ✕ ✕ ✕ ✕ ✕ ✕
MySQL ✕ ✓ ✓ ✓ ✓ ✓ ✓ ✓ ✓ ✓
License ✓ ✓ ✓ ✓ ✓ ✓ ✓ ✓ ✓ ✓
Domain ✓ ✕ ✕ ✕ ✕ ✓ ✕ ✓ ✓ ✕
Proprietary License ✓ ✕ ✕ ✕ ✕ ✕ ✕ ✕ ✕ ✕
Local ✕ ✕ ✓ ✕ ✓ ✕ ✕ ✕ ✕ ✓
Programming Lan-guage
✕ ✓ ✕ ✕ ✓ ✓ ✓ ✓ ✕ ✓
Java ✕ ✓ ✕ ✕ ✕ ✓ ✕ ✕ ✕ ✓
Storage ✓ ✓ ✓ ✓ ✓ ✓ ✓ ✓ ✓ ✓
PHP ✕ ✕ ✕ ✕ ✓ ✕ ✓ ✓ ✕ ✕
Open Source ✕ ✓ ✓ ✓ ✓ ✓ ✓ ✓ ✓ ✓
Wiki ✓ ✓ ✓ ✓ ✓ ✓ ✓ ✓ ✓ ✓
Hosting ✓ ✓ ✓ ✓ ✓ ✓ ✓ ✓ ✓ ✓
Hosted Service ✓ ✓ ✕ ✓ ✕ ✓ ✓ ✓ ✓ ✕
(a) Product comparison matrix (✓ feature is in the product ; ✕ feature is not in the product)
Java
Wiki
Programming Language Storage License
PHP Open Source
Proprietary License
Hosting
LocalHosted Service
MySQL PostgreSQL
Domain
EQ = { PostgreSQL � Proprietary License }
RE = { PostgreSQL => Domain }EX = { Proprietary License => !Programming Language,Local => !Proprietary License }
Ѱ = {∅}
(b) fmg
// root and mandatory relationships
Wiki ∧ (Wiki � Storage) ∧ (Wiki � License) ∧ (Wiki � Hosting)
// parent-child relationships ∧ (Programming Language � Wiki) ∧ (Java � Programming
Language) ∧ (PHP � Programming Language)
∧ (MySQL � Storage) ∧ ; ∧ (Domain � Hosted Service)
// mutual exclusions: at least 1 and at most 1 (Xor-groups) ∧ (Java � !PHP) ∧ (Programming Language � (Java ∨ PHP))
∧ … ∧ (Local � !Hosted Service) ∧ (Hosting � (Local ∨ Hosted
Service)) // cross-tree constraints (EQ, RE, EX)
∧ (PostgreSQL � Proprietary License) ∧ ... ∧
(Local => !Proprietary License)
����
(c) The corresponding formula of fmg
Figure 7.1: An FM with the same configuration semantics than fmu (�fmg� = �fmu�) and thePCM of Figure 7.1a while exhibiting an appropriate ontological semantics
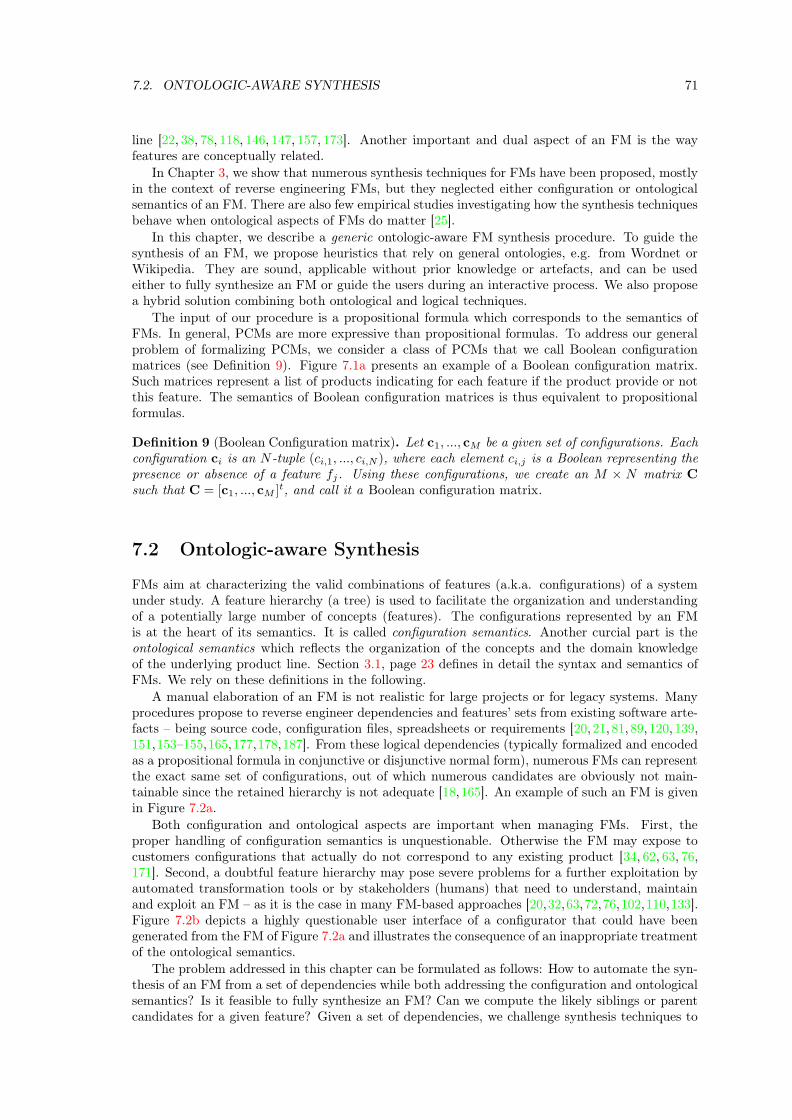
7.2. ONTOLOGIC-AWARE SYNTHESIS 71
line [22, 38, 78, 118, 146, 147, 157, 173]. Another important and dual aspect of an FM is the wayfeatures are conceptually related.
In Chapter 3, we show that numerous synthesis techniques for FMs have been proposed, mostlyin the context of reverse engineering FMs, but they neglected either configuration or ontologicalsemantics of an FM. There are also few empirical studies investigating how the synthesis techniquesbehave when ontological aspects of FMs do matter [25].
In this chapter, we describe a generic ontologic-aware FM synthesis procedure. To guide thesynthesis of an FM, we propose heuristics that rely on general ontologies, e.g. from Wordnet orWikipedia. They are sound, applicable without prior knowledge or artefacts, and can be usedeither to fully synthesize an FM or guide the users during an interactive process. We also proposea hybrid solution combining both ontological and logical techniques.
The input of our procedure is a propositional formula which corresponds to the semantics ofFMs. In general, PCMs are more expressive than propositional formulas. To address our generalproblem of formalizing PCMs, we consider a class of PCMs that we call Boolean configurationmatrices (see Definition 9). Figure 7.1a presents an example of a Boolean configuration matrix.Such matrices represent a list of products indicating for each feature if the product provide or notthis feature. The semantics of Boolean configuration matrices is thus equivalent to propositionalformulas.
Definition 9 (Boolean Configuration matrix). Let c1, ..., cM be a given set of configurations. Eachconfiguration ci is an N -tuple (ci,1, ..., ci,N ), where each element ci,j is a Boolean representing thepresence or absence of a feature fj. Using these configurations, we create an M × N matrix C
such that C = [c1, ..., cM ]t, and call it a Boolean configuration matrix.
7.2 Ontologic-aware Synthesis
FMs aim at characterizing the valid combinations of features (a.k.a. configurations) of a systemunder study. A feature hierarchy (a tree) is used to facilitate the organization and understandingof a potentially large number of concepts (features). The configurations represented by an FMis at the heart of its semantics. It is called configuration semantics. Another curcial part is theontological semantics which reflects the organization of the concepts and the domain knowledgeof the underlying product line. Section 3.1, page 23 defines in detail the syntax and semantics ofFMs. We rely on these definitions in the following.
A manual elaboration of an FM is not realistic for large projects or for legacy systems. Manyprocedures propose to reverse engineer dependencies and features’ sets from existing software arte-facts – being source code, configuration files, spreadsheets or requirements [20, 21, 81, 89, 120, 139,151,153–155,165,177,178,187]. From these logical dependencies (typically formalized and encodedas a propositional formula in conjunctive or disjunctive normal form), numerous FMs can representthe exact same set of configurations, out of which numerous candidates are obviously not main-tainable since the retained hierarchy is not adequate [18,165]. An example of such an FM is givenin Figure 7.2a.
Both configuration and ontological aspects are important when managing FMs. First, theproper handling of configuration semantics is unquestionable. Otherwise the FM may expose tocustomers configurations that actually do not correspond to any existing product [34, 62, 63, 76,171]. Second, a doubtful feature hierarchy may pose severe problems for a further exploitation byautomated transformation tools or by stakeholders (humans) that need to understand, maintainand exploit an FM – as it is the case in many FM-based approaches [20,32,63,72,76,102,110,133].Figure 7.2b depicts a highly questionable user interface of a configurator that could have beengenerated from the FM of Figure 7.2a and illustrates the consequence of an inappropriate treatmentof the ontological semantics.
The problem addressed in this chapter can be formulated as follows: How to automate the syn-thesis of an FM from a set of dependencies while both addressing the configuration and ontologicalsemantics? Is it feasible to fully synthesize an FM? Can we compute the likely siblings or parentcandidates for a given feature? Given a set of dependencies, we challenge synthesis techniques to

72 CHAPTER 7. FEATURE MODEL SYNTHESIS
����
����
������� �������
���
������������������������
�������
����������
��������������������
�������������� ����� �����������
�������������������������������������������������������������������������������������������������������������������������������������������������������������������������������������������������
��
���
���������
��������
����������
�����
�����������
�����
�������������������������(a) fmu
(b) Configurator UI
Figure 7.2: What practitioners do not want. At the bottom, a non intuitive user interface of aconfigurator that could have been generated from fmu due to its doubtful ontological semantics.
7.2. ONTOLOGIC-AWARE SYNTHESIS 73
��������������������������������������
�������!�
����!��
!��
��������
!�
!����
!�
������������
�����������������
��������������������
������������
�������������������
���
���
���
���
������������
!
Figure 7.3: A key issue for automated operations: numerous FMs conformant to the configurationsemantics of φ exist but are likely to have an inappropriate ontological semantics.
assist in selecting a feature hierarchy as close as possible to a ground truth – without an a prioriknowledge of the ground truth.
We now explain the impact of ontological semantics with respect to the FM synthesis, a problemat the heart of many reverse engineering and FM management procedures (see Figure 7.3).
7.2.1 The Importance of Ontological Semantics
Let us consider the following re-engineering scenario (see [48] for more details). After havingreverse engineered an FM, a practitioner aims to generate a graphical interface (like in Figure 7.2b)for assisting users in customizing the product that best fits his/her needs. Unfortunately, theontological semantics of the FM is highly questionable (see Figure 7.2a) and poses two kinds ofproblems.
Automated exploitation. Transformation tools that operate over the FM will naturallyexploit its ontological semantics. Figure 7.2 gives an example of a possible transformation from anFM to a user interface (UI). The generated UI (see Figure 7.2b) is as unintuitive as the ontologicalsemantics of the FM is: features PHP and Java are below MySQL, instead of being below Programming
Language ; Programming Language itself is badly located below Hosting ; Open Source is below Storage
whereas the intended meanings was to state that a Wiki engine has different alternatives of a License.All in all, the series of questions and the organization of the elements in the UI are clearly nonexploitable for a customer willing to choose a Wiki.
Human exploitation. One could argue that an automated transformation is not adequateand a developer is more likely to write or tune the transformation. In this case, the developer facesdifferent problems.
First, there are evident readability issues when the developer has to understand and operateover the model. For example, PHP and Java are misplaced below MySQL in the FM of Figure 7.2a.A developer might understand that the MySQL database is implemented either in Java or PHPwhereas the intended meaning was to state that the Wiki engine is developed in one of these twoprogramming languages. This fictive example illustrates that an incorrect ontological semanticsmight induce a developer in error when exploiting an FM.
Second, when writing the transformation, the ontological semantics cannot be exploited assuch and the developer has to get around the issue, complicating her task. A solution could be torefactor the FM, but the operation is an instance of the synthesis problem (see below). Third, adeveloper can hardly rely on default transformation rules in case the ontological semantics of theFM is incorrect.
Default rules typically organize siblings in a same UI block. In the example of Figure 7.2b theapplication of transformation rules leads to a discussable layout in the UI (Programming Language
and PostgreSQL, Local and Proprietary License are grouped together). As a result, a developer has tooverride transformation rules, increasing the effort. Another option is to correct the ontological
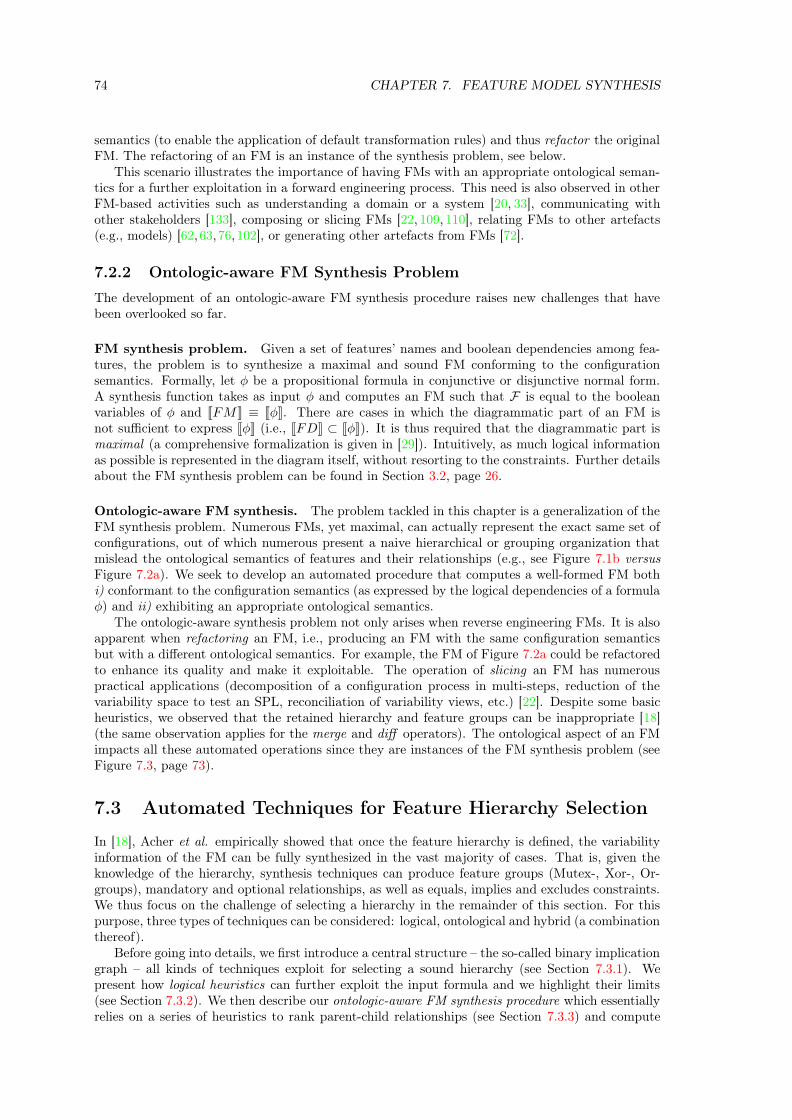
74 CHAPTER 7. FEATURE MODEL SYNTHESIS
semantics (to enable the application of default transformation rules) and thus refactor the originalFM. The refactoring of an FM is an instance of the synthesis problem, see below.
This scenario illustrates the importance of having FMs with an appropriate ontological seman-tics for a further exploitation in a forward engineering process. This need is also observed in otherFM-based activities such as understanding a domain or a system [20, 33], communicating withother stakeholders [133], composing or slicing FMs [22, 109, 110], relating FMs to other artefacts(e.g., models) [62,63,76,102], or generating other artefacts from FMs [72].
7.2.2 Ontologic-aware FM Synthesis Problem
The development of an ontologic-aware FM synthesis procedure raises new challenges that havebeen overlooked so far.
FM synthesis problem. Given a set of features’ names and boolean dependencies among fea-tures, the problem is to synthesize a maximal and sound FM conforming to the configurationsemantics. Formally, let φ be a propositional formula in conjunctive or disjunctive normal form.A synthesis function takes as input φ and computes an FM such that F is equal to the booleanvariables of φ and �FM� ≡ �φ�. There are cases in which the diagrammatic part of an FM isnot sufficient to express �φ� (i.e., �FD� ⊂ �φ�). It is thus required that the diagrammatic part ismaximal (a comprehensive formalization is given in [29]). Intuitively, as much logical informationas possible is represented in the diagram itself, without resorting to the constraints. Further detailsabout the FM synthesis problem can be found in Section 3.2, page 26.
Ontologic-aware FM synthesis. The problem tackled in this chapter is a generalization of theFM synthesis problem. Numerous FMs, yet maximal, can actually represent the exact same set ofconfigurations, out of which numerous present a naive hierarchical or grouping organization thatmislead the ontological semantics of features and their relationships (e.g., see Figure 7.1b versusFigure 7.2a). We seek to develop an automated procedure that computes a well-formed FM bothi) conformant to the configuration semantics (as expressed by the logical dependencies of a formulaφ) and ii) exhibiting an appropriate ontological semantics.
The ontologic-aware synthesis problem not only arises when reverse engineering FMs. It is alsoapparent when refactoring an FM, i.e., producing an FM with the same configuration semanticsbut with a different ontological semantics. For example, the FM of Figure 7.2a could be refactoredto enhance its quality and make it exploitable. The operation of slicing an FM has numerouspractical applications (decomposition of a configuration process in multi-steps, reduction of thevariability space to test an SPL, reconciliation of variability views, etc.) [22]. Despite some basicheuristics, we observed that the retained hierarchy and feature groups can be inappropriate [18](the same observation applies for the merge and diff operators). The ontological aspect of an FMimpacts all these automated operations since they are instances of the FM synthesis problem (seeFigure 7.3, page 73).
7.3 Automated Techniques for Feature Hierarchy Selection
In [18], Acher et al. empirically showed that once the feature hierarchy is defined, the variabilityinformation of the FM can be fully synthesized in the vast majority of cases. That is, given theknowledge of the hierarchy, synthesis techniques can produce feature groups (Mutex-, Xor-, Or-groups), mandatory and optional relationships, as well as equals, implies and excludes constraints.We thus focus on the challenge of selecting a hierarchy in the remainder of this section. For thispurpose, three types of techniques can be considered: logical, ontological and hybrid (a combinationthereof).
Before going into details, we first introduce a central structure – the so-called binary implicationgraph – all kinds of techniques exploit for selecting a sound hierarchy (see Section 7.3.1). Wepresent how logical heuristics can further exploit the input formula and we highlight their limits(see Section 7.3.2). We then describe our ontologic-aware FM synthesis procedure which essentiallyrelies on a series of heuristics to rank parent-child relationships (see Section 7.3.3) and compute
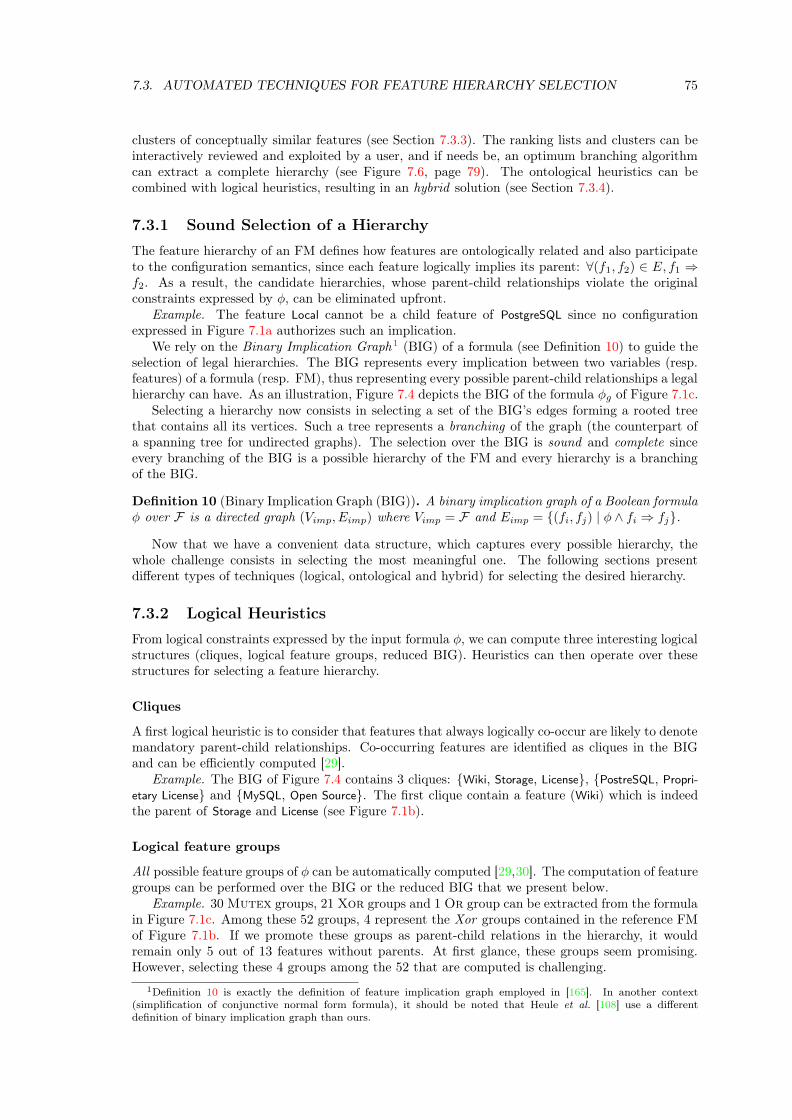
7.3. AUTOMATED TECHNIQUES FOR FEATURE HIERARCHY SELECTION 75
clusters of conceptually similar features (see Section 7.3.3). The ranking lists and clusters can beinteractively reviewed and exploited by a user, and if needs be, an optimum branching algorithmcan extract a complete hierarchy (see Figure 7.6, page 79). The ontological heuristics can becombined with logical heuristics, resulting in an hybrid solution (see Section 7.3.4).
7.3.1 Sound Selection of a Hierarchy
The feature hierarchy of an FM defines how features are ontologically related and also participateto the configuration semantics, since each feature logically implies its parent: ∀(f1, f2) ∈ E, f1 ⇒f2. As a result, the candidate hierarchies, whose parent-child relationships violate the originalconstraints expressed by φ, can be eliminated upfront.
Example. The feature Local cannot be a child feature of PostgreSQL since no configurationexpressed in Figure 7.1a authorizes such an implication.
We rely on the Binary Implication Graph1 (BIG) of a formula (see Definition 10) to guide theselection of legal hierarchies. The BIG represents every implication between two variables (resp.features) of a formula (resp. FM), thus representing every possible parent-child relationships a legalhierarchy can have. As an illustration, Figure 7.4 depicts the BIG of the formula φg of Figure 7.1c.
Selecting a hierarchy now consists in selecting a set of the BIG’s edges forming a rooted treethat contains all its vertices. Such a tree represents a branching of the graph (the counterpart ofa spanning tree for undirected graphs). The selection over the BIG is sound and complete sinceevery branching of the BIG is a possible hierarchy of the FM and every hierarchy is a branchingof the BIG.
Definition 10 (Binary Implication Graph (BIG)). A binary implication graph of a Boolean formulaφ over F is a directed graph (Vimp, Eimp) where Vimp = F and Eimp = {(fi, fj) | φ ∧ fi ⇒ fj}.
Now that we have a convenient data structure, which captures every possible hierarchy, thewhole challenge consists in selecting the most meaningful one. The following sections presentdifferent types of techniques (logical, ontological and hybrid) for selecting the desired hierarchy.
7.3.2 Logical Heuristics
From logical constraints expressed by the input formula φ, we can compute three interesting logicalstructures (cliques, logical feature groups, reduced BIG). Heuristics can then operate over thesestructures for selecting a feature hierarchy.
Cliques
A first logical heuristic is to consider that features that always logically co-occur are likely to denotemandatory parent-child relationships. Co-occurring features are identified as cliques in the BIGand can be efficiently computed [29].
Example. The BIG of Figure 7.4 contains 3 cliques: {Wiki, Storage, License}, {PostreSQL, Propri-
etary License} and {MySQL, Open Source}. The first clique contain a feature (Wiki) which is indeedthe parent of Storage and License (see Figure 7.1b).
Logical feature groups
All possible feature groups of φ can be automatically computed [29,30]. The computation of featuregroups can be performed over the BIG or the reduced BIG that we present below.
Example. 30 Mutex groups, 21 Xor groups and 1 Or group can be extracted from the formulain Figure 7.1c. Among these 52 groups, 4 represent the Xor groups contained in the reference FMof Figure 7.1b. If we promote these groups as parent-child relations in the hierarchy, it wouldremain only 5 out of 13 features without parents. At first glance, these groups seem promising.However, selecting these 4 groups among the 52 that are computed is challenging.
1Definition 10 is exactly the definition of feature implication graph employed in [165]. In another context(simplification of conjunctive normal form formula), it should be noted that Heule et al. [108] use a differentdefinition of binary implication graph than ours.
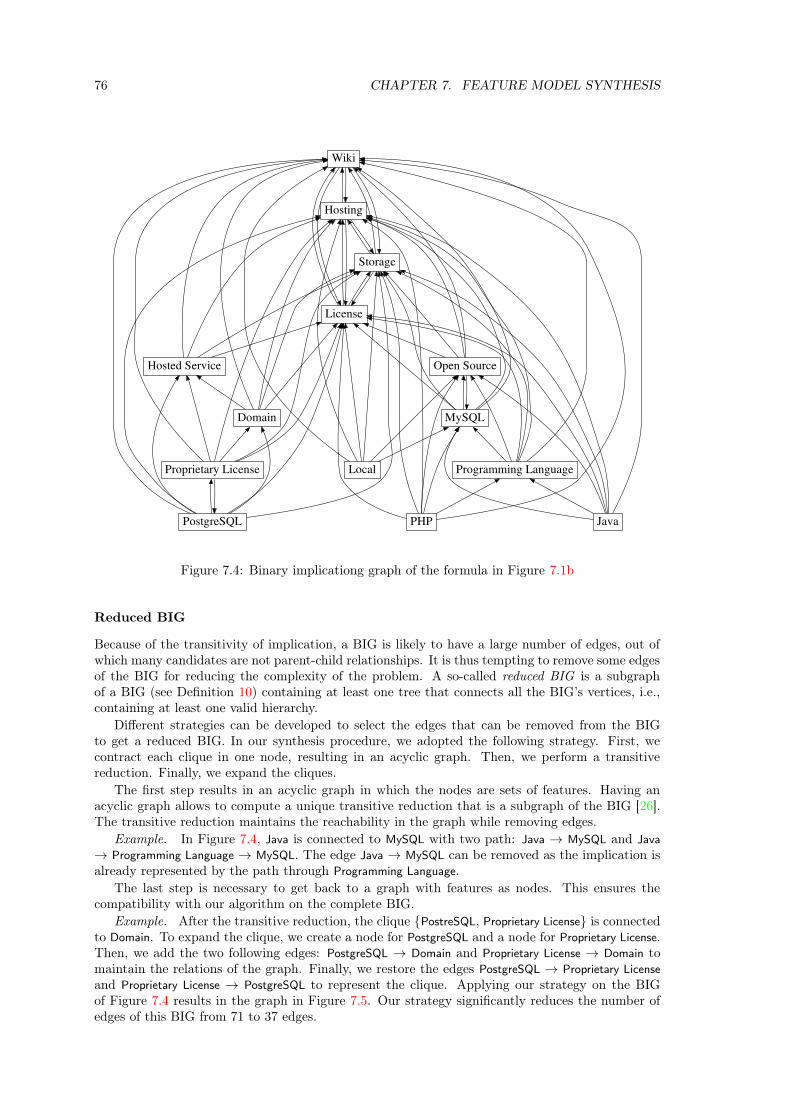
76 CHAPTER 7. FEATURE MODEL SYNTHESIS
PostgreSQL
Domain
Proprietary License
License
Storage
Wiki
Hosting
Hosted Service
MySQL
Open Source
Local Programming Language
JavaPHP
Figure 7.4: Binary implicationg graph of the formula in Figure 7.1b
Reduced BIG
Because of the transitivity of implication, a BIG is likely to have a large number of edges, out ofwhich many candidates are not parent-child relationships. It is thus tempting to remove some edgesof the BIG for reducing the complexity of the problem. A so-called reduced BIG is a subgraphof a BIG (see Definition 10) containing at least one tree that connects all the BIG’s vertices, i.e.,containing at least one valid hierarchy.
Different strategies can be developed to select the edges that can be removed from the BIGto get a reduced BIG. In our synthesis procedure, we adopted the following strategy. First, wecontract each clique in one node, resulting in an acyclic graph. Then, we perform a transitivereduction. Finally, we expand the cliques.
The first step results in an acyclic graph in which the nodes are sets of features. Having anacyclic graph allows to compute a unique transitive reduction that is a subgraph of the BIG [26].The transitive reduction maintains the reachability in the graph while removing edges.
Example. In Figure 7.4, Java is connected to MySQL with two path: Java → MySQL and Java
→ Programming Language → MySQL. The edge Java → MySQL can be removed as the implication isalready represented by the path through Programming Language.
The last step is necessary to get back to a graph with features as nodes. This ensures thecompatibility with our algorithm on the complete BIG.
Example. After the transitive reduction, the clique {PostreSQL, Proprietary License} is connectedto Domain. To expand the clique, we create a node for PostgreSQL and a node for Proprietary License.Then, we add the two following edges: PostgreSQL → Domain and Proprietary License → Domain tomaintain the relations of the graph. Finally, we restore the edges PostgreSQL → Proprietary License
and Proprietary License → PostgreSQL to represent the clique. Applying our strategy on the BIGof Figure 7.4 results in the graph in Figure 7.5. Our strategy significantly reduces the number ofedges of this BIG from 71 to 37 edges.

7.3. AUTOMATED TECHNIQUES FOR FEATURE HIERARCHY SELECTION 77
PostgreSQL
Domain
Proprietary License
MySQL
License
Storage
Wiki
Hosting
Open Source
Local
Hosted Service
Programming Language
JavaPHP
Figure 7.5: Reduced binary implicationg graph of the graph in Figure 7.4
A reduced BIG can be used as a support for a sound synthesis, i.e., all represented hierarchiesof the reduced BIG are conforming to the configuration semantics. However, a reduced BIG losesthe property of completeness as it arbitrarily removes some hierarchies. Overall, it may be anefficient heuristic for reducing the complexity of the synthesis problem.
Potential Limits of Logical Techniques
We now present three techniques of the state-of-the-art that exploit the previous logical structures(BIG, reduced BIG, cliques and feature groups) to select an appropriate hierarchy. Then, wehighlight their potential2 limits regarding the ontologic-aware FM synthesis problem defined inSection 7.2.2.
A first basic approach, denoted FMRANDBIG, is to randomly select a branching of the BIG.As stated in Section 7.3.1, every branching of the BIG is a possible hierarchy of the FM andconversely. Therefore, FMRANDBIG randomly select one of the possible hierarchies for the FM. Asecond approach, denoted FMRANDRBIG, is to randomly select a branching over the reduced BIGinstead of the complete BIG.
A third approach is proposed in [101]. Haslinger et al. proposed a technique (referred asFMFASE in the remainder of the chapter) that takes as input a set of products and fully generatesan FM. The algorithm is iterative and essentially relies on logical structures exposed above: cliquesare randomly unfolded, a reduced BIG is used to select parents, and feature groups (if any) arepromoted.
FMFASE has three major drawbacks: (1) as reported in [101], the generated FM may not conformto the input configurations in the case of arbitrary constraints ; (2) the operations for computing
2The empirical study of the next section is precisely here to observe and quantify the limits in practical settings.

78 CHAPTER 7. FEATURE MODEL SYNTHESIS
logical structures assume the enumeration of the complete set of product. It leads to an exponentialblowup ; (3) feature names and ontological semantics are not considered during the synthesis.
The two first drawbacks – the lack of soundness and the performance issues – prompted usto re-develop their algorithm based this time on state-of-the-art satisfiability techniques [29]. Weconsider that the algorithm, called FMFASESAT hereafter, is representative of a pure logical-basedtechnique for fully synthesizing an FM.
Unawareness of Ontological Meaning. All these logical techniques share the third ma-jor drawback: ontological semantics is not considered during the synthesis. FMRANDBIG andFMRANDRBIG are ignoring any information about the features which can results in inappropriatehierarchies such as the one in Figure 7.2a. FMFASE and FMFASESAT base their hierarchy selectionon logical information which may not reflect actual ontological relations between features. Exam-ple. The features Programming Language and PostgreSQL can form a mutex group according to theformula in Figure 7.1c. Promoting this group as part of the hierarchy is valid from a logical pointof view but it does not correspond to the desired hierarchy presented in Figure 7.1b.
Without exploiting ontological knowledge, it is unlikely that the synthesized FM will correspondto an appropriate ontological semantics. This third drawback is a motivation for the developmentof ontological heuristics which do consider the relations between the features.
7.3.3 Ontological Heuristics
As a reminder, the objective is to select the most appropriate hierarchy from the BIG which isa compact representation of all possible hierarchies of an FM. A first natural strategy is to adda weight on every edge (f1, f2) of the BIG, defining the probability of f2 to be the parent off1. The weights are computed by ontological heuristics that directly evaluate the probability ofa relationship between a feature and a parent candidate. A ranking list of parent candidates foreach feature can be extracted from the weighted BIG. From a user perspective, the ranking listscan be consulted and exploited to select or ignore a parent. In addition, we perform hierarchicalclustering based on the similarity of the features to compute groups of features. The intuitive ideais that clusters can be exploited to identify siblings in the tree since members of the clusters arelikely to share a common parent feature. For example, clusters can help tuning the previouslycomputed weights, thus increasing the quality of the previous ranking lists. Moreover, users canoperate over the clusters to define the parent of a group of features (instead of choosing a parentfor every feature of a group).
Once we get the two pieces of information, we select the branching that has the maximum totalweight. To compute an optimum branching, we use Tarjan’s algorithm [52,170] whose complexityis O(m log n) with n the number of vertices and m the number of edges. The hierarchy is thenfed to syntesize a complete FM. The synthesis process is likely to be incremental and interactive ;users can validate and modify the ranking list and the set of clusters. The overall synthesis processis described in Figure 7.6.
Heuristics for Parent Candidates
The design of the ontological heuristics is guided by a simple observation: parent-child relations ina hierarchy often represent a specialization or a composition of a concept (feature).
Example. Java is a specialization of a Programming language while a Wiki is composed of a License,a Storage and a Programming Language.
As siblings are specializations or parts of the more general concept of their parent, they sharethe same context. Different kinds of relations (e.g., extension of the behavior of a parent feature)can be considered. The intuitive idea is that sharing the same context tends to make a featuresemantically close to its parent and its siblings.
Example. Open source and Proprietary License are both referring to permissive rights about theuse of a product.
From these observations, we developed several heuristics that exploit the feature names in orderto compute the edges’ weights of the BIG. We can divide the heuristics in two categories: syntac-tical heuristics and semantical heuristics.
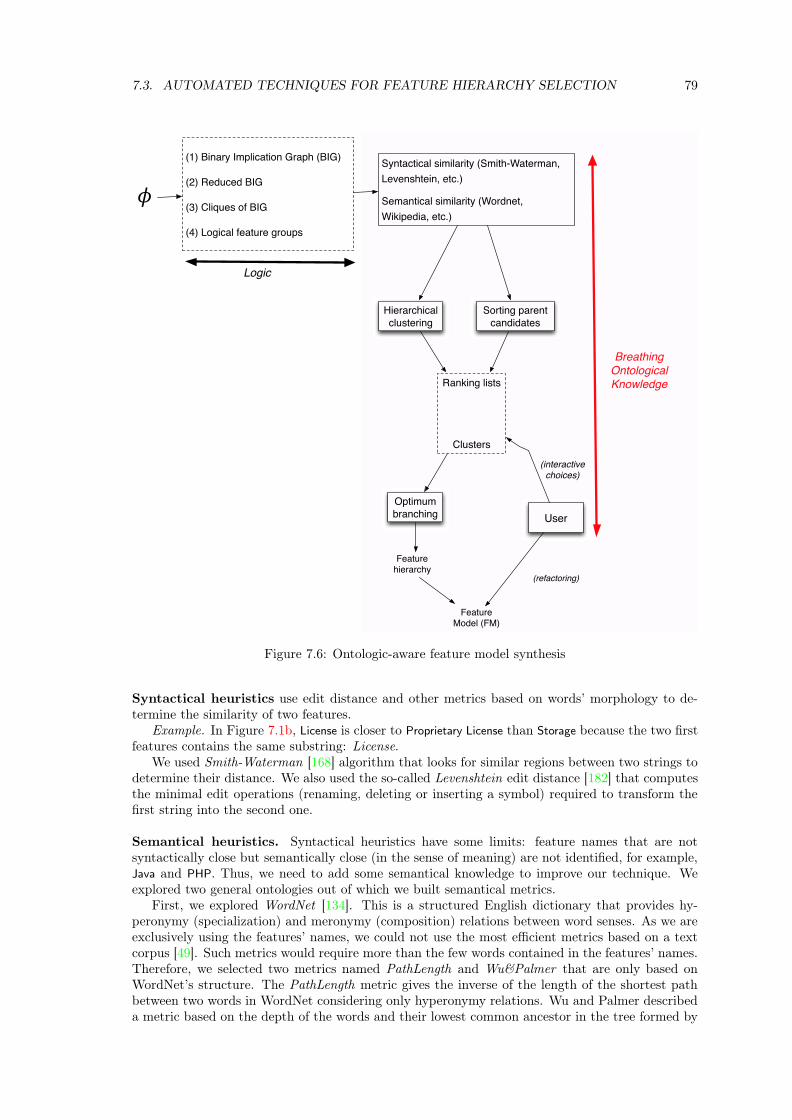
7.3. AUTOMATED TECHNIQUES FOR FEATURE HIERARCHY SELECTION 79
Sorting parent
candidates
Hierarchical
clustering
Optimum
branching User
Feature hierarchy
Feature Model (FM)
Ranking lists
Clusters
� (1) Binary Implication Graph (BIG)
(2) Reduced BIG
(3) Cliques of BIG
(4) Logical feature groups
Syntactical similarity (Smith-Waterman,
Levenshtein, etc.)
Semantical similarity (Wordnet,
Wikipedia, etc.)
(refactoring)
(interactive choices)
Breathing
Ontological
Knowledge
Logic
Figure 7.6: Ontologic-aware feature model synthesis
Syntactical heuristics use edit distance and other metrics based on words’ morphology to de-termine the similarity of two features.
Example. In Figure 7.1b, License is closer to Proprietary License than Storage because the two firstfeatures contains the same substring: License.
We used Smith-Waterman [168] algorithm that looks for similar regions between two strings todetermine their distance. We also used the so-called Levenshtein edit distance [182] that computesthe minimal edit operations (renaming, deleting or inserting a symbol) required to transform thefirst string into the second one.
Semantical heuristics. Syntactical heuristics have some limits: feature names that are notsyntactically close but semantically close (in the sense of meaning) are not identified, for example,Java and PHP. Thus, we need to add some semantical knowledge to improve our technique. Weexplored two general ontologies out of which we built semantical metrics.
First, we explored WordNet [134]. This is a structured English dictionary that provides hy-peronymy (specialization) and meronymy (composition) relations between word senses. As we areexclusively using the features’ names, we could not use the most efficient metrics based on a textcorpus [49]. Such metrics would require more than the few words contained in the features’ names.Therefore, we selected two metrics named PathLength and Wu&Palmer that are only based onWordNet’s structure. The PathLength metric gives the inverse of the length of the shortest pathbetween two words in WordNet considering only hyperonymy relations. Wu and Palmer describeda metric based on the depth of the words and their lowest common ancestor in the tree formed by
80 CHAPTER 7. FEATURE MODEL SYNTHESIS
hyperonymy relations [189].These two metrics compute the similarity of two words, however features’ name may contain
several words. Wulf-Hadash et al. also used the Wu&Palmer metric in order to compute featuresimilarity [190]. We used the same formula for combining word similarity into sentence similarity:
Sim(f1, f2) =
m�i=1
maxj=1..n
wsimi,j +n�
j=1
maxi=1..m
wsimi,j
m+ n
where m and n are respectively the number of words in f1 and f2 and wsimi,j is the similiaritybetween the i-th word of f1 and the j-th word of f2.
WordNet contains few technical words, thus we explored Wikipedia to increase the number ofrecognized words. The well known encyclopedia offers a large database containing text articles andlinks between them. Associating a set of articles to a feature enables the use of techniques thatcompute semantic similarity of texts.
Example. We can associate the features Java and Programming language of the FM in Figure 7.1bto their respective articles in Wikipedia.
To search articles on Wikipedia and compare them, we use the work of Milne et al. [129, 136].The authors provide a tool, called WikipediaMiner, that can extract a database from an offlinedump of Wikipedia, search Wikipedia articles from the database and compare articles based ontheir hyperlinks3.
WikipediaMiner provides a model based on the hyperlink structure of Wikipedia that serves asa basis to compute the semantic similarity of two articles. In this model, an article is representedby a vector containing the occurrence of each link found in the article weighted by the probabilityof the link occurring in the entire Wikipedia database.
Our heuristics exploit WikipediaMiner API and databases to search articles with the closesttitle to a feature’s name4. Then, it computes the semantic similarity of the features based on thesimilarity of the articles. The scores computed by WikipediaMiner are directly assigned to therelevant edges in the BIG. If no article is found, the heuristics simply assigns the minimal weight(i.e., 0) to the edges connected to the feature. It is important to note that the process is fullyautomated: users of such heuristic never have to manually search or compare Wikipedia articles.
Detecting Siblings with Hierarchical Clustering
Defining weights on the BIG’s edges and computing the optimum branching can be summarizedas choosing the best parent for a feature. However, it is sometimes easier to detect that a groupof features are siblings. To detect such siblings we reuse the heuristics of the previous section(Smith-Waterman, Levenshtein, PathLength, Wu&Palmer, Wikipedia and Wiktionary).
We first compute the similarity between features without considering the BIG structure. Then,we perform agglomerative hierarchical clustering on these values. Agglomerative hierarchical clus-tering consists in putting each feature in a different cluster and merge the closest clusters accordingto their similarity. The merge operation is repeated until the distance between two clusters fallsbelow a user specified threshold.
Finally, we use the BIG to determine if the clusters belongs to one of the two categories below.In the following, C represents a cluster and possibleParents gives the parent candidates accordingto the BIG.
• ∃fp ∈ F , ∀fc ∈ C, fp ∈ possibleParents(fc), i.e., all the features can be siblings. It remainsto find a common parent of the cluster among the other features.
• ∃P ⊂ C, ∀fp ∈ P, ∀fc ∈ C, fp �= fc, fp ∈ possibleParents(fc), i.e., some features are parentof the others. It remains to find the parent among the features within the cluster.
3The extraction process is time-consuming (about 2 days on a single machine) and the extracted database containsapproximatively 40GB of data. WikipediaMiner also provides an API to search and compare articles in the database.
4The heuristics based on WikipediaMiner do not guarantee that the most relevant article is retrieved. Forinstance, searching Storage in Wikipedia leads to a disambiguation page linking to different types of storage. Ourcurrent strategy is to arbitrarily choose a given definition. Asking the user to choose the most appropriate articlecan raise this limitation and is an interesting perspective to further improve the effectiveness of our heuristic.

7.4. TOOL SUPPORT 81
In the two cases, the best parent is chosen according to heuristics for parent candidates.Example. In Figure 7.1b, we determine with the Wikipedia heuristic that Java and PHP are
semantically close, thus being in a same cluster. It corresponds to the first category exposed above.The key benefit is that we can now solely focus on their common parents – we can automaticallycompute them using the BIG. The best parent among the common parents corresponds here toProgramming Language.
Clusters and Optimum Branching. Once we have defined the parents of the clusters, we modifythe edges’ weights of the BIG to consider this new information during the optimum branchingalgorithm. This modification consists in setting the maximal weight to each edge between a childand its chosen parent. The rationale is that features of the clusters are likely to share the sameparent, thus the idea of augmenting the weights.
Example. We assign the maximum weight (i.e., 1) for the following BIG’s edges: Java → Pro-
gramming Language and PHP → Programming Language.
7.3.4 Logic + Ontologic = Hybrid
Ontological heuristics allows to synthesize an FM that have both a correct configuration semanticsand an appropriate ontological semantics. However, the complexity of the BIG may disturb thistype of heuristics and limit their benefits. Instead of operating over the BIG, other logical structuresobtained from φ can be considered when applying ontological heuristics (see left part of Figure 7.6).This mix of ontological and logical heuristics is what we call a hybrid heuristic. It exploits logicalinformation to reduce the complexity of the problem and then select an appropriate hierarchybased on ontological information.
We propose a hybrid approach called FMONTOLOGIC in the remainder. The ontological heuristicswe develop in Section 7.4.1 operate this time over the reduced BIG (instead of the BIG itself). Asexplained in Section 7.3.2, this structure significantly reduces the number of parent candidates andclusters; the drawback is that some hierarchies are no longer represented.
Example. In the complete BIG (see Figure 7.4), the feature Java has 7 parent candidates. Inthe reduced BIG (see Figure 7.5), the same feature Java is this time directly in relation with thecorrect parent Programming Language. On the other hand, the loss of completeness can prevent theselection of some desired hierarchies, e.g., PostgreSQL is not anymore in relation with its parentStorage after the reduction of the BIG (see Figure 7.5).
7.4 Tool Support
We implement and integrate all previous automated techniques into WebFML, a Web-based envi-ronment for managing FMs [7]. A unique feature of WebFML is its interactive support for choosinga sound and meaningful hierarchy. Ranking lists, clusters, cliques, and other facilities (graphicalpreview, undo/redo, etc.) are all integrated into WebFML to guide users in the choice of a relevanthierarchy among the numerous possibilities.
WebFML is built on top of FAMILIAR [87] and provides FM management operations all basedon the synthesis procedure. Likewise practitioners can envision the use of WebFML in practicalscenarios: the merging of multiple product lines [23]; the slicing of a configuration process intodifferent steps or tasks [109]; the sound refactoring of FMs [18], especially when fully automatedtechniques produce incorrect FMs; the reverse engineering of configurable systems through thecombined use of composition, decomposition and refactoring operators [14,19].
WebFML also aims to ease the mechanical translation of artefacts with variability into FMs.It enables practitioners (e.g., product line managers, software developers) to reduce their effortand avoid accidental complexity when (re)-engineering or maintaining their variability models. Ina nutshell, WebFML is a comprehensive environment for synthesizing FMs from various kinds ofartefacts:
• product comparison matrices: by giving a specific interpretation of their semantics, a class ofthese matrices can be interpreted as FMs;

82 CHAPTER 7. FEATURE MODEL SYNTHESIS
• dependency graph which can be extracted from configuration files of build systems (e.g.pom.xml files in Maven) [14,19];
• compilation directives and source code in which features and their dependencies can be minedin order to synthesize an FM [29,165].
• propositional formula in conjunctive or disjunctive normal form [18,29,162];
• a (set of) FMs: slicing, merging or refactoring existing FMs are instances of the synthesisproblem we are addressing with WebFML [18,23,109].
7.4.1 Implementation of Ontological Heuristics
As part of WebFML we implemented six ontological heuristics (see Section 7.3) based on specializedlibraries:
• The syntactical heuristics, Smith-Waterman (SW) and Levenshtein (L), come from the Sim-metrics library5;
• PathLength (PL) and Wu&Palmer (WP) rely on extJWNL6 which handles the communica-tion between WordNet and our tool.
• Wikipedia Miner [136] offers an API to browse Wikipedia’s articles offline and compute theirrelatedness [135]. We used this tool on the english version of Wikipedia (Wiki) and Wiktionary(Wikt) which form the last two heuristics.
7.4.2 Features of the environment
WebFML offers an interactive mode where the user can import a formula (e.g., in DIMACS format),synthesizes a complete FM and export the result in different formats. During the FM synthesis,the graphical user interface displays a ranking list of parent candidates for every feature, a list ofclusters, a list of cliques and a graphical preview of the FM under construction (see Figure 7.7, E ,F , G and H ).
During the interactive process, users can:
• select or ignore a parent candidate in the ranking lists (see Figure 7.7, F );
• select a parent for a cluster within the cluster’s features or any potential parent featureoutside the cluster (see Figure 7.7, G ). The user can also consider a subset of a cluster whenselecting the parent;
• select a parent for a clique with the same interaction as clusters (see Figure 7.7, H ).
• undo a previous choice (see Figure 7.7, C );
• define the different heuristics and parameters of the synthesis (see Figure 7.7, B );
• automatically generate a complete FM according to previous choices and selected heuristics(see Figure 7.7, C );
• use FAMILIAR capabilities within an integrated console (see Figure 7.7, I );
• manage FAMILIAR script files and previously computed variables (see Figure 7.7, A andD ).
A typical usage is to perform some choices, generate a complete FM with the heuristics andreiterate until having a satisfactory model. At any moment, the optimum branching algorithm cansynthesize a complete FM.
5http://sourceforge.net/projects/simmetrics6http://extjwnl.sourceforge.net
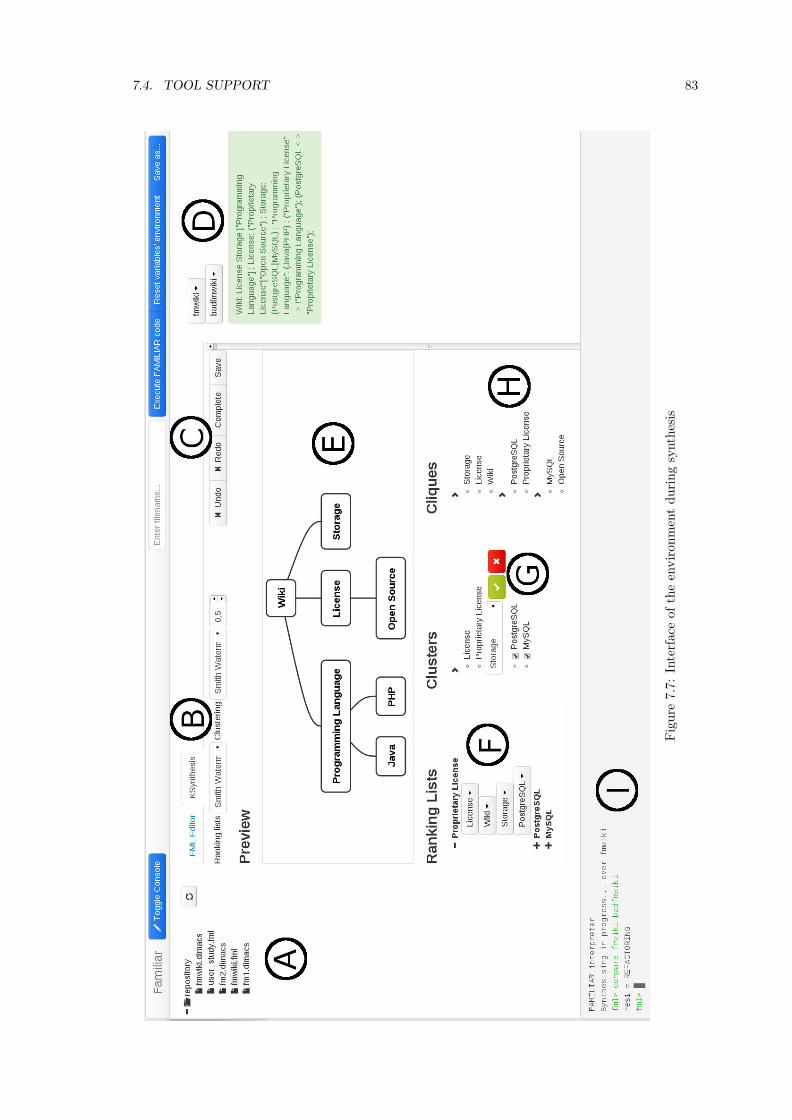
7.4. TOOL SUPPORT 83
Fig
ure
7.7:
Inte
rfac
eof
the
envi
ronm
ent
duri
ngsy
nthe
sis
84 CHAPTER 7. FEATURE MODEL SYNTHESIS
7.4.3 Interactive edits of parent candidates and clusters
The ranking lists of parent candidates and the clusters form the main information during thesynthesis. As the amount of information can be overwhelming, we propose a tree explorer view formanipulating and visualizing both parent candidates and clusters (see Figure 7.7, F , G and H ).A tree explorer view is scalable: it allows to focus on specific features or clusters while the otherinformation in the explorer can be hidden.
During the synthesis, the user interacts almost exclusively by clicking on the elements of theseexplorers. Clicking on a feature in parent candidate lists allows to select or ignore a parent can-didate. Users can also click on a cluster to choose a parent among the common parent candidatesof the sibling features (see Figure 7.7, G ). If the cluster contains the desired parent, the user canclick on the feature and select the children within the cluster. In both cases, the user can deselectsome features to consider only a subset of the cluster. The same behaviour applies to cliques.
We also propose a graphical preview of the FM based on Dagre7 and D38 javascript libraries.It allows to summarize the previous choices and have a global view of the current result (seeFigure 7.7, E ).
7.5 Evaluation
So far, we have presented a sound procedure and various automated techniques, integrated intothe WebFML environment, for synthesizing FMs. In this section we empirically investigate whichheuristics presented in Section 7.3 are the best for breathing ontological knowledge. We conduct aseries of experiments on 156 realistic FMs (see Section 7.5.1 for more details). Given an encodingof an FM fmt as a formula, we evaluate the ability of the different synthesis techniques at selectinga feature hierarchy as close as possible to the original hierarchy of fmt. Specifically we aim atanswering the following research questions:
• RQ1: How effective are the techniques to fully synthesize an FM? Is a fully automatedsynthesis feasible? The effectiveness corresponds to the percentage of parent-child relationsthat are correctly synthesized with respect to the ground truth. When the whole synthesisprocess is performed in a single step, without any user intervention, the resulting FM maybe far from the ground truth. This question aims at quantifying this potential effect.
• RQ2: How effective are techniques to compute ranking lists and clusters? For rankinglists, the effectiveness corresponds to the percentage of parents from the ground truth thatare in the top 2 positions of the lists. For clusters, it corresponds to the percentage ofcorrect clusters (i.e. clusters that exist in the ground truth) and the percentage of featuresthat correct clusters represent in the ground truth FM. Selecting the most likely parentsand siblings of a given feature can significantly reduce the number of choices a user has toperform during the interactive selection of a feature hierarchy. Is the reduction of the BIGa good heuristic? Are logical structures like cliques and feature groups good clusters? Doontological heuristics help?
For each of the research question, we compare logical, ontological and hybrid-based techniquesexposed in Section 7.3. We explore the possible role of the reduced BIG, cliques and logical featuregroups for improving the synthesis – "as such" or as a complement to ontological techniques.
7.5.1 Experimental Settings
FM synthesis techniques under evaluation
Table 7.1 summarizes the available techniques and when they can be applied (e.g., FMFASE does notcompute ranking lists or clusters and thus cannot address RQ2). FMONTO denotes the synthesistechnique that relies on one of the six ontological heuristics over the BIG for computing the full
7https://github.com/cpettitt/dagre8http://d3js.org/
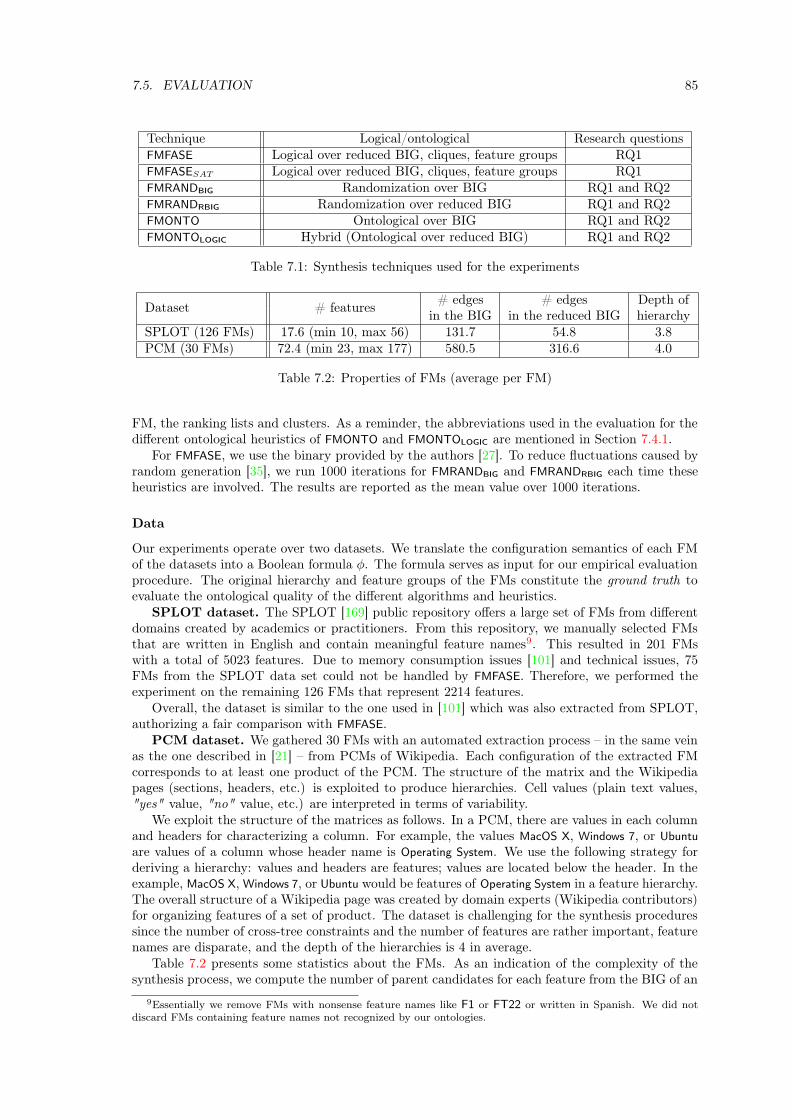
7.5. EVALUATION 85
Technique Logical/ontological Research questionsFMFASE Logical over reduced BIG, cliques, feature groups RQ1FMFASESAT Logical over reduced BIG, cliques, feature groups RQ1FMRANDBIG Randomization over BIG RQ1 and RQ2FMRANDRBIG Randomization over reduced BIG RQ1 and RQ2FMONTO Ontological over BIG RQ1 and RQ2FMONTOLOGIC Hybrid (Ontological over reduced BIG) RQ1 and RQ2
Table 7.1: Synthesis techniques used for the experiments
Dataset # features# edges # edges Depth of
in the BIG in the reduced BIG hierarchySPLOT (126 FMs) 17.6 (min 10, max 56) 131.7 54.8 3.8PCM (30 FMs) 72.4 (min 23, max 177) 580.5 316.6 4.0
Table 7.2: Properties of FMs (average per FM)
FM, the ranking lists and clusters. As a reminder, the abbreviations used in the evaluation for thedifferent ontological heuristics of FMONTO and FMONTOLOGIC are mentioned in Section 7.4.1.
For FMFASE, we use the binary provided by the authors [27]. To reduce fluctuations caused byrandom generation [35], we run 1000 iterations for FMRANDBIG and FMRANDRBIG each time theseheuristics are involved. The results are reported as the mean value over 1000 iterations.
Data
Our experiments operate over two datasets. We translate the configuration semantics of each FMof the datasets into a Boolean formula φ. The formula serves as input for our empirical evaluationprocedure. The original hierarchy and feature groups of the FMs constitute the ground truth toevaluate the ontological quality of the different algorithms and heuristics.
SPLOT dataset. The SPLOT [169] public repository offers a large set of FMs from differentdomains created by academics or practitioners. From this repository, we manually selected FMsthat are written in English and contain meaningful feature names9. This resulted in 201 FMswith a total of 5023 features. Due to memory consumption issues [101] and technical issues, 75FMs from the SPLOT data set could not be handled by FMFASE. Therefore, we performed theexperiment on the remaining 126 FMs that represent 2214 features.
Overall, the dataset is similar to the one used in [101] which was also extracted from SPLOT,authorizing a fair comparison with FMFASE.
PCM dataset. We gathered 30 FMs with an automated extraction process – in the same veinas the one described in [21] – from PCMs of Wikipedia. Each configuration of the extracted FMcorresponds to at least one product of the PCM. The structure of the matrix and the Wikipediapages (sections, headers, etc.) is exploited to produce hierarchies. Cell values (plain text values,"yes" value, "no" value, etc.) are interpreted in terms of variability.
We exploit the structure of the matrices as follows. In a PCM, there are values in each columnand headers for characterizing a column. For example, the values MacOS X, Windows 7, or Ubuntu
are values of a column whose header name is Operating System. We use the following strategy forderiving a hierarchy: values and headers are features; values are located below the header. In theexample, MacOS X, Windows 7, or Ubuntu would be features of Operating System in a feature hierarchy.The overall structure of a Wikipedia page was created by domain experts (Wikipedia contributors)for organizing features of a set of product. The dataset is challenging for the synthesis proceduressince the number of cross-tree constraints and the number of features are rather important, featurenames are disparate, and the depth of the hierarchies is 4 in average.
Table 7.2 presents some statistics about the FMs. As an indication of the complexity of thesynthesis process, we compute the number of parent candidates for each feature from the BIG of an
9Essentially we remove FMs with nonsense feature names like F1 or FT22 or written in Spanish. We did notdiscard FMs containing feature names not recognized by our ontologies.
86 CHAPTER 7. FEATURE MODEL SYNTHESIS
FM. We have an average of 6.3 (from 0 to 36) parent candidates in SPLOT FMs and 8.3 (from 1 to86) for PCM FMs. We also compute the average number of character contained in feature namesof the input formula. The average is 11 characters per name for SPLOT FMs and 18 for PCMFMs. With so little information for the ontological heuristics used in FMONTO and FMONTOLOGIC,the datasets are challenging and longer feature descriptions may improve the following results.
Method for Comparing the Evaluated Techniques
To answer our research questions, we compare the presented techniques according to a set ofmetrics that will be defined throughout the evaluation. To perform this comparison, we computethe average and the median of the metrics over the datasets.
We also run statistical tests to assess the significance of a difference between two techniques.When comparing two techniques, we measure the same metric on the same FMs, thus having pairedsamples. In this case, the most suitable tests are paired tests. A classic paired test is the t-test.However, this particular test requires that the data follows a normal distribution. To verify thisassumption, we used the Shapiro-Wilk test. Most of these tests rejected (according to a threshold of0.05 for the p-value) the hypothesis that the data is normal. Therefore, our experiments rely on theWilcoxon rank-sum test, which does not assume a normal distribution of data. In our evaluation,the null hypothesis states that the two compared techniques have the same mean. The alternatehypothesis states that the means are different. Therefore, if we reject the null hypothesis, thedifference between two techniques is significant but the direction of this difference is still unknown.
To complete the results of our tests, we also compute the effect size (i.e. how different are theresults). In our case, we measure the effect size as the difference of the means of the two comparedtechniques. Using this definition allows an easy interpretation of the effect size in terms of themetric used. It also allows to know the direction of the difference between two heuristics.
In the following sections, the results of the statistical tests are reported according to a thresh-old of 0.05 for the p-value. For further details, all the p-values and effect sizes are reported inAppendix A.
7.5.2 RQ1: Fully Automated Synthesis
Our goal is to evaluate the effectiveness of a fully automated synthesis technique. The resultingsynthesized FM should exhibit a feature hierarchy as close as possible to the original hierarchyof the ground truth. We consider that the more the number of common edges between the twohierarchies is, the more effective the technique is (see Definition 11).
Definition 11 (Effectiveness for a fully automated synthesis). The effectiveness of an FM synthesisalgorithm in a fully automated process is computed as follows:
effectiveness =commonEdges(synthesized FM, ground truth)
|F |− 1
commonEdges(synthesized FM, ground truth) represents the number of edges that are common be-tween the hierarchy synthesized by the algorithm and the hierarchy from the ground truth. Itcorresponds to the number of correct parent-child relations according to the ground truth. |F | isthe number of features in the ground truth FM. As an FM hierarchy is a tree, |F |− 1 is the totalnumber of parent-child relations.
For each input formula/set of configurations of the two data sets, we challenge all the techniquesof Table 7.1 to fully synthesize an FM. In this experiment, we only use the ranking lists computedby the different techniques and we do not consider ontological or logical clusters.
Table 7.3 reports the percentage of common edges with the ground truth. We split the tablein two, clearly separating (1) techniques that operate over the BIG (see Table 7.3a) from (2) tech-niques that apply a logical heuristic and operate over the reduced BIG (see Table 7.3b). There aretwo hypotheses behind this separation.
(H1) Ontological techniques are superior to random or logical heuristics when operating overthe same logical structure.
7.5. EVALUATION 87
H1 Results. In Table 7.3a all ontological heuristics (FMONTO) outperform FMRANDBIG. ForSPLOT, the best heuristic PathLength improves by 9.5% (average) and 10.6% (median) the effec-tiveness of FMRANDBIG. Similar observations are made for the PCM dataset: the best heuristicWikipedia improves by 10.4% (average) and 13.1% (median) the effectiveness of FMRANDBIG.
Table 7.3b shows that almost all ontological heuristics (FMONTO) outperform FMFASE, FMFASESAT
or FMRANDRBIG being on SPLOT or PCM dataset. Only the Levenshtein heuristic is outperformedby FMFASE on SPLOT dataset and by FMRANDRBIG on PCM dataset. However the improvementgained by ontological heuristics is less significant than in Table 7.3a. A possible reason is the useof the reduced BIG (see H2 below).
Statistical tests confirm that FMONTO significantly outperforms FMRANDBIG, except for theWu&Palmer heuristic on the PCM dataset and the Levenshtein heuristic on both datasets. Forthe results of FMONTOLOGIC, 6 out of 30 statistical tests shows that it outperforms pure logicaltechniques (FMRANDRBIG, FMFASE and FMFASESAT ). The other tests cannot conclude that thereis a significant difference with the results of the pure logical techniques.
Overall, we conclude that the hypothesis H1 is verified for the ontological techniques ofFMONTO. We also note an improvement of hybrid techniques of FMONTOLOGIC compared to purelogical techniques (FMRANDRBIG, FMFASE and FMFASESAT ). However, the tests cannot confirmthat this difference is significant. This may be explained by the use of the reduced BIG. The nexthypothesis address this question.
(H2) The reduced BIG can improve the effectiveness.
H2 Results. Results in Table 7.3a and Table 7.3b indicate that all techniques benefit fromthe reduction of the BIG. However the improvement is more apparent for FMRANDBIG. SpecificallyFMRANDRBIG increases by 24.1% (resp. 10.4%) the effectiveness of FMRANDBIG in PCM dataset(resp. SPLOT dataset). Comparatively, the best improvement of FMONTOLOGIC w.r.t. FMONTO is21.8% (resp. 8.2%) in PCM dataset (resp. SPLOT dataset).
The reduction of the BIG significantly decreases the number of edges, thus favouring a randomselection. For the SPLOT dataset, 56.1% (in average, 59.1% for the median) of the parent-childrelations from the ground truth are kept after reduction of the BIG while more than half of theedges are removed. For PCM dataset, 83.8% (in average, 88.1% for the median) of the parent-childrelations from the ground truth are kept after reduction of the BIG while almost half of the edgesare removed. In practice the tradeoff between a reduction of the problem space and a less accuraterepresentation clearly favours both FMONTOLOGIC and FMRANDRBIG.
If we compare the score of FMONTO in Table 7.3a with the scores of FMRANDRBIG, FMFASE
and FMFASESAT in Table 7.3b, we note that the purely logical techniques on the reduced BIGoutperform ontological techniques on the complete BIG. This is another important observation infavour of H2. Without the use of the reduced BIG, ontological heuristics are beat by randomizedor logical-based heuristics, highlighting the prior importance of the logical structure. Finally, allthe statistical tests confirm that H2 is verified.
Key findings for RQ1.
• A fully automated synthesis produces FMs far from the ground truth. At best, the percent-age of correct parent-child relationships in the synthesized FM is 37.8% (for SPLOT) and44.4% (for PCM); In practice the hybrid approach could provide a "by-default" visualisa-tion of the FM but numerous faulty parent-child relationships (more than a half) need tobe reviewed and corrected. Therefore it remains crucial to guide the users when refactoringthe faulty FM or interactively selecting a feature hierarchy during the synthesis process.
• The experiment demonstrates that a hybrid approach provides the best support for fullysynthesizing an FM. A key aspect is that the reduced BIG significantly improves the effec-tiveness of all techniques.

88 CHAPTER 7. FEATURE MODEL SYNTHESIS
Table 7.3: Effectiveness of full synthesis (percentage of common edges)
(a) Full synthesis with BIG
Data setPure logical techniques Ontological techniques (FMONTO)
FMRANDBIG SW L WP PL Wiki Wikt
SPLOTaverage 20.9 28.8 26.9 29.1 30.4 29.4 28.5median 16.7 24.0 21.8 27.3 27.3 26.5 27.3
PCMaverage 15.9 24.0 19.4 20.8 23.2 26.3 22.7median 14.0 19.9 18.0 19.0 22.4 27.1 19.0
(b) Full synthesis with a reduced BIG (� means that the approach cannot be applied due to performanceissues)
Data setPure logical techniques Hybrid techniques (FMONTOLOGIC)
FMFASE FMFASESAT FMRANDRBIG SW L WP PL Wiki Wikt
SPLOTaverage 36.1 31.9 31.3 36.9 34.9 36.5 37.8 37.4 36.7median 35.8 25.0 27.3 32.7 30.8 32.2 36.2 33.9 33.3
PCMaverage � 39.9 40.0 43.1 39.8 42.6 43.6 44.4 42.2median � 32.9 32.8 35.9 34.2 34.1 35.2 37.4 35.5
7.5.3 RQ2: Quality of ranking lists and clusters
Our goal is to evaluate the quality of the ranking lists and the clusters. We also evaluate the useof cliques and feature groups during the synthesis for selecting the hierarchy of an FM. In thisexperiment we do not consider FMFASE and FMFASESAT techniques as they do not provide suchinformation.
Ranking lists
We consider that the ranking lists should place the original parent of the ground truth as closeas possible to the top of the list. Specifically, we look at the Top 2 positions of the lists andevaluate the effectiveness of a technique at computing ranking lists as defined in Definition 12.With an average of 6.3 parent candidates per feature in the SPLOT dataset, we chose to restrictour evaluation to the top 2 positions in order to reduce the impact of random choices. Indeed, italready allows a probability of almost 32% (in average) of having a correct parent for randomizedapproaches.
Definition 12 (Effectiveness for computing ranking lists). The effectiveness of an FM synthesisalgorithm for computing ranking lists is computed as follows:
effectiveness =# parents in top 2 positions
|F |− 1
To compute the # parents in top 2 positions, we check that the parent of each feature (as it appearsin the ground thuth) appears in the top 2 positions of the ranking list. |F |−1 represents the numberof features that have a parent in the ground truth ( i.e. all the features except the root).
Table 7.4 reports the percentage of correct parents in the Top 2 positions of the ranking lists.As in the previous experiment, we separate the techniques that operate over the BIG from thetechniques that operate over the reduced BIG and pose the same two hypotheses as in RQ1.
(H3) Ontological techniques are superior to random heuristics when operating over the samelogical structure.
H3 Results. In Table 7.4a, FMONTO outperforms FMRANDBIG. For SPLOT FMs, the bestheuristic PathLength improves by 10.2% (average) and 11.7% (median) the effectiveness of FMRANDBIG.For the other dataset, the Wikipedia heuristic improves by 9.4% (average) and 10.6% (median) theeffectivness of FMRANDBIG. The statistical tests confirm these results for the SPLOT dataset andfor the Wikipedia heuristic on the PCM dataset. For the other heuristics, the tests cannot confirmthat there is a significant difference between FMONTO and FMRANDBIG.

7.5. EVALUATION 89
Table 7.4: Percentage of correct parents in the top 2 positions of the ranking lists (RQ2)
(a) With BIG
Data setPure logical technique Ontological techniques (FMONTO)
FMRANDBIG SW L WP PL Wiki Wikt
SPLOTaverage 43.0 50.0 49.5 51.6 53.2 51.4 50.2median 38.3 48.8 46.3 50.0 50.0 55.4 50.0
PCMaverage 32.3 39.9 37.3 37.0 39.8 41.7 38.0median 28.9 37.2 35.8 34.5 40.0 39.5 34.0
(b) With reduced BIG
Data setPure logical technique Hybrid techniques (FMONTOLOGIC)
FMRANDRBIG SW L WP PL Wiki Wikt
SPLOTaverage 51.6 56.4 55.6 57.1 58.9 57.1 56.5median 50.5 55.6 55.1 54.9 56.3 58.3 57.1
PCMaverage 52.2 54.9 53.0 55.0 56.3 55.7 54.3median 46.5 53.5 47.7 52.9 55.0 55.9 53.6
Table 7.4b also shows that FMONTOLOGIC outperforms FMRANDRBIG on both data sets but thescores are significantly closer. The tests reflect this observation as they cannot confirm that adifference exists between FMONTOLOGIC and FMRANDRBIG, except for the PathLength heuristic onthe SPLOT dataset.
Overall, we cannot conclude that the hypothesis H3 is verified in all cases but the averageand median scores indicate at least a slight improvement of the effectiveness of FMONTO (resp.FMONTOLOGIC) compared to FMRANDBIG (resp. FMRANDRBIG).
(H4) The reduced BIG improves the quality of ranking lists.H4 Results. The SPLOT dataset (resp. PCM dataset) results in a 5.7% (average) and 6.3%
(median) (resp. 16.5% and 15%) improvement of the effectiveness of our best heuristic PathLength.FMRANDRBIG also clearly benefits from the reduction of the BIG as it improves the effectiveness ofFMRANDBIG by 8.6% for SPLOT and 19.9% for PCM.
The statistical test confirms the results on the PCM dataset. However, on the SPLOT dataset,the difference is not significant for most of the heuristics. This may be explained by the 43.9% ofcorrect parents brutally removed by the reduction in the SPLOT dataset. For the PCM dataset,the reduction of the BIG removes only 16.2% of correct parents.
As a result, the hypothesis H4 is verified for the PCM dataset but the results for SPLOT showsthat the reduced BIG may have a limited effect.
Clusters
We consider that the computed clusters should contain either sibling features from the ground truthor siblings with their corresponding parent – in line with the two cases identified in Section 7.3.3,page 80. For example in Figure 7.1b, page 70, {Hosted Service, Local} is a correct cluster becausethe two features are siblings. {Hosted Service, Local, Hosting} is also a correct cluster becauseHosting is the parent of Hosted Service and Local. The effectiveness of a technique corresponds tothe number of correct clusters and the percentage of features that these clusters represent (seeDefinition 13 for further details).
Definition 13. The effectiveness of an FM synthesis algorithm for computing clusters is composedof two aspects:
Percentage of correct clusters =# correct clusters
# clusters
Percentage of features in a correct cluster =# features in correct clusters
|F |
# clusters represents the number of clusters that are generated by the algorithm. # correct clustersis the number of clusters that contain either sibling features from the ground truth or siblings with

90 CHAPTER 7. FEATURE MODEL SYNTHESIS
their corresponding parent. # features in correct clusters is the sum of the correct clusters’ sizes.Finally, |F | represents the number of features in the ground truth.
Table 7.5 reports for each dataset, the number of clusters, the clusters’ sizes, the percentage ofcorrect clusters computed by the techniques, and the number of features in a correct cluster (inaverage and for the median). For each heuristic, we optimized10 the thresholds for the clusteringin order to produce the largest number of features in a correct cluster. Intuitively, clusters allowthe user to choose only one parent for a set of features. Maximizing the number of features incorrect clusters potentially reduces the user effort. As previously, we separate our evaluation intwo hypotheses.
(H5) Ontological techniques are superior to random heuristics when computing clusters over thesame logical structure.
H5 Results. Table 7.5a shows that FMONTO generates less clusters per FM than FMRANDBIG.However, FMONTO produces clusters that are slightly bigger and more accurate. For SPLOT, ourbest heuristic PathLength generates 67.6% (average) and 75% (median) of correct clusters whileFMRANDBIG reaches 27.7% (average) and 25% (median). The percentage of features in correctclusters is also significantly better than FMRANDBIG. For the PCM dataset, the difference is greaterwith 79.2% (average) and 77.7% (median) of correct clusters for PathLength comparted to only14.9% (average) and 12.8% (median) for FMRANDBIG. Table 7.5b also shows that FMONTOLOGIC
outperforms FMRANDRBIG for all the results.We observe that PathLength is the best heuristic according to the percentage of correct clusters
whereas Levenshtein is the best one according to the percentage of features in a correct cluster.We also note that the Levenshtein heuristic produces more and bigger clusters than PathLength.These differences show that there is a tradeoff between the number of features contained in clustersand their accuracy. It corresponds to the classical tradeoff between precision and recall that willbe further illustrated with the use of the reduced BIG in H6.
Statistical tests show that FMONTO (resp. FMONTOLOGIC) outperforms FMRANDBIG (reps.FMRANDRBIG) on both datasets, except for Wu&Palmer and PathLength heuristics. It confirmsthe usefulness of ontological-based heuristics, whether they operate over a reduced BIG or a BIGand validates the hypothesis H5.
(H6) The reduced BIG improves the quality of the clusters.H6 Results. Table 7.5b shows that the reduced BIG allows to produce less clusters per FM
compared to the techniques operating over the complete BIG. The clusters are also slightly smaller.For SPLOT, 74.8% (average) and 100% (median) of clusters are correct with our best heuristicWiktionary. For PCM, the PathLength heuristic produces 89.2% (average) and 89.6% (median) ofcorrect clusters. Therefore, and for every ontological-based heuristics, the accuracy of the generatedclusters increases when we reduce the BIG. The statistical tests confirm these results except forWu&Palmer and PathLength heuristics on the SPLOT dataset despite their improvements.
However, the percentage of features in a correct cluster is slightly inferior compared to theresults with a complete BIG. On a complete BIG (see Table 7.5a), our best heuristic Levenshteinproduces 31% (average) and 30% (median) of correct clusters for SPLOT (resp. 41.4% and 41.2%for PCM). On a reduced BIG, Levenshtein produces 29.2% (average) and 29% (median) for SPLOT(reps. 41% and 41.2% for PCM). All the statistical tests are consistent with these observations asthey cannot state that the difference is significant.
The results show that there is no clear superiority of an approach. The use of the reduced BIGor the use of the complete BIG when computing clusters have both pros and cons. On the one hand,the reduced BIG supports the identification of more accurate but less clusters with less features.On the other hand, the complete BIG provides more false positives but a user can consult andmanipulate larger clusters. From a practical and tooling point of view, there is a classical tradeoffto find between precision and recall.
10The threshold values were manually determined. For each heuristic, we changed the threshold value by stepsof 0.1 (all our heuristics return a value between 0 and 1) to maximize the average number of features in a correctcluster.
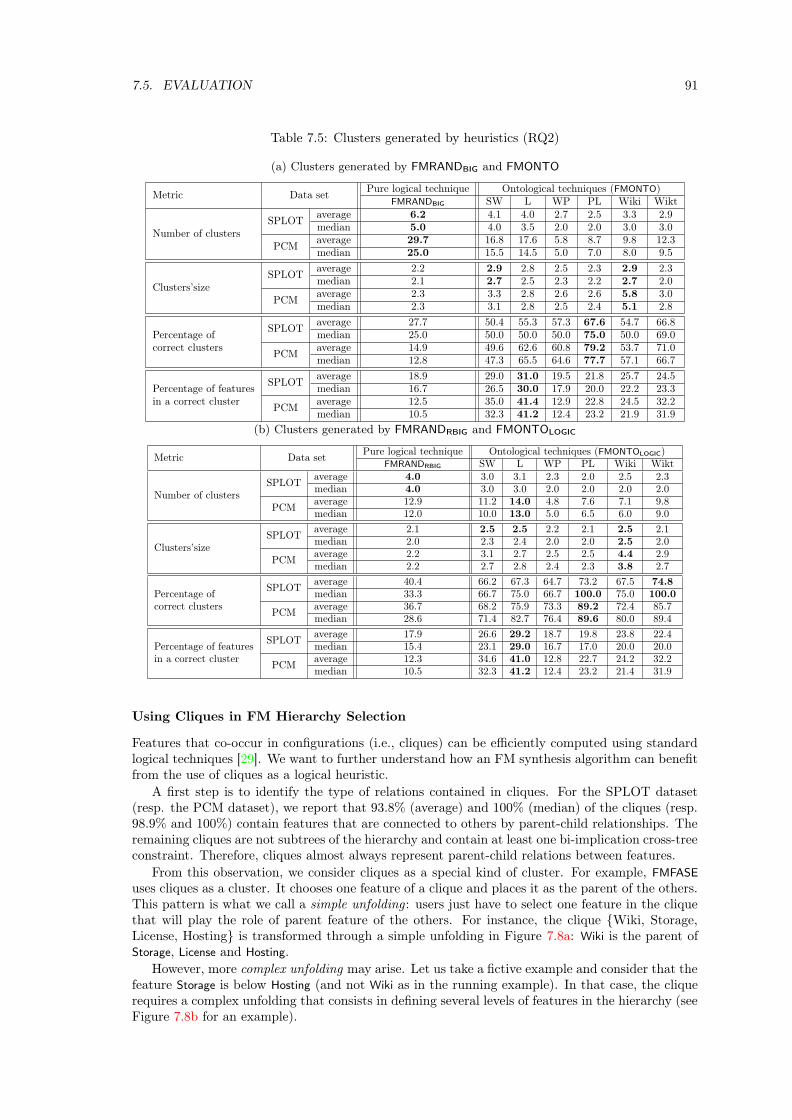
7.5. EVALUATION 91
Table 7.5: Clusters generated by heuristics (RQ2)
(a) Clusters generated by FMRANDBIG and FMONTO
Metric Data setPure logical technique Ontological techniques (FMONTO)
FMRANDBIG SW L WP PL Wiki Wikt
Number of clustersSPLOT
average 6.2 4.1 4.0 2.7 2.5 3.3 2.9median 5.0 4.0 3.5 2.0 2.0 3.0 3.0
PCMaverage 29.7 16.8 17.6 5.8 8.7 9.8 12.3median 25.0 15.5 14.5 5.0 7.0 8.0 9.5
Clusters’sizeSPLOT
average 2.2 2.9 2.8 2.5 2.3 2.9 2.3median 2.1 2.7 2.5 2.3 2.2 2.7 2.0
PCMaverage 2.3 3.3 2.8 2.6 2.6 5.8 3.0median 2.3 3.1 2.8 2.5 2.4 5.1 2.8
SPLOTaverage 27.7 50.4 55.3 57.3 67.6 54.7 66.8
Percentage of median 25.0 50.0 50.0 50.0 75.0 50.0 69.0correct clusters
PCMaverage 14.9 49.6 62.6 60.8 79.2 53.7 71.0median 12.8 47.3 65.5 64.6 77.7 57.1 66.7
SPLOTaverage 18.9 29.0 31.0 19.5 21.8 25.7 24.5
Percentage of features median 16.7 26.5 30.0 17.9 20.0 22.2 23.3in a correct cluster
PCMaverage 12.5 35.0 41.4 12.9 22.8 24.5 32.2median 10.5 32.3 41.2 12.4 23.2 21.9 31.9
(b) Clusters generated by FMRANDRBIG and FMONTOLOGIC
Metric Data setPure logical technique Ontological techniques (FMONTOLOGIC)
FMRANDRBIG SW L WP PL Wiki Wikt
Number of clustersSPLOT
average 4.0 3.0 3.1 2.3 2.0 2.5 2.3median 4.0 3.0 3.0 2.0 2.0 2.0 2.0
PCMaverage 12.9 11.2 14.0 4.8 7.6 7.1 9.8median 12.0 10.0 13.0 5.0 6.5 6.0 9.0
Clusters’sizeSPLOT
average 2.1 2.5 2.5 2.2 2.1 2.5 2.1median 2.0 2.3 2.4 2.0 2.0 2.5 2.0
PCMaverage 2.2 3.1 2.7 2.5 2.5 4.4 2.9median 2.2 2.7 2.8 2.4 2.3 3.8 2.7
SPLOTaverage 40.4 66.2 67.3 64.7 73.2 67.5 74.8
Percentage of median 33.3 66.7 75.0 66.7 100.0 75.0 100.0correct clusters
PCMaverage 36.7 68.2 75.9 73.3 89.2 72.4 85.7median 28.6 71.4 82.7 76.4 89.6 80.0 89.4
SPLOTaverage 17.9 26.6 29.2 18.7 19.8 23.8 22.4
Percentage of features median 15.4 23.1 29.0 16.7 17.0 20.0 20.0in a correct cluster
PCMaverage 12.3 34.6 41.0 12.8 22.7 24.2 32.2median 10.5 32.3 41.2 12.4 23.2 21.4 31.9
Using Cliques in FM Hierarchy Selection
Features that co-occur in configurations (i.e., cliques) can be efficiently computed using standardlogical techniques [29]. We want to further understand how an FM synthesis algorithm can benefitfrom the use of cliques as a logical heuristic.
A first step is to identify the type of relations contained in cliques. For the SPLOT dataset(resp. the PCM dataset), we report that 93.8% (average) and 100% (median) of the cliques (resp.98.9% and 100%) contain features that are connected to others by parent-child relationships. Theremaining cliques are not subtrees of the hierarchy and contain at least one bi-implication cross-treeconstraint. Therefore, cliques almost always represent parent-child relations between features.
From this observation, we consider cliques as a special kind of cluster. For example, FMFASE
uses cliques as a cluster. It chooses one feature of a clique and places it as the parent of the others.This pattern is what we call a simple unfolding : users just have to select one feature in the cliquethat will play the role of parent feature of the others. For instance, the clique {Wiki, Storage,License, Hosting} is transformed through a simple unfolding in Figure 7.8a: Wiki is the parent ofStorage, License and Hosting.
However, more complex unfolding may arise. Let us take a fictive example and consider that thefeature Storage is below Hosting (and not Wiki as in the running example). In that case, the cliquerequires a complex unfolding that consists in defining several levels of features in the hierarchy (seeFigure 7.8b for an example).

92 CHAPTER 7. FEATURE MODEL SYNTHESIS
(a) Simple unfolding : one parent and one level ofdescendants
Wiki
Storage License Hosting
(b) Complex unfolding : one parent and severallevels of descendants
Wiki
Storage
License Hosting
Figure 7.8: Clique unfolding: simple versus complex
Table 7.6: Cliques and logical feature groups as clusters
(a) With the BIG (� means that the clusters cannot be computed due to performance issues)
Metric Data set CliquesFeature groups
All groups Mutex Xor Or
Number of clustersSPLOT
average 1.6 9.5 2.8 5.9 1.3median 1.0 3.0 0.0 1.0 1.0
PCMaverage 1.4 55.7 45.2 17.8 �
median 1.0 8.0 7.5 1.0 �
Clusters’sizeSPLOT
average 5.0 2.2 1.2 1.6 1.8median 4.0 2.3 0.0 2.0 2.0
PCMaverage 7.0 5.7 5.6 5.4 �
median 6.0 5.0 4.5 5.0 �
SPLOTaverage 50.0 69.3 41.7 89.1 72.9
Percentage of correct median 50.0 75.0 33.3 100.0 100.0clusters
PCMaverage 31.1 92.2 91.5 91.1 �
median 0.0 100.0 100.0 100.0 �
SPLOTaverage 17.5 36.3 5.8 21.9 13.2
Percentage of features median 15.4 35.0 0.0 16.0 8.9in a correct cluster
PCMaverage 3.3 60.7 53.2 15.6 �
median 0.0 60.7 53.1 12.2 �
(b) With the feature graph (reduced BIG)
Metric Data setFeature groups
All groups Mutex Xor Or
Number of clustersSPLOT
average 3.7 0.4 2.0 1.3median 2.0 0.0 1.0 1.0
PCMaverage 10.4 8.4 2.0 �
median 8.0 5.0 1.0 �
Clusters’sizeSPLOT
average 2.2 0.5 1.4 1.8median 2.3 0.0 2.0 2.0
PCMaverage 5.9 5.3 5.8 �
median 5.0 3.9 5.0 �
SPLOTaverage 80.0 69.0 92.1 72.9
Percentage of correct median 100.0 100.0 100.0 100.0clusters
PCMaverage 100.0 100.0 100.0 �
median 100.0 100.0 100.0 �
SPLOTaverage 32.6 2.6 16.7 13.2
Percentage of features in a median 33.3 0.0 13.6 8.9correct cluster
PCMaverage 64.3 46.0 18.3 �
median 60.7 40.7 14.0 �

7.5. EVALUATION 93
����
������� ������� �������
����� ����������
�
����� ����������
����������������������������������
����� ����������
Figure 7.9: Logical feature groups: bi-implied features, clique contraction, parent place-holder
We evaluate the use of cliques as clusters with the same metrics used in Section 7.5.3. Table 7.6apresents the results. We observe that simple unfolding (i.e. a correct cluster) is required in 50%(average) and 50% (median) of the cliques of SPLOT FMs. For PCM FMs, this pattern represents31.1% (average) and 0% (median) of the cliques. In at least half of the cases, cliques require moreuser effort than a traditional cluster in which only one parent should be selected (i.e. it requires acomplex unfolding). Therefore, a simple unfolding can be used as a default heuristic for selectingparent-child relations in a clique but not as a reliable heuristic in a fully automated synthesis.
Using Logical Feature Groups in FM Hierarchy Selection
In addition to cliques, logical feature groups can be exploited during the selection of the FMhierarchy. All possible logical feature groups of a formula can be computed either using the reducedBIG [29] or the BIG. A logical feature group consists in a set of sibling features and a parent feature.It is in line with the definition of cluster given in Section 7.3.3. We study here how the so-calledlogical feature groups are interesting structures for representing clusters.
Computing feature groups from a formula may lead to numerous groups containing the sameset of sibling features but with different parents. This is due to feature groups in which the parentis logically bi-implied by another feature (i.e., the parent feature belongs to a clique). An exampleis given in Figure 7.9. To avoid this combinatorial explosion, we omit the parents and consider onlythe sibling features. We introduce a place-holder that can be one of the parent of the siblings (seeright of Figure 7.9). This factoring strategy has the merit of presenting to users only one cluster,abstracting numerous other clusters. For the experiment, we verified whether logical feature groupsare correct clusters – in line with the definition of Section 7.5.3, page 89.
Table 7.6a shows the results. For SPLOT FMs, 69.3% (average) and 75% (median) of logicalfeature groups are correct clusters. These results are slightly superior to the 67.6% (average) and75% (median) of correct clusters generated by our best heuristic PathLength (see Table 7.5a).
For PCM FMs, 92.2% (average) and 100% (median) of feature groups are correct clusters. Itoutperforms the 79.2% (average) and 77.7% (median) of correct clusters from our best heuristicPathLength.
However, we note that 473 Xor-groups were generated from a unique FM and 36 only werecorrect clusters. This extreme example shows that, in some cases, logical feature groups may chal-lenge an automated technique or overwhelm a user with numerous incorrect clusters.
(H7) The reduced BIG can improve the quality of logical feature groups.H7 Results. Table 7.6b shows the same metrics than Table 7.6a but for feature groups com-
puted from the reduced BIG of the FM. We note that reducing the BIG significantly reduces thenumber of computed feature groups. Also, their accuracy increases compared to the groups in Ta-ble 7.6a but the correct groups often involve less features. Statistical tests show that the percentageof correct clusters is significantly better when using a reduced BIG. However, the difference in thepercentage of features in a correct cluster is not stated as significant. Moreover, the test for theMutex groups on the SPLOT dataset shows a significant decrease of the metric. Therefore, thetest cannot verify H7 but they illustrate the tradeoff between precision and recall when computingclusters which is consistent with the results of H6.

94 CHAPTER 7. FEATURE MODEL SYNTHESIS
Key findings for RQ2.
• The experiment demonstrates that an approach based on ontological heuristics providesthe best support for producing ranking lists. At best, the user has to review only 2 parentcandidates for 58.9% of the features (for SPLOT) and 56.3% (for PCM);
• An approach based on the reduced BIG does not necessarily improve the quality of theranking lists or clusters;
• Ontological heuristics are beneficial to ranking lists. Ontological heuristics also generateless clusters than FMRANDBIG but they are far more accurate;
• Among the ontological heuristics, there is no clear winner – even if all are beneficial forbreathing ontological knowledge;
• In 93.8% (resp. 98.9%) of the cases, all features of the cliques are connected by parent-childrelationships to at least one feature. Nevertheless cliques require complex unfolding in morethan 50% of the cases;
• Logical feature groups form accurate clusters especially when they are computed over thereduced BIG. The place-holder for factoring out similar feature groups makes the difference.Yet there are extreme cases in which lots of logical feature groups do not correspond toclusters.
7.5.4 Summary and Discussion
Eventually a combined use of techniques, that is, a hybrid approach empirically emerges:
• Ontological heuristics with reduced BIG are the best suited for a one-step full synthesis ofFM (see RQ1);
• Ontological heuristics over the reduced BIG are the best suited for computing ranking lists(see RQ2);
• Logical feature groups with place-holders and computed over the reduced BIG are the mostaccurate clusters (see RQ2);
• Cliques and clusters obtained with ontological heuristics can complete the information pre-sented to users (see RQ2).
The empirical results impact feature modeling tools (e.g., WebFML) and call for more investi-gations in terms of user experience.
As part of WebFML we have integrated default synthesis heuristics for (1) one-step full synthesis,(2) ranking lists and (3) clusters. We choose the most suited heuristics according to the empiricalresults. We now discuss our choices, some tradeoffs, and practical implications of the experiments.
For one-step full synthesis, we select PathLength with the reduced BIG as the default heuristic(PathLength gives the best results for the SPLOT dataset). All heuristics operating over theBIG are inferior to PathLength and are not included in WebFML. Statistical tests show no clearsuperiority of PathLength over other ontological heuristics with the reduced BIG or FMFASE. Thechoice of PathLength can thus be replaced by another heuristic (WebFML allows users to choose aspecific heuristic).
More importantly, the empirical results show that one-step full synthesis is far from the groundtruth. Two attitudes are possible for a user. The first is to refactor the synthesized FM and fixthe erroneous relations between features. The second is to not use a one-step full synthesis. Inany case, a crucial feature of WebFML is the ability to provide an interactive support for users (seehereafter).
For the computation of ranking lists, PathLength and Wikipedia heuristics outperform the otherheuristics of FMONTO and FMONTOLOGIC. The two heuristics have very similar results. In WebFML,
7.6. THREATS TO VALIDITY 95
we choose PathLength as the default heuristic. The reason of this choice instead of Wikipedia is onlytechnical. The Wikipedia heuristic requires a large database (40GB) which makes the deploymentharder than with a WordNet based heuristic.
For the computation of clusters, two ontological heuristics stand out and have interesting prop-erties: PathLength and Levenshtein. Yet the choice of a default heuristic requires to consider sometradeoffs. On the one hand, PathLength is the most accurate heuristic. On the other hand, thecorrect clusters produced by Levenshtein cover more features. In practice, a user of WebFML needsto review less clusters with PathLength but the part of the hierarchy that could be synthesizedfrom these clusters is smaller. Conversely, using Levenshtein forces the user to review more clustersbut the induced benefit can be more important.
The tradeoff between the number of clusters to review and the accuracy of the heuristics needsto be addressed in a usability study. Currently, Levenshtein is the default heuristic retainedfor computing clusters in WebFML. WebFML does not present logical feature groups by default,considering they may overwhelm users with lots of false clusters. Nevertheless users can depictthem on demand, typically when choices have already been made and the number of clusters isbecoming lower. More generally, users can change heuristics for clusters if needs be and WebFML
provides facilities to manage clusters (e.g., non relevant clusters can be removed).
Summary. Ranking lists, logical feature groups, cliques, clusters with ontological heuristics: allare potentially useful for the synthesis; and the better they are, the better it is for users. Based onempirical results, WebFML integrates state-of-the-art techniques and provides advanced facilitiesfor manipulating the information (e.g., unfolding of cliques). Now the overall challenge is to makeall these structures visible into an environment – without overwhelming and distracting the userwith extraneous or redundant information. The usability aspects of an FM synthesis environmentlike WebFML deserve a focused and careful attention. We leave it as future work.
7.6 Threats to Validity
7.6.1 External Validity
Threats to external validity are conditions that limit our ability to generalize the synthesis resultsto other forms of dependencies or feature names. A first concern is whether FMs are representativeof practice. We use the SPLOT public repository [169]. SPLOT is a common benchmark forthe FM community (see, e.g., [18, 29, 100, 101, 132, 146, 147, 157, 191]) and is considered to manage"realistic" examples by several authors. We also diversify the dataset with the use of PCMs.
Our major concern is whether FMs (from SPLOT or PCMs) are good ground truths w.r.tontological semantics. Indeed, a unique characteristic of our work is that we do consider theontological semantics of the FMs. From this respect, it is hard to certify that the chosen FMs areof good quality. The fact that FMs of SPLOT come from academic publications and practitionersis certainly a good point, but not a guarantee. A possible improvement is a manual review of theFMs, at least to discard FMs with nonsense feature names, at best to possibly improve FMs. Theontological semantics of FMs we extract from PCMs is aligned with the structure of Wikipediapages and the matrix itself but would also benefit from an external review, e.g., by another poolof researchers.
Another external threat is that we hypothesize that the user effort is reduced thanks to thebranching algorithm, the computation of clusters and ranking lists, and the interactive support.We have not run user experiments to validate this claim. Such experiments involve usability ofWebFML while we focus on the automated techniques. This evaluation is future work.
7.6.2 Internal Validity
A first internal threat is that the manual selection of the SPLOT FMs was done by the authors. Toavoid subjective choices, we clearly defined criteria for rejecting an FM before doing the selection.Moreover, the selection was performed separately by two of the authors and their results werecross-checked.

96 CHAPTER 7. FEATURE MODEL SYNTHESIS
Another internal threat is that the extraction of FMs from PCMs is a mix between automatedtechniques and manual directives. This creates a threat of potential bias, since the author knewthe procedures that were to be evaluated against this model. We take care of retaining the originalstructure of the PCMs. The manual intervention essentially consists in removing unnecessarycolumns (like the version number, website or developer name of a product). Importantly, ourinterpretation of variability remains fixed for all the PCMs (e.g., we interpret a "No" value in acell as an absence of a feature). Another interpretation of variability can lead to a different setof dependencies and may disturb some heuristics (e.g., the use of the reduced BIG). We plan tofurther investigate this hypothesis in the future. Moreover, as we apply part of our procedures toWikipedia PCMs dataset, one might perceive that some of the heuristics, based also on Wikipedia,are biased. However the heuristics do not operate over Wikipedia pages where we extracted thePCM. We exploit Wikipedia as a general ontology.
Another internal threat comes from the manual optimization of the clustering thresholds forthe evaluation of the heuristics. Another set of thresholds could generate less favourable results.It is unclear whether this difference would be significant.
The statistical tests performed in the evaluation form another internal threat. Performing adifferent test or interpreting differently the results could change the conclusions about the effec-tiveness of our algorithms and heuristics. However, the Wilcoxon test and the 0.05 threshold forthe p-values are classical setups for this kind of evaluation. Moreover, we provide all the p-valuesin Appendix A so that the reader can make his or her own interpretation of the results.
Finally we implement various heuristics and procedures for synthesizing FMs or collectingstatistics. Their implementation may be incorrect. We thoroughly tested our infrastructure usingtest cases and reuse as much as possible existing codes [22, 29, 78]. We replicated numerous timesthe empirical study, on different datasets (see, e.g., our technical report using an older SPLOTdataset [2]). Besides the collection of results and statistics is fully automated with R scripts.
7.7 Conclusion
In this chapter, we address the problem of synthesising a feature model (FM) conformant to a set ofconfigurations and also exhibiting an appropriate ontological semantics as defined by its hierarchyand feature groups. This problem is crucial for product line (re-)engineering scenarios involvingreverse engineering, slicing, or refactoring of FMs.
We develop a series of automated techniques, applicable without prior knowledge or artefacts, totake into account ontological knowledge during FM synthesis. We perform an empirical evaluationon 156 sets of configurations for which we have a ground truth FM. We use two data sets: (1) theSPLOT repository [169] and (2) large FMs extracted from PCMs found in Wikipedia. The FMscome from different domains and their complexity vary. In average, there are 18 features per FMof SPLOT, 72 features per FM of PCMs, and about 7 parent candidates per features to consider.We empirically characterize the strengths and limits of state-of-the-art automated techniques inthe quest of breathing ontological knowledge into FM synthesis. The experiments also show thata hybrid approach, mixing ontological and logical techniques, provides the best support for fullysynthesizing an FM or for assisting users through ranking lists and clusters.
Our dataset on PCMs from Wikipedia shows that the formalization of a class of PCMs throughthe use of FMs is possible. As long as the PCM is not ambiguous and that its semantics is encodablein a propositional formula, our techniques can automatically synthesize a corresponding FM.
The data, code, and instructions for reproducing the results are available online http://tinyurl.
com/OntoFMExperiments and act as a baseline for comparison. Based on our findings, we de-veloped an ontologic-aware synthesis environment, called WebFML, that equips important au-tomated operations for FMs with ontological capabilities. More details can be found in http:
//tinyurl.com/WebFMLDemo.Specifically, we make the following contributions:
• We develop six heuristics for clustering and ranking the syntactic/semantic relationshipsbetween feature names. We also adapt logical heuristics so that they can be applied before"breathing ontological knowledge" into FM synthesis;

7.7. CONCLUSION 97
• We develop WebFML [7], an environment that integrates all the techniques and supportspractitioners in synthesizing sound and meaningful FMs from various kinds of artefacts (e.g.propositional formula, dependency graph, FMs or PCMs). We are unaware of such an envi-ronment despite the availability of a wide range of academic or industrial feature modelingtools [43,122,131,144,148,174,187];
• The empirical evaluation shows that the hybrid approach can retrieve, in average, 37.8% ofparent-child relationships of the SPLOT FMs (44.4% for the PCM dataset) in one step andwithout any user intervention. Although the hybrid approach constitutes the state-of-the-artheuristic, the results show that a fully automated synthesis is likely to produce FMs far fromthe ground truths. We provide empirical evidence that the role of the user remains crucialand we highlight the interactive nature of the synthesis process;
• The hybrid approach ranks the correct parent among the 2 first results for 58.9% of thefeatures (for the SPLOT dataset) and 56.3% of the features (for the PCM dataset). Theclusters retrieved by the hybrid approach are correct in more than half of the time while thenumber of clusters to review remains rather low (4.1 for the SPLOT dataset, 17.6 for thePCM dataset);
• We compare our method with an existing technique [101] and logical-based heuristics. Basedon empirical results, we analyze the strengths, weaknesses and possible synergies betweenlogical and ontological-based techniques – leading to the design of a hybrid approach.


Chapter 8
Synthesis of Attributed Feature Models from
Product Descriptions
"You’ve been living in a dream world, Neo."
Morpheus
Our procedure in Chapter 7 allow to synthesis an FM from a PCM. The FM formalism that weused has a semantics based on propositional formula. It limits the applicability of our procedureto a class of PCMs encodable in this algebra. However, PCMs contain various kinds of informationthat are not Boolean (our evaluations in Part II give further details). In this chapter, we extend ourtechniques to synthesize Attributed Feature Models (AFMs). Thanks to attributes the support ofnumerical information or enumerations is made possible (see Section 8.1). We formally define theproblem of AFM synthesis from a class of PCMs that we call configuration matrix (see Section 8.2).Then, we present the first algorithm for synthesizing AFMs from a class of PCMs (see Section 8.3).Our evaluation focuses on the scalability of the algorithm based on the size and characteristics ofthe input matrix (see Section 8.4 and 8.5). Then, we discuss threats to the validity of our approach(see Section 8.6). From our evaluation and our different works in Part II, we discuss the transitionfrom PCMs to AFMs (see Section 8.7). Finally, we summarize our contributions in Section 8.8.
8.1 From PCM to AFM
Feature attributes are a useful extension, intensively employed in practice, for documenting thedifferent values across a range of products [39, 43, 60]. With the addition of attributes, optionalbehaviour can be made dependent not only on the presence or absence of features, but also onthe satisfaction of constraints over domain values of attributes [66]. Recently, languages andtools have emerged to fully support attributes in feature modeling and SPL engineering (e.g.,see [39,43,60,84,98]).
Until now, the impressive research effort has focused on synthesizing basic, Boolean featuremodels – without feature attributes (see Section 3.2, page 26 for further details). Despite theevident opportunity of encoding quantitative information as attributes, the synthesis of attributedfeature models has not yet caught attention.
In this section, we motivate the need for an automated encoding of product descriptions asAFMs. We also introduce background related to AFMs.
8.1.1 Product Comparison Matrices and Feature Models
Many modern companies provide solutions for customization and configuration of their productsto match the needs of each specific customer. From a user’s perspective, it means a large variety ofproducts to choose from. It is therefore crucial for companies not only to provide comprehensivedescriptions of their products, but also to do it in an easily navigable manner. Product descriptions
99

100 CHAPTER 8. ATTRIBUTED FEATURE MODEL SYNTHESIS
Configuration
matrix
AFM
Product Comparison Matrices,
Spreadsheets
Textual product
description
Manual elaboration
Synthesis
Reasoning
(product configuration,
extraction of information,
T-wise testing,
multi-objective, etc.)
Understanding a domain,
Communication with stakeholders
Forward engineering
(engineering a configurator,
relating an AFM to another
artefact, etc.)
Figure 8.1: Core problem: synthesis of attributed feature model from configuration matrix
IdLicense License Language Lang WYSIType Price Support uage WYG
W1 Commercial 10 Yes Java YesW2 NoLimit 20 No – YesW3 NoLimit 10 No – YesW4 GPL 0 Yes Python YesW5 GPL 0 Yes Perl YesW6 GPL 10 Yes Perl YesW7 GPL 0 Yes PHP NoW8 GPL 10 Yes PHP Yes
Figure 8.2: A configuration matrix for Wiki engines.
can be represented in many formats. The objective of such formats is to describe the characteristicsof a set of products in order to document and differentiate them.
As we have seen in Chapter 2, PCMs offer one way to achieve this objective. However, theexpressiveness of AFMs is not sufficient for representing the entire complexity of PCMs on theWeb. In particular, they cannot represent uncertainty or ambiguity that we often encounter inPCMs on the Web. Therefore, we now consider a class of PCMs that we call configuration matrix(see Definition 14).
Definition 14 (Configuration matrix). Let c1, ..., cM be a given set of configurations. Each con-figuration ci is an N -tuple (ci,1, ..., ci,N ), where each element ci,j is the value of a variable Vj. Avariable represents either a feature or an attribute. Using these configurations, we create an M×N
matrix C such that C = [c1, ..., cM ]t, and call it a configuration matrix.
Figure 8.1 summarizes our motivation for synthesizing an AFM from a configuration matrix.As shown in the upper part of Figure 8.1, the input to the synthesis algorithm is a configurationmatrix. Configuration matrices present clear semantics in line with the expressiveness of AFMs.They act as a formal, intermediate representation that can be obtained from various sources, suchas (1) PCMs, (2) spreadsheets, (3) disjunction of constraints, or (4) simply through a manualelaboration (e.g., practitioners explicitly enumerate and maintain a list of configurations [45]).
For instance, let us consider the domain of Wiki engines. The list of features supported by aset of Wiki engines can be documented using a configuration matrix. Figure 8.2 is a very simplifiedconfiguration matrix, which provides information about eight different Wiki engines.
The resulting AFM (see lower part of Figure 8.1) can as well be used to document a set ofconfigurations and open new perspectives. First, state-of-the-art reasoning techniques for AFM can

8.1. FROM PCM TO AFM 101
Commercial => LicensePrice = 10
LicensePrice = 10 => Commercial
Commercial => Java
Java => Commercial
GPL => LicensePrice <= 10
NoLimit => ¬LanguageSupport
¬LanguageSupport => NoLimit
GPL => LanguageSupport
NoLimit => LicensePrice >= 10
¬PHP => WYSIWYG
Python => LicensePrice = 0
Wiki engine
LanguageSupport LicenseType
Language: {Java, Python,
Perl, PHP}LicensePrice: {0, 10, 20}
GPL Commercial NoLimit
WYSIWYG
Φ = ¬WYSIWYG <=> PHP ∧ LicensePrice = 0
Figure 8.3: One possible attributed feature model for representing the configuration matrix inFigure 8.2
be reused [39,66,98,172]. Second, the hierarchy helps to structure the information and a potentiallylarge number of features into multiple levels of increasing detail [75]. It helps to understand adomain or communicate with other stakeholders [43, 45, 75]. Finally, an AFM is central to manyproduct line approaches and can serve as a basis for forward engineering [31] (e.g. through amapping with source code or design models).
Overall, configuration matrices and feature models are semantically related and aim to char-acterize a set of configurations. The two formalisms are complementary as they propose differentviews on the same product line. We aim to better understand the gap and switch from one rep-resentation to the other. For instance, Figure 8.3 depicts an attributed feature diagram as wellas constraints that together provide one possible representation of the configuration matrix ofFigure 8.2.
8.1.2 Attributed Feature Models
Several formalisms supporting attributes exist [39, 44, 60, 84]. In this chapter, we consider anextension of FODA-like FMs including attributes and inspired from the FAMA framework [43,44].An AFM is composed of an attributed feature diagram (see Definition 15 and Figure 8.4) and anarbitrary constraint (see Definition 16).
Definition 15 (Attributed Feature Diagram). An attributed feature diagram (AFD) is a tuple �F ,H, EM , GMTX , GXOR, GOR, A, D, δ, α, RC� such that:
• F is a finite set of boolean features.• H = (F,E) is a rooted tree of features where E ⊆ F × F is a set of directed child-parent
edges.• EM ⊆ E is a set of edges defining mandatory features.• GMTX , GXOR, GOR ⊆ P (E\Em) are sets of feature groups. The feature groups of GMTX ,GXOR and GOR are non-overlapping and each feature group is a set of edges that share thesame parent.
• A is a finite set of attributes.• D is a set of possible domains for the attributes in A.• δ ∈ A → D is a total function that assigns a domain to an attribute.• α ∈ A → F is a total function that assigns an attribute to a feature.• RC is a set of constraints over F and A that are considered as human readable and may
appear in the feature diagram in a graphical or textual representation ( e.g. binary implicationconstraints can be represented as an arrow between two features).

102 CHAPTER 8. ATTRIBUTED FEATURE MODEL SYNTHESIS
RC ::= bool_factor ‘⇒’ bool_factor
bool_factor ::= feature_name | ‘¬’ feature_name | rel_expr
rel_expr ::= attribute_name rel_op num_literalrel_op ::= ‘>’ | ‘<’ | ‘≥’ | ‘≤’ | ‘=’
Figure 8.4: The grammar of readable constraints.
A domain d ∈ D is a tuple �Vd, 0d, <d� with Vd a finite set of values, 0d ∈ Vd the null value ofthe domain and <d a partial order on Vd. When a feature is not selected, all its attributes boundby α take their null value, i.e. ∀(a, f) ∈ α with δ(a) = �Va, 0a, <a�, we have ¬f ⇒ (a = 0a).
For the set of constraints in RC, formally defining what is human readable is essential fordesigning automated techniques that can synthesize RC. In this chapter, we define RC as theconstraints that are consistent with the grammar1 in Figure 8.4 (see bottom of Figure 8.3 forexamples). We consider that these constraints are small enough and simple enough to be humanreadable. In this grammar, each constraint is a binary implication, which specifies a relationbetween the values of two attributes or features. Feature names and relational expressions overattributes are the boolean factors that can appear in an implication. Further, we only allow naturalnumbers as numerical literals (num_literal).
The grammar of Figure 8.4 and the formalism of attributed feature diagrams (see Definition 15)are not expressively complete regarding propositional logics, and therefore cannot represent any setof configurations (more details are given in Section 8.2.2). Therefore, to enable accurate represen-tation of any possible configuration matrix, an AFM is composed of an AFD and a propositionalformula:
Definition 16 (Attributed Feature Model). An attributed feature model is a pair �AFD,Φ� whereAFD is an attributed feature diagram and Φ is an arbitrary constraint over F and A that representsthe constraints that cannot be expressed by RC.
Example. Figure 8.3 shows an example of an AFM describing a product line of Wiki engines.The feature WikiMatrix is the root of the hierarchy. It is decomposed in 3 features: LicenseType whichis mandatory and WYSIWYG and LanguageSupport which are optional. The xor-group composed ofGPL, Commercial and NoLimit defines that the wiki engine has exactly 1 license and it must beselected among these 3 features. The attribute LicensePrice is attached to the feature LicenseType.The attribute’s domain states that it can take a value in the following set: {0, 10, 20}. Thereadable constraints and Φ for this AFM are listed below its hierarchy (see Figure 8.3). The firstone restricts the price of the license to 10 when the feature Commercial is selected.
Like FMs, the main objective of an AFM is to define the valid configurations of a product line.A configuration of an AFM is defined as a set of selected features and a value for every attribute.A configuration is valid if it respects the constraints defined by the AFM (e.g. the root featureof an AFM is always selected). The set of valid configurations corresponds to the configurationsemantics of the AFM (see Definition 17).
Definition 17 (Configuration semantics). The configuration semantics �m� of an AFM m is theset of valid configurations represented by m.
8.2 Synthesis Formalization
Two main challenges of synthesizing an AFM from a configuration matrix are (1) preserving theconfiguration semantics of the input matrix and (2) producing a maximal and readable diagram fora further exploitation by practitioners (see Figure 8.1). Synthesizing an AFM that represents theexact same set of configurations (i.e. configuration semantics) as the input configuration matrixis primordial; a too permissive AFM would expose the user to illegal configurations. To preventthis situation, the algorithm must be sound (see Definition 18). Conversely, if the AFM is too
1Other kinds of constraints (e.g. based on arithmetic operators) can be considered as well. They may becomputationally expensive to synthesize and require the use of constraint-based solvers.
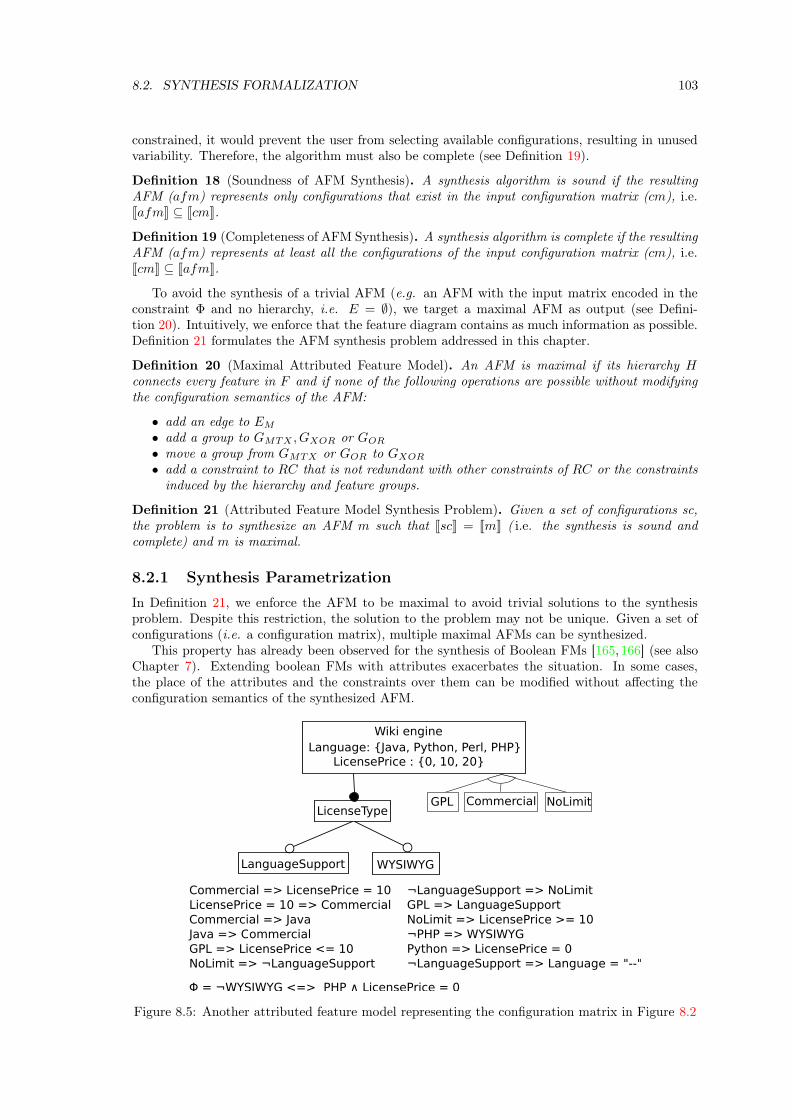
8.2. SYNTHESIS FORMALIZATION 103
constrained, it would prevent the user from selecting available configurations, resulting in unusedvariability. Therefore, the algorithm must also be complete (see Definition 19).
Definition 18 (Soundness of AFM Synthesis). A synthesis algorithm is sound if the resultingAFM (afm) represents only configurations that exist in the input configuration matrix (cm), i.e.�afm� ⊆ �cm�.
Definition 19 (Completeness of AFM Synthesis). A synthesis algorithm is complete if the resultingAFM (afm) represents at least all the configurations of the input configuration matrix (cm), i.e.�cm� ⊆ �afm�.
To avoid the synthesis of a trivial AFM (e.g. an AFM with the input matrix encoded in theconstraint Φ and no hierarchy, i.e. E = ∅), we target a maximal AFM as output (see Defini-tion 20). Intuitively, we enforce that the feature diagram contains as much information as possible.Definition 21 formulates the AFM synthesis problem addressed in this chapter.
Definition 20 (Maximal Attributed Feature Model). An AFM is maximal if its hierarchy H
connects every feature in F and if none of the following operations are possible without modifyingthe configuration semantics of the AFM:
• add an edge to EM
• add a group to GMTX , GXOR or GOR
• move a group from GMTX or GOR to GXOR
• add a constraint to RC that is not redundant with other constraints of RC or the constraintsinduced by the hierarchy and feature groups.
Definition 21 (Attributed Feature Model Synthesis Problem). Given a set of configurations sc,the problem is to synthesize an AFM m such that �sc� = �m� ( i.e. the synthesis is sound andcomplete) and m is maximal.
8.2.1 Synthesis Parametrization
In Definition 21, we enforce the AFM to be maximal to avoid trivial solutions to the synthesisproblem. Despite this restriction, the solution to the problem may not be unique. Given a set ofconfigurations (i.e. a configuration matrix), multiple maximal AFMs can be synthesized.
This property has already been observed for the synthesis of Boolean FMs [165, 166] (see alsoChapter 7). Extending boolean FMs with attributes exacerbates the situation. In some cases,the place of the attributes and the constraints over them can be modified without affecting theconfiguration semantics of the synthesized AFM.
GPL Commercial NoLimit
WYSIWYG
Wiki engine
Language: {Java, Python, Perl, PHP}
LanguageSupport
LicensePrice : {0, 10, 20}
LicenseType
Commercial => LicensePrice = 10
LicensePrice = 10 => Commercial
Commercial => Java
Java => Commercial
GPL => LicensePrice <= 10
NoLimit => ¬LanguageSupport
¬LanguageSupport => NoLimit
GPL => LanguageSupport
NoLimit => LicensePrice >= 10
¬PHP => WYSIWYG
Python => LicensePrice = 0
¬LanguageSupport => Language = "--"
Φ = ¬WYSIWYG <=> PHP ∧ LicensePrice = 0
Figure 8.5: Another attributed feature model representing the configuration matrix in Figure 8.2
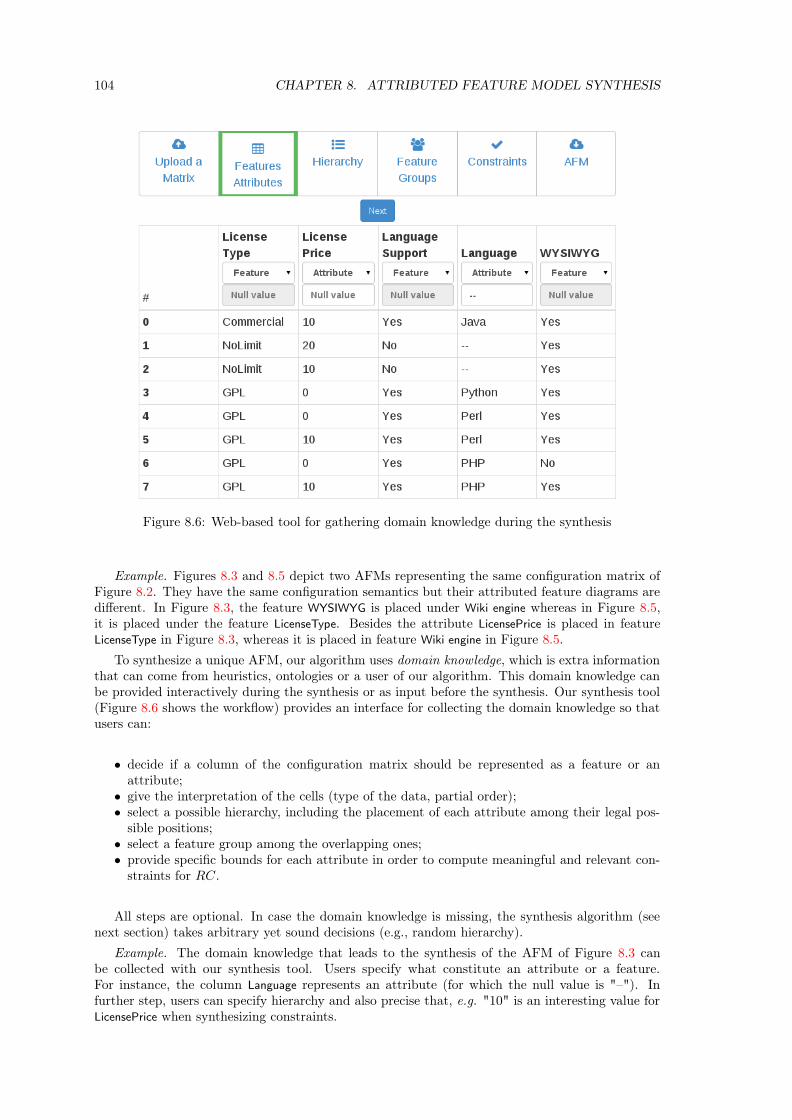
104 CHAPTER 8. ATTRIBUTED FEATURE MODEL SYNTHESIS
Figure 8.6: Web-based tool for gathering domain knowledge during the synthesis
Example. Figures 8.3 and 8.5 depict two AFMs representing the same configuration matrix ofFigure 8.2. They have the same configuration semantics but their attributed feature diagrams aredifferent. In Figure 8.3, the feature WYSIWYG is placed under Wiki engine whereas in Figure 8.5,it is placed under the feature LicenseType. Besides the attribute LicensePrice is placed in featureLicenseType in Figure 8.3, whereas it is placed in feature Wiki engine in Figure 8.5.
To synthesize a unique AFM, our algorithm uses domain knowledge, which is extra informationthat can come from heuristics, ontologies or a user of our algorithm. This domain knowledge canbe provided interactively during the synthesis or as input before the synthesis. Our synthesis tool(Figure 8.6 shows the workflow) provides an interface for collecting the domain knowledge so thatusers can:
• decide if a column of the configuration matrix should be represented as a feature or anattribute;
• give the interpretation of the cells (type of the data, partial order);• select a possible hierarchy, including the placement of each attribute among their legal pos-
sible positions;• select a feature group among the overlapping ones;• provide specific bounds for each attribute in order to compute meaningful and relevant con-
straints for RC.
All steps are optional. In case the domain knowledge is missing, the synthesis algorithm (seenext section) takes arbitrary yet sound decisions (e.g., random hierarchy).
Example. The domain knowledge that leads to the synthesis of the AFM of Figure 8.3 canbe collected with our synthesis tool. Users specify what constitute an attribute or a feature.For instance, the column Language represents an attribute (for which the null value is "–"). Infurther step, users can specify hierarchy and also precise that, e.g. "10" is an interesting value forLicensePrice when synthesizing constraints.
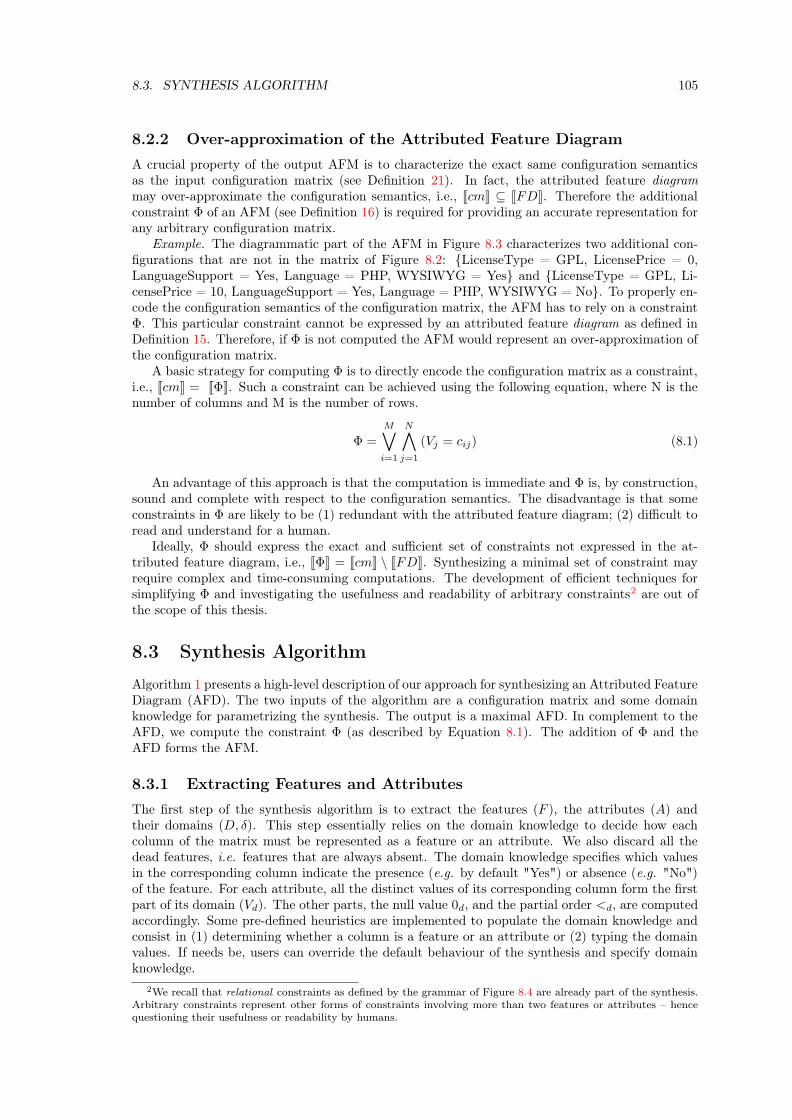
8.3. SYNTHESIS ALGORITHM 105
8.2.2 Over-approximation of the Attributed Feature Diagram
A crucial property of the output AFM is to characterize the exact same configuration semanticsas the input configuration matrix (see Definition 21). In fact, the attributed feature diagrammay over-approximate the configuration semantics, i.e., �cm� ⊆ �FD�. Therefore the additionalconstraint Φ of an AFM (see Definition 16) is required for providing an accurate representation forany arbitrary configuration matrix.
Example. The diagrammatic part of the AFM in Figure 8.3 characterizes two additional con-figurations that are not in the matrix of Figure 8.2: {LicenseType = GPL, LicensePrice = 0,LanguageSupport = Yes, Language = PHP, WYSIWYG = Yes} and {LicenseType = GPL, Li-censePrice = 10, LanguageSupport = Yes, Language = PHP, WYSIWYG = No}. To properly en-code the configuration semantics of the configuration matrix, the AFM has to rely on a constraintΦ. This particular constraint cannot be expressed by an attributed feature diagram as defined inDefinition 15. Therefore, if Φ is not computed the AFM would represent an over-approximation ofthe configuration matrix.
A basic strategy for computing Φ is to directly encode the configuration matrix as a constraint,i.e., �cm� = �Φ�. Such a constraint can be achieved using the following equation, where N is thenumber of columns and M is the number of rows.
Φ =M�
i=1
N�
j=1
(Vj = cij) (8.1)
An advantage of this approach is that the computation is immediate and Φ is, by construction,sound and complete with respect to the configuration semantics. The disadvantage is that someconstraints in Φ are likely to be (1) redundant with the attributed feature diagram; (2) difficult toread and understand for a human.
Ideally, Φ should express the exact and sufficient set of constraints not expressed in the at-tributed feature diagram, i.e., �Φ� = �cm� \ �FD�. Synthesizing a minimal set of constraint mayrequire complex and time-consuming computations. The development of efficient techniques forsimplifying Φ and investigating the usefulness and readability of arbitrary constraints2 are out ofthe scope of this thesis.
8.3 Synthesis Algorithm
Algorithm 1 presents a high-level description of our approach for synthesizing an Attributed FeatureDiagram (AFD). The two inputs of the algorithm are a configuration matrix and some domainknowledge for parametrizing the synthesis. The output is a maximal AFD. In complement to theAFD, we compute the constraint Φ (as described by Equation 8.1). The addition of Φ and theAFD forms the AFM.
8.3.1 Extracting Features and Attributes
The first step of the synthesis algorithm is to extract the features (F ), the attributes (A) andtheir domains (D, δ). This step essentially relies on the domain knowledge to decide how eachcolumn of the matrix must be represented as a feature or an attribute. We also discard all thedead features, i.e. features that are always absent. The domain knowledge specifies which valuesin the corresponding column indicate the presence (e.g. by default "Yes") or absence (e.g. "No")of the feature. For each attribute, all the distinct values of its corresponding column form the firstpart of its domain (Vd). The other parts, the null value 0d, and the partial order <d, are computedaccordingly. Some pre-defined heuristics are implemented to populate the domain knowledge andconsist in (1) determining whether a column is a feature or an attribute or (2) typing the domainvalues. If needs be, users can override the default behaviour of the synthesis and specify domainknowledge.
2We recall that relational constraints as defined by the grammar of Figure 8.4 are already part of the synthesis.Arbitrary constraints represent other forms of constraints involving more than two features or attributes – hencequestioning their usefulness or readability by humans.
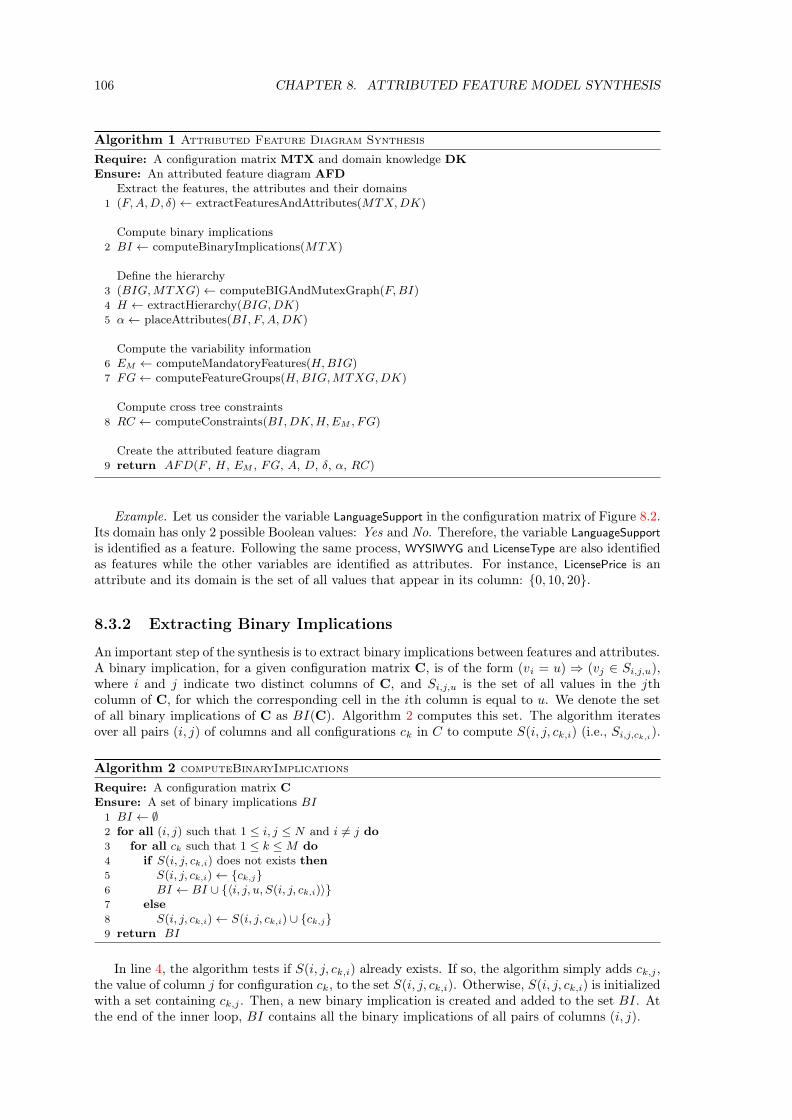
106 CHAPTER 8. ATTRIBUTED FEATURE MODEL SYNTHESIS
Algorithm 1 Attributed Feature Diagram Synthesis
Require: A configuration matrix MTX and domain knowledge DK
Ensure: An attributed feature diagram AFD
Extract the features, the attributes and their domains1 (F,A,D, δ) ← extractFeaturesAndAttributes(MTX,DK)
Compute binary implications2 BI ← computeBinaryImplications(MTX)
Define the hierarchy3 (BIG,MTXG) ← computeBIGAndMutexGraph(F,BI)4 H ← extractHierarchy(BIG,DK)5 α ← placeAttributes(BI, F,A,DK)
Compute the variability information6 EM ← computeMandatoryFeatures(H,BIG)7 FG ← computeFeatureGroups(H,BIG,MTXG,DK)
Compute cross tree constraints8 RC ← computeConstraints(BI,DK,H,EM , FG)
Create the attributed feature diagram9 return AFD(F , H, EM , FG, A, D, δ, α, RC)
Example. Let us consider the variable LanguageSupport in the configuration matrix of Figure 8.2.Its domain has only 2 possible Boolean values: Yes and No. Therefore, the variable LanguageSupport
is identified as a feature. Following the same process, WYSIWYG and LicenseType are also identifiedas features while the other variables are identified as attributes. For instance, LicensePrice is anattribute and its domain is the set of all values that appear in its column: {0, 10, 20}.
8.3.2 Extracting Binary Implications
An important step of the synthesis is to extract binary implications between features and attributes.A binary implication, for a given configuration matrix C, is of the form (vi = u) ⇒ (vj ∈ Si,j,u),where i and j indicate two distinct columns of C, and Si,j,u is the set of all values in the jthcolumn of C, for which the corresponding cell in the ith column is equal to u. We denote the setof all binary implications of C as BI(C). Algorithm 2 computes this set. The algorithm iteratesover all pairs (i, j) of columns and all configurations ck in C to compute S(i, j, ck,i) (i.e., Si,j,ck,i
).
Algorithm 2 computeBinaryImplications
Require: A configuration matrix C
Ensure: A set of binary implications BI
1 BI ← ∅2 for all (i, j) such that 1 ≤ i, j ≤ N and i �= j do3 for all ck such that 1 ≤ k ≤ M do4 if S(i, j, ck,i) does not exists then5 S(i, j, ck,i) ← {ck,j}6 BI ← BI ∪ {�i, j, u, S(i, j, ck,i)�}7 else8 S(i, j, ck,i) ← S(i, j, ck,i) ∪ {ck,j}9 return BI
In line 4, the algorithm tests if S(i, j, ck,i) already exists. If so, the algorithm simply adds ck,j ,the value of column j for configuration ck, to the set S(i, j, ck,i). Otherwise, S(i, j, ck,i) is initializedwith a set containing ck,j . Then, a new binary implication is created and added to the set BI. Atthe end of the inner loop, BI contains all the binary implications of all pairs of columns (i, j).

8.3. SYNTHESIS ALGORITHM 107
8.3.3 Defining the Hierarchy
The hierarchy H of an AFD is a rooted tree of features such that ∀(f1, f2) ∈ E, f1 ⇒ f2, i.e. eachfeature implies its parent. As a result, the candidate hierarchies, whose parent-child relationshipsviolate this property, can be eliminated upfront. To guide the selection of a legal hierarchy for theAFD, we rely on the Binary Implication Graph (BIG) of a configuration matrix:
Definition 22 (Binary Implication Graph (BIG)). A binary implication graph of a configurationmatrix C is a directed graph (VBIG, EBIG) where VBIG = F and EBIG = {(fi, fj) | (fi ⇒ fj) ∈BI(C)}.
The BIG aims to represent all the binary implications, thus representing every possible parent-child relationships in a legal hierarchy. We compute the BIG as follows: for each constraint in BI
(see Algorithm 2) involving two features we add an edge in the BIG. Hierarchy H of the AFD isa rooted tree inside the BIG. In general, it is possible to find many such trees. As part of the tool(see Figure 8.6), users can specify domain knowledge to select a tree. The BIG is exploited tointeractively assist users in the selection of the AFD’s hierarchy. In case the domain knowledge isincomplete, a branching of the graph (the counterpart of a spanning tree for undirected graphs) israndomly computed [3].
After choosing the hierarchy of features, we focus on the placement of attributes. An attributea can be placed in a feature f if ¬f ⇒ (a = 0a). As a result, the candidate features verifying thisproperty are considered as legal positions for the attribute. We promote, according to the domainknowledge, one of the legal positions of each attribute.
Example. In Figure 8.2, the attribute Language has a domain d with “–" as its null value,i.e. 0d = “–". This null value restricts the place of the attribute. The property ¬f ⇒ (a = 0a)of Definition 15 holds for the attribute Language and the feature LanguageSupport. However, theconfiguration W7 forbids the attribute to be placed in feature WYSIWYG. The value of Language isnot equal to its null value when WYSIWYG is not selected.
8.3.4 Computing the Variability Information
As the hierarchy of an AFD is made of features only, attributes do not impact the computationof the variability information (optional/mandatory features and feature groups). Therefore, wecan rely on algorithms that have been developed for Boolean FMs [3, 165, 166] such as the one inChapter 7.
First, for the computation of mandatory features, we rely on the BIG as it represents everypossible implication between two features. For each edge (c, p) in the hierarchy, we check that theinverted edge (p, c) exists in the BIG. In that case, we add this edge to EM .
For feature groups, we reuse algorithms from the synthesis of Boolean FMs [3, 165, 166]. Forthe sake of self-containedness, we briefly describe the computation of each type of group.
For mutex-groups (GMTX), we compute a so-called mutex graph that contains an edge whenevertwo features are mutually exclusive. The maximum cliques of this mutex graph are the mutex-groups [165,166].
For or-groups (GOR), we translate the input matrix to a binary integer programming prob-lem [166]. Finding all solutions to this problem results in the list of or-groups.
For xor-groups (GXOR), we consider mutex-groups since a xor-group is a mutex-group with anadditional constraint stating that at least one feature of the group should be selected. We check,for each mutex-group, that its parent implies the disjunction of the features of the group. For that,we iterate over the binary implications (BI) until we find that the property is inconsistent. Toensure the maximality of the resulting AFM, we discard any or-group or mutex-group that is alsoan xor-group.
Finally, the features that are not involved in a mandatory relation or a feature group areconsidered optional.
8.3.5 Computing Cross Tree Constraints
The final step of the AFD synthesis algorithm is to compute cross tree constraints (RC). Wegenerate three kinds of constraints: requires, excludes and relational constraints.

108 CHAPTER 8. ATTRIBUTED FEATURE MODEL SYNTHESIS
A requires constraint represents an implication between two features. All the implicationscontained in the BIG (i.e. edges) that are not represented in the hierarchy or mandatory features,are promoted as requires constraints (e.g. the implication Commercial ⇒ Java in Figure 8.3).
Excludes constraints represent the mutual exclusion of two features. Such constraints arecontained in the mutex graph. As the previously computed mutex-groups may not represent allthe edges of the mutex graph, we promote the remaining edges of the mutex graph as excludesconstraints. For example, the features NoLimit and LanguageSupport, in Figure 8.3, are mutuallyexclusive. This relation is included in RC as an excludes constraint: NoLimit ⇒ ¬LanguageSupport.
Finally, relational constraints are all the constraints following the grammar described in Fig-ure 8.4 and involving at least one attribute. Admittedly there is a huge number of possible con-straints that respect the grammar of RC. Our algorithm relies on some domain knowledge (seeFigure 8.6) to restrict the domain values of attributes considered for the computation of RC. For-mally, the knowledge provides the information required for merging binary implications as (ai, k)pairs, where ai is an attribute, and k belongs to Di. In case the knowledge is incomplete (e.g.,users do not specify a bound for an attribute), we randomly choose a value among the domain ofan attribute.
Then the algorithm proceeds as follows. First, we transform each constraint referring to onefeature and one attribute to a constraint that respects the grammar of RC. Then, we focuson constraints in BI that involve two attributes and we merge them according to the domainknowledge. Using the pairs (ai, k) of the domain knowledge, we partition the set of all binaryimplications with ai = u on the left hand side of the implication into three categories: those withu < k, those with u = k, and those with u > k. Let bj,1, ..., bj,p be all such binary implications,belonging to the same category, and involving aj (i.e., each bj,r is of the form (ai = ur ⇒ aj ∈ Sr)).We merge these binary implications into a single one: (ai ∈ {u1, ..., up} ⇒ aj ∈ S1 ∪ ... ∪ Sp)whenever the conformance of the grammar of RC holds.
Example. From the configuration matrix of Figure 8.2, we can extract the following binaryimplication: GPL ⇒ LicensePrice ∈ {0, 10}. We also note that the domain of LicensePrice is {0, 10, 20}.Therefore, the right side of the binary implication can be rewriten as LicensePrice <= 10. As thisconstraint can be expressed by the grammar of RC, we add GPL ⇒ LicensePrice <= 10 to RC (seeFigure 8.3).
8.4 Evaluation on Random Matrices
We developed a tool3 that implements Algorithm 1. The tool is mainly implemented in Scala pro-gramming language. Algorihtm 2 is written in pure Scala and relies on appropriate data structures(e.g. HashMap and HashSet) for efficient computation of implications. For the computation ofor-groups, we rely on the SAT4J solver4.
To provide an insight into the scalability of our procedure, we experimentally evaluate theruntime complexity of our AFD synthesis procedure. For this purpose, we have developed arandom matrix generator, which takes as input three parameters:
• number of variables (features and attributes)
• number of configurations
• maximum domain size (i.e. maximum number of distinct values in a column)
The type of each variable (feature or attribute) is randomly selected according to a uniformdistribution. An important property is that our generator does not ensure that the number ofconfigurations and the maximum domain size are reached at the end of the generation. Anyduplicated configuration or missing value of a domain is not corrected. Therefore, the parametersentered for our experiments may not reflect the real properties of the generated matrices. To avoidany misinterpretation or bias, we present the concrete numbers in the following results.
3The complete source code can be found in https://github.com/gbecan/FOReverSE-AFMSynthesis4http://www.sat4j.org

8.4. EVALUATION ON RANDOM MATRICES 109
Tim
e (
min
)
Number of variables
1
5
10
15
20
25
30
5
10
15
20
25
30
35
40
50
60
70
Tim
e (
min
)
Number of variables
1
5
10
15
20
25
30
5
10
15
20
25
30
35
40
50
60
70
Figure 8.7: Scalability of or-groups computation w.r.t the number of variables
Square
root
of
tim
e (
s(1
/2) )
Number of variables
01
02
03
04
0
5
10
0
20
0
50
0
10
00
20
00
Figure 8.8: Scalability w.r.t the number of variables
Moreover, to reduce fluctuations caused by the random generator, we perform the experimentsat least 100 times for each triplet of parameters. In order to get the results in a reasonable time,we used a cluster of computers. Each node in the cluster is composed of two Intel Xeon X5570 at2.93 Ghz with 24GB of RAM.
8.4.1 Initial Experiments with Or-groups
We first perform some initial experiments on random matrices. We quickly notice that computationof the or-groups posed a scalability problem. It is not surprising since this part of the synthesisalgorithm is NP-hard, leading to some timeouts even for Boolean FMs (e.g., see [166]).
Specifically, we measured the time needed to compute the or-groups from a matrix with 1000configurations, a maximum domain size of 10 and a number of variables ranging from 5 to 70. Tokeep a reasonable time for the execution of the experiment, we set a timeout at 30 minutes. Resultsare presented in Figure 8.7. The red dots indicate average values in each case. The results confirmthat the computation of or-groups quickly becomes time consuming. The 30 minutes timeout isreached with matrices containing only 30 variables. With at least 60 variables, the timeout issystematically reached. Therefore, we deactivated the computation of or-groups in the followingexperiments.
8.4.2 Scalability with respect to the number of variables
To evaluate the scalability with respect to the number of variables, we perform the synthesis ofrandom matrices with 1000 configurations, a maximum domain size of 10 and a number of variables
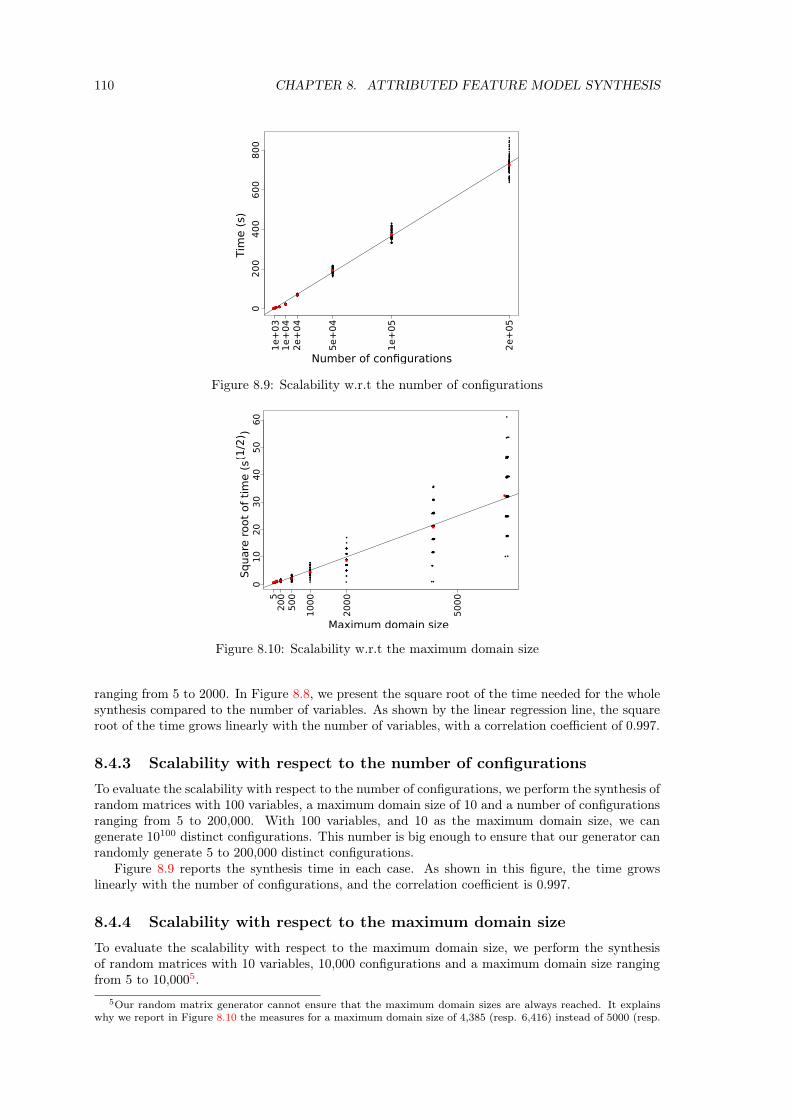
110 CHAPTER 8. ATTRIBUTED FEATURE MODEL SYNTHESIS
800
600
400
200
0
Tim
e (
s)
Number of configurations
1e+
03
1e+
04
2e+
04
5e+
04
1e+
05
2e+
05
Figure 8.9: Scalability w.r.t the number of configurations
Square
root
of
tim
e (
s(1
/2) )
Maximum domain size
01
02
03
04
05
06
0
52
00
50
0
10
00
20
00
50
00
Figure 8.10: Scalability w.r.t the maximum domain size
ranging from 5 to 2000. In Figure 8.8, we present the square root of the time needed for the wholesynthesis compared to the number of variables. As shown by the linear regression line, the squareroot of the time grows linearly with the number of variables, with a correlation coefficient of 0.997.
8.4.3 Scalability with respect to the number of configurations
To evaluate the scalability with respect to the number of configurations, we perform the synthesis ofrandom matrices with 100 variables, a maximum domain size of 10 and a number of configurationsranging from 5 to 200,000. With 100 variables, and 10 as the maximum domain size, we cangenerate 10100 distinct configurations. This number is big enough to ensure that our generator canrandomly generate 5 to 200,000 distinct configurations.
Figure 8.9 reports the synthesis time in each case. As shown in this figure, the time growslinearly with the number of configurations, and the correlation coefficient is 0.997.
8.4.4 Scalability with respect to the maximum domain size
To evaluate the scalability with respect to the maximum domain size, we perform the synthesisof random matrices with 10 variables, 10,000 configurations and a maximum domain size rangingfrom 5 to 10,0005.
5Our random matrix generator cannot ensure that the maximum domain sizes are always reached. It explainswhy we report in Figure 8.10 the measures for a maximum domain size of 4,385 (resp. 6,416) instead of 5000 (resp.
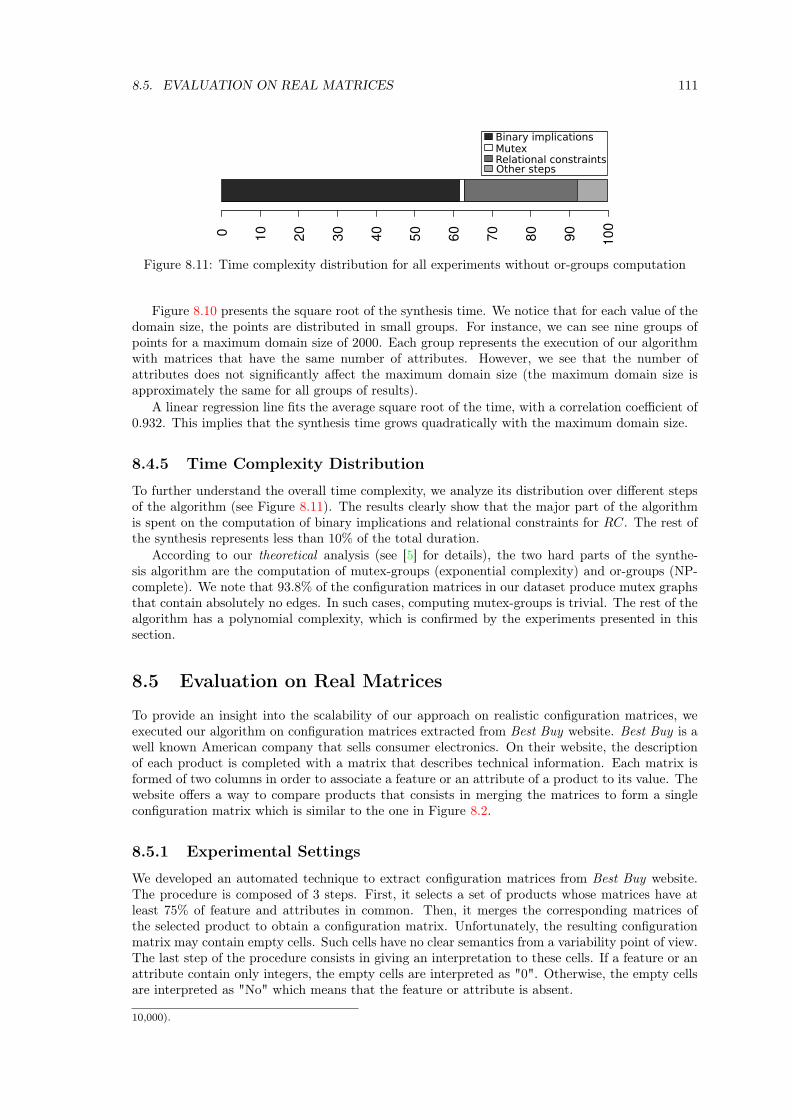
8.5. EVALUATION ON REAL MATRICES 111
0
10
20
30
40
50
60
70
80
90
10
0
Binary implicationsMutexRelational constraintsOther steps
Figure 8.11: Time complexity distribution for all experiments without or-groups computation
Figure 8.10 presents the square root of the synthesis time. We notice that for each value of thedomain size, the points are distributed in small groups. For instance, we can see nine groups ofpoints for a maximum domain size of 2000. Each group represents the execution of our algorithmwith matrices that have the same number of attributes. However, we see that the number ofattributes does not significantly affect the maximum domain size (the maximum domain size isapproximately the same for all groups of results).
A linear regression line fits the average square root of the time, with a correlation coefficient of0.932. This implies that the synthesis time grows quadratically with the maximum domain size.
8.4.5 Time Complexity Distribution
To further understand the overall time complexity, we analyze its distribution over different stepsof the algorithm (see Figure 8.11). The results clearly show that the major part of the algorithmis spent on the computation of binary implications and relational constraints for RC. The rest ofthe synthesis represents less than 10% of the total duration.
According to our theoretical analysis (see [5] for details), the two hard parts of the synthe-sis algorithm are the computation of mutex-groups (exponential complexity) and or-groups (NP-complete). We note that 93.8% of the configuration matrices in our dataset produce mutex graphsthat contain absolutely no edges. In such cases, computing mutex-groups is trivial. The rest of thealgorithm has a polynomial complexity, which is confirmed by the experiments presented in thissection.
8.5 Evaluation on Real Matrices
To provide an insight into the scalability of our approach on realistic configuration matrices, weexecuted our algorithm on configuration matrices extracted from Best Buy website. Best Buy is awell known American company that sells consumer electronics. On their website, the descriptionof each product is completed with a matrix that describes technical information. Each matrix isformed of two columns in order to associate a feature or an attribute of a product to its value. Thewebsite offers a way to compare products that consists in merging the matrices to form a singleconfiguration matrix which is similar to the one in Figure 8.2.
8.5.1 Experimental Settings
We developed an automated technique to extract configuration matrices from Best Buy website.The procedure is composed of 3 steps. First, it selects a set of products whose matrices have atleast 75% of feature and attributes in common. Then, it merges the corresponding matrices ofthe selected product to obtain a configuration matrix. Unfortunately, the resulting configurationmatrix may contain empty cells. Such cells have no clear semantics from a variability point of view.The last step of the procedure consists in giving an interpretation to these cells. If a feature or anattribute contain only integers, the empty cells are interpreted as "0". Otherwise, the empty cellsare interpreted as "No" which means that the feature or attribute is absent.
10,000).
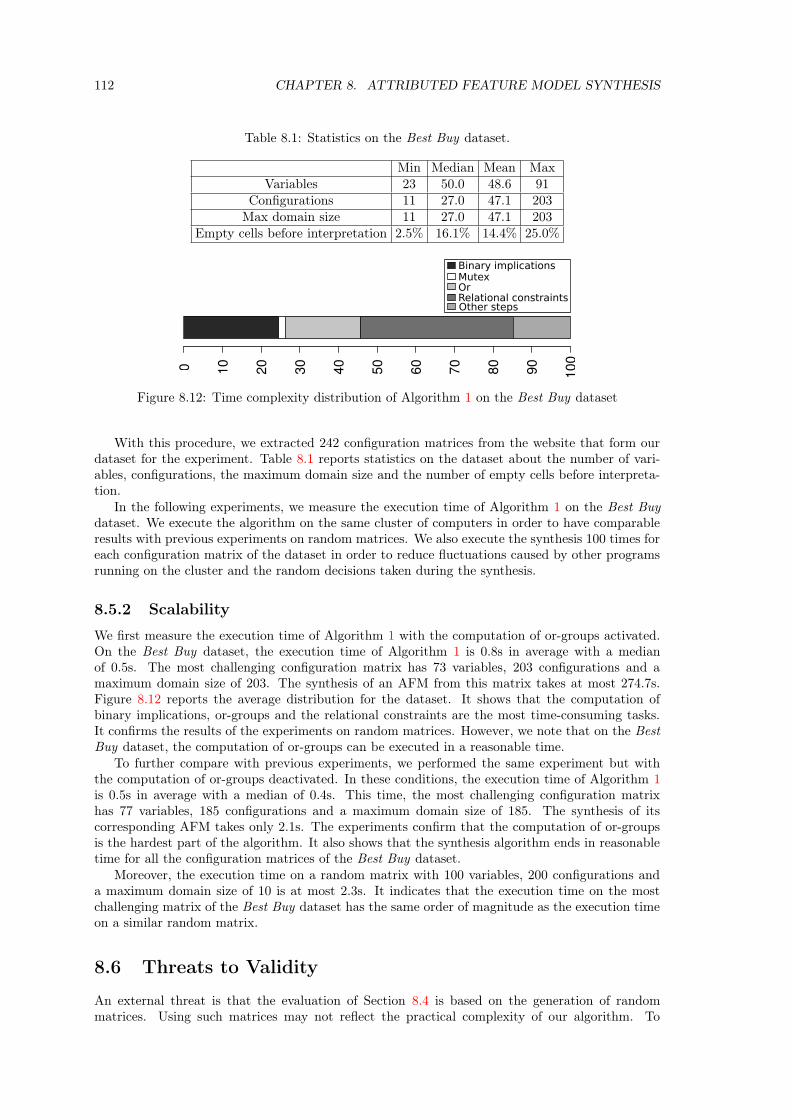
112 CHAPTER 8. ATTRIBUTED FEATURE MODEL SYNTHESIS
Table 8.1: Statistics on the Best Buy dataset.
Min Median Mean MaxVariables 23 50.0 48.6 91
Configurations 11 27.0 47.1 203Max domain size 11 27.0 47.1 203
Empty cells before interpretation 2.5% 16.1% 14.4% 25.0%
0 10
20
30
40
50
60
70
80
90
100
Binary implicationsMutex
Relational constraintsOther steps
Or
Figure 8.12: Time complexity distribution of Algorithm 1 on the Best Buy dataset
With this procedure, we extracted 242 configuration matrices from the website that form ourdataset for the experiment. Table 8.1 reports statistics on the dataset about the number of vari-ables, configurations, the maximum domain size and the number of empty cells before interpreta-tion.
In the following experiments, we measure the execution time of Algorithm 1 on the Best Buydataset. We execute the algorithm on the same cluster of computers in order to have comparableresults with previous experiments on random matrices. We also execute the synthesis 100 times foreach configuration matrix of the dataset in order to reduce fluctuations caused by other programsrunning on the cluster and the random decisions taken during the synthesis.
8.5.2 Scalability
We first measure the execution time of Algorithm 1 with the computation of or-groups activated.On the Best Buy dataset, the execution time of Algorithm 1 is 0.8s in average with a medianof 0.5s. The most challenging configuration matrix has 73 variables, 203 configurations and amaximum domain size of 203. The synthesis of an AFM from this matrix takes at most 274.7s.Figure 8.12 reports the average distribution for the dataset. It shows that the computation ofbinary implications, or-groups and the relational constraints are the most time-consuming tasks.It confirms the results of the experiments on random matrices. However, we note that on the BestBuy dataset, the computation of or-groups can be executed in a reasonable time.
To further compare with previous experiments, we performed the same experiment but withthe computation of or-groups deactivated. In these conditions, the execution time of Algorithm 1is 0.5s in average with a median of 0.4s. This time, the most challenging configuration matrixhas 77 variables, 185 configurations and a maximum domain size of 185. The synthesis of itscorresponding AFM takes only 2.1s. The experiments confirm that the computation of or-groupsis the hardest part of the algorithm. It also shows that the synthesis algorithm ends in reasonabletime for all the configuration matrices of the Best Buy dataset.
Moreover, the execution time on a random matrix with 100 variables, 200 configurations anda maximum domain size of 10 is at most 2.3s. It indicates that the execution time on the mostchallenging matrix of the Best Buy dataset has the same order of magnitude as the execution timeon a similar random matrix.
8.6 Threats to Validity
An external threat is that the evaluation of Section 8.4 is based on the generation of randommatrices. Using such matrices may not reflect the practical complexity of our algorithm. To

8.7. DISCUSSION 113
PCM
CM
AFD
AFM
H
AFM
syn
thesis
User effortComputational complexity
remove ambiguity and uncertaintyguide user
quadratic choose parent-child relations
potentially exponential for
mutex and or-groups
choose interesting feature groups
and constraints
polynomial for other steps
linear for a trivial algorithm exploit a large constraint
exploit a potentially large number
of generating constraints
Figure 8.13: Main steps for going from a PCM to an AFM
mitigate this threat we complement the evaluation with a realistic data set (Best Buy).Evaluating the scalability on a cluster of computers instead of a single one may impact the
scalability results and is an internal threat to validity. We use a cluster composed of identicalnodes to limit this threat. Even if the nodes do not represent standard computers, the practicalcomplexity of the algorithm is not influenced by this gain of processing power. Moreover, all thenecessary data for the experiments are present in the local disks of the nodes thus avoiding anynetwork related issue. Finally, we performed 100 runs for each set of parameters in order to reduceany variation of performance. Another threat to internal validity is related to our interpretationof cell values in realistic matrices of Section 8.5. Another semantics for empty cells may havean influence on the results. Our initial experiments (not reported in this thesis) did not revealsignificant changes.
To check the correctness of the implementation, we have manually reviewed some resultingAFMs. We also tested the algorithm against a set of manually designed configuration matrices.Each matrix represents a minimal example of a construct of an AFM (e.g. one of the matricesrepresents an AFM composed of a single xor-group). The test suite covers all the concepts in anAFM. None of these experiments revealed any anomalies in our implementation.
8.7 Discussion
The transition from a PCM to an AFM is a complex task that can be decomposed in 4 main steps.Each step is a transition from one formalism to the other.
The first step is to go from a PCM to a configuration matrix. PCMs may contain ambiguity,uncertainty or types of data that we cannot model with AFMs. Before applying our AFM syn-thesis techniques, we must refine or remove all this information. By transitioning from PCM toconfiguration matrix, we gain clear semantics. OpenCompare and the different services that wepresented in Part II can help in performing this task. However, it typically requires importanteffort from the user.
The second step is to extract a hierarchy of features from the configuration matrix. It allowsto switch from a product-based view to a feature-based view. This allows to have a very broadrepresentation of the product line and its organization. For example, it can be used to guide thegeneration of a configurator. In this context, the hierarchy gives the organization of the questions

114 CHAPTER 8. ATTRIBUTED FEATURE MODEL SYNTHESIS
inferred from the features. As we showed in Chapter 7, a fully automated synthesis is unlikely. Theheuristics that we developed can help in choosing parent-child relations. However, user knowledgeis often required to obtain a high quality hierarchy.
The third step is to add variability information to the hierarchy of the AFM in order to obtainan attributed feature diagram. Basically, we add mandatory or optional features, feature groupsand basic cross-tree constraints to the hierarchy. The resulting feature diagram still represents anoverapproximation of the product line but it represents a more precise overview than the hierachyalone. Let continue with our example of the generation of a configurator. Having an attributedfeature diagram allows to infer how to represent the possible answers of each question. For instance,we can generate radio buttons for a xor-group and check boxes for an or-group. It also allows topropagate some constraints (e.g. a require constraint) while the user perform its selection. Theseoperations are not possible with the hierachy alone.
As we have seen with or-groups, computing all these information can be costly. In addition,the number of generated constraints can be important. As part of our experiments, we report thatthe number of constraints synthesized for the random dataset is 237 in average with a maximumof 8906. The Best Buy dataset exhibits 6281 constraints in average with a maximum of 28300. Wecan assume there are more constraints since the number of configurations is lower. Again someuser effort can be required to select the feature groups and constraints that are relevant for theintended application of the model.
The fourth and final step is to add an additional formula Φ to the attributed feature diagram.The formula can be directly extracted from the configuration matrix with Equation 8.1. This leadsto a formula that has the size of the input matrix and contain redundant information with respectto the feature diagram. The formula is unlikely to be exploitable by a human. Yet, it bringssoundness to the synthesis procedure. This is particularly useful for reasoning on the productline. If we push further our example of the configurator, having an AFM ensures that the usercan explore the entire product space. His or her selection will lead to an existing product of theproduct line modeled by the AFM. To make the constraint readable or at least reduce its size,numerous strategies can be considered. For example, we can use minimisation [181], prioritization,or let users control the constraint they want.
Overall, we notice that each step requires potentially high computational or user effort (seeFigure 8.13 for a summary). In extreme cases, the cost of synthesizing an AFM or exploiting itbecomes greater than the cost of directly using a PCM or a configuration matrix. Therefore, thetransition to another formalism must be strongly motivated by the objective of the user. If foryour application a hierarchy of features is enough, then it is not necessary to risk a combinatorialexplosion by synthesizing a complete AFM. In another example, if your product line is highlyconstrained, it may be easier to use exploit a configuration matrix instead of an attributed fea-ture diagram with numerous constraints. It is important to evaluate the benefits of a formalismcompared to the price of its synthesis and its exploitation.
8.8 Conclusion
Developing techniques for synthesizing attributed feature models requires to cope with extra com-plexity. A synthesis algorithm must decide what becomes a feature, what becomes an attribute andidentify the domain of each attribute. Compared to features, the domain of an attribute may con-tain more than two values. Moreover, the placement of the attributes further increases the numberof possible hierarchies in a feature model. Finally, cross-tree constraints over attributes are nowpossible; this level of expressiveness (beyond Boolean logic) challenges synthesis techniques.
In this chapter, we developed the theoretical foundations and algorithms for synthesizing at-tributed feature models given a configuration matrix. Configuration matrices document a set ofproducts along different Boolean and numerical values. They form a class of PCMs that are coveredby the semantics of AFMs. We presented parametrizable, tool-supported techniques for comput-ing hierarchies, feature groups, placements of feature attributes, domain values, and constraints.We described algorithms for comprehensively computing logical relations between features and at-tributes. Our synthesis algorithm is capable of taking knowledge (e.g., about the hierarchy andplacement of attributes) into account so that users can specify, if needs be, a hierarchy or some
8.8. CONCLUSION 115
placements of attributes. Our work both strengthens the understanding of the formalism andprovides a tool-supported solution.
Furthermore, we evaluated the practical scalability of our synthesis procedure with regardsto the number of configurations, features, attributes, and domain values by using randomizedconfiguration matrices and real-world examples. Our results show that our approach can synthesizematrices containing up to 2,000 attributed features, and 20,000 distinct configurations in less thana couple of minutes.
Finally, we detailed the different steps to synthesize an AFM from a PCM. We highlighted thesyntactic and semantic gap between PCMs and AFMs and its impact on the computational anduser effort of the synthesis. We also show that the use of intermediate representation (e.g. thehierarchy of the AFM or the attributed feature diagram) can be sufficient for some applicationswhile requiring less effort to synthesize. We conclude that the synthesis of AFMs from PCMs mustbe strongly motivated by the benefits of exploiting such formalism for a given application.
The key contributions of the chapter can be summarized as follows:
• We described formal properties of AFMs (over-approximation, equivalence) and establishedsemantic correspondences with the formalism of configuration matrices (Section 8.2);
• We designed and implemented a tool-supported, parameterizable synthesis algorithm (Sec-tion 8.3);
• We empirically evaluated the scalability of the synthesis algorithm on random (Section 8.4)and real-world matrices (Section 8.5).
• We highlighted the syntactic and semantic gap between PCMs and AFMs. We also showedthe potential computational and user effort required to synthesize an AFM from a PCM.


Part IV
Conclusion and Perspectives
117

Chapter 9
Conclusion
"Everything that has a beginning has an end."
The Oracle
The Web forms a large and growing source of unstructured data [55]. This data comes in variousformats and is created by numerous contributors. The amount of data and its diversity challengesthe development of software that can process this information. Product Comparison Matrices(PCMs) are an example of this phenomenon. They are simple and convenient ways to document aproduct line. This simplicity hides a large diversity of information, formats and practices. The lackof a standard format or guidelines worsens the situation. PCMs may also contain ambiguous oruncertain information. Overall, it makes the creation and exploitation of PCMs difficult, whetherit is realized by humans or machines. To overcome the situation, there is a need for a precisemodel or formalism for PCMs. Therefore, in this thesis we address the following question: how toformalize product comparison matrices?
In this context, we explored two approaches that aim at defining a formalism for PCMs andautomatically transform raw PCMs into this formalism. The first one is a model-based approachthat is composed of a metamodel and a transformation from raw PCMs to PCM models confor-mant to the metamodel. The second one is the synthesis of Feature Models (FMs) from PCMs.To evaluate our approaches we often relied on the case study of Wikipedia. With more than 5millions articles, the encyclopedia contains numerous and diverse PCMs that are challenging forour techniques. We now discuss how our approaches contribute to the formalization of PCMs.
9.1 Formalizing PCMs Via Metamodeling
As we noted in Chapter 2, PCMs can be considered as a special case of tables or spreadsheets.Despite the significant amount of work for the formalization and automated processing of thesetwo kinds of artifacts, no formalism for PCMs has been proposed. Our first contribution is thusto propose a model-based approach for the formalization of PCMs (see Part II). This approach ismainly composed of a metamodel describing the domain of PCMs and a transformation from rawPCMs to PCM models conformant to the metamodel.
Designing a model-based approach for PCMs is a challenging task. There is no identifiedexpert, standard or oracle that can help us to elaborate the metamodel and the transformation.In addition, the tremendous number of PCMs on the Web hinders a comprehensive exploration ofexisting PCMs or the manual construction of an oracle. This challenges the selection of a smalland representative dataset of PCMs on which we can base the design of our metamodel. Moreover,we cannot rely on an oracle to test our transformation on numerous PCMs. Finally, it challengesthe elaboration of a metamodel that can support the development of services dedicated to PCMs.
To address these challenges, we proposed an iterative process. It relies on the automated trans-formation of a large dataset of PCMs into PCM models. The metamodel and the generated modelsare evaluated according to three kinds of experiments. First, we perform automated analyses based
119

120 CHAPTER 9. CONCLUSION
on statistics and metamorphic tests to respectively measure the use of the concepts in our meta-model and assess the precision of our transformation. Second, we ask users to check the precisionand relevance of our formalization on a small set of PCMs. Finally, we implement numerous ser-vices on top of our metamodel. The feedback from the developers provides insights on the usabilityand learnability of our metamodel. Based on this evaluation, we refine our metamodel and trans-formation. We iterate by applying the new transformation on the dataset of PCMs in order toobtain new PCM models. Our iterative process is thus driven by data, end-users and services.
Following our process, we designed a model-based approach for the formalization of PCMs.The central element of this approach is a domain metamodel which describes the structure andsemantics of a PCM. The structure is mainly composed of products and features which reflectsthe underlying domain of product lines. By doing so, we abstract away the implementation andgraphical details (e.g. rows and columns) of common formats for describing PCMs such as HTML,CSV or wikitext. For the semantics, the metamodel provides built-in variability patterns that wecan observe in cells of PCMs. For instance, it contains concepts of Boolean, numerical, multiple andconditional information. It can also model information that is not available or partially provided.
On top of this metamodel, we defined a set of generic and automated transformations forgoing from a raw PCM to a PCM model conformant to the domain metamodel. As part of thistransformation chain, we developed a set of rules that interpret the content of cells and encodethem in the variability patterns of the domain metamodel. Based on this information, we developedgeneric algorithms for detecting the orientation of a PCM and extract its logical structure (featuresand products). A first evaluation on 75 PCMs from Wikipedia shows that we are able to retrieve thesemantics of a cell in 93.11% of the cases. We performed a second evaluation on the comprehensivedataset of the English version of Wikipedia. The results indicate that our import and exportcapabilities are able to automatically process 91% of the 1,501,406 PCMs that we extracted fromthe dataset.
We completed the domain metamodel with a set of specialized metamodels for the manipulation,edition and import/export of PCM models. The rationale is to separate each concern of thelifecycle of a PCM into a dedicated metamodel. With the cooperation of researchers, engineersand students, we implemented several services for PCMs. For instance, we provide an editor,a comparator, a configurator and statistical visualizations. We also support CSV, HTML andwikitext files in our importing and exporting procedures. The feedback we gathered during thesenumerous developments were encouraging regarding the relevance and quality of our approach. Inparticular, we improve the comprehension and usability of our first attempt described in Chapter 5.
The majority of the metamodels and services that we developed during this thesis are integratedinto an initiative called OpenCompare. The facade of this project is the website opencompare.org.With this initiative we aim to create a community of PCM contributors and users, and supporttheir activity by providing innovative services for PCMs.
With our iterative process, we were able to design a metamodel that is relevant to the domainof PCMs. It provides the necessary concepts for defining the logical structure and semantics ofPCMs. Moreover, our generic transformations can accurately transform a large diversity of PCMsinto PCM models. Finally, a set of task-specific metamodels support and ease the developmentof various services dedicated to PCMs. Overall, our model-based approach provides a generic andprecise formalization of PCMs.
9.2 Formalizing PCMs Via the Synthesis of Feature Models
A PCM is a simple way to describe a product line. Several formalisms have been proposed to modela product line. The defacto standard is called feature modeling. However, the manual elaborationof an FM can be time-consuming and error-prone. Numerous techniques have been proposed tosynthesize FMs from various kinds of artifacts. Our analysis of the state of the art of Chapter 3reveals two main limitations in existing synthesis techniques. The first one is the lack of techniquesthat respect both configuration and ontological semantics of the input product line. This hindersthe exploitation of FMs. The second limitation is that all the synthesis techniques targets BooleanFMs. This ignores the different extensions to feature modeling. In particular, we are interestedin Attributed FMs (AFMs) which can model more than Boolean information. This reflects the

9.3. HOW TO FORMALIZE PRODUCT COMPARISON MATRICES? 121
Boolean
Configuration
Matrix
Configuration Matrix
Product Comparison Matrix PCM Model
Feature Model
Attributed
Feature Model
Services
Edit
Compare
Configure
Import
Export
Share
Analyze
Visualize
Table
Spreadsheet
Figure 9.1: Contributions
diversity of information contained in PCMs. Despite the availability of languages and tools forAFMs, there exists no synthesis algorithm for such formalism.
In Part III, we address the two limitations of the state of the art by proposing the first algorithmfor synthesizing AFMs. Our algorithm takes as input configuration matrices that can containmore than Boolean information such as numerical values or enumerations. We formally define theproblem of AFM synthesis and evaluate the theoretical and practical complexity of our algorithm.We also highlight that an AFM presents extra complexity compared to a Boolean FM. Yet, ourevaluation on both random and realistic configuration matrices shows that our algorithm scales upto matrices containing 2,000 attributed features, and 200,000 distinct configurations in a couple ofminutes.
Our procedure is sound and complete and produces AFMs that presents a meaningful hierar-chy. We develop six heuristics based on syntactical similarity, semantical similarity and generalontologies (WordNet and Wikipedia). These heuristics help a user in choosing the best parent-childrelations in the hierarchy of the FM. If needs be, a branching algorithm can automatically computean FM based on these heuristics.
Our evaluation on 126 FMs from the SPLOT repository and 30 FMs extracted from Wikipediashows that a hybrid heuristic, exploiting logical and ontological information, performs the best.In average, a hybrid heuristic can retrieve 37.8% of parent-child relationships of the SPLOT FMs(44.4% for the PCM dataset) in one step and without any user intervention. However, we notethat more than half of the parent-child relations are incorrect. This shows that a fully automatedsynthesis produces FMs far from the ground truth. User support is thus needed. Thanks toour heuristics, the user has to review only two parent candidates in more than half of the cases.In addition, logical constructs such as feature groups and cliques of features provide interestinginformation for further guiding the user in selecting the hierarchy of an FM.
Overall, our FM synthesis techniques allow a precise formalization of a class of PCMs (con-figuration matrices). Similarly to OpenCompare, having an FM that represents a PCM eases itsexploitation. In particular, the exploitation can be based on the formally defined semantics ofFMs. Moreover, this enable the use of existing services that rely on feature modeling such asmodel checking [172], automating product configuration [98], computing relevant information [43],communicating with stakeholders [45] or deriving software-intensive products [31].
Incidentally, our techniques also support other kinds of artifacts as input (e.g. source code,propositional formulas or textual requirements). As FM synthesis is a key operation in FM man-agement, we contribute not only to our main research question but also to several operations usedin product line engineering.
122 CHAPTER 9. CONCLUSION
9.3 How to Formalize Product Comparison Matrices?
Figure 9.1 presents a summary of our contributions. Our first solution (see top of Figure 9.1)is a model-based approach that provides accurate and generic methods for formalizing PCMs.The domain metamodel precisely describes the structure and semantics of a PCM. The set oftransformations is capable of encoding millions of PCMs from Wikipedia and supports commonformats such as CSV and HTML. Our approach provides the basis for easing the development ofservices dedicated to PCMs. We developed important services such as an editor, a comparator, aconfigurator and statistical visualizations.
Our second solution (see middle and bottom of Figure 9.1) is a synthesis algorithm that producesprecise and high quality AFMs. Due to the syntactic and semantic gap between PCM and AFMs,our algorithm is limited to a class of PCMs: configuration matrices. In addition, it may require apotentially high computational and user effort.
Our solutions provide two different views on the same PCM. On the one hand, a PCM modelis product-oriented. It adopts a logical structure that is close to the original PCM. Its semanticsallows the development of basic edition, manipulation and visualization techniques. On the otherhand, an AFM is feature-oriented. It focuses on the variability represented by the PCM. With itsprecise semantics, it enables the use of advanced reasoning techniques. Moreover, the synthesis ofan AFM allows to switch to product line engineering techniques for managing the set of productsrepresented by a PCM.
Our model-based approach provides the necessary basis for editing and exploiting PCMs whileour AFM synthesis algorithm is best suited for advanced reasoning on the semantics of a PCM.As a complement our first solution can be used to edit and transform PCMs into configurationmatrices and thus feed our second solution. Overall, our two solutions based on metamodels andfeature models are complementary approaches to the precise formalization of a large diversity ofPCMs.
9.4 Towards the Formalization of Unstructured Data
As we explained previously, PCMs are an example of the numerous unstructured data available onthe Web. The techniques developed in this thesis could be applied or adapted to other contexts.A first idea is to use the formalism of PCMs to represent other sources of product descriptions.For instance, we developed a tool based on OpenCompare to extract the information contained intextual descriptions of products in the form of a PCM [10]. The tool uses natural language pro-cessing techniques to perform this operation. Another example is the great number of informationthat the open data movement [142] is making accessible in the form of APIs or CSV files. Theyare also facing the need to develop software for understanding and exploiting this information.Part of this information could be encoded as a PCM and thus our contributions could ease thedevelopment of innovative services. We want to emphasize that in this context, the term productrefers to something that has comparable characteristics. It is more generic than the term used forcommercial products.
Another idea is to use our FM synthesis algorithms (see Part III) for other kinds of artifacts thanconfiguration matrices. We already demonstrated that our FM synthesis algorithm of Chapter 7supports various artifacts (e.g. source code, configuration files or textual requirements) as longas they can be encoded in a propositional formula. This contributes to several operations forsoftware product lines. Our AFM synthesis algorithm (see Chapter 8) could also be adapted tosupport similar formulas. This is particularly relevant for systems like the Linux kernel whichcontain constraints on numerical information [140, 164]. Our algorithm could ease the analysis ofvariability in these systems by synthesizing a precise and meaningful AFM.
Finally, the iterative process that we propose in Chapter 4 is not restricted to PCMs. Modelingexperts facing the need for formalizing a large number of complex and heterogeneous data, couldreuse our process to elaborate a model-based approach. They would have to find adapted experi-ments for evaluating the approach based on the data, end-users and services but it would result inrelevant and accurate metamodels and transformations.

9.4. TOWARDS THE FORMALIZATION OF UNSTRUCTURED DATA 123
All these ideas show that the contributions of this thesis are applicable to other domains thanPCMs. The research domain of software engineering and in particular software product lines couldbenefit from our techniques.


Chapter 10
Perspectives
"A world without rules or controls, borders or bound-aries. A world where anything is possible. Where we gofrom there is a choice I leave to you"
Neo
The work presented in this thesis opens many perspectives that we present in this chapter.First, we explore how we could further investigate the transition between a PCM and an FM (seeSection 10.1). Then, we highlight challenges for the metamodeling community that we identifiedduring the elaboration of our model-based approaches (see Section 10.2). We also show how wecan pursue our analysis of the Wikipedia case study (see Section 10.3). Finally, we present thefuture of OpenCompare and the engineering and research challenges that we want to address (seeSection 10.4).
10.1 From PCMs to FMs
10.1.1 User Effort
In Part III, we presented techniques to synthesize FMs that are sound and complete and exhibitan appropriate hierarchy. We showed that a fully automated synthesis is likely to produce featuremodels far from ground truth. User knowledge is thus required to obtain high quality FMs.
Measuring and managing the user effort during FM synthesis is crucial. We developed heuristicsto rank parent candidates. It potentially reduce user effort during the selection of the hierarchyof an FM. We evaluated the effectiveness of our heuristics based on the position of the correctparent in the ground truth. However, we did not perform a user study to measure the user effortin a realistic setting. In addition, we showed that in some cases, the synthesis of AFM can lead tonumerous constraints. This encourages us to develop techniques for presenting a relevant subsetof configurations or constraints to the user.
Another challenge is to to identify the situations when going from a PCM to an FM might notbe desirable. For example, we could find a heuristic that, based on the shape of the PCM (e.g. thenumber of products and features), indicates if the user effort will be significant or not. Overall, wewould like to measure user effort and further understand the relation between PCMs and FMs.
10.1.2 Extended Support of PCMs
In Chapter 8, we presented a technique for synthesizing AFMs from PCMs. This technique islimited to a class of PCMs that we call configuration matrices. In particular, configuration matricesdo not contain uncertainty that we can encounter in some PCMs. We measured that 9.4% of thecells of PCMs from Wikipedia contain uncertainty (NotAvailable in our metamodel). Therefore,supporting uncertainty in the synthesis of FMs would greatly improve the support of PCMs.
125

126 CHAPTER 10. PERSPECTIVES
The challenge is to extend the formalism of AFMs in order to support uncertainty. A first stepis to identify a logic that provides the necessary constructs to define the semantics of such extendedAFMs. A second step is to develop reasoners for performing operations on the model (e.g. checkingif a product exists or if a constraint holds). One lead is the work of Czarnecki et al. that presentprobabilistic FMs [77]. It is an extension to Boolean FMs that can model soft constraints. Oncethe formalism is determined, we can envision to synthesize such extended AFMs from a PCM. Forimplementing the algorithm, we could benefit from the API provided by OpenCompare.
10.2 Metamodeling
10.2.1 Machine Learning for Metamodeling
In Part II, we presented a model-based approach for the formalization and exploitation of PCMs.To elaborate this approach, we performed lots of manual analysis and developments. We analyzedhundreds of PCMs from Wikipedia. We designed a set of metamodels. We developed regularexpressions to detect types of cells. We implemented several transformations between differentconcrete formats and models.
Using a manual approach limits the exploration of PCMs. We are quickly overwhelmed bythe number and diversity of existing PCMs. To overcome this problem, we started to automatethe process. For example, we used metamorphic testing to cover the entire dataset of PCMsfrom Wikipedia. We think there is an opportunity to further automate the elaboration of ourtechniques and model-based approach in general. In particular, we envision the use of machinelearning techniques to identify concepts for a metamodel from a large dataset of raw data.
We conducted a preliminary study that uses well known algorithms such as k-means [128] orlatent semantic analysis [83] to perform clustering of PCM cells. The results show that we areable to retrieve some of the concepts discovered in our manual analysis. We also think there is apotential for finding new kinds of data that could be integrated in our metamodels.
Another opportunity of automation is the derivation of classifiers that can detect the typesof the cells contained in a PCM (e.g. date, version). Such classifiers could be more flexible andaccurate than our regular expressions. We plan to continue our study in order to automaticallyderive metamodels and their associated transformations. Even if a user seems required to guidethe extraction of concepts, such automated techniques could ease the modeling of a large datasets.
10.2.2 Comparison of Model-Based Approaches
In Chapter 6, we explained how our initial approach based on a unique metamodel was not ap-propriate for deriving services. We noticed conflicts between our different objectives: describe thePCM domain, manipulate a PCM, edit a PCM and interoperate with other formats. For instance,a representation of a PCM based on rows and columns (appropriate for developing an editor) con-flicts with a representation based on products and features (appropriate for describing the PCMdomain). Therefore, we proposed another approach based on several task-specific metamodelsgathered around a central domain metamodel. We highlighted how this new approach eases thecreation of services compared to the initial approach. Yet the management of multiple metamodelsintroduces well-known synchronization problems.
We mainly based the comparison of our approaches on numerous feedback from researchers,engineers and students. However the feedback was informal and we had difficulties to quantifyor formally assess the superiority of the new approach. The challenge is to define a frameworkfor comparing model-based approaches. It would have to consider the multiplicity of metamodelsand objectives. An important step would be to define measurable criteria in order to quantifythe superiority of a metamodel with respect to an objective. Such criteria would need coverstructural aspects (e.g. number of classes, associations) but also cognitive aspects (e.g. usability,comprehension) [105].
We think that the PCM domain can serve as a case study for the elaboration of such framework.By providing all the models and source code of OpenCompare in a freely accessible repository, wehope that other solutions will be developed and compared.

10.3. WIKIPEDIA CASE STUDY 127
10.3 Wikipedia Case Study
In this thesis, we often relied on Wikipedia either as a knowledge base for our techniques or as asource of PCMs. Wikipedia is an interesting case study for the domain of PCMs. We would liketo further understand how contributors of Wikipedia create and edit PCMs. To do so, we want topush further the analysis of our Wikipedia dataset by analyzing the evolution of PCMs over time.Furthermore, we want to understand if Wikipedia contributors use external tools to edit tablesand PCMs in particular. This work could motivate and prioritize the development of services orformalisms in OpenCompare.
We had the opportunity to discuss with a small community of contributors of Wikipedia.We presented our work on OpenCompare and they seemed very interested in the project andthe benefits it could bring to the encyclopedia. An interesting challenge would be to adapt andintegrate the editor or some services of OpenCompare in MediaWiki, the project that supportsWikipedia. We would gain immediate and valuable feedback about our models and services as wellas a large number of users.
Finally, a particularity of the syntax of Wikipedia pages, the wikitext language, is to provide amechanism called templates. Templates are a kind of macros that provide a way to reuse existingparts of Wikipedia. We noticed that they are often used in PCMs. Therefore, we would like tobetter understand how they are use in this context. From this study, we may be able to improvetheir support in our importer and exporter for Wikipedia.
10.4 OpenCompare
OpenCompare is a first step towards the creation of a community of contributors and users of PCMs.A strong motivation is to gather feedback from this community in order to improve OpenCompare.As they are end-users of our services, the could give us precious insights on the usability or relevanceof our metamodels and services. We could use this information to guide the development of a betterdomain metamodel for PCMs, a better API or an oracle for testing OpenCompare. To supportthis community, we need to fully support collaboration in the services of OpenCompare and inparticular in its editor. We may face several engineering and research challenges.
A first challenge is the development of version control for PCMs. The ability to track thedifferent versions of a PCM is essential in a collaborative context. A related feature is to be ableto compute the difference between two versions and present it in an intelligible way. We alreadyimplemented a basic diff operation in the API of OpenCompare but we could improve it.
An important feature for a community is to be able to search and discover PCMs. One way todo that is to present PCMs related to a given one. This is particularly relevant for completing theinformation that a user seeks with complementary PCMs. Das Sarma et al. developed a techniquefor ranking similar tables [79]. In particular, they exploit the similarity of entities and schemas.Moreover, they also considered Wikipedia as a source of tables for their evaluation. We could adapttheir technique to PCMs by deriving a schema from features and products.
One application of finding related PCMs is to provide an auto-complete mechanism. The idea isto suggest products, features or cells that could be related to the PCM under edition. Potentially,the contributors only have to review the suggested information instead of searching it. Therefore,it can ease the creation, completion or correction of a PCM. In addition to related PCMs, we couldexploit Web APIs or databases as a source of knowledge.
To further help users of OpenCompare to quickly search and explore PCMs, we would like toprovide a summary of the information they contain. For example, it could be presented as a textor an infographic generated automatically from a PCM. The challenge here is to find importantfacts in a PCM that could summarize the essential information it contains.
Finally, the information contained in PCMs is likely to change over time. To avoid a tedioussearch and correction of outdated information, we could link cells to external and dynamic sources.For instance, the price of a product could be retrieved from the API of a commercial website.
By integrating these numerous operations and services in OpenCompare, we get closer to theexpressiveness of spreadsheets. It questions the integration of OpenCompare with spreadsheets. If

128 CHAPTER 10. PERSPECTIVES
we tightly connect OpenCompare to the world of spreadsheets, we may benefit from the existingoperations and community of tools such as Excel or Tableau.
We think that all these innovative services could further improve the current practice for editingand using PCMs. This thesis is the necessary step to provide abstractions and formalizationtechniques on which we can build these innovative services.

Part V
Appendices
129

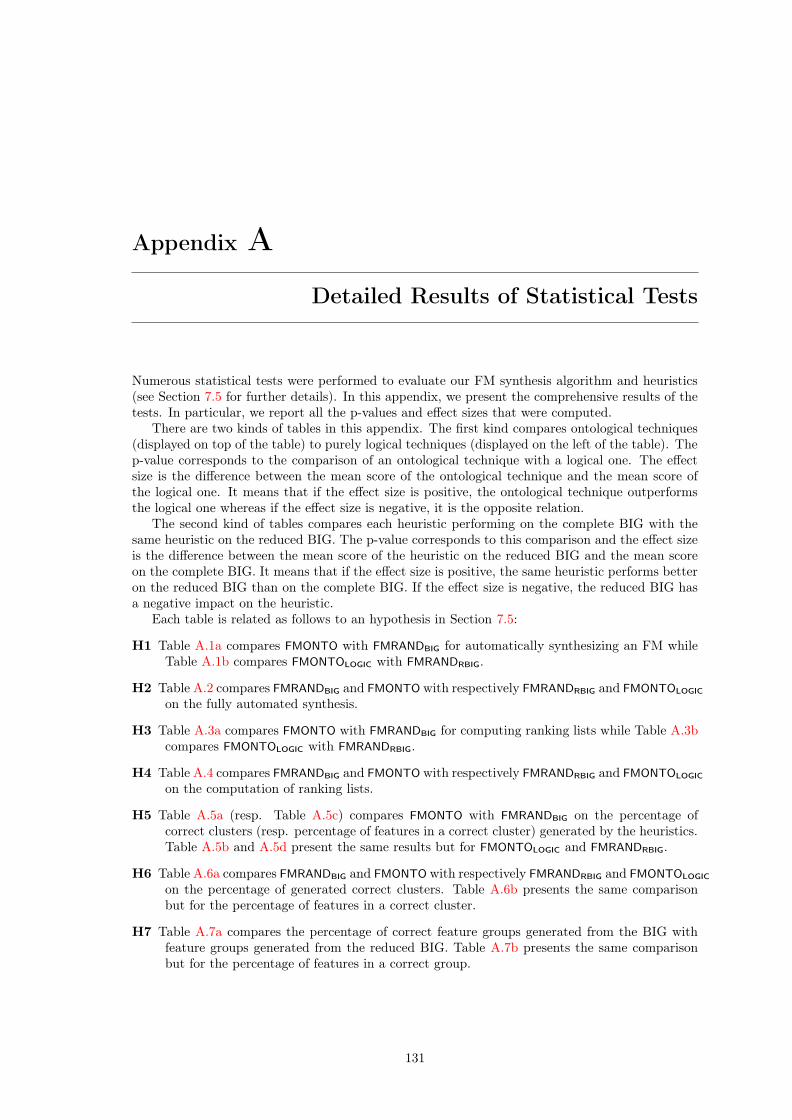
Appendix A
Detailed Results of Statistical Tests
Numerous statistical tests were performed to evaluate our FM synthesis algorithm and heuristics(see Section 7.5 for further details). In this appendix, we present the comprehensive results of thetests. In particular, we report all the p-values and effect sizes that were computed.
There are two kinds of tables in this appendix. The first kind compares ontological techniques(displayed on top of the table) to purely logical techniques (displayed on the left of the table). Thep-value corresponds to the comparison of an ontological technique with a logical one. The effectsize is the difference between the mean score of the ontological technique and the mean score ofthe logical one. It means that if the effect size is positive, the ontological technique outperformsthe logical one whereas if the effect size is negative, it is the opposite relation.
The second kind of tables compares each heuristic performing on the complete BIG with thesame heuristic on the reduced BIG. The p-value corresponds to this comparison and the effect sizeis the difference between the mean score of the heuristic on the reduced BIG and the mean scoreon the complete BIG. It means that if the effect size is positive, the same heuristic performs betteron the reduced BIG than on the complete BIG. If the effect size is negative, the reduced BIG hasa negative impact on the heuristic.
Each table is related as follows to an hypothesis in Section 7.5:
H1 Table A.1a compares FMONTO with FMRANDBIG for automatically synthesizing an FM whileTable A.1b compares FMONTOLOGIC with FMRANDRBIG.
H2 Table A.2 compares FMRANDBIG and FMONTO with respectively FMRANDRBIG and FMONTOLOGIC
on the fully automated synthesis.
H3 Table A.3a compares FMONTO with FMRANDBIG for computing ranking lists while Table A.3bcompares FMONTOLOGIC with FMRANDRBIG.
H4 Table A.4 compares FMRANDBIG and FMONTO with respectively FMRANDRBIG and FMONTOLOGIC
on the computation of ranking lists.
H5 Table A.5a (resp. Table A.5c) compares FMONTO with FMRANDBIG on the percentage ofcorrect clusters (resp. percentage of features in a correct cluster) generated by the heuristics.Table A.5b and A.5d present the same results but for FMONTOLOGIC and FMRANDRBIG.
H6 Table A.6a compares FMRANDBIG and FMONTO with respectively FMRANDRBIG and FMONTOLOGIC
on the percentage of generated correct clusters. Table A.6b presents the same comparisonbut for the percentage of features in a correct cluster.
H7 Table A.7a compares the percentage of correct feature groups generated from the BIG withfeature groups generated from the reduced BIG. Table A.7b presents the same comparisonbut for the percentage of features in a correct group.
131
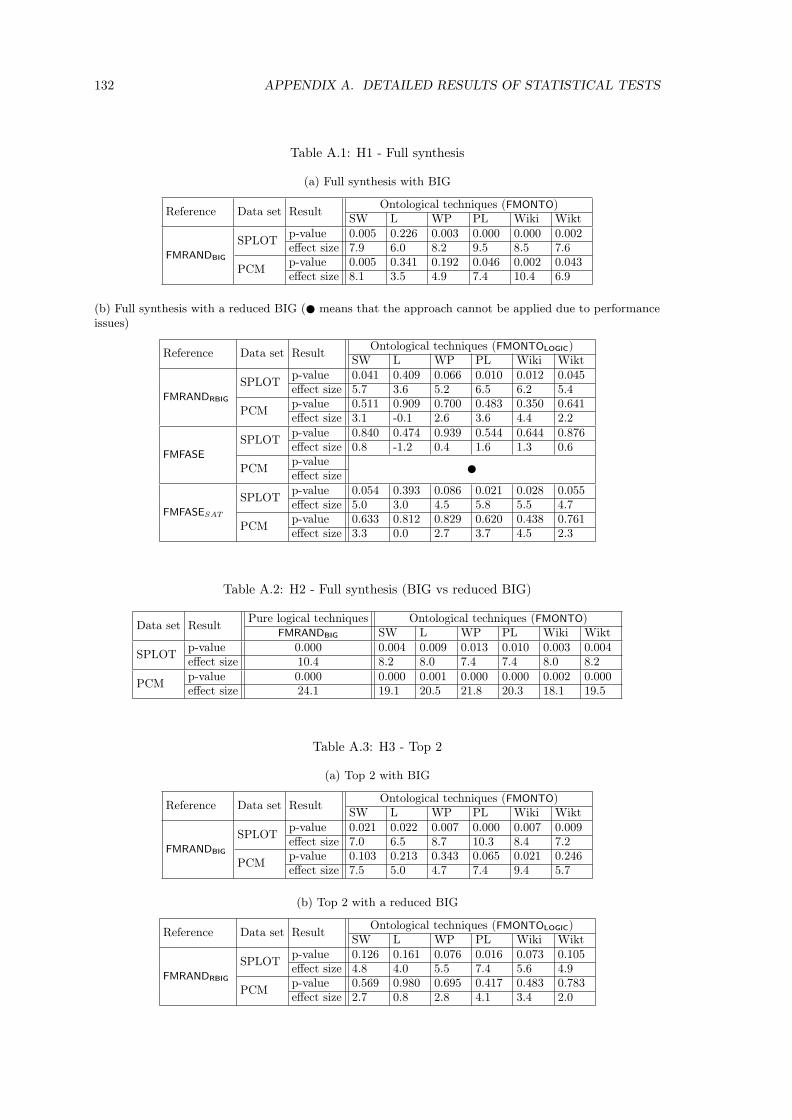
132 APPENDIX A. DETAILED RESULTS OF STATISTICAL TESTS
Table A.1: H1 - Full synthesis
(a) Full synthesis with BIG
Reference Data set ResultOntological techniques (FMONTO)
SW L WP PL Wiki Wikt
FMRANDBIG
SPLOTp-value 0.005 0.226 0.003 0.000 0.000 0.002effect size 7.9 6.0 8.2 9.5 8.5 7.6
PCMp-value 0.005 0.341 0.192 0.046 0.002 0.043effect size 8.1 3.5 4.9 7.4 10.4 6.9
(b) Full synthesis with a reduced BIG (� means that the approach cannot be applied due to performanceissues)
Reference Data set ResultOntological techniques (FMONTOLOGIC)
SW L WP PL Wiki Wikt
FMRANDRBIG
SPLOTp-value 0.041 0.409 0.066 0.010 0.012 0.045effect size 5.7 3.6 5.2 6.5 6.2 5.4
PCMp-value 0.511 0.909 0.700 0.483 0.350 0.641effect size 3.1 -0.1 2.6 3.6 4.4 2.2
FMFASE
SPLOTp-value 0.840 0.474 0.939 0.544 0.644 0.876effect size 0.8 -1.2 0.4 1.6 1.3 0.6
PCMp-value
�effect size
FMFASESAT
SPLOTp-value 0.054 0.393 0.086 0.021 0.028 0.055effect size 5.0 3.0 4.5 5.8 5.5 4.7
PCMp-value 0.633 0.812 0.829 0.620 0.438 0.761effect size 3.3 0.0 2.7 3.7 4.5 2.3
Table A.2: H2 - Full synthesis (BIG vs reduced BIG)
Data set ResultPure logical techniques Ontological techniques (FMONTO)
FMRANDBIG SW L WP PL Wiki Wikt
SPLOTp-value 0.000 0.004 0.009 0.013 0.010 0.003 0.004effect size 10.4 8.2 8.0 7.4 7.4 8.0 8.2
PCMp-value 0.000 0.000 0.001 0.000 0.000 0.002 0.000effect size 24.1 19.1 20.5 21.8 20.3 18.1 19.5
Table A.3: H3 - Top 2
(a) Top 2 with BIG
Reference Data set ResultOntological techniques (FMONTO)
SW L WP PL Wiki Wikt
FMRANDBIG
SPLOTp-value 0.021 0.022 0.007 0.000 0.007 0.009effect size 7.0 6.5 8.7 10.3 8.4 7.2
PCMp-value 0.103 0.213 0.343 0.065 0.021 0.246effect size 7.5 5.0 4.7 7.4 9.4 5.7
(b) Top 2 with a reduced BIG
Reference Data set ResultOntological techniques (FMONTOLOGIC)
SW L WP PL Wiki Wikt
FMRANDRBIG
SPLOTp-value 0.126 0.161 0.076 0.016 0.073 0.105effect size 4.8 4.0 5.5 7.4 5.6 4.9
PCMp-value 0.569 0.980 0.695 0.417 0.483 0.783effect size 2.7 0.8 2.8 4.1 3.4 2.0

133
Table A.4: H4 - Top 2 (BIG vs reduced BIG)
Data set ResultPure logical techniques Ontological techniques (FMONTO)
FMRANDBIG SW L WP PL Wiki Wikt
SPLOTp-value 0.004 0.048 0.059 0.082 0.060 0.109 0.045effect size 8.6 6.4 6.1 5.4 5.7 5.7 6.3
PCMp-value 0.000 0.015 0.016 0.004 0.008 0.031 0.006effect size 19.9 15.1 15.7 18.0 16.5 14.0 16.3
Table A.5: H5 - Clusters generated by heuristics
(a) Percentage of correct clusters with BIG
Reference Data set ResultOntological techniques (FMONTO)
SW L WP PL Wiki Wikt
FMRANDBIG
SPLOTp-value 0.000 0.000 0.000 0.000 0.000 0.000effect size 22.7 27.6 29.6 39.9 26.9 39.1
PCMp-value 0.000 0.000 0.000 0.000 0.000 0.000effect size 34.7 47.7 45.9 64.3 38.9 56.1
(b) Percentage of correct clusters with a reduced BIG
Reference Data set ResultOntological techniques (FMONTOLOGIC)
SW L WP PL Wiki Wikt
FMRANDRBIG
SPLOTp-value 0.000 0.000 0.000 0.000 0.000 0.000effect size 25.1 26.1 23.6 32.0 26.3 33.6
PCMp-value 0.000 0.000 0.000 0.000 0.000 0.000effect size 31.5 39.2 36.6 52.5 35.6 48.9
(c) Percentage of features in a correct cluster with BIG
Reference Data set ResultOntological techniques (FMONTO)
SW L WP PL Wiki Wikt
FMRANDBIG
SPLOTp-value 0.000 0.000 0.678 0.545 0.008 0.036effect size 10.0 12.1 0.6 2.9 6.8 5.6
PCMp-value 0.000 0.000 0.944 0.000 0.000 0.000effect size 22.5 28.9 0.4 10.3 12.0 19.7
(d) Percentage of features in a correct cluster with a reduced BIG
Reference Data set ResultOntological techniques (FMONTOLOGIC)
SW L WP PL Wiki Wikt
FMRANDRBIG
SPLOTp-value 0.000 0.000 0.793 0.812 0.033 0.111effect size 8.8 11.3 0.9 1.9 6.0 4.6
PCMp-value 0.000 0.000 0.944 0.000 0.000 0.000effect size 22.3 28.7 0.5 10.4 11.9 19.8

134 APPENDIX A. DETAILED RESULTS OF STATISTICAL TESTS
Table A.6: H6 - Clusters generated by heuristics (BIG vs reduced BIG)
(a) Percentage of correct clusters
Data set ResultPure logical techniques Ontological techniques (FMONTO)
FMRANDBIG SW L WP PL Wiki Wikt
SPLOTp-value 0.000 0.000 0.002 0.111 0.191 0.001 0.040effect size 13.4 15.8 12.0 7.4 5.5 12.8 8.0
PCMp-value 0.000 0.001 0.002 0.045 0.007 0.001 0.001effect size 21.9 18.6 13.3 12.5 10.1 18.6 14.7
(b) Percentage of features in a correct cluster
Data set ResultPure logical techniques Ontological techniques (FMONTO)
FMRANDBIG SW L WP PL Wiki Wikt
SPLOTp-value 0.220 0.294 0.506 0.694 0.348 0.403 0.375effect size -1.1 -2.3 -1.8 -0.8 -2.1 -1.9 -2.1
PCMp-value 0.866 0.956 0.962 0.950 0.997 0.915 1.000effect size -0.1 -0.4 -0.3 -0.1 -0.1 -0.3 0.0
Table A.7: H7 - Feature groups (BIG vs reduced BIG)
(a) Percentage of correct clusters
Data set Result All groups Mutex Xor
SPLOTp-value 0.008 0.010 0.257effect size 10.7 27.4 3.0
PCMp-value 0.024 0.051 0.233effect size 7.8 8.5 8.9
(b) Percentage of features in a correct cluster
Data set Result All groups Mutex Xor
SPLOTp-value 0.398 0.013 0.143effect size -3.7 -3.2 -5.2
PCMp-value 0.761 0.395 0.670effect size 3.6 -7.3 2.7

Appendix B
Theoretical Analysis of AFM Synthesis Algorithm
Our algorithm presented in Section 8.3, page 105 addresses the synthesis problem defined in Def-inition 21. This definition states that the synthesized AFM must be maximal and have the sameconfiguration semantics as the input configuration matrix. In the following, we check these twoproperties. We also evaluate the scalability of our algorithm by analyzing its theoretical timecomplexity.
B.1 Soundness and Completeness
Synthesizing an AFM that represents the exact same set of configurations (i.e. configurationsemantics) as the input configuration matrix is primordial. In order to ensure this property, thesynthesis algorithm must be sound (see Definition 18) and complete (see Definition 19).
B.1.1 Valid and Comprehensive Computation of Binary Implications
An AFM can be seen as the representation of a set of configurations (see Defintion 17) but also asa set of constraints over the features and attributes. These two views are equivalent but presenttwo opposite reasonings. The former view focuses on adding configurations while the latter focuseson removing configurations. In the following, we will switch from one view to the other in orderto prove the soundness and completeness of our algorithm.
A central operation in our algorithm is the computation of all the binary implications that arepresent in the input configuration matrix. The soundness and completeness of our algorithm aretied to a valid and comprehensive computation of these constraints. Definition 23 and Definition 24define these two properties for the computation of binary implications, respectively.
Definition 23 (Validity of binary implications). Let C be an M ×N configuration matrix. A setof binary implications BI is valid w.r.t. C, iff for each �i, j, u, S� ∈ BI the following conditionholds:
∀k ∈ [1..M ]. (ck,i = u) ⇒ ck,j ∈ S (B.1)
Definition 24 (Comprehensiveness of binary implications). Let C be an M × N configurationmatrix. A set of binary implications BI is comprehensive w.r.t. C, iff:
∀i, j ∈ [1..N ], ∀u ∈ Di. ∃ �i, j, u, S� ∈ BI such that S ⊆ Dj : (B.2)
Intuitively, for each possible combination of i, j, and u, at least one binary implication exists inBI.
Let C be an M ×N configuration matrix. The set of binary implications BI computed usingAlgorithm 2 is valid and comprehensive with respect to C. The proof of these two properties is asfollows:
Validity: Let �i, j, u, S� be an arbitrary binary implication in BI. In line 5 and 8 of thealgorithm, we add the value of column j for configuration ck (noted as ck,j) to S(i, j, ck,i). This
135

136 APPENDIX B. THEORETICAL ANALYSIS OF AFM SYNTHESIS ALGORITHM
particular S is bound to i, j and the value of the column i for the configuration ck (noted asck,i). As a result, for each k ∈ [1..M ] such that ck,i = u, ck,j is in S, and Equation B.1 holds for�i, j, u, S�.
Comprehensiveness: The for statements in lines 2 and 3 iterate over all values of i, j andu, and generate all distinct combinations (i, j, u). For each of these combinations, line 4 ensuresthat one binary implication is added to BI. Let �i, j, u, S� be a binary implication in BI. Inaddition, line 5 and 8 guarantee that the value added to S is in Dj and thus S ⊆ Dj . Therefore,Equation B.2 holds for BI.
B.1.2 Proof of Soundness of the Synthesis Algorithm
According to Definition 18, the algorithm detailed in Section 8.3 is sound if all the configurationsrepresented by the AFM exist also in the configuration matrix. To prove this property, it isequivalent to show that the constraints represented by the configuration matrix are included in theconstraints represented by the AFM.
In general, the attributed feature diagram (see Definition 15) is not expressive enough to repre-sent the constraints of the configuration matrix (see Section 8.2.2). To keep the algorithm sound,we rely on the additional constraint Φ of the AFM. A simple strategy is to use Equation 8.1 tospecify the whole configuration matrix as a constraint, and include it in the AFM as Φ. Sucha constraint would, by construction, restrict the configuration semantics of the AFM to a subsetof the configuration semantics of the matrix. Therefore, our algorithm is sound if Φ is carefullydefined. Otherwise, it may represent an overapproximation of the input configuration matrix (seeSection 8.2.2).
B.1.3 Proof of Completeness of the Synthesis Algorithm
To prove the completeness of our algorithm, we have to show that all the configurations representedby the configuration matrix exist also in the synthesized AFM (see Definition 19). It is equivalentto show that all the constraints represented by the AFM are included in the constraints representedby the configuration matrix. A first observation is that, apart from or-groups, xor-groups and Φ,the AFM is constructed from a set of binary implications computed by Algorithm 2 (step 2 ofAlgorithm 1).
As proved in Section B.1.1, the computed binary implications are valid. Therefore, all theconstraints presented by these implications are included in the configuration matrix. All thesubsequent computations relying on the binary implications do not introduce new constraints.They only reuse and transform these binary implications into feature modeling concepts.
For or-groups and xor-groups, we reuse existing techniques that rely on the input configurationmatrix. These techniques are designed for a similar context of FM synthesis and ensure thecompleteness of the resulting FM [29,166]. In our context of AFMs, the features and the attributesare separated in two distinct sets, repesctively F and A. Moreover, the attributes do not enterin the definition of the hierarchy H or the feature groups. As a consequence, the adaptation oftechniques for computing or-groups and xor-groups to the context of AFMs is straightforward andguarantees the completeness.
Finally, Φ as computed by Equation 8.1 is equivalent to the configuration matrix. Therefore,adding such a Φ to AFM does not exclude from it any of the configurations represented by theconfiguration matrix.
Overall, each step of the algorithm of Section 8.3 guarantees the property of completeness.Therefore, the whole synthesis process ensures completeness.
B.2 Maximality
Another challenge is to ensure the maximality of the synthesized AFM in order to avoid trivialanswers to the AFM synthesis problem (see Section 8.3). In this section, we prove that Algorithm 1produces a maximal attributed feature model. This is stated in Theorem 1.

B.2. MAXIMALITY 137
Theorem 1 (Maximality of the configuration semantics). Let M be a configuration matrix, andAFM be a sound and complete synthesis of M , generated using Algorithm 1. Then, AFM is alsomaximal.
Proof. To prove the maximality of AFM = �F,H,EM , GMTX , GXOR, GOR, A,D, δα, RC�, weshow that all conditions in Definition 20 hold for AFM :
H connects every feature in F . The algorithm ensures that the synthesized hierarchycontains all the features of the configuration matrix. The hierarchy is a rooted tree which isextracted from the binary implication graph (BIG) in step 4 of Algorithm 1. By construction (seeDefinition 22), the BIG contains all the features. Moreover, the comprehensive computation of thebinary implications (see Section B.1.1) ensures that the BIG represents all possible implicationsof the configuration matrix. We can define a hierarchy of an AFM as a spanning tree of theBIG. Therefore, every spanning tree of the BIG is a possible hierarchy for the AFM and everypossible hierarchy is a spanning tree of the BIG [3]. The existence of a single spanning tree isnot generally ensured for a binary implication graph computed from any arbitrary configurationmatrix. Specifically, the BIG may contain more than a single connected component. In such cases,we simply create a new root feature r in the BIG, and connect every feature in F to r. As aconsequence, line 3 of the algorithm always generates a connected graph. The extractHierarchy
routine in line 4 of Algorithm 1, uses the domain knowledge to chose one spanning tree of the BIGas H. Therefore, H is guaranteed to be a tree containing all features in F .
Adding an edge to Em changes the configuration semantics of AFM (�AFM�). Thealgorithm ensures that no edge can be added to the set of mandatory edges, Em, without chang-ing the configuration semantics of the AFM (i.e., adding or removing items from �AFM�). Em
represents every edge (f1, f2) of the hierarchy H such that f1 ⇔ f2. In line 6 of the algorithm, foreach edge (f1, f2) in the hierarchy H, we add an edge (f2, f1) to Em, iff (f2, f1) exists in the BIG.As mentioned previously, the BIG exactly represents all possible implications of the configurationmatrix. Adding any other edge to Em implies that the added edge does not exist in BIG. Therefore,no edge can be further added to Em without changing the configuration matrix, which correspondsto the configuration semantics of the AFM.
Adding an item to any of GMTX , GOR, or GXOR changes �AFM�. The computation offeature groups is entirely performed with existing techniques that are designed for the synthesis ofboolean FMs. Our definition of a maximal AFM (see Definition 15 and 20) preserves the definitionof feature groups and the notion of maximality used in boolean FMs. Moreover, the attributes areclearly separated from features and are not part of the feature groups. Therefore, the techniquesdesigned for boolean FMs are not impacted by the attributes and keep their properties (soundness,completeness and maximality). As we are using techniques that are designed for synthesizingsound, complete and maximal boolean FMs [29, 166], no group can be added to GMTX , GOR
GXOR without changing the configuration semantics of the AFM .
Moving any item from GMTX or GOR to GXOR changes �AFM�. An xor-group is afeature-group that is both a mutex-group and an or-group. In Algorithm 1, we promote everymutex-group that is also an or-group as an xor-group. Moreover, the previous property of maxi-mality ensures that all the possible feature groups are computed. Therefore, moving another groupfrom GMTX or GOR to GXOR is impossible without changing the configuration semantics of theAFM.
Adding a non-redundant constraint to RC changes �AFM�. As shown in the grammar ofRC in Figure 8.4, all readable constraints are implications between values of features or attributes.We compute the set of all such binary implications in line 2 of the algorithm. As proven inSection B.1.1, Algorithm 2 perform a comprehensive computation of binary implications in BI. Anyadditional constraint is therefore, either redundant, forbidden by the domain knowledge (i.e. itsnumerical literal is not part of the interesting values) or inconsistent with configuration matrix M .The latter implies that adding a non-redundant constraint to RC would change the configurationsemantics of AFM .
Overall, every property of the maximality is verified in the resulting AFM of our algorithm.

138 APPENDIX B. THEORETICAL ANALYSIS OF AFM SYNTHESIS ALGORITHM
B.3 Complexity analysis
The manual elaboration of an AFM is error-prone and time-consuming. As we showed previously,the soundness and completeness of our algorithm address the first problem. For the second problem,we have to evaluate the time complexity of our algorithm. It depends on 3 characteristics of theinput configuration matrix:
• number of variables (features + attributes): v = f + a
• number of configurations: c
• maximum domain size (i.e. maximum number of distinct values for a variable): d
In the following, we analyze the complexity for each step of Algorithm 1 and 2.
B.3.1 Extracting Features and Attributes
The first step of Algorithm 1 is the extraction of features, attributes and their domains. Thisextraction simply consists in running through the configuration matrix to gather the domains andidentify features and attributes. The size of the matrix is characterized by the number of variables(columns) and the number of configurations (rows). Therefore, the complexity is O(v.c).
B.3.2 Extracting Binary Implications
The extraction of binary implications is computed by Algorithm 2 whose complexity is as follows.The outer for loop of lines 2-8 iterates over all pairs of variables in the configuration matrix (O(v2)).The inner for loop of lines 3-8 iterates over all configurations (O(c)). In this loop, we perform 2types of operations: checking the existence of the set S(i, j, ck,i) in line 4 and adding one elementto a set. Checking the existence of S(i, j, ck,i), for a given i and j, involves searching for an elementin a map that has potentially d elements. Therefore, its complexity is O(d). The latter operationis performed on a set that accesses its elements by a hash function. Adding an element to such aset has a complexity of O(1). Overall, the complexity of the computation of binary implications isO(v2.c.d).
B.3.3 Defining the Hierarchy
In line 3, we iterate over all the binary implications to compute the binary implication graph andthe mutex graph. For each binary implication, if it represents an implication between two features,we add an edge to the binary implication graph. If the binary implication represents a mutualexclusion between two features, we add an edge to the mutex graph. Both checks are done in aconstant time. Therefore, the complexity of this step depends on the number of binary implications.As explained in Algorithm 2, we create a binary implication for each pair of variables (i, j) and foreach value ck,i in the domain of the i. It results in a maximum of v2.d binary implications. As aconsequence, the complexity of line 3 is O(v2.d).
In line 4, we compute the hierarchy of the AFM by selecting a tree in the binary implicationgraph. This step is performed by the domain knowledge (i.e. by a user or an external algorithm).In [3], we propose an algorithm for this task which has a time complexity of O(f.log(f 2)).
In line 5, we compute all the possible places for each attribute. We recall that an attribute a
can be placed in the feature f if ¬f ⇒ (a = 0a), with 0a being the null value of the domain ofa. We first initialize the possible places for all attributes as an empty set. Then, we iterate overeach binary implication {�i, j, u, S�} in order to add the valid places. The loop has a complexityof O(v2.d) as it represents the maximum number of binary implications. A valid place is identifiedas follows. First, we check that i is a feature, j is an attribute and that u represents the absenceof the feature i. Then, we verify that S is equal to the null value of the domain of j. If all theseproperties are respected, the feature i is thus a valid place for the attribute j and can be added toits possible places. These verifications have a complexity of O(d). Overall, the complexity of thisstep is O(v2.d2).

B.3. COMPLEXITY ANALYSIS 139
B.3.4 Computing the Variability Information
The computation of variability information is done in two steps: mandatory features and featuregroups. For detecting mandatory features, we iterate over every edge of the hierarchy. As thehierarchy is a tree containing all the features as nodes, the number of edges is exactly equal tof − 1. For each edge, we check that the inverted edge exists in the binary implication graph. Thischeck is performed with a complexity of O(f) in our implementation. Overall, the complexity isO(f2).
For feature groups, we rely on existing techniques that are developed in [29,166]. We summarizethe results of the complexity analysis of these techniques.
The computation of mutex groups consists in finding maximal cliques in the mutex graph. Asthe mutex graph contains all the features as nodes, the complexity of this operation is O(3f/3) [176].
For or-groups, the algorithm relies on a binary integer programming which is an NP-completeproblem.
For the computation of xor-groups, there are two alternatives. The first one assumes thecomputation of or-groups. For each or-group, it iterates through the mutex-groups to check ifthere exists an equivalent group (i.e. same parent and same children). As the number of groupsis bounded by the number of features, the two iterations have a complexity of O(f 2). Checkingif two groups are equivalent consists in checking the equality of two sets. The maximum size fora group is also bounded by the number of features. The check is performed with a complexity ofO(f2). Overall, this first technique for computing xor-groups is O(f 4).
The second technique do not assume the computation of or-groups. It iterates over every mutex-group and checks that, for each configuration, the parent of the group implies the disjunction ofthe features of the group. Checking this property depends on the size of the mutex-group, whichis bounded by the number of features f . Overall, the complexity of this second technique forcomputing xor-groups is O(f2.c)
B.3.5 Computing Cross Tree Constraints
The computation of cross tree constraints (RC) is performed in three steps.First, the requires constraints are extracted from the binary implication graph. The algorithm
iterates over every edge of the graph and checks if it exists either in the mandatory features or inthe hierarchy. The binary implication graph is composed of the features as nodes and thus containsat most f2 edges. In addition, the number of edges represented by the mandatory features and thehierarchy is bounded by the number of features f . Therefore, the complexity of this step is O(f 3).
Then, the excludes constraints are extracted from the mutex graph by looking for all the edgesthat are in the mutex graph but not in any mutex-group. The algorithm iterates over every edge ofthe mutex graph and checks that it does not exist in the mutex-groups. Like the binary implicationgraph, the mutex graph contains at most f 2 edges. Moreover, the mutex-groups represent at mostf edges (size of the hierarchy). Therefore, checking if an edge exists in the mutex-groups has acomplexity of O(f). Overall, the complexity of this step is O(f 3).
Finally, the complex constraints are extracted from the binary implications computed in line 2of Algorithm 1. This extraction is done in two steps. In the first step, the algorithm iterates overevery binary implication, which results in a complexity of O(v2.d). Then, binary implications thatrefer to a particular pair of attributes (e.g., (ai, aj)) are divided into three categories based onthe bound specified on the first attribute, by the domain knowledge. The items in each categoryare then merged. To speed up the detection of implications that need to be merged, we store theimplications in a map indexed by the pairs of attributes. Therefore, the algorithm is working onthree maps that have at most v2 elements. Thus, the complexity of an operation on the map isO(v2). Merging two binary constraints (ai, u1, aj , S1) and (ai, u2, aj , S2) consists in computing theunion of S1 and S2. These sets contain values of the attribute aj and have a maximum size of d.Therefore, the complexity for merging two binary constraints is O(d) and the total complexity ofthis first step is O(v2.d(v2 + d)) = O(v4.d+ v2.d2).
In the second step of the extraction of constraints, we iterate over the three maps previouslycomputed. Each map has potentially v2 elements. The complexity of the loop is thus O(v2). Inthese maps, the value of each element (ai, aj) is composed of the result of the previous merge
140 APPENDIX B. THEORETICAL ANALYSIS OF AFM SYNTHESIS ALGORITHM
operations, which is a set S of at most d elements. We check that S can be represented as “aj OP
k”, with OP a comparison operator from the grammar of RC and k a value of the domain of aj ,specifying the bound on it. If this representation is possible, we add it as a complex constraint toRC. In our implementation this check has a complexity of d2. Therefore, the complexity of thesecond step is O(v2.d2).
Overall, the complexity of the computation of complex constraints is O(v4.d+ v2.d2).
B.3.6 Overall Complexity
The time complexity analysis of Algorithm 1 shows that, apart from the computation of mutex-groups and or-groups, the synthesis of an attributed feature diagram has a polynomial time com-plexity. In particular, its complexity is O(v4.d+v2.d2+v2.c.d). The complexity of the computationof mutex-groups and or-groups are exponential and NP-complete, respectively. They represent thehardest parts of Algorithm 1 from a theoretical point of view. To obtain an AFM, we have to takeinto account the computation of Φ. With our algorithm in Equation 8.1, we simply iterate overeach value of the configuration matrix, which results in a complexity of O(v.c).
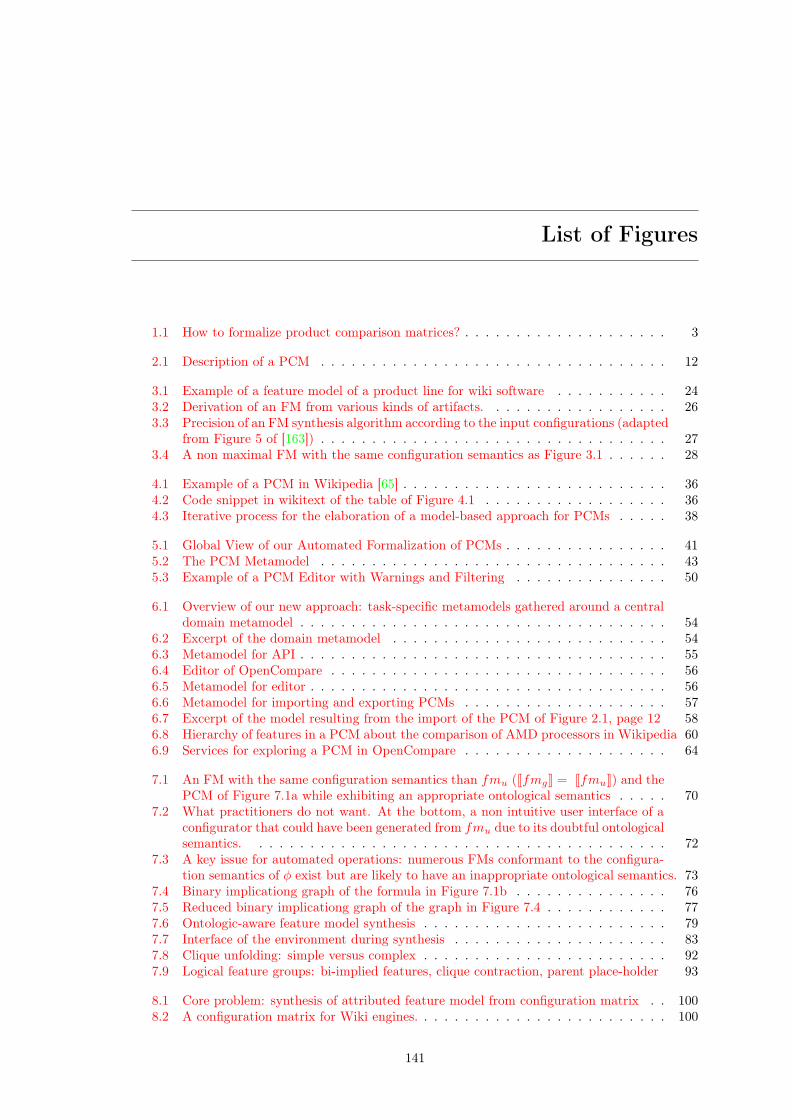
List of Figures
1.1 How to formalize product comparison matrices? . . . . . . . . . . . . . . . . . . . . 3
2.1 Description of a PCM . . . . . . . . . . . . . . . . . . . . . . . . . . . . . . . . . . 12
3.1 Example of a feature model of a product line for wiki software . . . . . . . . . . . 243.2 Derivation of an FM from various kinds of artifacts. . . . . . . . . . . . . . . . . . 263.3 Precision of an FM synthesis algorithm according to the input configurations (adapted
from Figure 5 of [163]) . . . . . . . . . . . . . . . . . . . . . . . . . . . . . . . . . . 273.4 A non maximal FM with the same configuration semantics as Figure 3.1 . . . . . . 28
4.1 Example of a PCM in Wikipedia [65] . . . . . . . . . . . . . . . . . . . . . . . . . . 364.2 Code snippet in wikitext of the table of Figure 4.1 . . . . . . . . . . . . . . . . . . 364.3 Iterative process for the elaboration of a model-based approach for PCMs . . . . . 38
5.1 Global View of our Automated Formalization of PCMs . . . . . . . . . . . . . . . . 415.2 The PCM Metamodel . . . . . . . . . . . . . . . . . . . . . . . . . . . . . . . . . . 435.3 Example of a PCM Editor with Warnings and Filtering . . . . . . . . . . . . . . . 50
6.1 Overview of our new approach: task-specific metamodels gathered around a centraldomain metamodel . . . . . . . . . . . . . . . . . . . . . . . . . . . . . . . . . . . . 54
6.2 Excerpt of the domain metamodel . . . . . . . . . . . . . . . . . . . . . . . . . . . 546.3 Metamodel for API . . . . . . . . . . . . . . . . . . . . . . . . . . . . . . . . . . . . 556.4 Editor of OpenCompare . . . . . . . . . . . . . . . . . . . . . . . . . . . . . . . . . 566.5 Metamodel for editor . . . . . . . . . . . . . . . . . . . . . . . . . . . . . . . . . . . 566.6 Metamodel for importing and exporting PCMs . . . . . . . . . . . . . . . . . . . . 576.7 Excerpt of the model resulting from the import of the PCM of Figure 2.1, page 12 586.8 Hierarchy of features in a PCM about the comparison of AMD processors in Wikipedia 606.9 Services for exploring a PCM in OpenCompare . . . . . . . . . . . . . . . . . . . . 64
7.1 An FM with the same configuration semantics than fmu (�fmg� = �fmu�) and thePCM of Figure 7.1a while exhibiting an appropriate ontological semantics . . . . . 70
7.2 What practitioners do not want. At the bottom, a non intuitive user interface of aconfigurator that could have been generated from fmu due to its doubtful ontologicalsemantics. . . . . . . . . . . . . . . . . . . . . . . . . . . . . . . . . . . . . . . . . 72
7.3 A key issue for automated operations: numerous FMs conformant to the configura-tion semantics of φ exist but are likely to have an inappropriate ontological semantics. 73
7.4 Binary implicationg graph of the formula in Figure 7.1b . . . . . . . . . . . . . . . 767.5 Reduced binary implicationg graph of the graph in Figure 7.4 . . . . . . . . . . . . 777.6 Ontologic-aware feature model synthesis . . . . . . . . . . . . . . . . . . . . . . . . 797.7 Interface of the environment during synthesis . . . . . . . . . . . . . . . . . . . . . 837.8 Clique unfolding: simple versus complex . . . . . . . . . . . . . . . . . . . . . . . . 927.9 Logical feature groups: bi-implied features, clique contraction, parent place-holder 93
8.1 Core problem: synthesis of attributed feature model from configuration matrix . . 1008.2 A configuration matrix for Wiki engines. . . . . . . . . . . . . . . . . . . . . . . . . 100
141

142 LIST OF FIGURES
8.3 One possible attributed feature model for representing the configuration matrix inFigure 8.2 . . . . . . . . . . . . . . . . . . . . . . . . . . . . . . . . . . . . . . . . . 101
8.4 The grammar of readable constraints. . . . . . . . . . . . . . . . . . . . . . . . . . 1028.5 Another attributed feature model representing the configuration matrix in Figure 8.2 1038.6 Web-based tool for gathering domain knowledge during the synthesis . . . . . . . . 1048.7 Scalability of or-groups computation w.r.t the number of variables . . . . . . . . . 1098.8 Scalability w.r.t the number of variables . . . . . . . . . . . . . . . . . . . . . . . . 1098.9 Scalability w.r.t the number of configurations . . . . . . . . . . . . . . . . . . . . . 1108.10 Scalability w.r.t the maximum domain size . . . . . . . . . . . . . . . . . . . . . . 1108.11 Time complexity distribution for all experiments without or-groups computation . 1118.12 Time complexity distribution of Algorithm 1 on the Best Buy dataset . . . . . . . 1128.13 Main steps for going from a PCM to an AFM . . . . . . . . . . . . . . . . . . . . . 113
9.1 Contributions . . . . . . . . . . . . . . . . . . . . . . . . . . . . . . . . . . . . . . . 121
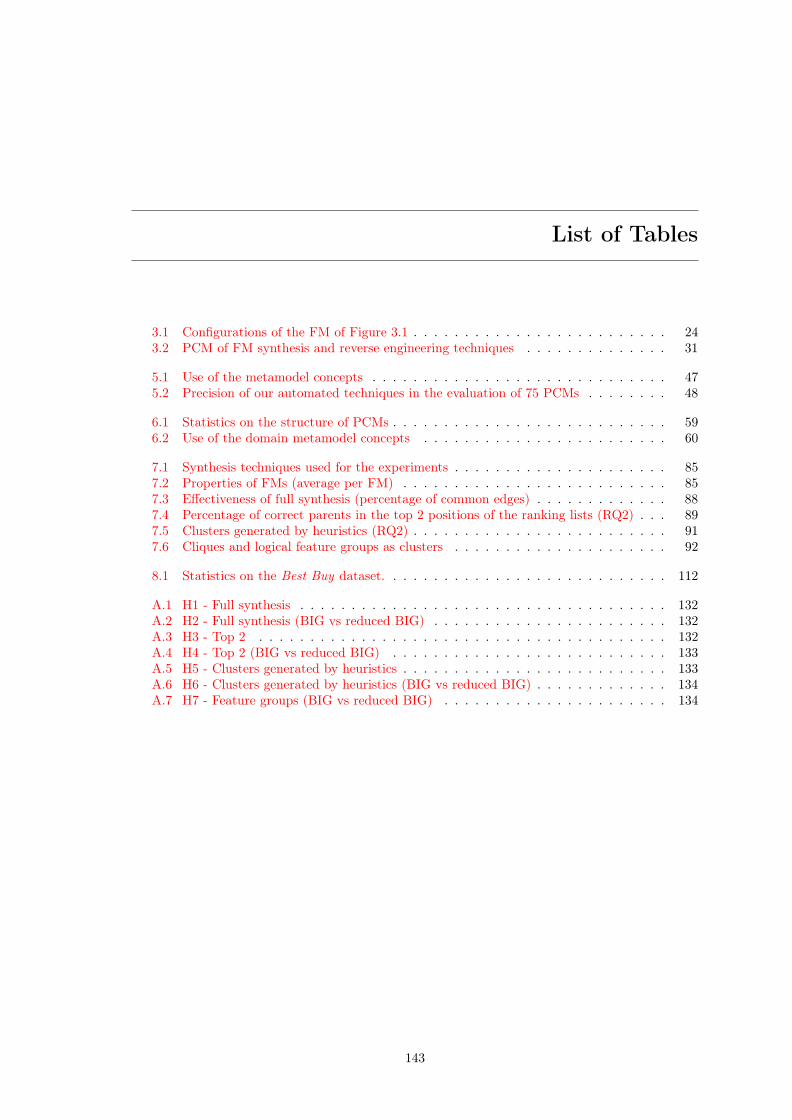
List of Tables
3.1 Configurations of the FM of Figure 3.1 . . . . . . . . . . . . . . . . . . . . . . . . . 243.2 PCM of FM synthesis and reverse engineering techniques . . . . . . . . . . . . . . 31
5.1 Use of the metamodel concepts . . . . . . . . . . . . . . . . . . . . . . . . . . . . . 475.2 Precision of our automated techniques in the evaluation of 75 PCMs . . . . . . . . 48
6.1 Statistics on the structure of PCMs . . . . . . . . . . . . . . . . . . . . . . . . . . . 596.2 Use of the domain metamodel concepts . . . . . . . . . . . . . . . . . . . . . . . . 60
7.1 Synthesis techniques used for the experiments . . . . . . . . . . . . . . . . . . . . . 857.2 Properties of FMs (average per FM) . . . . . . . . . . . . . . . . . . . . . . . . . . 857.3 Effectiveness of full synthesis (percentage of common edges) . . . . . . . . . . . . . 887.4 Percentage of correct parents in the top 2 positions of the ranking lists (RQ2) . . . 897.5 Clusters generated by heuristics (RQ2) . . . . . . . . . . . . . . . . . . . . . . . . . 917.6 Cliques and logical feature groups as clusters . . . . . . . . . . . . . . . . . . . . . 92
8.1 Statistics on the Best Buy dataset. . . . . . . . . . . . . . . . . . . . . . . . . . . . 112
A.1 H1 - Full synthesis . . . . . . . . . . . . . . . . . . . . . . . . . . . . . . . . . . . . 132A.2 H2 - Full synthesis (BIG vs reduced BIG) . . . . . . . . . . . . . . . . . . . . . . . 132A.3 H3 - Top 2 . . . . . . . . . . . . . . . . . . . . . . . . . . . . . . . . . . . . . . . . 132A.4 H4 - Top 2 (BIG vs reduced BIG) . . . . . . . . . . . . . . . . . . . . . . . . . . . 133A.5 H5 - Clusters generated by heuristics . . . . . . . . . . . . . . . . . . . . . . . . . . 133A.6 H6 - Clusters generated by heuristics (BIG vs reduced BIG) . . . . . . . . . . . . . 134A.7 H7 - Feature groups (BIG vs reduced BIG) . . . . . . . . . . . . . . . . . . . . . . 134
143


Author’s publications
[1] Mathieu Acher, Guillaume Bécan, Benoit Combemale, Benoit Baudry, and Jean-MarcJézéquel. Product lines can jeopardize their trade secrets. In Foundations of Software Engi-neering, pages 930–933, 2015.
[2] Guillaume Bécan, Mathieu Acher, Benoit Baudry, and Sana Ben Nasr. Breathing OntologicalKnowledge Into Feature Model Management. Rapport Technique RT-0441, INRIA, October2013.
[3] Guillaume Bécan, Mathieu Acher, Benoit Baudry, and Sana Ben Nasr. Breathing ontologicalknowledge into feature model synthesis: an empirical study. Empirical Software Engineering,pages 1–48, 2015.
[4] Guillaume Bécan, Mathieu Acher, Jean-Marc Jézéquel, and Thomas Menguy. On the vari-ability secrets of an online video generator. In Workshop on Variability Modelling of Software-intensive Systems, page 96, 2015.
[5] Guillaume Bécan, Razieh Behjati, Arnaud Gotlieb, and Mathieu Acher. Synthesis of attributedfeature models from product descriptions. In Software Product Line Conference, pages 1–10,2015.
[6] Guillaume Bécan, Razieh Behjati, Arnaud Gotlieb, and Mathieu Acher. Synthesis of attributedfeature models from product descriptions: Foundations. arXiv preprint arXiv:1502.04645,2015.
[7] Guillaume Bécan, Sana Ben Nasr, Mathieu Acher, and Benoit Baudry. Webfml: synthesizingfeature models everywhere. In Software Product Line Conference: Companion Volume forWorkshops, Demonstrations and Tools, pages 112–116, 2014.
[8] Guillaume Bécan, Sana Ben Nasr, and Benoit Baudry. An ontologic-aware feature modelingenvironment. In Journées lignes de produits, 2013.
[9] Guillaume Bécan, Nicolas Sannier, Mathieu Acher, Olivier Barais, Arnaud Blouin, and BenoitBaudry. Automating the formalization of product comparison matrices. In Automated softwareengineering, pages 433–444, 2014.
[10] Sana Ben Nasr, Guillaume Bécan, Mathieu Acher, João Bosco Ferreira Filho, Benoit Baudry,Nicolas Sannier, and Jean-Marc Davril. Matrixminer: a red pill to architect informal productdescriptions in the matrix. In Foundations of Software Engineering, pages 982–985, 2015.
[11] Jean-Marc Davril, Patrick Heymans, Guillaume Bécan, and Mathieu Acher. On breaking thecurse of dimensionality in reverse engineering feature models. In Configuration Workshop,volume 17, 2015.
[12] Nicolas Sannier, Guillaume Bécan, Mathieu Acher, Sana Ben Nasr, and Benoit Baudry. Com-paring or configuring products: Are we getting the right ones? In Workshop on VariabilityModelling of Software-Intensive Systems, page 9, 2014.
[13] Nicolas Sannier, Guillaume Bécan, Sana Ben Nasr, and Benoit Baudry. On product comparisonmatrices and variability models from a product comparison/configuration perspective. InJournées lignes de produits, 2013.
145

Bibliography
[14] Ebrahim Khalil Abbasi, Mathieu Acher, Patrick Heymans, and Anthony Cleve. Reverse engi-neering web configurators. In Software Maintenance, Reengineering and Reverse Engineering,pages 264–273, 2014.
[15] Robin Abraham and Martin Erwig. Type inference for spreadsheets. In Principles andpractice of declarative programming, pages 73–84, 2006.
[16] Robin Abraham and Martin Erwig. Ucheck: A spreadsheet type checker for end users.Journal of Visual Languages & Computing, 18(1):71–95, 2007.
[17] Robin Abraham, Martin Erwig, Steve Kollmansberger, and Ethan Seifert. Visual specifica-tions of correct spreadsheets. In 2005 IEEE Symposium on Visual Languages and Human-Centric Computing (VL/HCC’05), pages 189–196. IEEE, 2005.
[18] Mathieu Acher, Benoit Baudry, Patrick Heymans, Anthony Cleve, and Jean-Luc Hainaut.Support for reverse engineering and maintaining feature models. In Workshop on VariabilityModelling of Software-intensive Systems, page 20, 2013.
[19] Mathieu Acher, Anthony Cleve, Philippe Collet, Philippe Merle, Laurence Duchien, andPhilippe Lahire. Reverse engineering architectural feature models. In Software Architecture,pages 220–235. 2011.
[20] Mathieu Acher, Anthony Cleve, Philippe Collet, Philippe Merle, Laurence Duchien, andPhilippe Lahire. Extraction and evolution of architectural variability models in plugin-basedsystems. Software & Systems Modeling, 13(4):1367–1394, 2014.
[21] Mathieu Acher, Anthony Cleve, Gilles Perrouin, Patrick Heymans, Charles Vanbeneden,Philippe Collet, and Philippe Lahire. On extracting feature models from product descriptions.In Workshop on Variability Modeling of Software-Intensive Systems, pages 45–54, 2012.
[22] Mathieu Acher, Philippe Collet, Philippe Lahire, and Robert B France. Familiar: A domain-specific language for large scale management of feature models. Science of Computer Pro-gramming, 78(6):657–681, 2013.
[23] Mathieu Acher, Benoit Combemale, Philippe Collet, Olivier Barais, Philippe Lahire, andRobert B France. Composing your compositions of variability models. In Model-DrivenEngineering Languages and Systems, pages 352–369. 2013.
[24] Marco D Adelfio and Hanan Samet. Schema extraction for tabular data on the web. VLDBEndowment, 6(6):421–432, 2013.
[25] Alvin Ahnassay, Ebrahim Bagheri, and Dragan Gasevic. Empirical evaluation in softwareproduct line engineering. Technical report, Tech. Rep. TR-LS3-130084R4T, Laboratory forSystems, Software and Semantics, Ryerson University, 2013.
[26] Alfred V. Aho, Michael R Garey, and Jeffrey D. Ullman. The transitive reduction of adirected graph. SIAM Journal on Computing, 1(2):131–137, 1972.
[27] Algorithm of Haslinger et al. [101]. http://www.jku.at/sea/content/e139529/e126342/
e188736/.
147
148 BIBLIOGRAPHY
[28] Vander Alves, Christa Schwanninger, Luciano Barbosa, Awais Rashid, Peter Sawyer, PaulRayson, Christoph Pohl, and Andreas Rummler. An exploratory study of information re-trieval techniques in domain analysis. In Software Product Line Conference, pages 67–76,2008.
[29] Nele Andersen, Krzysztof Czarnecki, Steven She, and Andrzej Wąsowski. Efficient synthesisof feature models. In Software Product Line Conference, pages 106–115, 2012.
[30] Michal Antkiewicz, Thiago Tonelli Bartolomei, and Krzysztof Czarnecki. Automatic extrac-tion of framework-specific models from framework-based application code. In Automatedsoftware engineering, pages 214–223, 2007.
[31] Sven Apel, Don Batory, Christian Kästner, and Gunter Saake. Feature-Oriented SoftwareProduct Lines. Springer, 2013.
[32] Sven Apel and Christian Kästner. An overview of feature-oriented software development.Journal of Object Technology, 8(5):49–84, 2009.
[33] Sven Apel, Christian Kastner, and Christian Lengauer. Language-independent and auto-mated software composition: The featurehouse experience. Transactions on Software Engi-neering, 39(1):63–79, 2013.
[34] Sven Apel, Alexander von Rhein, Philipp Wendler, Armin Größlinger, and Dirk Beyer. Strate-gies for product-line verification: Case studies and experiments. In International Conferenceon Software Engineering, pages 482–491, 2013.
[35] Andrea Arcuri and Lionel Briand. A practical guide for using statistical tests to assessrandomized algorithms in software engineering. In International Conference on SoftwareEngineering, pages 1–10, 2011.
[36] Franz Baader and Werner Nutt. The description logic handbook. chapter Basic DescriptionLogics, pages 43–95. 2003.
[37] Ebrahim Bagheri, Faezeh Ensan, and Dragan Gasevic. Decision support for the softwareproduct line domain engineering lifecycle. Automated Software Engineering, 19(3):335–377,2012.
[38] Ebrahim Bagheri and Dragan Gasevic. Assessing the maintainability of software product linefeature models using structural metrics. Software Quality Journal, 19(3):579–612, 2011.
[39] Kacper Bąk, Krzysztof Czarnecki, and Andrzej Wąsowski. Feature and meta-models in clafer:mixed, specialized, and coupled. In Software Language Engineering, pages 102–122. 2011.
[40] Kacper Bąk, Dina Zayan, Krzysztof Czarnecki, Michał Antkiewicz, Zinovy Diskin, AndrzejWąsowski, and Derek Rayside. Example-driven modeling: model= abstractions+ examples.In International Conference on Software Engineering, pages 1273–1276, 2013.
[41] Don Batory. Feature modularity for product-lines. Tutorial at: OOPSLA, 6, 2006.
[42] Don Batory, David Benavides, and Antonio Ruiz-Cortes. Automated analysis of featuremodels: challenges ahead. Communications of the ACM, 49(12):45–47, 2006.
[43] David Benavides, Sergio Segura, and Antonio Ruiz-Cortés. Automated analysis of featuremodels 20 years later: A literature review. Information Systems, 35(6):615–636, 2010.
[44] David Benavides, Sergio Segura, Pablo Trinidad, and Antonio Ruiz Cortés. Fama: Tooling aframework for the automated analysis of feature models. Workshop on Variability Modellingof Software-Intensive Systems, 2007:01, 2007.
[45] Thorsten Berger, Divya Nair, Ralf Rublack, Joanne M Atlee, Krzysztof Czarnecki, and An-drzej Wąsowski. Three cases of feature-based variability modeling in industry. In Model-Driven Engineering Languages and Systems, pages 302–319. 2014.
149
[46] Thorsten Berger, Ralf Rublack, Divya Nair, Joanne M Atlee, Martin Becker, Krzysztof Czar-necki, and Andrzej Wąsowski. A survey of variability modeling in industrial practice. In In-ternational Workshop on Variability Modelling of Software-intensive Systems, page 7, 2013.
[47] Thorsten Berger, Steven She, Roberto Lotufo, Andrzej Wasowski, and Krzysztof Czarnecki. Astudy of variability models and languages in the systems software domain. IEEE Transactionson Software Engineering, 39(12):1611–1640, 2013.
[48] Quentin Boucher, Ebrahim Khalil Abbasi, Arnaud Hubaux, Gilles Perrouin, Mathieu Acher,and Patrick Heymans. Towards more reliable configurators: A re-engineering perspective. InWorkshop on Product Line Approaches in Software Engineering, pages 29–32, 2012.
[49] Alexander Budanitsky and Graeme Hirst. Evaluating wordnet-based measures of lexicalsemantic relatedness. Computational Linguistics, 32(1):13–47, 2006.
[50] Michael J Cafarella, Alon Halevy, Daisy Zhe Wang, Eugene Wu, and Yang Zhang. Webtables:exploring the power of tables on the web. VLDB Endowment, 1(1):538–549, 2008.
[51] Michael J Cafarella, Alon Y Halevy, Yang Zhang, Daisy Zhe Wang, and Eugene Wu. Uncov-ering the relational web. In WebDB, 2008.
[52] Paolo M Camerini, Luigi Fratta, and Francesco Maffioli. A note on finding optimum branch-ings. Networks, 9(4):309–312, 1979.
[53] Javier Canovas and Jordi Cabot. Discovering implicit schemas in json data. In InternationalConference on Web Engineering, 2013.
[54] Jessie Carbonnel, Marianne Huchard, and Alain Gutierrez. Variability representation inproduct lines using concept lattices: feasibility study with descriptions from wikipedia’sproduct comparison matrices. In International Conference on Formal Concept Analysis,page 16, 2015.
[55] José María Cavanillas, Edward Curry, and Wolfgang Wahlster. New horizons for a data-driven economy.
[56] Chris Chambers and Martin Erwig. Automatic detection of dimension errors in spreadsheets.Journal of Visual Languages & Computing, 20(4):269–283, 2009.
[57] Hsin-Hsi Chen, Shih-Chung Tsai, and Jin-He Tsai. Mining tables from large scale html texts.In Computational linguistics, pages 166–172, 2000.
[58] Kun Chen, Wei Zhang, Haiyan Zhao, and Hong Mei. An approach to constructing fea-ture models based on requirements clustering. In International Conference on RequirementsEngineering, pages 31–40, 2005.
[59] Tsong Yueh Chen, Tsun Him Tse, and Z Quan Zhou. Fault-based testing without the needof oracles. Information and Software Technology, 45(1):1–9, 2003.
[60] Andreas Classen, Quentin Boucher, and Patrick Heymans. A text-based approach to featuremodelling: Syntax and semantics of tvl. Science of Computer Programming, 76(12):1130–1143, 2011.
[61] Andreas Classen, Patrick Heymans, and Pierre-Yves Schobbens. What’s in a feature: A re-quirements engineering perspective. In International Conference on Fundamental Approachesto Software Engineering, pages 16–30. Springer, 2008.
[62] Andreas Classen, Patrick Heymans, Pierre-Yves Schobbens, and Axel Legay. Symbolic modelchecking of software product lines. In International Conference on Software Engineering,pages 321–330, 2011.
150 BIBLIOGRAPHY
[63] Andreas Classen, Patrick Heymans, Pierre-Yves Schobbens, Axel Legay, and Jean-FrançoisRaskin. Model checking lots of systems: efficient verification of temporal properties in soft-ware product lines. In International Conference on Software Engineering, pages 335–344,2010.
[64] Edgar F Codd. A relational model of data for large shared data banks. Communications ofthe ACM, 13(6):377–387, 1970.
[65] Comparison of Web Conferencing Software. https://en.wikipedia.org/wiki/
Comparison_of_web_conferencing_software.
[66] Maxime Cordy, Pierre-Yves Schobbens, Patrick Heymans, and Axel Legay. Beyond booleanproduct-line model checking: dealing with feature attributes and multi-features. In Interna-tional Conference on Software Engineering, pages 472–481, 2013.
[67] Jesús Sánchez Cuadrado, Juan de Lara, and Esther Guerra. Bottom-up meta-modelling:An interactive approach. In Model Driven Engineering Languages and Systems, pages 3–19,2012.
[68] Jácome Cunha, Martin Erwig, and Joao Saraiva. Automatically inferring classsheet modelsfrom spreadsheets. In Visual Languages and Human-Centric Computing, pages 93–100, 2010.
[69] Jácome Cunha, João P Fernandes, Hugo Ribeiro, and João Saraiva. Towards a catalog ofspreadsheet smells. In Computational Science and Its Applications, pages 202–216. Springer,2012.
[70] Jácome Cunha, João Paulo Fernandes, Jorge Mendes, and João Saraiva. Mdsheet: A frame-work for model-driven spreadsheet engineering. In International Conference on SoftwareEngineering, pages 1395–1398, 2012.
[71] Krzysztof Czarnecki, Thomas Bednasch, Peter Unger, and Ulrich Eisenecker. Generativeprogramming for embedded software: An industrial experience report. In Generative Pro-gramming and Component Engineering, pages 156–172. Springer, 2002.
[72] Krzysztof Czarnecki and Ulrich Eisenecker. Generative Programming: Methods, Tools, andApplications. 2000.
[73] Krzysztof Czarnecki, Simon Helsen, and Ulrich Eisenecker. Staged configuration using featuremodels. In Software Product Lines, pages 266–283. 2004.
[74] Krzysztof Czarnecki, Simon Helsen, and Ulrich Eisenecker. Formalizing cardinality-basedfeature models and their specialization. Software process: Improvement and practice, 10(1):7–29, 2005.
[75] Krzysztof Czarnecki, Chang Hwan, Peter Kim, and KT Kalleberg. Feature models are viewson ontologies. In Software Product Line Conference, pages 41–51, 2006.
[76] Krzysztof Czarnecki and Krzysztof Pietroszek. Verifying feature-based model templatesagainst well-formedness ocl constraints. In Generative programming and component engi-neering, pages 211–220, 2006.
[77] Krzysztof Czarnecki, Steven She, and Andrzej Wa Sowski. Sample spaces and feature models:There and back again. In Software Product Line Conference, pages 22–31, 2008.
[78] Krzysztof Czarnecki and Andrzej Wasowski. Feature diagrams and logics: There and backagain. In Software Product Line Conference, pages 23–34, 2007.
[79] Anish Das Sarma, Lujun Fang, Nitin Gupta, Alon Halevy, Hongrae Lee, Fei Wu, ReynoldXin, and Cong Yu. Finding related tables. In International Conference on Management ofData, pages 817–828, 2012.

151
[80] Jean-Marc Davril, Edouard Delfosse, Negar Hariri, Mathieu Acher, Jane Cleland-Huang,and Patrick Heymans. Feature model extraction from large collections of informal productdescriptions. In Foundations of Software Engineering, pages 290–300, 2013.
[81] Christian Dietrich, Reinhard Tartler, Wolfgang Schröder-Preikschat, and Daniel Lohmann.A robust approach for variability extraction from the linux build system. In Software ProductLine Conference, pages 21–30, 2012.
[82] Documentation of the visual editor of MediaWiki. https://www.mediawiki.org/wiki/
VisualEditor/Portal.
[83] Susan T Dumais, George W Furnas, Thomas K Landauer, Scott Deerwester, and RichardHarshman. Using latent semantic analysis to improve access to textual information. InHuman factors in computing systems, pages 281–285, 1988.
[84] Holger Eichelberger and Klaus Schmid. Mapping the design-space of textual variability mod-eling languages: a refined analysis. International Journal on Software Tools for TechnologyTransfer, pages 1–26, 2014.
[85] David W Embley, Matthew Hurst, Daniel Lopresti, and George Nagy. Table-processingparadigms: a research survey. International Journal of Document Analysis and Recognition,8(2-3):66–86, 2006.
[86] Gregor Engels and Martin Erwig. Classsheets: automatic generation of spreadsheet applica-tions from object-oriented specifications. In Automated software engineering, pages 124–133,2005.
[87] FAMILIAR: FeAture Model scrIpt Language for manIpulation and Automatic Reasonning.http://nyx.unice.fr/projects/familiar/.
[88] Martin Faunes, Juan Cadavid, Benoit Baudry, Houari Sahraoui, and Benoit Combemale. Au-tomatically searching for metamodel well-formedness rules in examples and counter-examples.In Model-Driven Engineering Languages and Systems, pages 187–202. 2013.
[89] Alessio Ferrari, Giorgio O Spagnolo, and Felice Dell’Orletta. Mining commonalities andvariabilities from natural language documents. In Software Product Line Conference, pages116–120, 2013.
[90] Marc Fisher and Gregg Rothermel. The euses spreadsheet corpus: a shared resource forsupporting experimentation with spreadsheet dependability mechanisms. In ACM SIGSOFTSoftware Engineering Notes, volume 30, pages 1–5. ACM, 2005.
[91] Martin Fowler. Refactoring: Improving the design of existing code. In 11th European Con-ference. Jyväskylä, Finland, 1997.
[92] Robert France, Indrakshi Ray, Geri Georg, and Sudipto Ghosh. Aspect-oriented approach toearly design modelling. In IEE Proceedings-Software, volume 151, pages 173–185, 2004.
[93] Robert France and Bernhard Rumpe. Model-driven development of complex software: Aresearch roadmap. In Future of Software Engineering, pages 37–54, 2007.
[94] Martinš Francis, Dimitrios S Kolovos, Nicholas Matragkas, and Richard F Paige. Addingspreadsheets to the mde toolkit. In Model-Driven Engineering Languages and Systems, pages35–51. 2013.
[95] Wolfgang Gatterbauer, Paul Bohunsky, Marcus Herzog, Bernhard Krüpl, and Bernhard Pol-lak. Towards domain-independent information extraction from web tables. In World WideWeb, pages 71–80, 2007.
[96] Thomas R Gruber. Toward principles for the design of ontologies used for knowledge sharing.International journal of human-computer studies, 43(5):907–928, 1995.
152 BIBLIOGRAPHY
[97] Tom Gruber, In Ling Liu Ontology, and M Tamer Özsu. Encyclopedia of database systems.Ontology, 2009.
[98] Jianmei Guo, Edward Zulkoski, Rafael Olaechea, Derek Rayside, Krzysztof Czarnecki, SvenApel, and Joanne M Atlee. Scaling exact multi-objective combinatorial optimization byparallelization. In Automated software engineering, pages 409–420, 2014.
[99] Negar Hariri, Carlos Castro-Herrera, Mehdi Mirakhorli, Jane Cleland-Huang, and BamshadMobasher. Supporting domain analysis through mining and recommending features fromonline product listings. Transactions on Software Engineering, 39(12):1736–1752, 2013.
[100] Evelyn Nicole Haslinger, Roberto E Lopez-Herrejon, and Alexander Egyed. Reverse en-gineering feature models from programs’ feature sets. In Working Conference on ReverseEngineering, pages 308–312, 2011.
[101] Evelyn Nicole Haslinger, Roberto Erick Lopez-Herrejon, and Alexander Egyed. On extract-ing feature models from sets of valid feature combinations. In Fundamental Approaches toSoftware Engineering, pages 53–67. 2013.
[102] Florian Heidenreich, Pablo Sánchez, Joao Santos, Steffen Zschaler, Mauricio Alférez, JoaoAraujo, Lidia Fuentes, Uirá Kulesza, Ana Moreira, and Awais Rashid. Relating featuremodels to other models of a software product line. In Transactions on aspect-oriented softwaredevelopment, pages 69–114. 2010.
[103] David G Hendry and Thomas RG Green. Creating, comprehending and explaining spread-sheets: a cognitive interpretation of what discretionary users think of the spreadsheet model.International Journal of Human-Computer Studies, 40(6):1033–1065, 1994.
[104] Felienne Hermans, Martin Pinzger, and Arie van Deursen. Detecting and visualizing inter-worksheet smells in spreadsheets. In International Conference on Software Engineering, pages441–451, 2012.
[105] Felienne Hermans, Martin Pinzger, and Arie Van Deursen. Domain-specific languages inpractice: A user study on the success factors. Springer, 2009.
[106] Felienne Hermans, Martin Pinzger, and Arie van Deursen. Automatically extracting classdiagrams from spreadsheets. In ECOOP, pages 52–75. 2010.
[107] Felienne Hermans, Martin Pinzger, and Arie Van Deursen. Supporting professional spread-sheet users by generating leveled dataflow diagrams. In International Conference on SoftwareEngineering, pages 451–460, 2011.
[108] Marijn JH Heule, Matti Järvisalo, and Armin Biere. Efficient cnf simplification based onbinary implication graphs. In Theory and Applications of Satisfiability Testing, pages 201–215. 2011.
[109] A. Hubaux, M. Acher, T. T. Tun, P. Heymans, P. Collet, and P. Lahire. Domain Engineering:Product Lines, Conceptual Models, and Languages, chapter Separating Concerns in FeatureModels: Retrospective and Multi-View Support. Springer, 2013.
[110] Arnaud Hubaux, Thein Than Tun, and Patrick Heymans. Separation of concerns in featurediagram languages: A systematic survey. ACM Computing Surveys, 45(4):51, 2013.
[111] Matthew Hurst. Layout and language: Challenges for table understanding on the web. InInternational Workshop on Web Document Analysis, pages 27–30, 2001.
[112] Matthew Francis Hurst. The interpretation of tables in texts. 2000.
[113] Javier Luis Cánovas Izquierdo and Jordi Cabot. Enabling the collaborative definition ofdsmls. In Advanced Information Systems Engineering, pages 272–287, 2013.

153
[114] Aleksandar Jakšić, Robert B France, Philippe Collet, and Sudipto Ghosh. Evaluating theusability of a visual feature modeling notation. In International Conference on SoftwareLanguage Engineering, pages 122–140. Springer, 2014.
[115] Mikoláš Janota, Victoria Kuzina, and Andrzej Wąsowski. Model construction with externalconstraints: An interactive journey from semantics to syntax. In Model Driven EngineeringLanguages and Systems, pages 431–445. 2008.
[116] Faizan Javed, Marjan Mernik, Jeff Gray, and Barrett R Bryant. Mars: A metamodel recoverysystem using grammar inference. Information and Software Technology, 50(9):948–968, 2008.
[117] Kyo C Kang, Sholom G Cohen, James A Hess, William E Novak, and A Spencer Peterson.Feature-oriented domain analysis (foda) feasibility study. Technical report, DTIC Document,1990.
[118] Kyo C Kang, Jaejoon Lee, and Patrick Donohoe. Feature-oriented product line engineering.IEEE software, (4):58–65, 2002.
[119] Gabor Karsai, Holger Krahn, Class Pinkernell, Bernhard Rumpe, Martin Schneider, andSteven Völkel. Design guidelines for domain specific languages. In Matti Rossi, JonathanSprinkle, Jeff Gray, and Juha-Pekka Tolvanen, editors, OOPSLA Workshop on Domain-Specific Modeling, pages 7–13, 2009.
[120] Christian Kastner, Alexander Dreiling, and Klaus Ostermann. Variability mining: Consistentsemi-automatic detection of product-line features. Transactions on Software Engineering,40(1):67–82, 2014.
[121] Steven Kelly and Risto Pohjonen. Worst practices for domain-specific modeling. IEEESoftware, 26(4):22–29, 2009.
[122] Charles W Krueger. Biglever software gears and the 3-tiered spl methodology. In Object-oriented programming systems and applications companion, pages 844–845, 2007.
[123] Filippo Lanubile, Christof Ebert, Rafael Prikladnicki, and Aurora Vizcaíno. Collaborationtools for global software engineering. IEEE software, (2):52–55, 2010.
[124] Jesús J López-Fernández, Jesús Sánchez Cuadrado, Esther Guerra, and Juan de Lara.Example-driven meta-model development. Software & Systems Modeling, pages 1–25, 2013.
[125] Roberto E Lopez-Herrejon, Lukas Linsbauer, José A Galindo, José A Parejo, David Bena-vides, Sergio Segura, and Alexander Egyed. An assessment of search-based techniques forreverse engineering feature models. Journal of Systems and Software, 103:353–369, 2015.
[126] Roberto Erick Lopez-Herrejon, José A Galindo, David Benavides, Sergio Segura, and Alexan-der Egyed. Reverse engineering feature models with evolutionary algorithms: An exploratorystudy. In Search Based Software Engineering, pages 168–182. 2012.
[127] Daniel Lopresti and George Nagy. A tabular survey of automated table processing. InGraphics Recognition Recent Advances, pages 93–120. 1999.
[128] James MacQueen et al. Some methods for classification and analysis of multivariate obser-vations. In Berkeley symposium on mathematical statistics and probability, volume 1, pages281–297, 1967.
[129] Olena Medelyan, David Milne, Catherine Legg, and Ian H Witten. Mining meaning fromwikipedia. International Journal of Human-Computer Studies, 67(9):716–754, 2009.
[130] MediaWiki documentation on tables. https://www.mediawiki.org/wiki/Help:Tables.
[131] Marcilio Mendonca, Moises Branco, and Donald Cowan. Splot: software product lines onlinetools. In Object oriented programming systems languages and applications, pages 761–762,2009.

154 BIBLIOGRAPHY
[132] Marcilio Mendonca, Andrzej Wąsowski, and Krzysztof Czarnecki. Sat-based analysis offeature models is easy. In Software Product Line Conference, pages 231–240, 2009.
[133] Andreas Metzger, Klaus Pohl, Patrick Heymans, Pierre-Yves Schobbens, and Germain Saval.Disambiguating the documentation of variability in software product lines: A separation ofconcerns, formalization and automated analysis. In Requirements Engineering Conference,pages 243–253, 2007.
[134] George A Miller. Wordnet: a lexical database for english. Communications of the ACM,38(11):39–41, 1995.
[135] David Milne. Computing semantic relatedness using wikipedia link structure. In New zealandcomputer science research student conference, 2007.
[136] David Milne and Ian H Witten. An open-source toolkit for mining wikipedia. ArtificialIntelligence, 194:222–239, 2013.
[137] Pierre-Alain Muller, Frédéric Fondement, Benoit Baudry, and Benoît Combemale. Modelingmodeling modeling. Software & Systems Modeling, 11(3):347–359, 2012.
[138] Alexandr Murashkin, Michał Antkiewicz, Derek Rayside, and Krzysztof Czarnecki. Visual-ization and exploration of optimal variants in product line engineering. In Software ProductLine Conference, pages 111–115, 2013.
[139] Sarah Nadi, Thorsten Berger, Christian Kästner, and Krzysztof Czarnecki. Mining config-uration constraints: Static analyses and empirical results. In International Conference onSoftware Engineering, pages 140–151, 2014.
[140] Sarah Nadi and Ric Holt. The linux kernel: A case study of build system variability. Journalof Software: Evolution and Process, 26(8):730–746, 2014.
[141] Nan Niu and Steve Easterbrook. Concept analysis for product line requirements. In Aspect-oriented software development, pages 137–148, 2009.
[142] Open Knowledge Foundation. https://okfn.org/opendata/.
[143] Raymond R Panko. Thinking is bad: Implications of human error research for spreadsheetresearch and practice. arXiv preprint arXiv:0801.3114, 2008.
[144] Andreas Pleuss and Goetz Botterweck. Visualization of variability and configuration options.International Journal on Software Tools for Technology Transfer, 14(5):497–510, 2012.
[145] Klaus Pohl, Günter Böckle, and Frank J van der Linden. Software product line engineering:foundations, principles and techniques. Springer Science & Business Media, 2005.
[146] Randolf Pohl, Vanessa Stricker, and Klaus Pohl. Measuring the structural complexity offeature models. In Automated Software Engineering, pages 454–464, 2013.
[147] Richard Pohl, Kim Lauenroth, and Klaus Pohl. A performance comparison of contemporaryalgorithmic approaches for automated analysis operations on feature models. In AutomatedSoftware Engineering, pages 313–322, 2011.
[148] pure::variants. http://www.pure-systems.com/pure_variants.49.0.html.
[149] Clément Quinton, Andreas Pleuss, Daniel Le Berre, Laurence Duchien, and Goetz Botter-weck. Consistency checking for the evolution of cardinality-based feature models. In Proceed-ings of the 18th International Software Product Line Conference-Volume 1, pages 122–131.ACM, 2014.
[150] Clément Quinton, Daniel Romero, and Laurence Duchien. Cardinality-based feature modelswith constraints: a pragmatic approach. In Proceedings of the 17th International SoftwareProduct Line Conference, pages 162–166. ACM, 2013.
155
[151] Ariel Rabkin and Randy Katz. Static extraction of program configuration options. In Inter-national Conference on Software Engineering, pages 131–140, 2011.
[152] Alberto Rodrigues da Silva. Model-driven engineering. Computer Languages, Systems andStructures, 43(C):139–155, 2015.
[153] J Rubin and M Chechik. Domain engineering: Product lines, conceptual models, and lan-guages, chap. a survey of feature location techniques, 2013.
[154] Julia Rubin and Marsha Chechik. Locating distinguishing features using diff sets. In Auto-mated Software Engineering, pages 242–245, 2012.
[155] Uwe Ryssel, Joern Ploennigs, and Klaus Kabitzsch. Extraction of feature models from formalcontexts. In Software Product Line Conference, page 4, 2011.
[156] Nicolas Sannier, Mathieu Acher, and Benoit Baudry. From comparison matrix to variabilitymodel: The wikipedia case study. In Automated Software Engineering, pages 580–585, 2013.
[157] Abdel Salam Sayyad, Tim Menzies, and Hany Ammar. On the value of user preferences insearch-based software engineering: a case study in software product lines. In InternationalConference on Software engineering, pages 492–501, 2013.
[158] Klaus Schmid, Rick Rabiser, and Paul Grünbacher. A comparison of decision modelingapproaches in product lines. In Workshop on Variability Modeling of Software-IntensiveSystems, pages 119–126, 2011.
[159] Douglas C Schmidt. Model-driven engineering. IEEE computer society, 39(2):25, 2006.
[160] Pierre-Yves Schobbens, Patrick Heymans, Jean-Christophe Trigaux, and Yves Bontemps.Generic semantics of feature diagrams. Computer Networks, 51(2):456–479, 2007.
[161] Christoph Seidl, Ina Schaefer, and Uwe Assmann. Capturing variability in space and timewith hyper feature models. In Workshop on Variability Modelling of Software-Intensive Sys-tems, page 6, 2014.
[162] Steven She. Feature Model Synthesis. PhD thesis, University of Waterloo, 2013.
[163] Steven She, Krzysztof Czarnecki, and Andrzej Wąsowski. Usage scenarios for feature modelsynthesis. In VARiability for You Workshop: Variability Modeling Made Useful for Everyone,pages 15–20, 2012.
[164] Steven She, Rafael Lotufo, Thorsten Berger, Andrzej Wasowski, and Krzysztof Czarnecki.The variability model of the linux kernel. VaMoS, 10:45–51, 2010.
[165] Steven She, Rafael Lotufo, Thorsten Berger, Andrzej Wøsowski, and Krzysztof Czarnecki.Reverse engineering feature models. In International Conference on Software Engineering,pages 461–470, 2011.
[166] Steven She, Uwe Ryssel, Nele Andersen, Andrzej Wąsowski, and Krzysztof Czarnecki. Ef-ficient synthesis of feature models. Information and Software Technology, 56(9):1122–1143,2014.
[167] Alexey O Shigarov. Table understanding using a rule engine. Expert Systems with Applica-tions, 42(2):929–937, 2015.
[168] Temple F Smith and Michael S Waterman. Identification of common molecular subsequences.Journal of molecular biology, 147(1):195–197, 1981.
[169] SPLOT: Software Product Line Online Tools. http://www.splot-research.org/.
[170] Robert Endre Tarjan. Finding optimum branchings. Networks, 7(1):25–35, 1977.

156 BIBLIOGRAPHY
[171] Sahil Thaker, Don Batory, David Kitchin, and William Cook. Safe composition of productlines. In Generative programming and component engineering, pages 95–104, 2007.
[172] Thomas Thüm, Sven Apel, Christian Kästner, Ina Schaefer, and Gunter Saake. A classifica-tion and survey of analysis strategies for software product lines. ACM Computing Surveys,47(1):6, 2014.
[173] Thomas Thüm, Don Batory, and Christian Kästner. Reasoning about edits to feature models.In International Conference on Software Engineering, pages 254–264, 2009.
[174] Thomas Thüm, Christian Kästner, Fabian Benduhn, Jens Meinicke, Gunter Saake, andThomas Leich. Featureide: An extensible framework for feature-oriented software devel-opment. Science of Computer Programming, 79:70–85, 2014.
[175] Yuri A Tijerino, David W Embley, Deryle W Lonsdale, Yihong Ding, and George Nagy.Towards ontology generation from tables. World Wide Web, 8(3):261–285, 2005.
[176] Etsuji Tomita, Akira Tanaka, and Haruhisa Takahashi. The worst-case time complexityfor generating all maximal cliques and computational experiments. Theoretical ComputerScience, 363(1):28–42, 2006.
[177] Edoardo Vacchi, Walter Cazzola, Benoit Combemale, and Mathieu Acher. Automating vari-ability model inference for component-based language implementations. In Software ProductLine Conference, pages 167–176, 2014.
[178] Marco Tulio Valente, Virgilio Borges, and Leonardo Passos. A semi-automatic approachfor extracting software product lines. Transactions on Software Engineering, 38(4):737–754,2012.
[179] Markus Voelter, Sebastian Benz, Christian Dietrich, Birgit Engelmann, Mats Helander,Lennart C. L. Kats, Eelco Visser, and Guido Wachsmuth. DSL Engineering - Designing,Implementing and Using Domain-Specific Languages. dslbook.org, 2013.
[180] Markus Voelter, Sebastian Benz, Christian Dietrich, Birgit Engelmann, Mats Helander,Lennart CL Kats, Eelco Visser, and Guido Wachsmuth. DSL engineering: Designing, imple-menting and using domain-specific languages. dslbook. org, 2013.
[181] Alexander von Rhein, Alexander Grebhahn, Sven Apel, Norbert Siegmund, Dirk Beyer, andThorsten Berger. Presence-condition simplification in highly configurable systems. In Inter-national Conference Software Engineering, 2015.
[182] Robert A Wagner and Michael J Fischer. The string-to-string correction problem. Journalof the ACM, 21(1):168–173, 1974.
[183] Jingjing Wang, Haixun Wang, Zhongyuan Wang, and Kenny Q Zhu. Understanding tableson the web. In Conceptual Modeling, pages 141–155. 2012.
[184] Xinxin Wang and Derick Wood. Tabular abstraction, editing, and formatting. Citeseer, 1996.
[185] Yalin Wang and Jianying Hu. A machine learning based approach for table detection on theweb. In World Wide Web, pages 242–250, 2002.
[186] David M. Weiss and Chi Tau Robert Lai. Software Product-line Engineering: A Family-basedSoftware Development Process. Addison-Wesley Longman Publishing Co., Inc., Boston, MA,USA, 1999.
[187] Nathan Weston, Ruzanna Chitchyan, and Awais Rashid. A framework for constructingsemantically composable feature models from natural language requirements. In SoftwareProduct Line Conference, pages 211–220, 2009.
[188] Wikipedia documentation on tools to ease the work of contributors. http://en.wikipedia.org/wiki/Wikipedia:Tools.

157
[189] Zhibiao Wu and Martha Palmer. Verbs semantics and lexical selection. In Annual meetingon Association for Computational Linguistics, pages 133–138, 1994.
[190] Ora Wulf-Hadash and Iris Reinhartz-Berger. Cross product line analysis. In Workshop onVariability Modelling of Software-Intensive Systems, 2013.
[191] Li Yi, Wei Zhang, Haiyan Zhao, Zhi Jin, and Hong Mei. Mining binary constraints in theconstruction of feature models. In Requirements Engineering Conference, pages 141–150,2012.
[192] R Zanibbi, D Blostein, and JR Cordy. A survey of table recognition: Models, observations,transformations, and inferences. International Journal of Document Analysis and Recogni-tion, 7:1–16, 2003.

158 BIBLIOGRAPHY
Bref. J’ai fait une thèse.