concentration and characteristics of depleted uranium in water, air and biological samples collected...
TRANSCRIPT

ARTICLE IN PRESS
0969-8043/$ - se
doi:10.1016/j.ap
�Correspond+39 065007328
E-mail addr
Applied Radiation and Isotopes 63 (2005) 381–399
www.elsevier.com/locate/apradiso
Concentration and characteristics of depleted uraniumin water, air and biological samples collected
in Serbia and Montenegro
Guogang Jia�, Maria Belli, Umberto Sansone, Silvia Rosamilia, Stefania Gaudino
Italian Environmental Protection Agency and Technical Services, Via V. Brancati 48, 00144 Roma, Italy
Received 1 February 2005; received in revised form 18 May 2005; accepted 18 May 2005
Abstract
During the Balkan conflicts, in 1995 and 1999, depleted uranium (DU) rounds were employed and were left in the
battlefield. Health concern is related to the risk arising from contamination of the environment with DU penetrators
and dust. In order to evaluate the impact of DU on the environment and population in Serbia and Montenegro,
radiological surveys of DU in water, air and biological samples were carried out over the period 27 October–5
November 2001. The uranium isotopic concentrations in biological samples collected in Serbia and Montenegro, mainly
lichens and barks, were found to be in the range of 0.67–704Bqkg�1 for 238U, 0.48–93.9 Bq kg�1 for 234U and
0.02–12.2Bq kg�1 for 235U, showing uranium levels to be higher than in the samples collected at the control sites.
Moreover, 236U was detectable in some of the samples. The isotopic ratios of 234U/238U showed DU to be detectable in
many biological samples at all examined sites, especially in Montenegro, indicating widespread ground-surface DU
contamination, albeit at very low level. The uranium isotopic concentrations in air obtained from the air filter samples
collected in Serbia and Montenegro were found to be in the range of 1.99–42.1 mBqm�3 for 238U, 0.96–38.0mBqm�3 for234U, and 0.05–1.83 mBqm�3 for 235U, being in the typical range of natural uranium values. Thus said, most of the air
samples are DU positive, this fact agreeing well with the widespread DU contamination detected in the biological
samples. The uranium concentrations in water samples collected in Serbia and Montenegro were found to be in the
range of 0.40–21.9mBq l�1 for 238U, 0.27–28.1mBq l�1 for 234U, and 0.01–0.88mBq l�1 for 235U, these values being
much lower than those in mineral water found in central Italy and below the WHO guideline for drinking water. From a
radiotoxicological point of view, at this moment there is no significant radiological risk related to these investigated sites
in terms of possible DU contamination of water, air and/or plants.
r 2005 Elsevier Ltd. All rights reserved.
Keywords: 238U; 234U; 235U; 236U; Water; Air; Lichen; Alpha-spectrometry
e front matter r 2005 Elsevier Ltd. All rights reserve
radiso.2005.05.042
ing author. Tel.: +390650073219;
7.
ess: [email protected] (G. Jia).
1. Introduction
Depleted uranium (DU) is the by-product of the
nuclear industrial process that is used to enrich natural
uranium ore for use in nuclear reactors and nuclear
weapons. It is estimated that at present, approximately
6� 105 tons of DU have been amassed in the USA
d.

ARTICLE IN PRESSG. Jia et al. / Applied Radiation and Isotopes 63 (2005) 381–399382
alone. DU is an extremely dense (19.05 g cm�3), hard,
autopyrophoric, relatively cheap metal, making it ideal
for military application in armour piercing munitions
and enhanced armour protection. DU was first exten-
sively used by US Forces during the Gulf War in
Operation Desert Storm in 1991, and then in the Balkan
conflicts during 1995–1999. It has been reported that as
a result of military use, the inventory of DU dispersed
into the environment was about 320 tons in Iraq and
Kuwait during the Gulf War in 1991, about 3 tons in
Bosnia and Herzegovina in 1995, about 1 ton in Serbia
and Montenegro and about 11 tons in Kosovo in 1999
(Hamilton, 2001; Bleise et al., 2003). Most recently,
during the Iraq War in March and April 2003,430 tonsof DU was released into the environment. DU is a
radioactive heavy metal that emits ionizing radiation of
three types: alpha, beta and gamma, due to the decay of
the radionuclides in the parent material, the various
progeny and fission and/or activation products. En-
hanced public awareness with regard to the health
hazard arising from exposure to ionizing radiation in the
environment contaminated by DU has lead to increased
efforts by the scientific community to assess the true
effects of DU usage. In particular, the military use of
DU has been a subject of considerable concern in the
field of radiation protection, environmental protection
and radioecology over the past fifteen years. As such, the
United Nations Environment Programme (UNEP) has
organized several missions, with participation from
experts from inter-governmental agencies, well-known
institutions and other interested parties, to conduct an
overall assessment of the consequences of DU, post-
conflict, on the environment and human settlements.
Following the Balkan conflict in 1999, during the
period 5–19 November 2000, the Italian Environmental
Protection Agency (ANPA) participated in the field
mission to Kosovo. During the mission, water, vegeta-
tion, soil and smear samples were collected, the relevant
data being published elsewhere (Sansone et al., 2001;
UNEP, 2001; Jia et al., 2004a). Although DU has about
60% of the radioactivity of the natural uranium for an
equal mass of substance (Cantaluppi and Degeto, 2000),
elevated uranium activity concentrations have been
observed in most of the surface soil samples and all of
the biological samples collected in Kosovo. In some
soils, elevations of even seven thousand times higher
than the background uranium level have been observed.
Subsequently, during the period 27 October–5 Novem-
ber 2001, the ANPA participated in the UNEP-
coordinated field mission to Serbia and Montenegro
(UNEP, 2002). During the mission, collection was
primarily made of water, air [collected by the Greek
Atomic Energy Commission (GAEC) and analysed by
ANPA] and biological matrices (lichen, bark, etc.). In
this current paper, the uranium activity concentrations
in the collected samples are reported in detail, compar-
ison being made with samples uncontaminated by DU,
collected at control sites in Italy. These data are of
interest, serving as basic information for the particular
affected sites, the quantity and quality of DU used in the
conflict, and evaluation of the potential effects of DU on
human health and/or the environment.
2. Materials and methods
2.1. Apparatus and reagents
The uranium sources were counted by alpha-spectro-
metry (Model 7401 with passivated implanted planar
silicon detector and Genie-2000 spectroscopy system,
Canberra, USA) with a counting efficiency of 31.2% and
a background of p2� 10�6 s�1 in the energy region ofinterest. The electrodeposition apparatus (model
PL320QMD; Thurlby Thandar Instruments Ltd., Eng-
land) was used to accumulate uranium in Perspex cells
of 25mm internal diameter on stainless-steel disks of
20mm diameter in the medium of 0.025M di-ammo-
nium oxalate (Jia et al., 2002, 2004b). Chromatographic
columns were 150mm long and 9mm internal diameter.
Standard solutions of 232U and/or 236U, Microthene
(microporous polyethylene, 60–140 mesh), and tri-octyl-
phosphine oxide (TOPO, 99%) were supplied by
Amersham (G. B.), Ashland (Italy), and Fluka (Switzer-
land) respectively. FeCl3 was used to prepare the carrier
solution for uranium separation in water samples and all
other reagents were analytical grade (Merck, Germany).
2.2. Column preparation
A solution (50ml) of 0.3M TOPO in cyclohexane was
added to 50 g of Microthene; the mixture was stirred for
several minutes until homogeneous and was then
evaporated to eliminate cyclohexane at 50 1C. The
porous powder thus obtained contained about 10.4%
TOPO. A portion (1.6 g) of the Microthene-TOPO
powder, mixed with 3ml concentrated HCl and some
water, was transferred to a chromatographic column;
after conditioning with 30ml of 2M HNO3, the column
was ready for use.
2.3. Sampling sites
The criteria for selecting the sampling sites were that:
(1) they should be locations for which the approximate
number of DU rounds was known; (2) they should
represent a range of environmental conditions and
properties, and; (3) the areas to be examined should be
safe from mines and unexploded ordnance. In fact, since
the end of the Kosovo military conflict great efforts have
been made by Serbian and Montenegrin authorities and
experts to localize, measure and remove contamination

ARTICLE IN PRESSG. Jia et al. / Applied Radiation and Isotopes 63 (2005) 381–399 383
from DU and DU penetrators on ground. Eleven
contaminated sites in Serbia had been surveyed up to
October 2001 and, of these, five including Pljackovica,
Borovac, Bratoselce, Bukurevac, Reljan, were investi-
gated by the UNEP team. In Montenegro, one site
(Cape Arza) partly surveyed by Montenegrin experts
was also investigated by the UNEP team. The sampling
code, date and geographical coordinates (UTM) are
shown in Tables 1–3.
2.4. Sampling and sample preparation
In order to search for the presence of DU in botanical
samples, at each investigated site lichen samples were
collected using scalpers to obtain the material from
mature tree trunks, the latter being as much as possible
in the vertical position. Due to the lack of information
concerning the prevailing wind direction, lichen samples
were collected at different heights and positions along
the trunks in order to make a composite sample
representative of the different exposures. Bark samples
were also collected at the same sites in order to
investigate the relationship between the uranium content
of bark samples and of lichen samples. Where available,
lichen growing on rocks or soil, and moss samples were
also collected. To minimize effects of cross-contamina-
tion following collection, all botanical samples were
separately cleaned by removing visible soil particles and
foreign bodies, classified into different species, dried at
105 1C, and ground and homogenized in a ceramic
miller.
At sites in Serbia and Montenegro investigated by the
UNEP team all air samples were collected by the team
(UNEP, 2002). To measure low concentrations of
radionuclides in air, sampling systems (GMWL-2000)
equipped with high flow rate air pumps were used. At
each of the sites (except Pljackovica) a filter system was
placed in the centre of the fenced areas, while the other
two sampling systems were placed in a symmetric
position near the borders of the fenced areas. The three
systems were arranged in a line parallel to the wind
direction. The distance between the systems were
30–50m. At Pljackovica, only two systems were
operated and the filter systems were standing within
3m from each other. At Cape Arza the fenced area was
not easily accessed so the systems were placed outside
the fence, near the neighboring decontamination area.
During the investigation, the weather at the sites was
warm and dry. The wind speed was low to moderate,
except at the Reljan site where a strong wind prevailed.
In order to verify the presence of DU in drinking
water, water samples from private wells and taps were
collected and one seawater sample was also collected
from the Cape Arza site. One litre of water was sampled
at each site using a polyethylene bottle. Immediately
after sampling, without any filtering of the water, the
pHs of all water samples were adjusted too2 by addingHNO3 to ensure that trace elements were kept in
solution and to inhibit biological growth.
In order to evaluate the potential radiological impact
of DU on the environment of Serbia and Montenegro, a
number of environmental samples that were known to
be free of contamination by DU, including water, tree
trunk lichen and moss, and soil samples were also
collected from Italy (Roma, Urbino) at the control sites
(Tables 4–6). Detailed information about the control
sites can be found elsewhere (Jia et al., 1997, 2002).
2.5. Method
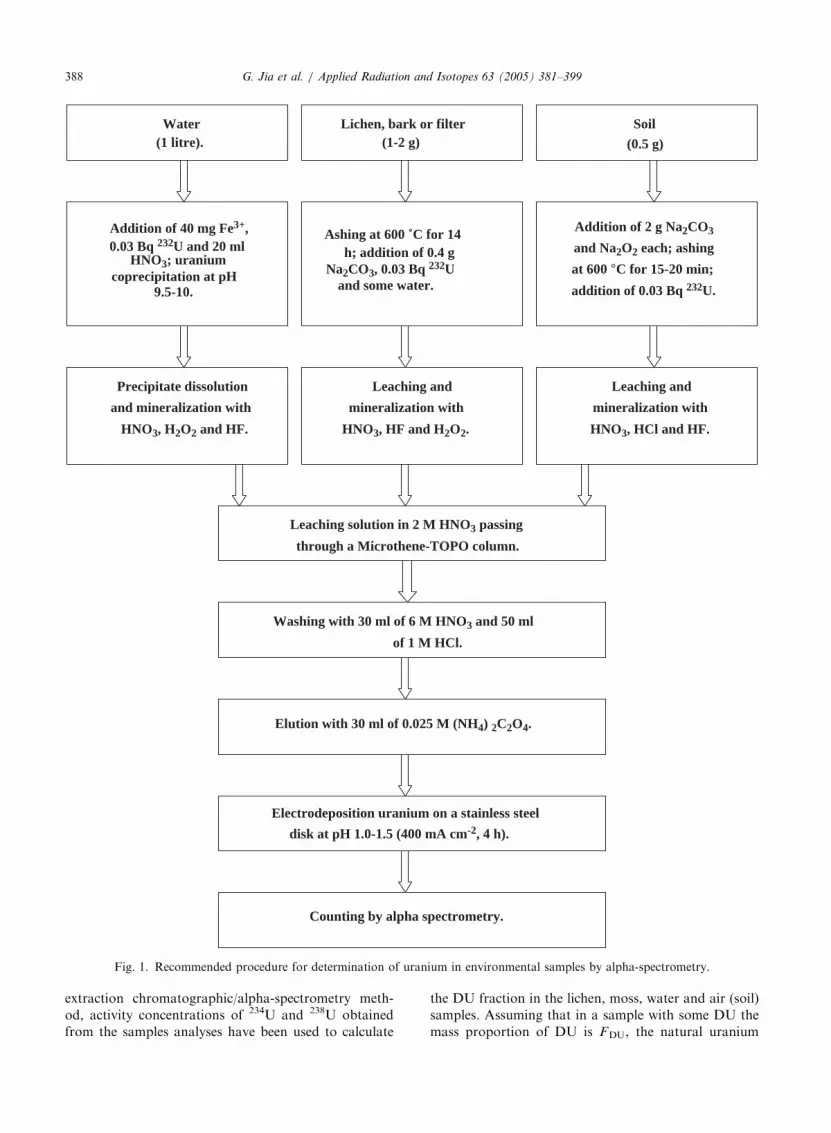
As shown in Fig. 1, the radioanalytical procedure for
determination of uranium isotopes in water, lichen, and
soil samples mainly includes steps of sample pretreat-
ment, leaching, uranium separation by a Microthene-
TOPO column, electrodeposition and measurement by
alpha-spectrometry. For more detailed procedure,
please refer to the literature (Jia et al., 2002, 2004b).
In order to evaluate the reliability of the method, five
reference or certified materials (IAEA-135 Sediment,
IAEA-315 Sediment, IAEA-326 Soil, IAEA-327 Soil
and IAEA-368 Sediment) have been analysed and the
obtained results are all within the 95% confidence
interval for the recommended or information values.
The lower limits of detection of the method are
0.37Bqkg�1 (soil) and 0.22mBq l�1 (water) for 238U
and 234U, 0.038Bqkg�1 (soil) and 0.022mBq l�1 (water)
for 235U and 236U if 0.5 g of soil and 1 l of water are
analysed. The average uranium yields for waters, lichens
and soils are 74.579.0%, 77.874.9% and 89.479.7%,respectively.
2.6. Calculation of DU fraction in possible DU
contaminated environmental samples
Quantitative determination of the DU fraction (FDU)
in DU contaminated environmental samples is difficult,
primarily because of the relatively large content of
natural uranium present in the environment, with typical
activity values in the range from 10 to 30Bqkg�1 for238U or 234U. When background information of the
uranium isotopic abundance is available, the presence of
DU in samples can be assessed by variation of uranium
isotopic ratios, such as 234U/238U and 235U/238U. To this
end accurate measurement methods must be adopted
which need to be validated very carefully prior to their
use (Magnoni et al., 2001).
Uranium is present in nature as three isotopes, 238U,234U and 235U. The 238U and 234U belong to the same
decay chain (238U series), while the 235U belongs to the
so-called actinium series, which is much less abundant.
If not disturbed by any selective chemical effects
(different leaching rate) or physical effects (alpha recoil)

ARTIC
LEIN
PRES
STable 1
sampling sites of lichens (L, Lr, Ls), barks (B), mosses (M), mushroom (F) and leaves (Le) in Serbia and Montenegro in 2001a
Sample code Sample type Substrate Sampling date Sampling site Coordinates, (UTM) Sample code Sample type Substrate Sampling date Sampling site Coordinates, (UTM)
L 1-3 Lichen Tree 30-10-2001 Pljackovica 573657 714594 L 22-1a Lichen Tree 31-10-2001 Bratoselce 562282 688396
B 1-3 Bark Tree 30-10-2001 Pljackovica 573657 714594 L 22-1b Lichen Tree 31-10-2001 Bratoselce 562282 688396
L 1-4a Lichen Tree 30-10-2001 Pljackovica 573657 714594 L 25-2a Lichen Tree 1-11-2001 Bukurevac 558156 688423
B 1-4a Bark Tree 30-10-2001 Pljackovica 573657 714594 L 25-2b Lichen Tree 1-11-2001 Bukurevac 558156 688423
L 2-3,4 Lichen Tree 30-10-2001 Pljackovica 573664 714632 L 26-1a Lichen Tree 1-11-2001 Bukurevac 558084 688527
L 2-4a Lichen Tree 30-10-2001 Pljackovica 573664 714632 B 26-1a Bark Tree 1-11-2001 Bukurevac 558084 688527
L 2-7 Lichen Tree 30-10-2001 Pljackovica 573664 714632 L 28-1a Lichen Tree 1-11-2001 Reljan 563208 685137
L 2-8 Lichen Tree 30-10-2001 Pljackovica 573664 714632 L 29-1a Lichen Tree 1-11-2001 Reljan 563173 685079
B 2-8 Bark Tree 30-10-2001 Pljackovica 573664 714632 B 29-1a Bark Tree 1-11-2001 Reljan 563173 685079
L 3-1 Lichen Tree 30-10-2001 Pljackovica 573689 714660 Ls 30-1a Lichen Soil 1-11-2001 Reljan 563171 685063
L 3-2a Lichen Tree 30-10-2001 Pljackovica 573689 714660 Ls 30-1b Lichen Soil 1-11-2001 Reljan 563171 685063
L 3-2b Lichen Tree 30-10-2001 Pljackovica 573689 714660 Lr 31-1a Lichen Rock 1-11-2001 Reljan 563123 685073
L 3-2c Lichen Tree 30-10-2001 Pljackovica 573689 714660 M 31-2 Moss Rock 1-11-2001 Reljan 563123 685073
L 3-3a Lichen Tree 30-10-2001 Pljackovica 573689 714660 L m1-1a Lichen Tree 3-11-2001 Cape Arza 300180 696077
L 3-3b Lichen Tree 30-10-2001 Pljackovica 573689 714660 L m2-1a Lichen Tree 3-11-2001 Cape Arza 300180 696077
L 3-6a Lichen Tree 30-10-2001 Pljackovica 573689 714660 Le m2-2 Leaf Tree 1-11-2001 Reljan 563123 685073
L 3-6b Lichen Tree 30-10-2001 Pljackovica 573689 714660 L m3-1a Lichen Tree 3-11-2001 Cape Arza 300187 696137
Le 3-7 Leaf Tree 30-10-2001 Pljackovica 573637 714629 B m3-1a Bark Tree 3-11-2001 Cape Arza 300187 696137
Lr 4-1 Lichen Rock 30-10-2001 Pljackovica 573637 714629 Le m3-2 Leaf Tree 3-11-2001 Cape Arza 300187 696137
L 5-1 Lichen Tree 30-10-2001 Pljackovica 573637 714562 M m4-1 Moss Rock 3-11-2001 Cape Arza 300188 696136
L 9-1a Lichen Tree 31-10-2001 Borovac 561910 693899 Le m5-1 Leaf Tree 3-11-2001 Cape Arza 300188 696136
L 9-1c Lichen Tree 31-10-2001 Borovac 561910 693899 L m5-2a Lichen Tree 3-11-2001 Cape Arza 300257 696122
L 10-1a Lichen Tree 31-10-2001 Borovac 561894 693852 L m5-2b Lichen Tree 3-11-2001 Cape Arza 300257 696122
L 10-4a Lichen Tree 31-10-2001 Borovac 561894 693852 L m6-1a Lichen Tree 3-11-2001 Cape Arza 300065 696128
F 10-7 Mushroom — 31-10-2001 Borovac 561838 694023 L m6-2a Lichen Tree 3-11-2001 Cape Arza 300065 696128
F 11-1 Mushroom — 31-10-2001 Borovac 561838 694023 B m6-2a Bark Tree 3-11-2001 Cape Arza 300065 696128
L 12-1a Lichen Tree 31-10-2001 Borovac 561838 694023 Le m6-4 Leaf Tree 3-11-2001 Cape Arza 300222 696092
L 12-1c Lichen Tree 31-10-2001 Borovac 561838 694023 L m7-1a Lichen Tree 3-11-2001 Cape Arza 300222 696092
L 12-2a Lichen Tree 31-10-2001 Borovac 561838 694023 L m7-1b Lichen Tree 3-11-2001 Cape Arza 300222 696092
L 12-2b Lichen Tree 31-10-2001 Borovac 561838 694023 L m7-1c Lichen Tree 3-11-2001 Cape Arza 300222 696092
L 12-2c Lichen Tree 31-10-2001 Borovac 561838 694023 Le m7-2 Leaf Tree 3-11-2001 Cape Arza 300222 696092
Ls 18-1 Lichen Soil 31-10-2001 Bratoselce 562274 688318 Le m7-3 Leaf Tree 3-11-2001 Cape Arza 300234 696084
L 19-1a Lichen Tree 31-10-2001 Bratoselce 562305 688342 L m8-1 Lichen Tree 3-11-2001 Cape Arza 300222 696092
L 20-1a Lichen Tree 31-10-2001 Bratoselce 562305 688312 B m8-1 Bark Tree 3-11-2001 Cape Arza 300222 696092
L 21-2a Lichen Tree 31-10-2001 Bratoselce 562258 688363 Le m8-2a Leaf Tree 3-11-2001 Cape Arza 300222 696092
B 21-2a Bark Tree 31-10-2001 Bratoselce 562258 688363 Le m8-2b Leaf Tree 3-11-2001 Cape Arza 300222 696092
L 21-3a Lichen Tree 31-10-2001 Bratoselce 562258 688363 L m9-1a Lichen Tree 3-11-2001 Cape Arza 300234 696084
B 21-3a Bark Tree 31-10-2001 Bratoselce 562258 688363 B m9-1a Bark Tree 3-11-2001 Cape Arza 300234 696084
L 21-4 Lichen Tree 31-10-2001 Bratoselce 562258 688363 Ls m10-1a Lichen Soil 3-11-2001 Cape Arza 300222 696092
B 21-4 Bark Tree 31-10-2001 Bratoselce 562258 688363 L m11-1 Lichen Tree 3-11-2001 Cape Arza 300222 696092
aLr and Ls are lichens collected from rock and soil, respectively
G.
Jia
eta
l./
Ap
plied
Ra
dia
tion
an
dIso
top
es6
3(
20
05
)3
81
–3
99
384

ARTICLE IN PRESS
Table 2
Sampling sites of air in Serbia and Montenegro in 2001 (AF: Air filter)
Sample code Sampling date Sampling site Sampling volume (m3) Coordinates (UTM)
AF 1-1 30-10-2001 Pljackovica 156 573613 714596
AF 1-3 30-10-2001 Pljackovica 156 573613 714596
AF 2-1 31-10-2001 Borovac 150 561956 694025
AF 2-2 31-10-2001 Borovac 150 561969 694064
AF 2-3 31-10-2001 Borovac 150 561935 693979
AF 3-1 31-10-2001 Bratoselce 116 562271 688310
AF 3-2 31-10-2001 Bratoselce 116 562278 688285
AF 3-3 31-10-2001 Bratoselce 116 562292 688251
AF 4-1 1-11-2001 Bukurevac 130 558190 688787
AF 4-2 1-11-2001 Bukurevac 130 558209 688731
AF 4-3 1-11-2001 Bukurevac 130 558165 688761
AF 5-1 1-11-2001 Reljan 130 553168 685120
AF 5-2 1-11-2001 Reljan 130 553155 685074
AF 5-3 1-11-2001 Reljan 130 553150 685032
AF 6-1 3-11-2001 Cape Arza 192 300146 696097
AF 6-2 3-11-2001 Cape Arza 192 300119 696100
AF 6-3 3-11-2001 Cape Arza 192 300174 696120
Table 3
Sampling sites of tap water (TW), well water (WW) and sea water (SW) in Serbia and Montenegro in 2001
Sample code Sampling date Sampling site Coordinates (UTM)
TW6 30-10-2001 Przar 574041 713641
WW7 30-10-2001 Przar 573796 713729
TW8 30-10-2001 Przar (Hotel) 573707 713478
TW13 31-10-2001 Borovac 561577 695276
WW14 31-10-2001 Borovac 561162 694635
WW15 31-10-2001 Borovac 562061 694078
WW16 31-10-2001 Borovac 562087 694072
WW17 31-10-2001 Borovac 562028 694185
WW23 31-10-2001 Bratoselce — —
WW27 1-11-2001 Bukurevac 558184 688800
SW12 3-11-2001 Cape Arza 300239 696157
G. Jia et al. / Applied Radiation and Isotopes 63 (2005) 381–399 385
they should be in radioactive equilibrium. In the case of
equilibrium, the isotopic abundances of natural uranium
by weight are 99.2745% of 238U, 0.00550% of 234U and
0.720% of 235U with a 234U/238U mass ratio (Rm234/238)
of 5.54� 10–5 and a 235U/238U mass ratio (Rm235/238) of
0.00725. If the corresponding activity ratio is consid-
ered, the 234U/238U value (Ra234/238) is about 1.00, and
the 235U/238U value (Ra235/238) is about 0.0466 (Invano-
vich and Harmon, 1992). Thus said, it is a matter of fact
that the selective chemical and physical effects always
occur in biological and environmental samples, to some
greater or lesser degree.
In order to estimate quantitatively the DU fraction in
lichen, air and water samples collected in Serbia and
Montenegro, basic information about the uranium
isotopic abundances in uncontaminated environmental
samples should also be investigated. For this purpose
and as already mentioned, some lichen, moss, soil and
water samples uncontaminated from DU have been
collected from central Italy and analysed for the
knowledge of the variation of their natural uranium
isotopic abundances. Soil samples were also selected, as
the manifest 234U/238U ratio variation in air at a given
place will also reflect to an extent the ratio variation in
soil at that location.
The obtained activity concentrations of uranium
isotopes in lichen, moss and soil samples uncon-
taminated from DU are given in Tables 4 and 5,
showing that the average 234U/238U activity ratios are
1.00670.097 for lichen, 1.02770.082 for moss and
0.99370.033 for soil. The obtained isotopic abundancesby weight are (99.0570.43)% of 238U, (0.005397

ARTICLE IN PRESS
Table 4238U, 234U and 235U concentrations (in Bqkg�1) in tree trunk lichen (L) and moss (M) samples collected in central Italy (Urbino) in
1997
Sample code Sample weight, g U yield,% 238U 234U 235U 234U/238U 235U/238U
L1 1.2107 82.3 2.4870.16 2.5070.16 0.1070.03 1.00670.091 0.04070.014L3 1.0394 66.3 2.7170.22 2.5370.21 0.2370.07 0.93170.107 0.08670.026L4 1.1837 89.9 4.6770.23 4.6170.23 0.2370.05 0.98870.070 0.04970.011L6 1.1074 85.8 2.5670.18 2.5870.19 0.0470.03 1.00870.103 0.01770.012L7 1.0363 76.4 2.5470.14 2.6970.14 0.1970.04 1.05670.137 0.07370.031L9 1.0277 73.0 2.2170.17 2.3970.18 0.1270.04 1.08270.115 0.05370.020L10 1.0625 52.0 2.9670.22 2.9870.23 0.2870.07 1.00970.108 0.09470.026L11 1.0481 71.1 1.4670.16 1.2770.15 0.0870.04 0.86970.140 0.05270.031L21 1.0702 74.7 4.6870.32 5.1770.34 0.1970.07 1.10570.106 0.04070.015L22 1.0873 78.7 1.3770.13 1.4070.13 0.0570.03 1.02170.136 0.03570.022L23 1.1074 70.2 2.9170.21 2.4470.19 0.0970.04 0.84070.090 0.03270.015L24 1.1638 78.0 1.0170.10 0.8570.10 0.0470.03 0.84270.130 0.04270.027L25 1.0126 78.0 2.3370.17 2.2570.17 0.1570.05 0.96370.100 0.06470.021L26 1.1525 80.3 1.9270.14 1.9270.14 0.1070.03 1.00070.099 0.05170.018L27 1.0681 84.5 3.8170.22 3.9970.22 0.2770.06 1.04770.107 0.07070.023L28 1.1423 65.3 1.7070.19 1.9870.20 0.1770.07 1.16170.177 0.10170.041L29 1.0363 78.5 2.1770.19 2.5370.20 0.2270.06 1.16870.137 0.10170.031
Mean or range 1.0126–1.2107 75.679.0 1.01–4.68 0.85–5.17 0.04–0.28 1.00670.097 0.05970.025
M1 1.0729 69.9 2.9170.26 3.3070.28 0.2370.08 1.13270.139 0.08170.028M2 1.0141 75.3 1.5370.16 1.8070.17 0.0970.05 1.18070.167 0.06070.030M3 1.0589 78.0 5.1370.35 4.6770.33 0.2070.07 0.91070.089 0.03870.014M4 1.0301 71.8 3.5570.25 3.8170.26 0.3170.08 1.07270.106 0.08670.023M5 1.3123 75.0 1.6270.12 1.7770.12 0.0670.03 1.09070.110 0.04070.017M6 1.0203 77.0 5.3370.35 5.5670.36 0.3170.09 1.04370.096 0.05970.017M10 1.0007 75.6 1.3770.12 1.3370.14 0.0670.03 0.97270.133 0.04670.024M20 1.0870 82.3 1.5070.12 1.5370.12 0.1770.04 1.01970.113 0.11670.030M21 1.2246 91.2 6.9070.37 6.1970.34 0.2770.07 0.89770.069 0.03970.010M22 1.0990 97.0 6.2570.34 6.1770.34 0.2770.07 0.98870.077 0.04470.011M23 1.0984 73.7 1.1870.14 1.1570.14 0.0670.04 0.97870.167 0.04970.033M26 1.1952 89.0 7.1470.38 7.6970.40 0.3170.07 1.07670.080 0.04470.011M27 1.0314 81.7 2.8970.19 2.8970.19 0.1170.04 1.00070.093 0.03870.014
Mean or range 1.0007–1.3123 79.878.1 1.18–7.14 1.15–7.69 0.06–0.31 1.02770.082 0.05770.024
G. Jia et al. / Applied Radiation and Isotopes 63 (2005) 381–399386
0.00057)% of 234U, (0.94370.430)% of 235U [Rm234/238:
(5.4570.59)� 10�5; Rm235/238: 0.0095470.00439] in
lichen, (99.1270.36)% of 238U, (0.0054870.00043)%of 234U, (0.87370.036)% of 235U [Rm234/238: (5.5370.44)� 10�5; Rm235/238: 0.0088270.00369] in moss and(99.2270.082)% of 238U, (0.0053070.00018)% of 234U,
(0.78070.085)% of 235U [Rm234/238: (5.3470.18)� 10�5;
Rm235/238: 0.0078670.00087] in soil. These results showa similar characteristic to that of natural uranium in
these samples.
Disequilibrium of 234U with 238U was observed in
water samples (Table 6). The 234U/238U activity ratios
are higher and variable in mineral or drinking waters
(1.4270.19), and relatively constant in river waters
(1.1870.04) and seawaters (1.1570.06). The observedisotopic abundances by weight are (99.2070.15)% of238U, (0.0075770.0010)% of 234U, (0.78870.149)%
of 235U [Rm234/238: (7.6371.01)� 10�5; Rm235/238:
0.0079570.00152] in drinking water, (99.2870.10)%of 238U, (0.0063470.00023)% of 234U, (0.71870.105)%of 235U [Rm234/238: (6.8671.88)� 10�5; Rm235/238:
0.0073370.00206] in river water and (99.1670.11)%of 238U, (0.0061170.00033)% of 234U, (0.83170.113)%of 235U [Rm234/238: (6.4771.88)� 10�5; Rm235/238:
0.0073370.00216] in seawater.The uranium isotopic abundance (m/m) of DU were
obtained by analysing smear samples obtained from the
penetrators used in the Balkan conflict (Jia et al., 2004a),
being (99.7770.01)% of 238U, (0.00067870.000014)%of 234U, (0.22470.009)% of 235U, and (0.0029570.00020)% of 236U (Rm234/238: 6.79� 10
�6; Rm235/238:
0.00224; Rm236/238: 2.96� 10�5).
Due to the fact that the activity concentrations of234U and 238U can be accurately measured by the

ARTICLE IN PRESS
Table 5238U, 234U and 235U concentrations (in Bq kg�1) in soil samples collected in Italy in December 1998
Sample code Sample weight (g) U yield (%) 238U 234U 235U 234U/238U 235U/238U
S1 0.5110 81.7 29.971.3 31.371.3 1.6570.24 1.04870.062 0.05570.008S2 0.5298 88.9 30.971.2 30.871.2 1.6570.22 0.99670.056 0.05370.007S3 0.5170 83.0 25.671.1 26.471.1 1.3470.21 1.03370.062 0.05270.009S4 0.5080 100.7 31.971.3 31.771.3 1.5870.23 0.99370.056 0.04970.007S5 0.5503 94.7 29.571.1 28.671.1 1.5070.20 0.96970.052 0.05170.007S6 0.5358 95.2 29.371.1 28.471.1 1.4270.20 0.96870.053 0.04870.007S7 0.5190 97.5 31.771.2 31.871.2 1.3670.19 1.00370.054 0.04370.006S8 0.5078 92.9 29.171.2 29.571.2 1.2870.20 1.01270.058 0.04470.007S9 0.4999 81.6 29.771.2 29.671.2 1.6870.24 0.99770.059 0.05770.008S10 0.5224 87.9 29.871.5 27.171.4 1.5270.30 0.91070.066 0.05170.010S11 0.5337 73.9 33.071.2 33.371.2 1.4870.19 1.00970.052 0.04570.006S12 0.5100 80.3 28.971.6 29.371.6 1.1870.29 1.01570.079 0.04170.010S13 0.5505 76.3 28.971.2 28.471.2 1.3270.21 0.98370.058 0.04670.007S14 0.5293 99.0 53.171.7 53.871.7 2.4870.23 1.01270.046 0.04770.005S15 0.5259 98.8 29.471.0 30.171.1 1.6770.19 1.02570.052 0.05770.007S16 0.5148 97.2 29.571.1 30.171.1 1.5670.19 1.02270.052 0.05370.007S17 0.5184 76.7 33.171.4 30.371.3 1.6770.25 0.91670.055 0.05070.008S18 0.5578 86.2 27.271.1 27.171.1 1.3270.20 0.99770.058 0.04970.008S20 0.5157 95.2 29.471.2 29.271.2 1.7370.23 0.99470.056 0.05970.008S21 0.5207 89.9 30.871.2 29.971.2 1.3670.20 0.96870.054 0.04470.007S22 0.5254 82.2 31.271.3 31.371.3 1.8070.24 1.00370.057 0.05870.008S23 0.5027 96.1 29.871.2 29.271.2 1.8070.24 0.98070.056 0.06070.008
Mean or range 0.4990–0.5578 88.978.4 25.6–53.1 26.4–53.8 1.18–2.48 0.99370.033 0.05170.006
Table 6238U, 234U and 235U concentrations (in mBq l�1) in drinking water (DW), filtered river water (RW) and sea water (SW) samples
collected in Italy
Sample code Water volume (l) U yield (%) 238U 234U 235U 234U/238U 235U/238U
DW1 1.000 73.5 7.5070.39 7.8470.40 0.5170.10 1.0570.08 0.06870.013DW2 1.000 62.6 17.771.0 29.871.5 0.6370.16 1.6870.13 0.03670.009DW3 1.000 71.0 18.070.8 27.271.1 0.9770.14 1.5270.09 0.05470.008DW4 1.000 81.7 97.574.0 13175 4.8270.45 1.3470.08 0.04970.005DW5 0.500 70.4 10374 13574 4.7770.43 1.3170.06 0.04670.004DW6 0.500 62.0 33.972.7 48.173.4 2.1570.60 1.4270.15 0.06370.018DW7 0.538 71.7 35.771.5 48.472.0 1.7370.26 1.3670.08 0.04970.008DW8 1.000 90.9 0.3070.06 0.4970.07 0.0270.02 1.6270.38 0.04970.057DW9 1.000 75.5 4.7670.30 7.0370.38 0.2170.06 1.4870.12 0.04570.014
Mean or range 0.500–1.000 73.379.0 0.30-103 0.49-135 0.02-4.82 1.4270.19 0.05170.010
RW1 1.000 59.5 19.471.0 23.771.1 0.7270.16 1.2270.09 0.03770.008RW2 0.500 77.0 29.471.7 33.671.8 1.4970.33 1.1470.09 0.05170.012RW3 0.500 88.7 30.871.6 37.771.8 1.6270.30 1.2270.09 0.05370.010RW4 0.500 80.0 22.871.4 26.471.5 1.0470.28 1.1670.10 0.04670.012
Mean or range 0.500-1.000 76.3712.2 19.4-30.8 23.7-37.7 0.72-1.62 1.1870.04 0.04770.007
SW1 0.500 88.8 40.272.0 41.972.0 2.6270.40 1.0470.07 0.06570.011SW2 1.000 68.9 39.671.9 45.872.2 1.9270.29 1.1670.08 0.04870.008SW3 1.000 68.0 42.571.8 49.172.0 2.4170.27 1.1670.07 0.05770.007SW4 1.000 70.2 42.771.7 51.572.0 1.9870.22 1.2170.07 0.04670.006SW5 1.000 83.0 42.471.4 49.271.6 2.2570.18 1.1670.05 0.05370.005
Mean or range 0.500–1.000 75.879.5 41.571.5 47.573.7 2.2470.29 1.1570.06 0.05470.008
G. Jia et al. / Applied Radiation and Isotopes 63 (2005) 381–399 387
ARTICLE IN PRESS
Soil
(0.5 g)
Leaching solution in 2 M HNO3 passing
through a Microthene-TOPO column.
Lichen, bark or filter (1-2 g)
Addition of 40 mg Fe3+, 0.03 Bq 232U and 20 ml
HNO3; uranium coprecipitation at pH
9.5-10.
Ashing at 600 ˚C for 14 h; addition of 0.4 g
Na2CO3, 0.03 Bq 232U and some water.
Addition of 2 g Na2CO3
and Na2O2 each; ashing
at 600 °C for 15-20 min;
addition of 0.03 Bq 232U.
Water (1 litre).
Precipitate dissolution
and mineralization with
HNO3, H2O2 and HF.
Leaching and
mineralization with
HNO3, HF and H2O2.
Leaching and
mineralization with
HNO3, HCl and HF.
Washing with 30 ml of 6 M HNO3 and 50 ml
of 1 M HCl.
Elution with 30 ml of 0.025 M (NH4) 2C2O4.
Electrodeposition uranium on a stainless steel
disk at pH 1.0-1.5 (400 mA cm-2, 4 h).
Counting by alpha spectrometry.
Fig. 1. Recommended procedure for determination of uranium in environmental samples by alpha-spectrometry.
G. Jia et al. / Applied Radiation and Isotopes 63 (2005) 381–399388
extraction chromatographic/alpha-spectrometry meth-
od, activity concentrations of 234U and 238U obtained
from the samples analyses have been used to calculate
the DU fraction in the lichen, moss, water and air (soil)
samples. Assuming that in a sample with some DU the
mass proportion of DU is FDU, the natural uranium

ARTICLE IN PRESSG. Jia et al. / Applied Radiation and Isotopes 63 (2005) 381–399 389
represents the fraction 1� FDU. Therefore, based on the
average uranium isotopic abundances obtained by
weight, which are 99.156% of 238U and 0.00536% of234U in lichen, moss or air (soil) samples uncontami-
nated from DU, and 99.773% of 238U and 0.000678% of234U in DU of the penetrators, the mass ratio between234U and 238U (Rm234/238) in a lichen, moss or air (soil)
sample is given by the formula
Rm234=238 ¼0:00536ð1� FDUÞ þ 0:000678FDU
99:156ð1� FDUÞ þ 99:773FDU. (1)
The activity ratio between 234U and 238U, Ra234/238 is
given by 2.312� 105 Rm234/238/12.44. For FDU ¼ 0, the
Ra234/238 is 1.00; for FDU ¼ 0:5, the Ra234/238 is 0.564;
and for FDU ¼ 1, the Ra234/238 is 0.126, etc. The
Rm234/238 value can be obtained from the sample
analyses, therefore, FDU in lichen, moss and air (soil)
samples collected in Serbia and Montenegro is calcu-
lated as
FDU ¼0:00536� 99:156Rm234=238
0:00468þ 0:617Rm234=238. (2)
Due to the obvious radioactive disequilibrium be-
tween 234U and 238U in water samples, uranium isotopic
abundances by weight in seawater, which are 99.162%
of 238U and 0.00611% of 234U, are used to estimate the
DU fraction in the drinking water samples collected in
Serbia and Montenegro. Rm234/238 in water samples is
given from the following equation:
Rm234=238 ¼0:00611ð1� FDUÞ þ 0:000678FDU
99:162ð1� FDUÞ þ 99:773FDU(3)
and FDU in drinking water is
FDU ¼0:00611� 99:162Rm234=238
0:00540þ 0:610Rm234=238. (4)
Experimental determination of the isotopic ratio
between 234U and 238U is affected by uncertainties, the
magnitude of which depends upon the accuracy and
precision of the measurements of the single isotopes. It
appears clear that the values of the isotopic ratios
overlap with those of natural uranium when the DU
fraction is not significant. Magnoni et al. (2001) have
assessed the sensitivity of the technique, and concluded
that the threshold for detection of the DU fraction in a
typical soil or other matrices sample containing
5–60Bqkg�1 of natural 238U, is about 10–20% of the
total uranium present in the sample.
3. Results and discussion
The pyrophoric nature of DU is of special relevance
to the environmental impacts resulting from its use in
ordnance and armouring. The characteristics and
behaviour of DU anti-armour rounds fired by A-10
aircraft in the environment can principally be classified
into two scenarios. First, when rounds hit either non-
armoured targets or miss targets, they will generally
remain intact, passing through the target and/or
becoming buried in the ground. The depth depends on
the angle of the round, the speed of the plane, the type of
target and the nature of the ground surface. In clay soils,
the penetrators may reach more than 2m in depth. In
this scenario, there are risks of external exposure and
underground water contamination due to the mobiliza-
tion of DU in soil profile after corrosion and dissolution
on the basis of the acidity and reducing properties of the
environment and the hydrological characteristics of the
region. Second, when rounds hit the armoured or hard
targets, normally 10–35% (maximum of 70%) of the
penetrators become aerosol on impact with armour and
the DU dust catches fire (Rand, 1999). Most of the dust
particles areo5 mm in size and spread according to winddirection. The DU dust is black and consists mainly of
uranium oxides. A target that has been hit by DU
ammunition can be recognized by the black dust cover
in and around the target (USAEPI., 1994). The dust
formed during the penetration of armoured vehicles can
be dispersed into the environment, contaminating the
air, water, vegetation and soil. One opinion is that such
contamination should be limited to within about 100m
of the target (CHPPM, 2000; Nellis, 1997), while
another is that these uranium oxide particles can be
dispersed with a radius of several kilometres (UNEP,
2001). It is obvious that the contamination range of DU
largely depends on the local climate and meteorological
conditions. After deposition, the small penetrator
fragments and DU dust may also be redistributed due
to: (1) the resuspension by wind; (2) transportation by
insects, worms and some human activities (cultivation,
irrigation and fertilization); (3) biological and chemical
processes by corrosion or oxidation and reduction, and;
(4) rainwater, surface water and underground water. It is
a matter of record that the second scenario is responsible
for most of the air, water, vegetation and soil
contamination and can cause DU to become a primary
radiation source (UNEP, 2001, 2002).
The obtained activity concentrations of uranium
isotope in the samples collected in Serbia, Montenegro
and also from the control sites are given in Tables 4–10.
The reported uncertainty for individual analysis in the
tables is 1s, this being estimated from the uncertainties
associated with the tracer activity, the addition of the
tracer to the sample and the counting statistics of the
sample and the blank, etc.
3.1. Uranium in lichen, moss, mushroom, bark and leaf
samples
Lichens, mosses, mushrooms, barks and leaves have
been widely used as sensitive, inexpensive and easily

ARTIC
LEIN
PRES
STable 7238U, 234U, 235U and 236U concentrations (in Bqkg�1) in biological samples (L: lichen; B: bark; Le: leaf; F: mushroom; M: moss) collected in Serbia from 27 October to 5
November 2001
Site Sample
code
Lichen species U yield
(%)
238U 234U 235U 236U 234U/238U 235U/238U 236U/238U FDU, %
Pljackovica L 1-3 Parmelia borreri 66.7 4.0470.29 3.8770.28 0.2570.08 ND* 0.95770.098 0.06170.021 ND p5.3B 1-3 — 44.2 1.8370.15 2.0470.16 0.1370.05 ND 1.1170.12 0.06970.029 ND ND
L 1-4a Parmelia borreri 84.2 2.6570.26 2.5170.25 0.1770.08 ND 0.94670.134 0.06370.029 ND p6.6B 1-4a — 43.7 1.8870.14 1.6770.14 0.0570.04 ND 0.88470.099 0.02870.021 ND p13.6L 2-3,4 Hypogymnia farinacea 74.4 3.2270.18 2.7770.16 0.1670.04 0.00770.011 0.86270.069 0.05870.013 0.002170.0035 p16.1L 2-4a Parmelia acetabulum 73.8 3.5770.21 3.3070.20 0.1670.05 ND 0.92670.079 0.04370.015 ND p8.9L 2-7 Parmelia borreri 66.8 2.4970.29 2.2170.27 0.0870.07 0.00670.037 0.88970.152 0.03270.029 0.002270.0149 p13.1L 2-8 Parmelia borreri 93.7 1.7370.12 1.8170.12 0.1070.03 ND 1.0470.097 0.06070.020 ND ND
B 2-8 — 56.4 0.8170.08 0.8270.08 0.0370.03 ND 1.0270.15 0.03770.035 ND ND
L 3-1 Parmelia tiliacea 72.3 2.8270.29 3.4670.32 0.1970.09 ND 1.2370.17 0.06870.032 ND ND
L 3-1 Pseudevernia furfuracea 75.6 5.2170.23 5.1270.23 0.2470.04 ND 0.98370.062 0.04670.009 ND ND
B 3-1 — 93.7 5.9270.60 5.7770.59 0.1670.11 ND 0.97670.140 0.02670.020 ND ND
L 3-2a Pseudevernia furfuracea 57.6 0.7070.08 0.6970.08 0.0470.03 ND 0.99070.167 0.06170.047 ND ND
L 3-2b Hypogymnia farinacea 61.3 1.5170.11 1.4270.11 0.0870.03 ND 0.93870.100 0.05070.023 ND p7.5L 3-2b Hypogymnia farinacea 72.8 3.1570.15 3.1870.15 0.1770.03 ND 1.0170.067 0.05470.010 ND ND
L 3-2c Parmelia sulcata 67.0 4.7670.40 5.0370.41 0.3070.11 ND 1.0670.124 0.06370.023 ND ND
L 3-3a Pseudevernia furfuracea 58.3 0.8970.13 0.8970.13 0.0270.04 ND 1.0070.206 0.02770.046 ND ND
L 3-3b Hypogymnia farinacea 76.4 1.5070.16 1.0270.14 0.0470.04 0.00470.010 0.67970.118 0.04670.029 0.002670.0177 36.9
L 3-6a Hypogymnia farinacea 68.3 1.4870.12 1.4870.12 0.0470.03 ND 1.0070.114 0.02670.021 ND ND
L 3-6b Hypogymnia farinacea 78.0 0.8570.13 0.8070.12 0.1270.06 ND 0.94270.201 0.14170.071 ND p7.1Le 3-7 — 71.6 0.2270.05 0.2870.05 0.0270.01 ND 1.3270.36 0.08870.065 ND ND
Lr 4-1 Lecanora muralis 103 9.6370.55 9.3870.54 0.6970.14 ND 0.97470.079 0.07170.015 ND ND
Lr 4-1 Lecanora muralis 70.6 13.170.9 14.171.0 1.0270.20 ND 1.0870.10 0.07770.016 ND ND
Lr 4-1 Lecanora muralis 96.4 9.4670.35 9.7170.36 0.5270.06 ND 1.0370.05 0.05570.007 ND ND
Lr 4-1 Lecanora muralis 98.3 13.670.6 14.670.6 0.6470.10 ND 1.0870.07 0.04770.007 ND ND
Lr 4-1 Lecanora muralis 97.7 20.371.0 21.371.0 1.3070.23 ND 1.0570.07 0.06470.012 ND ND
Lr 4-1 Lecanora muralis 101 13.870.4 14.170.4 0.6870.06 0.06670.017 1.0270.05 0.04970.005 0.004870.0013 ND
L 5-1 Ramalina farinacea 60.0 0.7270.12 0.4970.11 0.0370.05 ND 0.68770.192 0.03770.066 — 35.9
Borovac L 9-1a Parmelia sulcata 92.7 2.7170.19 2.7070.19 0.0570.03 ND 0.99670.101 0.02070.012 ND ND
L 9-1c Parmelia acetabulum 81.2 2.7770.19 3.0070.20 0.1670.05 ND 1.0870.10 0.05770.018 ND ND
L 10-1a Xanthoria parietina 71.6 1.4070.14 1.2370.13 0.0770.04 ND 0.88470.130 0.04970.031 ND p13.6L 10-4a Xanthoria parietina 58.9 1.7970.12 1.8070.12 0.0970.04 ND 1.0070.096 0.05270.020 ND ND
F 10-7 — 62.4 1.1170.12 0.8070.11 0.0370.02 ND 0.72170.124 0.02470.017 ND 32.1
F 11-1 — 51.1 0.6770.10 0.4870.09 0.0270.04 ND 0.71770.175 0.02670.057 ND 32.6
L 12-1a Pseudevernia furfuracea 80.6 1.0870.10 0.9570.10 0.0570.03 ND 0.87870.123 0.04670.030 ND p14.3L 12-1c Parmelia sulcata 101 3.2470.24 3.4770.25 0.1970.07 ND 1.0770.11 0.05770.022 ND ND
L 12-2a Physcia biziana 91.2 4.1470.28 4.6970.30 0.2270.07 ND 1.1370.10 0.05270.018 ND ND
L 12-2b Parmelia acetabulum 81.9 5.7670.31 5.3270.29 0.1770.06 ND 0.92470.070 0.02970.010 ND p9.1L 12-2c Parmelia borreri 98.9 4.1470.33 4.7070.36 0.3370.09 ND 1.1370.12 0.07970.023 ND ND
G.
Jia
eta
l./
Ap
plied
Ra
dia
tion
an
dIso
top
es6
3(
20
05
)3
81
–3
99
390

ARTIC
LEIN
PRES
SBratoselce Ls 18-1 Cladonia convoluta 53.2 82.075.2 42.472.8 2.2370.35 0.61970.156 0.51770.048 0.02770.005 0.007570.0020 55.3
Ls 18-1 Cladonia convoluta 73.0 11573 60.171.8 3.3170.18 0.37470.047 0.52170.022 0.02970.002 0.003270.0004 54.8
L 19-1a Physcia adscendens 78.5 2.8270.25 2.8270.25 0.2070.07 ND 1.0070.12 0.07070.026 ND ND
L 20-1a Physcia adscendens 51.1 2.8070.28 1.8170.23 0.1370.09 ND 0.64770.103 0.04670.031 ND 40.5
L 21-2a Physcia biziana 80.5 3.0870.17 2.6970.15 0.0970.03 0.02370.013 0.87170.068 0.03670.010 0.007470.0042 15.1
B 21-2a — 34.0 2.4370.19 2.3870.19 0.1070.06 ND 0.97770.108 0.04170.024 ND ND
L 21-3a Parmelia acetabulum 68.4 4.0470.23 4.2570.23 0.2170.06 ND 1.0570.08 0.05370.014 ND ND
L 21-3a Parmelia acetabulum 71.8 5.0570.21 4.7570.20 0.2770.04 ND 0.94070.057 0.05470.009 ND p7.3B 21-3a — 62.1 3.1170.18 3.1070.18 0.1270.04 ND 0.99770.084 0.04070.014 ND ND
L 21-4 Parmelia borreri 76.2 3.5170.20 3.1170.19 0.0970.04 0.00870.010 0.88570.073 0.02570.011 0.002370.0028 p13.5L 21-4 Parmelia borreri 98.3 3.8970.16 4.0170.16 0.1970.03 ND 1.0370.059 0.05070.008 ND ND
B 21-4 — 67.0 3.4070.19 3.3070.19 0.2070.05 ND 0.97070.079 0.06070.016 ND ND
L 22-1a Parmelia quercina 95.0 3.0170.16 2.9670.16 0.1070.03 ND 0.98570.074 0.03470.011 ND ND
L 22-1b Physcia biziana 92.1 4.3670.22 4.3070.22 0.3170.06 ND 0.98570.070 0.07170.014 ND ND
L 25-2a Physcia tenella 78.0 4.8970.27 5.7070.30 0.1970.06 ND 1.1670.09 0.03970.012 ND ND
L 25-2b Physconia grisea 66.7 3.5070.28 3.2570.27 0.2570.09 ND 0.92770.106 0.07270.025 ND p8.7L 25-4 — 83.9 0.8770.07 0.5470.06 0.0670.02 0.00970.006 0.61670.084 0.06570.019 0.009870.0066 44.0
L 26-1a Physconia grisea 67.2 5.8370.29 5.8870.29 0.3070.07 ND 1.0170.07 0.05170.012 ND ND
L 26-1a Physconia grisea 94.5 8.5070.29 8.3370.28 0.3570.04 ND 0.98070.047 0.04170.005 ND ND
B 26-1a — 66.1 2.3770.14 2.5570.14 0.1870.04 ND 1.0870.086 0.07870.018 ND
Reljan L 28-1a Physcia adscendens 81.5 2.7970.17 2.4970.16 0.1170.04 0.01470.011 0.89470.079 0.04470.013 0.004970.0039 p12.5L 29-1a Physcia adscendens 59.0 2.6570.18 2.4170.17 0.1270.05 ND 0.90870.087 0.04770.018 ND p10.9B 29-1a — 40.9 1.0270.11 1.1570.12 0.0570.02 ND 1.1370.17 0.04870.024 ND ND
Ls 30-1a Parmelia somloensis 80.1 14.170.9 15.270.9 0.6570.14 ND 1.0870.09 0.04670.010 ND ND
Ls 30-1b Cladonia convoluta 86.9 15.971.1 15.871.1 0.9970.25 ND 0.99770.100 0.06270.017 ND ND
Lr 31-1 Ramalina capitata 80.0 1.6970.16 1.6270.15 0.1170.05 ND 0.95970.128 0.06370.027 ND p5.1Lr 31-1a Ramalina capitata 62.1 1.6370.15 1.8270.15 0.1270.04 ND 1.1270.138 0.07170.028 ND ND
Lr 31-1a Ramalina capitata 72.1 2.8470.17 1.6870.13 0.0970.03 ND 0.59270.057 0.03070.012 ND 46.8
Lr 31-1a Ramalina capitata 94.1 2.7170.14 1.9170.11 0.1070.03 ND 0.70670.055 0.03770.010 ND 33.8
Lr 31-1a Ramalina capitata 97.0 4.3070.42 2.9570.36 0.2170.10 ND 0.68570.108 0.05070.023 ND 36.2
M 31-2 — 85.4 10.470.34 10.670.34 0.4970.05 ND 1.0170.04 0.04770.005 ND ND
Mean or range 75.0716.2 0.94970.159 0.05170.0190.22–115 0.28–60.2 0.018–3.31 ND-0.619 0.517–1.32 0.020–0.141 ND-0.0098 ND-55.3
*: not detectable.
G.
Jia
eta
l./
Ap
plied
Ra
dia
tion
an
dIso
top
es6
3(
20
05
)3
81
–3
99
391

ARTIC
LEIN
PRES
STable 8238U, 234U, 235U and 236U concentrations (in Bq kg�1) in biological samples (L: lichen; B: bark; Le: leaf ) collected in Montenegro from 27 October to 5 November 2001
Site Sample
code
Lichen species U yield
(%)
238U 234U 235U 236U 234U/238U 235U/238U 236U/238U FDU, %
Cape Arza L m1-1a Xanthoria parietina 108.9 0.8970.12 0.9770.12 0.0970.04 ND 1.0870.20 0.09770.050 ND ND
LB m1-1 — 73.0 15.270.5 7.3570.30 0.3470.06 0.0770.03 0.48470.026 0.02370.004 0.004970.0018 59.1
L m2-1a Parmelia subrudecta 94.5 7.3870.41 3.5970.27 0.2170.07 0.0470.04 0.48670.045 0.02870.010 0.005070.0048 58.8
LB m2-1 — 73.0 11.570.4 5.2170.25 0.3470.06 0.0570.03 0.45270.027 0.03070.005 0.004370.0022 62.8
Le m2-2 — 71.7 0.2570.03 0.2170.03 0.0170.01 ND 0.85070.170 0.04770.050 ND p 17.5
L m3-1a Parmotrema chinense 83.2 5.0270.34 3.5370.28 0.1370.06 ND 0.70370.073 0.02670.012 ND 34.1
LB m3-1 — 73.0 8.0670.33 5.1770.25 0.3970.07 ND 0.64170.041 0.04870.009 ND 41.2
Le m3-2 — 80.5 0.3070.03 0.2270.03 0.0170.01 ND 0.72470.127 0.03970.037 ND 31.7
M m4-1 — 102.6 16.470.7 10.370.5 0.4770.08 0.1170.03 0.62970.038 0.02870.005 0.006670.0021 42.6
Le m5-1 — 60.6 0.2370.05 0.1670.05 0.0170.02 ND 0.67770.266 0.05370.066 ND 37.2
L m5-2a Parmotrema chinense 85.1 7.3970.55 6.6870.51 0.3370.11 ND 0.90470.096 0.04470.015 ND p 11.4
L m 5-2b Parmotrema hypoleucinum 76.8 5.6670.47 4.5870.41 0.1570.08 ND 0.81070.100 0.02770.014 ND 22.0
L m 5-2b Parmotrema hypoleucinum 71.2 5.0370.22 5.1370.22 0.2970.05 ND 1.0270.06 0.05770.009 ND ND
LB m5-2 — 73.0 7.6070.26 5.8470.22 0.2870.04 0.0370.01 0.76870.039 0.03770.006 0.004070.0019 26.7
L m6-1a Parmelia subrudecta 73.0 23.370.7 12.070.4 0.7070.06 0.1170.02 0.51570.022 0.03070.003 0.004970.0010 55.6
L m6-1a Parmelia subrudecta 100.3 14.370.5 6.8070.27 0.3270.05 0.0570.02 0.47570.025 0.02270.004 0.003570.0015 60.1
L m6-2a Xanthoria parietina 98.0 15.970.5 7.3970.30 0.5270.07 0.0470.02 0.46470.025 0.03370.005 0.002570.0014 61.3
B m6-2a — 58.5 3.6570.19 1.1170.10 0.0670.03 0.0170.02 0.30670.031 0.01570.009 0.003170.0056 79.5
Le m6-4 — 62.5 0.2670.03 0.2070.03 0.0170.01 ND 0.75970.157 0.05570.053 ND 27.8
L m7-1a Parmelia borreri 87.0 78.374.1 13.271.0 0.5870.19 0.6170.17 0.16970.015 0.00770.002 0.007970.0022 95.1
L m7-1b Hypogymnia tubulosa 96.8 60.872.1 9.8570.51 0.7070.13 0.3470.08 0.16270.010 0.01170.002 0.005670.0014 95.9
L m7-1c Parmotrema chinense 71.5 79.274.5 13.171.1 1.5370.34 0.5270.18 0.16570.017 0.01970.004 0.006570.0023 95.5
LB m7-1 — 73.0 73.671.9 13.070.4 1.1570.09 0.4670.05 0.17670.007 0.01670.001 0.006270.0007 94.3
Le m7-2 — 74.9 0.2570.05 0.0470.04 0.0170.01 ND 0.16270.162 0.04570.049 ND 95.9
Le m7-3 — 83.4 0.1970.05 0.1370.05 0.0470.02 ND 0.68670.336 0.20470.113 ND 36.1
L m8-1 Parmelia soredians 29.2 36.771.5 7.1870.39 0.5870.10 0.2270.06 0.19670.013 0.01670.003 0.005970.0015 92.1
L m8-1 Parmelia soredians 61.2 61.272.7 11.970.7 0.7270.16 0.4270.11 0.19470.015 0.01270.003 0.006870.0018 92.2
B m8-1 — 101.0 19.670.8 3.3470.25 0.3270.08 0.1170.04 0.17070.015 0.01670.004 0.005770.0022 95.0
Le m8-2a — 67.7 0.2670.05 0.0970.05 0.0270.01 ND 0.35470.191 0.06070.057 ND 73.9
Le m8-2b — 73.0 3.7570.15 0.8870.07 0.0670.02 0.0270.01 0.23470.021 0.01570.005 0.004170.0029 87.7
L m9-1a Parmotrema chinense 97.1 52.171.8 11.170.6 0.9170.16 0.3270.09 0.21470.013 0.01770.003 0.006270.0017 90.0
B m9-1a — 66.9 11.070.6 1.8870.19 0.1470.06 0.0570.03 0.17070.019 0.01370.005 0.004370.0030 94.9
LB m9-1 — 73.0 45.871.4 11.770.5 0.7870.12 0.2470.06 0.25670.014 0.01770.003 0.005370.0014 85.1
Ls m10-1a Cladonia rangiformis 95.2 69.472.3 10.470.4 0.9570.10 0.3670.05 0.14970.008 0.01470.001 0.005370.0008 97.3
LB m10-1 — 73.0 656722 85.773.2 9.9370.66 4.9070.39 0.13170.007 0.01570.001 0.007570.0006 99.5
LB m10-1 — 66.8 704743 93.976.1 12.271.2 ND 0.13370.012 0.01770.002 ND 99.2
L m11-1 — 73.0 45.871.3 10.270.3 0.9070.08 0.2770.04 0.22270.010 0.02070.002 0.005970.0008 89.1
L m11-1 — 81.7 22.770.9 4.7270.26 0.5170.08 0.1170.03 0.20870.014 0.02270.004 0.005070.0015 90.6
Mean or
Range
78.0715.4 0.44570.285
0.19–704 0.04–93.9 0.011–12.2 ND-4.90 0.131–1.08 0.007–0.204 ND-0.0079 ND-99.5
G.
Jia
eta
l./
Ap
plied
Ra
dia
tion
an
dIso
top
es6
3(
20
05
)3
81
–3
99
392

ARTICLE IN PRESS
Table 10238U, 234U and 235U concentrations (in mBq l�1) in tap water (TW), well water (WW) and sea water (SW) samples collected in Serbia
and Montenegro in 2001
Sample code Water volume (l) U yield (%) 238U 234U 235U 234U/238U 235U/238U FDU (%)
TW6 0.500 86.2 4.5470.37 5.0970.39 0.3470.10 1.1270.13 0.07670.023 ND
WW7 0.500 85.6 1.1770.23 1.3170.24 0.0970.06 1.1270.30 0.07770.056 ND
TW8 0.500 91.3 16.270.8 23.371.0 0.8370.17 1.4470.10 0.05170.011 ND
TW13 0.990 61.8 5.2070.38 5.7970.40 0.2870.09 1.1170.11 0.05470.018 ND
WW14 1.000 60.9 0.5870.08 0.7470.08 0.0470.02 1.2670.22 0.07470.034 ND
WW15 1.000 63.0 0.4070.10 0.2770.09 0.0170.03 0.66070.277 0.03670.065 47.7
WW16 1.000 49.5 0.5270.11 0.4370.11 0.0270.03 0.81670.278 0.03670.065 32.3
WW17 1.000 54.5 0.6170.14 0.8670.15 0.0370.04 1.4170.39 0.04570.064 ND
WW23 1.000 61.3 21.970.9 28.171.2 0.8870.14 1.2870.08 0.04070.007 ND
WW27 1.000 40.1 0.5670.12 0.8370.14 0.0270.02 1.4770.40 0.04470.032 ND
SW12 0.500 75.3 44.471.8 49.772.0 2.2070.29 1.1270.06 0.05070.007 ND
Mean or range 0.500–1.000 66.3716.3 0.40–44.4 0.27–49.7 0.01–2.22 0.660–1.47 0.036–0.077 ND-47.7
Table 9238U, 234U and 235U concentrations (in mBq m�3) in air filter samples collected in Serbia and Montenegro in 2001
Sample code Air volume (m3) U yield (%) 238U 234U 235U 234U/238U 235U/238U FDU, %
AF 1-1 156 87.4 22.971.5 6.2070.77 0.4770.27 0.27170.038 0.02170.012 83.4
AF 1-3 156 89.6 19.171.1 6.7770.64 0.2670.18 0.35470.039 0.01470.010 74.0
AF 2-1 150 72.8 2.9670.49 3.2670.50 0.1970.19 1.1070.025 0.06470.067 ND
AF 2-2 150 74.6 2.3370.38 2.2270.38 0.1570.16 0.95370.225 0.06270.068 p5.7AF 2-3 150 74.5 3.0170.43 2.0170.38 0.0570.15 0.66970.159 0.01870.050 38.0
AF 3-1 116 74.2 7.9970.82 7.8770.82 0.3270.26 0.98570.144 0.04070.032 ND
AF 3-2 116 56.4 42.173.4 38.073.2 1.8370.84 0.90170.106 0.04470.020 p11.7AF 3-3 116 58.0 7.0070.95 6.8270.94 0.4270.36 0.97370.188 0.06070.052 ND
AF 4-1 130 56.9 8.3770.80 7.2170.74 0.2770.25 0.86170.136 0.03270.030 p16.2AF 4-2 130 52.5 4.9470.78 5.4470.81 0.5570.36 1.1070.024 0.11270.075 ND
AF 4-3 130 62.7 18.872.0 19.972.1 1.4770.67 1.0670.016 0.07870.037 ND
AF 5-1 130 51.1 10.871.1 10.071.0 0.3370.32 0.92370.133 0.03170.030 p9.2AF 5-2 130 47.0 8.6870.86 8.1170.83 0.3970.30 0.93470.160 0.04570.035 p7.9AF 5-3 130 57.7 4.2470.67 4.5970.69 0.0970.24 1.0870.024 0.02070.058 ND
AF 6-1 192 63.3 3.0470.44 1.3170.34 0.2270.18 0.42970.127 0.07370.060 65.3
AF 6-2 192 67.0 1.9970.32 0.9670.26 0.1970.19 0.48370.182 0.09670.098 59.2
AF 6-3 192 63.7 5.0270.47 1.1570.28 0.2870.16 0.22970.080 0.05670.041 88.3
Mean or range 116–192 65.1712.3 1.99–42.1 0.96–38.0 0.05–1.83 0.229–1.10 0.014–0.112 ND-88.3
G. Jia et al. / Applied Radiation and Isotopes 63 (2005) 381–399 393
available bio-indicators to monitor air pollution from
potentially toxic substances. In particular, lichens and
mosses are efficient accumulators of many elements,
including heavy metals and radionuclides that are
released into the atmosphere due to natural and human
activities. Since the 1960s, they have been successfully
employed to assess the global deposition of radio-
nuclides derived from atmospheric nuclear weapons
tests and atmospheric re-entry of nuclear powered
satellites (Holm and Persson, 1978). A large amount of
research has been carried out in particular to monitor
the radionuclides derived from the Chernobyl accident
of 1986 (Feige et al., 1990).
The remarkable capacity of lichens for accumulating
uranium and other pollutants is based on their intrinsic
biology, as they lack roots and outer protective organs,
such as stomata and cuticle, do not have access to soil
nutrient pools and mainly depend on both wet and dry
atmospheric deposition to obtain mineral nutrients.
Lichens are usually very long-lived, their morphology
does not vary with the seasons and accumulation of
pollutants can occur throughout the years. Mosses are

ARTICLE IN PRESS
0.1
1
10
100
1000
101238U concentration, Bq kg-1
234 U
conc
entr
atio
n, B
q kg
-1
[234U] = 0.994[238U] + 0.049
r = 0.987, n=30, P<0.001
lichenmoss
Fig. 2. 234U concentrations in lichen (K) and moss (J) samples
collected from Urbino (Central Italy) as a function of their 238U
concentration.
[235U] = 0.0392[238U] + 0.0481r = 0.748, n=30, P<0.001
0.001
0.01
0.1
1
10
100
1 10238U concentration, Bq kg-1
235 U
con
cent
rati
on, B
q kg
-1
lichen moss
Fig. 3. 235U concentrations in lichen (K) and moss (J) samples
collected from Urbino (Central Italy) as a function of their 238U
concentration.
G. Jia et al. / Applied Radiation and Isotopes 63 (2005) 381–399394
simple green land plants with leaves and a stem and
always without roots. Mosses depend upon external
moisture to transport nutrients. Many mosses assimilate
much of their nutrients and water through their tiny
leaves. Unlike the leaves of higher (flowering) plants,
which have a waxy covering called a cuticle, mosses lack
this protection. This allows mosses to take up water
quickly through their leaves during periods of rain or
high humidity, and to dry fast when the air dries. This
rapid and direct absorption is detrimental when the
moisture is laden with pollutants. Study of the elemental
composition has provided accord between atmospheric
element levels, element concentrations observed in the
lichen and moss tissues, and the exposure time of the
lichens and mosses to airborne pollutants (UNEP,
2002).
As shown in Table 4, the activity concentrations
of uranium isotopes in all tree trunk lichen samples
obtained at the control sites in central Italy were
detectable, values being in the range of
1.01–4.68Bq kg�1 for 238U, 0.85–5.17 Bqkg�1 for 234U
and 0.04–0.28 Bqkg�1 for 235U with a typical mean
activity ratio of 0.98470.082 for 234U/238U and
0.05370.021 for 235U/238U.The corresponding activity concentrations of
uranium isotopes (Table 4) in tree trunk moss samples
obtained at the control sites were in the range of
1.18–7.14Bq kg�1 for 238U, 1.15–7.69 Bqkg�1 for 234U
and 0.06–0.31 Bqkg�1 for 235U with a typical mean
activity ratio of 1.02770.082 for 234U/238U and
0.05770.024 for 235U/238U. As expected: (1) except for238U, 234U and 235U, other uranium isotopes in these
samples were not detectable and; (2) the uranium
isotopic concentrations in moss samples were similar in
value to that in lichens due to the fact that mosses are
ecologically and structurally closer to lichens than other
members of the plant kingdom.
If the 234U concentrations in lichens and mosses are
plotted against the 238U concentrations (Fig. 2) the
correlation equation is [234U] ¼ 0.994[238U]+0.049,
r ¼ 0:987, n ¼ 30;Po0:001; the very good linearity
correlation shows that the uranium sources in these
samples are the same. Fig. 3 shows the correlation
between 235U and 238U concentrations in these samples,
and the obtained equation is [235U] ¼ 0.0392[238U]+
0.0481, r ¼ 0:748; n ¼ 30;Po0:001. The results for 235Uare quite scattered due to its lower concentrations and
associated with this the high counting uncertainty, but
still show a positive correlation.
The radionuclides activity ratios in lichens and mosses
vary with the contamination source and they can be
utilized to identify the different release sources. The
natural composition is characterized by 234U/238U and235U/238U activity ratios of about 1.00 and 0.046,
respectively. Enriched uranium has higher 234U/238U
and 235U/238U ratios, whereas DU has lower 234U/238U
and 235U/238U ratios. The average ratios of 234U/238U
and 235U/238U in these lichens and mosses obtained from
Table 4 are 1.00970.098 and 0.05870.024, respectively.The value of the ratio 234U/238U of close to unity shows
that the uranium in the samples is mainly natural, but
there is a possible uranium contribution from fallout of
atmospheric nuclear weapon tests conducted in the
1950s and 1960s due to the higher 235U/238U ratio
(40.046).Due to their complex surface, slow growth rate and
slow metabolic activity, lichen and mosses are known to
strongly accumulate a great variety of radionuclides

ARTICLE IN PRESS
[234U ] = 0.941 [238U]0.777
r = 0.949, n =108, P<0.001
0.01
0.1
1
10
100
1000
0.1 1 10 100 1000238U concentration, Bq kg-1
234 U
con
cent
rati
on, B
q kg
-1
LichenBarkMossMushroomLeaf
Fig. 4. 234U concentrations in lichen (K), bark (m), moss (J),
mushroom (&) and leaf (� ) samples collected from Serbia and
Montenegro as a function of their 238U concentrations.
G. Jia et al. / Applied Radiation and Isotopes 63 (2005) 381–399 395
from atmospheric contamination with a very slow loss.
Early studies showed that the effective half-life of 137Cs
was 10 y in lichens and 4 y in mosses (Mihok et al.,
1989); as such, it seems that lichens are more effective
than mosses as accumulators of 137Cs airborne pollu-
tion. Conversely, from the data shown in Figs. 2 and 3 it
is seen that the uranium concentrations in these lichen
and moss samples are of the same level, therefore, the
accumulation effects of uranium in tree trunk lichens
and mosses are not distinguishable.
The uranium isotopic concentrations in tree trunk
lichen and moss, mushroom and bark samples collected
in Serbia and Montenegro are shown in Table 7 and 8,
values being in the range of 0.67–704Bqkg�1 for 238U,
0.48–93.9Bq kg�1 for 234U and 0.02–12.2Bq kg�1 for235U, showing that the uranium levels are higher than in
the samples collected at the control sites (Table 4).
Moreover, 236U is detectable in some of the samples.
The activity concentration ratios are in the range of
0.131–1.32 for 234U/238U, 0.007–0.141 for 235U/238U,
and not detectable (ND) �0.0098 for 236U/238U,
showing the existence of DU in some samples. Due to
the contribution from the substrate, the uranium activity
concentrations in lichens collected from soil or rock are
generally higher than in the tree trunk lichens, which
are in the range of 1.63–20.3 Bq kg�1 for 238U,
1.62–21.3Bq kg�1 for 234U and 0.10–1.30Bqkg�1 for235U; the activity concentration ratios are in the range of
0.592–1.12 for 234U/238U and 0.030–0.077 for 235U/238U.
These results also indicate the presence of DU in some
of the samples. The highest uranium activity concentra-
tions were found in the samples collected at the Cape
Arza site in Montenegro (704Bqkg�1 for 238U). It is
noted that at this site not only are the uranium contents
higher, but also DU is detectable in nearly all the
samples. These results reflect the intense battle that
occurred during the conflict at this site, the DU
penetrators hitting hard surfaces, shattering into dust
and then being dispersed in the air.
Pine tree leaves were also collected at the Cape Arza
site. The uranium isotopic concentration in the leaf
samples were much lower than that in other biological
samples, and were in the range of 0.19–3.75Bqkg�1
for 238U, 0.04–0.88 Bqkg�1 for 234U and 0.01–
0.06Bqkg�1 for 235U. The activity concentration ratios
were in the range of 0.162–0.850 for 234U/238U and
0.015–0.204 for 235U/238U. The samples were also all
DU positive.
Based on Eq. (2), the DU fractions in all the biological
samples have been calculated and the relevant results are
also given in Tables 7 and 8. It is shown that DU is
detectable at all seven monitoring sites, the highest DU
fraction of 99.5% being found in a mixed lichen and
bark sample at the Cape Arza site.
The mechanisms of trace element uptake and reten-
tion in lichens differ from species to species. In order to
distinguish the accumulation effect of uranium among
lichen species, the lichens have been classified as shown
in Tables 7 and 8. However, due to: (1) the limited
sample numbers, and; (2) large variation of the uranium
concentrations even in the same species, statistical
evaluation of the uranium accumulation effects in
different lichen species are still not possible. The
information is nevertheless very helpful for future
studies on the mechanism and accumulation effects of
DU in different lichen species.
Figs. 4 and 5 show the correlation between 234U
or 235U and 238U activity concentration in all the bio-
logical samples collected in Serbia and Montenegro,
being either expressed as a power regression as [234U] ¼
0.941[238U]0.777, r ¼ 0:949; n ¼ 108;Po0:001 and [235U]¼ 0.0527[238U]0.794, r ¼ 0:942; n ¼ 108; Po0:001 re-
spectively, or by linear regression as [234U] ¼ 0.134
[238U]+3.90, r ¼ 0:906; n ¼ 108;Po 0:001 and [235U] ¼0.0162[238U]+0.132, r ¼ 0:985; n ¼ 108;Po0:001. Com-paring the linear correlation between 234U and 238U
concentrations in Fig. 4 with that in Fig. 2, less good
correlation is obtained in Fig. 4. The high variability
found in the activity ratios of 234U/238U is as a result of
DU contamination in the samples, indicating that the
radiological impact of DU ordnance was site-specific
and that the contamination scenario was different in the
various parts of the investigated area. Carefully examin-
ing the results in Fig. 4, it seems that the results can
be classified into two or three parts. The results in
the upper part can be expressed by a linear regression
as [234U] ¼ 1.04[238U]�0.0947, r ¼ 0:997; n ¼ 55;Po0:001, which represent the samples uncontaminated byDU or containing mainly natural uranium similar to
Fig. 2; the results in the middle and lower parts concern
samples contaminated from DU or containing both

ARTICLE IN PRESS
[235U ] = 0.0527 [238U]0.794
r = 0.942, n =108, P<0.001
0.001
0.01
0.1
1
10
100
0.1 1 10 100 1000238U concentration, Bq kg-1
235 U
con
cent
rati
on, B
q kg
-1
LichenBarkMossMushroomLeaf
Fig. 5. 235U concentrations in lichen (K), bark (m), moss (J),
mushroom (&) and leaf (� ) samples collected from Serbia and
Montenegro as a function of their 238U concentrations.
G. Jia et al. / Applied Radiation and Isotopes 63 (2005) 381–399396
natural and DU. In summary, Figs. 4 and 5 provide a
representative description of uranium isotopic ratios for
the current environmental ecosystem in Serbia and
Montenegro following the Balkan conflict in 1999.
Moreover, the results from the field survey in Serbia
and Montenegro have clearly demonstrated that lichens,
mosses, mushrooms, leaves and barks are sensitive bio-
indicators of past airborne contamination of DU dust or
particles, in particular in areas where DU ammunition
has been used.
3.2. Uranium in air
The concentrations of uranium in air vary widely,
depending on the weather conditions and the uranium
content in soil. Example literature values are
0.9–5mBqm�3 in the United States and 0.02–18 mBqm�3
in Europe (UNSCEAR, 2000). The given reference value
is 1 mBqm�3 of 238U. Most of the natural uranium levels
will be in the range of 0.1–10mBqm�3.
As presented in Table 9, the uranium isotopic
concentrations in air obtained from the air filter samples
collected in Serbia and Montenegro are in the range of
1.99–42.1mBqm�3 for 238U, 0.96–38.0mBqm�3 for234U, and 0.05–1.83mBqm�3 for 235U, which are in the
typical range of natural uranium values.
The highest value (AF 3-2) was found in the samples
collected at Bratoselce. At this site the highest value of
natural uranium concentrations in soil were also
measured (UNEP, 2002). The lowest uranium concen-
trations and also the lowest 234U/238U activity ratios
were measured in Cape Arza, which is located near the
sea. It is well known that at coastal locations uranium
concentrations in air may be an order of magnitude
lower than in continental or industrialized areas, which
explains the low uranium concentration.
Based on Eq. (2), the DU fractions in air samples have
also been calculated (Table 9). It is interesting to note
that although the detected uranium isotopic concentra-
tions in all the collected air samples are within the
typical range of natural uranium values, the 234U/238U
activity ratio analyses strongly indicate DU to be
contained in two air samples from Pljackovica (AF
1–1 and AF 1–3), one each from Borovac (AF 2–3),
Bratoselce (AF 3–2) and Bukurevac (AF 4–1), and
three from Cape Arza (AF 6–1, AF 6–2, AF 6–3).
The specific activities of DU in the samples at
the Pljackovica and Cape Arza sites have been found
to be higher than the specific activities of natural
occurring uranium. The existence of DU in air can only
be explained by resuspension of DU contaminated
particles and/or soil. This fact agrees well with the
widespread DU contamination detected in the biological
samples.
The risk assessment to the public from exposure to
DU is mainly associated with its radiological (external
and internal exposures) and chemical effects (chemical
toxicity), with dependency on physical and chemical
behaviour of DU, concentration level in the environ-
ment, uptake in the body and so on. As far as
radiological risk is concerned, inhalation of DU from
air is one of the most important pathways. Based
on the respiratory volume of air for reference man
(23m3 d�1), the committed effective dose conversion
factors for uranium isotopes (insoluble uranium: slow
clearance from lung) (8.0� 10�6 SvBq�1 for 238U,
9.6� 10�6 SvBq�1 for 234U and 8.5� 10�6 SvBq�1 for235U) and the DU concentration in air (in mBqm�3), the
annual committed effective dose due to the inhalation of
DU from air as estimated on a worst-case scenario
assuming that a person lives continuously in the place
where the maximum concentration of DU in air was
detected (Pljackovica) is 1.73mSv (1.28 mSv from 238U,
0.42mSv from 234U and 0.03 mSv from 235U) (ICRP,
1974; EU, 1996). The ICRP-recommended subsidiary
dose limit for critical groups and the principal dose
limit for public are 5 and 1mSv y�1, respectively
(ICRP, 1977). Therefore, the dose due to the inhala-
tion of DU from air in Serbia and Montenegro is
insignificant.
One also has to consider that the air samples were
collected under dry warm weather condition at moderate
wind speed. At higher wind speed the concentrations of
DU in air might be higher, while in damp, rainy weather
the DU particles are washed out from the air and
deposited on the ground. However, given the entire
range of climatic possibilities, the DU concentrations in
air at the investigated sites would almost certainly have
never been so high that the resulting dose would have
been significant.

ARTICLE IN PRESSG. Jia et al. / Applied Radiation and Isotopes 63 (2005) 381–399 397
3.3. Uranium in water
Uranium concentrations in natural waters vary from
region to region due to the different rocks composing
the aquifer, the water composition, the distance from
uraniferous areas and climatic and agricultural condi-
tions that prevail. The values ranged widely, fromo0.01to 150Bq l�1. It is reported that the typical 234U/238U
activity ratios in natural water samples range from 0.8 to
10, while 235U/238U activity ratio is thought to have a
quite uniform value of about 0.046 (Goldstein et al.,
1997). For comparison Table 6 shows the uranium
isotopic concentrations in drinking water, filtered river
water and seawater samples collected in central Italy as
control sites. It is seen that the uranium concentrations
in Tireno and Adriatic seawaters are medium high and
constant with a mean ratio of 1.1570.06 for 234U/238Uand 0.05470.008 for 235U/238U. Conversely, the ura-
nium concentrations in drinking and river waters vary
considerably and range from 0.30 to 103mBq l�1 for238U, from 0.49 to 135mBq l�1 for 234U, and from 0.02
to 4.82mBq l�1 for 235U. The mean activity ratios are
1.3570.19 for 234U/238U and 0.05070.009 for235U/238U. All the data in Table 6 indicate character-
istics of natural uranium. The WHO have derived a
guideline for drinking water uranium quality of 2mg l�1
(24.9mBq 238U l�1) and the value is considered to be
protective for sub-clinical renal effects reported in
epidemiological study (WHO, 1998). From Table 6 it
is seen that the uranium concentrations in some drinking
waters are above the derived guideline value. Most of
the drinking waters in Table 6 are mineral water.
Geological conditions, where there is high radiation
background, high concentration of organic matter, iron
hydroxide, carbonaceous material, clay minerals or
sulphides, are the most important factors for the
uranium concentration variation in drinking water. In
some parts of Italy, especially in the volcanic regions,
minerals contain high level of natural uranium and
thorium. Due to the complex and/or redox reactions in
water, some uranium can be leached out and take on a
soluble form, for instance, uranyl carbonate (UO2CO3)
which is formed by the action of CO2 under pressure on
UO22+ and stable up to 500 1C (Partington, 1966). This
could be the reason why the uranium concentrations in
some Italian mineral waters are significant.
During the field mission in Serbia and Montenegro
great attention has been paid to the possible water
contamination of DU. The results of the uranium assay
in the water samples collected in Serbia and Montenegro
are presented in Table 10. From these results, it can be
concluded that the uranium concentrations are much
lower than those in mineral water found in central Italy
(Table 6). The activity concentrations range from 0.40 to
21.9mBq l�1 for 238U, from 0.27 to 28.1mBq l�1 for234U and from 0.01 to 0.88mBq l�1 for 235U. The mean
activity ratios range from 0.660 to 1.47 for 234U/238U
and from 0.036 to 0.077 for 235U/238U. The low
concentrations and solubility of uranium in rocks and
soils are the cause of low uranium concentration in the
waters. The activity ratios for these samples, except for
WW15 and WW16, are consistent with a predominantly
natural source of uranium for almost the entire set of
samples. However, two samples collected from a private
well at Borovac (WW15 and WW16) show low234U/238U activity ratios of 0.660 and 0.816, and the
estimated DU fractions (m/m) in the two samples are
47.7 and 32.3%, respectively, indicating the possible
presence of anthropogenic contribution of DU in the
samples. The low uranium concentrations associated
with the high relative uncertainty in the two samples
reflects poor counting statistics, therefore further in-
vestigation on the two sites is necessary.
Based on the information currently available, the
uranium concentrations in Serbia and Montenegro
waters are below the guideline derived by WHO for
drinking water. Therefore, the uranium isotopes in these
waters do not constitute a risk to health at the present
time from the radiotoxicological point of view. How-
ever, in some cases the aquifer depth is very close to the
ground surface, as a result of which the filtering action
of soil might be reduced and DU leached from the
buried penetrators and fragments might reach the
groundwater system. Previous study has indicated that
DU, when it occurs in small fragments or as dust
particles, is more easily dissolved than uranium in
mineral lattices (Sansone et al., 2001). Thus, it has
higher mobility than natural uranium and the extent of
the migration of the dissolved DU through the soil
profile could represent a potential risk of future
contamination of the underground aquifers. Since only
limited numbers of samples have been collected in the
areas where DU ordnance was used, groundwater used
for drinking should be checked in future to increase the
confidence with regard to results observed during the
fields studies in Serbia and Montenegro (UNEP, 2002).
4. Conclusion
The uranium isotopic concentrations in biological
samples collected in Serbia and Montenegro, mainly
lichens and barks, are in the range of 0.67–704Bqkg�1
for 238U, 0.48–93.9Bq kg�1 for 234U and 0.02–
12.2Bq kg�1 for 235U, showing that the uranium levels
are higher than in the samples collected at the control
site. Moreover, the 236U in some of the samples is
detectable. The isotopic ratios of 234U/238U show that
DU is detectable in many biological samples at all
examined sites, especially in Montenegro, indicating the
widespread ground-surface DU contamination, albeit at
very low level. The presence of DU in the biological
ARTICLE IN PRESSG. Jia et al. / Applied Radiation and Isotopes 63 (2005) 381–399398
samples was as a result of DU contamination in air. The
air contamination sources could be: (1) direct DU
contamination, i.e. at least some of the penetrators hit
hard surfaces, shattered into dust and dispersed in air
during the conflict, and/or; (2) indirect DU contamina-
tion, i.e. resuspension of DU contaminated surface soil
after the conflict. The radiological survey also shows
that lichens, and in addition barks, are sensitive bio-
indicators of past airborne contamination of DU dust or
aerosol particles generated at the time of conflict by DU
penetrators.
The uranium isotopic concentrations in air obtained
from the air filter samples collected in Serbia and
Montenegro are in the range of 1.99–42.1 mBqm�3
for 238U, 0.96–38.0 mBqm�3 for 234U and 0.05–
1.83mBqm�3 for 235U, which are in the typical range
of natural uranium values. Thus said, most of the air
filter samples are DU positive, a fact agreeing well with
the widespread DU contamination detected in the
biological samples.
The uranium concentrations in water samples col-
lected in Serbia and Montenegro are in the range of
0.40–21.9mBq l�1 for 238U, 0.27–28.1mBq l�1 for 234U
and 0.01–0.88mBq l�1 for 235U, which are much lower
than those in mineral water found in central Italy
and below the guideline derived by WHO for drinking
water.
From a radiotoxicological of view, at this moment
there is no significant radiological risk related to these
investigated sites in terms of possible DU contamination
of water, air and/or plants.
References
Bleise, A., Danesi, P.R., Burkart, W., 2003. Properties, use and
health effects of depleted uranium (DU): a general overview.
J. Environ. Radioactiv. 64, 93–112.
Cantaluppi, C., Degeto, S., 2000. Civil and military use of
depleted uranium: environmental and health problems. In:
Proceedings of the XXXI AIRP National Congress, 20–22
September 2000, Ancona, pp. 47–57 (in Italian).
CHPPM, 2000. Health risk assessment consultation No. 26-
MF-7555-00D, Depleted uranium-Human exposure assess-
ment and health risk characterization in support of the
environmental exposure report ‘‘Depleted uranium in the
Gulf’’ of the Office of the Special Assistant to the Secretary
of Defense for Gulf War Illnesses, Medical Readiness, and
Military Deployments (OSAGWI), OSAGWI Levels I, II,
and III Scenarios, 15 September 2000.
EU, 1996. Council Directive 96/29EURATOM OF 13 May
1996 laying down the basic safety standards of the
protection of workers and the general public against the
dangers arising from ionizing radiation. Official J. Eur.
Commun. L 159 39 26 June 1996.
Feige, G.B., Niemann, L., Jahnke, S., 1990. Lichen and mosses-
silent chronists of the Chernobyl accident. Bibliotheca
Lichenologica 38, 63–77.
Goldstein, S.J., Rodriguez, M.J., Lujan, N., 1997.
Measurement and application of uranium isotopes
for human and environmental monitoring. Health Phys.
72, 10–18.
Hamilton, E.I., 2001. Depleted uranium (DU): a holistic
consideration of DU and related matters. Sci. Total
Environ. 281, 5–21.
Holm, E., Persson, R.B.R., 1978. Global fallout of curium.
Nature 273, 289–290.
ICRP, 1974. Report of the Task Group on Reference
Man, 1974. Commission on Radiation Protection
(ICRP), publication No 23. Pergamon Press, Oxford,
pp. 346.
ICRP, 1977. Recommendations of the International Commis-
sion on Radiological Protection. ICRP Publication No. 26.
Pergamon Press, Oxford, pp. 53.
Invanovich, M., Harmon, R.S. (Eds.), 1992. Uranium-Series
Disequilibrium: Applications to Earth, Marine, and Envir-
onmental Sciences, Second ed. Clarendon Press, Oxford,
pp. 290–333.
Jia, G., Desideri, D., Guerra, F., Meli, M.A., Testa, C., 1997.
Concentration and vertical distribution of plutonium and
americium in Italian mosses and lichens. J. Radioanal. Nucl.
Chem. 222 (1), 3–9.
Jia, G., Belli, M., Sansone, U., Rosamilia, S., Ocone, R.,
Gaudino, S., 2002. The determination of uranium isotopes
in environmental samples by alpha-spectrometry. J. Radio-
anal. Nucl. Chem. 253 (3), 395–406.
Jia, G., Belli, M., Sansone, U., Rosamilia, S., Gaudino, S.,
2004a. Concentration, distribution and characteristics of
depleted uranium in the Kosovo ecosystem: a comparison
with the uranium behaviour in the environment unconta-
minated by DU. J. Radioanal. Nucl. Chem. 260 (3),
481–493.
Jia, G., Torri, G., Innocenzi, P., 2004b. An improved method
for determination of uranium isotopes in environmental
samples by alpha-spectrometry. J. Radioanal. Nucl. Chem.
262 (2), 433–441.
Magnoni, M., Bertino, S., Bellotto, B., Campi, M., 2001.
Variations of the isotopic ratios of uranium in environ-
mental samples containing traces of depleted uranium:
theoretical and experimental aspects. Radiat. Protect.
Dosimetry 97 (4), 337–340.
Mihok, S., Schwartz, B., Wiewel, A.M., 1989. Bioconcentration
of fallout 137Cs by fungi and red-backed voles. Health Phys.
57, 959–966.
Nellis, 1997. Resumption of use of depleted uranium rounds at
Nellis Air Force Range. Target 63–10. US Army Corps of
Engineers, Nebraska. Draft June 1997.
Partington, J.R., 1966. General and Inorganic Chemistry.
Fourth ed, Macmillan London, Toronto ST Martiu’s press,
Melbourne, New york, pp. 760B.
Rand, 1999. In: Harley, N.H., Foulkes, E.C., Hilborne, L.H.,
Hudson, A., Anthony, C.R. (Eds.), A review of the scientific
literature as it pertains to Gulf war illnesses. RAND.
Washington, USA. 1999. http://www.gulflink.osd.mil/
library/randrep/Rodushkin et al. 1999. Determination of
plutonium concentration and isotopic ratio on environ-
mental samples with a double-focusing sector field ICP-MS.
Nuclear Instruments Methods on Physics Research, Section
A 423, 472–479.

ARTICLE IN PRESSG. Jia et al. / Applied Radiation and Isotopes 63 (2005) 381–399 399
Sansone, U., Danesi, P.R., Barbizzi, S., Belli, M., Campbell,
M., Gaudino, S., Jia, G., Ocone, R., Pati, A., Rosamilia, S.,
Stellato, L., 2001. Radioecological survey in the areas
targeted by depleted uranium ammunitions during the 1999
Balkans conflict. Sci. Total Environ. 281 (1–3), 23–35.
UNEP, 2001. Depleted uranium in Kosovo: post-conflict
environmental assessment. First published in Switzerland
in 2001 by UNEP.
UNEP, 2002. Depleted uranium in Serbia and Montenegro:
post-conflict environmental assessment in the Federal
Republic of Yugoslavia. First published in Switzerland in
2002 by UNEP.
UNSCEAR, 2000. Sources and effects of ionizing radiation.
United Nations Scientific Committee on the Effects of
Atomic Radiation Report to the General Assembly, with
scientific annexes. Vol. 1, United Nations, New York, 2000,
pp. 123, ISBN: 92-1142238-8.
USAEPI, 1994. Health and environmental consequences of
depleted uranium use by US Army. Technical Report, June
1995. Army Environmental Policy Institute. Champaign,
Illinois, 1994.
WHO, 1998. Guideline for drinking water quality. Addendum
to Volume 2: Health criteria and other supporting informa-
tion, Second ed. Geneva (1998), Switzerland.