computer-aided analysis of formation pressure integrity
TRANSCRIPT

Louisiana State UniversityLSU Digital Commons
LSU Historical Dissertations and Theses Graduate School
1986
Computer-Aided Analysis of Formation PressureIntegrity Tests Used in Oil Well Drilling.Mauricio Aguiar AlmeidaLouisiana State University and Agricultural & Mechanical College
Follow this and additional works at: https://digitalcommons.lsu.edu/gradschool_disstheses
This Dissertation is brought to you for free and open access by the Graduate School at LSU Digital Commons. It has been accepted for inclusion inLSU Historical Dissertations and Theses by an authorized administrator of LSU Digital Commons. For more information, please [email protected].
Recommended CitationAlmeida, Mauricio Aguiar, "Computer-Aided Analysis of Formation Pressure Integrity Tests Used in Oil Well Drilling." (1986). LSUHistorical Dissertations and Theses. 4277.https://digitalcommons.lsu.edu/gradschool_disstheses/4277
INFORMATION TO USERS
While the most advanced technology has been used to photograph and reproduce this manuscript, the quality of the reproduction is heavily dependent upon the quality of the material submitted. For example:
• Manuscript pages may have indistinct print. In such cases, the best available copy has been filmed.
• Manuscripts may not always be complete. In such cases, a note will indicate that it is not possible to obtain missing pages.
• Copyrighted material may have been removed from the manuscript. In such cases, a note will indicate the deletion.
Oversize materials (e.g., maps, drawings, and charts) are photographed by sectioning the original, beginning at the upper left-hand corner and continuing from left to right in equal sections with small overlaps. Each oversize page is also filmed as one exposure and is available, for an additional charge, as a standard 35mm slide or as a 17”x 23” black and white photographic print.
Most photographs reproduce acceptably on positive microfilm or microfiche but lack the clarity on xerographic copies made from the microfilm. For an additional charge, 35mm slides of 6”x 9” black and white photographic prints are available for any photographs or illustrations that cannot be reproduced satisfactorily by xerography.
R e p ro d u c e d with p e rm is s io n of th e co p y rig h t ow ner. F u rth e r re p ro d u c tio n p roh ib ited w ithou t p e rm iss io n .

Reproduced with permission of the copyright owner. Further reproduction prohibited without permission.
8710540
Almeida, M auricio Aguiar
COMPUTER-AIDED ANALYSIS OF FORMATION PRESSURE INTEGRITY TESTS USED IN OIL WELL DRILLING
The Louisiana State University and Agricultural and Mechanical Col. Ph.D.
UniversityMicrofilms
International 300 N. Zeeb Road, Ann Arbor, Ml 48106
1986
R e p ro d u c e d with p e rm is s io n of th e co p y rig h t ow ner. F u rth e r re p ro d u c tio n p ro h ib ited w ithou t p e rm iss io n .

Reproduced with permission of the copyright owner. Further reproduction prohibited without permission.

PLEASE NOTE:
In all cases this material has been filmed in the best possible way from the available copy. Problems encountered with this document have been identified here with a check mark V .
1. Glossy photographs or pages_____
2. Colored illustrations, paper or print______
3. Photographs with dark background_____
4. Illustrations are poor copy______
5. Pages with black marks, not original copy______
6. Print shows through as there is text on both sides of p a g e _______
7. Indistinct, broken or small print on several pages
8. Print exceeds margin requirements______
9. Tightly bound copy with print lost in sp ine_______
10. Computer printout pages with indistinct print _
11. Page(s)____________lacking when material received, and not available from school orauthor.
12. Page(s)___________ seem to be missing in numbering only as text follows.
13. Two pages num bered . Text follows.
i 4. Curling and wrinkled pages______
15. Dissertation contains pages with print at a slant, filmed a s received_________
16. Other_______________________________________________________________________
UniversityMicrofilms
International
R e p ro d u c e d with p e rm iss io n of th e co p y rig h t ow ner. F u rth e r re p ro d u c tio n p roh ib ited w ithou t p e rm iss io n .

Reproduced with permission of the copyright owner. Further reproduction prohibited without permission.

COMPUTER-AIDED ANALYSIS OF FORMATION PRESSURE INTEGRITY TESTS USED IN OIL WELL DRILLING
A Dissertation
S ubm itted to th e G raduate F acu lty of the Louisiana S ta te U niversity and
A gricultural and M echanical College in partia l fulfillm ent of th e
requ irem en ts for the degree of Doctor of Philosophy
The Department of Petroleum Engineering
_by
M auriclo de Aguiar A lm eidaB.S., Fundacao Tecnico-Educacional Souza M arques, 1978
M . S., Louisiana S ta te U niversity , 1985
December 1986
R e p ro d u c e d with p e rm iss io n of th e co p y rig h t o w n er. F u rth e r re p ro d u c tio n p ro h ib ited w ithou t p e rm iss io n .
ACKN0W1 JUDGEMENTS
I am g ratefu lly indebted to Professor Dr. Adam T. Bourgoyne,
J r . , Chairm an of m y G raduate Committee, u nder w hose supervision
th is w ork w as accomplished, for his helpful guidance and
indefatigable assistance. I also w ish to th a n k Dr. William Holden, Dr.
W hitehead, Dennis, and th e staff of th e Petroleum Engineering
D epartm ent a t Louisiana S ta te U niversity , for th e ir assistance.
1 am also gratefu l for th e assistance furnished b y Petroleo
Brasileiro S. A.-PETROBRAS w hich m ade it possible to pu rsue th is
p ro ject on a fu ll-tim e basis. Due th an k s a re extended to th e offshore
division of Tenneco Oil Company for furn ish ing th e field d a ta used in
th is work.
Special g ra titude is given to m y m o th er and fa th e r w hose
encouragem ent and understanding w ere invaluable aids th roughou t
m y education.
Special th a n k s to m y friend M rs. Teresa Casariego w ho typed
th is work; to m y friends in Baton Rouge, LA., I a m also registering
m y sincere appreciation.
Finally, I a m specially dedicating th is dissertation to m y wife,
F atim a, an d m y children Thais (6Vfe) and Priscila (4fc), for th e ir love,
and encouragem ent, during th e extended course of th is work.
R e p ro d u c e d with p e rm iss io n of th e co p y rig h t ow ner. F u rth e r re p ro d u c tio n p roh ib ited w ithou t p e rm iss io n .
TABLE OF CONTENTS
Page
A cknow ledgem ents........................................................................................ ii
List of F ig u re s ..................................................................................................vii
List of T a b le s ................................................................................................. xii
A b s t r a c t ............................................................................................................ xiii
INTRODUCTION ................................................................................................ 1
UTERATURE REVIEW .................................................................................. 12Factors Affecting F rac tu re In itiation P re s s u re ............................ 12
Subsurface S tress F ie ld .................................................................. 13H ydraulic F ractu ring M e c h a n is m ............................................. 16Cylindrical Borehole E ffe c t............................................................ 18O verburden S t r e s s ............................................................................ 21P enetra ting V ersus N onpenetra ting F ractu ring F lu id s 25Tensile S treng th of R o ck ................................................................ 30Jo in ts and F au lts N ear th e Well B o re ..................................... 32Form ation Pore P re s s u r e ............................................................... 35
Correlations for F rac tu re P ressure P red ic tio n ............................ 36
F rac tu re E xpansion .............................................................................. 49
S y stem Overall C om pressib ility ....................................................... 61M ud C om pressib ility ...................................................................... 63Drill Pipe an d Drill Collar E x p an sio n ......................................... 65Casing E xpan sio n ............................................................................. 65
Casing Not C em en te d ................................................................ 67Casing C em en te d ........................................................................ 68
F il t r a t io n ............................................................................................ 69Borehole E x p an sio n ........................................................................ 72N on-Newtonian Fluid Flow E ffe c ts ........................................... 74
F rac tu re C losure.................................................................................... 78
i i i
R e p ro d u c e d with p e rm is s io n of th e co p y rig h t ow ner. F u rth e r re p ro d u c tio n p ro h ib ited w ithou t p e rm iss io n .
TABLE OF CONTENTS (continued)
Page
PROPOSED MATHEMATICAL MODEL....................................................... 82Overall Compressibility M o d e l........................................................... 82
Borehole E xpansion .......................................................................... 84
F rac tu re Induction M o d e l................................................................... 87V ertical F rac tu re I n it ia t io n .......................................................... 93Horizontal F rac tu re In it ia t io n ..................................................... 94Biot's Constant.................................................................................... 95Poisson’s R a t io ................................................................................... 97O verburden S t r e s s ........................................................................... 99General A ssum ptions ...................................................................... 100
F rac tu re Expansion M o d e l................................................................. 102Fluid-Loss R a t e ................................................................................. 105F rac tu re A rea................................................................................... 105Differential Equation....................................................................... 105No-Fluid-Loss Solution.................................................................... 107Large-Fluid-Loss Solution.............................................................. 110N um erical Solution.......................................................................... IllF rac tu re W idth V ariation W ith Distance............................... 112Proposed S o lu tio n ........................................................................... 114Elastic C o n s tan ts ............................................................................ 116
F rac tu re Closure M o d e l..................................................................... 117Fluid-Loss Coefficient.................................................................... 125
COMPUTER MODEL .................................................................................... 128F e a tu r e s ................................................................................................. 128In pu t P a ram e te rs ................................................................................. 134O utput P a r a m e te r s ............................................................................ 136
Data File O rgan iza tion ...................................................................... 136
Curve-M atching T e ch n iq u e ............................................................. 136
Leak-Off Test D esign........................................................................... 138In tro d u c tio n .................................................................................... 138Exam ple D esign .............................................................................. 139
i v
R e p ro d u c e d with p e rm is s io n of th e co p y rig h t ow ner. F u rth e r re p ro d u c tio n p roh ib ited w ithou t p e rm iss io n .
TABLE OF CONTENTS (continued)
Page
Open-hole se c tio n ...................................................................... 139Bit depth drilling tim e and circulation tim e .................... 139Surface porosity and porosity decline co n stan t.............. 143Pore p r e s s u re ............................................................................. 145Elastic constants of rock ........................................................ 145Cem enting j o b ............................................................................ 147
Total injected v o lu m e ............................................................. 147Pressure-decline p e r io d .......................................................... 148Drilling f lu id ................................................................................ 148F low -rate selection .................................................................. 148Expected c u r v e ........................................................................... 150
Test P ro ced u re s ..................................................................................... 150
VERIFICATION OF COMPUTER MODEL USING FIELD DATA ............... 155Selected W e lls ........................................................................................ 156Computed P a ra m e te r s ........................................................................ 161
Biot’s C o n s ta n t....................................... :......................................... 161Poisson's R a t io ................................................................................. 161Surface Porosity and th e Porosity-Decline Constant 163Young's M o d u lu s ............................................................................ 163
Field Data A n a ly s is ............................................................................. 166
S ensitiv ity Analysis Of The M o d e l................................................ 176Flow R ate.......................................................................................... 176Poisson’s R a t io ................................................................................ 178Bulk S hear M o d u lu s ..................................................................... 178F rac tu re H e ig h t............................................................................. 180Borehole Expansion M odel............................................................ 183Pore P re s s u re ................................................................................. 183M ud V isco s ity ................................................................................ 183Well D iam e te r............................................................................... 186Top-of-Cement D e p th ................................................................... 186M icro -an n u lu s .............................................................................. 190W ater-L oss ...................................................................................... 190
SUMMARY AND CONCLUSIONS............................................................ 195Conclusions.......................................................................................... 196
v
R e p ro d u c e d with p e rm iss io n of th e co p y rig h t ow ner. F u rth e r re p ro d u c tio n p roh ib ited w ithou t p e rm iss io n .

TABLE OF CONTENTS (continued)
Page
R ecom m endations................................................................................ 200
NOMENCLATURE.......................................................................................... 201
REFERENCES.................................................................................................. 204
APPENDIX A: DERIVATION OF FRACTURE-1NDUCT10NEQUATIONS.......................................................................... 209
APPENDIX B: DERIVATION OF THE OVERBURDEN STRESSEQUATION ............................................................................ 216
APPENDIX C: FLOW RATE THROUGH AN ELLIPTICAL CROSSSECTIONAL AREA ............................................................... 219
APPENDIX D: FRACTURE AREA ............................................................... 224
APPENDIX E: SOLUTION FOR LARGE FLUID-LOSS RATE ................... 225
APPENDIX F: DESCRIPTION OF THE DATAFILE FOR THECOMPUTER PROGRAM LEAK ........................................... 228
APPENDIX G: ELASTIC-PLASTIC SOLUTION OF A HOLLOWCYLINDER ............................................................................ 233
APPENDIX H: FRACTURE-CLOSURE PRESSURE.................................... 237
v i
R e p ro d u c e d with p e rm iss io n of th e co p y rig h t ow ner. F u rth e r re p ro d u c tio n p roh ib ited w ithou t p e rm iss io n .

LIST OF FIGURES
F ig u re Page
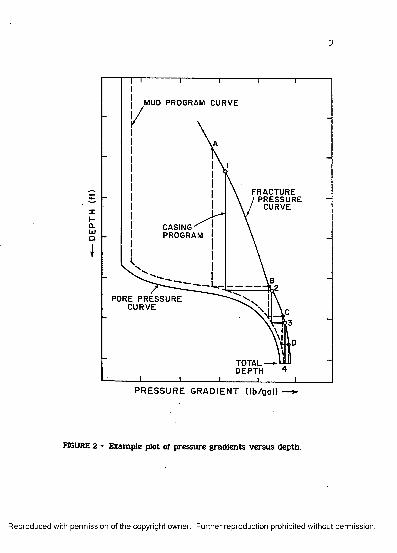
1 Schem atic showing th e form ation w ith th e lowest fra c tu re p ressu re ju s t below th e la st casing sea t and th e form ation w ith th e highest pore p ressure fo rm ation a t th e holebo ttom ........................................................................................................... 2
2 Exam ple plot of p ressu re grad ien ts ve rsu s d ep th ......................... 3
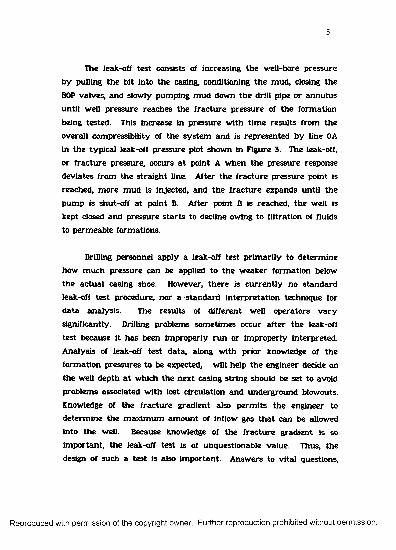
3 Typical leak-off p ressu re plot for a w ell w ith a sh o rt openhole section ................................................................................................. 6
4 S tress d istribu tion in re la tive ly young deltaic sedim ents 14
5 S chem atic showing th e fra c tu re in itia tion m echan ism 17
6 S tress s ta te s a round a borehole for regional-stress ratiosTy / Tx of 1.4, 2.0, 3.0, and 1.0............................................................... 19
7 Effect of w all thickness on in te rn a l bu rsting p ressu re ofhollow rock cylinders.............................................................................. 22
8 O verburden s tress grad ien t v e rsu s dep th for n o rm a llycom pacted Gulf Coast fo rm ations........................................................ 24
9 Exam ple of offshore frac tu re g rad ien ts ............................................. 26
10 Possible d istribution of pore fluid p ressu re around th eborehole....................................................................................................... 28
11 G raph of bu rsting p ressure v e rsu s hole d iam ete r forthick-w alled hollow cylinders of lim estones................................... 31
12 F rac tu re p ressu re v e rsu s radial confining s tress forB andera sandstone .................................................................................. 33
13 M atth ew s and Kelly m a tr ix s tress coefficient forn o rm a lly pressured fo rm ations.......................................................... 39
v i i
R e p ro d u c e d with p e rm is s io n of th e co p y rig h t ow ner. F u rth e r re p ro d u c tio n p roh ib ited w ithou t p e rm iss io n .
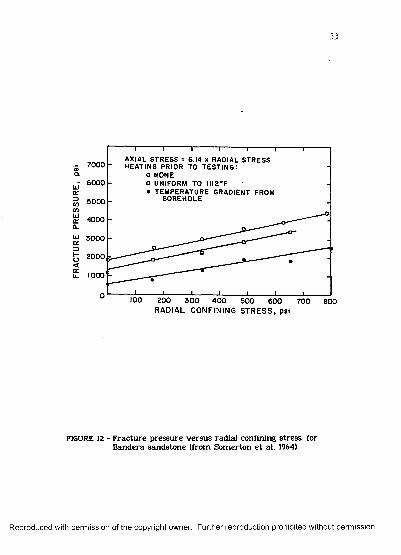
Figure Page
14 K function versu s dep th used in estim ating frac tu re g rad ien ts ..................................................................................................... 41
15 V ariation in overburden g rad ien ts w ith geologic age................. 42
16 V ariations of Poisson ra tio w ith d ep th ............................................ 43
17 S tress ra tio v ersu s rock d en sity ........................................................ 45
18 Poisson ra tio v ersu s shale index........................................................ 47
19 Correlation of th e effective horizontal s tress gradient ve rsu s th e effective v ertica l s tress g rad ien t for th ew este rn and cen tra l Gulf of M exico................................................ 48
20 Two simplified possibilities for th e geom etry of ah y d rau lic f ra c tu re ................................................................................. 50
21 P ressure d a ta v ersu s tim e ................................................................... 56
22 Examples showing different cha racte ris tic slopes........................ 58
23 Exam ple of a three-d im ensional f ra c tu re profile........................ 60
24 Typical w ell configuration during a leak-off te s t ........................ 62
25 Typical s tress -stra in d iagram for stee l .............................. 66
26 Exam ple of bonding betw een casing cem en t andfo rm ation .................................................................................................. 70
27 Exam ple of a leak-off te s t perfo rm ed in a well drilled inth e Louisiana Gulf Coast a re a ............................................................ 73
28 Typical pressure-flow ra te response for th e flow ofdrilling fluids........................................................................................... 76
29 Illustration of p ressu re te rm s used for p ressu re declineana ly sis ..................................................................................................... 81
30 P artia l yielding of a thick w alled cy linder................................... 86v i i i
R e p ro d u c e d w ith p e rm is s io n of th e c o p y rig h t o w n er. F u rth e r re p ro d u c tio n p ro h ib ited w ith o u t p e rm iss io n .
Figure Page
31 V ariation of th e Poisson ra tio w ith dep th ..................................... 98
32 F rac tu re geom etry for th e proposed com puter Model 103
33 Dimensionless solutions for th e m ax im um frac tu re w id thas a function of tim e ............................................................................ 108
34 Dimensionless solutions for th e fra c tu re length as afunction of tim e ..................................................................................... 109
35 V ariation of m ax im u m frac tu re w id th w ith d istancefrom w ell................................................................................................. 113
36 Function f j( 6 ) and f2( 6 ) v e rsu s th e dim ensionless tim ep a ram e te rs .............................................................................................. 123
37 Flow c h a r t of th e com puter program LEAK................................. 129
38 Example ou tp u t of a sim ulated leak-off te st plot....................... 131
39 The effect of trapped a ir on a leak-off te s t .................................. 132
40 The m enu display of th e p rog ram .................................................. 133
41 Example well configuration................................................................ 140
42 Porosity versu s dep th for th e EI-215-D-1 well drilled inLouisiana Gulf Coast a re a ................................................................... 146
43 User’s m en u for an exam ple. Form ation in teg rity te st a ta 9-5/8" casing se a t.............................................................................. 149
44 Expected p ressure v ersu s tim e cu rv e for in th e exam pleleak-off te s t design-^4=0.25 3PM....................................................... 151
45 Expected p ressure v ersu s tim e cu rv e in th e exam pleleak-off te s t design a t 0.50 BPM...................................................... 152
46 Porosity versu s dep th in well VR 75 * 3...................................... 165
47 Lithology inform ation for well used in exam ple leak-off testdesign .................................................................................................... 167
i x
R e p ro d u c e d w ith p e rm is s io n of th e c o p y rig h t o w n er. F u rth e r re p ro d u c tio n p ro h ib ited w ithou t p e rm iss io n .
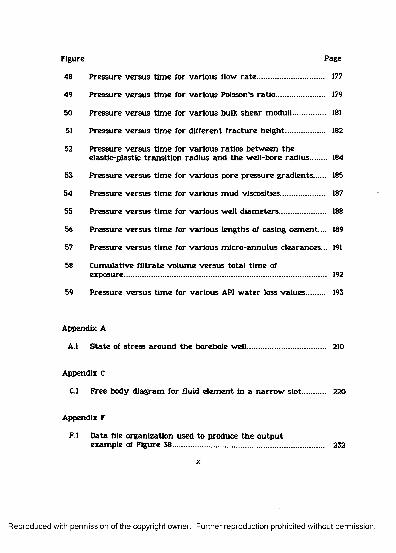
Figure Page
48 P ressure versu s tim e for various flow r a te ................................. 177
49 Pressure versu s tim e for various Poisson's ra tio ........................ 179
50 P ressure versu s tim e for various bulk shear m oduli................ 181
51 Pressure versu s tim e for different frac tu re heigh t.................... 182
52 Pressure versu s tim e for various ratios betw een th e elastic-plastic tran sition rad iu s and th e w ell-bore rad iu s 184
53 P ressure versu s tim e for various pore p ressure g rad ien ts 185
54 Pressure v ersu s tim e for various m ud viscosities...................... 187
55 Pressure v ersu s tim e for various well d iam eters....................... 188
56 P ressure versu s tim e for various lengths of casing cem ent.... 189
57 P ressure versu s tim e for various m icro-annu lus clearances... 191
58 C um ulative filtra te volum e versus to tal tim e ofexposure..................................................................................................... 192
59 P ressure versu s tim e for various API w a te r loss va lues 193
Appendix A
A.l S ta te of stress around th e borehole w ell........................................ 210
Appendix C
C.l F ree body d iagram for fluid e lem ent in a n a rro w slot 220
Appendix F
F.l Data file organization used to produce th e ou tp u texam ple of Figure 38............................................................................ 232
x
R e p ro d u c e d with p e rm is s io n of th e co p y rig h t ow ner. F u rth e r re p ro d u c tio n p ro h ib ited w ithou t p e rm iss io n .

Figure Page
Appendix H
H.l - Pum p-in/Flow -back te s t ........................................................................ 238
H.2 - P ressure decline a f te r s h u t- in ............................................................. 239
x i
R e p ro d u c e d w ith p e rm is s io n of th e c o p y rig h t o w n er. F u rth e r re p ro d u c tio n p ro h ib ited w ithou t p e rm iss io n .
LIST OF TABLES
Page
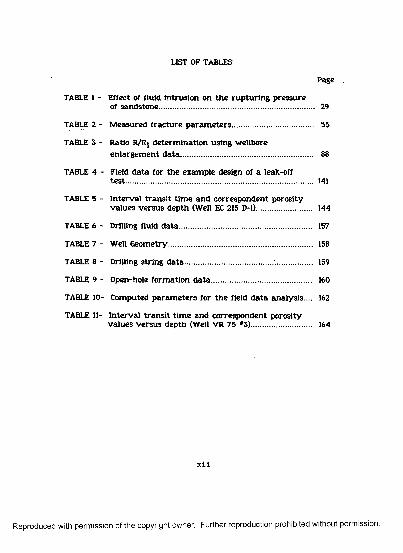
TABLE 1 - Effect of fluid in trusion on th e ru p tu r in g p ressureof sandstone .............................................................................. 29
TABLE 2 - M easured frac tu re p a ra m e te rs ........................................ 55
TABLE 3 - Ratio R/Rj d e term ination using w ellboreen largem en t d a ta .................................................................. 88
TABLE 4 - Field d a ta for th e exam ple design of a leak-offte s t .............................................................................................. 141
TABLE 5 - In te rval tra n s i t tim e and correspondent porosityvalues v ersu s depth (Well EC 215 D-l)............................ 144
TABLE 6 - Drilling fluid d a ta .................................................................. 157
TABLE 7 - Well G eom etry....................................................................... 158
TABLE 8 - Drilling string d a ta .............................................. 159
TABLE 9 - Open-hole form ation d a ta .................................................. 160
TABLE 10- Computed p a ram e te rs for th e field d a ta analysis.... 162
TABLE 11- In te rv a l tra n s it tim e and correspondent porosityvalues v e rsu s depth (Well VR 75 #3).............................. 164
x i i
R e p ro d u c e d with p e rm is s io n of th e co p y rig h t ow ner. F u rth e r re p ro d u c tio n p ro h ib ited w ithou t p e rm iss io n .
ABSTRACT
Form ation p ressu re-in teg rity te sts or leak-off te sts h av e been
increasingly perform ed th roughou t th e w orld. The te s t is perform ed
p rim arily to v e rify how m uch p ressu re can be applied to th e
fo rm ation below th e bo ttom of casing, an d to te s t th e cem ent job
sh ea th around th e outside of th e casing. The initia l design of th e
various casing strings to be cem ented in th e well depends heav ily on
th e predicted frac tu re -p ressu re curve. If th is predicted cu rv e is not
verified b y th e test, th e casing plan will h av e to be changed. Thus,
verify ing fo rm ation frac tu re -p ressu re during drilling is of g rea t
im portance. However, th e lack of a s tan d a rd leak-off te s t procedure
an d s tan d a rd in te rp re ta tio n technique for d a ta ana lysis genera lly
cause th e resu lts obtained b y different well operato rs to v a r y
significantly.
In th is s tu d y , th e developm ent of a com puter s im ulation model
for leak-off te sts h a s been accomplished. This m odel is m ore realistic
th a n th e one c u rre n t ly used, b u t is sufficiently simple th a t i t can be
applied w ith d a ta n o rm a lly available during leak-orf te s t operations
in th e field. The m odel includes th e m a n y factors th a t affect
p ressu re behavior during th e test, an d can p redict w ith reasonable
ac cu racy w h a t th e p ressure cu rv e will look like. In addition, te st
in te rp re ta tio n using th e com puter model is easily achieved using a
cu rv e m atch ing technique.
The firs t s tep tow ard th e developm ent of th e com puter model
w as to subdivide th e leak-off te s t in to four phases: (1) pressu re
increase due to overall com pressibility of th e system , (2) f rac tu rex i i i
R e p ro d u c e d with p e rm iss io n of th e co p y rig h t o w n er. F u rth e r re p ro d u c tio n p ro h ib ited w ithou t p e rm iss io n .

initia tion, (3) f rac tu re expansion, and (4) pressure decline and
fra c tu re closure a fte r th e pum p is shut-in . The second step w as th e
developm ent of m ath em atica l models for each phase separa ted ly .
The m a th em atica l model th a t predicts p ressure increase before
f ra c tu re in itia tion includes th e m ost im p o rtan t variab les affecting
overall com pressibility of th e system . The modelling of f rac tu re
in itia tion is based on th e classical elastic ity theory . The modelling of
fra c tu re expansion an d closure is based on th e solution of th e
con tin u ity equation for flow in to a vertical-elliptical f rac tu re w ith
constan t height. Having th e modelling of each phase done, a
com puter program th a t predicts th e pressure behavior during th e
leak-off te s t w as w ritten . An exam ple showing how th e com puter
model can be used for leak-off te s t design w as th en presented.
The com puter model w as verified using field d a ta furn ished by
Tenneco Oil Company. The d a ta analysis w as perform ed using a
cu rve-m atch ing technique w ith th e com puter model. Also a
sensitiv ity ana lysis w as perform ed to determ ine th e effect of several
well and form ation characteristics on th e shape of th e p ressure
versu s tim e cu rv e obtained during a form ation in teg rity test.
x i v
R e p ro d u c e d with p e rm iss io n of th e co p y rig h t o w n er. F u rth e r re p ro d u c tio n p ro h ib ited w ithou t p e rm iss io n .
INTRODUCTION
Planning to d a y 's m odern deep wells requ ires knowledge of how
to predict form ation pore pressures and frac tu re -p ressu re gradients.
The design of th e casing strings to be cem ented in th e well is of
p r im a ry im portance in well planning, especially w hen abnorm al
p ressu re zones a re encountered. In general, casing m u s t be se t w hen
th e m ud density requ ired to overcom e form ation pore p ressure a t
th e bottom of a section of borehole is g rea te r th a n th e m ax im um
m u d density th a t can be sustained w ith o u t frac tu rin g th e w eakest
form ation exposed to th e m ud.
The situa tion depicted in Figure 1 illu s tra tes th is problem.
Form ation B, ju s t below th e la st casing seat, h as th e lowest f rac tu re
p ressure. Continued drilling will expose fo rm ation A, w hich has the
highest pore pressure. However, to p rev en t th e h igh-pressure fluid
contained in form ation A from invading th e well, drilling personnel
should increase th e m ud density . The m ud-density va lue is lim ited
b y th e m ax im um m ud density th a t form ation B can susta in w ithou t
being frac tu red . If th e m u d density needed to overcom e th e
h igh-pressure zone (form ation A) is g rea te r th a n th is m ax im um
value, an o th er casing m u s t be se t above th e h igh-pressure zone so
th a t drilling can continue safely.
Knowing th e frac tu re -p ressu re grad ien ts and th e form ation
pore pressures th a t can be expected enables th e engineer to d e term ine th e best casing-seat depths. Figure 2 shows th e
frac tu re -p ressu re cu rv e and pore pressure cu rves as solid lines; th e
dashed line rep resen ts th e m ud-density design for th is pa rticu la r
l
R e p ro d u c e d with p e rm iss io n of th e co p y rig h t ow ner. F u rth e r re p ro d u c tio n p roh ib ited w ithou t p e rm iss io n .

FORMATION B (LOW EST FRACTURE .J PRESSURE)
SAND
SHALE
FORMATION A (H IG H E S T PO RE
PRESSURE)
SAND
FIGURE 1 - S chem atic showing th e fo rm ation w ith th e low estfra c tu re p ressu re ju s t below th e la st casing sea t and th e fo rm ation w ith th e highest pore p ressu re fo rm ation a t th e hole bottom .
R e p ro d u c e d with p e rm iss io n of th e co p y rig h t ow ner. F u rth e r re p ro d u c tio n p roh ib ited w ithou t p e rm iss io n .
3
MUD PROGRAM CURVE
FRACTURE / PRESSURE f CURVE
XI-CLllJO
CASINGPROGRAM
PORE PRESSURE CURVE
TOTAL - DEPTH
PRESSURE GRADIENT (lb /gal)
FIGURE 2 - Exam ple plot of p ressu re g rad ien ts v e rsu s depth .
R e p ro d u c e d with p e rm is s io n of th e co p y rig h t ow ner. F u rth e r re p ro d u c tio n p ro h ib ited w ithou t p e rm iss io n .
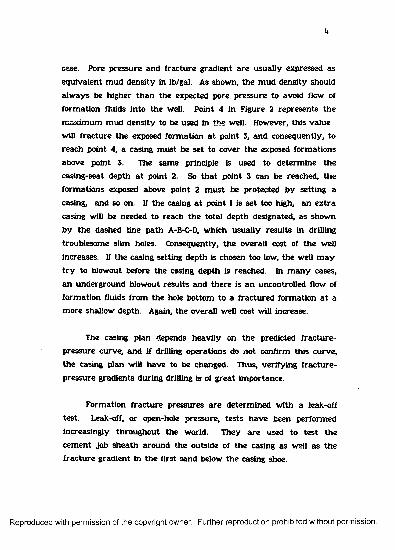
case. Pore p ressure and frac tu re gradient a re usually expressed as
equivalent m ud density in lb/gal. As shown, th e m ud density should
a lw ays be higher th a n the expected pore p ressure to avoid flow of
fo rm ation fluids in to th e well. Point 4 in Figure 2 rep resen ts th e
m ax im um m ud density to be used in th e well. However, th is value
will f rac tu re th e exposed form ation a t point 3, an d consequently, to
reach point 4, a casing m ust be set to cover th e exposed form ations
above point 3. The sam e principle is used to determ ine th e
casing-seat depth a t point 2. So th a t poin t 3 can be reached, th e
form ations exposed above point 2 m u s t be pro tected b y setting a
casing, and so on. If th e casing a t point 1 is se t too high, an ex tra
casing will be needed to reach th e to ta l depth designated, as show n
b y th e dashed line p a th A-B-C-D, w hich usually resu lts in drilling
troublesom e slim holes. Consequently, th e overall cost of th e well
increases. If th e casing setting depth is chosen too low, th e well m a y
t r y to blowout before th e casing dep th is reached. In m a n y cases,
a n underground blowout results and th e re is an uncontrolled flow of
fo rm ation fluids from th e hole bottom to a f rac tu red form ation a t a
m ore shallow depth. Again, th e overall well cost will increase.
The casing p lan depends h eav ily on th e predicted frac tu re -
p ressure curve, an d if drilling operations do no t confirm th is cu rve,
th e casing p lan will have to be changed. Thus, verify ing frac tu re -
p ressu re g radients during drilling is of g rea t im portance.
Form ation frac tu re pressures a re de term ined w ith a leak-off
test. Leak-off, o r open-hole pressure, te sts h av e been perform ed
increasingly th roughou t th e world. They a re used to te s t th e
cem ent Job sh ea th around th e outside of th e casing as well as th e f rac tu re g radient in th e first sand below th e casing shoe.
R e p ro d u c e d with p e rm iss io n of th e co p y rig h t o w n er. F u rth e r re p ro d u c tio n p ro h ib ited w ithou t p e rm iss io n .
5
The leak-off te s t consists of increasing th e well-bore pressure
b y pulling th e b it in to th e casing, conditioning th e m ud, closing th e
BOP valves, and slowly pum ping m ud dow n th e drill pipe or annu lu s
until well p ressu re reaches th e fra c tu re p ressure of th e form ation
being tested. This increase in p ressu re w ith tim e resu lts from th e
overall com pressibility of th e sy stem and is represen ted b y line OA
in th e typ ica l leak-off p ressu re plot show n in Figure 3. The leak-off,
or f rac tu re pressure, occurs a t point A w hen th e p ressure response
deviates from th e s tra ig h t line. A fter th e fra c tu re p ressure point is
reached, m ore m ud is injected, and th e f ra c tu re expands un til th e
pum p is shut-off a t point B. A fter point B is reached, th e well is
kept closed and p ressure s ta r ts to decline owing to filtration of fluids
to perm eable form ations.
Drilling personnel app ly a leak-off te st p rim arily to d e term ine
how m uch p ressure can be applied to th e w eaker form ation below
th e ac tu a l casing shoe. However, th e re is c u rre n tly no s tan d a rd
leak-off te s t procedure, nor a s tan d a rd in te rp re ta tio n technique for
d a ta analysis. The resu lts of different well operato rs v a r y
significantly. Drilling problem s som etim es occur a fte r th e leak-off
te st because it h as been Im properly ru n or im properly in terp re ted .
Analysis of leak-off te s t da ta , along w ith p rio r knowledge of th e
fo rm ation pressures to be expected, w ill help th e engineer decide on
th e well dep th a t w hich th e n ex t casing string should be se t to avoid
problem s associated w ith lost circulation an d underground blowouts.
Knowledge of th e frac tu re g rad ien t also p erm its th e engineer to
d e term ine th e m ax im u m am o u n t of inflow gas th a t can be allowed
in to th e well. Because knowledge of th e fra c tu re g rad ien t is so
im portan t, th e leak-off te s t is of unquestionable value. Thus, th e
design of such a te s t is also im p o rtan t. A nsw ers to v ita l questions,
R e p ro d u c e d w ith p e rm is s io n of th e c o p y rig h t ow n e r. F u rth e r re p ro d u c tio n p ro h ib ited w ithou t p e rm iss io n .
6
VOLUME OF MUD. INJECTED
.PRESSURE DECLINE Y AFTER SHUT-IN
_L_E_AK1 OFF_____PRESSURE LINE
UJor3COUlLJt rCL
zoI—oUJ-3z m
0TIME (min)
FIGURE 3 - Typical leak-off p ressu re plot for a w ell w ith a sh o rt open hole section.
R e p ro d u c e d w ith p e rm iss io n of th e c o p y rig h t ow ner. F u rth e r re p ro d u c tio n p ro h ib ited w ith o u t p e rm iss io n .

7
such a s how fas t th e m u d should be pum ped, w h a t f ra c tu re gradient
can be expected, how m uch m ud will be injected, how a good
p ressure-response cu rv e will look, an d w h e th e r th e casing o r cem ent
is leaking, can be obtained if a reliable com puter sim ulation model of
a leak-off te s t is available.
A simplified model is c u r re n t ly used to in te rp re t leak-off tests.
The fluid is considered to be slightly com pressible an d pum ped into a
perfec tly rigid container. The in jection p ressu re a t th e surface is
plotted against th e volum e of m u d in jected u n til th e observed tre n d
d ep a rts from a straigh t-line. The s tra igh t-line fit is obtained by
visual inspection of th e plotted points. F rac tu re p ressu re is
d e term ined from th e p ressu re a t w hich firs t d e p a rtu re from a
s tra ig h t line is seen. The cu rv e is also used to check for leaks. If th e
pressu re d ep a rts from a s tra ig h t line ea rlie r th a n expected, a leak in
th e cem en t behind th e casing is suspected. This simplified model
relies heav ily on th e experience of th e person in te rp re tin g th e test.
The p a ra m e te rs affecting th e f ra c tu re an d th e f rac tu rin g process a re
no t ana lyzed fu r th e r.
In o th e r a rea s of petro leum engineering, such as reservo ir and
production engineering, elabora te models h av e been used w ith g rea t
success to in te rp re t w ell-pressure tests. The d iffusiv ity equation,
w hich expresses th e m echan ism governing fluid flow in a porous
m edium , h as been solved for a w ide range of assum ed well
conditions, p e rm itting p ressu re d a ta to be used to calculate
im p o rtan t p a ram ete rs, such as fo rm ation perm eab ility , skin factors, and th e reservo ir volum e com m unicating w ith th e well. However,
un til now only h ighly simplified equations h av e been presen ted for
fo rm ation frac tu re -p ressu re analysis . This w ork develops a model of
R e p ro d u c e d with p e rm iss io n of th e co p y rig h t o w n er. F u rth e r re p ro d u c tio n p ro h ib ited w ithou t p e rm iss io n .

th e well sy stem m uch m ore realistic th a n th e one presen tly used.
The model can predict w ith reasonable accu racy w h a t th e pressure
cu rv e will look like before and a f te r shut-in .
The first p a r t of this s tu d y concerns th e prediction of the
p ressure requ ired to in itia te a frac tu re . F ractu ring occurs as a resu lt of fluid p ressure exerted b y th e drilling fluid inside th e
borehole. Theoretical derivation of equations for determ ining
frac tu re pressure h av e been developed in th e lite ra tu re . However,
these equations a re generally too complex, and some of th e
p a ram ete rs involved cannot be easily estim ated w ith d a ta norm ally
available in th e field. Simplifications of th e theoretical equations
based on reasonable assum ptions m ake th e m m ore usable in th e
field. However, unresolved conflicts exist in th e approaches various
a u th o rs have taken concerning fundam en ta l issues such as (1) th e
concept of failure, (2) elastic ity versus plasticity , (3) th e stress fields
presen t in th e e a r th in th e v ic in ity of th e well bore, (4)
nonpenetration versu s pene tration of drilling fluid in to form ation
during th e p ressure test, (5) hom ogeneity and isotropy versus
heterogeneity , and (6) o rientation of th e frac tu re . Consequently, a
nu m b e r of em pirical m ethods of determ ining th e frac tu re gradient
hav e been used. Approaches range from sim ple regression analysis
of field d a ta to sem i-theoretical approaches. In th is work, a
correlation used to predict form ation fra c tu re p ressure w as selected
from th e m a n y previously published correlation techniques. The
frac tu re initia tion model is used to determ ine th e lim it of region I of
th e typical p ressu re in teg rity te s t show n in Figure 3.
The second p a r t of th is s tu d y concerns frac tu re expansion.
W hen pum ping of fluid in to th e well continues a f te r th e form ation
R e p ro d u c e d with p e rm is s io n of th e co p y rig h t ow ner. F u rth e r re p ro d u c tio n p ro h ib ited w ithou t p e rm iss io n .

9
has been broken, th e f rac tu re form ed extends. The p ressure
behavior a t borehole conditions, in fro n t of th e frac tu re , is influenced
b y th e frac tu re geom etry . The problem of com puting th e geom etry
of a h yd rau lic f rac tu re during expansion h a s been studied w ith in
tw o sep ara te disciplines: fluid m echanics and frac tu re mechanics.
These disciplines provide tools for exploring th e three-dim ensional
ch a rac te r of frac tu re grow th and frac tu re con tainm ent. To date,
how ever, th e ex trem e com plexity of th e general problem has
resulted in analyses based on m ore simplified tw o-dim ensional, linear
elastic ity solutions of equilibrium cracks. The three-dim ensional
models include th e variations of w idth , length, and height of th e
frac tu re w ith tim e, w hereas tw o-dim ensional models consider th e
frac tu re height to be constant.
The frac tu re expansion model used in th is s tu d y has been
developed p rim arily on th e basis of detailed s tu d y of previously
published w orks w ritte n for o ther applications. The model is th e
resu lt of th e num erical solution of th e con tinu ity equation governing
th e frac tu re expansion m echanism (region II, Figure 3). The solution
includes th e assum ptions of a v e rtica lly closed la te ra lly sim ilar
elliptical f rac tu re opening and propagating in a homogeneous,
isotropic, an d linearly elastic reservo ir rock. The frac tu re expansion
model is used to s im u la te region II of th e typ ical p ressure in teg rity
te s t show n in Figure 3.
The con tinu ity equation for th e frac tu ring expansion
m echanism is also solved to determ ine p ressu re decline following
fractu ring , a condition th a t occurs w hen th e pum p is sh u t-in and
pressure begins to decrease w hile th e well is still closed (region III,
Figure 3). This p ressu re decrease is due to filtration of th e in jected
R e p ro d u c e d with p e rm iss io n of th e co p y rig h t ow ner. F u rth e r re p ro d u c tio n p roh ib ited w ithou t p e rm iss io n .

10
fluid th rough th e fra c tu re walls. The p ressu re decline analyses of a
leak-off te s t p e rm it estim ation of som e im p o rtan t pa ram ete rs. The
m ost im p o rtan t ones include th e fluid loss coefficient, fluid viscosity
degradation, fo rm ation m odulus, f ra c tu re closure pressure, and
fra c tu re length. Once these p a ram e te rs a re de term ined through
pressu re decline analysis, th e y can be used in th e leak-off te s t
sim ulation of region I and 2 in Figure 3.
The th ird p a r t of th is s tu d y investigates m ethods of
characte rizing th e overall com pressibility of th e sy stem . To precisely
predict f ra c tu re pressures and surface p um p pressure, th e com puter
model should take in to account th e physical expansion of th e casing
caused b y th e increase in p ressure, th e d y n am ic filtra tion of drilling
fluid in to perm eable form ations in th e open-hole section, open-hole
en largem en t caused b y p ressure applied a t th e borehole walls, and
th e presence of a n y a ir trapped in th e sy stem . These factors should
be included in th e model since th e y affect overall com pressibility. In
addition, since m ud is pum ped in to th e well, non-N ew tonian fluid
flow effects will increase th e injection p ressu re a t su rface and should
also be ta k en in to account in th e model.
Finally , th is w ork in troduces a com puter model w ritte n for
rou tine s im ulation of leak-off tests. The model is m u ch m ore
realistic th a n th e one c u rre n tly used, b u t is sufficiently sim ple th a t
it can be applied w ith d a ta no rm ally available during leak-off te s t operations in th e field.
The p rogram o u tp u t consists of a plot of su rface p ressure as a
function of tim e. In addition, com puted values of f rac tu re p ressure
R e p ro d u c e d with p e rm iss io n of th e co p y rig h t ow ner. F u rth e r re p ro d u c tio n p ro h ib ited w ithou t p e rm iss io n .

11
a t surface, fra c tu re grad ien t, height, length, w idth, an d general d a ta
a re displayed on th e plot.
The model w as verified using field data . The model w as th e n
used to develop a s tan d a rd leak-off te s t in te rp re ta tio n procedure. A
sensitiv ity analysis w as m ade to dete rm in e th e re la tiv e im portance
of th e various fo rm ation and w ellbore p a ra m e te rs on th e
in te rp re ta tio n of a fo rm ation p ressu re in teg rity test.
R e p ro d u c e d with p e rm is s io n of th e co p y rig h t ow ner. F u rth e r re p ro d u c tio n p roh ib ited w ithou t p e rm iss io n .

LITERATURE REVIEW
The m ath em atica l model for th e com puter sim ulation of th e
leak-off te s t is subdivided in to th re e tim e periods: (1) th e period
before th e form ation fra c tu re p ressu re has been reached, (2) th e
period during w hich frac tu re expansion takes place, and (3) th e
period of p ressu re decline a f te r pum ping has stopped. Therefore, th is
s tu d y began w ith a rev iew of th e factors th a t affect th e pressures
observed during each of those th re e periods. All of th e previous
l i te ra tu re has addressed h y d rau lic frac tu ring as a form ation
s tim ulation m ethod and h as n o t been d irected tow ards th e
in te rp re ta tio n of p ressu re in teg rity tests. F o rtunate ly , m uch of th e
basic f ra c tu re m echanics th e o ry will also app ly to form ation
p ressure in teg rity tests. M y discussion of previous studies will be
lim ited to those aspects im p o rtan t to th e task being undertaken .
Factors Affectinft Fracture JnitiatioiLErggsuEg
As discussed previously, th e purpose of a p ressu re in teg rity , or
leak-off, te s t is to es tim ate fo rm ation frac tu re p ressure. W hen
conducting th is te st, th e engineer needs to know approx im ately w hen
f rac tu re initia tion can be expected. Thus, a m eans of predicting
fo rm ation frac tu re in itia tion p ressu re is needed. This section
describes th e p r im a ry p a ram e te rs know n to affect form ation
fra c tu re in itia tion p ressure.
12
R e p ro d u c e d with p e rm iss io n of th e co p y rig h t ow ner. F u rth e r re p ro d u c tio n p roh ib ited w ithou t p e rm iss io n .

13
Subsurface S tress Field
To understand th e underground stresses th a t tend to resist
form ation frac tu re , w e m u st consider th e geologic processes th a t
h av e occurred. A simple and com m on subsurface s tress s ta te
genera lly encountered in sed im en ta ry basins containing oil and gas
often occurs in a tech n ica lly relaxed area . As th e deposition of
sedim ents continues over geologic tim e, th e vertica l m a trix stress, (Tz,
increases owing to th e increased loading a t th e g rain-to-grain
contacts. Under th e Influence of th is vertical stress, th e rock's
n a tu ra l tendency is to expand la tera lly , bu t it is p reven ted from
doing so b y th e surrounding rock. The tendency to expand
introduces horizontal stresses. If w e designate as principal m a tr ix
stresses those stresses th a t a re norm al to planes in w hich no shear
occurs, th e general s ta te of stress underground can be defined in
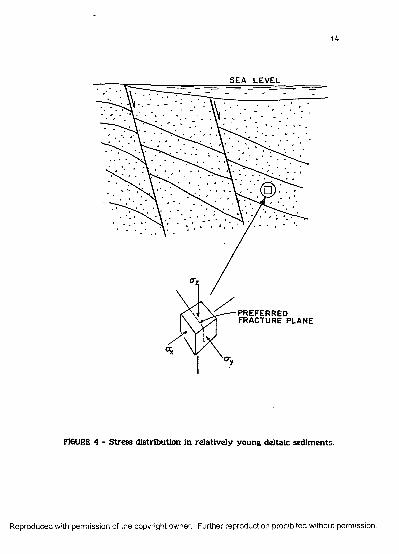
te rm s of TXj <Ty , and <TZ, as shown in Figure 4.
In te chn ica lly relaxed sedim ents, fa r aw ay from in tru sive
bodies such as salt domes or shale diapirs, th e cause of stress is
p rim arily due to only th e w eight of th e overlying m ass. In th is
simplified situation, th e horizontal m a tr ix stresses (Tx an d (Ty a re
approxim ately equal to and sm aller th a n th e vertica l m a tr ix stress,
CTZ. In th is case, w hen th e rocks exhibit an elastic behavior th e
relationship betw een th e vertica l s tress and th e induced horizontal
stresses can be expressed b y th e following equation from elastic ity
th eo ry
<rx*tr7 -<r„ - iM/<i-»)].<rz.......................... (i)
R e p ro d u c e d with p e rm is s io n o f th e cop y rig h t ow ner. F u rth e r re p ro d u c tio n p ro h ib ited w ithou t p e rm iss io n .
14
SEA LEVEL
PREFERRED FRACTURE PLANE
FIGURE 4 - S tress d istribu tion in re la tive ly young deltaic sedim ents.
R e p ro d u c e d w ith p e rm is s io n of th e c o p y rig h t o w n er. F u rth e r re p ro d u c tio n p ro h ib ited w ithou t p e rm iss io n .

15
w here CTj is th e average horizontal s tress and jjl is Poisson's ratio .
Equation (1) also assum es th a t th e horizontal s tress is approxim ately
zero in rock being com pressed b y sedim enta tion . Since Poisson's
ratio , for sed im en ta ry rocks ranges betw een approx im ately 0.18
and 0.27 (Birch e t al. 1942), th e average horizontal com pressive stress
would be expected to lie w ith in 22-37 percen t of th e principal vertical
m a tr ix stress. If th e rocks exhibit plastic behavior, th e horizontal
and v ertica l g rain stresses would tend to equalize; th a t is, th e
horizontal s tress w ould approach 100 p ercen t of th e v ertica l s tress
due to th e w eight of th e overburden.
H ubbert and Willis (1957) pointed ou t t h a t over long periods of
geologic tim e th e e a r th h a s exhibited a high degree of m obility , and
rocks h av e been deform ed to th e lim it of failure b y fau lting and
folding. For th is to occur, th e principal s tresses m u s t be
substan tia lly different. Thus, principal stresses in these rocks m u s t
h av e been unequa l w hen folding o r faulting occurred (H ubbert and
Willis 1957). The conditions for w hich Equation (1) w as derived would
tend to app ly to a young deltaic depositional en v iro n m en t w here
no rm al faulting is com m on, an d th e horizontal stresses a re less th a n
th e vertica l stress. In a rea s w h ere th ru s t fau lts an d folding a re
occurring, th e horizontal stresses tend to be m o re th a n th e vertica l
stresses.
H arrison e t al. (1954) found th a t th e e a r th 's c ru s t is stab le over
a w ide range of s tress relationships. The stable region is bounded b y
conditions of faulting. The firs t condition occurs w hen one of th e
unequal horizontal s tresses decreases below th e low er lim it of th e
stab le range no rm a l faulting occurs and continues un til th e stress
R e p ro d u c e d with p e rm is s io n of th e co p y rig h t ow ner. F u rth e r re p ro d u c tio n p ro h ib ited w ithou t p e rm iss io n .

16
relationship is re tu rn e d to th e low er lim it of th e stab le range. The
second condition lim iting th e stab le region is th e occurrence of
t ra n sc u rre n t and th ru s t faulting. These ty p e s of fau lting re tu rn th e
s tress conditions to only th e ir respective upper lim its of stability;
in these instances one or both horizontal stresses would exceed th e
vertica l stress.
H ydraulic F ractu rin g M echanism
We can b e tte r un d ers tan d th e problem of determ ining th e
frac tu re p ressu re of a given form ation b y firs t considering a v e ry
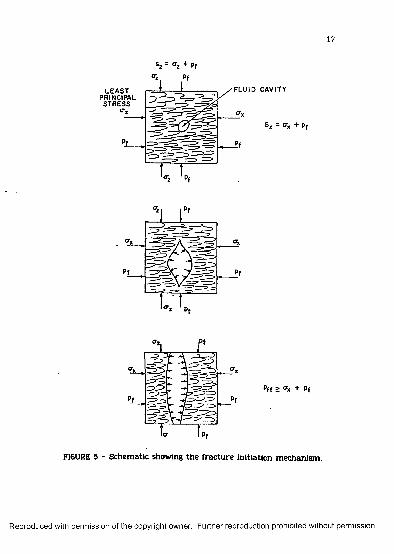
simplified situa tion in w hich a fluid is in troduced in to a sm all c av ity
located in th e cen te r of th e rock elem ent, as show n in Figure 5. For
th e f ra c tu re fluid to en te r th e cav ity , th e p ressu re of th e fluid m u s t
exceed th e pore pressure of th e form ation. Assuming th a t th e fluid
canno t flow a significant d istance in to th e pore spaces, as p ressure of
th e fluid is increased above th e form ation pore pressure, th e rock
m a tr ix begins to be com pressed. The com pression will be g rea test in
th e direction of th e m in im u m m a tr ix stress. The form ation will
fra c tu re w hen th e fra c tu re fluid p ressu re exceeds th e sum of th e
m in im um principal m a tr ix stress, th e pore p ressure, and th e tensile
s tren g th of th e form ation, S*.
The p referred fra c tu re orien tation will be perpendicular to th e
least principal stress. Consequently, in regions characterized by
norm al faulting, according to Equation (1), th e least principal s tress is
horizontal and th e frac tu re orien tation should be vertical. In regions
characterized b y ac tive th ru s t faulting, how ever, w h ere th e least
principal s tress is vertical, th e fra c tu re orien tation should be
horizontal. This simplified s ta te of s tress underground can be altered
R e p ro d u c e d with p e rm is s io n of th e co p y rig h t ow ner. F u rth e r re p ro d u c tio n p ro h ib ited w ithou t p e rm iss io n .
17
FLUID CAVITYLEASTPRINCIPAL
STRESS
FIGURE 5 - Schem atic showing th e fra c tu re in itia tion m echanism .
R e p ro d u c e d with p e rm iss io n of th e co p y rig h t ow ner. F u rth e r re p ro d u c tio n p ro h ib ited w ithou t p e rm iss io n .

18
b y various facto rs th a t in tu rn affect th e fra c tu re p ressure of th e
form ation .
Cylindrical Bpre.hQlg.Effeet
The presence of a cylindrical borehole changes th e s ta te of
stress a t its v ic in ity . Generally th is distortion is theoretically
calculated b y assum ing th a t th e rock is elastic, th e borehole sm ooth
and cylindrical, and th e borehole axis vertica l an d parallel to one of
th e pre-existing regional principal stresses.
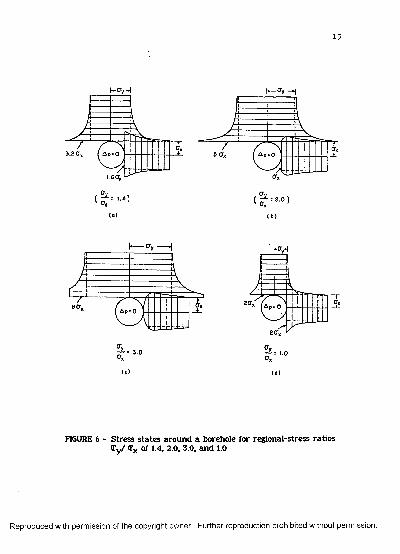
The v ertica l borehole crea tes a local zone of high stress.
H ubbert and Willis (1957) pointed o u t th a t these s tress concentrations
a re local an d th a t th e stresses rap id ly approach th e und istu rbed
regional s tress a rea w ith in a few hole d iam eters. Figure 6 shows
values of th e horizontal s tress across th e principal planes in th e
v ic in ity of th e borehole corresponding to som e re la tiv e values of th e
(Ty/ffx ratio . The distortion of th e stress field is no t only in th e
horizontal direction. However, th e m agn itude of th e distortion in th e
v e rtica l direction, w hich is a function of th e regional horizontal
stresses, is v e ry sm all com pared to th e concentrations of th e
horizontal stresses. S tress concentrations rap id ly disappear w ith
distance a w a y from th e well bore in all directions (Hubbert and
Willis 1957).
Since th e presence of th e borehole affects th e s ta te of stress
w ith in its v ic in ity , it also affects th e p ressu re n ecessary to ru p tu re
th e form ation . It h as been shown (Timoshenko an d Goodier 1951) th a t
th e tangen tia l s tress on th e perip h ery of th e hole is equal to tw ice
th e homogeneous com pressive s tress of th e und istu rbed a rea a w a y
R e p ro d u c e d with p e rm iss io n of th e co p y rig h t ow n e r. F u rth e r re p ro d u c tio n p ro h ib ited w ithou t p e rm iss io n .
H—ay —i
oy
FIGURE 6 - S tress s ta te s a ro u n d a borehole for reg ional-stress ra tio s Ty / <TX of 1.4, 2.0, 3.0, an d 1.0
R e p ro d u c e d with p e rm is s io n of th e co p y rig h t ow ner. F u rth e r re p ro d u c tio n p ro h ib ited w ithou t p e rm iss io n .
2 0
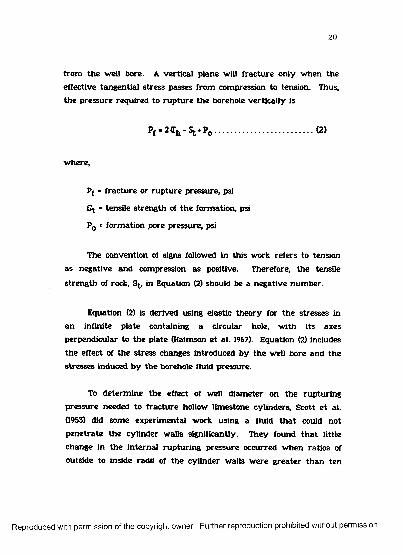
from th e w ell bore. A vertica l plane will f rac tu re on ly w hen th e
effective tangen tia l s tress passes from com pression to tension. Thus,
th e p ressu re requ ired to ru p tu re th e borehole v ertica lly is
P , - 2 <r„-%♦•><>........................................... (2)
w here,
Pf = frac tu re or ru p tu re p ressure, psi
= tensile s tren g th of th e form ation, psi
P0 = fo rm ation pore p ressure, psi
The convention of signs followed in th is w ork re fe rs to tension
as negative an d compression as positive. Therefore, th e tensile
s tren g th of rock, St , in Equation (2) should be a nega tive num ber.
Equation (2) is derived using elastic th e o ry for th e stresses in
an infin ite p la te containing a circu lar hole, w ith its axes
perpendicular to th e p la te (Haimson e t al. 1967). Equation (2) includes
th e effect of th e stress changes in troduced b y th e well bore and th e
stresses induced b y th e borehole fluid pressure.
To d eterm ine th e effect of w ell d iam ete r on th e ru p tu rin g
p ressu re needed to f rac tu re hollow lim estone cylinders, Scott e t al.
(1953) did som e experim en tal w ork using a fluid th a t could not
pen e tra te th e cylinder w alls significantly. They found th a t little
change in th e in te rn a l ru p tu r in g p ressu re occurred w hen ratios of
outside to inside radii of th e cy linder w alls w ere g rea te r th a n ten
R e p ro d u c e d with p e rm iss io n of th e co p y rig h t ow ner. F u rth e r re p ro d u c tio n p roh ib ited w ithou t p e rm iss io n .

21
(Figure 7). In experim ents perform ed in shallow wells, no effect on
ru p tu rin g p ressure w as observed w hen th e well d iam eter w as varied
from 0.19 to 6.0 in., regardless of th e ty p e of fluid used.
Qygrburdgn. Stress
O verburden stress, S^, is th e stress caused in a given point
underground b y th e overburden load or geostatic load of th e
sedim ents above th is point. This geostatic load is supported a t a
given depth b y th e g rain-to-grain contact points of th e rock m a teria l
and b y th e p ressure of th e fluid inside th e pore spaces. The vertical
principal m a tr ix stress, <TZ, is th e resu lt of th is grain-to-grain
supported load, an d th e overburden stress can be expressed by
The im portance of th e overburden s tress in calculating
ru p tu rin g p ressure is expressed b y Equation (3), combined w ith
Equations (1) an d (2), w hich yields
The vertica l overburden stress being equal to th e geostatic load a t a given point is a function of th e bulk densities of th e m ateria ls
overly ing th e point u nder consideration. The correc t va lu e of th e
v ertica l overburden stress is therefo re th e sum of th e overlying load
of each la y e r of d ifferent form ations. However, th e to ta l s ta te of
s tress of th e rock a t th e depth of in te re s t is no t a lw ays adequately
(3)
Pj »(2 m/(1 -m)) IS2 - i 0 l-S t+ P0 (4)
R e p ro d u c e d with p e rm iss io n of th e co p y rig h t ow ner. F u rth e r re p ro d u c tio n p roh ib ited w ithou t p e rm iss io n .

22
10,000
Tensile Strength (psi) 5 0 C U -------
OTCl
NOINTRUSION
LJ 1,000a:3wV)UJa:Q.
2 0 a
200
120UJa:3I-CL3o:
100INTRUSION
RATIO OF RADII (External Radius /B o re Radius)
FIGURE 7 - Effect of w all thickness on in te rn a l bursting p ressu re of hollow rock cylinders (from Scott e t a. 1953).
R e p ro d u c e d w ith p e rm iss io n of th e co p y rig h t o w ner. F u rth e r re p ro d u c tio n p ro h ib ited w ithou t p erm iss io n .
23
described b y th e v ertica l overburden s tress calculation. Common
geologic processes o th e r th a n sim ple sedim enta tion , like th e u pw ard
m o v em en t of low -density sa lt or plastic shale domes, can a lte r th e
vertica l s ta te of stress. It is som etim es possible to find th e vertica l
s tress s ta te a t dep th exceeding th e geostatic load. In th e W est Coast
a rea , for exam ple, th e continental d r if t is causing a collision of th e
N orth A m erican and Pacific p lates, w h ich resu lts in large la te ra l
com pressive stresses. This can also be caused b y th e in te rn a l g rain
friction in sedim ents im m edia te ly above a sa lt dome. However, rocks
genera lly a re q u ite w eak in tension, and faulting will occur, w hich
tends to relieve th e buildup of stresses significantly above th e
geostatic load.
The vertica l overburden is often assum ed to be equal to 1.0
p si/ft of dep th (H arrison e t al. 1954; H ubbert and Willis 1957). This is
th e sam e as assum ing a constan t va lue of bulk density over th e
en tire sedim ent section. This sim plifying assum ption can be helpful
in som e a reas w hen planning wells deeper th a n 10,000 ft. However,
it can lead to significant e rro rs in th e com putation of overburden
stress, especially for shallow sedim ents b eneath deepw ater offshore
locations. This approxim ation genera lly is used w hen th e change in
bulk density w ith respect to dep th is n o t know n.
M ore recen t approaches account for v aria tions in overburden
p ressu re and h av e produced m ore accu ra te resu lts. The m ost
accu ra te estim ates of pore p ressu re and overburden stress g rad ien t
can be m ade using density o r porosity d a ta available from well logs.
Figure 8 shows a n exam ple of v ariab le overbu rden g radients in th e
Gulf of Mexico b y dep th (Eaton 1969). This cu rv e is often used as a
R e p ro d u c e d with p e rm iss io n of th e co p y rig h t ow ner. F u rth e r re p ro d u c tio n p roh ib ited w ithou t p e rm iss io n .

24
OOO
XI-GLUJO
2 0 1— 0.70 0 .8 0 0.90 1.00OVERBURDEN STRESS GRADIENT (p s i/ft)
FIGURE 8 - O verburden s tress g rad ien t v e rsu s d ep th for n o rm a lly com pacted Gulf Coast fo rm ations (after Eaton 1969).
R e p ro d u c e d w ith p e rm iss io n of th e c o p y rig h t ow ner. F u rth e r re p ro d u c tio n p ro h ib ited w ithou t p erm iss io n .

25
rep resen ta tion of average conditions in this a re a w hen well logging
d a ta a re no t available.
O verburden stress grad ien t also varies significantly w ith w a te r
dep th (Christm an 1973) in offshore areas, and th is va ria tion is
responsible for th e significant differences in frac tu re grad ien ts shown
in th e exam ple presented in Figure 9. Typical onshore frac tu re
g rad ien ts a re also show n for com parative purposes. The d e trim en ta l
effect of w a te r depth on frac tu re p ressu re is though t to be d irectly
re la ted to th e reduction in overburden stress caused b y replacing
p a r t of th e high-density overburden w ith low er-density seaw ater.
Penetrating. V ersus N onpenetrating F ractu ring Fluids
A nonpenetrating fluid is defined in th is w ork as a fluid
incapable of perm eating a rock form ation. W hether a fluid is
p ene tra ting or nonpene tra ting w ith respect to a ce rta in rock depends
upon th e sizes of th e in terconnected pores and n a tu ra lly occurring
frac tu re s in th e rock. An o rd in a ry drilling m ud form ing a re la tive ly
im perm eable filter cake on a rock is usually assum ed to be a
nonpene trating fluid (Scott e t al. 1953), even though th e re m a y be
sm all am o u n t of filtration tak ing place. The ra te s of a n y filtration
tak ing place a re sm all enough to be neglected is th a t th e y do no t
h av e a significant effect on th e length or w id th of th e frac tu re form ed.
In th e case of a pene tra ting fluid, th e p ressu re difference
betw een th e well-bore fluid, Pw , and th e pore fluid in th e form ation,
Pq, will cause a n o u tw ard radial flow from th e well in to th e
R e p ro d u c e d with p e rm iss io n of th e co p y rig h t ow ner. F u rth e r re p ro d u c tio n p ro h ib ited w ithou t p e rm iss io n .

SUBS
EA
DEP
TH
(100
0 ft
)
26
FRACTURE GRADIENT, Subsea (ppg)
.45 .50 .55 .60 .65 .70 .75 .80FRACTURE GRADIENT, Subsea (p s i/f t)
FIGURE 9 - Exam ple of offshore frac tu re grad ien ts (a fte r C hristm an 1973).
R e p ro d u c e d w ith p e rm is s io n of th e c o p y rig h t o w n er. F u rth e r re p ro d u c tio n p ro h ib ited w ithou t p e rm iss io n .

form ation. Generally, to sim plify th e problem being studied, i t is
assum ed th a t th e properties of th e pene tra tin g fluid and those of th e
form ation fluid a re sim ilar. In addition, th e fo rm ation is assum ed to
h av e un ifo rm perm eab ility so th a t th e fluid flow is ax isym m etric .
Figure 10 shows a possible d istribution of p ressu re around th e
borehole w ith a p ene tra ting and a nonpene tra ting ty p e of fluid.
Timoshenko an d Goodier (1951) and G eertsm a (1957) applied th e th e o ry
of therm oelasticity , modified to solve problem s in elastic m a teria l, to
show th a t fluid flow th rough porous m edia causes stresses th a t affect
th e ru p tu rin g p ressure of perm eable form ations. W hen th is happens,
th e fluid in trusion reduces th e breakdow n pressure.
This theoretical resu lt w as confirm ed b y th e experim en tal
w ork of Scott e t al. (1953) w ith frac tu ring cylinders of sandstone rock
in th e lab o ra to ry an d shallow wells in a sandstone outcrop. They
used m inera l oil as th e p ene tra ting fluid and drilling m ud hav ing
v e ry low fluid loss as th e nonpene tra ting fluid. On th e basis of th e ir
resu lts, th e y concluded th a t th e use of pen e tra tin g fluids resu lts in a
lower ru p tu r in g pressure of rock form ations th a n m a y be expected
w ith nonpene tra ting fluids. Their resu lts a re presented in Table 1.
R e p ro d u c e d with p e rm is s io n of th e co p y rig h t ow ner. F u rth e r re p ro d u c tio n p ro h ib ited w ithou t p e rm iss io n .

2 8
Well Rock
(a)DISTRIBUTION OF PORE FLUID PRESSURE AROUND WELLBORE (RADIUS rw) FOR NONPENETRATING
FRACTURING FLUIDS
Rock
(b )PO SSIB LE DISTRIBUTION OF PORE FLUID PRESSUREAROUND W ELLBORE (RADIUS rw ) FOR PENETRATING
FRACTURING FLUIDS FIGURE 10 -Possible d istribu tion of pore fluid p ressu re around th e
borehole (from Haimson and F a irh u rs t 1967).
R e p ro d u c e d with p e rm iss io n of th e co p y rig h t o w n er. F u rth e r re p ro d u c tio n p ro h ib ited w ithou t p erm iss io n .

TABLE 1 - Effect of fluid in trusion on th e ru p tu rin g pressure of sandstone (from Scott e t al. 1953).
Radii (in.) Internal External
RupturingFluid
RupturingPressure
(psi)Type of Fracture
.19 1.73 drilling mud 2.700 vertical
.19 1.73 drilling mud 2.000 vertical
.19 1.75 drilling mud 2.300 vertical
.19 1.73 mineral oil 1.200 horizontal
.19 1.75 mineral oil 1,400 horizontal
.19 1.75 mineral oil 1.400 horizontal
.19 infinite drilling mud 4.800 vertical
.19 infinite drilling mud 4200 not distinguishable
.19 infinite drilling mud 4.300 not distinguishable
.19 infinite drilling mud 3.900 not distinguishable
.19 infinite mineral oil 1.130 not distinguishable
.19 infinite mineral oil 600 horizontal
.19 infinite mineral oil 700 horizontal
.19 infinite mineral oil 630 not distinguishable
R e p ro d u c e d with p e rm iss io n of th e co p y rig h t ow ner. F u rth e r re p ro d u c tio n p roh ib ited w ithou t p e rm iss io n .

30
Tensile S treng th of Rock
The general tren d of th e effect of tensile s tren g th on th e
frac tu re initia tion pressure m a y be seen in Figure 7, w hich shows
th a t th e g rea te r th e s treng th , th e higher th e in te rn a l rup tu rin g
pressure for a given ra tio of ex ternal to bore radius. However, rocks
a re seldom isotropic or homogeneous, and th e y usually v a r y widely
in stren g th characteristics. Deviations from th e assum ed isotropy
and hom ogeneity will change th e breakdow n pressure of th e
form ation. Experim ental w ork (Scott e t al. 1953) h a s indicated th a t
th e ra tio of in te rn a l bursting p ressure to tensile stren g th in cylinders
of sandstone and shale m a y v a ry from 1.4 for sandstone to 28.6 for
shale. These resu lts lead to th e conclusion th a t th e difference
betw een th e breakdow n pressure of tw o rocks m a y exceed m a n y
tim es th e difference betw een th e ir tensile strengths.
Weibull's (1952) statistical th e o ry of m a te ria l s tren g th indicates
th a t th e resu lts of s tanda rd tensile s treng th tests th a t pull th e
specimens ap a rt, and resu lts of cy linder-rup tu ring tests, should no t
be expected to agree unless bore cy linders la rger th a n 1.5 in. a re
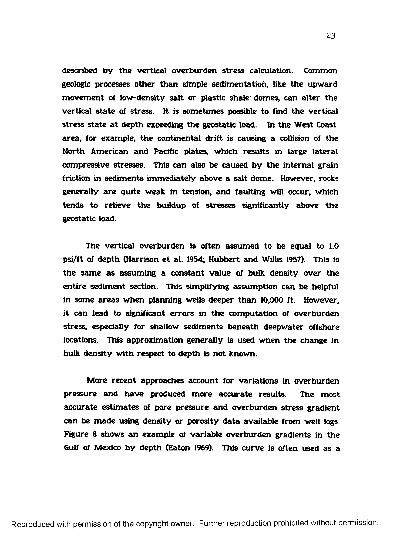
em ployed. This behavior is supported b y th e d a ta show n in Figure
11. The value listed in m a teria l handbooks for tenside s treng th of
lim estone is approxim ately 500 psi. This va lue agrees v e ry well
w ith th e value given in Figure 11 for hole d iam eters of thick-w alled
cy linders of lim estone g rea te r th a n 1.5 in.
H ubbert and Willis (1957), how ever, pointed ou t t h a t th e tensile s tren g th of flawless specimens can v e ry from zero, for unconsolidated
m aterials , to hundereds of pounds per square inch for th e strongest
rocks. But, as observation of a n y outcrop will dem onstrate , flawless
R e p ro d u c e d with p e rm is s io n of th e co p y rig h t ow ner. F u rth e r re p ro d u c tio n p ro h ib ited w ithou t p e rm iss io n .
BUR
STIN
G
PRES
SUR
E (p
si)
31
FIGURE
40 0 0
3000
2000
1000
0.5 1.0DIAMETER (in)
2.0
II - Graph of b u rs ting p ressure versu s hole d iam ete r for thick-w alled hollow cylinders of lim estones (Harrison e t al. 1954).
R e p ro d u c e d with p e rm is s io n of th e co p y rig h t ow ner. F u rth e r re p ro d u c tio n p ro h ib ited w ithou t p e rm iss io n .

3 2
specimens of linear dim ensions g rea te r th a n a few feet ra re ly occur.
In addition to th e bedding lim itations t h a t lim it tensile s tren g th to a
m in im um , th e rocks a re u sually in tersec ted b y one o r m ore sy stem s
of jo in ts w ith on ly slight displacem ents. Across the se jo in t surfaces
th e tensile s tren g th is essentially reduced to zero.
U nder th e idealized conditions of isotropy, hom ogeneity , and
elastic behavior of rocks, th e tensile s tren g th will affect th e frac tu re
p ressure of th e form ation . Sand and shale occur freq u en tly in th e
m ost com m on lithology; induced h y d rau lic frac tu re s a re expected to
occur in sand sections r a th e r th a n in shale because of th e higher tensile s tren g th of shale.
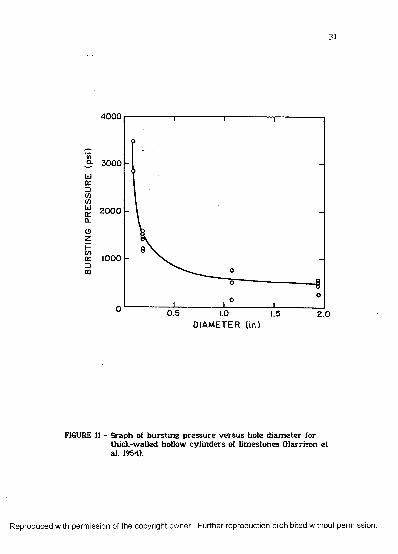
S om erton e t al. (1964) h av e show n th a t te m p e ra tu re can
substan tia lly a l te r physical properties of rocks. On th e bases of plots
like th e one in Figure 12, th e y concluded th a t Young’s M oduli and
Poisson's ratios, as well as s treng th s, a re decreased b y th e rm a l
tre a tm e n t. However, it is in teresting to n o te th a t th e te m p e ra tu re
used in th e ir te s t (1112°F) is excessively high com pared to usual
borehole te m p era tu res . Scott e t al. (1953) in experim en ts conducted
on sandstone cylinders a t te m p e ra tu re s betw een 80*F and 200°F
showed no v aria tio n in f rac tu re p ressu re w ith te m p e ra tu re for
e ith e r pene tra tin g or nonpene tra ting fluids. This range of
te m p e ra tu re is m u ch closer to th e ran g e of values of bottom -hole te m p e ra tu re encoun tered during leak-off tests.
Jo in ts an d Eaults N ear th e Well Bore
The p ressu re requ ired to induce hyd rau lic f ra c tu re can be
g rea tly affected if th e well bore, instead of being sm ooth an d
R e p ro d u c e d with p e rm iss io n of th e co p y rig h t ow ner. F u rth e r re p ro d u c tio n p roh ib ited w ithou t p e rm iss io n .
3 3
J 6000 org 5000 inc 4000 a.w 3000 353 2000 <a 1000
100 200 300 400 500 600 700 800RADIAL CONFINING STRESS, psi
FIGURE 12 - F rac tu re p ressu re versu s rad ia l confining s tress for Bandera sandstone (from Som erton e t al. 1964).
R e p ro d u c e d with p e rm iss io n of th e co p y rig h t ow ner. F u rth e r re p ro d u c tio n p ro h ib ited w ithou t p e rm iss io n .
1 « 1 1 .... J 1AXIAL STRESS = 6.14 x RADIAL STRESS
1" HEATING PRIOR TO TESTIN G : -
O NONEo UNIFORM TO H I2°F _• TEMPERATURE GRADIENT FROM
BOREHOLE
_
_______------------------------------ -- ^ ----- •.
L _____ - —---------------- ------ •
------------1------------1------------1------------1------------1________1________i

3 4
cylindrical, as assum ed in Equation (4), has th e rocks n e a r it
in tersected b y a sy stem of jo in ts and faults. H ubbert an d Willis
(1957) s ta ted th a t a n y section of a well bore a few tens of feet long
has probably been intersected. Thus, i t appears th a t th e tensile
s treng th s of m ost rocks subjected to hydrau lic frac tu ring by
p ressure applied in well bores a re effectively zero. Then, according
to Equation (4), th e p ressure requ ired to frac tu re th e fo rm ation is
only th a t required to reduce th e compressive stresses across some
planes in th e wall of th e hole to zero. The n a tu ra lly occurring
frac tu re will begin to open w hen th e applied p ressure equals th e
com pressive stress norm al to it, <Tf This com pressive s tress is
expressed by
<rt - 1/2 .<rz/ u - i - (i - 2jx). cos 20i+po (5)
Harrison e t al. (1954) equated th is com pressive stress no rm a l to
an inclined frac tu re (Equation 5) to th e injection pressure requ ired to
in itia te a vertica l f rac tu re in a non fractu red location (Equation 2).
They th e n solved th e re su lta n t equation for th e frac tu re inclination angle, 0, and derived th e following form ula:
0 - 1/2 COS’ 1 1 < l-4 » )/ ( 1-2j j i) + ( 2 ( 1 - p i ) / ( 1 - 2 * ) ) . 1. . (6)
Assuming a nom inal va lue of 0.25 for Poisson's ratio , j i , and
-0.1 for th e tensile stren g th to vertica l m a trix stress ratio , St /(T2, and
solving th e above equation for th e angle 0, a t w hich th e existing
frac tu re is as likely to open as is a new vertica l frac tu re , resu lts in a
va lue of approxim ately 53°. This va lue indicates th a t for these
R e p ro d u c e d with p e rm iss io n of th e co p y rig h t ow ner. F u rth e r re p ro d u c tio n p roh ib ited w ithou t p e rm iss io n .

3 5
conditions, a n a tu ra lly occurring frac tu re will be opened
preferen tia lly to a vertica l f rac tu re if i t m akes an angle of about 53°
or less w ith th e vertical. In addition, fau lts th a t c rea te angles of 30°
or less w ith th e vertica l frac tu re , according to Equation (5), should
widen a t applied pressures equal to (Tz/2, w hereas v ertica l joints, 0=0,
should be (Tz/3.
H arrison e t al. extended th e ir ana lyses to include cases in
w hich th e n a tu ra lly occurring frac tu re w as tigh tly closed or filled
w ith secondary deposits, so th a t, though i t possessed a negligible
tensile s treng th , fluid could no t be read ily in jected in to it. If w e use
th e sam e approach as before, b u t consider th a t th e p ressure required
to open th e frac tu re is tw ice th e no rm a l com pressive s tress to widen
it, th e p reexisten t f rac tu re would be opened w hen
05 1 /2 .COS*1! 1*(1 - m> /€1 -2jk).St /<rs ] ............. (7)
As th e vertica l s tress increases w ith depth , 0 approaches zero.
For sm all values of 0, th e tigh tly closed or cem ented frac tu re would
no t be opened in preference to a new v ertica l fra c tu re unless i t w ere
alm ost vertical.
Form ation Pore P ressure
J u s t as th e effect of overburden varia tions is im portan t, so also
is th e effect of form ation pore pressure variations. This would be
expected from inspection of th e theoretical relationships presented in
th e ea rlier sections. Correlations for predicting pore p ressure a re
R e p ro d u c e d with p e rm is s io n of th e co p y rig h t ow ner. F u rth e r re p ro d u c tio n p ro h ib ited w ithou t p e rm iss io n .

36
available in th e li te ra tu re . In th is s tu d y , it h as been assum ed th a t
th e pore p ressu re is know n.
Correlations for F rac tu re P ressure Prediction
H ubbert an d Willis's (1957) pioneering pape r established m u ch of
th e theoretical basis for subsequent w ork in frac tu re -g rad ien t
prediction techniques. They described th e effect th a t v aria tions in
th e th re e principal s tresses can hav e on f ra c tu re g rad ien t and
fra c tu re o rien tation . They pointed o u t th a t th e p ressu re to f rac tu re
a given fo rm ation should overcom e th e local s tress concen tration a t
th e borehole wall. This s tress concen tration w as found to be tw ice
th e least principal s tress of an und istu rbed region. In addition, th e y
s ta ted th a t un d er conditions of incipient n o rm a l faulting, such as
those in th e Gulf Coast a rea , th e horizontal m a tr ix stress is th e least
principal stress. If th e horizontal m a tr ix stresses in th e x an d y
direction a re equal, th e n th e p ressure requ ired to in itia te f ra c tu re in
a homogeneous, isotropic fo rm ation should be
Pf*2<rh+P0............................. <a)
w h ere <TX = <Ty = (T^. On th e basis of lab o ra to ry experim ents,
H ubbert a n d Willis concluded th a t in unconsolidated shallow
sedim ents, th e horizontal m a tr ix stress w ould be approx im ate ly
o ne-th ird th e vertica l m a tr ix stress. This observation is consistent
w ith Equation (1) if a va lu e of 0.25 is used for Poisson's ra tio .
The theoretical t r e a tm e n t used b y m ost a u th o rs (H ubbert and
Willis 1957; Haimson an d F a irh u rs t 1967; Hagoort e t al. 1980; Campos
R e p ro d u c e d with p e rm iss io n of th e co p y rig h t o w n er. F u rth e r re p ro d u c tio n p ro h ib ited w ithou t p erm iss io n .

3 7
1983) is to solve th e classical problem of s tress concen tration in a
v e ry large rec tan g u la r p la te w ith a sm all c ircu lar hole a t its cen ter
using elastic ity theo ry . The additional s tress fields in troduced b y th e
fluid being pum ped in to th e well an d b y borehole fluid m ovem ent
in to th e fo rm ation a re added b y th e principle of superposition
(Hubbert and Willis' 1957). The final solution, w hich is derived in
Appendix A, is
Pf - I3<ry -<r x - /12 - a . (1-2jjl) / (1 -*)] ♦ P0 (9)
w here a is th e Biot's constan t (Geertsma 1957).
Equation (9) Includes th e assum ptions th a t rock form ation is
elastic, porous, isotropic, homogeneous, an d has m easu rab le values of
Poisson's ra tio and Biot's constan t. In addition, th e w ell-bore w all is
considered to be sm ooth an d circu lar in cross section, and th e
principal regional stresses ac t parallel to th e v ertica l axis of th e well
bore. The frac tu rin g fluid is considered to p e n e tra te th e form ation.
The theoretical developm ent for a nonpene tra ting ty p e of fluid is also given in Appendix A and yields
pfs 3.<ry-<rx- v po........................... no)
It is in teresting to no te th a t th e assum ptions (Tx = (Ty = CTh and
= 0 reduce Equation (10) to th e H ubbert an d Willis fo rm u la defined
b y Equation (8).
R e p ro d u c e d with p e rm is s io n of th e co p y rig h t ow ner. F u rth e r re p ro d u c tio n p ro h ib ited w ithou t p e rm iss io n .

38
Drilling experience h as show n th a t form ation frac tu re gradients
genera lly increase w ith depth, even in n o rm a lly pressured
form ations. M atthew s and Kelly (1967) replaced H ubbert and Willis's
(1957) assum ption th a t th e m in im um m a tr ix s tress w as one-th ird th e
overburden w ith a m a tr ix stress coefficient, Kj , th a t is a function of
depth and can be regarded conceptually as th e ra tio of horizontal
effective stress to vertica l effective stress. The coefficient " K j" w as
determ ined em pirically from field d a ta collected a t th e south Texas
and Louisiana Gulf Coast, in n o rm a lly pressured form ations only.
Figure 13 shows th e plot obtained using these field d ata . The
frac tu re p ressure is given b y
Pf - I j . V P o ....................................... <n >
However, for abnorm ally p ressured form ations, th e m a trix
s tress should be determ ined a t th e dep th of a no rm ally pressured
form ation th a t h a s th e sam e m a tr ix stress as th e abnorm ally
pressured form ation . This dep th can be found graphically b y using a
pore p ressure ve rsu s depth plot or b y using th e equation
‘ pon* * (12)
w h ere S ^ , Pon an d P0 a re th e overburden stress and pore
p ressure eva luated a t and Dj, respectively. is th e depth of th e
corresponding n o rm a lly pressured form ation , and Dj is th e depth of
in teres t. Equation (12) can be simplified b y assum ing a fixed value of overburden load gradient.
R e p ro d u c e d with p e rm iss io n of th e co p y rig h t ow ner. F u rth e r re p ro d u c tio n p roh ib ited w ithou t p e rm iss io n .

3 9
SOUTH TEXAS GULF COAST
OOO
XI-0-LjJo
LOUISIANA GULF COAST
200.3 0.4 0 .5 0 .6 0 .7 0 .8 0.9
Kj, MATRIX STRESS COEFFICIENT1.0
FIGURE 13 - M atthew s and Kelly m a tr ix s tress coefficient forn o rm a lly pressured form ations (M atthew s an d Kelly 1967).
R e p ro d u c e d with p e rm iss io n of th e co p y rig h t ow ner. F u rth e r re p ro d u c tio n p roh ib ited w ithou t p e rm iss io n .

In 1968, P ennebaker presented a correlation sim ilar to th a t of
M atthew s and Kelly. P ennebaker refe rred to th e coefficient "Kj" as
th e effective stress ra tio an d correlated th is ra tio w ith depth,
regardless of pore p ressure ratio . In th is case, th e ac tu a l dep th of
in te re s t Dj, is used d irectly in Figure 14 to obtain Kj. In addition,
P ennebaker did n o t assum e a constan t v a lu e of v ertica l overbu rden
stress. He developed a correlation for determ in ing vertica l
overburden stress g rad ien t as a function of depth and geologic age for
various depths a t w hich th e in te rv a l tra n s i t tim e obtained from
seismic d a ta is 100 |i sec/ft. This correlation is show n in Figure 15.
Eaton (1969) developed a correlation assum ing th a t th e
relationship betw een horizontal and v ertica l m a tr ix s tress is
ac cu ra te ly described b y Equation (1). Using observed fra c tu re -
g rad ien t d a ta from w este rn Texas and th e Texas and Louisiana Gulf
Coast, h e com puted values of Poisson's ra tio as a function of depth , as
show n in Figure 16. However, he d id n 't m ake a n y distinction
betw een frac tu re -p ressu re g rad ien t an d frac tu re-ex tension p ressu re
g radient. Consequently, th e va lu e of Poisson's ra tio obtained in
F igure 15 would h av e been slightly d iffe ren t if th e ana ly sis w as
m ad e using Equation (4). The Gulf Coast d a ta w e re an a lyzed b y
f irs t assum ing a constan t overburden s tress g rad ien t of 1.0 p si/ft an d
th e n assum ing a variab le overbu rden s tress obtained b y in tegra tion
of bulk density logs. Eaton 's equation is
Pf -U /U -jO K V P ^ + Po................................. (13)
w h ere Poisson's ra tio is obtained as show n in Figure 16.
R e p ro d u c e d with p e rm iss io n of th e co p y rig h t o w n er. F u rth e r re p ro d u c tio n p ro h ib ited w ithou t p e rm iss io n .
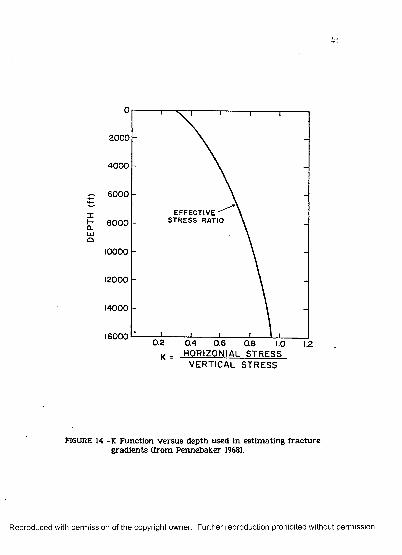
41
2000
4000
6000
E F F E C T IV E ''" S T R E SS RATIO
IF-CLLdO
8000
10000
12000
14000
160000.2 0.4 0.6 0.8
H0RIZ0NIAL STRESS1.0 1.2
VERTICAL STRESS
FIGURE 14 -K Function v e rsu s dep th used in estim ating f ra c tu re gradients (from Pennebaker 1968).
R e p ro d u c e d with p e rm iss io n of th e co p y rig h t ow ner. F u rth e r re p ro d u c tio n p ro h ib ited w ithou t p e rm iss io n .

DEPT
H (f
t)
- AT OF 100/i s e c /f t AT I20<2000
4000 14000 '
6000
8000
10000
12000
14000
16000 10 12 14 16 18 20OVERBURDEN GRADIENT (Sz - lb /g a l)
FIGURE 15 - V ariation in overburden grad ien t w ith geologic age (Pennebaker 1968).
R e p ro d u c e d with p e rm is s io n of th e co p y rig h t ow ner. F u rth e r re p ro d u c tio n p roh ib ited w ithou t p e rm iss io n .
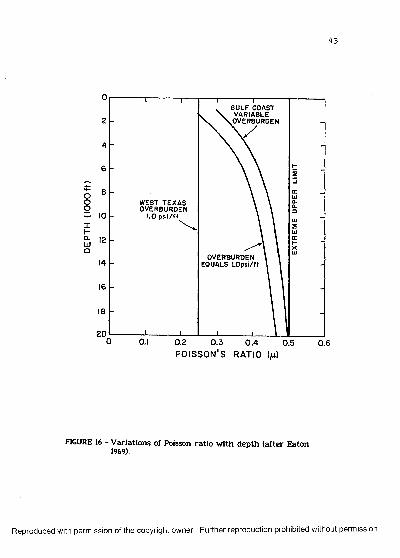
DEPT
H (1
00
0ft
)
43
GULF COAST VARIABLE
(.OVERBURDEN
WEST TEXAS OVERBURDEN
1.0 p s i / f f
OVERBURDEN EQUALS I.O psi/ft
200.2 0.3POISSON'S RATIO ( f j .)
0.4 0.5 0.6
FIGURE 16 - V ariations of Poisson ra tio w ith dep th (after Eaton 1969).
R e p ro d u c e d with p e rm iss io n of th e co p y rig h t ow ner. F u rth e r re p ro d u c tio n p roh ib ited w ithou t p e rm iss io n .

4 4
C hristm an (1973) exam ined som e bulk d ensity logs of th e S an ta
B arbara channel off th e California coast and found th a t in wells
having low frac tu re pressures zones of unusu a lly low density w ere
exposed in th e w ell bore, and h igh -frac tu re g radients w ere
accom panied th roughou t th e well bore b y rocks of g re a te r-th a n -
norm al density . The finding suggests th a t fo rm ation bulk density
co rrelates w ith s tress ra tio an d can serve as a m easu re of th e degree
of compaction. F rac tu ring is assum ed to be a t th e depth of highest
s tress ra tio and lowest rock density . The plot of these s tress ratios
observed in th e S an ta B arbara channel v e rsu s th e rock density is
show n in Figure 17. The equation to p redict form ation frac tu re
pressure is
P f - F ^ - V ^ ............................... (14)w here,
% * s tress ra tio (Figure 17).
C hristm an 's approach em phasizes th a t d ifferent ty p es of rocks
can h av e different f rac tu re initiation gradients, if all o th e r factors
a re equal. This th e n reinforces th e concept th a t th e w eakest
form ation is n o t necessarily a t th e casing shoe.
A nderson e t al. (1973) utilized Biot's (1956) s tre ss -s tra in relations
for elastic porous m edia and ce rta in o th e r assum ptions to develop
th e following theoretical expression for frac tu re -g rad ien t prediction:
P ,. <2. M I - M» - h * « • - 3»> / u -» )) « • P0 ....................U5>
R e p ro d u c e d with p e rm is s io n o f th e c o p y rig h t ow ner. F u rth e r re p ro d u c tio n p ro h ib ited w ithou t p e rm iss io n .

1.50
1.75
2.00
-J 2 .25
© F rac tu re T ests • Lost C irculation o No Lost C ircu lation
2 .5 0 •— 0.2 0.3 0 .4 0.5 0.6 0.7 0.8
STRESS RATIO (Fo-)
FIGURE 17 - S tress ra tio ve rsu s rock d en s ity (a fte r C hristm an 1973).
R e p ro d u c e d with p e rm iss io n of th e co p y rig h t ow ner. F u rth e r re p ro d u c tio n p roh ib ited w ithou t p e rm iss io n .

k6
In addition to th e frac tu re -p ressu re equation, Anderson e t al.
developed a n em pirical relationship betw een Poisson's ratio , p , and
th e shale con ten t of sand. The shale content, together w ith pore and
overburden pressures, w as estim ated b y using acoustic an d density
logging devices. These d a ta w ere used to develop th e
frac tu re -p ressu re prediction Equation (15) and th e plot in Figure 18.
In addition, Anderson e t a l.’s studies show th a t frac tu re
g rad ien t v a ries significantly a t a given dep th in a geological a re a and
th a t these varia tio n s can be a ttr ib u te d to variab le m echanical
properties of form ations, a finding sim ilar to C hristm an 's (1973).
B rennan and Annis (1984) began th e ir w ork in th e w este rn and
cen tra l Gulf of Mexico, b y firs t compiling a d a ta base on each well
th a t included overburden p ressure, pore p ressure, an d form ation
fra c tu re pressures. They th e n perform ed an ana lysis to investigate
previously published depth-based correlations. They found th a t th e
inadequacy of th e resu lts obtained w as p rim arily a t tr ib u tab le to th e
varia tio n from w ell to well of th e top of abnorm al p ressu re and of
pore pressure w ith respect to overburden p ressure.
Assuming a variab le overbu rden m easu red from form ation
properties an d including seaw ate r overbu rden p ressure, B rennan and
Annis developed th e following equation b y cu rv e fitting a plot of (Pf -
Pq) versu s ( ^ - Pq), using 57 leak-off te s t da ta . This plot is presented
in Figure 19.
P|-P<>* »-35<VV- KOGj-Po)2 ..................... « «
R e p ro d u c e d with p e rm iss io n of th e co p y rig h t ow ner. F u rth e r re p ro d u c tio n p roh ib ited w ithou t p e rm iss io n .

4 ?
.40
<tr
£ . 2 0o(SiCOo
.10
0 20 30S H A L E INDEX (% )
4 0
FIGURE 18 - Poisson ra tio v e rsu s shale index.
R e p ro d u c e d w ith p e rm iss io n of th e co p y rig h t o w ner. F u rth e r re p ro d u c tio n p ro h ib ited w ithou t p erm iss io n .
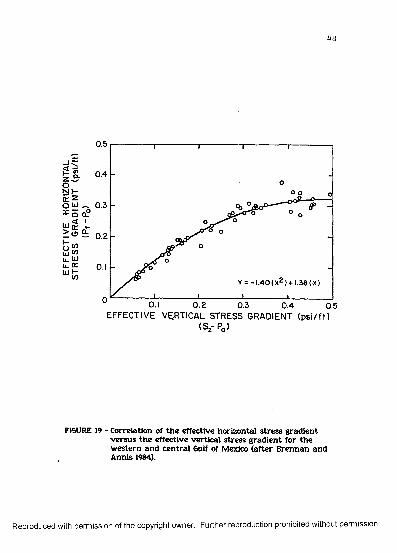
EFF
EC
TIV
E
HO
RIZ
ON
TAL
STR
ESS
GR
AD
IEN
T (p
si/f
t)
(Pf-
Po)
4 8
0.5
0.4
o o
0.1
Y = - 1 . 4 0 (X ) + 1 .38 (X)
0.1 0 .2 0.3EFFECTIVE VERTICAL STRESS GRADIENT (p s i/f t)
0.4 0.5
(Sz-P 0 )
FIGURE 19 - Correlation of th e effective horizontal s tress g rad ien t v e rsu s th e effective v ertica l stress g rad ien t for th e w estern an d cen tra l Gulf of Mexico (after B rennan and Annis 1984).
R e p ro d u c e d with p e rm is s io n of th e co p y rig h t ow ner. F u rth e r re p ro d u c tio n p roh ib ited w ithou t p e rm iss io n .

4 9
F rac tu re Expansion
The li te ra tu re on h y d rau lic frac tu rin g can be divided in to tw o
m a in groups p rim arily concerned w ith th e geom etry of th e
expanding h yd rau lic f rac tu re . This li te ra tu re h as evolved from th e
studies of engineers in te res ted in im proving th e design of f ra c tu re
s tim u la tion tre a tm e n ts of oil an d gas reservoirs. A uthors of th e f irs t
group use th e design m ethods firs t proposed b y Perkins and Kern
(1961) an d N ordgren (1972), know n as th e PKN m ethod a f te r its
au th o rs. Basically, a u th o rs in th is group assum e a vertica lly closed
la te ra lly sim ilar elliptical crack. The second group of a u th o rs uses
th e design m ethods firs t proposed b y Christianovich and Zheltov
(1955), G eertsm a an d DeKlerk (1969), Kiel (1970) an d D aneshy (1973),
know n as th e CGDD m ethod a f te r its au tho rs. This second group also
assum es a vertica lly bounded frac tu re . However, th e fra c tu re w id th
is assum ed constan t across th e height of th e f ra c tu re th a t fo rm s th e
shape of a rec tan g u la r crack opening. The geom etries proposed by
these tw o groups a r e show n in Figure 20.
The m a in difference betw een th e PKN m ethod an d th e CGDD
m ethod re la tes to th e poten tia l for bedding p lane slip. The CGDD
m ethod assum es th a t th e fo rm ation bed being frac tu red is
independent of th e beds above an d below, an d consequently th e
e a r th w ould h a v e to slip a t th e in terface betw een frac tu red region
a n d overburden an d underbu rden , as illu s tra ted in th e detailed view
in Figure 20. On th e o th e r hand , th e PKN group assum es th a t th e re
is no slip of th e boundaries, or only a negligible am o u n t, along th e
horizontal planes confining th e f ra c tu re height. They assum e th a t
sufficient bonding occurs betw een th e frac tu red bed an d th e ad jacen t
s t r a ta th a t th e f ra c tu re w ill close a t th e tips. In addition, th e PKN
R e p ro d u c e d with p e rm iss io n of th e co p y rig h t o w n er. F u rth e r re p ro d u c tio n p ro h ib ited w ithou t p e rm iss io n .

Reproduced
with perm
ission of the
copyright owner.
Further reproduction prohibited
without perm
ission.
.P e to il A Detoil
OverburdenO verburden
FracturedZone
FracturedZone
\ . lln d erb u rd enU nderburden
- Top Bed _ F o rm atio n Beading Slip
FractureT
Detail A
_~Top B e d z ^Form ation
F ractured ! Form a/ion
F ra c tu re
Detail B
FIGURE 20 -Two simplified possibilities for th e geo m etry of a . hydraulic fracture.

51
group believes th a t high horizontal stresses a t th e top and bottom
la y ers lim it th e height grow th of vertica l frac tu re s in to these zones
b y tending to close th e frac tu re . These boundary zones can be
p en e tra ted un til th e opposing forces counterbalance one ano ther. If
the se b o undary zones a re no t thick enough, th e n th e frac tu re m a y
crack th rough in to o the r zones. Examples of these higher horizontal
stresses can be found som etim es in shale an d in lim estone reservoirs
w h ere non- perm eable sections m a y h av e higher horizontal stresses
th a n do perm eable sections a f te r th e reservo ir pressu re has been
d raw n down (Perkins and Kern 1961). Figure 20 shows th e geom etry
of these tw o hypothesis. Also, in a rea s w here th e horizontal stress is
less th a n th e vertica l stress, form ations th a t fail p lastically will hav e
a higher horizontal stress th a n form ations th a t fail elastically.
Nolte (1982) found th a t bedding planes slip only if th e friction
betw een beds can be overcom e. This fric tion is d irectly proportional
to th e overburden load acting on th e planes w here slip occurs.
Therefore, it is m ore likely th a t bedding planes will slip a t shallower
dep ths th a n a t deeper depths because of th e difference in overburden.
V arious models available in th e l i te ra tu re a re based on
theoretical approaches used to solve th e fra c tu re m echanics problem;
these approaches a re built on ce rta in assum ptions th a t sim plify th e
m a th em atica l solution. These models, according to th e ir frac tu re
geom etry and o the r assum ptions, genera lly fall in one of th e tw o
groups, PKN or CGDD. Since th e y do no t incorporate a rigorous
m a th em atica l solution th e y a re classified as practical application
models. In general, th e technical approach is to solve th e con tinu ity
equation, including th e effects of fluid loss to th e form ation th rough
R e p ro d u c e d with p e rm is s io n of th e co p y rig h t ow ner. F u rth e r re p ro d u c tio n p ro h ib ited w ithou t p e rm iss io n .
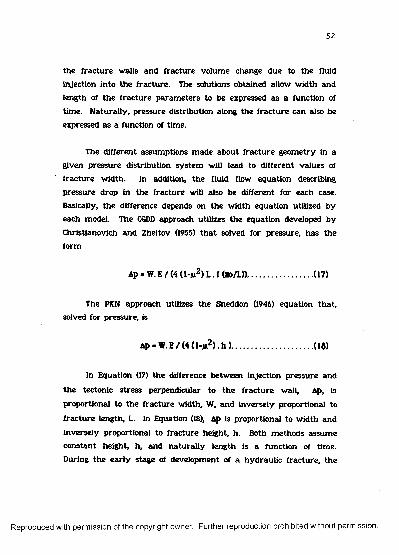
5 2
th e fra c tu re walls and frac tu re volum e change due to th e fluid
injection in to th e frac tu re . The solutions obtained allow w id th and
length of th e f rac tu re param ete rs to be expressed as a function of
tim e. N atu ra lly , p ressure distribution along th e frac tu re can also be
expressed as a function of tim e.
The d ifferent assum ptions m ade abou t f rac tu re geom etry in a
given p ressure distribution sy stem will lead to d ifferent values of
f rac tu re w idth . In addition, th e fluid flow equation describing
pressu re drop in th e frac tu re will also be d ifferent for each case.
Basically, th e difference depends on th e w id th equation utilized by
each model. The CGDD approach utilizes th e equation developed by
Chrlstianovich an d Zheltov (1955) th a t solved for p ressure, has th e
form
Ap « W.E / (4 (1-m2) L . f (a>/L))............................ (17)
The PKN approach utilizes th e Sneddon (1946) equation th a t, solved for pressure, is
Ap « W.E / (4 . h )................................... (16)
In Equation (17) th e difference betw een injection p ressure and
th e tectonic stress perpendicular to th e fra c tu re w all, Ap, is
proportional to th e f rac tu re w idth , W, and inverse ly proportional to
f rac tu re length, L. In Equation (18), Ap is proportional to w id th and
inverse ly proportional to frac tu re height, h . Both m ethods assum e constan t height, h, and n a tu ra lly length is a function of tim e.
During th e e a rly stage of developm ent of a h yd rau lic frac tu re , th e
R e p ro d u c e d with p e rm iss io n of th e co p y rig h t ow ner. F u rth e r re p ro d u c tio n p roh ib ited w ithou t p e rm iss io n .

5 3
change in length w ith tim e is m uch faste r th a n th e change in w id th
w ith tim e. Thus, Equation (17) indicates th a t change in p ressure
caused b y flow along th e f rac tu re decreases w ith tim e (Daneshy
1973). However, Equation (18) predicts th e opposite, since fra c tu re
height is constant, p ressure will a lw ays Increase w ith tim e.
Investigators (Geerstma and Deklerk 1969; D aneshy 1973)
supporting th e CGDD m ethod claim th a t close exam ination of
frac tu rin g p ressure ch a rts will show th a t if th e frac tu ring fluid and
in jection ra te s rem ain constant, th e frac tu rin g p ressure usually
decreases during th e frac tu re expansion. These charts , how ever,
w ere no t included in th e ir papers.
W arpinski (1985) m ade field m easu rem en ts of w id th an d
pressu re in a propagating hyd rau lic f ra c tu re a t th e U. S. DOE's
N evada te s t site to investigate p ressure drop along th e frac tu re an d
crack tip a rriv a l tim e during th e norm al f rac tu re grow th stage. On
th e basis of these field m easurem ents, W arpinski expressed fra c tu re
length as a function of tim e, t , in th e form
L- A. t f * ................................................... (19)
They com pared th e values of th e constant, A, and th e tim e
exponent, m , obtained for d ifferent values of length and tim e d irec tly w ith those predicted b y th e theories of G eertsm a and DeKlerk (1969)
(CGDD approach), and Nordgren (1972) (PKN approack). Fluid loss to th e
fo rm ation w as ignored because it w as re la tiv e ly low. The resu lts
showed th a t N ordgren's exponent for t, w hen N ordgren 's no fluid loss
solution w as used, m atched th e d a ta best, an d th e constan t A for
both theories w as n o t v e ry different. The m easured frac tu re
R e p ro d u c e d with p e rm is s io n of th e co p y rig h t ow ner. F u rth e r re p ro d u c tio n p ro h ib ited w ithou t p e rm iss io n .
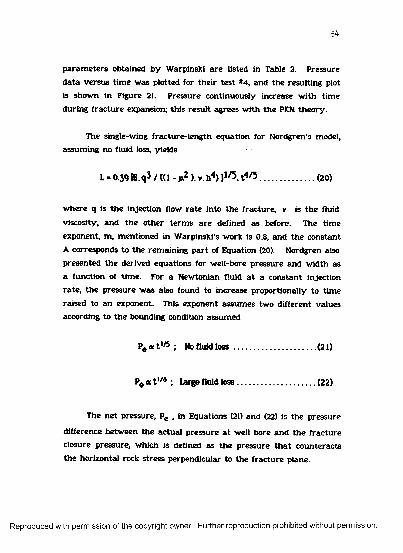
54-
p a ra m e te rs obtained b y W arpinski a re listed in Table 2. P ressure
d a ta v e rsu s tim e w as p lo tted for th e ir te s t *4, and th e resu lting plot
is show n in Figure 21. P ressure continuously increase w ith tim e
during f ra c tu re expansion; th is re su lt agrees w ith th e PKN th e o ry .
The single-wing frac tu re -len g th equation for N ordgren's model, assum ing no fluid loss, yields
L - 0.39 ®.q3 / «1 - >i2 ).». h4) l1 , t4/5 ........................ (20)
w h ere q is th e injection flow r a te in to th e frac tu re , v is th e fluid
viscosity , an d th e o th e r te rm s a re defined as before. The tim e
exponent, m , m entioned in W arpinski’s w ork is 0.8, an d th e constan t
A corresponds to th e rem ain ing p a r t of Equation (20). N ordgren also
p resen ted th e derived equations for w ell-bore p ressure and w id th as
a function of tim e. For a N ew tonian fluid a t a constan t injection
ra te , th e p ressu re w as also found to increase p roportionally to tim e
raised to a n exponent. This exponent assum es tw o d iffe ren t values
according to th e bounding condition assum ed
P * a t ,/5 ; No fluid lo ss ................................... (21)
Pe a t !/* ; Large fluid loss.................................. (22)
The n e t p ressure, Pc , in Equations (21) and (22) is th e p ressure
difference betw een th e ac tu a l p ressu re a t w ell bore an d th e f rac tu re
closure pressure, w hich is defined as th e p ressure th a t coun terac ts
th e horizontal rock s tress perpendicular to th e f rac tu re plane.
R e p ro d u c e d with p e rm iss io n of th e co p y rig h t ow ner. F u rth e r re p ro d u c tio n p roh ib ited w ithou t p e rm iss io n .
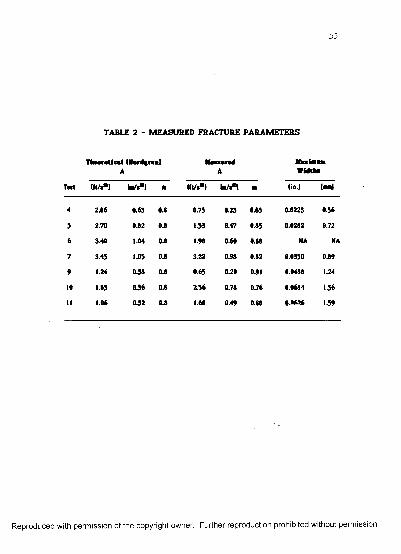
TABLE 2 - MEASURED FRACTURE PARAMETERS
TfcMraticml ( la r l in t ) Mmaartrf i u i a nA A V itftte
Test (ft/**) lm/*u \ • (ft/**) !■/**! ■ (in.) ( u l
4 2.06 0.63 0.8 0.75 0.23 0.85 0.0223 0.56
5 2.70 0.82 0.8 1.53 0.47 0.85 0.0282 0.72
6 3.40 1.04 0.8 1.98 0.60 0.88 NA NA
7 3.45 1.05 0.8 3.22 0.98 0.82 0.0350 0.89
9 1.24 0.38 0.8 0.65 0.20 0.91 0.0488 1.24
10 1.85 0.56 0.8 2.56 0.78 0.76 0.0614 1.56
11 1.06 0.32 0 A 1.60 0.49 0.88 0.0626 1.59
R e p ro d u c e d with p e rm iss io n of th e co p y rig h t o w n er. F u rth e r re p ro d u c tio n p ro h ib ited w ithou t p e rm iss io n .

PRES
SUR
E
56
Mpo psi400
SINGLE-WINGFLOW300
2
NORMAL FRACTURE GROWTH
200
100
0
200 4 0 0 TIME (sec)
6 0 0
FIGURE 21 - P ressure d a ta v ersu s tim e (after W arpinski 1985).
R e p ro d u c e d w ith p e rm iss io n of th e c o p y rig h t ow ner. F u rth e r re p ro d u c tio n p ro h ib ited w ithou t p erm iss io n .
5 7
Nolte an d S m ith (1981) discuss how to in te rp re t frac tu re -
p ressure response during fra c tu re expansion and conclude th a t th e
d a ta p resented a re consistent w ith th e frac tu rin g assum ption of
Perkins and Kern (1961) during th e initia l portion of th e tre a tm e n ts
called "mode I" in Figure 22. In addition, th e y noticed th a t in mode I
th e slope of each tr e a tm e n t fell w ith in Nordgren bounds (1/8 and 1/5)
show n in Equations (21) and (22). In terestingly, th e injection period of
tim e above frac tu re closure in a leak-off te s t practica lly never
reaches 50 m in. Thus, w e can conclude, based on Figure 22, th a t
leak-off te sts a re v e ry likely to fall in th e m ode I category. In fact,
in practice mode II is practica lly n ev e r reached during a leak-off test.
Nolte and S m ith (1981) extended th e w ork done b y N ordgren
(1972) to propose th a t th e tim e exponent used in Equations (21) and
(22) for N ew tonian fluid could be rep resen ted for a generalized fluid
as
w here e is th e tim e exponent, an d n is th e pow er-law exponent.
The models derived w ith CGDD an d PKN m ethods a re know n as
tw o-dim ensional models (2-D models) because of th e ir assum ption of
constan t frac tu re height. Recently, som e researchers h av e claim ed
th e developm ent of m ore sophisticated three-d im ensional models (3-D
models) yielding good resu lts (Williams 1970; S e tta ri and Cleary 1984;
M eyer 1985). In th e 3-D models, th e f ra c tu re height, w id th , and
length a re allowed to v a r y w ith tim e. The assum ption is th a t th e
frac tu re will ex tend vertica lly u n til i t reaches th e upper and lower
e » 1 / (2 n + 3) ; No fluid loss... • « 1/ (4 & * 4) ; Large fluid loos.
(23)(24)
R e p ro d u c e d with p e rm is s io n of th e co p y rig h t ow ner. F u rth e r re p ro d u c tio n p ro h ib ited w ithou t p e rm iss io n .

PRES
SURE
AB
OVE
CLOS
URE
(psi
)
5 8
Lock>up4 0 0 0
Case I
2000C ase 2
Case1000
I lH * IV-
1.0 N egative
•» -S ta r t P roppant
20 2 0 0 4 0 0T IM E (min)
FIGURE 22 -Exam ples showing d ifferent cha racte ris tic slopes (after Nolte and S m ith 1981).
R e p ro d u c e d with p e rm iss io n of th e co p y rig h t ow ner. F u rth e r re p ro d u c tio n p roh ib ited w ithou t p e rm iss io n .
59
s tra ta . How deep th e frac tu re p en e tra te s in to these s tr a ta will
depend on th e confining stress co n tras t in th e fo rm ation being
frac tu red . Figure 23 illu stra tes how th e frac tu re profile changes
w ith confining stress con trast, A y . It shows th a t as th e confining
s tress co n tra s t increases, th e f rac tu re tends to look m ore like th e one
predicted b y 2-D models w ith lim ited height. In general, these 3-D
models incorporate th e CGDD and PKN m ethods w hen confining stress
co n tra s t is high. For ea rly stages during fra c tu re expansion or w hen
th e leng th /he igh t ra tio is less th a n or equal to 1, th e CGDD m ethod is
used; w hen th is ra tio is g rea te r th a n 1, th e PKN m ethod is used. For
m odera te to low er confining stress con tras t, th e model does no t lim it
th e f ra c tu re shape to being elliptical or rec tangu la r, b u t ra th e r
allows th e w id th profile to change depending on th e o verbu rden /
u nd erb u rd en s tress and moduli co n tras t an d th e fra c tu re height-to
length aspect ratio .
M ey er 's (1985) 3-D model, for exam ple, assum es th a t th e
p ressu re profile in itia lly decreases w ith tim e (CGDD approach), un til it
reaches th e upper and lower s tra ta . Once it reaches these barriers,
th e p ressu re will increase if confining s tress con tras ts a re large, or it
will continue to decrease if th e b a rrie rs a re w eak.
The 3-D models developed a re pow erful tools for realistic
ana ly sis of f ra c tu re tre a tm e n ts because th e y solve th e rock
m echanics problem m ore rigorously th a n do th e 2-D models.
However, verification and rou tine practica l application in th e full 3-D
m ode a re genera lly lim ited b y lack of d a ta (S ettari an d Cleary 1984).
A ny Im provem ent in accu racy th a t could be obtained w ith the
m a th em a tic a l model is genera lly lost because of th e inaccuracy of
som e of th e es tim ates of th e p a ram e te rs used in th e model.
R e p ro d u c e d w ith p e rm is s io n of th e c o p y rig h t o w ner. F u rth e r re p ro d u c tio n p ro h ib ited w ithou t p e rm iss io n .

60
40 0
300Act = 0 psi
^ ,A c r= 100 psi V \ A < r = 5 0 0 psi
i -A nr
200
100A O 1
-100
-200
-3 0 0
-4 0 0 -
100 200 3 0 0 4 0 0 5 0 0 6 0 0 700FRACTURE LENGTH (ft)
FIGURE 23 Example of a three-d im ensional f rac tu re profile.
R e p ro d u c e d w ith p e rm is s io n of th e c o p y rig h t o w n er. F u rth e r re p ro d u c tio n p ro h ib ited w ithou t p e rm iss io n .

61
S ystem Overall Compressibility
W hen m u d is firs t slowly pum ped in to th e well during a
leak-off test, th e Blow-out P reven ter (BOP) is closed, th e casing is not
leaking, and th e form ation has not been frac tu red . At th is tim e th e
well ac ts as a closed container com pletely full of m ud. The injection
of m ud in to th e well bore will increase th e an n u la r and th e drill pipe
p ressures because of fluid com pressibility. Increasing an n u la r and
drill pipe pressures will th e n cause a n increase in stresses in both
th e drill pipe and casing. The increasing stress will cause th e
m echanical dim ensions of casing and drill pipe to change; th is change
in dim ensions is reflected b y a well bore volum e and p ressure
change. In addition, non-N ew tonian fluid flow effects such as
pressu re drop in th e drill pipe and open-hole section, as w ell a s effect
of gel s treng th , should also be taken in to account w hen th e engineer
predicts th e relationship betw een su rface pum p pressu re and
p ressure a t th e bottom of th e drill pipe. The volum e of m ud
responsible for increasing pressure and for casing and drill pipe
expansion is sm aller th a n th e to tal volum e injected w ith in a ce rta in
period of tim e since p a r t of it is lost th rough filtration to perm eable
form ations, if a n y a re present. Figure 24 shows a typ ical well
configuration during a leak-off test.
The basic equation used to calculate th e in jection p ressure
response resu lting from constan t injection flow ra te is th e definition
of iso therm al com pressibility:
C * - 1/V (^V/bpJp........................................(25)
R e p ro d u c e d with p e rm iss io n of th e co p y rig h t ow ner. F u rth e r re p ro d u c tio n p ro h ib ited w ithou t p e rm iss io n .
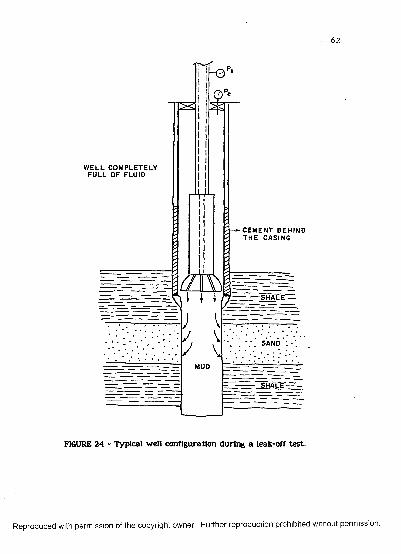
62
W E L L C O M P L E T E L Y FU L L O F FLUID
C E M E N T B E H IN D T H E CA SI N G
S H A L E'
SAND
MUD
FIGURE 24 - Typical w ell configuration during a leak-off te st.
R e p ro d u c e d with p e rm iss io n of th e co p y rig h t ow ner. F u rth e r re p ro d u c tio n p roh ib ited w ithou t p e rm iss io n .

63
Equation (25) is genera lly simplified for sm all p ressu re changes
an d th e com pressibility closely approxim ated by using th e following
equa tion for average com pressibility, Cavg :
CAVG --1/V .UV/4P).....................................(26)
or
AP»-AV/Cav g .V..........................................(27)
The to ta l w ell-bore volum e occupied b y th e m ud , V, can be
a rb i tra r ily chosen from th e original, final, or average volum e w ith
no significant change in th e num erical answ er. For th e purposes of
th is w ork, th e original volum e w as a rb i tra r ily chosen to be used in
th e m a th em atic a l model.
The effective m u d com pressibility for w a te r-b a se m uds, C ^,
w ith oil b u t no gas p resen t can be expressed as
Cm * * C0 . S0 ♦ Cg.Sg..........................(2d)
Cyr* C0 , Cg ■ w a te r, oil, an d solids in th e m u d com pressibilities
respectively; psi.
*vr , S0 , Sg « w a te r, oil, and solids in th e m u d sa tu ra tions ,
respectively .
R e p ro d u c e d with p e rm is s io n of th e co p y rig h t ow ner. F u rth e r re p ro d u c tio n p roh ib ited w ithou t p e rm iss io n .

The w a te r com pressibility (C^) is a function of both pressure
and tem p era tu re . V alues lor iso therm al com pressibility of w a te r
can be obtained using Tait's em pirical equation, w hich w as p u t into a
m ore useful form b y Wilcox (1979):
C ,, = 0.1366 / (40 096.1 + 161.27 T - 1.769 T2 + P) (29)
w here,
P = p ressure, psi
T = tem perature,°C
Equation (29) has been verified experim en tally w ith in th e
te m p era tu re range of 25°C to 85°C. However, it is believed th a t
Equation (29) can be safely applied w ith in th e te m p era tu re range of
25°C to 125°C. The solid's com pressibility can be found in th e
l i te ra tu re (Nowacki 1962) and has an average value of 0.2 x 10"6 psi-1.
The average com pressibility of oil w ith no gas dissolved in i t can be
estim ated b y using th e em pirical relation of O'Bryan e t al. (1986),
w hich is
C0 - 6.72 - 0.0522 T ♦ 3.64 x 10“4 T2 - 6.06 10‘7 ♦
+ (3 96 X 10‘5 - 4.64 X 10"7 T + 3-16 x 10"9 T2 - 5.04 x 10'12 t3) P ++ (2.54 x 10"10 - 3.79 X 10"12 T+ 2.42 x 10"14 T2 - 3.63 10"17 t3)P2
................................................................................................ (30)
In Equation (30) te m p era tu re should be given in °F.
R e p ro d u c e d with p e rm iss io n of th e co p y rig h t ow ner. F u rth e r re p ro d u c tio n p ro h ib ited w ithou t p e rm iss io n .

6 5
Drill Pipe and Drill Collar Expansion
Drill pipe expansion during a leak-off te s t is negligible since th e
difference in in te rn a l and ex ternal pressures to th e pipe is small.
This p ressure difference corresponds to th e fric tional pressu re loss of
th e fluid flowing in th e pipe ahead of a given point, assum ing
injection th rough th e pipe. The pressure drop value inside th e pipe
is sm all as a re su lt of th e low values of injection r a te no rm ally used
w hen run n in g a leak-off test.
Casing Expansion
The well-bore volum e change, AV, caused b y a change in
surface injection pressure w ith tim e, is one of th e m ost difficult
p a ram e te rs to eva luate for Equation (27). W ith respect to th e last
casing set, th e well can be configured tw o w ays: (1) w ith th e casing
cem ented up to th e surface or (2) w ith th e casing p artia lly cem ented
and p artia lly backed b y old m ud. In each case, th e stra in s
associated w ith p ressure change will be different. Therefore, these
tw o situa tions will be considered separa te ly in th is section.
The pressure-induced stress is assum ed no t to exceed th e
proportionality lim it of th e elastic region of th e s tress -stra in d iagram
for th e casing m a te ria l being used. This assum ption is valid since
casing design practice considers exceeding th e yield point of th e steel
to be equivalent to failure. The elastic region is show n in th e typical
stress-stra in d iagram for steel presented in Figure 25. Change in
p ressu re or pressure-induced stress can be used w ith th e change in
volum e AV, ra th e r th a n th e absolute p ressu re or stress. Hooke's law
can be applied to model th e stress-stra in relationship.
R e p ro d u c e d with p e rm iss io n of th e co p y rig h t ow ner. F u rth e r re p ro d u c tio n p roh ib ited w ithou t p e rm iss io n .
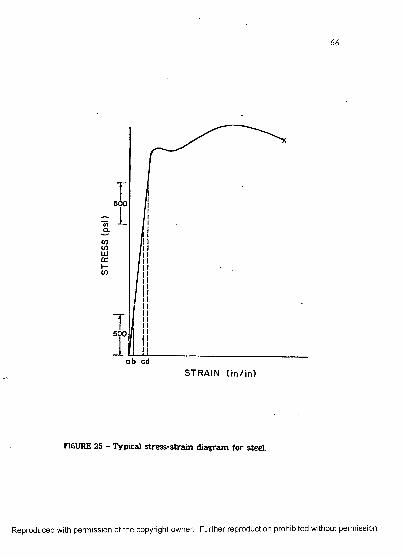
6 6
500
COCOIxlorh-CO
500
ab cdSTRAIN ( in /in )
FIGURE 25 - Typical s tre ss -s tra in d iag ram for steel.
R e p ro d u c e d with p e rm iss io n of th e co p y rig h t o w n er. F u rth e r re p ro d u c tio n p ro h ib ited w ithou t p e rm iss io n .

6 7
Casing Not Cem ented. For th e section of th e well in w hich th e casing
is n o t cem ented, th e p ressure of th e fluid behind th e casing is
assum ed no t to be changed b y th e expansion of th e casing. This is
felt to be a valid assum ption because of th e leak p a th s genera lly
availab le to th e fluid outside of th e casing In addition, to sim plify
th e s tre ss -s tra in equations, th e casing is considered to be a
u n ifo rm cylinder. The couplings used to connect th e jo in ts of
casing a re neglected In th is ana ly sis since th e y account for less th a n
2 percen t of th e to ta l pipe length.
H earn (1977) h as shown th a t th e d ia m etra l s tra in on a cylinder
equals th e hoop or circum ferentia l s tra in . The d ia m etra l s tra in is
equal to th e change in d iam ete r divided b y th e unstra in ed d iam eter.
Combining rad ia l an d hoop stress resulting from p ressu re loading and
eva lu a ted b y Lam e's equations (Hearn 1977) w ith Hooke's law
(Timoshenko an d Goodier 1951) one obtains th e following for th e
change in d iam ete r (Wilcox 1979), AD;
AD-D/Eg I (l-j*2s)(A P j R| - AP0 / (R0 - Rj) ♦ jAgO+jjig)
(APi Ri + AP0 R0)/(R0 + R1) l ...................................................... (31)
w here,
Pj = v a ria tio n in p ressu re inside th e cylinder, psi
P0 = v aria tio n in p ressu re outside th e cylinder, psi
Rj = in te rn a l rad iu s of th e cylinder, in.
R0 = ex te rn a l rad iu s of th e cy linder, in.
D = original d iam ete r of th e cy linder, in.
R e p ro d u c e d with p e rm iss io n of th e co p y rig h t o w n er. F u rth e r re p ro d u c tio n p ro h ib ited w ithou t p e rm iss io n .
Es = Young's m odulus for steel, psi
Ms = Poisson's ra tio for steel
Equation (31) Includes th e reasonable assum ption th a t applied
p ressure displaces all points of an a n n u la r ring of th e cylinder wall
b y th e sam e am ount, depending on th e rad iu s of th e ring. Thus, th e
cylinder w all m a in ta in s its sym m etrica l rad iai shape, and no
shearing stresses can be set up on tra n sv e rse planes. In addition, th e
casing is considered to be anchored b y th e cem ented section; thus,
th e longitudinal s tra in due to v aria tion in in te rn a l p ressu re is zero.
Casing cem ented . Determ ining th e d iam etra l s tra in caused b y th e
change in in te rn a l pressure of casing in th e cem ented section
necessitates a good knowledge of th e bond q u a lity betw een casing
an d cem ent, and betw een cem ent and form ation. If a g rea t p a r t of
th e cem ented section does no t adhe re to th e form ation, b u t does
have a good bond w ith th e casing, in te rn a l p ressure increases will
cause th e casing to expand, an d tension stresses will be induced in
th e cem ent. Since cem ent has low resistance under tension, it will
break . On th e o ther hand , if th e bond betw een th e cem en t and
form ation is good, th e stresses induced b y th e casing try in g to
expand will be tra n sm itte d th rough th e cem ent body, w hich in th is
case will be under compression, to th e form ation , w hich w ould
p robably hold th e d istribu ted load. If th is happens, casing expansion
will be negligible.
The situa tion in w hich casing expansion can be m ost easily
eva luated occurs w hen th e re is a space or gap betw een th e casing
a n d th e cem ent behind it along th e e n tire cem ented section. This gap
R e p ro d u c e d with p e rm iss io n of th e co p y rig h t ow ner. F u rth e r re p ro d u c tio n p ro h ib ited w ithou t p e rm iss io n .
6 9
often form s during th e cem enting Job and is called a m icroannulus.
The m icroannulus can be caused b y continued p ressure on th e casing
a f te r cem enting, squeezing, or th e rm a l expansion of th e casing w hen
th e cem ent is setting up. N orm ally m icroannuli h av e d iam eter
clearances of less th a n 0.01 In. A cem ent bond log (CBL) can be used
to d eterm ine w h e th e r a m icroannulus is present. If th e CBL ru n
a f te r cem enting shows a good cem enting bond along m ost of th e
section cem ented, an d th e casing is cem ented in a com petent
form ation, th e casing expansion will be negligible. However, if a
m icroannu lus effect shows up on th e logs, th e casing will expand
un til i t reaches th e cem ent and th e n stop. Figure 26 shows th e
cem en t behind th e casing in th e possible situa tions described above.
F iltration
During a leak-off te st, m ud filtration to a perm eable form ation
occurs. The volum e of m u d (filtrate) lost to th e fo rm ation will affect
th e overall p ressu re behavior of th e well bore for a constant
injection ra te . F iltration first occurs in perm eable form ations
exposed to th e m ud in th e open-hole section. Later, w hen th e
form ation is frac tu red , fluid loss will also occur th rough th e w alls of th e opened frac tu re .
S tatic and dynam ic filtration hav e been th e sub jec t of several
labo ra to ry studies (Howard and Fast 1957; O utm ans 1963; P enny e t al.
1985). The expression of e lem en ta ry filtration theo ry , w hich assum es
s ta tic conditions of filtration , s teady sta te , and incom pressibility of th e m u d cake is
R e p ro d u c e d w ith p e rm is s io n of th e c o p y rig h t o w n e r. F u rth e r re p ro d u c tio n p ro h ib ited w ithou t p e rm iss io n .

7 0
Cosin< C em ent Formation
Pi
a - Good bond - casing expansion is negligible
C asingx C em ent Form ation
Bad Bond
b - Bad bond between cement and formation - Casing will expand only by breaking the cement
Casim Cem ent Form ation
Casing Expansion — M icroannulos
c - Bad bond between casing and cement - microannulus effect
FIGURE 26 - Exam ple of bonding betw een casing ,cem ent an d form ation .
R e p ro d u c e d w ith p e rm is s io n of th e co p y rig h t ow ner. F u rth e r re p ro d u c tio n p ro h ib ited w ithou t p e rm iss io n .

71
Vf - A/5.615 / I (APK) /144.51 v 1 {(fgc - i ^ ) / fgmJVT* Vgp (32)--------------------- v ------------------------ J
2cw here,
Vf = cum m u la tiv e f il tra te volum e, bbl
VSp » sp u r t loss volum e, bbl
AP = p ressu re drop across th e cake, psi
K = filte r cake perm eab ility , darcies
v = fil tra te viscosity, cp
t = tim e, m in
A = perm eab le a re a in con tact w ith th e fluid, f t2
fsc = vo lum e fraction of solids in th e cake
fsm = vo lum e fraction of solids in th e m ud
C = fluid loss coefficient f t / /m in
The p erm eab ility of th e m u d cake tends to decrease w ith
increasing p ressu re and th e te rm u n d er th e square roo t in Equation
(32) rem ain s essentially constan t. Consequently, th e cum m u la tiv e
filtra te vo lum e becomes r a th e r insensitive to changes in th e
filtra tion p ressure.
O utm ans (1963) suggested th a t th e dyn am ic filtra tion process in
th e borehole h a s th re e stages w hile th e b it is crea ting new borehole
w all. During th e firs t stage, solids deposited in f ro n t of th e porous
fo rm ation build up th e filter cake. This buildup continues un til th e
sh ear s tress exerted on th e filter cake b y th e circu lating drilling fluid
overcom es th e m a x im u m sh ea r s tress of th e su rface la y e r of th e
filte r cake being form ed. During th e second stage, filtra tion takes
R e p ro d u c e d with p e rm iss io n of th e co p y rig h t ow ner. F u rth e r re p ro d u c tio n p roh ib ited w ithou t p e rm iss io n .

place th ro u g h a filter cake of constan t thickness in s tea d y -s ta te
condition. The th ird stage begins w hen th e filtration ra te becomes
con stan t and independent of th e cake thickness.
During th e drilling of a well, th e filter cake is no t deposited by
e ith e r d ynam ic or s ta tic filtration alone, b u t b y both. W henever th e
circulation stops, s ta tic filter cake is deposited on th e d ynam ic cake,
and th e ra te of filtration decreases. If circulation is re s ta rte d a fte r
deposition of s ta tic cake on th e dynam ic cake, erosion will rem ove
th e top la y e r to th e point w h ere th e r a te of solids deposition is equal
to th e r a te of erosion. During th is tim e, th e r a te of filtration will
increase slightly.
Borehole Expansion
An en largem ent of th e d iam eter of an open-hole section of th e
borehole caused b y an increase in in te rn a l p ressu re will affect th e
overall com pressibility of th e sy stem . This en largem ent is
p ractica lly negligible for m ost com petent rocks exhibiting elastic
behavior. However, in highly stressed regions plastic behavior m a y
be expected from rocks such as lim estone, clays, salt, shale, and
unconsolidated sands. Teplitz and Hassebroek (1946) suggested
w ell-bore expansion due to plastic deform ation of shales as a possible
explanation for cem en t lost during squeeze operations because of squeeze cem enting pressures.
The plastic behavior of some unconsolidated shales in th e Louisiana Gulf Coast a re a could be th e cause of th e g rea t difference
betw een th e p ressu re responses of casing te sts and form ation tests
observed during leak-off tests. Figure 27 shows a n exam ple of th is
R e p ro d u c e d with p e rm iss io n of th e co p y rig h t ow ner. F u rth e r re p ro d u c tio n p ro h ib ited w ithou t p e rm iss io n .
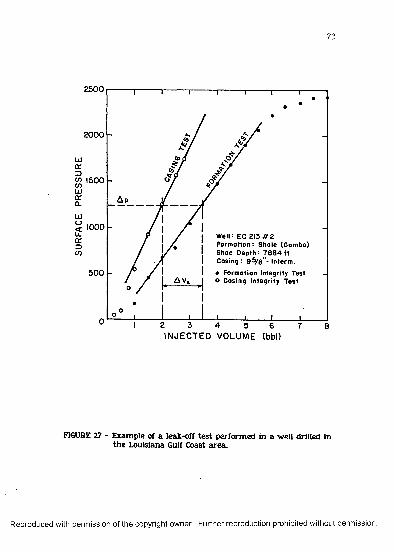
73
2500
2000
Ll)a:
w 1500inLUorCL
< 1000 U.or3(n
5 0 0
I 2 3 4 5 6 7 8INJECTED VOLUME (bbl)
FIGURE 27 - Example of a leak-off te s t perform ed in a well drilled in th e Louisiana Gulf Coast a rea .
R e p ro d u c e d with p e rm is s io n of th e co p y rig h t ow ner. F u rth e r re p ro d u c tio n p ro h ib ited w ithou t p e rm iss io n .
Ap
W ell: EC 213 # 2 F o rm atio n : S h ale (Gumbo) Shoe D ep th : 7 8 8 4 f t C o s in g : 95 /8"* Interm .
# F orm ation Integrity Test o C asing In teg rity T estAv«

7 ^
problem th a t w as seen in a well drilled in th e Louisiana Gulf Coast
a rea . The open-hole form ation exposed during th e te s t is
unconsolidate shale. The casing te st cu rve includes th e effect of
casing expansion only, w hereas th e form ation te s t cu rv e also includes
filtration and borehole expansion effects. The difference in slope
betw een these tw o cu rves cannot be explained b y a high fluid loss to
th e form ation during th e form ation te s t because a v e ry large fluid
loss ra te would be requ ired to com pensate th e difference shown. A
large fluid loss ra te is no t likely to occur in fro n t of im perm eable
shale. Hence, re la tive ly high borehole expansion should be due to th e
plastic behavior of th e exposed shale form ation is th e m ost plausible
explanation.
Non-Newtonian Fluid Flow Effects
During a leak-off te s t th e m ud is flowing th ro u g h th e drill pipe,
drill collars, and ou t of th e drilling colum n th rough th e b it je ts . The
open-hole section is som etim es v e ry long, and a p ressu re loss in th is
section m a y occur. However, th e to ta l p ressu re loss caused b y th e
fluid flow is sm all com pared to th e p ressure requ ired to break th e
gel s tren g th and in itia te circulation. C henevert an d McClure (1970)
suggest th a t th is so-called gelification effect can be eva luated b y
using th e following equation:
Pg - Tg.^ /300 I l/d * - d p )]............................. (33)
w here,
Pg = p ressu re requ ired to b reak th e gel, psi
Tg * gel s treng th , lbs/100 ft2
R e p ro d u c e d with p e rm iss io n of th e co p y rig h t ow ner. F u rth e r re p ro d u c tio n p roh ib ited w ithou t p e rm iss io n .
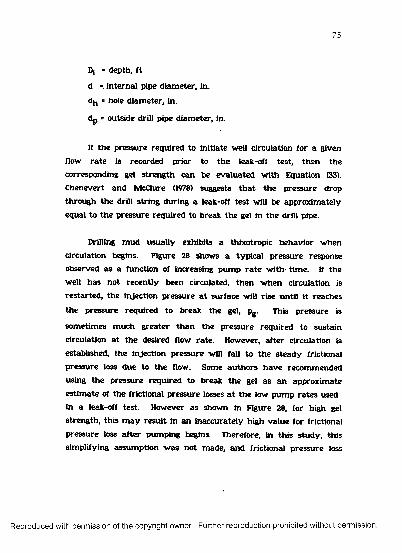
75
Dj = depth, f t
d - in te rn a l pipe d iam eter, in.
* hole d iam eter, in.
dp = outside drill pipe d iam eter, in.
If th e p ressu re requ ired to in itia te well c irculation for a given
flow ra te is recorded p rior to th e leak-off te st, th e n th e
corresponding gel s tren g th can be ev a luated w ith Equation (33).
C henevert and McClure (1978) suggests t h a t th e p ressu re drop
th rough th e drill s trin g during a leak-off te s t w ill be approx im ate ly
equal to th e pressure requ ired to b reak th e gel in th e drill pipe.
Drilling m u d u sually exhibits a th ixotropic behav io r w hen
circulation begins. Figure 28 shows a typ ica l p ressu re response
observed a s a function of increasing pum p r a te w ith tim e. If th e
well h as no t rece n tly been circulated, th e n w hen circulation is
re s ta rted , th e injection p ressu re a t surface will rise u n til i t reaches
th e p ressu re requ ired to b reak th e gel, pg . This p ressu re is
som etim es m uch g rea te r th a n th e p ressu re requ ired to susta in
circulation a t th e desired flow ra te . However, a f te r circulation is
established, th e in jection p ressu re will fall to th e s tea d y frictional
p ressu re loss due to th e flow. Some au th o rs h a v e recom m ended
using th e p ressu re requ ired to b reak th e gel as a n approx im ate
es tim ate of th e frictional p ressure losses a t th e low pum p ra te s used
in a leak-off te st. However a s show n in Figure 28, for high gel
s treng th , th is m a y re su lt in a n inaccu ra te ly high v a lu e for frictional
p ressu re loss a f te r pum ping begins. Therefore, in th is s tu d y , th is
sim plifying assum ption w as no t m ade, an d frictional p ressu re loss
R e p ro d u c e d with p e rm is s io n of th e co p y rig h t ow ner. F u rth e r re p ro d u c tio n p ro h ib ited w ithou t p e rm iss io n .

76
<cc
o
q:=><ntnLlIccCL
tl t 2 tT IM E
P R E S S U R E R EQ U IR ED TOB R E A K T H E G E L .
1 \ j
f \ \/ ! LA M IN A R T U R B U L E N T/ REG IO N R EG IO N
tT IM E
FIGURE 28 - Typical pressure-flow ra te response for th e flow of drilling fluids.
R e p ro d u c e d with p e rm is s io n of th e co p y rig h t ow ner. F u rth e r re p ro d u c tio n p ro h ib ited w ithou t p e rm iss io n .
77
w as com puted using conventional equations as th e to ta l p ressure
drop in th e drill pipe, drill collars, and bit.
Langlinais e t al. (1985) com pared experim ental d a ta collected in
tw o 6000-ft wells using th e various prediction techniques for th e
fluid p ressure losses in a single-phase flow and concluded th a t
accu ra te resu lts can be obtained w ith both th e Bingham plastic and
th e pow er-law rheological models. However, for th e d a ta taken from
th e an n u lu s 4.892 in. b y 2.875 in. a t lam in a r flow conditions, th e
pow er-law model, w hich utilizes a slot-approxim ation equivalent
d iam ete r and low viscosities, w as m arg inally be tte r. W hen d a ta
w ere com pared for com m on range of flow ra te s (0.25 to 1.50
bbl/m in), annu lu s dimensions, and viscosities used in leak-off tests,
th e pow er-law m odel seem ed to show b e tte r resu lts th a n th e
Bingham plastic model, especially for flow ra te s betw een 0.67 and
1.07 bbl/m in .
A nother p ressure drop to be considered is th a t w hich occurs a t
th e bit. The p ressure loss through th e bit, APb , can be expressed as
- < q ^ m ) / » . « a h * ca > ......................................
w here,
p m » m u d density , lb/gal
An * to ta l nozzle a rea , in^.
C<j = discharge coefficient = 0.95
q = injection flow ra te , bbl/m in
R e p ro d u c e d with p e rm iss io n of th e co p y rig h t ow ner. F u rth e r re p ro d u c tio n p roh ib ited w ithou t p e rm iss io n .
7 8
For th e com mon flow -rate range used during a leak-off te s t
(0.25 to 1.50 bbl/m in) w ith th re e nozzles of 12/32 in. in d iam ete r and
10 lb/gal m ud density , th e p ressu re loss through th e b it v a ries from
0.84 to 31.63 psi. Chenevert an d McClure (1978) neglect th e p ressure
drop caused b y flow m th e drill s tring and bit. They consider only
th e p ressure needed to b reak th e gel s treng th in determ in ing th e
an ticipated leak-off pressure.
F rac tu re Closure
During a leak-off test, th e pum p is stopped a fte r th e frac tu re is
induced and w hile it still is expanding. This m om en t m a rk s th e
beginning of th e shu t-in period during w hich p ressure declines in th e
well bore. This pressure decline is a consequence of th e m ud
filtration th rough th e open frac tu re walls. Since in jection has
stopped, th e pressure in th e frac tu re will continue to decline, and
consequently th e frac tu re will g radually close. Analyzing th e r a te of
p ressu re decline perm its estim ation of some of th e p a ram e te rs th a t
q u an tify a f rac tu re and th e frac tu ring process. Among th e m ost
im p o rtan t p a ram ete rs th a t can be re la ted to th e shape of th e
pressure-decline curve a re th e fluid loss coefficient, fluid viscosity
degradation, form ation modulus, f rac tu re closure p ressure, and
fra c tu re length. These p a ram e te rs a re genera lly assum ed during th e
sim ulation process; a fte r th e leak-off te s t th e y can be determ ined on
th e basis of th e pressure decline da ta , w hich increases th e reliab ility
of th e sim ulation for th e n ex t te st. M ultiple leak off te sts a re
com m only perform ed to check for te s t repeatability .
Nolte (1982) presented theoretical analyses perm iting those
p a ram e te rs m entioned above to be estim ated from th e p ressu re
R e p ro d u c e d with p e rm iss io n of th e co p y rig h t ow ner. F u rth e r re p ro d u c tio n p ro h ib ited w ithou t p e rm iss io n .

79
decline following a f ra c tu re tre a tm e n t of a producing well. On th e
basis of p r im a ry assum ptions of a v ertica l f ra c tu re of essentially
constan t height propagating th rough a quasi-elastic form ation w ith
continuous displacem ents (i.e., no slip) a t planes bounding th e top and
bottom of th e frac tu re , he derived th e following equation:
d p /d jto t/y ■ I (4 C.hp.E) / 88V ^) If (at/t.).........(35)
w here,
dp /d t = r a te of p ressu re decline a t tim e t = t 0 * At, psi/m in
hp = fluid loss height, ft
ps = ra tio of average along th e fra c tu re an d well-bore
pressure a t sh u t -in
At = tim e since pum ping stopped (shut-in), m in
t 0 = pum ping tim e prio r to shu t-in , m in
The function f ( A t/t^) is defined b y th e bounds
2 ( / 1 + At/tp - Vr A t7 £ ) > f ( A t / y > s in '1 (1 + At/tp)- ^
A m ore useful equation w as derived from Equation (35) to
d e term ine th e difference in th e decline p ressure betw een tim es
S | and &2 •
AP ( *2) - 1 (C.hp.E./lp) / ((1 - f i X h 2. P8) ). G.( ) . . . . (36)
R e p ro d u c e d with p e rm is s io n of th e co p y rig h t ow ner. F u rth e r re p ro d u c tio n p ro h ib ited w ithou t p e rm iss io n .
80
The function G ( is defined by
G ( t t . t , ) . (16/Jn) ^ , ) 3 / 2 - - S ,V 2) J.. . (3 7 )
an d I = At / t 0 w hich implies 6j » Atj / t 0 and S2 -A t2 / t 0.
Figure 29 illu s tra tes p ressu re te rm s th a t could be used for
decline ana lysis in a typical p ressu re response plot of a leak-off test.
It is in teresting to no te th a t these equations a re Independent of th e
frac tu re length. The p a ram e te rs in Equations (35) and (36) w ere
derived in th is s tu d y assum ing th a t th e fluid would obey th e
pow er-law model. The equation is
Ps - (2n ♦ 2) / (2n ♦ a + 3)................................................. (30)
The p a ra m e te r "a" reflects th e decrease in fluid viscosity down
th e frac tu re due to tem p era tu re , shear, and tim e degradation of th e
fluid sy stem . The va lu e of "a" ranges from 0 for a N ew tonian fluid
of constan t v iscosity to abou t 2 for frac tu rin g fluids exhibiting a
strong viscosity degradation as th e fluid m oves o u t in to th e frac tu re .
The p a ra m e te r "n" is th e pow er-law exponent.
R e p ro d u c e d with p e rm iss io n of th e co p y rig h t ow ner. F u rth e r re p ro d u c tio n p roh ib ited w ithou t p e rm iss io n .

81
R e p ro d u c e d with p e rm is s io n of th e co p y rig h t ow ner. F u rth e r re p ro d u c tio n p ro h ib ited w ithou t p e rm iss io n .
FIGU
RE
29 -
Illu
stra
tion
of pr
essu
re
term
s us
ed
for
pres
sure
de
clin
e an
alys
is
(Nol
te 19
82).

PROPOSED MATHEMATICAL MODEL
OyeraIl_CompressibilitY_Mod^l
The increase in injection pressure a t surface as a function of
volum e of m ud injected before th e form ation is broken down is
determ ined by th e com puter model w ith an in terac tive procedure.
For a given sm all additional volum e of m ud in jected a t th e surface,
Equation (27) can be used to calculate th e change in pressure as a
function of th e average com pressibility of m ud and th e to ta l m ud
volum e of th e system . However, p a r t of th e m ud injected is lost
th rough filtration to perm eable layers of th e form ation; p a r t is used
to fill th e clearance crea ted b y th e casing expansion; p a r t will occupy
th e volum e of a ir trapped in th e sy stem th a t shrinks w ith pressure
Increase; and p a r t will occupy th e clearance crea ted b y th e borehole
expansion.
The increase in pressure during a sho rt in te rv a l of tim e, At, is
calculated ite ra tiv e ly b y first estim ating a sm all volum e of m ud,
Ayg , th a t m u s t be sm aller th a n th e volum e, Ayj , in jected during
th e tim e, At. Using Equation (27) and th e volum e estim ated , th e
corresponding p ressure increase is calculated. This p ressure-increase
value is th e n used to determ ine th e volum e of f iltra te lost to
perm eable form ations, AVj , th e volum e increase of th e sy stem due
to casing expansion, A V ^ , th e volum e change of a n y a ir trapped in
th e sy stem , AVa jr , and th e borehole expansion volum e, AVS . These
th re e changes in volum e should satisfy th e following m a te ria l
balance equation:
R e p ro d u c e d with p e rm iss io n of th e co p y rig h t ow ner. F u rth e r re p ro d u c tio n p roh ib ited w ithou t p e rm iss io n .

83
AV<$ ■ AVj - (AVf * AVc s g ♦ AVA j R ♦ AV s ) (39)
The rig h t-h an d side of Equation (39), w hich is th e calculated
volum e of m ud responsible for th e p ressu re increase, should be
approx im ately equal to th e estim ated va lu e or le ft-hand side of
Equation (39). If th e values disagree, a new es tim ate is m ade, and an
in te rv a l halving technique used to continue th e ite ra tiv e process
u n til ag reem ent is reached.
The volum e of f iltra te lost to th e form ation , AVf , du ring a
given period of tim e, At, is calculated w ith th e following equation:
A = to ta l a re a of perm eable form ations exposed, f t2
t » to ta l tim e of filtration , m in
At = in c rem en t of tim e, m in
AVf = volum e of m u d lost during At, bbl
In Equation (40) i t is assum ed th a t th e increase in th e
difference in p ressu re betw een th e borehole and th e fo rm ation is
com pensated b y th e decrease in th e perm eab ility of th e m u d cake
being form ed. The fluid loss coefficient, C, ca n be determ ined w ith
th e resu lts obtained from a s tan d a rd API fluid loss te s t combined
w ith th e following simplified equation:
AVF - ( C .A ./5 -6 1 5 )I / t + A ? - / T l (40)
w h ere
c - K V V jp ) / 150291 (41)
R e p ro d u c e d w ith p e rm iss io n o f th e c o p y rig h t ow ner. F u rth e r re p ro d u c tio n p ro h ib ited w ith o u t p e rm iss io n .

84
Equation (41) a lread y includes th e filter paper a re a (45 cm 2)
and th e tim e of filtra tion for s tan d a rd API te sts (30 m in). The
fil tra te volum e Vf , and th e s p u rt volum e, Vsp , a re given in cm 3
an d th e fluid loss coefficient in f t /m in % .
The volum e increase of th e sy stem due to casing expansion,
AVCSg , is calculated b y determ in ing th e change in d iam eter, AD, of
th e inside d iam eter of th e casing w ith Equation (31) and substitu ting
i t in th e following equation:
&VCSG - ( (D + AD)2 -® 2) / 102Q.5Uo ...................(42)
w h ere
D = inside d iam ete r of th e casing, in
L0 = to ta l leng th of th e casing, f t
The change in volum e of a ir trapped in th e sy stem AVa jr , is
calculated w ith Equation (27).
BorehPi? Sxpflnapn
The p lasticity th e o ry is applied h ere in a n a t te m p t to model
th e plastic behavior of som e unconsolidated shales found in th e
Louisiana Gulf Coast. The plastic behavior of these shales is believed
to cause significant borehole expansion an d consequently affect th e
overall com pressibility of th e sy stem .
R e p ro d u c e d w ith p e rm is s io n of th e c o p y rig h t o w n er. F u rth e r re p ro d u c tio n p ro h ib ited w ithou t p e rm iss io n .

6 5
Initially , th e case w e'll consider is th a t of a hollow cylinder,
Rj < r < R2 , in p lan e-s tra in w ith p ressure Pj applied a t Rj and
p ressure P2 applied a t R2 (Figure 30). The assum ption is th a t th e
rock m a te r ia l m a y yield only p a rtia lly so th a t th e re is a plastic
region su rrounded b y a region stressed below th e lim it of plasticity .
In th e o u te r portion of th e cylinder, R < r < R2 , th e equations
m u s t sa tisfy th e conditions of stress and s tra in of a perfec tly elastic
body. In th e inner ring, Rj < r < R, plastic th e o ry m u s t be used.
The to ta l s tra in , cr , a t a given radius, r , is calculated w ith th e
following equation:
{ p2 ♦ at/r 2)2 (Pr p2) / « r /r2)2 - m - o }
[ 1/(2 ( X * G» j - [R2/(2Gr2) l [(p1-P2) /((R /R 2)2 -to(R /R ,)2 - l)]
......................................................................... (43)
Detailed derivation of Equation (43) is p resen ted in Appendix G.
The well bore can be considered a hole in th e m iddle of an infinite
p late, w hich im plies R2 -> • in Equation (43). The to ta l s tra in a t th e
w ell bore, r * Rj , caused b y a n increase in in te rv a l p ressu re, Apj,
according to Equation (43) is
% = (1 + |i) AP, / [ E [1 + In ( R /R j)2 1 CR/Rj)2 (44)
In Equation (44), i t is assum ed th a t th e increase in pressure,
Ap, w o n 't cause an increase in p ressu re fa r a w a y from th e well bore
R e p ro d u c e d with p e rm iss io n of th e co p y rig h t o w n er. F u rth e r re p ro d u c tio n p ro h ib ited w ithou t p erm iss io n .

86
\ P l o s t i c
E l a s t i c
FIGURE 30 - P artia l yielding of a thick w alled cylinder.
R e p ro d u c e d with p e rm is s io n of th e co p y rig h t ow ner. F u rth e r re p ro d u c tio n p ro h ib ited w ithou t p e rm iss io n .

87
w hich implies th a t AP2 = 0. However, Equation (44) cannot be used
unless th e ra tio betw een th e plastic lim it rad iu s and well-bore
radius, R/Rj, is known. Based on casing and fo rm ation in teg rity te s t
d a ta from unconsolidated shale in th e Gulf Coast a rea , a n average
v alue of R/Rj = 20 w as obtained. This v a lu e w as obtained b y reading
th e en largem en t volum e of th e well for d ifferen t values of p ressu re
increase, Apj. Figure 27 shows how th e en largem en t volum e, AVS , is
obtained for a given, APj . The values of to ta l s tra in can be easily
calculated using th e initial well d iam ete r and th e en largem ent
volum e. Table 3 shows th e p a ram e te rs used in Equation (44) and
th e corresponding values of R/Rj determ ined for five d ifferent wells.
The ra tio R/Rj = 20 should be used only for unconsolidated shale
encountered in th e Louisiana Gulf Coast a rea . For o the r a rea s or
d ifferent plastic form ations, th e ra tio R/Rj should be reeva luated
using th e techn ique illustrated b y Table 3.
If th e rock m a te ria l does no t exhib it a plastic behavior, th e
v alue of R/Rj to be used in Equation (44) is 1. This va lue reduces
Equation (44) to th e s tra in equation of a perfec tly elastic m a teria l.
F rac tu re Induction Model
The frac tu re induction model selected for use in th is com puter
model is based on th e assum ption of a n infin ite p la te w ith a circular
hole in it. This classical solution leads to equations th a t include
form ation properties such as Poisson’s ra tio and Biot's constan t, and
state-o f-stress com ponents such as horizontal m a tr ix stresses and
R e p ro d u c e d with p e rm is s io n of th e co p y rig h t ow ner. F u rth e r re p ro d u c tio n p ro h ib ited w ithou t p e rm iss io n .

TABLE 3
WELL: MM 160 A-S
(IS S/S* SURFACE CASING AT 5166 FT (MD))
(bbl)Ad
(in)c Ap
(f»i)R/R, OTHER
INFORMATION
0.30 0.14175 0.00810 200 18.0 E- !.5x!06 psi
0.62 0.29171 0.01667 400 18.4 H - 0.255
0.94 0.44042 0.02517 600 18.6
1.26 0.5S790 0.03359 800 18.5
I.5S 0.73419 0.04195 1000 18.5
AVG: 18.40
R e p ro d u c e d with p e rm iss io n of th e co p y rig h t ow ner. F u rth e r re p ro d u c tio n p ro h ib ited w ithou t p e rm iss io n .

TABLE S (cont.)
WELL: SMI 171 *1
(75/8' CASING AT 15040 FT (MD) rad 12939 FT (TVD))
AV,(Ml)
Ad(to)
c Ap(P«i)
t/R, OTHERINFORMATION
0.35 0.0762 0.0090 200 26.5 E-2.75xl0*psi 0.313
H* 277 It0.75 0.1624 0.0191 400 27.5
1.15 0.2478 0.0292 600 27.7
1.55 0.3324 0.0391 800 28.0
1.95 0.4161 0.0490 1000 28.0
2.35 0.4991 0.0587 1200 28.0
AVG: 27.6
R e p ro d u c e d with p e rm is s io n of th e co p y rig h t ow ner. F u rth e r re p ro d u c tio n p roh ib ited w ithou t p e rm iss io n .
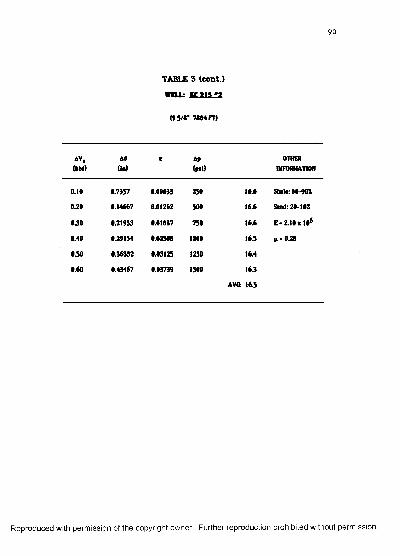
90
TABLE 3 (cont.)
WELL: EC 211 • !
(9 5/8’ 7884 FT)
AV.(bbl)
Ad(in)
c Ap(f»i)
OTHERINFORMATION
0.10 0.7357 0.00633 250 16.6 Shale: *0-901
0.20 0.14667 0.01262 500 16.6 Sand: 20-1 OS
0.30 0.21933 0.01837 750 16.6 E- 2.10 x 10
0.40 0.29134 0.02508 1000 16.5 It - 0-28
0.30 0.36332 0.03125 1250 16.4
0.60 0.43467 0.03739 1500 16.3
AVG: 16.5
R e p ro d u c e d with p e rm iss io n of th e co p y rig h t ow ner. F u rth e r re p ro d u c tio n p roh ib ited w ithou t p e rm iss io n .

91
TABLE 3 (cont.)
WELL: T 1 212 *1
(9 5/S' INTERM CASING AT 19137 FT (MD))
(bbl)Ad(in)
c Ap(P>1)
R/R, OTHERINFORMATION
0.100 0.07903 0.00647 250 18.5 E-2.3xl06pii II- 0.295
0.225 0.17711 0.01446 500 18.5
0.350 0.27442 0.02240 750 18.6
0.475 0.37098 0.3028 1000 19.5
0.600 0.46681 0.3811 1250 19.5
AVG: 18.92
R e p ro d u c e d with p e rm iss io n of th e co p y rig h t o w n er. F u rth e r re p ro d u c tio n p ro h ib ited w ithou t p e rm iss io n .
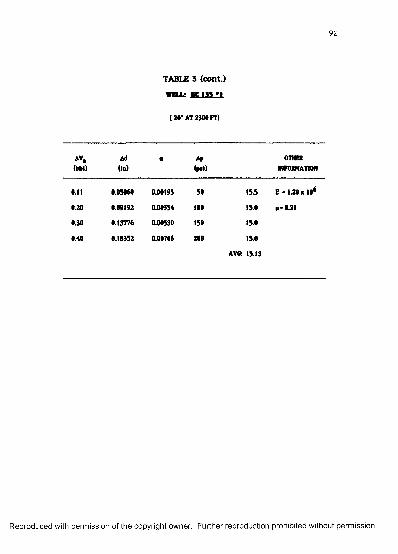
9 2
TABLE 3 (cont.)
WELL: H IM *1
(20' AT 2300 FT)
AV.(bbl)
Ad(Id)
c Ap(p><)
OTHERINFORMATION
0.11 0.05060 0.00195 50 15.5 E - 1.20 x 10®
0.20 0.09192 0.00354 100 15.0 li" 0.21
0.30 0.13776 0.00530 150 15.0
0.40 0.IS352 0.00706 200 15.0
AVG: 15.13
R e p ro d u c e d with p e rm iss io n of th e co p y rig h t ow ner. F u rth e r re p ro d u c tio n p ro h ib ited w ithou t p e rm iss io n .

93
vertica l m a tr ix stresses, w hich a re som etim es difficult to m easure.
In th e model, the se p a ra m e te rs a re considered best determ ined b y
extrapolation . W ith th is technique, f ra c tu re g rad ien ts of th e various
fo rm ations can be com puted a f te r th e f irs t hole is drilled in a given
a rea . These f ra c tu re g rad ien ts a re th e n used to es tim ate th e
fra c tu re g rad ien t in th e second hole, w hile such variab les as changes
in dep th an d fluid p ressu re a re tak en in to consideration. As th e
second hole is drilled, in fo rm ation gained is used to u pdate and
im prove d a ta obtained from th e firs t hole, an d th e process is
continued w ith subsequen t drilling.
The equations used in th is w ork a re explained in Appendix A;
com pression is rep resen ted a s positive an d tension as negative.
Tensile s tren g th of th e fo rm ation , St, w hich appears in all th e
equations in Appendix A, is th u s a negative num ber.
V ertical F rac tu re Initiation
V ertical frac tu rin g begins w hen th e m a x im u m effective
tangen tia l s tress exceeds th e tensile s tren g th of th e form ation . In
th e case of a p en e tra tin g ty p e of fluid, th e p ressu re a t well bore
necessary to induce frac tu rin g of th e form ation , P{ , can be
determ ined b y
Pf - K2M/(l-M)) lS2 -P0 l-S t l / l2-a(l-2 jJi)/(l-p i)N P0 ...(45)
Equation (45) can be used on ly for a pen e tra tin g fluid. This
characte ristic of th e fluid for a ce rta in fo rm ation is highly dependent
on rock p erm eab ility an d n a tu ra lly occurring frac tu re s in th e
R e p ro d u c e d with p e rm iss io n of th e co p y rig h t o w n er. F u rth e r re p ro d u c tio n p ro h ib ited w ithou t p e rm iss io n .
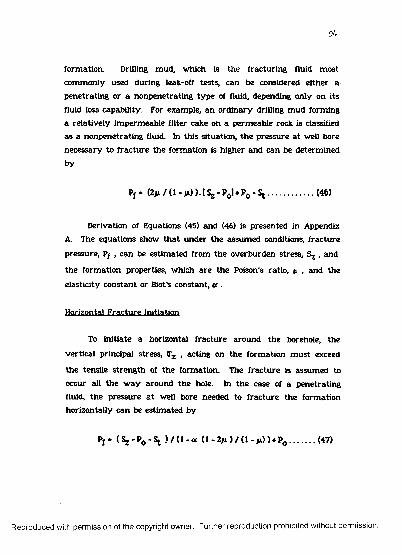
9 ^
form ation. Drilling m ud , w hich is the frac tu ring fluid m ost
com m only used during leak-off tests, can be considered e ither a
p ene tra ting or a nonpene trating ty p e of fluid, depending only on its
fluid loss capability . For exam ple, a n o rd in a ry drilling m ud form ing
a re la tiv e ly im perm eable filter cake on a perm eable rock is classified
as a nonpene tra ting fluid. In th is situation , th e p ressure a t well bore
necessary to f rac tu re th e form ation is higher and can be determ ined
by
Pf - (2M /(l-M )) rS2 -P0l*P0 -St ................... (46)
D erivation of Equations (45) and (46) is p resented in Appendix
A. The equations show th a t under th e assum ed conditions, frac tu re
p ressure, Pf , can be estim ated from th e overburden stress, , and
th e fo rm ation properties, w hich a re th e Poison's ratio , \i , and th e
elastic ity constan t o r Biot's constant, a .
Horizontal F rac tu re Initiation
To in itia te a horizontal f rac tu re around th e borehole, th e
vertica l principal stress, <TZ , acting on th e form ation m u s t exceed
th e tensile s tren g th of th e form ation. The frac tu re is assum ed to
occur all th e w a y a round th e hole. In th e case of a p ene tra ting
fluid, th e p ressure a t well bore needed to f rac tu re th e form ation horizontally can be estim ated b y
P f- (S2 -P0 -St ) / ( ! - « <1-2jx) / ( 1 - m) )*P 0 .......... (47)
R e p ro d u c e d with p e rm iss io n of th e co p y rig h t ow ner. F u rth e r re p ro d u c tio n p roh ib ited w ithou t p e rm iss io n .
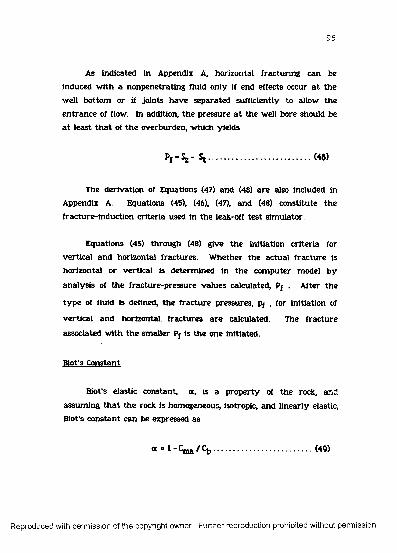
95
As indicated in Appendix A, horizontal frac tu ring can be
induced w ith a nonpenetrating fluid only if end effects occur a t th e
well bo ttom or if jo in ts hav e separated sufficiently to allow th e
en tra n c e of flow. In addition, th e pressure a t th e well bore should be
a t least th a t of th e overburden, w hich yields
W S t .................................................... (46)
The derivation of Equations (47) and (48) a re also included in
Appendix A. Equations (45), (46), (47), and (48) constitu te th e
frac tu re-induc tion c rite ria used in th e leak-off te s t s im ulator.
Equations (45) th rough (48) give th e in itia tion c rite ria for
ve rtica l and horizontal frac tu res. W hether th e ac tual f rac tu re is
horizontal o r vertica l is determ ined in th e com puter model by
ana ly sis of th e frac tu re-p ressu re values calculated, P f . A fter th e
ty p e of fluid is defined, th e frac tu re pressures, pf , for initia tion of
v e rtica l an d horizontal, frac tu res a re calculated. The frac tu re
associated w ith th e sm aller Pf is th e one initiated.
Plotls_CpnstaQt
Biot's elastic constant, a , is a p ro p erty of th e rock, and
assum ing th a t th e rock is homogeneous, isotropic, an d linearly elastic, Biot's constan t can be expressed as
“ • ‘ - W C b .................................................. «»>
R e p ro d u c e d w ith p e rm is s io n of t h e c o p y rig h t o w n e r. F u rth e r re p ro d u c tio n p ro h ib ited w ithou t p e rm iss io n .
96
The com pressibility of th e m a te ria l of th e rock, can be
m easu red from core sam ples or obtained from published tab les of
physical p roperties of rocks (Carmichael 1982). The bulk rock
com pressibility, Cb , can also be determ ined experim en ta lly b y firs t
m easuring th e com pressional w av e tra v e l tim e of th e rock, Atc , w ith
a sonic logging tool, and th e bulk density of th e rock , an d using
th e following relationship:
1/C„ - -M > )........... (50)
The va lu e of Biot's constan t is needed in th e com puter model
only w hen a p ene tra ting ty p e of fluid has been used to f ra c tu re th e
form ation . However, drilling fluids a re genera lly designed to be
nonpene tra ting to prom ote well-bore s tab ility and lim it fo rm ation
dam age.
The v a lu e of a is w ith in th e range 0 < a < 1, w here 0 is th e
porosity of th e rock form ation . The best technique for determ in ing
a is to te s t rep resen ta tiv e form ation cores in th e labo ra to ry .
Common values of a reported in th e li te ra tu re for sandstone a re
w ith in th e ran g e of 0.70 to 0.90.
R e p ro d u c e d with p e rm iss io n of th e co p y rig h t o w n er. F u rth e r re p ro d u c tio n p ro h ib ited w ithou t p e rm iss io n .

97
Poi9?o^_Rati.Q
Poisson's ratio , |i , used in th e preceding equations, is a rock
p ro p e rty th a t can also be determ ined experim en ta lly from acoustic
logs th rough th e following equation:
M * ( 2 - ( A t g / A t ^ F ! / !2 I 1 - t i t g / A tp )2 ] ] .......................(51)
In Equation (51) th e sh ear w ave tra v e l tim e, Ats , should be
m easured from an acoustic log. Poisson's ra tio can also be eva luated
b y plotting th e effective horizon tal s tress g rad ien t v e rsu s th e
effective vertica l s tress g rad ien t from Equation (21); th is yields
2 p . / ( \ ^ ~ [ P i -P0 *St ) / [ Sg - Pq ] ............................... (52)
Equation (52) assum es a nonpene tra ting ty p e of fluid and a
variab le overburden s tress w ith depth. The te rm can be eva luated
for a given a re a of drilling a c tiv ity as a function of depth, w hich will
allow th e estab lishm ent of a correlation betw een Poisson's ra tio and
dep th for th a t a rea . F igure 31 shows th e va ria tion of Poisson's ra tio
w ith dep th for th e Gulf Coast a re a based on Eaton 's (1969) da ta . The
cu rv e show n in Figure 31 is used in th e s im u la to r to d e term ine th e
proper va lue of Poisson's ra tio to be used in Equations (45), (46), and
(50) for th e Gulf Coast a rea . To provide app rop ria te in p u t for th e
com puter, th e cu rv e show n in Figure 31 w as fitted using a n equation
suggested b y Constant and Bourgoyne (1986). The resu lting equation
is
R e p ro d u c e d with p e rm iss io n of th e co p y rig h t ow ner. F u rth e r re p ro d u c tio n p roh ib ited w ithou t p e rm iss io n .
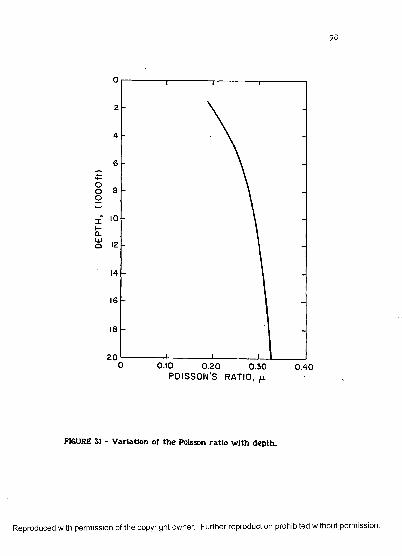
9 8
OOo
Ih-Q.LUQ
200 0.10 0.20 0 .3 0 0 .4 0
POISSON'S RATIO, fj.
FIGURE 31 - V ariation of th e Poisson ra tio w ith depth .
R e p ro d u c e d w ith p e rm iss io n of th e c o p y rig h t ow ner. F u rth e r re p ro d u c tio n p ro h ib ited w ithou t p erm iss io n .
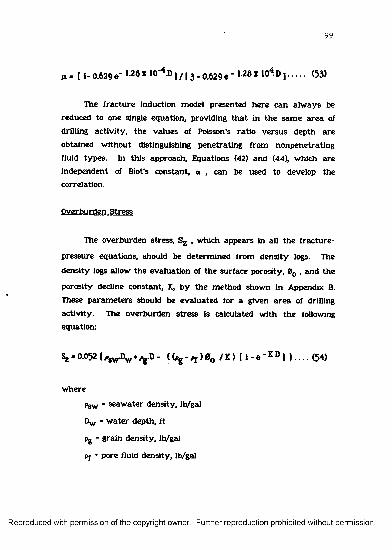
99
M - [ 1- 0.629 • ’ 12d x 10’ 4 D1/13- 0.629 e " 12d * 1<)4 D ] ....... <53)
The frac tu re induction model presented h ere can alw ays be
reduced to one single equation, providing th a t in th e sam e a re a of
drilling ac tiv ity , th e values of Poisson’s ra tio versu s depth a re
obtained w ithou t distinguishing pene tra ting from nonpenetrating
fluid types. In th is approach, Equations (42) and (44), w hich a re
independent of Biot’s constant, a , can be used to develop th e correlation.
Overburden Stress
The overburden stress, , w hich appears in all th e frac tu re -
pressure equations, should be determ ined from d ensity logs. The
density logs allow th e evaluation of th e surface porosity, 0O , and the
porosity decline constant, K, b y th e m ethod shown in Appendix B.
These p a ram e te rs should be evaluated for a given a re a of drilling
ac tiv ity . The overburden stress is calculated w ith th e following equation:
0 . 0 5 2 (C»g - ^ ) 0 O 1 1 ) 1 1 -e-KD) }. . . . (5 4 )
w here
Psw * seaw ate r density , lb/gal
Dy, = w a te r depth, f t
pg = grain density , lb/gal
Pf * pore fluid density , lb/gal
R e p ro d u c e d with p e rm is s io n of th e co p y rig h t ow ner. F u rth e r re p ro d u c tio n p ro h ib ited w ithou t p e rm iss io n .
10 0
The accuracy of Equation (54) for evaluating overburden stress
as a function of dep th depends heav ily upon how accu ra te ly th e
p a ram e te rs K and 0O a re evaluated for a given a rea .
general Assum ptions
The assum ptions m ade in th e derivation of th e frac tu re -
p ressu re equations deal p rim arily w ith principal stresses p resen t
n e a r th e borehole, rock hom ogeneity, rock isotropy, and elastic
behavior of rocks.
Derivations of Equations (45) th rough (48) w ere based on th e
assum ption th a t one principal stress is parallel to th e borehole axis,
w hich does no t a lw ays hold true . However, th e derivation of
equations th a t can handle a n y orientation of th e principal stresses,
can be obtained using a sim ilar procedure. In practice, th e
orien tation of th e principal stresses is unknow n, b u t is generally
assum ed to be in th e vertica l and horizontal directions. Thus, a non
parallel orien tation of th e borehole and a principal s tress would be of
in te res t only for directional boreholes.
The equation for breakdow n p ressure is show n in Appendix A
to depend on both of th e horizontal principal m a tr ix stresses, <TX and
(Ty. These m a tr ix stresses w ere considered equal, w hich is tru e only
in tectonically relaxed areas, w here th e only ac tive force is th a t of
g rav ity . W hen th e difference betw een <TX an d (Ty increases, th e
breakdow n pressure decreases. Thus, if th e assum ption <TX = <Ty does
n o t hold, th e fra c tu re p ressure obtained in th e field will be sm aller
R e p ro d u c e d with p e rm is s io n of th e co p y rig h t ow ner. F u rth e r re p ro d u c tio n p ro h ib ited w ithou t p e rm iss io n .
1 01
th a n th a t predicted b y th e equations, assum ing th a t all o ther
assum ptions a re n o t violated.
Rock hom ogeneity and iso tropy a re assum ptions in troduced in
th e derivation m a in ly for m a th em atica l simplification. However,
rocks a re seldom hom ogeneous or isotropic. Deviations from these
assum ed conditions will affect th e breakdow n p ressu re of th e
form ation . These m a th em atica l simplifications m u s t be m ade if
useful equations a re to be obtained. Sufficient d a ta a re genera lly
no t available to enab le us to ta k e th is inhom ogeneity an d aniso tropy
into account.
The equations developed a re for horizontal and vertical
f rac tu re induction. Inclined frac tu re s seldom begin as inclined
fractu res; th e y u sua lly s ta r t as vertica l and reo rien t them selves
a w ay from th e well bore to become inclined. It is assum ed in th is
m odel th a t th e vertica l f ra c tu re in itia tion c rite ria of Equations (45)
and (46) provide a n accu ra te estim ation of th e frac tu re -p ressu re
value for inclined frac tu res . This sim plification avoids th e use of
leng th y and im practical equations for induction of inclined frac tu res .
This assum ption is reasonable because inclined frac tu res , as
m entioned above, genera lly s ta r t as v ertica l frac tu res .
Among th e theories available for th e s tu d y of reservo ir rocks,
elastic ity often best fits th e rock behavior before failu re occurs. The
assum ption of elastic behavior for rocks holds t ru e for m ost
com petent rocks. However, th e inelastic behav io r of som e rocks, such
as unconsolidated shales, will affect th e principal rock stresses and
consequently affect th e breakdow n pressure. F rac tu re grad ien ts in
soft plastic shales a re expected to be g re a te r th a n those in
R e p ro d u c e d with p e rm iss io n of th e co p y rig h t o w n er. F u rth e r re p ro d u c tio n p ro h ib ited w ithou t p erm iss io n .

1 0 2
sandstones. This is because th e cohesive resistance or in te rn a l
friction is less in plastic shales th a n in sandstones w hich p erm its less
difference betw een th e horizontal an d vertica l m a tr ix stresses. The
frac tu re -p re ssu re prediction for plastic shales, obtained w ith
equations derived from elastic ity theories, genera lly yields conservative values.
Erac tu r e ,Expansion Model
The f ra c tu re expansion model selected for use in th is s tu d y is
basen on N ordgren 's (1972) w ork. The model is based on th e solution
of th e co n tinu ity equation for flow of a n incom pressible fluid th rough
an a lread y -in itia ted frac tu re . The assum ption of incom pressibility of
th e fluid will cause on ly sm all e rro rs in th e case of leak-off te sts
th a t use w ate r-b ase drilling m uds. In addition, to ta l p ressure
varia tio n is re la tiv e ly sm all during fra c tu re expansion, w hich alsc
justifies th e assum ption of incom pressibility. The model cannot,
how ever, be used for highly com pressible fluids such as foams.
The f ra c tu re geom etry assum ed is show n in Figure 32. The
fra c tu re expansion model is lim ited to a vertica l f rac tu re considered
to propagate in a s tra ig h t line a w a y from th e well. The vertica l
height, h , is lim ited to th e thickness of th e form ation being frac tu red .
These assum ptions define th e m odel as a 2-D model of th e ty p e
included in th e PKN m ethod. In addition, i t is assum ed th a t an
isotropic, hom ogeneous m a te ria l su rro u n d s th e frac tu re .
The con tin u ity equation for flow of a n incompressible fluid
th rough a cross section of th e f ra c tu re show n in Figure 32 is
R e p ro d u c e d w ith p e rm is s io n of th e c o p y rig h t o w n er. F u rth e r re p ro d u c tio n p ro h ib ited w ithou t p e rm iss io n .

1 0 3
Well
Fracture
"Wmax2
W m a x
2
V
FIGURE 32 - F rac tu re geom etry for th e proposed com puter Model.
R e p ro d u c e d with p e rm is s io n of th e co p y rig h t ow ner. F u rth e r re p ro d u c tio n p ro h ib ited w ithou t p e rm iss io n .
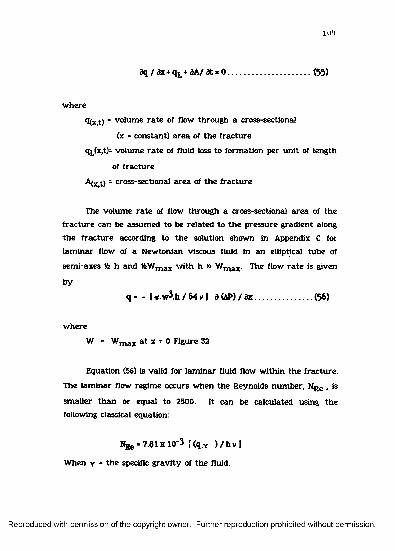
1 0 4
dq/ax+qL+dA /dt»0...................................(55)
w h ere
q(x = volum e ra te of flow through a cross-sectional
(x = constant) a rea of th e frac tu re
q^(x,t)= volum e r a te of fluid loss to form ation per u n it of length
of frac tu re
A(x t) = cross-sectional a rea of th e frac tu re
The volum e ra te of flow th rough a cross-sectional a rea of th e
frac tu re can be assum ed to be re la ted to th e p ressure g radient along
th e frac tu re according to th e solution show n in Appendix C for
lam in a r flow of a N ew tonian viscous fluid in a n elliptical tube of
sem i-axes % h and VfeWm ax w ith h » Wm a x . The flow ra te is given
b y
q» - [ ir.w^.h/ 64v 1 d(AP)/dx........................ (56)
w here
w = w m ax a t x = 0 Figure 32
Equation (56) is valid for lam in a r fluid flow w ith in th e frac tu re .
The lam in a r flow regim e occurs w hen th e Reynolds num ber, NRe , is
sm aller th a n or equal to 2500. It can be calculated using th e following classical equation:
NRe- 7.61x10⁻³ I (q.Y ) /h v ]
W hen y = th e specific g rav ity of th e fluid.
R e p ro d u c e d with p e rm iss io n of th e co p y rig h t o w n er. F u rth e r re p ro d u c tio n p ro h ib ited w ithou t p e rm iss io n .

1 0 5
ElMjd-Loss Rat?
The following equation can be used to re la te fluid-loss r a te per
u n it of length of frac tu re , , to th e fluid-loss coefficient, C, th e
fra c tu re height, h, and tim e a t w hich th e frac tu re a re a a t position x
is exposed:
qL* (2 C H )//t-T '(x y ............................... (58)
F rac tu re A rea
The cross-sectional area , A, of th e elliptical f ra c tu re w ith w idth, w , and height, h , is
A ■ (ir/4 )w h..................................... (59)
The derivation of Equation (59) is p resented in Appendix D.
Taking th e partia l d erivative of a A w ith respect to th e tim e, t,
yields
dA / dt ■ (ir / 4) h d w / d t................................. (60)
Differential Equation
If w e su b stitu te Equations (56), (58), and (60) in to Equation (55)
an d use th e vertica l p la ne-s tra in solution, Equation (18), for a
fra c tu re under constan t pressure, w e hav e
R e p ro d u c e d with p e rm iss io n of th e co p y rig h t ow ner. F u rth e r re p ro d u c tio n p roh ib ited w ithou t p e rm iss io n .
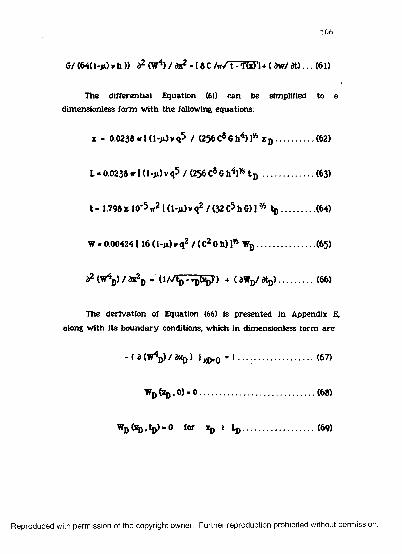
106
G/ (64(1- j j l )v h )) a2 (W4) / ax2 « 18C /ir Z t7 W l+ ( aw/ at). . . (6l)
The d ifferentia l Equation (61) can be simplified to a
dim ensionless fo rm w ith th e following equations:
x - 0.0238ir I (1-M)vq5 / <256C*G1i4) 1* x D................. (62)
L * 0.02381r I (I-m) v q5 / (256 Ca G h4)* t D ...................... (63)
t - l.7 9 8 x lO '5 tf2 |(l .M)vq2 / ( 32C5 h G )l% % ...............(64)
W - 0.004241 16 (1-m) v q2 / ( C2 G h) ]% WD ......................... (65)
a2 <W4D) / ax2,) - (1 / / V tW ’) + ( aWD7 dtD) ................<66>
The derivation of Equation (66) is presented in Appendix E,
along w ith its b o u n d ary conditions, w hich in dim ensionless fo rm a re
- ( a (W4,)) / 3Xq ) I xQsQ = I ................................. (67)
WD& b ,0 )» 0 .................................................. (68)
W d G ^ V - O iCT »D 1 l D ..................................... (W )
R e p ro d u c e d with p e rm is s io n of th e co p y rig h t ow ner. F u rth e r re p ro d u c tio n p ro h ib ited w ithou t p e rm iss io n .
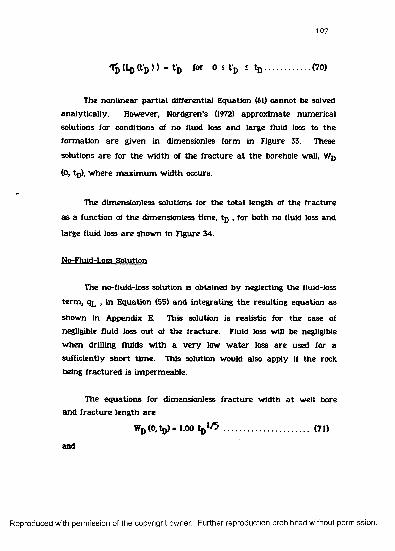
107
'ib d D ftj) > > - lb tCf 0 i 1'd s to ...................<70>
The non linear p a r tia l differential Equation (61) cannot be solved
ana ly tically . However, N ordgren's (1972) approx im ate num erical
solutions for conditions of no fluid loss and large fluid loss to th e
form ation a re given in dim ensionles form in Figure 33. These
solutions a re for th e w id th of th e f rac tu re a t th e borehole wall, WD
(0, tjj), w here m a x im u m w id th occurs.
The dim ensionless solutions for th e to ta l length of th e frac tu re
as a function of th e dim ensionless tim e, t D , for both no fluid loss and
large fluid loss a re show n in Figure 34.
No-Fluid-Loss Solution
The no-fluid-loss solution is obtained b y neglecting th e fluid-loss
te rm , , in Equation (55) and in teg rating th e resulting equation as
shown in Appendix E. This solution is realistic for th e case of
negligible fluid loss ou t of th e frac tu re . Fluid loss will be negligible
w hen drilling fluids w ith a v e ry low w a te r loss a re used for a
sufficiently sh o rt tim e. This solution would also app ly if th e rock
being frac tu red is im perm eable.
The equations for dim ensionless f ra c tu re w id th a t well bore and frac tu re leng th a re
WD ( 0 , y . | . 0 0 tj)1^ ........................................... (71)
and
R e p ro d u c e d with p e rm is s io n of th e co p y rig h t ow ner. F u rth e r re p ro d u c tio n p ro h ib ited w ithou t p e rm iss io n .

R e p ro d u c e d with p e rm iss io n of th e co p y rig h t o w n er. F u rth e r re p ro d u c tio n p ro h ib ited w ithou t p e rm iss io n .
FIGU
RE
33 -
Dim
ensi
onle
ss
solu
tions
for
th
e m
axim
um
frac
ture
w
idth
as
a fu
nctio
n of
tim
e.

Reproduced
with perm
ission of the
copyright owner.
Further reproduction prohibited
without perm
ission.
10.0
1.0
LARGE FLUID LOSS
NO FLUID LOSS
t*D s *’ 2 t[)/5 PROPOSED SOLUTION
0.612’ tf 3
1.273560.01
0.01 0.10 1.00 10.00
FIGURE 34 - Dimensionless solutions lo r th e f ra c tu re length as a‘ function of tim e.
109

1 1 0
W - 1-32 t u 4 / 5 ........................................................ (7 2 )
The fra c tu re w id th is obtained from th e dim ensionless solution
of Figure 33 for a given dim ensionless tim e, tj) , in com bination w ith
Equations (64) an d (65). The p ressure expansion a t th e f rac tu re
en tran ce can th e n be determ ined b y substitu ting th e w id th obtained
in Equation (18). The resulting equation is
p (0, t) ♦ W (0,t).G / ( (1-M).h ) ........................... (73)
In Equation (73), (Tjj is th e m a tr ix stress ac ting perpendicular to
th e fra c tu re wall, given in psi. This stress is equal to th e norm al
com pressive s tress on th e fra c tu re plane before f rac tu r in g occurs,
a n d i t is also know n as irac tu re-c lo su re pressure. A m ethod for
m easu ring frac tu re-c losure p ressu re from pressure-decline d a ta is
p resen ted in Appendix H.
Large-Flujd-Loss Solution
The large-fluid-loss or la rge-tim e solution is based on th e
assum ption th a t for large tim e, th e te rm corresponding to th e
change in cross-sectional a re a of th e fra c tu re w ith tim e, dA/ dt, can
be neglected in com parisons w ith th e fluid-loss te rm , q^ , in Equation
(55). The resulting p a rtia l differential equation can be easily
in tegra ted , as show n in Appendix C. The large-fluid-loss assum ption
is realistic on ly if th e f ra c tu re w all is exposed for a long period of
tim e to a drilling fluid w ith a m odera te to high w a te r loss, and a
perm eab le form ation is presen t. The validation of th is
R e p ro d u c e d with p e rm iss io n of th e co p y rig h t ow ner. F u rth e r re p ro d u c tio n p ro h ib ited w ithou t p e rm iss io n .
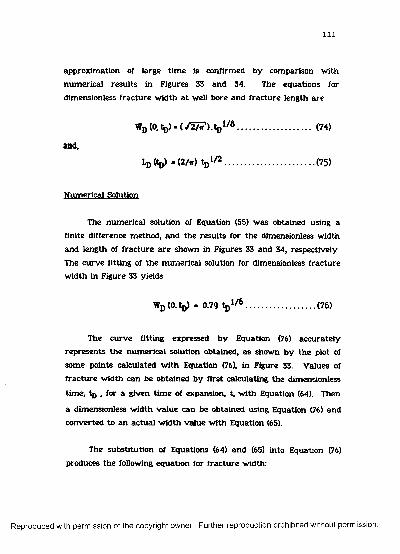
I l l
approxim ation of large tim e is confirm ed b y com parison w ith
num erica l resu lts in Figures 33 an d 34. The equations for
dim ensionless fra c tu re w id th a t well bore and frac tu re length a re
WD(0.tfc)-(y57?)..tj,1'# ........................ (74)and,
LoOj,) -(2 M ....................................... (75)
N um erical Solution
The num erical solution of Equation (55) w as obtained using a
finite difference m ethod, and th e resu lts for th e dimensionless w id th
and length of fra c tu re a re show n in Figures 33 and 34, respectively.
The cu rv e fitting of th e num erical solution for dimensionless f rac tu re w id th in Figure 33 yields
WD(0.t^) . 0.79 V * ..............................(76)
The cu rv e fitting expressed b y Equation (76) accu ra te ly
rep resen ts th e num erica l solution obtained, as shown b y th e plot of
som e points calculated w ith Equation (76), in Figure 33. Values of
fra c tu re w id th can be obtained b y firs t calculating th e dim ensionless
tim e, tD , for a given tim e of expansion, t, w ith Equation (64). Then
a dim ensionless w id th value can be obtained using Equation (76) and
converted to an ac tu a l w id th va lu e w ith Equation (65).
The substitu tion of Equations (64) an d (65) in to Equation (76)
produces th e following equation for fra c tu re w idth:
R e p ro d u c e d with p e rm iss io n of th e co p y rig h t ow ner. F u rth e r re p ro d u c tio n p roh ib ited w ithou t p e rm iss io n .
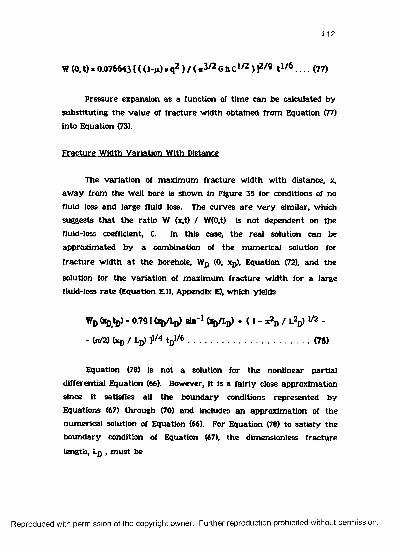
1 1 2
W (0,t)-0.076643l((l-M )vq2 ) / ( i r ^ /2 GhC1/2) l2/9 t 1 /6. . . . (77)
P ressure expansion as a function of tim e can be calculated by
substitu ting th e v a lu e of frac tu re w id th obtained from Equation (77)
in to Equation (73).
F rac tu re W idth V ariation W ith Distance
The varia tion of m ax im um frac tu re w id th w ith distance, x,
a w ay from th e well bore Is shown In Figure 35 for conditions of no
fluid loss and large fluid loss. The curves a re v e ry sim ilar, which
suggests th a t th e ra tio W (x,t) / W(0,t) is no t dependent on th e
fluid-loss coefficient, C. In th is case, th e rea l solution can be
approxim ated b y a com bination of th e num erical solution for
f rac tu re w id th a t th e borehole, WD (0, Xp), Equation (72), and th e
solution for th e varia tio n of m ax im um frac tu re w id th for a large
fluid-loss r a te (Equation E.ll, Appendix E), w hich yields
wD (Xby ■ 0.791 <V4)> fta'1 <VLd> * ( 1 - / L2d> 1/2 -- (n/2) <xD / Ld) ]>/« tD</‘ ......................................................(7#)
Equation (78) is no t a solution for th e nonlinear pa rtia l
differential Equation (66). However, it is a fa irly close approxim ation
since it satisfies ail th e boundary conditions rep resen ted by
Equations (67) th rough (70) an d includes a n approxim ation of th e
num erical solution of Equation (66). For Equation (78) to sa tisfy th e
b o undary condition of Equation (67), th e dim ensionless frac tu re
length, Lj) , m u s t be
R e p ro d u c e d with p e rm iss io n of th e co p y rig h t o w n er. F u rth e r re p ro d u c tio n p ro h ib ited w ithou t p erm iss io n .

Reproduced
with perm
ission of the
copyright owner.
Further reproduction prohibited
without perm
ission.
NO FLUIO LOSS (SMALL TIME APPROXIMATION)
LARGE FLUID LOSS (LARGE TIME APPROXIMATION)
PRO POSED SOLUTION3 0 .5
0 .5xL
FIGURE 35 - V ariation of m ax im u m fra c tu re w id th w ith distance from well.
113
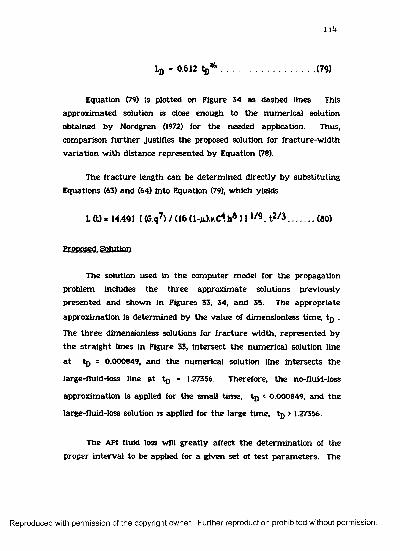
1 1 ^
Ld - 0.612 ( f l * .........................................(79)
Equation (79) is plotted on Figure 34 as dashed lines. This
approx im ated solution is close enough to th e num erica l solution
obtained b y Nordgren (1972) for th e needed application. Thus,
com parison fu r th e r Justifies th e proposed solution for frac tu re -w id th
v a ria tio n w ith distance rep resen ted b y Equation (78).
The f ra c tu re length can be determ ined d irec tly b y substitu ting
Equations (63) an d (64) in to Equation (79), w hich yields
L (t) - 14.491 I (G.q7) / (16 (l-ji).v.C4. fa*) ] 1/9. t2/3 ............(60)
Proposed Solution
The solution used in th e com puter m odel for th e propagation
problem includes th e th re e approx im ate solutions previously
p resen ted and show n in Figures 33, 34, an d 35. The app rop ria te
approxim ation is determ ined b y th e va lu e of dim ensionless tim e, tD .
The th re e dim ensionless solutions for f ra c tu re w id th , rep resen ted by
th e s tra ig h t lines in Figure 33, in tersec t th e num erica l solution line
a t tj) = 0.000849, and th e num erica l solution line in tersec ts th e
large-fluid-loss line a t tD = 1.27356. Therefore, th e no-fluid-loss
approxim ation is applied for th e sm all tim e, t D < 0.000849, an d th e
large-fluid-loss solution is applied for th e large tim e, tp > 1.27356.
The API fluid loss will g rea tly affect th e de te rm ina tion of th e
proper in te rv a l to be applied for a given se t of te s t p a ram ete rs . The
R e p ro d u c e d with p e rm iss io n of th e co p y rig h t o w n er. F u rth e r re p ro d u c tio n p ro h ib ited w ithou t p e rm iss io n .

1 1 5
low er th e API value, th e sm aller th e t D obtained, and th e larger
th e f ra c tu re w id th produced. N atu ra lly , for v e r y sm all tim es th e
model w ill also approx im ate th e no-fluid-loss solution.
The frac tu re -w id th equations for conditions of no fluid loss and
large fluid loss a re derived in th e sam e m a n n e r as w as Equation (77)
for num erica l solution; th e y a re
-No Fluid Loss
W (0, t) - 0.0942651 ( (l-jO.v.q2 ) / ( G.h) l 1 . t ! /5 ................(51)
-Large Fluid Loss
W (0,t) - 0.066462 I (2 (l-^).v.q2 ) / (wJ.G.C.h) \ m t , / 8 . . . . (82)
The equations for f ra c tu re length a re
-No Fluid Loss
L(t) - 101.261 (G .q3)/(< l-M ).v.b4 ) ] 1 /5 .t 4/ 5 ..........................(8J)
-Large Fluid Loss
lft)-I(5615.q)/(»li.C))t1/2..................... (64)
F rom Equation (84) i t can be seen th a t th e fluid-loss coefficient,
C, canno t be equal to zero. Equations (77), (80), (81), (82), (83), an d (84),
com bined w ith Equation (73), constitu te th e basic m a th em atica l m odeling of f rac tu re expansion assum ed in th is w ork.
R e p ro d u c e d with p e rm iss io n of th e co p y rig h t ow ner. F u rth e r re p ro d u c tio n p roh ib ited w ithou t p e rm iss io n .
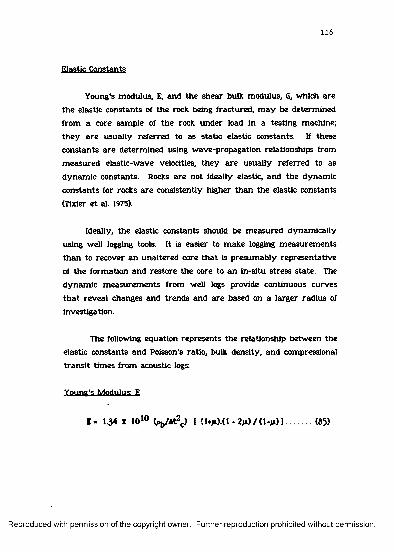
116
Elastic Constants
Young's modulus, E, and th e shear bulk modulus, 6, w hich a re
th e elastic constants of th e rock being frac tu red , m a y be determ ined
from a core sam ple of th e rock under load in a testing m achine;
th e y a re usually referred to as s ta tic elastic constants. If these
constan ts a re determ ined using w ave-propagation relationships from
m easured elastic-w ave velocities, th e y a re usually re fe rred to as
d y nam ic constants. Rocks a re not ideally elastic, an d th e dynam ic
constan ts for rocks a re consistently higher th a n th e elastic constants
(Tixier e t al. 1975).
Ideally, th e elastic constants should be m easured dynam ically
using well logging tools. It is easier to m ake logging m easu rem en ts
th a n to recover a n unaltered core th a t is p resum ably rep resen ta tive
of th e form ation an d res to re th e core to an in-situ stress s ta te . The
d ynam ic m easu rem en ts from well logs provide continuous curves
th a t revea l changes and trends and a re based on a la rger radius of
investigation.
The following equation rep resen ts th e relationship betw een th e
elastic constan ts an d Poisson's ratio , bulk density , and com pressional
t r a n s i t tim es from acoustic logs:
Young's . Mpdu liiSL_g
E . 1.34 X 10¹⁰ 0>b/4t2c) I <1«jO (I-2 » > /(1 - jl>1............ (#5)
R e p ro d u c e d with p e rm is s io n of th e co p y rig h t ow ner. F u rth e r re p ro d u c tio n p ro h ib ited w ithou t p e rm iss io n .

117
In Equation (85) th e bulk density , pjj, is obtained from a density
log in g/cm 3. The com pressional tra n s i t tim e, Atc , is m easured from
a sonic log in |i sec/ft. Young's m odulus is given in psi.
Bulk S hear Modulus: 6
Once Young's m odulus has been calculated for th e rock, th e
bulk shear modulus, G, is calculated using th e following equation:
G- E / (2 (1+jjl) ) ........................................... (66)
The o ther tw o elastic constants, Poisson's ra tio and Biot's
constant, a re determ ined as discussed ea rlier in th is chap ter.
F rac tu re Closure Model
The fracture-closure model to be used in th e m a them atica l
model for leak-off te st sim ulation is based on th e solution of th e
con tinu ity equation governing th e fluid flow in to th e frac tu re . Since
flow ra te during frac tu re closure is zero, because th e pum p h as been
sh u t in, th e corresponding te rm th a t includes flow r a te is set to zero
a fte r in tegration of th e differential equation over th e length of th e
frac tu re .
Equation (55), th e general con tinu ity equation governing th e
frac tu re phenom ena, com bines w ith Equation (58) to yield
d q /d x * ((2 C hp) / / t - Ttx)') + dA/ d t = 0 ....... (87)
R e p ro d u c e d with p e rm is s io n of th e co p y rig h t ow ner. F u rth e r re p ro d u c tio n p roh ib ited w ithou t p e rm iss io n .

1 1 8
The fra c tu re height, h, in th e fluid-loss te rm in Equation (55) is
replaced b y th e perm eable fraction of th e to ta l height of th e
frac tu re , hp in Equation (87). In th e fractu re-expansion model, h and
h p w ere m ade equal for m ath em atica l simplification and th is
assum ption w as found to h av e a negligible effect on th e final answ er.
During frac tu re closure, how ever, th e p ressu re decline is caused only
b y th e filtration o r fluid loss th rough th e fra c tu re w all, and th e h p /h
ra tio can significantly affect th e pressure-decline g radient. If hp
canno t be eva luated from logs before th e leak-off te st, th e n it can be
se t equal to th e to ta l f ra c tu re height, h, for sim ulation purposes and
eva luated la te r from logs or th e leak-off te s t d a ta obtained.
The cross-sectional a re a of th e elliptical crack is given by
Equation (59); th e derivation for th is equation is given in Appendix D.
The m ax im u m fra c tu re w id th for a frac tu re un d er constan t p ressure
is rep resen ted as
W -(( l-M)/G )h A P ................................... m
By substitu ting Equation (88) in to (59) an d deriv ing w ith respect
to t, one obtains
3A/ dt - (ir <1-m) / 4G ) h 2 ( dP/ d t)......................... (89)
Equation (89) contains th e reasonable assum ption th a t th e bulk
sh ear m odulus of th e form ation , 6, and th e to ta l f rac tu re height, h,
do no t change significantly w ith tim e. Now, com bining Equations (89)
and (87) yields
R e p ro d u c e d with p e rm iss io n of th e co p y rig h t ow ner. F u rth e r re p ro d u c tio n p roh ib ited w ithou t p e rm iss io n .

1 1 9
d q / a x « ( ( 2.c.hp) / / t -T fe ) ’) «• IiT (1-jOh2 / (4 G)].dP / d t. . . . (90)
The m ethod followed to solve Equation (90) is th e sam e as th a t
used b y Nolte (1982). Since th e theoretical approach used h ere is th e
sam e as th a t used to solve th e frac tu re-expansion problem , th e
assum ptions a re th e sam e, an d consequently th e discussion of th e
assum ptions m ade in th e frac tu re-expansion model also applies here.
The following equation is obtained b y in teg ra ting Equation (90)
over th e leng th of th e f ra c tu re and m aking th e b o u ndary conditions
of flow ra te equal to zero a t th e borehole (x=0) and a t th e f rac tu re
tip (x=L):
12 Chp.L / /^ ).f(t)« -(ir /4 )((l-M X h 2 )/G J9L < tf> / dt) d x .. .(91)
w here
r(t) d* / / t - T W ...................................... (92)
and,
t 0 = in jection tim e p rio r to sh u t-in , m in
L = f ra c tu re leng th m easu red from th e borehole, f t
To ob ta in a general solution for th e pressure-decline problem ,
w e m u s t hand le th e in tegra l te rm s in Equations (91) an d (92)
sep ara ted ly because no d irect in teg ra tion is possible. The tim e a t
w hich fluid loss begins a t a d istance, x, from th e well, Ttx), is a
function of x. This function m u s t be determ ined before th e in teg ral
te rm in Equation (92) can be eva luated . The x function can be
R e p ro d u c e d with p e rm iss io n of th e co p y rig h t o w n er. F u rth e r re p ro d u c tio n p ro h ib ited w ithou t p e rm iss io n .
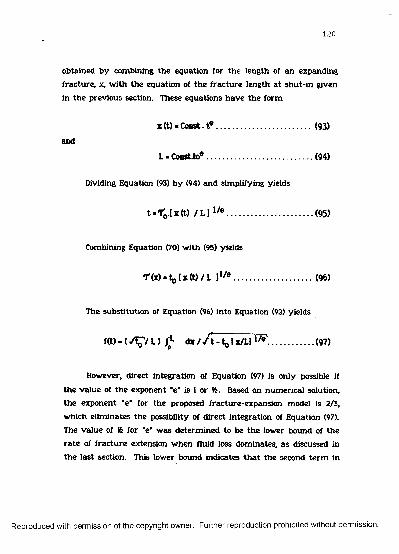
obtained b y com bining th e equation for th e length of an expanding
frac tu re , x, w ith th e equation of th e f ra c tu re length a t sh u t-in given
in th e previous section. These equations h av e th e form
z (t) ■ Const. t ? .......................................... (93)and
L - Constto*.............................................. (94)
Dividing Equation (93) b y (94) an d sim plifying yields
/ L I 1'* ..................................... (95)
Combining Equation (70) w ith (95) yields
T(z) - ^ I x (t) / L l1 /e...................................(96)
The substitu tion of Equation (96) in to Equation (92) yields
« 0 * ( ^ / L ) / oL d x z / t - tp Ix /L ] ■'*'.................... (97)
However, d irect in teg ration of Equation (97) is only possible if
th e v alue of th e exponent "e" is 1 or Vfe. Based on num erica l solution,
th e exponent "e" for th e proposed fracture-expansion model is 2/3,
w hich elim inates th e possibility of d irect in teg ration of Equation (97).
The value of 16 for "e" w as determ ined to be th e lower bound of th e
r a te of f ra c tu re extension w hen fluid loss dom inates, as discussed in
th e la s t section. This low er bound indicates th a t th e second te rm in
R e p ro d u c e d with p e rm iss io n of th e co p y rig h t o w n er. F u rth e r re p ro d u c tio n p ro h ib ited w ithou t p e rm iss io n .

121
Equation (87) dom inates th e th ird te rm to th e ex ten t th a t th is th ird
te rm , w hich controls fluid storage, can be neglected. The exponent
"e" equals Vis in Equation (97), allows th e following solution a fte r
integration:
fj (t)«8to"11( l + ; Lowbound................(98)
The value of "e" for th e upper bound is obtained b y assum ing
a no-fluid-loss ra te . In th is case, qL can be neglected in Equation
(84), as explained in th e previous section. The corresponding
exponent is e = 4/5, w hich also does not allow direct in tegration of
(97). However, th e upper-bound exponent can be set equal to 1, a
m ore conservative value to allow integration. This assum ption will
prove to be reasonable w hen th e solution is obtained. The exponent
e*l in Equation (97) allows th e following solution:
f2( t ) . 2 [ / ( t - y / t o ' l ; upporbound (99)
The ac tual va lue of exponent e in th e proposed frac tu re -
expansion model is 2/3, w hich is exactly halfw ay betw een th e upper-
and low er-bound exponents 16 an d 1. Then, th e solution found for f(t)
using th e exponent 2/3 should be in th e In terval
f 1(t)<f(t)<f2 (t) ...................................(100)
For simplification, th e te rm 6 - (t - y / is introduced in
Equations (98) an d (99) and yields
R e p ro d u c e d with p e rm iss io n of th e co p y rig h t ow ner. F u rth e r re p ro d u c tio n p roh ib ited w ithou t p e rm iss io n .

1 2 2
(101)
and
(102)
The functions fj ( b) and f2 ( b) a re plotted in Figure 36. The
difference betw een th e tw o curves is v e ry small, especially for
values of b > 1.5, w hich rep resen t th e com m on range found in leak-off
te st operations. Even for sm aller values of b, th e bounds a re still
v e ry close, and as a result, e ith e r of th e tw o bounds can be used as
an approxim ated solution for Equation (92) w ithou t com prom ising th e
accuracy since th e proposed solution falls in betw een th e bounded
solutions, and since o th e r p a ram e te rs in Equation (91) canno t be
estim ated w ith a n y ce rta in ty .
Therefore, picking th e upper bound as th e approx im ate solution
for f (t), substitu ting it in Equation (91), and solving for th e in tegral te rm yields
/ ffL ( dp/ a t ) dx - (l6.G.C.&p L ) / (ir ) I / I T ? - V T1.. (103)
If w e le t p be th e average p ressure along th e frac tu re length , L,
p can be expressed as
p * 1/L J L P.dx * 0 (104)
Derivation of Equation (104) w ith respect to tim e yields
dp/at- i/L/Lap/dt <ix (105)
R e p ro d u c e d with p e rm is s io n of th e co p y rig h t ow ner. F u rth e r re p ro d u c tio n p roh ib ited w ithou t p e rm iss io n .
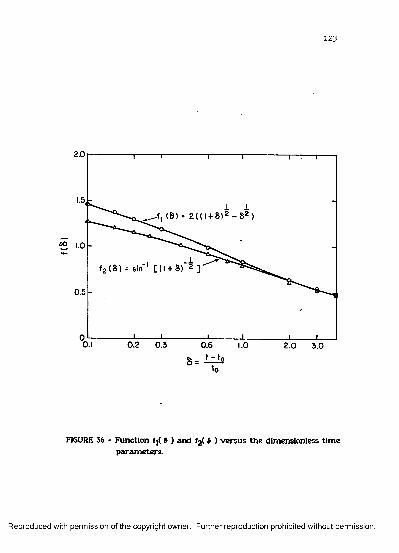
1 2 3
2.0
-f, (S) = 2 ( ( l + 8 ) 2 - 8 2 )
*2 10
f2 (S) = sin'1 [ 0 + 8)~ 2 ]
0.5
0.1 0.2 0.3 0.6 1.0 2 .0 3.0
8 ='O
FIGURE 36 - Function fj( 6 ) an d f2( 6 ) v e rsu s th e dim ensionless tim e p aram e te rs .
R e p ro d u c e d with p e rm is s io n of th e co p y rig h t ow ner. F u rth e r re p ro d u c tio n p ro h ib ited w ithou t p e rm iss io n .

1 2k
S ubstitu ting (105) in to (103), and substitu ting th e partia l
derivative, since p is a function of tim e only, gives
dp/dt - [ (16.C.hpG) / ( f t / t ^ ( 1 -u ) h 2 ) ] {/T T T - / F ) .......... (106)
Since b - (t - t ^ / t 0 , th e derivation of th is expression w ith
respect to tim e yields
dt « t^d b ...............................................(107)
To d eterm ine th e partia l derivative of p w ith respect to tim e
in Equation (106), w e m u s t firs t ev a lu a te p b y m eans of Equation
(104) as a function of th e w ell-bore p ressure, p. This p ressu re
decreases from p a t th e well bore to pj_ a t th e tip of th e crack as a
continuous function. Since th e flow g rad ien t is n o t linear an
a rith m e tic average is n o t appropriate . Then, assum ing a quad ra tic
fo rm yields
P fc )« P -0 > -P L)<X/L)2 ...............................(106)
Substitu tion of (108) in to (104) an d in teg ra tion yields
p . (2P ♦ PL) / 3 ...................................... (100)
Finally, a f te r Equation (109) is expressed w ith respect to tim e, t,
an d th e resu lting equation and Equation (107) a re substitu ted into
R e p ro d u c e d w ith p e rm iss io n of th e c o p y rig h t ow ner. F u rth e r re p ro d u c tio n p ro h ib ited w ithou t p erm iss io n .

1 2 5
(106), th e resulting equation is in teg rated over th e ra tio of tim e, b , in
th e in te rv a l b0 to b , w hich yields
4P (S0 , t) - ( <16.C.ly G . / ^ ) / <ir.<l-M) A2) ) I (1 ♦ «£/2 - *5/2 - 1 %
(110)
where,
AP(60 ,6 )-P fr0) -P fc ) ......................................( I l l )
and
G (6, V - 1 1 (1 ♦ tt 5/2 -tift. I I - M l* S<>) 3/2 - t0W - 1 | J . . . (112)
Efaid-Lpss Coefficient
The fluid-loss coefficient, C, can be graphically determ ined in
th e labo ra to ry w ith a stan d a rd API fluid-loss te st. The procedure
consists of plotting cum ulative filtra te volum e, Vf , v ersu s th e square
root of th e corresponding tim e. As shown b y Equation (32) for wall
cake building fluids, th is yields a linear relationship w ith th e slope,
m . The relationship betw een th e frac tu ring fluid or fluid-loss
coefficient and th e slope, m , for th is case is obtained by
d ifferentiating Equation (32) w ith respect to tim e, t, and dividing th e
resu lt b y th e cross-sectional area , A, of th e m edia th rough w hich th e
flow ra te , q, takes place. It yields
(dVj / d t ) (1/A) - (q/A) - v - (m/2 A) (1 //E )................... (113)
R e p ro d u c e d with p e rm iss io n of th e co p y rig h t ow ner. F u rth e r re p ro d u c tio n p roh ib ited w ithou t p e rm iss io n .
126
The fluid-loss coefficient is defined as
C -v ./T (114)
Finally, if w e com bine Equations (113) and (114), and conve rt to
field units, th e fluid-loss coefficient becomes
Equation (115) expresses th e fluid-loss coefficient in field u n its of
f t/ /m in ', th e area , A, in cm 2, and th e slope, m , in cm 3/ /m in : The
slope, m , obtained from Equation (32) can be substitu ted into
Equation (115), yielding
The v alue of C can be obtained th rough an API fluid-loss test.
The s tra ig h t line plotted determ ines th e sp u rt loss, Vsp , w hich is th e
in tercep t w ith th e y-axis, and th e slope, m . The sp u rt loss of drilling
fluids is usually negligible.
The fluid-loss coefficient can also be determ ined b y using
pressure-decline d a ta from leak-off tests. Equation (112) indicates
th a t if tw o points a re selected on th e pressure-decline da ta , th e
function G ( 6 , 5 ^ can be eva luated . The tw o corresponding values
of p ressu re a re used to also ev a lu a te AP ( &Q , 6). If th e rem ain ing
variab les a r e know n, Equation (110) can be used to d eterm ine th e
C * 0.0164. m/A (115)
C ■ 0.0164 ( (Vf - Vgp) / A /T ) (116)
R e p ro d u c e d with p e rm iss io n of th e co p y rig h t o w n er. F u rth e r re p ro d u c tio n p ro h ib ited w ithou t p e rm iss io n .

1 2 ?
fluid-loss coefficient. This procedure can be repea ted for various d a ta
points to obta in a n average v alue of fluid-loss coefficient. Curve-
m atch ing techniques can also be used to obtain th is average. Nolte
(1982) shows th is technique in detail.
R e p ro d u c e d with p e rm iss io n of th e co p y rig h t o w n er. F u rth e r re p ro d u c tio n p ro h ib ited w ithou t p e rm iss io n .

COMPUTER MODEL
The successful planning of fu tu re w ells requ ires a good
knowledge of how to predict frac tu re -p ressu re g radients and properly
v erify th e m during drilling. Leak-off te sts a re used to verify th e
frac tu re -p ressu re g rad ien t of th e w eaker fo rm ation below th e ac tual
casing shoe. However, a s tan d a rd leak-off te s t procedure h as not y e t
been form ulated , no r h as a s tan d a rd in te rp re ta tio n technique for
d a ta analysis. Consequently, these d a ta canno t be fully utilized. A
com puter sim ulation of a leak-off te s t h as been developed to aid in
designing th e te s t before i t is ac tua lly conducted and also to allow
in te rp re ta tio n of th e d a ta collected a f te r th e te s t is ru n . This
ch ap te r will show th e steps taken to develop th e so ftw are necessary
to accomplish th is task. In addition, th e p rogram configuration and
necessary d a ta file organization will also be discussed here. The
p rogram follows th e steps show n in th e flow c h a rt in Figure 37.
Featu res
The com puter m odel developed to s im ula te leak-off tests
predicts w ith reasonable accu racy th e shape of th e p ressu re curve
on th e basis of ce rta in n u m b e r of inp u t p a ram e te rs com m only
available in th e field. The com puter model incorporates four
m a th em atic a l models th a t s im ulate each individual phase th a t
occurs during a leak-off te s t. These phases a re (1) p ressu re increase
due to change in overall com pressibility of th e well sy stem , (2)
fo rm ation breakdow n an d th e consequent creation of a frac tu re , (3)
expansion of th is f rac tu re to an elliptical shape, an d (4) closure of th e
fra c tu re b y fluid filtra tion a fte r th e pum p is stopped. These four
128
R e p ro d u c e d with p e rm iss io n of th e co p y rig h t ow ner. F u rth e r re p ro d u c tio n p roh ib ited w ithou t p e rm iss io n .
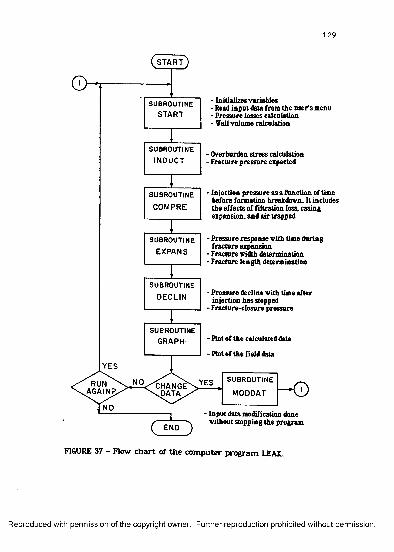
12 9
- Initializes variables- Read input data from the user’s menu- Pressure losses calculation- Veil volume calculation
- Overburden stress calculation- Fracture pressure expected
- Injection pressure as a function of time before formation breakdown. It includes the effects of filtration loss, casing expansion, and air trapped
- Pressure response with time during fracture expansion
- Fracture width determination- Fracture length determination
- Pressure decline with time after injection has stopped
- Fracture-closure pressure
- Plot of the calculated data
- Plot of the field dataYES
NO- Input data modification done
without stopping the program( END
RUNAGAIN?,
A N\ d a ta
SUBROUTINESTART
SUBROUTINE
EXPANS
SUBROUTINE
DECLIN
SUBROUTINE
INDUCT
SUBROUTINE
COMPRE
SUBROUTINE
MODDAT
SUBROUTINEGRAPH
FIGURE 37 - Flow c h a rt of th e com puter p rogram LEAK.
R e p ro d u c e d with p e rm is s io n of th e co p y rig h t ow ner. F u rth e r re p ro d u c tio n p ro h ib ited w ithou t p e rm iss io n .

1 3 0
models a re explained in th e previous chap ter. The in p u t d a ta
needed for th e model a re stored in a d a ta file in th e fo rm a t shown
in Appendix F to be used b y th e com puter p rogram LEAK. The
program plots injection pressure a t surface against tim e. Since flow
ra te is approxim ately constan t th roughou t th e test, th is tim e scale is
d irectly proportional to th e volum e of m ud in jected for th e portion
of th e te s t during w hich th e pum ps a re used. In addition, inpu t te st
p a ram e te rs im p o rtan t in th e sim ulation process a re show n on th e
righ t-hand corner of th e plot, as depicted in th e exam ple o u tp u t in
Figure 38. The list of in p u t/o u tp u t p a ram e te rs show n in Figure 38
can also be p rin ted a t th e end of a ru n .
An additional fea tu re of th e com puter model developed in its
ab ility to sim ula te th e injection p ressure cu rv e of a leak-off te s t for
a n y volum e of a ir trapped. Figure 39 shows a n exam ple of th is ty p e
of sim ulation; in th is exam ple, a ir trapped is assum ed to be zero
initially , and th e n changed to 3.5 ft3, w ith o the r conditions kept
constant. The c u rv a tu re occurring a t e a rly tim es is caused b y th e
presence of a ir in th e closed-well system .
The com puter p rogram LEAK is w r itte n In FORTRAN com puter
language and designed to be u se r friendly. The in p u t d a ta needed
for th e p rogram a re stored in a d a ta file fo rm a tted as show n in
Appendix F. The m ost im p o rtan t a lte rab le d a ta a re displayed on th e
screen in th e fo rm a t of a m enu (Figure 40). The code shown in th e
le ft-hand com er is used to change th e corresponding pair of
pa ram ete rs. The 26 p a ram e te rs displayed can be changed as often
as needed during a leak-off te s t sim ulation or in terp re ta tion .
R e p ro d u c e d with p e rm is s io n of th e co p y rig h t ow ner. F u rth e r re p ro d u c tio n p ro h ib ited w ithou t p e rm iss io n .
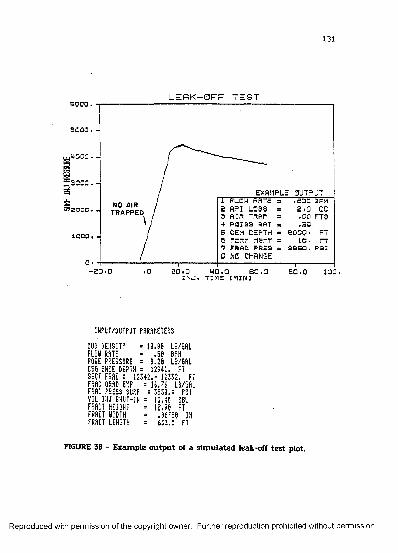
1 3 1
L E f i K —O F F T E S T
u .4000 . -31_30CQ. H
bC320Q0 . . NO AIR
EXAMPLE OUTPUT
20.□ Z N J .
1 FLEW RHTE £ API LOSS3 AIR TRAP4 p o ia a rat5 GEM DEPTH c rcnn riBrrr7 FRAC PRES 0 NO CHANGE
4 0 . 0 6 0 .0TIME CP1IN1
.son SFM2 .0 cc•00 FT3.ED
8000• FT 1 0 - PT
a a s o . p a :
INPUT/OUTPUT PARAMETERS
HUD DENSITY = 16.80 LB/GHLFLOW RATE = .58 BP11PORE PRESSURE = 9.26 LB/GflLCSG SHOE DEPTH = 12941. FT SECT FRfiC • 12342.- 12352. FT FRflC GRflD EXP = 16.76 LB/GflL FRfiC PRESS SURF = 3958.4 PSI VOL IHJ SHUT-IN = 11.48 BBL FRflCT HEIGHT = 16.86 FT FRflCT WIDTH = .06756 INFRflCT LENGTH = 633.5 FT
FIGURE 38 - Exam ple o u tp u t of a sim ula ted leak-off te s t plot.
R e p ro d u c e d with p e rm iss io n of th e co p y rig h t ow ner. F u rth e r re p ro d u c tio n p roh ib ited w ithou t p e rm iss io n .
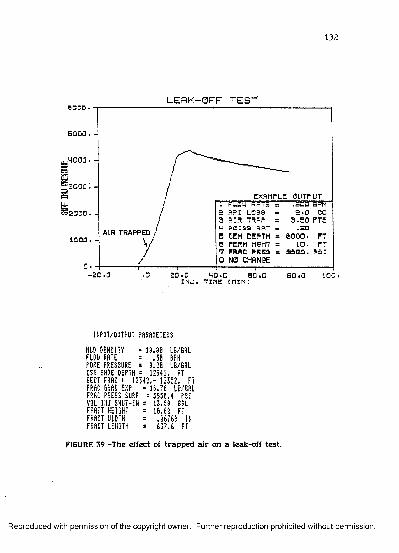
132
L E R K —O F F T E S T
'30DQEXAMPLE OUTPUT
2 API LOSS3 AIR TRAP
AIR TRAPPED 5 CEM DEPTH = 8000. FT o pe r m n s r r rO FRAE PRES = 3.SSG . P S I 0 NO CHANGE
1GQQ10 • T T
.0 4 0 .0 6 0 .0 60 .0 100 .I N J . TIME CHIN]
INPUT/OUTPUT PARAMETERS
HUD DENSITY = 16.60 LB/GALFLOW RATE = .56 BPHPORE PRESSURE = 9.26 LB/GALCSG SHOE DEPTH = 12941. FT SECT FRAC : 12342.- 12352. FT FRfiC GRfiD EXP =16.76 LB/GflL FRfiC PRESS SURF = 3956.4 PS1 VOL in; SHUT-IN = 13.50 BBLFRflCT HEIGHT = 16.66 FTFRflCT IJIDTH = .66769 INFRfiCT LENGTH = 637.6 FT
FIGURE 39 -The effect of trapped a ir on a leak-off test.
R e p ro d u c e d with p e rm is s io n of th e co p y rig h t ow ner. F u rth e r re p ro d u c tio n p ro h ib ited w ithou t p e rm iss io n .

1 3 3
MENU
1 MUD DENSITY / MUD VISCOSITY2 MUD YIELD PT / MUD 10 MIN GEL3 MUD SPURT LOSS/API FLUID LOSS4 FLOW RATE/TOTAL DEPTH5 PORE PRESS/TENSILE STRENGTH6 SURF P0R05/P0R0S DECL CONST7 VOL INJ SHUT-IN/TOT PERM HGHT8 TOP AND/BOTTOM OF FORM INTER9 HOLE DIAM / MICROANNULUS
10 BIOT CONST/POISSON RATIO11 AIR GAP/WATER DEPTH(OFFSHORE)12 DRILLING TIME / CIRCULAT TIME13 TOP CEMENT DEPTH/AIR TRAPPED14 TO CONTINUE THE PROGRAM
10.00 LB/GAL / 25.00 CP8.00 * /1 0 0 FT2 / 9.00 */IOO FT2
.0 CM3 / 2.0 CM3
.50 BBL/MIN/ 12951 FT:5900 PSI / 0 PSI
.42 / .0000732.00 BBL / 10 FT
12342 FT / 12352 FT13.00 IN / .0000 IN
.79 / .30108 FT / 95. FT20.0 MIN / 120.0 MIN6000 FT / 0.00 FT3
ENTER PROPER CODE TO CHANGE ANY PARAMETER/S ?
FIGURE 40 - The m enu display of th e program .
R e p ro d u c e d with p e rm iss io n of th e co p y rig h t o w n er. F u rth e r re p ro d u c tio n p ro h ib ited w ithou t p e rm iss io n .

13 4
W hen th e injection p ressure is calculated, a sm aller m enu is
added in th e lower r igh t-hand corner, as shown in Figure 38. This
m en u includes th e in p u t/o u tp u t p a ram ete rs th a t th e user will m ost
likely w a n t to v a ry . These variab les can also be changed b y using
th e corresponding code on th e left. These p a ram e te rs a re shown on
th e plot so th a t th e user can v isually associate th e m ost im p o rtan t
p a ram ete rs w ith th e cu rve shape produced.
jfflaaLBaa msteEg
The inform ation necessary for a leak-off te s t sim ulation can be
obtained d irectly from field observations and fed into th e com puter.
This Inform ation includes
1. Flow ra te
2. Drilling fluid inform ation
a. M ud density
b. m ud viscosity
c. 10-min gel
d. yield point
e. percentage oil
f. percentage solids
g. API fluid loss
h. sp u rt loss
3. Well geom etry
a. Total well depth
b. Casing shoe depth of la s t casing
c. Top of cem ent outside la st casing
d. Casing OD, ID, grade
e. Drill collars OD, ID, length
R e p ro d u c e d with p e rm is s io n of th e co p y rig h t ow ner. F u rth e r re p ro d u c tio n p ro h ib ited w ithou t p e rm iss io n .

1 3 5
f. Drilling pipes OD, ID, length
g. H eavy-w eight drill pipes OD, ID, length
h. Bit size
i. Bit je ts size
j . W ater dep th (if offshore)
4. Lithology (open-hole section only)
a. Type
b. Depth in te rv a l of each fo rm ation
c. Pore p ressu re
d. F orm ation age
e. Surface porosity decline constan t (Appendix B)
5. A m ount of tim e th a t th e form ations a re exposed to th e
drilling fluid
6. Volume of a ir trapped during th e te st
During th e drilling personnel's p repara tions for a leak-off te st
a ir can become trapped in th e m ud-in jec tion lines betw een th e
top of th e m u d level in th e drill s tring itself and th e ou tle t of
th e m ud p um p to be used during th e te st. A nother place
w here a ir becomes trapped is betw een th e a n n u la r BOP valve
and th e m ud level inside th e an n u la r space in th e casing. At
th e beginning of th e leak-off te st, w hen m u d is firs t slowly
in jected in to th e well, th e w ell is com pletely closed; th e a ir
trapped is th u s com pressed an d injection p ressu re increases
v e ry slowly w ith tim e. As th e volum e of a ir trapped di
minishes, due to p ressu re increase, th e in jection pressure
increases m ore rap id ly because of th e change in th e overall com pressibility of th e system .
R e p ro d u c e d with p e rm iss io n of th e co p y rig h t o w n er. F u rth e r re p ro d u c tio n p ro h ib ited w ithou t p e rm iss io n .

136
7. Air gap betw een th e kelly bushing and th e floor (or w a te r
su rface if offshore)
8. T em peratu re a t su rface and te m p e ra tu re g rad ien t
O utput P aram ete rs
The p rogram o u tp u t consists p rim arily of a plot of injection
p ressure a t su rface versu s in jection tim e, w hich also includes th e
surface in jection p ressu re needed to f rac tu re th e form ation for th e
given inp u t conditions. The o u tpu t also includes th e frac tu re
g rad ien t expected, to ta l in jected volum e of m ud a t shu t-in , th e
m ax im u m fra c tu re w id th obtained, and th e to ta l f ra c tu re length.
Pfrt a FHe Orga n i s m
W ith th e info rm ation listed in th e previous section, th e d a ta
file for th e p rogram can be added in th e fo rm a t show n in Appendix
F. The d a ta file used to obta in th e o u tp u t exam ple show n in Figure
38 is also shown in Appendix F.
Curvg-MatchinK Technique
Once th e in p u t d a ta is defined for a given a re a and stored in
th e d a ta file, th e model will produce a sim ulated leak-off te s t plot
s im ilar to th e one in Figure 38. During th e leak-off te st, th e ac tual
d a ta m easured to plot p ressu re ve rsu s tim e a re sto red in th e d a ta
file (see Appendix F), and th e p rogram will read d a ta from th e d a ta
file and plot it on top of th e sim ulated plot. The u se r can th e n
easily observe w h e th e r a m a tc h occurs betw een th e predicted plot
an d th e field d a ta plot. The com puter m odel is assum ed to
R e p ro d u c e d with p e rm iss io n of th e co p y rig h t ow ner. F u rth e r re p ro d u c tio n p roh ib ited w ithou t p e rm iss io n .

1 3 7
accu ra te ly s im u la te th e behavior of a p ressure cu rve for th e inpu t
p a ra m e te rs given. A m a tch of th e d a ta indicates th a t all th e inpu t
p a ram e te rs agree w ith th e field conditions, and th e p a ram e te rs then
rep resen t th e leak-off te s t design crite ria for th a t specific well depth
and th e form ations it pene trates. These p a ram e te rs m a y also be
used for fu tu re w ells drilled in th e sam e area .
W hen a good m a tch betw een th e predicted and observed
leak-off te s t cu rves is obtained, th e observed leak-off te s t can be
in te rp re ted w ith confidence. W hen a m ism atch occurs, inpu t d a ta
can be varied over th e possible range to see w h e th e r th e observed
d a ta can be explained. Failure to obtain a m a tch indicates a poor
cem en t job. A m ism atch betw een th e predicted cu rve and th e one
produced b y field d a ta m eans th a t some inp u t p a ram e te rs should be
changed so th a t th e y fit th e field data . For exam ple, if th e frac tu re
pressu re predicted b y th e model is h igher th a n th e ac tual frac tu re
pressu re observed, th e p aram ete rs involved in f rac tu re p ressure
determ ination , such as Poisson's ratio , depth, overburden stress, pore
pressure, and tensile streng th , should be reeva luated un til a m a tch is
obtained. If v a ria tio n of these p aram ete rs over a likely range of
values does no t produce a m atch , th e n a leaking cem ent is indicated.
In large open-hole sections, different form ations a re som etim es
exposed, and th e w eakest one m a y no t be a t th e casing seat. If i t is
n o t a sm aller frac tu re -p ressu re gradient will be observed.
Changing ce rta in p a ram e te rs will affect th e whole shape of th e
sim ulated p ressu re cu rve because th e y appear in each stage of th e
frac tu rin g m echanism , w hich includes frac tu re creation, expansion,
and closure. For exam ple, if th e fracture-expansion portion of th e
sim ulated cu rv e is s im ilar to th e one shown b y th e field da ta , bu t
R e p ro d u c e d with p e rm is s io n of th e co p y rig h t ow ner. F u rth e r re p ro d u c tio n p roh ib ited w ithou t p e rm iss io n .
1 3 8
th e fra c tu re pressure does no t m a tch , the Poisson's ra tio should not
be changed because it will affect both th e f rac tu re pressure and the
fracture-expansion curve. In th is case, such p a ram e te rs as
overburden stress, tensile streng th , and pore pressure should be
exam ined first.
The n ex t section illustrates th is cu rve-m atch ing technique w ith
a series of leak-off te s t d a ta obtained in th e field.
LeaK-Otf. Igsi .Design
Introduction
The com puter model for leak-off te st sim ulation can be used
no t only for in terp re ting tests, b u t also for designing leak-off tests.
Before drilling personnel conduct th e test, it is v e ry im p o rtan t for
th e m to know th e flow ra te to be used during th e test, w h a t
f rac tu re gradient is expected, th e to ta l volum e of m ud to be injected
during th e test, and w h a t a good pressure response cu rve looks like.
To b e tte r describe th e steps th a t should be taken to design a leak-off
te s t w ith th e softw are developed, th is section uses a n exam ple to illu s tra te th e process.
The well chosen for th is exam ple is located in th e Louisiana
Gulf Coast a rea . M ost of th e inform ation needed to design th e
leak-off comes from drilling-m orning reports and m ud logs, which
w ere generously furn ished b y Tenecco Oil Company. The leak-off
te s t can be designed a fte r all th e necessary well inform ation is
collected. The te st can also be designed before th e well is drilled on
R e p ro d u c e d with p e rm iss io n of th e co p y rig h t o w n er. F u rth e r re p ro d u c tio n p ro h ib ited w ithou t p e rm iss io n .

1 3 9
th e basis of expected d a ta from th e w ell-planning design, or w hile
th e casing is set, w hich provides th e m ost up-to -da te inform ation.
Exam ple .Pesign
The exam ple design of th e leak-off te s t presented h ere
incorporates d a ta from a well drilled in th e Gulf of Mexico a re a by
Tenneco Oil Company. The well, located in Eugene Island block *215,
is nam ed 0CS-G-0580 No. D-l. The design presented h ere is for th e
p redom inan tly shale form ation im m ediately below th e casing sea t of
th e 9 - 5/8" in te rm e d ia ry casing se t a t 12,342 f t ( tru e vertica l depth).
The well is directional, and th e configuration a t th e tim e of th e te st
is show n in Figure 41.
The general inform ation needed for th e te st design is listed in
Table 4. O ther inform ation needed and no t available a t th e tim e of
th e te s t will be presented during th e developm ent of th e exam ple.
Open-hole section. A fter th e casing is cem ented and th e float collar
equipm ent, cem ent, and shoe drilled, 10-20 ft of form ation should be
drilled (rathole). In th e p resen t case, th e ra tho le should be drilled to
12,951 f t (MD), w hich includes 10 f t of open-hole section. The
fo rm ation below th e casing shoe is p redom inan tly shale m ixed w ith
sand , as show n in Figure 41. The 10 f t of open-hole section will
expose th is lithology to th e test.
Bit depth, drilling tim e, and circulation tim e . The drilling tim e spent
to drill th e ra tho le should be recorded so th a t th e cum m ula tive
w a te r loss to perm eable fo rm ations can be calculated. A fter th e
ra th o le is drilled, th e b it should be positioned a t 12,940 ft, w hich is
R e p ro d u c e d with p e rm iss io n of th e co p y rig h t ow ner. F u rth e r re p ro d u c tio n p roh ib ited w ithou t p e rm iss io n .

1 4 0
EUGENE ISLAND 215 D!
RKB
108 '
9,5'
SU R FA C E-68 # / f t - K 55
TOP OF CEMENT ~ 8 0 0 0 * (MD)L IT H 0 L 0 6 Y
SAND
9 ^ 8 INTERM - 5 3 .5 # / f t - S 9 5 (ID 8 .5 3 5 " )
I2 9 4 IV I2 3 4 2 '■SHALE
I2 9 5 l>/ I 2 3 5 2 <
FIGURE 41 - Exam ple well configuration.
R e p ro d u c e d with p e rm is s io n of th e co p y rig h t ow ner. F u rth e r re p ro d u c tio n p ro h ib ited w ithou t p e rm iss io n .

141
TABLE4
FIELD DATA FOB THE EXAMPLE DESIGI OF A LEAK-OFF TEST
(TELL E l 213 B I)
WellIdentif.
Mud PItsUc Yield 10 Min API Solids Density Viscosity Point GEL Fluid Loss Goncent (lb/gsl) (CP) (LBF/100ft*) (LBF/100ft2) (ca3) (X)
Oil Hov Drlf Concent lata Tiaw
(X) (BPM) (MIN)
Circul.Tiaw(MIN)
H2I5D-I 10.8 23.0 0.0 9.0 16.0 26 2. 20.0 120.0
Well Geometry
WellIdentif.
Lest CASING CSG OD ID (>) (in.) (in.)
(Top)Leoftb(ft)
CASING (BMtoa) OD ID Leostb tin) (in) (ft)
TotalDeptb
(ft)
WaterDeptb
(ft)
AIR Top Ceaeot GAP Deptb (ft) (ft)
ShoeDepth
MD/TVD(ft)
E12I5D-I I 9.625 0.335 12941 - - - 1293112332
95.0 100.2 0000 1294112342
R e p ro d u c e d with p e rm iss io n of th e co p y rig h t ow ner. F u rth e r re p ro d u c tio n p roh ib ited w ithou t p e rm iss io n .
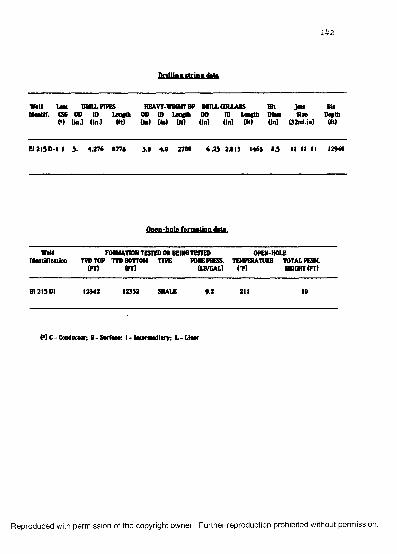
Wall Lot DULL PIPES HEAVY-WBGHT DP DRILL COLLARS Bit JeU BitMeotif. CSC OD ID Leoftli OD ID Lcoftb OD ID Le^th Dint Sim Depth
(>) (in.) (in.) (ft) (in) (in) (ft) (in) (in) (ft) (in) (32od.in) (ft)
El215D-l I 5. 4.276 8778 5-0 4.8 2700 6.25 2.813 1463 8.5 I! II 11 12940
Open-hole formation dote.
Well FORMATION TESTED OR BEING TESTED OPEN-HOLEIdentification TVD TOP TVD BOTTOM TYPE PORE PRESS. TEMPERATURE TOTAL PERM.
(FT) (FT) (LB/GAL) (*F) HEIGHT (FT)
EI215DI 12342 12352 SHALE 9.2 211 10
(*) C- Conductor; S-Sorfaca; I - Intaraediafy; L-Liner
R e p ro d u c e d with p e rm is s io n of th e co p y rig h t ow ner. F u rth e r re p ro d u c tio n p ro h ib ited w ithou t p e rm iss io n .

1 4 3
inside th e casing. The well should be circulated w ith a m ud volum e
of a t least 1.5 tim es th e to tal volum e of m ud in th e well. This will
clean th e annu lu s and obtain a uniform m ud w eight of 10.8 lb/gal
th roughout th e well. In our example, th e values of drilling tim e and
circulating tim e w ere estim ated to be 20 m ln and 120 m in,
respectively.
Surface porosity an d porositv-decline co n s ta n t. Surface porosity (0O)
and th e porosity-decline constan t (K) a re determ ined as discussed in
Appendix B. According to th is m ethod, a porosity log of th e a rea
should be used to plot porosity as a function of depth. The porosity
log available for th e exam ple well is an acoustic log; th e values of
fo rm ation tr a n s i t tim e versu s depth obtained from th is log a re listed
in Table 5. The values w ere averaged over 500-ft depth in tervals.
The corresponding porosities, listed in th e sam e table, w ere calculated
using th e following equation for th e Gulf Coast area:
A t^ -50+(130 + Atj) 0 -1 6 O 0 2 .................................. (116)
w here
At0 = m easured in te rv a l tra n s it tim e, \i sec/ft
Atf = In te rval tra n s i t tim e of th e porous fluid, n sec/ft
Equation (116) includes th e varia tion of in te rv a l tra n s i t tim e of
th e rock m a trix , Atm , w ith porosity for th e Gulf Coast a rea
(Bourgoyne 1986).
R e p ro d u c e d with p e rm iss io n of th e co p y rig h t o w n er. F u rth e r re p ro d u c tio n p ro h ib ited w ithou t p e rm iss io n .

l a t o n r t l trunt tiae Mid ctrreifoaieat fam ily tsIbm n m t 4 tp tk .
DEPTH INTEBVAL INTEBVAL TRANSIT TIME At
POROSITY
0
1000 - 1300 156.4 0.3981300 - 2000 130.8 0.3702000 - 2300 143.4 0.3362300 - 3000 141.0 0.3243000- 3300 141A 0.3273300- 4000 141.0 0.3244000 - 4300 136.4 0.3044300 - 3000 1392 0.3163000- 3300 134.8 02973300 - 6000 1334 02996000- 6300 1282 02696300 - 7000 1232 02397000- 7300 1192 02357300 - 8000 1212 02438000- 8300 1162 02218300- 9000 112.4 02079000- 9300 111.0 02029300-10000 108.4 0.192
10000-10300 1032 0.18210300-11000 1012 0.16611000-11300 96.8 0.15011300-12000 982 0.13312000-12300 96.4 0.148
R e p ro d u c e d w ith p e rm is s io n of th e c o p y rig h t o w n e r. F u rth e r re p ro d u c tio n p ro h ib ited w ithou t p e rm iss io n .
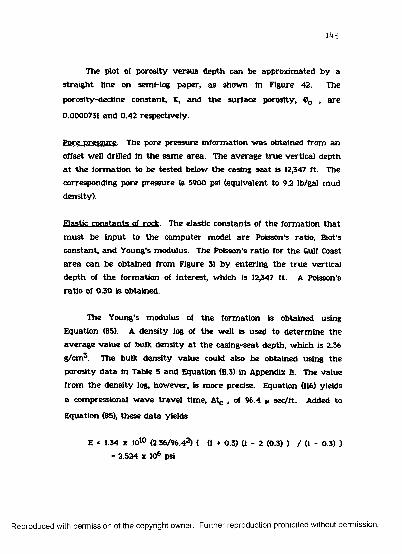
1 4 5
The plot of porosity v e rsu s depth can be approxim ated b y a
s tra ig h t line on semi-log paper, a s shown in Figure 42. The
porosity-decline constan t, K, and th e su rface porosity , 0O , a re
0.0000731 an d 0.42 respectively .
Pore p ressu re . The pore p ressu re in fo rm ation w as obtained from an
offset w ell drilled in th e sam e a rea . The ave rage tr u e v ertica l depth
a t th e fo rm ation to be te sted below th e casing sea t is 12,347 ft. The
corresponding pore p ressu re is 5900 psi (equivalent to 9.2 lb/gal m ud
density).
Elastic constan ts of rock. The elastic constan ts of th e fo rm ation th a t
m u s t be in p u t to th e com puter model a re Poisson's ra tio , Biot's
constan t, an d Young's m odulus. The Poisson's ra tio for th e Gulf Coast
a re a can be obtained from Figure 31 toy en tering th e t r u e vertica l
dep th of th e fo rm ation of in teres t, w hich is 12,347 ft. A Poisson's
ra tio of 0.30 is obtained.
The Young's m odulus of th e fo rm ation is obtained using
Equation (85). A d en s ity log of th e well is used to dete rm in e th e
average v a lu e of bulk density a t th e casing-seat depth , w hich is 2.36
g/cm 3. The bulk den sity va lu e could also be obtained using th e
porosity d a ta in Table 5 an d Equation (B.3) in Appendix B. The value
from th e den sity log, how ever, is m ore precise. Equation (116) yields
a com pressional w av e tra v e l tim e, Atc , of 96.4 m sec/ft. Added to
Equation (85), the se d a ta yields
E = 1.34 X 10¹⁰ (2.36/96.42) { (1 ♦ 0.3) (1 - 2 (0.3) ) / (1 - 0.3) ) «= 2.524 x 10⁶ psi
R e p ro d u c e d with p e rm iss io n of th e co p y rig h t o w n er. F u rth e r re p ro d u c tio n p ro h ib ited w ithou t p e rm iss io n .

146
0 .4 2POROSITY TREND
(E l 215 Dl)
<f> o = 0 .42 K = 0 .0000731
2000
4 0 0 0
OH 6 0 0 0
X
a- 8000LdQ
^ 0 . 4 2 - e a0000734^10000
12000
140000.05 0.1 1.0
POROSITY
FIGURE 42 - Porosity versu s depth for th e EI-215-D-1 well drilled in Louisiana Gulf Coast a rea .
R e p ro d u c e d with p e rm iss io n of th e co p y rig h t ow ner. F u rth e r re p ro d u c tio n p ro h ib ited w ithou t p e rm iss io n .

1 ^ 7
If w e assum e th e com pressibility of th e rock m a trix , Cm a , to be
equal to 0.1 x 10⁻⁶ psi"1; calculate th e bulk rock com pressibility from
Equation (50); an d substitu te th e resu lts in Equation (49), w e get
a - 1 - (0.1 x 10’6) / (2 .1 X 10"6) - 0.79
Cementing job. Two in p u t d a ta re la ted to th e cem en t outside th e
in te rm ed ia te casing a re needed. The firs t is th e q u a lity of th e
cem enting Job, w hich can indicate th e existence of a m icroannulus
betw een th e casing and th e cem ent. This inform ation can be
obtained if a CBL-VDL log is ru n a f te r th e cem ent sets. The
m icroannulus, if it occurs, cannot be la rger th a n 0.01 in., th e
m ax im um size n o rm a lly encountered. In th e p resen t exam ple, no
CBL-VDL logs w ere ru n , b u t inform ation gathered from o the r wells
indicates th a t th e q uality of th e cem enting job is genera lly v e ry
good, and no m icroannulus problem s h av e been noticed.
The second piece of inform ation needed is th e dep th of th e top
of th e cem ent outside th e casing. This in fo rm ation can also be
obtained from th e CBL-VDL log. Also, i t can be calculated on th e
basis of th e volum e of cem ent displaced an d th e well geom etry . In
ou r exam ple well, th e top of th e cem ent is a t approx im ately 8000 ft of m easured depth.
Total in jected vo lum e. The to tal volum e of drilling fluid in jected
before shu tting -in th e pum p and a fte r frac tu rin g th e form ation
m u s t be en te red in to th e program . During th e sim ulation process
th is va lue tells th e program w hen to stop s im ulating th e frac tu re
expansion and s ta r t sim ulating th e pressure-decline period. About
R e p ro d u c e d with p e rm iss io n of th e co p y rig h t o w n er. F u rth e r re p ro d u c tio n p ro h ib ited w ithou t p e rm iss io n .

1 4 8
p ressure h as been reached. In th e exam ple well, 2 bbl of m ud will
be in jected a f te r th e form ation h as been frac tu red .
Pressure-decline period. A fter th e p um p is stopped, th e well should
be kept closed, and p ressure and tim e should be recorded un til th e
pressure falls to th e fractu re-closure pressure. Som etim es th is point
is indicated b y a break in th e r a te of decline. In a n y case, the
pressure during th e decline period should be recorded so th a t
p a ram e te rs affecting th e pressure decline r a te can be estim ated by a
h is to ry m atch ing technique using th e com puter model.
Drilling fluid. The drilling-fluid p roperties can be determ ined from
th e m ud p rogram planned for th e well or b y d irect m easu rem en t.
D irectly m easuring th e m ud properties is preferable. However, m ud
properties can be m easured only im m ed ia te ly before th e te st begins.
In th e p resen t exam ple, th e well is a lread y drilled, and th e m ud
properties w ere m easured im m ed ia te ly before th e te s t s ta rted . They
appear on th e ou tp u t m enu shown in Figure 43. The m ost im p o rtan t
in p u t d a ta th e model uses a re show n on th e o u tp u t in Figure 43.
Flow ra te selection. Initially, th e selection of flow ra te should be
based on pum p lim itations, m ud vo lum e in th e hole, and open-hole
conditions. N orm ally, th e flow r a te for a leak-off te s t should fall in
th e range of 0.25-1.50 bbl/m in . The range for v e ry sh o rt open-hole
sections th a t do n o t expose a n y sandstone fo rm ations should be
0.25-0.50 bbl/m in. If sandstone fo rm ations a re presen t, th e range
should be 0.75-1.50 bbl/m in, depending on th e length of th e open-hole
section. Also, th e to tal tim e of th e te s t should be considered. For
low flow ra te s and g rea t m ud volum e in th e hole, th e te s t will take longer th a n for high flow ra tes .
R e p ro d u c e d with p e rm iss io n of th e co p y rig h t o w n er. F u rth e r re p ro d u c tio n p ro h ib ited w ithou t p e rm iss io n .
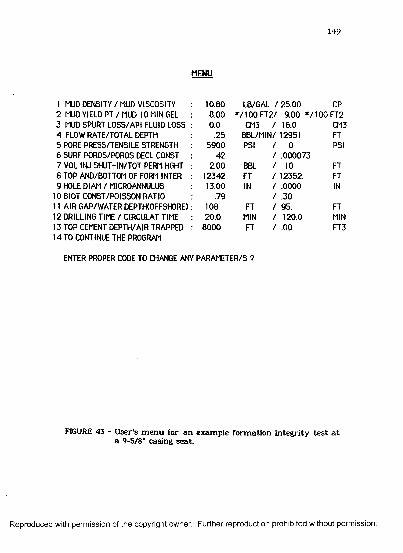
1 4 9
MENU
1 MUD DENSITY / MUD VISCOSITY 10.80 LB/GAL / 25.00 CP2 MUD YIELD PT / MUD 10 MIN GEL 8.00 */IO O F T 2 / 9.00 * /1 0 0 FT23 MUD SPURT LOSS/API FLUID LOSS 0.0 CM3 / 16.0 CM34 FLOW RATE/TOTAL DEPTH .25 BBL/MIN/ 12951 FT5 PORE PRESS/TENSILE STRENGTH 5900 PSI / 0 PSI6 SURF POROS/POROS DECL CONST .42 / .0000737 VOL INJ SHUT-IN/TOT PERM HGHT 2.00 BBL / 10 FT8 TOP AND/BOTTOM OF FORM INTER 12342 FT / 12352. FT9 HOLE DIAM / MICROANNULUS 13.00 IN / .0000 IN
10 BIOT CONST/POISSON RATIO .79 / .3011 AIR GAP/WATER DEPTH(OFFSHORE) 108 FT / 95. FT12 DRILLING TIME / CIRCULAT TIME 20.0 MIN / 120.0 MIN13 TOP CEMENT DEPTH/AIR TRAPPED 8000 FT / .00 FT314 TO CONTINUE THE PROGRAM
ENTER PROPER CODE TO CHANGE ANY PARAMETER/S ?
FIGURE 43 - U ser's m en u for a n exam ple fo rm ation in teg rity te s t a t a 9-5/8" casing seat.
R e p ro d u c e d with p e rm iss io n of th e co p y rig h t o w n er. F u rth e r re p ro d u c tio n p ro h ib ited w ithou t p e rm iss io n .

1 5 0
In th e example, th e open-hole section is v e ry sh o rt (10 ft), and
only shale is present; therefore, th e initial flow ra te chosen is 0.25
bbl/m in .
Expected cu rv e . All th e inform ation described above is n ex t en tered
in to th e com puter model. The p rogram ou tp u t is th e expected pum p
pressure versu s tim e cu rve for th e leak-off test. This cu rv e is shown
in Figure 44, along w ith o th e r im p o rtan t inpu t and ou tpu t p aram ete rs .
The prediction show n in Figure 44 of th e tim e needed to reach
breakdow n pressure is approx im ately 32 m in or a to tal of 8 bbl
in jected a t 0.25 bbl/m in. Increasing th e flow ra te to 0.50 bbl/m in
(Figure 45) will reduce th e tim e to approx im ately 16 m in. The
increase in flow ra te reduce th e to tal tim e of th e te s t and increase
th e m ax im um frac tu re w id th and length.
Test Procedures
1. A fter th e cem ent and float equ ipm ent a re drilled, a ratho le
should be drilled 10 f t below th e casing seat. If geologic
inform ation indicates th a t a fo rm ation w eaker th a n those
exposed is p resen t w ith in close range, th e n th is form ation
should be drilled th rough and th e te s t repeated .
2. A fter th e ra tho le is drilled, th e b it should be positioned in
th e casing im m ediately above th e shoe to reduce th e risk of th e drill pipe becoming stuck during th e te st.
R e p ro d u c e d with p e rm is s io n of th e co p y rig h t ow ner. F u rth e r re p ro d u c tio n p ro h ib ited w ithou t p e rm iss io n .

» M
l fff
SSJR
E
151
L E R K -O F F TE S T .
El 215 Q-l
2 0 .00ZNJ.
FLOW FmTE =API LOSS B R if t TftRP = p a i s a p a t = CEM DEPTH = rcrrn nerrr =FSAC: PRES a
0 m CHRN5E
3 0 .0 0 4 0 . 0 0 ITIME tn iN l
-0 0 FT5
a a a a . p a
INPUT/OUTPUT PftEflHETERS
HUD DEHSIIY = 10.80 LB/GflLFLOIsI RATE = .25 BPtlPOSE PRESSURE = 9.20 LB/GflLCSS SHOE DEPTH = 12941. FT SECT FRfiC : 12342.- 12352. FT FRfiC GRflD EXP = 16.76 LB/GfiL FRfiC PRESS SURF = 1936.5 PSI VOL IHJ SHUT-IH = 11.40 BBLFRflCT HEIGHT = 10.88 FTFRflCT WIDTH = .84437 IHFRflCT LENGTH = 235.4 FT
FIGURE 4 4 - Expected p ressu re versu s tim e cu rv e for th e flow ra te in th e exam ple leak-off te st design a t 0.25 BPM.
R e p ro d u c e d w ith p e rm is s io n of th e co p y rig h t ow ner. F u rth e r re p ro d u c tio n p ro h ib ited w ithou t p e rm iss io n .
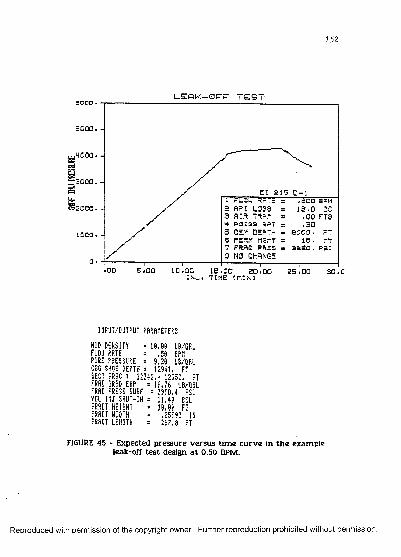
SIPF
IMJ
PTOS
UKE
1 5 2
El a 15 D -i1 FLOW RRTe £ A PI LOSS 3 f t l f t TRAP
5 OEM DEPTH c r a w nerrr7 FR flC P R E S 0 NO CHANGE0 .
.00 5 . 0 0 1 0 . 0 0 1 5 .0 0 2 0 . 0 0TIME CHIN 3
3 0 . C
INPUT/OUTPUT PflRflMETESS
HUD DENSITY = 10.88 LB/GflL FLO# RATE = .50 BPHPOPE PRESSURE = 9.20 LB/GflL CSG SHOE DEPTH = 12941. FT SECT FRfiC : 12342.- 12352. FT FRfiC GRfiD EXP = 16.76 LB/GfiL FRfiC PRESS SURF = 3950.4 PSI VOL INJ SHUT-IN = 11.48 BBLFRflCT HEIGHT = 10.88 FTFRfiCT WIDTH = .85392 INFRflCT LENGTH = 297.0 FT
FIGURE 45 - Expected p ressure v ersu s tim e cu rv e in th e exam ple leak-off te s t design a t 0.50 BPM.
R e p ro d u c e d w ith p e rm is s io n of th e c o p y rig h t o w n er. F u rth e r re p ro d u c tio n p ro h ib ited w ithou t p e rm iss io n .
1 5 3
3. The well should be circu lated using th e m u d p um p un til th e
m u d density re tu rn in g from th e an n u lu s is th e sam e as th e
m ud density being pum ped down th e drill pipe. The drilled
cuttings or a n y in jected slugs should be circulated to th e
surface.
4. The sm aller cem enting pum p, r a th e r th a n th e m u d pum p,
should be used to conduct th e leak-off te st. A fter switching
to th e cem enting pum p, circu late f irs t th rough th e bypass in
th e standpipe m anifold to rem ove a ir from th e pum p piping.
5. W hen th e hole is full of m ud, a blow out p rev en te r should be
closed above th e drilling spool.
6. R etu rns th rough th e choke m anifold should be circulated
dow n th e drill pipe to rem ove a n y a ir trapped below th e
an n u la r p rev en te r and in th e choke manifold.
7. The p um p r a te should be se t a t th e desired value for th e
te st. A r a te of 0.25 bb l/m in w as used in th e exam ple test.
8. The choke should be closed and th e stroke coun ter an d tim er reset.
9. Pum ping dow n th e drill pipe should continue a t a constan t
pum p r a te and bo th drill pipe and choke p ressu re recorded as a function of tim e o r volum e injected.
R e p ro d u c e d with p e rm iss io n of th e co p y rig h t o w n er. F u rth e r re p ro d u c tio n p ro h ib ited w ithou t p e rm iss io n .
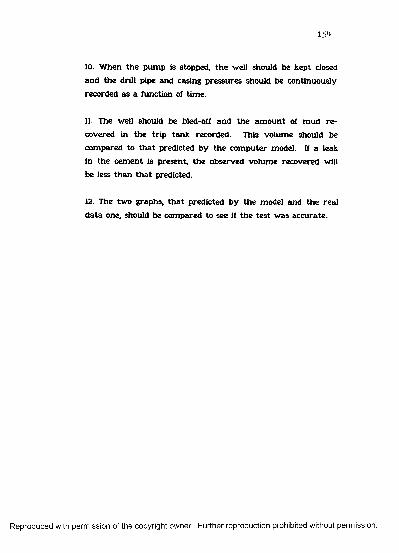
1 5 ^
10. W hen th e pum p is stopped, th e well should be kept closed
and th e drill pipe and casing pressures should be continuously
recorded as a function of tim e.
11. The well should be bled-off and th e am o u n t of m ud re
covered in th e tr ip ta n k recorded. This volum e should be
com pared to th a t predicted b y th e com puter model. If a leak
in th e cem ent is present, th e observed volum e recovered will
be less th a n th a t predicted.
12. The tw o graphs, th a t predicted b y th e model and th e rea l
d a ta one, should be com pared to see if th e te s t w as accurate .
R e p ro d u c e d with p e rm iss io n of th e co p y rig h t ow ner. F u rth e r re p ro d u c tio n p roh ib ited w ithou t p e rm iss io n .
VERIFICATION OF COMPUTER MODEL USING FIELD DATA
This chap ter explains how th e model has been verified w ith
field d a ta from wells drilled offshore of th e Louisiana Gulf Coast. All
d a ta w ere generously furn ished b y th e offshore division of Tenneco
Oil Company. Data from four wells w ere used to v erify th e p ressure
response predicted by th e com puter model. Data from an additional
e ight wells w ere used to provide some of th e needed inform ation
concerning sedim ent density , lithology, porosity, bulk shear modulus,
etc. W hen these d a ta w ere unavailable for a well, average values
for th e a rea w ere used.
Once th e p aram ete rs necessary to ru n th e com puter model
w ere all defined, th e y w ere en tered in to th e model. The ou tp u t
produced by th e model Includes th e sim ulated leak-off pressure
cu rv e and a plot of th e observed p ressure d a ta points. The predicted
cu rv e and th e field d a ta points plotted w ere th e n checked for a
m a tch . A fter a m a tch w as obtained, th e f rac tu re pressure and
fra c tu re dim ensions w ere com puted and a su m m a ry of the
calculated resu lts prin ted . This in te rp re ta tio n procedure w as
au tom atica lly perform ed b y th e com puter model.
W hen th e curves did no t m atch , th e p a ram e te rs th a t could be
causing th e m ism atch w ere varied over a range of values considered
no rm al for those p a ram e te rs in an effort to m a tch th e observed
da ta . Once a m a tch of th e tw o curves w ere obtained, th is process w as stopped, and th e resu lts w ere prin ted .
155
R e p ro d u c e d w ith p e rm is s io n of th e c o p y rig h t ow n e r. F u rth e r re p ro d u c tio n p ro h ib ited w ithou t p e rm iss io n .
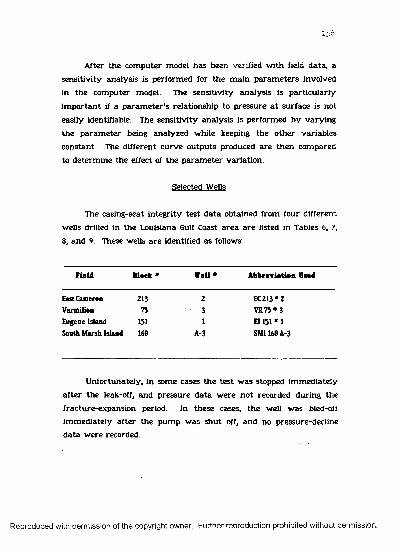
156
A fter th e com puter model has been verified w ith field d ata , a
sensitiv ity analysis is perform ed for th e m a in p a ram e te rs involved
in th e com puter model. The sensitiv ity analysis is p a rticu la rly
im p o rtan t if a p a ra m e te r 's relationship to p ressu re a t su rface is not
easily identifiable. The sensitiv ity analysis is perform ed b y v ary in g
th e p a ram e te r being ana lyzed w hile keeping th e o the r variab les
constant. The different cu rve ou tpu ts produced a re th e n com pared
to determ ine th e effect of th e p a ram e te r variation .
Selected Wells
The casing-seat in teg rity te s t d a ta obtained from four d ifferent
wells drilled in th e Louisiana Gulf Coast a re a a re listed in Tables 6, 7,
8, and 9. These wells a re identified as follows:
F ield B lock * T e l l * A b b r e r ia t io n U sed
East Cameron 213 2 EC 213*2Vermilion 75 3 VR75 * 3Eugene Island 151 1 El 151 * 1South Marsh Island 160 A-3 SMI 160 A-3
U nfortunately , in some cases th e te st w as stopped im m ediately
a f te r th e leak-off, and p ressure d a ta w ere no t recorded during th e
fracture-expansion period. In these cases, th e well w as bled-off
im m ediately a fte r th e pum p w as sh u t off, and no pressure-decllne d a ta w ere recorded.
R e p ro d u c e d w ith p e rm is s io n of th e c o p y rig h t o w n e r. F u rth e r re p ro d u c tio n p ro h ib ited w ithou t p e rm iss io n .

1 5 7
TABLE6
1- T)riHinff Fluid
Well Lut Mod Plastic Yield 10 Min AM Stolid* Oil Flev Drtg Circul.Ideatir. CSG Density Viscosity Point GEL Fluid Lou Concent Goocent Rate Tim Tim
(>) (Ib/gt!) (CP) (LBF/100ft2)(LBF/100ft2) <c«3) (X) (X) (BPM)(MIN) (MIN)
EC 213*2 1 11.8 27.0 12.0 6.00 2.8 19 2 0.30 60. 0.
VR7V3 S 9.5 9.0 25.0 44.00 20.0 8 0 0.25 60. 60.
El 131 *1 1 10.1 10.0 6.0 3.00 36 10 0 0.25 30. 30.
SMI-160-A3 S 9.6 7.0 13.0 150 20.2 8 0 0.30 30. 180.
R e p ro d u c e d with p e rm iss io n of th e co p y rig h t o w n er. F u rth e r re p ro d u c tio n p ro h ib ited w ithou t p erm iss io n .

1 5 8
TABLE7
2-xsufifigjaga
Lut CASING (Top) CASING (Bsttoa) Total Water Alt TopCeaent ShoeCSG OD ID Laogtb OD ID Leafth Depth Depth GPA Depth Depth(*) (lo.) (In.) (ft) (ia) (ia) (ft) (ft) (ft) (ft) (ft) MD/TVD
(ft)
EC 213*2 1 95/S 8.535 7884. 7944 111. 201. 78847884
VI75 #3 S 13 3/8 12.347 4510. 4564 21. 201. 222 45104554 4500
1151*1 I 95/8 8.535 14284. - 14351 280. 116. 12000 14284
SMI-160-A3 S 13 3/8 12.347 5166. 5228 280. 201. 312 5166 4828 4175
(*) S - surface I - InterBMdiary L- liner
R e p ro d u c e d with p e rm is s io n of th e co p y rig h t ow ner. F u rth e r re p ro d u c tio n p roh ib ited w ithou t p e rm iss io n .

WellIdeotif.
Last DRILL PIPES HEAVY-WEGKTDP DRILL COLLARS CSC OD ID Leafth OD ID Length OD ID Length (*) On.) (in.) (ft) (le) (la) (It) (ia) (ia) (ft)
BitDins(ia)
JettSise
(32nd.in)
BitDepth
(ft)
EC 213 *2 1 3 3.750 6377. 3 3 420 61/2 2.813 1087. 8 1/2 14 14 14 7884
VB 75 *3 S 4 1/2 3.286 2447. 41/2 2.730 917 8 2.812 1146. 121/4 15 15 15 4510
El 131 *1 1 5 3.750 12064. 5 3 882 9 2.813 1338. 81/2 12 12 II 14284
SMI-160-A3 S 4 1/2 3.286 3078 41/2 2.730 912 7 3/4 3.0 1238. 121/4 16 16 16 5166
(*) S-surface I - intersMdiary L-liner
R e p ro d u c e d w ith p e rm iss io n of th e co p y rig h t ow ner. F u rth e r re p ro d u c tio n p ro h ib ited w ithou t p erm iss io n .

160
TABLE9
4 - Qpen-holcfomMioft frfr.
WallIdentification
LastC8G(*)
FORMATION TESTED OR BEING TESTED TVD TOP TVD BOTTOM TYPE PORE PRESS.
(FT) (FT) (LB/GAL)
OPEN-HOLE TEMPERATURE TOTAL PERM.
CF) HEIGHT (FT)
EC 213*2 I 7884. 7915- Shat# "SOtSum ' 20* 9.40 157 31.0
VR 75 *3 S 4510. 4520. Shatysum 9.40 125 54.0(»)
El 151*1 1 14284. 14351. Shale 9.60 256 67.0
SMI-160-A3 s 4775. 4805 Shale-Gtmbo 8.95 127 0.
(•) Not coofirMd
R e p ro d u c e d with p e rm is s io n of th e co p y rig h t ow ner. F u rth e r re p ro d u c tio n p ro h ib ited w ithou t p e rm iss io n .
l 6 l
C om putation of th e calculated p a ra m e te rs en tered into th e
m odel is explained in th e following section for all th e wells tested.
The d a ta listed in Tables 6, 7, 8, and 9, along w ith th e calculated
p aram ete rs, w ere in pu t in to th e m odel using th e d a ta file
organization described in Appendix F.
Cpmp u t ed_Ea ra m e te rs
The p a ram e te rs th a t m u s t be com puted before th e y can be
en te red in to th e model a re Biot's constan t, Poisson's ratio , surface
porosity , porosity-decline constan t, and Young's m odulus.
Biot's Constant
Biot’s constant, w hich genera lly v aries from 0.7 to 0.9, is used
on ly w hen th e frac tu ring fluid is of th e p ene tra ting type . As
discussed earlier, drilling m uds a re designed to be nonpene tra ting
fluids; therefore, th e model doesn 't use Biot's constan t for drilling m uds.
Edison'? Ratio
Poisson's ra tio is calculated w ith Equation (53) as a function of
depth . The dep th to be used is th e average tru e v ertica l dep th
betw een th e top and th e bottom of th e fo rm ation to be frac tu red .
This dep th inform ation is obtained b y looking for th e w eakest
fo rm ation exposed in th e open-hole section. These depths a re given
in Table 9, and th e com puted Poisson’s ra tio s a re listed in Table 10.
R e p ro d u c e d with p e rm iss io n of th e co p y rig h t o w n er. F u rth e r re p ro d u c tio n p ro h ib ited w ithou t p erm iss io n .

162
WELLIDENTIFICATION
(Dj) DEPTH OF INTEREST
(ft)
(M>POISSON'S
RATIOSURFACEPOROSITY
<K) POROSITY DECLINE (Cons tut)
(E) YOUNGS MODULUS (psi x 106)
EC 213 *2 7890. 0.29 0.415 0.0000886 2.100
VI75 *3 4515. 0.26 0.415 0.0000886 1.452
El 151 #1 14318. 0.31 0.420 0.0000731 3.000
SMI-160-A3 5170. 0.24 0.415 0.0000886 1.460
R e p ro d u c e d with p e rm is s io n of th e co p y rig h t ow ner. F u rth e r re p ro d u c tio n p roh ib ited w ithou t p e rm iss io n .

1 6 3
Surface Porosity and th e Porositv-Decline Constant
The surface porosity 0O , and porosity-decline constan t, K, a re
obtained b y th e procedure explained in Appendix B and exemplified
in th e preceding chap ter. The values of 0O an d K a re obtained for
th e well El 215 D-l w as also used for th e w ell El 151 *1 since no logs
a re available for th is well. This w as felt to be a reasonable
assum ption because bo th wells w ere in th e sam e general area .
The sonic log available for th e well VR 75 #3 provided th e d a ta
on in te rv a l t ra n s i t tim e v ersu s depth in te rv a l given in Table 11. The
corresponding porosities w ere calculated using Equation (116) and a re
plotted as a function of dep th in Figure 46. The values of 0O an d K
a re listed in Table 10. Since no logs a re available for th e well EC 213
#2, th e values of 0O and K w ere assum ed to be equal to those of th e
well VR 75 #3.
Young's M odulus
To calculate Young's m odulus w ith Equation (85), th e engineer
m u s t know th e bulk density , in te rv a l tra n s i t tim e, and Poisson's
ra tio a t th e dep th of in teres t. The values of Poisson's ra tio for each
well a re listed in Table 10. The in te rv a l tra n s i t tim e for th e well VR
75 *3 is given in Table 11; th e bulk density w as obtained b y
com bining Equations (116) and (B.3) from Appendix B. For th e well El
151 #1, th e v alue of bulk density w as obtained from th e density log
an d in te rv a l tra n sit tim e from th e sonic log of th e well El 215 D-l.
The Young’s m odulus for th e well SMI 160 A-3 w as calculated using
R e p ro d u c e d with p e rm iss io n of th e co p y rig h t o w n er. F u rth e r re p ro d u c tio n p ro h ib ited w ithou t p e rm iss io n .

16 4
TABLE 11
DEPTHINTERVAL
(ft)
INTERVALTRANSITTIME
JIMC/ft
POROSITY DEPTHINTERVAL
(ft)
INTERVAL TRANSIT TIME
ji Me/ft
POROS1
6600-6700 117.4 0.226 9300- 9500 104.7 0.1786700-6800 113.2 0.210 9500- 9700 102.0 0.1696800-6900 118.0 0.229 9700- 9900 102.5 0.1716900-7100 117.3 0.226 9900-10100 100.3 0.1637100-7300 115.8 0.220 10100-10300 102.2 0.1707300-7500 114.8 0.216 10300-10500 97.5 0.1537500-7700 111.6 0.204 10500-10700 97.5 0.1547700-7900 113.1 0.210 10700-10900 101.5 0.1667900-8100 111.0 0.202 10900-11100 101.0 0.1668100-8300 109.3 0.196 11100-11300 95.8 0.1478300-8500 107.5 0.189 11300-11500 95.5 0.1468500-8700 110.1 0.199 11500-11700 103.5 0.1748700-8900 105.6 0.182 11700-11900 103.3 0.1738900-9100 107.4 0.188 11900-12100 108.6 0.1889100-9300 107.3 0.188 12100-12300 100.8 0.165
12300-12500 98.6 0.15712500-12700 100.9 0.16612700-12900 108.5 0.19312900-13100 114.0 0.21213100-13300 125.7 0.25913300-13500 132.1 0.285
R e p ro d u c e d with p e rm iss io n of th e co p y rig h t ow ner. F u rth e r re p ro d u c tio n p roh ib ited w ithou t p e rm iss io n .
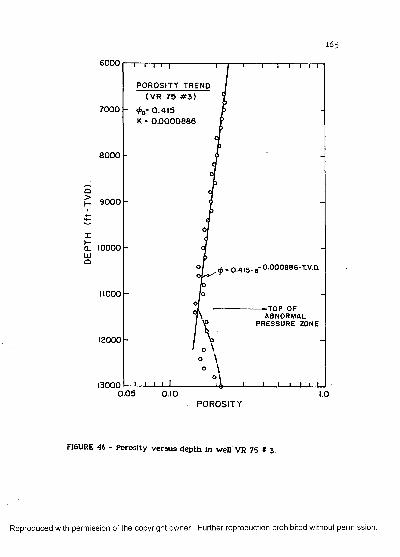
1 6 5
600 0
POROSITY TREND(V R 75 # 3 )
<f>o= 0 .415 K = 0 .0 0 0 0 8 8 6
7000
8 0 0 0
H 9 0 0 0
CL 1 0 0 0 0
= 0 .4 1 5 - e " 0 0 0 0 8 8 6 *TV D -
11000
— T O P O F A B N O R M A L
P R E S S U R E ZO N E
12000
130000.05 0.10 1.0
POROSITY
FIGURE 46 - Porosity v e rsu s dep th in well VR 75 * 3 .
R e p ro d u c e d with p e rm iss io n of th e co p y rig h t o w n er. F u rth e r re p ro d u c tio n p ro h ib ited w ithou t p e rm iss io n .

166
th e available log inform ation from th e well VR 75 *3. Table 10
sum m arizes th e Young's m odulus calculated for each well.
Field Data Analysis
The resu lts of th e field d a ta ana lysis perform ed using th e
com puter model a re com pared to th e observed pu m p p ressure
response for each well. In th e o u tpu ts presented, th e solid line
rep resen ts th e cu rv e sim ulated b y th e model an d will be re fe rred to
as th e "predicted curve"; asterisks rep resen t th e cu rve based on th e
field d a ta points, w hich will be referred to as th e "field d a ta curve."
.W-glL£C.2i? #2
The com puter model w as ru n using th e available d a ta for th is
well to produce th e ou tp u t show n as RUN * 1. The llthology
info rm ation available for th e open-hole section of th is well, 7884-7944
ft, Is show n in Figure 47. It indicates th a t th e section is
p redom inan tly composed of shale. Since th e fo rm ation h as a high
shale content, th e tensile stren g th w as considered in itia lly 350 psi.
In addition, because of th e plastic behavior of th is unconsolidated
shale, th e borehole is expected to expand, and th is expansion w as
accounted for in RUN * 1.
Data obtained from th e drilling-m orning rep o rt indicate th a t
th e w ell h ad no t been circulated before th e te s t (Table 6). Therefore,
th e p ressu re necessary to b reak th e gel w as considered m ore
rep resen ta tiv e of p ressure losses th a n th e p ressu re losses due to flow.
However, a n exam ination of th e stra igh t-line tre n d seem s to indicate
t h a t a m u ch higher pressu re w as necessary to b reak th e m u d gel,
R e p ro d u c e d with p e rm iss io n of th e co p y rig h t ow ner. F u rth e r re p ro d u c tio n p ro h ib ited w ithou t p e rm iss io n .

167
nn i iiurf
Shale
S M I - I6 0 -A 3 E I - I 5 I m (*)
( * ) B a se d on o f f - s e t w ells. Lithology log n o t a v a ila b le .
FIGURE 47 - Lithology inform ation for w ell used in exam ple leak-off te s t design.
R e p ro d u c e d with p e rm iss io n of th e co p y rig h t o w n er. F u rth e r re p ro d u c tio n p ro h ib ited w ithou t p e rm iss io n .
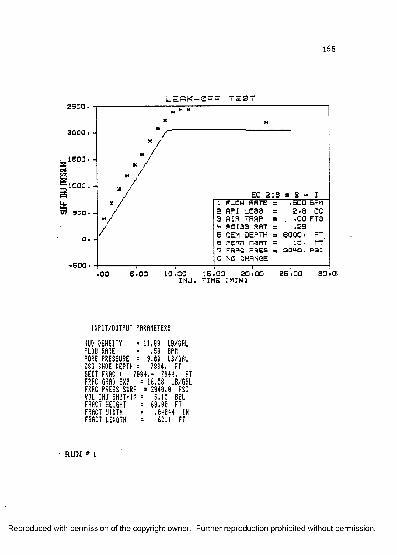
SUFF
m ft
tSSUR
E168
L E S K - Q F r T E S T
K M
/* /
" /* /m /
X /j EC 2 1 3 * 2 - I* / 1 FLOW RH7E = . s a a SFM/ s R PI L 0 8 9 = 2 . 8 CC
3 ft l f t TRAP = . .0 0 FT9/ «4 p f l i a a r a t = .2 5/ 5 CEM DEPTH = 8 0 0 0 • FT
0 r a w n s r r r = 1 3 - TT7 FRAC PRES = 2QM-a . P S I0 NO CHANGE
1 1 1 1 1--------------•0 0 5 <00 1 0 .0 0 1 5 .0 0 2 0 . 0 0 2 5 .0 0 3 0 .0 1
INPUT/OUTPUT PfiRflPIETERS
HUD DEH8ITV =11.80 LB/GRLFLOW RRIE = .50 mPORE PRESSURE = 9.80 LB/GfiLCSG SHOE DEPTH = 7884. FTSECT FRfiC s 7884.- 7944. FT FRfiC GRfiD EXP = 16.58 LB/GftL FRfiC PRESS SURF = 2848.8 PSI VOL INJ SHUT-IN = 6.15 BBLFRfiCT HEIGHT = 68.00 FT FRftCT WIDTH = .84344 IHFRfiCT LENGTH = 62.1 FT
RUN * 1
R e p ro d u c e d with p e rm iss io n of th e co p y rig h t o w n er. F u rth e r re p ro d u c tio n p ro h ib ited w ithou t p e rm iss io n .

169
w hich suggests th a t th e gel s tren g th should hav e been m uch h igher
th a n th a t reported 6 lbf/100 ft2 . A nother significant m ism atch
occurs on th e fracture-expansion portion of th e tw o curves. The
p redicted cu rve has a fla t shape during th e frac tu re expansion,
w hereas th e field d a ta cu rve has a well-defined cu rv a tu re . The fla t
shape occurs only w hen th e fluid loss ra te th rough th e frac tu re
walls is high, or th e frac tu re is of g rea t height. A high fluid loss ra te
is no t possible because th e form ation is p ractica lly im perm eable, and
consequently, th e frac tu re height in itia lly assum ed, 60 ft, should be
m uch sm aller.
The frac tu re height w as reduced to 15 ft, w hich corresponds to
th e height of a section exactly below th e casing sea t th a t has th e
h ighest sand content in th e open-hole section, approx im ately 30
percent, as shown in Figure 47. In fact, because of th e high sand
content, th is section should be th e w eakest one exposed. The effects
of th e changes discussed above a re shown in RUN * 2. The curves
show a good m atch , especially in th e fracture-expansion portion of th e curve. Interestingly, f rac tu re pressures w ere m atched w ithou t
a n y variab le being changed specifically for th is purpose. In addition,
th e on ly field d a ta point recorded during th e pressure-decline period
falls exactly on th e predicted pressure-decline line. This indicates th e
correctness of th e fluid-loss coefficient an d perm eable height en tered
in to th e model.
The frac tu re p ressure obtained is 2293 psi, w hich corresponds to th e frac tu re gradient of 16.58 lb/gal. The frac tu re geom etry , a fte r
th e injection of approxim ately 6.15 bbl of drilling m ud, appears on
th e o u tp u t plot RUN * 2 along w ith o th e r im p o rtan t inform ation.
R e p ro d u c e d with p e rm iss io n of th e co p y rig h t ow ner. F u rth e r re p ro d u c tio n p roh ib ited w ithou t p e rm iss io n .

170
L E A K - 0 F P
i« 1 0 0 0 • -
BOO ■ .
//
EC 2 1 3 * 2 - I1 FLOW RATE = .EDO BPM2 API LOSS = 2 - 8 CC3 AIR TRAP = - 0 0 FTS4 P 0 I S 3 RAT = .S 35 CEM DEPTH = 6 0 0 0 . FT o rcrtn marrr = ia . rrn FRAC PRE9 = 2 9 9 9 . P 9 I 0 NO CHANGE
10.00 IN J •
15.00 20 .00TIME (M IN I
25 .00
INPUT/OUTPUT PARAMETERS
MUD DENSITY = 11.80 LB/'GAL FLOW RATE = .50 8PMPORE PRESSURE = 9.03 LB/GAL CSG SHOE DEPTH = 7884. FTSECT FRAC s 7884.- 7899. FT FRftC GRAD ESP = 18.58 LB/GftL FRAC PRESS SURF = 2293.2 PSI VOL IHJ SHUT-IN = 6.15 BBLFRACT HEIGHT = 15.80 FT FRACT WIDTH = .85508 INFRACT LENGTH = 213.9 FT
RUN # 2
R e p ro d u c e d w ith p e rm is s io n of th e c o p y rig h t o w n er. F u rth e r re p ro d u c tio n p ro h ib ited w ith o u t p e rm iss io n .
171
Well El 151 * 1
Field d a ta w ere ana lyzed w ith th e com puter model to produce
th e cu rve m a tch show n as RUN * 3. At th e beginning of th e te st
th e field d a ta cu rv e shows a slight cu rv a tu re , w hich suggests th a t
som e a ir w as trapped in th e sy stem during th e test. This portion of
th e cu rve w as m atched b y th e predicted cu rve w hen a volum e of 1.5
f t3 of a ir w as en tered as trapped in th e sy stem . Lithology
inform ation for th e open-hole section indicates th e presence of
unconsolidated shale of th e ty p e show n in th e field a s shale gumbo.
This ty p e of form ation is characte rized b y a plastic behavior, w hich
is confirm ed in RUN * 3 b y th e m a tch obtained on th e straigh t-line
portion of th e cu rve. This m a tch w as obtained w hen th e borehole
expansion due to plastic fo rm ations in th e model w as considered.
However, th e upper p a r t of th e field d a ta cu rv e could no t be
m atched . The predicted cu rv e show n in RUN * 3 w as obtained w hen
Poisson's ra tio w as decreased from 0.30 to 0.28. Poisson's ra tio could
hav e been decreased un til th e f rac tu re p ressures m atched. But a
Poisson's ra tio low er th a n 0.28 would be ou t of th e com m on range
for th e a re a and depth being considered. The cu rves indicate th a t
th e upper field d a ta points do no t follow th e stra igh t-line tre n d of
th e predicted curve, b u t d ep a rt from it a t abou t 3500 psi. The fact
th a t th is p ressu re could not be m atched by v a ry in g th e p a ram e te rs
over a reasonable range suggests th a t a leak in th e cem ent occurred
and th a t m ore shallow, w eaker fo rm ations m igh t h av e been
frac tu red b y m ud channeling th rough th e cem ent.
R e p ro d u c e d with p e rm is s io n of th e co p y rig h t ow ner. F u rth e r re p ro d u c tio n p roh ib ited w ithou t p e rm iss io n .

1 7 2
LERK-OFF TEST
;300Q
1 FLDU RHTE = . 2 5 0 BFMa RPI U.3 R if t “ = 1 - 5 0 FT5
5 CEM DEPTH = iaO G O . FT1000.7 FftflC P R E S 0 NO CHANGE
Q..0 so . a g o .a so .a 100.1
INPUT/OUTPUT PARAMETERS
HUD DENSITY = 10.19 LB/GALFLOU RATE = .25 BPHPORE PRESSURE = 9.55 LB/GALCSG SHOE DEPTH = 14284. FT SECT FRfiC s 14284.- 14351. FT FRfiC GRfiD EXP = 16.44 LB/GftL FRfiC PRESS SURF = 4729.4 PSI VOL INJ SHUT-IN = 16.10 BBL FRfiCT HEIGHT = 67.08 FT FRfiCT WIDTH = .02888 1HFRfiCT LENGTH = 29.3 FT
RUN # 3
R e p ro d u c e d with p e rm iss io n of th e co p y rig h t ow ner. F u rth e r re p ro d u c tio n p roh ib ited w ithou t p e rm iss io n .
1 7 3
Well VR 75 * 3
The cu rve m a tch obtained betw een th e predicted p ressure
cu rve and th e field d a ta cu rve is shown in RUN * 4. The lithology
inform ation available for th is well indicates th a t th e open-hole
section is composed of shaly-sand. The in te rva ls from 4510 to 4520
f t an d from 4548 to 4564 f t show cleaner sands th a n occur in th e
re s t of th e in terval. The straigh t-line tre n d of th e pressure cu rve
w as m a tched b y adjusting for a n en largem ent of th e w ell-bore
section due to th e presence of plastic form ations. In th is case, a
portion of th e open hole section w as assum ed to h av e a high shale
con ten t w ith a tensile s treng th of 350 psi. This va lue lies w ith in th e
com m on range for shale (0-500 psi).
The frac tu re w as assum ed to occur in th e cleanest sand
s itua ted in th e in te rv a l between 4510 an d 4520 ft, rig h t below th e
casing seat. The good m atch obtained for th e fracture-expansion
portion of th e curve, approxim ately 19-22 m in, confirm s th e assum ption. The frac tu re pressure a t su rface in RUN * 4 is 1545 psi,
w hich corresponds to a frac tu re g radient of 15.85 lb/gal. O ther
im p o rtan t inform ation is also prin ted in RUN * 4.
WelLSMlJ_6^Ar3
RUN * 5 shows th e m a tch obtained for th e field d a ta of th e
well SMI 160 A-3. The m a tch w as obtained b y assum ing a frac tu re
height of 6 f t rig h t below th e casing seat. In addition, since th e
form ation is practica lly 100 percent shale gumbo, th e fluid loss to th e
form ation w as considered negligible an d th e API w a te r loss w as set
equal to 1 c n A The frac tu re p ressure obtained a t surface is 947 psi,
R e p ro d u c e d with p e rm iss io n of th e co p y rig h t o w n er. F u rth e r re p ro d u c tio n p ro h ib ited w ithou t p e rm iss io n .

surf
JNJ m
mi ? k
L E f l K - 0 F p T E S T
-5 0 0 .5 .0 0 1 0 . 0 0
ZNJ ■
VR 75 * 3Tusw rrte -
2 API LOSS =3 Rift TRAP = 4> p a ia a r a t = 5 GEM DEPTH s o rcrrn nsriT = n p ra c p r e s = 0 N0 CHANGE
rs sa a PM' £0-0 CC
• 00 FT9.3 50 . FT
10 . r t1545. P3I
- r -15 .00 2 0 .0 0
TIME CMINl
"T"25 .0 0 30.01
INPUT/OUTPUT PfiRAHETERS
M " : *% kS"LW H S ? , : ^ , . LTSECT FRfiC J 4510.- 4520. FTFRfiC GRAD EXP = 15.65 LB/GftLFRfiC PRESS SURF = 1544.9 PSIVOL in; shut- in = 5 . I 0 bbl FRfiCT HEIGHT = 18.00 FTFRfiCT IdlDTH = .02625 INFRfiCT LENGTH = 60.3 FT
RUN * 4
R e p ro d u c e d w ith p e rm iss io n of th e co p y rig h t ow ner. F u rth e r re p ro d u c tio n p ro h ib ited w ithou t p erm iss io n .
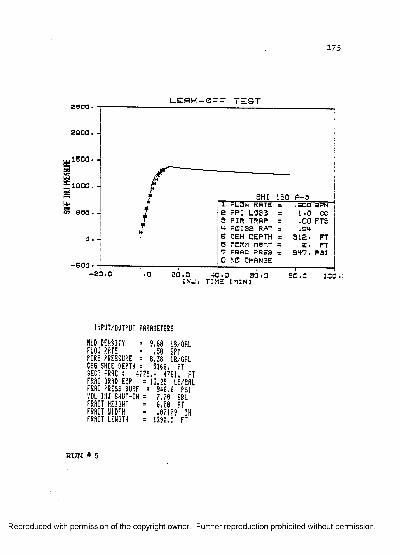
1 7 5
L E A K —0 F =
^ is q o .
-
r — — —s
-------------------
SMI 160 f i -Ss i FLOW RRTS = .EDO a PM
t 2 API LOSS = 1 .0 c c
t 3 f llf t TRFlP = -0 0 FT3
t 4- p a i s a r a t = .2 41 5 OEM DEPTH = 3 1 2 1 FT
0 p c r tn n s n T = Z - TT7 FRPiC PRE3 = 34-7 . p a i0 NO CHANGE
r2 0 . 0
I N J .<40 SO .O
TIME CMIN]
INPUT/OUTPUT PARAMETERS
HUD DENSITY = 9.69 LB/GALFLOW RATE = .59 BPtlPORE PRESSURE = 8.38 LB/GfiLCSG SHOE DEPTH = 5168. FTSECT FRfiC s 4775,- 4781. FT FRAC GRAD EXP = 13.25 LB/GALFRAC PRESS SURF = 946.6 PSIVOL INJ SHUT-IN = 7.70 BBLFRACT HEIGHT = 6.88 FTFRACT WIDTH = .07189 INFRACT LENGTH = 1290.3 FT
RUN * 5
R e p ro d u c e d with p e rm is s io n of th e co p y rig h t ow ner. F u rth e r re p ro d u c tio n p ro h ib ited w ithou t p e rm iss io n .
176
w hich corresponds to a f rac tu re grad ien t of 13.25 lb/gal. The frac tu re
w id th a t th e well bore is 0.07109 in. O ther inform ation is p rin ted in
th e ou tp u t RUN *5.
S.engMvitv Analysis .of._thg. -Model
The sensitiv ity analysis presented in th is section w as
perform ed w ith th e d a ta available from th e wells EC 213 * 2 and El
151 * 1. The effect of changing one variab le in th e com puter model,
w hile keeping th e o thers constant, will be discussed in th is section.
The m ain variab les included in th e sensitiv ity ana lysis a re (1) flow
ra te , (2) Poisson's ratio , (3) bulk shear m odulus, (4) frac tu re height, (5)
rock m echanics behavior, (6) pore pressure, (7) m ud viscosity, (8) well
d iam eter, (9) cem ent-top depth , (10) m icroannulus w idth , and (11) API
w a te r loss. O ther p a ram e te rs th a t affect th e p ressure behavior a t
surface during a leak-off te st a re also included in th e model. M ost of
these p aram ete rs a re included in the frac tu re geom etry of th e well,
m u d properties, and drill-string geom etry and the refo re a re know n
to a high degree of accuracy . A sensitiv ity ana ly sis w as perform ed
only for those p a ram e te rs th a t cannot be easily defined or selected.
Flow Rate
The effects of flow -rate changes on p ressure behavior a t
su rface a re shown in Figure 48. Increasing th e flow ra te causes th e
f rac tu re p ressure of th e form ation to be reached sooner, w hich
consequently increases th e slope of th e stra igh t-line trend . The
increase in flow ra te also causes an increase in p ressu re during
frac tu re expansion This is due to th e increase in p ressure drop in
R e p ro d u c e d with p e rm is s io n of th e co p y rig h t ow ner. F u rth e r re p ro d u c tio n p ro h ib ited w ithou t p e rm iss io n .
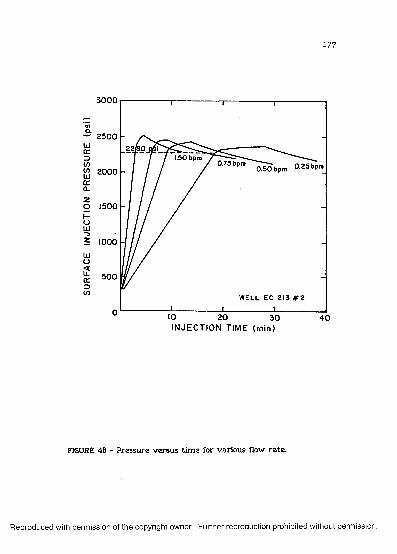
SURF
ACE
INJE
CTIO
N PR
ESSU
RE
(psi
)
177
3 0 0 0
2500
1.50 bpma75bP'" oSobpm 0.25bpm2000
1500
1000
500
WELL EC 213 # 2
0 0 20 INJECTION TIME (min)
30 40
FIGURE 48 - P ressure v ersu s tim e for various flow ra te .
R e p ro d u c e d w ith p e rm iss io n of th e co p y rig h t ow ner. F u rth e r re p ro d u c tio n p ro h ib ited w ithou t p erm iss io n .
17 8
th e frac tu re . The pressure-decline cu rve is also affected b y flow
ra te , as expected, since during th is period th e p um p is sh u t off.
Poisson's Ratio
Figure 49 shows how changing Poisson's ra tio affects th e
p ressure behavior of th e curve. F rac tu re p ressu re is v e ry sensitive
to varia tions in Poisson's ratio . An increase in Poisson's ra tio from
0.24 to 0.28 in th is exam ple causes th e fra c tu re p ressu re to increase
b y approx im ately 450 psi.
Equation (73) re la tes pressure during fra c tu re expansion to
Poisson's ratio . According to th a t equation, an increase in Poisson's
ra tio causes an increase in pressure. However, th is p ressu re increase
is sm all, a s show n b y th e plot in Figure 49. P ressure decline is not
v e ry sensitive to changes in Poisson's ratio ; according to Equation
(110), an increase in Poisson's ra tio causes a slight increase in th e ra te
of pressu re decline.
Bulk S hear M odulus
Equation (86) d irec tly re la tes th e bulk sh ear modulus to
Young's modulus. Thus, th e sensitiv ity ana ly ses a re th e sam e for
both param ete rs. Young's m odulus is re la ted to th e overall
com pressibility of th e sy stem through th e s tress -s tra in relations for
elastic, plastic, and elastic-plastic rock behavior. These relations a re
given in Appendix 6. An increase in Young's m odulus will cause a
decrease in s tra in in th e open-hole section. This decrease in s tra in is
tran sla ted into less expansion of th e borehole and consequently
R e p ro d u c e d with p e rm is s io n of th e co p y rig h t ow ner. F u rth e r re p ro d u c tio n p ro h ib ited w ithou t p e rm iss io n .

SURF
ACE
INJE
CTIO
N PR
ESSU
RE
(psi
)
1 7 9
3 000
2 5 0 0
2000
1500
1000
5 0 0
05 10 15 20INJECTION TIME (min)
FIGURE 49 - P ressure v ersu s tim e for various Poisson's ratio .
^660_psi
2120 psi
I622psi
WELL EC 213 t t 2
R e p ro d u c e d with p e rm iss io n of th e co p y rig h t ow ner. F u rth e r re p ro d u c tio n p roh ib ited w ithou t p e rm iss io n .
180
im plies a higher ra te of p ressu re increase before fra c tu re initiation
(Figure 50).
During frac tu re expansion, th e p ressu re is d irec tly re la ted to
th e bulk sh ea r modulus. However, in th e proposed model, th e
exponent of th e bulk shear m odulus is a lw ays less th a n 1. Therefore,
th e ra te of p ressu re increase is n o t v e ry sensitive to changes in th e
bulk sh ear m odulus.
On th e o the r hand, during th e pressure-decline period, p ressure
is v e ry sensitive to changes in th e bulk sh ear m odulus. The
exponent of th e bulk shear m odulus is 1 during th is period. Figure
50 shows how changing th e bulk sh ea r m odulus effects p ressure
behavior.
F rac tu re Height
The frac tu re height, h, n a tu ra lly does no t affect p ressure behavior before f rac tu re in itia tion or th e frac tu re -p ressu re value
itself. During frac tu re expansion, how ever, changes in frac tu re
height g rea tly affect pressu re behavior. Figure 51 shows th a t th is is
especially tru e w hen th e frac tu re height is sm all. During th e
pressure-decline period, th e ra tio betw een th e perm eable portion of
th e to ta l frac tu re height and th e fra c tu re height itself g rea tly
influences th e p ressure behavior of th e curve. In Figure 51, th e
perm eable height is fixed to equal 5 ft. As frac tu re height decreases,
th e ra tio betw een th e tw o heights increases, and consequently th e
pressu re declines faster. This can also be deduced b y exam ining
Equation (110).
R e p ro d u c e d with p e rm is s io n of th e co p y rig h t ow ner. F u rth e r re p ro d u c tio n p ro h ib ited w ithou t p e rm iss io n .
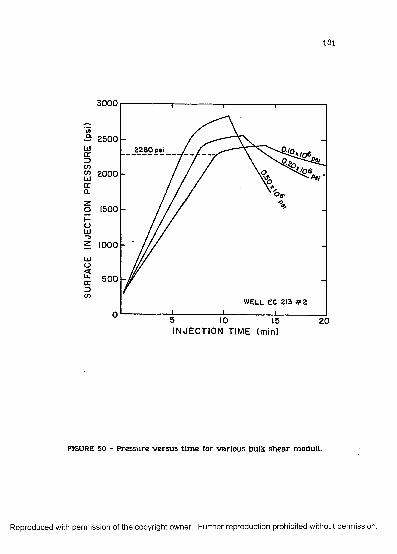
181
3 0 0 0
2 5 0 0_ 2280 psi
y> 2000
1500
1000
5 0 0
WELL EC 213 # 2
20INJECTION TIME (min)
FIGURE 50 - P ressure versu s tim e for various bulk sh ear moduli.
R e p ro d u c e d w ith p e rm iss io n of th e co p y rig h t ow ner. F u rth e r re p ro d u c tio n p ro h ib ited w ithou t p erm iss io n .

SURF
ACE
INJE
CTI
ON
PR
ESSU
RE
(psi
)
182
3 0 0 0
2 5 0 0
2000h = 5 ft
1500
1000
5 0 0
WELL EC 213 # 2
0 10 20 3 0 4 0INJECTION TIM E (min)
FIGURE 51 - P ressure versu s tim e lor different f rac tu re heights.
R e p ro d u c e d w ith p e rm is s io n of th e c o p y rig h t o w ner. F u rth e r re p ro d u c tio n p ro h ib ited w ithou t p e rm iss io n .

1 8 3
Borehole Expansion Model
Figure 52 shows th e effects of th e borehole expansion model on
surface injection p ressu re during a leak-off te st. In Figure 52, R/Rj is
th e ra tio betw een th e rad ius of th e tran sition from th e zone of
plastic behavior to th e zone of elastic behavior and th e well-bore
radius, Rj . These tw o radii a re show n in Figure 30, th e overall
com pressibility model. This ra tio de term ines how fa r th e plastic
region extends from th e well bore. The perfect elastic s ta te of stress
exists th roughou t th e form ation w hen R/Rj = 1. Increasing th e plastic
region (increasing R/Rj) reduces th e r a te of p ressu re increase before
frac tu re initia tion. This occurs because th e en largem ent of th e
borehole affects th e overall com pressibility of th e system .
Pore P ressure
Pore p ressu re affects only th e f rac tu re p ressu re obtained. An
increase in pore p ressu re causes a n increase in f ra c tu re p ressure and
vice-versa. Figure 53 shows how v ary in g th e pore p ressure grad ien t
affects th e p ressu re behavior of th e curve.
M ud Viscosity
M ud v iscosity affects th e surface in jection pressure during
frac tu re expansion. In th e proposed model, p ressu re is d irectly
re la ted to m u d v iscosity raised to an exponent m uch sm aller th a n
un ity . Therefore, varia tions in m ud v iscosity essentially do no t
affect th e shape of th e p ressure cu rve predicted b y th e com puter
model.
R e p ro d u c e d w ith p e rm is s io n of th e c o p y rig h t o w n er. F u rth e r re p ro d u c tio n p ro h ib ited w ithou t p e rm iss io n .
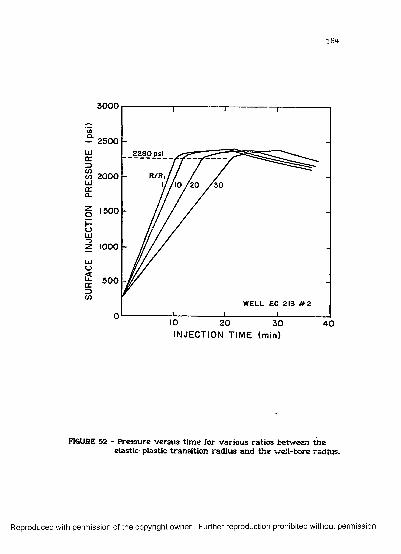
SURF
ACE
INJE
CTIO
N
PRES
SUR
E (p
si)
1 84
3 0 0 0
25 0 02 2 8 0 p s i_
R /R ,200010 / 2 0 / 3 0
1500
1000
5 0 0
WELL EC 213 # 2
0 20 3 0INJECTION TIM E (min)
4 0
FIGURE 52 - P ressure v ersu s tim e for various ra tio s betw een th eelastic-plastic tra n sitio n rad iu s an d th e w ell-bore radius.
R e p ro d u c e d w ith p e rm iss io n of th e co p y rig h t o w ner. F u rth e r re p ro d u c tio n p ro h ib ited w ithou t p erm iss io n .
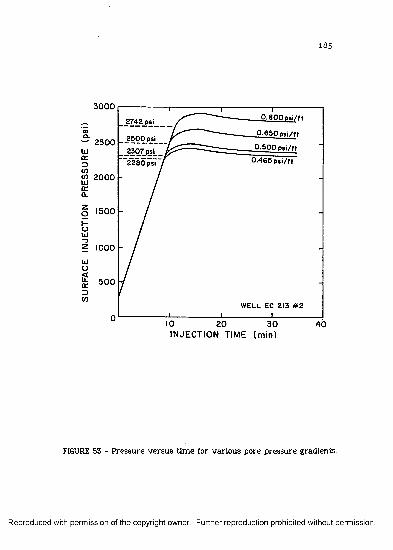
1 8 5
3 0 0 0__ 0 .8 0 0 p s i / f »
_ 0 .6 5 0 p s i / f t
0 .5 0 0 p s i /f t
^> .465 p s i / f t
274_2psi
2 5 0 0
cn 2 0 0 0
1500
1000
5 0 0
WELL EC 213 * 2
010 4 020 3 0INJECTION TIME (m in)
FIGURE 53 - pressu re v ersu s tim e for various pore pressure gradients.
R e p ro d u c e d with p e rm is s io n of th e co p y rig h t ow ner. F u rth e r re p ro d u c tio n p ro h ib ited w ithou t p e rm iss io n .
186
During th e pressure-decline period, th e m ud filtra te viscosity is
assum ed to be equal to th e pore fluid viscosity; the refo re th e m ud
filtra te viscosity does no t affect th e r a te of p ressure decline. Figure
54 shows how a change in m ud viscosity from 10 to 30 cp affects th e
pressure behavior of th e predicted curve.
Well Diamete r.
As shown b y Figure 55, th e well d iam eter only affects the
portion of th e cu rve recording th e period before frac tu re initia tion.
This w as expected, since well d iam eter is included in th e equation of
th e rock stra in , w hich w as show n to g rea tly affect th a t p a r t of th e
predicted pressure curve. For a given d iam etra l s tra in (the ra tio
betw een th e enlarged and th e original diam eter), an increase in
d iam eter is expected to increase the hole en largem ent volum e, w hich
causes a lower r a te of p ressure increase. This is confirm ed b y th e plot in Figure 55.
Top-of-Cement Depth
The plot in Figure 56 shows th a t for th e depth of th e top of th e
cem ent outside th e last casing to affect th e p ressure predicted b y th e
model, th e noncem ented sections m u s t be g rea te r th a n about 7000
ft. The effect shown for a 14,000-ft noncem ented section, an
unusually long one, is v e ry small. Therefore, neglecting th is effect in
th e model would not cause m a jo r errors.
R e p ro d u c e d with p e rm is s io n of th e co p y rig h t ow ner. F u rth e r re p ro d u c tio n p roh ib ited w ithou t p e rm iss io n .
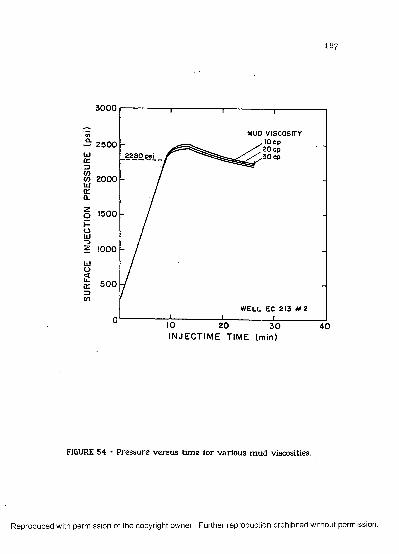
SURF
ACE
INJE
CTI
ON
PR
ESSU
RE
(psi
)
187
3 0 0 0
MUD VISCOSITY . lO cp
X V 20cp/ / 3 0 c p2 5 0 0
2000
1500
1000
5 0 0
WELL EC 213 # 2
010 2 0 3 0 IN JE C TIM E TIM E (min)
4 0
FIGURE 54 - P ressure v ersu s tim e for various m u d viscosities.
R e p ro d u c e d w ith p e rm iss io n of th e co p y rig h t ow ner. F u rth e r re p ro d u c tio n p ro h ib ited w ithou t p erm iss io n .
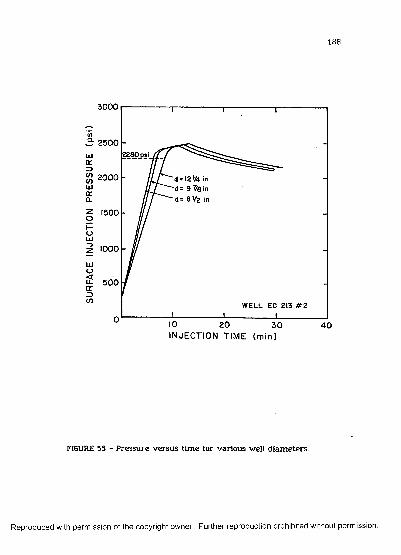
SURF
ACE
INJE
CTI
ON
PR
ESSU
RE
(psi
)
188
30 0 0
25 0 0
2000 d -1 2 Ui ii d= 9 7/Q ii
1500
1000
5 0 0
WELL EC 213 # 2
10 20 INJECTION TIME (m in)
3 0 4 0
FIGURE 55 - P ressure versu s tim e for various well d iam eters .
R e p ro d u c e d with p e rm iss io n of th e co p y rig h t ow ner. F u rth e r re p ro d u c tio n p roh ib ited w ithou t p e rm iss io n .

SURF
ACE
INJE
CTIO
N PR
ESSU
RE
(psi
)
1 8 9
6 0 0 0
5 0 0 0
4 0 0 0
3 0 0 0
2000
1000
010 2 0 3 0 4 0INJECTION TIME (min)
FIGURE 56 - P ressure versu s tim e for various lengths of casing cem ent.
4 7 2 9 p s [
' CEMENT TOP A T:
^ O . f t '* 7 0 0 0 . f t 1 4 0 0 0 . f t
WELL E l 151 #
R e p ro d u c e d w ith p e rm is s io n of th e co p y rig h t o w ner. F u rth e r re p ro d u c tio n p ro h ib ited w ithou t p e rm iss io n .

190
M icroannulus
The effect of a m icroannulus on th e p ressu re behavior of th e
predicted cu rve is show n in Figure 57 for a casing com pletely
cem ented up to th e surface. The casing is 7884 ft long, and norm ally
m icroannuli provide less th a n 0,01 in. of d iam eter clearance. Figure
57 shows th e tw o ex trem es in te rm s of clearance for th is situation.
It can be seen from th e figure th a t a m icroannulus can significantly
affect p ressu re behavior if th e m icroannulus occcurs in a long
cem ented section of casing, and th e clearance is v e ry large.
W ater Loss
Figure 58 shows how cum ulative filtra te varies w ith tim e for
different API w a te r loss values. The fluid loss to th e form ation
w ith in a given period of tim e is g rea t during th e ea rly stage of
filtration . A fter th e m ud cake has been built, a low er filtration ra te
is observed. In fact, Figure 58 shows th a t for a n API of 10 cm3,
approxim ately 0.0074 bbl of fluid will be lost betw een 60 and 70 m in
a fte r filtration is s tarted . For a 10-min in te rv a l a t th e beginning of
filtration , how ever, th e volum e lost is approx im ately 0.036 bbl, w hich
is five tim es g rea ter th a n th e loss 60 m in a f te r filtration has begun.
During a leak-off test, th e perm eable form ations h av e been exposed
for longer th a n 60 m in because of drilling and circulation tim e.
Therefore, th e additional filtra te volum e lost during th e te s t is
expected to be v e ry low. The practica lly negligible decrease in
p ressure before frac tu re initia tion show n in Figure 59, w hich is
caused b y a n increase in API w a te r loss, confirm s this.
R e p ro d u c e d with p e rm iss io n of th e co p y rig h t ow ner. F u rth e r re p ro d u c tio n p roh ib ited w ithou t p e rm iss io n .

SURF
ACE
INJE
CTI
ON
PR
ESSU
RE
(psi
)
191
3 0 0 0
25 0 0 MICROANNULUS 0 . in
f /O .O I in
2000
1500
1000
5 0 0
WELL EC 213 # 2
20INJECTION TIM E (m in )
FIGURE 57 - P ressure v ersu s tim e for various m icro -annu lus clearances.
R e p ro d u c e d w ith p e rm iss io n of th e co p y rig h t ow ner. F u rth e r re p ro d u c tio n p ro h ib ited w ithou t p erm iss io n .
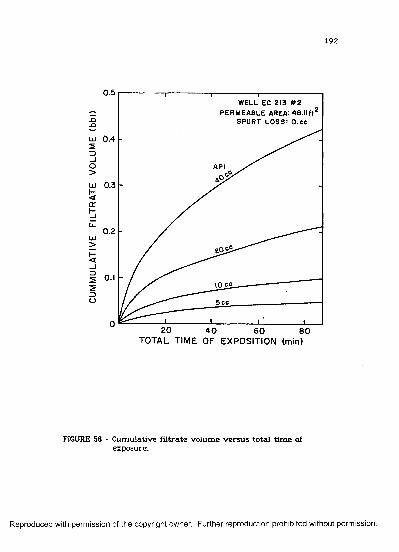
1 9 2
0.5WELL EC 213 t t Z
PERMEABLE AREA: 48.11ft1 SPURT L O S S : O .c cjO
-O
UJ2
O>UJ 0.3
API
H<q:
i jLl.
0.2UJ>I-<_J
lO c c .
5cc
20 4 0 6 0 8 0TOTAL TIME OF EXPOSITION (min)
FIGURE 58 - Cum ulative f il tra te vo lum e versu s to ta l tim e of exposure.
R e p ro d u c e d with p e rm iss io n of th e co p y rig h t ow ner. F u rth e r re p ro d u c tio n p roh ib ited w ithou t p e rm iss io n .

SURF
ACE
INJE
CTIO
N PR
ESSU
RE
(psi
)
1 9 3
3 0 0 0
25002280 psi
2000
API
1500■20
30
1000 “60
500
WELL EC 213 # 2
INJECTION TIME (min)
FIGURE 59 - P ressure v ersu s tim e for various API w a te r loss values.
R e p ro d u c e d w ith p e rm iss io n of th e co p y rig h t ow ner. F u rth e r re p ro d u c tio n p ro h ib ited w ithou t p erm iss io n .

During frac tu re expansion th e effect of changing API w a te r loss
on pressure is no t v e ry significant. This is because th e p ressure is
re la ted to API w a te r loss raised to an exponent betw een 0 and -1.
Figure 59 shows th a t an increase in API w a te r loss p ractica lly does
n o t affect th e fracture-expansion portion of th e curve. However, th is
increase will g rea tly affect th e frac tu re w id th an d length obtained,
as indicated b y Equations (77) and (80).
During th e pressure-decline period, th e effect of changing API
w a te r loss is m ore significant. The ra te of p ressu re decline is
d irectly proportional to API w a te r loss. Thus, if th e API w a te r loss
va lue doubles, th e ra te of p ressu re decline also doubles.
R e p ro d u c e d with p e rm is s io n of th e co p y rig h t ow ner. F u rth e r re p ro d u c tio n p ro h ib ited w ithou t p e rm iss io n .

SUMMARY AND CONCLUSIONS
A reliable com puter sim ulation model for form ation pressure-
in teg rity tests has been developed. The com puter model is based on
a m athem atica l model th a t takes into account th e m a n y factors
th a t affect p ressu re behavior. The model w as developed by
subdividing th e form ation p ressu re-in teg rity te st, o r leak-off te s t into
four phases: (1) pressu re increase due to change in th e overall
com pressibility of th e system , (2) form ation breakdow n w hen th e
f rac tu re is initia ted, (3) frac tu re expansion, and (4) pressu re decline
an d frac tu re closure a fte r th e pum p is sh u t in.
The m a them atica l model for predicting injection p ressure
before frac tu ring includes th e m ost im p o rtan t variables affecting
overall com pressibility of th e system : m ud com pressibility, casing
expansion, well-bore expansion, fluid loss to perm eable form ations,
and volum e of a ir accidentally trapped in th e sy stem . The frac tu re
p ressure is determ ined w ith th e equations derived from th e
e lastic ity and p lasticity th eo ry for a hole in th e m iddle of an infinite
plate.
A fracture-expansion model for an elliptical crack propagating
in an elastic, isotropic, homogeneous form ation h as been proposed for
use in modeling p ressure varia tion w ith tim e during th e frac tu re -
expansion period. This model is based on th re e different
approxim ated solutions for th e con tinu ity equation of flow: (1) large
fluid-loss approxim ation, (2) no fluid-loss approxim ation, and (3)
195
R e p ro d u c e d with p e rm iss io n of th e co p y rig h t ow ner. F u rth e r re p ro d u c tio n p roh ib ited w ithou t p e rm iss io n .

1 96
num erical solution approxim ation. Each solution is used according to
its dim ensionless tim e ran g e of valid ity .
The solution of th e con tinu ity equation for flow has also been
used to model th e pressure-decline period a f te r th e pum p is s h u t in.
The com puter sim ulation p rogram w as w ritte n on th e basis of these
four m a th em atic a l models.
The com puter model w as verified using field d a ta from offshore
of th e Louisiana Gulf Coast furnished b y th e offshore division of
Tenneco Oil Com pany. A curve-m atch ing technique w as applied to
an a lyze th e field d a ta w ith the com puter model. An exam ple
showing how th e com puter model can be used for leak-off te s t design
w as also presented .
Conclusions
The following conclusions a re m ade on th e basis of th e sensitiv ity te s ts conducted:
1. The m ost im p o rtan t p a ram ete rs affecting frac tu re-in itia tion
pressure a re Poisson's ratio , tensile stren g th , overburden stress,
pore pressure, and fluid ty p e (penetrating or nonpenetrating).
2. The m ost im p o rtan t p a ram ete rs affecting th e p ressu re-tim e
slope of a p ressu re-in teg rity te s t a re flow ra te , API w a te r loss,
volum e of a ir accidentally trapped in th e sy stem , top-of-
R e p ro d u c e d w ith p e rm is s io n of th e c o p y rig h t o w n er. F u rth e r re p ro d u c tio n p ro h ib ited w ithou t p e rm iss io n .

1 9 ?
cem ent depth, well d iam eter, an d rock m echanics behavior of
th e form ation (expressed b y th e ra tio R/Rj).
3. The least im p o rta n t p a ra m e te r affecting th e p ressu re-tim e
slope is th e m icroannulus.
4. The m ost im p o rtan t p a ra m e te rs affecting th e p ressu re-tim e
relationship during f ra c tu re expansion a re fra c tu re height, bulk
shear modulus, flow ra te , and Poisson's ratio .
5. The m ud viscosity and th e API w a te r loss p a ra m e te rs do not
affect th e p ressu re -tim e re lationship significantly during th e
fracture-expansion period.
6 . The m ost im p o rta n t p a ra m e te rs affecting th e p ressu re-tim e
relationship during th e frac tu re-c lo su re period a re API w a te r
loss, bulk sh ear m odulus, Poisson’s ratio , and th e ra tio betw een th e frac tu re perm eab le height an d f ra c tu re height.
The following conclusions a re m ade on th e basis of th e field d a ta analysis:
1. The low p ressu re -tim e slope show n b y p ressu re -in teg rity
te sts perform ed in p redom inan tly unconsolidated shale
lithology can be explained b y th e en largem en t of th e well bore due to th e plastic behav io r of th is form ation .
R e p ro d u c e d w ith p e rm iss io n of th e co p y rig h t ow ner. F u rth e r re p ro d u c tio n p ro h ib ited w ithou t p erm iss io n .

198
2. The w ell-bore en largem ent, calculated using th e s tress-stra in
relations from th e e lastic ity th eo ry , is a lw ays sm aller th a n th e
en largem ent calculated using th e elastic-plastic s tress-stra in
relationship. The rock s tra in equation derived for th e elastic-
plastic case is a function of th e ra tio betw een th e extension
rad ius of th e plastic region an d th e w ell-bore rad ius, R/Rj.
3. The ra tio R/Ri for th e re la tiv e ly shallow gum bo-shale
llthology encountered in th e Gulf Coast a re a w as found to v a ry
betw een 15 and 28. This ran g e w as found using th e available
leak-off te s t d a ta from th e ran g e of 2300-13000 ft. A ra tio
equal to 1 should be used for rocks having a p u re ly elastic behavior.
4. A p ressu re-in teg rity te s t th a t h as an ea rly concave upw ard
pressu re-tim e relationship indicates th e presence of a ir trapped
in th e piping sy stem connected to th e pum p ou tle t or in th e an n u la r below th e kelly-bushing.
5. A p ressu re-in teg rity te s t th a t h a s a concave upw ard
pressu re-tim e relationship all th e w a y up to th e frac tu re -
in itia tion pressure indicates th a t th e fluid-loss ra te to
perm eable form ations is v e r y high.
6 . A p ressu re-in teg rity te s t th a t in w hich a concave dow nw ard
p ressu re-tim e relationship occurs m uch ea rlie r th a n th e
R e p ro d u c e d with p e rm iss io n of th e co p y rig h t o w n er. F u rth e r re p ro d u c tio n p ro h ib ited w ithou t p e rm iss io n .

199
f rac tu re pressure predicted indicates a cem en t leak or a casing
leak.
7. A p ressu re-in teg rity te st showing a constan t p ressu re as a
function of tim e a fte r th e pum p has been sh u t in indicates
th a t only im perm eable form ations a re p resen t in th e open-hole section.
8. A p ressu re-in teg rity te s t showing the p ressu re-tim e curve
displaced upw ard from th e origin indicates th a t th is displace
m e n t corresponds to th e pressure losses in th e sy stem . The
pressure losses in th e sy stem can be rep resen ta tiv e of th e
pressure requ ired to b reak the m ud gel s tren g th if th e well
has not been circulated before th e test, o r th e y can be an
indication of p ressu re losses due to th e flow of th e drilling fluid.
R e p ro d u c e d with p e rm iss io n of th e co p y rig h t ow ner. F u rth e r re p ro d u c tio n p roh ib ited w ithou t p e rm iss io n .
2 0 0
Recom m endations
1. Among th e m a n y factors affecting th e p ressu re behav io r
during a fo rm ation p ressu re -in teg rity te st, th e m icroannu lus
effect w as proved b y th e sensitiv ity ana ly sis to be negligible.
In fu tu re w ork, th e model can be simplified b y elim inating th e
m icroannulus effect.
2. The tensile s tren g th of rocks h as been neglected in m ost of
th e frac tu re -p ressu re correlations developed in th e past. In th e
frac tu re -p ressu re prediction equations derived in th is w ork,
how ever, th e tensile stren g th significantly affects th e fra c tu re
pressure obtained. A lthough it is a lm ost impossible to m easu re
th is p a ram e te r un d er well conditions, an a t te m p t should be
m ade to es tim ate i t b y th e h is to ry m a tch ing technique
presented in th is w ork for d ifferen t fo rm ations and depths
w ith in a given a re a of drilling ac tiv ity .
R e p ro d u c e d with p e rm is s io n of th e co p y rig h t ow ner. F u rth e r re p ro d u c tio n p ro h ib ited w ithou t p e rm iss io n .
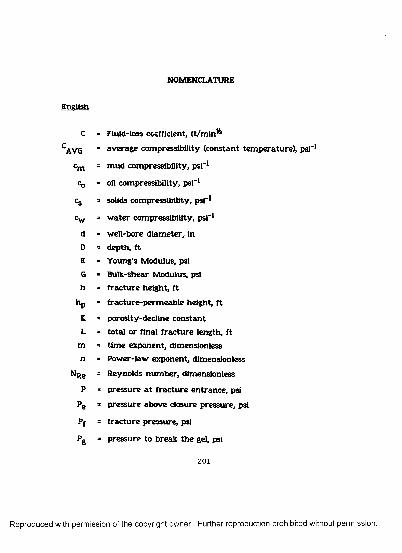
NOMENCLATURE
English
c - Fluid-loss coefficient, f t /m in ^
'AVG - ave rage com pressibility (constant tem p era tu re ), psi*
°m = m u d com pressibility , p s r 1
= oil com pressibility , psi-1
Cs - solids com pressibility , psi"1
°w - w a te r com pressibility , psi"1
d = w ell-bore d iam eter, in
D = dep th , f tE = Young’s M odulus, psi
G B ulk-shear M odulus, psih - f ra c tu re heigh t, f t
h P - frac tu re -p erm eab le height, f t
K - porosity-decline constan tL = to ta l o r final f ra c tu re length, f t
m = tim e exponent, dim ensionlessn - Pow er-law exponent, dim ensionless
% e = Reynolds n u m b e r, dim ensionless
P - pressu re a t f ra c tu re en trance , psi
*>e - pressu re above closure pressure, psi
P | = fra c tu re p ressure, psi
p* * p ressu re to b reak th e gel, psi
201
R e p ro d u c e d with p e rm iss io n of th e co p y rig h t o w n er. F u rth e r re p ro d u c tio n p ro h ib ited w ithou t p e rm iss io n .

2 0 2
P0 = original fo rm ation pore pressure, psi
Pp = pore-fluid pressure, psi
Pw - w ell-bore pressure, psi
q * to ta l flow ra te , bpm
qj = flow r a te a t th e f rac tu re en trance , bpm
qL = fluid loss r a te p e r un it of a rea , bbl/ft2
R j = radius, in
Sxx, S y y , S22 = to ta l principal stresses, psi
= form ation-tensile s treng th , psi
S0 = oil concentration , dim ensionless
Ss = solids concentration , dim ensionless
= w a te r concentration, dim ensionless
Sjj = overbu rden stress, psi
T ■ te m p era tu re , *C o r °F as noted
t » tim e, m in
t0 » to ta l tim e a t shu t-in , m in
V - to ta l m ud volum e, bbl
Vf * volum e of m ud filtrate , bbl
v sp = spurt-loss volum e, bbl
W = f rac tu re w idth, f t
x ■ d istance from th e f rac tu re en tran ce to a point In th ef rac tu re , f t
xQ » d istance from th e f rac tu re en tran ce to th e tip of th e
frac tu re , ft
AD = change in borehole d iam eter, in
AP = change in pressure, psi
R e p ro d u c e d with p e rm iss io n of th e co p y rig h t o w n er. F u rth e r re p ro d u c tio n p ro h ib ited w ithou t p e rm iss io n .

20 3
Greek
6 - At/t^
0 ■ porosity, dimensionless
- surface porosity, dimensionless
M * Poisson's ratio , dimensionless
V « m ud viscosity, cp
T = stress, psi
Th = average horizontal stress
Tg ■ gel s treng th , lbf/100 f t2
€ = s tra in , in /in
it * constan t (3.14159)
*t> - bulk density , g/cm 3
' g » g ra in density , g/cm3
a = Blot's constant, dimensionless
SubscriDts
D = dimensionlessi = initial or in te res t
n = norm al
x,y,z = general orientationso = outsidew = well bore
R e p ro d u c e d with p e rm is s io n of th e co p y rig h t ow ner. F u rth e r re p ro d u c tio n p ro h ib ited w ithou t p e rm iss io n .

REFERENCES
Anderson, R. A., Ingram , D. S., and Zanier, A. M.: "Determining F rac tu re P ressure G radients from Well Logs," J o u rn a l of Petroleum Technology Reprint Volume: Acoustic Logging (Nov. 1973) 1259-1268.
B arenblatt, G. I.: “M athem atica l Theory of Equilibrium Cracks," Advances in Applied M echanics (1962) 55-129.
Biot, M. A.: "Theory of Propagation of Elastic W aves in a Fluid- S a tu ra ted Porous Solid: 1-Low F requency Range, 2- High F requency Range," Jo u rn a l of th e Acoustical Soc. of A m erica (1956), vol. 28, 168-191.
Birch, F., Schairer, J . F., and Spicer, H. C.: "Handbook of PhysicalConstants," Geological Society of A m erica Special Papers 36 (Jan . 1942).
Bourgoyne, A. T., J r .: "Applied Drilling Engineering," Society of Petroleum Engineering. Dallas, TX. (1986).
B rennan, R. M., and Annis, M. R.: "A New F rac tu re PredictionTechnique That Shows Good Results in Gulf of Mexico A bnorm al Pressure," SPE paper * 13210 (1984).
Campos, Joao C. B.: "Tensoes Na Parede de um Poco Circular Segundo a Teoria da Elasticidada," Boletim Tecnico. published by PETROBRAS th e Brazilian oil com pany (1983) 209-216.
Carm ichael, R. S.: Handbook of Physical P roperties of Rocks. CRC Press (1982) Vol. I, II, III.
Chenevert, M. E., and McClure, L. J .: "How to Run Casing and Open-Hole P ressure Tests," Oil and Gas Jo u rn a l (M arch 1978)66-76.
Christianovich, S. A., and Zeltov, Y. P.: "Form ation of V ertical F rac tu res by M eans of Highly Viscous Liquid," Proc. Fourth World Petroleum Congress (1955) II, 579-586.
2 0 4
R e p ro d u c e d with p e rm iss io n of th e co p y rig h t o w n er. F u rth e r re p ro d u c tio n p ro h ib ited w ithou t p e rm iss io n .

2 0 5
C hristm an, S. A.: "Offshore F rac tu re Gradients," J o u rn a l of Petroleum Technology (Aug. 1973) 910-914.
Conoco Inc. “Conoco In te rnal Cem ent Bond Logging School," Chapter 8, pp. 81 and 82. U npublished m a teria l.
Constant, W. D., and Bourgoyne, A. T., J r .: "F ractu re Gradient Prediction for Offshore Wells," SPE paper # 15105 (1986), 127.
Daneshy, A. A.: "On The Design of V ertical H ydraulic Fractures," T rans.. AIME (Jan . 1973) vol. 255, 83-97.
Eaton, B. A.: "F ractu re Gradient Prediction and Its Application in Oil Field Operations," J o u rn a l of Petro leum Technology (Oct. 1969) 1353-1360.
Geertsm a, J ., and DeKlerk, F.: "A Rapid M ethod of Predicting W idth and E xtent of H ydraulically Induced Fractures," J o u rn a l of Petro leum Technology (Dec. 1969) 1571-1581.
Geertsm a, J.: "The Effect of Fluid P ressure Decline on V olum etric Changes in Porous Rock," T rans.. AIME (1957), vol. 210, 331-340.
Hagoort, J . , W eatherhill, B. D., an d S ettari, A.: "Modeling ThePropagation of W aterflood-Induced H ydraulic Fractures," Soc. of Petro leum Engineers J o u rn a l (Aug. 1980) 293-303.
Haimson, Bezalel, and F a irh u rs t, Charles: “Initiation and Extension of H ydraulic F rac tu res in Rocks," Soc. of P etro leum Engineers JournaK Sept. 1967) 310-318.
H arrison, E., Kieschnick, W. F., J r . , an d McGuire, W .J.: "TheM echanics of F rac tu re Induction and Extension," Trans.. AIME (1954), vol. 201, 252-263.
Hearn, E. J .: M echanics of M aterials: An In troduction to th eM echanics of Elastic an d Plastic Deformations of Solids and S tru c tu ra l Components. Pergam on Press Ltd., Oxford (1977) 179-180, 195-196.
Howard, G. C., and Fast, C. R.: "Optim um Fluid Characteristics for F rac tu re Extension," Drilling and Production Practice (1957) 261-270.
R e p ro d u c e d with p e rm iss io n of th e co p y rig h t o w n er. F u rth e r re p ro d u c tio n p ro h ib ited w ithou t p erm iss io n .
2 06
H ubbert, M. K., and Willis, D. G.: "M echanics of H ydraulic Fracturing," Trans.. AIME (1957), vol. 210, 153-166.
Jaeger, J . C., and Cook, N. G.: F undam enta ls of Rock M echanics. Chapm an and Hall, London (1979) 3rd. Edition.
Kiel, 0. M.: "A New H ydraulic F ractu ring Process," J o u rn a l of Petroleum Technology (Jan . 1970) 89-96.
Lamb, H.: H ydrodynam ics. Dover Publications Inc., New York (1932), 6th . Edition.
Langlinais, J . P., Bourgoyne, A. T., J r . , and Holden, W. R.: "Frictional P ressure Losses for th e Flow of Drilling M ud and M ud/Gas M ixtures," SPE paper * 11993 (1985).
M atthew s, W. R., and Kelly, J.: "How to Predict F orm ation Pore P ressure an d F rac tu re Gradient From Electric and Sonic Logs," Oil and Gas J o u rn a l (Feb. 20, 1967).
M eyer, B. R.: "New S im ulato r M akes F rac tu re Design Routine," Oil and Gas Jo u rn a l (Ju n e 1985) 87-92.
Nolte, K. G.: "D eterm ination of F rac tu re P aram ete rs from F ractu ring P ressure Decline," SPE paper * 8342 presented a t 54 th A nnual Tech. Conf., Las Vegas (Sept. 1982).
Nolte, K. G.: "F ractu re Design Considerations Based on P ressure Analysis," SPE paper # 10911 (1982).
Nolte, K. G., an d Sm ith, M. B.: "In terp re tation of F ractu ring Pressures," Jo u rn a l of Petro leum Technology (Sept. 1981) 1767-1775.
N ordgren, R. P.: "Propagation of a V ertical H ydraulic Fracture," T rans.. AIME (1971) vol. 253.
Norwacki, W.: Therm oelasticitv . Addison-Wesley (1962).
O’B ryan, P. L., Bourgoyne, A. T., J r . , M onger, T. G., an d Kopcso, Debra: "The Compressibility of Oil-Base Drilling Fluids," Louisiana S ta te U niversity , Baton Rouge (1986).
R e p ro d u c e d with p e rm iss io n of th e co p y rig h t o w n er. F u rth e r re p ro d u c tio n p ro h ib ited w ithou t p e rm iss io n .

2 0 7
O utm ans H. D.: "M echanics of S tatic an d Dynam ic F iltration in th e Borehole," SPE paper * 491 (1963).
Pennebaker, S. E.: "An Engineering In te rp re ta tion of Seismic Data," SPE paper * 2165 (1968).
Penny, G. S., Conway, M. W., and Lee, W.: "Control an d Modeling of Fluid Leak-Off During H ydraulic Fracturing," Jo u rn a l of Petroleum Technology (1985) 937-949.
Perkins, T. K., and Kern, L. R.: :W idths of H ydraulic Fractures," Jo u rn a l of Petro leum Technology (1961) 937-949.
Scott, P. P., J r . , Bearden, W. G., and Howard, G. C.: "Rock R upture as Affected b y Fluid Properties," T rans.. AIME (1953) vol. 198 111-124.
Settari, A.: "Sim ulation of Hydraulic F racturing Processes," Soc. of Petroleum Engineers Jo u rn a l (Dec. 1980) 487-500.
Settari, A.: "A New General Model of Fluid Loss in HydraulicFracturing," Soc. of Petroleum Engineers Jo u rn a l (Aug. 1985) 491-501.
Settari, A., and Cleary, M. P.: "Three-Dimensional S im ulation of Hydraulic Fracturing," Jo u rn a l of Petroleum Technology (Ju ly 1984) 1177-1190.
Sneddon, I. N.: "The Distribution of S tress in th e Neighborhood of a Crack in a n Elastic Solid," Proc. Roval Society of London (Oct- Dec. 1946), series A, 187, 229-260.
Som erton, W. H., M eh tam M. M., an d Dean, G. W.: "Thermal A lteration of Sandstones," SPE paper # 907 (Oct. 1964)
Teplitz, A. J . , an d Hassebroek, W. E.: "An Investigation of Oil Well Cementing," Drilling Production Practice. API (1946) 76.
Timoshenko, S. P. an d Goodier, J . N.: Theory of Elasticity. McGraw Hill Publishing Co., New York (1951).
Tixier, M. P., Loveless, G. W., and Anderson, R. A.: "Estimation of Form ation S treng th from th e M echanical Properties Log," Jo u rn a l of P etroleum Technology R eprint Volume: Acoustic Logging (M arch 1975) 283-293.
R e p ro d u c e d with p e rm is s io n of th e co p y rig h t ow ner. F u rth e r re p ro d u c tio n p ro h ib ited w ithou t p e rm iss io n .

W arpinski, N. R.: "M easurem ent of W idth and P ressure in aPropagating H ydraulic Fracture," Soc. of P etroleum Engineers Jo u rn a l (Feb. 1985) 46-54.
Weibull, W.: "A S u rv ey of S tatistical Effects in th e Field of M aterial Failure," Applied M echanics Review (Nov. 1952) 5 and 449.
Wilcox, T. C.: “M echanical In teg rity Testing of Injection Wells," M. S. thesis, Louisiana S ta te U niversity , Baton Rouge (1979).
Williams, B. B.: "Fluid Loss From H ydraulically Induced Fractures," Jo u rn a l of Petroleum Technology (Ju ly 1970) 882-888.
R e p ro d u c e d with p e rm is s io n of th e co p y rig h t ow ner. F u rth e r re p ro d u c tio n p ro h ib ited w ithou t p e rm iss io n .
208a
AEEENMX A
R e p ro d u c e d with p e rm is s io n of th e co p y rig h t ow ner. F u rth e r re p ro d u c tio n p ro h ib ited w ithou t p e rm iss io n .

2 0 9
APPENDIX A
DERIVATION OF FRACTURE-INDUCTION EQUATIONS
The stress field due to th e tw o horizontal to ta l principal
s tresses Sxx an d Syy acting on th e edges of a v e ry large rec tangu la r
p la te w ith a sm all c ircu lar hole (radius rw ) a t its cen ter is given by
(Haimson an d F a irh u rs t 1967).
^rrl a [ ( «Tx +ay) 12 ) 0 - rw2/r2 - «<rx -<Ty) / 2) (1 + 3 r4w/r4 ‘
-4 r w2 / r2)COS20]
0*00! = 1 (<<rx+ay)/2)(l+ rw2/r2 ♦ <«rx-cry) / 2) (I + 3 rw4/r4
COS 2 0 ]
K(Ty -(rx ) / 2 ) ( l - 3 rw4 / r 4 ) +2 rw4 / r 4 )sm 20]
ffzzl -(rz" r 12 -^ x ^ w 2 / r 2 COS2 0 ]
®0Z1 *®rzl * 0 .......................................................................
Equations (A-l) assum e th a t th e borehole axis is parallel to th e
principal stress, (Tz , as show n in Figure A.l. The resu lting stress
d istribution in te rm s of to ta l s tresses (Sy = <Ty + Pp) a t th e
w ell-bore rad iu s (r = rw ) in th e polar coordinates show n in Figure (A.l) is
R e p ro d u c e d with p e rm iss io n of th e co p y rig h t o w n er. F u rth e r re p ro d u c tio n p ro h ib ited w ithou t p e rm iss io n .

BOREHOLE
X
a) ORIENTATION OF O X,, 0X 2 . 0 X 3 WITH RESPECT TO THE IN SITU PRINCIPAL STRESSES (GENERAL C A SE)
WELLBORE
b) TOTAL STRESS COMPONENTS ON THE BOREHOLE WALL IN POLAR COORDINATES
FIGURE A.l - S ta te ol s tress around th e borehole well.
R e p ro d u c e d with p e rm is s io n of th e co p y rig h t ow ner. F u rth e r re p ro d u c tio n p roh ib ited w ithou t p e rm iss io n .

211
Srrl-Po
S q q i =(Tx +(Ty + 2 (rx -(ry)COS20 + Po
S 7 Z l = { [ z - 2 t ^ - ( [ y ) C O S 20 + Po
sre\uSezimSi2i3 0 ............................................. (A2)
The stresses induced b y th e borehole fluid pressure, pw , a t the
depth under consideration, and a t th e wellbore (Campos 1983) a re
% rt- pw->o
%92’ ^ w V
hZ2 " Sr92 ■ %z2 " sfz2 ■ 0 ....................................................k-3)
When fluid penera tes th e form ation from th e well bore,
assum ing th a t th e pene tra ting fluid has th e sam e viscosity as th e
form ation fluid and the form ation has th e sam e perm eab ility in all
directions, th e induced stresses a t th e wall of th e borehole a re
Srr3 = °
S ee j.a K i-a M J /O -jd K P p -P o )
$223 - a [ <1-2m) / <1 - jd 1 <Pp - P0)
^
The com plete sta te of s tress underground a t th e borehole wall
is determ ined b y th e principle of superposition (TimoshenKo and
R e p ro d u c e d with p e rm is s io n of th e co p y rig h t ow ner. F u rth e r re p ro d u c tio n p roh ib ited w ithou t p e rm iss io n .

212
Goodier 1951), w hich consists of th e com ponents (Tyi , 0*^2 , <Tjj3 . This
yields
srr " po + pw " po " pw
Sqq - Tx + Ty + 2 (Tx - ITy)COS 20♦ 2 p0 - Pw + a [(1 -2m/( 1 -M> 1 (Pp - P0)
Szz=(T2 -2r(iry -(rx)COS2e + P<> + a [ (1-2m)/(1-m)1 (P p -P 0)
S re 'S e z 'S rz 3 0 ..................................................................... ^ 5 )
Equation series (A.5) shows th a t all shear stresses a re zero a t
th e borehole w all, and the refo re Sr r , Sqq , and Szz a re th e th re e
secondary principal stresses a t th e borehole w all. The m ax im um
stresses occur a t © = 0 an d st . Substitu ting a n y of these values in
Equations (A.5) yields
Srr " Pw
3<rx - try ♦ 2 P0 - pw + ai<i-2pL)/<W 0](Pp- p0)
Sgj =(T2 -2M((ry -<rx) + P0 + a[(l-2M )/(l-jd] <Pp - P0) . . . . (A.6)
If th e a rea un d er consideration is tectonically relaxed, Equation
(1) from th e te x t can be sub stitu ted in Equations (A.6) to yield
^ r * pw
See * t2 m/ ( i-m))<tz *2 p0 - pw* « [ ( i - 2^/ (i-»)l 0>p - p0)
Sjj = <TZ * P0 ♦ <A (1-2m) / (1-m) 1 (Pp - P0) ....................................(A.7)
R e p ro d u c e d with p e rm iss io n of th e co p y rig h t o w n er. F u rth e r re p ro d u c tio n p ro h ib ited w ithou t p e rm iss io n .

2 1 3
V ertical F rac tu re Initiation
V ertical frac tu re s begin w hen th e m a x im u m effective
tangen tia l stress, (Tqq, exceeds th e tensile s tren g th of th e form ation,
S t . Then, f rac tu re in itia tion occurs w hen (Tgg = St , w hich substitu tes
in Equations A.7 (rem em ber th a t Sqq = (Tqq + Pp) to yield
St - (2 M/ (1 - M»<rz ♦ 2 P0 - Pw * CC 1(1 - 2 M) / (1 - M )1 ( Pp - p0) - Pp
.................................................................................................CA.8)
For a penetrating type fo fluid, the pore pressure, Pp, at the
borehole wall is Pp = Pw (see Figure 10). Substituting this equality in
(A.8) and solving for the well-bore pressure, yields
Pw = l U M / U - j O X r z - S t l ' f c - a U - Z j O / d - r ) ) +P0 .. CA.9)
For a nonpene tra ting ty p e of fluid, th e pore p ressure, Pp, a t
th e borehole w all is th e original fo rm ation pore pressure, o r Pp = P0.
Therefore, th e w ell-bore p ressure becom es from Equation (A.8)
pw -1 2 pi/ ( i - m ) 1 <r2 - V P 0 ................................te-10*
R e p ro d u c e d with p e rm iss io n of th e co p y rig h t ow ner. F u rth e r re p ro d u c tio n p roh ib ited w ithou t p e rm iss io n .

2 1 4
Horizontal F rac tu re Initiation
Horizontal frac tu re s begin w hen th e m ax im u m effective
v ertica l stress, ffyy, exceeds th e tensile s tren g th of th e form ation,
Thus, fra c tu re in itia tion occurs w hen th e m a x im u m effective vertical
stress, Q77 , exceeds th e tensile s tren g th of th e form ation , th a t »3,
fra c tu re in itia tion occurs w hen 077 = St* w hich substitu tes in
Equation (A.7) to yield
St - cr2 + p0 - Pp ♦ « [ ( 1 - 2 m) / ( 1 - m)J <pp - p0>...........t * 11*
For a pene tra tin g fluid Pp - Pw , then , Pw can be expressed as
Pw - (Tz-St) / I 1 -ocCl -2 jjl) / ( 1 - m )> ♦ P0 ........................... (A.12)
S ubstitu ting for a nonpene tra ting fluid, Pp - P0 , th en in
Equation B.ll y ields
h m*Z..................................<A.I3)
Equation (A.13) indicates th e im possibility of obtaining a
horizontal f ra c tu re w ith a nonpene trating fluid. However, end effects
should occur a t th e well bottom in w hich axial forces equal to th e
p ressure tim es th e a re a of th e cross section of th e hole would be
exerted upon th e ends of th e in terval. A nother w a y of producing
horizontal f ra c tu re w ith a nonpene tra ting fluid is to in troduce points
th a t a re separa ted sufficiently to allow th e en tra n c e of th e fluid.
R e p ro d u c e d with p e rm iss io n of th e co p y rig h t o w n er. F u rth e r re p ro d u c tio n p ro h ib ited w ithou t p erm iss io n .

2 1 5
Then, i t is only necessary to apply sufficient pressure to hold th e
frac tu re open.
The pressure a t th e well bore in a n y case should be a t least
th a t of th e overburden, and then
Pw = % ...................................................W O
R e p ro d u c e d w ith p e rm iss io n of th e co p y rig h t ow ner. F u rth e r re p ro d u c tio n p ro h ib ited w ithou t p erm iss io n .

215a
APRENPIX.B
R e p ro d u c e d with p e rm is s io n of th e co p y rig h t ow ner. F u rth e r re p ro d u c tio n p ro h ib ited w ithou t p e rm iss io n .

216
APPENDIX BDERIVATION OF THE OVERBURDEN STRESS EQUATION
The vertica l overburden stress, S^, originating from geostatic
load a t a sedim ent depth, Ds, for sedim ents having a n average bulk
density , p^, w here g is th e g rav ita tional constant, is given b y
»»
The value of p^ can be expressed as a function of porosity , 0,
th e grain density , />g, and th e pore fluid density , pp by
pb = pg. ( l - 0 ) * Pf .0 .....................................................(B.2)
The change in bulk density w ith depth of buria l is p rim arily
ra te d to th e change in sedim ent porosity w ith com paction. V alues of
bulk density as a function of dep th can be obtained from
conventional well-logging m ethods applied in a given area . Since
grain density of s ed im en ta ry deposits h as been found to be
approx im ately constan t w ith depth (Bourgoyne 1986), porosity can be
calculated d irec tly b y rea rrang ing Equation (B.2) in th e form
0 = <B.3>
This equation allows average bulk density d a ta read from w ell
logs to be easily expressed in te rm s of a n average porosity for a n y
R e p ro d u c e d with p e rm is s io n of th e co p y rig h t ow ner. F u rth e r re p ro d u c tio n p roh ib ited w ithou t p e rm iss io n .

217
assum ed values of grain density and pore fluid density . The plot of
th e depth of these average porosity values in a semi-log paper can
genera lly be approxim ated b y a s traigh t-line trend . The equation of
th is s tra ig h t line is given by
0 = 0 o.e“E D ................................................. (B.4)
The surface porosity 0O , is th e porosity a t a depth of zero, and
K is th e porosity-decllne constan t. For th e Gulf Coast area , for
exam ple, these values a re 0O = 0.41 and K = 0.000085, and
0 = 0.41 e “0-000085 D............................................. (B.5)
The substitu tion of Equation (B.2) in (B.l) yields
or rearrang ing
G>g-/>f)-0 Ig-<1D............................ (B.6)
S ubstitu ting (B.4) in (B.6) yields
V - f f l ' g - © 7)
For offshore areas, Equation (B.7) m u s t be in tegra ted in tw o
parts . From th e surface to th e ocean bottom , w hich in th is case is
R e p ro d u c e d with p e rm is s io n of th e co p y rig h t ow ner. F u rth e r re p ro d u c tio n p ro h ib ited w ithou t p e rm iss io n .
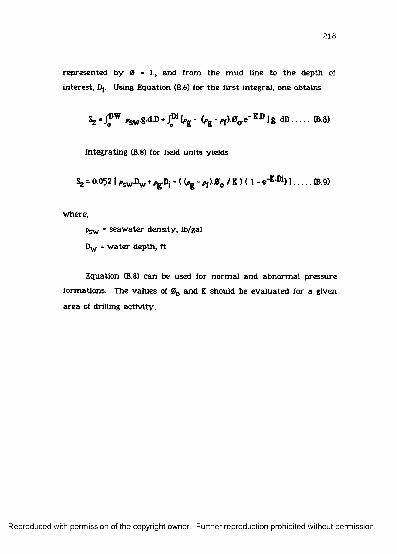
218
represented b y 0 = 1., and from th e m ud line to th e depth of
in terest, Dj. Using Equation (B.6) for th e firs t in tegral, one obtains
h - 4DW ' s w - g - a - D V “ 1 g ® © ®)
Integrating (B.8) for field units yields
Sj = 0.052 [ , SWJ)W . ,g.D, - ( (,g - ,j)uef0 / E ) ( 1 - e 'KDi) ] .........©9)
w here,
psw = seaw ate r density , lb/gal
Dw = w ate r depth, ft
Equation (B.8) can be used for norm al and abnorm al pressure
form ations. The values of 0O and K should be eva luated for a given
a rea of drilling ac tiv ity .
R e p ro d u c e d with p e rm is s io n of th e co p y rig h t ow ner. F u rth e r re p ro d u c tio n p ro h ib ited w ithou t p e rm iss io n .

218a
AEEEMPKL-C.
R e p ro d u c e d with p e rm is s io n of th e co p y rig h t ow ner. F u rth e r re p ro d u c tio n p ro h ib ited w ithou t p e rm iss io n .
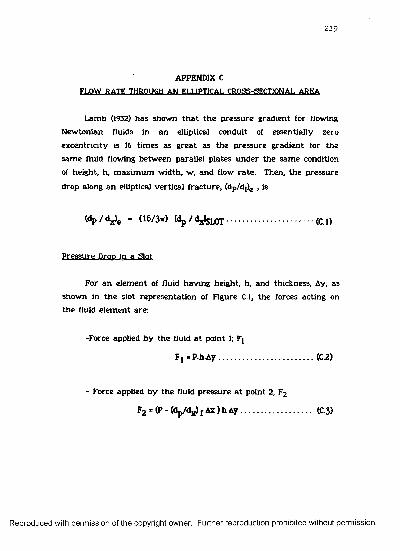
2 1 9
APPENDIX C
FLOW RATE THROUGH AN ELLIPTICAL CROSS-SECTIONAL AREA
Lam b (1932) h as show n th a t th e p ressu re grad ien t for flowing
N ew tonian fluids in a n elliptical conduit of essentially zero
excen tric ity is 16 tim es as g rea t as th e p ressure g rad ien t for th e
sam e fluid flowing betw een parallel p la tes u n d e r th e sam e condition
of height, h , m ax im um w idth , w, and flow ra te . Then, th e p ressure
drop along an elliptical vertical f rac tu re , (dp/dpe , is
Mp/<Ve - <16'» V^'sior........................ffi i)
P ressure Drop in a Slot
For an elem ent of fluid hav ing height, h, and thickness, Ay, as
show n in th e slot rep resen ta tion of Figure C.l, th e forces acting on th e fluid elem ent are:
-Force applied b y th e fluid a t poin t 1; Fj
F j - P .h A y .................................................(C.2)
- Force applied b y th e fluid p ressu re a t point 2; F2
F2 = (P - (d p /< y f AX) h A y .................................... (C-3)
R e p ro d u c e d with p e rm iss io n of th e co p y rig h t o w n er. F u rth e r re p ro d u c tio n p ro h ib ited w ithou t p e rm iss io n .

. t - r i i „ VT
A R E A : d A = d W - h
FLOW q
TOP VIEW
FIGURE C.l - Free body d iag ram for fluid e lem en t in a n a rro w slot.
R e p ro d u c e d with p e rm iss io n of th e co p y rig h t ow ner. F u rth e r re p ro d u c tio n p ro h ib ited w ithou t p e rm iss io n .

- Frictional force exerted b y th e ad jacen t la y e r of fluid below
th e fluid elem ent; F j
F $= r.h .A Z .................................................. (C.4)
- Frictional force exerted b y th e ad jacen t la y e r of fluid above
th e fluid element; F4
F4 = *TW+Ay H ax = (T + (d f/dy ) Ay ).H .ax.................... (C.5)
For a s tea d y -s ta te flow, th e sum of th e forces acting in the
fluid elem ent m u s t be zero, then
P. h.Ay - (P - (dp/djj) f.Ax) h-Ay + T 'h As - ♦ (d f /d y Ay) ).h.Ax = 0 . . (C.6)
Dividing th e equation by h.Ay.Ax yields
(dp /d x) f.A x-(dT/dy) = ° ................................... (C.7)
Since (dp/dx)f is not a function of w, Equation (C.7) can be
in tegra ted w ith respect to w. S eparating variab les an d in tegrating
gives
'r'=w(<jp/<yI*r0 ..........................(«)
T0 is th e constan t of in tegration and correponds to th e shear
s tress a t w = 0. The shear ra te , v , is given b y
Y .-C d y /d y ) .................................................(C.9)
R e p ro d u c e d w ith p e rm iss io n of th e co p y rig h t ow ner. F u rth e r re p ro d u c tio n p ro h ib ited w ithou t p erm iss io n .

Thus, for th e N ew tonian model com bining (C.8) and (C.9), it
yields
(C.10)
Separating variables and in tegrating gives:
v = (- 72/ 2v )(d p /dx)f - fT0y/v) * v0
W here v0 is th e second constan t of integration, w hich
corresponds to th e fluid velocity a t w = 0. Considering th a t th e fluid
w ets th e slot walls, th e velocity, v, is zero for y = 0 and for y = w.
Then, applying these boundary conditions to equation (C.ll), it becomes
q - / v-dA - f v.h.dy - (h/2v) (dp /d^ J * ( wy - y2) d y (C. 13)
v = (l/2v) (dp/djlf ( w.y - y2) (C.12)
The flow ra te , q, is given b y
Integrating th is equation from y = 0 to y = w, yields
q = (wJ.h / 12v) (dp/djj), (C.14)
R e p ro d u c e d with p e rm is s io n of th e co p y rig h t ow ner. F u rth e r re p ro d u c tio n p ro h ib ited w ithou t p e rm iss io n .

2 2 3
S ubstitu ting (dp/dx)f for th e slot approxim ation given by
Equation (C.14) in to Equation (C.l) yields
q - lw.w?h / (64*)) Mp/<J,)e .............................(C.15)
W here w in Equation (C.15) is th e m a x im u m w id th of th e
elliptical cross-sectional a re a of th e frac tu re , an d h is th e frac tu re height.
R e p ro d u c e d w ith p e rm iss io n of th e co p y rig h t ow ner. F u rth e r re p ro d u c tio n p ro h ib ited w ithou t p erm iss io n .

223a
APPENDIX D
R e p ro d u c e d with p e rm is s io n of th e co p y rig h t ow ner. F u rth e r re p ro d u c tio n p ro h ib ited w ithou t p e rm iss io n .
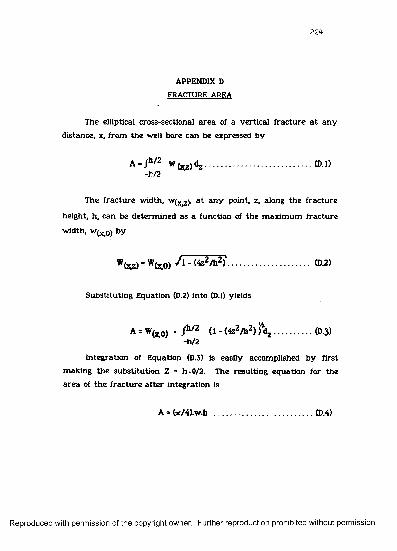
2 2 4
APPENDIX D
FRACTURE AREA
The elliptical cross-sectional a re a of a vertica l frac tu re a t a n y
distance, x, from th e well bore can be expressed by
The frac tu re w idth, W(x>z), a t a n y point, z, along th e frac tu re
height, h , can be determ ined as a function of th e m ax im um frac tu re
w idth, W(x o) by
S ubstitu ting Equation (D.2) in to (D.l) yields
A - Wfco, . Jh/2 (J - (4z2/b2) ) \ ................0>.3»- h /2
In tegration of Equation (D.3) is easily accomplished b y first
m aking th e substitu tion Z = h.©/2. The resulting equation for th e
a re a of th e frac tu re a fte r in teg ration is
A = / h/2 (D.l)
(D.2)
A * (ir/4).W .h CD-4)
R e p ro d u c e d w ith p e rm iss io n of th e co p y rig h t ow ner. F u rth e r re p ro d u c tio n p ro h ib ited w ithou t p erm iss io n .
224a
APPENMX E
R e p ro d u c e d with p e rm iss io n of th e co p y rig h t o w n er. F u rth e r re p ro d u c tio n p ro h ib ited w ithou t p e rm iss io n .
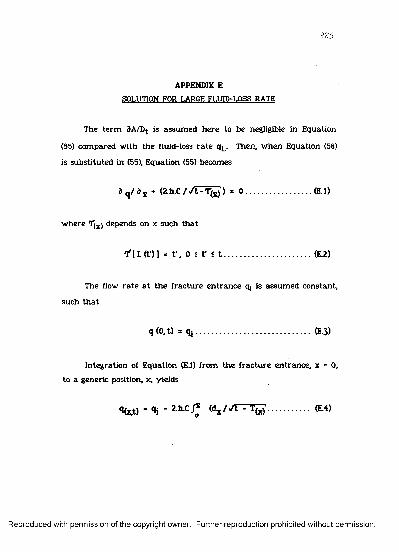
2 2 5
APPENDIX E
SOLUTION FOR LARGE FLUID-LOSS RATE
The te rm dA/Dj- is assum ed h ere to be negligible in Equation
(55) com pared w ith th e fluid-loss ra te q ^ Then, w hen Equation (58)
is substitu ted in (55), Equation (55) becomes
d q / d x + < 2 .fa .C // t-T fe)*) - ............0 ..................... (E.l)
w here T(x) depends on x such th a t
'I 'l L f t ') ] = t \ 0 i V i t ...........................................(E.2)
The flow ra te a t th e frac tu re en tran ce qj is assum ed constant,
such th a t
q(0 ,t) = q j .................................................(E.3)
In tegration of Equation (E.l) from th e f rac tu re en trance , x = 0 ,
to a generic position, x, yields
q&t) * % - 2 h-c% .......... ... « .«
R e p ro d u c e d with p e rm is s io n of th e co p y rig h t ow ner. F u rth e r re p ro d u c tio n p ro h ib ited w ithou t p e rm iss io n .
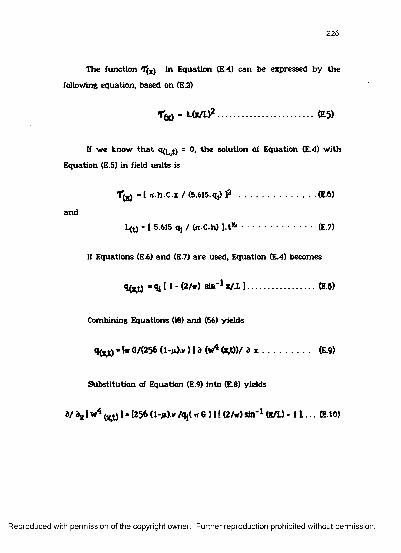
226
The function T(x) in Equation (E.4) can be expressed b y th e
following equation, based on (E.2)
*<*> - tfc/L)2 ..................................................<E.5>
If w e know th a t qfl^t) = °> th e solution of Equation (E.4) w ith
Equation (E.5) in field u n its is
« [ n .h .C .x / (5.615.qp J2 ....................................... (E.6)
and
L(t) - [ 5.615 q, / (n.C.h) J . t * ...................................... (E.7)
If Equations (E.6) an d (E.7) a re used, Equation (E.4) becomes
q(*t) *flt n - c m sin'1 m i ...................... cm)
Combining Equations (18) an d (56) yields
q^t) - 1« G/(256 <1-m>* ) 1i (w4 <*t))/ i s ........................ (E.9)
S ubstitu tion of Equation (E.9) in to (E.8) yields
i f a* I w4 ) • 1256 (1-jO.v /qt(w G) ]! (2/*) sin'1 te/L) • 1 L. . . (MO)
R e p ro d u c e d with p e rm is s io n of th e co p y rig h t ow ner. F u rth e r re p ro d u c tio n p ro h ib ited w ithou t p e rm iss io n .

227
In tegration of Equation (E.10) from 0 to x gives
w&t) ■ 41 <2<l-pL).w.qi2>/ (*J.O£A) ]1 /41 (x/D sjn '1 Ot/L) ♦
( iV a 2) ) , / 2 -(*X/2L)11/4 t , / 8 .................................... (E ll)
The m ax im u m frac tu re w idth occurs a t x=0; therefore,
Equation (E.ll), used w ith field units, yields
W(0t) - 0.0664631 (2 (1-jO.v.qj2) /(^ .G .C .h ) ] 1/4 t l / * . . . . (E.12)
The dim ensionless form s for f rac tu re length and w id th a t th e
well bore a re obtained b y m eans of Equations (58):
- <2/*)V/2 .................................(E.13)
and
................................. (B. 14)
R e p ro d u c e d with p e rm is s io n of th e co p y rig h t ow ner. F u rth e r re p ro d u c tio n p ro h ib ited w ithou t p e rm iss io n .
227a
APPENP1X.-F.
R e p ro d u c e d with p e rm is s io n of th e co p y rig h t ow ner. F u rth e r re p ro d u c tio n p ro h ib ited w ithou t p e rm iss io n .

2 2 8
APPENDIX F
DESCRIPTION OF THE DATAFILE FOR THE COMPUTER PROGRAM LEAK
MMdrBelated.flata
LINE 1 - M ud Properties.
RHOM (LB/GAL) - M ud density .
VISCM (CP) - M ud plastic viscosity.
YP (LB/100 FT2) - M ud yield point.
GEL (LB/100 FT2 ) - M ud 10-min gel.
API (CM3) - API fluid loss reported a t 30 m in (standard test).
VSP (CM3) - S p u rt loss. If not available en te r zero. The s p u rt loss
effect in th e model is v e ry sm all (see chap ter 3, "Proposed
M athem atica l Model").
LINE 2- M ud Composition and o the r P aram eters .
SS OB) - Solids sa tu ra tio n in th e m ud.
SO OB) - Oil sa tu ra tio n in th e m ud.
Q1 (BPM) - Flow ra te used o r to be used in th e leak-off test.
TDRILL (MIN) - Drilling tim e to drill th e open-hole section.
TCIRC (MIN) - Time circulating before th e leak-off te s t begins.
Wg-lLSgom etry
LINE 3 - Casing-string d a ta
ODCSG (in.) - Casing outside d iam eter.
DICSG (in.) - Casing inside d iam eter.
OLCSG (ft) - Casing length.
R e p ro d u c e d with p e rm iss io n of th e co p y rig h t ow ner. F u rth e r re p ro d u c tio n p roh ib ited w ithou t p e rm iss io n .
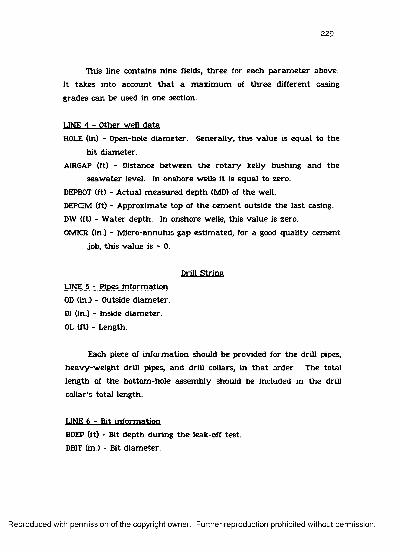
2 2 9
This line contains n ine fields, th re e for each p a ra m e te r above.
It takes in to account th a t a m ax im um of th re e d ifferen t casing
g rades can be used in one section.
LINE 4 Qt hgr ... well-d a ta
HOLE (in) - Open-hole d iam eter. Generally, th is value is equal to th e
bit d iam eter.
AIRGAP (ft) - Distance betw een th e ro ta ry kelly bushing and th e
seaw ate r level. In onshore wells it is equal to zero.
DEPBOT (ft) - A ctual m easured dep th (MD) of th e well.
DEPCIM (ft) - A pproxim ate top of th e cem en t outside th e la st casing.
DW (ft) - W ater depth. In onshore wells, th is va lue is zero.
OMICR (in.) - M icro-annulus gap estim ated , for a good q u a lity cem ent
job, th is va lue is ~ 0 .
Drill S tring
LINE 5 - Pipes inform ation
OD (in.) - Outside d iam eter.
DI (in.) - Inside d iam eter.
OL (ft) - Length.
Each piece of in fo rm ation should be provided for th e drill pipes,
h eavy -w eigh t drill pipes, and drill collars, in th a t order. The to tal
length of th e bottom -hole assem bly should be included in th e drill
collar's to ta l length.
LINE 6 - Bit inform ation
BDEP (ft) - Bit depth during th e leak-off te st.
DBIT (in.) - Bit d iam eter.
R e p ro d u c e d with p e rm is s io n of th e co p y rig h t ow ner. F u rth e r re p ro d u c tio n p ro h ib ited w ithou t p e rm iss io n .

230
AJ1, AJ2, AJ3 (/32 in.) - J e ts size. Sizes for all th re e je ts should be
entered .
Of^nihoLeJloxma tion
LINE 7 - Depths an d T em peratu re inform ation
HPERM 1 (ft) - Total perm eable height. The sum of th e height of
each perm eable fo rm ation in th e open-hole section.
HPERM 2 (ft) - P erm eable height of th e fo rm ation to be frac tu red .
TVDB (ft) - True vertica l depth of th e w ell-bottom . In th e case of a
v ertica l well: TVDB = DEPBOT.
TVDS (ft) - True v ertica l dep th of th e casing shoe.
DEP1 (ft) - True v ertica l dep th of th e top of th e fo rm ation to be
frac tu red . G enerally, th is va lue is equal to TVDS.
DEP2 (ft) - T rue v ertica l dep th of th e bottom of th e fo rm ation to be
frac tu red .
GTEMP (°F/100 ft) - Local te m p e ra tu re gradient.
LINE 8 - RocK _rela_tedj_arameters
P (PSI) - Pore p ressure of fo rm ation to be frac tu red .
ZFOR - Polsson's ra tio of rock (Figure 31).
EFOR - Young's m odulus of rock (Equation 85).
ALPHA - Biot’s constan t.
ST (PSD - Tensile s tren g th of th e form ation .
PHI - Surface porosity .
AK - Porosity-decline constan t.
RHOGR (LB/GAL) - A verage g rains density .
RHOFL (LB/GAL) - F orm ation fluid density .
R e p ro d u c e d with p e rm iss io n of th e co p y rig h t o w n er. F u rth e r re p ro d u c tio n p ro h ib ited w ithou t p e rm iss io n .

231
Figure F.l shows th e d a ta file used to produce th e ou tpu t
exam ple of Figure 38, w hich follows th e d a ta file organization
described above.
R e p ro d u c e d w ith p e rm iss io n of th e co p y rig h t ow ner. F u rth e r re p ro d u c tio n p ro h ib ited w ithou t p erm iss io n .

2 3 2
10.8 23.0 8.0 9.0 16.0 3 0
026 0.02 023 20. 120.
9.625 8.333 12941. 0. 0. 0. 0. 0. 0.
13-0 108. 12931. 8000. 93. 0.
3 0 4276 8778. 3D 4.0 2700. 623 2213 1463.
12940. 8.3 11. 11. 11.
10. 10. 12332. 12342. 12342. 12332. 1.14
3900. 0.30 1.324E06 0.79 300. 0.42 0.0000731 21.643 8.94
999. 999.
4.0 1230.
30 1610.
33 1790.
6J0 1990.
6.3 2173.
7.0 2290.
7.3 2430.
8.0 2690.
9j0 2930.
10.0 3123.
1023 3200.
10.3 3230.
999. 999.
FIGURE F.l - Data Flic Organization Used to Produce th e O utput
Exam ple of Figure 38.
R e p ro d u c e d w ith p e rm iss io n of th e co p y rig h t ow ner. F u rth e r re p ro d u c tio n p ro h ib ited w ithou t p erm iss io n .
232a
APPENDIX 6
R e p ro d u c e d with p e rm is s io n of th e co p y rig h t ow ner. F u rth e r re p ro d u c tio n p ro h ib ited w ithou t p e rm iss io n .

2 3 3
APPENDIX G
ELASTIC-PLASTIC SOLUTION OF A HOLLOW CYLINDER
The hollow cy linder Rj < r < R2 in p lane s tra in show n in Figure
30 w ith p ressu re pj applied a t Rj and p ressu re P2 applied a t R2 is
considered here. There is a plastic region, Rj < r < R, and an elastic
region R < r < R2. The radius, R, of th e elastic-plastic bou n d ary is
de term ined b y th e technique described in th e ch ap te r "Proposed
M athem atica l Model" and co n tinu ity conditions have to be satisfied the re .
The radial, <Tr , and tangen tia l stresses, (Tq, for a hollow cylinder
a re obtained from th e elastic ity th e o ry (Timoshenko and Goodier 1957), an d a re expressed b y
(Tr = (x ♦ 2 G) (C^/dy) + (x u / r ) ......................................... (G. 1)
<re = x (d u /d r ) + <x + 2 G )<u/r)........................................... (G.2)
w here X is th e Lam e's constan t and u th e d isplacem ent a t th e
radius, r . Since th e in ternal, pj , an d ex ternal, p2 , p ressu res a re
independent of r and th e vertica l direction Z, th e stress equation is
given b y (Jaeger and Cook 1979)
d<rr / d r ♦«rf -<r8V r - o ...................................... (G.3)
R e p ro d u c e d with p e rm iss io n of th e co p y rig h t ow ner. F u rth e r re p ro d u c tio n p roh ib ited w ithou t p e rm iss io n .

23k
Substitu tion of Equation (G.l) and (G.2) into (G.3) yields
(d2u/df2) + (1/r) ( d ^ ) - u /r2 - 0 ...............................(G.4)
The general solution of (G.4) is
u = A . r ♦ B /r .............................................. (G.5)
w here A and B a re constan ts of in tegrta tion th a t can be determ ined
b y th e boundary conditions
<Tr = Pi w hen r =
(Tr = P2 w hen r = R2
plastic * elastic w hen r = R
«Te> plastic = Mastic w hen r = R ..................... (G.6)
Plastic Reaion
The p lasticity th e o ry (Jaeger and Cook 1979) indicates th a t th e
yield condition expressed b y th e following equation
{T0 -(Tr » 2 K .......................................... (G.7)
m u s t be satisfied. The p a ram e te r K is re la ted to th e yield stress of
th e rock, <T 0 , b y th e expression K * (T0 / /3 .
R e p ro d u c e d with p e rm is s io n of th e co p y rig h t ow ner. F u rth e r re p ro d u c tio n p ro h ib ited w ithou t p e rm iss io n .

2 3 5
S ubstitu tion of Equation (G.l) and (G.2) in to (G.7) w ith th e
bo u n d ary conditions (G.6), yields
A - I P 2 4(KR2/R22)ll /2 (X * G )............................ (G.d)
B -E R 2/2G ................................................................ (G.9)
The to tal s tra in (plastic + elastic), a t a distance, r , from th e
borehole, cr , is expressed b y
• r - V ^ r .............................................*G10)
S ubstitu tion of Equations (G.8) and (G.9) in to (G.5), and
derivation of th e resulting equation w ith respect to r , yields
V dr * *r * 1 p2 ♦ ® r2 /*22 M /(2 fe ♦ 0) > - * *2/(2 6 r2) .......... (G.U)
The value of K can be found b y combining Equations (G.3) w ith
(G.7), w hich yields
<!<Fr / 6 r » 2 K / r .............................................(G.12)
Solving Equation (G.12), using th e boundary conditions (G.6),
gives
E - <P, - P2) / ( Ot/Kj)2 ‘ l0««n W/Ei)2 - 1 ) ..................... (G.13)
R e p ro d u c e d with p e rm iss io n of th e co p y rig h t o w n er. F u rth e r re p ro d u c tio n p ro h ib ited w ithou t p e rm iss io n .

236
Finally, substitu ting Equation G.13 in to (G.ll) gives
«, - 1P2 ♦ <R/R2)2 0>!-P2) / I<R/R2)2 - k>g« «/R 2)2 '11 /(2<x ♦ G»
- lR2/(2.G.f2 )1 ( P j - P2 )/ [«/R2> - log* «/R2)2 - II ....................(G.14)
The s tra in a t th e borehole wall, r = Rj, if th e well is considered
as a hole in th e middle of a n infinitive p late, R2 -* “ , according to
Equation (G.14), is
Cg, - P2/(2 (X* G)) ♦ (R/R,)2 (1/2G) [(P , - p2)/ 0 * log* (R/R,)2) 1
........................................................................................................... (G.15)
For a n in c rem en t of p ressure, APj, a t th e borehole w all, Rj ,
and considering th a t fa r from th e well bore, AP2 = 0, Equation (G.15)
is reduced to
Eg, = <R/R,)2 / G* log* (R/R,)2) . 4 P ,/2 6 ...........................(G.I6)
R e p ro d u c e d with p e rm is s io n of th e co p y rig h t ow ner. F u rth e r re p ro d u c tio n p ro h ib ited w ithou t p e rm iss io n .

236a
APPENDIX H
R e p ro d u c e d with p e rm is s io n of th e co p y rig h t ow ner. F u rth e r re p ro d u c tio n p ro h ib ited w ithou t p e rm iss io n .
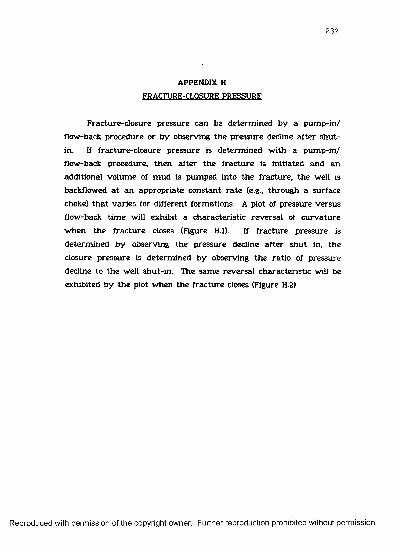
23 7
APPENDIX H
FRACTURE-CLOSURE PRESSURE
F ractu re-closure p ressure can be determ ined by a pum p-in /
flow-back procedure or b y observing th e p ressu re decline a fte r sh u t-
in. If frac tu re-c lo su re p ressure is de term ined w ith a pum p-in /
flow-back procedure, th e n a fte r th e frac tu re is in itia ted and an
additional volum e of m u d is pum ped in to th e frac tu re , th e well is
backflowed a t an approp ria te constan t r a te (e.g., th rough a surface
choke) th a t v a ries for d ifferent form ations. A plot of p ressure versus
flow-back tim e will exhibit a characte ristic reversa l of c u rv a tu re
w hen th e fra c tu re closes (Figure H.l). If frac tu re pressure is
d eterm ined b y observing th e pressure decline a fte r sh u t in, th e
closure p ressure is determ ined b y observing th e ra tio of pressure
decline to th e well shu t-in . The sam e reversa l characteristic will be
exhibited b y th e plot w hen th e frac tu re closes (Figure H.2).
R e p ro d u c e d with p e rm iss io n of th e co p y rig h t o w n er. F u rth e r re p ro d u c tio n p ro h ib ited w ithou t p e rm iss io n .

2 3 8
PRESSURE
P U M P -IN
F L O W -B A C K
_CLOSURE_P R E S S U R E
TIME
a - R o te to o low b - C o r r e c t r a t e c - R o te to o f a s t
FIGURE H.l - Pum p-in/flow -back test.
R e p ro d u c e d w ith p e rm iss io n of th e co p y rig h t ow ner. F u rth e r re p ro d u c tio n p ro h ib ited w ithou t p erm iss io n .
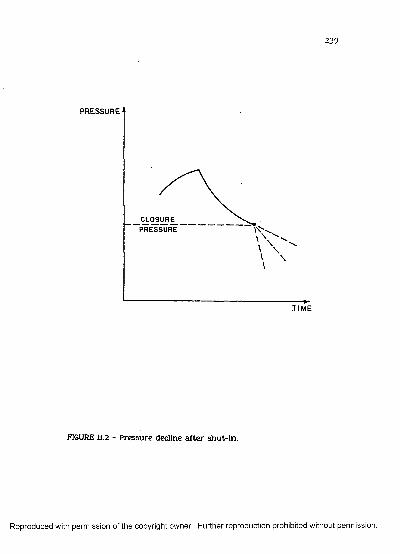
239
PRESSURE
CL O S UR E_
P R E S S U R E
-TIME
FIGURE H.2 - P ressure decline a fte r sh u t-in .
R e p ro d u c e d w ith p e rm iss io n of th e co p y rig h t ow ner. F u rth e r re p ro d u c tio n p ro h ib ited w ithou t p erm iss io n .

240
VITA
M auricio de Aguiar Almeida, th e son of M anoel de Almeida and
Irinea de A guiar Almeida, w as born on April 14, 1956, in Rio de
Janeiro , RJ, Brazil. He graduated from Funda<?ao Tecnico-Educacional
Souza M arques in December 1978, receiving his Bachelor of Science
degree in m echanical engineering. A fter graduation , he joined th e
petro leum engineer staff of Petroleo Brasileiro S. A. - PETROBRAS in
Salvador, Bahia, Brazil, in 1979, w h ere he a ttended petro leum
engineering classes un til 1980. A fter receiving one y e a r of tra in ing
on oil rigs in th e field, he joined th e drilling engineer s taff of th e
P etrobras Research Center in Rio de Janeiro , RJ, Brazil. He w orked
th e re u n til A ugust of 1982, w hen he w as selected to en te r Louisiana
S ta te U niversity to pu rsue a M aster of Science degree in petro leum
engineering. A fter receiving his M as te r’s degree in th e su m m er of
1985, he continued studies in LSU’s Ph.D. program . Upon graduation ,
he will r e tu rn to w ork in th e PETROBRAS Research Center in Brazil. He m a rried M aria de F atim a Cabral in J a n u a ry , 1979, and has tw o daugh ters , Thais and Priscila.
R e p ro d u c e d with p e rm is s io n of th e co p y rig h t ow ner. F u rth e r re p ro d u c tio n p ro h ib ited w ithou t p e rm iss io n .

Major Field:
DOCTORAL EXAMINATION AND DISSERTATION REPORT
Mauricio De Aguiar Almeida
Petroleum Engineering
Title of Dissertation: Computer Aided Analysis of Formation Pressure Integrity TestsUsed in Oil Well Drilling
Approved:
Major Professor and Chamnim v
i]jLDean of the Graduate Slhool
EXAMINING COM]
Date of Examination:
August 25 , 1986
R e p ro d u c e d with p e rm iss io n of th e co p y rig h t ow ner. F u rth e r re p ro d u c tio n p ro h ib ited w ithou t p e rm iss io n .