compressive structured light for recovering inhomogeneous participating media
TRANSCRIPT

Compressive Structured Light for Recovering
Inhomogeneous Participating Media
Jinwei Gu, Shree Nayar, Eitan Grinspun,Peter Belhumeur, and Ravi Ramamoorthi
Columbia University, New York, NY 10027, [email protected]
Abstract. We propose a new method named compressive structuredlight for recovering inhomogeneous participating media. Whereas con-ventional structured light methods emit coded light patterns onto thesurface of an opaque object to establish correspondence for triangulation,compressive structured light projects patterns into a volume of partici-pating medium to produce images which are integral measurements of thevolume density along the line of sight. For a typical participating mediumencountered in the real world, the integral nature of the acquired imagesenables the use of compressive sensing techniques that can recover theentire volume density from only a few measurements. This makes theacquisition process more efficient and enables reconstruction of dynamicvolumetric phenomena. Moreover, our method requires the projection ofmultiplexed coded illumination, which has the added advantage of in-creasing the signal-to-noise ratio of the acquisition. Finally, we proposean iterative algorithm to correct for the attenuation of the participatingmedium during the reconstruction process. We show the effectiveness ofour method with simulations as well as experiments on the volumetricrecovery of multiple translucent layers, 3D point clouds etched in glass,and the dynamic process of milk drops dissolving in water.
1 Introduction
Structured light has a long history in the computer vision community [1]. It hasmatured into a robust and efficient method for recovering the surfaces of objects.By projecting coded light patterns on the scene, and observing it using a camera,correspondences are established and the 3D structure of the scene is recoveredby triangulation. Over the years, researchers have developed various types ofcoding strategies, such as binary codes, phase shifting, spatial neighborhoodcoding, etc. All structured light range finding approaches are based on a commonassumption: Each point in the camera image receives light reflected from a singlesurface point in the scene.
However, many real-world phenomena can only be described by volume den-sities rather than boundary surfaces. Such phenomena are often referred to asparticipating media. Examples include translucent objects, smoke, clouds, mix-ing fluids, and biological tissues. Consider an image acquired by photographing
2
a volume of a participating medium. Unlike in the case of an opaque object,here each pixel receives scattered light from all points along the line of sight
within the volume. Narasimhan et al. [2] have addressed the problem of recov-ering opaque surfaces immersed in a participating medium (rather than a clearmedium) using structured light range finding. The goal in this case is to makeexisting structured light range finding methods robust to light scattering by themedium, rather than recover the medium itself.
The problem of recovering the volume density of a participating medium(in particular, smoke), was addressed by Hawkins et al. [3]. They used a high-powered laser sheet and a high-speed camera (5000fps) to measure thin slices ofa smoke density field via scanning, which is similar to a technique termed laser-induced fluorescence (LIF) in the fluid imaging community [4]. Fuchs et al. [5]proposed the idea of shooting a set of static laser rays into the volume and usingspatial interpolation to reconstruct the volume. However, the measurements areinherently sparse in this case and hence the recovered density is low in resolution.
In this paper, we show that by using coded light patterns, one can make themeasurement of a participating medium highly efficient in terms of acquisitiontime as well as illumination power. In particular, we exploit the fact that thebrightness measurements made at image pixels correspond to true line-integralsthrough the medium (see Fig. 1a), and then solve for its volumetric density. Weconsider both spatially- and temporally-coded light patterns. Because the pat-terns are predetermined, measurement and reconstruction time are decoupled.We target low-density inhomogeneous media, for which the density function issparse in an appropriately-chosen basis1; this allows us to harness compressivesensing techniques [6, 7] that accurately reconstruct a signal from only a fewmeasurements. We refer to our approach as compressive structured light.
We show that compressive structured light is more economical than a straight-forward sequential scanning of a volume. Whereas the sampling rate of the latteris limited by the desired resolution, the sampling rate of the former is restrictedby the sparsity of the data–a considerably more relaxed constraint for low-densityphenomena. Since our approach requires fewer measurements, it naturally en-ables the recovery of dynamic participating media. An added advantage of com-pressive structured light, is that it requires the projection of multiplexed codedillumination which results in measurements with higher signal-to-noise ratio [8].An important practical consequence is that light sources of significantly lowerpower than in the case of sequential scanning can be used.
We have implemented our approach using a digital projector and a camera asshown in Fig. 1c. The projector and the camera are synchronized and both oper-ate at 360fps. Using 24 coded light patterns, we are able to recover a 1283 volumeat 15fps. Using this system, we have recovered various types of inhomogeneousparticipating media, as shown in §7.
1 “sparse” does not necessarily imply that the volume density must be sparsely dis-tributed in space. It means that the density can be represented with a few non-zerocoefficients in an appropriately-chosen basis, such as, wavelets, gradients, principalcomponents, etc.

3
y
z
x
Projector
L(x,y)
Camera
m
n
I(y,z)
Participating
Medium
(a)
I y,z
L x,y
( , , )x y zρ
(b)
Projector
Camera
Milk
Drops
(c)
Fig. 1. (a) Compressive structured light for recovering inhomogeneous participatingmedia. Coded light is emitted along the z-axis to the volume while the camera ac-quires images as line-integrated measurements of the volume density along the x-axis.The light is coded in either the spatial domain or temporal domain with a predeter-mined sequence. We reconstruct the volume density from the measurements by usingcompressive sensing techniques. (b) Image formation model for participating mediumunder single scattering. The image irradiance at one pixel, I(y, z), depends on the inte-gral along the x-axis of the projector’s light, L(x, y), and the medium density, ρ(x, y, z),along a ray through the camera center; refer to (1)–(2). (c) Experiment setup.
2 Related Work
Compressive Sensing Compressive sensing [6, 7] is a nascent field of appliedmathematics with a variety of successful applications including imaging [9], med-ical visualization [10], and face recognition [11]. It offers a theoretical frameworkto reconstruct “sparse” signals from far fewer samples than required by the con-ventional Shannon sampling theorem. Our work builds on the basic formulationof compressive sensing, which we augment with auxiliary terms specific to thereconstruction of volume density.
Reconstruction of Volumetric Phenomena There are several recent works in re-construction of volumetric phenomena from multiple views. Hasinoff et al. [12]used two views to reconstruct flames by assuming flames are surfaces in thevolume. Based on tomographic algorithms, Ihrke et al. [13, 14] and Trifonov etal. [15] used eight views and 72–360 views, respectively, for recovering flames(and smoke) as well as transparent objects. We mentioned light-based meth-ods [3–5] earlier in the previous section. For a comprehensive survey of works inthis area, see Ihrke et al. [16].
Multiplexed Illumination Our work is also related to multiplexed illumination [8]in that both use coded light as illumination. However, there is a fundamentaldifference: Whereas the conventional multiplexing aims at increasing signal-to-noise ratio of the measurements, our work aims at increasing the efficiency ofthe acquisition process, i.e., to reconstruct high dimensional signals from a fewmeasurements. In summary, both the coding strategies and the reconstructionalgorithms are different.

4
3 Background on Compressive Sensing
In its simplest form, compressive sensing seeks a solution of the underdeterminedlinear system Ax = b, where x ∈ R
n is a sparse signal, A is an m×n matrix(“measurement ensemble”), and b is the vector of m measurements, with m<n.
Compressive sensing theory asserts that one can recover the signal from farfewer measurements than the dimension of the signal, if the signal is sparse—it isrepresented with few non-zero coefficients in a suitable basis—and the measure-ments are uncorrelated, in the sense that each measurement is an inner productof the signal with a test function that has a necessarily dense representation inthe chosen basis. Given a measurement ensemble matrix A, compressive sam-pling theory predicts that x is the minimizer of ||x||1, subject to Ax = b.
The above reconstruction strategy has been shown to work well for sparsesignal estimation, even from a noisy measurement [17]. In our work, we augmentthe basic problem above with auxiliary terms that enforce the nonnegative con-straint for the signal, and that exploit the sparsity not only of the signal valuebut also its gradient. Indeed, our evaluation (§6, §7) indicates that using thesparsity of the gradient is important for accurate and efficient reconstruction.
4 Image Formation Model
In this section, we derive the relationship between the volume density ρ andthe image irradiance I of the camera under our camera/projector setting. Wefocus on non-emissive participating media with relatively low density in whichmultiple scattering is assumed to be negligible.
As shown in Fig. 1b, each camera pixel receives light scattered from a row ofvoxels along the line of sight in the volume (i.e., the red line in Fig. 1b). Considerone such voxel. Before the light scattered by this voxel reaches the camera, it isfirst attenuated as it travels from the projector to the voxel, scattered at the voxel,and then attenuated as it travels from the voxel to the camera. Under the assump-tion of single scattering, the final radiance sensed by the camera from this partic-ular voxel is [18]: L(x, y) ·exp(−τ1) ·σs ·ρ(x, y, z) ·p(θ) ·exp(−τ2), where ρ(x, y, z)is the participating medium’s volume density at the voxel, p(θ) is the phase func-tion, and τ1 = σt
∫s1
ρds1 and τ2 = σt
∫s2
ρds2 are the “optical distance” from theprojector to the voxel and from the voxel to the camera, respectively; σs and σt
are the scattering coefficient and the attenuation coefficient of the participatingmedium [18]. Since p(θ) is the same for all voxels under orthographic projectionfor both the camera and the projector, the above formula can be simplified to(up to a scale related to p(θ) and σs): L(x, y) · exp (−(τ1 + τ2)) · ρ(x, y, z). Theimage irradiance, I(y, z), which is the integral of the scattered light from all thevoxels along the line, is therefore
I(y, z) =
∫x
L(x, y) · exp (−(τ1 + τ2)) · ρ(x, y, z)dx . (1)
In the low density case, or when σt is relatively small compared with the scatter-ing, the effect of attenuation usually can be ignored [3, 5], i.e., the exponential

5
term in the above equation is equal to 1. Equation (1) thus can be reduced to alinear projection of the light and the volume density,
I(y, z) =
∫x
ρ(x, y, z) · L(x, y) dx . (2)
For media where the attenuation cannot be ignored, we present a simple, iterativemethod based on iterative relinearization (see §5.3).
5 Compressive Structured Light
(a) (b) (c) (d)x
y
time
time
Camera
z
Fig. 2. Different coding strategies of the light L(x, y) at time t for recovering inho-mogeneous participating media: (a) scan (one stripe turned on) [4, 3]; (b) laser-linesinterpolation (one pixel turned on per one row) [5]; (c) Spatial coding of compressivestructured light (all pixels are turned on with random values per time frame); (d) Tem-poral coding of compressive structured light (random binary stripes are turned on pertime frame). Compressive structured light, shown in (c) and (d), recovers the volumeby reconstructing the 1D signal along x-axis from a few integral measurements.
In this section, we explain the idea of compressive structured light for recov-ering inhomogeneous participating media. For participating media, each camerapixel receives light from all points along the line of sight within the volume. Thuseach camera pixel is an integral measurement of one row of the volume density.Whereas conventional structured light range finding methods seek to triangulatethe position of a single point, compressed structured light seeks to reconstructthe 1D density “signal” from a few measured integrals of this signal.
This is clearly a more difficult problem. One way to avoid this problem isto break the integrals into pieces which can be measured directly. The price,however, is the deterioration of either spatial resolution or temporal resolutionof the acquisition. Existing methods either illuminate a single slice at a time andscan the volume (see Fig. 2a and [4, 3]), thus sacrificing temporal resolution, orthey illuminate a single pixel per row and use interpolation to reconstruct thevolume (e.g., Fig. 2b and [5]), sacrificing spatial resolution.
In contrast, the proposed compressive structured light method uses the lightmuch more efficiently, projecting coded light patterns that yield “signatures,” orintegral measurements, of the unknown volume density function.

6
The didactic illustration in Fig. 1a depicts a simple lighting/viewpoint geom-etry under orthographic projection, with the camera viewpoint along the x-axis,and the projector emitting along the z-axis. Consider various coding strategies ofthe 3D light function L(x, y, t): Spatial codes (Fig. 2c) recover the volume from asingle image by trading spatial resolution along one dimension; Temporal codes(Fig. 2d) trade temporal resolution by emitting a sequence of vertical binarystripes (with no coding along y-axis), so that full spatial resolution is retained.2
We will see that these compressive structured light codes yield high efficiencyboth in acquisition time and illumination power; this comes at the cost of a moresophisticated reconstruction process, to which we now turn our attention.
5.1 Formulation
Consider first the case of spatial coding. Suppose we want to reconstruct a volumeat the resolution n×n×n (e.g., n=100). The camera and the projector have theresolution of M×M pixels (e.g., M =1024). Therefore, one row of voxels alongthe x-axis (refer to the red line in Fig. 1a) will receive light from m=M/n (e.g.,m = 1024/100≈ 10) rows of the projector’s pixels. The light scattered by thesevoxels in the viewing direction will then be measured, at each z-coordinate,by a vertical column of m camera pixels. Thus, using the fact that we havegreater spatial projector/camera resolution than voxel resolution, we can havem measurements for each n unknowns. Similarly, we can also acquire these mmeasurements using temporal coding, i.e., changing the project light patterns ateach of the m time frames.
Without loss of generality, we use l1 =L(x, 1),· · · ,lm =L(x,m) to denote them rows of pixels from the projector, and b1 =I(1, z),· · · ,bm =I(m, z) to denotethe image irradiance of the m pixels in the camera image. Let x=[ρ1,· · · ,ρn]T
be the vector of the voxel densities along the row. Assuming no attenuation, theimage irradiance for each of these m pixels is a linear projection of the light andthe voxels’ density from (2): bi = lT
ix, i = 1,· · · ,m. Rewriting these m equations
in matrix form, we have: Ax = b, where A = [l1,· · · ,lm]T
is a m×n matrix,
b=[b1,· · · ,bm]T
is a m×1 vector.Thus, if attenuation is not considered, the problem of recovering the volume is
formulated as the problem of reconstructing the 1D signal x given the constraintsAx = b. To retain high spatial and temporal resolution, we often can only affordfar fewer measurements than the number of unknowns, i.e., m < n, which meansthe above equation is an underdetermined linear system and optimization isrequired to solve for the best x according to certain priors.
One benefit of this optimization-based reconstruction is high efficiency inacquisition, which we quantify using the measurement cost, m/n, where m isthe number of the measurements and n is the number of unknowns (i.e., thedimension of the signal). For example, the measurement cost of the scanningmethod [4, 3] is one. We show that by exploiting the sparsity of the signal, wecan reconstruct the volume with much lower measurement cost (about 1
8 to 14 ).
2 All of the 4 methods shown in Fig. 2 can be equally improved using color channels.

7
Table 1. Different norms used for reconstruction
Method Optimization Functional Constraints
Least Square (LS) ||Ax − b||2Nonnegative Least Square (NLS) ||Ax − b||2 x ≥ 0
CS-Value ||x||1 Ax = b, x ≥ 0
CS-Gradient ||x′||1 Ax = b, x ≥ 0
CS-Both ||x||1 + ||x′||1 Ax = b, x ≥ 0
5.2 Reconstruction via Optimization
Formulation Solving the underdetermined linear system requires some prior (as-sumed) knowledge of the unknown signal, which can be represented as optimiza-tion functionals or constraints on the data. We consider several alternatives, aslisted in Table 1. Besides the commonly-used Least Square (LS) and Nonnega-tive Least Square (NLS), we consider functionals using ℓ1-norms, as these biastoward sparse representations:3
First, we observe that for many natural volumetric phenomena, often onlya small portion of the entire volume is occupied by the participating media.For example, consider the beautiful ribbon patterns generated by smoke; simi-larly, sparsity was implicitly used to reconstruct (surface-like) flames [12]). Thissuggests the use of the ℓ1-norm of the signal value (CS-Value).
Furthermore, the sparsity of gradients of natural images is well studied [20,21]. Related work in image restoration [22] uses nonlinear optimization to mini-mize “total variation,” i.e., the sum of ℓ2-norm of image gradient. In this vein,we consider the use of ℓ1-norm on the signal’s gradient (CS-Gradient).
Finally, consider a dynamic process, such as milk dissolving in water: herediffusion decreases the signal value’s sparsity over time, but it increases thegradient sparsity. Motivated by this observation, we consider the sum of ℓ1-norms of both the value and the gradient (CS-Both), so that the algorithm hasthe ability to “adapt” for the sparsity.Analysis Comparison of these reconstruction methods is first performed on 1Dsynthetic signals. These signals are randomly sampled rows from the volumedensity of smoke acquired in Hawkins et al. [3]. We restrict the measurementcost, m/n, to be 1/4. The measurement ensemble, A, is generated in a waythat each element is drawn independently from a normal distribution and eachcolumn is normalized to 1, which is effectively a white noise matrix and is knownto be good for compressive sensing [7]. NRMSE (normalized root mean squarederror) is used as the measure of error.
The reconstruction results are shown in Fig. 3. The commonly-used LS per-forms the worst, since it merely minimizes the errors without using any prior onthe data. With the nonnegative constraint added, NLS has better performance.CS-Value and CS-Gradient are better than NLS given that both use one more
3 LS and NLS are solved with SVD and Levenberg-Marquardt, respectively. The otherfunctionals are formulated as Linear Programming (LP) and solved with GLPK [19].

8
0 10 20 30 40 50 60 70 80 90 100
0
0.02
0.04
0.06
0.08
0.1
0.12
0.14
0.16
0.18
0.266 0.146 0.0240.053 0.021
0 10 20 30 40 50 60 70 80 90 1000
0.05
0.1
0.15
0.2
0.25
0.3
0.35
0 10 20 30 40 50 60 70 80 90 1000
0.05
0.1
0.15
0.2
0.25
0.3
0.35
0 10 20 30 40 50 60 70 80 90 1000
0.05
0.1
0.15
0.2
0.25
0.3
0.35
0 10 20 30 40 50 60 70 80 90 1000
0.05
0.1
0.15
0.2
0.25
0.3
0.35
0 10 20 30 40 50 60 70 80 90 1000
0.05
0.1
0.15
0.2
0.25
0.3
0.35
0 10 20 30 40 50 60 70 80 90 100
0
0.1
0.2
0.3
0.4
0.5
0.6
0.7
0 10 20 30 40 50 60 70 80 90 100
0
0.1
0.2
0.3
0.4
0.5
0.6
0.7
0 10 20 30 40 50 60 70 80 90 100
0
0.1
0.2
0.3
0.4
0.5
0.6
0.7
0 10 20 30 40 50 60 70 80 90 100
0
0.1
0.2
0.3
0.4
0.5
0.6
0.7
0 10 20 30 40 50 60 70 80 90 100
0
0.02
0.04
0.06
0.08
0.1
0.12
0.14
0.16
0.18
0 10 20 30 40 50 60 70 80 90 100
0
0.02
0.04
0.06
0.08
0.1
0.12
0.14
0.16
0.18
0 10 20 30 40 50 60 70 80 90 100
0
0.02
0.04
0.06
0.08
0.1
0.12
0.14
0.16
0.18
0 10 20 30 40 50 60 70 80 90 100
0
0.02
0.04
0.06
0.08
0.1
0.12
0.14
0.16
0.18
Ground Truth LS NLS CS-Gradient CS-Value CS-Both
0.272 0.076 0.0140.052 0.005
NRMSE = 0.330 0.177 0.0070.026 0.001
Reconstruction
x
ρ
0 10 20 30 40 50 60 70 80 90 100
0
0.02
0.04
0.06
0.08
0.1
0.12
0.14
0.16
0.18
0 10 20 30 40 50 60 70 80 90 1000
0.05
0.1
0.15
0.2
0.25
0.3
0 10 20 30 40 50 60 70 80 90 100
0
0.1
0.2
0.3
0.4
0.5
0.6
0.7
0 10 20 30 40 50 60 70 80 90 100
0
0.1
0.2
0.3
0.4
0.5
0.6
0.7
0.35
Fig. 3. Comparison of different reconstruction methods. The first column is the orig-inal signal. The remaining columns show reconstruction results (red dashed lines) fordifferent methods, given the measurement cost, m/n, is equal to 1/4. The value beloweach plot is the NRMSE(normalized root mean squared error) of reconstruction.
prior—the sparsity on the signal value or on the signal gradient. The fact thatCS-Gradient is better than CS-Value indicates that the sparsity on the signalgradient holds better than the sparsity on the signal value. Finally, as expected,CS-Both outperforms other methods due to its adaptive ability. In our trials,the favorable performance of CS-Both was not sensitive to changes of the rela-tive weighting of the value and gradient terms. These observations carry over tothe 3D setting (see Fig. 4), where we reconstruct a 1283 volume; note that thisrequires 128 × 128 independent 1D reconstructions.
5.3 Iterative Attenuation Correction
Until now, we have not considered the attenuation in the image formation modelin (1) yet. To take into account attenuation, we use a simple iterative relineariza-tion algorithm as follows:
1. Assume no attenuation, solve the optimization problem with techniques from§5.2 to get the initial reconstruction of the volume density ρ(0).
2. At iteration k, assuming σt is known4, compute the attenuated light as:L(k)(x, y, z) = exp (− (τ1 + τ2)) ·L(x, y), where τ1 and τ2 are computed usingρ(k−1) as shown in §4.
3. With the attenuated light L(k)(x, y, z), (1) becomes a linear equation. Wesolve for ρ(k) and go to next iteration until it converges.5
Since our overall framework accommodates the scanning method [4, 3] andthe interpolation method [5] as special cases, the iterative algorithm could bedirectly applied to these prior methods as well.
4 The attenuation coefficient, σt, of the participating medium can be obtained fromliterature, specified by a user, or be measured by a second camera taking the shad-owgram of the volume.
5 In practice, we found that the algorithm usually converges within 3-4 iterations.

9
6 Validation via Simulation
To further validate our method, we perform simulations on a synthetic volume.The volume is generated from a triangular mesh of a horse and it is discretizedinto 1283 voxels. For each voxel, if it is inside the mesh, the density is designedto be proportional to the distance from the center of the voxel to the centerof the mesh, otherwise the density is 0. Fig. 4a shows the volume where bluecorresponds to the lowest density while yellow corresponds to the highest density.A slice of the volume is shown in Fig. 4b.
(a) Ground Truth
(b) Sample Slice
(c) Coded Image (d) Reconstructed Slice (e) Reconstructed Volume at 2 Views
Spatial Coding of Compressive Structured Light
x
y
z
(g) Coded Image (h) Reconstructed Slice (i) Reconstructed Volume at 2 Views
Temporal Coding of Compressive Structured Light
1 4 7 10 13 160
0.01
0.02
0.03
Iterations
Err
or
(NR
MS
E)
Ground Truth Iteration 1 Iteration 2 Iteration 3
(a)
(b)
Fig. 4. Simulation results of volume reconstruction using compressive structured light.LEFT: (a) The original volume where blue means the lowest density and yellow meansthe highest density. (b) A slice of the volume. The top and the bottom row on the rightshows the reconstruction results for spatial coding and temporal coding, respectively.For each row, from left to right are the coded image acquired by the camera, thereconstruction of the slice, and the reconstructed volume under two different views.RIGHT: (a) Reconstruction errors and (b) slices with iterative attenuation correction.
Both spatial coding and temporal coding of compressive structured light aretested. The measurement cost, m/n, is fixed to 1/4. For spatial coding, we use arandom color image with resolution of 1280×1280 as the coded light from theprojector. This gives us m=1280/128×3=30 measurements to recover densitiesof 128 voxels on one row of the volume. Based on (1), a single image (shownin Fig. 4c) is generated from the camera view and used for reconstruction. Fortemporal coding, we use random binary stripes as illumination and generate 32images for reconstruction. One of these images is shown in Fig. 4g. CS-Both isused to reconstruct the volume for both cases. As shown in Fig. 4, both meth-ods accurately reconstruct the volume. Moreover, Fig. 4(right) shows the recon-struction errors and reconstructed slices at different iterations of attenuationcorrection, which demonstrates the effectiveness of the iterative algorithm.
We also evaluate different reconstruction methods at various measurementcosts from 1/16 to 1. The results are shown as a table in Fig. 5. Conclusionssimilar to the ones from the previous 1D signal simulation (Fig. 3) can be drawnfrom these results: (1) As expected, all methods have improvements as the mea-

10
1/16 1/8 1/4 1/2 1
LS
NLS
CS-Value
CS-Gradient
CS-Both
m/n
Fig. 5. Comparison of different reconstruction methods at different measurement costs,m/n. CS-Both outperforms other methods.
surement cost increases. (2) Without using any prior of the data, LS is the worstfor reconstruction with insufficient measurements. (3) CS-Gradient and CS-Bothlargely outperform other methods, especially for low measurement cost, whichindicating strong sparsity in the signal’s gradient. (4) CS-Both is better thanCS-Gradient, especially at low measurement cost (e.g., as shown in Fig. 5 atm/n = 1/16). Based on these preliminary simulations, we chose to run our ac-tual acquisition experiments with a measurement cost of 1/4 and the CS-Bothoptimization functional.
7 Experimental Results
We have implemented the temporal coding of compressive structured light forrecovering inhomogeneous participating media. The spatial coding is not imple-mented currently due to its extensive calibration requirement, as discussed in§8. As shown in Fig. 1c, our system consists of a 1024×768 DLP projector anda 640×480 Dragonfly Express 8-bit camera, positioned at right angles, bothviewing the inhomogeneous participating medium (milk drops in water). Theprojector and the camera are synchronized and both operate at 360fps.6 Using24 coded light patterns, we are able to recover a 1283 volume at 15fps. Theselight patterns consist of 128 vertical stripes. Each stripe is assigned 0 or 1 ran-domly with the probability of 0.5. In this way, about half amount of the light isturned on for each measurement. We also tried alternative light patterns such asHadamard codes, and found the random binary codes have better performance.
6 The camera’s resolution is set to 320×140 in order to achieve 360fps.
11
(a) Photograph
(b) Coded Image
View 1 View 2 View 3
Without Attenuation Correction
With Attenuation Correction
View 1 View 2 View 3
(c)
(d)
(a) Photograph
(b) Coded Image
View 1 View 2 View 3
Without Attenuation Correction
With Attenuation Correction
View 1 View 2 View 3
(c)
(d)
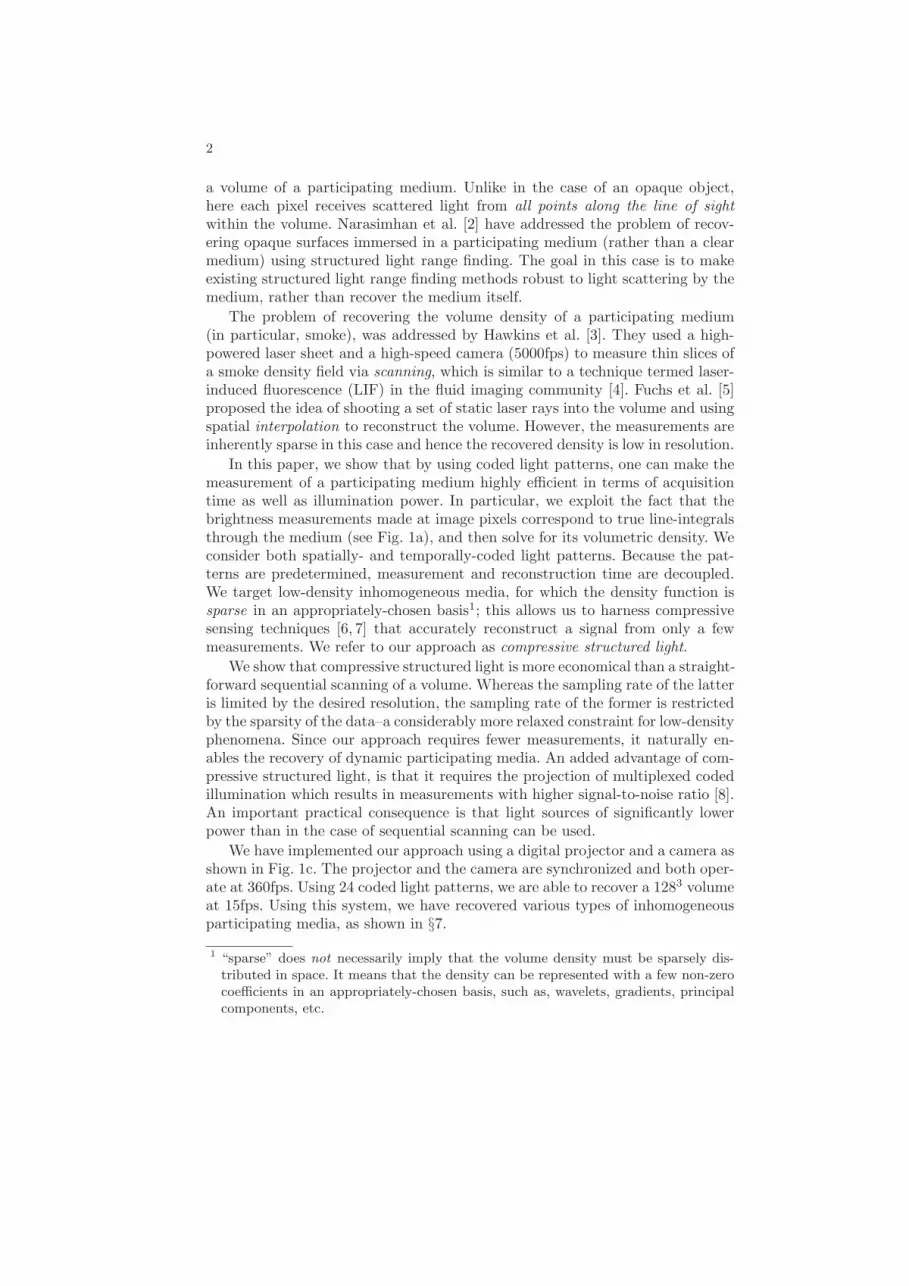
Fig. 6. Reconstruction results of LEFT: an object consisting of two glass slabs withpowder where the letters “EC” are on the back slab and “CV” on the front slab, andRIGHT: point cloud of a face etched in a glass cube. Both examples show: (a) aphotograph of the objects, (b) one of the 24 images captured by the camera, and re-constructed volumes at different views with (c) and without (d) attenuation correction.
We used this system to recover several types of inhomogeneous participatingmedia, including, multiple translucent layers, a 3D point cloud of a face etchedin a glass cube, and the dynamic process of milk mixing with water. The recon-structed volumes are visualized with the ray casting algorithm [23] in which theopacity function is set to the volume density.
We first perform reconstruction on static volumes. Fig. 6(left) shows theresults of an object consisting of two glass slabs with powder on both. Theletters “EC” are drawn manually on the back plane and “CV” on the frontplane by removing the powder. Thus we create a volume in which only twoplanes have non-zero density. A photograph of the object is shown in Fig. 6a.We then reconstruct the volume using the proposed method. Fig. 6 shows oneof the 24 captured images as well as the reconstructed volume at different viewswith and without attenuation correction. It shows that attenuation correctionimproves the results by increasing the density on the back plane.
Similarly, Fig. 6(right) show the reconstruction for a 3D point cloud of a faceetched in a glass cube. As shown, our method also achieved good reconstructionof the volume. In this example, multiple scattering and attenuation within thepoint cloud are much stronger than the previous example. Thus in the recon-structed volume, the half of the face not directly visible to the camera has alower estimated density (e.g., the relative darker area of the right eye in Fig. 6).
Finally, we use our system to reconstruct time-varying volumes. We takethe dynamic process of milk drops dissolving in water as an example. We usea syringe to drip milk drops into a water tank as shown in the adjacent figure.With the proposed method, we are able to reconstruct time-varying volumes withhigh spatial resolution (128× 128× 250) at 15fps, which recovers the interestingpatterns of the dynamic process (see Fig. 7).

12
8 Limitations
Multiple Scattering. Although utilizing more light elements increases the effi-ciency of the acquisition, it will increase multiple scattering as well, which willcause biased reconstruction, as the artifacts shown in Fig. 6. One potential wayto alleviate this problem is to separate multiple/single scattering by using morecomplex light codes in a similar way to Nayar et al. [24].Calibration for the Spatial Coding Method. The spatial coding seems more desir-able than the temporal coding due to its high temporal resolution (i.e., volumereconstruction from one single image) and the easy access of high spatial resolu-tion devices. However, it requires highly accurate calibration both geometricallyand radiometrically. The defocus of both the projector and the camera needs tobe considered as well. In contrast, the temporal coding method is more robustto noise and defocus and easy to calibrate.
9 Conclusions
We proposed compressive structured light for recovering the volume densities ofinhomogeneous participating media. Unlike conventional structured light rangefinding methods where coded light patterns are used to establish correspondencefor triangulation, compressive structured light uses coded light as a way to gen-erate measurements which are line-integrals of volume density. By exploiting thesparsity of the volume density, the volume can be accurately reconstructed froma few measurements. This makes the acquisition highly efficient both in acquisi-tion time and illumination power, and thus enables the recovery of time-varyingvolumetric phenomena.
We view compressive structured light as a general framework for coding the3D light function L(x, y, t) for reconstruction of signals from line-integral mea-surements. In this light, existing methods such as laser sheet scanning and laserline interpolation, as well as the spatial coding and temporal coding discussed inthis paper, can be considered as special cases. One interesting future direction isto design more complex coding strategies to improve the performance or applythe method to new problems.
Acknowledgments: We would like to thank Tim Hawkins for providing theirsmoke data and anonymous reviewers for their valuable comments. This workwas supported in part by the NSF (ITR-03-25867, CCF-05-41259, IIS-04-12759,IIS-05-28402, CNS-06-14770, and CCF-06-43268), a Sloan Research FellowshipBR-4485, and an ONR Young Investigator award N00014-07-1-0900.
References
1. Salvi, J., Pages, J., Batlle, J.: Pattern codification strategies in structured lightsystems. Pattern Recognition 37 (2004) 827–849
2. Narasimhan, S., Nayar, S., Sun, B., Koppal, S.: Structured light in scatteringmedia. In: ICCV’05. (2005) 420–427

13
3. Hawkins, T., Einarsson, P., Debevec, P.: Acquisition of time-varying participatingmedia. In: SIGGRAPH’05. (2005) 812–815
4. Deusch, S., Dracos, T.: Time resolved 3D passive scalar concentration-field imag-ing by induced fluorescence (LIF) in moving liquids. Measurement Science andTechnology 12(2) (2001) 188–200
5. Fuchs, C., Chen, T., Goesele, M., Theisel, H., Seidel, H.: Density estimation fordynamic volumes. Computers and Graphics 31(2) (2007) 205–211
6. Candes, E.J., Romberg, J.: Sparsity and incoherence in compressive sampling.Inverse Problems 23(3) (2007) 969–985
7. Donoho, D.: Compressed sensing. IEEE Trans. on Information Theory 52(4)(2006) 1289–1306
8. Schechner, Y.Y., Nayar, S.K., Belhumeur, P.N.: A theory of multiplexed illumina-tion. In: ICCV’03. (2003) 808–815
9. Willett, R., Gehm, M., Brady, D.: Multiscale reconstruction for computationalspectral imaging. In: Computational Imaging V at SPIE Electronic Imaging. (2007)
10. Lustig, M., Donoho, D., Pauly, J.M.: Sparse MRI: The application of compressedsensing for rapid MRI imaging. Magnetic Resonance in Medicine 58(6) (2007)1182–1195
11. Wright, J., Yang, A., Ganesh, A., Sastry, S., Ma, Y.: Robust face recognition viasparse representation (2008)
12. Hasinoff, S., Kutulakos, K.: Photo-consistent reconstruction of semi-transparentscenes by density sheet decomposition. IEEE Trans. on PAMI 29(5) (2007) 870–885
13. Ihrke, I., Magnor, M.: Image-based tomographic reconstruction of flames. In: SCA.(2004) 36l–375
14. Ihrke, I., Magnor, M.: Adaptive grid optical tomography. Graphical Models 68(5)(2006) 484–495
15. Trifonov, B., Bradley, D., Heidrich, W.: Tomographic reconstruction of transparentobjects. In: EGSR. (2006) 51–60
16. Ihrke, I., Kutulakos, K.N., Lensch, H.P.A., Magnor, M., Heidrich, W.: State ofthe art in transparent and specular object reconstruction. In: STAR Proc. ofEurographics. (2008)
17. Candes, E.J., Romberg, J., Tao, T.: Stable signal recovery from incomplete andinaccurate measurements. Communications on Pure and Applied Mathematics59(8) (2006) 1207–1223
18. Ishimaru, A.: Wave Propagation and Scattering in Random Media. IEEE Press,New York (1978)
19. GLPK: The Gnu Linear Programming Kit. http://www.gnu.org/software/glpk20. Olshausen, B.A., Field, D.J.: Emergence of simple-cell receptive field properties
by learing a sparse code for natural images. Nature 381 (1996) 607–60821. Simoncelli, E.P.: Statistical models for images: compression restoration and syn-
thesis. In: Proc Asilomar Conference on Signals, Systems and Computers. (1997)673–678
22. Rudin, L.I., Osher, S., Fatemi, E.: Nonlinear total variation noise removal algo-rithm. Physica D 60 (1992) 259–268
23. Schroeder, W., Martin, K., Lorensen, B.: The Visualization Toolkit: An Object-Oriented Approach to 3D Graphics. 4th edn. Pearson Eduction, Inc. (2006)
24. Nayar, S.K., Krishnan, G., Grossberg, M.D., Raskar, R.: Fast separation of directand global components of a scene using high frequency illumination. In: SIG-GRAPH’06. (2006) 935–944

14
View 1 View 2 View 3
Tim
e (s
ec.)
0.0
1.0
2.0
3.0
4.0
Photograph
x
y
zx
y
z x
y
z
Fig. 7. Reconstruction results of milk drops dissolving in water. 24 images are usedto reconstruct the volume at 128 × 128 × 250 at 15fps. The reconstructed volumes areshown in three different views. Each row corresponds to one instance in time. Theleftmost column shows the corresponding photograph (i.e., all projector pixels emitwhite) of the dynamic process.